Mining Unstructured Financial News to Forecast Intraday Stock Price Movements Master Thesis presented by Simon Bacher Matriculation Number 1306810 Supervisors: Dr. Johanna V¨ olker, Markus Doumet submitted to the Lehrstuhl f ¨ ur K ¨ unstliche Intelligenz Prof. Dr. Heiner Stuckenschmidt University Mannheim October 2012

Welcome message from author
This document is posted to help you gain knowledge. Please leave a comment to let me know what you think about it! Share it to your friends and learn new things together.
Transcript

Mining Unstructured Financial News to ForecastIntraday Stock Price Movements
Master Thesis
presented bySimon Bacher
Matriculation Number 1306810Supervisors: Dr. Johanna Volker, Markus Doumet
submitted to theLehrstuhl fur Kunstliche Intelligenz
Prof. Dr. Heiner StuckenschmidtUniversity Mannheim
October 2012

“We conclude that markets are very efficient,but that rewards to the especially diligent, intelligent,or creative may in fact be waiting.”
Bodie et al. (1989), p. 371

Contents
List of Figures iv
List of Tables v
List of Listings vii
1 Introduction 11.1 Research questions . . . . . . . . . . . . . . . . . . . . . . . . . 21.2 Contributions . . . . . . . . . . . . . . . . . . . . . . . . . . . . 31.3 Outline . . . . . . . . . . . . . . . . . . . . . . . . . . . . . . . 4
2 Theoretical foundations 62.1 Financial background . . . . . . . . . . . . . . . . . . . . . . . . 6
2.1.1 Trading fundamentals . . . . . . . . . . . . . . . . . . . 62.1.2 Trading on financial news . . . . . . . . . . . . . . . . . 10
2.2 Text mining . . . . . . . . . . . . . . . . . . . . . . . . . . . . . 142.2.1 Feature vector representation . . . . . . . . . . . . . . . . 142.2.2 Text preprocessing . . . . . . . . . . . . . . . . . . . . . 172.2.3 Feature weighting . . . . . . . . . . . . . . . . . . . . . . 192.2.4 Dimensionality reduction . . . . . . . . . . . . . . . . . . 192.2.5 Classification . . . . . . . . . . . . . . . . . . . . . . . . 232.2.6 Evaluation . . . . . . . . . . . . . . . . . . . . . . . . . 33
3 Review of relevant systems 383.1 Description of relevant systems . . . . . . . . . . . . . . . . . . . 383.2 Key findings . . . . . . . . . . . . . . . . . . . . . . . . . . . . . 51
4 Trading system 544.1 Design . . . . . . . . . . . . . . . . . . . . . . . . . . . . . . . . 554.2 Implementation . . . . . . . . . . . . . . . . . . . . . . . . . . . 57
ii

CONTENTS iii
4.2.1 Data preparation . . . . . . . . . . . . . . . . . . . . . . 574.2.2 Training . . . . . . . . . . . . . . . . . . . . . . . . . . . 63
5 Evaluation 725.1 Evaluation settings . . . . . . . . . . . . . . . . . . . . . . . . . 725.2 Evaluation methodology . . . . . . . . . . . . . . . . . . . . . . 735.3 Results . . . . . . . . . . . . . . . . . . . . . . . . . . . . . . . . 74
5.3.1 2-class problem . . . . . . . . . . . . . . . . . . . . . . . 745.3.2 3-class problem . . . . . . . . . . . . . . . . . . . . . . . 81
5.4 Financial evaluation . . . . . . . . . . . . . . . . . . . . . . . . . 855.4.1 Market simulation settings . . . . . . . . . . . . . . . . . 865.4.2 Results . . . . . . . . . . . . . . . . . . . . . . . . . . . 87
6 Conclusion 926.1 Summary . . . . . . . . . . . . . . . . . . . . . . . . . . . . . . 926.2 Future work . . . . . . . . . . . . . . . . . . . . . . . . . . . . . 94
7 Bibliography 96
A Data preparation 115A.A S&P 500 companies used as data source . . . . . . . . . . . . . . 115A.B Format of a news release distributed by LexisNexis . . . . . . . . 119A.C The Penn Treebank tag set . . . . . . . . . . . . . . . . . . . . . 122
B Training 124B.A Stop word list used for text preprocessing . . . . . . . . . . . . . 124B.B Additional experimental results . . . . . . . . . . . . . . . . . . . 126

List of Figures
2.1 Limit order book example . . . . . . . . . . . . . . . . . . . . . 92.2 k nearest neighbors algorithm . . . . . . . . . . . . . . . . . . . 252.3 Example decision tree . . . . . . . . . . . . . . . . . . . . . . . . 272.4 Hyperplanes for a two class data set . . . . . . . . . . . . . . . . 31
3.1 General schema of a typical trading system . . . . . . . . . . . . 39
4.1 Trading system schema . . . . . . . . . . . . . . . . . . . . . . . 564.2 LIBSVM parameter tuning . . . . . . . . . . . . . . . . . . . . . 70
5.1 Financial performance of the classifiers (2-class problem) . . . . . 885.2 Financial performance of the classifiers (3-class problem) . . . . . 90
iv

List of Tables
2.1 Contingency table . . . . . . . . . . . . . . . . . . . . . . . . . . 212.2 Example training set . . . . . . . . . . . . . . . . . . . . . . . . 262.3 Confusion matrix . . . . . . . . . . . . . . . . . . . . . . . . . . 34
3.1 Comparison of all relevant systems . . . . . . . . . . . . . . . . . 52
4.1 Relevant information in a news document . . . . . . . . . . . . . 61
5.1 Evaluation with the initial setting on the 2-class problem . . . . . 755.2 Performance comparison with different feature sets . . . . . . . . 765.3 Bigrams combined with different feature sets . . . . . . . . . . . 775.4 Different approaches to deal with the unbalanced data set . . . . . 785.5 Different classifiers with the SMOTE approach . . . . . . . . . . 795.6 Different classifiers without resampling . . . . . . . . . . . . . . 795.7 Different methods of dimensionality reduction . . . . . . . . . . . 805.8 Evaluation with the final setting on the 2-class problem . . . . . . 815.9 Different classifiers on the 3-class problem . . . . . . . . . . . . . 825.10 Different approaches to deal with the unbalanced data set (3-class
problem) . . . . . . . . . . . . . . . . . . . . . . . . . . . . . . . 845.11 Performance evaluation of the binary metalearning algorithm . . . 845.12 Evaluation with a final setting on the 3-class problem . . . . . . . 855.13 Significance of profit differences to the DefaultLearner . . . . . . 895.14 Significance of profit differences to the RandomLearner . . . . . . 905.15 Significance of profit differences to the RandomLearner (3-class
problem) . . . . . . . . . . . . . . . . . . . . . . . . . . . . . . . 91
A.1 All S&P 500 companies and their Bloomberg tickers . . . . . . . 115A.2 The Penn Treebank tag set . . . . . . . . . . . . . . . . . . . . . 123
B.1 Stop word list used for text preprocessing . . . . . . . . . . . . . 124
v

LIST OF TABLES vi
B.2 Abbreviations used in the results . . . . . . . . . . . . . . . . . . 127B.3 Additional experimental results (2-class problem) . . . . . . . . . 129B.4 Additional experimental results (3-class problem) . . . . . . . . . 132B.5 Additional experimental results (second 2-class problem) . . . . . 134
List of Listings
4.1 Trade data file example of the Hewlett-Packard stock (GMT time) 584.2 LexisNexis query . . . . . . . . . . . . . . . . . . . . . . . . . . 594.3 Extracting a news headline via XPath . . . . . . . . . . . . . . . 604.4 Thesaurus rule example written in JAPE . . . . . . . . . . . . . . 624.5 Example for the training data set in the ARFF format . . . . . . . 64
A.1 Example for a news release distributed by LexisNexis . . . . . . . 119
vii

Chapter 1
Introduction
The legendary investor Daniel Drew (1797–1879) was quoted as saying “Anybodywho plays the stock market not as an insider is like a man buying cows in themoonlight” (Renehan, 2004). The efficient market hypothesis (EMH) introduceda century later by Fama (1965) seems to support this statement. The semi-strongform of the EMH states that it is impossible to earn excess profits from publiclyavailable news and announcements. However, in the past decades strong evidencehas been discovered that challenges the EMH. For instance, the empirical works ofTetlock (2007), Chan (2003), and Bernard & Thomas (1990) raise the claim thatnews articles and announcements are able to directly influence the market’s supply-demand equilibrium (Munz, 2011). As a consequence, most professional investorsrapidly adjust their trading behavior to the latest news. They typically have accessto a newswire service.
With the emergence of information technology such as the World Wide Web,a large amount of data becomes available to us all. According to estimations, theinformation available worldwide doubles roughly every 20 months (Frawley et al.,1992). In particular, human investors have access to an increasing amount of digitalfinancial news articles that potentially influence future security prices. Farhoo-mand & Drury (2002) confirm the information overload that market participantsexperience. Thus, their ability to make rational and fast trading decisions dependshighly on the process of selecting information most relevant to them (Mitra &Mitra, 2011).
Recently, text mining has received growing attention as a means to analyzeunstructured textual data. One of the main advantages of text mining is the abilityto process large amounts of text quickly therefore leaving more demanding tasksto humans (Dorre et al., 1999). There are many promising attempts to tap thepotential of text mining in practical applications. Examples include government
1
CHAPTER 1. INTRODUCTION 2
agencies being able to detect terrorist networks by linking unstructured informationor banks tracking their customers’ spending behavior more efficiently (Fan et al.,2006). It seems natural to apply the text mining task within the financial domainto address the information overload problem while supporting investors’ tradingdecisions.
In this thesis, we aim to develop a system that forecasts short-term stock pricemovements using text mining techniques. With regards to the forecasting problemwe tackle the challenge of choosing input data and processing it accordingly. Weperform adjustments of state of the art text mining techniques in order to maximizethe prediction performance. We also address the issue of, from a financial point ofview, evaluating the prediction performance.
The remainder of this introduction is structured as follows. First, we present thekey research questions in this thesis (Section 1.1). Then we provide an overview ofour contributions with respect to these research questions (Section 1.2). Last, wegive an outline of the thesis (Section 1.3).
1.1 Research questions
1. In the introductory section, we argued that state of the art text mining tech-niques potentially provide the means to resolve the information overloadproblem faced by market participants today. This leads us to our first re-search question: Is it possible to forecast short term stock price movementsusing text mining techniques on unstructured financial news?
2. Text classification is a promising text mining task suitable for analyzing tex-tual data. It includes building a function (classifier) from a set of labeleddata in order to label previously unseen data. The success of such a clas-sifier highly depends on the quality of the input data it operates on. Thereare different types of news that can serve as input data, such as regulatedor unregulated news. News articles are published by different sources andtheir reliability and relevance for the stock price vary. In addition, the newsarticles themselves can be assumed to be not equally relevant for the stockprice movements. For instance, a news article published at a weekend mighthave another effect on the stock prices than a news article published during atrading day. Similarly, news articles dealing with issues such as dividends ormajor product announcements might be particularly important for the stockprice. This leads us to the following question: Which news data must beselected to provide a classifier with training data that is as relevant and noisefree as possible?
CHAPTER 1. INTRODUCTION 3
3. An important prerequisite of building a classifier is to label the input data,in our case the news articles. An automatic labeling requires the alignmentof the news articles with the relevant stock prices. Factors that are essen-tial for this alignment process include the time window used to assess thenews’ price influence and the approach to calculate the price changes afterpublishing the news. As a result, these factors influence the characteristicsof the training data set. They determine not only the quality of the newslabeling, but also the amount of different labels and the distribution of thedata with respect to the different labels. This in turn influences the expectedprediction quality. The following question arises: How can the news databe automatically labeled to build a classifier that achieves a high predictionperformance?
4. The ambitious goal of forecasting stock prices using text mining techniquesrequires achieving the highest possible prediction performance. This in-volves the challenge of extracting the characteristics (features) from the newsarticles that are essential for their semantics. Reducing the number of fea-tures using different metrics might as well influence the performance. More-over, it is important to address the problem of a highly unbalanced trainingdata set. Since different classifiers have shown varying performance in thepast, making the right classifier choice suitable for our specific goal is neces-sary. An important question to ask is therefore: How do state of the art textmining techniques help to improve the classifier’s prediction performance?
5. A goal highly relevant for the practical application is to achieve monetaryprofits based on the price forecasting. Thus, the predictions made by theclassifier need to be translated into a trading strategy that can be executedin real markets. To ensure the profitability of such a strategy, it must betested under real market conditions. Trading volume restrictions and tradingcosts need to be taken into account. The arising key question is: Do thepredictions made by a classifier lead to significant excess profits based onrealistic market assumptions?
1.2 Contributions
In this thesis, we develop a system that analyzes unstructured financial news usingtext classification in order to forecast stock price trends. We review similar sys-tems to build on successful ideas and combine them with novel approaches (Ques-tion 1). We discuss the different types of news that are potentially relevant to thestock prices and choose news sources for the system accordingly. To eliminate ir-
CHAPTER 1. INTRODUCTION 4
relevant news, we present suitable filtering approaches such as the implementationof a rule-based thesaurus (Question 2). We develop an automatic labeling approachand compare it to a manual labeling approach. We evaluate the influence of differ-ent automatic labeling approaches on the prediction performance (Question 3). Forthe training, we introduce a set of features novel with respect to the price forecast-ing task. We compare different text mining techniques such as the feature vectordimensionality reduction and different classifiers (Question 4). To answer Ques-tion 5, we investigate the influence of trading costs on potential profits and run amarket simulation that is able to support or reject the practical profitability of thesystem.
1.3 Outline
The remaining parts of this thesis are organized as follows.In Chapter 2, we introduce the theoretical foundations to provide a background
understanding of the following chapters of the thesis. In Section 2.1, we focus onthe financial foundations. We explain basic characteristics of market trades andintroduce the phenomenon of trading costs (Section 2.1.1). In Section 2.1.2, wediscuss the different types of news articles and explain their potential influence onthe stock prices from the viewpoint of the efficient market hypothesis. We explainthe event study methodology as a means to test the efficient market hypothesis andto investigate the speed of stock price adjustments as a reaction to new information.In Section 2.2, we introduce the foundations of text mining. After an overview ofthe different ways to transform a document into a feature vector, we explain all nec-essary text preprocessing steps. We describe the process of optionally weightingthe particular features and reducing the feature vector dimensionality by eliminat-ing less relevant features. We compare different classifiers that can be used topredict the stock price influence of unlabeled news. Finally, we introduce the mostcommon means to evaluate the prediction performance.
In Chapter 3, we provide a comprehensive review of relevant systems devel-oped in the last two decades. We conclude this chapter with a comparison of thesystems’ key characteristics, and summarize key findings that might help to buildon successful ideas and address existing gaps using new approaches.
In Chapter 4, we present the development of our trading system. After pro-viding an overview of the system design (Section 4.1), we describe the systemimplementation in detail (Section 4.2). We explain the process of preparing thedata (Section 4.2.1), which includes acquiring the news and price data, extract-ing the news contents, filtering out irrelevant news, and converting the news intoa proper format to make them ready for the subsequent steps. We then describe
CHAPTER 1. INTRODUCTION 5
the process related to training the data (Section 4.2.2). This includes automaticallylabeling the news using the stock price data, extracting a set of features, applyingmethods for handling unbalanced data, and finally training the classifier to predictthe labels of unseen news articles.
In Chapter 5, we describe how we evaluate the performance of the system.After introducing the evaluation settings and the evaluation methodology (Sec-tions 5.1 and 5.2), we present the results of the classifier evaluation separated fortwo different data sets, each resulting from a different labeling approach. For bothdata sets, we present a parameter tuning in order to increase the performance (Sec-tion 5.3). Finally, we evaluate the performance of the system financially by per-forming a trading simulation (Section 5.4).
In Chapter 6, we provide a summary of the thesis and point out ideas for po-tential future work.

Chapter 2
Theoretical foundations
In this chapter, we describe the foundations that will be used to design a price fore-casting trading system. In Section 2.1, we provide an overview of the financialbasics that are required when trading with the goal of short-term profits. In Sec-tion 2.2, we introduce the fundamentals of text mining and describe the process oftraining a large amount of text data to classify an unseen test data set.
2.1 Financial background
In this section, we describe financial foundations that we will utilize when design-ing a trading system and when evaluating this system financially. In Section 2.1.1,we explain fundamentals of trading at stock markets. In Section 2.1.2, we discussthe role of news articles and their potential influence on the stock prices.
2.1.1 Trading fundamentals
The characteristics of markets can determine whether short term stock trading de-cisions are profitable. In this section we explain how securities are typically tradedon the market. We then give an overview about the costs of trading to create real-istic assumptions on the profits that can be earned by a trading system.
In principle, most basics described in this section hold not only for stocks,but for any kind of financial securities such as treasury notes, bonds and federalagency securities. However, since this thesis aims to predict stock prices, we limitour description to stocks. Furthermore, since we are interested in short-term pricemovements, we do not take dividends into account, which is cash returned by acompany to its stakeholders typically quarterly as part of its payout policy (Brealeyet al., 2011).
6

CHAPTER 2. THEORETICAL FOUNDATIONS 7
Trading mechanics
Whenever an investor wishes to buy or sell a stock, he or she must file a marketorder specifying the following: The stock’s issuer and company name, the orderpurpose (buy or sell), the order size (number of shares) and the order type. Indi-vidual investors typically use intermediates, so called brokers, to place the orderon the market.
The following four types of orders can be distinguished (Elton et al., 2011a):
• Market order: An order to buy or sell at the best price currently possible.For instance, suppose there are investors on the market willing to pay 30$for a single Microsoft stock and at the same time there are investors willingto sell Microsoft for 30.50$. Then Microsoft would be quoted at 30$ bid and30.50$ ask. If an investor is placing a market order to buy Microsoft, he orshe would pay 30.50$, which is currently the best price available. Similarly,if an investor is placing a market order to sell Microsoft, the order pricewould be 30$.
• Limit order: An order to buy (sell) at a fixed maximum (minimum) price.For instance, assume an investor places a limit order on the market to sellMicrosoft stocks for the minimum price of 31$. Then the order is executedas soon as another investor is willing to pay 31$ or above for the Microsoftstock. Since this might not happen at all, limit orders are not always exe-cuted. Therefore, the investor is required to specify a period of time whenplacing a limit order. If the order has not been executed within this time,the limit order is canceled automatically. This type of limit orders is calledstanding limit order (Harris, 2003).
• Short sale: An order to sell a stock the investor does not own and buy it backat a later point of time. For instance, an investor borrows a Microsoft stockfor 30$ from a brokerage firm and sells the stock on the market. Later he orshe buys the stock back and returns it to the brokerage. If the stock trades atthis time at 20$, the investor has earned a profit of 10$. The most commonreason for investors to short-sell a stock is to expect the stock price to declinein the future.
• Stop order: An order that will be converted to a market order when the stockprice reaches a fixed limit. Stop orders are usually used to lock in a profit.For instance, an investor owns a Microsoft stock bought at 20$ that nowdeals at 35$. In order to save a part of the earned profit, the investor couldplace a stop sell (or stop loss) order at 30$. As soon as the price drops to30$, the order becomes a market sell order.
CHAPTER 2. THEORETICAL FOUNDATIONS 8
In practice, stocks are mainly traded on stock markets such as the New York stockexchange (NYSE) in the United States or the Frankfurt stock exchange (FrankfurterWertpapierborse, FWB) in Germany.
Trading costs
Trading costs are an important aspect of trading markets, since they determine howlarge the expected mispricing of a stock has to be before an investor will place anorder. There are three main sources of trading costs: Direct costs, costs causedby the bid-ask-spread (Elton et al., 2011a) and price impact costs (Edelen et al.,2007).1
The direct costs include commissions, fees and taxes. Commissions are paidto market brokers in order to execute the trade. They are known in advance of thetrade, but vary from broker to broker. Similarly, commissions charged by a singlebroker may vary depending on the difficulty of the trade to be executed. Com-missions are calculated based on the total price of stock traded. Fees are paid bythe brokers and they typically pass the bills to their customers, the investors. Feesinclude ticket charges for floor brokers, clearing and settlement costs, exchangefees, and in the U.S. SEC (Securities and Exchange Commission) transaction fees,which recover governmental costs for supervising the markets (SEC, 2007). Taxesare charged based on realized earnings. They are known in advance, but depend onthe total transaction size (Kissell, 2006).
The costs caused by the bid-ask-spread were first analyzed by Demsetz (1968)and can be understood by considering a continuously trading market on a stockexchange. All standing limit orders placed by investors are filed in the so calledlimit order book, usually maintained by the exchange. An example of a limit orderbook is illustrated in Figure 2.1. The best bid price for a Deutsche Bank stock is23.795e (1,494 shares), and the best ask price is 23.805e (313 shares). Withoutany new orders, no trade would be executed. The difference between best bid andbest ask price is called bid-ask spread and would be 23.805e-23.795e = 0.01e.The best price estimate of the current stock value is the average of best bid and bestask price (23.795e+23.805e)/2 = 23.800e. If an investor is placing now a newmarket buy order, he or she would have to pay the best price of 23.805e and thuspaying an extra amount of 0.005e, which is half of the bid-ask-spread (Harris,2003). However, there are more sophisticated methods to estimate the costs ofthe bid-ask-spread by taking market realities into account, such as the possibilityfor traders to hide the order size (e.g. Bessembinder & Venkataraman, 2010). The
1Another cost factor is the cost of acquiring information to support the investor’s trading decision.Since this is hoped to be achieved in this thesis, the costs are neglected here.

CHAPTER 2. THEORETICAL FOUNDATIONS 9
Ask Vol.
313
882
2,256
3,854
2,450
4,711
6,792
Bid Vol.
1,494
2,106
2,886
5,326
4,281
2,834
6,721
Bid
23,795
23,790
23,785
23,780
23,775
23,770
23,765
Ask
23,805
23,810
23,815
23,820
23,825
23,830
23,835
4,711
6,792
4,451
2,138
823
2,834
6,721
3,872
3,346
2,221
23,770
23,765
23,760
23,755
23,750
23,830
23,835
23,840
23,845
23,850
Figure 2.1: Limit order book for Deutsche Bank AG at 14:09:53 MEZ on 23rd July2012 on Xetra, the FWB trading system (Deutsche Borse, 2012)
more illiquid the stock is traded, the higher the costs caused by the bid-ask-spreadare likely to be (Elton et al., 2011a).
The price impact (or market impact) costs are caused by either liquidity de-mands of an investor or the information content of an order. Liquidity demands re-quire paying a premium for attracting new buyers or sellers. In the example above(see Figure 2.1), an investor might want to buy 2,000 shares of Deutsche Bankstocks. However, only 313 shares are available for the best ask price of 23.805e.The investor would have to pay a premium of 0.005e each share for additional882 shares and a premium of 0.010e each share for the remaining 805 shares. Theinformation content of an order is a signal to the market that the security traded islikely to be mispriced. For instance, assume that an investor places an order to buy250,000 shares of Deutsche Bank stock. Once this information is released to themarket, other investors currently owning the stock might conclude that the stock isundervalued and adjust their prices upwards (Kissell, 2006).
The problem of correctly estimating trading costs is a challenging one and re-mains widely discussed (e.g. Odean, 1999; Snell & Tonks, 2003). Trading costs arenegatively correlated with the stock’s market capitalization (Edelen et al., 2007),since large stocks tend to be more liquid and trade with more volume than middle-size or small stocks, which results in less bid-ask-spread and price impact costs.In the following, large cap stocks are referred to as stocks with more than 8 bil-lion $ market capitalization (equal to 70% of the U.S. market capitalization), midcap stocks as stocks with a 2 to 8 billion $ market capitalization (20%) and smallcap stocks as stocks with less than 2 billion $ market capitalization (10%) (Morn-ingstar, 2011). Edelen et al. (2007) analyze trading costs for mutual funds on theU.S. market and report average one-way trading costs of 76 (bps, 1 basis point =1/100 of a percentage point) or 152 bps per round trip.2 For large cap stocks, av-
2One way trading costs are costs for a single trade, whereas round trip trading costs are costs forbuying and selling an equity.

CHAPTER 2. THEORETICAL FOUNDATIONS 10
erage one-way trading costs are 11 bps for trading commissions, 7 bps for bid-ask-spread costs and 26 bps for price impact costs, which sums up to around 45 bpstotal trading costs. The trading costs for mid-caps (84 bps) and small-caps (146bps) are substantially higher. Investment Technology Group (ITG), a multinationalresearch broker firm, quarterly estimates the average trading costs. In the U.S. (firstquarter 2012), they estimate total one-way trading costs for large cap stocks to be34.4 bps, for mid cap stocks 67.7 bps and for small cap stocks 117.3 bps. They re-port a significant decline of trading costs compared to the first quarter 2009, whenlarge cap stocks trading costs were 73.9 bps (ITG, 2012). This tendency is con-sistent with the findings of French (2008), who reports a 92% reduction of tradingcosts from 1980 to 2006 in the U.S. market. It can be explained with factors such asthe development of electronic trading networks and regulations by SEC to increasemarket transparency and liquidity (French, 2008). Li et al. (2011) assume averageround trip costs of only 30 bps for their stock price forecasting system.
2.1.2 Trading on financial news
In this section, we give an overview about financial news as a main source of infor-mation influencing the stock price. We elaborate on the efficient market hypothesisthat deals with the question whether and how fast new information is reflected inthe stock price. We discuss the event study methodology, which is a widely usedmethod to empirically test the efficient market hypothesis.
Financial news
Financial news can be divided into two different types: regulated news and unreg-ulated news (Munz, 2011). In the U.S., the term regulated news is defined by theSecurities and Exchange Commission (SEC). Its Regulation Full Disclosure (FC)forces since 2000 all publicly traded U.S. companies to simultaneously disclose“material” and “nonpublic” information to all investors (SEC, 2000). A piece ofinformation is “nonpublic” if it has not been made public to all investors yet. TheSEC defines “material” information as information that is highly likely for rea-sonable investors to be considered important for trading decisions. The followingexamples for material information are given, which are supposed to be reviewed todecide whether they are material (SEC, 2000, sec. II B.2):
1. “earnings information”
2. “mergers, acquisitions, tender offers, joint ventures, or changes in assets”
3. “new products or discoveries, or developments regarding customers or sup-pliers (e.g., the acquisition or loss of a contract)”
CHAPTER 2. THEORETICAL FOUNDATIONS 11
4. “changes in control or in management”
5. “change in auditors or auditor notification that the issuer may no longer relyon an auditor’s audit report”
6. “events regarding the issuer’s securities – e.g., defaults on senior securities,calls of securities for redemption, repurchase plans, stock splits or changesin dividends, changes to the rights of security holders, public or private salesof additional securities”
7. “bankruptcies or receiverships”
The information must be made publicly available on one or more of the followingchannels (SEC, 2000, sec. II B.24):
• Form-8K Disclosures, which are report templates specifically filed for thepurpose of disclosure
• Press releases disseminated by a newswire service
• Conference calls received by telephonic or electronic means
• The company’s website. This disclosure channel was added by SEC (2008).
Until recently, the NYSE demanded companies to use press releases to fulfill theirdisclosure obligation. In 2009, the rules were changed and allow companies touse any of the channels specified by SEC (2000, sec. II B.24). However, the SECassumes that many companies continue to use press releases in the future (SEC,2009). Press releases are typically distributed by newswire services. The servicesPR Newswire and Business Wire are market leaders and together share 58.6% ofthe newswire market (UBM, 2011). However, their competitor newswire servicessuch as Reuters, Dow Jones or Bloomberg are so-called Editorial Newswires thatmanually edit incoming press releases, which may be time consuming and reducesthe likelihood of making profits by trading on these news. Since PR Newswire andBusiness Wire publish news identical with the texts originally submitted their mar-ket share for publishing press releases enforced by the Regulation Full Disclosureis much higher (Mittermayer, 2006).
The term unregulated news is referred to as news not considered as materialinformation, such as analyst opinion or rumors, which can be distributed by var-ious channels like traditional news reporting, blogs or social media. This makesunregulated news a potential source of noise caused by irrelevant information oreditorial errors (Munz, 2011).

CHAPTER 2. THEORETICAL FOUNDATIONS 12
Efficient market hypothesis
The efficient market hypothesis (EMH) was originally proposed by Fama (1965)and states that security prices always fully reflect all available information in ef-ficient capital markets. In other words, it is impossible to earn profits by tradingbased on any available information (Jensen, 1978). However, this strong hypothesiswould mean that investors need incentives to trade until the prices in fact reflect allinformation. Thus, the costs of information acquisition and transaction costs wouldneed to be zero, which is clearly not the case (Grossman & Stiglitz, 1980). A lessrestricted definition of EMH seems to be more realistic, which states that secu-rity prices only reflect all information only until marginal trading benefits (profits)exceed the marginal trading costs (Fama, 1991).
Tests of EMH typically deal with the question how fast the information is re-flected in security prices. There are three different categories of EMH tests, eachconsidering a different subset of information (Elton et al., 2011b; Fama, 1970):
• weak form tests: Is all information contained in historical prices fully re-flected in the current price? These tests include examining seasonal patternssuch as high returns on January or returns predicted from past data.
• semi-strong tests: Is all publicly available information fully reflected in thecurrent price? These tests deal with the question whether investors can earnexcess profits based on public news and announcements that change priceexpectations.
• strong form tests: Is all information available, whether public or private,fully reflected in the correct prices? These tests examine whether any typeof investors can make excess profits, even if they possess insider information.
In this thesis, the semi-strong form of EMH is particularly interesting, since a trad-ing system earning excess returns based on analyzing financial news will need totest this semi-strong form. A method widely used in financial research to test semi-strong form of EMH is called event study and is described in following section.
Intraday event study methodology
Event studies have the purpose to test whether markets are efficient and in particu-lar, how fast new information is incorporated in the price (Elton et al., 2011b). Forinstance, an event such as a company merger or an earnings announcement mightbe reflected in the stock price within a few minutes, days or even weeks. Since weaim to forecast short term stock price movements in this thesis, we focus on event
CHAPTER 2. THEORETICAL FOUNDATIONS 13
studies examining price reactions within less than a day, so-called intraday eventstudies.
Event studies are typically structured as follows (MacKinlay, 1997). First, anevent of interest and an event window are defined. The event window representsthe period over which the stock prices of the companies involved in this event willbe analyzed. Second, selection criteria are introduced deciding which companiesare included in the event study. For instance, one might include only companiescontained in the S&P 500 index. Third, a measurement of the abnormal returnARiτ is determined, which is for the stock of company i and the event date τdefined as
ARiτ = Riτ − Eiτ .
Riτ is the actual ex post return over the event window and Eiτ is the normal re-turn, meaning the returns that are expected using a normal return model. Next, anestimation window is defined, which is the time period used to estimate the normalprice given the normal return model. Usually, the estimation window is chosen tobe a time period prior to the event window. Based on the estimated normal returns,the abnormal returns can be calculated to gain insides about the effects caused bythe event under study.
The following main issues need to be taken account when dealing with intradaydata (Mucklow, 1994):
• Calculating returns: The most common ways of calculating the returns of anygiven stock at time t are the proportional returnPt/Pt−1−1 and the logarith-mic return ln (Pt/Pt−1). However, using the proportional return introducesan upward bias of stock returns caused by the bid-ask-spread. Mucklow(1991) finds that using the logarithmic return eliminates this bias.
• Noncontinuous trading: There might be no stock trade at all in a given timeinterval. Assume a stock trading at time t at the price Pt and stops tradinguntil the time t+n, n ≥ 2, when it trades at price Pt+n. The return defined byPt and Pt+n can be described by three different ways. First, the equilibriumprice is assumed to remain stable during the non-trading period and thusthe return is assumed to be zero (realization method). Second, the return isallocated evenly throughout the non-trading period (quasiaccural method).Third, the non-trading period is treated as undefined and excluded from thesample (consecutive returns method).
• Estimating the normal return: There are three ways of estimating the normalreturn in order to determine the abnormal return of a stock. First, the return isassumed to be zero (raw returns model). Second, the return is assumed to be
CHAPTER 2. THEORETICAL FOUNDATIONS 14
equal to the mean return at the same time interval and stock at other days inthe estimation period (mean-adjusted returns model). Third, the return is ad-justed to market movements and risk using methods such as the capital assetpricing model (CAPM) proposed by Lintner (1965); Sharpe (1964) (marketadjusted models). Mucklow (1994) finds that for time periods less than 60minutes, the raw returns model is sufficient for well-specified statistical tests.
Mittermayer (2006) compiled the results of various intraday event studies withintwo decades. He concluded that stock prices start to adjust a few seconds after anews arrival and end to adjust usually 5-30 minutes later.
2.2 Text mining
Text mining can be defined as an application of data mining. Data mining is re-ferred to as the process of discovering meaningful patterns in usually well struc-tured data with the goal of gaining a (typically economic) advantage (Terada &Tokunaga, 2003; Witten et al., 2011, Chapter 1.1). However, in the case of textmining, the patterns are extracted from unstructured textual data in document col-lections (Feldman & Sanger, 2006). Sebastiani (2002) states that these documentcollections have large quantities. Witten et al. (2004) defines a wide range of textmining activities that particularly include document retrieval, text classification,language identification and extracting entities such as names and dates.
In this section, we describe the activities necessary to extract patterns fromfinancial news that might be responsible for significant stock price movements.First, we explain the different methods to represent a text document by identifyingfeatures that contain essential information about a text and how to transform thedocument into a compact feature vector (Section 2.2.1). We then discuss the pro-cess of actually extracting the features from the text (Section 2.2.2), calculating theweights of the feature vectors (Section 2.2.3) and successively reducing the over-all number of features to increase performance (Section 2.2.4). In Section 2.2.5,we compare different classifiers that transform the information contained in theextracted features into a model that is able to automatically classify unseen textdocuments. Last, we review suitable methods to evaluate the performance of thecreated model (Section 2.2.6).
2.2.1 Feature vector representation
The process of scanning text documents and extract useful information is calledinformation extraction (IE) (Hobbs & Riloff, 2010). Many IE techniques have re-cently been adapted to the research area of text classification and are used to extract
CHAPTER 2. THEORETICAL FOUNDATIONS 15
features that contribute to the semantics of the text document (Sebastiani, 2002).The following main types of features are particularly important in this thesis:
• n-grams
• Named entities
• Part of speech (POS) tags
• Sentiment
n-grams are sequences of n words in a row. The simplest form of n-grams areunigrams (n = 1), also referred to as bag-of-words. An n-gram with n = 2 isreferred to as bigram. The word “price” is an example for a unigram, the phrase“company acquisition” is an example for a bigram.
Named entities are proper names, i.e. names of particular things or classes(Sekine & Nobata, 2003). Named entities can be categorized into the followingwidely accepted classes proposed at the Seventh Message Understanding Confer-ence (MUC-7) (Chinchor, 1998): unique identifiers of entities (organizations, per-sons and locations), times (dates and times) and quantities (monetary values andpercentages). The process of identifying named entities in a text document is re-ferred to as named entity recognition and classification (NERC). NERC is typicallyrealized using either supervised learning techniques or handcrafted rule-based al-gorithms. Supervised learning techniques are based on the idea of automaticallyinferring rules or sequencing labeling algorithms based on a large amount of prela-beled training examples. Supervised learning techniques do not require systemdevelopers to have prior expert knowledge in linguistics and have recently becomeincreasingly popular (e.g. Asahara & Matsumoto, 2003; Borthwick et al., 1998).However, rule-based approaches are superior when only a few training examplesare available (Nadeau & Sekine, 2007).
A widely used and freely available system performing NERC is the languageengineering framework GATE (Cunningham et al., 2011) along with the informa-tion extraction system ANNIE (Cunningham et al., 2002). ANNIE consists ofdifferent processing resources that can be successively used to extract named enti-ties. The processing resource Gazetteer contains plain text lists containing widelyknown examples for named entities such as “Europe” or “New Taiwan dollar” cate-gorized by named entity types such as persons or locations. However, using only agazetteer is often not enough, since there might be words belonging to two or moredifferent categories. For instance, “Washington” could be a surname or a state,“Philip Morris” could be a person or a company (Mikheev et al., 1999).3 To ad-dress this problem, the ANNIE processing resources part of speech (POS) Tagger
3For other challenges of NERC using gazetteers see Nadeau et al. (2006)
CHAPTER 2. THEORETICAL FOUNDATIONS 16
(Hepple, 2000) and Semantic Tagger can be used. The POS Tagger creates annota-tions for each word or symbol, each representing one of 36 grammatical categoriesalso known as the Penn Treebank tag set (Marcus et al., 1993). The complete tagset can be found in Appendix A.C. Subsequently, the Semantic Tagger can be usedto produce the final named entity annotations. This is done by applying rules writ-ten in the JAPE (Java Annotations Pattern Engine) language (Cunningham et al.,2000). For instance, the following rule could be designed: If the words “lives in”are followed by a word that was annotated as NNP (singular proper noun) by POSTagger, annotate this noun as “Location” (Cunningham et al., 2011). Marrero et al.(2009) found that ANNIE performs well with respect to NERC compared to similarsystems.
As mentioned above, part of speech (POS) tags are word annotations repre-senting different grammatical categories. Words of a particular subset of categoriessuch as verbs or nouns might contribute more to the semantic of the text than oth-ers. Goncalves & Quaresma (2005) report that choosing such a word subset asfeatures leads to a learner performing equally well as a learner using all words.Similarly, the POS tags themselves can serve as features rather than the annotatedwords. This method has shown limited success in the past (Moschitti & Basili,2004), but has rarely been applied in the financial domain yet.
The sentiment of a text document represents the overall opinion towards itssubject (Pang et al., 2002); for instance, whether a financial article is good or badnews for the according company. Davis et al. (2012) report that the language sen-timent (optimistic or pessimistic tone) in earnings press releases reflects the futureperformance of the company at the market. Henry (2008) finds that investors’trading decisions are influenced by the tone in earnings press releases and reportshigher abnormal returns after press releases using a positive tone. The sentimentcan be automatically extracted using either a text classification or a lexicon-basedapproach (Taboada et al., 2011). The text classification approach includes label-ing text examples with their sentiment and trains a classifier to successively labelunseen text examples (Pang et al., 2002). The lexicon-based approach includescalculating the sentiment of a document by using the sentiment of the words orphrases contained in this document (Turney, 2002). In the first step, a dictionarycontaining words or word phrases along with their sentiment values is created au-tomatically (e.g. Hatzivassiloglou & McKeown, 1997; Turney, 2002) or manually(e.g. Taboada et al., 2011; Tong, 2001). Then all words or phrases in the dictionarycan be extracted from a text and their according sentiment values can be aggre-gated, resulting in a single sentiment score for each text (Taboada et al., 2011). Inthis thesis, we will use the manually created sentiment list provided by Taboadaet al. (2011).

CHAPTER 2. THEORETICAL FOUNDATIONS 17
With the exception of the sentiment feature, all features described consist ofwords or word phrases (also referred to as terms). However, classifier algorithmsare not able to handle textual data. Thus, text documents need to be converted intoa numerical vector of features, uniformly for training and test data. Let T be a set offeatures that occur at least once in the whole document corpus. For each documentdj every feature in T is given a weight 0 ≤ wij ≤ 1, resulting in a feature vector~dj =
⟨w1j , . . . , w|T |j
⟩(Sebastiani, 2002).
In the following, we will describe the process of text preprocessing (Sec-tion 2.2.2) and calculating the weights of the feature vector (Section 2.2.3) in moredetail.
2.2.2 Text preprocessing
Tokenization
The first step of text preprocessing is called tokenization, which is the process ofdividing the text into tokens. A token is a useful semantic unit consisting of acharacter sequence in a document. This character sequence might be a word, anumber, a symbol or a punctuation mark. Tokenization can simply be realized byusing white spaces as word separators and cutting off all numbers and symbols(Manning et al., 2008, Chapter 2). However, different problems become obviousin practice (Manning & Schutze, 1999):4
• A period following a word can cause ambiguities: The period can eithermark the end of a sentence or an abbreviation. For instance, Washington isoften referred to as Wash., which can be confused with the verb wash. Tomake matters worse, abbreviations such as etc. often occur at the end of thesentence. Here, one period serves both functions simultaneously.
• Contractions such as I’ll and isn’t present the problem whether or not andwhere to split them into single words. Phrases like dog’s may stand for dogis, dog has or can be considered as possessive case of dog. However, thereare valid examples that attach the ’s to the last word of a noun phrase, e.g.the house I rented yesterdays’ garden. Therefore, it is not clear how to treatthese phrases.
• Hyphens that occur between words often make it difficult to determine howto tokenize these words. For instance, e-mail might clearly be considered asone word, whereas word groups such as text-based or 90-cent-an-hour raise
4Manning et al. (2008, Chapter 2) emphasizes the difference of tokenization issues in differentlanguages. However, since this thesis deals with English speaking news, we focus on this language.

CHAPTER 2. THEORETICAL FOUNDATIONS 18
should be separated into single words. Hyphens are also commonly used atthe end of a line to divide words into two parts in order to improve justifi-cation of text. These line-breaking hyphens can be confused with hyphensused naturally.
To address these problems, it is recommended to customize the tokenizer (Weisset al., 2005) taking the domain into account.
Stop Words
Very common words such as is and the are not very helpful for determining thecorrect document class. Eliminating these words can highly increase the runtimeof classification by reducing the number of tokens up to 40% (Navarro & Ziviani,2011). They are called stop words and are typically stored in stop lists, whichare often hand-crafted using domain specific knowledge. An example used in thisthesis can be found in Appendix B.A.
Stemming and lemmatization
Stemming and lemmatization both have the goal to reduce the extracted words totheir common base form, since it often seems to be useful to match words with re-lated ones. For instance, the words is, are, am and be would be transformed into be,the words cat, cat’s, cats and cats’ would be transformed into cat. However, stem-ming and lemmatization have subtle differences. Stemming refers to the heuristicof reducing a word to its stem by cutting off the word’s end in order to achieve, inmost cases, acceptable results. In contrast, lemmatization is the process of reduc-ing a word to its lemma, which is the canonical form of the word. This is done byfiguring out and removing inflectional endings using morphological analysis. Forinstance, a stemmer would most likely transform the word saw into s, whereas alemmatizer would try to identify whether the token is a verb or a noun in order todecide whether to output saw or see (Manning et al., 2008, Chapter 2).
One of the most well-known stemming algorithms is the Porter stemmer de-veloped by Porter (1980). It is based on the idea of removing the longest possi-ble affixes of words. This is done by applying hand-crafted rules. The sequenceC?(V C)mV ? represents a word, where C is a list of consonants and V is a listof vocals. Then C? is an optional consonant sequence in the beginning and V ? anoptional vocal sequence in the end of the word. The sequences V C are repeatedm times in between. For instance, the words free and why correspond to m = 0,the words prologue and compute to m = 2. In the next step, rules satisfying cer-tain conditions are defined: The temporal stemming rule (m > 0)EED → EE
CHAPTER 2. THEORETICAL FOUNDATIONS 19
transforms agreed to agree and leaves feed unchanged since it satisfies m = 0(Weissmann, 2004).
Stemming has the disadvantage of causing ambiguities between words. Forinstance, the Porter stemmer would reduce the words operational, operative andoperating to oper. This would cause the phrases operational research, operatingsystem and operative dentistry to lose part of their meaning. Lemmatization canpartly solve this problem by removing only inflectional endings. However, oper-ating system would be transformed to operate system, which is still a bad match(Manning et al., 2008, Chapter 2). Krovetz (1993) and Hull (1998) report smallbut consistent improvements in retrieval effectiveness achieved through stemming(Xu & Croft, 1998). Stemming has been successfully used in practice, reducingthe number of terms by about 40% (Witten et al., 1999a, p. 147).
2.2.3 Feature weighting
The feature vector to used to represent a document described in Section 2.2.1 con-tains a weight for each feature. The most commonly used approaches to calculatethese weights, are binary weighting and TF-IDF weighting.
Binary weighting simply assigns a feature occurring in a document the weight 1and the weight 0 otherwise. TF-IDF weighting (Salton & Buckley, 1988) relies ontwo different measurements, the document frequency (DF) and the term frequency(TF). DFi refers to the number of documents that contain a term i, TFi,j refers tothe number of occurrences of term i in the document j (Baeza-Yates & Ribeiro-Neto, 2011). LetN be the number of documents in the whole corpus. Then DFi/Nis the document frequency relative to the corpus. Thus, IDFi = logN/DFi can bereferred to as the inverted document frequency of term i, which decreases with thenumber of documents containing term i. The TF-IDF weighting scheme is definedas
wi,j = TFi,j × IDFi,
where wi,j is the weight associated with term i and document j. TF-IDF exists indifferent variants as discussed in Witten et al. (1999a). These introduce extensionssuch as varying parameters to increase or reduce the influence of TFi,j or using thelog function to increase the weight (Baeza-Yates & Ribeiro-Neto, 2011).
2.2.4 Dimensionality reduction
Before feeding the classifier with the extracted features, it might be useful to selectthe most important ones. This process is referred to as dimensionality reductionand has the following two main reasons (Manning et al., 2008, Chapter 13): First,it reduces the number of so-called noise features. These are features that contribute
CHAPTER 2. THEORETICAL FOUNDATIONS 20
to high misclassification error. For instance, a rare word might be not importantfor a document, but still happens to be present in this document. Then a classifiermight draw the wrong conclusion of a strong relationship between this word andthe document. This problem is called overfitting and will be explained in detail inSection 2.2.5. Second, since large documents might contain thousands of features,reducing their number will reduce the time needed for the successive classifiertraining. In the following, the most important feature selection methods will bereviewed.5
Frequency based methods
A popular approach to reduce feature dimension is the TF-IDF weighting schemedescribed in Section 2.2.3. Once the terms are TF-IDF weighted, the ones withthe weights wi,j laying above a predefined threshold can be selected as features(Goncalves, 2011). Another option is to use document frequency (DF) on its ownas a ranking to reduce features (Luhn, 1957) and is based on the idea that rare termsare either noise features (not helpful for the classifier training) or do not influencethe global performance (Yang & Pedersen, 1997). Those features can therefore beeliminated to reduce training time. Very common words considered to be noiseeither and are assumed to be filtered out in advance by the use of a stop list (seeSection 2.2.2).
Term strength (TS)
Term strength, sometimes also referred to as word strength, ranks terms based theprobability of a term t being existent in a document that is similar to any documentcontaining t. More formally this can be written as
s(t) = Pr(t contained in y|t contained in x),
where x and y is an arbitrary pair of similar documents (x, y). Two documentsare considered to be similar, if their cosine similarity is above a certain threshold.6
Then the term strength of t can be approximated by dividing the number of docu-ment pairs (x, y) in which t occurs in both x and y by the number of documentswhere t occurs in x (Wilbur & Sirotkin, 1992; Yang & Wilbur, 1996).
5For further methods see Sebastiani (2002, p.14 ff.)6A detailed explanation of cosine similarity can be found e.g. in Salton & McGill (1986, p. 201
ff.)
CHAPTER 2. THEORETICAL FOUNDATIONS 21
Information gain (IG)
Information gain (Quinlan, 1986) measures the degree of information available forthe category prediction based on the presence of absence of a term. It can be writtenas
Gain(t) = −m∑i=1
Pr(ci)log2Pr(ci)
+Pr(t)
m∑i=1
Pr(ci|t)log2Pr(ci|t)
+Pr(t)
m∑i=1
Pr(ci|t)log2Pr(ci|t).
In this functional, cimi=1 is the set of categories and t is a term (Yang & Pedersen,1997). The part −
∑mi=1 Pr(ci)log2Pr(ci) is also referred to as entropy E(t) of a
term t (Manning et al., 2008, Chapter 13). All terms below a predefined thresholdcan be discarded (Yang & Pedersen, 1997).
Mutual information (MI)
The mutual information criterion measures how much influence the presence orabsence of a term has in correctly deciding the class of a document (Manninget al., 2008, Chapter 13). Suppose a term t and a class c and let Pr(A) be the apriori probability of A. Then is the mutual information defined as
I(t, c) = logPr(t ∧ c)
Pr(t)× Pr(c). (2.1)
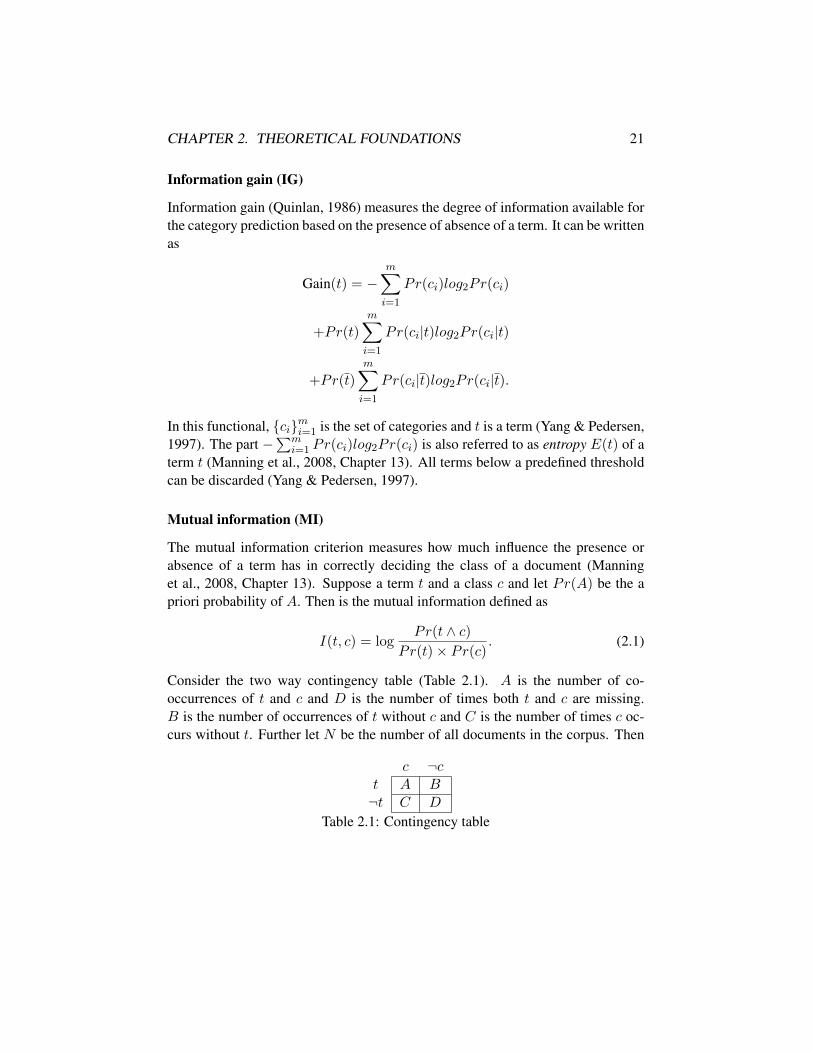
Consider the two way contingency table (Table 2.1). A is the number of co-occurrences of t and c and D is the number of times both t and c are missing.B is the number of occurrences of t without c and C is the number of times c oc-curs without t. Further let N be the number of all documents in the corpus. Then
c ¬ct A B¬t C D
Table 2.1: Contingency table
CHAPTER 2. THEORETICAL FOUNDATIONS 22
Equation 2.1 can be estimated as
I(t, c) ≈ logA×N
(A+ C)(A+B)
(Yang & Pedersen, 1997). If t and c are independent, their mutual informationvalue is zero, meaning that information about one of the variables does not tellanything about the other variable (Goncalves, 2011). In order to rank the termsregarding their global mutual information, the following two variants can be for-mulated (Yang & Pedersen, 1997):
Iavg(t) =
m∑i=1
Pr(ci)I(t, ci)
Imax(t) =m
maxi=1
I(t, ci),
where m is the number of classes. Features are selected if Iavg(t) (or alternativelyIavg(t)) is above a certain threshold. All other features are filtered out (Goncalves,2011).
Despite its popularity, MI has the disadvantage of being influenced by the apriori probabilities by the terms. Two terms with identical conditional probabilityPr(t|r) have different MI values if one term is more frequent than the other. Thismakes the MI scores non-comparable when having highly varying term frequencies(Yang & Pedersen, 1997).
χ2 statistic (CHI)
χ2 measures the independence of class and term occurrence, where independenceis defined as Pr(AB) = Pr(A)Pr(B) (Manning et al., 2008, Chapter 13). Againsuppose the contingency table (Table 2.1) and letN be the number of all documentsin the corpus, then χ2 is defined as
χ2(t, c) =N × (AD − CB)2
(A+ C)× (B +D)× (A+B)× (C +D).
Notice that χ2(t, c) is zero if t and c are independent and increases the less inde-pendent t and c become. A global χ2 term ranking can be determined using one ofthe alternative versions
χ2avg(t) =
m∑i=1
Pr(ci)χ2(t, ci)
CHAPTER 2. THEORETICAL FOUNDATIONS 23
χ2max(t) =
mmaxi=1
χ2(t, ci)
(Yang & Pedersen, 1997). Similarly to MI, features are selected if χ2avg(t) (alter-
natively χ2max(t)) is higher than a defined threshold (Goncalves, 2011).
Compared to MI, CHI has the advantage of being comparable across termswith varying term frequencies as it is a normalized value (Yang & Pedersen, 1997).Dunning (1993) shows, however, that CHI only performs well on large corpora oron corpora restricted to the most common words. Despite their differences, MIand CHI seem to perform similarly well in most text classification applications(Manning et al., 2008, Chapter 13).
2.2.5 Classification
Generally, one can distinguish between supervised and unsupervised learningmethods (Duda & Hart, 1973). In unsupervised learning, one tries to discoverpatterns from unlabeled examples. A common unsupervised learning task is clus-tering, a task of finding a finite set of clusters in order to describe the data (Fayyadet al., 1996). Supervised learning involves learning a function from prelabeledexamples. A typical supervised learning task is the classification. In this the-sis, we focus on a well-known instance of classification, the text classification(or text categorization). Assume a document domain D, an initial corpus Ω =d1 . . . d|Ω| ⊂ D of documents, and a set of labels (classes) C =
c1 . . . c|C|
.
Let Φ : D×C → T, F be a function that assigns either the value T or F to eachpair 〈dj , ci〉 ∈ D × C. T means the document dj belongs to the class ci, F meansdj does not belong to ci. The function Φ is unknown and describes how the docu-ments are supposed to be classified. The task of text classification then is to createa function Φ : D × C → T, F in such a way that Φ and Φ correspond as muchas possible. The function Φ is also referred to as classifier or model (Sebastiani,2002).
The process of text classification can be divided into two different phases, thelearning phase and the application phase. The learning phase involves a text clas-sification algorithm that learns the model from text documents with given labelsusing extracted features described in Section 2.2.1. In the application phase, thesepatterns can be used to assign labels (classes) to yet unseen documents.
Some text classification algorithms (including support vector machines) cannotnaturally handle more than two classes. Although for most of these classificationalgorithms exist variants handling multiclass problems, these variants might bedifficult to implement or not be fast enough (Witten et al., 2011). Alternatively, themulticlass problem can be transformed into different binary class problem usingone of the following main approaches (Witten et al., 2011):
CHAPTER 2. THEORETICAL FOUNDATIONS 24
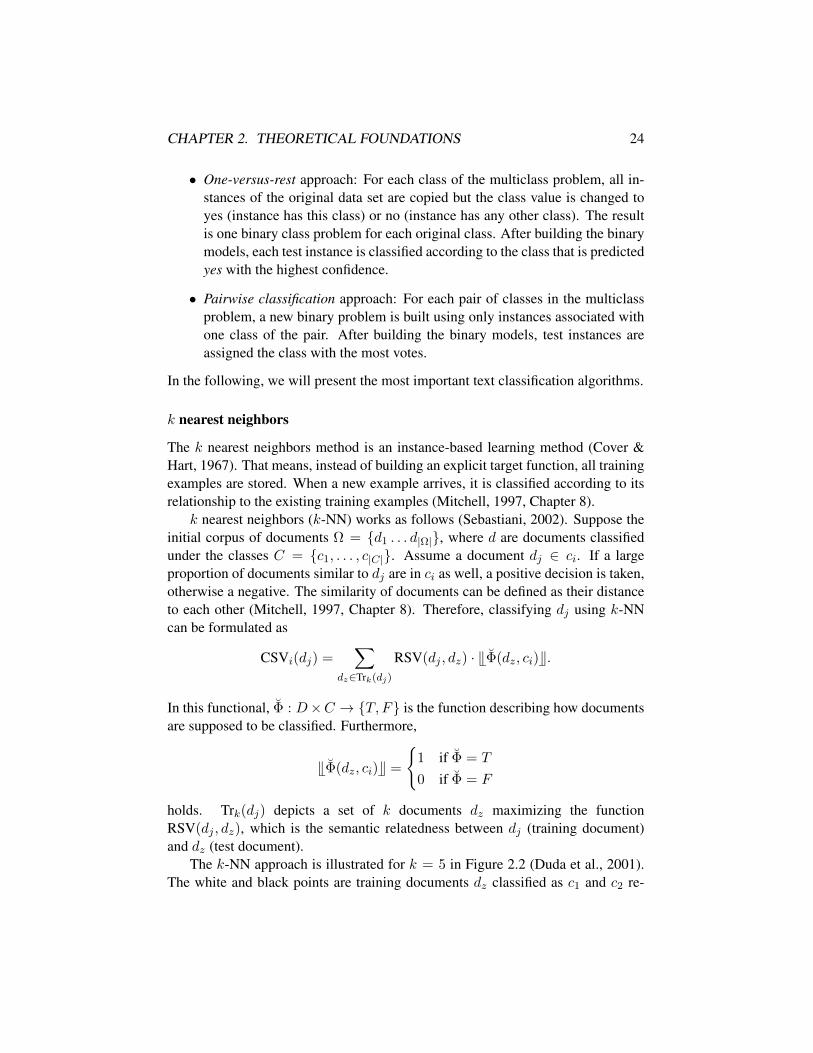
• One-versus-rest approach: For each class of the multiclass problem, all in-stances of the original data set are copied but the class value is changed toyes (instance has this class) or no (instance has any other class). The resultis one binary class problem for each original class. After building the binarymodels, each test instance is classified according to the class that is predictedyes with the highest confidence.
• Pairwise classification approach: For each pair of classes in the multiclassproblem, a new binary problem is built using only instances associated withone class of the pair. After building the binary models, test instances areassigned the class with the most votes.
In the following, we will present the most important text classification algorithms.
k nearest neighbors
The k nearest neighbors method is an instance-based learning method (Cover &Hart, 1967). That means, instead of building an explicit target function, all trainingexamples are stored. When a new example arrives, it is classified according to itsrelationship to the existing training examples (Mitchell, 1997, Chapter 8).
k nearest neighbors (k-NN) works as follows (Sebastiani, 2002). Suppose theinitial corpus of documents Ω = d1 . . . d|Ω|, where d are documents classifiedunder the classes C = c1, . . . , c|C|. Assume a document dj ∈ ci. If a largeproportion of documents similar to dj are in ci as well, a positive decision is taken,otherwise a negative. The similarity of documents can be defined as their distanceto each other (Mitchell, 1997, Chapter 8). Therefore, classifying dj using k-NNcan be formulated as
CSVi(dj) =∑
dz∈Trk(dj)
RSV(dj , dz) · TΦ(dz, ci)U.
In this functional, Φ : D×C → T, F is the function describing how documentsare supposed to be classified. Furthermore,
TΦ(dz, ci)U =
1 if Φ = T
0 if Φ = F
holds. Trk(dj) depicts a set of k documents dz maximizing the functionRSV(dj , dz), which is the semantic relatedness between dj (training document)and dz (test document).
The k-NN approach is illustrated for k = 5 in Figure 2.2 (Duda et al., 2001).The white and black points are training documents dz classified as c1 and c2 re-
CHAPTER 2. THEORETICAL FOUNDATIONS 25
X1
X2
Figure 2.2: k nearest neighbors (based on Duda et al., 2001, p. 183)
spectively. The gray point represents a test document dj . Starting with dj , k-NNincreases a spherical area until it contains k = 5 training documents. In this case,the majority of these documents are members of the black class c2. Therefore, djwould be classified into c2.
Results of k-NN can differ when choosing different values for k. Mittermayer& Knolmayer (2006a) use k = 10, Yang (1994, 1999) finds that the values 30 ≤k ≤ 45 have proven to be successful. An increasing k does not significantly reduceperformance (Sebastiani, 2002).
Since the data does not need to be divided linearly in a document space, themain advantage of k-NN is its good performance even if classes are highly diverseor overlapping (Gerstl et al., 2002). In the training phase, nothing needs to becalculated apart from the number of nearest neighbors, which can be done in avery short time (Mittermayer, 2006). However, the training phase is much moretime consuming, since the similarity of all documents in the entire training set withthe test document must be calculated one by one. This inefficiency is the majordrawback of k-NN (Sebastiani, 2002).
Decision Trees
Decision trees are a very simple but yet effective approach to classify data. A de-cision tree represents a function that takes a vector of values as input and returns asingle value as output, which represents a classification decision. The tree consists
CHAPTER 2. THEORETICAL FOUNDATIONS 26
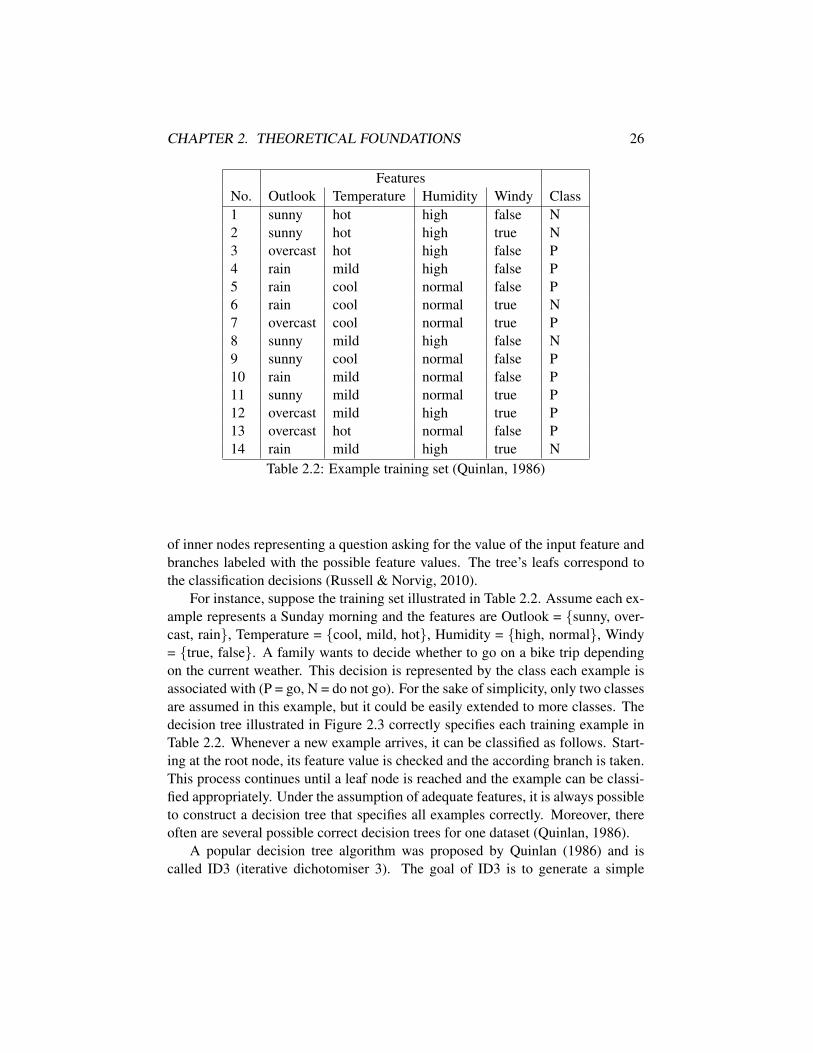
FeaturesNo. Outlook Temperature Humidity Windy Class1 sunny hot high false N2 sunny hot high true N3 overcast hot high false P4 rain mild high false P5 rain cool normal false P6 rain cool normal true N7 overcast cool normal true P8 sunny mild high false N9 sunny cool normal false P10 rain mild normal false P11 sunny mild normal true P12 overcast mild high true P13 overcast hot normal false P14 rain mild high true N
Table 2.2: Example training set (Quinlan, 1986)
of inner nodes representing a question asking for the value of the input feature andbranches labeled with the possible feature values. The tree’s leafs correspond tothe classification decisions (Russell & Norvig, 2010).
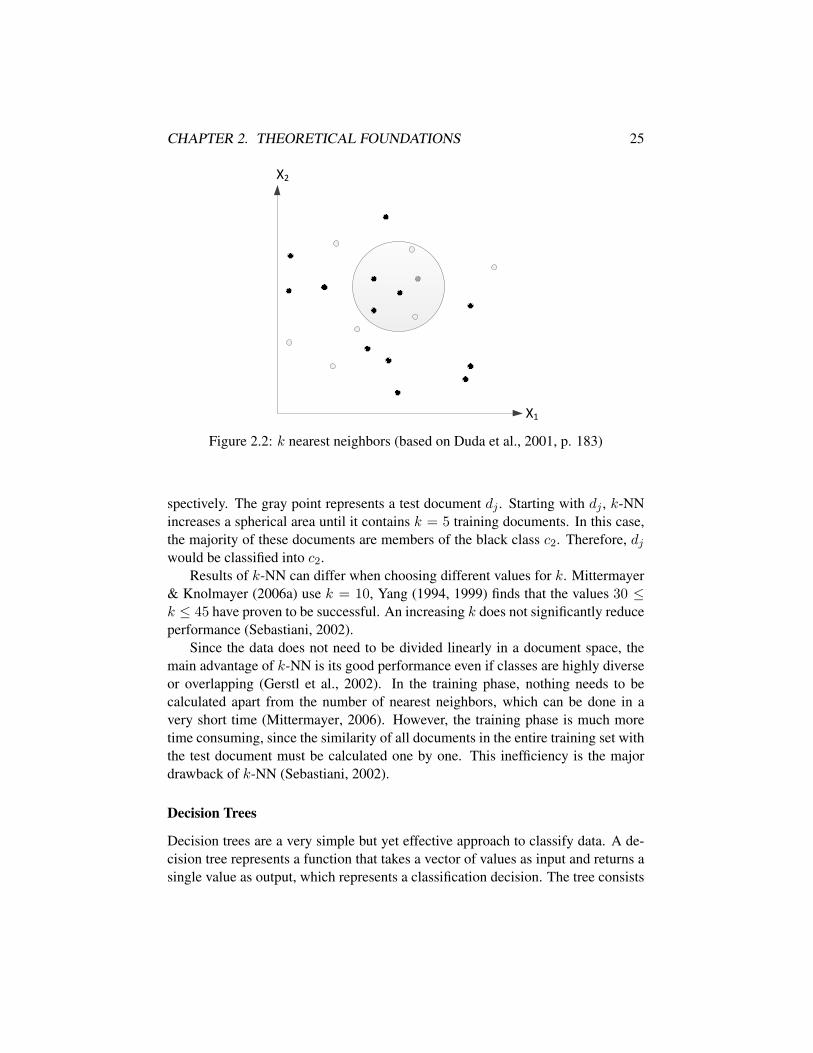
For instance, suppose the training set illustrated in Table 2.2. Assume each ex-ample represents a Sunday morning and the features are Outlook = sunny, over-cast, rain, Temperature = cool, mild, hot, Humidity = high, normal, Windy= true, false. A family wants to decide whether to go on a bike trip dependingon the current weather. This decision is represented by the class each example isassociated with (P = go, N = do not go). For the sake of simplicity, only two classesare assumed in this example, but it could be easily extended to more classes. Thedecision tree illustrated in Figure 2.3 correctly specifies each training example inTable 2.2. Whenever a new example arrives, it can be classified as follows. Start-ing at the root node, its feature value is checked and the according branch is taken.This process continues until a leaf node is reached and the example can be classi-fied appropriately. Under the assumption of adequate features, it is always possibleto construct a decision tree that specifies all examples correctly. Moreover, thereoften are several possible correct decision trees for one dataset (Quinlan, 1986).
A popular decision tree algorithm was proposed by Quinlan (1986) and iscalled ID3 (iterative dichotomiser 3). The goal of ID3 is to generate a simple
CHAPTER 2. THEORETICAL FOUNDATIONS 27
Outlook
Humidity WindyP
PN N P
sunny overcast rain
high normal true false
Figure 2.3: Example decision tree (Quinlan, 1986)
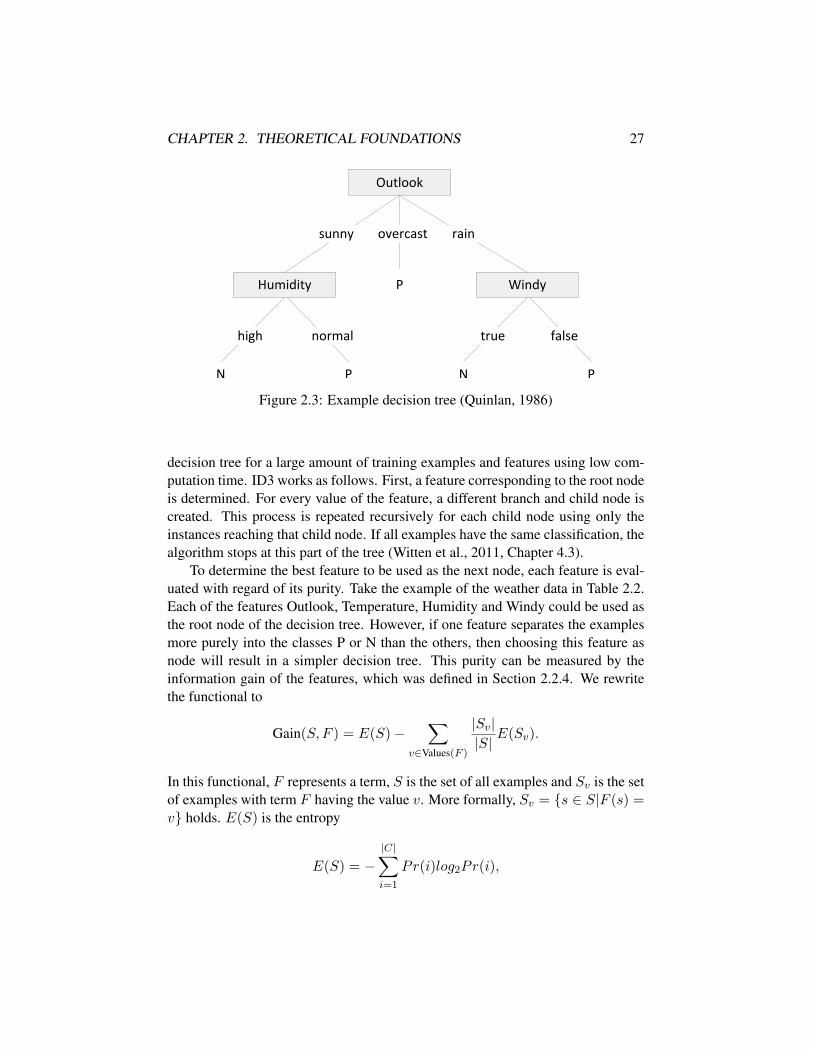
decision tree for a large amount of training examples and features using low com-putation time. ID3 works as follows. First, a feature corresponding to the root nodeis determined. For every value of the feature, a different branch and child node iscreated. This process is repeated recursively for each child node using only theinstances reaching that child node. If all examples have the same classification, thealgorithm stops at this part of the tree (Witten et al., 2011, Chapter 4.3).
To determine the best feature to be used as the next node, each feature is eval-uated with regard of its purity. Take the example of the weather data in Table 2.2.Each of the features Outlook, Temperature, Humidity and Windy could be used asthe root node of the decision tree. However, if one feature separates the examplesmore purely into the classes P or N than the others, then choosing this feature asnode will result in a simpler decision tree. This purity can be measured by theinformation gain of the features, which was defined in Section 2.2.4. We rewritethe functional to
Gain(S, F ) = E(S)−∑
v∈Values(F )
|Sv||S|
E(Sv).
In this functional, F represents a term, S is the set of all examples and Sv is the setof examples with term F having the value v. More formally, Sv = s ∈ S|F (s) =v holds. E(S) is the entropy
E(S) = −|C|∑i=1
Pr(i)log2Pr(i),
CHAPTER 2. THEORETICAL FOUNDATIONS 28
where Pr(i) are fractions of the examples that are classified as ci ∈ C, where C isthe set of all classes possible (Mitchell, 1997).
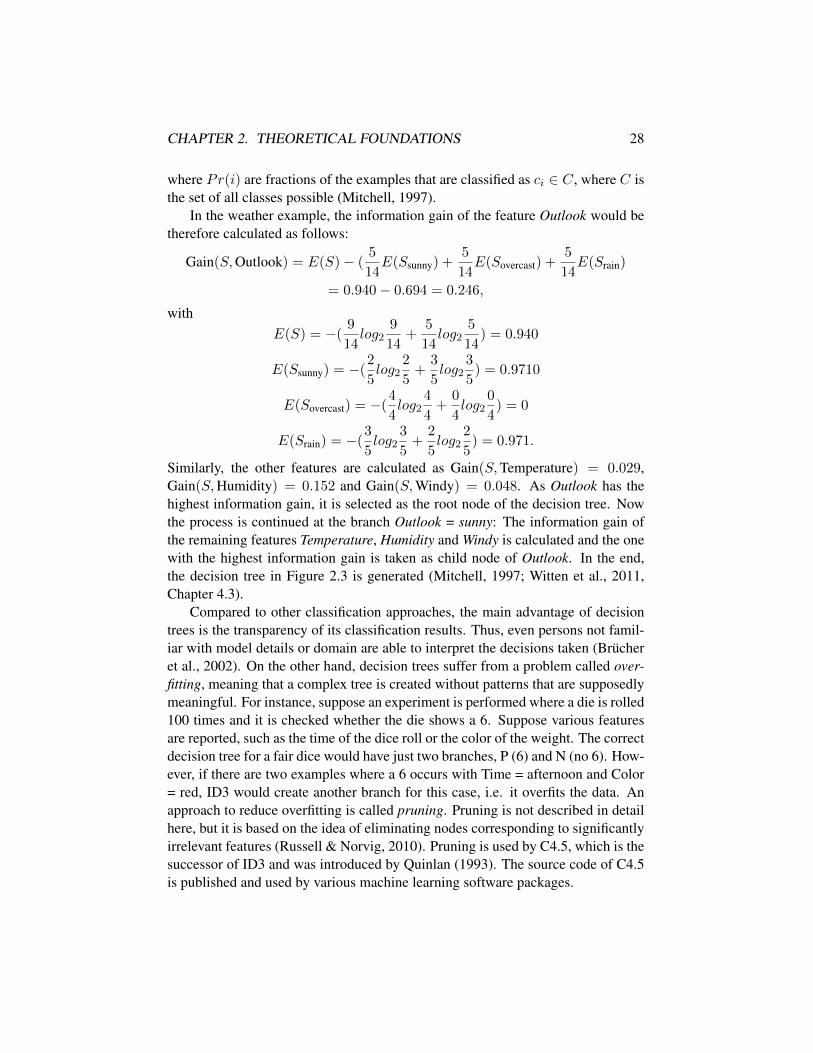
In the weather example, the information gain of the feature Outlook would betherefore calculated as follows:
Gain(S,Outlook) = E(S)− (5
14E(Ssunny) +
5
14E(Sovercast) +
5
14E(Srain)
= 0.940− 0.694 = 0.246,
withE(S) = −(
9
14log2
9
14+
5
14log2
5
14) = 0.940
E(Ssunny) = −(2
5log2
2
5+
3
5log2
3
5) = 0.9710
E(Sovercast) = −(4
4log2
4
4+
0
4log2
0
4) = 0
E(Srain) = −(3
5log2
3
5+
2
5log2
2
5) = 0.971.
Similarly, the other features are calculated as Gain(S,Temperature) = 0.029,Gain(S,Humidity) = 0.152 and Gain(S,Windy) = 0.048. As Outlook has thehighest information gain, it is selected as the root node of the decision tree. Nowthe process is continued at the branch Outlook = sunny: The information gain ofthe remaining features Temperature, Humidity and Windy is calculated and the onewith the highest information gain is taken as child node of Outlook. In the end,the decision tree in Figure 2.3 is generated (Mitchell, 1997; Witten et al., 2011,Chapter 4.3).
Compared to other classification approaches, the main advantage of decisiontrees is the transparency of its classification results. Thus, even persons not famil-iar with model details or domain are able to interpret the decisions taken (Brucheret al., 2002). On the other hand, decision trees suffer from a problem called over-fitting, meaning that a complex tree is created without patterns that are supposedlymeaningful. For instance, suppose an experiment is performed where a die is rolled100 times and it is checked whether the die shows a 6. Suppose various featuresare reported, such as the time of the dice roll or the color of the weight. The correctdecision tree for a fair dice would have just two branches, P (6) and N (no 6). How-ever, if there are two examples where a 6 occurs with Time = afternoon and Color= red, ID3 would create another branch for this case, i.e. it overfits the data. Anapproach to reduce overfitting is called pruning. Pruning is not described in detailhere, but it is based on the idea of eliminating nodes corresponding to significantlyirrelevant features (Russell & Norvig, 2010). Pruning is used by C4.5, which is thesuccessor of ID3 and was introduced by Quinlan (1993). The source code of C4.5is published and used by various machine learning software packages.
CHAPTER 2. THEORETICAL FOUNDATIONS 29
Bayesian approaches
Bayesian approaches are based on the idea of creating a probabilistic model usingthe training documents. Newly arriving test documents are assigned to the classthat is most likely to be correct based on this model (Gerstl et al., 2002). A verycommon kind of Bayesian classifiers is known as naıve Bayes (Michie et al., 1994)and builds on the assumption that all features are equally important and indepen-dent of one another if the class is known. Even though these assumptions are notrealistic, naıve Bayes performs surprisingly well (Witten et al., 2011, Chapter 4.2).However, there are extension of naıve Bayes do not depend on these assumptions(e.g. Lam et al., 1997), which are not described in detail here.
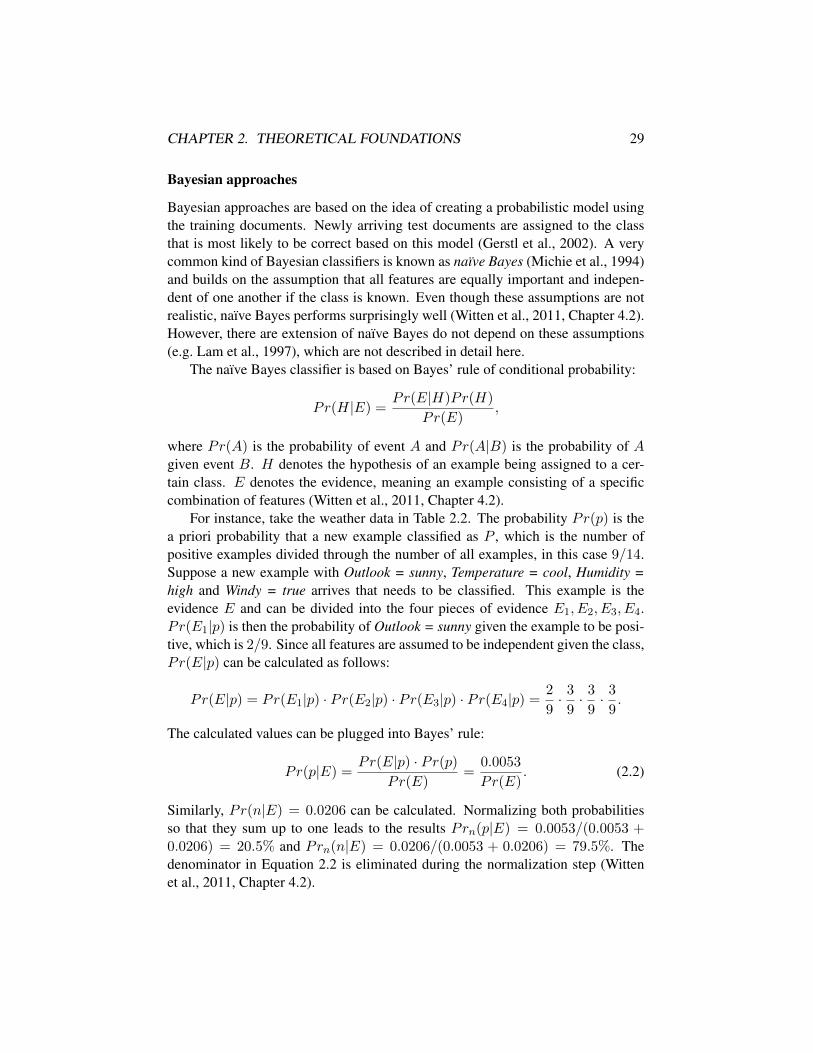
The naıve Bayes classifier is based on Bayes’ rule of conditional probability:
Pr(H|E) =Pr(E|H)Pr(H)
Pr(E),
where Pr(A) is the probability of event A and Pr(A|B) is the probability of Agiven event B. H denotes the hypothesis of an example being assigned to a cer-tain class. E denotes the evidence, meaning an example consisting of a specificcombination of features (Witten et al., 2011, Chapter 4.2).
For instance, take the weather data in Table 2.2. The probability Pr(p) is thea priori probability that a new example classified as P , which is the number ofpositive examples divided through the number of all examples, in this case 9/14.Suppose a new example with Outlook = sunny, Temperature = cool, Humidity =high and Windy = true arrives that needs to be classified. This example is theevidence E and can be divided into the four pieces of evidence E1, E2, E3, E4.Pr(E1|p) is then the probability of Outlook = sunny given the example to be posi-tive, which is 2/9. Since all features are assumed to be independent given the class,Pr(E|p) can be calculated as follows:
Pr(E|p) = Pr(E1|p) · Pr(E2|p) · Pr(E3|p) · Pr(E4|p) =2
9· 3
9· 3
9· 3
9.
The calculated values can be plugged into Bayes’ rule:
Pr(p|E) =Pr(E|p) · Pr(p)
Pr(E)=
0.0053
Pr(E). (2.2)
Similarly, Pr(n|E) = 0.0206 can be calculated. Normalizing both probabilitiesso that they sum up to one leads to the results Prn(p|E) = 0.0053/(0.0053 +0.0206) = 20.5% and Prn(n|E) = 0.0206/(0.0053 + 0.0206) = 79.5%. Thedenominator in Equation 2.2 is eliminated during the normalization step (Wittenet al., 2011, Chapter 4.2).
CHAPTER 2. THEORETICAL FOUNDATIONS 30
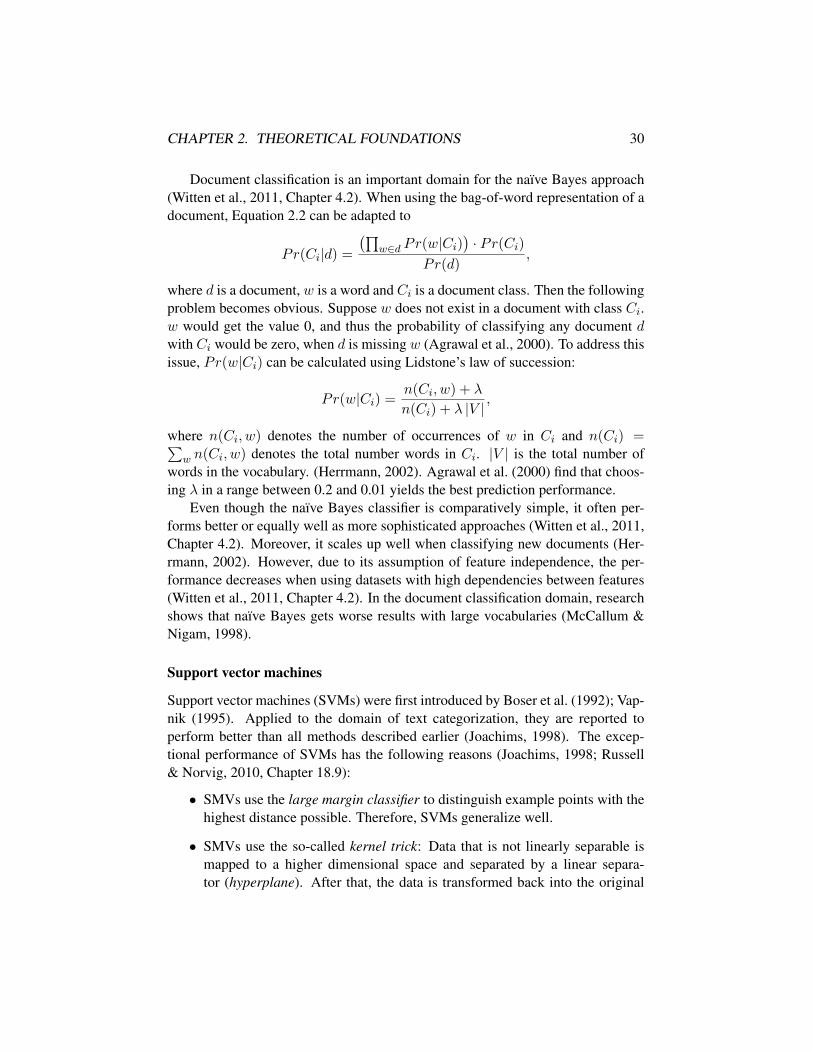
Document classification is an important domain for the naıve Bayes approach(Witten et al., 2011, Chapter 4.2). When using the bag-of-word representation of adocument, Equation 2.2 can be adapted to
Pr(Ci|d) =
(∏w∈d Pr(w|Ci)
)· Pr(Ci)
Pr(d),
where d is a document, w is a word and Ci is a document class. Then the followingproblem becomes obvious. Suppose w does not exist in a document with class Ci.w would get the value 0, and thus the probability of classifying any document dwith Ci would be zero, when d is missing w (Agrawal et al., 2000). To address thisissue, Pr(w|Ci) can be calculated using Lidstone’s law of succession:
Pr(w|Ci) =n(Ci, w) + λ
n(Ci) + λ |V |,
where n(Ci, w) denotes the number of occurrences of w in Ci and n(Ci) =∑w n(Ci, w) denotes the total number words in Ci. |V | is the total number of
words in the vocabulary. (Herrmann, 2002). Agrawal et al. (2000) find that choos-ing λ in a range between 0.2 and 0.01 yields the best prediction performance.
Even though the naıve Bayes classifier is comparatively simple, it often per-forms better or equally well as more sophisticated approaches (Witten et al., 2011,Chapter 4.2). Moreover, it scales up well when classifying new documents (Her-rmann, 2002). However, due to its assumption of feature independence, the per-formance decreases when using datasets with high dependencies between features(Witten et al., 2011, Chapter 4.2). In the document classification domain, researchshows that naıve Bayes gets worse results with large vocabularies (McCallum &Nigam, 1998).
Support vector machines
Support vector machines (SVMs) were first introduced by Boser et al. (1992); Vap-nik (1995). Applied to the domain of text categorization, they are reported toperform better than all methods described earlier (Joachims, 1998). The excep-tional performance of SVMs has the following reasons (Joachims, 1998; Russell& Norvig, 2010, Chapter 18.9):
• SMVs use the large margin classifier to distinguish example points with thehighest distance possible. Therefore, SVMs generalize well.
• SMVs use the so-called kernel trick: Data that is not linearly separable ismapped to a higher dimensional space and separated by a linear separa-tor (hyperplane). After that, the data is transformed back into the original
CHAPTER 2. THEORETICAL FOUNDATIONS 31
Ha
(a) Three possible hyperplanes
H H+H-
w
margin
(b) Optimal hyperplane H
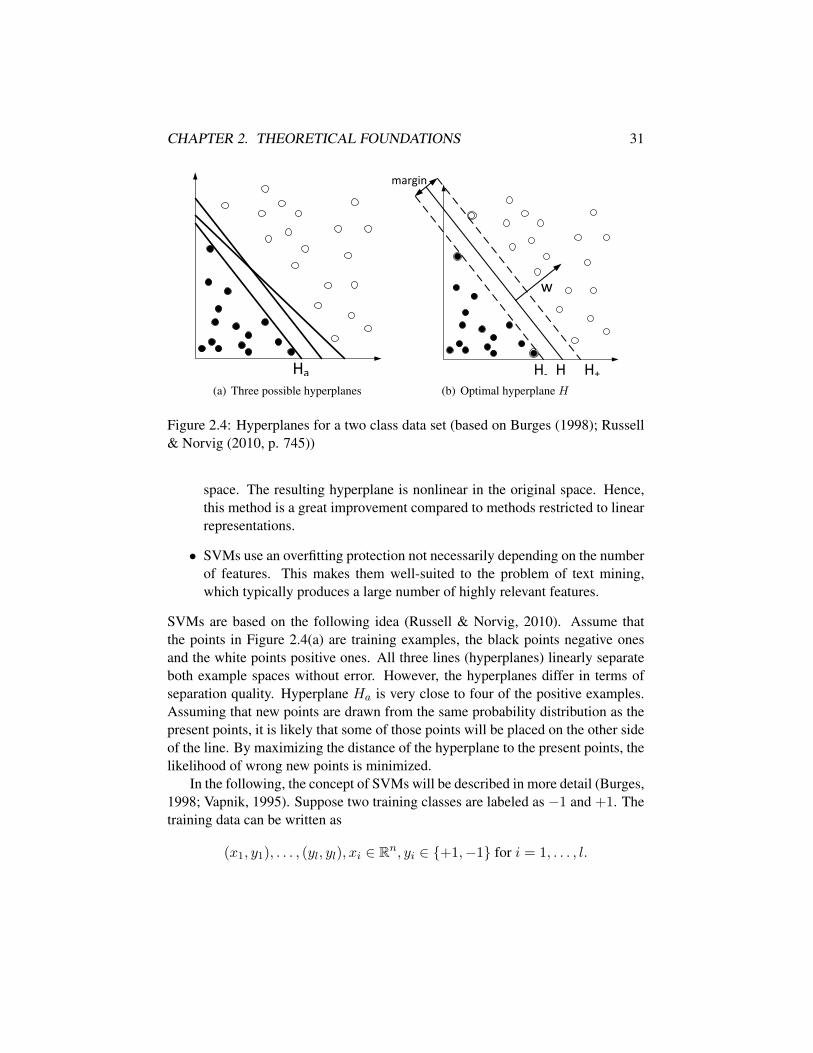
Figure 2.4: Hyperplanes for a two class data set (based on Burges (1998); Russell& Norvig (2010, p. 745))
space. The resulting hyperplane is nonlinear in the original space. Hence,this method is a great improvement compared to methods restricted to linearrepresentations.
• SVMs use an overfitting protection not necessarily depending on the numberof features. This makes them well-suited to the problem of text mining,which typically produces a large number of highly relevant features.
SVMs are based on the following idea (Russell & Norvig, 2010). Assume thatthe points in Figure 2.4(a) are training examples, the black points negative onesand the white points positive ones. All three lines (hyperplanes) linearly separateboth example spaces without error. However, the hyperplanes differ in terms ofseparation quality. Hyperplane Ha is very close to four of the positive examples.Assuming that new points are drawn from the same probability distribution as thepresent points, it is likely that some of those points will be placed on the other sideof the line. By maximizing the distance of the hyperplane to the present points, thelikelihood of wrong new points is minimized.
In the following, the concept of SVMs will be described in more detail (Burges,1998; Vapnik, 1995). Suppose two training classes are labeled as −1 and +1. Thetraining data can be written as
(x1, y1), . . . , (yl, yl), xi ∈ Rn, yi ∈ +1,−1 for i = 1, . . . , l.
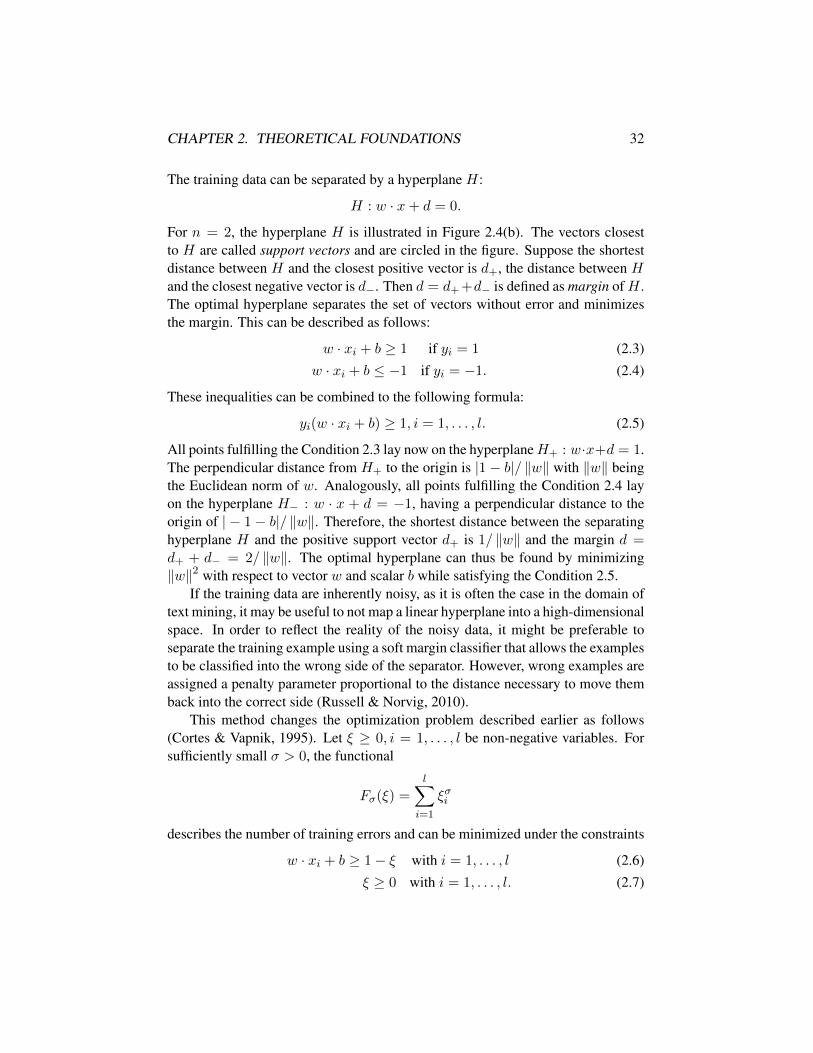
CHAPTER 2. THEORETICAL FOUNDATIONS 32
The training data can be separated by a hyperplane H:
H : w · x+ d = 0.
For n = 2, the hyperplane H is illustrated in Figure 2.4(b). The vectors closestto H are called support vectors and are circled in the figure. Suppose the shortestdistance between H and the closest positive vector is d+, the distance between Hand the closest negative vector is d−. Then d = d+ +d− is defined as margin ofH .The optimal hyperplane separates the set of vectors without error and minimizesthe margin. This can be described as follows:
w · xi + b ≥ 1 if yi = 1 (2.3)
w · xi + b ≤ −1 if yi = −1. (2.4)
These inequalities can be combined to the following formula:
yi(w · xi + b) ≥ 1, i = 1, . . . , l. (2.5)
All points fulfilling the Condition 2.3 lay now on the hyperplaneH+ : w·x+d = 1.The perpendicular distance from H+ to the origin is |1 − b|/ ‖w‖ with ‖w‖ beingthe Euclidean norm of w. Analogously, all points fulfilling the Condition 2.4 layon the hyperplane H− : w · x + d = −1, having a perpendicular distance to theorigin of | − 1 − b|/ ‖w‖. Therefore, the shortest distance between the separatinghyperplane H and the positive support vector d+ is 1/ ‖w‖ and the margin d =d+ + d− = 2/ ‖w‖. The optimal hyperplane can thus be found by minimizing‖w‖2 with respect to vector w and scalar b while satisfying the Condition 2.5.
If the training data are inherently noisy, as it is often the case in the domain oftext mining, it may be useful to not map a linear hyperplane into a high-dimensionalspace. In order to reflect the reality of the noisy data, it might be preferable toseparate the training example using a soft margin classifier that allows the examplesto be classified into the wrong side of the separator. However, wrong examples areassigned a penalty parameter proportional to the distance necessary to move themback into the correct side (Russell & Norvig, 2010).
This method changes the optimization problem described earlier as follows(Cortes & Vapnik, 1995). Let ξ ≥ 0, i = 1, . . . , l be non-negative variables. Forsufficiently small σ > 0, the functional
Fσ(ξ) =
l∑i=1
ξσi
describes the number of training errors and can be minimized under the constraints
w · xi + b ≥ 1− ξ with i = 1, . . . , l (2.6)
ξ ≥ 0 with i = 1, . . . , l. (2.7)
CHAPTER 2. THEORETICAL FOUNDATIONS 33
For computational reasons, the case σ = 1 is considered. The idea of introducinga penalty for wrong examples can be formalized as the following minimizationproblem (Vapnik, 1995):
Φ(w, ξ) =1
2w2 + C
(l∑
i=1
ξi
)with the Constraints 2.6 and 2.7, where C is a given constant (penalty parameter).This minimization problem can be transformed into the maximization problem
W (α) =l∑
i=1
αi −1
2
l∑i,j=1
yiyjαiαjK(xi, xj)
subject to the constraints
0 ≤ αi ≤ C, i = 1, . . . , l
l∑i=1
αiyi = 0,
where K(xi, xj) is called the kernel function.7 The following kernels are mostcommonly used in practice (Hsu et al., 2010):
• linear: K(xi, xj) = xTi xj
• polynomial: K(xi, xj) = (γxTi xj + r)d, γ > 0
• radial basis function (RBF): K(xi, xj) = exp(−γ ‖xi − xj‖2), γ > 0
• sigmoid: K(xi, xj) = tanh(γxTi xj + r),
where γ, r and d are kernel parameters. The most widely used software packagesimplementing the SVM approach are LIBSVM (Chang & Lin, 2011) and SVMlight
(Joachims, 1999), which perform similarly well (Zanni et al., 2006). Both packagesare free of charge and provide a variety of additional features allowing advancedparameter tuning and evaluation.
2.2.6 Evaluation
The performance of text classification can be measured in terms of effectiveness(taking the right classification decisions) and efficiency (system run time). In thisthesis, we will focus on the effectiveness, which is usually the more importantaspect (Sebastiani, 2002).
7For a detailed proof, see Vapnik (1995, p. 129 ff.)

CHAPTER 2. THEORETICAL FOUNDATIONS 34
correct labelyes no
predicted labelyes TPi FPino FNi TNi
Table 2.3: Confusion matrix for category ci
Evaluation Metrics
Evaluation metrics are based on the idea of quantifying the different kinds of pos-sible classification errors, which are illustrated in a so-called confusion matrix(Massy, 1965) as shown in Table 2.3. For instance, if the classifier decides anexample to be in class ci and it is in ci in reality, this example is a true positive. Ifthe classifier decides an example to be in ci, but in reality it is not in ci, this exam-ple is a false positive. True negatives and false negatives are defined analogously.The terms TPi, FPi, TNi and FNi depict the according number of examples, e.g.TPi is the number of true positives for class ci (Sebastiani, 2002).
The two most commonly used standard metrics are precision (π) and recall(ρ). π is the number of examples correctly classified divided by the total numberof examples classified as positive. ρ is the number of examples correctly classifieddivided by the total number of examples that are positive in reality. Formally thiscan be written as
πi =TPi
TPi + FPi
ρi =TPi
TPi + FNi.
Using two different numbers for evaluating a classifier has the advantage that onenumber might be more important than the other in certain applications. A mea-surement to express the trade-off between precision and recall is called F-measure(F ) and is defined as
Fi =1
α 1πi
+ (1− α) 1ρi
=(β2 + 1)πiρiβ2πi + ρi
,
where β2 = (1 − α)/α and α ∈ [0, 1]. β changes the relative importance ofprecision and recall in the formula (Goncalves, 2011; Manning et al., 2008, Chapter8). The form most frequently used in practice is the so-called balanced F-measure(F1) introduced by van Rijsbergen (1979), which combines precision and recall
CHAPTER 2. THEORETICAL FOUNDATIONS 35
using equal weights (α = 1/2 or β = 1) (Yang & Liu, 1999):
F1i =2πiρiπi + ρi
.
The metrics described so far evaluated only a single class. There are two stan-dard methods that can be used to evaluate a classifier across different classes,macro-averaging (M ) and micro-averaging (µ). Macro-averaging is consideredto be a per-class average, since it is calculated by first determining the values ofthe per-class confusion matrix and then compute the global score by averaging thisper-class confusion matrix. In contrast, micro-averaging is calculated by first build-ing a global confusion matrix with cells containing the sums of the correspondingper-class confusion matrices and then computing the global score based on thisglobal confusion matrix (Yang, 1999). Global precision and recall can therefore becomputed as
πM =
∑|C|i=1 πi|C|
, ρM =
∑|C|i=1 ρi|C|
,
using macro-averaging, where |C| is the total number of classes. Similarly, globalprecision and recall can be computed as
πµ =TP
TP + FP=
∑|C|i=1 TPi∑|C|
i=1(TPi + FPi),
ρµ =TP
TP + FN=
∑|C|i=1 TPi∑|C|
i=1(TPi + FNi),
using micro-averaging (Sebastiani, 2002). The global version of the balanced F-measure can be calculated as
FM1 =
∑|C|i=1 F1i
|C|and Fµ1 =
2πµρµ
πµ + ρµ.
FM1 gives every single class the same importance, whereas Fµ1 gives every singledocument the same importance (Goncalves, 2011).
Other common metrics to measure the classifier effectiveness are accuracy (A)and error (E). Accuracy is defined as number of examples correctly classifieddivided by the total number of examples. Error is defined as number of examplesincorrectly classified divided by the total number of examples (Goncalves, 2011).Formally, they can be defined as
Ai =TPi + TNi
TPi + TNi + FPi + FNi
CHAPTER 2. THEORETICAL FOUNDATIONS 36
Ei = 1−Ai =FPi + FNi
TPi + TNi + FPi + FNi
(Sebastiani, 2002).
Handling unbalanced data
Despite their simplicity, the use of the metrics accuracy and error has a majordisadvantage. For classes that are very unbalanced, meaning that the number ofpositive examples strongly differs from the number of negative examples, a triv-ial classifier rejecting or accepting all examples performs very well (Cohen, 1996).For instance, suppose a binary classification problem that divides a corpus of 1,000documents into the classes ci and cj . Suppose 980 documents belong to ci (ma-jority class) and 20 documents belong to cj (minority class). A trivial classifierassigning all documents in the corpus the class ci would get the high accuracyA = 980/1000 = 98%. A more sophisticated classifier predicting 50% of all doc-uments would do almost equally well (A = (10 + 980)/1000 = 99%), suggestingthat the classifiers are nearly equivalent, which is clearly wrong (Goncalves, 2011).
To address this problem, there are two different main approaches. First, clas-sification errors can be assigned different cost factors according to the importanceof the class. This can be done using a cost matrix C, which contains the samerows and columns as the confusion matrix in Table 2.3. In the cost matrix eachcell C(i, j) represents the cost for classifying an example to class i when it inreality belongs to class j (Domingos, 1999). Notice that most learning schemesare able to predict not only the actual value of an instance, but also the probabil-ity of that prediction to be correct. The cost values can be combined with theseprobabilities and for each instance, the classifier makes a prediction by minimizingthe costs (Witten et al., 2011). Second, oversampling and undersampling can beused to artificially change the distribution of the examples before training. Over-sampling creates synthetic examples (often duplicates) belonging to the minorityclass, whereas undersampling discards examples belonging to the majority class.Undersampling has the disadvantage of deleting potentially useful examples in thetraining set. On the other hand, oversampling has the disadvantage of generatingcopies of examples and thus, increasing the risk of overfitting. In addition, thedata set becomes larger, which increases the training time (Weiss et al., 2007).SMOTE, an implementation of an oversampling approach is publicly available andfree of charge (Chawla et al., 2002). It addresses the problem of oversampling bycreating random examples rather than copying existing ones. Despite their disad-vantages, oversampling and undersampling obtained good results in the past (e.g.Chen et al., 2004; Kubat & Matwin, 1997). Weiss et al. (2007) report that cost-based approaches consistently outperform over- and undersampling when dealing
CHAPTER 2. THEORETICAL FOUNDATIONS 37
with large data sets (more than 10,000 examples). For smaller data sets, neither ofthe approaches can be identified as clearly superior.
k-fold cross validation
k-fold cross validation (Kohavi, 1995) is a way to evaluate data statistically validon a single data set even when only a limited amount of data is available. It isdone by dividing the data set randomly into k disjoint subsets of approximatelyequal size. This random sampling should be done in a way that each class hasabout the same proportion in the training set as in the test set. Otherwise, certainclasses would be overrepresented in the test set and bias the results. This processis called stratification. Successively, k rounds of training are performed. In eachround, a different subset is used as test data and the remaining data is used fortraining, until in the end each subset has been used for testing exactly once. Themost commonly used value for k is 10, a variant which is also called tenfold crossvalidation. Research has shown that k = 10 usually performs best (Witten et al.,2011, Chapter 5).
Chapter 3
Review of relevant systems
Forecasting price movements using text mining techniques has been investigatedby many researchers in the past two decades. In this chapter, we discuss the sys-tems we consider to be the most important ones for the research in this thesis.Most systems use different types of input data, support different domains and servedifferent purposes (some predicting price trends, others volatility). However, thesystems are typically developed following the schema in Figure 3.1.
News articles and stock (or stock index) price data are first gathered and storedlocally. The news articles are then preprocessed, which often includes word stem-ming, stop word removal and feature extraction using approaches such as bag-of-words or word phrases. In a next step, the price data are used to assess the influenceof the news article on the stock price. For instance, if a price jump occurs a fewminutes after a news release, the news could be assumed to influence the price pos-itively. The news articles are given labels like UP, DOWN and STABLE accordingly.Next, the labeled news articles are used as training data and a classifier is trained.In the forecast (application) phase, the system is fed with news and automaticallylabels them, typically in order to support investors’ trading decisions.
3.1 Description of relevant systems
Wuthrich et al. (1998)
Wuthrich et al. pioneered by developing a prototype that aims to predict move-ments of five major stock indices in the U.S., Asia and Europe, amongst themthe Dow Jones Industrial Average, daily at 7:45 am Hong Kong time (Cho et al.,1999; Wuthrich et al., 1998). News articles published online by the Wall Street
38
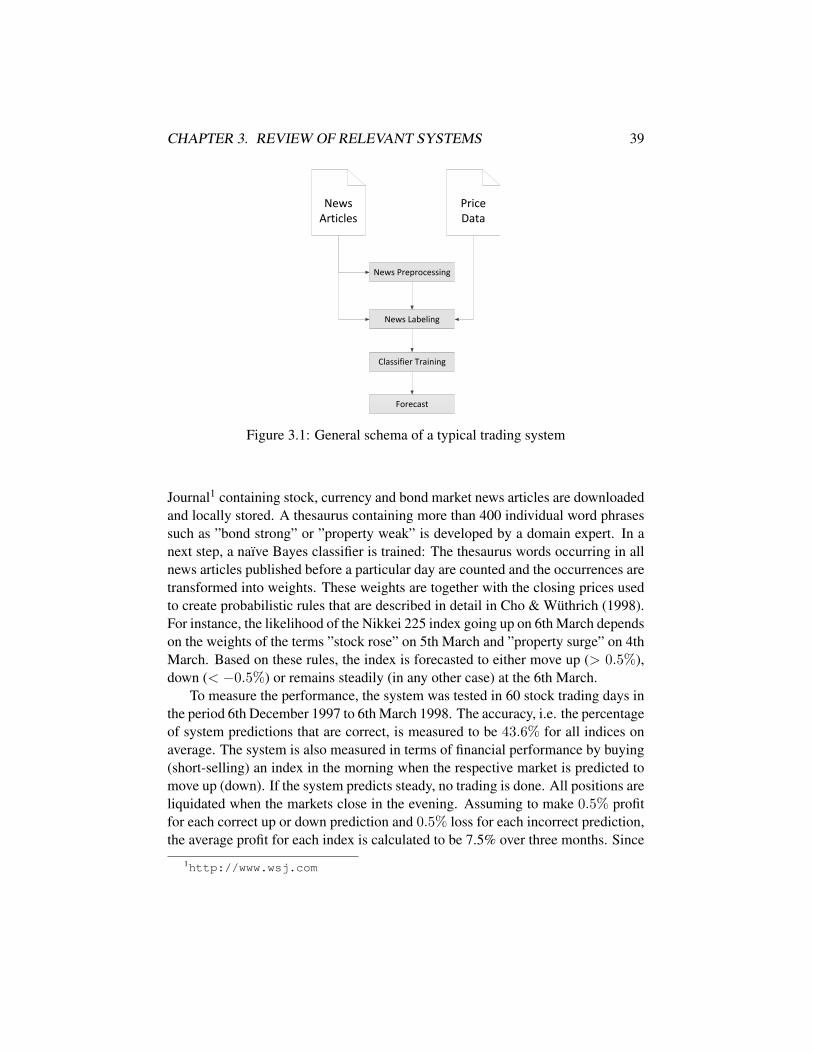
CHAPTER 3. REVIEW OF RELEVANT SYSTEMS 39
News Articles
Price Data
News Preprocessing
News Labeling
Classifier Training
Forecast
Figure 3.1: General schema of a typical trading system
Journal1 containing stock, currency and bond market news articles are downloadedand locally stored. A thesaurus containing more than 400 individual word phrasessuch as ”bond strong” or ”property weak” is developed by a domain expert. In anext step, a naıve Bayes classifier is trained: The thesaurus words occurring in allnews articles published before a particular day are counted and the occurrences aretransformed into weights. These weights are together with the closing prices usedto create probabilistic rules that are described in detail in Cho & Wuthrich (1998).For instance, the likelihood of the Nikkei 225 index going up on 6th March dependson the weights of the terms ”stock rose” on 5th March and ”property surge” on 4thMarch. Based on these rules, the index is forecasted to either move up (> 0.5%),down (< −0.5%) or remains steadily (in any other case) at the 6th March.
To measure the performance, the system was tested in 60 stock trading days inthe period 6th December 1997 to 6th March 1998. The accuracy, i.e. the percentageof system predictions that are correct, is measured to be 43.6% for all indices onaverage. The system is also measured in terms of financial performance by buying(short-selling) an index in the morning when the respective market is predicted tomove up (down). If the system predicts steady, no trading is done. All positions areliquidated when the markets close in the evening. Assuming to make 0.5% profitfor each correct up or down prediction and 0.5% loss for each incorrect prediction,the average profit for each index is calculated to be 7.5% over three months. Since
1http://www.wsj.com
CHAPTER 3. REVIEW OF RELEVANT SYSTEMS 40
the system traded at only 40 days, this equals a round trip profit (profit for buyingand selling a security) of 7.5%/40 = 0.13% (Mittermayer & Knolmayer, 2006b).No transaction costs are taken into account.
However, the good financial performance reported cannot be achieved inreality. The authors make the invalid assumption that closing prices are on averageidentical to the next day’s opening prices (Mittermayer & Knolmayer, 2006b).Moreover, the authors themselves acknowledge that the system could benefit fromtaking numeric time series data into account (Wuthrich et al., 1998).
Fawcett & Provost (1999)
Fawcett & Provost do not try to exploit security price movements, but rather aimto issue alarms before a stock price “spike” happens. A spike is defined as a 10%price change in either direction. News stories and stock prices for approximately6,000 companies in a three months time frame are gathered. Details such as thenews source, the stock price frequency or the company choice are not specified.A story is labeled with a price spike if it appears from midnight the day beforethe spike until 10:30 am at the day of the spike. An adjusted version of the frauddetection system DC-1 (Fawcett & Provost, 1997) is used for extracting words andbigrams from the news and does the classifier training.
The implementation and analysis details of this system are not published.
Lavrenko et al. (1999)
The system Ænalyst developed by Lavrenko et al. tries to predict forthcomingtrends in prices of single stocks (Lavrenko et al., 1999, 2000a,b). In a first step,stock price trends are identified using the piecewise linear regression technique(Pavlidis & Horowitz, 1974). Time series are transformed into segments of ap-proximately two hours and associated with one of the labels SURGE (segment slope≥ 75%), SLIGHT+ (segment slope ≥ 50%), plunge (segment slope ≤ −75%),SLIGHT- (segment slope ≤ −50%) and NO RECOMMENDATION (any other case).Next, financial news articles are gathered from Yahoo! Finance2, which maintainsa list of stories considered to be relevant to a particular stock symbol. Each newsarticle is then associated with a price trend and its according label if the news arti-cle’s time stamp is h hours or less before the start of the trend. Using a window of5 to 10 hours tends to work best. The training is performed using the bag-of-words
2Formerly http://biz.yahoo.com, now http://finance.yahoo.com/
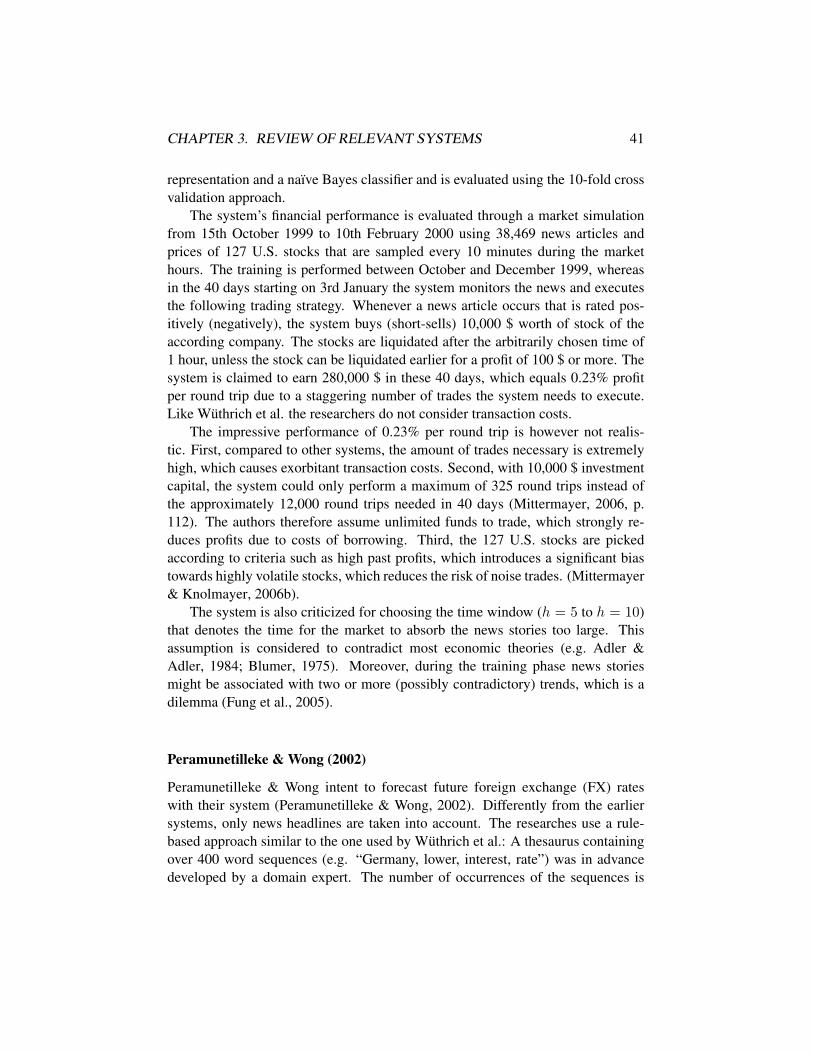
CHAPTER 3. REVIEW OF RELEVANT SYSTEMS 41
representation and a naıve Bayes classifier and is evaluated using the 10-fold crossvalidation approach.
The system’s financial performance is evaluated through a market simulationfrom 15th October 1999 to 10th February 2000 using 38,469 news articles andprices of 127 U.S. stocks that are sampled every 10 minutes during the markethours. The training is performed between October and December 1999, whereasin the 40 days starting on 3rd January the system monitors the news and executesthe following trading strategy. Whenever a news article occurs that is rated pos-itively (negatively), the system buys (short-sells) 10,000 $ worth of stock of theaccording company. The stocks are liquidated after the arbitrarily chosen time of1 hour, unless the stock can be liquidated earlier for a profit of 100 $ or more. Thesystem is claimed to earn 280,000 $ in these 40 days, which equals 0.23% profitper round trip due to a staggering number of trades the system needs to execute.Like Wuthrich et al. the researchers do not consider transaction costs.
The impressive performance of 0.23% per round trip is however not realis-tic. First, compared to other systems, the amount of trades necessary is extremelyhigh, which causes exorbitant transaction costs. Second, with 10,000 $ investmentcapital, the system could only perform a maximum of 325 round trips instead ofthe approximately 12,000 round trips needed in 40 days (Mittermayer, 2006, p.112). The authors therefore assume unlimited funds to trade, which strongly re-duces profits due to costs of borrowing. Third, the 127 U.S. stocks are pickedaccording to criteria such as high past profits, which introduces a significant biastowards highly volatile stocks, which reduces the risk of noise trades. (Mittermayer& Knolmayer, 2006b).
The system is also criticized for choosing the time window (h = 5 to h = 10)that denotes the time for the market to absorb the news stories too large. Thisassumption is considered to contradict most economic theories (e.g. Adler &Adler, 1984; Blumer, 1975). Moreover, during the training phase news storiesmight be associated with two or more (possibly contradictory) trends, which is adilemma (Fung et al., 2005).
Peramunetilleke & Wong (2002)
Peramunetilleke & Wong intent to forecast future foreign exchange (FX) rateswith their system (Peramunetilleke & Wong, 2002). Differently from the earliersystems, only news headlines are taken into account. The researches use a rule-based approach similar to the one used by Wuthrich et al.: A thesaurus containingover 400 word sequences (e.g. “Germany, lower, interest, rate”) was in advancedeveloped by a domain expert. The number of occurrences of the sequences is
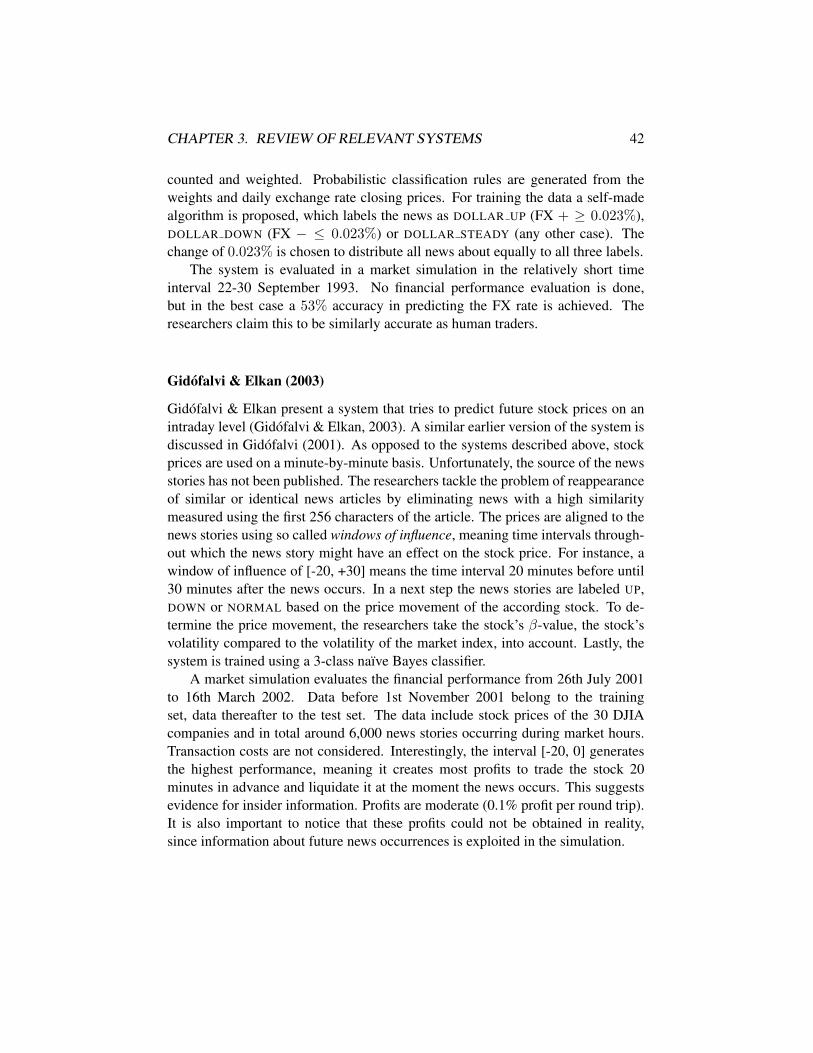
CHAPTER 3. REVIEW OF RELEVANT SYSTEMS 42
counted and weighted. Probabilistic classification rules are generated from theweights and daily exchange rate closing prices. For training the data a self-madealgorithm is proposed, which labels the news as DOLLAR UP (FX + ≥ 0.023%),DOLLAR DOWN (FX − ≤ 0.023%) or DOLLAR STEADY (any other case). Thechange of 0.023% is chosen to distribute all news about equally to all three labels.
The system is evaluated in a market simulation in the relatively short timeinterval 22-30 September 1993. No financial performance evaluation is done,but in the best case a 53% accuracy in predicting the FX rate is achieved. Theresearchers claim this to be similarly accurate as human traders.
Gidofalvi & Elkan (2003)
Gidofalvi & Elkan present a system that tries to predict future stock prices on anintraday level (Gidofalvi & Elkan, 2003). A similar earlier version of the system isdiscussed in Gidofalvi (2001). As opposed to the systems described above, stockprices are used on a minute-by-minute basis. Unfortunately, the source of the newsstories has not been published. The researchers tackle the problem of reappearanceof similar or identical news articles by eliminating news with a high similaritymeasured using the first 256 characters of the article. The prices are aligned to thenews stories using so called windows of influence, meaning time intervals through-out which the news story might have an effect on the stock price. For instance, awindow of influence of [-20, +30] means the time interval 20 minutes before until30 minutes after the news occurs. In a next step the news stories are labeled UP,DOWN or NORMAL based on the price movement of the according stock. To de-termine the price movement, the researchers take the stock’s β-value, the stock’svolatility compared to the volatility of the market index, into account. Lastly, thesystem is trained using a 3-class naıve Bayes classifier.
A market simulation evaluates the financial performance from 26th July 2001to 16th March 2002. Data before 1st November 2001 belong to the trainingset, data thereafter to the test set. The data include stock prices of the 30 DJIAcompanies and in total around 6,000 news stories occurring during market hours.Transaction costs are not considered. Interestingly, the interval [-20, 0] generatesthe highest performance, meaning it creates most profits to trade the stock 20minutes in advance and liquidate it at the moment the news occurs. This suggestsevidence for insider information. Profits are moderate (0.1% profit per round trip).It is also important to notice that these profits could not be obtained in reality,since information about future news occurrences is exploited in the simulation.
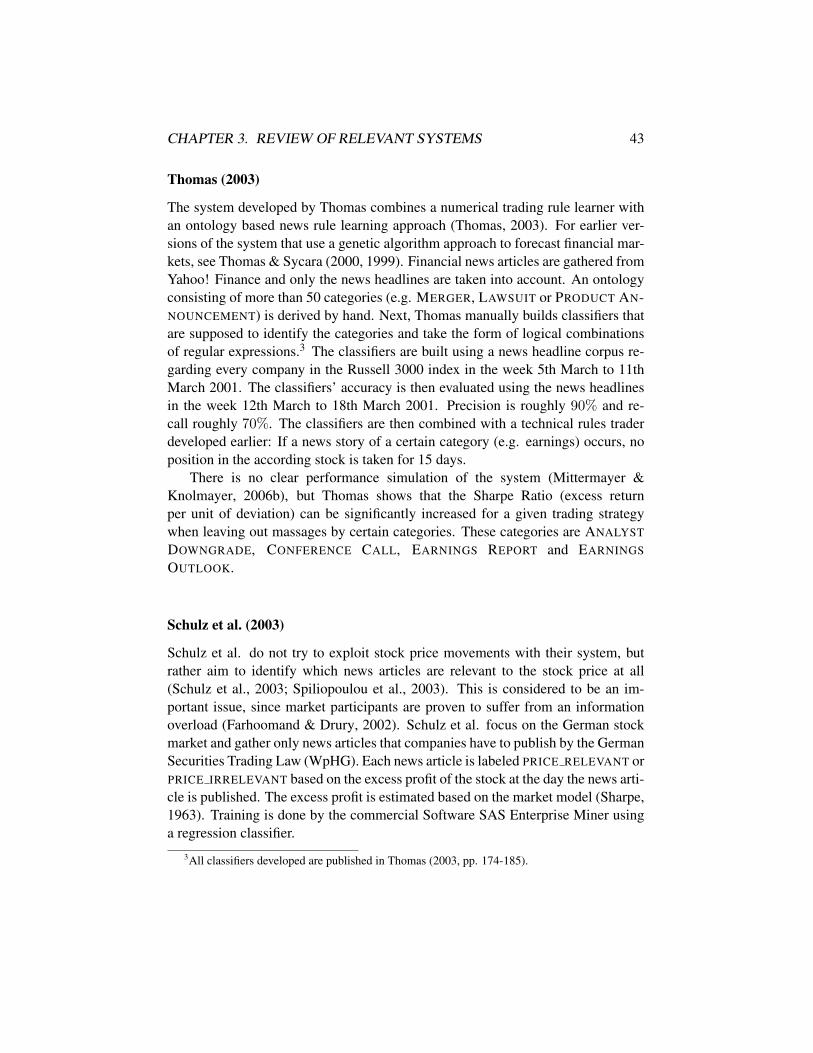
CHAPTER 3. REVIEW OF RELEVANT SYSTEMS 43
Thomas (2003)
The system developed by Thomas combines a numerical trading rule learner withan ontology based news rule learning approach (Thomas, 2003). For earlier ver-sions of the system that use a genetic algorithm approach to forecast financial mar-kets, see Thomas & Sycara (2000, 1999). Financial news articles are gathered fromYahoo! Finance and only the news headlines are taken into account. An ontologyconsisting of more than 50 categories (e.g. MERGER, LAWSUIT or PRODUCT AN-NOUNCEMENT) is derived by hand. Next, Thomas manually builds classifiers thatare supposed to identify the categories and take the form of logical combinationsof regular expressions.3 The classifiers are built using a news headline corpus re-garding every company in the Russell 3000 index in the week 5th March to 11thMarch 2001. The classifiers’ accuracy is then evaluated using the news headlinesin the week 12th March to 18th March 2001. Precision is roughly 90% and re-call roughly 70%. The classifiers are then combined with a technical rules traderdeveloped earlier: If a news story of a certain category (e.g. earnings) occurs, noposition in the according stock is taken for 15 days.
There is no clear performance simulation of the system (Mittermayer &Knolmayer, 2006b), but Thomas shows that the Sharpe Ratio (excess returnper unit of deviation) can be significantly increased for a given trading strategywhen leaving out massages by certain categories. These categories are ANALYST
DOWNGRADE, CONFERENCE CALL, EARNINGS REPORT and EARNINGS
OUTLOOK.
Schulz et al. (2003)
Schulz et al. do not try to exploit stock price movements with their system, butrather aim to identify which news articles are relevant to the stock price at all(Schulz et al., 2003; Spiliopoulou et al., 2003). This is considered to be an im-portant issue, since market participants are proven to suffer from an informationoverload (Farhoomand & Drury, 2002). Schulz et al. focus on the German stockmarket and gather only news articles that companies have to publish by the GermanSecurities Trading Law (WpHG). Each news article is labeled PRICE RELEVANT orPRICE IRRELEVANT based on the excess profit of the stock at the day the news arti-cle is published. The excess profit is estimated based on the market model (Sharpe,1963). Training is done by the commercial Software SAS Enterprise Miner usinga regression classifier.
3All classifiers developed are published in Thomas (2003, pp. 174-185).
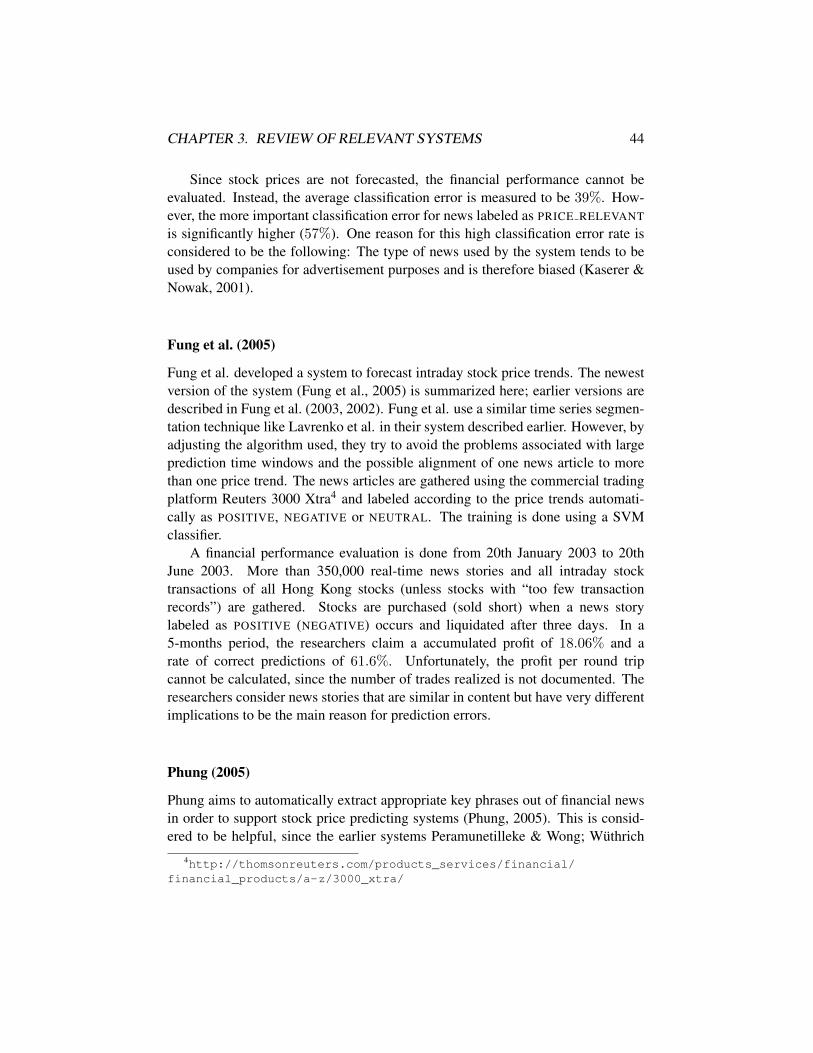
CHAPTER 3. REVIEW OF RELEVANT SYSTEMS 44
Since stock prices are not forecasted, the financial performance cannot beevaluated. Instead, the average classification error is measured to be 39%. How-ever, the more important classification error for news labeled as PRICE RELEVANT
is significantly higher (57%). One reason for this high classification error rate isconsidered to be the following: The type of news used by the system tends to beused by companies for advertisement purposes and is therefore biased (Kaserer &Nowak, 2001).
Fung et al. (2005)
Fung et al. developed a system to forecast intraday stock price trends. The newestversion of the system (Fung et al., 2005) is summarized here; earlier versions aredescribed in Fung et al. (2003, 2002). Fung et al. use a similar time series segmen-tation technique like Lavrenko et al. in their system described earlier. However, byadjusting the algorithm used, they try to avoid the problems associated with largeprediction time windows and the possible alignment of one news article to morethan one price trend. The news articles are gathered using the commercial tradingplatform Reuters 3000 Xtra4 and labeled according to the price trends automati-cally as POSITIVE, NEGATIVE or NEUTRAL. The training is done using a SVMclassifier.
A financial performance evaluation is done from 20th January 2003 to 20thJune 2003. More than 350,000 real-time news stories and all intraday stocktransactions of all Hong Kong stocks (unless stocks with “too few transactionrecords”) are gathered. Stocks are purchased (sold short) when a news storylabeled as POSITIVE (NEGATIVE) occurs and liquidated after three days. In a5-months period, the researchers claim a accumulated profit of 18.06% and arate of correct predictions of 61.6%. Unfortunately, the profit per round tripcannot be calculated, since the number of trades realized is not documented. Theresearchers consider news stories that are similar in content but have very differentimplications to be the main reason for prediction errors.
Phung (2005)
Phung aims to automatically extract appropriate key phrases out of financial newsin order to support stock price predicting systems (Phung, 2005). This is consid-ered to be helpful, since the earlier systems Peramunetilleke & Wong; Wuthrich
4http://thomsonreuters.com/products_services/financial/financial_products/a-z/3000_xtra/
CHAPTER 3. REVIEW OF RELEVANT SYSTEMS 45
et al. frequently use keywords provided by domain experts, which are not neces-sarily applicable to different business sectors. The news articles are gathered fromthe Malaysian newspaper “The Star Online”5 and are filtered using hand-pickedword queries relevant to company and sector. Subsequently, an adapted versionof the automatic keyphrase extraction algorithm (KEA) proposed by Witten et al.(1999b), which uses a naıve Bayes classifier, is used to extract key word phrasesfrom the news articles.
Since Phung only extracts financial keywords based on word queries, nofinancial performance evaluation is done. However, the prediction accuracy isevaluated using a test period from 1st February to 30th April 2004 and a trainingperiod from 1st May to 31st July. 90 news articles are gathered in total. In thetest period, precision is 21.1%, recall is 21.4%. Phung explains this relatively lowaccuracy partly with the unreliability of word queries chosen initially.
Mittermayer & Knolmayer (2006a)
Mittermayer & Knolmayer developed another system trying to predict intradaystock prices using text mining approaches (Mittermayer, 2004, 2006; Mittermayer& Knolmayer, 2006a). Only U.S. press releases are taken into account, which areacquired from the newswire service PR Newswire. The following news articlesare filtered out in advance: News articles associated with more than one company,news articles that occur outside the trading hours and news articles belonging to acategory that is considered to be non-relevant. The news articles are automaticallylabeled as follows: The 15 minutes after a news release are divided into 49 mov-ing average time windows of 90 seconds each. Using real time stock prices, theprofits of each time window are calculated compared to the average price between1 minute before and 1 minute after the news occurrence. For a maximum profit of> 3% and a maximum loss of< 3%, news articles are labeled as GOOD. News arti-cles are labeled as BAD analogously. If maximum and minimum loss both exceed acertain threshold, news articles are labeled as UNCLEAR and are excluded from thetraining process. In other case, the news articles are labeled as NEUTRAL. The dataare in a next step trained using a bag-of-words approach and different classifiers.The SVM classifier with polynomial kernel performs best. The researchers alsouse a handcrafted thesaurus containing words and word phrases assumed to drivestock prices. Features in this thesaurus are forced into the final set of features,which partially overrides the results of the bag-of-words approach. The thesaurusis made publicly available in (Mittermayer, 2006, pp. 240-242).
5http://biz.thestar.com.my/
CHAPTER 3. REVIEW OF RELEVANT SYSTEMS 46
Training this done from 1st April to 31st December 2002 with all newspublished by PRNewswire and intraday prices of all S&P 500 stocks in 15-secondintervals. An accuracy and financial performance evaluation is done via a marketsimulation form 1st January to 31st December 2003. The researchers use asimilar trading strategy like Lavrenko et al.. Stocks are purchased (short-sold)when news articles are labeled as GOOD (BAD). All positions are liquidatedafter 15 minutes, with the exception of stocks gaining > 0.5% or losing < 2%.Those are immediately liquidated when hitting the threshold. The accuracyrate is 82%, which is exceptionally good, taking into account that no earliersystem obtained more than 50%. The average profits per round trip are in thebest case 0.29%, outperforming the results reported by Lavrenko et al.. Theresearchers explain the good performance with the careful selection of news arti-cles, the application of noise-reducing heuristics and their novel labeling approach.
Robertson et al. (2006)
Robertson et al. developed a system focusing on stocks at the U.S., UK and Aus-tralian market (Robertson et al., 2006, 2007a,b,c; Robertson, 2008). Similarly toSchulz et al. their goal is to separate news articles relevant to the market behav-ior from irrelevant ones. News articles are gathered using the commercial soft-ware Bloomberg Professional6 and include Press Announcements, Annual Reports,Analyst Recommendations and general news from more than 200 different newsproviders. An adapted version of the Generalized Autoregressive Conditional Het-eroskedasticity (GARCH) model proposed by Bollerslev (1986) is used to calcu-late the difference between forecasted and realized stock volatility in a defined timewindow ∆t after a news arrival. News articles with a high forecast error are labeledas INTERESTING, all other news articles are labeled as UNINTERESTING. The dataare trained using an SVM classifier and a C4.5 decision tree classifier. Choosingthe SVM classifier and ∆t = 5 minutes performs best in most test settings.
Forecast accuracy is evaluated through a market simulation using intradaystock prices of stocks in the S&P 100, FTSE 100 and ASX 100 indices in a timeperiod from 1st May 2005 to 31st August 2006. The accuracy measured for theU.S. market is 80%, which is similar to the results Mittermayer & Knolmayerachieved.7 However, the researchers acknowledge that the prediction of stock
6Bloomberg Professional R© is a trademark of Bloomberg Finance L.P., a Delaware limited part-nership, or its subsidiaries.
7The researchers claim in Robertson et al. (2007a) to achieve a higher accuracy than Mittermayer(2004). However, they compare the accuracy (percentage of vectors correctly classified) to the aver-age weighted recall, which is invalid.
CHAPTER 3. REVIEW OF RELEVANT SYSTEMS 47
prices done by Mittermayer & Knolmayer is harder than the classification inrelevant and irrelevant news (Robertson et al., 2007a).
Schumaker & Chen (2006)
Schumaker & Chen aim to forecast intraday stock prices with their system (Schu-maker & Chen, 2006, 2010, 2008, 2009).8 News articles are gathered from Yahoo!Finance and features are extracted using three different approaches, namely bag-of-words, noun phrases and named entities. Unlike in most of the other systems,news articles are not labeled with a single term such as UP or DOWN but are givendiscrete numeric price predictions. This is achieved by performing linear regres-sion on the minute-by-minute price data 60 minutes prior to the news occurrenceand extrapolating what the stock price should be 20 minutes later. For training, thesupport vector regression (SVR) method described in Vapnik (1995) is used, anadapted version of SVM that is able to handle discrete number analysis.
Performance is evaluated by a market simulation in 26th October to 28thNovember 2005, which is shorter than the time periods used by most other systems.However, since all stock quotes are gathered on an intraday level, the time periodseems to be appropriate. Stocks are traded based on the approach used by Mitter-mayer & Knolmayer (2006a). Once a news article is published, the system buys(short-sells) the according stock if the price is predicted to be≥ 1% higher (lower)20 minutes later. The directional accuracy, meaning the percentage of times thepredicted price value was in the correct direction, is 50.7% using the noun phrasesapproach, outperforming bag-of-words (49.3%) and named entities (49.2%). Theresearchers claim to achieve a profit of 3.60% using the named entities approach,outperforming bag-of-words (2.24%) and noun phrases (2.15%).
However, looking more closely at the results reveals that 108 trades are neces-sary to achieve the best performance of 3.60%, investing a total of 108,000$ andgaining a total of 3,893$. This makes an average profit of 3, 893$/108 = 36.05$for each trade, boiling it down to a profit per round trip of 0.36% (named entities),0.22% (bag-of-words) and 0.22% (noun phrases). A 0.36% round trip profit isstill better than the ones achieved by most of the other systems. This might besurprising since the directional accuracy is not particularly high (49.2% chanceof predicting the correct direction). One explanation could be the conservativetrading strategy mentioned in Schumaker & Chen (2006): Taking only namedentities into account leads to less trades than using bag-of-words or noun phrases,
8A different version of the system taking Sentiment Analysis into account (Schumaker et al.,2012a,b), is not described here in detail.
CHAPTER 3. REVIEW OF RELEVANT SYSTEMS 48
which in turn decreases the probability of purchases that cause losses.
Groth & Muntermann (2008)
Groth & Muntermann developed a system forecasting intraday price movements ofGerman stocks using ad hoc disclosures enforced by German law (Groth & Munter-mann, 2008, 2009). Announcements are obtained from the Deutsche Gesellschaftfur Ad-hoc-Publizitat (DGAP) and are automatically labeled as POSITIVE or NEG-ATIVE, depending on whether the according stock price 15 minutes after the an-nouncement time is higher or lower than the price at the announcement time. Theauthors assume this time frame to be too short for significant influences by simul-taneous market fluctuations. Therefore, they do not take the market index intoaccount. Features are extracted using the bag-of-words approach. The training isperformed using an SVM classifier with a linear kernel.
Performance is evaluated by means of a 10-fold cross validation. The SVM ap-proach is compared to a DefaultLearner (Mierswa et al., 2006) that creates a modelbased on a default value for all examples. Since there are more instances labeled asPOSITIVE, the DefaultLearner simply classifies all instances POSITIVE. The over-all accuracy of the SVM approach is 56.50% and worse than the DefaultLearneraccuracy (60.76%). Financial performance is evaluated using ad hoc announce-ments published between 1st August 2003 and 29th July 2005. On occurrence ofan announcement labeled as POSITIVE (NEGATIVE), stocks are purchased (short-sold) and liquidated 15 minutes later. Despite the low accuracy, SVM earns anaverage 1.05% profit per round trip and outperforms the DefaultLearner from thefinancial point of view. A reason for this discrepancy might be that the SVM ap-proach outperforms the DefaultLearner in recall and precision for the NEGATIVE
class, which might offset expected losses from the poor classification quality of thePOSITIVE class (Groth & Muntermann, 2009). Finally, the authors apply a t-test toprove that the results are statistically significant.
Unfortunately, no details are given about the size and amount of trades nec-essary to achieve the good financial performance. An assumption about expectedborrowing and transaction costs is therefore not possible.
The authors developed an adapted version of the system focusing on forecast-ing stock price volatility rather than prices (Groth, 2010; Groth & Muntermann,2011). The system uses a similar training and evaluation setup as before, but labelsthe announcements according to an intraday market risk model proposed by Ahnet al. (2001). Similarly to Schulz et al. the goal of this system is merely to supporttraders confronted with information overflow issues.
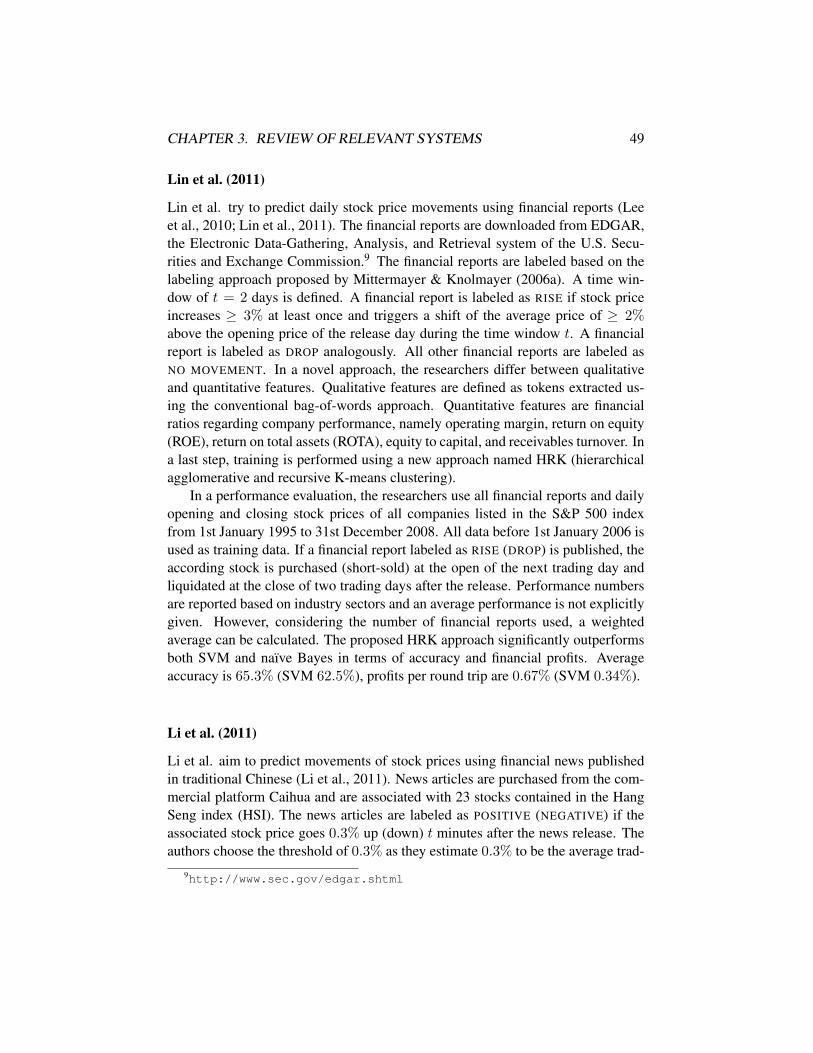
CHAPTER 3. REVIEW OF RELEVANT SYSTEMS 49
Lin et al. (2011)
Lin et al. try to predict daily stock price movements using financial reports (Leeet al., 2010; Lin et al., 2011). The financial reports are downloaded from EDGAR,the Electronic Data-Gathering, Analysis, and Retrieval system of the U.S. Secu-rities and Exchange Commission.9 The financial reports are labeled based on thelabeling approach proposed by Mittermayer & Knolmayer (2006a). A time win-dow of t = 2 days is defined. A financial report is labeled as RISE if stock priceincreases ≥ 3% at least once and triggers a shift of the average price of ≥ 2%above the opening price of the release day during the time window t. A financialreport is labeled as DROP analogously. All other financial reports are labeled asNO MOVEMENT. In a novel approach, the researchers differ between qualitativeand quantitative features. Qualitative features are defined as tokens extracted us-ing the conventional bag-of-words approach. Quantitative features are financialratios regarding company performance, namely operating margin, return on equity(ROE), return on total assets (ROTA), equity to capital, and receivables turnover. Ina last step, training is performed using a new approach named HRK (hierarchicalagglomerative and recursive K-means clustering).
In a performance evaluation, the researchers use all financial reports and dailyopening and closing stock prices of all companies listed in the S&P 500 indexfrom 1st January 1995 to 31st December 2008. All data before 1st January 2006 isused as training data. If a financial report labeled as RISE (DROP) is published, theaccording stock is purchased (short-sold) at the open of the next trading day andliquidated at the close of two trading days after the release. Performance numbersare reported based on industry sectors and an average performance is not explicitlygiven. However, considering the number of financial reports used, a weightedaverage can be calculated. The proposed HRK approach significantly outperformsboth SVM and naıve Bayes in terms of accuracy and financial profits. Averageaccuracy is 65.3% (SVM 62.5%), profits per round trip are 0.67% (SVM 0.34%).
Li et al. (2011)
Li et al. aim to predict movements of stock prices using financial news publishedin traditional Chinese (Li et al., 2011). News articles are purchased from the com-mercial platform Caihua and are associated with 23 stocks contained in the HangSeng index (HSI). The news articles are labeled as POSITIVE (NEGATIVE) if theassociated stock price goes 0.3% up (down) t minutes after the news release. Theauthors choose the threshold of 0.3% as they estimate 0.3% to be the average trad-
9http://www.sec.gov/edgar.shtml
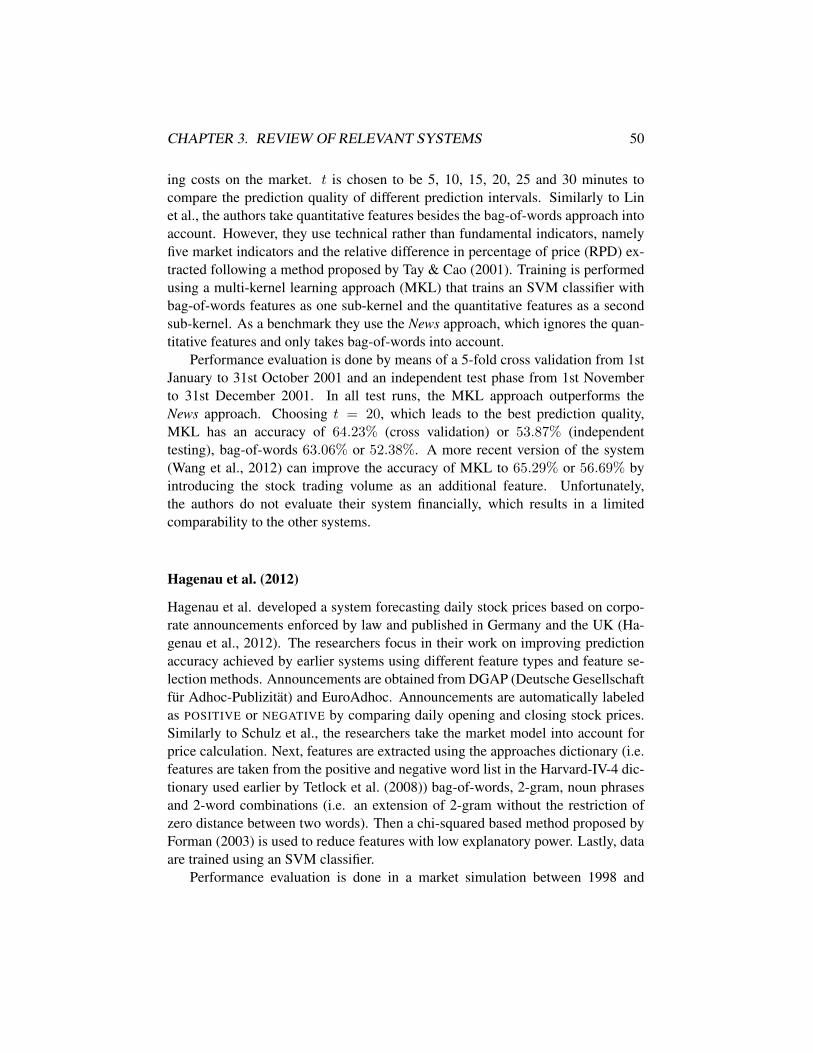
CHAPTER 3. REVIEW OF RELEVANT SYSTEMS 50
ing costs on the market. t is chosen to be 5, 10, 15, 20, 25 and 30 minutes tocompare the prediction quality of different prediction intervals. Similarly to Linet al., the authors take quantitative features besides the bag-of-words approach intoaccount. However, they use technical rather than fundamental indicators, namelyfive market indicators and the relative difference in percentage of price (RPD) ex-tracted following a method proposed by Tay & Cao (2001). Training is performedusing a multi-kernel learning approach (MKL) that trains an SVM classifier withbag-of-words features as one sub-kernel and the quantitative features as a secondsub-kernel. As a benchmark they use the News approach, which ignores the quan-titative features and only takes bag-of-words into account.
Performance evaluation is done by means of a 5-fold cross validation from 1stJanuary to 31st October 2001 and an independent test phase from 1st Novemberto 31st December 2001. In all test runs, the MKL approach outperforms theNews approach. Choosing t = 20, which leads to the best prediction quality,MKL has an accuracy of 64.23% (cross validation) or 53.87% (independenttesting), bag-of-words 63.06% or 52.38%. A more recent version of the system(Wang et al., 2012) can improve the accuracy of MKL to 65.29% or 56.69% byintroducing the stock trading volume as an additional feature. Unfortunately,the authors do not evaluate their system financially, which results in a limitedcomparability to the other systems.
Hagenau et al. (2012)
Hagenau et al. developed a system forecasting daily stock prices based on corpo-rate announcements enforced by law and published in Germany and the UK (Ha-genau et al., 2012). The researchers focus in their work on improving predictionaccuracy achieved by earlier systems using different feature types and feature se-lection methods. Announcements are obtained from DGAP (Deutsche Gesellschaftfur Adhoc-Publizitat) and EuroAdhoc. Announcements are automatically labeledas POSITIVE or NEGATIVE by comparing daily opening and closing stock prices.Similarly to Schulz et al., the researchers take the market model into account forprice calculation. Next, features are extracted using the approaches dictionary (i.e.features are taken from the positive and negative word list in the Harvard-IV-4 dic-tionary used earlier by Tetlock et al. (2008)) bag-of-words, 2-gram, noun phrasesand 2-word combinations (i.e. an extension of 2-gram without the restriction ofzero distance between two words). Then a chi-squared based method proposed byForman (2003) is used to reduce features with low explanatory power. Lastly, dataare trained using an SVM classifier.
Performance evaluation is done in a market simulation between 1998 and
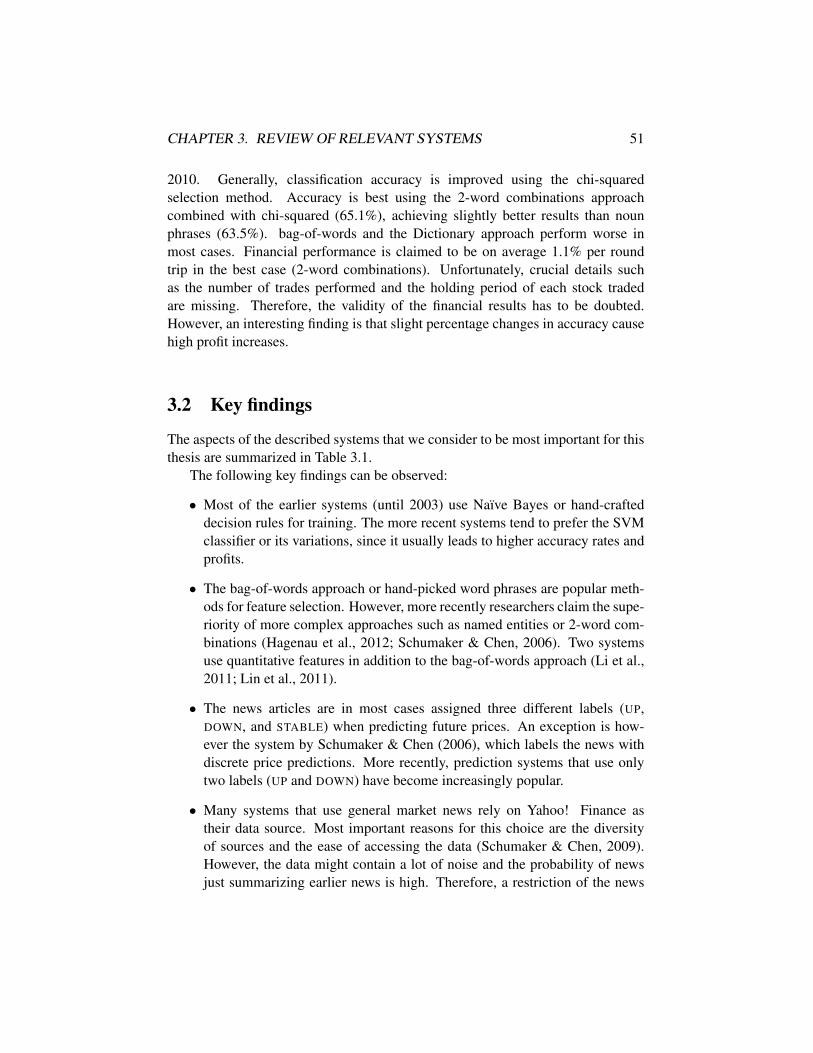
CHAPTER 3. REVIEW OF RELEVANT SYSTEMS 51
2010. Generally, classification accuracy is improved using the chi-squaredselection method. Accuracy is best using the 2-word combinations approachcombined with chi-squared (65.1%), achieving slightly better results than nounphrases (63.5%). bag-of-words and the Dictionary approach perform worse inmost cases. Financial performance is claimed to be on average 1.1% per roundtrip in the best case (2-word combinations). Unfortunately, crucial details suchas the number of trades performed and the holding period of each stock tradedare missing. Therefore, the validity of the financial results has to be doubted.However, an interesting finding is that slight percentage changes in accuracy causehigh profit increases.
3.2 Key findings
The aspects of the described systems that we consider to be most important for thisthesis are summarized in Table 3.1.
The following key findings can be observed:
• Most of the earlier systems (until 2003) use Naıve Bayes or hand-crafteddecision rules for training. The more recent systems tend to prefer the SVMclassifier or its variations, since it usually leads to higher accuracy rates andprofits.
• The bag-of-words approach or hand-picked word phrases are popular meth-ods for feature selection. However, more recently researchers claim the supe-riority of more complex approaches such as named entities or 2-word com-binations (Hagenau et al., 2012; Schumaker & Chen, 2006). Two systemsuse quantitative features in addition to the bag-of-words approach (Li et al.,2011; Lin et al., 2011).
• The news articles are in most cases assigned three different labels (UP,DOWN, and STABLE) when predicting future prices. An exception is how-ever the system by Schumaker & Chen (2006), which labels the news withdiscrete price predictions. More recently, prediction systems that use onlytwo labels (UP and DOWN) have become increasingly popular.
• Many systems that use general market news rely on Yahoo! Finance astheir data source. Most important reasons for this choice are the diversityof sources and the ease of accessing the data (Schumaker & Chen, 2009).However, the data might contain a lot of noise and the probability of newsjust summarizing earlier news is high. Therefore, a restriction of the news
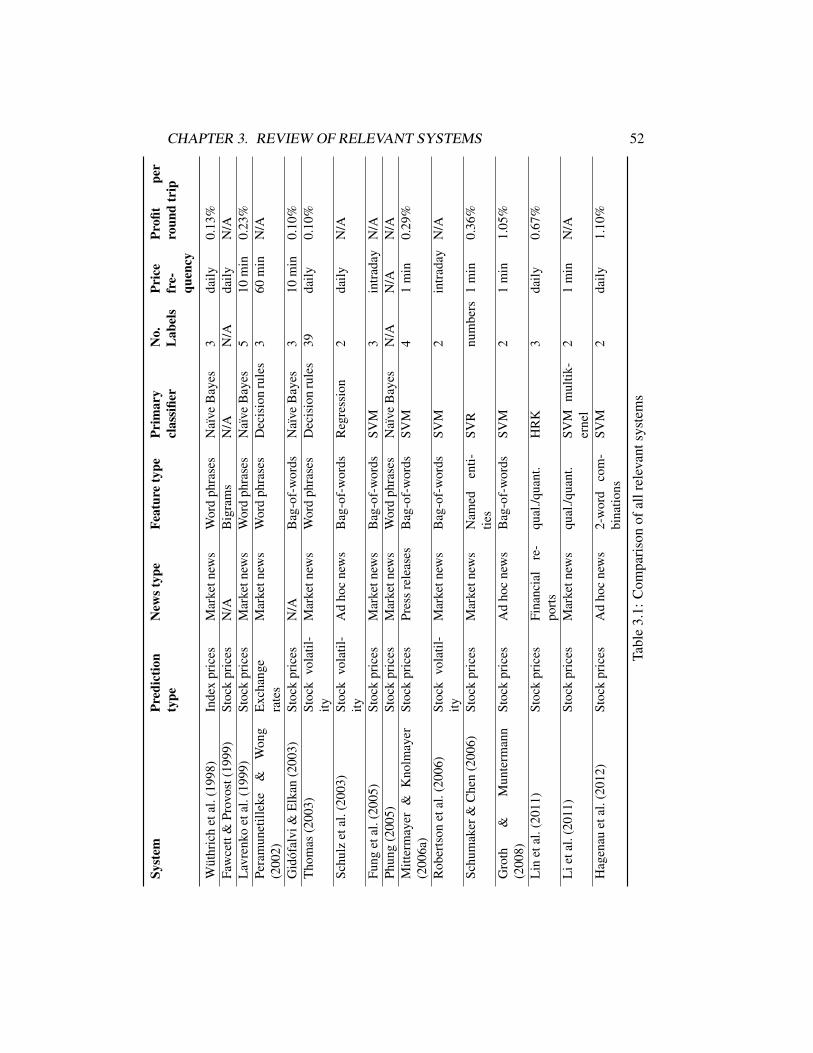
CHAPTER 3. REVIEW OF RELEVANT SYSTEMS 52Sy
stem
Pred
ictio
nty
peN
ewst
ype
Feat
ure
type
Prim
ary
clas
sifie
rN
o.L
abel
sPr
ice
fre-
quen
cy
Profi
tpe
rro
und
trip
Wut
hric
het
al.(
1998
)In
dex
pric
esM
arke
tnew
sW
ord
phra
ses
Naı
veB
ayes
3da
ily0.
13%
Faw
cett
&Pr
ovos
t(19
99)
Stoc
kpr
ices
N/A
Big
ram
sN
/AN
/Ada
ilyN
/AL
avre
nko
etal
.(19
99)
Stoc
kpr
ices
Mar
ketn
ews
Wor
dph
rase
sN
aıve
Bay
es5
10m
in0.
23%
Pera
mun
etill
eke
&W
ong
(200
2)E
xcha
nge
rate
sM
arke
tnew
sW
ord
phra
ses
Dec
isio
nru
les
360
min
N/A
Gid
ofal
vi&
Elk
an(2
003)
Stoc
kpr
ices
N/A
Bag
-of-
wor
dsN
aıve
Bay
es3
10m
in0.
10%
Tho
mas
(200
3)St
ock
vola
til-
ityM
arke
tnew
sW
ord
phra
ses
Dec
isio
nru
les
39da
ily0.
10%
Schu
lzet
al.(
2003
)St
ock
vola
til-
ityA
dho
cne
ws
Bag
-of-
wor
dsR
egre
ssio
n2
daily
N/A
Fung
etal
.(20
05)
Stoc
kpr
ices
Mar
ketn
ews
Bag
-of-
wor
dsSV
M3
intr
aday
N/A
Phun
g(2
005)
Stoc
kpr
ices
Mar
ketn
ews
Wor
dph
rase
sN
aıve
Bay
esN
/AN
/AN
/AM
itter
may
er&
Kno
lmay
er(2
006a
)St
ock
pric
esPr
ess
rele
ases
Bag
-of-
wor
dsSV
M4
1m
in0.
29%
Rob
erts
onet
al.(
2006
)St
ock
vola
til-
ityM
arke
tnew
sB
ag-o
f-w
ords
SVM
2in
trad
ayN
/A
Schu
mak
er&
Che
n(2
006)
Stoc
kpr
ices
Mar
ketn
ews
Nam
eden
ti-tie
sSV
Rnu
mbe
rs1
min
0.36
%
Gro
th&
Mun
term
ann
(200
8)St
ock
pric
esA
dho
cne
ws
Bag
-of-
wor
dsSV
M2
1m
in1.
05%
Lin
etal
.(20
11)
Stoc
kpr
ices
Fina
ncia
lre
-po
rts
qual
./qua
nt.
HR
K3
daily
0.67
%
Lie
tal.
(201
1)St
ock
pric
esM
arke
tnew
squ
al./q
uant
.SV
Mm
ultik
-er
nel
21
min
N/A
Hag
enau
etal
.(20
12)
Stoc
kpr
ices
Ad
hoc
new
s2-
wor
dco
m-
bina
tions
SVM
2da
ily1.
10%
Tabl
e3.
1:C
ompa
riso
nof
allr
elev
ants
yste
ms

CHAPTER 3. REVIEW OF RELEVANT SYSTEMS 53
corpus done by a few systems (e.g. Hagenau et al., 2012; Mittermayer &Knolmayer, 2006a) can be considered to be beneficial.
• The performance simulations of all systems are either implicitly or explicitlybased on the assumption of zero transaction costs. This leads to a bias infavor of systems needing a high number of trades to achieve the financialperformance reported.
These findings summarize ideas and methods that were successfully applied in thepast. However, they also discover existing limitations of related works. In thefollowing chapter, we aim to utilize these findings when developing a novel stockprice forecasting system.

Chapter 4
Trading system
The system presented in this chapter is based on the idea of predicting intradaystock price movements by analyzing news articles using text mining techniques.The system partly builds on ideas reviewed in the last chapter. When comparingour system to the systems reviewed, the following outstanding characteristics canbe highlighted:
• Many of the systems reviewed rely on news sources which can be assumedto be inherently noisy (see Section 3.2). To address this problem, our sys-tem uses news releases regulated by the U.S. government as described inSection 2.1.2.
• We use a novel set of features as classification input, which includes in par-ticular named entities, POS tags and document sentiment (see Section 2.2.1).
• We propose different methods to improve the performance when trainingdata that are highly unbalanced.
• We train and evaluate two different data sets resulting from different labelingapproaches. One data set contains two classes, the other three classes.
• We implement a binary metalearning algorithm in order to capture the se-mantics of the underlying training data more precisely.
• Rather than only considering one classifier, we implement and evaluate theperformance of all important classifiers described in Section 2.2.5.
• As opposed to earlier systems, we perform a market simulation taking trans-action costs into account in order to test the system in a more realistic setting.
In the rest of this chapter, we describe the basic design of the system (Section 4.1)and explain the system implementation in detail (Section 4.2).
54

CHAPTER 4. TRADING SYSTEM 55
4.1 Design
A basic schema of the system is illustrated in Figure 4.1. Its underlying process canbe divided into a training phase, a classification phase and an evaluation phase.
In the beginning of the training phase, we acquire news articles (press releases)published by major newswire services and dealing with a set of U.S. companies.Similarly, we download intraday stock prices of the same set of companies. Westore both data sets locally. In the news preprocessing step, we filter out certainnews articles such as news articles published not in the trading time or news articlesassociated with many different companies. Since the news articles are provided ina proprietary format, this step also includes extracting the important informationfrom the news files: the release date and time, news headline, news body, and thecompanies involved in the news. We also convert the news documents into a properformat that will later allow us to feed the data to a classifier. In the next step, wetry to reduce the number of irrelevant news by applying a rule-based thesaurus anddismissing all news not matching any of its rules. In the news labeling step, wealign the news articles with the stock prices. Since every news article is associ-ated with a company name and the release time, we can automatically assign eachnews article labels such as BUY, SELL, or HOLD. The choice of each label dependson the according stock’s price movement shortly after the news release. Once allnews articles in the training data set are labeled, we use a machine learning frame-work combined with a classification software to train a model based on the data.In the performance tuning phase, we perform an n-fold cross validation with thismodel and use common evaluation metrics to assess the performance. Based onthis evaluation, we change key parameters that are likely to influence the predic-tion performance. For instance, we extract a different set of features, use differentresampling methods, or change classifier parameters. We repeat the parameter tun-ing, training, and n-fold cross validation until we are satisfied with the predictionperformance.
In the classification phase, we acquire news articles published in a time framedifferent from the one in the training phase in order to ensure that training and testset are independent. Similarly, we acquire the according stock prices. We per-form the news preprocessing and the thesaurus filtering step in the same fashionas during the training phase. We then assign the news articles in the original dataset labels predicted by the tuned model created during the training phase. As ex-plained in Section 2.2.5, this model is the function Φ. In addition, we create a copyof the test data set. We assign the news articles in the copy of the data set labelscreated analogously to the training phase and thus obtain the function Φ. By com-paring both functions, we can evaluate the predicting performance by means of the
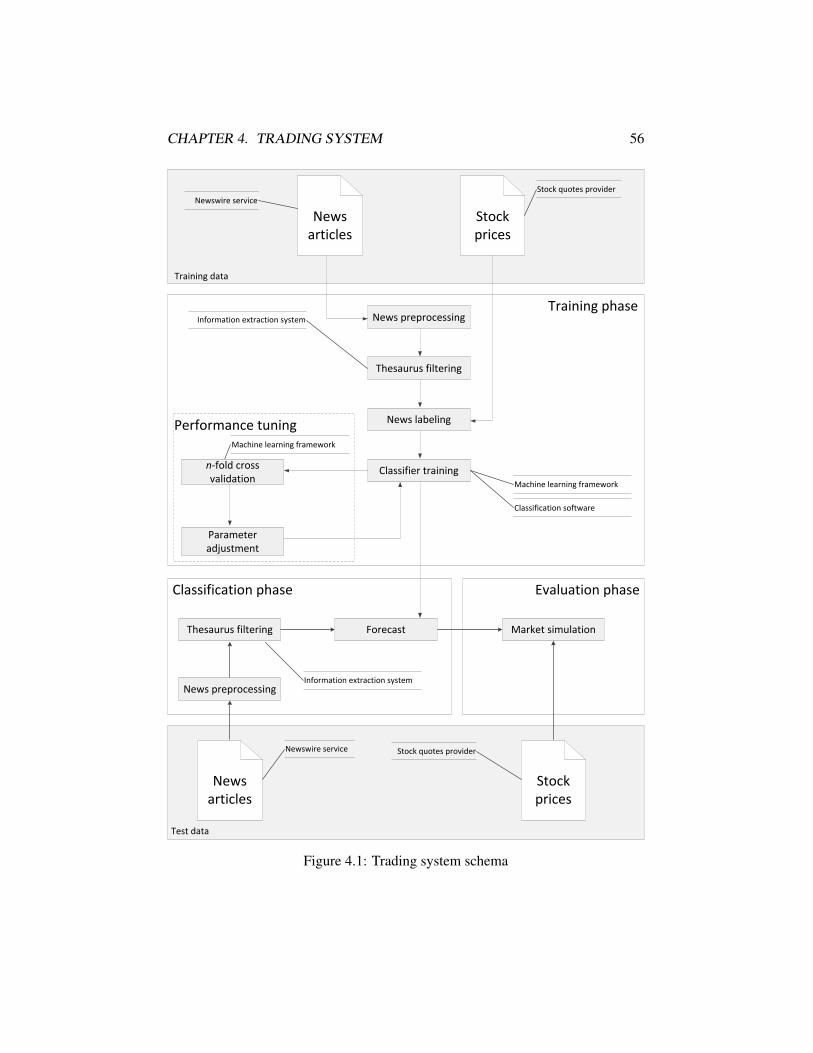
CHAPTER 4. TRADING SYSTEM 56
News preprocessing
News labeling
Classifier training
Forecast
Thesaurus filtering
Training data
Test data
News articles
Stock prices
News preprocessing
Training phase
Classification phase
Performance tuning
Stock prices
News articles
Thesaurus filtering
Evaluation phase
Market simulation
Newswire service
Stock quotes provider
Information extraction system
Machine learning framework
Machine learning framework
Classification software
Information extraction system
Newswire service Stock quotes provider
Parameter adjustment
n-fold cross validation
Figure 4.1: Trading system schema

CHAPTER 4. TRADING SYSTEM 57
independent test set.1
In the evaluation phase, we finally run a market simulation based on the labelspredicted by the classifier to evaluate the financial performance of the system. Forevery news article labeled BUY, we assume to place a buy market order for theaccording stock. For every news article labeled SELL, we assume to place a shortsale order. We liquidate each position after a fixed holding period. This allows usto calculate the profits the system is able to achieve in the independent test period.
4.2 Implementation
In this section, we explain the implementation of the trading system in detail. Mostparts of the system are implemented using the programming language Java.
In Section 4.2.1, we describe the data preparation. This includes acquiringnews and stock prices, extracting important information from the news articles,filtering out irrelevant news and converting the news into a proper format to preparethem to be fed to a classifier. In Section 4.2.2, we describe the actual classifiertraining. This includes labeling the news automatically, extracting features thatrepresent the semantics of the news, dealing with the issue of unbalanced data andtraining a classifier.
4.2.1 Data preparation
Data acquisition
The data used as input for the trading system is comprised of stocks of the U.S.market. This selection is done for the following reasons:
• The U.S. market is one of the most liquid markets worldwide, which de-creases the likelihood of non-trading periods and thus makes price predic-tions more reliable. Moreover, we expect a high news coverage for compa-nies that are very frequently traded.
• Most of the related systems described in Chapter 3 focus on the U.S. marketas well. This improves the comparability with our system.
• Most language processing tools freely available focus on the English lan-guage.
• The stock and news data is easy to acquire.1For the sake of simplicity, we do not illustrate this independent prediction evaluation in Fig-
ure 4.1, since this step is optional and not an essential part of the system schema.
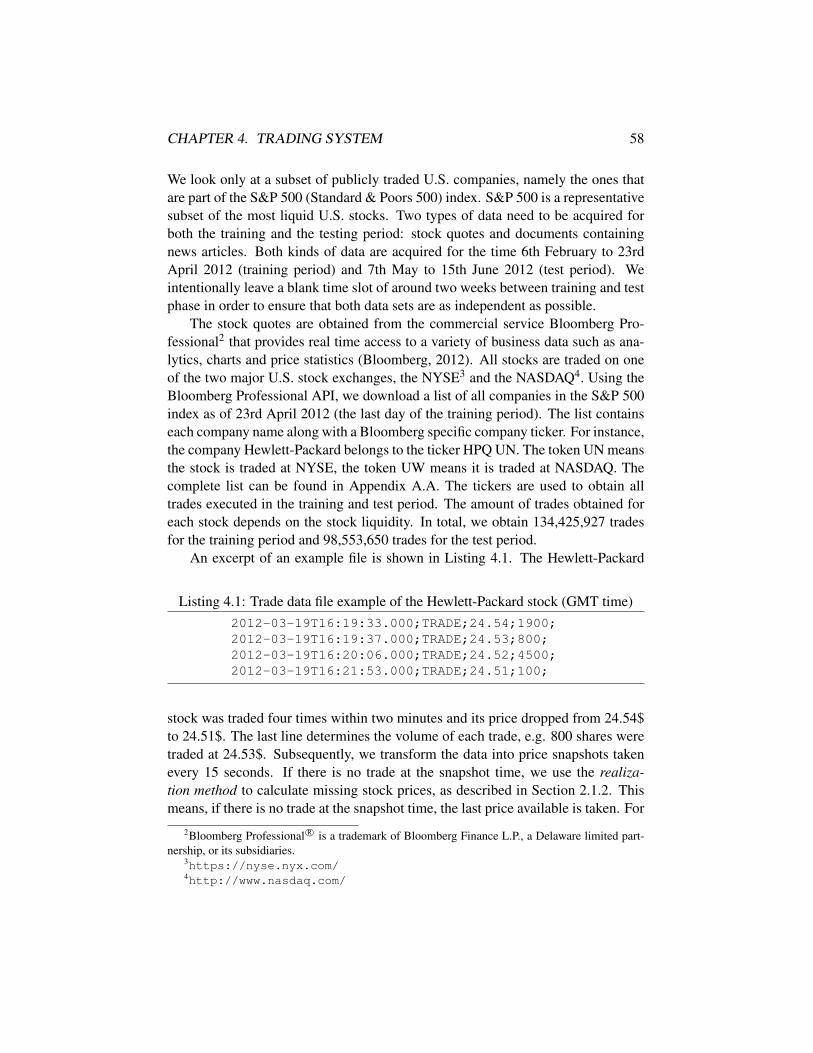
CHAPTER 4. TRADING SYSTEM 58
We look only at a subset of publicly traded U.S. companies, namely the ones thatare part of the S&P 500 (Standard & Poors 500) index. S&P 500 is a representativesubset of the most liquid U.S. stocks. Two types of data need to be acquired forboth the training and the testing period: stock quotes and documents containingnews articles. Both kinds of data are acquired for the time 6th February to 23rdApril 2012 (training period) and 7th May to 15th June 2012 (test period). Weintentionally leave a blank time slot of around two weeks between training and testphase in order to ensure that both data sets are as independent as possible.
The stock quotes are obtained from the commercial service Bloomberg Pro-fessional2 that provides real time access to a variety of business data such as ana-lytics, charts and price statistics (Bloomberg, 2012). All stocks are traded on oneof the two major U.S. stock exchanges, the NYSE3 and the NASDAQ4. Using theBloomberg Professional API, we download a list of all companies in the S&P 500index as of 23rd April 2012 (the last day of the training period). The list containseach company name along with a Bloomberg specific company ticker. For instance,the company Hewlett-Packard belongs to the ticker HPQ UN. The token UN meansthe stock is traded at NYSE, the token UW means it is traded at NASDAQ. Thecomplete list can be found in Appendix A.A. The tickers are used to obtain alltrades executed in the training and test period. The amount of trades obtained foreach stock depends on the stock liquidity. In total, we obtain 134,425,927 tradesfor the training period and 98,553,650 trades for the test period.
An excerpt of an example file is shown in Listing 4.1. The Hewlett-Packard
Listing 4.1: Trade data file example of the Hewlett-Packard stock (GMT time)2012-03-19T16:19:33.000;TRADE;24.54;1900;2012-03-19T16:19:37.000;TRADE;24.53;800;2012-03-19T16:20:06.000;TRADE;24.52;4500;2012-03-19T16:21:53.000;TRADE;24.51;100;
stock was traded four times within two minutes and its price dropped from 24.54$to 24.51$. The last line determines the volume of each trade, e.g. 800 shares weretraded at 24.53$. Subsequently, we transform the data into price snapshots takenevery 15 seconds. If there is no trade at the snapshot time, we use the realiza-tion method to calculate missing stock prices, as described in Section 2.1.2. Thismeans, if there is no trade at the snapshot time, the last price available is taken. For
2Bloomberg Professional R© is a trademark of Bloomberg Finance L.P., a Delaware limited part-nership, or its subsidiaries.
3https://nyse.nyx.com/4http://www.nasdaq.com/
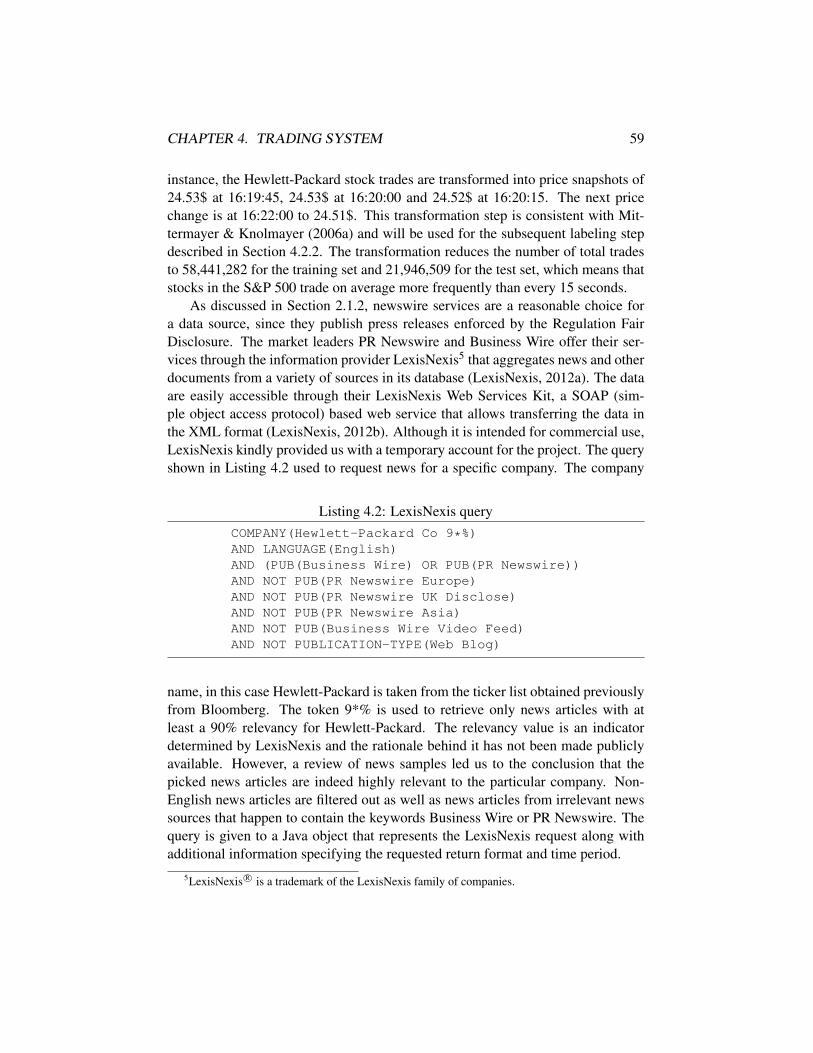
CHAPTER 4. TRADING SYSTEM 59
instance, the Hewlett-Packard stock trades are transformed into price snapshots of24.53$ at 16:19:45, 24.53$ at 16:20:00 and 24.52$ at 16:20:15. The next pricechange is at 16:22:00 to 24.51$. This transformation step is consistent with Mit-termayer & Knolmayer (2006a) and will be used for the subsequent labeling stepdescribed in Section 4.2.2. The transformation reduces the number of total tradesto 58,441,282 for the training set and 21,946,509 for the test set, which means thatstocks in the S&P 500 trade on average more frequently than every 15 seconds.
As discussed in Section 2.1.2, newswire services are a reasonable choice fora data source, since they publish press releases enforced by the Regulation FairDisclosure. The market leaders PR Newswire and Business Wire offer their ser-vices through the information provider LexisNexis5 that aggregates news and otherdocuments from a variety of sources in its database (LexisNexis, 2012a). The dataare easily accessible through their LexisNexis Web Services Kit, a SOAP (sim-ple object access protocol) based web service that allows transferring the data inthe XML format (LexisNexis, 2012b). Although it is intended for commercial use,LexisNexis kindly provided us with a temporary account for the project. The queryshown in Listing 4.2 used to request news for a specific company. The company
Listing 4.2: LexisNexis queryCOMPANY(Hewlett-Packard Co 9*%)AND LANGUAGE(English)AND (PUB(Business Wire) OR PUB(PR Newswire))AND NOT PUB(PR Newswire Europe)AND NOT PUB(PR Newswire UK Disclose)AND NOT PUB(PR Newswire Asia)AND NOT PUB(Business Wire Video Feed)AND NOT PUBLICATION-TYPE(Web Blog)
name, in this case Hewlett-Packard is taken from the ticker list obtained previouslyfrom Bloomberg. The token 9*% is used to retrieve only news articles with atleast a 90% relevancy for Hewlett-Packard. The relevancy value is an indicatordetermined by LexisNexis and the rationale behind it has not been made publiclyavailable. However, a review of news samples led us to the conclusion that thepicked news articles are indeed highly relevant to the particular company. Non-English news articles are filtered out as well as news articles from irrelevant newssources that happen to contain the keywords Business Wire or PR Newswire. Thequery is given to a Java object that represents the LexisNexis request along withadditional information specifying the requested return format and time period.
5LexisNexis R© is a trademark of the LexisNexis family of companies.
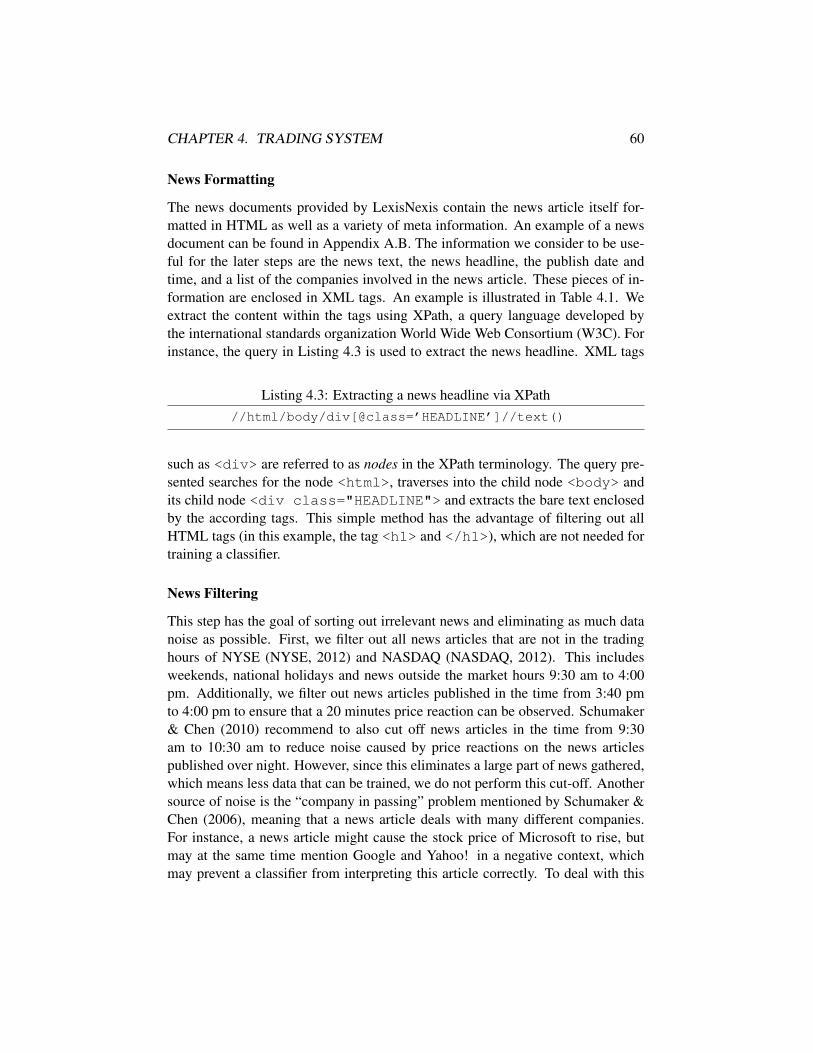
CHAPTER 4. TRADING SYSTEM 60
News Formatting
The news documents provided by LexisNexis contain the news article itself for-matted in HTML as well as a variety of meta information. An example of a newsdocument can be found in Appendix A.B. The information we consider to be use-ful for the later steps are the news text, the news headline, the publish date andtime, and a list of the companies involved in the news article. These pieces of in-formation are enclosed in XML tags. An example is illustrated in Table 4.1. Weextract the content within the tags using XPath, a query language developed bythe international standards organization World Wide Web Consortium (W3C). Forinstance, the query in Listing 4.3 is used to extract the news headline. XML tags
Listing 4.3: Extracting a news headline via XPath//html/body/div[@class=’HEADLINE’]//text()
such as <div> are referred to as nodes in the XPath terminology. The query pre-sented searches for the node <html>, traverses into the child node <body> andits child node <div class="HEADLINE"> and extracts the bare text enclosedby the according tags. This simple method has the advantage of filtering out allHTML tags (in this example, the tag <h1> and </h1>), which are not needed fortraining a classifier.
News Filtering
This step has the goal of sorting out irrelevant news and eliminating as much datanoise as possible. First, we filter out all news articles that are not in the tradinghours of NYSE (NYSE, 2012) and NASDAQ (NASDAQ, 2012). This includesweekends, national holidays and news outside the market hours 9:30 am to 4:00pm. Additionally, we filter out news articles published in the time from 3:40 pmto 4:00 pm to ensure that a 20 minutes price reaction can be observed. Schumaker& Chen (2010) recommend to also cut off news articles in the time from 9:30am to 10:30 am to reduce noise caused by price reactions on the news articlespublished over night. However, since this eliminates a large part of news gathered,which means less data that can be trained, we do not perform this cut-off. Anothersource of noise is the “company in passing” problem mentioned by Schumaker &Chen (2006), meaning that a news article deals with many different companies.For instance, a news article might cause the stock price of Microsoft to rise, butmay at the same time mention Google and Yahoo! in a negative context, whichmay prevent a classifier from interpreting this article correctly. To deal with this
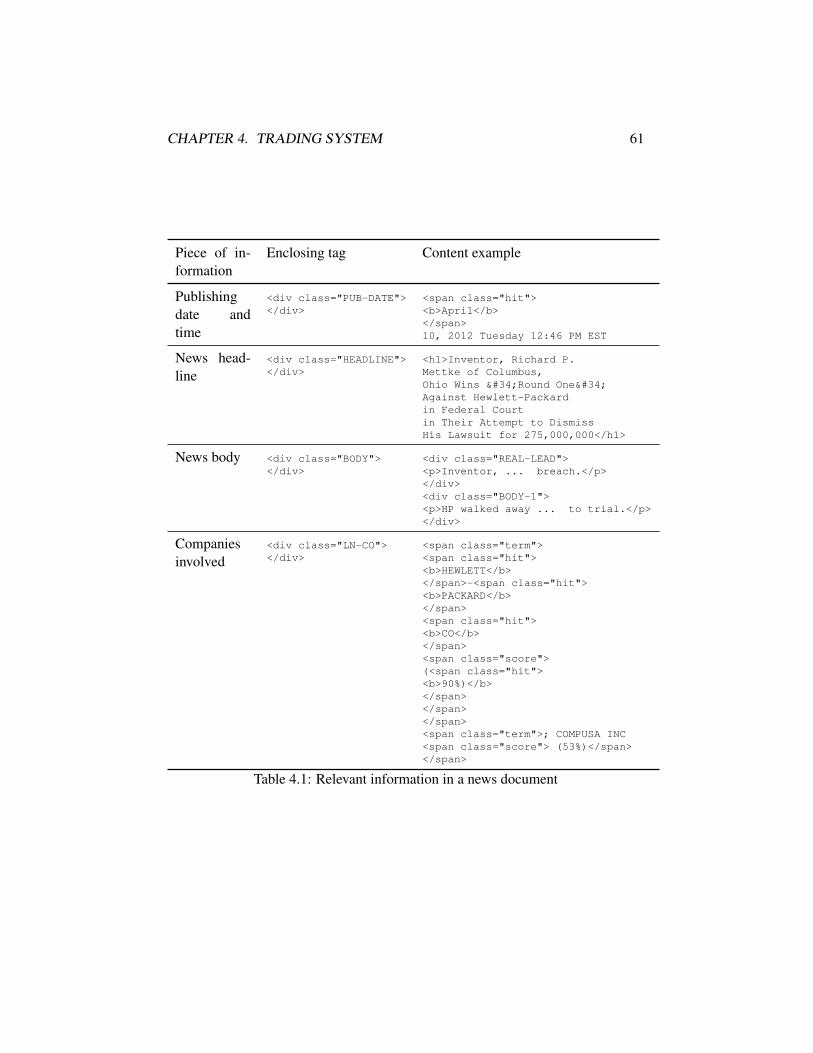
CHAPTER 4. TRADING SYSTEM 61
Piece of in-formation
Enclosing tag Content example
Publishingdate andtime
<div class="PUB-DATE"></div>
<span class="hit"><b>April</b></span>10, 2012 Tuesday 12:46 PM EST
News head-line
<div class="HEADLINE"></div>
<h1>Inventor, Richard P.Mettke of Columbus,Ohio Wins "Round One"Against Hewlett-Packardin Federal Courtin Their Attempt to DismissHis Lawsuit for 275,000,000</h1>
News body <div class="BODY"></div>
<div class="REAL-LEAD"><p>Inventor, ... breach.</p></div><div class="BODY-1"><p>HP walked away ... to trial.</p></div>
Companiesinvolved
<div class="LN-CO"></div>
<span class="term"><span class="hit"><b>HEWLETT</b></span>-<span class="hit"><b>PACKARD</b></span><span class="hit"><b>CO</b></span><span class="score">(<span class="hit"><b>90%)</b></span></span></span><span class="term">; COMPUSA INC<span class="score"> (53%)</span></span>
Table 4.1: Relevant information in a news document
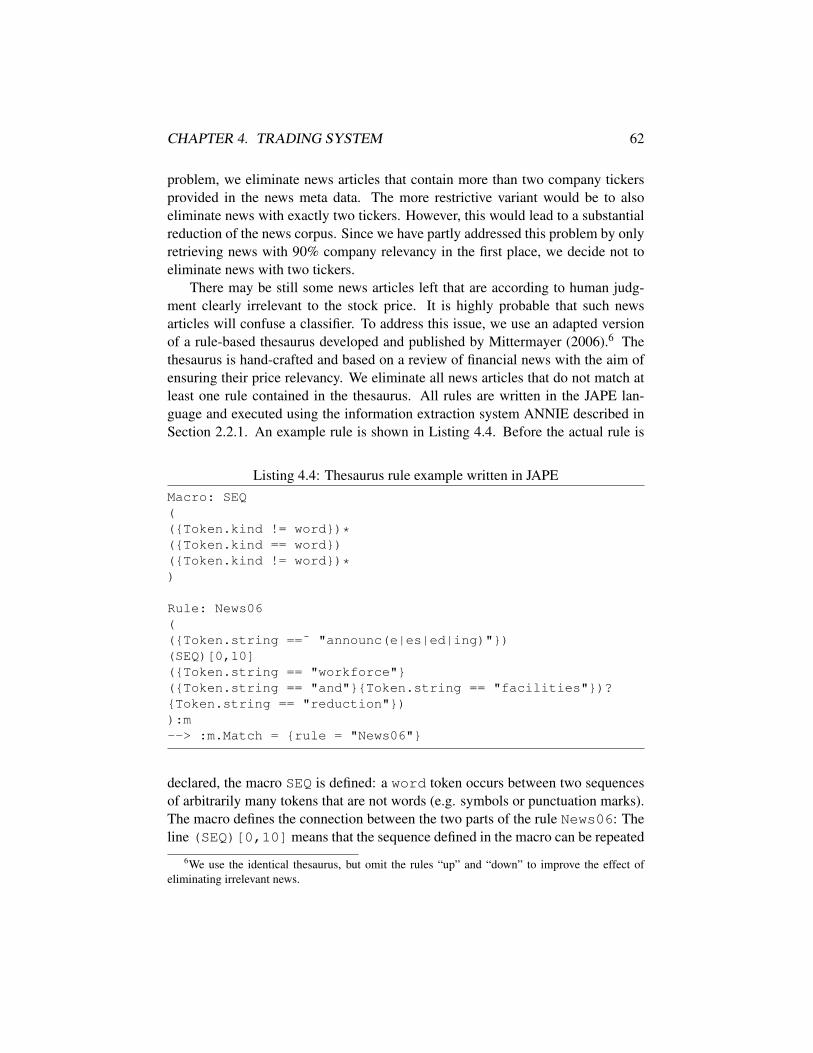
CHAPTER 4. TRADING SYSTEM 62
problem, we eliminate news articles that contain more than two company tickersprovided in the news meta data. The more restrictive variant would be to alsoeliminate news with exactly two tickers. However, this would lead to a substantialreduction of the news corpus. Since we have partly addressed this problem by onlyretrieving news with 90% company relevancy in the first place, we decide not toeliminate news with two tickers.
There may be still some news articles left that are according to human judg-ment clearly irrelevant to the stock price. It is highly probable that such newsarticles will confuse a classifier. To address this issue, we use an adapted versionof a rule-based thesaurus developed and published by Mittermayer (2006).6 Thethesaurus is hand-crafted and based on a review of financial news with the aim ofensuring their price relevancy. We eliminate all news articles that do not match atleast one rule contained in the thesaurus. All rules are written in the JAPE lan-guage and executed using the information extraction system ANNIE described inSection 2.2.1. An example rule is shown in Listing 4.4. Before the actual rule is
Listing 4.4: Thesaurus rule example written in JAPEMacro: SEQ((Token.kind != word)*(Token.kind == word)(Token.kind != word)*)
Rule: News06((Token.string ==˜ "announc(e|es|ed|ing)")(SEQ)[0,10](Token.string == "workforce"(Token.string == "and"Token.string == "facilities")?Token.string == "reduction")):m--> :m.Match = rule = "News06"
declared, the macro SEQ is defined: a word token occurs between two sequencesof arbitrarily many tokens that are not words (e.g. symbols or punctuation marks).The macro defines the connection between the two parts of the rule News06: Theline (SEQ)[0,10] means that the sequence defined in the macro can be repeated
6We use the identical thesaurus, but omit the rules “up” and “down” to improve the effect ofeliminating irrelevant news.

CHAPTER 4. TRADING SYSTEM 63
zero to ten times in a row. Before this sequence, an inflected form of the word “an-nounce” has to occur. After the sequence, either the phrase “workforce reduction”or the phrase “workforce and facilities reduction” has to occur. If this is the case,the whole sequence is given the name m. On the right side of the sign --> theannotation Match is created for the sequence m. In other words, if a form of theword announce is followed by the phrase “workforce reduction” or “workforce andfacilities reduction” with a maximum of ten words between them, the rule is firedand a match is declared. As soon as one match is found, the searching is stoppedfor a particular news article. If no rule finds a match, that news article is eliminated.
We acknowledge that there might be faster methods to extract rule-based pat-terns. However, the method has the advantage of being easily adaptable. For in-stance, one could eliminate a news article only if two rule matches occur. More-over, the runtime does not play a crucial role, since this step only needs to beperformed once for the training and once for the test data.
News conversion
For the subsequent training, we will use the freely available machine learningframework Weka developed and maintained at the University of Waikoto (Hallet al., 2009). For this we convert the data in the proprietary file format ARFF(Attribute-Relation File Format) used as input for Weka (Witten et al., 2011, p. 52ff.). An example for a typical training data set in the ARFF format is shown inListing 4.5. The first line depicts the name of the relation and is used to uniquelyidentify the data set. The following lines declare the attributes (features), whichcan be one of the types numeric, string, date, and nominal. The last at-tribute signal is the class attribute, which is nominal and can take on the valuesb (buy), h (hold) or s (sell). The @data token declares the beginning of the list ofall instances (news articles). Each of the following lines represents one instance.The instance values are separated by commas. Notice that the last value of bothexample instances is replaced by a ? token. This means the value is unknown yet,since we did not perform the labeling yet. All these ? tokens will be replaced byb, s or h during the labeling step described in the next section.
4.2.2 Training
News Labeling
Having the data prepared as described in Section 4.2.1, the news articles are nowready to be assigned labels. The labeling is based on the assumption that the in-formation in a news article takes 20 minutes to be fully reflected in the stock price.
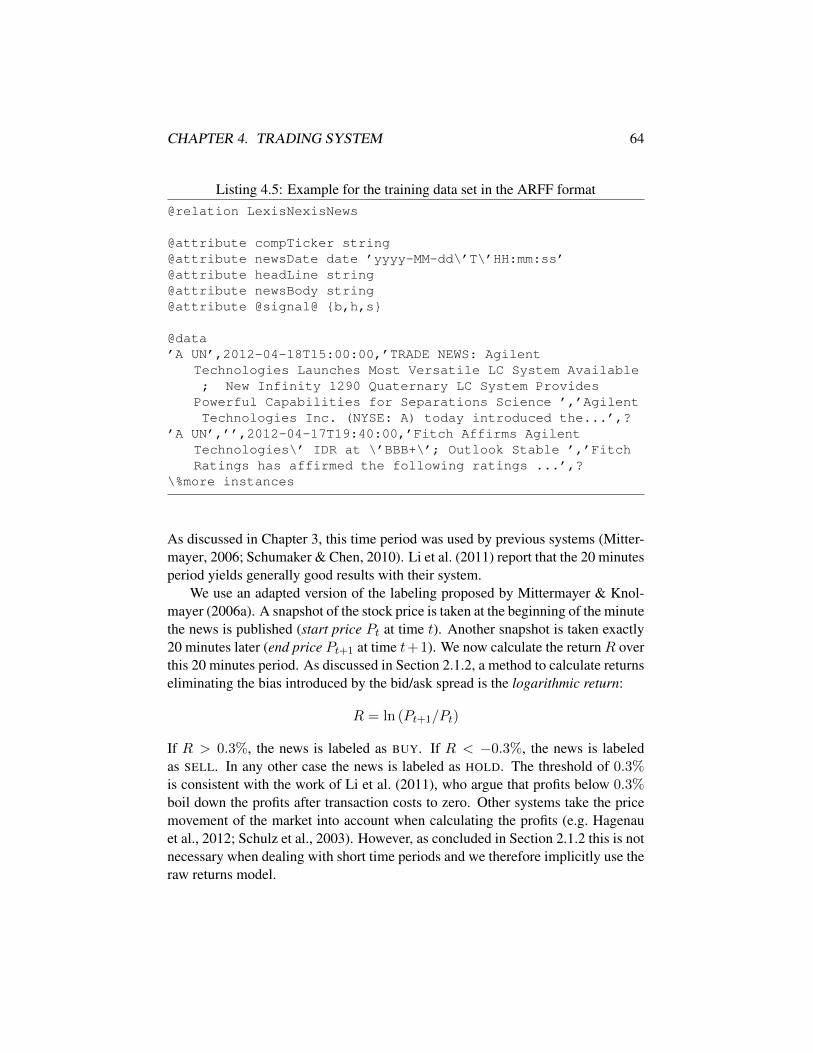
CHAPTER 4. TRADING SYSTEM 64
Listing 4.5: Example for the training data set in the ARFF format@relation LexisNexisNews
@attribute compTicker string@attribute newsDate date ’yyyy-MM-dd\’T\’HH:mm:ss’@attribute headLine string@attribute newsBody string@attribute @signal@ b,h,s
@data’A UN’,2012-04-18T15:00:00,’TRADE NEWS: Agilent
Technologies Launches Most Versatile LC System Available; New Infinity 1290 Quaternary LC System ProvidesPowerful Capabilities for Separations Science ’,’AgilentTechnologies Inc. (NYSE: A) today introduced the...’,?
’A UN’,’’,2012-04-17T19:40:00,’Fitch Affirms AgilentTechnologies\’ IDR at \’BBB+\’; Outlook Stable ’,’FitchRatings has affirmed the following ratings ...’,?
\%more instances
As discussed in Chapter 3, this time period was used by previous systems (Mitter-mayer, 2006; Schumaker & Chen, 2010). Li et al. (2011) report that the 20 minutesperiod yields generally good results with their system.
We use an adapted version of the labeling proposed by Mittermayer & Knol-mayer (2006a). A snapshot of the stock price is taken at the beginning of the minutethe news is published (start price Pt at time t). Another snapshot is taken exactly20 minutes later (end price Pt+1 at time t+1). We now calculate the return R overthis 20 minutes period. As discussed in Section 2.1.2, a method to calculate returnseliminating the bias introduced by the bid/ask spread is the logarithmic return:
R = ln (Pt+1/Pt)
If R > 0.3%, the news is labeled as BUY. If R < −0.3%, the news is labeledas SELL. In any other case the news is labeled as HOLD. The threshold of 0.3%is consistent with the work of Li et al. (2011), who argue that profits below 0.3%boil down the profits after transaction costs to zero. Other systems take the pricemovement of the market into account when calculating the profits (e.g. Hagenauet al., 2012; Schulz et al., 2003). However, as concluded in Section 2.1.2 this is notnecessary when dealing with short time periods and we therefore implicitly use theraw returns model.

CHAPTER 4. TRADING SYSTEM 65
Our labeling approach results in a 3-class problem with the class values BUY
(81 news articles), HOLD (778 news articles) and SELL (80 news articles). Thisclass distribution is heavily unbalanced (around 83% news articles labeled HOLD).As described in Section 2.2.6, classifiers tend to assign all documents to the major-ity class in such settings. In this case, this is the HOLD class, which will boil downthe financial profits to zero. To address this problem, we use another labeling ap-proach producing a 2-class problem. Instead of using the threshold 0.3%, we labelnews articles as BUY if R ≥ 0 (581 news articles) and as SELL if R < 0 (358 newsarticles). A similar labeling approach was proposed by Hagenau et al. (2012). Weacknowledge that it is likely to result in a trading strategy that buys and sells stocksyielding low returns and not being profitable after transaction costs. However, itmight still perform financially better than the 3-class problem in case the predictionperformance is much higher.
In order to validate whether the automatic labeling approach generally esti-mates the price influence of news correctly, we perform a manual labeling on arandom sample of the news corpus extracted using the 3-class problem. Althoughthe biggest class is the HOLD class, we draw 80 sample instances of each class aswe consider the BUY and the SELL class to be more important. Our primary goalis to determine whether the automatic labeling approach misclassifies many newsarticles into BUY instead of SELL and similarly, SELL instead of BUY. These typesof misclassification errors cause the greatest financial damage. Thus, we manu-ally label only news articles as BUY or SELL. We label news articles as SELL ifthey contain information such as dividend decreases, credit rating downgrades andpatent infringements. We label news articles as BUY analogously. If the decisiondoes not seem obvious or we consider the news to be irrelevant to the stock price,we leave the label blank. In total, we label 40 news articles as BUY, 34 news arti-cles as SELL and leave the remaining 166 news articles blank. The results are thefollowing: 56% of the news articles labeled automatically as BUY are correct com-pared to the manual labels, the remaining 44% are incorrectly classified as SELL.Analogously, 56% of the news articles labeled automatically as SELL are correct.This means that our automatic labeling approach is able to slightly beat a randomlabeling (50%).
The results suggest that a trained classifier is not likely to achieve a very highprediction accuracy. However, we decide to use the automatically labeled newsdata for training the system for the following reasons. First, a manual labelingapproach involves the resource-consuming labor of at least one (preferably morethan one) domain expert. These resources can be viewed as additional fix costsof the system, which reduce the potential profits. Since the system potentiallybenefits from more input data, the system would not scale well. Second, a well-documented automatic labeling is transparent and facilitates future work in this
CHAPTER 4. TRADING SYSTEM 66
area. Third, classifiers might be able to discover price relevant text characteristicsthat are not obvious to humans.
Feature Extraction
As discussed in Section 2.2.1, there are different approaches to extract featuresfrom the news headline and body that can be used to subsequently train a classifier.We use the following approaches:
• Unigrams (bag-of-words)
• Bigrams
• Part of speech (POS) bigrams
• Named entities
• POS categories
• Sentiment
Unigrams can easily be extracted using the Weka StringToWordVector filter (Wittenet al., 2011, p. 439 f.). It performs tokenization, stop words removal, stemming andTF-IDF value transformation. All of these steps can be tailored to the problem athand. For tokenization, we use the standard delimiters space, tab and the symbols.,;:’"()?!. Whenever one of these delimiters occurs, the character sequenceis split into a new token. For stop words removal, we used a commonly usedEnglish stop word list proposed by Lewis et al. (2004). The list is shown in Ap-pendix B.A. For stemming, we use the widely accepted Porter stemmer describedin Section 2.2.2. The TF-IDF transformation optionally converts the feature valuesfrom word frequencies into wi,j = TFi,j × log(N/DFi), where TFi,j is the termfrequency and log(N/DFi) is the inverted document frequency (see Section 2.2.3).
To extract bigrams, we use the freely available TagHelper tools (Rose et al.,2008) that support text analysis in different languages and build on Weka. Afterthe elimination of stop words and stemming, word pairs appearing next to eachother are extracted. As described in Section 2.2.1, POS bigrams are similar tobigrams, but they are pairs of 36 grammatical categories referred to as the PennTreebank tag set.
We extract named entities using the information extraction system ANNIE de-scribed in Section 2.2.1. The Semantic Tagger integrated in ANNIE is able toidentify and annotate words belonging to predefined categories using a built-in setof JAPE rules. In a first step, we eliminate e-mails and websites since parts of these

CHAPTER 4. TRADING SYSTEM 67
tokens are often mistakenly annotated as named entities, which introduces a poten-tial noise source. We filter out all words except for the ones annotated with thefollowing categories recommended in the MUC-7 framework (Chinchor, 1998):Time, Location, Organization, Person, Money, Percent and Date. These categorieshave been successfully used by Schumaker & Chen (2009). Additionally, we addall words belonging to the new category Jobtitle as we expect those words to con-tain useful information.
We use ANNIE’s POS tagger to extract words belonging to certain POS cate-gories defined in the Penn Treebank tag set. Specifically, we use the POS categoriesbelonging to one of the groups nouns, adjectives and adverbs. Zak & Ciura (2005)report a satisfying performance when taking only nouns, adjectives, adverbs andverbs into account.
For each news article, we calculate a number representing the article sentiment(see Section 2.2.1). For this task, we use the dictionary described by Taboada et al.(2011). It contains words and word phrases (terms) along with an integer value s.The terms are divided into the categories adjective, adverb, interjection, noun andverb. If s > 0, the according term is positive, if s < 0, it is negative. The higherthe absolute value, the clearer is the positive or negative meaning of the term. Forinstance, the word “disaster” is associated with −4 (clearly negative), the word“vital” is associated with +1 (slightly positive). The sentiment values of all termscontained in a news article are summed up. To avoid a bias towards longer newsarticles, we divide the result by the total number of words. Although companiesissuing press releases generally tend to prefer a positive tone in order to avoid lossof reputation (Mercer, 2004), we expect the sentiment value to be related to thestock price reaction on news.
Handling unbalanced data
As discussed in Section 2.2.6, it is necessary to address the issue of unbalanced databefore training a classifier. Since our 3-class problem is clearly unbalanced with83% of the instances belonging to the majority class HOLD, we use the followingapproaches:
• Undersampling via SpreadSubsample
• Oversampling via SMOTE
• Assigning costs via MetaCost
Undersampling is done using the Weka filter SpreadSubsample (Witten et al., 2011,Chapter 11.3). A random subsample of the majority class is drawn and discarded
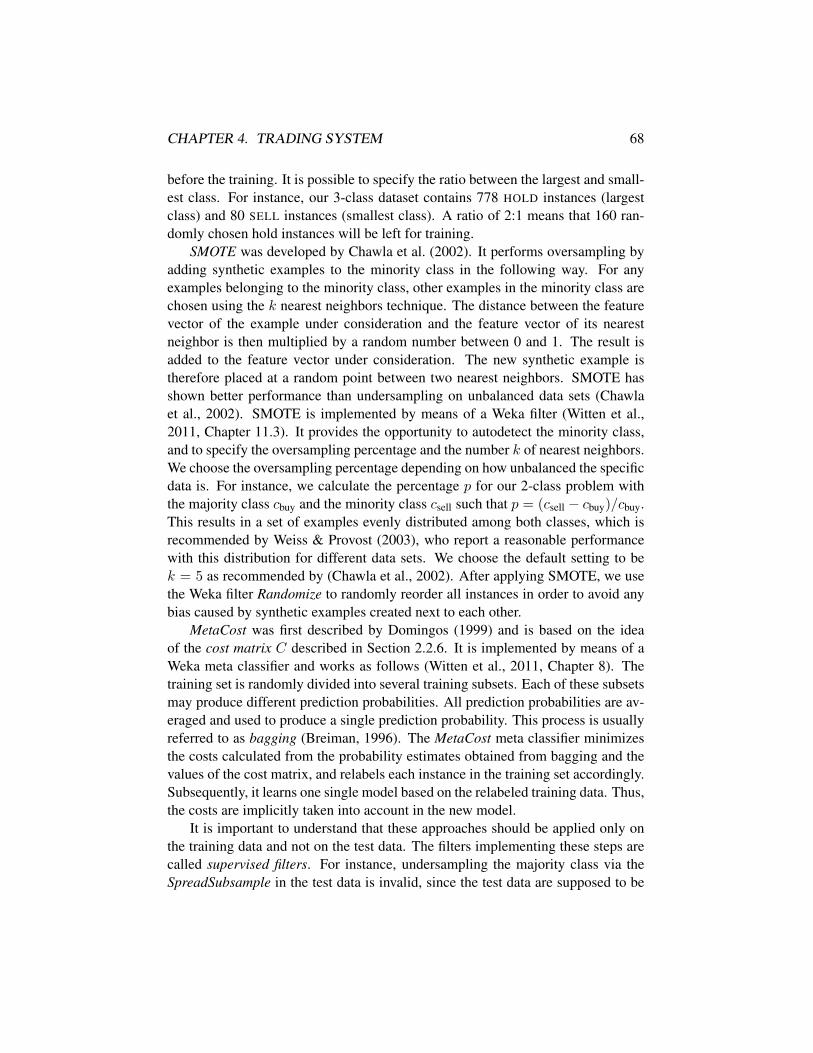
CHAPTER 4. TRADING SYSTEM 68
before the training. It is possible to specify the ratio between the largest and small-est class. For instance, our 3-class dataset contains 778 HOLD instances (largestclass) and 80 SELL instances (smallest class). A ratio of 2:1 means that 160 ran-domly chosen hold instances will be left for training.
SMOTE was developed by Chawla et al. (2002). It performs oversampling byadding synthetic examples to the minority class in the following way. For anyexamples belonging to the minority class, other examples in the minority class arechosen using the k nearest neighbors technique. The distance between the featurevector of the example under consideration and the feature vector of its nearestneighbor is then multiplied by a random number between 0 and 1. The result isadded to the feature vector under consideration. The new synthetic example istherefore placed at a random point between two nearest neighbors. SMOTE hasshown better performance than undersampling on unbalanced data sets (Chawlaet al., 2002). SMOTE is implemented by means of a Weka filter (Witten et al.,2011, Chapter 11.3). It provides the opportunity to autodetect the minority class,and to specify the oversampling percentage and the number k of nearest neighbors.We choose the oversampling percentage depending on how unbalanced the specificdata is. For instance, we calculate the percentage p for our 2-class problem withthe majority class cbuy and the minority class csell such that p = (csell − cbuy)/cbuy.This results in a set of examples evenly distributed among both classes, which isrecommended by Weiss & Provost (2003), who report a reasonable performancewith this distribution for different data sets. We choose the default setting to bek = 5 as recommended by (Chawla et al., 2002). After applying SMOTE, we usethe Weka filter Randomize to randomly reorder all instances in order to avoid anybias caused by synthetic examples created next to each other.
MetaCost was first described by Domingos (1999) and is based on the ideaof the cost matrix C described in Section 2.2.6. It is implemented by means of aWeka meta classifier and works as follows (Witten et al., 2011, Chapter 8). Thetraining set is randomly divided into several training subsets. Each of these subsetsmay produce different prediction probabilities. All prediction probabilities are av-eraged and used to produce a single prediction probability. This process is usuallyreferred to as bagging (Breiman, 1996). The MetaCost meta classifier minimizesthe costs calculated from the probability estimates obtained from bagging and thevalues of the cost matrix, and relabels each instance in the training set accordingly.Subsequently, it learns one single model based on the relabeled training data. Thus,the costs are implicitly taken into account in the new model.
It is important to understand that these approaches should be applied only onthe training data and not on the test data. The filters implementing these steps arecalled supervised filters. For instance, undersampling the majority class via theSpreadSubsample in the test data is invalid, since the test data are supposed to be
CHAPTER 4. TRADING SYSTEM 69
unknown. The result would be a reported performance that cannot be achieved inreality. Weka provides a metalearning scheme named FilteredClassifier that wrapsthe learning algorithm into the filtering process to avoid this behavior. This is alsouseful for the StringToWordVector used for feature extraction. FilteredClassifiercauses only words in the training set to be extracted. New words occurring in thetest set are eliminated (Witten et al., 2011, Chapter 11.3). In order to use differentfilters and process them successively, we use the Weka filter MultiFilter.
Notice that some of the filters used depend on random numbers (e.g. SMOTEfor creating the synthetic examples). To make sure that the performance results arestable and do not randomly change each time we build a new model, we specify aconstant random seed for each of these filters.
Classifier
Once the news articles are labeled and the features are extracted, a classifier can betrained in order to create a model that is able to label unseen test data. As describedin Section 2.2.5, the most common classifiers are the k-nearest neighbor classifier,decision trees, naıve Bayes and support vector machines (SVM). We train eachclassifier using the Weka framework in order to compare their performance. Wekaprovides a straight-forward implementation of the naıve Bayes classifier that can bereasonably used without any parameter tuning. The k-nearest neighbor algorithmis implemented by Weka’s IBk classifier (Aha et al., 1991). In its standard version,it uses the Euclidean distance as base for the distance function. It is possible tospecify the number k of nearest neighbors. The decision tree algorithm C4.5 (seeSection 2.2.5) is implemented by the Weka classifier J48.
SVM is implemented using the LIBSVM software package (Chang & Lin,2011) that can be used by Weka using the wrapper WLSVM developed by EL-Manzalawy & Honavar (2005). LIBSVM provides the commonly used kernelslinear, polynomial, radial basis function (RBF), and sigmoid. The linear kernel is agood choice for data with many more features than instances (Hsu et al., 2010), asit is the case in text mining. Groth & Muntermann (2008) also use the linear kernelin their application. However, Mittermayer & Knolmayer (2006a) report that somenon-linear kernels outperform the linear kernel. Thus we evaluate the performanceof the linear kernel and the RBF kernel. While it is only necessary to tune the costparameter C for the linear kernel, Hsu et al. (2010) stress the importance of tuningthe parameter C and γ (see Section 2.2.5) for non-linear kernels. The tuning is im-plemented by LIBSVM as follows (Hsu et al., 2010): Exponentially growing pairsof C and γ are successively trained and evaluated using k-fold cross validation.The (C, γ) with the highest overall accuracy is taken and trained again to build thefinal model. An example is illustrated in Figure 4.2. The colored lines indicate ar-
CHAPTER 4. TRADING SYSTEM 70
-5 0 5 10 15
-14
-12
-10
-8
-6
-4
-2
0
2
news0079f.libsvm
Best log2(C) = 9 log2(gamma) = -13 accuracy = 63.1523%
C = 512 gamma = 0.0001220703125
"-" 63
62.562
61.561
60.560
log2(C)
log2(gamma)
Figure 4.2: LIBSVM parameter tuning
eas in which a certain level of accuracy is reached. In this example, the parameterpair C = 29 and γ = 2−13 yields the highest accuracy (63.1523%) and thereforeis used to create the final model.
In Section 4.2.2, we introduced the 3-class problem that deals with the labelsBUY, HOLD and SELL. In the following, we transform this problem into two binaryclass problems hoping to improve the classifier performance by better capturingthe semantics of the problem. The main idea behind the transformation is that theBUY class and the SELL class can be considered more important than the HOLD
class. The reason is that news articles labeled as BUY or SELL will trigger a tradeand cause transaction costs and (negative) profits, whereas news articles labeledas HOLD do not trigger any financial transaction. We build the new problem asfollows. All instances of the original 3-class problem are copied twice. In thefirst copy, the label values are changed to SELL or NO SELL. In the second copy,the label values are changed to BUY or NO BUY. We perform these relabelingsteps conveniently using the Weka filter MakeIndicator that is able to replace anynominal attribute by a boolean one. Subsequently, each copy is used to train a sep-arate classifier. If one classifier predicts the label BUY for an instance and the otherclassifier predicts NO SELL, this instance is labeled BUY. Similarly, if one classifierpredicts SELL and the other one predicts NO BUY, the final prediction is SELL. In all

CHAPTER 4. TRADING SYSTEM 71
other cases, the final prediction is HOLD. We implement this novel classifier by ex-tending the abstract Java class RANDOMIZABLESINGLECLASSIFIERENHANCER
provided by the Weka API. Our classifier is designed as metalearning algorithm,meaning that it modifies the functionality of an arbitrary classifier (Witten et al.,2011, Chapter 11).
Chapter 5
Evaluation
The main goal of the system described in the last chapter is to forecast short termstock price movements in order to realize highest possible profits. In this chap-ter, we perform an evaluation of the system with two main objectives: First, weaim to evaluate the prediction performance of our system and research how wecan increase the performance by varying the labeling approach and the trainingcharacteristics. By optimizing the prediction performance, we hope to increase thepotential financial performance of the system. Second, we aim to evaluate howour system performs financially. We do so by designing and running a marketsimulation that allows the system to operate under conditions close to reality.
5.1 Evaluation settings
As described in the last chapter, we made a number of design decisions that mayinfluence the performance of the system. The most important system characteris-tics can be divided into the input data, labeling approach and classifier training. Inthe following, we describe the system characteristics that are fixed. We leave thosecharacteristics unchanged throughout the evaluation process.
All choices made regarding the input data naturally remain fixed. The newssources of the system are press releases published by the newswire services PRNewswire and Business Wire. The news articles are published from 6th Februaryto 23rd April 2012 (training period) and 7th May to 15th June 2012 (test period).We only take news articles into account dealing with companies that are part of theS&P 500 index. We only consider news articles published between 9:30 am and3:40 pm within trading days. We retrieve only news articles with 90% relevancyfor the respective company (according to LexisNexis). Subsequently, we filter outnews articles containing more than two company tags. Similarly, we discard news
72
CHAPTER 5. EVALUATION 73
articles rejected by the thesaurus.We fix a few characteristics regarding the labeling approach. The most impor-
tant one is to use the time frame of 20 minutes in order to label the news articlesdepending on the stock price movement. As stated in Section 4.2.2, we base our de-cision on previous research, yielding good results with the 20 minutes time frame.This also increases the performance comparability to similar systems. Further-more, as concluded in Section 4.2.2, it is beneficial to use the logarithmic return tocalculate the stock returns for labeling.
Regarding the classifier training, we fix the text preprocessing steps of remov-ing stop words and stemming all words using the Porter stemmer. These choicesare consistent to most systems described in Chapter 3 and as stated in Section 2.2.2,they have been successfully used in practice.
5.2 Evaluation methodology
Based on the fixed settings described in the last section, we vary the set of systemcharacteristics that we consider to be crucial for the prediction performance. Inorder to conveniently manipulate all characteristics, we store all relevant settingsin a public Java class. The class contains public constants, each representing asetting variable such as the label threshold, the classifier used, or one of the trainingparameters. In the following, we describe the characteristics we vary.
As for the input data, we leave all settings described in the last section fixed.Varying them would unnecessarily increase the complexity of the evaluation.
We vary the labeling approach in one aspect: By choosing different thresholdsfor determining the labels of the news, we produce a 3-class problem (threshold0.3%) and a 2-class problem (threshold 0%). As described in Section 4.2.2, the2-class problem can help to address the problem of unbalanced data. In addition,in Section 3.2 we concluded that related systems have been successfully devel-oped based on both types of problems. We take the novel approach to evaluate theperformance of both a 2-class and a 3-class problem using the same input data.
Regarding the classifier training, there is a number of characteristics that are ofinterest in the area of text mining. First, the feature representation can be changedbetween unigrams (bag-of-words), bigrams, POS bigrams, named entities, POScategories, sentiment, and combinations of these features. While applying com-plex features rather than the simple bag-of-words representation has generallyshown limited success in the past (Moschitti & Basili, 2004), stock forecastingsystems were able to improve their performance by using named entities (Schu-maker & Chen, 2006) and bigrams (Hagenau et al., 2012). Another parameter thatmight influence the system performance, is the choice of a dimensionality reduc-
CHAPTER 5. EVALUATION 74
tion method described in Section 2.2.4. Hagenau et al. (2012) report a performanceimprovement by using the chi-squared method, Mittermayer & Knolmayer (2006a)increase their system accuracy by using term frequency to reduce the number offeatures. Moreover, we vary the popular weighting schemes TF-IDF and boolean.For training, we compare four of the most popular classifiers (see Section 2.2.5),namely the k-nearest neighbor classifier, the decision tree algorithm C4.5 usingits Weka implementation J48, naıve Bayes and support vector machines (SVM)with the linear and the radial basis function kernel. In addition, we vary the SVMparameters C and γ as described in Section 4.2.2. In order to achieve a good per-formance despite the unbalanced nature of the data, we compare the approachesundersampling, oversampling, and the assignment of costs. For the 3-class prob-lem, we finally evaluate how the application of the binary metalearning algorithmintroduced in Section 4.2.2 influences the classifier performance.
5.3 Results
In this section, we evaluate the classification performance of the 3-class problemand the 2-class problem separately. We use the evaluation metrics described in Sec-tion 2.2.6. Since both problems contain comparatively few instances, we chooseto use the 10-fold cross validation approach implemented by Weka on the trainingset. Subsequently, we evaluate the performance on an independent test set.
5.3.1 2-class problem
In the initial setting, we use bag-of-words as features and perform no dimension-ality reduction. We use the SVM classifier, which is used by the most systemsdescribed in Chapter 3. Joachims (1998) reports that the SVM applied to text cat-egorization tasks outperform other classifiers. As concluded in Section 4.2.2, thelinear SVM kernel is a reasonable first choice. As opposed to other SVM kernels,the linear kernel does not involve γ (see Section 2.2.5), and the only parameter thatneeds to optimized is C. In order to ensure a stable performance, we optimize Cin this and each further setting separately by performing the LIBSVM optimiza-tion approach described in Section 4.2.2 and fixing γ to an arbitrary value. Theclassification performance is based on ten models that are created and evaluatedby Weka independently. The results are shown in Table 5.1. Weka performs im-portant metrics calculations based on the confusion matrix. They are described inSection 2.2.6 and include the accuracy (A), precision (π), recall (ρ) and balancedF-measure (F1). The last three metrics are given for both the BUY and SELL class.Consistently with Mittermayer & Knolmayer (2006a), we use macro-averaging to
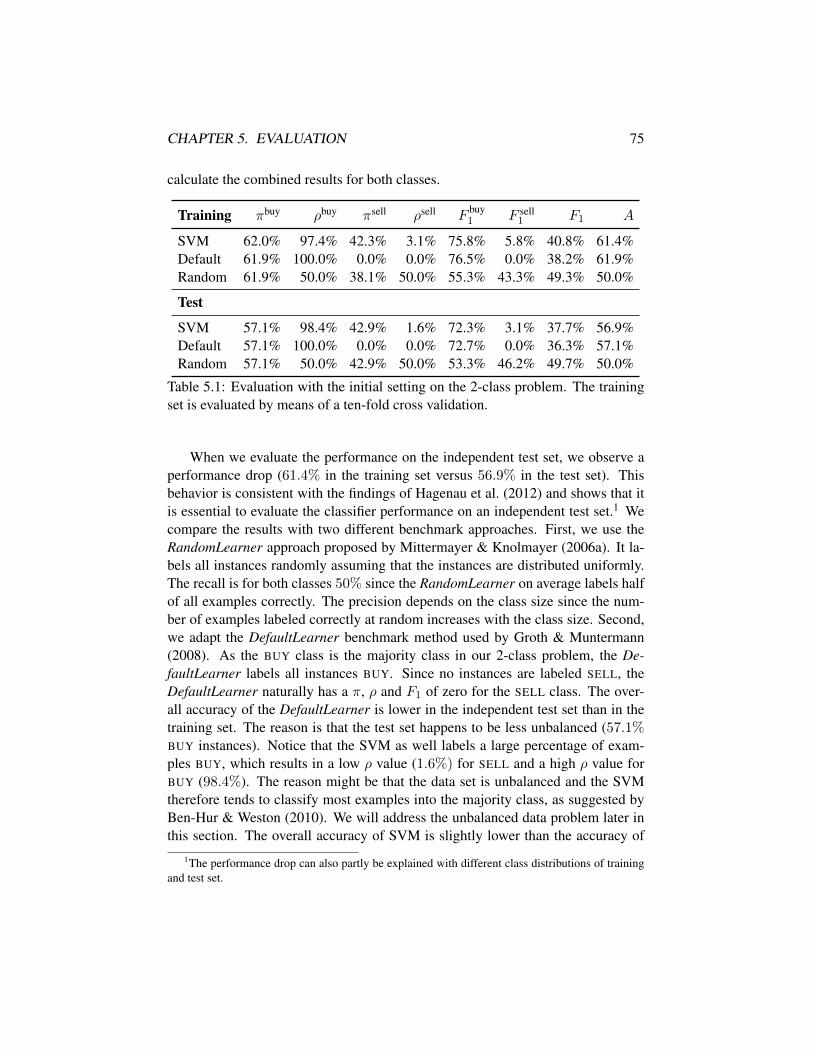
CHAPTER 5. EVALUATION 75
calculate the combined results for both classes.
Training πbuy ρbuy πsell ρsell Fbuy1 F sell
1 F1 A
SVM 62.0% 97.4% 42.3% 3.1% 75.8% 5.8% 40.8% 61.4%Default 61.9% 100.0% 0.0% 0.0% 76.5% 0.0% 38.2% 61.9%Random 61.9% 50.0% 38.1% 50.0% 55.3% 43.3% 49.3% 50.0%
Test
SVM 57.1% 98.4% 42.9% 1.6% 72.3% 3.1% 37.7% 56.9%Default 57.1% 100.0% 0.0% 0.0% 72.7% 0.0% 36.3% 57.1%Random 57.1% 50.0% 42.9% 50.0% 53.3% 46.2% 49.7% 50.0%
Table 5.1: Evaluation with the initial setting on the 2-class problem. The trainingset is evaluated by means of a ten-fold cross validation.
When we evaluate the performance on the independent test set, we observe aperformance drop (61.4% in the training set versus 56.9% in the test set). Thisbehavior is consistent with the findings of Hagenau et al. (2012) and shows that itis essential to evaluate the classifier performance on an independent test set.1 Wecompare the results with two different benchmark approaches. First, we use theRandomLearner approach proposed by Mittermayer & Knolmayer (2006a). It la-bels all instances randomly assuming that the instances are distributed uniformly.The recall is for both classes 50% since the RandomLearner on average labels halfof all examples correctly. The precision depends on the class size since the num-ber of examples labeled correctly at random increases with the class size. Second,we adapt the DefaultLearner benchmark method used by Groth & Muntermann(2008). As the BUY class is the majority class in our 2-class problem, the De-faultLearner labels all instances BUY. Since no instances are labeled SELL, theDefaultLearner naturally has a π, ρ and F1 of zero for the SELL class. The over-all accuracy of the DefaultLearner is lower in the independent test set than in thetraining set. The reason is that the test set happens to be less unbalanced (57.1%BUY instances). Notice that the SVM as well labels a large percentage of exam-ples BUY, which results in a low ρ value (1.6%) for SELL and a high ρ value forBUY (98.4%). The reason might be that the data set is unbalanced and the SVMtherefore tends to classify most examples into the majority class, as suggested byBen-Hur & Weston (2010). We will address the unbalanced data problem later inthis section. The overall accuracy of SVM is slightly lower than the accuracy of
1The performance drop can also partly be explained with different class distributions of trainingand test set.
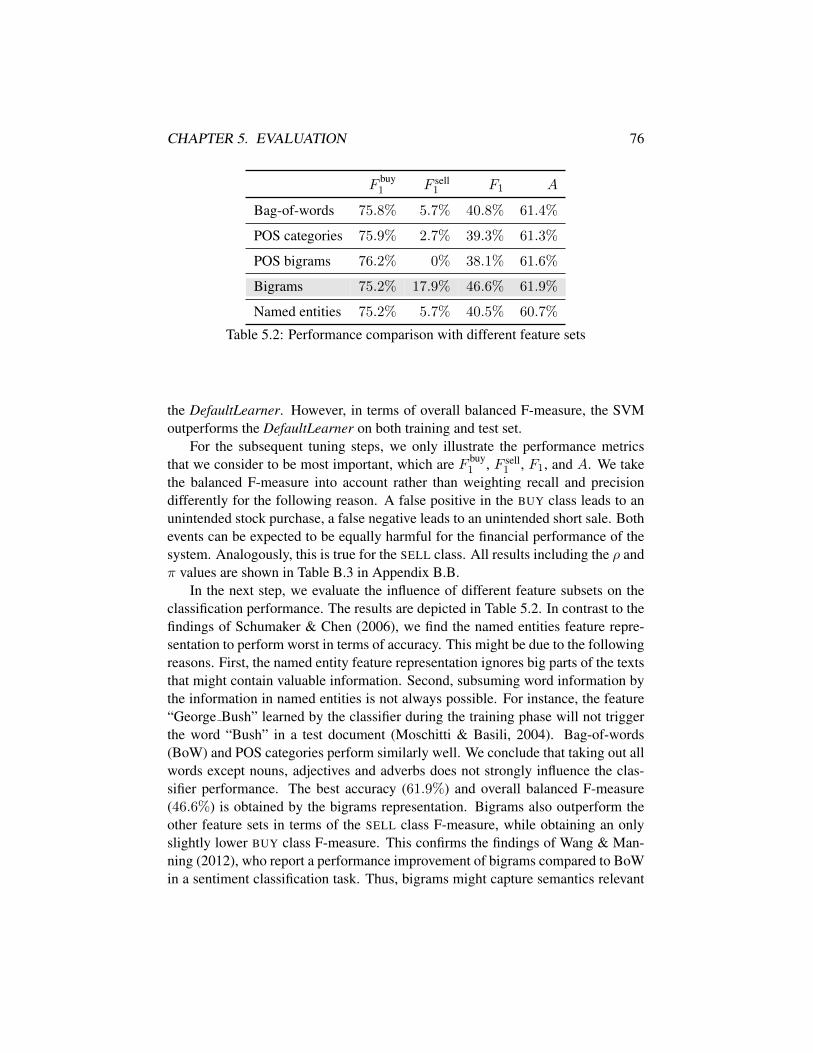
CHAPTER 5. EVALUATION 76
Fbuy1 F sell
1 F1 A
Bag-of-words 75.8% 5.7% 40.8% 61.4%
POS categories 75.9% 2.7% 39.3% 61.3%
POS bigrams 76.2% 0% 38.1% 61.6%
Bigrams 75.2% 17.9% 46.6% 61.9%
Named entities 75.2% 5.7% 40.5% 60.7%
Table 5.2: Performance comparison with different feature sets
the DefaultLearner. However, in terms of overall balanced F-measure, the SVMoutperforms the DefaultLearner on both training and test set.
For the subsequent tuning steps, we only illustrate the performance metricsthat we consider to be most important, which are F buy
1 , F sell1 , F1, and A. We take
the balanced F-measure into account rather than weighting recall and precisiondifferently for the following reason. A false positive in the BUY class leads to anunintended stock purchase, a false negative leads to an unintended short sale. Bothevents can be expected to be equally harmful for the financial performance of thesystem. Analogously, this is true for the SELL class. All results including the ρ andπ values are shown in Table B.3 in Appendix B.B.
In the next step, we evaluate the influence of different feature subsets on theclassification performance. The results are depicted in Table 5.2. In contrast to thefindings of Schumaker & Chen (2006), we find the named entities feature repre-sentation to perform worst in terms of accuracy. This might be due to the followingreasons. First, the named entity feature representation ignores big parts of the textsthat might contain valuable information. Second, subsuming word information bythe information in named entities is not always possible. For instance, the feature“George Bush” learned by the classifier during the training phase will not triggerthe word “Bush” in a test document (Moschitti & Basili, 2004). Bag-of-words(BoW) and POS categories perform similarly well. We conclude that taking out allwords except nouns, adjectives and adverbs does not strongly influence the clas-sifier performance. The best accuracy (61.9%) and overall balanced F-measure(46.6%) is obtained by the bigrams representation. Bigrams also outperform theother feature sets in terms of the SELL class F-measure, while obtaining an onlyslightly lower BUY class F-measure. This confirms the findings of Wang & Man-ning (2012), who report a performance improvement of bigrams compared to BoWin a sentiment classification task. Thus, bigrams might capture semantics relevant
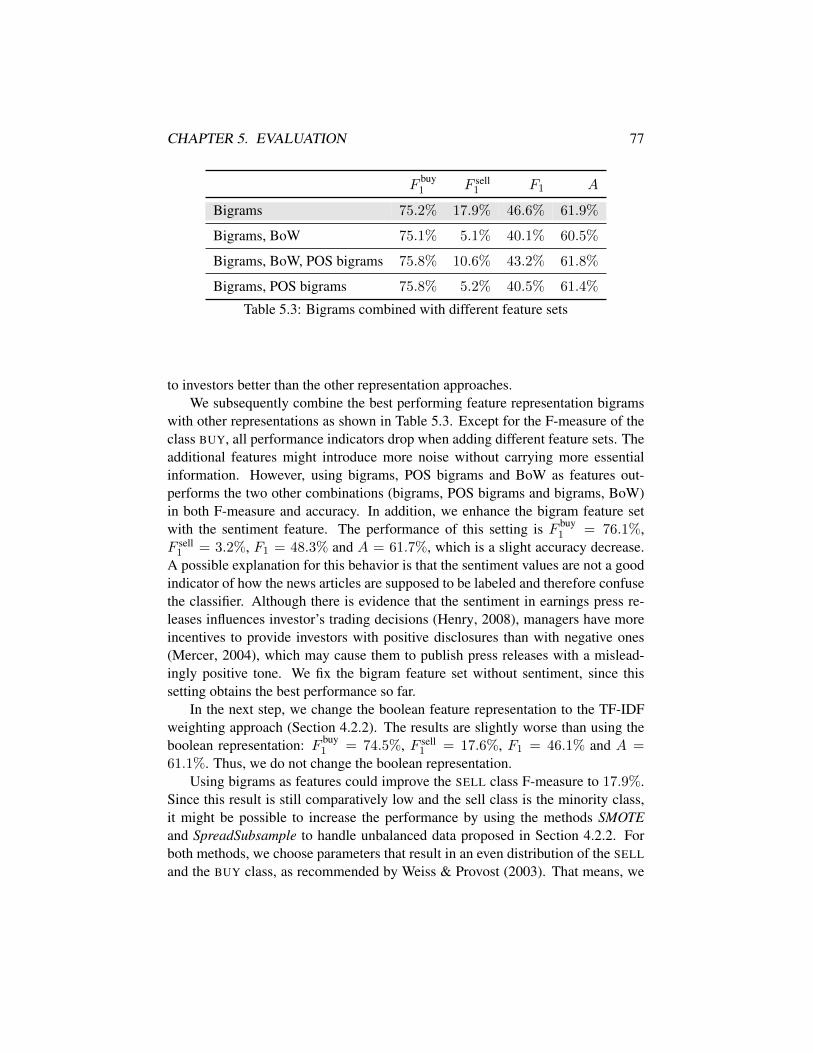
CHAPTER 5. EVALUATION 77
Fbuy1 F sell
1 F1 A
Bigrams 75.2% 17.9% 46.6% 61.9%
Bigrams, BoW 75.1% 5.1% 40.1% 60.5%
Bigrams, BoW, POS bigrams 75.8% 10.6% 43.2% 61.8%
Bigrams, POS bigrams 75.8% 5.2% 40.5% 61.4%
Table 5.3: Bigrams combined with different feature sets
to investors better than the other representation approaches.We subsequently combine the best performing feature representation bigrams
with other representations as shown in Table 5.3. Except for the F-measure of theclass BUY, all performance indicators drop when adding different feature sets. Theadditional features might introduce more noise without carrying more essentialinformation. However, using bigrams, POS bigrams and BoW as features out-performs the two other combinations (bigrams, POS bigrams and bigrams, BoW)in both F-measure and accuracy. In addition, we enhance the bigram feature setwith the sentiment feature. The performance of this setting is F buy
1 = 76.1%,F sell
1 = 3.2%, F1 = 48.3% and A = 61.7%, which is a slight accuracy decrease.A possible explanation for this behavior is that the sentiment values are not a goodindicator of how the news articles are supposed to be labeled and therefore confusethe classifier. Although there is evidence that the sentiment in earnings press re-leases influences investor’s trading decisions (Henry, 2008), managers have moreincentives to provide investors with positive disclosures than with negative ones(Mercer, 2004), which may cause them to publish press releases with a mislead-ingly positive tone. We fix the bigram feature set without sentiment, since thissetting obtains the best performance so far.
In the next step, we change the boolean feature representation to the TF-IDFweighting approach (Section 4.2.2). The results are slightly worse than using theboolean representation: F buy
1 = 74.5%, F sell1 = 17.6%, F1 = 46.1% and A =
61.1%. Thus, we do not change the boolean representation.Using bigrams as features could improve the SELL class F-measure to 17.9%.
Since this result is still comparatively low and the sell class is the minority class,it might be possible to increase the performance by using the methods SMOTEand SpreadSubsample to handle unbalanced data proposed in Section 4.2.2. Forboth methods, we choose parameters that result in an even distribution of the SELL
and the BUY class, as recommended by Weiss & Provost (2003). That means, we
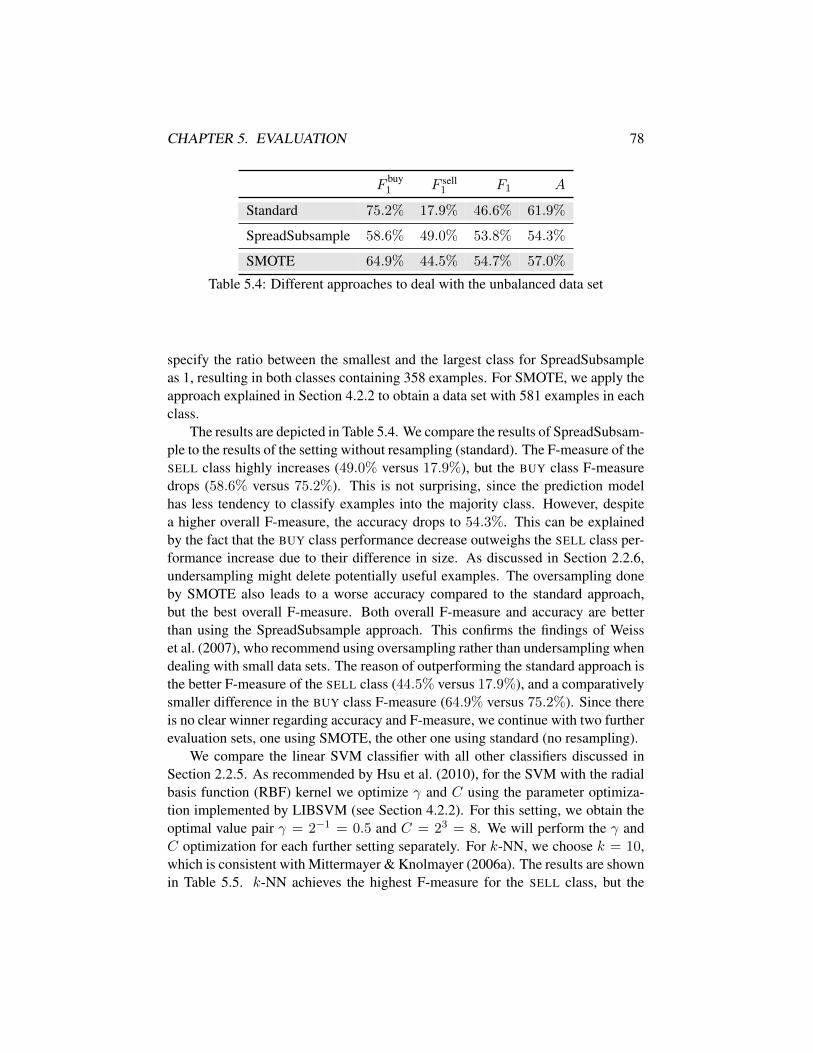
CHAPTER 5. EVALUATION 78
Fbuy1 F sell
1 F1 A
Standard 75.2% 17.9% 46.6% 61.9%
SpreadSubsample 58.6% 49.0% 53.8% 54.3%
SMOTE 64.9% 44.5% 54.7% 57.0%
Table 5.4: Different approaches to deal with the unbalanced data set
specify the ratio between the smallest and the largest class for SpreadSubsampleas 1, resulting in both classes containing 358 examples. For SMOTE, we apply theapproach explained in Section 4.2.2 to obtain a data set with 581 examples in eachclass.
The results are depicted in Table 5.4. We compare the results of SpreadSubsam-ple to the results of the setting without resampling (standard). The F-measure of theSELL class highly increases (49.0% versus 17.9%), but the BUY class F-measuredrops (58.6% versus 75.2%). This is not surprising, since the prediction modelhas less tendency to classify examples into the majority class. However, despitea higher overall F-measure, the accuracy drops to 54.3%. This can be explainedby the fact that the BUY class performance decrease outweighs the SELL class per-formance increase due to their difference in size. As discussed in Section 2.2.6,undersampling might delete potentially useful examples. The oversampling doneby SMOTE also leads to a worse accuracy compared to the standard approach,but the best overall F-measure. Both overall F-measure and accuracy are betterthan using the SpreadSubsample approach. This confirms the findings of Weisset al. (2007), who recommend using oversampling rather than undersampling whendealing with small data sets. The reason of outperforming the standard approach isthe better F-measure of the SELL class (44.5% versus 17.9%), and a comparativelysmaller difference in the BUY class F-measure (64.9% versus 75.2%). Since thereis no clear winner regarding accuracy and F-measure, we continue with two furtherevaluation sets, one using SMOTE, the other one using standard (no resampling).
We compare the linear SVM classifier with all other classifiers discussed inSection 2.2.5. As recommended by Hsu et al. (2010), for the SVM with the radialbasis function (RBF) kernel we optimize γ and C using the parameter optimiza-tion implemented by LIBSVM (see Section 4.2.2). For this setting, we obtain theoptimal value pair γ = 2−1 = 0.5 and C = 23 = 8. We will perform the γ andC optimization for each further setting separately. For k-NN, we choose k = 10,which is consistent with Mittermayer & Knolmayer (2006a). The results are shownin Table 5.5. k-NN achieves the highest F-measure for the SELL class, but the
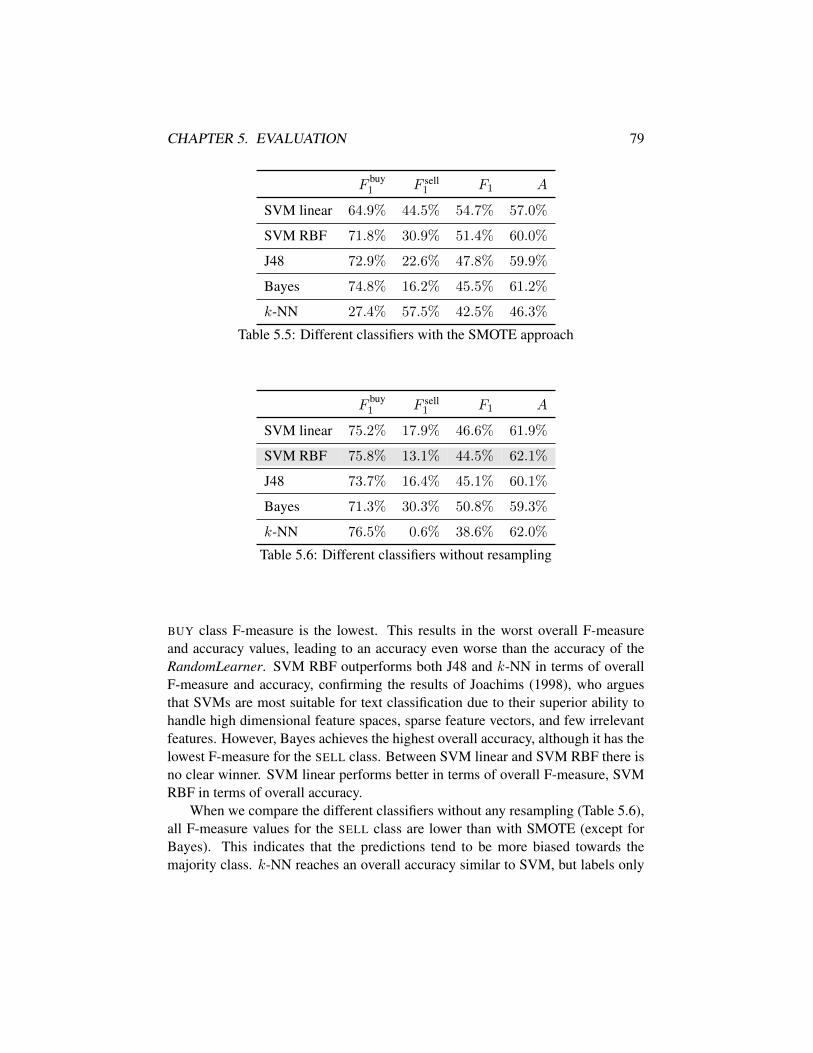
CHAPTER 5. EVALUATION 79
Fbuy1 F sell
1 F1 A
SVM linear 64.9% 44.5% 54.7% 57.0%
SVM RBF 71.8% 30.9% 51.4% 60.0%
J48 72.9% 22.6% 47.8% 59.9%
Bayes 74.8% 16.2% 45.5% 61.2%
k-NN 27.4% 57.5% 42.5% 46.3%
Table 5.5: Different classifiers with the SMOTE approach
Fbuy1 F sell
1 F1 A
SVM linear 75.2% 17.9% 46.6% 61.9%
SVM RBF 75.8% 13.1% 44.5% 62.1%
J48 73.7% 16.4% 45.1% 60.1%
Bayes 71.3% 30.3% 50.8% 59.3%
k-NN 76.5% 0.6% 38.6% 62.0%
Table 5.6: Different classifiers without resampling
BUY class F-measure is the lowest. This results in the worst overall F-measureand accuracy values, leading to an accuracy even worse than the accuracy of theRandomLearner. SVM RBF outperforms both J48 and k-NN in terms of overallF-measure and accuracy, confirming the results of Joachims (1998), who arguesthat SVMs are most suitable for text classification due to their superior ability tohandle high dimensional feature spaces, sparse feature vectors, and few irrelevantfeatures. However, Bayes achieves the highest overall accuracy, although it has thelowest F-measure for the SELL class. Between SVM linear and SVM RBF there isno clear winner. SVM linear performs better in terms of overall F-measure, SVMRBF in terms of overall accuracy.
When we compare the different classifiers without any resampling (Table 5.6),all F-measure values for the SELL class are lower than with SMOTE (except forBayes). This indicates that the predictions tend to be more biased towards themajority class. k-NN reaches an overall accuracy similar to SVM, but labels only
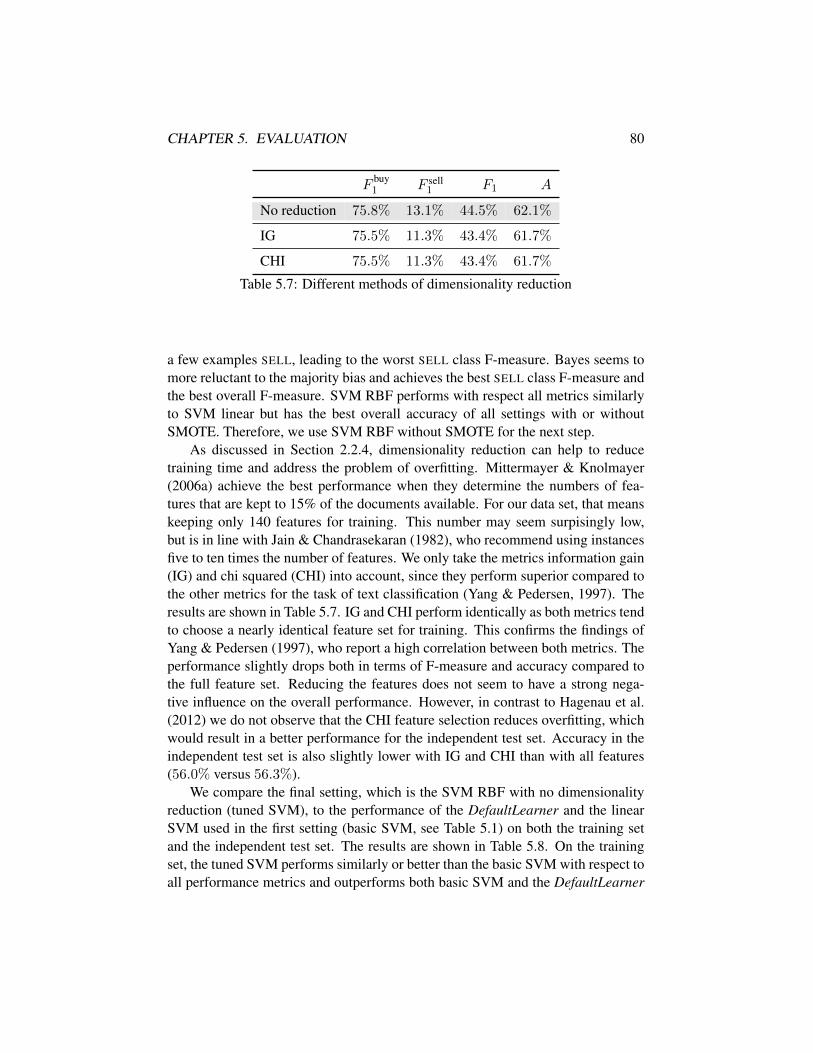
CHAPTER 5. EVALUATION 80
Fbuy1 F sell
1 F1 A
No reduction 75.8% 13.1% 44.5% 62.1%
IG 75.5% 11.3% 43.4% 61.7%
CHI 75.5% 11.3% 43.4% 61.7%
Table 5.7: Different methods of dimensionality reduction
a few examples SELL, leading to the worst SELL class F-measure. Bayes seems tomore reluctant to the majority bias and achieves the best SELL class F-measure andthe best overall F-measure. SVM RBF performs with respect all metrics similarlyto SVM linear but has the best overall accuracy of all settings with or withoutSMOTE. Therefore, we use SVM RBF without SMOTE for the next step.
As discussed in Section 2.2.4, dimensionality reduction can help to reducetraining time and address the problem of overfitting. Mittermayer & Knolmayer(2006a) achieve the best performance when they determine the numbers of fea-tures that are kept to 15% of the documents available. For our data set, that meanskeeping only 140 features for training. This number may seem surpisingly low,but is in line with Jain & Chandrasekaran (1982), who recommend using instancesfive to ten times the number of features. We only take the metrics information gain(IG) and chi squared (CHI) into account, since they perform superior compared tothe other metrics for the task of text classification (Yang & Pedersen, 1997). Theresults are shown in Table 5.7. IG and CHI perform identically as both metrics tendto choose a nearly identical feature set for training. This confirms the findings ofYang & Pedersen (1997), who report a high correlation between both metrics. Theperformance slightly drops both in terms of F-measure and accuracy compared tothe full feature set. Reducing the features does not seem to have a strong nega-tive influence on the overall performance. However, in contrast to Hagenau et al.(2012) we do not observe that the CHI feature selection reduces overfitting, whichwould result in a better performance for the independent test set. Accuracy in theindependent test set is also slightly lower with IG and CHI than with all features(56.0% versus 56.3%).
We compare the final setting, which is the SVM RBF with no dimensionalityreduction (tuned SVM), to the performance of the DefaultLearner and the linearSVM used in the first setting (basic SVM, see Table 5.1) on both the training setand the independent test set. The results are shown in Table 5.8. On the trainingset, the tuned SVM performs similarly or better than the basic SVM with respect toall performance metrics and outperforms both basic SVM and the DefaultLearner
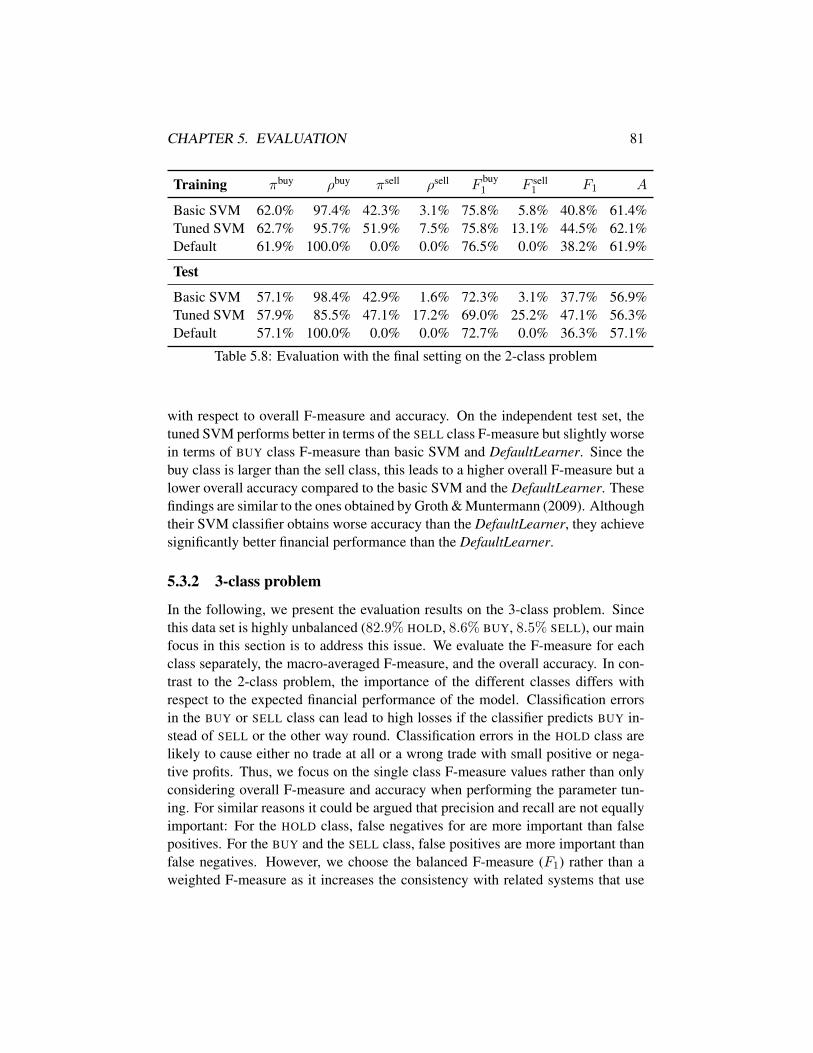
CHAPTER 5. EVALUATION 81
Training πbuy ρbuy πsell ρsell Fbuy1 F sell
1 F1 A
Basic SVM 62.0% 97.4% 42.3% 3.1% 75.8% 5.8% 40.8% 61.4%Tuned SVM 62.7% 95.7% 51.9% 7.5% 75.8% 13.1% 44.5% 62.1%Default 61.9% 100.0% 0.0% 0.0% 76.5% 0.0% 38.2% 61.9%
Test
Basic SVM 57.1% 98.4% 42.9% 1.6% 72.3% 3.1% 37.7% 56.9%Tuned SVM 57.9% 85.5% 47.1% 17.2% 69.0% 25.2% 47.1% 56.3%Default 57.1% 100.0% 0.0% 0.0% 72.7% 0.0% 36.3% 57.1%
Table 5.8: Evaluation with the final setting on the 2-class problem
with respect to overall F-measure and accuracy. On the independent test set, thetuned SVM performs better in terms of the SELL class F-measure but slightly worsein terms of BUY class F-measure than basic SVM and DefaultLearner. Since thebuy class is larger than the sell class, this leads to a higher overall F-measure but alower overall accuracy compared to the basic SVM and the DefaultLearner. Thesefindings are similar to the ones obtained by Groth & Muntermann (2009). Althoughtheir SVM classifier obtains worse accuracy than the DefaultLearner, they achievesignificantly better financial performance than the DefaultLearner.
5.3.2 3-class problem
In the following, we present the evaluation results on the 3-class problem. Sincethis data set is highly unbalanced (82.9% HOLD, 8.6% BUY, 8.5% SELL), our mainfocus in this section is to address this issue. We evaluate the F-measure for eachclass separately, the macro-averaged F-measure, and the overall accuracy. In con-trast to the 2-class problem, the importance of the different classes differs withrespect to the expected financial performance of the model. Classification errorsin the BUY or SELL class can lead to high losses if the classifier predicts BUY in-stead of SELL or the other way round. Classification errors in the HOLD class arelikely to cause either no trade at all or a wrong trade with small positive or nega-tive profits. Thus, we focus on the single class F-measure values rather than onlyconsidering overall F-measure and accuracy when performing the parameter tun-ing. For similar reasons it could be argued that precision and recall are not equallyimportant: For the HOLD class, false negatives for are more important than falsepositives. For the BUY and the SELL class, false positives are more important thanfalse negatives. However, we choose the balanced F-measure (F1) rather than aweighted F-measure as it increases the consistency with related systems that use
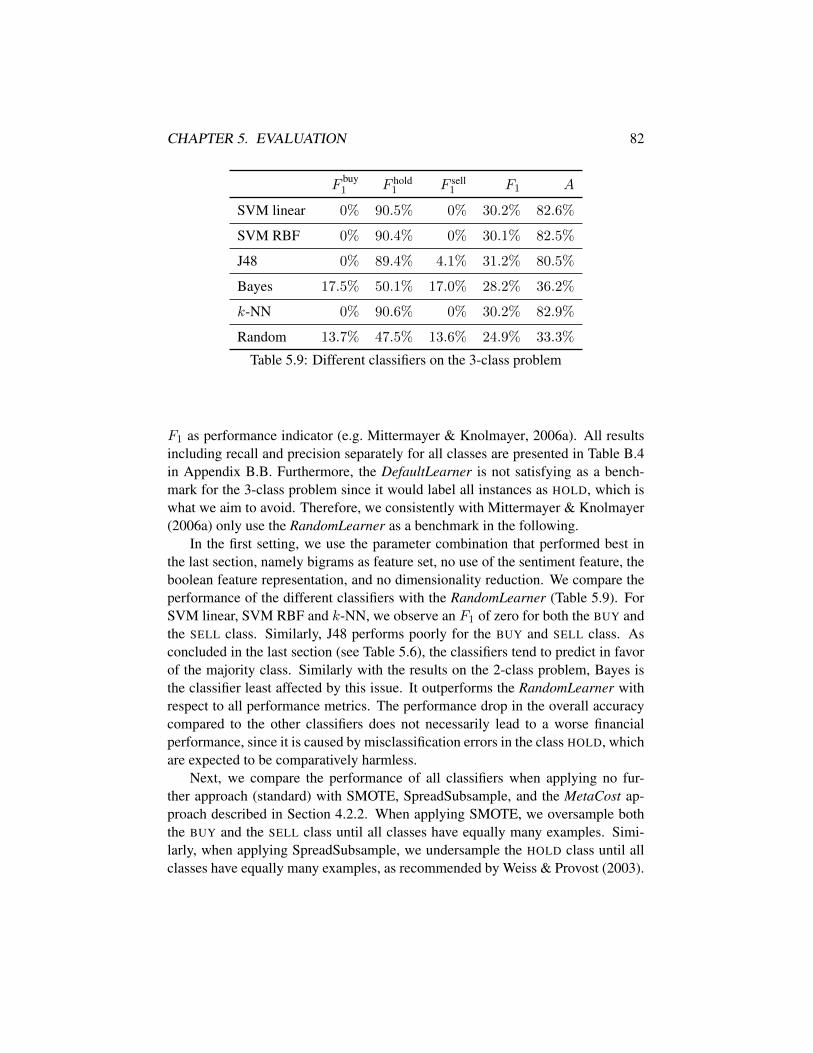
CHAPTER 5. EVALUATION 82
Fbuy1 F hold
1 F sell1 F1 A
SVM linear 0% 90.5% 0% 30.2% 82.6%
SVM RBF 0% 90.4% 0% 30.1% 82.5%
J48 0% 89.4% 4.1% 31.2% 80.5%
Bayes 17.5% 50.1% 17.0% 28.2% 36.2%
k-NN 0% 90.6% 0% 30.2% 82.9%
Random 13.7% 47.5% 13.6% 24.9% 33.3%
Table 5.9: Different classifiers on the 3-class problem
F1 as performance indicator (e.g. Mittermayer & Knolmayer, 2006a). All resultsincluding recall and precision separately for all classes are presented in Table B.4in Appendix B.B. Furthermore, the DefaultLearner is not satisfying as a bench-mark for the 3-class problem since it would label all instances as HOLD, which iswhat we aim to avoid. Therefore, we consistently with Mittermayer & Knolmayer(2006a) only use the RandomLearner as a benchmark in the following.
In the first setting, we use the parameter combination that performed best inthe last section, namely bigrams as feature set, no use of the sentiment feature, theboolean feature representation, and no dimensionality reduction. We compare theperformance of the different classifiers with the RandomLearner (Table 5.9). ForSVM linear, SVM RBF and k-NN, we observe an F1 of zero for both the BUY andthe SELL class. Similarly, J48 performs poorly for the BUY and SELL class. Asconcluded in the last section (see Table 5.6), the classifiers tend to predict in favorof the majority class. Similarly with the results on the 2-class problem, Bayes isthe classifier least affected by this issue. It outperforms the RandomLearner withrespect to all performance metrics. The performance drop in the overall accuracycompared to the other classifiers does not necessarily lead to a worse financialperformance, since it is caused by misclassification errors in the class HOLD, whichare expected to be comparatively harmless.
Next, we compare the performance of all classifiers when applying no fur-ther approach (standard) with SMOTE, SpreadSubsample, and the MetaCost ap-proach described in Section 4.2.2. When applying SMOTE, we oversample boththe BUY and the SELL class until all classes have equally many examples. Simi-larly, when applying SpreadSubsample, we undersample the HOLD class until allclasses have equally many examples, as recommended by Weiss & Provost (2003).
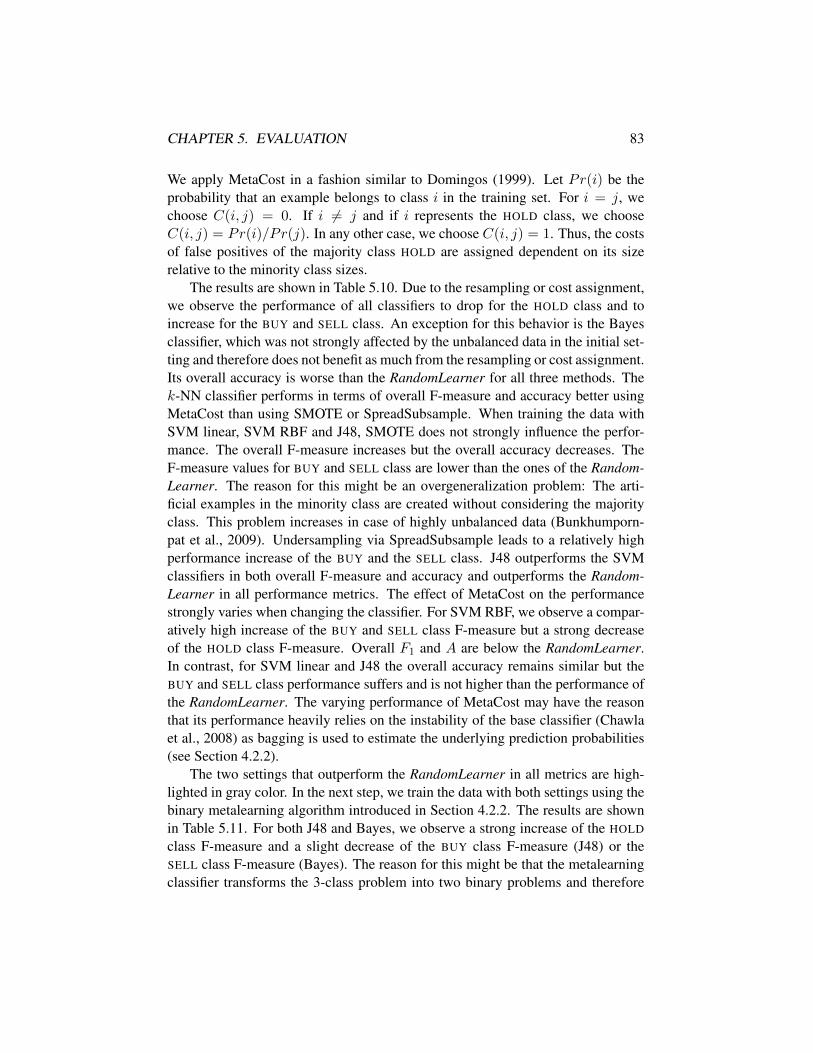
CHAPTER 5. EVALUATION 83
We apply MetaCost in a fashion similar to Domingos (1999). Let Pr(i) be theprobability that an example belongs to class i in the training set. For i = j, wechoose C(i, j) = 0. If i 6= j and if i represents the HOLD class, we chooseC(i, j) = Pr(i)/Pr(j). In any other case, we choose C(i, j) = 1. Thus, the costsof false positives of the majority class HOLD are assigned dependent on its sizerelative to the minority class sizes.
The results are shown in Table 5.10. Due to the resampling or cost assignment,we observe the performance of all classifiers to drop for the HOLD class and toincrease for the BUY and SELL class. An exception for this behavior is the Bayesclassifier, which was not strongly affected by the unbalanced data in the initial set-ting and therefore does not benefit as much from the resampling or cost assignment.Its overall accuracy is worse than the RandomLearner for all three methods. Thek-NN classifier performs in terms of overall F-measure and accuracy better usingMetaCost than using SMOTE or SpreadSubsample. When training the data withSVM linear, SVM RBF and J48, SMOTE does not strongly influence the perfor-mance. The overall F-measure increases but the overall accuracy decreases. TheF-measure values for BUY and SELL class are lower than the ones of the Random-Learner. The reason for this might be an overgeneralization problem: The arti-ficial examples in the minority class are created without considering the majorityclass. This problem increases in case of highly unbalanced data (Bunkhumporn-pat et al., 2009). Undersampling via SpreadSubsample leads to a relatively highperformance increase of the BUY and the SELL class. J48 outperforms the SVMclassifiers in both overall F-measure and accuracy and outperforms the Random-Learner in all performance metrics. The effect of MetaCost on the performancestrongly varies when changing the classifier. For SVM RBF, we observe a compar-atively high increase of the BUY and SELL class F-measure but a strong decreaseof the HOLD class F-measure. Overall F1 and A are below the RandomLearner.In contrast, for SVM linear and J48 the overall accuracy remains similar but theBUY and SELL class performance suffers and is not higher than the performance ofthe RandomLearner. The varying performance of MetaCost may have the reasonthat its performance heavily relies on the instability of the base classifier (Chawlaet al., 2008) as bagging is used to estimate the underlying prediction probabilities(see Section 4.2.2).
The two settings that outperform the RandomLearner in all metrics are high-lighted in gray color. In the next step, we train the data with both settings using thebinary metalearning algorithm introduced in Section 4.2.2. The results are shownin Table 5.11. For both J48 and Bayes, we observe a strong increase of the HOLD
class F-measure and a slight decrease of the BUY class F-measure (J48) or theSELL class F-measure (Bayes). The reason for this might be that the metalearningclassifier transforms the 3-class problem into two binary problems and therefore
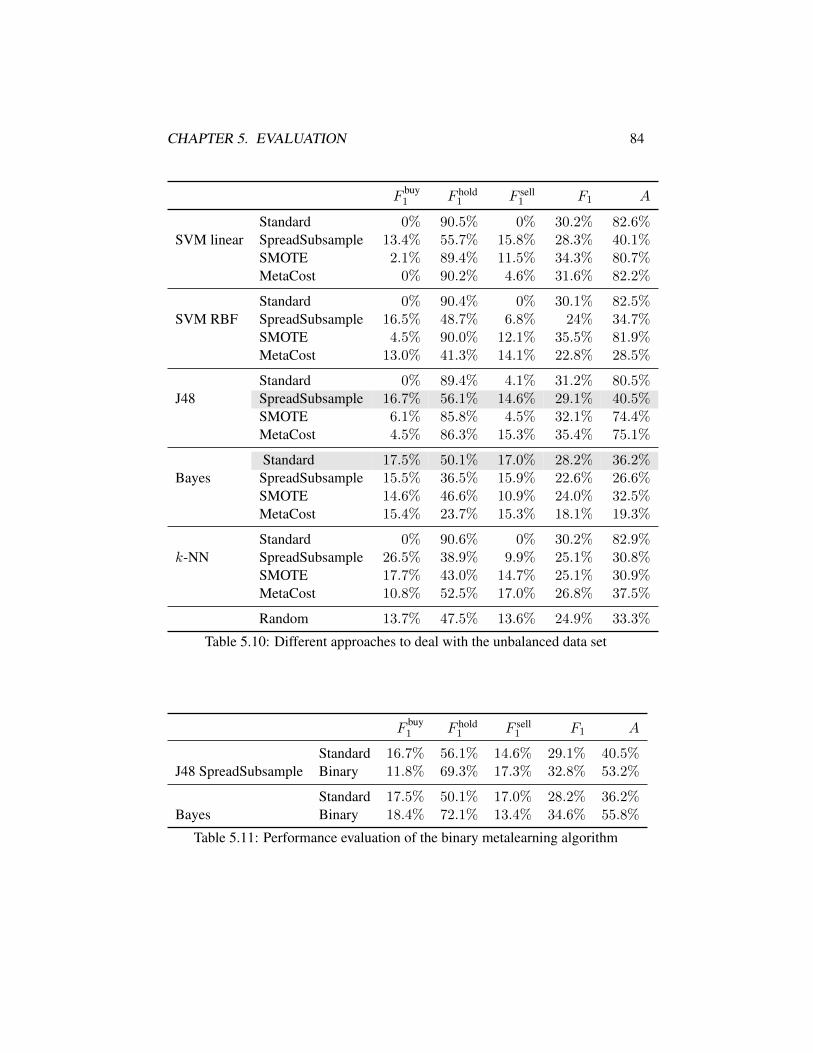
CHAPTER 5. EVALUATION 84
Fbuy1 F hold
1 F sell1 F1 A
SVM linearStandard 0% 90.5% 0% 30.2% 82.6%SpreadSubsample 13.4% 55.7% 15.8% 28.3% 40.1%SMOTE 2.1% 89.4% 11.5% 34.3% 80.7%MetaCost 0% 90.2% 4.6% 31.6% 82.2%
SVM RBFStandard 0% 90.4% 0% 30.1% 82.5%SpreadSubsample 16.5% 48.7% 6.8% 24% 34.7%SMOTE 4.5% 90.0% 12.1% 35.5% 81.9%MetaCost 13.0% 41.3% 14.1% 22.8% 28.5%
J48Standard 0% 89.4% 4.1% 31.2% 80.5%SpreadSubsample 16.7% 56.1% 14.6% 29.1% 40.5%SMOTE 6.1% 85.8% 4.5% 32.1% 74.4%MetaCost 4.5% 86.3% 15.3% 35.4% 75.1%
BayesStandard 17.5% 50.1% 17.0% 28.2% 36.2%SpreadSubsample 15.5% 36.5% 15.9% 22.6% 26.6%SMOTE 14.6% 46.6% 10.9% 24.0% 32.5%MetaCost 15.4% 23.7% 15.3% 18.1% 19.3%
k-NNStandard 0% 90.6% 0% 30.2% 82.9%SpreadSubsample 26.5% 38.9% 9.9% 25.1% 30.8%SMOTE 17.7% 43.0% 14.7% 25.1% 30.9%MetaCost 10.8% 52.5% 17.0% 26.8% 37.5%
Random 13.7% 47.5% 13.6% 24.9% 33.3%
Table 5.10: Different approaches to deal with the unbalanced data set
Fbuy1 F hold
1 F sell1 F1 A
J48 SpreadSubsampleStandard 16.7% 56.1% 14.6% 29.1% 40.5%Binary 11.8% 69.3% 17.3% 32.8% 53.2%
BayesStandard 17.5% 50.1% 17.0% 28.2% 36.2%Binary 18.4% 72.1% 13.4% 34.6% 55.8%
Table 5.11: Performance evaluation of the binary metalearning algorithm
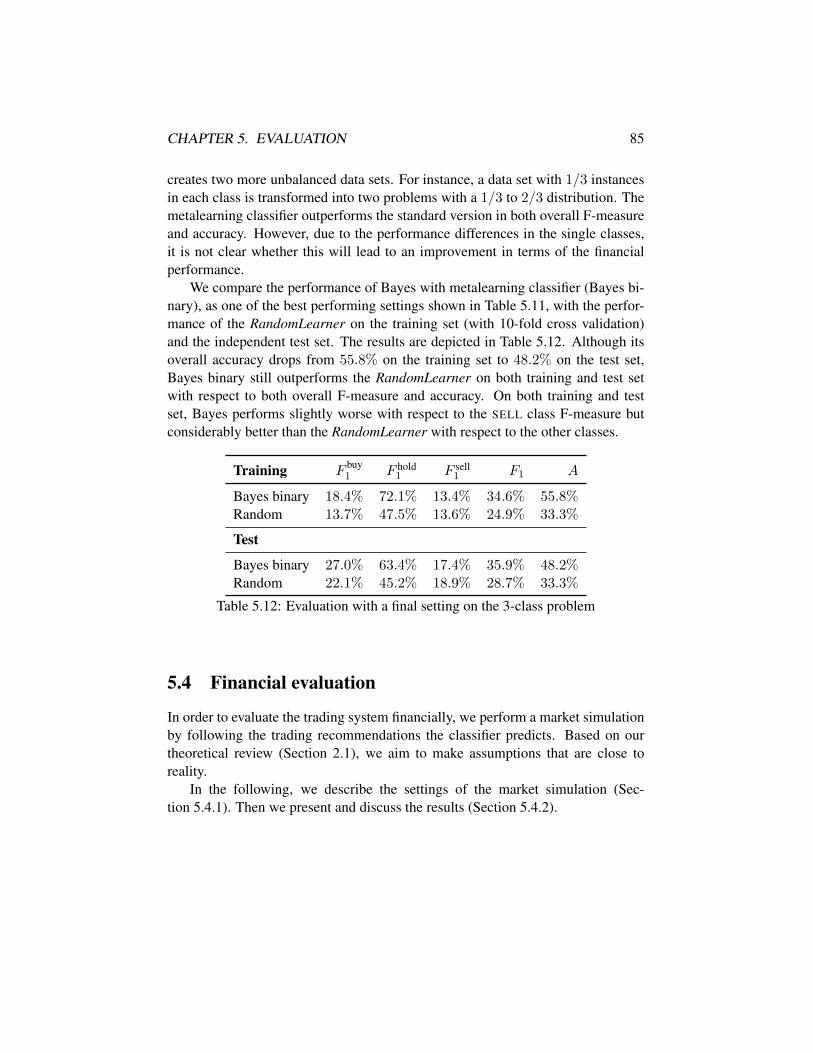
CHAPTER 5. EVALUATION 85
creates two more unbalanced data sets. For instance, a data set with 1/3 instancesin each class is transformed into two problems with a 1/3 to 2/3 distribution. Themetalearning classifier outperforms the standard version in both overall F-measureand accuracy. However, due to the performance differences in the single classes,it is not clear whether this will lead to an improvement in terms of the financialperformance.
We compare the performance of Bayes with metalearning classifier (Bayes bi-nary), as one of the best performing settings shown in Table 5.11, with the perfor-mance of the RandomLearner on the training set (with 10-fold cross validation)and the independent test set. The results are depicted in Table 5.12. Although itsoverall accuracy drops from 55.8% on the training set to 48.2% on the test set,Bayes binary still outperforms the RandomLearner on both training and test setwith respect to both overall F-measure and accuracy. On both training and testset, Bayes performs slightly worse with respect to the SELL class F-measure butconsiderably better than the RandomLearner with respect to the other classes.
Training Fbuy1 F hold
1 F sell1 F1 A
Bayes binary 18.4% 72.1% 13.4% 34.6% 55.8%Random 13.7% 47.5% 13.6% 24.9% 33.3%
Test
Bayes binary 27.0% 63.4% 17.4% 35.9% 48.2%Random 22.1% 45.2% 18.9% 28.7% 33.3%
Table 5.12: Evaluation with a final setting on the 3-class problem
5.4 Financial evaluation
In order to evaluate the trading system financially, we perform a market simulationby following the trading recommendations the classifier predicts. Based on ourtheoretical review (Section 2.1), we aim to make assumptions that are close toreality.
In the following, we describe the settings of the market simulation (Sec-tion 5.4.1). Then we present and discuss the results (Section 5.4.2).

CHAPTER 5. EVALUATION 86
5.4.1 Market simulation settings
We perform the market simulation in the time frame 7th May to 15th June 2012(test period). We run the classifier model obtained after the parameter tuning in thelast section on the unlabeled test set. As a result, we obtain a set of news labeledby the classifier. The labels are either BUY or SELL for the 2-class problem, andeither BUY, HOLD or SELL for the 3-class problem.
At the start of the simulation, we assume an available budget of 500,000$.This amount is consistent with the one chosen by Mittermayer (2006). At the timea news article is published that is labeled BUY, we place a market order (see Sec-tion 2.1.1) to buy stocks of the associated company worth 500,000$. Analogously,we place a short sale order worth 500,000$ in case of a news article labeled SELL.In both cases, we liquidate the position 20 minutes after the news arrival. Newsarticles labeled HOLD (in the 3-class problem) do not cause a trade. In accordancewith Mittermayer (2006), we assume that the process of downloading the newsmessage and the classifier prediction takes a maximum of 30 seconds. Therefore,we place an order with a delay of 30 seconds. We assume that this delay does nothave a strong influence on the profits, since the delay is very short compared tothe total holding period. For the sake of simplicity, we implicitly assume infinitedivisibility of a share, i.e. we are able to buy or sell exact 500,000$ of a stock. Asmost shares trade for less than 500$, the trade prices in our model differ only insmall fractions from the reality.
More importantly, we assume that we are able to buy 500,000$ worth of stockwithout moving the market. However, as described in Section 2.1.1, we would haveto pay price impact costs. A possible way to calculate these costs is to consider thewhole limit order book and reduce the profits by the price impact premium foreach trade. Unfortunately, we do not have the complete limit order books avail-able. Therefore, we assume fixed average price impact costs as discussed in Sec-tion 2.1.1. The trading costs are given in costs per round trip and are comprised ofdirect costs, costs caused by the bid-ask-spread and price impact costs. The totalcost can be assumed to sum up to c ≈ 69 bps = 0.69% for each round trip.2 Liet al. (2011) propose the lower estimate of 30 bps.
For the stock price data we utilize the same data set we used during the train-ing phase and transform it into price snapshots as described in Section 4.2.1. Foreach round trip, we calculate the profit Rb for a buy market order in the followingfashion:
Rb = (P20
P0.5− 1− c) · 500, 000.
2Since we look at S&P500 stocks, we adapt the trading costs for large caps estimated by ITG(2012): one-way costs of 34.4 bps, which is equivalent to round trip costs of ≈ 69 bps
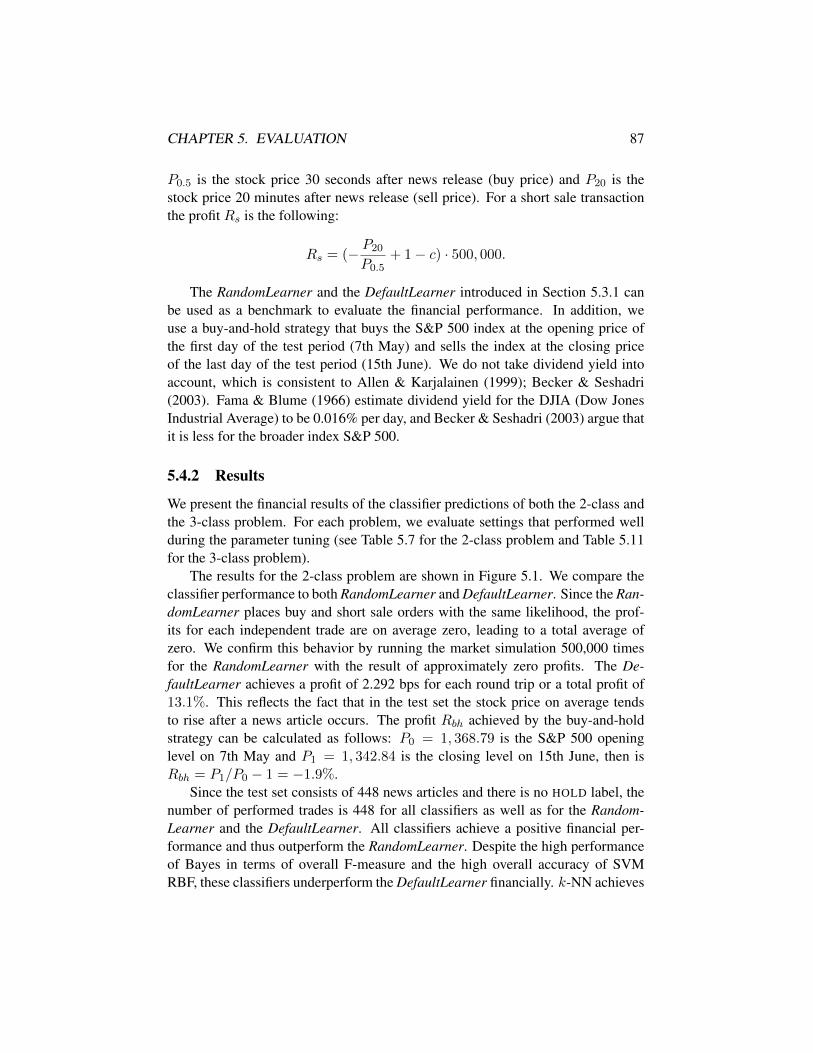
CHAPTER 5. EVALUATION 87
P0.5 is the stock price 30 seconds after news release (buy price) and P20 is thestock price 20 minutes after news release (sell price). For a short sale transactionthe profit Rs is the following:
Rs = (− P20
P0.5+ 1− c) · 500, 000.
The RandomLearner and the DefaultLearner introduced in Section 5.3.1 canbe used as a benchmark to evaluate the financial performance. In addition, weuse a buy-and-hold strategy that buys the S&P 500 index at the opening price ofthe first day of the test period (7th May) and sells the index at the closing priceof the last day of the test period (15th June). We do not take dividend yield intoaccount, which is consistent to Allen & Karjalainen (1999); Becker & Seshadri(2003). Fama & Blume (1966) estimate dividend yield for the DJIA (Dow JonesIndustrial Average) to be 0.016% per day, and Becker & Seshadri (2003) argue thatit is less for the broader index S&P 500.
5.4.2 Results
We present the financial results of the classifier predictions of both the 2-class andthe 3-class problem. For each problem, we evaluate settings that performed wellduring the parameter tuning (see Table 5.7 for the 2-class problem and Table 5.11for the 3-class problem).
The results for the 2-class problem are shown in Figure 5.1. We compare theclassifier performance to both RandomLearner and DefaultLearner. Since the Ran-domLearner places buy and short sale orders with the same likelihood, the prof-its for each independent trade are on average zero, leading to a total average ofzero. We confirm this behavior by running the market simulation 500,000 timesfor the RandomLearner with the result of approximately zero profits. The De-faultLearner achieves a profit of 2.292 bps for each round trip or a total profit of13.1%. This reflects the fact that in the test set the stock price on average tendsto rise after a news article occurs. The profit Rbh achieved by the buy-and-holdstrategy can be calculated as follows: P0 = 1, 368.79 is the S&P 500 openinglevel on 7th May and P1 = 1, 342.84 is the closing level on 15th June, then isRbh = P1/P0 − 1 = −1.9%.
Since the test set consists of 448 news articles and there is no HOLD label, thenumber of performed trades is 448 for all classifiers as well as for the Random-Learner and the DefaultLearner. All classifiers achieve a positive financial per-formance and thus outperform the RandomLearner. Despite the high performanceof Bayes in terms of overall F-measure and the high overall accuracy of SVMRBF, these classifiers underperform the DefaultLearner financially. k-NN achieves
CHAPTER 5. EVALUATION 88
0RandomLearner
2.302
2.44
3.435
2.562
3.637
2.929
0 0.5 1 1.5 2 2.5 3 3.5 4
SVM linear
SVM RBF
J48
Bayes
k-NN
DefaultLearner
Figure 5.1: Financial performance of the classifiers in bps per round trip(2-class problem)
3.637 bps (16.3% total profit) per round trip and J48 achieves 3.435 bps per roundtrip (15.4% total profit), both classifiers outperforming the DefaultLearner.
In the following, we evaluate whether the results are statistically significant.First, we compare k-NN to the DefaultLearner approach using the paired t testdescribed in Hsu & Lachenbruch (2008). Suppose that xi is the profit for each tradeachieved by k-NN, yi is the profit for each trade achieved by the DefaultLearner,and their difference is di = xi − yi for i = 1, . . . , n, where n = 448 is thetotal number of trades performed. We assume these differences to be normallydistributed, i.e. the random variable D = X − Y is normally distributed. Wefurther assume Di = Xi−Yi to be independent. The mean µd and the variance σ2
d
can be calculated as follows:
µd = µx − µy =1
n
n∑i=1
xi −1
n
n∑i=1
yi
σ2d =
1
n− 1
n∑i=1
(di − µd)2.
Suppose the null hypothesis is H0 : µx − µy ≤ 0, i.e. the average profits of k-NNare not higher than the average profits of the DefaultLearner, and the alternativehypothesis is H1 : µx − µy > 0. A Student’s t statistic can then be calculated as
t =√n · µd
σd.
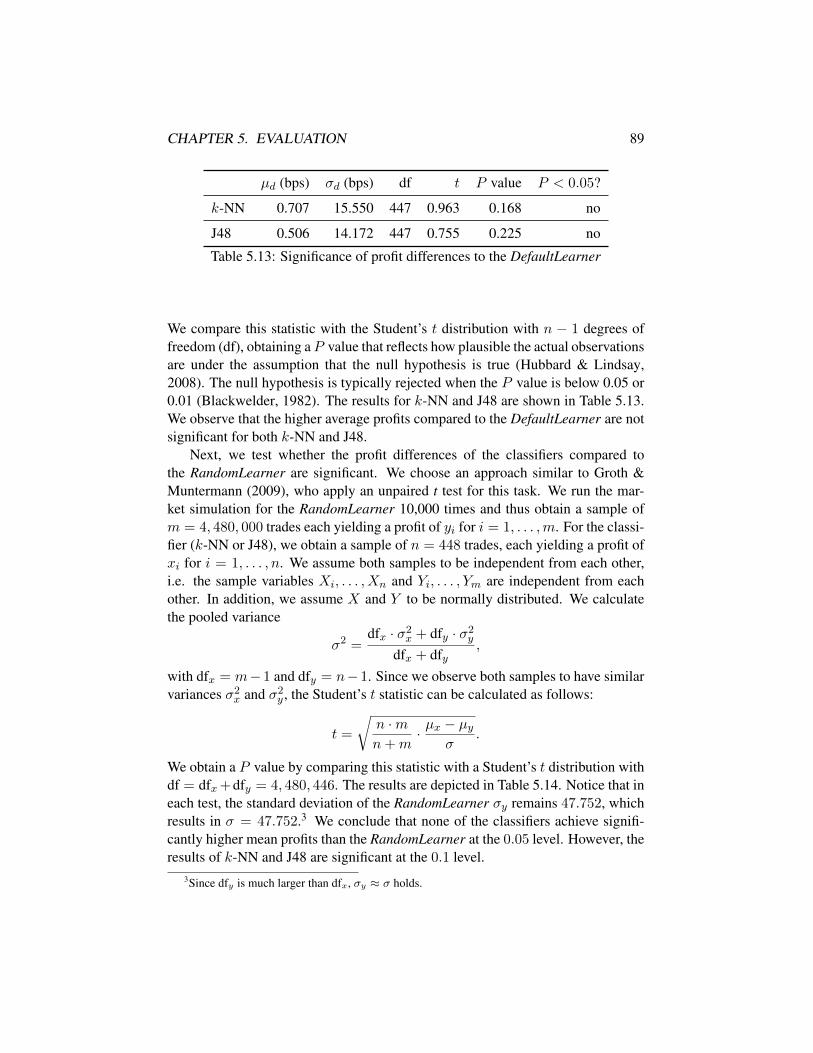
CHAPTER 5. EVALUATION 89
µd (bps) σd (bps) df t P value P < 0.05?
k-NN 0.707 15.550 447 0.963 0.168 no
J48 0.506 14.172 447 0.755 0.225 no
Table 5.13: Significance of profit differences to the DefaultLearner
We compare this statistic with the Student’s t distribution with n − 1 degrees offreedom (df), obtaining aP value that reflects how plausible the actual observationsare under the assumption that the null hypothesis is true (Hubbard & Lindsay,2008). The null hypothesis is typically rejected when the P value is below 0.05 or0.01 (Blackwelder, 1982). The results for k-NN and J48 are shown in Table 5.13.We observe that the higher average profits compared to the DefaultLearner are notsignificant for both k-NN and J48.
Next, we test whether the profit differences of the classifiers compared tothe RandomLearner are significant. We choose an approach similar to Groth &Muntermann (2009), who apply an unpaired t test for this task. We run the mar-ket simulation for the RandomLearner 10,000 times and thus obtain a sample ofm = 4, 480, 000 trades each yielding a profit of yi for i = 1, . . . ,m. For the classi-fier (k-NN or J48), we obtain a sample of n = 448 trades, each yielding a profit ofxi for i = 1, . . . , n. We assume both samples to be independent from each other,i.e. the sample variables Xi, . . . , Xn and Yi, . . . , Ym are independent from eachother. In addition, we assume X and Y to be normally distributed. We calculatethe pooled variance
σ2 =dfx · σ2
x + dfy · σ2y
dfx + dfy,
with dfx = m−1 and dfy = n−1. Since we observe both samples to have similarvariances σ2
x and σ2y , the Student’s t statistic can be calculated as follows:
t =
√n ·mn+m
· µx − µyσ
.
We obtain a P value by comparing this statistic with a Student’s t distribution withdf = dfx+dfy = 4, 480, 446. The results are depicted in Table 5.14. Notice that ineach test, the standard deviation of the RandomLearner σy remains 47.752, whichresults in σ = 47.752.3 We conclude that none of the classifiers achieve signifi-cantly higher mean profits than the RandomLearner at the 0.05 level. However, theresults of k-NN and J48 are significant at the 0.1 level.
3Since dfy is much larger than dfx, σy ≈ σ holds.
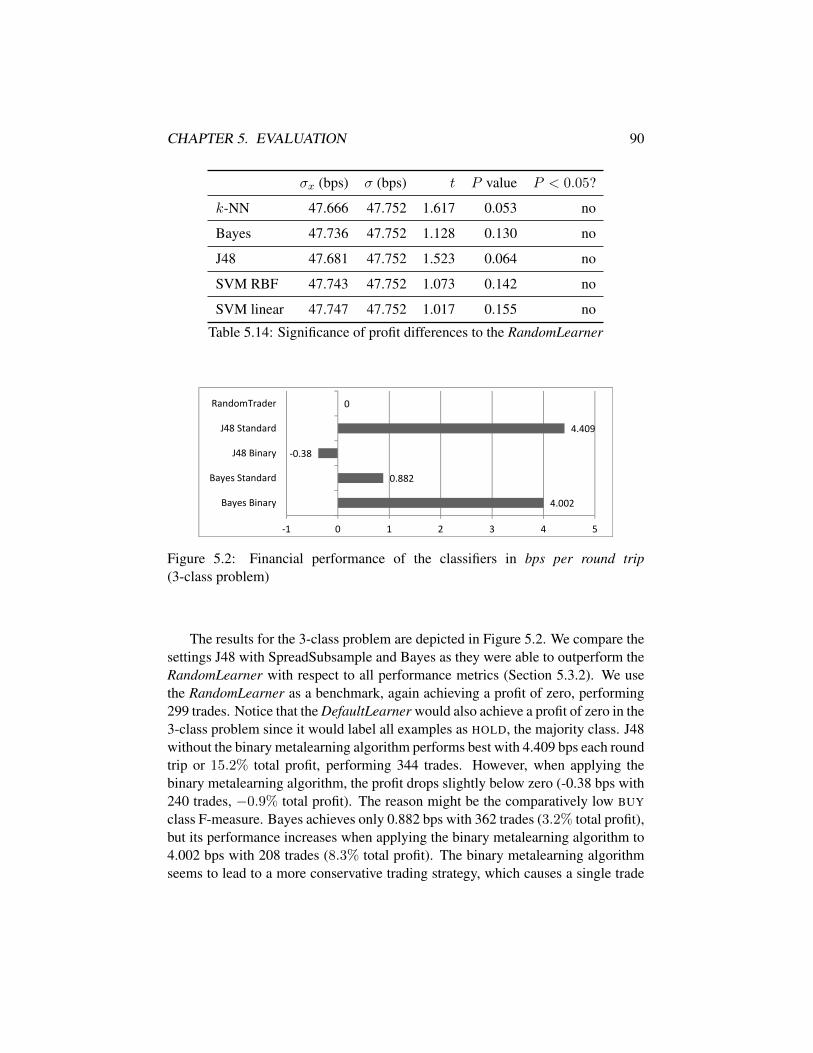
CHAPTER 5. EVALUATION 90
σx (bps) σ (bps) t P value P < 0.05?
k-NN 47.666 47.752 1.617 0.053 no
Bayes 47.736 47.752 1.128 0.130 no
J48 47.681 47.752 1.523 0.064 no
SVM RBF 47.743 47.752 1.073 0.142 no
SVM linear 47.747 47.752 1.017 0.155 no
Table 5.14: Significance of profit differences to the RandomLearner
0.882
-0.38
4.409
0
Bayes Standard
J48 Binary
J48 Standard
RandomTrader
4.002
-1 0 1 2 3 4 5
Bayes Binary
Figure 5.2: Financial performance of the classifiers in bps per round trip(3-class problem)
The results for the 3-class problem are depicted in Figure 5.2. We compare thesettings J48 with SpreadSubsample and Bayes as they were able to outperform theRandomLearner with respect to all performance metrics (Section 5.3.2). We usethe RandomLearner as a benchmark, again achieving a profit of zero, performing299 trades. Notice that the DefaultLearner would also achieve a profit of zero in the3-class problem since it would label all examples as HOLD, the majority class. J48without the binary metalearning algorithm performs best with 4.409 bps each roundtrip or 15.2% total profit, performing 344 trades. However, when applying thebinary metalearning algorithm, the profit drops slightly below zero (-0.38 bps with240 trades, −0.9% total profit). The reason might be the comparatively low BUY
class F-measure. Bayes achieves only 0.882 bps with 362 trades (3.2% total profit),but its performance increases when applying the binary metalearning algorithm to4.002 bps with 208 trades (8.3% total profit). The binary metalearning algorithmseems to lead to a more conservative trading strategy, which causes a single trade
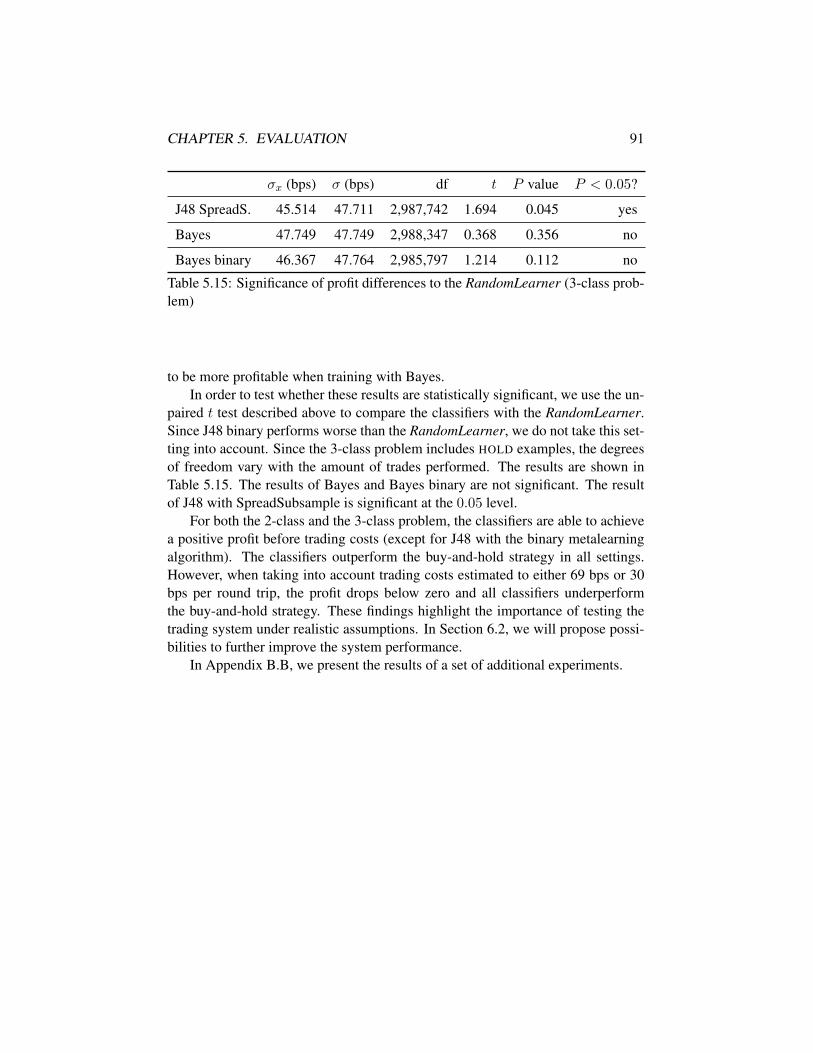
CHAPTER 5. EVALUATION 91
σx (bps) σ (bps) df t P value P < 0.05?
J48 SpreadS. 45.514 47.711 2,987,742 1.694 0.045 yes
Bayes 47.749 47.749 2,988,347 0.368 0.356 no
Bayes binary 46.367 47.764 2,985,797 1.214 0.112 no
Table 5.15: Significance of profit differences to the RandomLearner (3-class prob-lem)
to be more profitable when training with Bayes.In order to test whether these results are statistically significant, we use the un-
paired t test described above to compare the classifiers with the RandomLearner.Since J48 binary performs worse than the RandomLearner, we do not take this set-ting into account. Since the 3-class problem includes HOLD examples, the degreesof freedom vary with the amount of trades performed. The results are shown inTable 5.15. The results of Bayes and Bayes binary are not significant. The resultof J48 with SpreadSubsample is significant at the 0.05 level.
For both the 2-class and the 3-class problem, the classifiers are able to achievea positive profit before trading costs (except for J48 with the binary metalearningalgorithm). The classifiers outperform the buy-and-hold strategy in all settings.However, when taking into account trading costs estimated to either 69 bps or 30bps per round trip, the profit drops below zero and all classifiers underperformthe buy-and-hold strategy. These findings highlight the importance of testing thetrading system under realistic assumptions. In Section 6.2, we will propose possi-bilities to further improve the system performance.
In Appendix B.B, we present the results of a set of additional experiments.
Chapter 6
Conclusion
Financial news articles are proven to influence stock prices and thus, many profes-sional traders rely on newswire services as their major information source. How-ever, the increasing amount of up-to-date textual information leads to a substantialinformation overload, making it harder for market participants to select the in-formation relevant to them. Text mining as a means to analyze large amounts oftextual data is a promising approach to address this problem. The goal of this thesisis to forecast short term stock price movements using text mining techniques.
In the following, we provide a summary of this thesis (Section 6.1). We thenacknowledge the limitations of this thesis and propose ideas for further improve-ment (Section 6.2).
6.1 Summary
In Chapter 1, we provided an introduction to the thesis. In Chapter 2, we laid outthe theoretical foundations important for the subsequent chapters. In Section 2.1,we focused on basic financial concepts. We discussed the different ways to placean order at the market, and mentioned trading costs as an issue that needs to beconsidered by investors aiming for profits at the stock market. We then lookedat the different types and sources of financial news and identified newswire ser-vices as an important channel used to distribute regulated news. We discussed theefficient market hypothesis that questions the investors’ ability of earning excessprofits based on new information. We presented the event study methodology as ameans to test the efficient market hypothesis. In Section 2.2, we introduced the rel-evant text mining techniques. We explained the concept of transforming a text intoa feature vector representation and presented the features most important in thisthesis. We then went through the process of text preprocessing, assigning differ-
92
CHAPTER 6. CONCLUSION 93
ent feature weights according to their importance, and eliminating less importantfeatures. We compared the most common classifiers, provided means to handleunbalanced data sets, and presented metrics to evaluate the prediction performanceof a classifier.
In Chapter 3, we surveyed related systems that use text mining techniques withthe aim of either forecasting security prices or price volatility. We extracted ideasand approaches that tended to be successful in the past, including using a supportvector machine as a classifier, or restricting the diversity of news sources. We foundpotential areas for improvement, such as applying more complex sets of featuresor evaluating the system financially based on more realistic assumptions.
In Chapter 4, we presented our own stock price forecasting system. After illus-trating the general design of the system, we described our approach for acquiringthe news and stock price data. We extracted the needed information such as thepublishing time, the headline, and the text body from the news articles. We thenfiltered out less price relevant news articles and converted the news articles into asuitable format for the subsequent steps. Next, we labeled the news automatically,extracted different feature sets from the news, addressed the issue of unbalanceddata sets, and used the feature sets to train a classifier that is able to predict labelsfor an independent test set of news articles.
In Chapter 5, we evaluated the system performance for two different data sets(2-class problem and 3-class problem), both resulting from different labeling ap-proaches. We compared different system characteristics such as the feature setused, the method for handling unbalanced data, and the classifier trained with theaim of improving the prediction performance. Complex features such as part ofspeech categories and named entities do not improve the prediction accuracy com-pared to the bag-of-words approach. However, the bigram representation leads toan improved prediction performance and thus might be able to capture the relevanttext semantics more precisely. Given the data set is not highly unbalanced, wefound that the SMOTE oversampling approach outperforms the SpreadSubsampleundersampling approach. The classifier SVM is frequently described as superiorin the text classification task. However, our experiments suggested that for the 3-class problem, the Naıve Bayes and the decision tree were the only classifiers ableto outperform a random baseline with respect to all performance metrics.
Finally, we presented a market simulation based on assumptions close to re-ality in order to evaluate the system performance financially. We concluded thatpositive profits are achievable by all classifiers in the 2-class problem. In the 3-class problem, we observed positive profits for three of the four evaluated settings.However, when taking realistic trading costs into account, the profits are likely todrop below zero. In the next section, we will discuss possibilities for future workthat may have the potential to further improve the performance.
CHAPTER 6. CONCLUSION 94
6.2 Future work
The right choice of input data is one of the most important parts of a trading sys-tem such as the one developed in this thesis. More specifically, the likelihood ofthe stock prices being influenced by the news articles used for training, should beas high as possible. It can be assumed that this leads to less noise in the data andtherefore to a better prediction performance. Apart from the approaches presentedin this thesis (see Section 4.2.1) there are further ways to achieve this. First, thetrading volume can be taken into account. It has been shown that the stock’s tradingvolume is related to the announcement of relevant news (e.g. Kim & Verrecchia,1991; Ryan & Taffler, 2004). Therefore, only news articles followed by a signifi-cant increase in trading volume (compared to the stock’s average trading volume)can be used for training. Second, only news articles from a certain domain can betaken into account since the text characteristics responsible for changes in the stockprice might vary from domain to domain. For instance, one can consider only newsarticles dealing with the patent business of companies in the pharmaceutical sector.Although this limits the scope of the results, it potentially results in a more preciseprediction model. However, both of these approaches require a much larger datacorpus (e.g. 2 years intraday price data and news data) than the one used in thisthesis (17 weeks).
Some of the systems reviewed in this thesis predict stock price volatility. Arecent example is the system of Robertson et al. (2006). This system is based ona model specifically suitable for the task of volatility prediction, i.e. the expectedprice fluctuation of a stock. A possible method that might increase the financialperformance is to train two separate classifiers. Consider a two layer approach inthe classification phase. The first classifier predicts the expected volatility and thusthe expected stock price relevance of a published news article. Only if the newsarticle passes this relevance check will it be given to a classifier that predicts theactual stock price movement (UP or DOWN).
The automatic labeling approach has improvement potential. In general, thehigher the absolute value of the threshold used for labeling the news BUY or SELL,the more likely it is that the news is responsible for the price trend. Increasingthe threshold is therefore beneficial. However, it in turn increases the size of theHOLD class, making the data set more unbalanced. With more input data availablethis issue can be simply addressed using undersampling, which led in this thesisin most settings to poor prediction quality partly due to the small size of data left.Due to the limited resources available in this thesis, we assessed the effectivenessof the automatic labeling approach by manually labeling a random sample. Takingthis approach one step further, a team of domain experts can independently labelall training instances. Whenever all domain experts agree on either a label BUY
CHAPTER 6. CONCLUSION 95
or SELL, the training set is labeled accordingly. In case of disagreement, the labelUNCERTAIN is assigned. The resulting training set can serve as a gold standard forthe training set labeled automatically. Surprisingly, none of the systems reviewedin Chapter 3 attempt to establish such a gold standard.
When evaluating the classifier prediction performance, we observed the issueof the labeled data being unbalanced. SMOTE is one of the methods we used toaddress it. However, in case of strongly unbalanced data, SMOTE encounters anovergeneralization problem since it does not consider the majority class when cre-ating synthetic examples (Bunkhumpornpat et al., 2009). Different attempts havebeen made to improve SMOTE with respect to this problem (e.g. Bunkhumpornpatet al., 2009; Ramentol et al., 2012; Stefanowski & Wilk, 2008) which may increasethe prediction performance.
In the market simulation, we calculated the profits and considered the estimatedtrading costs independently including the price impact costs (see Section 2.1.1).Since a limited number of shares is available for the best price and a premium mustbe paid for each additional share an investor wants to buy, a more realistic way tocalculate the price impact costs is to take the whole limit order book into account.This approach would require the order book data for all trades in the simulationtime.
We believe that by tapping the full potential of text mining in the financialdomain there are many golden nuggets yet to be discovered. We hope that thecontributions presented in this thesis will help future research towards improvingthe quality of trading decisions powered by text mining techniques.

Chapter 7
Bibliography
Adler, P. A. & Adler, P. (1984). The Social Dynamics of Financial Markets, chapterThe market as collective behavior, (pp. 85–105). Jai Press.
Agrawal, R., Bayardo, R., & Srikant, R. (2000). Athena: Mining-based interactivemanagement of text databases. In C. Zaniolo, P. Lockemann, M. Scholl, & T.Grust (Eds.), Advances in Database Technology, volume 1777 of Lecture Notesin Computer Science (pp. 365–379). Berlin, Heidelberg: Springer.
Aha, D. W., Kibler, D., & Albert, M. K. (1991). Instance-based learning algo-rithms. Machine Learning, 6, 37–66.
Ahn, H.-J., Bae, K.-H., & Chan, K. (2001). Limit orders, depth, and volatility:Evidence from the stock exchange of Hong Kong. The Journal of Finance,56(2), 767–788.
Allen, F. & Karjalainen, R. (1999). Using genetic algorithms to find technicaltrading rules. Journal of Financial Economics, 51(2), 245–271.
Asahara, M. & Matsumoto, Y. (2003). Japanese named entity extraction with re-dundant morphological analysis. In Proceedings of the 2003 Conference of theNorth American Chapter of the Association for Computational Linguistics onHuman Language Technology - Volume 1 (pp. 8–15). Stroudsburg: Associationfor Computational Linguistics.
Baeza-Yates, R. A. & Ribeiro-Neto, B. (2011). Modern Information Retrieval,chapter Modeling, (pp. 57–130). Pearson Education: Boston.
Becker, L. & Seshadri, M. (2003). GP-evolved technical trading rules can outper-form buy and hold. In Procceedings of the Sixth International Conference onComputational Intelligence and Natural Computing Cary, North Carolina.
96
CHAPTER 7. BIBLIOGRAPHY 97
Ben-Hur, A. & Weston, J. (2010). A user’s guide to support vector machines. DataMining Techniques for the Life Sciences, 609, 223–239.
Bernard, V. L. & Thomas, J. K. (1990). Evidence that stock prices do not fullyreflect the implications of current earnings for future earnings. Journal of Ac-counting and Economics, 13(4), 305–340.
Bessembinder, H. & Venkataraman, K. (2010). Encyclopedia of Quantitative Fi-nance, chapter Bid–ask spreads. John Wiley & Sons: Hoboken, New Jersey.
Blackwelder, W. C. (1982). ”Proving the null hypothesis” in clinical trials. Con-trolled Clinical Trials, 3(4), 345–353.
Bloomberg (2012). Bloomberg professional. http://www.bloomberg.com/professional/. Accessed on 12/07/30.
Blumer, H. (1975). Readings in Collective Behavior, chapter Outline of collectivebehavior, (pp. 22–45). Rand McNally College Publishing.
Bodie, Z., Kane, A., & Marcus, A. J. (1989). Investments. New York: IrwinProfessional Publishing.
Bollerslev, T. (1986). Generalized autoregressive conditional heteroskedasticity.Journal of Econometrics, 31(3), 307–327.
Borthwick, A., Sterling, J., Agichtein, E., & Grishman, R. (1998). NYU: Descrip-tion of the MENE named entity system as used in MUC-7. In Proceedings of theSeventh Message Understanding Conference San Francisco: Morgan Kaufmann.
Boser, B. E., Guyon, I. M., & Vapnik, V. N. (1992). A training algorithm foroptimal margin classifiers. In Proceedings of the Fifth Annual Workshop onComputational Learning Theory (pp. 144–152). New York: ACM.
Brucher, H., Knolmayer, G., & Mittermayer, M.-A. (2002). Document classifi-cation methods for organizing explicit knowledge. In Proceedings of the ThirdEuropean Conference on Organizational Knowledge, Learning, and Capabili-ties Athens.
Brealey, R. A., Myers, S. C., & Allen, F. (2011). Principles of corporate finance,chapter Payout policy, (pp. 419–445). McGraw-Hill/Irwin: New York, 10. edi-tion.
Breiman, L. (1996). Bagging predictors. Machine Learning, 24(2), 123–140.
CHAPTER 7. BIBLIOGRAPHY 98
Bunkhumpornpat, C., Sinapiromsaran, K., & Lursinsap, C. (2009). Safe-level-SMOTE: Safe-level-synthetic minority over-sampling technique for handling theclass imbalanced problem. In T. Theeramunkong, B. Kijsirikul, N. Cercone, &T.-B. Ho (Eds.), Advances in Knowledge Discovery and Data Mining, volume5476 of Lecture Notes in Computer Science (pp. 475–482). Berlin, Heidelberg:Springer.
Burges, C. J. (1998). A tutorial on support vector machines for pattern recognition.Data Mining and Knowledge Discovery, 2, 121–167.
Chan, W. S. (2003). Stock price reaction to news and no-news: Drift and reversalafter headlines. Journal of Financial Economics, 70(2), 223–260.
Chang, C.-C. & Lin, C.-J. (2011). LIBSVM: A library for support vector machines.ACM Transactions on Intelligent Systems and Technology, 2, 1–27.
Chawla, N. V., Bowyer, K. W., Hall, L. O., & Kegelmeyer, W. P. (2002). SMOTE:Synthetic minority over-sampling technique. Journal of Artificial IntelligenceResearch, 16, 321–357.
Chawla, N. V., Cieslak, D. A., Hall, L. O., & Joshi, A. (2008). Automaticallycountering imbalance and its empirical relationship to cost. Data Mining andKnowledge Discovery, 17(2), 225–252.
Chen, C., Liaw, A., & Breiman, L. (2004). Using random forest to learn un-balanced data. Technical Report 666, University of California, Department ofStatistics, Berkeley.
Chinchor, N. A. (1998). Named entity task definition. In Proceedings of the Sev-enth Message Understanding Conference San Francisco: Morgan Kaufmann.
Cho, V. & Wuthrich, B. (1998). Towards real time discovery from distributedinformation sources. In Proceedings of the Second Pacific-Asia Conference onResearch and Development in Knowledge Discovery and Data Mining (pp. 376–377). London: Springer.
Cho, V., Wuthrich, B., & Zhang, J. (1999). Text processing for classification.Journal of Computational Intelligence in Finance, 7(2), 6–22.
Cohen, W. W. (1996). Learning to classify english text with ILP methods. In L.De Raedt (Ed.), Advances in Inductive Logic Programming (pp. 124–143). IOSPress.
CHAPTER 7. BIBLIOGRAPHY 99
Cortes, C. & Vapnik, V. (1995). Support-vector networks. Machine Learning,20(3), 273–297.
Cover, T. & Hart, P. (1967). Nearest neighbor pattern classification. IEEE Trans-actions on Information Theory, 13(1), 21–27.
Cunningham, H., Maynard, D., Bontcheva, K., & Tablan, V. (2002). GATE: Anarchitecture for development of robust HLT applications. In Proceedings of the40th Anniversary Meeting of the Association for Computational Linguistics (pp.168–175). Stroudsburg: Association for Computational Linguistics.
Cunningham, H., Maynard, D., Bontcheva, K., Tablan, V., Aswani, N., Roberts,I., Gorrell, G., Funk, A., Roberts, A., Damljanovic, D., Heitz, T., Green-wood, M. A., Saggion, H., Petrak, J., Li, Y., & Peters, W. (2011).Text processing with GATE (version 6). University of Sheffield, Depart-ment of Computer Science. http://gate.ac.uk/releases/gate-6.1-build3913-ALL/tao.pdf. Accessed on 12/08/23.
Cunningham, H., Maynard, D., & Tablan, V. (2000). JAPE: A Java AnnotationPatterns Engine (Second Edition). Technical report CS–00–10, University ofSheffield, Department of Computer Science.
Davis, A. K., Piger, J. M., & Sedor, L. M. (2012). Beyond the numbers: Measur-ing the information content of earnings press release language. ContemporaryAccounting Research, 29(3), 845–868.
Demsetz, H. (1968). The cost of transacting. The Quarterly Journal of Economics,82(1), 33–53.
Deutsche Borse (2012). The open Xetra order book. 10 best bid and ask quoteswith volume. http://www.boerse-frankfurt.de/en/aktien/xetra-orderbuch#tab_id=dax. Accessed on 12/07/23.
Domingos, P. (1999). MetaCost: A general method for making classifiers cost-sensitive. In Proceedings of the Fifth ACM SIGKDD International Conferenceon Knowledge Discovery and Data Mining (pp. 155–164). New York: ACM.
Dorre, J., Gerstl, P., & Seiffert, R. (1999). Text mining: Finding nuggets inmountains of textual data. In Proceedings of the Fifth ACM SIGKDD Inter-national Conference on Knowledge Discovery and Data Mining (pp. 398–401).New York: ACM.
Duda, R. O. & Hart, P. E. (1973). Pattern Classification and Scene Analysis. NewYork: John Wiley & Sons.
CHAPTER 7. BIBLIOGRAPHY 100
Duda, R. O., Hart, P. E., & Stork, D. G. (2001). Pattern Classification, chapterNonparametric techniques, (pp. 161–214). John Wiley & Sons: New York.
Dunning, T. (1993). Accurate methods for the statistics of surprise and coinci-dence. Computational Linguistics - Special issue on using large corpora: I,19(1), 61–74.
Edelen, R. M., Evans, R. B., & Kadlec, G. B. (2007). Scale effects in mutual fundperformance: The role of trading costs. Working Paper. SSRN.
EL-Manzalawy, Y. & Honavar, V. (2005). WLSVM: Integrating LibSVM intoWeka Environment. Software available at http://www.cs.iastate.edu/˜yasser/wlsvm. Accessed on 12/10/20.
Elton, E. J., Gruber, M. J., Brown, S. J., & Groetzmann, W. N. (2011a). ModernPortfolio Theory and Investment Analysis, chapter Financial markets, (pp. 11–27). John Wiley & Sons: New York, 5. edition.
Elton, E. J., Gruber, M. J., Brown, S. J., & Groetzmann, W. N. (2011b). ModernPortfolio Theory and Investment Analysis, chapter Efficient markets, (pp. 396–437). John Wiley & Sons: New York, 5. edition.
Fama, E. F. (1965). The behavior of stock-market prices. The Journal of Business,38(1), 34–105.
Fama, E. F. (1970). Efficient capital markets: A review of theory and empiricalwork. The Journal of Finance, 25(2), 383–417.
Fama, E. F. (1991). Efficient capital markets: II. The Journal of Finance, 46(5),1575–1617.
Fama, E. F. & Blume, M. E. (1966). Filter rules and stock-market trading. TheJournal of Business, 39(1), 226–241.
Fan, W., Wallace, L., Rich, S., & Zhang, Z. (2006). Tapping the power of textmining. Communications of the ACM, 49(9), 76–82.
Farhoomand, A. F. & Drury, D. H. (2002). Managerial information overload. Com-munications of the ACM, 45(10), 127–131.
Fawcett, T. & Provost, F. (1997). Adaptive fraud detection. Data Mining andKnowledge Discovery, 1, 291–316.
CHAPTER 7. BIBLIOGRAPHY 101
Fawcett, T. & Provost, F. (1999). Activity monitoring: Noticing interesting changesin behavior. In Proceedings of the Fifth ACM SIGKDD International Conferenceon Knowledge Discovery and Data Mining (pp. 53–62). New York: ACM.
Fayyad, U., Piatetsky-shapiro, G., & Smyth, P. (1996). From data mining to knowl-edge discovery in databases. AI Magazine, 17, 37–54.
Feldman, R. & Sanger, J. (2006). The Text Mining Handbook: Advanced Ap-proaches in Analyzing Unstructured Data. New York: Cambridge UniversityPress.
Forman, G. (2003). An extensive empirical study of feature selection metrics fortext classification. Journal of Machine Learning Research, 3, 1289–1305.
Frawley, W. J., Piatetsky-shapiro, G., & Matheus, C. J. (1992). Knowledge discov-ery in databases: An overview. AI Magazine, 13(3), 57–70.
French, K. R. (2008). Presidential address: The cost of active investing. TheJournal of Finance, 63(4), 1537–1573.
Fung, G., Xu Yu, J., & Lam, W. (2003). Stock prediction: Integrating text miningapproach using real-time news. In IEEE International Conference on Computa-tional Intelligence for Financial Engineering (pp. 395–402). Hong Kong: IEEE.
Fung, G., Yu, J., & Lam, W. (2002). News sensitive stock trend prediction. InM.-S. Chen, P. Yu, & B. Liu (Eds.), Advances in Knowledge Discovery andData Mining, volume 2336 of Lecture Notes in Computer Science (pp. 481–493). Berlin, Heidelberg: Springer.
Fung, G., Yu, J. X., & Lu, H. (2005). The predicting power of textual informationon financial markets. IEEE Intelligent Informatics Bulletin, 5(1), 1–10.
Gerstl, P., Hertweck, M., & Kuhn, B. (2002). Text Mining: Grundlagen, Verfahrenund Anwendungen. HMD – Praxis der Wirtschaftsinformatik, 222, 38–48.
Gidofalvi, G. (2001). Using News Articles to Predict Stock Price Movements.Technical report, University of California, Department of Computer Science andEngineering, San Diego.
Gidofalvi, G. & Elkan, C. (2003). Using News Articles to Predict Stock PriceMovements. Technical report, University of California, Department of ComputerScience and Engineering, San Diego.
Goncalves, M. (2011). Modern Information Retrieval, chapter Text classification.Pearson Education: Boston.

CHAPTER 7. BIBLIOGRAPHY 102
Goncalves, T. & Quaresma, P. (2005). Enhancing a Portuguese text classifier usingpart-of-speech tags. In M. Kłopotek, S. Wierzchon, & K. Trojanowski (Eds.),Intelligent Information Processing and Web Mining, volume 31 of Advances inSoft Computing (pp. 189–198). Berlin, Heidelberg: Springer.
Grossman, S. J. & Stiglitz, J. E. (1980). On the impossibility of informationallyefficient markets. The American Economic Review, 70(3), 393–408.
Groth, S. & Muntermann, J. (2008). A text mining approach to support intradayfinancial decision-making. In Proceedings of the Fourteenth Americas Confer-ence on Information Systems Toronto.
Groth, S. S. (2010). Enhancing automated trading engines to cope with news-related liquidity shocks. In Eighteenth European Conference on InformationSystems Pretoria.
Groth, S. S. & Muntermann, J. (2009). Supporting investment management pro-cesses with machine learning techniques. In H. R. Hansen, D. Karagiannis,& H.-G. Fill (Eds.), Business Services: Konzepte, Technologien, Anwendun-gen. Neunte Internationale Tagung Wirtschaftsinformatik, volume 247 (pp. 275–286). Wien: Osterreichische Computer Gesellschaft.
Groth, S. S. & Muntermann, J. (2011). An intraday market risk management ap-proach based on textual analysis. Decision Support Systems, 50(4), 680–691.
Hagenau, M., Liebmann, M., Hedwig, M., & Neumann, D. (2012). Automatednews reading: Stock price prediction based on financial news using context-specific features. In 45th Hawaii International Conference on System Science(pp. 1040–1049). Maui: IEEE.
Hall, M., Frank, E., Holmes, G., Pfahringer, B., Reutemann, P., & Witten, I. H.(2009). The WEKA data mining software: An update. ACM SIGKDD Explo-rations Newsletter, 11(1), 10–18.
Harris, L. (2003). Trading and exchanges. Market Microstructure for Practitioners,chapter Orders and order properties. Financial Management Association. OxfordUniversity Press: New York.
Hatzivassiloglou, V. & McKeown, K. R. (1997). Predicting the semantic orienta-tion of adjectives. In Proceedings of the Eighth Conference on European Chap-ter of the Association for Computational Linguistics (pp. 174–181). Stroudsburg:Association for Computational Linguistics.
CHAPTER 7. BIBLIOGRAPHY 103
Henry, E. (2008). Are investors influenced by how earnings press releases arewritten? Journal of Business Communication, 45(4), 363–407.
Hepple, M. (2000). Independence and commitment: Assumptions for rapid train-ing and execution of rule-based POS taggers. In Proceedings of the 38th AnnualMeeting on Association for Computational Linguistics (pp. 278–277). Strouds-burg: Association for Computational Linguistics.
Herrmann, K. (2002). Rakesh Agrawal: Athena: mining-based interac-tive management of text databases. Hauptseminar Informatik ”DatabaseHall of Fame”, Technische Universitat Munchen. http://wwwbayer.in.tum.de/lehre/WS2001/HSEM-bayer/textmining.pdf. Accessedon 12/06/04.
Hobbs, J. R. & Riloff, E. (2010). Information extraction. In N. Indurkhya & F. J.Damerau (Eds.), Handbook of Natural Language Processing. Boca Raton: CRCPress, Taylor and Francis Group, 2. edition.
Hsu, C.-W., Chang, C.-C., & Lin, C.-J. (2010). A Practical Guide to Support VectorClassification. Technical Report 1, National Taiwan University, Department ofComputer Science, Taipei.
Hsu, H. & Lachenbruch, P. A. (2008). Wiley Encyclopedia of Clinical Trials, chap-ter Paired t test. John Wiley & Sons: Hoboken, New Jersey.
Hubbard, R. & Lindsay, R. (2008). Why p values are not a useful measure ofevidence in statistical significance testing. Theory & Psychology, 18(1), 69–88.
Hull, D. A. (1998). Stemming algorithms: A case study for detailed evaluation.Journal of the American Society for Information Science, 47(1), 70–84.
ITG (2012). ITG’s global cost review 2012/Q1. Final results asof 7/11/2012. http://itg.com/news_events/papers/ITGGlobalCostReview_2012Q1.pdf. Accessed on 12/07/28.
Jain, A. & Chandrasekaran, B. (1982). 39 dimensionality and sample size con-siderations in pattern recognition practice. In P. Krishnaiah & L. Kanal (Eds.),Classification Pattern Recognition and Reduction of Dimensionality, volume 2of Handbook of Statistics (pp. 835–855). New York: Elsevier Science.
Jensen, M. C. (1978). Some anomalous evidence regarding market efficiency. Jour-nal of Financial Economics, 6(2-3), 95–101.
CHAPTER 7. BIBLIOGRAPHY 104
Joachims, T. (1998). Text categorization with support vector machines: Learningwith many relevant features. In C. Nedellec & C. Rouveirol (Eds.), Proceed-ings of the Tenth European Conference on Machine Learning, volume 1398 ofLecture Notes in Computer Science (pp. 137–142). Berlin, Heidelberg: Springer.
Joachims, T. (1999). Making Large-Scale Support Vector Machine Learning Prac-tical, (pp. 169–184). MIT Press: Cambridge.
Kaserer, C. & Nowak, E. (2001). Die Anwendung von Ereignisstudien bei Ad-hoc-Mitteilungen. Zugleich Stellungnahme zu dem Beitrag ”Die Information-swirkung von Ad hoc-Meldungen” von Klaus Roder. Zeitschrift fur Betrieb-swirtschaft, 71(11), 1353–1356.
Kim, O. & Verrecchia, R. E. (1991). Trading volume and price reactions to publicannouncements. Journal of Accounting Research, 29(2), 302–321.
Kissell, R. (2006). The expanded implementation shortfall: “Understanding trans-action cost components”. The Journal of Trading, 1(3), 6–16.
Kohavi, R. (1995). A study of cross-validation and bootstrap for accuracy estima-tion and model selection. In Proceedings of the Fourteenth International JointConference on Artificial intelligence, volume 2 (pp. 1137–1143). San Francisco:Morgan Kaufmann.
Krovetz, R. (1993). Viewing morphology as an inference process. In Proceedingsof the Sixteenth Annual International ACM SIGIR Conference on Research andDevelopment in Information Retrieval (pp. 191–202). New York: ACM.
Kubat, M. & Matwin, S. (1997). Addressing the curse of imbalanced training sets:One-sided selection. In D. H. Fisher (Ed.), Proceedings of the Fourteenth Inter-national Conference on Machine Learning (pp. 179–186). Burlington: MorganKaufmann.
Lam, W., Low, K. F., & Ho, C. Y. (1997). Using a Bayesian network inductionapproach for text categorization. In Proceedings of the Fifteenth InternationalJoint Conference on Artificial Intelligence (pp. 745–750). San Francisco: Mor-gan Kaufmann.
Lavrenko, V., Lawrie, D., Ogilvie, P., & Schmill, M. (1999). Ænalyst - electronicanalyst of stock behavior. CmpSci 791 m Project Draft. University of Mas-sachusetts, Department of Computer Science, Amherst.
CHAPTER 7. BIBLIOGRAPHY 105
Lavrenko, V., Schmill, M., Lawrie, D., Ogilvie, P., Jensen, D., & Allan, J. (2000a).Language models for financial news recommendation. In Proceedings of theNinth International Conference on Information and Knowledge Management(pp. 389–396). New York: ACM.
Lavrenko, V., Schmill, M., Lawrie, D., Ogilvie, P., Jensen, D., & Allan, J. (2000b).Mining of concurrent text and time series. In Proceedings of the Sixth ACMSIGKDD International Conference on Knowledge Discovery and Data Mining(pp. 37–44). New York: ACM.
Lee, A. J. T., Lin, M.-C., Kao, R.-T., & Chen, K.-T. (2010). An effective clusteringapproach to stock market prediction. In Proceedings of the Fourteenth PacificAsia Conference on Information Systems Taipei: Association for InformationSystems. Paper 54.
Lewis, D. D., Yang, Y., Rose, T. G., & Li, F. (2004). RCV1: A new benchmarkcollection for text categorization research. The Journal of Machine LearningResearch, 5, 361–397.
LexisNexis (2012a). About LexisNexis. http://www.lexisnexis.com/en-us/about-us/about-us.page. Accessed on 12/07/29.
LexisNexis (2012b). Welcome to the LexisNexis R© Web Services Kit. http://www.lexisnexis.com/webserviceskit/. Accessed on 12/07/30.
Li, X., Wang, C., Dong, J., Wang, F., Deng, X., & Zhu, S. (2011). Improvingstock market prediction by integrating both market news and stock prices. In A.Hameurlain, S. Liddle, K.-D. Schewe, & X. Zhou (Eds.), Database and ExpertSystems Applications, volume 6861 of Lecture Notes in Computer Science (pp.279–293). Berlin, Heidelberg: Springer.
Lin, M.-C., Lee, A. J. T., Kao, R.-T., & Chen, K.-T. (2011). Stock price movementprediction using representative prototypes of financial reports. ACM Transac-tions on Management Information Systems, 2(3), 1–18.
Lintner, J. (1965). The valuation of risk assets and the selection of risky invest-ments in stock portfolios and capital budgets. The Review of Economics andStatistics, 47(1), 13–37.
Luhn, H. P. (1957). A statistical approach to mechanized encoding and searching ofliterary information. IBM Journal of Research and Development, 1(4), 309–317.
MacKinlay, A. C. (1997). Event studies in economics and finance. Journal ofEconomic Literature, 35(1), 13–39.

CHAPTER 7. BIBLIOGRAPHY 106
Manning, C. D., Raghavan, P., & Schutze, H. (2008). Introduction to InformationRetrieval. New York: Cambridge University Press.
Manning, C. D. & Schutze, H. (1999). Foundations of Statistical Natural LanguageProcessing. Cambridge: MIT Press.
Marcus, M. P., Marcinkiewicz, M. A., & Santorini, B. (1993). Building a largeannotated corpus of English: the Penn Treebank. Computational Linguistics -Special Issue on Using Large Corpora: II, 19(2), 313–330.
Marrero, M., Sanchez-Cuadrado, S., Lara, J. M., & Andreadakis, G. (2009). Eval-uation of named entity extraction systems. Advances in Computational Linguis-tics. Research in Computing Science, 41, 47–58.
Massy, W. F. (1965). Discriminant analysis of audience characteristics. Journal ofAdvertising Research, 5, 39–48.
McCallum, A. & Nigam, K. (1998). A comparison of event models for Naive Bayestext classification. In AAAI-98 Workshop on Learning for Text Categorization(pp. 41–48).: AAAI Press.
Mercer, M. (2004). How do investors assess the credibility of management disclo-sures? Accounting Horizons, 18(3), 185–196.
Michie, D., Spiegelhalter, D. J., & Taylor, C. (1994). Machine Learning, Neuraland Statistical Classification. Upper Saddle River, New Jersey: Ellis Horwood.
Mierswa, I., Wurst, M., Klinkenberg, R., Scholz, M., & Euler, T. (2006). YALE:rapid prototyping for complex data mining tasks. In Proceedings of the TwelfthACM SIGKDD International Conference on Knowledge Discovery and DataMining (pp. 935–940). New York: ACM.
Mikheev, A., Moens, M., & Grover, C. (1999). Named entity recognition withoutgazetteers. In Proceedings of the Ninth Conference on European Chapter of theAssociation for Computational Linguistics (pp. 1–8). Stroudsburg: Associationfor Computational Linguistics.
Mitchell, T. (1997). Machine Learning. New York: McGraw-Hill Education (ISEEditions).
Mitra, L. & Mitra, G. (2011). The Handbook of News Analytics in Finance, chapterApplications of news analytics in finance: A review, (pp. 1–39). John Wiley &Sons: Hoboken, New Jersey.
CHAPTER 7. BIBLIOGRAPHY 107
Mittermayer, M.-A. (2004). Forecasting intraday stock price trends with text min-ing techniques. In R. H. Sprague (Ed.), Proceedings of the 37th Annual HawaiiInternational Conference on System Sciences Big Island: IEEE Computer Soci-ety.
Mittermayer, M.-A. (2006). Einsatz von Text Mining zur Prognose kurzfristigerTrends von Aktienkursen nach der Publikation von Unternehmensnachrichten.Berlin: dissertation.de.
Mittermayer, M.-A. & Knolmayer, G. (2006a). NewsCATS: A news categorizationand trading system. In Sixth International Conference on Data Mining (pp.1002–1007). Washington, D.C.: IEEE Computer Society.
Mittermayer, M.-A. & Knolmayer, G. (2006b). Text mining systems for mar-ket response to news: A survey. Working Paper. Universitat Bern, Institut furWirtschaftsinformatik, Bern.
Morningstar (2011). The Morningstar category classifications (for port-folios available for sale in the United States). Morningstar method-ology paper. http://corporate.morningstar.com/fr/documents/MethodologyDocuments/MethodologyPapers/MorningstarCategory_Classifications.pdf. Accessed on12/07/25.
Moschitti, R. & Basili, R. (2004). Complex linguistic features for text classifica-tion: A comprehensive study. In Proceedings of the 26th European Conferenceon Information Retrieval (pp. 181–196). Berlin, Heidelberg: Springer.
Mucklow, B. (1991). Logarithmic versus proportional returns: A note. WorkingPaper. University of Wisconsin.
Mucklow, B. (1994). Market microstructure: An examination of the effects onintraday event studies. Contemporary Accounting Research, 10(2), 355–382.
Munz, M. (2011). The Handbook of News Analytics in Finance, chapter Measuringthe value of media sentiment: A pragmatic view, (pp. 109–128). John Wiley &Sons: Hoboken, New Jersey.
Nadeau, D. & Sekine, S. (2007). A survey of named entity recognition and classi-fication. Lingvisticae Investigationes, 30(1), 3–26.
Nadeau, D., Turney, P., & Matwin, S. (2006). Unsupervised named-entity recog-nition: Generating gazetteers and resolving ambiguity. In L. Lamontagne & M.

CHAPTER 7. BIBLIOGRAPHY 108
Marchand (Eds.), Advances in Artificial Intelligence, volume 4013 of LectureNotes in Computer Science (pp. 266–277). Berlin, Heidelberg: Springer.
NASDAQ (2012). Nasdaq trading schedule. http://www.nasdaq.com/about/trading-schedule.aspx. Accessed on 12/07/31.
Navarro, G. & Ziviani, N. (2011). Modern Information Retrieval, chapter Docu-ments: Languages & properties, (pp. 203–254). Pearson Education: Boston.
NYSE (2012). New York stock exchange trading hours and holidays. http://www.nyx.com//en/holidays-and-hours/nyse. Accessed on12/07/31.
Odean, T. (1999). Do investors trade too much? The American Economic Review,89(5), 1279–1298.
Pang, B., Lee, L., & Vaithyanathan, S. (2002). Thumbs up? Sentiment classifi-cation using machine learning techniques. In Proceedings of the ACL-02 Con-ference on Empirical Methods in Natural Language Processing, volume 10 (pp.79–86). Stroudsburg: Association for Computational Linguistics.
Pavlidis, T. & Horowitz, S. (1974). Segmentation of plane curves. IEEE Transac-tions on Computers, C-23(8), 860–870.
Peramunetilleke, D. & Wong, R. K. (2002). Currency exchange rate forecastingfrom news headlines. In Proceedings of the Thirteenth Australasian DatabaseConference, volume 5 (pp. 131–139). Darlinghurst: Australian Computer Soci-ety.
Phung, Y.-C. (2005). Text mining for stock movement predictions: A Malaysianperspective. In A. Zanasi, C. Brebbia, & N. Ebecken (Eds.), Data MiningVI. Data Mining, Text Mining And Their Business Applications (pp. 103–112).Southampton: WIT Press.
Porter, M. F. (1980). An algorithm for suffix stripping. Program: ElectronicLibrary and Information Systems, 14(3), 130–137.
Quinlan, J. R. (1986). Induction of decision trees. Machine Learning, 1(1), 81–106.
Quinlan, J. R. (1993). C4.5: Programs for Machine Learning. San Francisco:Morgan Kaufmann Publishers.
CHAPTER 7. BIBLIOGRAPHY 109
Ramentol, E., Verbiest, N., Bello, R., Caballero, Y., Cornelis, C., & Herrera, F.(2012). SMOTE-FRST – a new resampling method using fuzzy rough set the-ory. In C. Kahraman, F. T. Bozbura, & E. E. Kerre (Eds.), Uncertainty Modelingin Knowledge Engineering and Decision Making. Proceedings of the Tenth In-ternational Flins Conference Istanbul: World Scientific.
Renehan, E. J. (2004). Robber baron. American Heritage, 55(5). http://www.americanheritage.com/content/robber-baron-0. Accessed on12/10/20.
Robertson, C., Geva, S., & Wolff, R. C. (2006). What types of events providethe strongest evidence that the stock market is affected by company specificnews? In Proceedings of the Fifth Australasian Conference on Data Miningand Analystics, volume 61 (pp. 145–153). Darlinghurst: Australian ComputerSociety.
Robertson, C., Geva, S., & Wolff, R. C. (2007a). Can the content of public newsbe used to forecast abnormal stock market behaviour? In Proceedings of theSeventh IEEE International Conference on Data Mining (pp. 637–642). Wash-ington, D.C.: IEEE Computer Society.
Robertson, C., Geva, S., & Wolff, R. C. (2007b). The intraday effect of publicinformation: Empirical evidence of market reaction to asset specific news fromthe US, UK, and Australia. SSRN Working Paper Series. http://ssrn.com/abstract=970884. Accessed on 12/07/22.
Robertson, C., Geva, S., & Wolff, R. C. (2007c). News aware volatility forecasting:is the content of news important? In Proceedings of the Sixth Australasian Con-ference on Data Mining and Analytics, volume 70 (pp. 161–170). Darlinghurst:Australian Computer Society.
Robertson, C. S. (2008). Real time financial information analysis. PhD thesis,Queensland University of Technology.
Rose, C., Wang, Y.-C., Cui, Y., Arguello, J., Stegmann, K., Weinberger, A., &Fischer, F. (2008). Analyzing collaborative learning processes automatically:Exploiting the advances of computational linguistics in computer-supported col-laborative learning. International Journal of Computer-Supported CollaborativeLearning, 3, 237–271.
Russell, S. J. & Norvig, P. (2010). Artificial Intelligence: A Modern Approach,chapter Learning from examples, (pp. 693–767). Prentice-Hall series in artificialintelligence. Prentice-Hall: Upper Saddle River, New Jersey, 3. edition.

CHAPTER 7. BIBLIOGRAPHY 110
Ryan, P. & Taffler, R. J. (2004). Are economically significant stock returns andtrading volumes driven by firm-specific news releases? Journal of BusinessFinance & Accounting, 31(1-2), 49–82.
Salton, G. & Buckley, C. (1988). Term-weighting approaches in automatic textretrieval. Information Processing and Management, 24(5), 513–523.
Salton, G. & McGill, M. J. (1986). Introduction to Modern Information Retrieval.New York: McGraw-Hill.
Schulz, A., Spiliopoulou, M., & Winkler, K. (2003). Kursrelevanzprognose vonAd-hoc-Meldungen: Text Mining wider die Informationsuberlastung im MobileBanking. In Wirtschaftinformatik Proceedings 2003. Paper 63.
Schumaker, R. & Chen, H. (2006). Textual analysis of stock market predictionusing financial news articles. In Proceedings of Twelfth Americas Conferenceon Information Systems: AIS Electronic Library.
Schumaker, R. & Chen, H. (2010). A discrete stock price prediction engine basedon financial news. Computer, 43(1), 51–56.
Schumaker, R., Zhang, Y., & Huang, C. (2012a). Evaluating sentiment in finan-cial news articles. Communications of International Information ManagementAssociation, 53, 458–464.
Schumaker, R. P. & Chen, H. (2008). Evaluating a news-aware quantitative trader:The effect of momentum and contrarian stock selection strategies. Journal ofthe American Society for Information Science and Technology, 59(2), 247–255.
Schumaker, R. P. & Chen, H. (2009). Textual analysis of stock market predictionusing breaking financial news: The AZFin text system. ACM Transactions onInformation Systems, 27(2), 1–19.
Schumaker, R. P., Zhang, Y., Huang, C.-N., & Chen, H. (2012b). Evaluating senti-ment in financial news articles. Decision Support Systems, 53(3), 458–464.
Sebastiani, F. (2002). Machine learning in automated text categorization. ACMComputing Surveys, 34(1), 1–47.
SEC (2000). Final rule: Selective disclosure and insider trading. http://www.sec.gov/rules/final/33-7881.htm. Accessed on 12/06/14.
SEC (2007). ”SEC Fee” — Section 31 Transaction Fees. http://www.sec.gov/answers/sec31.htm. Accessed on 12/08/17.
CHAPTER 7. BIBLIOGRAPHY 111
SEC (2008). Commission guidance on the use of company web sites. http://www.sec.gov/rules/interp/2008/34-58288.pdf. Accessed on12/06/14.
SEC (2009). Self-regulatory organizations; notice of filing and immediate effec-tiveness of proposed rule change by New York stock exchange LLC amendingthe exchange’s timely alert policy. http://www.sec.gov/rules/sro/nyse/2009/34-59823.pdf. Accessed on 12/06/11.
Sekine, S. & Nobata, C. (2003). Definition, dictionaries and tagger for extendednamed entity hierarchy. In Proceedings of the International Conference on Lan-guage Resources and Evaluation.
Sharpe, W. F. (1963). A simplified model for portfolio analysis. ManagementScience, 9(2), 277–293.
Sharpe, W. F. (1964). Capital asset prices: A theory of market equilibrium underconditions of risk. The Journal of Finance, 19(3), 425–442.
Snell, A. & Tonks, I. (2003). A theoretical analysis of institutional investors’ trad-ing costs in auction and dealer markets. The Economic Journal, 113(489), 576–597.
Spiliopoulou, M., Schulz, A., & Winkler, K. (2003). Text Mining an der Borse:Einfluss von Ad-hoc-Mitteilungen auf die Kursentwicklung. In C. Becker & H.Redlich (Eds.), Data Mining und Statistik in Hochschule und Wirtschaft. Pro-ceedings der 7. Konferenz der SAS-Anwender in Forschung und Entwicklung(KSFE) (pp. 215–228). Aachen: Shaker.
Stefanowski, J. & Wilk, S. (2008). Selective pre-processing of imbalanced datafor improving classification performance. In Proceedings of the Tenth Interna-tional Conference on Data Warehousing and Knowledge Discovery (pp. 283–292). Berlin, Heidelberg: Springer.
Taboada, M., Brooke, J., Tofiloski, M., Voll, K., & Stede, M. (2011). Lexicon-based methods for sentiment analysis. Computational Linguistics, 37(2), 267–307.
Tay, F. E. H. & Cao, L. (2001). Application of support vector machines in financialtime series forecasting. Omega, 29(4), 309–317.
Terada, A. & Tokunaga, T. (2003). Corpus based method of transforming nomi-nalized phrases into clauses for text mining application. IEICE Transactions onInformation and Systems, 86(9), 1736–1744.

CHAPTER 7. BIBLIOGRAPHY 112
Tetlock, P. C. (2007). Giving content to investor sentiment: The role of media inthe stock market. The Journal of Finance, 62(3), 1139–1168.
Tetlock, P. C., Saar-Tsechansky, M., & Macskassy, S. (2008). More than words:Quantifying language to measure firms’ fundamentals. The Journal of Finance,63(3), 1437–1467.
Thomas, J. & Sycara, K. (2000). Integrating genetic algorithms and text learningfor financial prediction. In A. Wu (Ed.), Proceedings of the GECCO-2000 Work-shop on Data Mining with Evolutionary Algorithms (pp. 72–75). Las Vegas.
Thomas, J. D. (2003). News and Trading Rules. PhD thesis, Carnegie MellonUniversity, Pittsburgh.
Thomas, J. D. & Sycara, K. (1999). The importance of simplicity and validationin genetic programming for data mining in financial data. In Proceedings ofthe joint GECCO-99 and AAAI-99 Workshop on Data Mining with EvolutionaryAlgorithms: Research Directions.
Tong, R. (2001). An operational system for detecting and tracking opinions in on-line discussions. In Working Notes of the SIGIR Workshop on Operational TextClassification (pp. 1–6). New York. ACM.
Turney, P. D. (2002). Thumbs up or thumbs down? Semantic orientation applied tounsupervised classification of reviews. In Proceedings of the 40th Annual Meet-ing on Association for Computational Linguistics (pp. 417–424). Stroudsburg:Association for Computational Linguistics.
UBM (2011). Annual reports & accounts 2011. http://asp-gb.secure-zone.net/v2/indexPop.jsp?id=1134/2178/4760&lng=en. Accessed on 12/07/02.
van Rijsbergen, C. J. (1979). Information Retrieval. Newton, MA: Butterworth-Heinemann, 2. edition.
Vapnik, V. N. (1995). The Nature of Statistical Learning Theory, chapter Con-structing learning algorithms, (pp. 119–166). Springer: New York.
Wang, F., Liu, L., & Dou, C. (2012). Stock market volatility prediction: A service-oriented multi-kernel learning approach. In Proceedings of the Ninth IEEE In-ternational Conference on Services Computing (pp. 49–56). Washington, D.C.:IEEE Computer Society.
CHAPTER 7. BIBLIOGRAPHY 113
Wang, S. & Manning, C. (2012). Baselines and bigrams: Simple, good sentimentand topic classification. In Proceedings of the 50th Annual Meeting of the As-sociation for Computational Linguistics (Volume 2: Short Papers) (pp. 90–94).Jeju Island: Association for Computational Linguistics.
Weiss, G. M., McCarthy, K., & Zabar, B. (2007). Cost-sensitive learning vs. sam-pling: Which is best for handling unbalanced classes with unequal error costs?In R. Stahlbock, S. F. Crone, & S. Lessmann (Eds.), Proceedings of the 2007 In-ternational Conference on Data Mining (pp. 35–41). Las Vegas: CSREA Press.
Weiss, G. M. & Provost, F. J. (2003). Learning when training data are costly: Theeffect of class distribution on tree induction. Journal of Artificial IntelligenceResearch, 19, 315–354.
Weiss, S. M., Indurkhya, N., Zhang, T., & Damerau, F. J. (2005). Text Mining. Pre-dictive Methods for Analyzing Unstructured Information, chapter From textualinformation to numerical vectors, (pp. 15–46). Springer: New York.
Weissmann, D. (2004). Stemming - Methoden und Ergebnisse. Working Paper.Universitat Heidelberg, Institut fur Computerlinguistik.
Wilbur, J. & Sirotkin, K. (1992). The automatic identification of stop words. Jour-nal of Information Science, 18, 45–55.
Witten, I. H., Don, K. J., Dewsnip, M., & Tablan, V. (2004). Text mining in adigital library. International Journal on Digital Libraries, 4, 56–59.
Witten, I. H., Frank, E., & Hall, M. A. (2011). Data Mining: Practical MachineLearning Tools and Techniques. The Morgan Kaufmann Series in Data Manage-ment Systems. San Francisco: Morgan Kaufmann Publishers, 3. edition.
Witten, I. H., Moffat, A., & Bell, T. C. (1999a). Managing Gigabytes: Compress-ing and Indexing Documents and Images. San Francisco: Morgan KaufmannPublishers.
Witten, I. H., Paynter, G. W., Frank, E., Gutwin, C., & Nevill-Manning, C. G.(1999b). KEA: Practical automatic keyphrase extraction. In Proceedings of theFourth ACM Conference on Digital Libraries (pp. 254–255). New York: ACM.
Wuthrich, B., Permunetilleke, D., Leung, S., Cho, V., Zhang, J., & Lam, W. (1998).Daily prediction of major stock indices from textual www data. In Proceedingsof the Fourth ACM SIGKDD International Conference on Knowledge Discoveryand Data Mining New York: ACM.
CHAPTER 7. BIBLIOGRAPHY 114
Xu, J. & Croft, W. B. (1998). Corpus-based stemming using co-occurrence of wordvariants. ACM Transactions on Information Systems, 16, 61–81.
Yang, Y. (1994). Expert network: Effective and efficient learning from humandecisions in text categorization and retrieval. In Proceedings of the SeventeenthAnnual International ACM SIGIR Conference on Research and Development inInformation Retrieval (pp. 13–22). New York: Springer.
Yang, Y. (1999). An evaluation of statistical approaches to text categorization.Information Retrieval, 1, 69–90.
Yang, Y. & Liu, X. (1999). A re-examination of text categorization methods. InProceedings of the 22nd Annual International ACM SIGIR Conference on Re-search and Development in Information Retrieval (pp. 42–49). New York: ACM.
Yang, Y. & Pedersen, J. O. (1997). A comparative study on feature selection intext categorization. In D. H. Fisher (Ed.), Proceedings of ICML-97, 14th Inter-national Conference on Machine Learning (pp. 412–420). Nashville: MorganKaufmann Publishers.
Yang, Y. & Wilbur, J. (1996). Using corpus statistics to remove redundant wordsin text categorization. Journal of the American Society for Information Science,47(5), 357–369.
Zak, I. & Ciura, M. (2005). Automatic text categorization. In 33rd InternationalConference on Information Systems Architecture and Technology.
Zanni, L., Serafini, T., & Zanghirati, G. (2006). Parallel software for training largescale support vector machines on multiprocessor systems. Journal of MachineLearning Research, 7, 1467–1492.

Appendix A
Data preparation
A.A S&P 500 companies used as data source
Table A.1: All S&P 500 companies and their Bloomberg tickers
Ticker Company name Ticker Company nameA UN Agilent Technologies Inc JNPR UN Juniper Networks IncAA UN Alcoa Inc JOY UN Joy Global IncAAPL UW Apple Inc JPM UN JPMorgan Chase & CoABC UN AmerisourceBergen Corp JWN UN Nordstrom IncABT UN Abbott Laboratories K UN Kellogg CoACE UN ACE Ltd KEY UN KeyCorpACN UN Accenture PLC KFT UN Kraft Foods IncADBE UW Adobe Systems Inc KIM UN Kimco Realty CorpADI UW Analog Devices Inc KLAC UW KLA-Tencor CorpADM UN Archer-Daniels-Midland Co KMB UN Kimberly-Clark CorpADP UW Automatic Data Processing Inc KMX UN CarMax IncADSK UW Autodesk Inc KO UN Coca-Cola Co/TheAEE UN Ameren Corp KR UN Kroger Co/TheAEP UN American Electric Power Co Inc KSS UN Kohl’s CorpAES UN AES Corp/The L UN Loews CorpAET UN Aetna Inc LEG UN Leggett & Platt IncAFL UN Aflac Inc LEN UN Lennar CorpAGN UN Allergan Inc LH UN LABORATORY CORP OF AMERICA
HOLDINGSAIG UN American International Group Inc LIFE UW Life Technologies CorpAIV UN Apartment Investment & Management Co LLL UN L-3 COMMUNICATIONS HOLDINGS INCAIZ UN Assurant Inc LLTC UW Linear Technology CorpAKAM UW Akamai Technologies Inc LLY UN Eli Lilly & CoALL UN Allstate Corp/The LM UN Legg Mason IncALTR UW Altera Corp LMT UN Lockheed Martin CorpAMAT UW Applied Materials Inc LNC UN Lincoln National CorpAMD UN Advanced Micro Devices Inc LO UN Lorillard IncAMGN UW Amgen Inc LOW UN Lowe’s Cos IncAMP UN Ameriprise Financial Inc LSI UN LSI CorpAMT UN American Tower Corp LTD UN Ltd Brands IncAMZN UW Amazon.com Inc LUK UN Leucadia National CorpAN UN AutoNation Inc LUV UN Southwest Airlines CoANF UN Abercrombie & Fitch Co LXK UN Lexmark International IncANR UN Alpha Natural Resources Inc M UN Macy’s IncAON UN Aon PLC MA UN Mastercard IncAPA UN Apache Corp MAR UN MARRIOTT INTERNATIONAL INCAPC UN Anadarko Petroleum Corp MAS UN Masco CorpAPD UN Air Products & Chemicals Inc MAT UW Mattel IncAPH UN Amphenol Corp MCD UN McDonald’s CorpAPOL UW Apollo Group Inc MCHP UW Microchip Technology IncARG UN Airgas Inc MCK UN McKesson CorpATI UN Allegheny Technologies Inc MCO UN Moody’s Corp
115
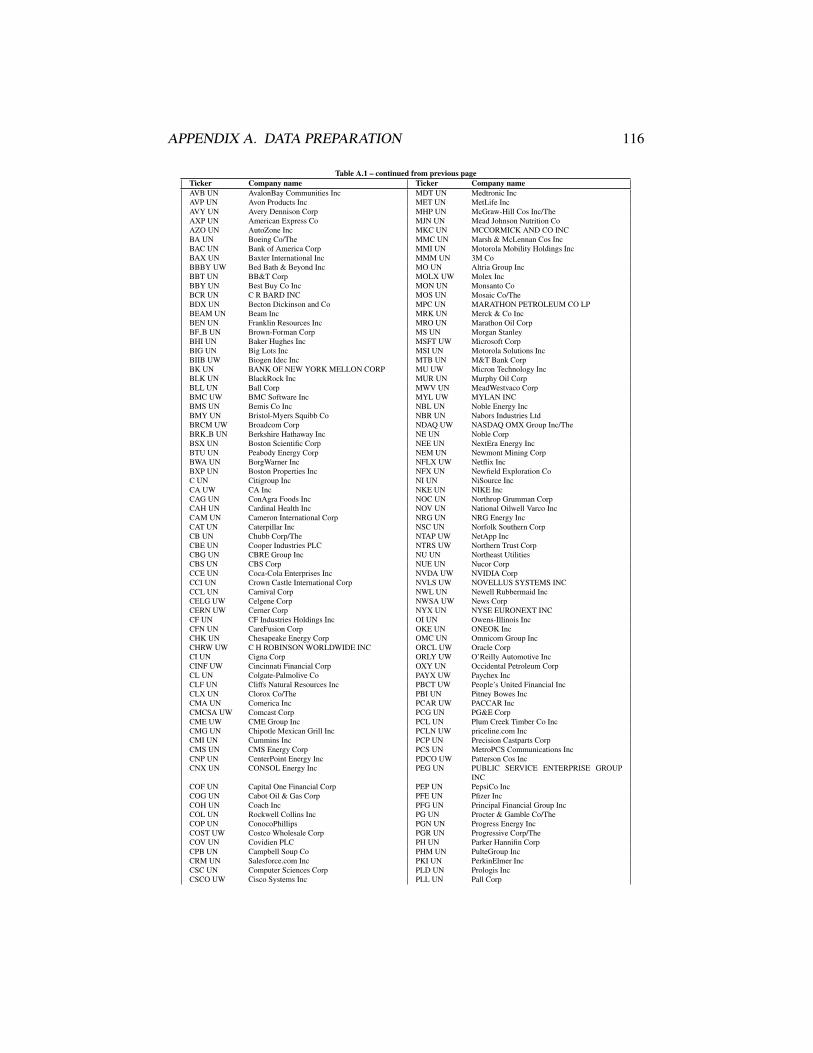
APPENDIX A. DATA PREPARATION 116
Table A.1 – continued from previous pageTicker Company name Ticker Company nameAVB UN AvalonBay Communities Inc MDT UN Medtronic IncAVP UN Avon Products Inc MET UN MetLife IncAVY UN Avery Dennison Corp MHP UN McGraw-Hill Cos Inc/TheAXP UN American Express Co MJN UN Mead Johnson Nutrition CoAZO UN AutoZone Inc MKC UN MCCORMICK AND CO INCBA UN Boeing Co/The MMC UN Marsh & McLennan Cos IncBAC UN Bank of America Corp MMI UN Motorola Mobility Holdings IncBAX UN Baxter International Inc MMM UN 3M CoBBBY UW Bed Bath & Beyond Inc MO UN Altria Group IncBBT UN BB&T Corp MOLX UW Molex IncBBY UN Best Buy Co Inc MON UN Monsanto CoBCR UN C R BARD INC MOS UN Mosaic Co/TheBDX UN Becton Dickinson and Co MPC UN MARATHON PETROLEUM CO LPBEAM UN Beam Inc MRK UN Merck & Co IncBEN UN Franklin Resources Inc MRO UN Marathon Oil CorpBF B UN Brown-Forman Corp MS UN Morgan StanleyBHI UN Baker Hughes Inc MSFT UW Microsoft CorpBIG UN Big Lots Inc MSI UN Motorola Solutions IncBIIB UW Biogen Idec Inc MTB UN M&T Bank CorpBK UN BANK OF NEW YORK MELLON CORP MU UW Micron Technology IncBLK UN BlackRock Inc MUR UN Murphy Oil CorpBLL UN Ball Corp MWV UN MeadWestvaco CorpBMC UW BMC Software Inc MYL UW MYLAN INCBMS UN Bemis Co Inc NBL UN Noble Energy IncBMY UN Bristol-Myers Squibb Co NBR UN Nabors Industries LtdBRCM UW Broadcom Corp NDAQ UW NASDAQ OMX Group Inc/TheBRK B UN Berkshire Hathaway Inc NE UN Noble CorpBSX UN Boston Scientific Corp NEE UN NextEra Energy IncBTU UN Peabody Energy Corp NEM UN Newmont Mining CorpBWA UN BorgWarner Inc NFLX UW Netflix IncBXP UN Boston Properties Inc NFX UN Newfield Exploration CoC UN Citigroup Inc NI UN NiSource IncCA UW CA Inc NKE UN NIKE IncCAG UN ConAgra Foods Inc NOC UN Northrop Grumman CorpCAH UN Cardinal Health Inc NOV UN National Oilwell Varco IncCAM UN Cameron International Corp NRG UN NRG Energy IncCAT UN Caterpillar Inc NSC UN Norfolk Southern CorpCB UN Chubb Corp/The NTAP UW NetApp IncCBE UN Cooper Industries PLC NTRS UW Northern Trust CorpCBG UN CBRE Group Inc NU UN Northeast UtilitiesCBS UN CBS Corp NUE UN Nucor CorpCCE UN Coca-Cola Enterprises Inc NVDA UW NVIDIA CorpCCI UN Crown Castle International Corp NVLS UW NOVELLUS SYSTEMS INCCCL UN Carnival Corp NWL UN Newell Rubbermaid IncCELG UW Celgene Corp NWSA UW News CorpCERN UW Cerner Corp NYX UN NYSE EURONEXT INCCF UN CF Industries Holdings Inc OI UN Owens-Illinois IncCFN UN CareFusion Corp OKE UN ONEOK IncCHK UN Chesapeake Energy Corp OMC UN Omnicom Group IncCHRW UW C H ROBINSON WORLDWIDE INC ORCL UW Oracle CorpCI UN Cigna Corp ORLY UW O’Reilly Automotive IncCINF UW Cincinnati Financial Corp OXY UN Occidental Petroleum CorpCL UN Colgate-Palmolive Co PAYX UW Paychex IncCLF UN Cliffs Natural Resources Inc PBCT UW People’s United Financial IncCLX UN Clorox Co/The PBI UN Pitney Bowes IncCMA UN Comerica Inc PCAR UW PACCAR IncCMCSA UW Comcast Corp PCG UN PG&E CorpCME UW CME Group Inc PCL UN Plum Creek Timber Co IncCMG UN Chipotle Mexican Grill Inc PCLN UW priceline.com IncCMI UN Cummins Inc PCP UN Precision Castparts CorpCMS UN CMS Energy Corp PCS UN MetroPCS Communications IncCNP UN CenterPoint Energy Inc PDCO UW Patterson Cos IncCNX UN CONSOL Energy Inc PEG UN PUBLIC SERVICE ENTERPRISE GROUP
INCCOF UN Capital One Financial Corp PEP UN PepsiCo IncCOG UN Cabot Oil & Gas Corp PFE UN Pfizer IncCOH UN Coach Inc PFG UN Principal Financial Group IncCOL UN Rockwell Collins Inc PG UN Procter & Gamble Co/TheCOP UN ConocoPhillips PGN UN Progress Energy IncCOST UW Costco Wholesale Corp PGR UN Progressive Corp/TheCOV UN Covidien PLC PH UN Parker Hannifin CorpCPB UN Campbell Soup Co PHM UN PulteGroup IncCRM UN Salesforce.com Inc PKI UN PerkinElmer IncCSC UN Computer Sciences Corp PLD UN Prologis IncCSCO UW Cisco Systems Inc PLL UN Pall Corp
APPENDIX A. DATA PREPARATION 117
Table A.1 – continued from previous pageTicker Company name Ticker Company nameCSX UN CSX Corp PM UN PHILIP MORRIS INTERNATIONAL INCCTAS UW Cintas Corp PNC UN PNC FINANCIAL SERVICES GROUP INCCTL UN CenturyLink Inc PNW UN Pinnacle West Capital CorpCTSH UW COGNIZANT TECHNOLOGY SOLUTIONS
CORPPOM UN Pepco Holdings Inc
CTXS UW Citrix Systems Inc PPG UN PPG Industries IncCVC UN Cablevision Systems Corp PPL UN PPL CorpCVH UN Coventry Health Care Inc PRGO UW Perrigo CoCVS UN CVS Caremark Corp PRU UN Prudential Financial IncCVX UN Chevron Corp PSA UN Public StorageD UN DOMINION RESOURCES INC PWR UN Quanta Services IncDD UN E I DU PONT DE NEMOURS & CO PX UN Praxair IncDE UN Deere & Co PXD UN Pioneer Natural Resources CoDELL UW Dell Inc QCOM UW QUALCOMM IncDF UN Dean Foods Co QEP UN QEP Resources IncDFS UN DISCOVER FINANCIAL SERVICES LLC R UN Ryder System IncDGX UN Quest Diagnostics Inc RAI UN Reynolds American IncDHI UN D R HORTON INC RDC UN Rowan Cos IncDHR UN Danaher Corp RF UN Regions Financial CorpDIS UN Walt Disney Co/The RHI UN Robert Half International IncDISCA UW Discovery Communications Inc RHT UN Red Hat IncDLTR UW Dollar Tree Inc RL UN Ralph Lauren CorpDNB UN Dun & Bradstreet Corp/The ROK UN Rockwell Automation IncDNR UN Denbury Resources Inc ROP UN Roper Industries IncDO UN Diamond Offshore Drilling Inc ROST UW Ross Stores IncDOV UN Dover Corp RRC UN Range Resources CorpDOW UN Dow Chemical Co/The RRD UW R R DONNELLEY & SONS CODPS UN Dr Pepper Snapple Group Inc RSG UN Republic Services IncDRI UN Darden Restaurants Inc RTN UN Raytheon CoDTE UN DTE Energy Co S UN Sprint Nextel CorpDTV UW DIRECTV SAI UN SAIC IncDUK UN Duke Energy Corp SBUX UW Starbucks CorpDV UN DeVry Inc SCG UN SCANA CorpDVA UN DaVita Inc SCHW UN Charles Schwab Corp/TheDVN UN Devon Energy Corp SE UN Spectra Energy CorpEA UW Electronic Arts Inc SEE UN Sealed Air CorpEBAY UW eBay Inc SHLD UW Sears Holdings CorpECL UN Ecolab Inc SHW UN Sherwin-Williams Co/TheED UN Consolidated Edison Inc SIAL UW Sigma-Aldrich CorpEFX UN Equifax Inc SJM UN J M SMUCKER COEIX UN Edison International SLB UN Schlumberger LtdEL UN Estee Lauder Cos Inc/The SLE UN Sara Lee CorpEMC UN EMC Corp SLM UW SLM CorpEMN UN Eastman Chemical Co SNA UN Snap-on IncEMR UN Emerson Electric Co SNDK UW SanDisk CorpEOG UN EOG Resources Inc SNI UN SCRIPPS NETWORKS INTERACTIVE INCEP UN El Paso Corp SO UN Southern Co/TheEQR UN Equity Residential SPG UN Simon Property Group IncEQT UN EQT Corp SPLS UW Staples IncESRX UW Express Scripts Holding Co SRCL UW Stericycle IncETFC UW E TRADE FINANCIAL CORP SRE UN Sempra EnergyETN UN Eaton Corp STI UN SunTrust Banks IncETR UN Entergy Corp STJ UN St Jude Medical IncEW UN Edwards Lifesciences Corp STT UN State Street CorpEXC UN Exelon Corp STZ UN Constellation Brands IncEXPD UW EXPEDITORS INTERNATIONAL OF
WASHINGTON INCSUN UN Sunoco Inc
EXPE UW Expedia Inc SVU UN SUPERVALU IncF UN Ford Motor Co SWK UN Stanley Black & Decker IncFAST UW Fastenal Co SWN UN Southwestern Energy CoFCX UN FREEPORT-MCMORAN COPPER AND
GOLD INCSWY UN Safeway Inc
FDO UN Family Dollar Stores Inc SYK UN Stryker CorpFDX UN FedEx Corp SYMC UW Symantec CorpFE UN FirstEnergy Corp SYY UN Sysco CorpFFIV UW F5 Networks Inc T UN AT&T IncFHN UN First Horizon National Corp TAP UN Molson Coors Brewing CoFII UN Federated Investors Inc TDC UN Teradata CorpFIS UN FIDELITY NATIONAL INFORMATION
SERVICES INCTE UN TECO Energy Inc
FISV UW Fiserv Inc TEG UN INTEGRYS ENERGY GROUP INCFITB UW Fifth Third Bancorp TEL UN TE Connectivity LtdFLIR UW FLIR Systems Inc TER UN Teradyne IncFLR UN Fluor Corp TGT UN Target CorpFLS UN Flowserve Corp THC UN Tenet Healthcare Corp
APPENDIX A. DATA PREPARATION 118
Table A.1 – continued from previous pageTicker Company name Ticker Company nameFMC UN FMC Corp TIE UN Titanium Metals CorpFOSL UW Fossil Inc TIF UN TIFFANY AND COFRX UN Forest Laboratories Inc TJX UN TJX Cos IncFSLR UW First Solar Inc TMK UN Torchmark CorpFTI UN FMC Technologies Inc TMO UN Thermo Fisher Scientific IncFTR UW Frontier Communications Corp TRIP UW TripAdvisor IncGAS UN AGL Resources Inc TROW UW T Rowe Price Group IncGCI UN Gannett Co Inc TRV UN Travelers Cos Inc/TheGD UN General Dynamics Corp TSN UN Tyson Foods IncGE UN General Electric Co TSO UN Tesoro CorpGILD UW Gilead Sciences Inc TSS UN TOTAL SYSTEM SERVICES INCGIS UN General Mills Inc TWC UN Time Warner Cable IncGLW UN Corning Inc TWX UN Time Warner IncGME UN GameStop Corp TXN UW Texas Instruments IncGNW UN Genworth Financial Inc TXT UN Textron IncGOOG UW Google Inc TYC UN Tyco International LtdGPC UN Genuine Parts Co UNH UN UnitedHealth Group IncGPS UN Gap Inc/The UNM UN Unum GroupGR UN Goodrich Corp UNP UN Union Pacific CorpGS UN Goldman Sachs Group Inc/The UPS UN United Parcel Service IncGT UN Goodyear Tire & Rubber Co/The URBN UW Urban Outfitters IncGWW UN WW Grainger Inc USB UN US BancorpHAL UN Halliburton Co UTX UN United Technologies CorpHAR UN HARMAN INTERNATIONAL INDUSTRIES
INCV UN Visa Inc
HAS UW Hasbro Inc VAR UN Varian Medical Systems IncHBAN UW HUNTINGTON BANCSHARES INC VFC UN VF CorpHCBK UW Hudson City Bancorp Inc VIAB UW Viacom IncHCN UN Health Care REIT Inc VLO UN Valero Energy CorpHCP UN HCP Inc VMC UN Vulcan Materials CoHD UN Home Depot Inc/The VNO UN Vornado Realty TrustHES UN Hess Corp VRSN UW VeriSign IncHIG UN HARTFORD FINANCIAL SERVICES
GROUP INCVTR UN Ventas Inc
HNZ UN H J HEINZ CO VZ UN Verizon Communications IncHOG UN Harley-Davidson Inc WAG UN Walgreen CoHON UN Honeywell International Inc WAT UN Waters CorpHOT UN STARWOOD HOTELS & RESORTS
WORLDWIDE INCWDC UN Western Digital Corp
HP UN Helmerich & Payne Inc WEC UN Wisconsin Energy CorpHPQ UN Hewlett-Packard Co WFC UN Wells Fargo & CoHRB UN H&R Block Inc WFM UW Whole Foods Market IncHRL UN Hormel Foods Corp WHR UN Whirlpool CorpHRS UN Harris Corp WIN UW Windstream CorpHSP UN Hospira Inc WLP UN WellPoint IncHST UN Host Hotels & Resorts Inc WM UN Waste Management IncHSY UN Hershey Co/The WMB UN Williams Cos Inc/TheHUM UN Humana Inc WMT UN Wal-Mart Stores IncIBM UN INTERNATIONAL BUSINESS MACHINES
CORPWPI UN Watson Pharmaceuticals Inc
ICE UN IntercontinentalExchange Inc WPO UN Washington Post Co/TheIFF UN INTERNATIONAL FLAVORS & FRA-
GRANCES INCWPX UN WPX Energy Inc
IGT UN INTERNATIONAL GAME TECHNOLOGYINC
WU UN Western Union Co/The
INTC UW Intel Corp WY UN Weyerhaeuser CoINTU UW Intuit Inc WYN UN Wyndham Worldwide CorpIP UN International Paper Co WYNN UW Wynn Resorts LtdIPG UN INTERPUBLIC GROUP OF COS INC X UN United States Steel CorpIR UN Ingersoll-Rand PLC XEL UN Xcel Energy IncIRM UN Iron Mountain Inc XL UN XL Group PlcISRG UW Intuitive Surgical Inc XLNX UW Xilinx IncITW UN Illinois Tool Works Inc XOM UN Exxon Mobil CorpIVZ UN Invesco Ltd XRAY UW DENTSPLY International IncJBL UN Jabil Circuit Inc XRX UN Xerox CorpJCI UN Johnson Controls Inc XYL UN XYLEM INCJCP UN J C PENNEY CO INC YHOO UW Yahoo! IncJDSU UW JDS Uniphase Corp YUM UN Yum! Brands IncJEC UN Jacobs Engineering Group Inc ZION UW ZIONS BANCORPJNJ UN Johnson & Johnson ZMH UN Zimmer Holdings Inc
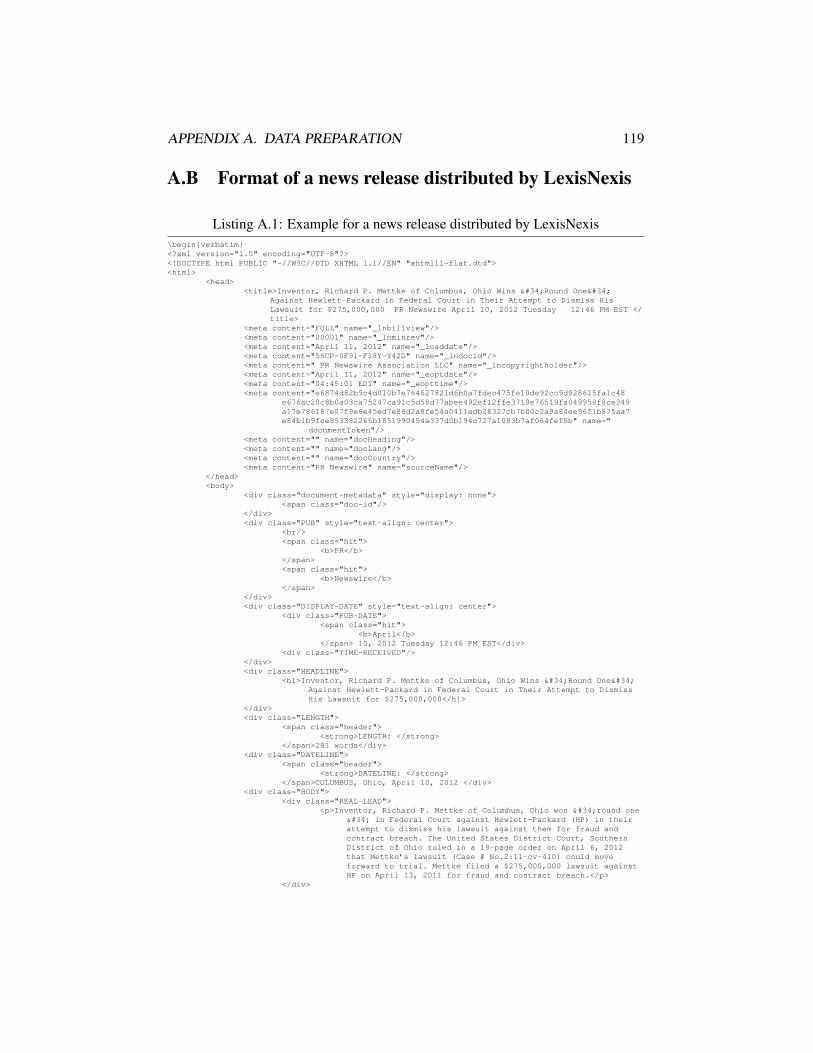
APPENDIX A. DATA PREPARATION 119
A.B Format of a news release distributed by LexisNexis
Listing A.1: Example for a news release distributed by LexisNexis\beginverbatim<?xml version="1.0" encoding="UTF-8"?><!DOCTYPE html PUBLIC "-//W3C//DTD XHTML 1.1//EN" "xhtml11-flat.dtd"><html>
<head><title>Inventor, Richard P. Mettke of Columbus, Ohio Wins "Round One"
Against Hewlett-Packard in Federal Court in Their Attempt to Dismiss HisLawsuit for $275,000,000 PR Newswire April 10, 2012 Tuesday 12:46 PM EST </title>
<meta content="FULL" name="_lnbillview"/><meta content="00001" name="_lnminrev"/><meta content="April 11, 2012" name="_loaddate"/><meta content="55CP-0F91-F18Y-Y42D" name="_lndocid"/><meta content=" PR Newswire Association LLC" name="_lncopyrightholder"/><meta content="April 11, 2012" name="_eoptdate"/><meta content="04:45:01 EDT" name="_eopttime"/><meta content="e6874d82b9c4d010b7e764627821d6b0a7fdec475fe10de92cc9d928615fa1c48
e676ac20c8b0a03ca75247ca91c5d58d77abee492ef12ffe3719e76519fa049959f8ce349a17e786187e07f9e6e45ed7e86d2a8fe54a0411adb28327cb7b00c2a9a84ee96f1b875aa7e84b1b9fce853382265b1851990454a337d0b194c727a1083b7af064fef5b" name="
documentToken"/><meta content="" name="docHeading"/><meta content="" name="docLang"/><meta content="" name="docCountry"/><meta content="PR Newswire" name="sourceName"/>
</head><body>
<div class="document-metadata" style="display: none"><span class="doc-id"/>
</div><div class="PUB" style="text-align: center">
<br/><span class="hit">
<b>PR</b></span><span class="hit">
<b>Newswire</b></span>
</div><div class="DISPLAY-DATE" style="text-align: center">
<div class="PUB-DATE"><span class="hit">
<b>April</b></span> 10, 2012 Tuesday 12:46 PM EST</div>
<div class="TIME-RECEIVED"/></div><div class="HEADLINE">
<h1>Inventor, Richard P. Mettke of Columbus, Ohio Wins "Round One"Against Hewlett-Packard in Federal Court in Their Attempt to DismissHis Lawsuit for $275,000,000</h1>
</div><div class="LENGTH">
<span class="header"><strong>LENGTH: </strong>
</span>281 words</div><div class="DATELINE">
<span class="header"><strong>DATELINE: </strong>
</span>COLUMBUS, Ohio, April 10, 2012 </div><div class="BODY">
<div class="REAL-LEAD"><p>Inventor, Richard P. Mettke of Columbus, Ohio won "round one
" in Federal Court against Hewlett-Packard (HP) in theirattempt to dismiss his lawsuit against them for fraud andcontract breach. The United States District Court, SouthernDistrict of Ohio ruled in a 19-page order on April 6, 2012that Mettke’s lawsuit (Case # No.2:11-cv-410) could moveforward to trial. Mettke filed a $275,000,000 lawsuit againstHP on April 13, 2011 for fraud and contract breach.</p>
</div>
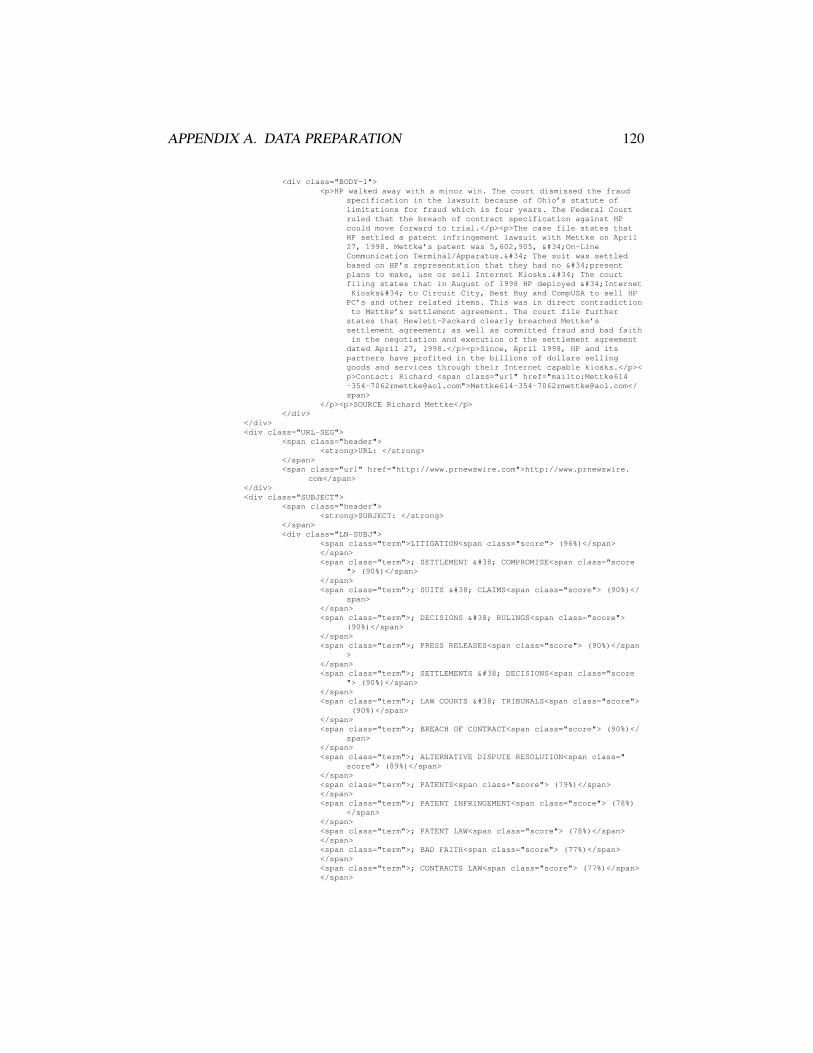
APPENDIX A. DATA PREPARATION 120
<div class="BODY-1"><p>HP walked away with a minor win. The court dismissed the fraud
specification in the lawsuit because of Ohio’s statute oflimitations for fraud which is four years. The Federal Courtruled that the breach of contract specification against HPcould move forward to trial.</p><p>The case file states thatHP settled a patent infringement lawsuit with Mettke on April27, 1998. Mettke’s patent was 5,602,905, "On-LineCommunication Terminal/Apparatus." The suit was settledbased on HP’s representation that they had no "presentplans to make, use or sell Internet Kiosks." The courtfiling states that in August of 1998 HP deployed "InternetKiosks" to Circuit City, Best Buy and CompUSA to sell HP
PC’s and other related items. This was in direct contradictionto Mettke’s settlement agreement. The court file further
states that Hewlett-Packard clearly breached Mettke’ssettlement agreement; as well as committed fraud and bad faithin the negotiation and execution of the settlement agreement
dated April 27, 1998.</p><p>Since, April 1998, HP and itspartners have profited in the billions of dollars sellinggoods and services through their Internet capable kiosks.</p><p>Contact: Richard <span class="url" href="mailto:[email protected]">[email protected]</span>
</p><p>SOURCE Richard Mettke</p></div>
</div><div class="URL-SEG">
<span class="header"><strong>URL: </strong>
</span><span class="url" href="http://www.prnewswire.com">http://www.prnewswire.
com</span></div><div class="SUBJECT">
<span class="header"><strong>SUBJECT: </strong>
</span><div class="LN-SUBJ">
<span class="term">LITIGATION<span class="score"> (96%)</span></span><span class="term">; SETTLEMENT & COMPROMISE<span class="score
"> (90%)</span></span><span class="term">; SUITS & CLAIMS<span class="score"> (90%)</
span></span><span class="term">; DECISIONS & RULINGS<span class="score">
(90%)</span></span><span class="term">; PRESS RELEASES<span class="score"> (90%)</span
></span><span class="term">; SETTLEMENTS & DECISIONS<span class="score
"> (90%)</span></span><span class="term">; LAW COURTS & TRIBUNALS<span class="score">
(90%)</span></span><span class="term">; BREACH OF CONTRACT<span class="score"> (90%)</
span></span><span class="term">; ALTERNATIVE DISPUTE RESOLUTION<span class="
score"> (89%)</span></span><span class="term">; PATENTS<span class="score"> (79%)</span></span><span class="term">; PATENT INFRINGEMENT<span class="score"> (78%)
</span></span><span class="term">; PATENT LAW<span class="score"> (78%)</span></span><span class="term">; BAD FAITH<span class="score"> (77%)</span></span><span class="term">; CONTRACTS LAW<span class="score"> (77%)</span></span>
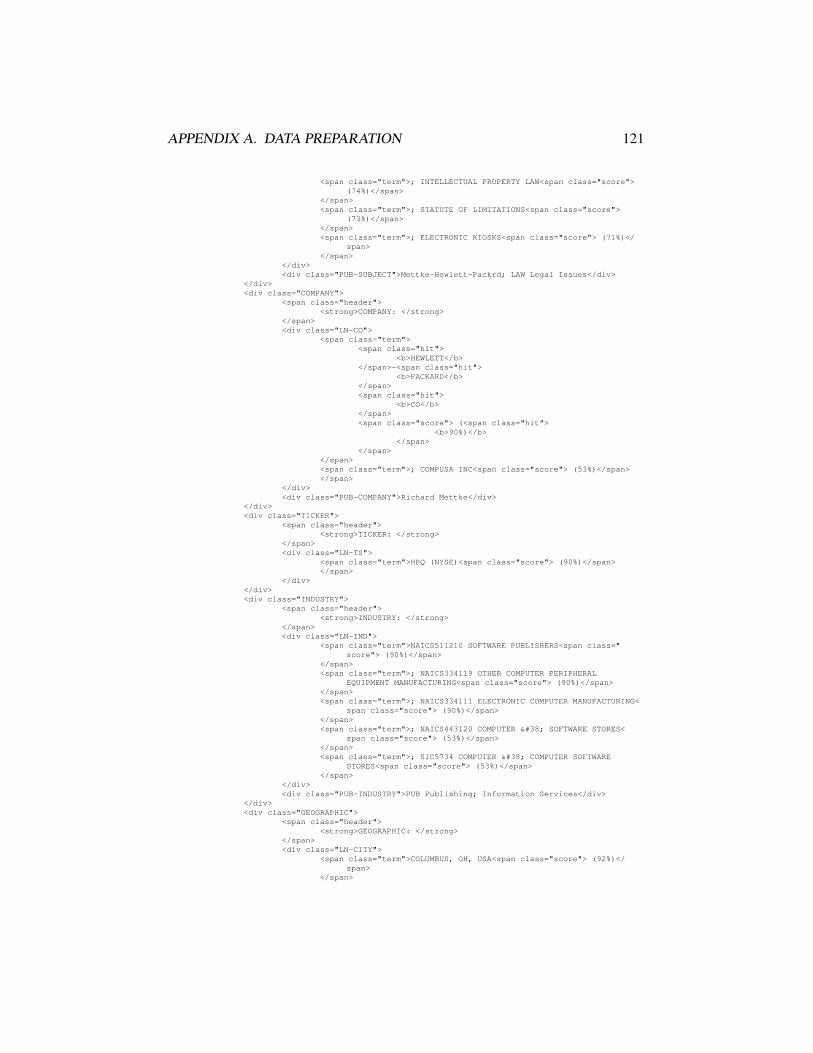
APPENDIX A. DATA PREPARATION 121
<span class="term">; INTELLECTUAL PROPERTY LAW<span class="score">(74%)</span>
</span><span class="term">; STATUTE OF LIMITATIONS<span class="score">
(73%)</span></span><span class="term">; ELECTRONIC KIOSKS<span class="score"> (71%)</
span></span>
</div><div class="PUB-SUBJECT">Mettke-Hewlett-Packrd; LAW Legal Issues</div>
</div><div class="COMPANY">
<span class="header"><strong>COMPANY: </strong>
</span><div class="LN-CO">
<span class="term"><span class="hit">
<b>HEWLETT</b></span>-<span class="hit">
<b>PACKARD</b></span><span class="hit">
<b>CO</b></span><span class="score"> (<span class="hit">
<b>90%)</b></span>
</span></span><span class="term">; COMPUSA INC<span class="score"> (53%)</span></span>
</div><div class="PUB-COMPANY">Richard Mettke</div>
</div><div class="TICKER">
<span class="header"><strong>TICKER: </strong>
</span><div class="LN-TS">
<span class="term">HPQ (NYSE)<span class="score"> (90%)</span></span>
</div></div><div class="INDUSTRY">
<span class="header"><strong>INDUSTRY: </strong>
</span><div class="LN-IND">
<span class="term">NAICS511210 SOFTWARE PUBLISHERS<span class="score"> (90%)</span>
</span><span class="term">; NAICS334119 OTHER COMPUTER PERIPHERAL
EQUIPMENT MANUFACTURING<span class="score"> (90%)</span></span><span class="term">; NAICS334111 ELECTRONIC COMPUTER MANUFACTURING<
span class="score"> (90%)</span></span><span class="term">; NAICS443120 COMPUTER & SOFTWARE STORES<
span class="score"> (53%)</span></span><span class="term">; SIC5734 COMPUTER & COMPUTER SOFTWARE
STORES<span class="score"> (53%)</span></span>
</div><div class="PUB-INDUSTRY">PUB Publishing; Information Services</div>
</div><div class="GEOGRAPHIC">
<span class="header"><strong>GEOGRAPHIC: </strong>
</span><div class="LN-CITY">
<span class="term">COLUMBUS, OH, USA<span class="score"> (92%)</span>
</span>

APPENDIX A. DATA PREPARATION 122
</div><div class="LN-ST">
<span class="term">OHIO, USA<span class="score"> (96%)</span></span>
</div><div class="LN-COUNTRY">
<span class="term">UNITED STATES<span class="score"> (96%)</span></span>
</div><div class="PUB-REGION">Ohio</div>
</div><div class="LOAD-DATE">
<span class="header"><strong>LOAD-DATE: </strong>
</span>April 11, 2012</div><div class="LANGUAGE">
<span class="header"><strong>LANGUAGE: </strong>
</span><span class="hit">
<b>ENGLISH</b></span>
</div><div class="PUBLICATION-TYPE">
<span class="header"><strong>PUBLICATION-TYPE: </strong>
</span>Newswire</div><div class="COPYRIGHT" style="text-align: center">
<div class="PUB-COPYRIGHT"><br/>Copyright 2012 PR Newswire Association LLC<br/>All Rights
Reserved</div></div>
</body></html>\endverbatim
A.C The Penn Treebank tag set

APPENDIX A. DATA PREPARATION 123
Tag Description
CC Coordinating conjunctionCD Cardinal numberDT DeterminerEX Existential thereFW Foreign wordIN Preposition or subordinating conjunctionJJ AdjectiveJJR Adjective, comparativeJJS Adjective, superlativeLS List item markerMD ModalNN Noun, singular or massNNS Noun, pluralNP Proper noun, singularNPS Proper noun, pluralPDT PredeterminerPOS Possessive endingPP Personal pronounPP$ Possessive pronounRB AdverbRBR Adverb, comparativeRBS Adverb, superlativeRP ParticleSYM SymbolTO toUH InterjectionVB Verb, base formVBD Verb, past tenseVBG Verb, gerund or present participleVBN Verb, past participleVBP Verb, non-3rd person singular presentVBZ Verb, 3rd person singular presentWDT Wh-determiner (wh = words starting with wh)WP Wh-pronounWP$ Possessive wh-pronounWRB Wh-adverb
Table A.2: The Penn Treebank tag set
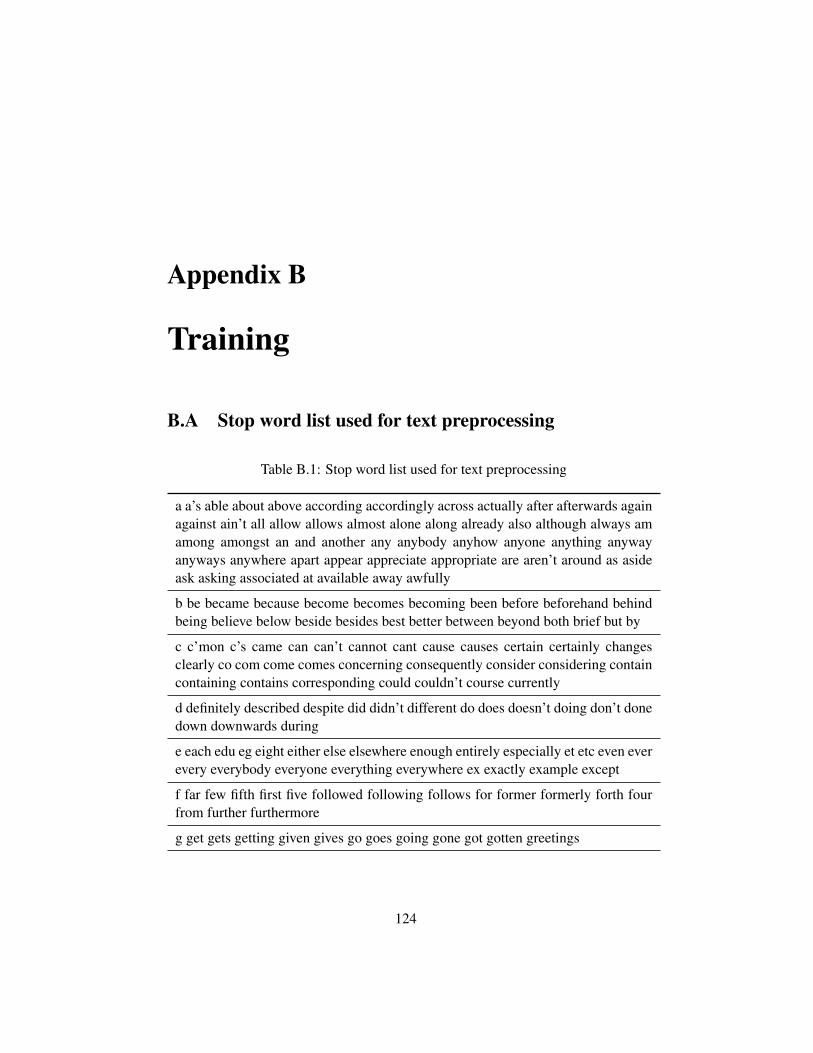
Appendix B
Training
B.A Stop word list used for text preprocessing
Table B.1: Stop word list used for text preprocessing
a a’s able about above according accordingly across actually after afterwards againagainst ain’t all allow allows almost alone along already also although always amamong amongst an and another any anybody anyhow anyone anything anywayanyways anywhere apart appear appreciate appropriate are aren’t around as asideask asking associated at available away awfully
b be became because become becomes becoming been before beforehand behindbeing believe below beside besides best better between beyond both brief but by
c c’mon c’s came can can’t cannot cant cause causes certain certainly changesclearly co com come comes concerning consequently consider considering containcontaining contains corresponding could couldn’t course currently
d definitely described despite did didn’t different do does doesn’t doing don’t donedown downwards during
e each edu eg eight either else elsewhere enough entirely especially et etc even everevery everybody everyone everything everywhere ex exactly example except
f far few fifth first five followed following follows for former formerly forth fourfrom further furthermore
g get gets getting given gives go goes going gone got gotten greetings
124

APPENDIX B. TRAINING 125
h had hadn’t happens hardly has hasn’t have haven’t having he he’s hello helphence her here here’s hereafter hereby herein hereupon hers herself hi him himselfhis hither hopefully how howbeit however
i i’d i’ll i’m i’ve ie if ignored immediate in inasmuch inc indeed indicate indicatedindicates inner insofar instead into inward is isn’t it it’d it’ll it’s its itself
j just
k keep keeps kept know knows known
l last lately later latter latterly least less lest let let’s like liked likely little looklooking looks ltd
m mainly many may maybe me mean meanwhile merely might more moreovermost mostly much must my myself
n name namely nd near nearly necessary need needs neither never nevertheless newnext nine no nobody non none noone nor normally not nothing novel now nowhere
o obviously of off often oh ok okay old on once one ones only onto or other othersotherwise ought our ours ourselves out outside over overall own
p particular particularly per perhaps placed please plus possible presumably prob-ably provides
q que quite qv
r rather rd re really reasonably regarding regardless regards relatively respectivelyright
s said same saw say saying says second secondly see seeing seem seemed seemingseems seen self selves sensible sent serious seriously seven several shall she shouldshouldn’t since six so some somebody somehow someone something sometimesometimes somewhat somewhere soon sorry specified specify specifying still subsuch sup sure
t t’s take taken tell tends th than thank thanks thanx that that’s thats the theirtheirs them themselves then thence there there’s thereafter thereby therefore thereintheres thereupon these they they’d they’ll they’re they’ve think third this thoroughthoroughly those though three through throughout thru thus to together too tooktoward towards tried tries truly try trying twice two
u un under unfortunately unless unlikely until unto up upon us use used useful usesusing usually uucp
v value various very via viz vs
APPENDIX B. TRAINING 126
w want wants was wasn’t way we we’d we’ll we’re we’ve welcome well went wereweren’t what what’s whatever when whence whenever where where’s whereafterwhereas whereby wherein whereupon wherever whether which while whither whowho’s whoever whole whom whose why will willing wish with within withoutwon’t wonder would would wouldn’t
x
y yes yet you you’d you’ll you’re you’ve your yours yourself yourselves
z zero
B.B Additional experimental results
In the following, we present a set of additional experimental results, conductedon different data sets. The prediction performance of each experiment is given inprecision for each class (πbuy, πsell, πhold), recall for each class (ρbuy, ρsell, ρhold),the balanced F-measure for each class (F buy
1 , F sell1 , F hold
1 ), the overall balancedF-measure F1 calculated using macro-averaging, and the accuracy A. All F1 andA values are given in %. All results are evaluated by means of a 10-fold crossvalidation of the training set.
In all results we use the abbreviations depicted in Table B.2. All settings thatare not explicitly given are identical with the settings used in Chapter 5. For in-stance, we use k-NN with k = 10. In the column dimensionality reduction (DR),the parameters are given in the format [DR] x%, or [DR] TH x. For instance, CHI15% means that the dimensionality reduction method chi-squared is performed toreduce the total amount of features to 15% of the total amount of instances. CHITH 0 means that chi-squared is performed to eleminate all features that obtainχ2 = 0. If the cell in the column DR is left blank, no dimensionality reductionis performed for this setting. In the column feature vector representation (VR), ablank cell means the boolean vector representation is chosen for this setting. In thecolumn methods for handling unbalanced data (UD), the parameters are given inthe format SS x, SM x, or MC x. For instance, SS 1 means that SpreadSubsampleis performed with parameter 1, i.e. the majority class is undersampled until the dis-tribution 1:1 is reached. SM 750 means that the minority classes are increased by750%. SM even means that the minority classes are increased until an even distri-bution with respect to all classes is reached. MC 10 means that the MetaCost filteris applied with C(i, j) = 0 for i = j, C(i, j) = 10 for i ∈ chold, and C(i, j) = 1 inall other cases. A blank cell in the column UD means that no methods for handlingunbalanced data are applied. In the column headline (HL), the parameter yes (y)means that only the headlines are used for training, instead of both headline and

APPENDIX B. TRAINING 127
Abbreviation Meaning
B BigramsBMA Binary metalearning algorithmBoW Bag-of-wordsCHI Chi-squaredClass. ClassifierDR Dimensionality reductionFeat. FeaturesHL HeadlineIDF IDF-TFIG Information gainPB POS bigramsMC MetaCostNE Named entitiesS SentimentSM SMOTESS SpreadSubsampleSVM SVM with RBF kernelSVM lin SVM with linear kernelTH x Threshold x%UD Methods for handling unbalanced dataVR Feature vector representationy yes
Table B.2: Abbreviations used in the results

APPENDIX B. TRAINING 128
news body as usual. In the column binary learning algorithm (BMA), the param-eter yes means that the binary learning algorithm is used to transform the 3-classproblem into two binary prediction problems.
The results of the 3-class problem are shown in Table B.3, the results of the2-class problem are shown in Table B.4. In Table B.5, we present a second 2-classproblem that is constructed by copying the 3-class problem and eliminating allHOLD news. However, during the classification phase the HOLD news needs to betaken into account. Therefore, a considerably worse performance is expected com-pared to the 10-fold cross validation at the training set. In the column thesaurus(Thes.), the parameter yes means that we use the thesaurus to filter out irrelevantnews like in both problems described previously. The rationale behind not per-forming any thesaurus filtering is that it increases the number of examples that canbe trained. In the column threshold (TH), the profit threshold of classifying a newsBUY or SELL is varied (+/− 0.3%, +/− 0.5%, +/− 0.2%).
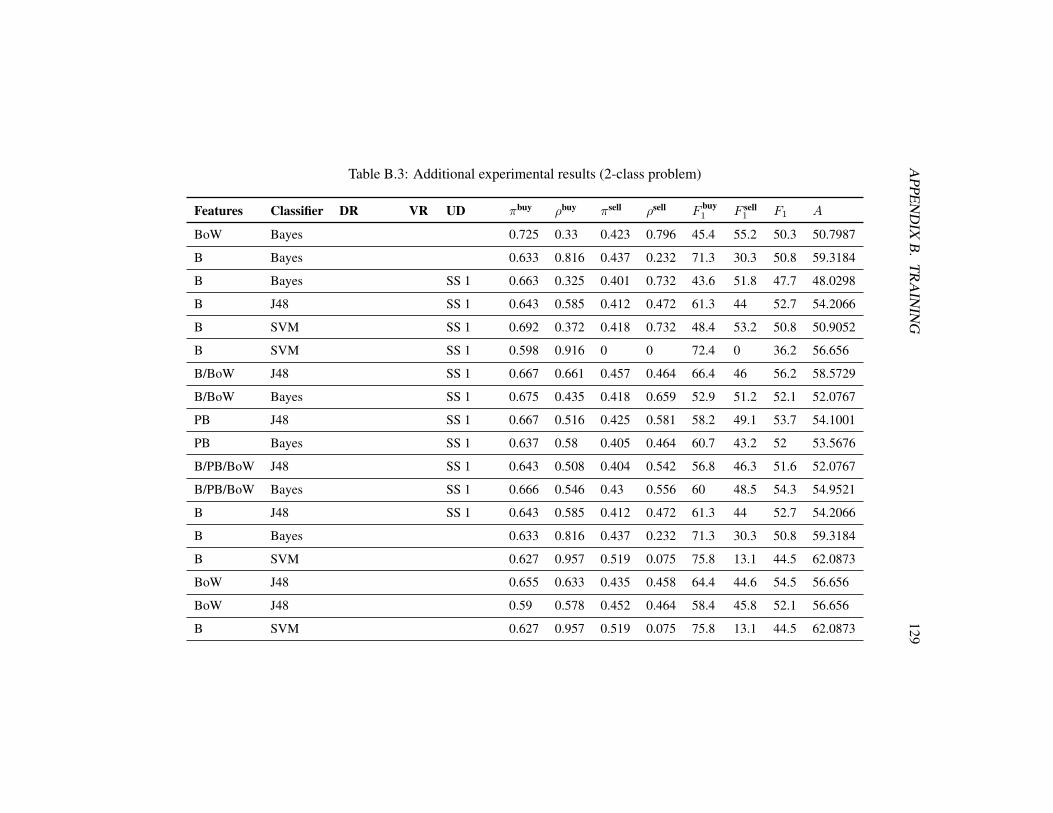
APPE
ND
IXB
.T
RA
ININ
G129
Table B.3: Additional experimental results (2-class problem)
Features Classifier DR VR UD πbuy ρbuy πsell ρsell F buy1 F sell
1 F1 A
BoW Bayes 0.725 0.33 0.423 0.796 45.4 55.2 50.3 50.7987
B Bayes 0.633 0.816 0.437 0.232 71.3 30.3 50.8 59.3184
B Bayes SS 1 0.663 0.325 0.401 0.732 43.6 51.8 47.7 48.0298
B J48 SS 1 0.643 0.585 0.412 0.472 61.3 44 52.7 54.2066
B SVM SS 1 0.692 0.372 0.418 0.732 48.4 53.2 50.8 50.9052
B SVM SS 1 0.598 0.916 0 0 72.4 0 36.2 56.656
B/BoW J48 SS 1 0.667 0.661 0.457 0.464 66.4 46 56.2 58.5729
B/BoW Bayes SS 1 0.675 0.435 0.418 0.659 52.9 51.2 52.1 52.0767
PB J48 SS 1 0.667 0.516 0.425 0.581 58.2 49.1 53.7 54.1001
PB Bayes SS 1 0.637 0.58 0.405 0.464 60.7 43.2 52 53.5676
B/PB/BoW J48 SS 1 0.643 0.508 0.404 0.542 56.8 46.3 51.6 52.0767
B/PB/BoW Bayes SS 1 0.666 0.546 0.43 0.556 60 48.5 54.3 54.9521
B J48 SS 1 0.643 0.585 0.412 0.472 61.3 44 52.7 54.2066
B Bayes 0.633 0.816 0.437 0.232 71.3 30.3 50.8 59.3184
B SVM 0.627 0.957 0.519 0.075 75.8 13.1 44.5 62.0873
BoW J48 0.655 0.633 0.435 0.458 64.4 44.6 54.5 56.656
BoW J48 0.59 0.578 0.452 0.464 58.4 45.8 52.1 56.656
B SVM 0.627 0.957 0.519 0.075 75.8 13.1 44.5 62.0873
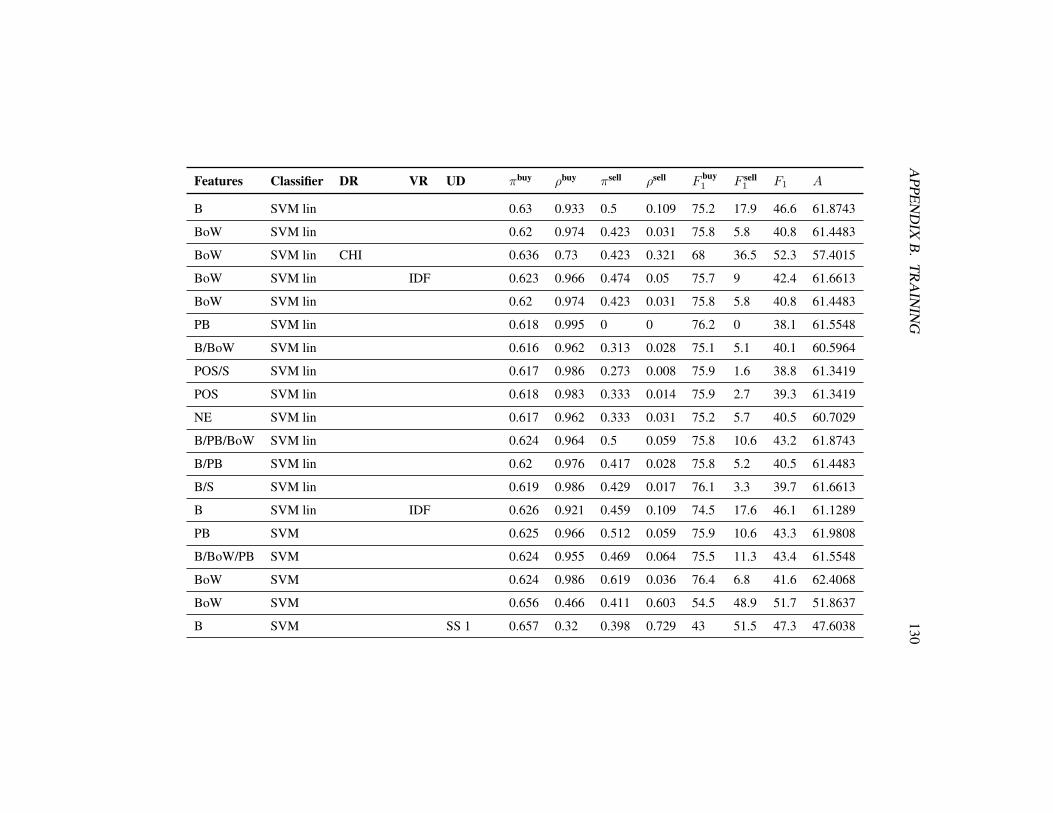
APPE
ND
IXB
.T
RA
ININ
G130
Features Classifier DR VR UD πbuy ρbuy πsell ρsell F buy1 F sell
1 F1 A
B SVM lin 0.63 0.933 0.5 0.109 75.2 17.9 46.6 61.8743
BoW SVM lin 0.62 0.974 0.423 0.031 75.8 5.8 40.8 61.4483
BoW SVM lin CHI 0.636 0.73 0.423 0.321 68 36.5 52.3 57.4015
BoW SVM lin IDF 0.623 0.966 0.474 0.05 75.7 9 42.4 61.6613
BoW SVM lin 0.62 0.974 0.423 0.031 75.8 5.8 40.8 61.4483
PB SVM lin 0.618 0.995 0 0 76.2 0 38.1 61.5548
B/BoW SVM lin 0.616 0.962 0.313 0.028 75.1 5.1 40.1 60.5964
POS/S SVM lin 0.617 0.986 0.273 0.008 75.9 1.6 38.8 61.3419
POS SVM lin 0.618 0.983 0.333 0.014 75.9 2.7 39.3 61.3419
NE SVM lin 0.617 0.962 0.333 0.031 75.2 5.7 40.5 60.7029
B/PB/BoW SVM lin 0.624 0.964 0.5 0.059 75.8 10.6 43.2 61.8743
B/PB SVM lin 0.62 0.976 0.417 0.028 75.8 5.2 40.5 61.4483
B/S SVM lin 0.619 0.986 0.429 0.017 76.1 3.3 39.7 61.6613
B SVM lin IDF 0.626 0.921 0.459 0.109 74.5 17.6 46.1 61.1289
PB SVM 0.625 0.966 0.512 0.059 75.9 10.6 43.3 61.9808
B/BoW/PB SVM 0.624 0.955 0.469 0.064 75.5 11.3 43.4 61.5548
BoW SVM 0.624 0.986 0.619 0.036 76.4 6.8 41.6 62.4068
BoW SVM 0.656 0.466 0.411 0.603 54.5 48.9 51.7 51.8637
B SVM SS 1 0.657 0.32 0.398 0.729 43 51.5 47.3 47.6038
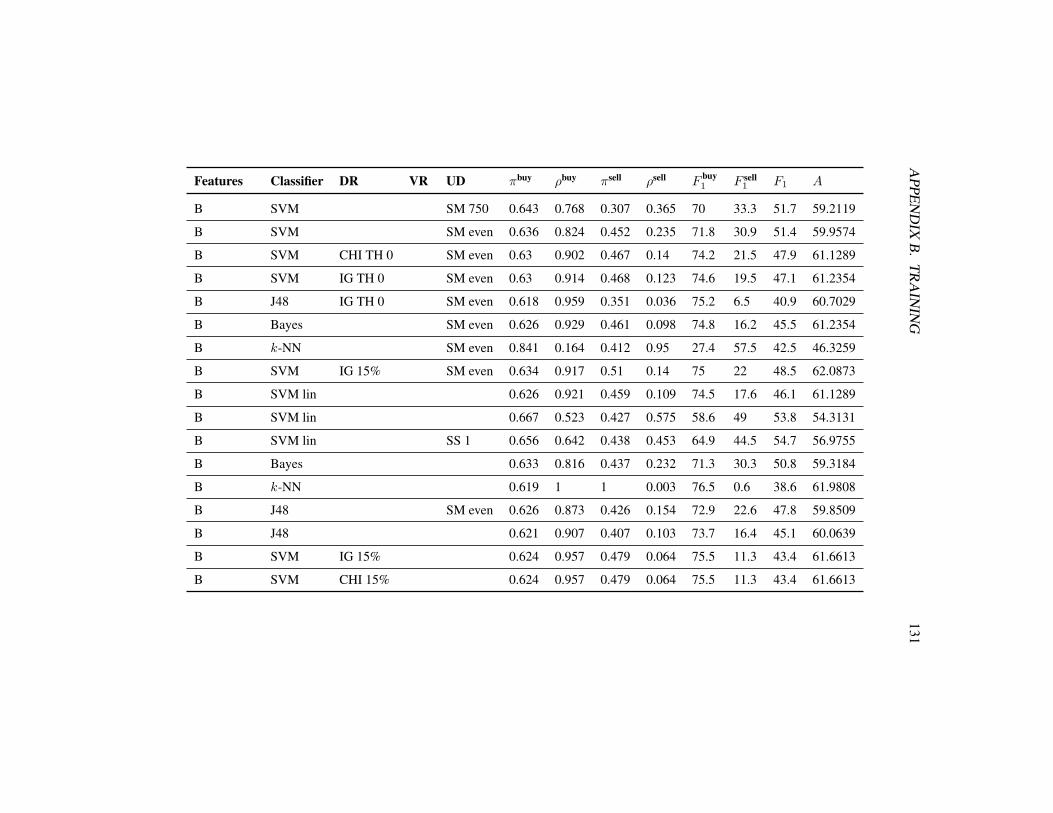
APPE
ND
IXB
.T
RA
ININ
G131
Features Classifier DR VR UD πbuy ρbuy πsell ρsell F buy1 F sell
1 F1 A
B SVM SM 750 0.643 0.768 0.307 0.365 70 33.3 51.7 59.2119
B SVM SM even 0.636 0.824 0.452 0.235 71.8 30.9 51.4 59.9574
B SVM CHI TH 0 SM even 0.63 0.902 0.467 0.14 74.2 21.5 47.9 61.1289
B SVM IG TH 0 SM even 0.63 0.914 0.468 0.123 74.6 19.5 47.1 61.2354
B J48 IG TH 0 SM even 0.618 0.959 0.351 0.036 75.2 6.5 40.9 60.7029
B Bayes SM even 0.626 0.929 0.461 0.098 74.8 16.2 45.5 61.2354
B k-NN SM even 0.841 0.164 0.412 0.95 27.4 57.5 42.5 46.3259
B SVM IG 15% SM even 0.634 0.917 0.51 0.14 75 22 48.5 62.0873
B SVM lin 0.626 0.921 0.459 0.109 74.5 17.6 46.1 61.1289
B SVM lin 0.667 0.523 0.427 0.575 58.6 49 53.8 54.3131
B SVM lin SS 1 0.656 0.642 0.438 0.453 64.9 44.5 54.7 56.9755
B Bayes 0.633 0.816 0.437 0.232 71.3 30.3 50.8 59.3184
B k-NN 0.619 1 1 0.003 76.5 0.6 38.6 61.9808
B J48 SM even 0.626 0.873 0.426 0.154 72.9 22.6 47.8 59.8509
B J48 0.621 0.907 0.407 0.103 73.7 16.4 45.1 60.0639
B SVM IG 15% 0.624 0.957 0.479 0.064 75.5 11.3 43.4 61.6613
B SVM CHI 15% 0.624 0.957 0.479 0.064 75.5 11.3 43.4 61.6613
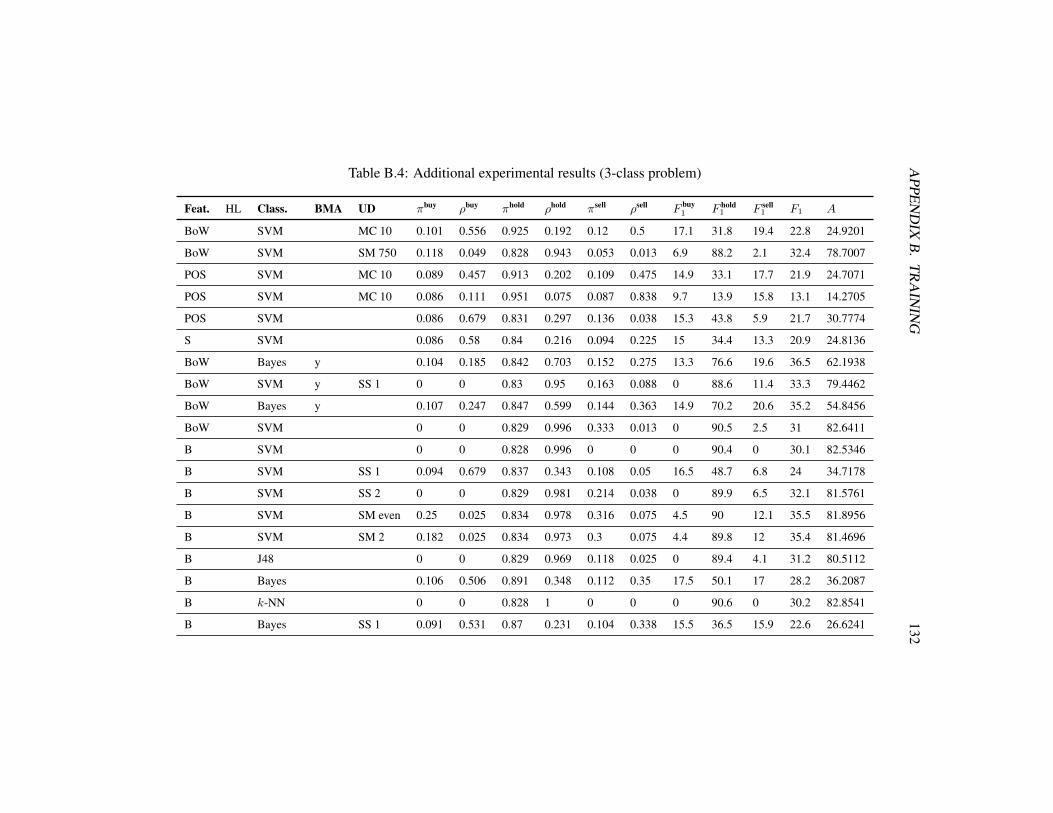
APPE
ND
IXB
.T
RA
ININ
G132
Table B.4: Additional experimental results (3-class problem)
Feat. HL Class. BMA UD πbuy ρbuy πhold ρhold πsell ρsell F buy1 F hold
1 F sell1 F1 A
BoW SVM MC 10 0.101 0.556 0.925 0.192 0.12 0.5 17.1 31.8 19.4 22.8 24.9201
BoW SVM SM 750 0.118 0.049 0.828 0.943 0.053 0.013 6.9 88.2 2.1 32.4 78.7007
POS SVM MC 10 0.089 0.457 0.913 0.202 0.109 0.475 14.9 33.1 17.7 21.9 24.7071
POS SVM MC 10 0.086 0.111 0.951 0.075 0.087 0.838 9.7 13.9 15.8 13.1 14.2705
POS SVM 0.086 0.679 0.831 0.297 0.136 0.038 15.3 43.8 5.9 21.7 30.7774
S SVM 0.086 0.58 0.84 0.216 0.094 0.225 15 34.4 13.3 20.9 24.8136
BoW Bayes y 0.104 0.185 0.842 0.703 0.152 0.275 13.3 76.6 19.6 36.5 62.1938
BoW SVM y SS 1 0 0 0.83 0.95 0.163 0.088 0 88.6 11.4 33.3 79.4462
BoW Bayes y 0.107 0.247 0.847 0.599 0.144 0.363 14.9 70.2 20.6 35.2 54.8456
BoW SVM 0 0 0.829 0.996 0.333 0.013 0 90.5 2.5 31 82.6411
B SVM 0 0 0.828 0.996 0 0 0 90.4 0 30.1 82.5346
B SVM SS 1 0.094 0.679 0.837 0.343 0.108 0.05 16.5 48.7 6.8 24 34.7178
B SVM SS 2 0 0 0.829 0.981 0.214 0.038 0 89.9 6.5 32.1 81.5761
B SVM SM even 0.25 0.025 0.834 0.978 0.316 0.075 4.5 90 12.1 35.5 81.8956
B SVM SM 2 0.182 0.025 0.834 0.973 0.3 0.075 4.4 89.8 12 35.4 81.4696
B J48 0 0 0.829 0.969 0.118 0.025 0 89.4 4.1 31.2 80.5112
B Bayes 0.106 0.506 0.891 0.348 0.112 0.35 17.5 50.1 17 28.2 36.2087
B k-NN 0 0 0.828 1 0 0 0 90.6 0 30.2 82.8541
B Bayes SS 1 0.091 0.531 0.87 0.231 0.104 0.338 15.5 36.5 15.9 22.6 26.6241
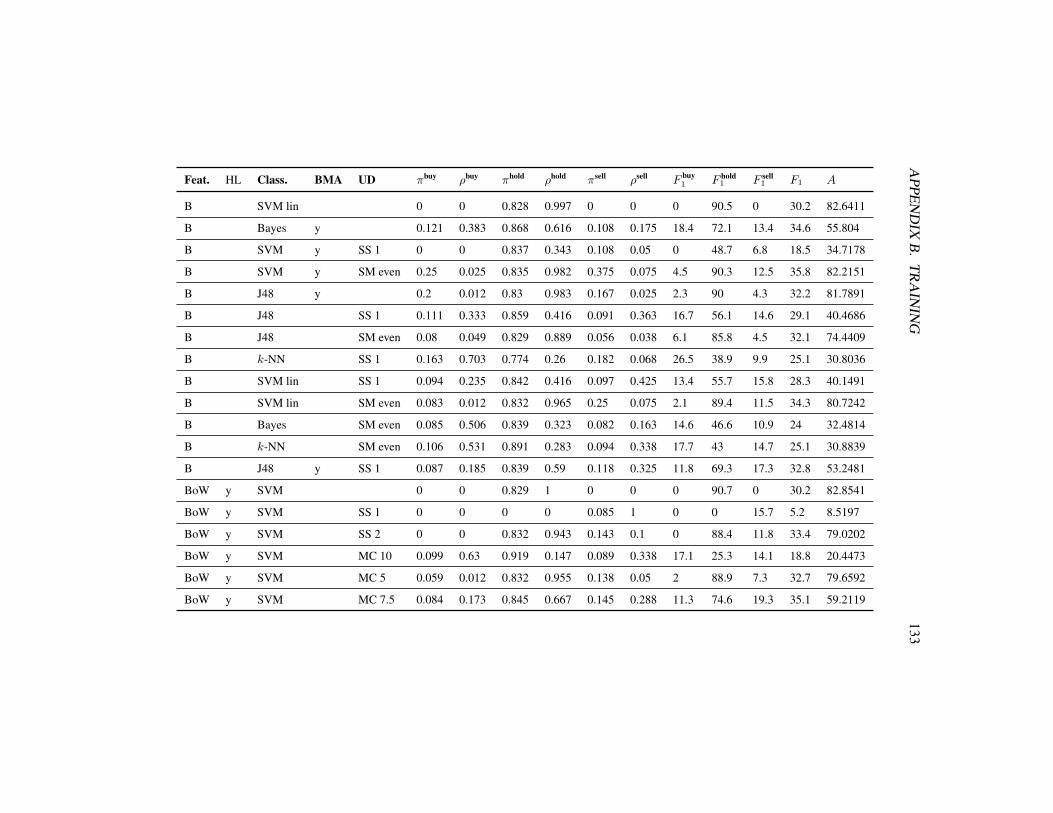
APPE
ND
IXB
.T
RA
ININ
G133
Feat. HL Class. BMA UD πbuy ρbuy πhold ρhold πsell ρsell F buy1 F hold
1 F sell1 F1 A
B SVM lin 0 0 0.828 0.997 0 0 0 90.5 0 30.2 82.6411
B Bayes y 0.121 0.383 0.868 0.616 0.108 0.175 18.4 72.1 13.4 34.6 55.804
B SVM y SS 1 0 0 0.837 0.343 0.108 0.05 0 48.7 6.8 18.5 34.7178
B SVM y SM even 0.25 0.025 0.835 0.982 0.375 0.075 4.5 90.3 12.5 35.8 82.2151
B J48 y 0.2 0.012 0.83 0.983 0.167 0.025 2.3 90 4.3 32.2 81.7891
B J48 SS 1 0.111 0.333 0.859 0.416 0.091 0.363 16.7 56.1 14.6 29.1 40.4686
B J48 SM even 0.08 0.049 0.829 0.889 0.056 0.038 6.1 85.8 4.5 32.1 74.4409
B k-NN SS 1 0.163 0.703 0.774 0.26 0.182 0.068 26.5 38.9 9.9 25.1 30.8036
B SVM lin SS 1 0.094 0.235 0.842 0.416 0.097 0.425 13.4 55.7 15.8 28.3 40.1491
B SVM lin SM even 0.083 0.012 0.832 0.965 0.25 0.075 2.1 89.4 11.5 34.3 80.7242
B Bayes SM even 0.085 0.506 0.839 0.323 0.082 0.163 14.6 46.6 10.9 24 32.4814
B k-NN SM even 0.106 0.531 0.891 0.283 0.094 0.338 17.7 43 14.7 25.1 30.8839
B J48 y SS 1 0.087 0.185 0.839 0.59 0.118 0.325 11.8 69.3 17.3 32.8 53.2481
BoW y SVM 0 0 0.829 1 0 0 0 90.7 0 30.2 82.8541
BoW y SVM SS 1 0 0 0 0 0.085 1 0 0 15.7 5.2 8.5197
BoW y SVM SS 2 0 0 0.832 0.943 0.143 0.1 0 88.4 11.8 33.4 79.0202
BoW y SVM MC 10 0.099 0.63 0.919 0.147 0.089 0.338 17.1 25.3 14.1 18.8 20.4473
BoW y SVM MC 5 0.059 0.012 0.832 0.955 0.138 0.05 2 88.9 7.3 32.7 79.6592
BoW y SVM MC 7.5 0.084 0.173 0.845 0.667 0.145 0.288 11.3 74.6 19.3 35.1 59.2119
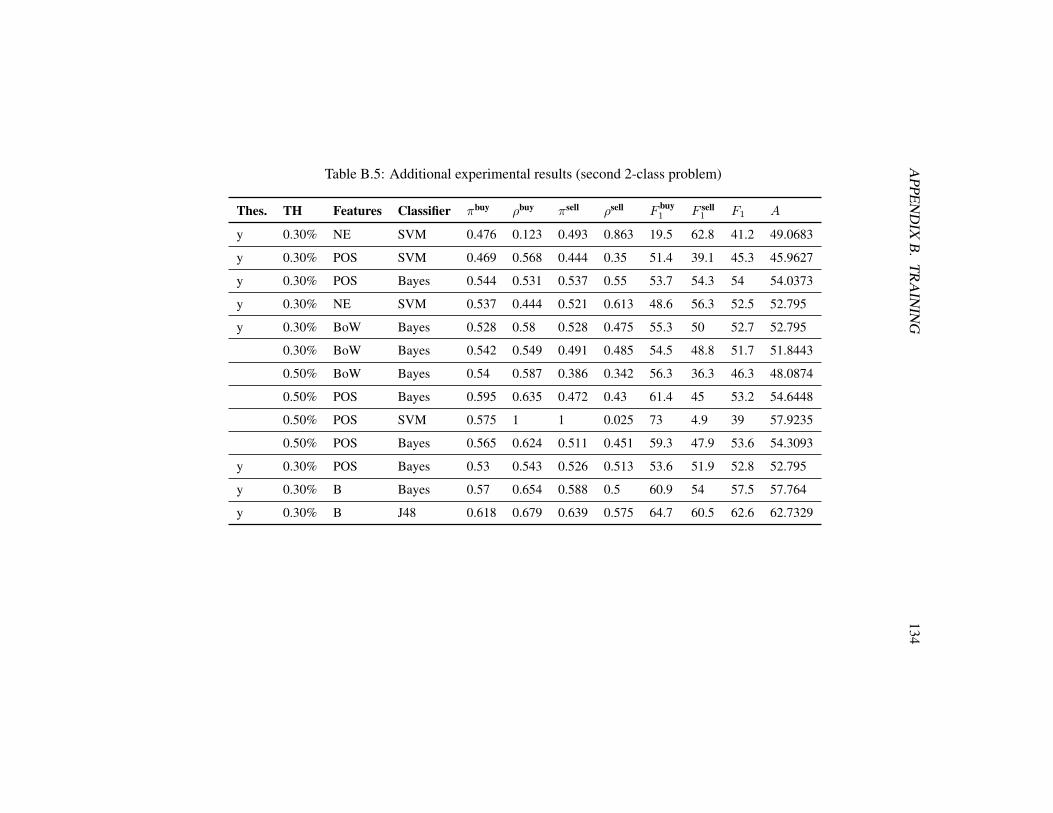
APPE
ND
IXB
.T
RA
ININ
G134
Table B.5: Additional experimental results (second 2-class problem)
Thes. TH Features Classifier πbuy ρbuy πsell ρsell F buy1 F sell
1 F1 A
y 0.30% NE SVM 0.476 0.123 0.493 0.863 19.5 62.8 41.2 49.0683
y 0.30% POS SVM 0.469 0.568 0.444 0.35 51.4 39.1 45.3 45.9627
y 0.30% POS Bayes 0.544 0.531 0.537 0.55 53.7 54.3 54 54.0373
y 0.30% NE SVM 0.537 0.444 0.521 0.613 48.6 56.3 52.5 52.795
y 0.30% BoW Bayes 0.528 0.58 0.528 0.475 55.3 50 52.7 52.795
0.30% BoW Bayes 0.542 0.549 0.491 0.485 54.5 48.8 51.7 51.8443
0.50% BoW Bayes 0.54 0.587 0.386 0.342 56.3 36.3 46.3 48.0874
0.50% POS Bayes 0.595 0.635 0.472 0.43 61.4 45 53.2 54.6448
0.50% POS SVM 0.575 1 1 0.025 73 4.9 39 57.9235
0.50% POS Bayes 0.565 0.624 0.511 0.451 59.3 47.9 53.6 54.3093
y 0.30% POS Bayes 0.53 0.543 0.526 0.513 53.6 51.9 52.8 52.795
y 0.30% B Bayes 0.57 0.654 0.588 0.5 60.9 54 57.5 57.764
y 0.30% B J48 0.618 0.679 0.639 0.575 64.7 60.5 62.6 62.7329

Ehrenwortliche Erklarung
Ich versichere, dass ich die beiliegende Masterarbeit ohne Hilfe Dritter und ohneBenutzung anderer als der angegebenen Quellen und Hilfsmittel angefertigt unddie den benutzten Quellen wortlich oder inhaltlich entnommenen Stellen alssolche kenntlich gemacht habe. Diese Arbeit hat in gleicher oder ahnlicher Formnoch keiner Prufungsbehorde vorgelegen. Ich bin mir bewusst, dass eine falscheErklarung rechtliche Folgen haben wird.
Mannheim, den Unterschrift
Related Documents