Welcome message from author
This document is posted to help you gain knowledge. Please leave a comment to let me know what you think about it! Share it to your friends and learn new things together.
Transcript
MINING AND METALLURGY INSTITUTE BOR
MINING AND METALLURGY ENGINEERING BOR is a journal based on the rich tradition of expert and scientific work from the field of mining, underground and open-pit mining, mineral proce-ssing, geology, mineralogy, petrology, geomecha-nics, metallurgy, materials, technology, as well as related fields of science. Since 2001, is published twice a year, and since 2011 four times year.
Editor-in-chief Academic Ph.D. Milenko Ljubojev, Principal Reasearch Fellow, Associate member of ESC Mining and Metallurgy Institute Bor E-mail: [email protected] Phone: +38130/454-109, 435-164
Editor Vesna Marjanović, B.Eng.
English Translation Nevenka Vukašinović
Technical Editor Suzana Cvetković
Preprinting Vesna Simić
Printed in: Grafomedtrade Bor
Circulation: 200 copies
Web site www.irmbor.co.rs
Journal is financially supported by The Ministry of Education, Science and Technological Development of the Republic Serbia Mining and Metallurgy Institute Bor
ISSN 2334-8836 Journal indexing in SCIndex and ISI. All rights reserved.
Published by Mining and Metallurgy Institute Bor 19210 Bor, Zeleni bulevar 35 E-mail: [email protected] Phone: +38130/454-110 Scientific – Technical Cooperation with the Engineering Academy of Serbia
Editorial Board Prof.Ph.D. Tajduš Antoni
The Stanislaw University of Mining and Metallurgy, Krakow, Poland
Prof.Ph.D. Mevludin Avdić MGCF-University of Tuzla, B&H
Prof.Ph.D. Vladimir Bodarenko National Mining University, Department of Deposit Mining, Ukraine
Ph.D. Mile Bugarin, Senior Research Associate Mining and Metallurgy Institute Bor
Prof.Ph.D. Kemal Gutić MGCF-University of Tuzla, B&H
Ph.D. Miroslav R.Ignjatović, Senior Research Associate Chamber of Commerce and Industry Serbia
Prof.Ph.D. Vencislav Ivanov Mining Faculty, University of Mining and Geology "St. Ivan Rilski" Sofia Bulgaria
Academic Prof.Ph.D. Jerzy Kicki Gospodarkl Surowcami Mineralnymi i Energia, Krakow, Poland
Ph. D., PEng. Dragan Komljenović Hydro-Quebec Research Institute Canada
Ph. D. Ana Kostov, Principal Research Fellow Mining and Metallurgy Institute Bor
Prof. Ph. D. Nikola Lilić Faculty of Mining and Geology Belgrade
Ph.D. Dragan Milanović, Research Associate Mining and Metallurgy Institute Bor
Prof.Ph.D. Vitomir Milić Technical Faculty Bor
Ph.D. Aleksandra Milosavljević, Research Associate Mining and Metallurgy Institute Bor
Ph.D. Dragoslav Rakić Faculty of Mining and Geology Belgrade
Prof.Ph.D. Rodoljub Stanojlović, Technical Faculty Bor
Academic Prof.Ph.D. Mladen Stjepanović Engineering Academy of Serbia
Ph.D. Vlastimir Trujić, Principal Research Fellow Mining and Metallurgy Institute Bor
Ph.D. Biserka Trumić, Senior Research Associate Mining and Metallurgy Institute Bor
Prof.Ph.D. Nebojša Vidanović Faculty of Mining and Geology Belgrade
Prof.Ph.D. Milivoj Vulić University of Ljubljana, Slovenia
Prof.Ph.D. Nenad Vušović Technical Faculty Bor
JOURNAL OF INTERNATIONAL IMPORTANCE, VERIFIED BY A SPECIAL DECISION ON THE MINISTRY OF EDUCATION, SCIENCE AND TECHNOLOGICAL DEVELOPMENT
OF THE REPUBLIC SERBIA - M24
INSTITUT ZA RUDARSTVO I METALURGIJU BOR
MINING AND METALLURGY ENGINEERING BOR je časopis baziran na bogatoj tradiciji stručnog i naučnog rada u oblasti rudarstva, podzemne i površinske eksploatacije, pripreme mineralnih sirovina, geologije, mineralogije, petrologije, geomehanike, metalurgije, materijala, tehnologije i povezanih srodnih oblasti. Izlazi dva puta godišnje od 2001. godine, a od 2011. godine četiri puta godišnje.
Glavni i odgovorni urednik Akademik dr Milenko Ljubojev, naučni savetnik Institut za rudarstvo i metalurgiju Bor E-mail: [email protected] Tel. 030/454-109, 435-164
Urednik Vesna Marjanović, dipl.inž.
Prevodilac Nevenka Vukašinović, prof.
Tehnički urednik Suzana Cvetković, teh.
Priprema za štampu Vesna Simić, teh.
Štamparija: Grafomedtrade Bor Tiraž: 200 primeraka
Internet adresa www.irmbor.co.rs
Izdavanje časopisa finansijski podržavaju Ministarstvo za prosvetu, nauku i tehnološki razvoj Republike Srbije Institut za rudarstvo i metalurgiju Bor
ISSN 2334-8836
Indeksiranje časopisa u SCIndeksu i u ISI. Sva prava zadržana.
Izdavač Institut za rudarstvo i metalurgiju Bor 19210 Bor, Zeleni bulevar 35 E-mail: [email protected] Tel. 030/454-110 Naučno - tehnička saradnja sa Inženjerskom Akademijom Srbije
Uređivački odbor Prof. dr Tajduš Antoni
Stanislavov univerzitet za rudarstvo i metalurgiju, Krakov, Poljska
Prof. dr Mevludin Avdić RGGF-Univerzitet u Tuzli, BiH
Prof. dr Vladimir Bodarenko Nacionalni rudarski univerzitet, Odeljenje za podzemno rudarstvo, Ukrajina
Dr Mile Bugarin, viši naučni saradnik Institut za rudarstvo i metalurgiju Bor
Prof. dr Kemal Gutić RGGF-Univerzitet u Tuzli, BiH Akademik
Dr Miroslav R. Ignjatović, viši naučni saradnik Privredna komora Srbije
Prof. dr Vencislav Ivanov Rudarski fakultet Univerziteta za rudarstvo i geologiju "St. Ivan Rilski" Sofija Bugarska
Prof. dr Jerzy Kicki Državni institut za mineralne sirovine i energiju, Krakov, Poljska
Dr Dragan Komljenović Istraživački institut Hidro-Quebec, Kanada
Dr Ana Kostov, naučni savetnik Institut za rudarstvo i metalurgiju Bor
Prof. Dr Nikola Lilić Rudarsko geološki fakultet Beograd
Dr Dragan Milanović, naučni saradnik Institut za rudarstvo i metalurgiju Bor
Prof. dr Vitomir Milić Tehnički fakultet Bor
Dr Aleksandra Milosavljević, naučni saradnik Institut za rudarstvo i metalurgiju Bor
Dr Dragoslav Rakić, docent Rudarsko geološki fakultet Beograd
Prof. dr Rodoljub Stanojlović Tehnički fakultet Bor
Akademik Prof. dr Mladen Stjepanović Inženjerska akademija Srbije
Dr Vlastimir Trujić, naučni savetnik Institut za rudarstvo i metalurgiju Bor
Dr Biserka Trumić, viši naučni saradnik Institut za rudarstvo i metalurgiju Bor
Prof. dr Nebojša Vidanović Rudarsko geološki fakultet Beograd
Prof. dr Milivoj Vulić Univerzitet u Ljubljani, Slovenija
Prof. dr Nenad Vušović Tehnički fakultet Bor
ČASOPIS MEĐUNARODNOG ZNAČAJA VERIFIKOVAN POSEBNOM ODLUKOM MINISTARSTVA ZA PROSVETU, NAUKU I TEHNOLOŠKI RAZVOJ
REPUBLIKE SRBIJE - M24
CONTENS SADR@AJ
Dragan Ignjatović, Lidija Đurđevac Ignjatović, Milenko Ljubojev, Ivan Ivanov
TESTING THE CARRYING CAPACITY OF ANCHOR IN THE ORE BODY “T1” ...................................... 1
ISPITIVANJE NOSIVOSTI ANKERA U RUDNOM TELU „T1“ ...................................................................... 7
Zoran Vaduvesković, Nenad Vušović, Daniel Kržanović
ANALYSIS THE POSIBILITY OF IMPROVING THE ECONOMIC INDICATORS OF EXPLOITATION THE DEPOSIT CEMENTACIJA KRAKU BUGARESKU - ORE FIELD CEROVO ...... 13 ANALIZA MOGUĆNOSTI POBOLJŠANJA EKONOMSKIH POKAZATELJA EKSPLOATACIJE LEŽIŠTA CEMENTACIJA KRAKU BUGARESKU – RUDNO POLJE CEROVO ....................................... 25
Vedran Kostić, Zoran Vaduvesković, Daniel Kržanović
SELECTION OF THE OPTIMUM LOCATION OF THE PRIMARY ORE CRUSHING AT THE OPEN PIT SOUTH MINING DISTRICT USING THE COMPARATIVE ANALYSIS OF SIMULATION RESULTS OF THE TRUCK TRANSPORT ............................................................................. 37 IZBOR OPTIMALNE LOKACIJE PRIMARNOG DROBLJENJA RUDE NA POVRŠINSKOM KOPU JUŽNI REVIR UPOREDNOM ANALIZOM REZULTATA SIMULACIJE KAMIONSKOG TRANSPORTA ................................................................................................ 47
Slavica R. Mihajlović, Dragan S. Radulović, Sonja Z. Milićević, Živko T. Sekulić
APPLICATION OF LIME IN THE POLYVINYL CHLORIDE INDUSTRY .................................................. 57
PRIMENA KREČNJAKA U INDUSTRIJI POLIVINIL-HLORIDA ................................................................. 63
Milan Petrov, Ljubiša Andrić, Živko Sekulić, Zoran Bartulović
MODELING THE BATCH POWER OF MILL ................................................................................................... 69
MODELOVANJE ŠARŽNE SNAGE MLINA ..................................................................................................... 77
Biljana Ilić, Dragan Mihajlović
RECYCLING IN THE FUNCTION OF SAVINGS AND GREEN ECONOMY OF MINERAL RESOURCES ................................................................................................................................ 85
RECIKLAŽA U FUNKCIJI ŠTEDNJE I ODRŽIVE EKONOMIJE MINERALNIH SIROVINA .................. 95
Miomir Mikić, Ivana Jovanović, Daniela Urošević
RECLAMATION OF THE ASH AND SLAG LANDFILL GACKO - B&H .................................................. 105
REKULTIVACIJA DEPONIJE PEPELA I ŠLJAKE GACKO - B I H ............................................................ 113
Milan Petrov, Ljubiša Andrić, Živko Sekulić, Vladimir Jovanović
MODELING THE MILL OPERATION ACCORDING TO DENSITY OF MILL BATCH AND SPECIFIC CAPACITY .............................................................................................. 121 MODELOVANJE RADA MLINA PREMA GUSTINI ŠARŽE MLINA I SPECIFIČNOM KAPACITETU .......................................................................................................................... 129
Zagorka Aćimović, Anja Terzić, Ljubiša Andrić, Vera Stojanović, Marko Pavlović
THE FLAWS OF ALUMINIUM-MAGNESIUM ALLOY ELEMENTS – INFLUENCE OF INCLUSIONS ............................................................................................... 137
GREŠKE NA ELEMENTIMA OD ALUMINIJUM-MAGNEZIJUM LEGURE - UTICAJ UKLJUČAKA .................................................................................................................... 145
Vladimir Radovanović, Ljiljana Savić
KNOWLEDGE AND INNOVATIONS - KEY FACTORS OF DEVELOPMENT AND EMPLOYMENT IN THE MINING COMPANIES .................................................. 153
ZNANJE I INOVACIJE KLJUČNI FAKTORI RAZVOJA I ZAPOŠLJAVANJA U RUDARSKIM PREDUZEĆIMA ......................................................................................................................... 161
No. 1, 2014 Mining & Metallurgy Engineering Bor 1
MINING AND METALLURGY INSTITUTE BOR ISSN: 2334-8836 UDK: 622
UDK: 622.261.2(045)=20 DOI:10.5937/MMEB1401001I
Dragan Ignjatović*, Lidija Đurđevac Ignjatović*, Milenko Ljubojev*, Ivan Ivanov**
TESTING THE CARRYING CAPACITY OF ANCHOR IN THE ORE BODY “T1”***
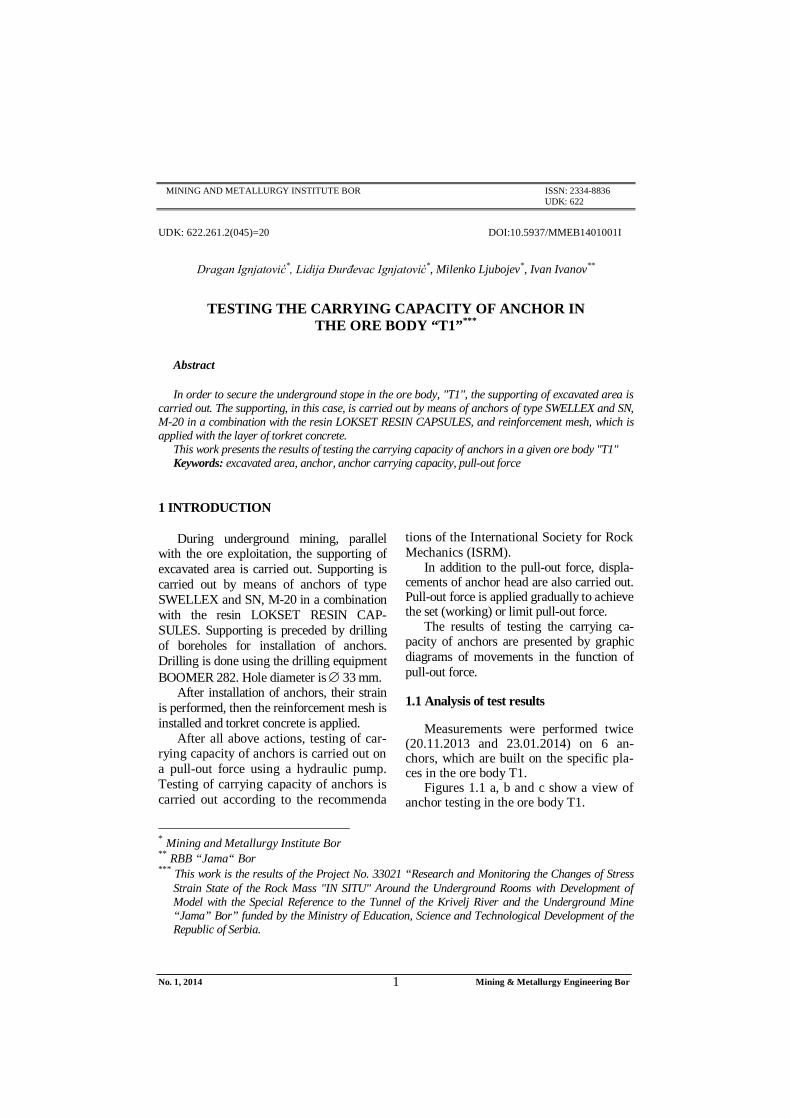
Abstract
In order to secure the underground stope in the ore body, "T1", the supporting of excavated area is carried out. The supporting, in this case, is carried out by means of anchors of type SWELLEX and SN, M-20 in a combination with the resin LOKSET RESIN CAPSULES, and reinforcement mesh, which is applied with the layer of torkret concrete.
This work presents the results of testing the carrying capacity of anchors in a given ore body "T1" Keywords: excavated area, anchor, anchor carrying capacity, pull-out force
* Mining and Metallurgy Institute Bor ** RBB “Jama“ Bor *** This work is the results of the Project No. 33021 “Research and Monitoring the Changes of Stress
Strain State of the Rock Mass "IN SITU" Around the Underground Rooms with Development of Model with the Special Reference to the Tunnel of the Krivelj River and the Underground Mine “Jama” Bor” funded by the Ministry of Education, Science and Technological Development of the Republic of Serbia.
1 INTRODUCTION
During underground mining, parallel with the ore exploitation, the supporting of excavated area is carried out. Supporting is carried out by means of anchors of type SWELLEX and SN, M-20 in a combination with the resin LOKSET RESIN CAP-SULES. Supporting is preceded by drilling of boreholes for installation of anchors. Drilling is done using the drilling equipment BOOMER 282. Hole diameter is 33 mm.
After installation of anchors, their strain is performed, then the reinforcement mesh is installed and torkret concrete is applied.
After all above actions, testing of car-rying capacity of anchors is carried out on a pull-out force using a hydraulic pump. Testing of carrying capacity of anchors is carried out according to the recommenda
tions of the International Society for Rock Mechanics (ISRM).
In addition to the pull-out force, displa-cements of anchor head are also carried out. Pull-out force is applied gradually to achieve the set (working) or limit pull-out force.
The results of testing the carrying ca-pacity of anchors are presented by graphic diagrams of movements in the function of pull-out force.
1.1 Analysis of test results
Measurements were performed twice (20.11.2013 and 23.01.2014) on 6 an-chors, which are built on the specific pla-ces in the ore body T1.
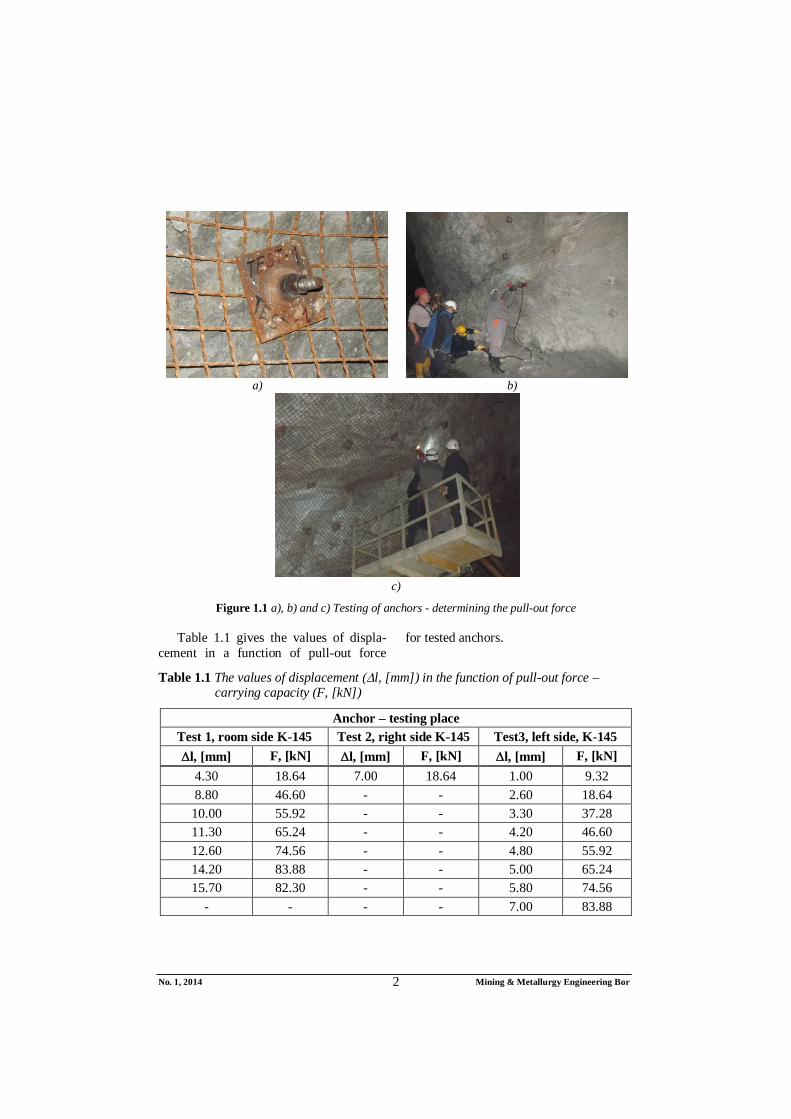
Figures 1.1 a, b and c show a view of anchor testing in the ore body T1.
No. 1, 2014 Mining & Metallurgy Engineering Bor 2
a) b)
c)
Figure 1.1 a), b) and c) Testing of anchors - determining the pull-out force
Table 1.1 gives the values of displa-cement in a function of pull-out force
for tested anchors.
Table 1.1 The values of displacement (l, [mm]) in the function of pull-out force – carrying capacity (F, [kN])
Anchor – testing place Test 1, room side K-145 Test 2, right side K-145 Test3, left side, K-145 l, [mm] F, [kN] l, [mm] F, [kN] l, [mm] F, [kN]
4.30 18.64 7.00 18.64 1.00 9.32 8.80 46.60 - - 2.60 18.64 10.00 55.92 - - 3.30 37.28 11.30 65.24 - - 4.20 46.60 12.60 74.56 - - 4.80 55.92 14.20 83.88 - - 5.00 65.24 15.70 82.30 - - 5.80 74.56
- - - - 7.00 83.88
No. 1, 2014 Mining & Metallurgy Engineering Bor 3
Table 1.1 - continued
Anchor – testing place Test 1, right side
K-123 Test 2, right side
K-123 Test 3, roof of room
K-123 l, [mm] F, [kN] l, [mm] F, [kN] l, [mm] F, [kN]
7.10 18.64 3.00 18.64 2.00 18.64 7.60 27.96 3.20 27.96 6.10 27.96 8.20 37.28 4.00 37.28 7.50 37.28 8.40 46.60 5.90 46.60 10.50 46.60 8.50 55.92 6.00 55.92 11.00 55.92 9.20 65.24 7.10 65.24 13.00 60.58
13.30 74.56 7.40 74.56 14.00 65.24 15.90 83.88 8.00 83.88 14.80 74.56 17.70 93.20 9.80 93.20 15.00 83.88 18.60 102.52 9.90 102.52 15.10 93.20 19.40 111.84 10.00 111.84 16.00 102.52 23.50 121.16 12.90 121.16 16.30 111.84 26.00 130.48 13.00 130.48 16.50 121.16 27.00 135.14 13.50 139.80 25.50 130.48
- - 16.70 149.12 - - - - 17.40 153.78 - -
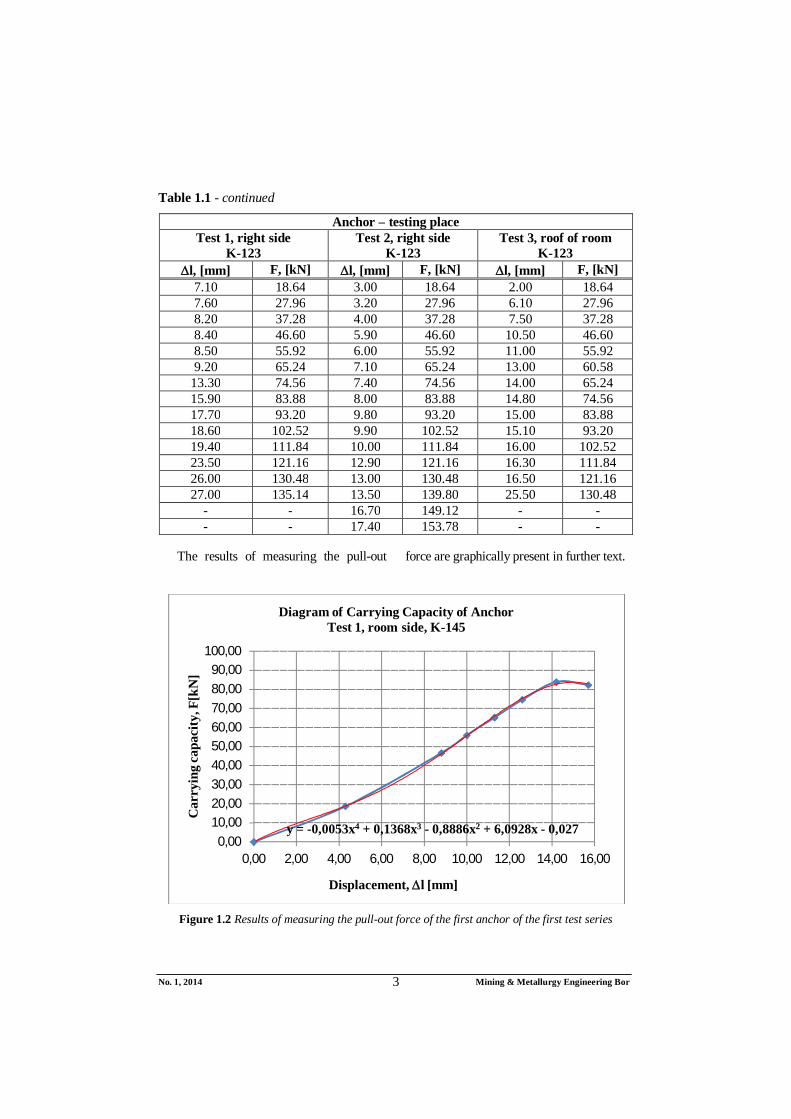
The results of measuring the pull-out force are graphically present in further text.
Figure 1.2 Results of measuring the pull-out force of the first anchor of the first test series
y = -0,0053x4 + 0,1368x3 - 0,8886x2 + 6,0928x - 0,0270,00
10,0020,0030,0040,0050,0060,0070,0080,0090,00
100,00
0,00 2,00 4,00 6,00 8,00 10,00 12,00 14,00 16,00
Car
ryin
g ca
paci
ty, F
[kN
]
Displacement, l [mm]
Diagram of Carrying Capacity of AnchorTest 1, room side, K-145
No. 1, 2014 Mining & Metallurgy Engineering Bor 4
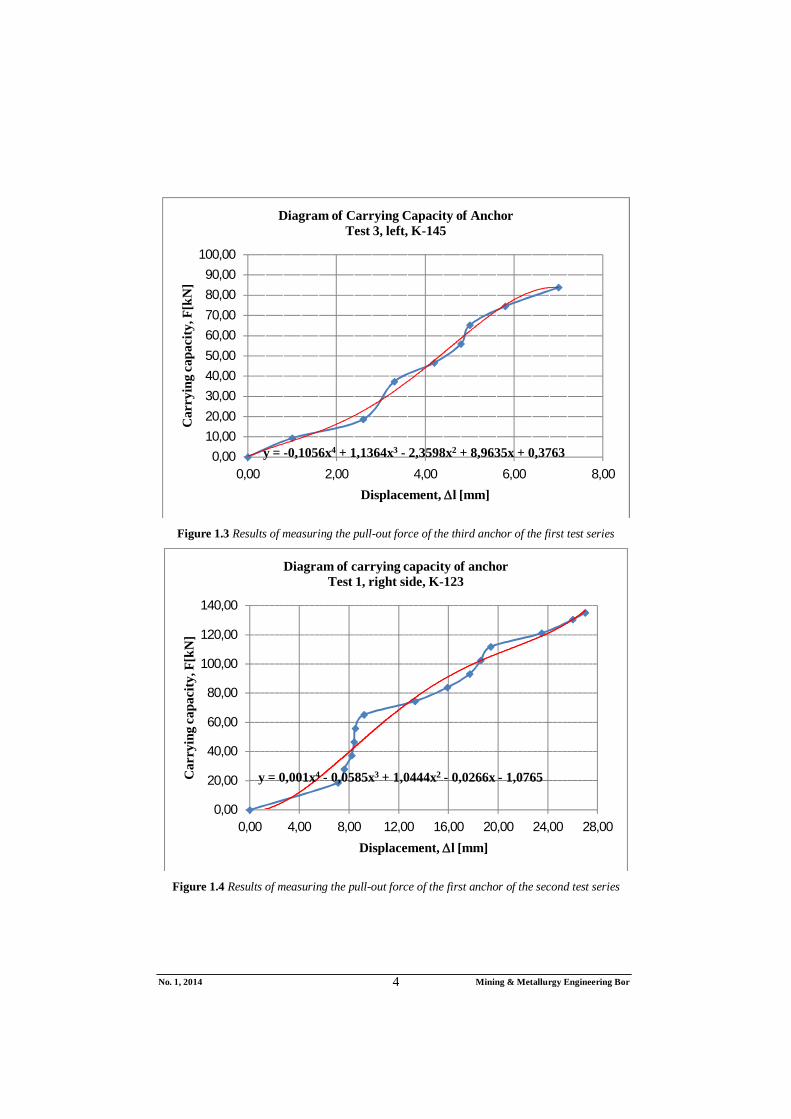
Figure 1.3 Results of measuring the pull-out force of the third anchor of the first test series
Figure 1.4 Results of measuring the pull-out force of the first anchor of the second test series
y = -0,1056x4 + 1,1364x3 - 2,3598x2 + 8,9635x + 0,37630,00
10,00
20,00
30,00
40,00
50,00
60,00
70,00
80,00
90,00
100,00
0,00 2,00 4,00 6,00 8,00
Car
ryin
g ca
paci
ty, F
[kN
]
Displacement, l [mm]
Diagram of Carrying Capacity of AnchorTest 3, left, K-145
y = 0,001x4 - 0,0585x3 + 1,0444x2 - 0,0266x - 1,0765
0,00
20,00
40,00
60,00
80,00
100,00
120,00
140,00
0,00 4,00 8,00 12,00 16,00 20,00 24,00 28,00
Car
ryin
g ca
paci
ty, F
[kN
]
Displacement, l [mm]
Diagram of carrying capacity of anchorTest 1, right side, K-123
No. 1, 2014 Mining & Metallurgy Engineering Bor 5
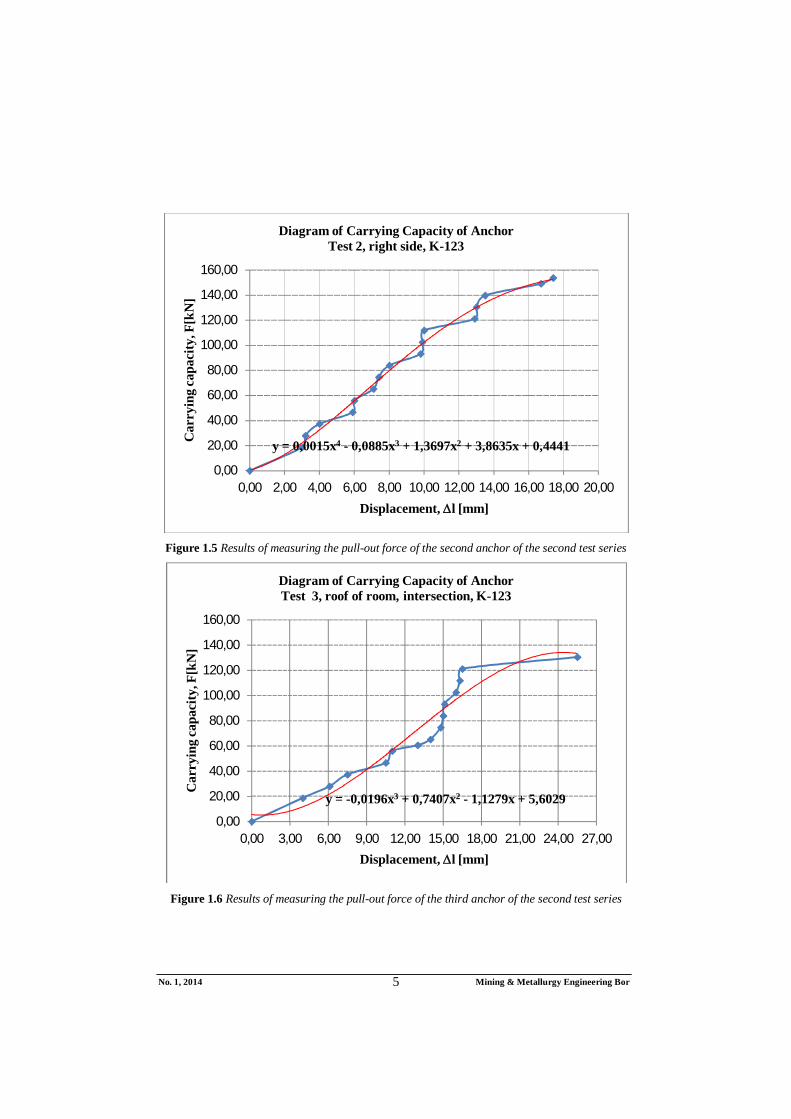
Figure 1.5 Results of measuring the pull-out force of the second anchor of the second test series
Figure 1.6 Results of measuring the pull-out force of the third anchor of the second test series
y = 0,0015x4 - 0,0885x3 + 1,3697x2 + 3,8635x + 0,4441
0,00
20,00
40,00
60,00
80,00
100,00
120,00
140,00
160,00
0,00 2,00 4,00 6,00 8,00 10,00 12,00 14,00 16,00 18,00 20,00
Car
ryin
g ca
paci
ty, F
[kN
]
Displacement, l [mm]
Diagram of Carrying Capacity of AnchorTest 2, right side, K-123
y = -0,0196x3 + 0,7407x2 - 1,1279x + 5,6029
0,00
20,00
40,00
60,00
80,00
100,00
120,00
140,00
160,00
0,00 3,00 6,00 9,00 12,00 15,00 18,00 21,00 24,00 27,00
Car
ryin
g ca
paci
ty, F
[kN
]
Displacement, l [mm]
Diagram of Carrying Capacity of AnchorTest 3, roof of room, intersection, K-123
No. 1, 2014 Mining & Metallurgy Engineering Bor 6
Values of pull-out forces of anchors
were compared with the specification and attest given by the manufacturer, and it can be concluded that the anchors com-pletely fulfill their functions.
2 CONCLUSION
In order to secure the underground stope in the ore body, "T1", the supporting of ex-cavated area is carried out after finished exploitation. The supporting, in this case, is carried out by means of anchors of type SWELLEX and SN, M-20 in a combination with the resin LOKSET RESIN CAP-SULES, and reinforcement mesh, which is applied with the layer of torkret concrete.
After tests, which were carried out in the field, it can be concluded that the test-ed anchors meet the prescribed quality according to the current standard and at-test of manufacturer.
REFERENCES
[1] Quarterly Report on the Status of Works on the Ore Exploitation from the Ore Body "T1" in the “Jama” Bor, Mining and Metallurgy Institute Bor, Laboratory for Geomechanics, March 2014;
[2] M. Memić, E. Hadžić, S. Softić, Met-hodology of Design and Construction the Underground Rooms, Tuzla 1999;
[3] R. Popović, M. Ljubojev, L. Đurđevac Ignjatović, Deformability Parameters for Forming the Stress-strain State Models of Rock Massif, Mining and Metallurgy Engineering Bor, 3/2013, str. 1-6.
[4] V. Milić, I. Svrkota, D. Petrović, Analysis of Block Stability for Semi - Level Caving Method With Kateral Loading, Mining and Metallurgy Engineering Bor, 2/2013, pp. 21-26.
[5] S. Ćosić, M. Avdić, A. Sušić, M. Ljubojev, Finite Element Analysis of Deep Underground Salt, Mining and Metallurgy Engineering Bor, 3/2013, pp. 65-72.
Broj 1, 2014. Mining & Metallurgy Engineering Bor 7
INSTITUT ZA RUDARSTVO I METALURGIJU BOR ISSN: 2334-8836 UDK: 622
UDK: 622.261.2(045)=861 DOI:10.5937/MMEB1401001I
Dragan Ignjatović*, Lidija Đurđevac Ignjatović*, Milenko Ljubojev*, Ivan Ivanov**
ISPITIVANJE NOSIVOSTI ANKERA U RUDNOM TELU „T1“***
Izvod
U cilju obezbeđenja podzemnog otkopa u rudnom telu „T1“, nakon izvršene eksploatacije se vrši podgrađivanje otkopnog prostora. Podgrađivanje se, u ovom slučaju, izvodi pomoću ankera SWELLEX i SN, M-20 u kombinaciji sa smolom LOKSET RESIN CAPSULES, i armaturnom mrežom, preko koje se nanosi sloj torkret betona.
U ovom radu su prikazani rezultati ispitivanja nosivosti ankera u datom rudnom telu „T1“ Ključne reči: otkopni prostor, anker, nosivost ankera, sila čupanja
* Institut za rudarstvo i metalurgiju Bor ** RBB „Jama“ Bor ***Ovaj rad je proistekao iz Projekta nauke broj 33021 „Istraživanje i praćenje promena naponsko
deformacionog stanja u stenskom masivu „IN SITU“ oko podzemnih prostorija sa izradom modela sa posebnim osvrtom na tunel Kriveljske reke i Jame Bor“, koga finansira Ministarstvo prosvete, nauke i tehnološkog razvoja Republike Srbije
1. UVOD
U toku podzemnog otkopavanja, upo-redo sa eksploatacijom rude, vršeno je podgrađivanje otkopnog prostora. Pod-građivanje se vrši ankerima tipa SWELLEX i SN, M-20 u kombinaciji sa smolom LOKSET RESIN CAPSULES. Podgrađi-vanju prethodi bušenje bušotina za ugradnju ankera. Bušenje se vrši bušaćom garni-turom BOOMER 282. Prečnik bušotina je 33 mm.
Nakon ugradnje ankera, vršeno je njiho-vo naprezanje, zatim postavljanje armaturne mreže i nanošenje torkret betona.
Posle svih navedenih radnji vršena su ispitivanja nosivosti ankera na silu čupa-nja pomoću hidraulične pumpe. Ispitivanje nosivosti ankera je vršeno prema prepo-
rukama Međunarodnog društva za meha-niku stena (ISRM).
Pored sile čupanja registrovana su i pomeranja glave ankera. Sila čupanja se nanosi postepeno do dostizanja zadate (radne) ili granične sile čupanja.
Rezultati ispitivanja nosivosti ankera su prikazani grafički dijagramima pomeranja u funkciji sile čupanja.
1.1. Analiza rezultata ispitivanja
Merenja su izvršena u dva navrata (20.11.2013. i 23.01.2014. godine) na 6 ankera, koji su ugrađeni na karakterističnim mestima u rudnom telu T1.
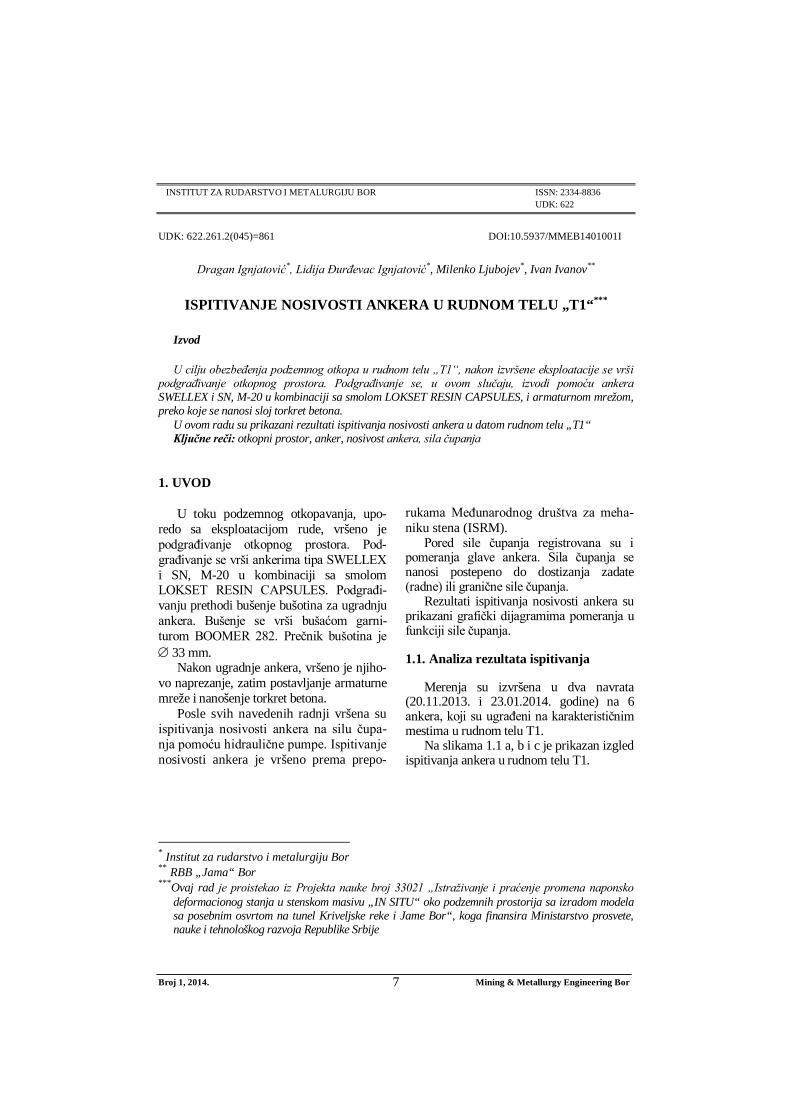
Na slikama 1.1 a, b i c je prikazan izgled ispitivanja ankera u rudnom telu T1.
Broj 1, 2014. Mining & Metallurgy Engineering Bor 8
a) b)
c)
Sl. 1.1 a), b) i c). Ispitivanje ankera – određivanje sile čupanja
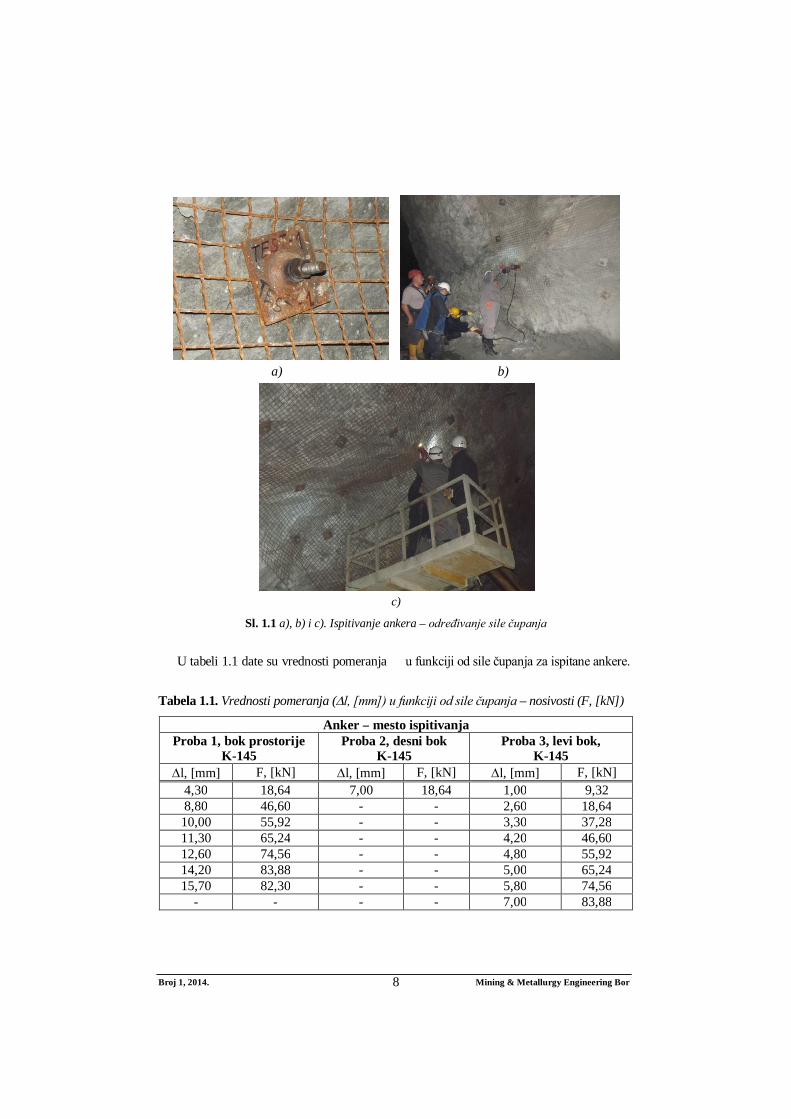
U tabeli 1.1 date su vrednosti pomeranja u funkciji od sile čupanja za ispitane ankere.
Tabela 1.1. Vrednosti pomeranja (l, [mm]) u funkciji od sile čupanja – nosivosti (F, [kN])
Anker – mesto ispitivanja Proba 1, bok prostorije
K-145 Proba 2, desni bok
K-145 Proba 3, levi bok,
K-145 l, [mm] F, [kN] l, [mm] F, [kN] l, [mm] F, [kN]
4,30 18,64 7,00 18,64 1,00 9,32 8,80 46,60 - - 2,60 18,64 10,00 55,92 - - 3,30 37,28 11,30 65,24 - - 4,20 46,60 12,60 74,56 - - 4,80 55,92 14,20 83,88 - - 5,00 65,24 15,70 82,30 - - 5,80 74,56
- - - - 7,00 83,88
Broj 1, 2014. Mining & Metallurgy Engineering Bor 9
Nastavak tabele 1.1.
Anker – mesto ispitivanja Proba 1, desni bok
K-123 Proba 2, desni bok
K-123 Proba 3, strop prostorije
K-123 l, [mm] F, [kN] l, [mm] F, [kN] l, [mm] F, [kN]
7,10 18,64 3,00 18,64 2,00 18,64 7,60 27,96 3,20 27,96 6,10 27,96 8,20 37,28 4,00 37,28 7,50 37,28 8,40 46,60 5,90 46,60 10,50 46,60 8,50 55,92 6,00 55,92 11,00 55,92 9,20 65,24 7,10 65,24 13,00 60,58 13,30 74,56 7,40 74,56 14,00 65,24 15,90 83,88 8,00 83,88 14,80 74,56 17,70 93,20 9,80 93,20 15,00 83,88 18,60 102,52 9,90 102,52 15,10 93,20 19,40 111,84 10,00 111,84 16,00 102,52 23,50 121,16 12,90 121,16 16,30 111,84 26,00 130,48 13,00 130,48 16,50 121,16 27,00 135,14 13,50 139,80 25,50 130,48
- - 16,70 149,12 - - - - 17,40 153,78 - -
U daljem tekstu su grafički prikazi rezultata merenja sile čupanja.
Sl. 1.2. Rezultati merenja sile čupanja prvog ankera prve serije probe
Broj 1, 2014. Mining & Metallurgy Engineering Bor 10
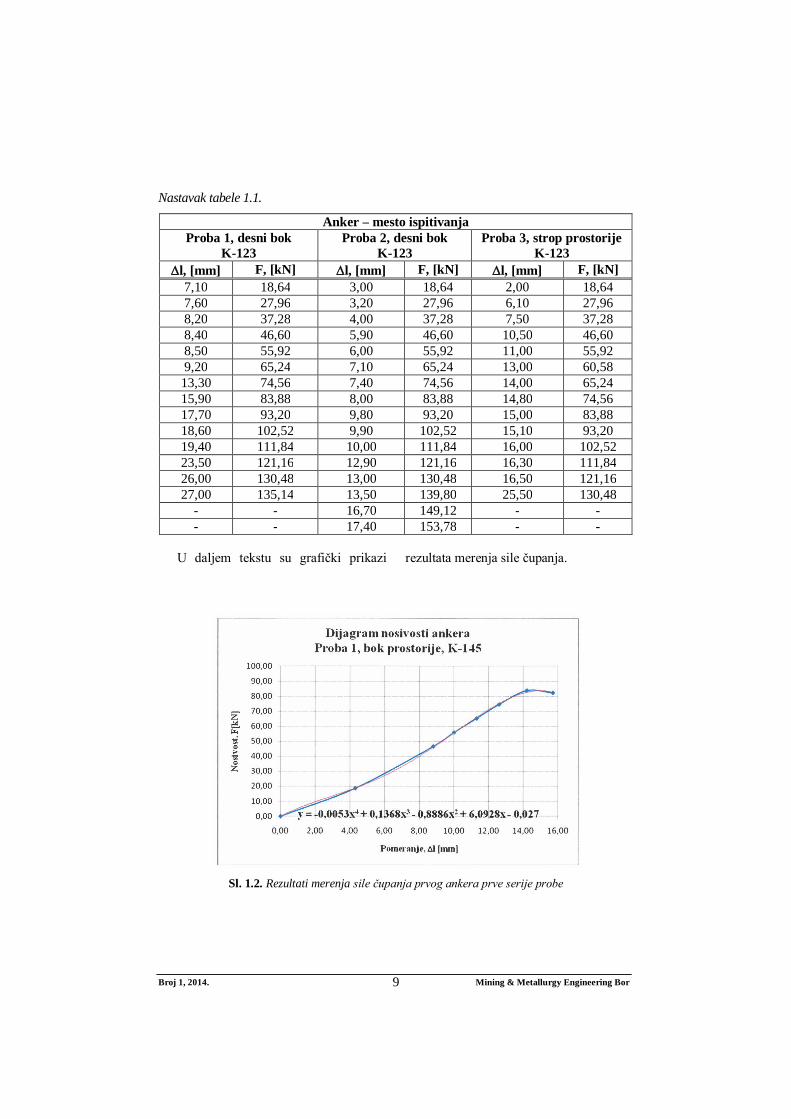
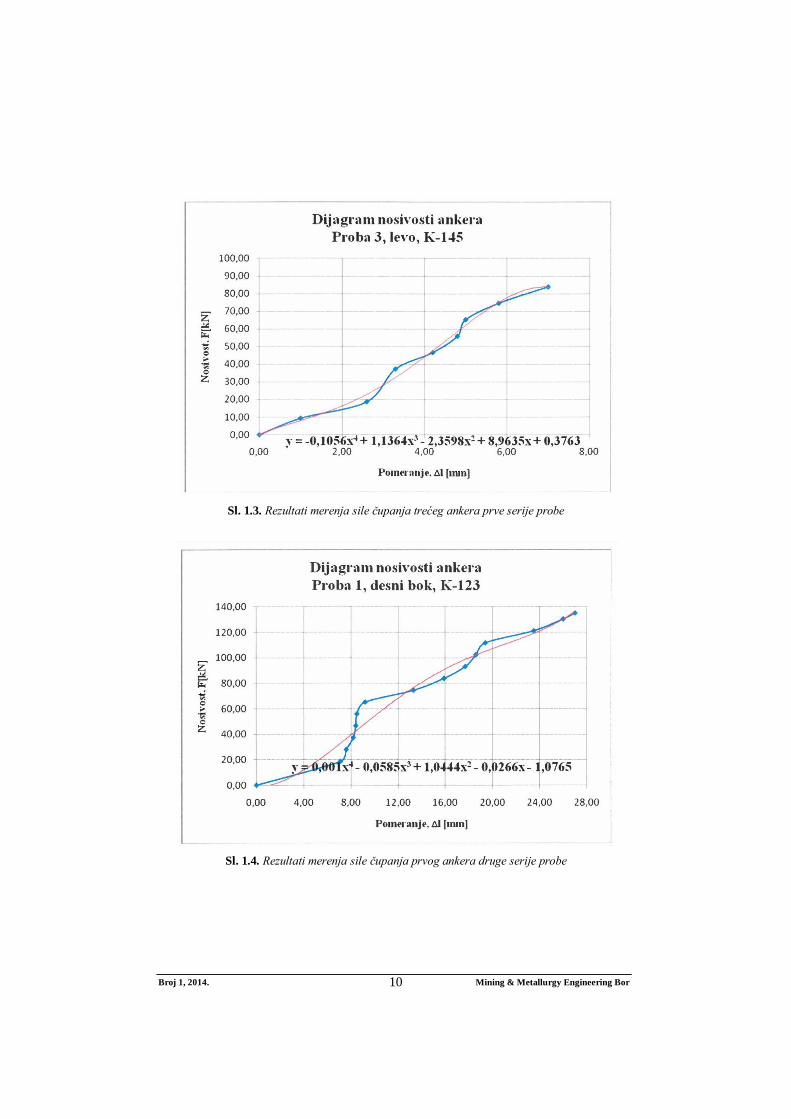
Sl. 1.3. Rezultati merenja sile čupanja trećeg ankera prve serije probe
Sl. 1.4. Rezultati merenja sile čupanja prvog ankera druge serije probe
Broj 1, 2014. Mining & Metallurgy Engineering Bor 11
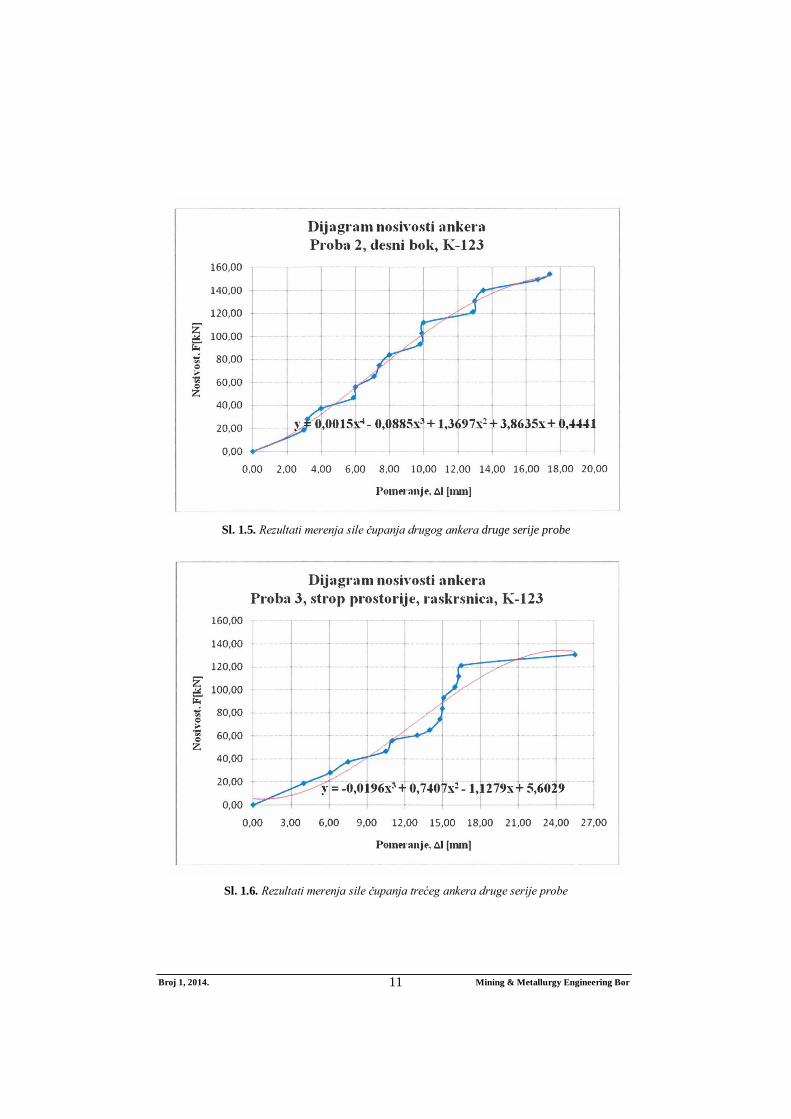
Sl. 1.5. Rezultati merenja sile čupanja drugog ankera druge serije probe
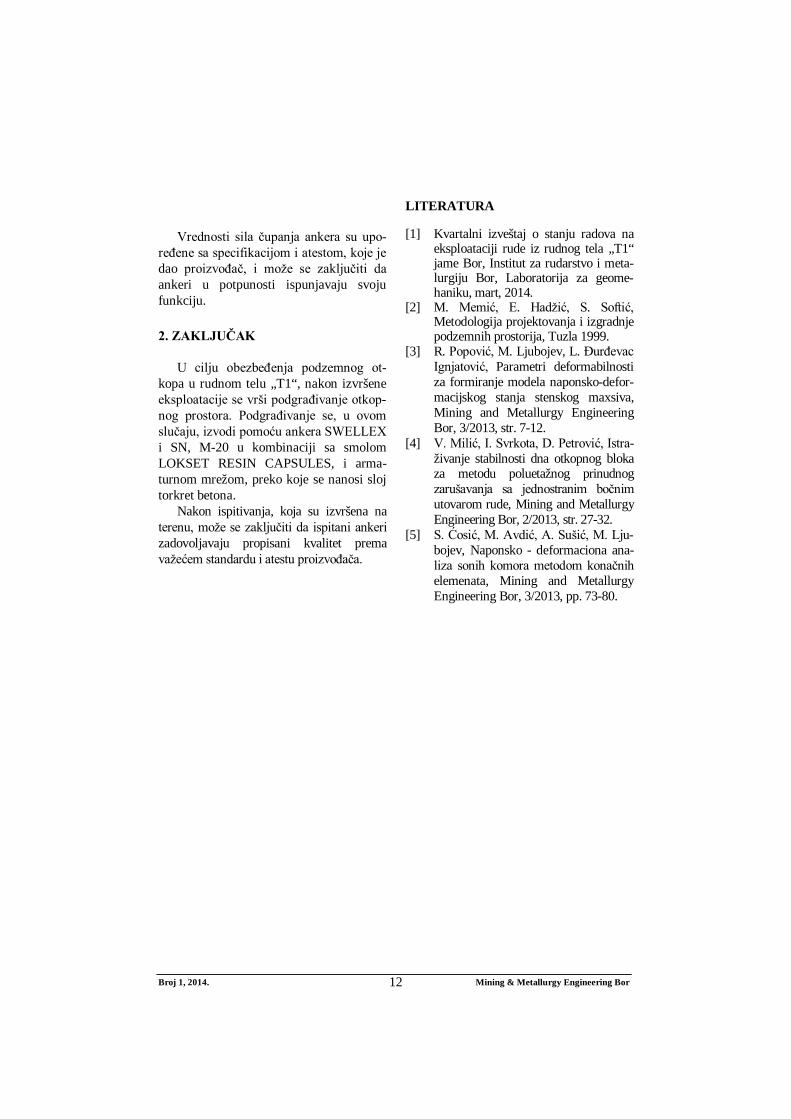
Sl. 1.6. Rezultati merenja sile čupanja trećeg ankera druge serije probe
Broj 1, 2014. Mining & Metallurgy Engineering Bor 12
Vrednosti sila čupanja ankera su upo-
ređene sa specifikacijom i atestom, koje je dao proizvođač, i može se zaključiti da ankeri u potpunosti ispunjavaju svoju funkciju.
2. ZAKLJUČAK
U cilju obezbeđenja podzemnog ot-kopa u rudnom telu „T1“, nakon izvršene eksploatacije se vrši podgrađivanje otkop-nog prostora. Podgrađivanje se, u ovom slučaju, izvodi pomoću ankera SWELLEX i SN, M-20 u kombinaciji sa smolom LOKSET RESIN CAPSULES, i arma-turnom mrežom, preko koje se nanosi sloj torkret betona.
Nakon ispitivanja, koja su izvršena na terenu, može se zaključiti da ispitani ankeri zadovoljavaju propisani kvalitet prema važećem standardu i atestu proizvođača.
LITERATURA
[1] Kvartalni izveštaj o stanju radova na eksploataciji rude iz rudnog tela „T1“ jame Bor, Institut za rudarstvo i meta-lurgiju Bor, Laboratorija za geome-haniku, mart, 2014.
[2] M. Memić, E. Hadžić, S. Softić, Metodologija projektovanja i izgradnje podzemnih prostorija, Tuzla 1999.
[3] R. Popović, M. Ljubojev, L. Đurđevac Ignjatović, Parametri deformabilnosti za formiranje modela naponsko-defor-macijskog stanja stenskog maxsiva, Mining and Metallurgy Engineering Bor, 3/2013, str. 7-12.
[4] V. Milić, I. Svrkota, D. Petrović, Istra-živanje stabilnosti dna otkopnog bloka za metodu poluetažnog prinudnog zarušavanja sa jednostranim bočnim utovarom rude, Mining and Metallurgy Engineering Bor, 2/2013, str. 27-32.
[5] S. Ćosić, M. Avdić, A. Sušić, M. Lju-bojev, Naponsko - deformaciona ana-liza sonih komora metodom konačnih elemenata, Mining and Metallurgy Engineering Bor, 3/2013, pp. 73-80.
No. 1, 2014 Mining & Metallurgy Engineering Bor 13
MINING AND METALLURGY INSTITUTE BOR ISSN: 2334-8836 UDK: 622
UDK: 622.271:66.061:681.5(045)=20 DOI:10.5937/MMEB1401013V
Zoran Vaduvesković*, Nenad Vušović**, Daniel Kržanović*
ANALYSIS THE POSIBILITY OF IMPROVING THE ECONOMIC INDICATORS OF EXPLOITATION THE DEPOSIT CEMENTACIJA
KRAKU BUGARESKU - ORE FIELD CEROVO***
Abstract
Cementacija - Kraku Bugaresku is a complex of ore bodies in the southeastern part of the deposit Cerovo. It contains a substantial portion of ore with high content of oxides regarding to the total copper in the ore, and with the existing processing technology in the current period, the modest results in metal recovery were achieved. This work, through an analysis, gives a discussion of possible combination of processing using the conventional flotation processing with pyrometallurgical treatment and heap leaching with the hydrometallurgical extraction of metal by SX -EW, in terms of the economic viability of such method. This work firstly made a comparison of optimization results of potential open pits in the ore deposit (Whittle Fx), in both cases for the same input techno-economic data. The obtained potential open pits in the optimization process (pit shells) for Revenue Factor 1 (i.e. the selling price of Cu cath-ode ton of 5,000 $) are differ from each other by about 8 million tons of ore in favor of the combined processing method and the amount of Cu in the ore to 16,502.44 t, while had grade in the case of meth-od combination is higher for 3.27 %. Discounted cash flow is higher by as much as 61.94 %, which expressed in monetary units is 47,905,712 $.
Keywords: heap leaching, SX -EW , optimization of open pits, discounted cash flow
* Mining and Metallurgy Institute Bor ** University of Belgrade,Technical Faculty Bor *** This work is within the Projects of technological development TR33038 “Improving Technology of
Exploitation and Processing of Copper Ore with Monitoring the Living and Working Environment in the RTB Bor Group” and TR34004 “The New Production Line for Copper Production by Solvent Ex-traction of Mine Water”, funded by the Ministry of Education, Science and Technological Deve-lopment of the Republic of Serbia.
INTRODUCTION
The ore field Kraku Bugaresku (KB) - Cementacija is part of a complex of ore de-posits at the site Cerovo Mali Krivelj, which is different from the rest of the deposit by the way of origin and type of mineralization. It is a cementation zone of secondary en-richment, and a portion of mineralization belongs to the oxide mineralization (about 40% of total geological reserves). It consists of the ore bodies Cementacija 1, 2, 3 and 4,
out of which Cementacija 3 and 4 are distin-guished by content of oxide ore to total re-serves. According to the copper content, the complex belongs to the low-grade deposits whose economics of exploitation is very sensitive to some parameters such metal recovery in the process of enrichment, ex-ploitation costs in technological chain from mining to metallurgical treatment, and even the sequence of mining the ore bodies (Push backs) within the cementation zone.
No. 1, 2014 Mining & Metallurgy Engineering Bor 14
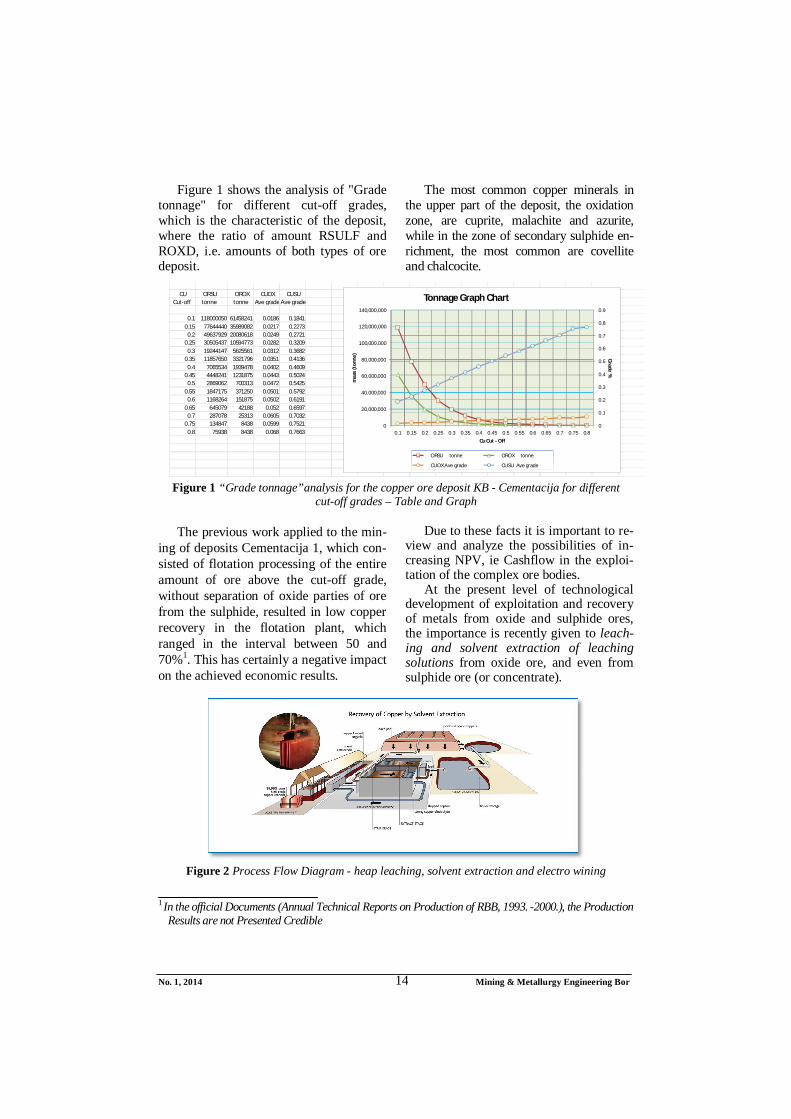
Figure 1 shows the analysis of "Grade tonnage" for different cut-off grades, which is the characteristic of the deposit, where the ratio of amount RSULF and ROXD, i.e. amounts of both types of ore deposit.
The most common copper minerals in the upper part of the deposit, the oxidation zone, are cuprite, malachite and azurite, while in the zone of secondary sulphide en-richment, the most common are covellite and chalcocite.
Figure 1 “Grade tonnage”analysis for the copper ore deposit KB - Cementacija for different
cut-off grades – Table and Graph
The previous work applied to the min-ing of deposits Cementacija 1, which con-sisted of flotation processing of the entire amount of ore above the cut-off grade, without separation of oxide parties of ore from the sulphide, resulted in low copper recovery in the flotation plant, which ranged in the interval between 50 and 70%1. This has certainly a negative impact on the achieved economic results.
Due to these facts it is important to re-view and analyze the possibilities of in-creasing NPV, ie Cashflow in the exploi-tation of the complex ore bodies.
At the present level of technological development of exploitation and recovery of metals from oxide and sulphide ores, the importance is recently given to leach-ing and solvent extraction of leaching solutions from oxide ore, and even from sulphide ore (or concentrate).
Figure 2 Process Flow Diagram - heap leaching, solvent extraction and electro wining
1 In the official Documents (Annual Technical Reports on Production of RBB, 1993. -2000.), the Production
Results are not Presented Credible
CU ORSU OROX CUOX CUSU Cut-off tonne tonne Ave grade Ave grade
0.1 118000050 61458241 0.0186 0.18410.15 77644440 35989082 0.0217 0.2273
0.2 49637929 20080618 0.0249 0.27210.25 30505437 10594773 0.0282 0.3209
0.3 19244147 5625561 0.0312 0.36820.35 11857650 3321796 0.0351 0.4136
0.4 7065534 1939478 0.0402 0.46090.45 4448241 1231875 0.0443 0.5024
0.5 2869062 700313 0.0472 0.54250.55 1847175 371250 0.0501 0.5792
0.6 1168264 151875 0.0502 0.61910.65 645079 42188 0.052 0.6597
0.7 287078 25313 0.0605 0.70320.75 134847 8438 0.0599 0.7521
0.8 75938 8438 0.068 0.76630
0.1
0.2
0.3
0.4
0.5
0.6
0.7
0.8
0.9
0
20,000,000
40,000,000
60,000,000
80,000,000
100,000,000
120,000,000
140,000,000
0.1 0.15 0.2 0.25 0.3 0.35 0.4 0.45 0.5 0.55 0.6 0.65 0.7 0.75 0.8
Grade %
mas
s (t
onne
)
Cu Cut - Off
Tonnage Graph Chart
ORSU tonne OROX tonne
CUOX Ave grade CUSU Ave grade
No. 1, 2014 Mining & Metallurgy Engineering Bor 15
ANALYSIS IN SOFTWARE FOR STRATEGIC PLANNING WHITTLE FX
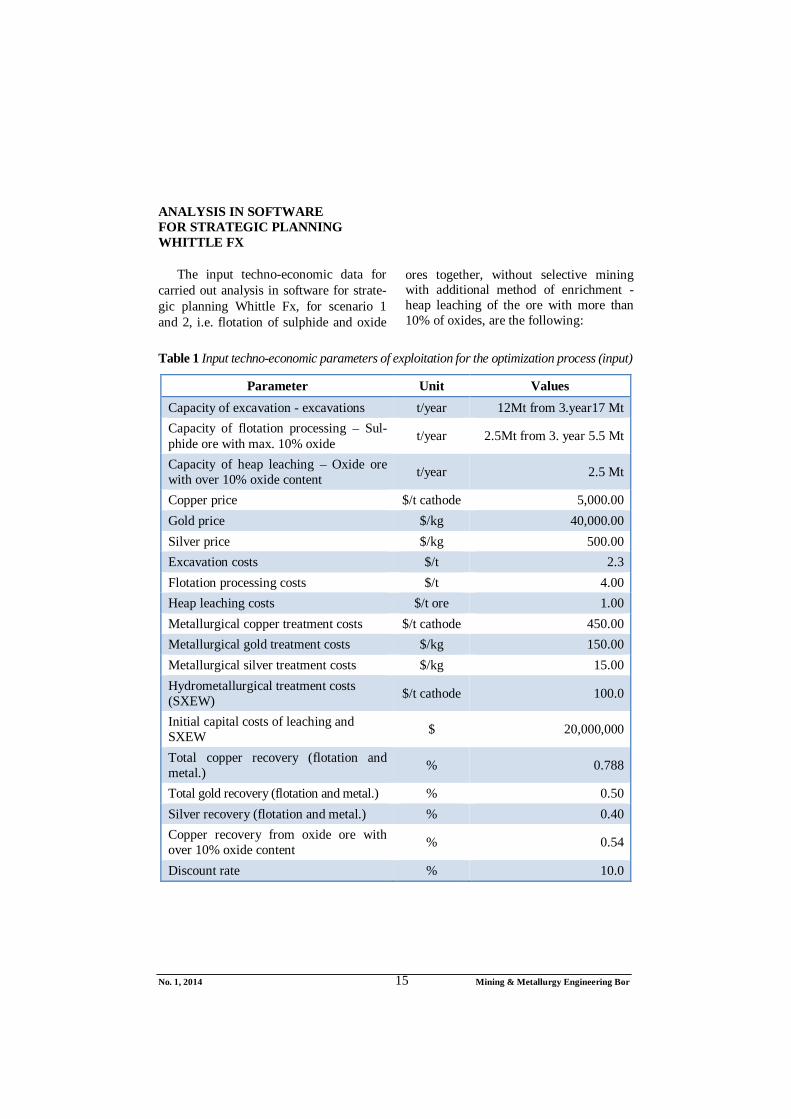
The input techno-economic data for carried out analysis in software for strate-gic planning Whittle Fx, for scenario 1 and 2, i.e. flotation of sulphide and oxide
ores together, without selective mining with additional method of enrichment - heap leaching of the ore with more than 10% of oxides, are the following:
Table 1 Input techno-economic parameters of exploitation for the optimization process (input)
Parameter Unit Values Capacity of excavation - excavations t/year 12Mt from 3.year17 Mt Capacity of flotation processing – Sul-phide ore with max. 10% oxide t/year 2.5Mt from 3. year 5.5 Mt
Capacity of heap leaching – Oxide ore with over 10% oxide content t/year 2.5 Mt
Copper price $/t cathode 5,000.00 Gold price $/kg 40,000.00 Silver price $/kg 500.00 Excavation costs $/t 2.3 Flotation processing costs $/t 4.00 Heap leaching costs $/t ore 1.00 Metallurgical copper treatment costs $/t cathode 450.00 Metallurgical gold treatment costs $/kg 150.00 Metallurgical silver treatment costs $/kg 15.00 Hydrometallurgical treatment costs (SXEW) $/t cathode 100.0
Initial capital costs of leaching and SXEW $ 20,000,000
Total copper recovery (flotation and metal.) % 0.788
Total gold recovery (flotation and metal.) % 0.50 Silver recovery (flotation and metal.) % 0.40 Copper recovery from oxide ore with over 10% oxide content % 0.54
Discount rate % 10.0
No. 1, 2014 Mining & Metallurgy Engineering Bor 16
Analysis2 was carried out for 3 scenar-ios, as follows:
1. Scenario 1 – processing method marked as "MILL", i.e. flotation ROXD and RSULF, i.e. two types of ore;
2. Scenario 2 – method "MILL" for ore with > 10% oxide, and method "LEAC" for ore with content > 10% oxide, wherein the leaching capacity is not limited;
3. Scenario 3 – same as Scenario 2, but with limited capacity of leach-ing to 2,500,000 t, and with the use of two types of stockpiles for ore less than 10% oxide ore and over 10% oxide (SP1 and SP2). Stock-piles were used as a "buffer" for addition of design capacity both in the flotation and leaching.
In further analysis for Scenarios 1 and 2, the results of optimization are presented in the tables type Pit Pit By Garph, i.e. the open pits from optimization with calcula-
ted cash flow and discounted cash flow for each of a set of nested open pit mines. Economic indicators are calculated for three possible cases – the Best Case, Worst Case, and Specific Case, i.e. for the mining bench by bench, and using pushbacks in mining. A key for the evalu-ation and selection of the optimal pit on the criterion of the optimal profit is dis-counted cash flow best case. This means that the selected pit (Final pit) is excavat-ed in stages (Push backs).
In all three cases, a mining schedule is designed and calculated for mine life of selected open pit per the above criteria with the appropriate graphical views. Al-so, the calculated amounts per type of ore (as Rock Type) are presented in tables, with lower and higher oxide contents, or the realized capacities for the method "MILL" and method "LEAC" in Scenario 3 – with additional calculated amounts of ore that go to the stockpiles and from there into the process.
2 Beside the above given input data, the block model of deposit, so called “mod” file, is exported into software Whittle. In designing the mentioned “mod” file in the basic software, in this case Gemcom, the terrain topography is used, i.e. current mining lay out. In the case of this analysis, the mining lay out is at 10.08.2001, before reactivation of open pit, because the analysis was not carried out as a part of the Study or Project, but with the aim to point out the possibilities for increasing the economic ef-fects of production, also initiating the important explorations aimed to extraction of Cu by hydromet-allurgical method.
No. 1, 2014 Mining & Metallurgy Engineering Bor 17
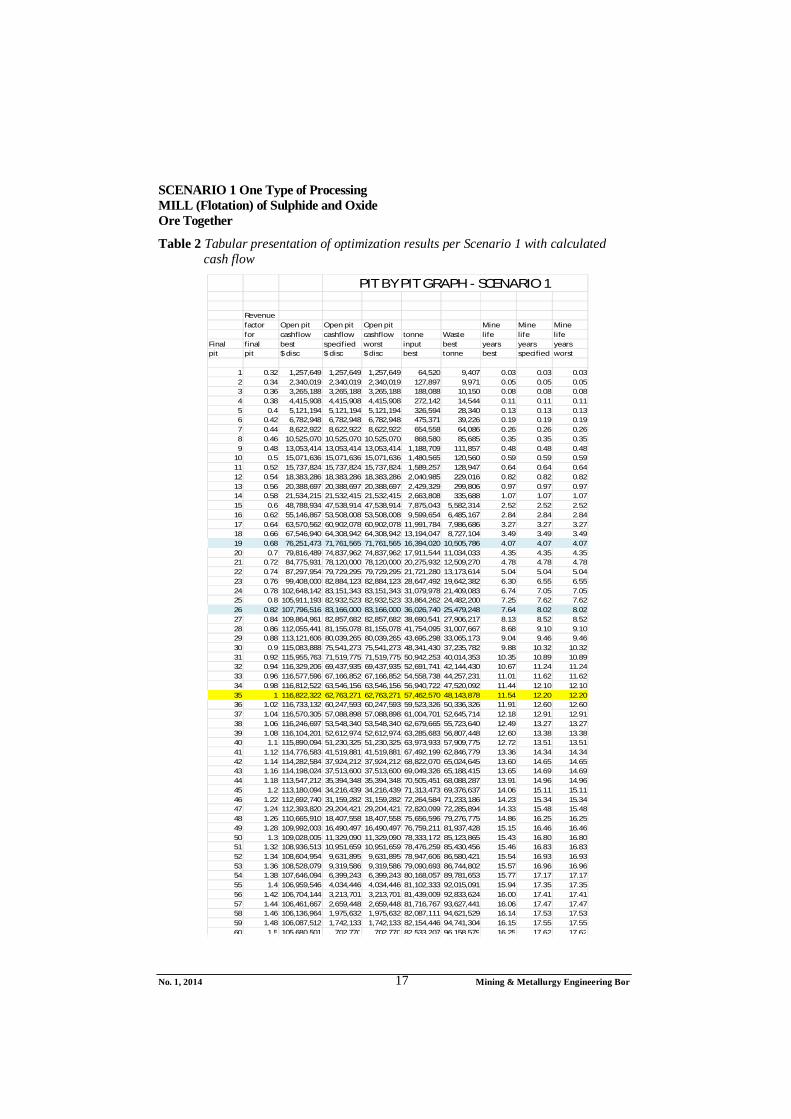
SCENARIO 1 One Type of Processing MILL (Flotation) of Sulphide and Oxide Ore Together
Table 2 Tabular presentation of optimization results per Scenario 1 with calculated cash flow
Revenue factor Open pit Open pit Open pit Mine Mine Mine for cashflow cashflow cashflow tonne Waste life life life Final final best specified worst input best years years years pit pit $ disc $ disc $ disc best tonne best specified worst
1 0.32 1,257,649 1,257,649 1,257,649 64,520 9,407 0.03 0.03 0.032 0.34 2,340,019 2,340,019 2,340,019 127,897 9,971 0.05 0.05 0.053 0.36 3,265,188 3,265,188 3,265,188 188,088 10,150 0.08 0.08 0.084 0.38 4,415,908 4,415,908 4,415,908 272,142 14,544 0.11 0.11 0.115 0.4 5,121,194 5,121,194 5,121,194 326,594 28,340 0.13 0.13 0.136 0.42 6,782,948 6,782,948 6,782,948 475,371 39,226 0.19 0.19 0.197 0.44 8,622,922 8,622,922 8,622,922 654,558 64,086 0.26 0.26 0.268 0.46 10,525,070 10,525,070 10,525,070 868,580 85,685 0.35 0.35 0.359 0.48 13,053,414 13,053,414 13,053,414 1,188,709 111,857 0.48 0.48 0.48
10 0.5 15,071,636 15,071,636 15,071,636 1,480,565 120,560 0.59 0.59 0.5911 0.52 15,737,824 15,737,824 15,737,824 1,589,257 128,947 0.64 0.64 0.6412 0.54 18,383,286 18,383,286 18,383,286 2,040,985 229,016 0.82 0.82 0.8213 0.56 20,388,697 20,388,697 20,388,697 2,429,329 299,806 0.97 0.97 0.9714 0.58 21,534,215 21,532,415 21,532,415 2,663,808 335,688 1.07 1.07 1.0715 0.6 48,788,934 47,538,914 47,538,914 7,875,043 5,582,314 2.52 2.52 2.5216 0.62 55,146,867 53,508,008 53,508,008 9,599,654 6,485,167 2.84 2.84 2.8417 0.64 63,570,562 60,902,078 60,902,078 11,991,784 7,986,686 3.27 3.27 3.2718 0.66 67,546,940 64,308,942 64,308,942 13,194,047 8,727,104 3.49 3.49 3.4919 0.68 76,251,473 71,761,565 71,761,565 16,394,020 10,505,786 4.07 4.07 4.0720 0.7 79,816,489 74,837,962 74,837,962 17,911,544 11,034,033 4.35 4.35 4.3521 0.72 84,775,931 78,120,000 78,120,000 20,275,932 12,509,270 4.78 4.78 4.7822 0.74 87,297,954 79,729,295 79,729,295 21,721,280 13,173,614 5.04 5.04 5.0423 0.76 99,408,000 82,884,123 82,884,123 28,647,492 19,642,382 6.30 6.55 6.5524 0.78 102,648,142 83,151,343 83,151,343 31,079,978 21,409,083 6.74 7.05 7.0525 0.8 105,911,193 82,932,523 82,932,523 33,864,262 24,482,200 7.25 7.62 7.6226 0.82 107,796,516 83,166,000 83,166,000 36,026,740 25,479,248 7.64 8.02 8.0227 0.84 109,864,961 82,857,682 82,857,682 38,690,541 27,906,217 8.13 8.52 8.5228 0.86 112,055,441 81,155,078 81,155,078 41,754,095 31,007,667 8.68 9.10 9.1029 0.88 113,121,606 80,039,265 80,039,265 43,695,298 33,065,173 9.04 9.46 9.4630 0.9 115,083,888 75,541,273 75,541,273 48,341,430 37,235,782 9.88 10.32 10.3231 0.92 115,955,763 71,519,775 71,519,775 50,942,253 40,014,353 10.35 10.89 10.8932 0.94 116,329,206 69,437,935 69,437,935 52,691,741 42,144,430 10.67 11.24 11.2433 0.96 116,577,596 67,166,852 67,166,852 54,558,738 44,257,231 11.01 11.62 11.6234 0.98 116,812,522 63,546,156 63,546,156 56,940,722 47,520,092 11.44 12.10 12.1035 1 116,822,322 62,763,271 62,763,271 57,462,570 48,143,878 11.54 12.20 12.2036 1.02 116,733,132 60,247,593 60,247,593 59,523,326 50,336,326 11.91 12.60 12.6037 1.04 116,570,305 57,088,898 57,088,898 61,004,701 52,645,714 12.18 12.91 12.9138 1.06 116,246,697 53,548,340 53,548,340 62,679,665 55,723,640 12.49 13.27 13.2739 1.08 116,104,201 52,612,974 52,612,974 63,285,683 56,807,448 12.60 13.38 13.3840 1.1 115,890,094 51,230,325 51,230,325 63,973,933 57,909,775 12.72 13.51 13.5141 1.12 114,776,583 41,519,881 41,519,881 67,492,199 62,846,779 13.36 14.34 14.3442 1.14 114,282,584 37,924,212 37,924,212 68,822,070 65,024,645 13.60 14.65 14.6543 1.16 114,198,024 37,513,600 37,513,600 69,049,326 65,188,415 13.65 14.69 14.6944 1.18 113,547,212 35,394,348 35,394,348 70,505,451 68,088,287 13.91 14.96 14.9645 1.2 113,180,094 34,216,439 34,216,439 71,313,473 69,376,637 14.06 15.11 15.1146 1.22 112,692,740 31,159,282 31,159,282 72,264,584 71,233,186 14.23 15.34 15.3447 1.24 112,393,820 29,204,421 29,204,421 72,820,099 72,285,894 14.33 15.48 15.4848 1.26 110,665,910 18,407,558 18,407,558 75,656,596 79,276,775 14.86 16.25 16.2549 1.28 109,992,003 16,490,497 16,490,497 76,759,211 81,937,428 15.15 16.46 16.4650 1.3 109,028,005 11,329,090 11,329,090 78,333,172 85,123,865 15.43 16.80 16.8051 1.32 108,936,513 10,951,659 10,951,659 78,476,259 85,430,456 15.46 16.83 16.8352 1.34 108,604,954 9,631,895 9,631,895 78,947,606 86,580,421 15.54 16.93 16.9353 1.36 108,528,079 9,319,586 9,319,586 79,090,693 86,744,802 15.57 16.96 16.9654 1.38 107,646,094 6,399,243 6,399,243 80,168,057 89,781,653 15.77 17.17 17.1755 1.4 106,959,546 4,034,446 4,034,446 81,102,333 92,015,091 15.94 17.35 17.3556 1.42 106,704,144 3,213,701 3,213,701 81,439,009 92,833,624 16.00 17.41 17.4157 1.44 106,461,667 2,659,448 2,659,448 81,716,767 93,627,441 16.06 17.47 17.4758 1.46 106,136,964 1,975,632 1,975,632 82,087,111 94,621,529 16.14 17.53 17.5359 1.48 106,087,512 1,742,133 1,742,133 82,154,446 94,741,304 16.15 17.55 17.5560 1.5 105,680,501 702,770 702,770 82,533,207 96,158,579 16.25 17.62 17.62
PIT BY PIT GRAPH - SCENARIO 1
No. 1, 2014 Mining & Metallurgy Engineering Bor 18
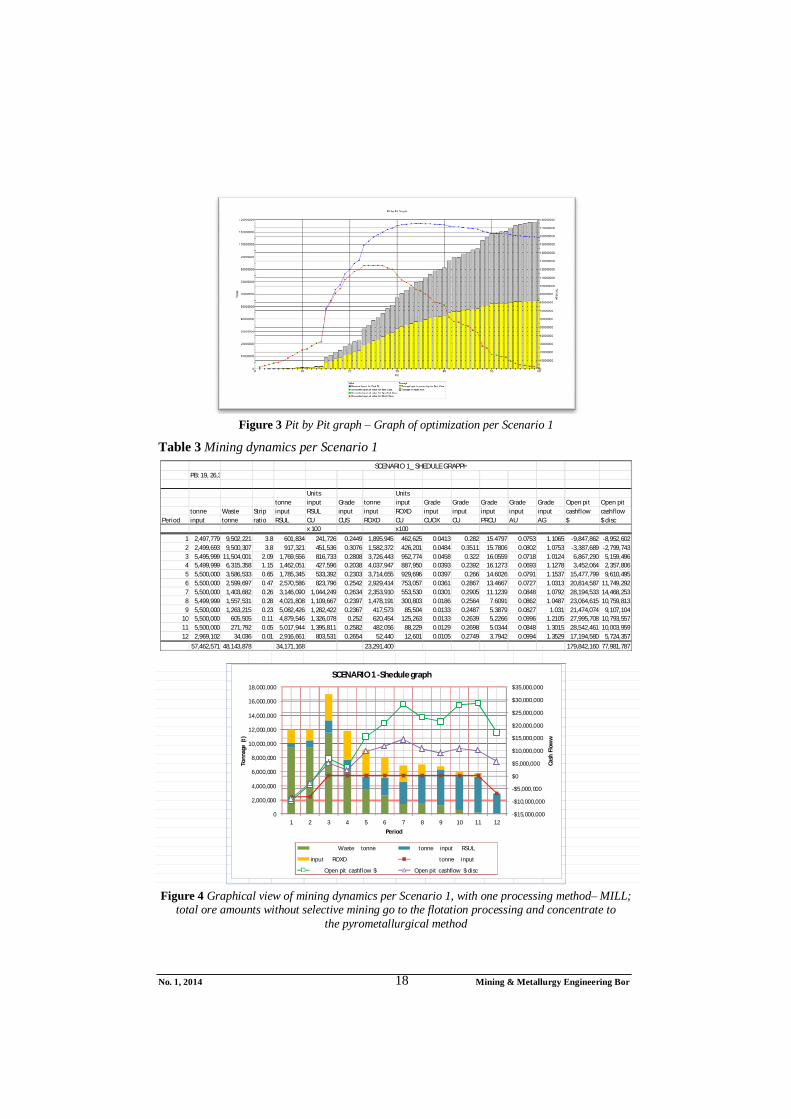
Figure 3 Pit by Pit graph – Graph of optimization per Scenario 1
Table 3 Mining dynamics per Scenario 1
Figure 4 Graphical view of mining dynamics per Scenario 1, with one processing method– MILL;
total ore amounts without selective mining go to the flotation processing and concentrate to the pyrometallurgical method
PB: 19, 26,35 Units Units tonne input Grade tonne input Grade Grade Grade Grade Grade Open pit Open pit tonne Waste Strip input RSUL input input ROXD input input input input input cashflow cashflow Period input tonne ratio RSUL CU CUS ROXD CU CUOX CU PRCU AU AG $ $ disc x 100 x100
1 2,497,779 9,502,221 3.8 601,834 241,726 0.2449 1,895,945 462,625 0.0413 0.282 15.4797 0.0753 1.1065 -9,847,862 -8,952,6022 2,499,693 9,500,307 3.8 917,321 451,536 0.3076 1,582,372 426,201 0.0484 0.3511 15.7806 0.0802 1.0753 -3,387,689 -2,799,7433 5,495,999 11,504,001 2.09 1,769,556 816,733 0.2808 3,726,443 952,774 0.0458 0.322 16.0559 0.0718 1.0124 6,867,290 5,159,4964 5,499,999 6,315,358 1.15 1,462,051 427,596 0.2038 4,037,947 887,950 0.0393 0.2392 16.1273 0.0693 1.1278 3,452,064 2,357,8065 5,500,000 3,586,533 0.65 1,785,345 533,392 0.2303 3,714,655 929,696 0.0397 0.266 14.6026 0.0791 1.1537 15,477,799 9,610,4956 5,500,000 2,599,697 0.47 2,570,586 823,796 0.2542 2,929,414 753,057 0.0361 0.2867 13.4667 0.0727 1.0313 20,814,587 11,749,2927 5,500,000 1,403,682 0.26 3,146,090 1,044,249 0.2634 2,353,910 553,530 0.0301 0.2905 11.1239 0.0848 1.0792 28,194,533 14,468,2538 5,499,999 1,557,531 0.28 4,021,808 1,109,667 0.2397 1,478,191 300,803 0.0186 0.2564 7.6091 0.0862 1.0487 23,064,615 10,759,8139 5,500,000 1,263,215 0.23 5,082,426 1,282,422 0.2367 417,573 85,504 0.0133 0.2487 5.3879 0.0827 1.031 21,474,074 9,107,104
10 5,500,000 605,505 0.11 4,879,546 1,326,078 0.252 620,454 125,263 0.0133 0.2639 5.2266 0.0996 1.2105 27,995,708 10,793,55711 5,500,000 271,792 0.05 5,017,944 1,395,811 0.2582 482,056 88,229 0.0129 0.2698 5.0344 0.0848 1.3015 28,542,461 10,003,95912 2,969,102 34,036 0.01 2,916,661 803,531 0.2654 52,440 12,601 0.0105 0.2749 3.7942 0.0994 1.3529 17,194,580 5,724,357
57,462,571 48,143,878 34,171,168 23,291,400 179,842,160 77,981,787
SCENARIO 1_ SHEDULE GRAPPH
-$15,000,000
-$10,000,000
-$5,000,000
$0
$5,000,000
$10,000,000
$15,000,000
$20,000,000
$25,000,000
$30,000,000
$35,000,000
0
2,000,000
4,000,000
6,000,000
8,000,000
10,000,000
12,000,000
14,000,000
16,000,000
18,000,000
1 2 3 4 5 6 7 8 9 10 11 12
Cash
Flo
ww
Tonn
age
(t)
Period
SCENARIO 1 -Shedule graph
Waste tonne tonne input RSUL
input ROXD tonne input
Open pit cashflow $ Open pit cashflow $ disc
No. 1, 2014 Mining & Metallurgy Engineering Bor 19
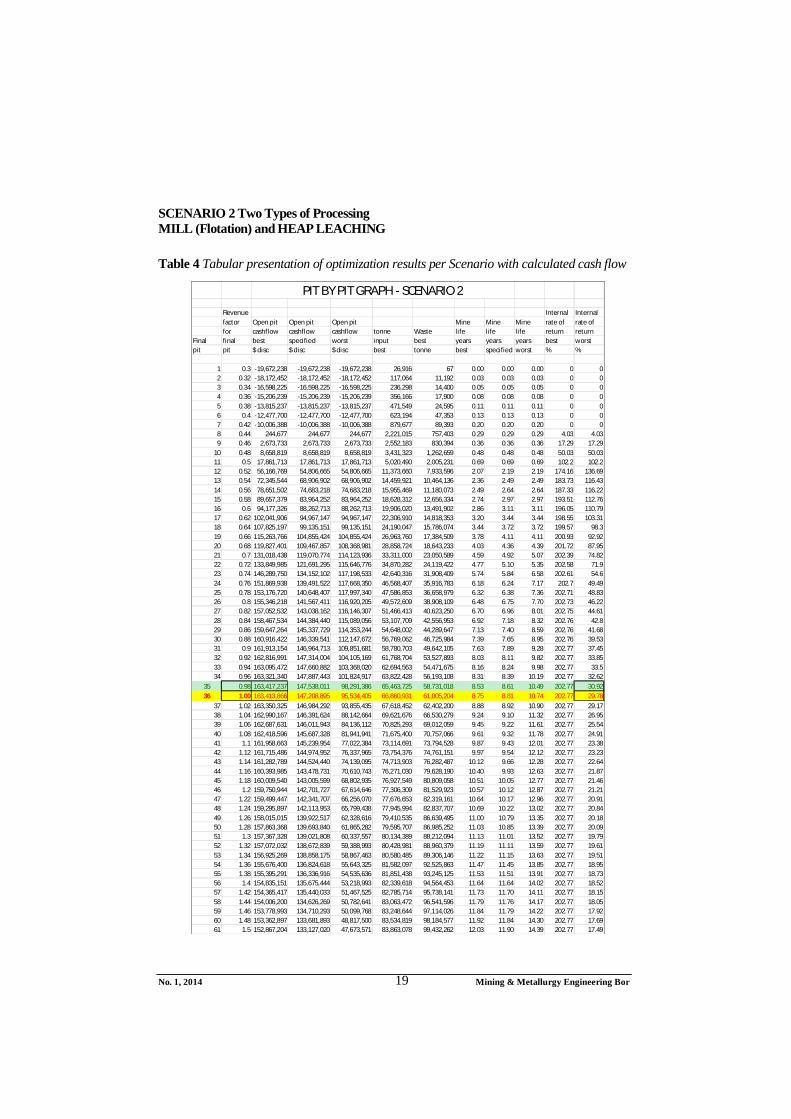
SCENARIO 2 Two Types of Processing MILL (Flotation) and HEAP LEACHING
Table 4 Tabular presentation of optimization results per Scenario with calculated cash flow
Revenue Internal Internal factor Open pit Open pit Open pit Mine Mine Mine rate of rate of for cashflow cashflow cashflow tonne Waste life life life return return Final final best specified worst input best years years years best worst pit pit $ disc $ disc $ disc best tonne best specified worst % %
1 0.3 -19,672,238 -19,672,238 -19,672,238 26,916 67 0.00 0.00 0.00 0 02 0.32 -18,172,452 -18,172,452 -18,172,452 117,064 11,192 0.03 0.03 0.03 0 03 0.34 -16,598,225 -16,598,225 -16,598,225 236,298 14,400 0.05 0.05 0.05 0 04 0.36 -15,206,239 -15,206,239 -15,206,239 356,166 17,900 0.08 0.08 0.08 0 05 0.38 -13,815,237 -13,815,237 -13,815,237 471,549 24,595 0.11 0.11 0.11 0 06 0.4 -12,477,700 -12,477,700 -12,477,700 623,194 47,353 0.13 0.13 0.13 0 07 0.42 -10,006,388 -10,006,388 -10,006,388 879,677 89,393 0.20 0.20 0.20 0 08 0.44 244,677 244,677 244,677 2,221,015 757,403 0.29 0.29 0.29 4.03 4.039 0.46 2,673,733 2,673,733 2,673,733 2,552,183 830,394 0.36 0.36 0.36 17.29 17.29
10 0.48 8,658,819 8,658,819 8,658,819 3,431,323 1,262,659 0.48 0.48 0.48 50.03 50.0311 0.5 17,861,713 17,861,713 17,861,713 5,020,490 2,005,231 0.69 0.69 0.69 102.2 102.212 0.52 56,166,769 54,806,665 54,806,665 11,373,660 7,933,596 2.07 2.19 2.19 174.16 136.6913 0.54 72,345,544 68,906,902 68,906,902 14,459,921 10,464,136 2.36 2.49 2.49 183.73 116.4314 0.56 78,651,502 74,683,218 74,683,218 15,955,469 11,180,073 2.49 2.64 2.64 187.33 116.2215 0.58 89,657,379 83,964,252 83,964,252 18,628,312 12,656,334 2.74 2.97 2.97 193.51 112.7616 0.6 94,177,326 88,262,713 88,262,713 19,906,020 13,491,902 2.86 3.11 3.11 196.05 110.7917 0.62 102,041,906 94,967,147 94,967,147 22,306,910 14,818,353 3.20 3.44 3.44 198.55 103.3118 0.64 107,825,197 99,135,151 99,135,151 24,190,047 15,786,074 3.44 3.72 3.72 199.57 98.319 0.66 115,263,766 104,855,424 104,855,424 26,963,760 17,384,509 3.78 4.11 4.11 200.93 92.9220 0.68 119,827,401 109,467,857 108,368,981 28,858,724 18,643,233 4.03 4.36 4.39 201.72 87.9521 0.7 131,018,438 119,070,774 114,123,936 33,311,000 23,050,589 4.59 4.92 5.07 202.39 74.8222 0.72 133,849,985 121,691,295 115,646,776 34,870,282 24,119,422 4.77 5.10 5.35 202.58 71.923 0.74 146,289,750 134,152,102 117,198,533 42,640,316 31,908,409 5.74 5.84 6.58 202.61 54.624 0.76 151,869,938 139,491,522 117,668,350 46,568,407 35,916,783 6.18 6.24 7.17 202.7 49.4925 0.78 153,176,720 140,648,407 117,997,340 47,586,853 36,658,979 6.32 6.38 7.36 202.71 48.8326 0.8 155,346,218 141,567,411 116,920,205 49,572,609 38,908,109 6.48 6.75 7.70 202.73 46.2227 0.82 157,052,532 143,038,162 116,146,307 51,466,413 40,623,250 6.70 6.96 8.01 202.75 44.6128 0.84 158,467,534 144,384,440 115,089,056 53,107,709 42,556,953 6.92 7.18 8.32 202.76 42.829 0.86 159,647,264 145,337,729 114,353,244 54,648,002 44,289,647 7.13 7.40 8.59 202.76 41.6830 0.88 160,916,422 146,339,541 112,147,672 56,769,062 46,725,984 7.39 7.65 8.95 202.76 39.5331 0.9 161,913,154 146,964,713 109,851,681 58,780,703 49,642,105 7.63 7.89 9.28 202.77 37.4532 0.92 162,816,991 147,314,004 104,105,169 61,768,704 53,527,893 8.03 8.11 9.82 202.77 33.8533 0.94 163,095,472 147,660,882 103,368,020 62,694,563 54,471,675 8.16 8.24 9.98 202.77 33.534 0.96 163,321,340 147,887,443 101,824,917 63,822,428 56,193,108 8.31 8.39 10.19 202.77 32.62
35 0.98 163,417,237 147,538,011 98,291,386 65,463,725 58,731,018 8.53 8.61 10.49 202.77 30.9236 1.00 163,413,866 147,208,895 95,534,405 66,860,931 61,005,204 8.75 8.81 10.74 202.77 29.78
37 1.02 163,350,325 146,984,292 93,855,435 67,618,452 62,402,200 8.88 8.92 10.90 202.77 29.1738 1.04 162,990,167 146,391,624 88,142,664 69,621,676 66,530,279 9.24 9.10 11.32 202.77 26.9539 1.06 162,687,631 146,011,943 84,136,112 70,825,293 69,012,059 9.45 9.22 11.61 202.77 25.5440 1.08 162,418,596 145,687,328 81,941,941 71,675,400 70,757,066 9.61 9.32 11.78 202.77 24.9141 1.1 161,958,663 145,239,954 77,022,384 73,114,691 73,794,528 9.87 9.43 12.01 202.77 23.3842 1.12 161,715,486 144,974,952 76,337,965 73,754,376 74,761,151 9.97 9.54 12.12 202.77 23.2343 1.14 161,282,789 144,524,440 74,139,095 74,713,903 76,282,487 10.12 9.66 12.28 202.77 22.6444 1.16 160,393,985 143,478,731 70,610,743 76,271,030 79,628,190 10.40 9.93 12.63 202.77 21.8745 1.18 160,009,540 143,005,599 68,802,935 76,927,549 80,809,058 10.51 10.05 12.77 202.77 21.4646 1.2 159,750,944 142,701,727 67,614,646 77,306,309 81,529,923 10.57 10.12 12.87 202.77 21.2147 1.22 159,499,447 142,341,707 66,256,070 77,676,653 82,319,161 10.64 10.17 12.96 202.77 20.9148 1.24 159,295,897 142,113,953 65,799,438 77,945,994 82,837,707 10.69 10.22 13.02 202.77 20.8449 1.26 158,015,015 139,922,517 62,328,616 79,410,535 86,639,495 11.00 10.79 13.35 202.77 20.1850 1.28 157,863,368 139,693,840 61,865,282 79,595,707 86,985,252 11.03 10.85 13.39 202.77 20.0951 1.3 157,367,328 139,021,808 60,337,557 80,134,389 88,212,094 11.13 11.01 13.52 202.77 19.7952 1.32 157,072,032 138,672,839 59,388,993 80,428,981 88,960,379 11.19 11.11 13.59 202.77 19.6153 1.34 156,925,269 138,858,175 58,867,463 80,580,485 89,306,146 11.22 11.15 13.63 202.77 19.5154 1.36 155,676,400 136,824,618 55,643,325 81,582,097 92,525,863 11.47 11.45 13.85 202.77 18.9555 1.38 155,395,291 136,336,916 54,535,636 81,851,438 93,245,125 11.53 11.51 13.91 202.77 18.7356 1.4 154,835,151 135,675,444 53,218,993 82,339,618 94,564,453 11.64 11.64 14.02 202.77 18.5257 1.42 154,365,417 135,440,033 51,467,525 82,785,714 95,738,141 11.73 11.70 14.11 202.77 18.1558 1.44 154,006,200 134,626,269 50,782,641 83,063,472 96,541,596 11.79 11.76 14.17 202.77 18.0559 1.46 153,778,993 134,710,293 50,099,768 83,248,644 97,114,026 11.84 11.79 14.22 202.77 17.9260 1.48 153,362,897 133,681,893 48,817,500 83,534,819 98,184,577 11.92 11.84 14.30 202.77 17.6961 1.5 152,867,204 133,127,020 47,673,571 83,863,078 99,432,262 12.03 11.90 14.39 202.77 17.49
PIT BY PIT GRAPH - SCENARIO 2
No. 1, 2014 Mining & Metallurgy Engineering Bor 20
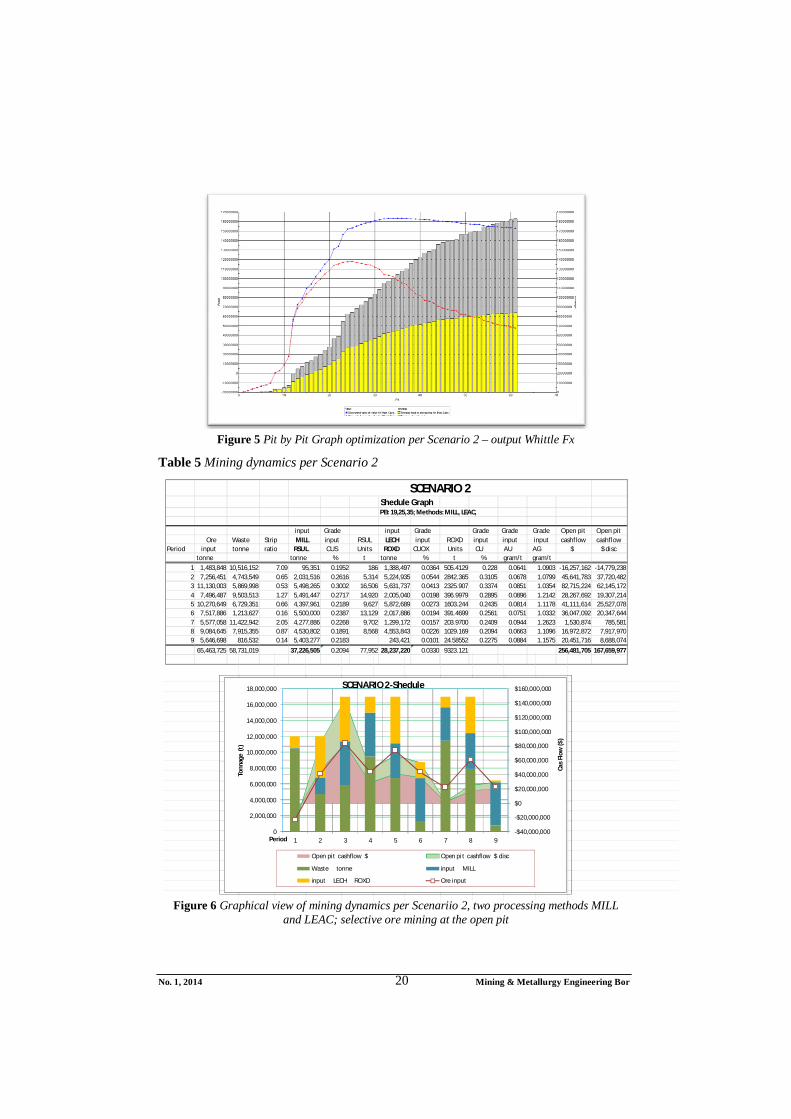
Figure 5 Pit by Pit Graph optimization per Scenario 2 – output Whittle Fx
Table 5 Mining dynamics per Scenario 2
Figure 6 Graphical view of mining dynamics per Scenariio 2, two processing methods MILL
and LEAC; selective ore mining at the open pit
Shedule Graph PB: 19,25,35; Methods: MILL, LEAC, input Grade input Grade Grade Grade Grade Open pit Open pit Ore Waste Strip MILL input RSUL LECH input ROXD input input input cashflow cashflow Period input tonne ratio RSUL CUS Units ROXD CUOX Units CU AU AG $ $ disc tonne tonne % t tonne % t % gram/t gram/t
1 1,483,848 10,516,152 7.09 95,351 0.1952 186 1,388,497 0.0364 505.4129 0.228 0.0641 1.0903 -16,257,162 -14,779,2382 7,256,451 4,743,549 0.65 2,031,516 0.2616 5,314 5,224,935 0.0544 2842.365 0.3105 0.0678 1.0799 45,641,783 37,720,4823 11,130,003 5,869,998 0.53 5,498,265 0.3002 16,506 5,631,737 0.0413 2325.907 0.3374 0.0851 1.0354 82,715,224 62,145,1724 7,496,487 9,503,513 1.27 5,491,447 0.2717 14,920 2,005,040 0.0198 396.9979 0.2895 0.0896 1.2142 28,267,692 19,307,2145 10,270,649 6,729,351 0.66 4,397,961 0.2189 9,627 5,872,689 0.0273 1603.244 0.2435 0.0814 1.1178 41,111,614 25,527,0786 7,517,886 1,213,627 0.16 5,500,000 0.2387 13,129 2,017,886 0.0194 391.4699 0.2561 0.0751 1.0332 36,047,092 20,347,6447 5,577,058 11,422,942 2.05 4,277,886 0.2268 9,702 1,299,172 0.0157 203.9700 0.2409 0.0944 1.2623 1,530,874 785,5818 9,084,645 7,915,355 0.87 4,530,802 0.1891 8,568 4,553,843 0.0226 1029.169 0.2094 0.0663 1.1096 16,972,872 7,917,9709 5,646,698 816,532 0.14 5,403,277 0.2183 243,421 0.0101 24.58552 0.2275 0.0884 1.1575 20,451,716 8,688,074
65,463,725 58,731,019 37,226,505 0.2094 77,952 28,237,220 0.0330 9323.121 256,481,705 167,659,977
SCENARIO 2
-$40,000,000
-$20,000,000
$0
$20,000,000
$40,000,000
$60,000,000
$80,000,000
$100,000,000
$120,000,000
$140,000,000
$160,000,000
0
2,000,000
4,000,000
6,000,000
8,000,000
10,000,000
12,000,000
14,000,000
16,000,000
18,000,000
1 2 3 4 5 6 7 8 9
Cas
Flow
($)
Tonn
age
(t)
Period
SCENARIO 2-Shedule
Open pi t cashflow $ Open pi t cashflow $ disc
Waste tonne input MILL
input LECH ROXD Ore input
No. 1, 2014 Mining & Metallurgy Engineering Bor 21
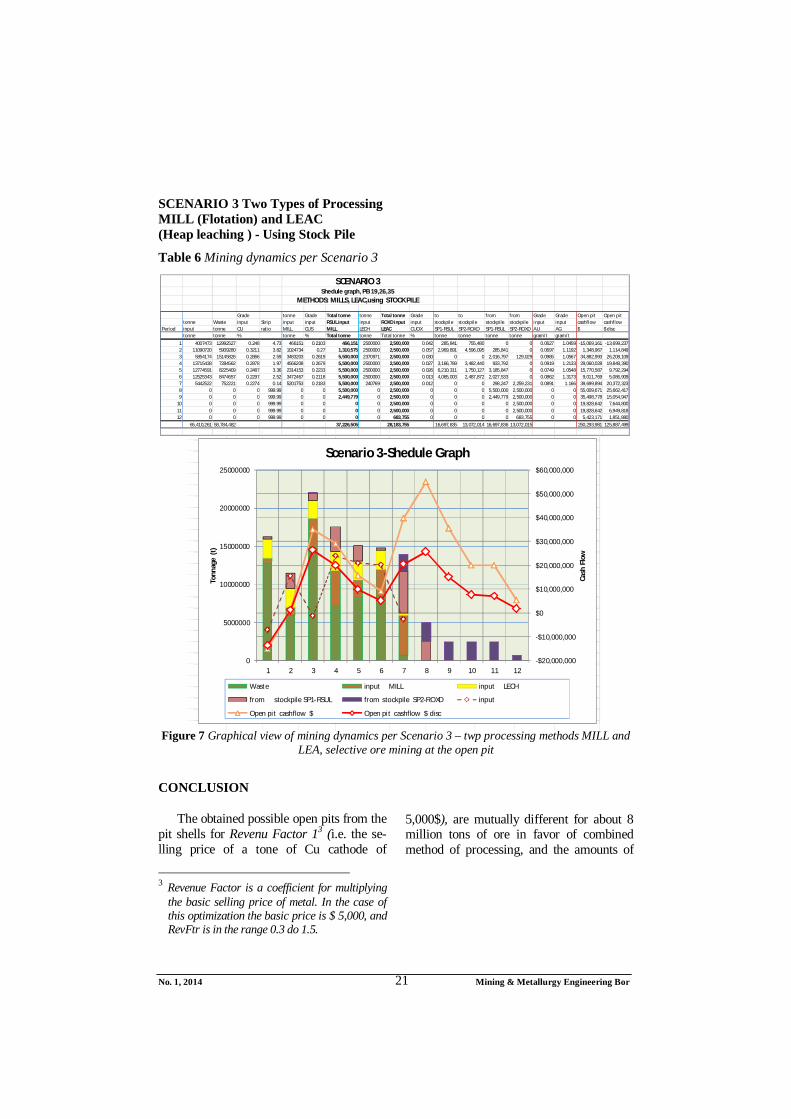
SCENARIO 3 Two Types of Processing MILL (Flotation) and LEAC (Heap leaching ) - Using Stock Pile
Table 6 Mining dynamics per Scenario 3
Figure 7 Graphical view of mining dynamics per Scenario 3 – twp processing methods MILL and
LEA, selective ore mining at the open pit
CONCLUSION
The obtained possible open pits from the pit shells for Revenu Factor 13 (i.e. the se-lling price of a tone of Cu cathode of
3 Revenue Factor is a coefficient for multiplying
the basic selling price of metal. In the case of this optimization the basic price is $ 5,000, and RevFtr is in the range 0.3 do 1.5.
5,000$), are mutually different for about 8 million tons of ore in favor of combined method of processing, and the amounts of
Grade tonne Grade Total tonne tonne Total tonne Grade to to from from Grade Grade Open pit Open pit tonne Waste input Strip input input RSUL input input ROXD input input stockpile stockpile stockpile stockpile input input cashflow cashflow Period input tonne CU ratio MILL CUS MILL LECH LEAC CUOX SP1-RSUL SP2-ROXD SP1-RSUL SP2-ROXD AU AG $ $ disc tonne tonne % tonne % Total tonne tonne Total tonne % tonne tonne tonne tonne gram/t gram/t
1 4007473 12992527 0.248 4.73 466151 0.2103 466,151 2500000 2,500,000 0.042 285,841 755,480 0 0 0.0627 1.0459 -15,069,161 -13,699,2372 11090720 5909280 0.3211 3.82 1024734 0.27 1,310,575 2500000 2,500,000 0.057 2,969,891 4,596,095 285,841 0 0.0697 1.1192 1,348,967 1,114,8493 5854174 15145826 0.2866 2.59 3483203 0.2619 5,500,000 2370971 2,500,000 0.030 0 0 2,016,797 129,029 0.0985 1.0567 34,882,993 26,208,1094 13715438 7284562 0.2878 1.97 4566208 0.2679 5,500,000 2500000 2,500,000 0.027 3,166,789 3,482,440 933,792 0 0.0919 1.2133 29,060,028 19,848,3905 12774591 8225409 0.2487 3.36 2314153 0.2233 5,500,000 2500000 2,500,000 0.026 6,210,311 1,750,127 3,185,847 0 0.0749 1.0548 15,770,587 9,792,2946 12525343 8474657 0.2297 2.52 3472467 0.2118 5,500,000 2500000 2,500,000 0.013 4,065,003 2,487,872 2,027,533 0 0.0862 1.3173 9,011,769 5,086,9097 5442522 752221 0.2274 0.14 5201753 0.2183 5,500,000 240769 2,500,000 0.012 0 0 298,247 2,259,231 0.0891 1.166 39,699,894 20,372,3238 0 0 0 999.99 0 0 5,500,000 0 2,500,000 0 0 0 5,500,000 2,500,000 0 0 55,009,671 25,662,4179 0 0 0 999.99 0 0 2,449,779 0 2,500,000 0 0 0 2,449,779 2,500,000 0 0 35,498,778 15,054,947
10 0 0 0 999.99 0 0 0 0 2,500,000 0 0 0 0 2,500,000 0 0 19,828,642 7,644,80011 0 0 0 999.99 0 0 0 0 2,500,000 0 0 0 0 2,500,000 0 0 19,828,642 6,949,81812 0 0 0 999.99 0 0 0 0 683,755 0 0 0 0 683,755 0 0 5,423,171 1,851,880
65,410,261 58,784,482 37,226,505 28,183,755 16,697,835 13,072,014 16,697,836 13,072,015 250,293,981 125,887,499
SCENARIO 3Shedule graph, PB 19,26,35
METHODS: MILLS, LEAC,using STOCK PILE
-$20,000,000
-$10,000,000
$0
$10,000,000
$20,000,000
$30,000,000
$40,000,000
$50,000,000
$60,000,000
0
5000000
10000000
15000000
20000000
25000000
1 2 3 4 5 6 7 8 9 10 11 12
Cash
Flo
w
Tonn
age
(t)
Scenario 3-Shedule Graph
Waste input MILL input LECH
from stockpile SP1-RSUL from stockpile SP2-ROXD input
Open pit cashflow $ Open pit cashflow $ disc
No. 1, 2014 Mining & Metallurgy Engineering Bor 22
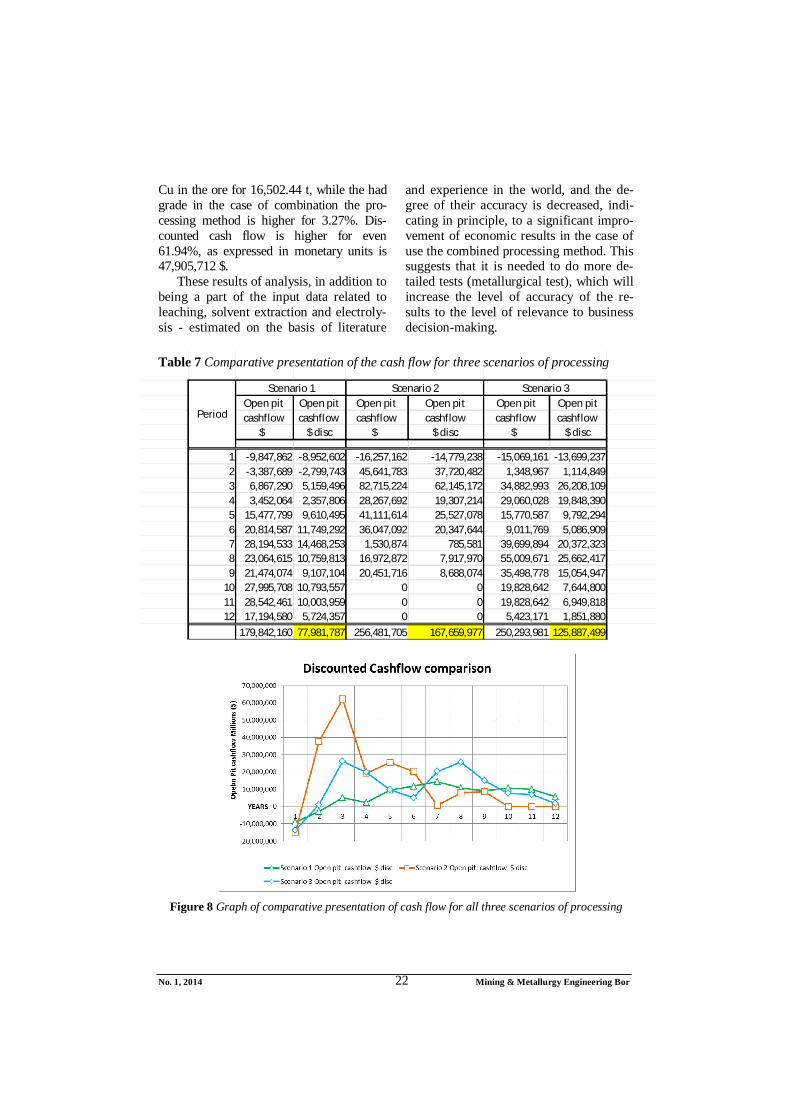
Cu in the ore for 16,502.44 t, while the had grade in the case of combination the pro-cessing method is higher for 3.27%. Dis-counted cash flow is higher for even 61.94%, as expressed in monetary units is 47,905,712 $.
These results of analysis, in addition to being a part of the input data related to leaching, solvent extraction and electroly-sis - estimated on the basis of literature
and experience in the world, and the de-gree of their accuracy is decreased, indi-cating in principle, to a significant impro-vement of economic results in the case of use the combined processing method. This suggests that it is needed to do more de-tailed tests (metallurgical test), which will increase the level of accuracy of the re-sults to the level of relevance to business decision-making.
Table 7 Comparative presentation of the cash flow for three scenarios of processing
Figure 8 Graph of comparative presentation of cash flow for all three scenarios of processing
Open pit Open pit Open pit Open pit Open pit Open pit cashflow cashflow cashflow cashflow cashflow cashflow
$ $ disc $ $ disc $ $ disc
1 -9,847,862 -8,952,602 -16,257,162 -14,779,238 -15,069,161 -13,699,2372 -3,387,689 -2,799,743 45,641,783 37,720,482 1,348,967 1,114,8493 6,867,290 5,159,496 82,715,224 62,145,172 34,882,993 26,208,1094 3,452,064 2,357,806 28,267,692 19,307,214 29,060,028 19,848,3905 15,477,799 9,610,495 41,111,614 25,527,078 15,770,587 9,792,2946 20,814,587 11,749,292 36,047,092 20,347,644 9,011,769 5,086,9097 28,194,533 14,468,253 1,530,874 785,581 39,699,894 20,372,3238 23,064,615 10,759,813 16,972,872 7,917,970 55,009,671 25,662,4179 21,474,074 9,107,104 20,451,716 8,688,074 35,498,778 15,054,947
10 27,995,708 10,793,557 0 0 19,828,642 7,644,80011 28,542,461 10,003,959 0 0 19,828,642 6,949,81812 17,194,580 5,724,357 0 0 5,423,171 1,851,880
179,842,160 77,981,787 256,481,705 167,659,977 250,293,981 125,887,499
Scenario 2 Scenario 3Scenario 1
Period
No. 1, 2014 Mining & Metallurgy Engineering Bor 23
Difference in the discounted cash flow (total and incremental per year) between the analyzed Scenarios 1 and 2 is significant, while between 2 and 3 is not too large, even in favor of scenario without the use of stock piles, but it may be the result of insufficient knowledge of the actual techno - economic parameters of leaching process.
In this analysis mostly literature data on leaching have been used [1, 7], and partly based data on the assessed values of other's experiences and conclusions and compari-sons with pyrometallurgical method of pro-cessing, where there is sufficient data. It is especially important for heap leaching to determine: recovery of basic and precious metals, as well as leaching time, also the costs of leaching pad preparation, con-sumption of acid, consumption of foil for substrate preparation, installation of distri-bution for acid (cyanide) and other norma-tive materials as well as the costs of obtain-ing metals from leaching solutions in the metallurgical process of treatment. All of these costs should be kept to a ton of ore, ore a tone of the final product in the way defined by software Whittle and in the analysis of acceptance the input costs.
The authors of the paper work did not have the ambition to deal in this analysis with the technology of leaching (detailed technique and chemistry of the leaching process. They are of the other specialties, but to compare the economic effects of these cases of the applied methods of ex-traction the primary and associated pre-cious metals, and based on that to make the certain conclusions presented in the paper.
The previous opinion of some experts as well as the inhabitants in the localities of ore deposits – Cerovo-Kraku Bugaresku, Ujova River and other current and potential locali-ties, at which the deposits are located with similar characteristics, is that the leaching process is highly hazardous to the environ-ment. Such opinion is denied in the world, inter alia, and because the total world pro-duction of copper, about 20%, is obtained by
leaching. The most developed countries in the world do that because they take much more account of environmental protection than we do, and whose regulations in this area are far more stringent than ours (the United States, Chile, Canada, South Africa and others).
The purpose of this analysis is to high-light the potential alternative method which can increase the profit from the exploitation of deposits containing high contents of oxide minerals in the ore, which adversely affect the metal recovery in flotation method of enrichment. The analysis of this type, even it is the case of doubt whether even to exploit such deposits, i.e. whether the economics of exploitation is satisfactory, as there are con-flicting opinions in the local professional community, can provide the adequate data for relevant qualified evaluation and deci-sion.
It is important to note that it is the trend of leaching technology is also leaching of sulphide concentrates.
REFERENCES
[1] J. Peacey1, G. Xian-Jian1, E. Robles2: ,Copper Hydrometallurgy-Current Sta-tus, Preliminary Economics, Future Direction and Positioning Versus Smelting, J. Peacey1, GUO Xian-Jian1, E. Robles 2,1.Hatch Associates Ltd., 2800 Speakman Drive, Mississauaga, Ontario L5K 2R7, Canada; 2Hatch IngenierosyConsultores Ltda., San Sebastian 283, Piso 9, Los Condes, Santiago 6760226, Chile;
[2] J. F. Lupo: Design and Operation of Heap Leach Pads, By: John F. Lupo, Ph.D. Golder Asociates;
[3] C. Avendaño Varas: Review on Heap Leaching of Copper Ores, Carlos Avendaño Varas, Chemical Engenieer, Sociedad Terral S.A;
[4] R. Denis, M. Marcotte: 1,7 Million Square Meters PVC Heap Leach Pad Case History,Robert Denis, Solmax
No. 1, 2014 Mining & Metallurgy Engineering Bor 24
International Inc., Varennes, Qc., Canada, Michel Marcotte, Genivar, Montreal, Qc., Canada, Draft paper submitted for publication GeoAfrica 2009;
[5] M. E. Orman, D. Romo, R. Tremayne: A Case Study of the Ocampo Phase 1 Heap Leach Expansion or Changing a Flat Pad to a Valley Fill, By: Marc E. Orman, David Romo, Russell Tre-mayne;
[6] Whittle Strategic Mine Planning, Gemcom Whittle™ Copyright © 2012 Gemcom Software International Inc.;
[7] G. Hovanec, Review of the Basic Economic Aspects of Copper Pro-duction Using the Method Acid Leaching, Mining Institute, Belgrade; (in Serbian)
[8] Z. Vaduvesković, M. Bugarin, D. Krža-nović, Stripping Delaz Analysis in Relation to Designed Long-Term Plan of Excavation at the Open Pit Veliki Krivelj, Mining and Metallurgy Engineering Bor, 2/2013, pp.33-42.
[9] J. Vukašinović, J. Đorđević Boljano-vić, Mining Industry in the Knowledge Economy, Mining and Metallurgy Engineering Bor, 2/2013, pp. 117-126.
Broj 1, 2014. Mining & Metallurgy Engineering Bor 25
INSTITUT ZA RUDARSTVO I METALURGIJU BOR ISSN: 2334-8836 UDK: 622
UDK: 622.271:66.061:681.5(045)=861 DOI:10.5937/MMEB1401013V
Zoran Vaduvesković*, Nenad Vušović**, Daniel Kržanović*
ANALIZA MOGUĆNOSTI POBOLJŠANJA EKONOMSKIH POKAZATELJA EKSPLOATACIJE LEŽIŠTA CEMENTACIJA
KRAKU BUGARESKU – RUDNO POLJE CEROVO***
Izvod
Cementacija Kraku Bugaresku je kompleks rudnih tela u jugoistočnom delu ležišta Cerovo. Sadrži znatan deo rude sa povećanim sadržajem oksida u odnosu na ukupan bakar u rudi, i sa postojećom tehnologijom prerade u dosadašnjem periodu postignutisu skromni rezultati u iskorišćenju metala.
Ovaj članak kroz analizu razmatra moguću kombinaciju metoda prerade klasičnom flotacijskom preradom sa pirometalurškom preradom i luženja na gomili sa hidrometalurškom ekstrakcijom metala postupkom SX-EW, sa aspekta ekonomske isplativosti takvog postupka. U članku je izvršeno najpre upoređenje rezultata optimizacije mogućih kopova na rudnom ležištu (Whittle Fx), u jednom i drugom slučaju za iste ulazne tehnoekonomske podatke. Dobijeni mogući kopovi iz procesa optimizacije (pit shells), za Revenu Factor 1 (tj. prodajnu cenu tone Cu katode od 5000 $), međusobno se razlikuju za oko 8 miliona tona rude u korist kombinovane metode prerade, a količine Cu u rudi za 16.502,44 t, dok je srednji sadržaj (had grade) u slučaju kombinacije metoda prerade veći za 3,27%. Diskontovani nov-čani tok (Cash Flow) je veći za čak 61,94%, što izraženo u novčanim jedinicama iznosi 47.905.712 $.
Keywords: luženje na gomili, SX –EV, optimizacija kopova, diskontovani novčani tok.
* Institut za rudarstvo i metalurgiju Bor ** Univerzitet u Beogradu,Tehnički fakultet Bor *** Članak je u sklopu projekata tehnološkog razvoja TR 33038 “Usavršavanje tehnologija eksploatacije i
prerade rude bakra sa monitoringom životne i radne sredine u RTB Bor Grupa” i TR 34004 “Nova proizvodna linija za dobijanje bakra solventnom ekstrakcijom rudničkih voda”, koji su finansirani od strane Ministarstva prosvete, nauke i tehnološkog razvoja.
UVOD
Rudno polje Kraku Bugaresku (KB) Cementacija je deo kompleksa rudnih ležišta na lokalitetu Cerovo Mali Krivelj, koje se razlikuje od ostatka ležišta prema načinu nastanka i vrsti orudnjenja. To je cementa-ciona zona sekundarnog obogaćenja, i jedan deo orudnjenja spada u oksidne minerali-zacije (oko 40% od ukupnih geoloških reze-rvi). Sastoji se od rudnih tela Cementacija 1, 2, 3 i 4 od kojih se prema sadržaju oksidne
rude u odnosu na ukupne rezerve, izdvajaju cementacija 3 i 4. Prema sadržaju bakra, ovaj kompleks spada u siromašna ležišta čija je ekonomika eksploatacije vrlo osetljiva na pojedine parametre kao što su iskorišćenje metala u procesu obogaćenja, troškove eksploatacije u tehnološkom lancu od otko-pavanja do metalurške prerade, pa čak i redosleda otkopavanja rudnih tela (Push backs) unutar cementacione zone.
Broj 1, 2014. Mining & Metallurgy Engineering Bor 26
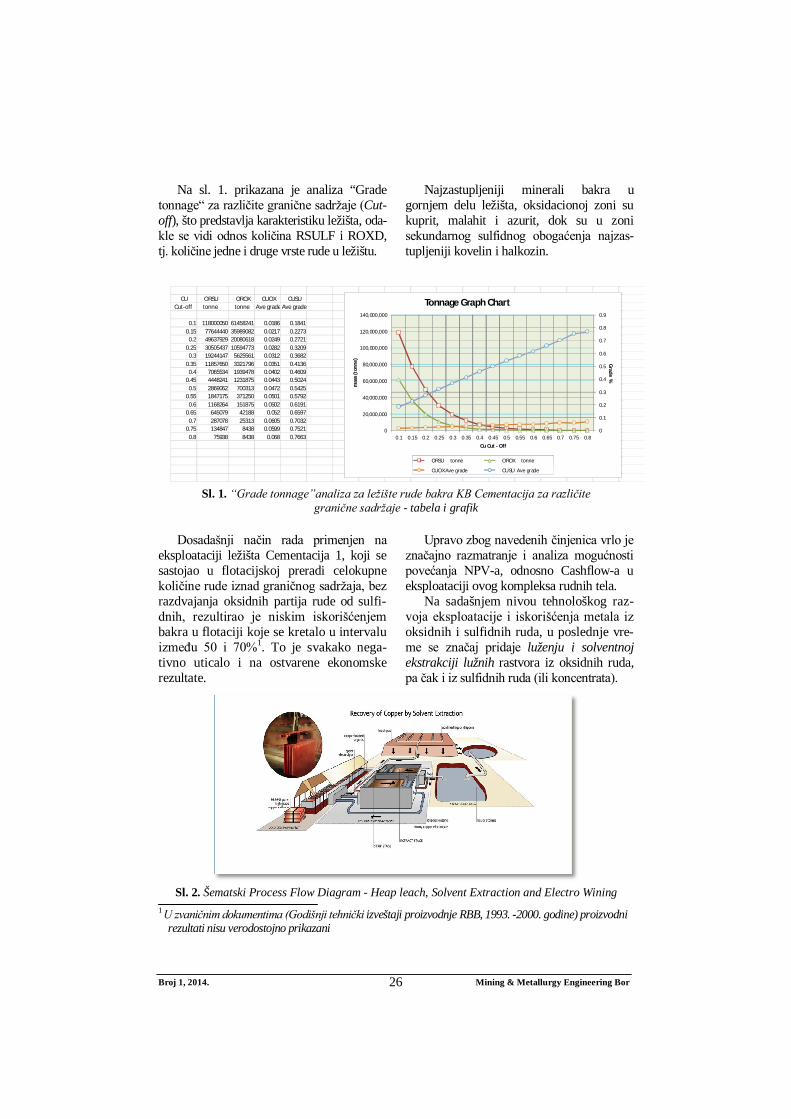
Na sl. 1. prikazana je analiza “Grade tonnage“ za različite granične sadržaje (Cut-off), što predstavlja karakteristiku ležišta, oda-kle se vidi odnos količina RSULF i ROXD, tj. količine jedne i druge vrste rude u ležištu.
Najzastupljeniji minerali bakra u gornjem delu ležišta, oksidacionoj zoni su kuprit, malahit i azurit, dok su u zoni sekundarnog sulfidnog obogaćenja najzas-tupljeniji kovelin i halkozin.
Sl. 1. “Grade tonnage”analiza za ležište rude bakra KB Cementacija za različite
granične sadržaje - tabela i grafik Dosadašnji način rada primenjen na
eksploataciji ležišta Cementacija 1, koji se sastojao u flotacijskoj preradi celokupne količine rude iznad graničnog sadržaja, bez razdvajanja oksidnih partija rude od sulfi-dnih, rezultirao je niskim iskorišćenjem bakra u flotaciji koje se kretalo u intervalu između 50 i 70%1. To je svakako nega-tivno uticalo i na ostvarene ekonomske rezultate.
Upravo zbog navedenih činjenica vrlo je značajno razmatranje i analiza mogućnosti povećanja NPV-a, odnosno Cashflow-a u eksploataciji ovog kompleksa rudnih tela.
Na sadašnjem nivou tehnološkog raz-voja eksploatacije i iskorišćenja metala iz oksidnih i sulfidnih ruda, u poslednje vre-me se značaj pridaje luženju i solventnoj ekstrakciji lužnih rastvora iz oksidnih ruda, pa čak i iz sulfidnih ruda (ili koncentrata).
Sl. 2. Šematski Process Flow Diagram - Heap leach, Solvent Extraction and Electro Wining
1 U zvaničnim dokumentima (Godišnji tehnički izveštaji proizvodnje RBB, 1993. -2000. godine) proizvodni rezultati nisu verodostojno prikazani
CU ORSU OROX CUOX CUSU Cut-off tonne tonne Ave grade Ave grade
0.1 118000050 61458241 0.0186 0.18410.15 77644440 35989082 0.0217 0.2273
0.2 49637929 20080618 0.0249 0.27210.25 30505437 10594773 0.0282 0.3209
0.3 19244147 5625561 0.0312 0.36820.35 11857650 3321796 0.0351 0.4136
0.4 7065534 1939478 0.0402 0.46090.45 4448241 1231875 0.0443 0.5024
0.5 2869062 700313 0.0472 0.54250.55 1847175 371250 0.0501 0.5792
0.6 1168264 151875 0.0502 0.61910.65 645079 42188 0.052 0.6597
0.7 287078 25313 0.0605 0.70320.75 134847 8438 0.0599 0.7521
0.8 75938 8438 0.068 0.76630
0.1
0.2
0.3
0.4
0.5
0.6
0.7
0.8
0.9
0
20,000,000
40,000,000
60,000,000
80,000,000
100,000,000
120,000,000
140,000,000
0.1 0.15 0.2 0.25 0.3 0.35 0.4 0.45 0.5 0.55 0.6 0.65 0.7 0.75 0.8
Grade %
mas
s (t
onne
)
Cu Cut - Off
Tonnage Graph Chart
ORSU tonne OROX tonne
CUOX Ave grade CUSU Ave grade
Broj 1, 2014. Mining & Metallurgy Engineering Bor 27
ANALIZA U SOFTVERU ZA STRATEŠKO PLANIRANJE WHITTLE FX
Ulazni tehnoekonomski podaci za ana-lizu vršenu u softveru za strateško planiranje Whittle Fx, za scenario 1. i 2., tj. flotiranje sulfidne i oksidne rude zajedno, bez selek-
tivnog otkopavanja i selektivno otkopa-vanje sa dodatnom metodom metode obo-gaćivanja - luženjem na gomili rude sa preko 10% oksida, su sledeći:
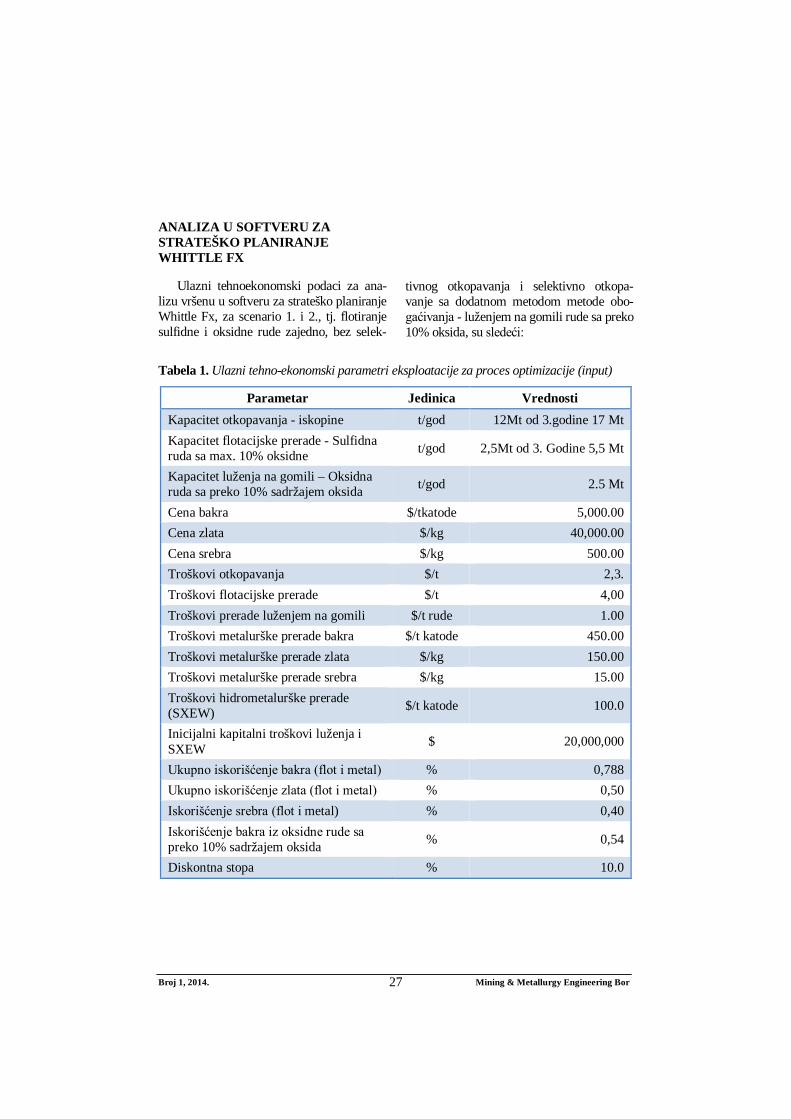
Tabela 1. Ulazni tehno-ekonomski parametri eksploatacije za proces optimizacije (input)
Parametar Jedinica Vrednosti Kapacitet otkopavanja - iskopine t/god 12Mt od 3.godine 17 Mt Kapacitet flotacijske prerade - Sulfidna ruda sa max. 10% oksidne t/god 2,5Mt od 3. Godine 5,5 Mt
Kapacitet luženja na gomili – Oksidna ruda sa preko 10% sadržajem oksida t/god 2.5 Mt
Cena bakra $/tkatode 5,000.00 Cena zlata $/kg 40,000.00 Cena srebra $/kg 500.00 Troškovi otkopavanja $/t 2,3. Troškovi flotacijske prerade $/t 4,00 Troškovi prerade luženjem na gomili $/t rude 1.00 Troškovi metalurške prerade bakra $/t katode 450.00 Troškovi metalurške prerade zlata $/kg 150.00 Troškovi metalurške prerade srebra $/kg 15.00 Troškovi hidrometalurške prerade (SXEW) $/t katode 100.0
Inicijalni kapitalni troškovi luženja i SXEW $ 20,000,000
Ukupno iskorišćenje bakra (flot i metal) % 0,788 Ukupno iskorišćenje zlata (flot i metal) % 0,50 Iskorišćenje srebra (flot i metal) % 0,40 Iskorišćenje bakra iz oksidne rude sa preko 10% sadržajem oksida % 0,54
Diskontna stopa % 10.0
Broj 1, 2014. Mining & Metallurgy Engineering Bor 28
Analiza2 je vršena za 3 scenarija, i to: 1. Scenario 1 – metoda prerade ozna-
čena sa „MILL“ tj. flotiranje ROXD i RSULF, odnosno dva tipa rude;
2. Scenario 2 – metoda „MILL“ za rudu sa > 10% oksida, i metoda „LEAC“ za rudu sa sadržajem > 10% oksida, pri čemu nije ograničen kapacitet luženja;
3. Scenario 3 – isti kao scenario 2, ali sa ograničenjem kapaciteta luženja na 2.500.000 t, i sa korišćenjem dve vrste skladišta (Stock Piles) za rudu do 10% oksida i rudu > 10% oksida (SP1 i SP2). Skladišta su korišćena kao “buffer” za dopunu projektovanog kapaciteta kako u flotaciji, tako i na luženju.
U daljoj analizi za SCENARIO 1 i 2 su tabelarno prikazani rezultati optimizacije u tabelama tipa Pit By Pit Garph, tj. kopovi iz optimizacije sa sračunatim nov-čanim tokom i diskontovanim novčanim
tokom za svaki kop iz seta ugnježdenih kopova. Ekonomski pokazatelji su sraču-nati za tri moguća slučaja – Best Case, Worst Case i Specific Case, tj za radne uglove kosina na kopu jednakim 0o, maxi-malni radni ugao i specifičan (izabrani) kop. Merodavan za ocenu i izbor opti-malnog kopa po kriterijumu optimalnog profita je diskontovani novčani tok (cash flow) za maksimalni radni ugao. To znači da se izabrani kop (Final pit) otkopava po fazama (Push backs).
Za sva tri slučaja je projektovana i sra-čunata dinamika otkopavanja za vek eksploatacije izabranog kopa po navedenom kriterijumu, sa odgovarajućim grafičkim prikazom. Takođe su u tabelama prikazane i obračunate količine po vrstama rude (kao Rock Type), sa manjim i većim sadržajem oksida, odnosno ostvarenim kapacitetima za metodu “MILL” i metodu”LEAC”, u scena-riju 3. - sa dodatnim obračunatim količinama rude koje idu na skladište i koje sa skladišta idu u procese.
2 Pored napred navedenih ulaznih podataka, u softver Whittle se unosi i blok model ležišta, tzv. mod fajl. U kreiranju navedenog u osnovnom softveru, u ovom slučaju Gemcom, koristi se i topografija terena, odnosno stanje rudarskih radova na rudniku. U slučaju ove analize, stanje terena je 10.08.2001., tj. stanje pre ponovnog aktiviranja kopa, upravo zbog toga što analiza nije rađena u sklopu Studije ili projekta, nego je urađena sa svrhom da ukaže na mogućnosti povećanja ekonomskih efekata proizvo-dnje i pokrene značajnija istraživanja u pravcu extrakcije Cu i pratećih plemenitih metala hidro-metalurškim postupkom.
Broj 1, 2014. Mining & Metallurgy Engineering Bor 29
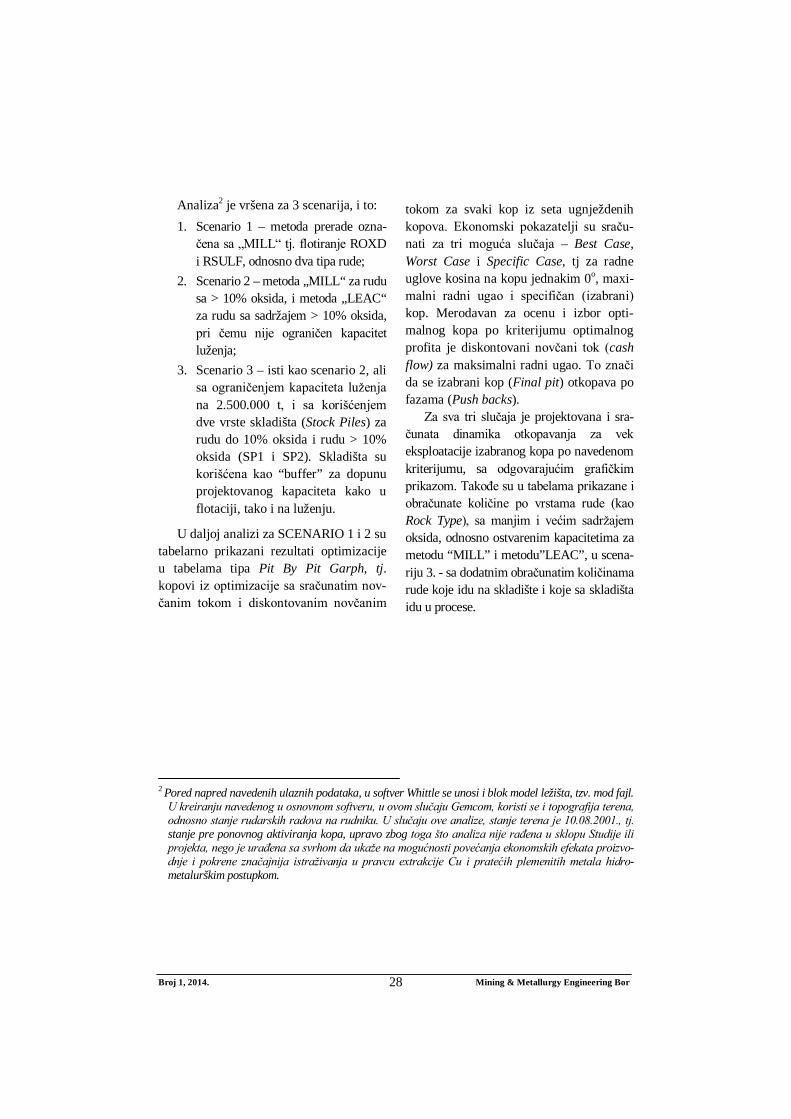
SCENARIO 1. Jedan tip prerade MILL (flotiranje) sulfidne i oksidne rude zajedno
Tabela 2. Tabelarni prikaz rezultata optimizacije po Scenariju 1, sa obračunatim
novčanog toka
Revenue factor Open pit Open pit Open pit Mine Mine Mine for cashflow cashflow cashflow tonne Waste life life life Final final best specified worst input best years years years pit pit $ disc $ disc $ disc best tonne best specified worst
1 0.32 1,257,649 1,257,649 1,257,649 64,520 9,407 0.03 0.03 0.032 0.34 2,340,019 2,340,019 2,340,019 127,897 9,971 0.05 0.05 0.053 0.36 3,265,188 3,265,188 3,265,188 188,088 10,150 0.08 0.08 0.084 0.38 4,415,908 4,415,908 4,415,908 272,142 14,544 0.11 0.11 0.115 0.4 5,121,194 5,121,194 5,121,194 326,594 28,340 0.13 0.13 0.136 0.42 6,782,948 6,782,948 6,782,948 475,371 39,226 0.19 0.19 0.197 0.44 8,622,922 8,622,922 8,622,922 654,558 64,086 0.26 0.26 0.268 0.46 10,525,070 10,525,070 10,525,070 868,580 85,685 0.35 0.35 0.359 0.48 13,053,414 13,053,414 13,053,414 1,188,709 111,857 0.48 0.48 0.48
10 0.5 15,071,636 15,071,636 15,071,636 1,480,565 120,560 0.59 0.59 0.5911 0.52 15,737,824 15,737,824 15,737,824 1,589,257 128,947 0.64 0.64 0.6412 0.54 18,383,286 18,383,286 18,383,286 2,040,985 229,016 0.82 0.82 0.8213 0.56 20,388,697 20,388,697 20,388,697 2,429,329 299,806 0.97 0.97 0.9714 0.58 21,534,215 21,532,415 21,532,415 2,663,808 335,688 1.07 1.07 1.0715 0.6 48,788,934 47,538,914 47,538,914 7,875,043 5,582,314 2.52 2.52 2.5216 0.62 55,146,867 53,508,008 53,508,008 9,599,654 6,485,167 2.84 2.84 2.8417 0.64 63,570,562 60,902,078 60,902,078 11,991,784 7,986,686 3.27 3.27 3.2718 0.66 67,546,940 64,308,942 64,308,942 13,194,047 8,727,104 3.49 3.49 3.4919 0.68 76,251,473 71,761,565 71,761,565 16,394,020 10,505,786 4.07 4.07 4.0720 0.7 79,816,489 74,837,962 74,837,962 17,911,544 11,034,033 4.35 4.35 4.3521 0.72 84,775,931 78,120,000 78,120,000 20,275,932 12,509,270 4.78 4.78 4.7822 0.74 87,297,954 79,729,295 79,729,295 21,721,280 13,173,614 5.04 5.04 5.0423 0.76 99,408,000 82,884,123 82,884,123 28,647,492 19,642,382 6.30 6.55 6.5524 0.78 102,648,142 83,151,343 83,151,343 31,079,978 21,409,083 6.74 7.05 7.0525 0.8 105,911,193 82,932,523 82,932,523 33,864,262 24,482,200 7.25 7.62 7.6226 0.82 107,796,516 83,166,000 83,166,000 36,026,740 25,479,248 7.64 8.02 8.0227 0.84 109,864,961 82,857,682 82,857,682 38,690,541 27,906,217 8.13 8.52 8.5228 0.86 112,055,441 81,155,078 81,155,078 41,754,095 31,007,667 8.68 9.10 9.1029 0.88 113,121,606 80,039,265 80,039,265 43,695,298 33,065,173 9.04 9.46 9.4630 0.9 115,083,888 75,541,273 75,541,273 48,341,430 37,235,782 9.88 10.32 10.3231 0.92 115,955,763 71,519,775 71,519,775 50,942,253 40,014,353 10.35 10.89 10.8932 0.94 116,329,206 69,437,935 69,437,935 52,691,741 42,144,430 10.67 11.24 11.2433 0.96 116,577,596 67,166,852 67,166,852 54,558,738 44,257,231 11.01 11.62 11.6234 0.98 116,812,522 63,546,156 63,546,156 56,940,722 47,520,092 11.44 12.10 12.1035 1 116,822,322 62,763,271 62,763,271 57,462,570 48,143,878 11.54 12.20 12.2036 1.02 116,733,132 60,247,593 60,247,593 59,523,326 50,336,326 11.91 12.60 12.6037 1.04 116,570,305 57,088,898 57,088,898 61,004,701 52,645,714 12.18 12.91 12.9138 1.06 116,246,697 53,548,340 53,548,340 62,679,665 55,723,640 12.49 13.27 13.2739 1.08 116,104,201 52,612,974 52,612,974 63,285,683 56,807,448 12.60 13.38 13.3840 1.1 115,890,094 51,230,325 51,230,325 63,973,933 57,909,775 12.72 13.51 13.5141 1.12 114,776,583 41,519,881 41,519,881 67,492,199 62,846,779 13.36 14.34 14.3442 1.14 114,282,584 37,924,212 37,924,212 68,822,070 65,024,645 13.60 14.65 14.6543 1.16 114,198,024 37,513,600 37,513,600 69,049,326 65,188,415 13.65 14.69 14.6944 1.18 113,547,212 35,394,348 35,394,348 70,505,451 68,088,287 13.91 14.96 14.9645 1.2 113,180,094 34,216,439 34,216,439 71,313,473 69,376,637 14.06 15.11 15.1146 1.22 112,692,740 31,159,282 31,159,282 72,264,584 71,233,186 14.23 15.34 15.3447 1.24 112,393,820 29,204,421 29,204,421 72,820,099 72,285,894 14.33 15.48 15.4848 1.26 110,665,910 18,407,558 18,407,558 75,656,596 79,276,775 14.86 16.25 16.2549 1.28 109,992,003 16,490,497 16,490,497 76,759,211 81,937,428 15.15 16.46 16.4650 1.3 109,028,005 11,329,090 11,329,090 78,333,172 85,123,865 15.43 16.80 16.8051 1.32 108,936,513 10,951,659 10,951,659 78,476,259 85,430,456 15.46 16.83 16.8352 1.34 108,604,954 9,631,895 9,631,895 78,947,606 86,580,421 15.54 16.93 16.9353 1.36 108,528,079 9,319,586 9,319,586 79,090,693 86,744,802 15.57 16.96 16.9654 1.38 107,646,094 6,399,243 6,399,243 80,168,057 89,781,653 15.77 17.17 17.1755 1.4 106,959,546 4,034,446 4,034,446 81,102,333 92,015,091 15.94 17.35 17.3556 1.42 106,704,144 3,213,701 3,213,701 81,439,009 92,833,624 16.00 17.41 17.4157 1.44 106,461,667 2,659,448 2,659,448 81,716,767 93,627,441 16.06 17.47 17.4758 1.46 106,136,964 1,975,632 1,975,632 82,087,111 94,621,529 16.14 17.53 17.5359 1.48 106,087,512 1,742,133 1,742,133 82,154,446 94,741,304 16.15 17.55 17.5560 1.5 105,680,501 702,770 702,770 82,533,207 96,158,579 16.25 17.62 17.62
PIT BY PIT GRAPH - SCENARIO 1
Broj 1, 2014. Mining & Metallurgy Engineering Bor 30
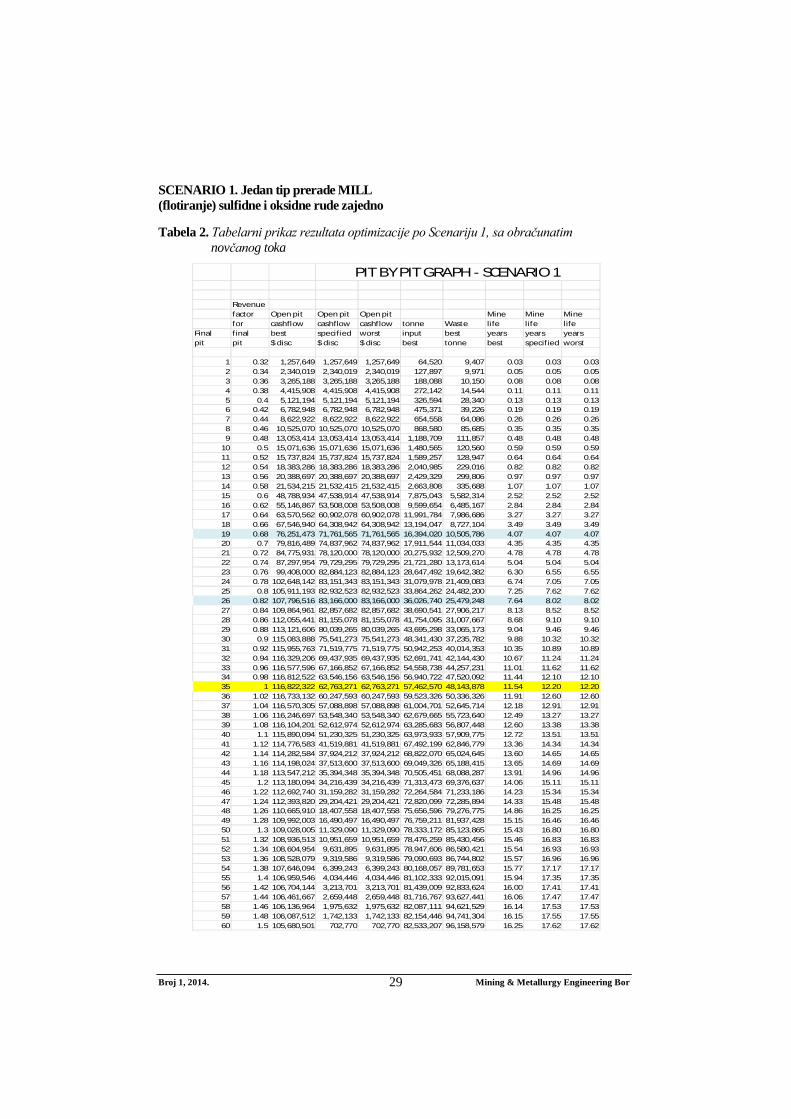
Sl. 3. Pit by Pit graph - Grafik optimizacije po Scenariju 1
Tabela 3. Dinamika otkopavanja po Scenariju 1
Sl. 4. Grafički prikaz DINAMIKE otkopavanja po Scenariju 1, sa jednom metodom prerade – MILL; ukupne količine rude bez selektivnog otkopavanja idu u flotacijsku
preradu i koncentrat na pirometalurški postupak
PB: 19, 26,35 Units Units tonne input Grade tonne input Grade Grade Grade Grade Grade Open pit Open pit tonne Waste Strip input RSUL input input ROXD input input input input input cashflow cashflow Period input tonne ratio RSUL CU CUS ROXD CU CUOX CU PRCU AU AG $ $ disc x 100 x100
1 2,497,779 9,502,221 3.8 601,834 241,726 0.2449 1,895,945 462,625 0.0413 0.282 15.4797 0.0753 1.1065 -9,847,862 -8,952,6022 2,499,693 9,500,307 3.8 917,321 451,536 0.3076 1,582,372 426,201 0.0484 0.3511 15.7806 0.0802 1.0753 -3,387,689 -2,799,7433 5,495,999 11,504,001 2.09 1,769,556 816,733 0.2808 3,726,443 952,774 0.0458 0.322 16.0559 0.0718 1.0124 6,867,290 5,159,4964 5,499,999 6,315,358 1.15 1,462,051 427,596 0.2038 4,037,947 887,950 0.0393 0.2392 16.1273 0.0693 1.1278 3,452,064 2,357,8065 5,500,000 3,586,533 0.65 1,785,345 533,392 0.2303 3,714,655 929,696 0.0397 0.266 14.6026 0.0791 1.1537 15,477,799 9,610,4956 5,500,000 2,599,697 0.47 2,570,586 823,796 0.2542 2,929,414 753,057 0.0361 0.2867 13.4667 0.0727 1.0313 20,814,587 11,749,2927 5,500,000 1,403,682 0.26 3,146,090 1,044,249 0.2634 2,353,910 553,530 0.0301 0.2905 11.1239 0.0848 1.0792 28,194,533 14,468,2538 5,499,999 1,557,531 0.28 4,021,808 1,109,667 0.2397 1,478,191 300,803 0.0186 0.2564 7.6091 0.0862 1.0487 23,064,615 10,759,8139 5,500,000 1,263,215 0.23 5,082,426 1,282,422 0.2367 417,573 85,504 0.0133 0.2487 5.3879 0.0827 1.031 21,474,074 9,107,104
10 5,500,000 605,505 0.11 4,879,546 1,326,078 0.252 620,454 125,263 0.0133 0.2639 5.2266 0.0996 1.2105 27,995,708 10,793,55711 5,500,000 271,792 0.05 5,017,944 1,395,811 0.2582 482,056 88,229 0.0129 0.2698 5.0344 0.0848 1.3015 28,542,461 10,003,95912 2,969,102 34,036 0.01 2,916,661 803,531 0.2654 52,440 12,601 0.0105 0.2749 3.7942 0.0994 1.3529 17,194,580 5,724,357
57,462,571 48,143,878 34,171,168 23,291,400 179,842,160 77,981,787
SCENARIO 1_ SHEDULE GRAPPH
-$15,000,000
-$10,000,000
-$5,000,000
$0
$5,000,000
$10,000,000
$15,000,000
$20,000,000
$25,000,000
$30,000,000
$35,000,000
0
2,000,000
4,000,000
6,000,000
8,000,000
10,000,000
12,000,000
14,000,000
16,000,000
18,000,000
1 2 3 4 5 6 7 8 9 10 11 12
Cash
Flo
ww
Ton
nage
(t)
Period
SCENARIO 1 -Shedule graph
Waste tonne tonne input RSUL
input ROXD tonne input
Open pit cashfl ow $ Open pit cashflow $ disc
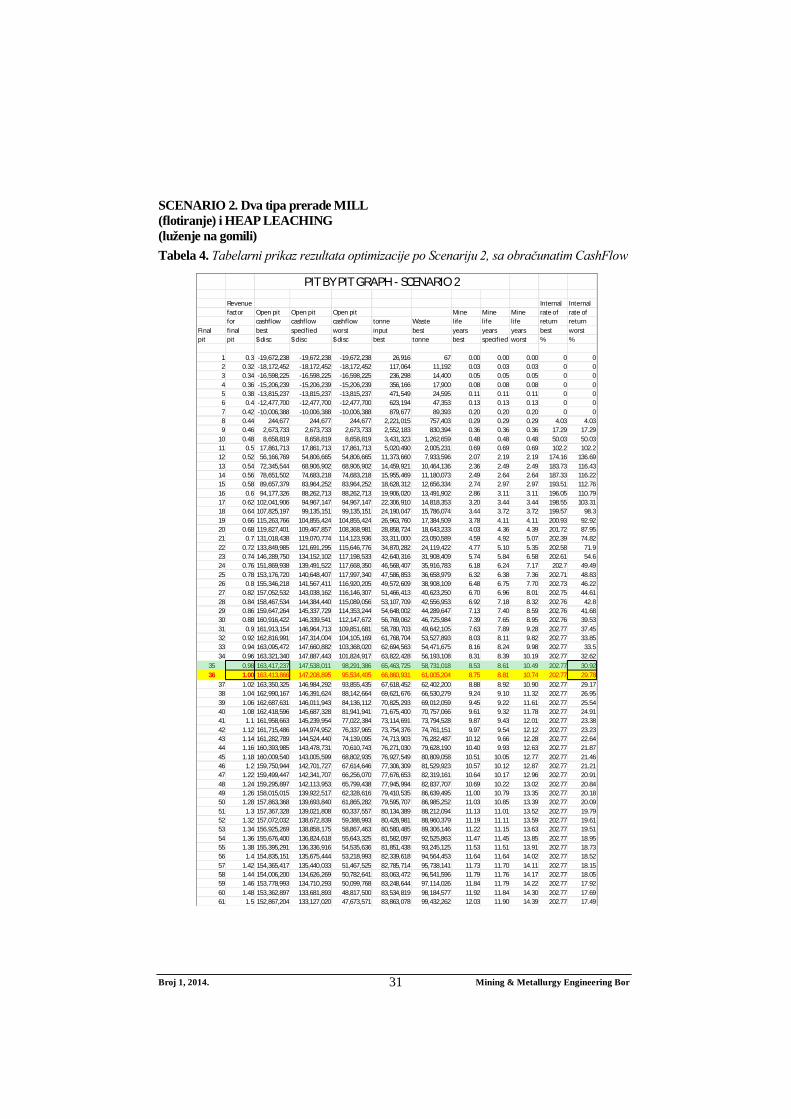
Broj 1, 2014. Mining & Metallurgy Engineering Bor 31
SCENARIO 2. Dva tipa prerade MILL (flotiranje) i HEAP LEACHING (luženje na gomili)
Tabela 4. Tabelarni prikaz rezultata optimizacije po Scenariju 2, sa obračunatim CashFlow
Revenue Internal Internal factor Open pit Open pit Open pit Mine Mine Mine rate of rate of for cashflow cashflow cashflow tonne Waste life life life return return Final final best specified worst input best years years years best worst pit pit $ disc $ disc $ disc best tonne best specified worst % %
1 0.3 -19,672,238 -19,672,238 -19,672,238 26,916 67 0.00 0.00 0.00 0 02 0.32 -18,172,452 -18,172,452 -18,172,452 117,064 11,192 0.03 0.03 0.03 0 03 0.34 -16,598,225 -16,598,225 -16,598,225 236,298 14,400 0.05 0.05 0.05 0 04 0.36 -15,206,239 -15,206,239 -15,206,239 356,166 17,900 0.08 0.08 0.08 0 05 0.38 -13,815,237 -13,815,237 -13,815,237 471,549 24,595 0.11 0.11 0.11 0 06 0.4 -12,477,700 -12,477,700 -12,477,700 623,194 47,353 0.13 0.13 0.13 0 07 0.42 -10,006,388 -10,006,388 -10,006,388 879,677 89,393 0.20 0.20 0.20 0 08 0.44 244,677 244,677 244,677 2,221,015 757,403 0.29 0.29 0.29 4.03 4.039 0.46 2,673,733 2,673,733 2,673,733 2,552,183 830,394 0.36 0.36 0.36 17.29 17.29
10 0.48 8,658,819 8,658,819 8,658,819 3,431,323 1,262,659 0.48 0.48 0.48 50.03 50.0311 0.5 17,861,713 17,861,713 17,861,713 5,020,490 2,005,231 0.69 0.69 0.69 102.2 102.212 0.52 56,166,769 54,806,665 54,806,665 11,373,660 7,933,596 2.07 2.19 2.19 174.16 136.6913 0.54 72,345,544 68,906,902 68,906,902 14,459,921 10,464,136 2.36 2.49 2.49 183.73 116.4314 0.56 78,651,502 74,683,218 74,683,218 15,955,469 11,180,073 2.49 2.64 2.64 187.33 116.2215 0.58 89,657,379 83,964,252 83,964,252 18,628,312 12,656,334 2.74 2.97 2.97 193.51 112.7616 0.6 94,177,326 88,262,713 88,262,713 19,906,020 13,491,902 2.86 3.11 3.11 196.05 110.7917 0.62 102,041,906 94,967,147 94,967,147 22,306,910 14,818,353 3.20 3.44 3.44 198.55 103.3118 0.64 107,825,197 99,135,151 99,135,151 24,190,047 15,786,074 3.44 3.72 3.72 199.57 98.319 0.66 115,263,766 104,855,424 104,855,424 26,963,760 17,384,509 3.78 4.11 4.11 200.93 92.9220 0.68 119,827,401 109,467,857 108,368,981 28,858,724 18,643,233 4.03 4.36 4.39 201.72 87.9521 0.7 131,018,438 119,070,774 114,123,936 33,311,000 23,050,589 4.59 4.92 5.07 202.39 74.8222 0.72 133,849,985 121,691,295 115,646,776 34,870,282 24,119,422 4.77 5.10 5.35 202.58 71.923 0.74 146,289,750 134,152,102 117,198,533 42,640,316 31,908,409 5.74 5.84 6.58 202.61 54.624 0.76 151,869,938 139,491,522 117,668,350 46,568,407 35,916,783 6.18 6.24 7.17 202.7 49.4925 0.78 153,176,720 140,648,407 117,997,340 47,586,853 36,658,979 6.32 6.38 7.36 202.71 48.8326 0.8 155,346,218 141,567,411 116,920,205 49,572,609 38,908,109 6.48 6.75 7.70 202.73 46.2227 0.82 157,052,532 143,038,162 116,146,307 51,466,413 40,623,250 6.70 6.96 8.01 202.75 44.6128 0.84 158,467,534 144,384,440 115,089,056 53,107,709 42,556,953 6.92 7.18 8.32 202.76 42.829 0.86 159,647,264 145,337,729 114,353,244 54,648,002 44,289,647 7.13 7.40 8.59 202.76 41.6830 0.88 160,916,422 146,339,541 112,147,672 56,769,062 46,725,984 7.39 7.65 8.95 202.76 39.5331 0.9 161,913,154 146,964,713 109,851,681 58,780,703 49,642,105 7.63 7.89 9.28 202.77 37.4532 0.92 162,816,991 147,314,004 104,105,169 61,768,704 53,527,893 8.03 8.11 9.82 202.77 33.8533 0.94 163,095,472 147,660,882 103,368,020 62,694,563 54,471,675 8.16 8.24 9.98 202.77 33.534 0.96 163,321,340 147,887,443 101,824,917 63,822,428 56,193,108 8.31 8.39 10.19 202.77 32.62
35 0.98 163,417,237 147,538,011 98,291,386 65,463,725 58,731,018 8.53 8.61 10.49 202.77 30.9236 1.00 163,413,866 147,208,895 95,534,405 66,860,931 61,005,204 8.75 8.81 10.74 202.77 29.78
37 1.02 163,350,325 146,984,292 93,855,435 67,618,452 62,402,200 8.88 8.92 10.90 202.77 29.1738 1.04 162,990,167 146,391,624 88,142,664 69,621,676 66,530,279 9.24 9.10 11.32 202.77 26.9539 1.06 162,687,631 146,011,943 84,136,112 70,825,293 69,012,059 9.45 9.22 11.61 202.77 25.5440 1.08 162,418,596 145,687,328 81,941,941 71,675,400 70,757,066 9.61 9.32 11.78 202.77 24.9141 1.1 161,958,663 145,239,954 77,022,384 73,114,691 73,794,528 9.87 9.43 12.01 202.77 23.3842 1.12 161,715,486 144,974,952 76,337,965 73,754,376 74,761,151 9.97 9.54 12.12 202.77 23.2343 1.14 161,282,789 144,524,440 74,139,095 74,713,903 76,282,487 10.12 9.66 12.28 202.77 22.6444 1.16 160,393,985 143,478,731 70,610,743 76,271,030 79,628,190 10.40 9.93 12.63 202.77 21.8745 1.18 160,009,540 143,005,599 68,802,935 76,927,549 80,809,058 10.51 10.05 12.77 202.77 21.4646 1.2 159,750,944 142,701,727 67,614,646 77,306,309 81,529,923 10.57 10.12 12.87 202.77 21.2147 1.22 159,499,447 142,341,707 66,256,070 77,676,653 82,319,161 10.64 10.17 12.96 202.77 20.9148 1.24 159,295,897 142,113,953 65,799,438 77,945,994 82,837,707 10.69 10.22 13.02 202.77 20.8449 1.26 158,015,015 139,922,517 62,328,616 79,410,535 86,639,495 11.00 10.79 13.35 202.77 20.1850 1.28 157,863,368 139,693,840 61,865,282 79,595,707 86,985,252 11.03 10.85 13.39 202.77 20.0951 1.3 157,367,328 139,021,808 60,337,557 80,134,389 88,212,094 11.13 11.01 13.52 202.77 19.7952 1.32 157,072,032 138,672,839 59,388,993 80,428,981 88,960,379 11.19 11.11 13.59 202.77 19.6153 1.34 156,925,269 138,858,175 58,867,463 80,580,485 89,306,146 11.22 11.15 13.63 202.77 19.5154 1.36 155,676,400 136,824,618 55,643,325 81,582,097 92,525,863 11.47 11.45 13.85 202.77 18.9555 1.38 155,395,291 136,336,916 54,535,636 81,851,438 93,245,125 11.53 11.51 13.91 202.77 18.7356 1.4 154,835,151 135,675,444 53,218,993 82,339,618 94,564,453 11.64 11.64 14.02 202.77 18.5257 1.42 154,365,417 135,440,033 51,467,525 82,785,714 95,738,141 11.73 11.70 14.11 202.77 18.1558 1.44 154,006,200 134,626,269 50,782,641 83,063,472 96,541,596 11.79 11.76 14.17 202.77 18.0559 1.46 153,778,993 134,710,293 50,099,768 83,248,644 97,114,026 11.84 11.79 14.22 202.77 17.9260 1.48 153,362,897 133,681,893 48,817,500 83,534,819 98,184,577 11.92 11.84 14.30 202.77 17.6961 1.5 152,867,204 133,127,020 47,673,571 83,863,078 99,432,262 12.03 11.90 14.39 202.77 17.49
PIT BY PIT GRAPH - SCENARIO 2
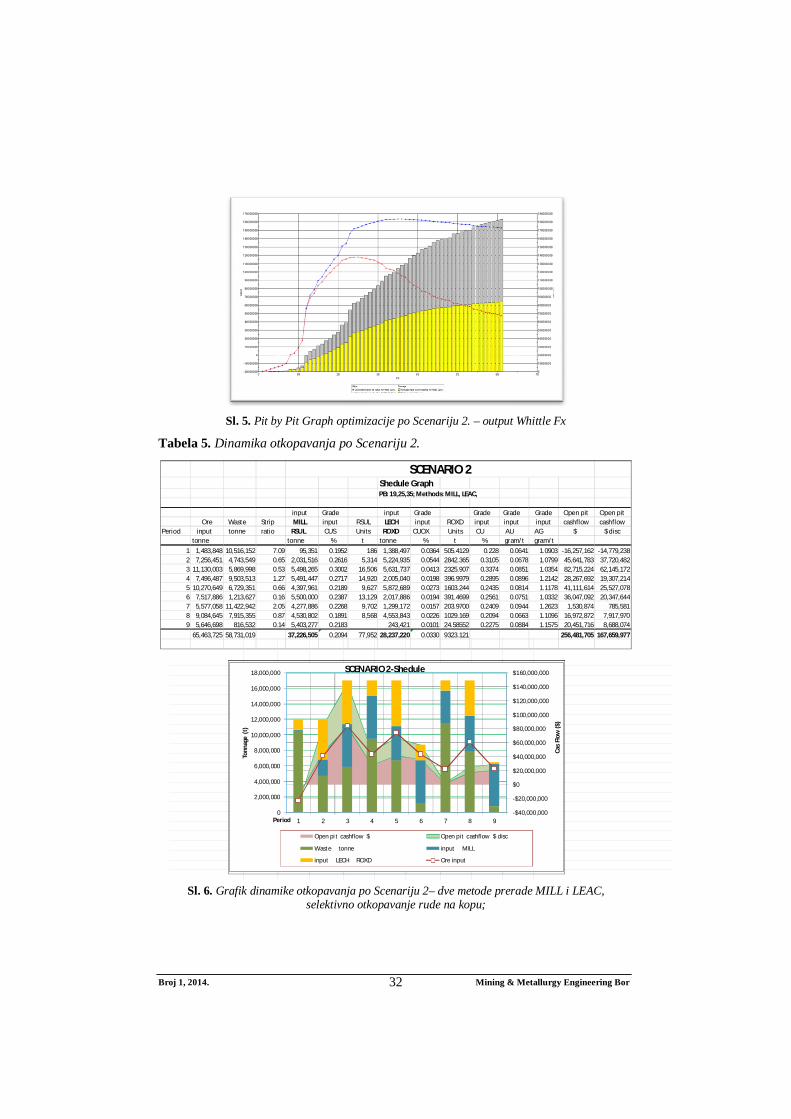
Broj 1, 2014. Mining & Metallurgy Engineering Bor 32
Sl. 5. Pit by Pit Graph optimizacije po Scenariju 2. – output Whittle Fx
Tabela 5. Dinamika otkopavanja po Scenariju 2.
Sl. 6. Grafik dinamike otkopavanja po Scenariju 2– dve metode prerade MILL i LEAC,
selektivno otkopavanje rude na kopu;
Shedule Graph PB: 19,25,35; Methods: MILL, LEAC, input Grade input Grade Grade Grade Grade Open pit Open pit Ore Waste Strip MILL input RSUL LECH input ROXD input input input cashflow cashflow Period input tonne ratio RSUL CUS Units ROXD CUOX Units CU AU AG $ $ disc tonne tonne % t tonne % t % gram/t gram/t
1 1,483,848 10,516,152 7.09 95,351 0.1952 186 1,388,497 0.0364 505.4129 0.228 0.0641 1.0903 -16,257,162 -14,779,2382 7,256,451 4,743,549 0.65 2,031,516 0.2616 5,314 5,224,935 0.0544 2842.365 0.3105 0.0678 1.0799 45,641,783 37,720,4823 11,130,003 5,869,998 0.53 5,498,265 0.3002 16,506 5,631,737 0.0413 2325.907 0.3374 0.0851 1.0354 82,715,224 62,145,1724 7,496,487 9,503,513 1.27 5,491,447 0.2717 14,920 2,005,040 0.0198 396.9979 0.2895 0.0896 1.2142 28,267,692 19,307,2145 10,270,649 6,729,351 0.66 4,397,961 0.2189 9,627 5,872,689 0.0273 1603.244 0.2435 0.0814 1.1178 41,111,614 25,527,0786 7,517,886 1,213,627 0.16 5,500,000 0.2387 13,129 2,017,886 0.0194 391.4699 0.2561 0.0751 1.0332 36,047,092 20,347,6447 5,577,058 11,422,942 2.05 4,277,886 0.2268 9,702 1,299,172 0.0157 203.9700 0.2409 0.0944 1.2623 1,530,874 785,5818 9,084,645 7,915,355 0.87 4,530,802 0.1891 8,568 4,553,843 0.0226 1029.169 0.2094 0.0663 1.1096 16,972,872 7,917,9709 5,646,698 816,532 0.14 5,403,277 0.2183 243,421 0.0101 24.58552 0.2275 0.0884 1.1575 20,451,716 8,688,074
65,463,725 58,731,019 37,226,505 0.2094 77,952 28,237,220 0.0330 9323.121 256,481,705 167,659,977
SCENARIO 2
-$40,000,000
-$20,000,000
$0
$20,000,000
$40,000,000
$60,000,000
$80,000,000
$100,000,000
$120,000,000
$140,000,000
$160,000,000
0
2,000,000
4,000,000
6,000,000
8,000,000
10,000,000
12,000,000
14,000,000
16,000,000
18,000,000
1 2 3 4 5 6 7 8 9
Cas
Flow
($)
Tonn
age
(t)
Period
SCENARIO 2-Shedule
Open pi t cashflow $ Open pit cashflow $ disc
Waste tonne input MILL
input LECH ROXD Ore input
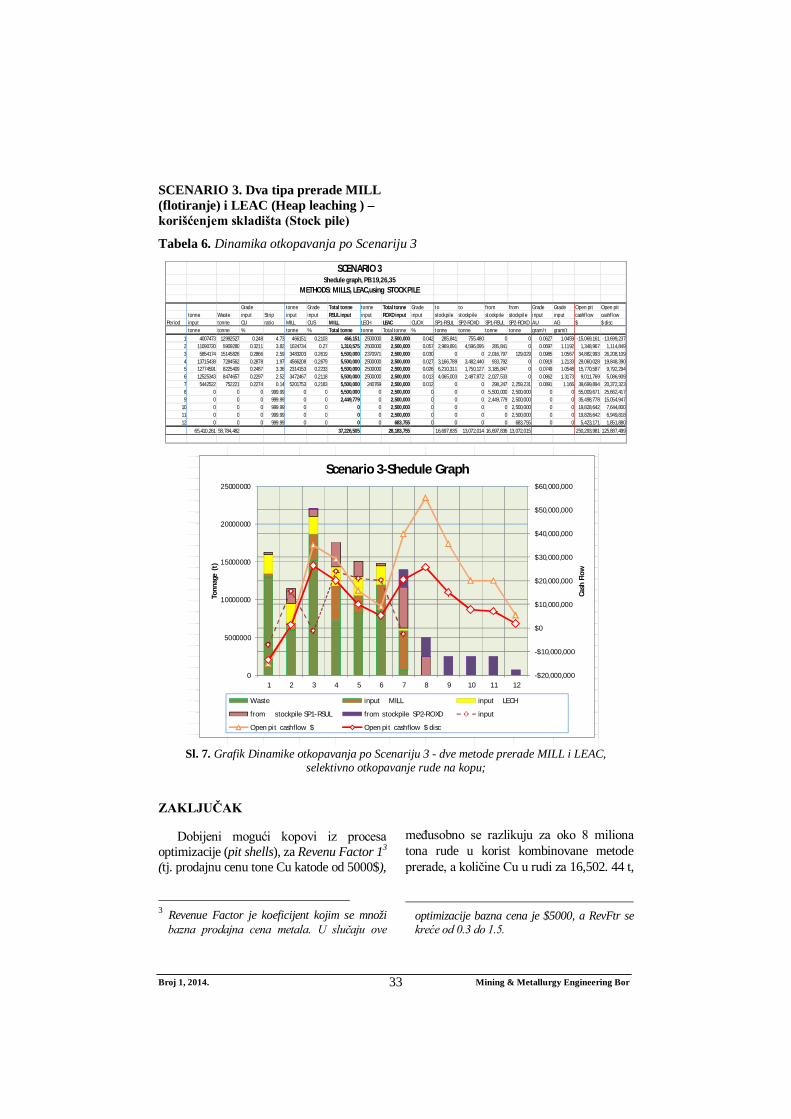
Broj 1, 2014. Mining & Metallurgy Engineering Bor 33
SCENARIO 3. Dva tipa prerade MILL (flotiranje) i LEAC (Heap leaching ) – korišćenjem skladišta (Stock pile)
Tabela 6. Dinamika otkopavanja po Scenariju 3
Sl. 7. Grafik Dinamike otkopavanja po Scenariju 3 - dve metode prerade MILL i LEAC,
selektivno otkopavanje rude na kopu;
ZAKLJUČAK
Dobijeni mogući kopovi iz procesa optimizacije (pit shells), za Revenu Factor 13 (tj. prodajnu cenu tone Cu katode od 5000$),
3 Revenue Factor je koeficijent kojim se množi
bazna prodajna cena metala. U slučaju ove
međusobno se razlikuju za oko 8 miliona tona rude u korist kombinovane metode prerade, a količine Cu u rudi za 16,502. 44 t,
optimizacije bazna cena je $5000, a RevFtr se kreće od 0.3 do 1.5.
Grade tonne Grade Total tonne tonne Total tonne Grade to to from from Grade Grade Open pit Open pit tonne Waste input Strip input input RSUL input input ROXD input input stockpile stockpile stockpile stockpile input input cashflow cashflow Period input tonne CU ratio MILL CUS MILL LECH LEAC CUOX SP1-RSUL SP2-ROXD SP1-RSUL SP2-ROXD AU AG $ $ disc tonne tonne % tonne % Total tonne tonne Total tonne % tonne tonne tonne tonne gram/t gram/t
1 4007473 12992527 0.248 4.73 466151 0.2103 466,151 2500000 2,500,000 0.042 285,841 755,480 0 0 0.0627 1.0459 -15,069,161 -13,699,2372 11090720 5909280 0.3211 3.82 1024734 0.27 1,310,575 2500000 2,500,000 0.057 2,969,891 4,596,095 285,841 0 0.0697 1.1192 1,348,967 1,114,8493 5854174 15145826 0.2866 2.59 3483203 0.2619 5,500,000 2370971 2,500,000 0.030 0 0 2,016,797 129,029 0.0985 1.0567 34,882,993 26,208,1094 13715438 7284562 0.2878 1.97 4566208 0.2679 5,500,000 2500000 2,500,000 0.027 3,166,789 3,482,440 933,792 0 0.0919 1.2133 29,060,028 19,848,3905 12774591 8225409 0.2487 3.36 2314153 0.2233 5,500,000 2500000 2,500,000 0.026 6,210,311 1,750,127 3,185,847 0 0.0749 1.0548 15,770,587 9,792,2946 12525343 8474657 0.2297 2.52 3472467 0.2118 5,500,000 2500000 2,500,000 0.013 4,065,003 2,487,872 2,027,533 0 0.0862 1.3173 9,011,769 5,086,9097 5442522 752221 0.2274 0.14 5201753 0.2183 5,500,000 240769 2,500,000 0.012 0 0 298,247 2,259,231 0.0891 1.166 39,699,894 20,372,3238 0 0 0 999.99 0 0 5,500,000 0 2,500,000 0 0 0 5,500,000 2,500,000 0 0 55,009,671 25,662,4179 0 0 0 999.99 0 0 2,449,779 0 2,500,000 0 0 0 2,449,779 2,500,000 0 0 35,498,778 15,054,947
10 0 0 0 999.99 0 0 0 0 2,500,000 0 0 0 0 2,500,000 0 0 19,828,642 7,644,80011 0 0 0 999.99 0 0 0 0 2,500,000 0 0 0 0 2,500,000 0 0 19,828,642 6,949,81812 0 0 0 999.99 0 0 0 0 683,755 0 0 0 0 683,755 0 0 5,423,171 1,851,880
65,410,261 58,784,482 37,226,505 28,183,755 16,697,835 13,072,014 16,697,836 13,072,015 250,293,981 125,887,499
SCENARIO 3Shedule graph, PB 19,26,35
METHODS: MILLS, LEAC,using STOCK PILE
-$20,000,000
-$10,000,000
$0
$10,000,000
$20,000,000
$30,000,000
$40,000,000
$50,000,000
$60,000,000
0
5000000
10000000
15000000
20000000
25000000
1 2 3 4 5 6 7 8 9 10 11 12
Cash
Flo
w
Tonn
age
(t)
Scenario 3-Shedule Graph
Waste input MILL input LECH
from stockpile SP1-RSUL from stockpile SP2-ROXD input
Open pit cashflow $ Open pit cashflow $ disc
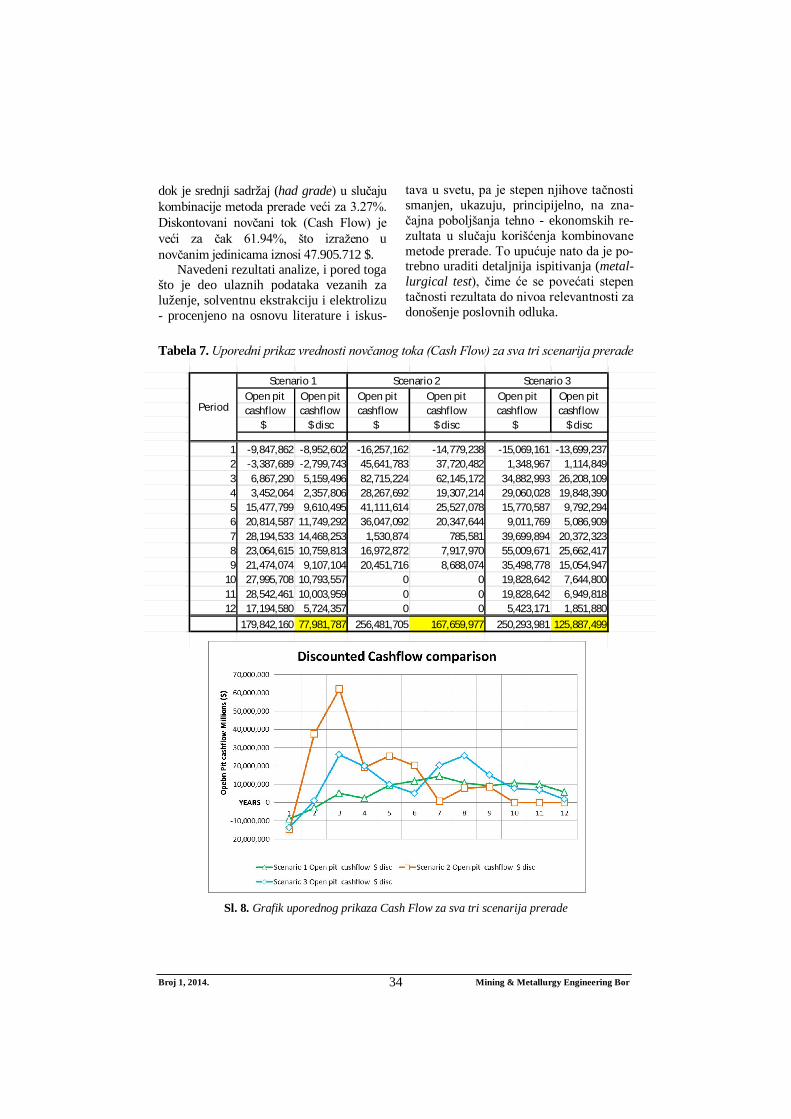
Broj 1, 2014. Mining & Metallurgy Engineering Bor 34
dok je srednji sadržaj (had grade) u slučaju kombinacije metoda prerade veći za 3.27%. Diskontovani novčani tok (Cash Flow) je veći za čak 61.94%, što izraženo u novčanim jedinicama iznosi 47.905.712 $.
Navedeni rezultati analize, i pored toga što je deo ulaznih podataka vezanih za luženje, solventnu ekstrakciju i elektrolizu - procenjeno na osnovu literature i iskus-
tava u svetu, pa je stepen njihove tačnosti smanjen, ukazuju, principijelno, na zna-čajna poboljšanja tehno - ekonomskih re-zultata u slučaju korišćenja kombinovane metode prerade. To upućuje nato da je po-trebno uraditi detaljnija ispitivanja (metal-lurgical test), čime će se povećati stepen tačnosti rezultata do nivoa relevantnosti za donošenje poslovnih odluka.
Tabela 7. Uporedni prikaz vrednosti novčanog toka (Cash Flow) za sva tri scenarija prerade
Sl. 8. Grafik uporednog prikaza Cash Flow za sva tri scenarija prerade
Open pit Open pit Open pit Open pit Open pit Open pit cashflow cashflow cashflow cashflow cashflow cashflow
$ $ disc $ $ disc $ $ disc
1 -9,847,862 -8,952,602 -16,257,162 -14,779,238 -15,069,161 -13,699,2372 -3,387,689 -2,799,743 45,641,783 37,720,482 1,348,967 1,114,8493 6,867,290 5,159,496 82,715,224 62,145,172 34,882,993 26,208,1094 3,452,064 2,357,806 28,267,692 19,307,214 29,060,028 19,848,3905 15,477,799 9,610,495 41,111,614 25,527,078 15,770,587 9,792,2946 20,814,587 11,749,292 36,047,092 20,347,644 9,011,769 5,086,9097 28,194,533 14,468,253 1,530,874 785,581 39,699,894 20,372,3238 23,064,615 10,759,813 16,972,872 7,917,970 55,009,671 25,662,4179 21,474,074 9,107,104 20,451,716 8,688,074 35,498,778 15,054,947
10 27,995,708 10,793,557 0 0 19,828,642 7,644,80011 28,542,461 10,003,959 0 0 19,828,642 6,949,81812 17,194,580 5,724,357 0 0 5,423,171 1,851,880
179,842,160 77,981,787 256,481,705 167,659,977 250,293,981 125,887,499
Scenario 2 Scenario 3Scenario 1
Period
Broj 1, 2014. Mining & Metallurgy Engineering Bor 35
Razlika u diskontovanom cashflow (zbirno i incremental po godinama) izmedju analiziranih scenarija 1. i 2. je značajna, dok između 2. i 3. nije prevelika, čak je u korist scenarija bez korišćenja stok pajlova, ali to može biti i posledica nedovoljnog pozna-vanja stvarnih tehno – ekonomskih para-metara procesa luženja.
U ovoj analizi su korišćeni delom literaturni podaci o luženju [1,7], delom su vrednosti procenjene na osnovu drugih, tuđih iskustava ili zaključaka i poređenja sa pirometalurškim načinom prerade gde postoji dovoljno podataka. Naročito je bitno za luženje na gomili (Heap Leac-hing) utvrditi: iskorišćenja osnovnog i plemenitih metala, kao i vremena luženja, troškove same metode luženja od pripre-me podloga za gomile rude koje će se tretirati, utroška kiseline, utroška folije za pripremu podloge, instalacije za razvod kiseline (cijanida) i drugih normativnih materijalakao i troškove dobijanja metala iz lužnih rastvora u metalurškom procesu prerade. Sve navedene troškove treba sve-sti na tonu rude, odnosno tonu finalnog proizvoda, na način kako softwer Whittle definiše i u analizi prihvata input troškova.
Autori članka nisu imali ambiciju da se u ovoj analizi bave samom tehnolo-gijom luženja (detaljnom tehnikom i hemizmom procesa luženja) obzirom da su drugih specijalnosti, već da uporede ekonomske efekte za navedene slučajeve primenjenih metoda ekstrakcije osnovnog i pratećih plemenitih metala i na osnovu toga izvuku određene zaključke, prezen-tirane u radu.
Dosadašnje mišljenje dela stručne jav-nosti kao i stanovništva na lokalitetima rudnih ležišta - Cerovo Kraku Bugaresku, Ujova reka i drugih sadašnjih i potencijalnih lokaleta na kojima su ležišta sa sličnim karakteristikama, je da je postupak luženja vrlo rizičan po zaštitu životne sredine.Takvo mišljenje je demantovano u svetu, pored ostalog i time što se od ukupne svetske proizvodnje bakra, oko 20% dobija luže-
njem. To rade i najrazvijenije države u svetu, koje mnogo vise vode računa o zaštiti životne sredine nego mi, i čiji su propisi iz ove oblasti daleko strožiji od naših (SAD, Čile, Kanada, Južnoafrička Republika i dr.).
Svrha ove analize je da ukaže na po-tencijalnu, alternativnu metodu kojom se može uvećati dobit od eksploatacije ležišta koja sadrže povećani sadržaj oksidnih minerala u rudi koji negativno utiču na iskorišćenje metala pri flotacijskoj metodi obogaćivanja. Analiza ovog tipa čaki ako se radi o dilemi da li uopšte eksploatisati takva ležišta tj. da li je ekonomika eksploatacije zadovoljavajuća, o čemu pos-toje u ovdašnjoj stručnoj javnosti oprečna mišljenja, mogu dati odgovarajuće podatke za relevantnu kvalifikovanu ocenu i odluku.
Važno napomenuti i to da je trend tehnologije luženja – luženje i sulfidnih koncentrata.
LITERATURA
[1] J. Peacey1, G. Xian-Jian1, E. Robles2: ,Copper Hydrometallurgy-Current Sta-tus, Preliminary Economics, Future Direction and Positioning Versus Smelting, J. Peacey1, GUO Xian-Jian1, E. Robles 2,1.Hatch Associates Ltd., 2800 Speakman Drive, Mississauaga, Ontario L5K 2R7, Canada; 2Hatch IngenierosyConsultores Ltda., San Sebastian 283, Piso 9, Los Condes, Santiago 6760226, Chile;
[2] J. F. Lupo: Design and Operation of Heap Leach Pads, By: John F. Lupo, Ph.D. Golder Asociates;
[3] C. Avendaño Varas: Review on Heap Leaching of Copper Ores, Carlos Avendaño Varas, Chemical Engenieer, Sociedad Terral S.A;
[4] R. Denis, M. Marcotte: 1,7 Million Square Meters PVC Heap Leach Pad Case History,Robert Denis, Solmax International Inc., Varennes, Qc.,
Broj 1, 2014. Mining & Metallurgy Engineering Bor 36
Canada, Michel Marcotte, Genivar, Montreal, Qc., Canada, Draft paper submitted for publication GeoAfrica 2009;
[5] M. E. Orman, D. Romo, R. Tremayne: A Case Study of the Ocampo Phase 1 Heap Leach Expansion or Changing a Flat Pad to a Valley Fill, By: Marc E. Orman, David Romo, Russell Tremayne;
[6] Whittle Strategic Mine Planning, Gemcom Whittle™ Copyright © 2012 Gemcom Software International Inc.;
[7] G. Hovanec, Osvrt na osnovne eko-nomske aspekte proizvodnje bakra primenom postupka kiselinskog luženja, Rudarski institut, Beograd;
[8] Z. Vaduvesković, M. Bugarin, D. Krža-nović, Analiza kašnjenja u raskrivanju u odnosu na projektovani dugoročni plan otkopavanja na površinskom kopu Veliki Krivelj, Mining and Metallurgy Engineering Bor, 2/2013, str. 43-52.
[9] J. Vukašinović, J. Đorđević Bolja-nović, Rudarska industrija u ekonomiji znanja, Mining and Metallurgy Engineering Bor, 2/2013, str. 127-134..
No. 1, 2014 Mining & Metallurgy Engineering Bor 37
MINING AND METALLURGY INSTITUTE BOR ISSN: 2334-8836 UDK: 622
UDK: 622.271/.68:622.73:681.325(045)=20 DOI:10.5937/MMEB1401037K
Vedran Kostić*, Zoran Vaduvesković*, Daniel Kržanović*
SELECTION OF THE OPTIMUM LOCATION OF THE PRIMARY ORE CRUSHING AT THE OPEN PIT SOUTH MINING DISTRICT
USING THE COMPARATIVE ANALYSIS OF SIMULATION RESULTS OF THE TRUCK TRANSPORT
Abstract
This work presents the procedure of transport simulation at the Open Pit South Mining District for two locations of the primary ore crushing and comparison of the achieved capacities and consumption of normative material, in order to determine the optimum location. Simulation was performed using the haulage and loading simulation software, Talpac.
Keywords: simulation, Talpac, transport routes, location of primary crushing.
* Mining and Metallurgy Institute Bor, [email protected]
INTRODUCTION
Copper deposit the South Mining Dis-trict - Majdanpek is located close to the town of Majdanpek in the basin of the river Mali Pek. The open pit South Mining Dis-trict, where the exploitation begun in 1959, is located within the copper deposit South Mining District – Majdanpek. The infra-structural facilities are situated in the imme-diate vicinity of the deposit that are used for ore processing as well as the truck waste landfills and flotation tailing dump. The open pit South Mining District is located at a distance of 0,5 km from the open pit North Mining District, which is also located near the town of Majdanpek (Figure 1).
The Feasibility Study has defined the dynamics of exploitation of the copper ore deposit South Mining District, with the an
nual capacity of ore mining of 8 500 000 t/year [1,2]. Dynamics of the Study has de-fined that only waste will be excavated in the first year in the operations Andesite Fin-ger in the northwestern part of the open pit and the East in the eastern part of the open pit, while the ore will be excavated from the second year.
The primary ore crushing plant is lo-cated in the western side of the final con-tour of open pit, at elevation of K+375, while the waste will be transported pri-marily to the external landfills and after repairing the transport system for waste, to the crushing plant of this system TS-1 [1.3]. The fragmented waste is transported by the transport systems TS-1 to the land-fill Ujevac.
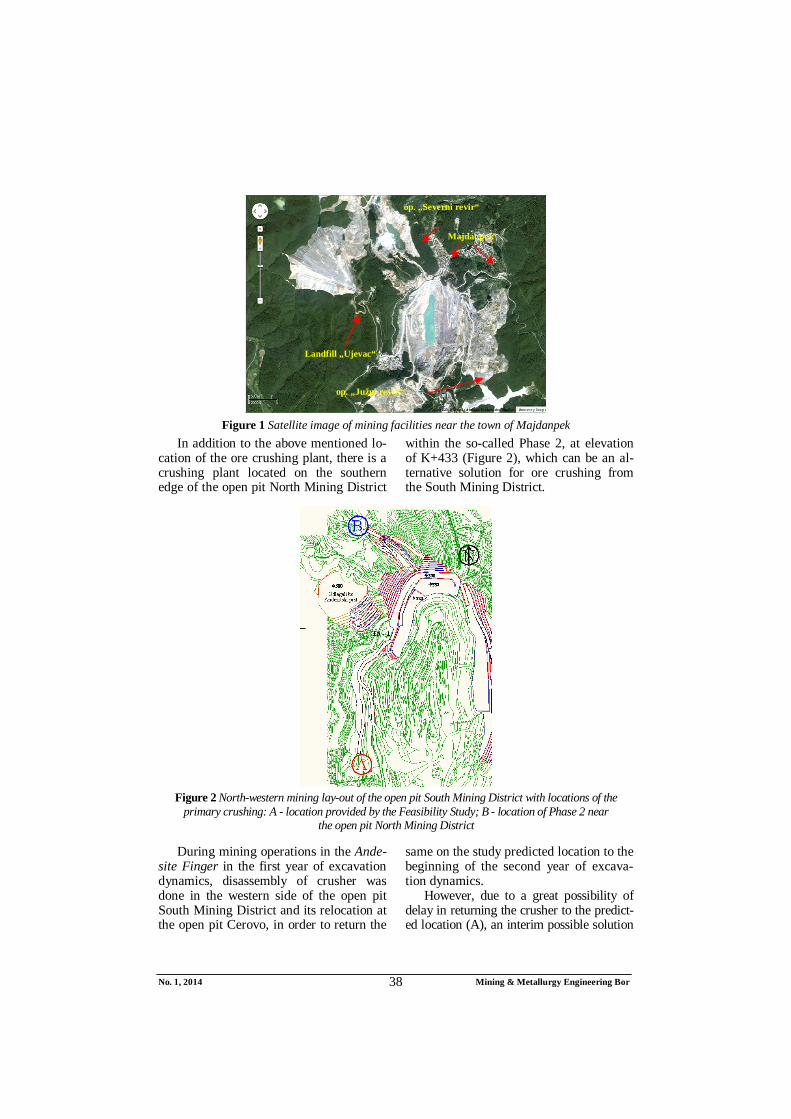
No. 1, 2014 Mining & Metallurgy Engineering Bor 38
Figure 1 Satellite image of mining facilities near the town of Majdanpek
In addition to the above mentioned lo-cation of the ore crushing plant, there is a crushing plant located on the southern edge of the open pit North Mining District
within the so-called Phase 2, at elevation of K+433 (Figure 2), which can be an al-ternative solution for ore crushing from the South Mining District.
Figure 2 North-western mining lay-out of the open pit South Mining District with locations of the
primary crushing: A - location provided by the Feasibility Study; B - location of Phase 2 near the open pit North Mining District
During mining operations in the Ande-
site Finger in the first year of excavation dynamics, disassembly of crusher was done in the western side of the open pit South Mining District and its relocation at the open pit Cerovo, in order to return the
same on the study predicted location to the beginning of the second year of excava-tion dynamics.
However, due to a great possibility of delay in returning the crusher to the predict-ed location (A), an interim possible solution
Majdanpek
op. „Severni revir“
Landfill „Ujevac“
op. „Južni revir“
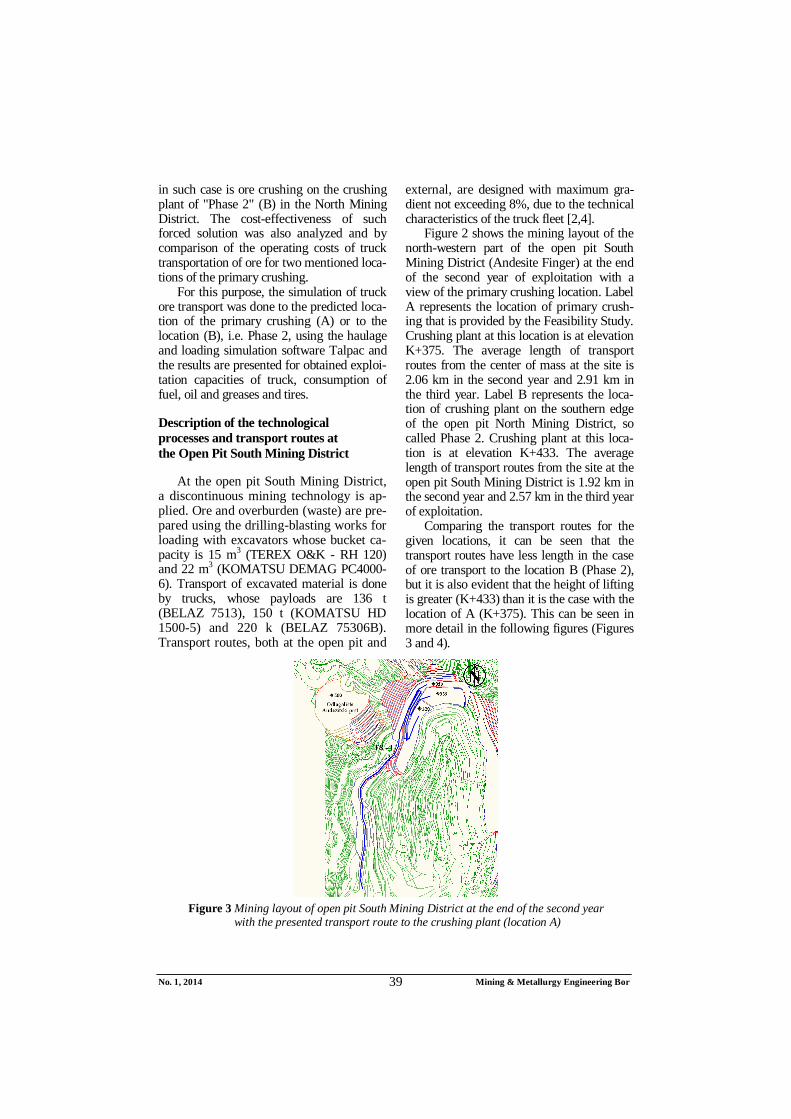
No. 1, 2014 Mining & Metallurgy Engineering Bor 39
in such case is ore crushing on the crushing plant of "Phase 2" (B) in the North Mining District. The cost-effectiveness of such forced solution was also analyzed and by comparison of the operating costs of truck transportation of ore for two mentioned loca-tions of the primary crushing.
For this purpose, the simulation of truck ore transport was done to the predicted loca-tion of the primary crushing (A) or to the location (B), i.e. Phase 2, using the haulage and loading simulation software Talpac and the results are presented for obtained exploi-tation capacities of truck, consumption of fuel, oil and greases and tires.
Description of the technological processes and transport routes at the Open Pit South Mining District
At the open pit South Mining District, a discontinuous mining technology is ap-plied. Ore and overburden (waste) are pre-pared using the drilling-blasting works for loading with excavators whose bucket ca-pacity is 15 m3 (TEREX O&K - RH 120) and 22 m3 (KOMATSU DEMAG PC4000-6). Transport of excavated material is done by trucks, whose payloads are 136 t (BELAZ 7513), 150 t (KOMATSU HD 1500-5) and 220 k (BELAZ 75306B). Transport routes, both at the open pit and
external, are designed with maximum gra-dient not exceeding 8%, due to the technical characteristics of the truck fleet [2,4].
Figure 2 shows the mining layout of the north-western part of the open pit South Mining District (Andesite Finger) at the end of the second year of exploitation with a view of the primary crushing location. Label A represents the location of primary crush-ing that is provided by the Feasibility Study. Crushing plant at this location is at elevation K+375. The average length of transport routes from the center of mass at the site is 2.06 km in the second year and 2.91 km in the third year. Label B represents the loca-tion of crushing plant on the southern edge of the open pit North Mining District, so called Phase 2. Crushing plant at this loca-tion is at elevation K+433. The average length of transport routes from the site at the open pit South Mining District is 1.92 km in the second year and 2.57 km in the third year of exploitation.
Comparing the transport routes for the given locations, it can be seen that the transport routes have less length in the case of ore transport to the location B (Phase 2), but it is also evident that the height of lifting is greater (K+433) than it is the case with the location of A (K+375). This can be seen in more detail in the following figures (Figures 3 and 4).
Figure 3 Mining layout of open pit South Mining District at the end of the second year
with the presented transport route to the crushing plant (location A)
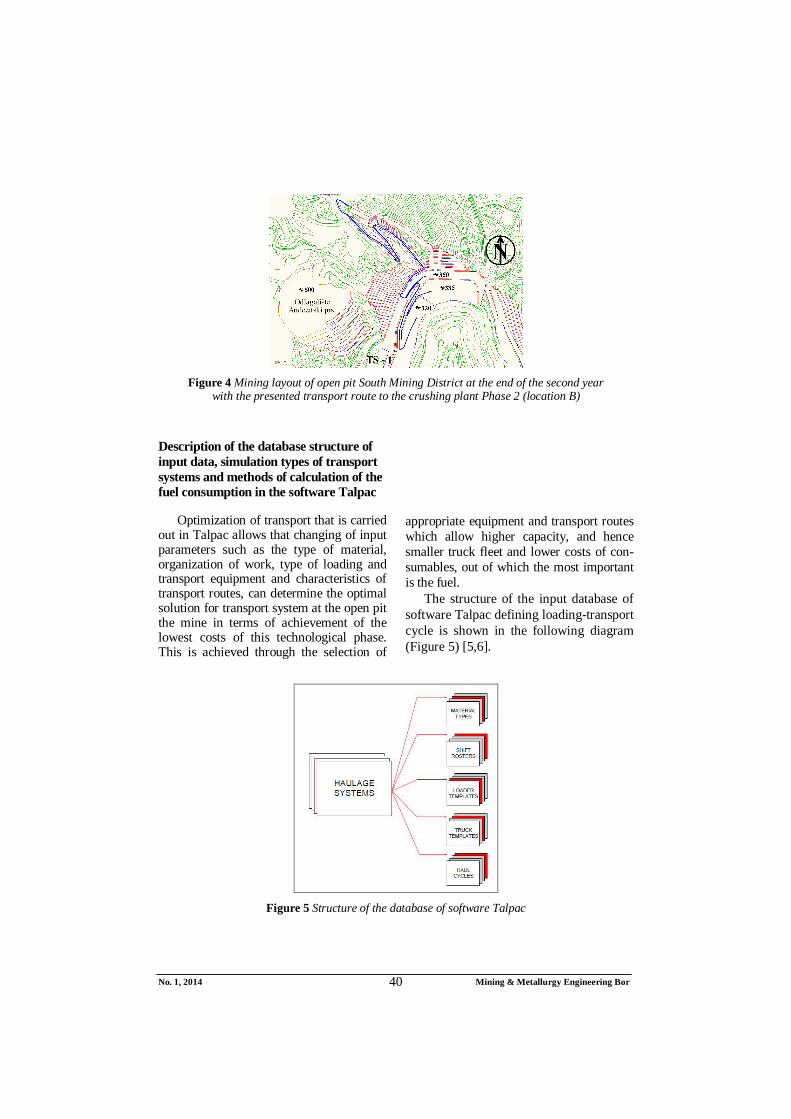
No. 1, 2014 Mining & Metallurgy Engineering Bor 40
Figure 4 Mining layout of open pit South Mining District at the end of the second year with the presented transport route to the crushing plant Phase 2 (location B)
Description of the database structure of input data, simulation types of transport systems and methods of calculation of the fuel consumption in the software Talpac
Optimization of transport that is carried out in Talpac allows that changing of input parameters such as the type of material, organization of work, type of loading and transport equipment and characteristics of transport routes, can determine the optimal solution for transport system at the open pit the mine in terms of achievement of the lowest costs of this technological phase. This is achieved through the selection of
appropriate equipment and transport routes which allow higher capacity, and hence smaller truck fleet and lower costs of con-sumables, out of which the most important is the fuel.
The structure of the input database of software Talpac defining loading-transport cycle is shown in the following diagram (Figure 5) [5,6].
Figure 5 Structure of the database of software Talpac
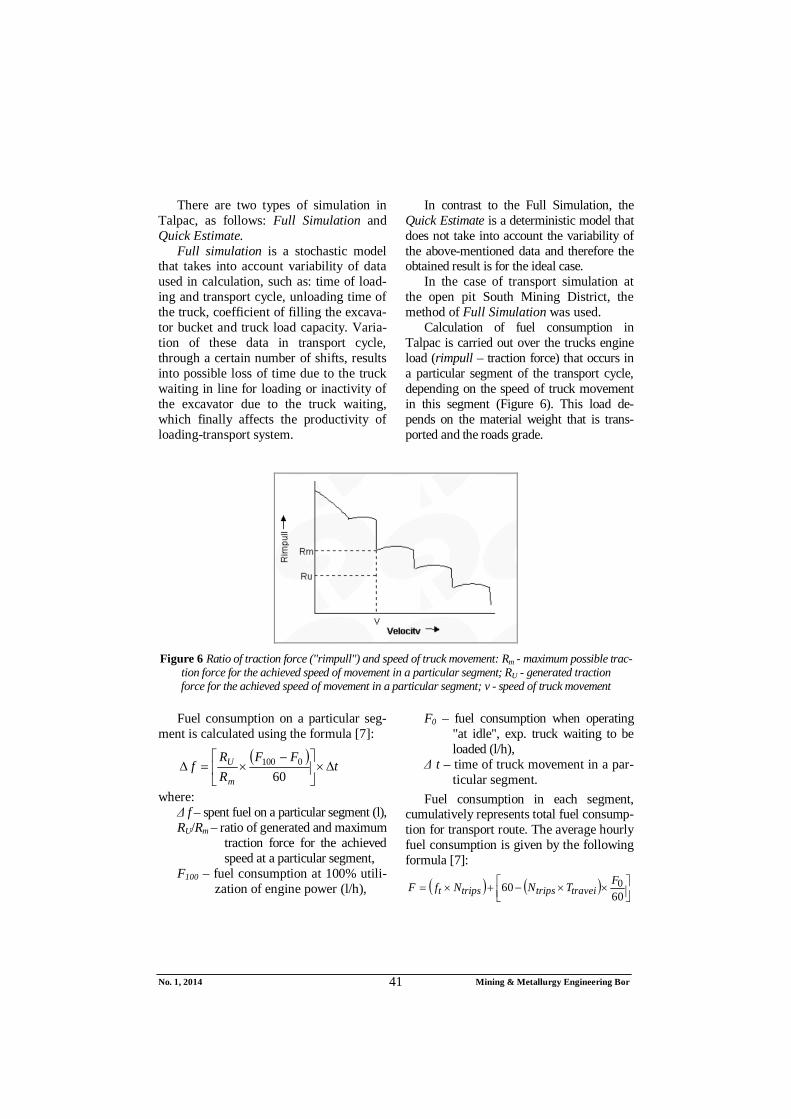
No. 1, 2014 Mining & Metallurgy Engineering Bor 41
There are two types of simulation in
Talpac, as follows: Full Simulation and Quick Estimate.
Full simulation is a stochastic model that takes into account variability of data used in calculation, such as: time of load-ing and transport cycle, unloading time of the truck, coefficient of filling the excava-tor bucket and truck load capacity. Varia-tion of these data in transport cycle, through a certain number of shifts, results into possible loss of time due to the truck waiting in line for loading or inactivity of the excavator due to the truck waiting, which finally affects the productivity of loading-transport system.
In contrast to the Full Simulation, the Quick Estimate is a deterministic model that does not take into account the variability of the above-mentioned data and therefore the obtained result is for the ideal case.
In the case of transport simulation at the open pit South Mining District, the method of Full Simulation was used.
Calculation of fuel consumption in Talpac is carried out over the trucks engine load (rimpull – traction force) that occurs in a particular segment of the transport cycle, depending on the speed of truck movement in this segment (Figure 6). This load de-pends on the material weight that is trans-ported and the roads grade.
Figure 6 Ratio of traction force ("rimpull") and speed of truck movement: Rm - maximum possible trac-
tion force for the achieved speed of movement in a particular segment; RU - generated traction force for the achieved speed of movement in a particular segment; v - speed of truck movement
Fuel consumption on a particular seg-
ment is calculated using the formula [7]:
t
FFRR
fm
U
600100
where: Δ f – spent fuel on a particular segment (l), RU/Rm – ratio of generated and maximum
traction force for the achieved speed at a particular segment,
F100 – fuel consumption at 100% utili-zation of engine power (l/h),
F0 – fuel consumption when operating "at idle", exp. truck waiting to be loaded (l/h),
Δ t – time of truck movement in a par-ticular segment.
Fuel consumption in each segment, cumulatively represents total fuel consump-tion for transport route. The average hourly fuel consumption is given by the following formula [7]:
6060 0FTNNfF traveitripstripst
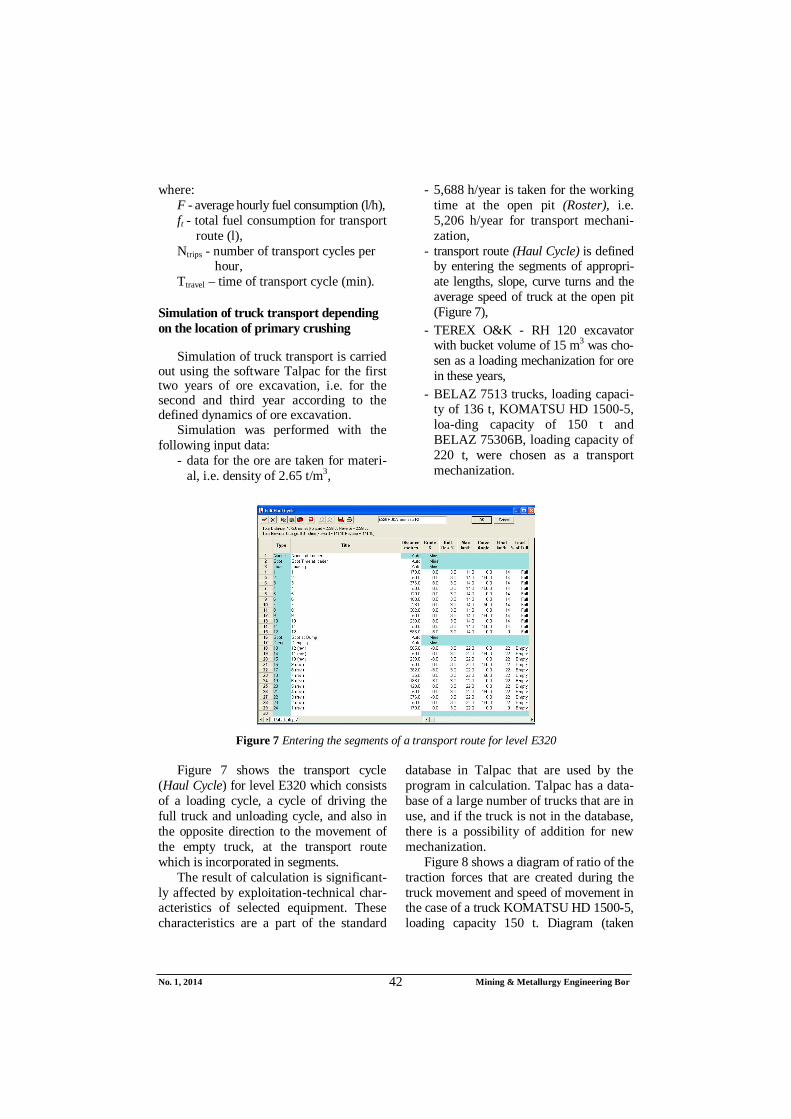
No. 1, 2014 Mining & Metallurgy Engineering Bor 42
where: F - average hourly fuel consumption (l/h), ft - total fuel consumption for transport
route (l), Ntrips - number of transport cycles per
hour, Ttravel – time of transport cycle (min).
Simulation of truck transport depending on the location of primary crushing
Simulation of truck transport is carried out using the software Talpac for the first two years of ore excavation, i.e. for the second and third year according to the defined dynamics of ore excavation.
Simulation was performed with the following input data:
- data for the ore are taken for materi-al, i.e. density of 2.65 t/m3,
- 5,688 h/year is taken for the working time at the open pit (Roster), i.e. 5,206 h/year for transport mechani-zation,
- transport route (Haul Cycle) is defined by entering the segments of appropri-ate lengths, slope, curve turns and the average speed of truck at the open pit (Figure 7),
- TEREX O&K - RH 120 excavator with bucket volume of 15 m3 was cho-sen as a loading mechanization for ore in these years,
- BELAZ 7513 trucks, loading capaci-ty of 136 t, KOMATSU HD 1500-5, loa-ding capacity of 150 t and BELAZ 75306B, loading capacity of 220 t, were chosen as a transport mechanization.
Figure 7 Entering the segments of a transport route for level E320
Figure 7 shows the transport cycle
(Haul Cycle) for level E320 which consists of a loading cycle, a cycle of driving the full truck and unloading cycle, and also in the opposite direction to the movement of the empty truck, at the transport route which is incorporated in segments.
The result of calculation is significant-ly affected by exploitation-technical char-acteristics of selected equipment. These characteristics are a part of the standard
database in Talpac that are used by the program in calculation. Talpac has a data-base of a large number of trucks that are in use, and if the truck is not in the database, there is a possibility of addition for new mechanization.
Figure 8 shows a diagram of ratio of the traction forces that are created during the truck movement and speed of movement in the case of a truck KOMATSU HD 1500-5, loading capacity 150 t. Diagram (taken
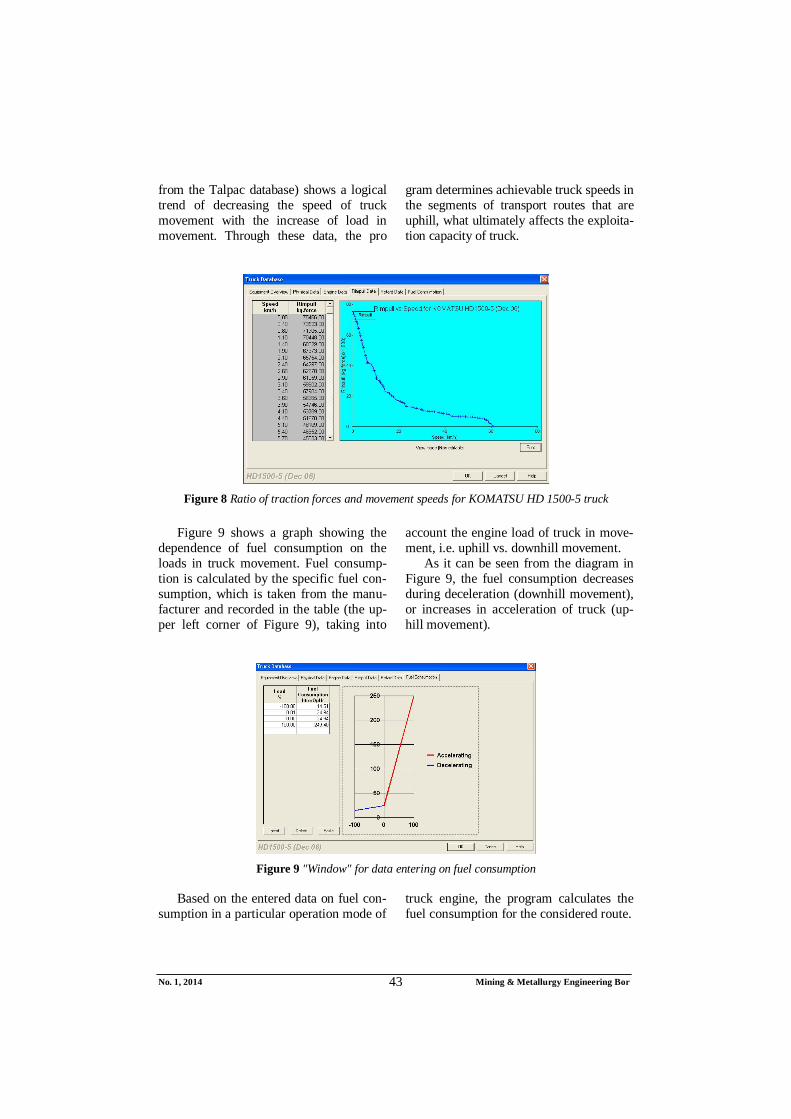
No. 1, 2014 Mining & Metallurgy Engineering Bor 43
from the Talpac database) shows a logical trend of decreasing the speed of truck movement with the increase of load in movement. Through these data, the pro
gram determines achievable truck speeds in the segments of transport routes that are uphill, what ultimately affects the exploita-tion capacity of truck.
Figure 8 Ratio of traction forces and movement speeds for KOMATSU HD 1500-5 truck
Figure 9 shows a graph showing the
dependence of fuel consumption on the loads in truck movement. Fuel consump-tion is calculated by the specific fuel con-sumption, which is taken from the manu-facturer and recorded in the table (the up-per left corner of Figure 9), taking into
account the engine load of truck in move-ment, i.e. uphill vs. downhill movement.
As it can be seen from the diagram in Figure 9, the fuel consumption decreases during deceleration (downhill movement), or increases in acceleration of truck (up-hill movement).
Figure 9 "Window" for data entering on fuel consumption
Based on the entered data on fuel con-
sumption in a particular operation mode of truck engine, the program calculates the fuel consumption for the considered route.
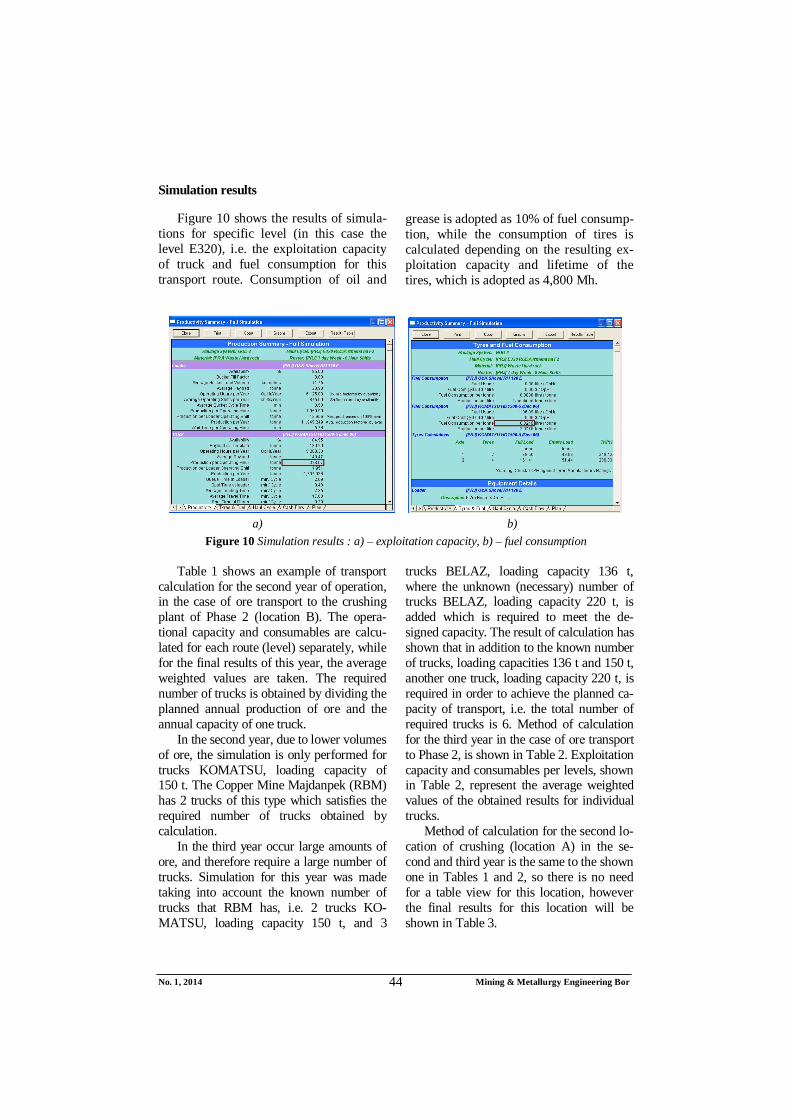
No. 1, 2014 Mining & Metallurgy Engineering Bor 44
Simulation results
Figure 10 shows the results of simula-tions for specific level (in this case the level E320), i.e. the exploitation capacity of truck and fuel consumption for this transport route. Consumption of oil and
grease is adopted as 10% of fuel consump-tion, while the consumption of tires is calculated depending on the resulting ex-ploitation capacity and lifetime of the tires, which is adopted as 4,800 Mh.
a) b)
Figure 10 Simulation results : a) – exploitation capacity, b) – fuel consumption
Table 1 shows an example of transport calculation for the second year of operation, in the case of ore transport to the crushing plant of Phase 2 (location B). The opera-tional capacity and consumables are calcu-lated for each route (level) separately, while for the final results of this year, the average weighted values are taken. The required number of trucks is obtained by dividing the planned annual production of ore and the annual capacity of one truck.
In the second year, due to lower volumes of ore, the simulation is only performed for trucks KOMATSU, loading capacity of 150 t. The Copper Mine Majdanpek (RBM) has 2 trucks of this type which satisfies the required number of trucks obtained by calculation.
In the third year occur large amounts of ore, and therefore require a large number of trucks. Simulation for this year was made taking into account the known number of trucks that RBM has, i.e. 2 trucks KO-MATSU, loading capacity 150 t, and 3
trucks BELAZ, loading capacity 136 t, where the unknown (necessary) number of trucks BELAZ, loading capacity 220 t, is added which is required to meet the de-signed capacity. The result of calculation has shown that in addition to the known number of trucks, loading capacities 136 t and 150 t, another one truck, loading capacity 220 t, is required in order to achieve the planned ca-pacity of transport, i.e. the total number of required trucks is 6. Method of calculation for the third year in the case of оrе transport to Phase 2, is shown in Table 2. Exploitation capacity and consumables per levels, shown in Table 2, represent the average weighted values of the obtained results for individual trucks.
Method of calculation for the second lo-cation of crushing (location A) in the se-cond and third year is the same to the shown one in Tables 1 and 2, so there is no need for a table view for this location, however the final results for this location will be shown in Table 3.
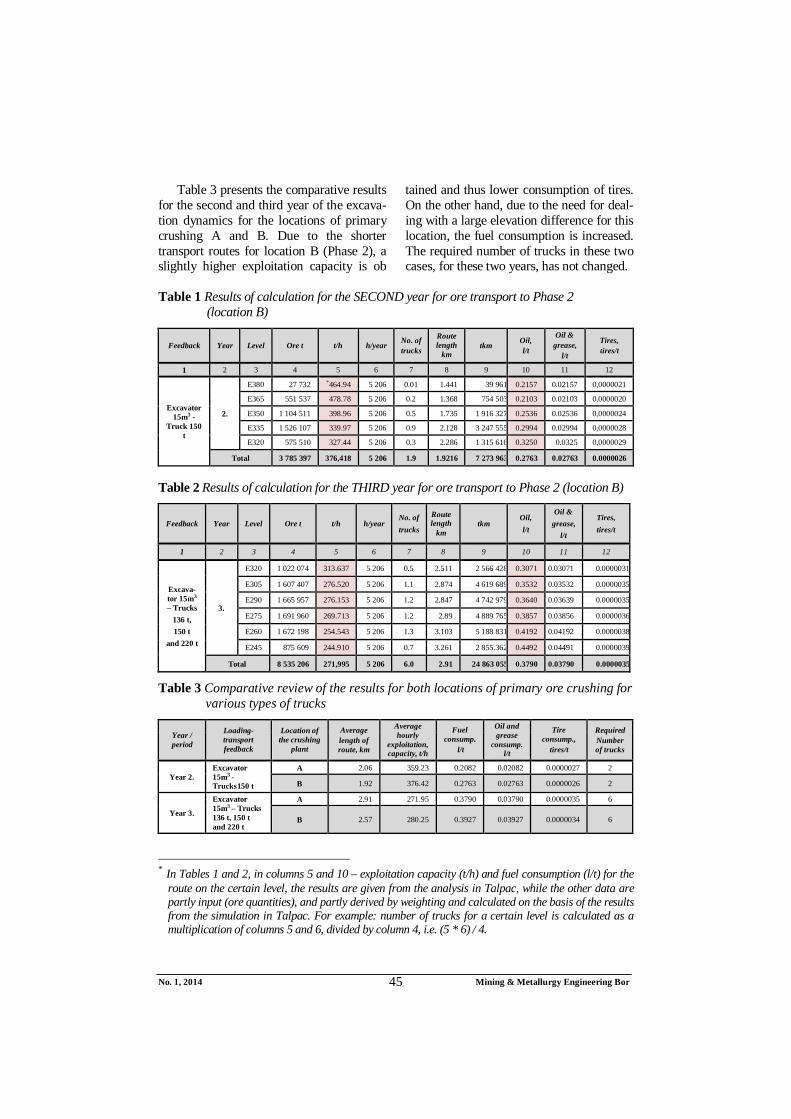
No. 1, 2014 Mining & Metallurgy Engineering Bor 45
Table 3 presents the comparative results for the second and third year of the excava-tion dynamics for the locations of primary crushing A and B. Due to the shorter transport routes for location B (Phase 2), a slightly higher exploitation capacity is ob
tained and thus lower consumption of tires. On the other hand, due to the need for deal-ing with a large elevation difference for this location, the fuel consumption is increased. The required number of trucks in these two cases, for these two years, has not changed.
Table 1 Results of calculation for the SECOND year for ore transport to Phase 2 (location B)
Feedback Year Level Ore t t/h h/year No. of trucks
Route length
km tkm Oil,
l/t
Oil & grease,
l/t
Tires, tires/t
1 2 3 4 5 6 7 8 9 10 11 12
Excavator 15m3 -
Truck 150 t
2.
E380 27 732 *464.94 5 206 0.01 1.441 39 961 0.2157 0.02157 0,0000021
E365 551 537 478.78 5 206 0.2 1.368 754 503 0.2103 0.02103 0,0000020
E350 1 104 511 398.96 5 206 0.5 1.735 1 916 327 0.2536 0.02536 0,0000024
E335 1 526 107 339.97 5 206 0.9 2.128 3 247 555 0.2994 0.02994 0,0000028
E320 575 510 327.44 5 206 0.3 2.286 1 315 616 0.3250 0.0325 0,0000029
Total 3 785 397 376,418 5 206 1.9 1.9216 7 273 963 0.2763 0.02763 0.0000026
Table 2 Results of calculation for the THIRD year for ore transport to Phase 2 (location B)
Feedback Year Level Ore t t/h h/year No. of trucks
Route length
km tkm
Oil, l/t
Oil & grease,
l/t
Tires, tires/t
1 2 3 4 5 6 7 8 9 10 11 12
Excava-tor 15m3 – Trucks
136 t, 150 t
and 220 t
3.
E320 1 022 074 313.637 5 206 0.5 2.511 2 566 428 0.3071 0.03071 0.0000031
E305 1 607 407 276.520 5 206 1.1 2.874 4 619 689 0.3532 0.03532 0.0000035
E290 1 665 957 276.153 5 206 1.2 2.847 4 742 979 0.3640 0.03639 0.0000035
E275 1 691 960 269.713 5 206 1.2 2.89 4 889 765 0.3857 0.03856 0.0000036
E260 1 672 198 254.543 5 206 1.3 3.103 5 188 831 0.4192 0.04192 0.0000038
E245 875 609 244.910 5 206 0.7 3.261 2 855.362 0.4492 0.04491 0.0000039
Total 8 535 206 271,995 5 206 6.0 2.91 24 863 055 0.3790 0.03790 0.0000035
Table 3 Comparative review of the results for both locations of primary ore crushing for various types of trucks
Year / period
Loading-transport feedback
Location of the crushing
plant
Average length of route, km
Average hourly
exploitation, capacity, t/h
Fuel consump.
l/t
Oil and grease
consump. l/t
Tire consump.,
tires/t
Required Number of trucks
Year 2. Excavator 15m3 - Trucks150 t
A 2.06 359.23 0.2082 0.02082 0.0000027 2
B 1.92 376.42 0.2763 0.02763 0.0000026 2
Year 3.
Excavator 15m3 – Trucks 136 t, 150 t and 220 t
A 2.91 271.95 0.3790 0.03790 0.0000035 6
B 2.57 280.25 0.3927 0.03927 0.0000034 6
* In Tables 1 and 2, in columns 5 and 10 – exploitation capacity (t/h) and fuel consumption (l/t) for the
route on the certain level, the results are given from the analysis in Talpac, while the other data are partly input (ore quantities), and partly derived by weighting and calculated on the basis of the results from the simulation in Talpac. For example: number of trucks for a certain level is calculated as a multiplication of columns 5 and 6, divided by column 4, i.e. (5 * 6) / 4.
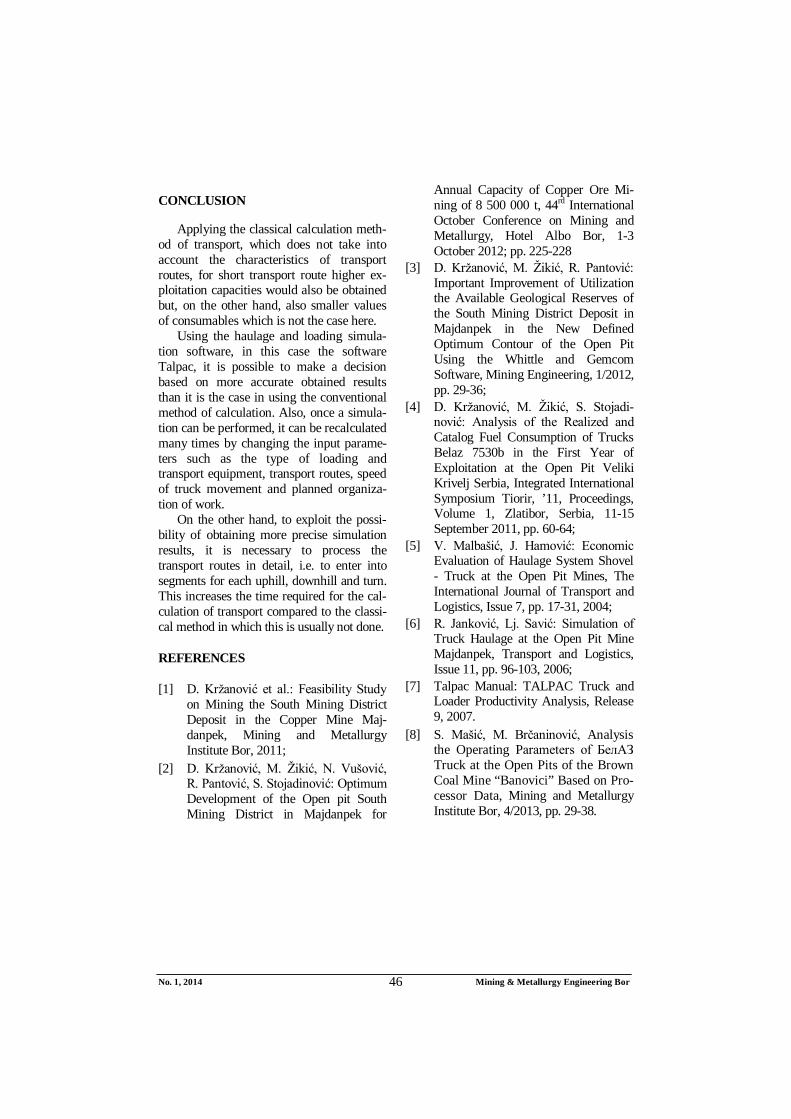
No. 1, 2014 Mining & Metallurgy Engineering Bor 46
CONCLUSION
Applying the classical calculation meth-od of transport, which does not take into account the characteristics of transport routes, for short transport route higher ex-ploitation capacities would also be obtained but, on the other hand, also smaller values of consumables which is not the case here.
Using the haulage and loading simula-tion software, in this case the software Talpac, it is possible to make a decision based on more accurate obtained results than it is the case in using the conventional method of calculation. Also, once a simula-tion can be performed, it can be recalculated many times by changing the input parame-ters such as the type of loading and transport equipment, transport routes, speed of truck movement and planned organiza-tion of work.
On the other hand, to exploit the possi-bility of obtaining more precise simulation results, it is necessary to process the transport routes in detail, i.e. to enter into segments for each uphill, downhill and turn. This increases the time required for the cal-culation of transport compared to the classi-cal method in which this is usually not done.
REFERENCES
[1] D. Kržanović et al.: Feasibility Study on Mining the South Mining District Deposit in the Copper Mine Maj-danpek, Mining and Metallurgy Institute Bor, 2011;
[2] D. Kržanović, M. Žikić, N. Vušović, R. Pantović, S. Stojadinović: Optimum Development of the Open pit South Mining District in Majdanpek for
Annual Capacity of Copper Ore Mi-ning of 8 500 000 t, 44rd International October Conference on Mining and Metallurgy, Hotel Albo Bor, 1-3 October 2012; pp. 225-228
[3] D. Kržanović, M. Žikić, R. Pantović: Important Improvement of Utilization the Available Geological Reserves of the South Mining District Deposit in Majdanpek in the New Defined Optimum Contour of the Open Pit Using the Whittle and Gemcom Software, Mining Engineering, 1/2012, pp. 29-36;
[4] D. Kržanović, M. Žikić, S. Stojadi-nović: Analysis of the Realized and Catalog Fuel Consumption of Trucks Belaz 7530b in the First Year of Exploitation at the Open Pit Veliki Krivelj Serbia, Integrated International Symposium Tiorir, ’11, Proceedings, Volume 1, Zlatibor, Serbia, 11-15 September 2011, pp. 60-64;
[5] V. Malbašić, J. Hamović: Economic Evaluation of Haulage System Shovel - Truck at the Open Pit Mines, The International Journal of Transport and Logistics, Issue 7, pp. 17-31, 2004;
[6] R. Janković, Lj. Savić: Simulation of Truck Haulage at the Open Pit Mine Majdanpek, Transport and Logistics, Issue 11, pp. 96-103, 2006;
[7] Talpac Manual: TALPAC Truck and Loader Productivity Analysis, Release 9, 2007.
[8] S. Mašić, M. Brčaninović, Analysis the Operating Parameters of БелАЗ Truck at the Open Pits of the Brown Coal Mine “Banovici” Based on Pro-cessor Data, Mining and Metallurgy Institute Bor, 4/2013, pp. 29-38.
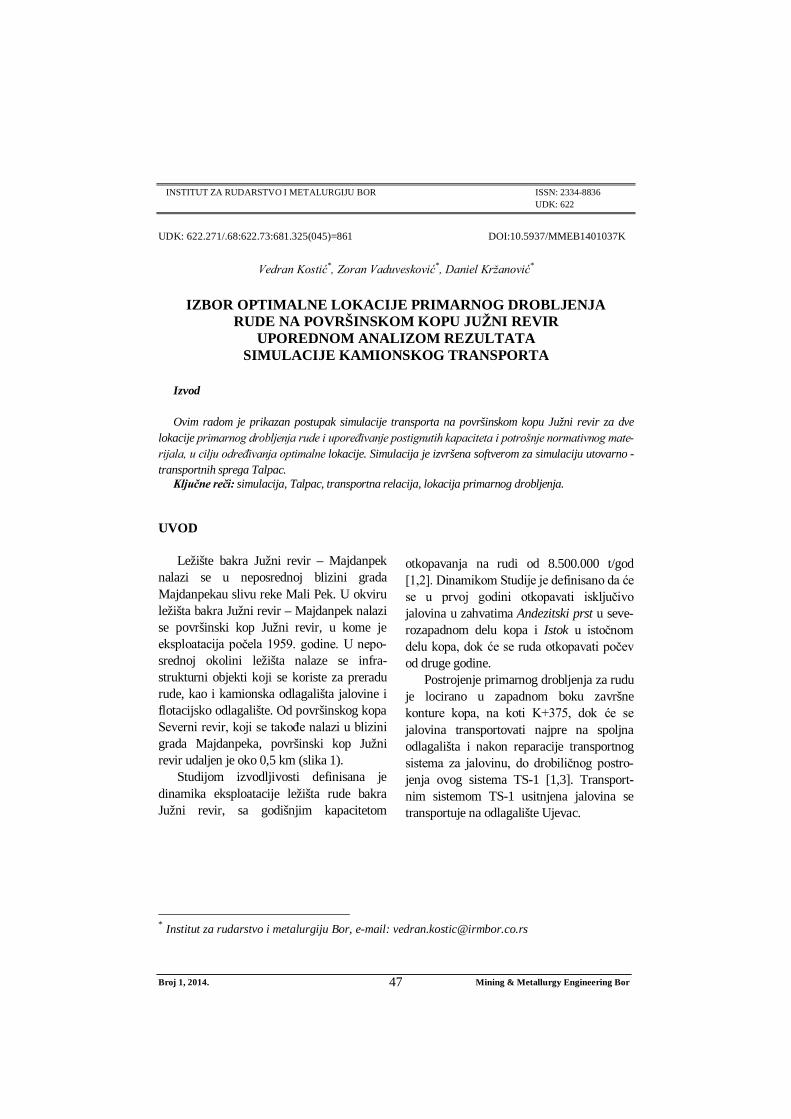
Broj 1, 2014. Mining & Metallurgy Engineering Bor 47
INSTITUT ZA RUDARSTVO I METALURGIJU BOR ISSN: 2334-8836 UDK: 622
UDK: 622.271/.68:622.73:681.325(045)=861 DOI:10.5937/MMEB1401037K
Vedran Kostić*, Zoran Vaduvesković*, Daniel Kržanović*
IZBOR OPTIMALNE LOKACIJE PRIMARNOG DROBLJENJA RUDE NA POVRŠINSKOM KOPU JUŽNI REVIR
UPOREDNOM ANALIZOM REZULTATA SIMULACIJE KAMIONSKOG TRANSPORTA
Izvod
Ovim radom je prikazan postupak simulacije transporta na površinskom kopu Južni revir za dve lokacije primarnog drobljenja rude i upoređivanje postignutih kapaciteta i potrošnje normativnog mate-rijala, u cilju određivanja optimalne lokacije. Simulacija je izvršena softverom za simulaciju utovarno - transportnih sprega Talpac.
Ključne reči: simulacija, Talpac, transportna relacija, lokacija primarnog drobljenja.
* Institut za rudarstvo i metalurgiju Bor, e-mail: [email protected]
UVOD
Ležište bakra Južni revir – Majdanpek nalazi se u neposrednoj blizini grada Majdanpekau slivu reke Mali Pek. U okviru ležišta bakra Južni revir – Majdanpek nalazi se površinski kop Južni revir, u kome je eksploatacija počela 1959. godine. U nepo-srednoj okolini ležišta nalaze se infra-strukturni objekti koji se koriste za preradu rude, kao i kamionska odlagališta jalovine i flotacijsko odlagalište. Od površinskog kopa Severni revir, koji se takođe nalazi u blizini grada Majdanpeka, površinski kop Južni revir udaljen je oko 0,5 km (slika 1).
Studijom izvodljivosti definisana je dinamika eksploatacije ležišta rude bakra Južni revir, sa godišnjim kapacitetom
otkopavanja na rudi od 8.500.000 t/god [1,2]. Dinamikom Studije je definisano da će se u prvoj godini otkopavati isključivo jalovina u zahvatima Andezitski prst u seve-rozapadnom delu kopa i Istok u istočnom delu kopa, dok će se ruda otkopavati počev od druge godine.
Postrojenje primarnog drobljenja za rudu je locirano u zapadnom boku završne konture kopa, na koti K+375, dok će se jalovina transportovati najpre na spoljna odlagališta i nakon reparacije transportnog sistema za jalovinu, do drobiličnog postro-jenja ovog sistema TS-1 [1,3]. Transport-nim sistemom TS-1 usitnjena jalovina se transportuje na odlagalište Ujevac.
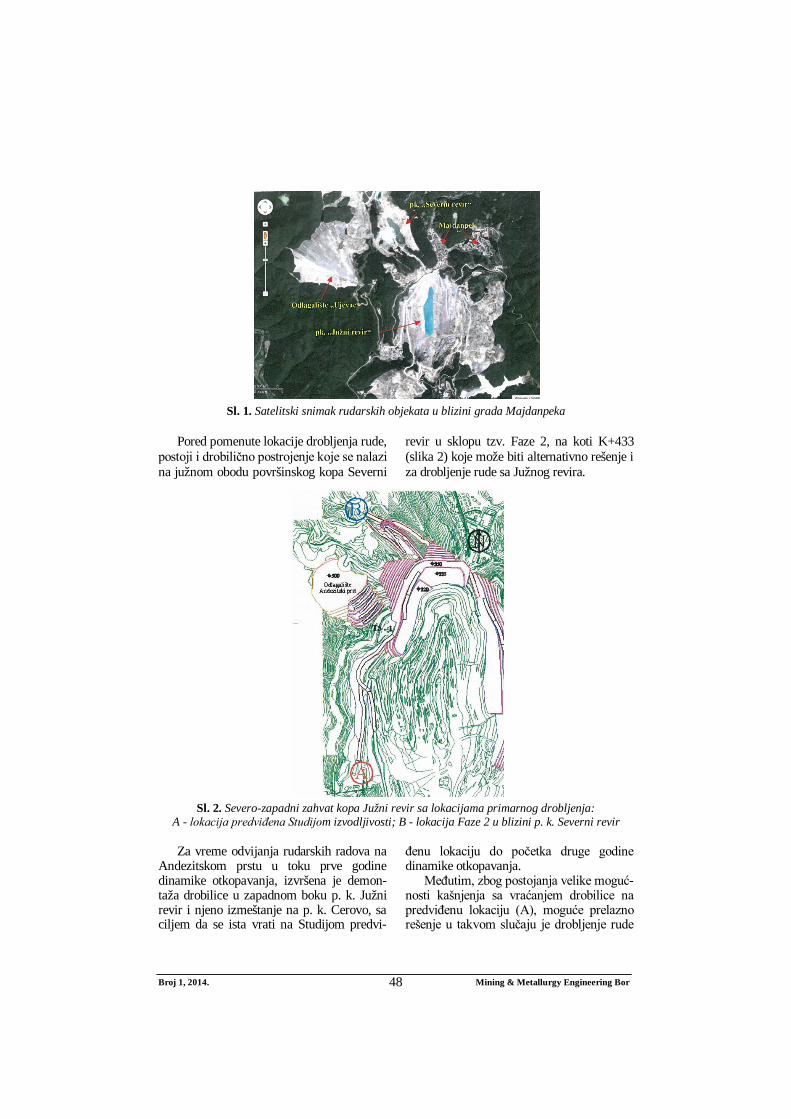
Broj 1, 2014. Mining & Metallurgy Engineering Bor 48
Sl. 1. Satelitski snimak rudarskih objekata u blizini grada Majdanpeka
Pored pomenute lokacije drobljenja rude,
postoji i drobilično postrojenje koje se nalazi na južnom obodu površinskog kopa Severni
revir u sklopu tzv. Faze 2, na koti K+433 (slika 2) koje može biti alternativno rešenje i za drobljenje rude sa Južnog revira.
Sl. 2. Severo-zapadni zahvat kopa Južni revir sa lokacijama primarnog drobljenja:
A - lokacija predviđena Studijom izvodljivosti; B - lokacija Faze 2 u blizini p. k. Severni revir Za vreme odvijanja rudarskih radova na
Andezitskom prstu u toku prve godine dinamike otkopavanja, izvršena je demon-taža drobilice u zapadnom boku p. k. Južni revir i njeno izmeštanje na p. k. Cerovo, sa ciljem da se ista vrati na Studijom predvi-
đenu lokaciju do početka druge godine dinamike otkopavanja.
Međutim, zbog postojanja velike moguć-nosti kašnjenja sa vraćanjem drobilice na predviđenu lokaciju (A), moguće prelazno rešenje u takvom slučaju je drobljenje rude
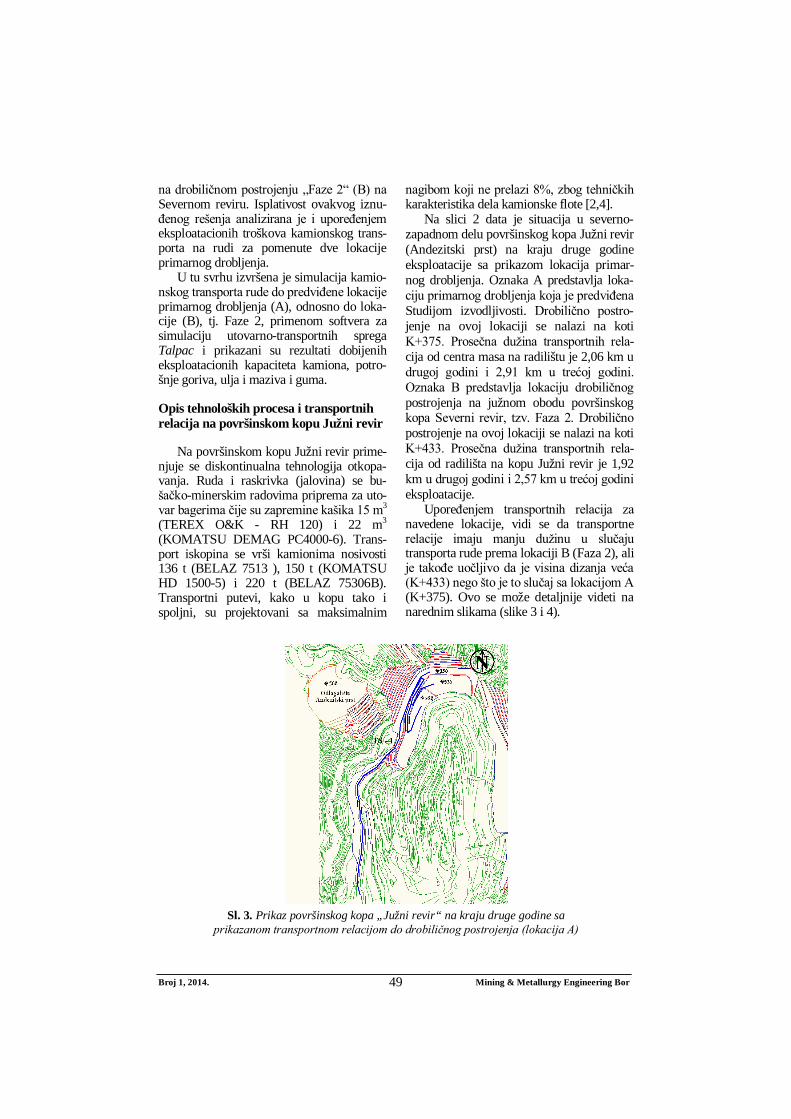
Broj 1, 2014. Mining & Metallurgy Engineering Bor 49
na drobiličnom postrojenju „Faze 2“ (B) na Severnom reviru. Isplativost ovakvog iznu-đenog rešenja analizirana je i upoređenjem eksploatacionih troškova kamionskog trans-porta na rudi za pomenute dve lokacije primarnog drobljenja.
U tu svrhu izvršena je simulacija kamio-nskog transporta rude do predviđene lokacije primarnog drobljenja (A), odnosno do loka-cije (B), tj. Faze 2, primenom softvera za simulaciju utovarno-transportnih sprega Talpac i prikazani su rezultati dobijenih eksploatacionih kapaciteta kamiona, potro-šnje goriva, ulja i maziva i guma.
Opis tehnoloških procesa i transportnih relacija na površinskom kopu Južni revir
Na površinskom kopu Južni revir prime-njuje se diskontinualna tehnologija otkopa-vanja. Ruda i raskrivka (jalovina) se bu-šačko-minerskim radovima priprema za uto-var bagerima čije su zapremine kašika 15 m3
(TEREX O&K - RH 120) i 22 m3
(KOMATSU DEMAG PC4000-6). Trans-port iskopina se vrši kamionima nosivosti 136 t (BELAZ 7513 ), 150 t (KOMATSU HD 1500-5) i 220 t (BELAZ 75306B). Transportni putevi, kako u kopu tako i spoljni, su projektovani sa maksimalnim
nagibom koji ne prelazi 8%, zbog tehničkih karakteristika dela kamionske flote [2,4].
Na slici 2 data je situacija u severno-zapadnom delu površinskog kopa Južni revir (Andezitski prst) na kraju druge godine eksploatacije sa prikazom lokacija primar-nog drobljenja. Oznaka A predstavlja loka-ciju primarnog drobljenja koja je predviđena Studijom izvodljivosti. Drobilično postro-jenje na ovoj lokaciji se nalazi na koti K+375. Prosečna dužina transportnih rela-cija od centra masa na radilištu je 2,06 km u drugoj godini i 2,91 km u trećoj godini. Oznaka B predstavlja lokaciju drobiličnog postrojenja na južnom obodu površinskog kopa Severni revir, tzv. Faza 2. Drobilično postrojenje na ovoj lokaciji se nalazi na koti K+433. Prosečna dužina transportnih rela-cija od radilišta na kopu Južni revir je 1,92 km u drugoj godini i 2,57 km u trećoj godini eksploatacije.
Upoređenjem transportnih relacija za navedene lokacije, vidi se da transportne relacije imaju manju dužinu u slučaju transporta rude prema lokaciji B (Faza 2), ali je takođe uočljivo da je visina dizanja veća (K+433) nego što je to slučaj sa lokacijom A (K+375). Ovo se može detaljnije videti na narednim slikama (slike 3 i 4).
Sl. 3. Prikaz površinskog kopa „Južni revir“ na kraju druge godine sa
prikazanom transportnom relacijom do drobiličnog postrojenja (lokacija A)
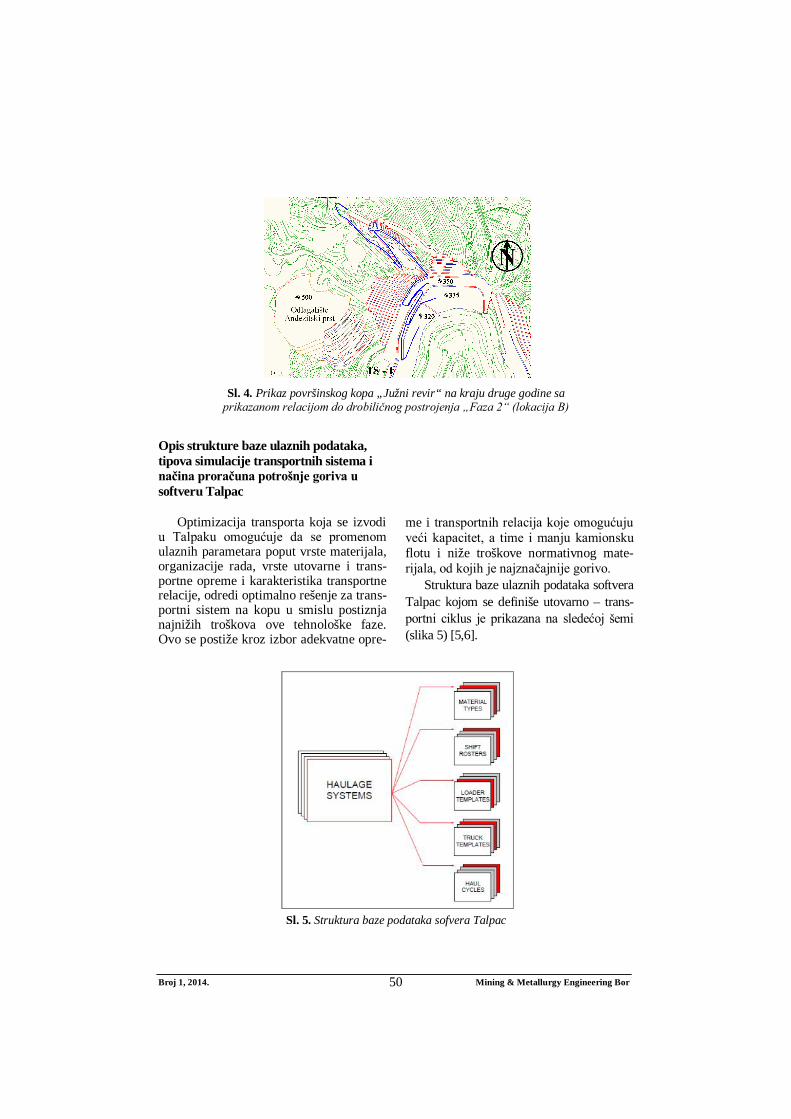
Broj 1, 2014. Mining & Metallurgy Engineering Bor 50
Sl. 4. Prikaz površinskog kopa „Južni revir“ na kraju druge godine sa
prikazanom relacijom do drobiličnog postrojenja „Faza 2“ (lokacija B)
Opis strukture baze ulaznih podataka, tipova simulacije transportnih sistema i načina proračuna potrošnje goriva u softveru Talpac
Optimizacija transporta koja se izvodi u Talpaku omogućuje da se promenom ulaznih parametara poput vrste materijala, organizacije rada, vrste utovarne i trans-portne opreme i karakteristika transportne relacije, odredi optimalno rešenje za trans-portni sistem na kopu u smislu postiznja najnižih troškova ove tehnološke faze. Ovo se postiže kroz izbor adekvatne opre-
me i transportnih relacija koje omogućuju veći kapacitet, a time i manju kamionsku flotu i niže troškove normativnog mate-rijala, od kojih je najznačajnije gorivo.
Struktura baze ulaznih podataka softvera Talpac kojom se definiše utovarno – trans-portni ciklus je prikazana na sledećoj šemi (slika 5) [5,6].
Sl. 5. Struktura baze podataka sofvera Talpac
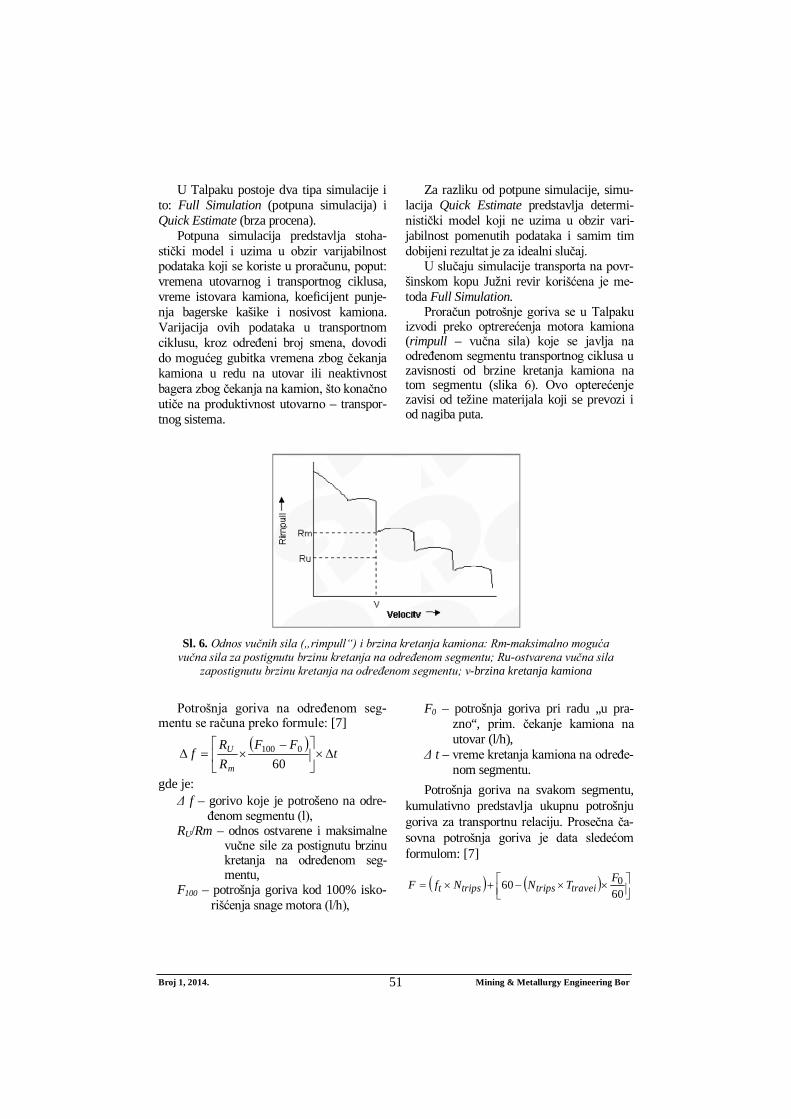
Broj 1, 2014. Mining & Metallurgy Engineering Bor 51
U Talpaku postoje dva tipa simulacije i to: Full Simulation (potpuna simulacija) i Quick Estimate (brza procena).
Potpuna simulacija predstavlja stoha-stički model i uzima u obzir varijabilnost podataka koji se koriste u proračunu, poput: vremena utovarnog i transportnog ciklusa, vreme istovara kamiona, koeficijent punje-nja bagerske kašike i nosivost kamiona. Varijacija ovih podataka u transportnom ciklusu, kroz određeni broj smena, dovodi do mogućeg gubitka vremena zbog čekanja kamiona u redu na utovar ili neaktivnost bagera zbog čekanja na kamion, što konačno utiče na produktivnost utovarno – transpor-tnog sistema.
Za razliku od potpune simulacije, simu-lacija Quick Estimate predstavlja determi-nistički model koji ne uzima u obzir vari-jabilnost pomenutih podataka i samim tim dobijeni rezultat je za idealni slučaj.
U slučaju simulacije transporta na povr-šinskom kopu Južni revir korišćena je me-toda Full Simulation.
Proračun potrošnje goriva se u Talpaku izvodi preko optrerećenja motora kamiona (rimpull – vučna sila) koje se javlja na određenom segmentu transportnog ciklusa u zavisnosti od brzine kretanja kamiona na tom segmentu (slika 6). Ovo opterećenje zavisi od težine materijala koji se prevozi i od nagiba puta.
Sl. 6. Odnos vučnih sila („rimpull“) i brzina kretanja kamiona: Rm-maksimalno moguća
vučna sila za postignutu brzinu kretanja na određenom segmentu; Ru-ostvarena vučna sila zapostignutu brzinu kretanja na određenom segmentu; v-brzina kretanja kamiona
Potrošnja goriva na određenom seg-
mentu se računa preko formule: [7]
tFF
RR
fm
U
600100
gde je: Δ f – gorivo koje je potrošeno na odre-
đenom segmentu (l), RU/Rm – odnos ostvarene i maksimalne
vučne sile za postignutu brzinu kretanja na određenom seg-mentu,
F100 – potrošnja goriva kod 100% isko-rišćenja snage motora (l/h),
F0 – potrošnja goriva pri radu „u pra-zno“, prim. čekanje kamiona na utovar (l/h),
Δ t – vreme kretanja kamiona na određe-nom segmentu.
Potrošnja goriva na svakom segmentu, kumulativno predstavlja ukupnu potrošnju goriva za transportnu relaciju. Prosečna ča-sovna potrošnja goriva je data sledećom formulom: [7]
6060 0FTNNfF traveitripstripst
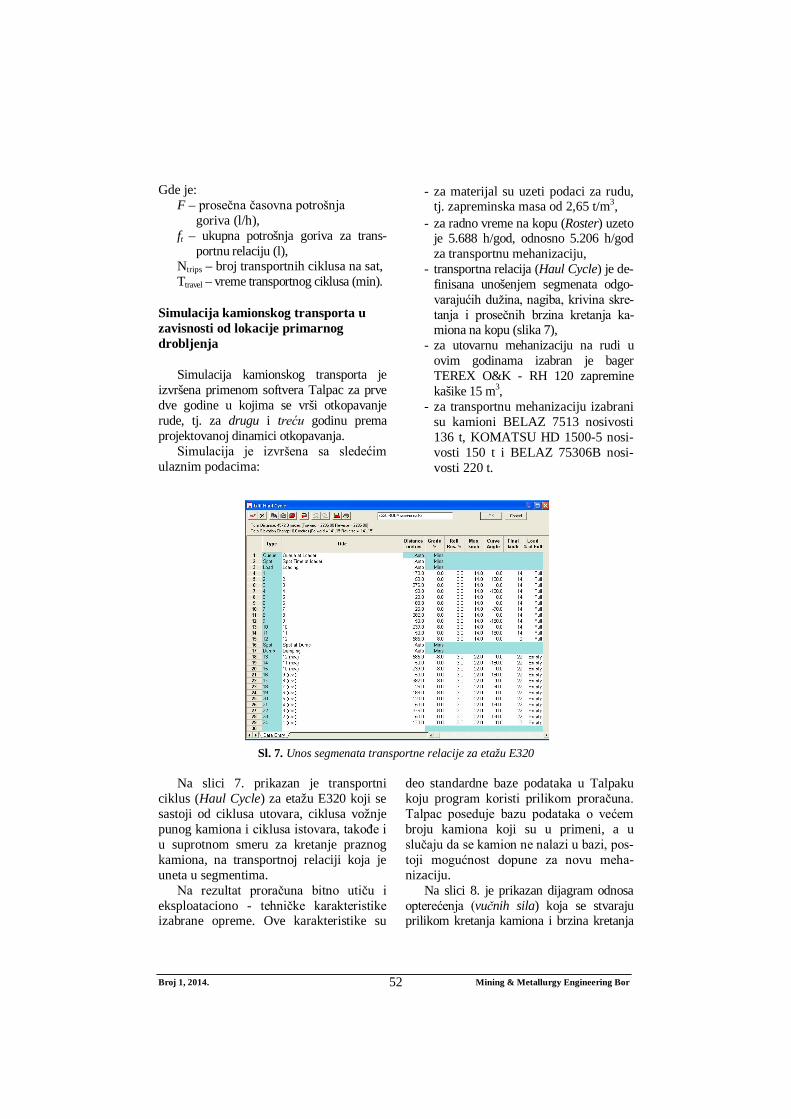
Broj 1, 2014. Mining & Metallurgy Engineering Bor 52
Gde je: F – prosečna časovna potrošnja
goriva (l/h), ft – ukupna potrošnja goriva za trans-
portnu relaciju (l), Ntrips – broj transportnih ciklusa na sat, Ttravel – vreme transportnog ciklusa (min).
Simulacija kamionskog transporta u zavisnosti od lokacije primarnog drobljenja
Simulacija kamionskog transporta je izvršena primenom softvera Talpac za prve dve godine u kojima se vrši otkopavanje rude, tj. za drugu i treću godinu prema projektovanoj dinamici otkopavanja.
Simulacija je izvršena sa sledećim ulaznim podacima:
- za materijal su uzeti podaci za rudu, tj. zapreminska masa od 2,65 t/m3,
- za radno vreme na kopu (Roster) uzeto je 5.688 h/god, odnosno 5.206 h/god za transportnu mehanizaciju,
- transportna relacija (Haul Cycle) je de-finisana unošenjem segmenata odgo-varajućih dužina, nagiba, krivina skre-tanja i prosečnih brzina kretanja ka-miona na kopu (slika 7),
- za utovarnu mehanizaciju na rudi u ovim godinama izabran je bager TEREX O&K - RH 120 zapremine kašike 15 m3,
- za transportnu mehanizaciju izabrani su kamioni BELAZ 7513 nosivosti 136 t, KOMATSU HD 1500-5 nosi-vosti 150 t i BELAZ 75306B nosi-vosti 220 t.
Sl. 7. Unos segmenata transportne relacije za etažu E320
Na slici 7. prikazan je transportni
ciklus (Haul Cycle) za etažu E320 koji se sastoji od ciklusa utovara, ciklusa vožnje punog kamiona i ciklusa istovara, takođe i u suprotnom smeru za kretanje praznog kamiona, na transportnoj relaciji koja je uneta u segmentima.
Na rezultat proračuna bitno utiču i eksploataciono - tehničke karakteristike izabrane opreme. Ove karakteristike su
deo standardne baze podataka u Talpaku koju program koristi prilikom proračuna. Talpac poseduje bazu podataka o većem broju kamiona koji su u primeni, a u slučaju da se kamion ne nalazi u bazi, pos-toji mogućnost dopune za novu meha-nizaciju.
Na slici 8. je prikazan dijagram odnosa opterećenja (vučnih sila) koja se stvaraju prilikom kretanja kamiona i brzina kretanja
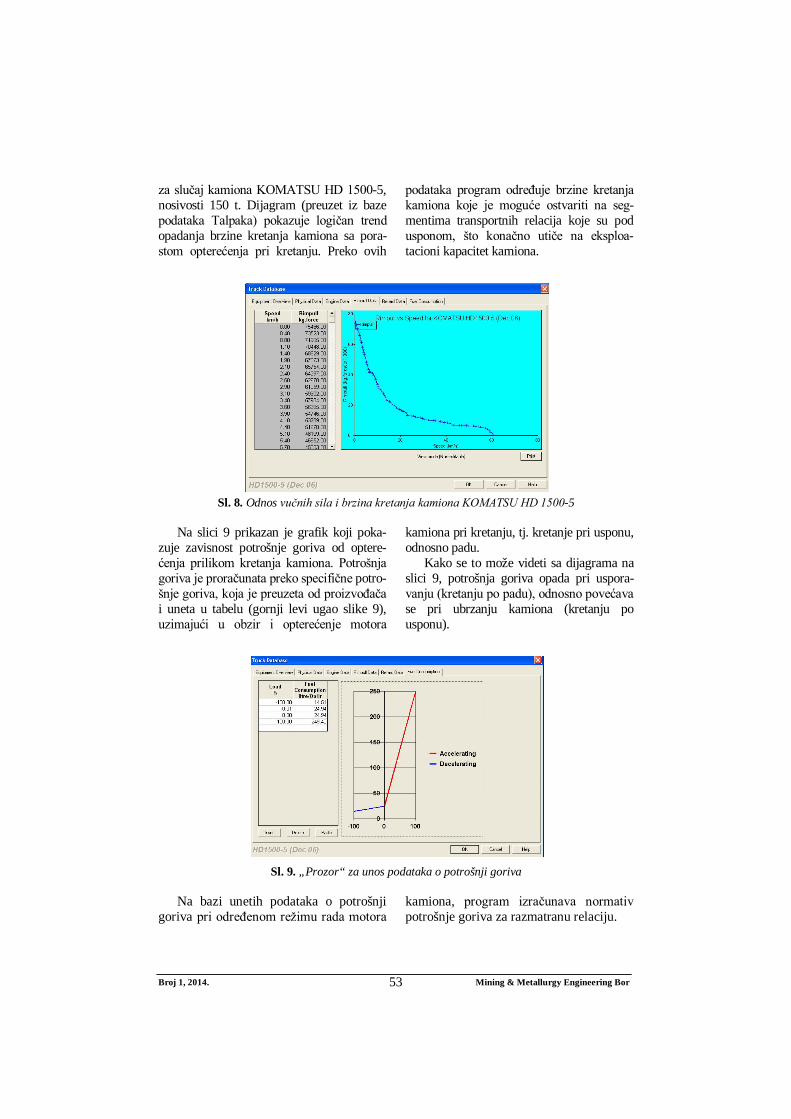
Broj 1, 2014. Mining & Metallurgy Engineering Bor 53
za slučaj kamiona KOMATSU HD 1500-5, nosivosti 150 t. Dijagram (preuzet iz baze podataka Talpaka) pokazuje logičan trend opadanja brzine kretanja kamiona sa pora-stom opterećenja pri kretanju. Preko ovih
podataka program određuje brzine kretanja kamiona koje je moguće ostvariti na seg-mentima transportnih relacija koje su pod usponom, što konačno utiče na eksploa-tacioni kapacitet kamiona.
Sl. 8. Odnos vučnih sila i brzina kretanja kamiona KOMATSU HD 1500-5
Na slici 9 prikazan je grafik koji poka-
zuje zavisnost potrošnje goriva od optere-ćenja prilikom kretanja kamiona. Potrošnja goriva je proračunata preko specifične potro-šnje goriva, koja je preuzeta od proizvođača i uneta u tabelu (gornji levi ugao slike 9), uzimajući u obzir i opterećenje motora
kamiona pri kretanju, tj. kretanje pri usponu, odnosno padu.
Kako se to može videti sa dijagrama na slici 9, potrošnja goriva opada pri uspora-vanju (kretanju po padu), odnosno povećava se pri ubrzanju kamiona (kretanju po usponu).
Sl. 9. „Prozor“ za unos podataka o potrošnji goriva
Na bazi unetih podataka o potrošnji
goriva pri određenom režimu rada motora kamiona, program izračunava normativ potrošnje goriva za razmatranu relaciju.
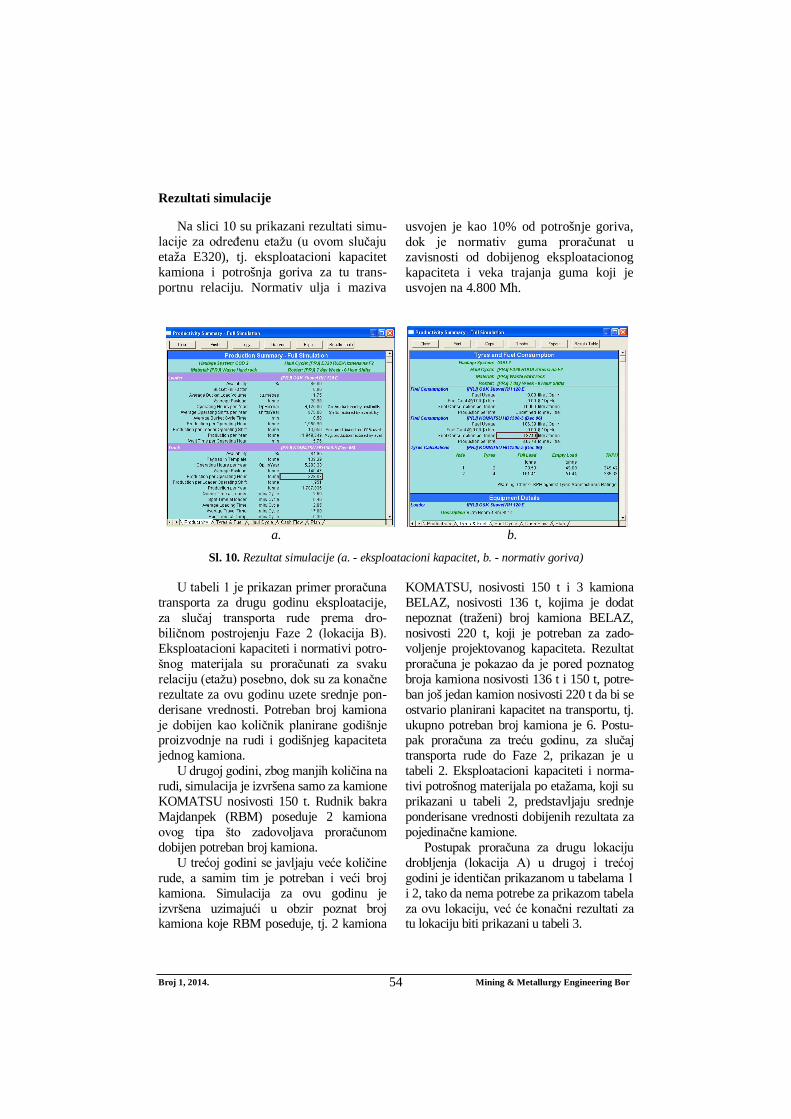
Broj 1, 2014. Mining & Metallurgy Engineering Bor 54
Rezultati simulacije
Na slici 10 su prikazani rezultati simu-lacije za određenu etažu (u ovom slučaju etaža E320), tj. eksploatacioni kapacitet kamiona i potrošnja goriva za tu trans-portnu relaciju. Normativ ulja i maziva
usvojen je kao 10% od potrošnje goriva, dok je normativ guma proračunat u zavisnosti od dobijenog eksploatacionog kapaciteta i veka trajanja guma koji je usvojen na 4.800 Mh.
a. b.
Sl. 10. Rezultat simulacije (a. - eksploatacioni kapacitet, b. - normativ goriva) U tabeli 1 je prikazan primer proračuna
transporta za drugu godinu eksploatacije, za slučaj transporta rude prema dro-biličnom postrojenju Faze 2 (lokacija B). Eksploatacioni kapaciteti i normativi potro-šnog materijala su proračunati za svaku relaciju (etažu) posebno, dok su za konačne rezultate za ovu godinu uzete srednje pon-derisane vrednosti. Potreban broj kamiona je dobijen kao količnik planirane godišnje proizvodnje na rudi i godišnjeg kapaciteta jednog kamiona.
U drugoj godini, zbog manjih količina na rudi, simulacija je izvršena samo za kamione KOMATSU nosivosti 150 t. Rudnik bakra Majdanpek (RBM) poseduje 2 kamiona ovog tipa što zadovoljava proračunom dobijen potreban broj kamiona.
U trećoj godini se javljaju veće količine rude, a samim tim je potreban i veći broj kamiona. Simulacija za ovu godinu je izvršena uzimajući u obzir poznat broj kamiona koje RBM poseduje, tj. 2 kamiona
KOMATSU, nosivosti 150 t i 3 kamiona BELAZ, nosivosti 136 t, kojima je dodat nepoznat (traženi) broj kamiona BELAZ, nosivosti 220 t, koji je potreban za zado-voljenje projektovanog kapaciteta. Rezultat proračuna je pokazao da je pored poznatog broja kamiona nosivosti 136 t i 150 t, potre-ban još jedan kamion nosivosti 220 t da bi se ostvario planirani kapacitet na transportu, tj. ukupno potreban broj kamiona je 6. Postu-pak proračuna za treću godinu, za slučaj transporta rude do Faze 2, prikazan je u tabeli 2. Eksploatacioni kapaciteti i norma-tivi potrošnog materijala po etažama, koji su prikazani u tabeli 2, predstavljaju srednje ponderisane vrednosti dobijenih rezultata za pojedinačne kamione.
Postupak proračuna za drugu lokaciju drobljenja (lokacija A) u drugoj i trećoj godini je identičan prikazanom u tabelama 1 i 2, tako da nema potrebe za prikazom tabela za ovu lokaciju, već će konačni rezultati za tu lokaciju biti prikazani u tabeli 3.
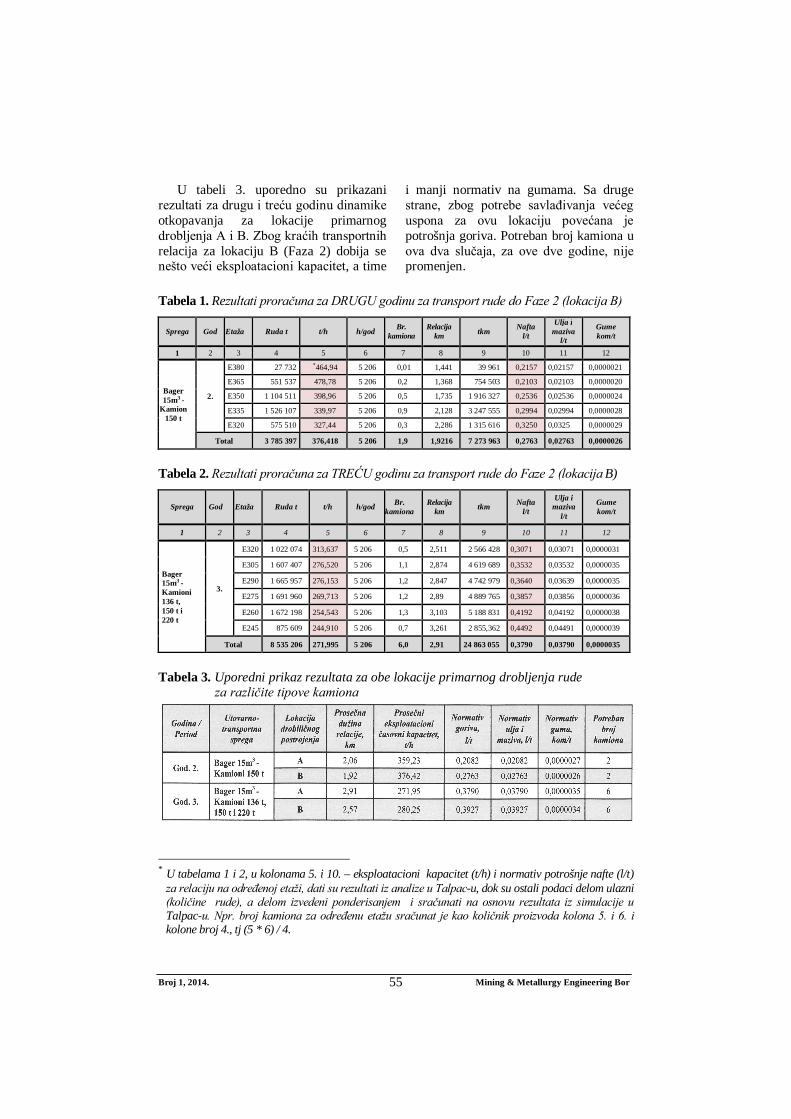
Broj 1, 2014. Mining & Metallurgy Engineering Bor 55
U tabeli 3. uporedno su prikazani rezultati za drugu i treću godinu dinamike otkopavanja za lokacije primarnog drobljenja A i B. Zbog kraćih transportnih relacija za lokaciju B (Faza 2) dobija se nešto veći eksploatacioni kapacitet, a time
i manji normativ na gumama. Sa druge strane, zbog potrebe savlađivanja većeg uspona za ovu lokaciju povećana je potrošnja goriva. Potreban broj kamiona u ova dva slučaja, za ove dve godine, nije promenjen.
Tabela 1. Rezultati proračuna za DRUGU godinu za transport rude do Faze 2 (lokacija B)
Sprega God Etaža Ruda t t/h h/god Br. kamiona
Relacija km tkm Nafta
l/t
Ulja i maziva
l/t
Gume kom/t
1 2 3 4 5 6 7 8 9 10 11 12
Bager 15m3 -
Kamion 150 t
2.
E380 27 732 *464,94 5 206 0,01 1,441 39 961 0,2157 0,02157 0,0000021
E365 551 537 478,78 5 206 0,2 1,368 754 503 0,2103 0,02103 0,0000020
E350 1 104 511 398,96 5 206 0,5 1,735 1 916 327 0,2536 0,02536 0,0000024
E335 1 526 107 339,97 5 206 0,9 2,128 3 247 555 0,2994 0,02994 0,0000028
E320 575 510 327,44 5 206 0,3 2,286 1 315 616 0,3250 0,0325 0,0000029
Total 3 785 397 376,418 5 206 1,9 1,9216 7 273 963 0,2763 0,02763 0,0000026
Tabela 2. Rezultati proračuna za TREĆU godinu za transport rude do Faze 2 (lokacija B)
Sprega God Etaža Ruda t t/h h/god Br. kamiona
Relacija km tkm Nafta
l/t
Ulja i maziva
l/t
Gume kom/t
1 2 3 4 5 6 7 8 9 10 11 12
Bager 15m3 - Kamioni 136 t, 150 t i 220 t
3.
E320 1 022 074 313,637 5 206 0,5 2,511 2 566 428 0,3071 0,03071 0,0000031
E305 1 607 407 276,520 5 206 1,1 2,874 4 619 689 0,3532 0,03532 0,0000035
E290 1 665 957 276,153 5 206 1,2 2,847 4 742 979 0,3640 0,03639 0,0000035
E275 1 691 960 269,713 5 206 1,2 2,89 4 889 765 0,3857 0,03856 0,0000036
E260 1 672 198 254,543 5 206 1,3 3,103 5 188 831 0,4192 0,04192 0,0000038
E245 875 609 244,910 5 206 0,7 3,261 2 855,362 0,4492 0,04491 0,0000039
Total 8 535 206 271,995 5 206 6,0 2,91 24 863 055 0,3790 0,03790 0,0000035
Tabela 3. Uporedni prikaz rezultata za obe lokacije primarnog drobljenja rude za različite tipove kamiona
* U tabelama 1 i 2, u kolonama 5. i 10. – eksploatacioni kapacitet (t/h) i normativ potrošnje nafte (l/t)
za relaciju na određenoj etaži, dati su rezultati iz analize u Talpac-u, dok su ostali podaci delom ulazni (količine rude), a delom izvedeni ponderisanjem i sračunati na osnovu rezultata iz simulacije u Talpac-u. Npr. broj kamiona za određenu etažu sračunat je kao količnik proizvoda kolona 5. i 6. i kolone broj 4., tj (5 * 6) / 4.
Broj 1, 2014. Mining & Metallurgy Engineering Bor 56
ZAKLJUČAK
Primenom klasične metode proračuna transporta, u kojoj se ne uzimaju u obzir karakteristike transportnih relacija, za kraće transportne relacije bi se takođe dobili veći eksploatacioni kapaciteti ali, sa druge strane, i manje vrednosti normativa što ovde nije slučaj.
Primenom softvera za simulaciju uto-varno-transportnih sprega, u ovom slučaju softvera Talpac, moguće je doneti odluku na bazi preciznije dobijenih rezultata nego što je to slučaj kod primene klasične metode proračuna. Takođe, jednom urađena simula-cija se može više puta preračunati, izmenom ulaznih parametara poput vrste utovarne i transportne opreme, transportnih relacija, brzina kretanja kamiona i planirane organi-zacije rada.
Sa druge strane, da bi se iskoristila mogućnost dobijanja što preciznijih rezultata simulacije, potrebno je da se transportna relacija detaljnije obradi, tj. unese u segmentima za svaki uspon, pad i skretanje. Ovim se povećava vreme potrebno za proračun transporta u odnosu na klasičnu metodu u kojoj se ovo obično ne radi.
LITERATURA
[1] D. Kržanović i dr.: Studija izvodlji-vosti eksploatacije ležišta Južni revir u rudniku bakra Majdanpek, Institut za rudarstvo i metalurgiju Bor, 2011
[2] D. Kržanović, M. Žikić, N. Vušović, R. Pantović, S. Stojadinović: Optimum Development of the Open Pit South Mining District in Majdanpek for
Annual Capacity of Copper Ore Mining of 8 500 000 t, The 44rd Inter-national October Conference on Mining and Metallurgy, Hotel Albo Bor, 1-3 oktobra 2012, str. 225-228
[3] D. Kržanović, M. Žikić, R. Pantović: Bitno poboljšanje iskorišćenja raspo-loživih geoloških rezervi ležišta Južni revir Majdanpek u novo definisanoj optimalnoj konturi kopa primenom softverskih paketa Whittle i Gemcom, Rudarski radovi 1/2012, str. 21-28
[4] D. Kržanović, M. Žikić, S. Stojadino-vić: Analiza ostvarene i kataloške potrošnje goriva kamiona Belaz 7530b u prvoj godini eksploatacije na povr-šinskom kopu Veliki Krivelj, Integra-ted International Symposium Tiorir ’11, Proceedings, Volume 1, Zlatibor, Srbija, 11-15 septembra 2011, str. 60-64
[5] V. Malbašić, J. Hamović: Economic Evaluation of Haulage System Shovel - truck on the Open Pit Mines, The International Journal of Transport and Logistics, iss. 7, pp. 17-31, 2004
[6] R. Janković, Lj. Savić: Simulation of Truck Haulage at the Open Pit Mine Majdanpek, Transport i logistika, iss. 11, pp. 96-103, 2006
[7] Talpac Manual: TALPAC Truck and Loader Productivity Analysis, Release 9, 2007
[8] S. Mašić, M. Brčaninović, Analiza parametara rada kamiona БелАЗ na površinskim kopovima RMU “Bano-vići” na osnovu podataka sa proce-sora, Mining and Metallurgy Institute Bor, 4/2013, str. 39-48
No. 1, 2014 Mining & Metallurgy Engineering Bor 57
MINING AND METALLURGY INSTITUTE BOR ISSN: 2334-8836 UDK: 622
UDK: 678.743:666.92(045)=20 DOI:10.5937/MMEB1401057M
Slavica R. Mihajlović*, Dragan S. Radulović*, Sonja Z. Milićević*, Živko T. Sekulić*
APPLICATION OF LIME IN THE POLYVINYL CHLORIDE INDUSTRY**
Abstract
This paper presents the importance of limestone in a variety of industries with a special focus on the use of limestone as filler in the industry of polyvinyl chloride (PVC). Of Out of all fillers, used in the industry of PVC processing, calcium carbonate type of fillers are 80%. Fillers are used in order to im-prove various mechanical properties of polymer such as tensile and breaking properties, density, bend-ing strength, hardness, thermal stability, viscosity and more. Latest trends of industrial development and demands of the processing industry for high quality carbonate fillers influenced the implementation process of surface modification limestone and calcite, which is the main constituent of fine micronized limestone in order to enhance its performance.
Keywords: limestone, calcite, filler, PVC
* Institute for Technology of Nuclear and Other Mineral Raw Materials, Franše d’Eperea 86, 11000 Belgrade, Serbia, e-mail address: [email protected]
** This paper is the result of research on the Project TR 34013: “Development of Technological Pro-cesses for Obtaining of Ecological Materials Based on Nonmetallic Minerals“, and the Project TR 34006: “Mechano-chemical Treatment under Insufficient Mineral Resources”, funded by the Mi-nistry of Education, Science and Technological Development of the Republic of Serbia for the period 2011-2014.
INTRODUCTION
Limestone is used in a large number of industries including the industry for pro-cessing of polyvinyl chloride (PVC). The largest application of limestone is found in the construction industry where it is used to make plaster, concrete mixtures, in manufac-turing various types of cement, lime and directly in the form of various sized crushed stone. Another important user of limestone is metallurgy, where limestone used in ag-glomeration, in blast furnaces and the Besemer smelting process. Chemical indus-try also uses a significant amount of raw materials in the industrial production of ni-trogen compounds, pulp, paper, soda, chlo-rine lime, carbide, rubber and others. In ag-ricultural, limestone is used for neutraliza
tion of acid soils, and as a feed additive. Significant amounts of limestone are used in the sugar industry, glass and ceramic indus-tries. In many cases, particular industries have established the general standards of quality limestone, although some users set their own internal requirements.
The quality of limestone (defined chemi-cal composition) refers to the smallest con-tent of CaO, or CaCO3, and maximum con-tent of impurities and harmful components, such as Fe2O3, SiO2, Al2O3, MgO, P2O5, TiO2, MnO, Cr2O3 content of alkali, cement and others. The group of physical properties that determine the quality of limestone are: grain size distribution, fortress, capacity, porosity, colour, etc. Limestone, used as filler in a
No. 1, 2014 Mining & Metallurgy Engineering Bor 58
variety of industries, must be of high quality finely divided materials. In the products, based on limestone, the most important qual-itative properties are colour (whiteness) and shine. Also, the physical structure of mineral and rock mass is an important factor, espe-cially when considering the ability of grind-ing the mineral raw materials. Within these requirements, and for each purpose, or users, the appropriate standards are identified. Pro-cedures for preparation the mineral raw ma-terials are processed to a number of Ca-carbonate raw materials with different chem-ical and mineral composition, in order to obtain a large number of products for vari-ous industries. In literature, the Ca-carbonate mineral deposits are commonly classified as the industrial mineral resources, while the geologists classify them into dolomite and limestone, [1].
LIMESTONE-FILLER FOR POLYVINYL CHLORIDE
Among many different additives that are necessary to polyvinyl chloride (PVC) in order to obtain a definitive quality product, a significant place have special additives un-der the name fillers for PVC. The term filler in PVC processing technology includes gen-erally very inexpensive inorganic material, resulting in the first task, which is to reduce the cost of overall mixture, or the finished product 2. Mineral fillers, which also in-clude limestone, with their largest applica-tion in the industry, are just thermoplastics, especially in PVC. Industry for the produc-tion of PVC sets certain requirements in terms of quality that apply to all fillers, in-cluding the limestone: to withstand heat, pressure and mechanical stresses with no changes that accompany the processing of PVC, should be well dispersed in PVC, more white, free of impurities and foreign matter, must not act abrasive, must not con-tain more than 0.4% moisture, if PVC are inactive, the fillers should be emphasized, however the need for their inertness and compatibility with all additives present in the mixture.
Limestone, as well as other inorganic fillers are added to the PVC is always in the form of fine, dry powder and in the mixing step of PVC with other additives, with the aim of better and more complete homogeni-sation. The latest trends of industry devel-opment and requirements of manufacturing industry for high quality carbonate fillers were directed towards finding the test proce-dures to improve properties of limestone as filler. Filler in order to get that power will improve the mechanical properties of PVC products is done by modifying the surface of calcite, which is the main constituent of fine micronized limestone. The most commonly used reagents for modification are fatty acid salts of various fatty acids, various oils, etc., 2-5. Limestone with surface-modified mineral calcite can be very easily dispersed in the polymer giving a homogeneous mix-ture. Moreover, limestone modified in any area calcite shows more improved properties as compared to lime which was not modified with the calcite namely: limestone becomes highly hydrophobic and thus water repellent and moisture which is very important for each filler; calcite surface modification sig-nificantly reduces the abrasive effect of limestone; these fillers show the improved rheological properties, higher impact re-sistance and better electrical properties; the use of this type of filler gets significantly better surface finished products, given the smoothness, gloss and its appearance [6]. It should be noted that all of the fillers, used in the industrial processing of PVC, 80% of total consumption are calcium carbonate type fillers.
POLIVINIL CHLORIDE (PVC)
Polyvinyl chloride (PVC) is more than 70 years one of the most important poly-mers whose production capacity of about 20% of the total world production of po-lymers. By the procedure of polymeriza-tion vinyl chloride is obtained powder from which further processing produces two types of PVC and rigid and PVC soft (flexible) PVC. Rigid PVC is obtained by processing the polymer powder without
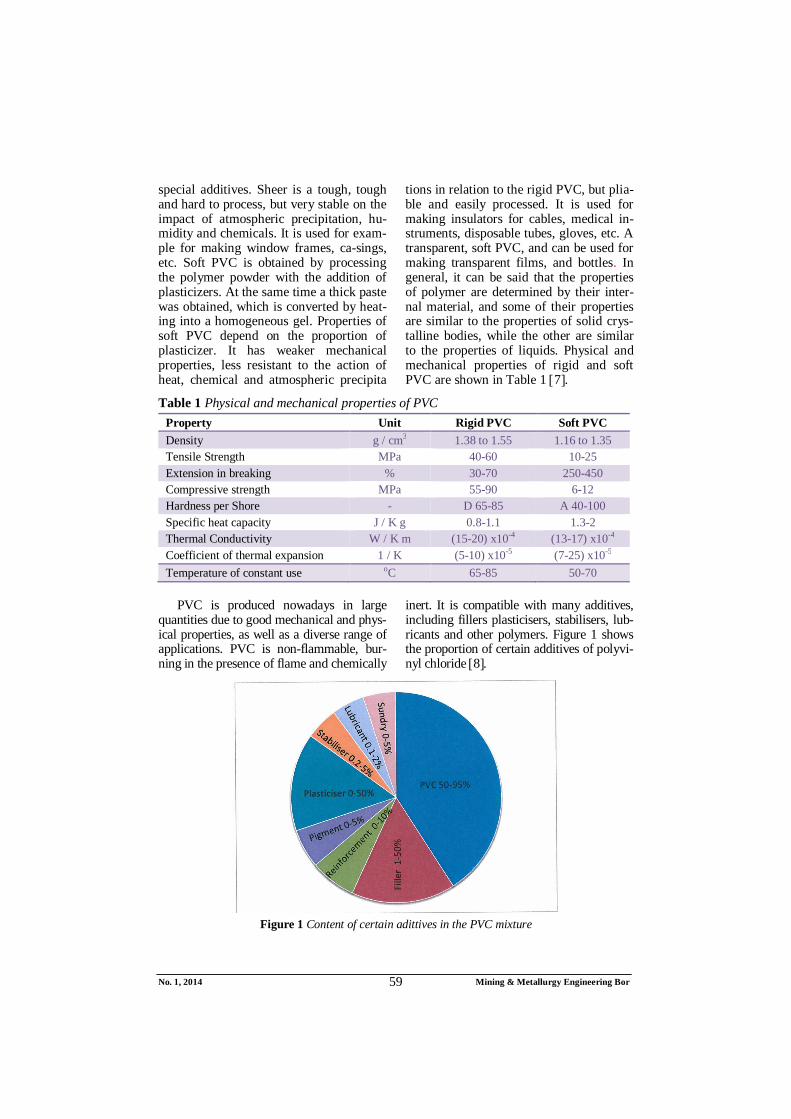
No. 1, 2014 Mining & Metallurgy Engineering Bor 59
special additives. Sheer is a tough, tough and hard to process, but very stable on the impact of atmospheric precipitation, hu-midity and chemicals. It is used for exam-ple for making window frames, ca-sings, etc. Soft PVC is obtained by processing the polymer powder with the addition of plasticizers. At the same time a thick paste was obtained, which is converted by heat-ing into a homogeneous gel. Properties of soft PVC depend on the proportion of plasticizer. It has weaker mechanical properties, less resistant to the action of heat, chemical and atmospheric precipita
tions in relation to the rigid PVC, but plia-ble and easily processed. It is used for making insulators for cables, medical in-struments, disposable tubes, gloves, etc. A transparent, soft PVC, and can be used for making transparent films, and bottles. In general, it can be said that the properties of polymer are determined by their inter-nal material, and some of their properties are similar to the properties of solid crys-talline bodies, while the other are similar to the properties of liquids. Physical and mechanical properties of rigid and soft PVC are shown in Table 1 7.
Table 1 Physical and mechanical properties of PVC Property Unit Rigid PVC Soft PVC Density g / cm3 1.38 to 1.55 1.16 to 1.35 Tensile Strength MPa 40-60 10-25 Extension in breaking % 30-70 250-450 Compressive strength MPa 55-90 6-12 Hardness per Shore - D 65-85 A 40-100 Specific heat capacity J / K g 0.8-1.1 1.3-2 Thermal Conductivity W / K m (15-20) x10-4 (13-17) x10-4 Coefficient of thermal expansion 1 / K (5-10) x10-5 (7-25) x10-5 Temperature of constant use oC 65-85 50-70
PVC is produced nowadays in large
quantities due to good mechanical and phys-ical properties, as well as a diverse range of applications. PVC is non-flammable, bur-ning in the presence of flame and chemically
inert. It is compatible with many additives, including fillers plasticisers, stabilisers, lub-ricants and other polymers. Figure 1 shows the proportion of certain additives of polyvi-nyl chloride 8.
Figure 1 Content of certain adittives in the PVC mixture
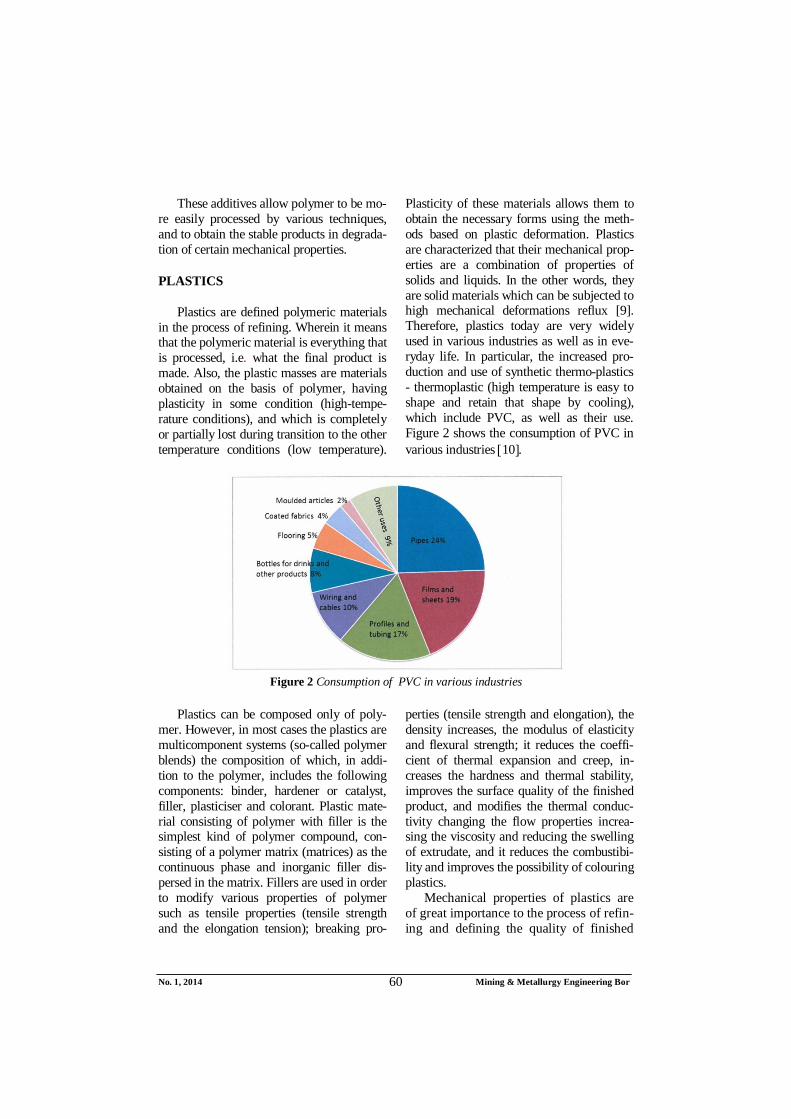
No. 1, 2014 Mining & Metallurgy Engineering Bor 60
These additives allow polymer to be mo-
re easily processed by various techniques, and to obtain the stable products in degrada-tion of certain mechanical properties.
PLASTICS
Plastics are defined polymeric materials in the process of refining. Wherein it means that the polymeric material is everything that is processed, i.e. what the final product is made. Also, the plastic masses are materials obtained on the basis of polymer, having plasticity in some condition (high-tempe-rature conditions), and which is completely or partially lost during transition to the other temperature conditions (low temperature).
Plasticity of these materials allows them to obtain the necessary forms using the meth-ods based on plastic deformation. Plastics are characterized that their mechanical prop-erties are a combination of properties of solids and liquids. In the other words, they are solid materials which can be subjected to high mechanical deformations reflux [9]. Therefore, plastics today are very widely used in various industries as well as in eve-ryday life. In particular, the increased pro-duction and use of synthetic thermo-plastics - thermoplastic (high temperature is easy to shape and retain that shape by cooling), which include PVC, as well as their use. Figure 2 shows the consumption of PVC in various industries 10.
Figure 2 Consumption of PVC in various industries
Plastics can be composed only of poly-
mer. However, in most cases the plastics are multicomponent systems (so-called polymer blends) the composition of which, in addi-tion to the polymer, includes the following components: binder, hardener or catalyst, filler, plasticiser and colorant. Plastic mate-rial consisting of polymer with filler is the simplest kind of polymer compound, con-sisting of a polymer matrix (matrices) as the continuous phase and inorganic filler dis-persed in the matrix. Fillers are used in order to modify various properties of polymer such as tensile properties (tensile strength and the elongation tension); breaking pro-
perties (tensile strength and elongation), the density increases, the modulus of elasticity and flexural strength; it reduces the coeffi-cient of thermal expansion and creep, in-creases the hardness and thermal stability, improves the surface quality of the finished product, and modifies the thermal conduc-tivity changing the flow properties increa-sing the viscosity and reducing the swelling of extrudate, and it reduces the combustibi-lity and improves the possibility of colouring plastics.
Mechanical properties of plastics are of great importance to the process of refin-ing and defining the quality of finished
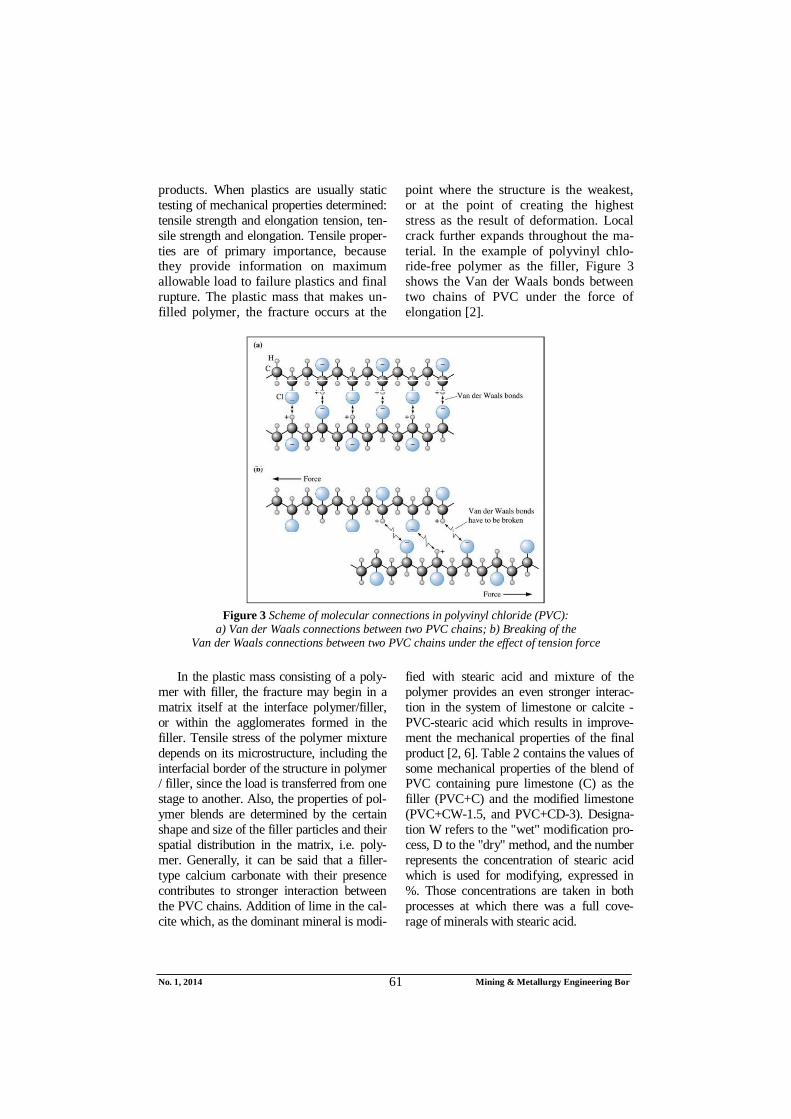
No. 1, 2014 Mining & Metallurgy Engineering Bor 61
products. When plastics are usually static testing of mechanical properties determined: tensile strength and elongation tension, ten-sile strength and elongation. Tensile proper-ties are of primary importance, because they provide information on maximum allowable load to failure plastics and final rupture. The plastic mass that makes un-filled polymer, the fracture occurs at the
point where the structure is the weakest, or at the point of creating the highest stress as the result of deformation. Local crack further expands throughout the ma-terial. In the example of polyvinyl chlo-ride-free polymer as the filler, Figure 3 shows the Van der Waals bonds between two chains of PVC under the force of elongation [2].
Figure 3 Scheme of molecular connections in polyvinyl chloride (PVC):
a) Van der Waals connections between two PVC chains; b) Breaking of the Van der Waals connections between two PVC chains under the effect of tension force
In the plastic mass consisting of a poly-
mer with filler, the fracture may begin in a matrix itself at the interface polymer/filler, or within the agglomerates formed in the filler. Tensile stress of the polymer mixture depends on its microstructure, including the interfacial border of the structure in polymer / filler, since the load is transferred from one stage to another. Also, the properties of pol-ymer blends are determined by the certain shape and size of the filler particles and their spatial distribution in the matrix, i.e. poly-mer. Generally, it can be said that a filler-type calcium carbonate with their presence contributes to stronger interaction between the PVC chains. Addition of lime in the cal-cite which, as the dominant mineral is modi-
fied with stearic acid and mixture of the polymer provides an even stronger interac-tion in the system of limestone or calcite - PVC-stearic acid which results in improve-ment the mechanical properties of the final product [2, 6]. Table 2 contains the values of some mechanical properties of the blend of PVC containing pure limestone (C) as the filler (PVC+C) and the modified limestone (PVC+CW-1.5, and PVC+CD-3). Designa-tion W refers to the "wet" modification pro-cess, D to the "dry" method, and the number represents the concentration of stearic acid which is used for modifying, expressed in %. Those concentrations are taken in both processes at which there was a full cove-rage of minerals with stearic acid.
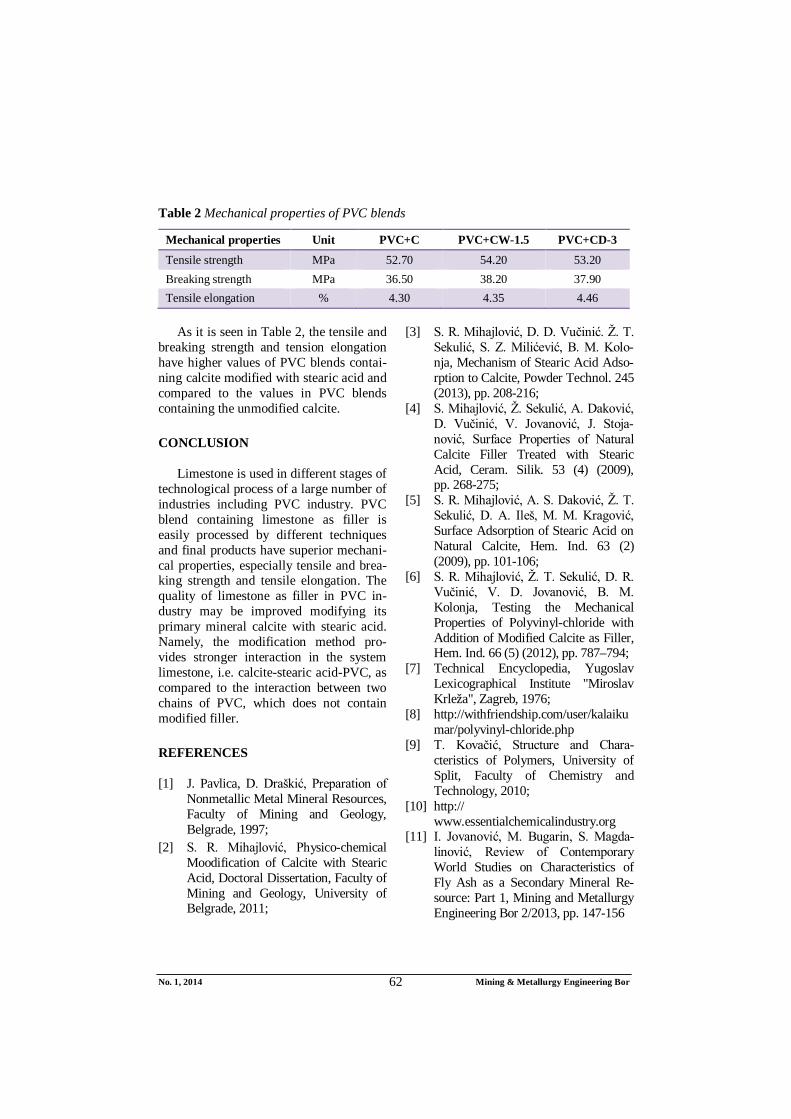
No. 1, 2014 Mining & Metallurgy Engineering Bor 62
Table 2 Mechanical properties of PVC blends
Mechanical properties Unit PVC+C PVC+CW-1.5 PVC+CD-3
Tensile strength MPa 52.70 54.20 53.20 Breaking strength MPa 36.50 38.20 37.90 Tensile elongation % 4.30 4.35 4.46
As it is seen in Table 2, the tensile and
breaking strength and tension elongation have higher values of PVC blends contai-ning calcite modified with stearic acid and compared to the values in PVC blends containing the unmodified calcite.
CONCLUSION
Limestone is used in different stages of technological process of a large number of industries including PVC industry. PVC blend containing limestone as filler is easily processed by different techniques and final products have superior mechani-cal properties, especially tensile and brea-king strength and tensile elongation. The quality of limestone as filler in PVC in-dustry may be improved modifying its primary mineral calcite with stearic acid. Namely, the modification method pro-vides stronger interaction in the system limestone, i.e. calcite-stearic acid-PVC, as compared to the interaction between two chains of PVC, which does not contain modified filler.
REFERENCES
[1] J. Pavlica, D. Draškić, Preparation of Nonmetallic Metal Mineral Resources, Faculty of Mining and Geology, Belgrade, 1997;
[2] S. R. Mihajlović, Physico-chemical Moodification of Calcite with Stearic Acid, Doctoral Dissertation, Faculty of Mining and Geology, University of Belgrade, 2011;
[3] S. R. Mihajlović, D. D. Vučinić. Ž. T. Sekulić, S. Z. Milićević, B. M. Kolo-nja, Mechanism of Stearic Acid Adso-rption to Calcite, Powder Technol. 245 (2013), pp. 208-216;
[4] S. Mihajlović, Ž. Sekulić, A. Daković, D. Vučinić, V. Jovanović, J. Stoja-nović, Surface Properties of Natural Calcite Filler Treated with Stearic Acid, Ceram. Silik. 53 (4) (2009), pp. 268-275;
[5] S. R. Mihajlović, A. S. Daković, Ž. T. Sekulić, D. A. Ileš, M. M. Kragović, Surface Adsorption of Stearic Acid on Natural Calcite, Hem. Ind. 63 (2) (2009), pp. 101-106;
[6] S. R. Mihajlović, Ž. T. Sekulić, D. R. Vučinić, V. D. Jovanović, B. M. Kolonja, Testing the Mechanical Properties of Polyvinyl-chloride with Addition of Modified Calcite as Filler, Hem. Ind. 66 (5) (2012), pp. 787–794;
[7] Technical Encyclopedia, Yugoslav Lexicographical Institute "Miroslav Krleža", Zagreb, 1976;
[8] http://withfriendship.com/user/kalaiku mar/polyvinyl-chloride.php
[9] T. Kovačić, Structure and Chara-cteristics of Polymers, University of Split, Faculty of Chemistry and Technology, 2010;
[10] http:// www.essentialchemicalindustry.org
[11] I. Jovanović, M. Bugarin, S. Magda-linović, Review of Contemporary World Studies on Characteristics of Fly Ash as a Secondary Mineral Re-source: Part 1, Mining and Metallurgy Engineering Bor 2/2013, pp. 147-156
Broj 1, 2014. Mining & Metallurgy Engineering Bor 63
INSTITUT ZA RUDARSTVO I METALURGIJU BOR ISSN: 2334-8836 UDK: 622
UDK: 678.743:666.92(045)=861 DOI:10.5937/MMEB1401057M
Slavica R. Mihajlović*, Dragan S. Radulović*, Sonja Z. Milićević*, Živko T. Sekulić*
PRIMENA KREČNJAKA U INDUSTRIJI POLIVINIL-HLORIDA**
Izvod
U radu je prikazan značaj krečnjaka u različitim industrijskim granama sa posebnim osvrtom na upotrebu krečnjaka kao punioca u industriji polivinil-hlorida (PVC). Od svih punilaca koja se koriste u industriji prerade PVC-a, 80 % su punioci tipa kalcijum karbonata. Punioci se koriste sa ciljem da se poboljšaju različite mehaničke osobine polimera kao što su: zatezna i prekidna svojstva, gustina, tvrdoća, toplotna postojanost, viskozitet i drugo. Najnoviji pravci industrijskog razvoja kao i zahtevi prerađivačke industrije za što kvalitetnijim karbonatnim puniocima uticali su na uvođenje postupka površinskog modifikovanja krečnjaka odnosno kalcita, koji je osnovni konstituent fino mikroniziranog krečnjaka kako bi se poboljšale njegove osobine.
Ključne reči: krečnjak, kalcit, punilac, PVC.
* Institut za tehnologiju nuklearnih i drugih mineralnih sirovina, Franše d’Eperea 86, 11000 Beograd, Srbija, e-mail adresa: [email protected]
**Ovaj rad je nastao kao rezultat istraživanja na Projektu TR 34013: „Osvajanje tehnoloških postupaka dobijanja ekoloških materijala na bazi nemetaličnih mineralnih sirovina“ i Projektu TR 34006: „Mehanohemijski tretman nedovoljno kvalitetnih mineralnih sirovina“, koje finansira Ministarstvo prosvete, nauke i tehnološkog razvoja Republike Srbije za period 2011-2014.
UVOD
Krečnjak se koristi u velikom broju industrijskih grana uključujući i industriju za preradu polivinil hlorida (PVC). Veliku primenu krečnjak je našao u građevinarstvu gde se koristi za pravljenje maltera, betonskih mešavina, u proizvodnji raznih vrsta cementa, kreča i direktno u vidu drobljenog kamena različite krupnoće. Značajan korisnik krečnjaka je metalurgija, gde se krečnjak koristi u aglomeraciji, u visokim pećima i kod Besemerovog postupka topljenja. Hemijska industrija, takođe, koristi značajne količine ove siro-vine u industrijskoj proizvodnji azotnih jedinjenja, celuloze, papira, sode, hlornog kreča, karbida, gume i dr. U poljoprivredi krečnjak se koristi za neutralizaciju kiselih zemljišta i kao dodatak stočnoj hrani. Značajne količine krečnjaka koriste indu-
strija šećera, staklarska i keramička indu-strija. U velikom broju slučajeva pojedine industrijske grane su utvrdile opšte stan-darde kvaliteta krečnjaka, mada ima slučajeva da korisnici određuju svoje interne zahteve.
Kvalitet krečnjaka (definisan hemijskim sastavom) odnosi se na najmanji sadržaj CaO, odnosno CaCO3 i najveći dozvoljeni sadržaj nečistoća i štetnih komponenti, kao što su: Fe2O3, SiO2, Al2O3, MgO, P2O5, TiO2, MnO, Cr2O3, sadržaj alkalija, gipsa i dr. U grupu fizičkih svojstava koje određuju kvalitet krečnjaka spadaju: granulometrijski sastav, tvrdina, nosivost, poroznost, boja i dr. Krečnjak koji se koristi kao punilac u različitim industrijskim granama mora da bude visokokvalitetna fino usitnjena siro-vina. Kod proizvoda na bazi krečnjaka
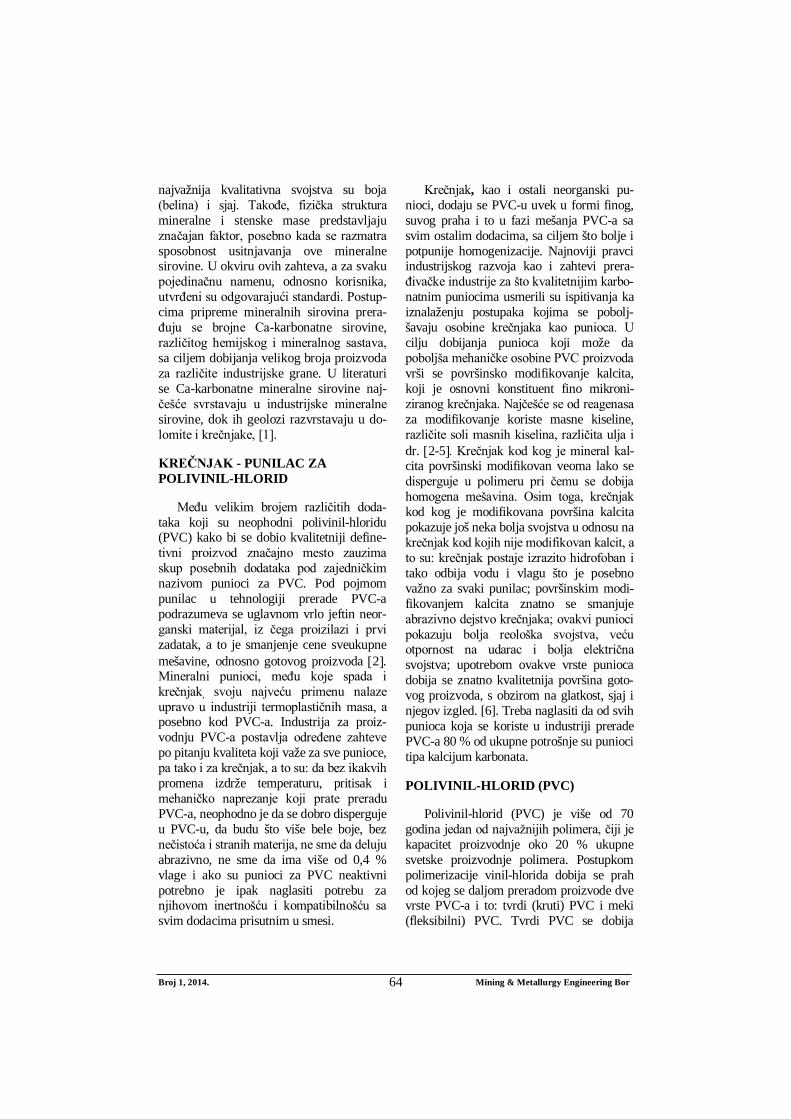
Broj 1, 2014. Mining & Metallurgy Engineering Bor 64
najvažnija kvalitativna svojstva su boja (belina) i sjaj. Takođe, fizička struktura mineralne i stenske mase predstavljaju značajan faktor, posebno kada se razmatra sposobnost usitnjavanja ove mineralne sirovine. U okviru ovih zahteva, a za svaku pojedinačnu namenu, odnosno korisnika, utvrđeni su odgovarajući standardi. Postup-cima pripreme mineralnih sirovina prera-đuju se brojne Ca-karbonatne sirovine, različitog hemijskog i mineralnog sastava, sa ciljem dobijanja velikog broja proizvoda za različite industrijske grane. U literaturi se Ca-karbonatne mineralne sirovine naj-češće svrstavaju u industrijske mineralne sirovine, dok ih geolozi razvrstavaju u do-lomite i krečnjake, [1].
KREČNJAK - PUNILAC ZA POLIVINIL-HLORID
Među velikim brojem različitih doda-taka koji su neophodni polivinil-hloridu (PVC) kako bi se dobio kvalitetniji define-tivni proizvod značajno mesto zauzima skup posebnih dodataka pod zajedničkim nazivom punioci za PVC. Pod pojmom punilac u tehnologiji prerade PVC-a podrazumeva se uglavnom vrlo jeftin neor-ganski materijal, iz čega proizilazi i prvi zadatak, a to je smanjenje cene sveukupne mešavine, odnosno gotovog proizvoda 2. Mineralni punioci, među koje spada i krečnjak, svoju najveću primenu nalaze upravo u industriji termoplastičnih masa, a posebno kod PVC-a. Industrija za proiz-vodnju PVC-a postavlja određene zahteve po pitanju kvaliteta koji važe za sve punioce, pa tako i za krečnjak, a to su: da bez ikakvih promena izdrže temperaturu, pritisak i mehaničko naprezanje koji prate preradu PVC-a, neophodno je da se dobro disperguje u PVC-u, da budu što više bele boje, bez nečistoća i stranih materija, ne sme da deluju abrazivno, ne sme da ima više od 0,4 % vlage i ako su punioci za PVC neaktivni potrebno je ipak naglasiti potrebu za njihovom inertnošću i kompatibilnošću sa svim dodacima prisutnim u smesi.
Krečnjak, kao i ostali neorganski pu-nioci, dodaju se PVC-u uvek u formi finog, suvog praha i to u fazi mešanja PVC-a sa svim ostalim dodacima, sa ciljem što bolje i potpunije homogenizacije. Najnoviji pravci industrijskog razvoja kao i zahtevi prera-đivačke industrije za što kvalitetnijim karbo-natnim puniocima usmerili su ispitivanja ka iznalaženju postupaka kojima se pobolj-šavaju osobine krečnjaka kao punioca. U cilju dobijanja punioca koji može da poboljša mehaničke osobine PVC proizvoda vrši se površinsko modifikovanje kalcita, koji je osnovni konstituent fino mikroni-ziranog krečnjaka. Najčešće se od reagenasa za modifikovanje koriste masne kiseline, različite soli masnih kiselina, različita ulja i dr. 2-5. Krečnjak kod kog je mineral kal-cita površinski modifikovan veoma lako se disperguje u polimeru pri čemu se dobija homogena mešavina. Osim toga, krečnjak kod kog je modifikovana površina kalcita pokazuje još neka bolja svojstva u odnosu na krečnjak kod kojih nije modifikovan kalcit, a to su: krečnjak postaje izrazito hidrofoban i tako odbija vodu i vlagu što je posebno važno za svaki punilac; površinskim modi-fikovanjem kalcita znatno se smanjuje abrazivno dejstvo krečnjaka; ovakvi punioci pokazuju bolja reološka svojstva, veću otpornost na udarac i bolja električna svojstva; upotrebom ovakve vrste punioca dobija se znatno kvalitetnija površina goto-vog proizvoda, s obzirom na glatkost, sjaj i njegov izgled. [6]. Treba naglasiti da od svih punioca koja se koriste u industriji prerade PVC-a 80 % od ukupne potrošnje su punioci tipa kalcijum karbonata.
POLIVINIL-HLORID (PVC)
Polivinil-hlorid (PVC) je više od 70 godina jedan od najvažnijih polimera, čiji je kapacitet proizvodnje oko 20 % ukupne svetske proizvodnje polimera. Postupkom polimerizacije vinil-hlorida dobija se prah od kojeg se daljom preradom proizvode dve vrste PVC-a i to: tvrdi (kruti) PVC i meki (fleksibilni) PVC. Tvrdi PVC se dobija
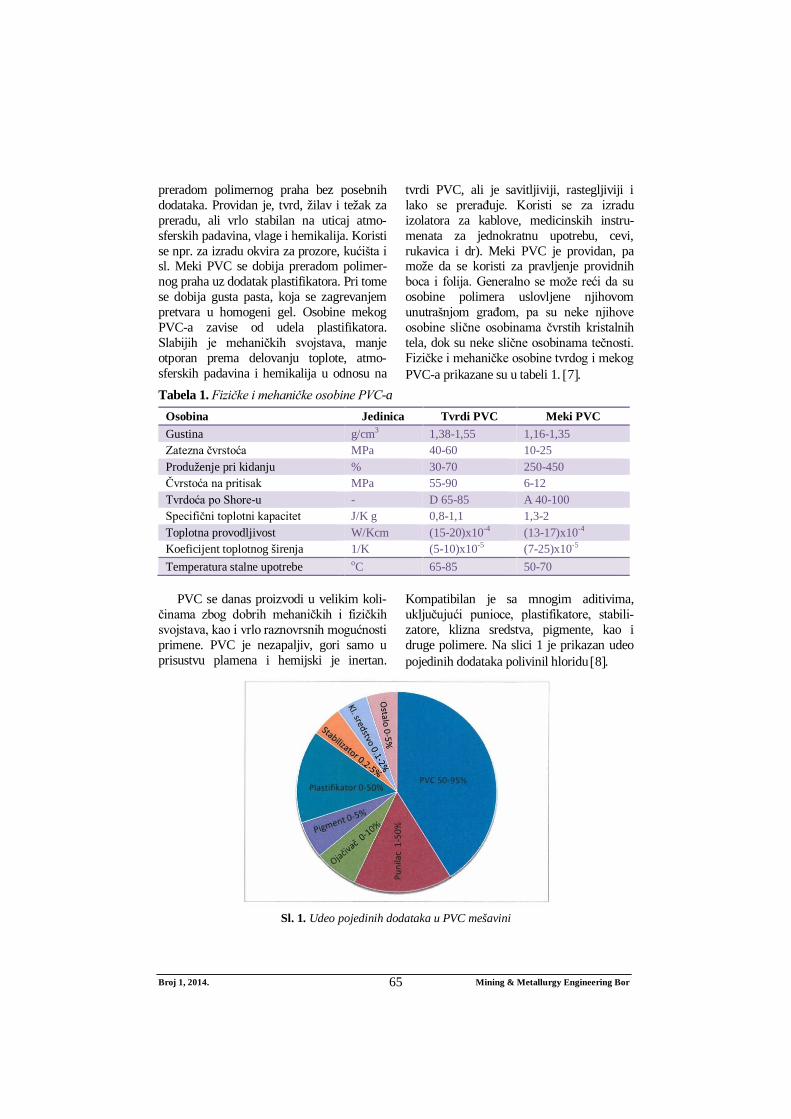
Broj 1, 2014. Mining & Metallurgy Engineering Bor 65
preradom polimernog praha bez posebnih dodataka. Providan je, tvrd, žilav i težak za preradu, ali vrlo stabilan na uticaj atmo-sferskih padavina, vlage i hemikalija. Koristi se npr. za izradu okvira za prozore, kućišta i sl. Meki PVC se dobija preradom polimer-nog praha uz dodatak plastifikatora. Pri tome se dobija gusta pasta, koja se zagrevanjem pretvara u homogeni gel. Osobine mekog PVC-a zavise od udela plastifikatora. Slabijih je mehaničkih svojstava, manje otporan prema delovanju toplote, atmo-sferskih padavina i hemikalija u odnosu na
tvrdi PVC, ali je savitljiviji, rastegljiviji i lako se prerađuje. Koristi se za izradu izolatora za kablove, medicinskih instru-menata za jednokratnu upotrebu, cevi, rukavica i dr). Meki PVC je providan, pa može da se koristi za pravljenje providnih boca i folija. Generalno se može reći da su osobine polimera uslovljene njihovom unutrašnjom građom, pa su neke njihove osobine slične osobinama čvrstih kristalnih tela, dok su neke slične osobinama tečnosti. Fizičke i mehaničke osobine tvrdog i mekog PVC-a prikazane su u tabeli 1. 7.
Tabela 1. Fizičke i mehaničke osobine PVC-a Osobina Jedinica Tvrdi PVC Meki PVC Gustina g/cm3 1,38-1,55 1,16-1,35 Zatezna čvrstoća MPa 40-60 10-25 Produženje pri kidanju % 30-70 250-450 Čvrstoća na pritisak MPa 55-90 6-12 Tvrdoća po Shore-u - D 65-85 A 40-100 Specifični toplotni kapacitet J/K g 0,8-1,1 1,3-2 Toplotna provodljivost W/Kcm (15-20)x10-4 (13-17)x10-4 Koeficijent toplotnog širenja 1/K (5-10)x10-5 (7-25)x10-5 Temperatura stalne upotrebe oC 65-85 50-70
PVC se danas proizvodi u velikim koli-
činama zbog dobrih mehaničkih i fizičkih svojstava, kao i vrlo raznovrsnih mogućnosti primene. PVC je nezapaljiv, gori samo u prisustvu plamena i hemijski je inertan.
Kompatibilan je sa mnogim aditivima, uključujući punioce, plastifikatore, stabili-zatore, klizna sredstva, pigmente, kao i druge polimere. Na slici 1 je prikazan udeo pojedinih dodataka polivinil hloridu 8.
Sl. 1. Udeo pojedinih dodataka u PVC mešavini
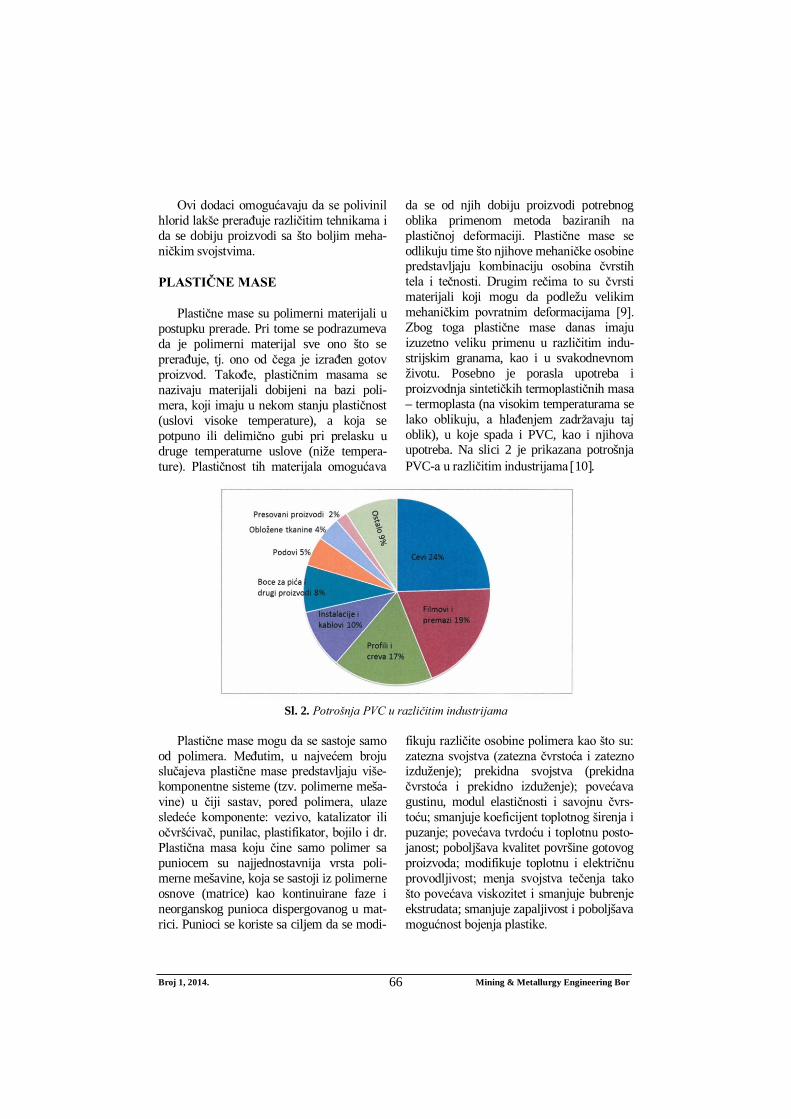
Broj 1, 2014. Mining & Metallurgy Engineering Bor 66
Ovi dodaci omogućavaju da se polivinil
hlorid lakše prerađuje različitim tehnikama i da se dobiju proizvodi sa što boljim meha-ničkim svojstvima.
PLASTIČNE MASE
Plastične mase su polimerni materijali u postupku prerade. Pri tome se podrazumeva da je polimerni materijal sve ono što se prerađuje, tj. ono od čega je izrađen gotov proizvod. Takođe, plastičnim masama se nazivaju materijali dobijeni na bazi poli-mera, koji imaju u nekom stanju plastičnost (uslovi visoke temperature), a koja se potpuno ili delimično gubi pri prelasku u druge temperaturne uslove (niže tempera-ture). Plastičnost tih materijala omogućava
da se od njih dobiju proizvodi potrebnog oblika primenom metoda baziranih na plastičnoj deformaciji. Plastične mase se odlikuju time što njihove mehaničke osobine predstavljaju kombinaciju osobina čvrstih tela i tečnosti. Drugim rečima to su čvrsti materijali koji mogu da podležu velikim mehaničkim povratnim deformacijama [9]. Zbog toga plastične mase danas imaju izuzetno veliku primenu u različitim indu-strijskim granama, kao i u svakodnevnom životu. Posebno je porasla upotreba i proizvodnja sintetičkih termoplastičnih masa – termoplasta (na visokim temperaturama se lako oblikuju, a hlađenjem zadržavaju taj oblik), u koje spada i PVC, kao i njihova upotreba. Na slici 2 je prikazana potrošnja PVC-a u različitim industrijama 10.
Sl. 2. Potrošnja PVC u različitim industrijama
Plastične mase mogu da se sastoje samo
od polimera. Međutim, u najvećem broju slučajeva plastične mase predstavljaju više-komponentne sisteme (tzv. polimerne meša-vine) u čiji sastav, pored polimera, ulaze sledeće komponente: vezivo, katalizator ili očvršćivač, punilac, plastifikator, bojilo i dr. Plastična masa koju čine samo polimer sa puniocem su najjednostavnija vrsta poli-merne mešavine, koja se sastoji iz polimerne osnove (matrice) kao kontinuirane faze i neorganskog punioca dispergovanog u mat-rici. Punioci se koriste sa ciljem da se modi-
fikuju različite osobine polimera kao što su: zatezna svojstva (zatezna čvrstoća i zatezno izduženje); prekidna svojstva (prekidna čvrstoća i prekidno izduženje); povećava gustinu, modul elastičnosti i savojnu čvrs-toću; smanjuje koeficijent toplotnog širenja i puzanje; povećava tvrdoću i toplotnu posto-janost; poboljšava kvalitet površine gotovog proizvoda; modifikuje toplotnu i električnu provodljivost; menja svojstva tečenja tako što povećava viskozitet i smanjuje bubrenje ekstrudata; smanjuje zapaljivost i poboljšava mogućnost bojenja plastike.
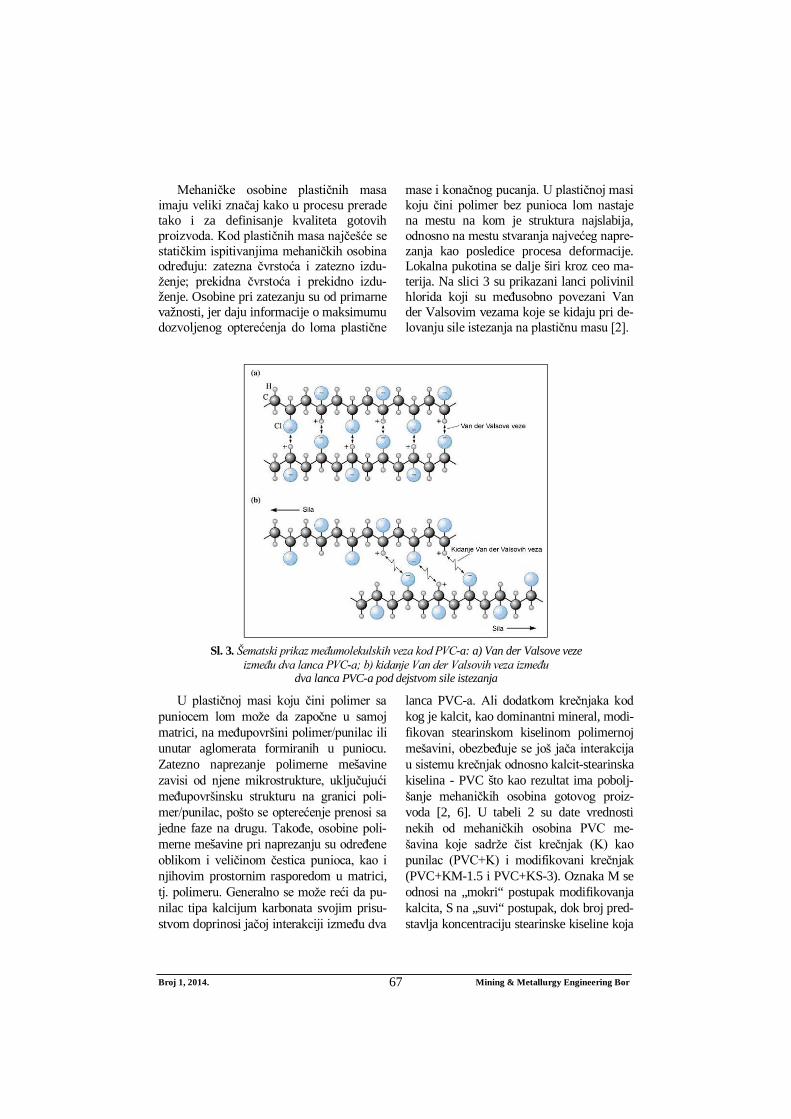
Broj 1, 2014. Mining & Metallurgy Engineering Bor 67
Mehaničke osobine plastičnih masa imaju veliki značaj kako u procesu prerade tako i za definisanje kvaliteta gotovih proizvoda. Kod plastičnih masa najčešće se statičkim ispitivanjima mehaničkih osobina određuju: zatezna čvrstoća i zatezno izdu-ženje; prekidna čvrstoća i prekidno izdu-ženje. Osobine pri zatezanju su od primarne važnosti, jer daju informacije o maksimumu dozvoljenog opterećenja do loma plastične
mase i konačnog pucanja. U plastičnoj masi koju čini polimer bez punioca lom nastaje na mestu na kom je struktura najslabija, odnosno na mestu stvaranja najvećeg napre-zanja kao posledice procesa deformacije. Lokalna pukotina se dalje širi kroz ceo ma-terija. Na slici 3 su prikazani lanci polivinil hlorida koji su međusobno povezani Van der Valsovim vezama koje se kidaju pri de-lovanju sile istezanja na plastičnu masu [2].
Sl. 3. Šematski prikaz međumolekulskih veza kod PVC-a: a) Van der Valsove veze
između dva lanca PVC-a; b) kidanje Van der Valsovih veza između dva lanca PVC-a pod dejstvom sile istezanja
U plastičnoj masi koju čini polimer sa puniocem lom može da započne u samoj matrici, na međupovršini polimer/punilac ili unutar aglomerata formiranih u puniocu. Zatezno naprezanje polimerne mešavine zavisi od njene mikrostrukture, uključujući međupovršinsku strukturu na granici poli-mer/punilac, pošto se opterećenje prenosi sa jedne faze na drugu. Takođe, osobine poli-merne mešavine pri naprezanju su određene oblikom i veličinom čestica punioca, kao i njihovim prostornim rasporedom u matrici, tj. polimeru. Generalno se može reći da pu-nilac tipa kalcijum karbonata svojim prisu-stvom doprinosi jačoj interakciji između dva
lanca PVC-a. Ali dodatkom krečnjaka kod kog je kalcit, kao dominantni mineral, modi-fikovan stearinskom kiselinom polimernoj mešavini, obezbeđuje se još jača interakcija u sistemu krečnjak odnosno kalcit-stearinska kiselina - PVC što kao rezultat ima pobolj-šanje mehaničkih osobina gotovog proiz-voda [2, 6]. U tabeli 2 su date vrednosti nekih od mehaničkih osobina PVC me-šavina koje sadrže čist krečnjak (K) kao punilac (PVC+K) i modifikovani krečnjak (PVC+KM-1.5 i PVC+KS-3). Oznaka M se odnosi na „mokri“ postupak modifikovanja kalcita, S na „suvi“ postupak, dok broj pred-stavlja koncentraciju stearinske kiseline koja
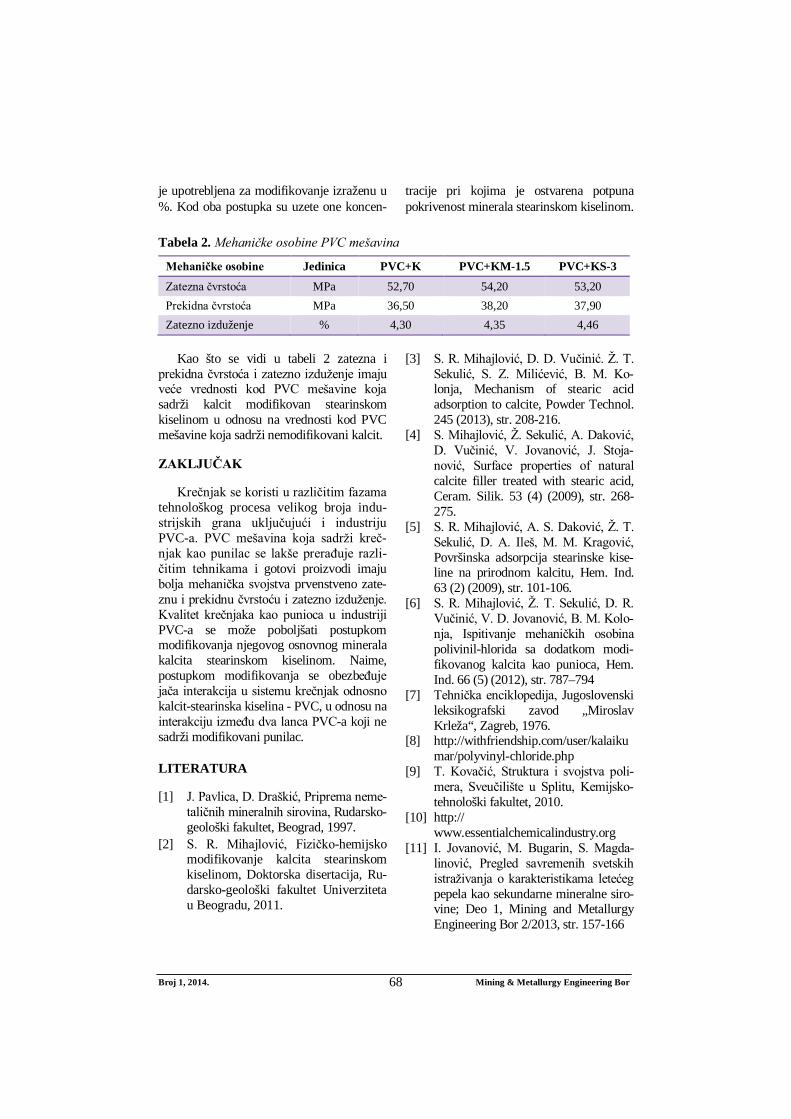
Broj 1, 2014. Mining & Metallurgy Engineering Bor 68
je upotrebljena za modifikovanje izraženu u %. Kod oba postupka su uzete one koncen-
tracije pri kojima je ostvarena potpuna pokrivenost minerala stearinskom kiselinom.
Tabela 2. Mehaničke osobine PVC mešavina
Mehaničke osobine Jedinica PVC+K PVC+KM-1.5 PVC+KS-3 Zatezna čvrstoća MPa 52,70 54,20 53,20 Prekidna čvrstoća MPa 36,50 38,20 37,90 Zatezno izduženje % 4,30 4,35 4,46
Kao što se vidi u tabeli 2 zatezna i
prekidna čvrstoća i zatezno izduženje imaju veće vrednosti kod PVC mešavine koja sadrži kalcit modifikovan stearinskom kiselinom u odnosu na vrednosti kod PVC mešavine koja sadrži nemodifikovani kalcit.
ZAKLJUČAK
Krečnjak se koristi u različitim fazama tehnološkog procesa velikog broja indu-strijskih grana uključujući i industriju PVC-a. PVC mešavina koja sadrži kreč-njak kao punilac se lakše prerađuje razli-čitim tehnikama i gotovi proizvodi imaju bolja mehanička svojstva prvenstveno zate-znu i prekidnu čvrstoću i zatezno izduženje. Kvalitet krečnjaka kao punioca u industriji PVC-a se može poboljšati postupkom modifikovanja njegovog osnovnog minerala kalcita stearinskom kiselinom. Naime, postupkom modifikovanja se obezbeđuje jača interakcija u sistemu krečnjak odnosno kalcit-stearinska kiselina - PVC, u odnosu na interakciju između dva lanca PVC-a koji ne sadrži modifikovani punilac.
LITERATURA
[1] J. Pavlica, D. Draškić, Priprema neme-taličnih mineralnih sirovina, Rudarsko-geološki fakultet, Beograd, 1997.
[2] S. R. Mihajlović, Fizičko-hemijsko modifikovanje kalcita stearinskom kiselinom, Doktorska disertacija, Ru-darsko-geološki fakultet Univerziteta u Beogradu, 2011.
[3] S. R. Mihajlović, D. D. Vučinić. Ž. T. Sekulić, S. Z. Milićević, B. M. Ko-lonja, Mechanism of stearic acid adsorption to calcite, Powder Technol. 245 (2013), str. 208-216.
[4] S. Mihajlović, Ž. Sekulić, A. Daković, D. Vučinić, V. Jovanović, J. Stoja-nović, Surface properties of natural calcite filler treated with stearic acid, Ceram. Silik. 53 (4) (2009), str. 268-275.
[5] S. R. Mihajlović, A. S. Daković, Ž. T. Sekulić, D. A. Ileš, M. M. Kragović, Površinska adsorpcija stearinske kise-line na prirodnom kalcitu, Hem. Ind. 63 (2) (2009), str. 101-106.
[6] S. R. Mihajlović, Ž. T. Sekulić, D. R. Vučinić, V. D. Jovanović, B. M. Kolo-nja, Ispitivanje mehaničkih osobina polivinil-hlorida sa dodatkom modi-fikovanog kalcita kao punioca, Hem. Ind. 66 (5) (2012), str. 787–794
[7] Tehnička enciklopedija, Jugoslovenski leksikografski zavod „Miroslav Krleža“, Zagreb, 1976.
[8] http://withfriendship.com/user/kalaiku mar/polyvinyl-chloride.php
[9] T. Kovačić, Struktura i svojstva poli-mera, Sveučilište u Splitu, Kemijsko-tehnološki fakultet, 2010.
[10] http:// www.essentialchemicalindustry.org
[11] I. Jovanović, M. Bugarin, S. Magda-linović, Pregled savremenih svetskih istraživanja o karakteristikama letećeg pepela kao sekundarne mineralne siro-vine; Deo 1, Mining and Metallurgy Engineering Bor 2/2013, str. 157-166
No. 1, 2014 Mining & Metallurgy Engineering Bor 69
MINING AND METALLURGY INSTITUTE BOR ISSN: 2334-8836 UDK: 622
UDK: 622.7(045)=20 DOI:10.5937/MMEB1401069P
Milan Petrov*, Ljubiša Andrić*, Živko Sekulić*, Zoran Bartulović*
MODELING THE BATCH POWER OF MILL**
Abstract
This paper presents a new method of modeling the batch power of mill on the basis of dimensional analysis and criterion equations. The grinding batch is represented by the grinding bodies, material and medium that is used to provide the flow of raw material through the mill, and most commonly water or air. The rate of energy consumption in the mill is regulated by the charge density and it presents the charge density. The feed power is dependent on the type of media milling body and prior to the treat-ment of mineral raw materials. Approximate power mill defined engine power is the power of batch mill highest charge density. In the work is varied density in batch laboratory mills and defined a model of batch power mill which we used in the adaptation of the mill plants in new industrial plant.The present model of the feed mill power is checked on industrial exploitation of quartz raw materials in Lukic polje near Milici. The process of mechano-chemical treatment defines as venture milling with longer resi-dence time of material in the mill and small batch densities, all with the aim to reduce the force with which the batch effect on grain mineral resources. Radicality of fragmentation varies with the density of charge so that the densities obtained with smaller sized features special milling products with a narrow-er range of narrow size class and thus increased the specific surface area and reactivity.
Keywords: batch strength, charge density, mechano-chemical treatment, reactivity
* Institute for Technology of Nuclear and Other Mineral Raw Materials, [email protected] ** The presented results are a part of research within the Projects TR 34006 “Mechanochemistry treat-
ment of low quality mineral raw materials” and TR 34013 “Development of technological processes for obtaining of ecological materials based on nonmetallic minerals” whose implementation is funded by the Ministry of Education, Science and Technological Development of the Republic of Serbia.
INTRODUCTION
Modeling the batch strength of mill, shown in the work was done on the basis of theoretical considerations and dimensional analysis using the criterion equations. The paper uses a laboratory model and dimen-sional analysis, based on the similarity of dynamic invariants developed a model of mechano-chemical treatment in an industrial mill. The paper describes the process flow of physical modeling and determination of engine power for lower density batch mill
š , given that the grinding is done with silex balls and not with the metal balls. Thus
developed model provides answers to the question of the necessary batch strength of quartz sand grinding at the converted facility for so-called unconventional conditions of grinding or mechano-chemical treatment.
THEORETICAL CONSIDERATIONS
Theoretical considerations are related to the model of flow in the mill as a streaming media through the pipe with the certain characteristics. The required parameters that describe this process are:
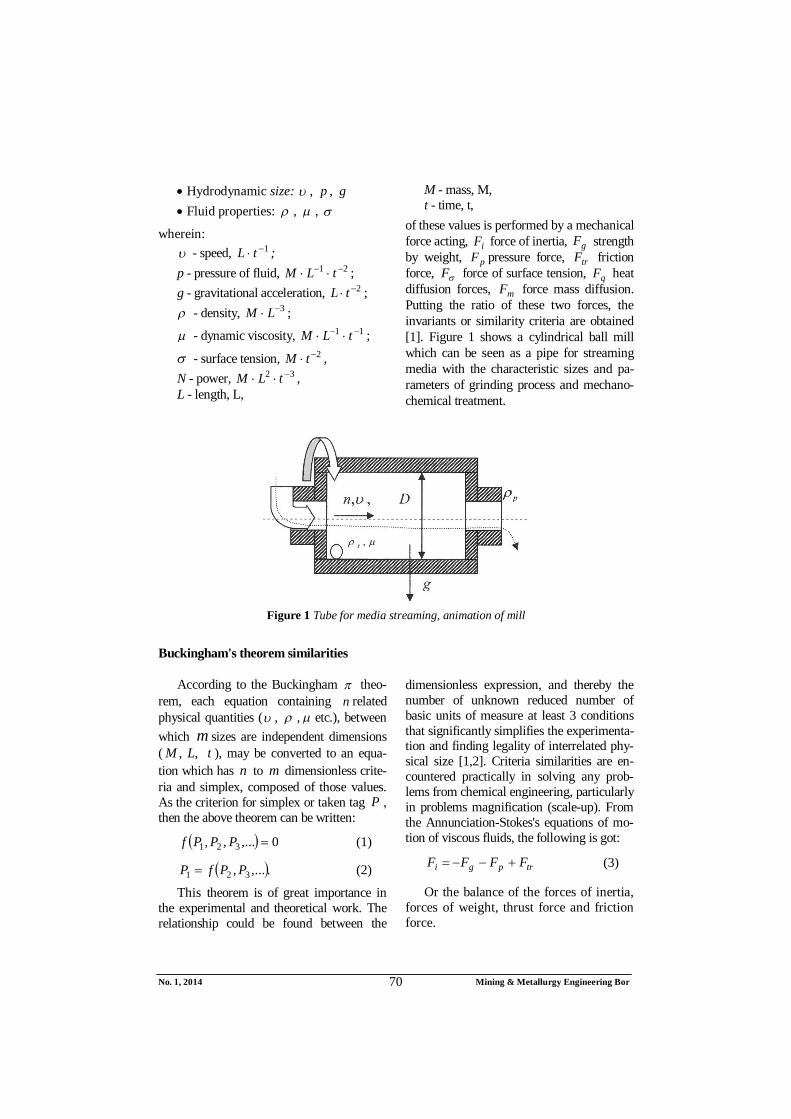
No. 1, 2014 Mining & Metallurgy Engineering Bor 70
Hydrodynamic size: , p , g Fluid properties: , ,
wherein: - speed, 1 tL ; p - pressure of fluid, 21 tLM ; g - gravitational acceleration, 2 tL ; - density, 3 LM ;
- dynamic viscosity, 11 tLM ;
- surface tension, 2 tM , N - power, 32 tLM , L - length, L,
M - mass, M, t - time, t,
of these values is performed by a mechanical force acting, iF force of inertia, gF strength by weight, pF pressure force, trF friction force, F force of surface tension, qF heat diffusion forces, mF force mass diffusion. Putting the ratio of these two forces, the invariants or similarity criteria are obtained [1]. Figure 1 shows a cylindrical ball mill which can be seen as a pipe for streaming media with the characteristic sizes and pa-rameters of grinding process and mechano-chemical treatment.
Figure 1 Tube for media streaming, animation of mill
Buckingham's theorem similarities
According to the Buckingham theo-rem, each equation containing n related physical quantities ( , , etc.), between which m sizes are independent dimensions ( ,M ,L t ), may be converted to an equa-tion which has n to m dimensionless crite-ria and simplex, composed of those values. As the criterion for simplex or taken tag P , then the above theorem can be written:
0,...,, 321 PPPf (1)
.,..., 321 PPfP (2)
This theorem is of great importance in the experimental and theoretical work. The relationship could be found between the
dimensionless expression, and thereby the number of unknown reduced number of basic units of measure at least 3 conditions that significantly simplifies the experimenta-tion and finding legality of interrelated phy-sical size [1,2]. Criteria similarities are en-countered practically in solving any prob-lems from chemical engineering, particularly in problems magnification (scale-up). From the Annunciation-Stokes's equations of mo-tion of viscous fluids, the following is got:
trpgi FFFF (3)
Or the balance of the forces of inertia, forces of weight, thrust force and friction force.
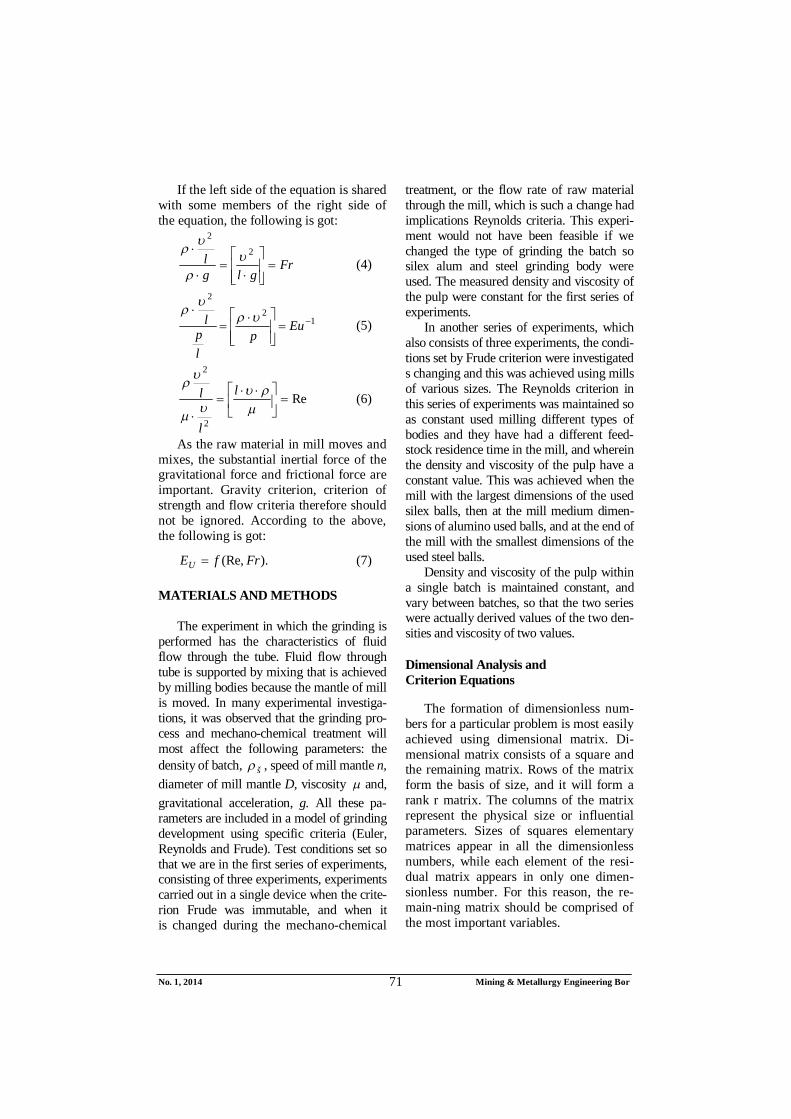
No. 1, 2014 Mining & Metallurgy Engineering Bor 71
If the left side of the equation is shared with some members of the right side of the equation, the following is got:
Frglg
l
2
2
(4)
12
2
Eu
plp
l
(5)
Re
2
2
l
l
l (6)
As the raw material in mill moves and mixes, the substantial inertial force of the gravitational force and frictional force are important. Gravity criterion, criterion of strength and flow criteria therefore should not be ignored. According to the above, the following is got:
).(Re, FrfEU (7)
MATERIALS AND METHODS
The experiment in which the grinding is performed has the characteristics of fluid flow through the tube. Fluid flow through tube is supported by mixing that is achieved by milling bodies because the mantle of mill is moved. In many experimental investiga-tions, it was observed that the grinding pro-cess and mechano-chemical treatment will most affect the following parameters: the density of batch, š , speed of mill mantle n, diameter of mill mantle D, viscosity and, gravitational acceleration, g. All these pa-rameters are included in a model of grinding development using specific criteria (Euler, Reynolds and Frude). Test conditions set so that we are in the first series of experiments, consisting of three experiments, experiments carried out in a single device when the crite-rion Frude was immutable, and when it is changed during the mechano-chemical
treatment, or the flow rate of raw material through the mill, which is such a change had implications Reynolds criteria. This experi-ment would not have been feasible if we changed the type of grinding the batch so silex alum and steel grinding body were used. The measured density and viscosity of the pulp were constant for the first series of experiments.
In another series of experiments, which also consists of three experiments, the condi-tions set by Frude criterion were investigated s changing and this was achieved using mills of various sizes. The Reynolds criterion in this series of experiments was maintained so as constant used milling different types of bodies and they have had a different feed-stock residence time in the mill, and wherein the density and viscosity of the pulp have a constant value. This was achieved when the mill with the largest dimensions of the used silex balls, then at the mill medium dimen-sions of alumino used balls, and at the end of the mill with the smallest dimensions of the used steel balls.
Density and viscosity of the pulp within a single batch is maintained constant, and vary between batches, so that the two series were actually derived values of the two den-sities and viscosity of two values.
Dimensional Analysis and Criterion Equations
The formation of dimensionless num-bers for a particular problem is most easily achieved using dimensional matrix. Di-mensional matrix consists of a square and the remaining matrix. Rows of the matrix form the basis of size, and it will form a rank r matrix. The columns of the matrix represent the physical size or influential parameters. Sizes of squares elementary matrices appear in all the dimensionless numbers, while each element of the resi-dual matrix appears in only one dimen-sionless number. For this reason, the re-main-ning matrix should be comprised of the most important variables.
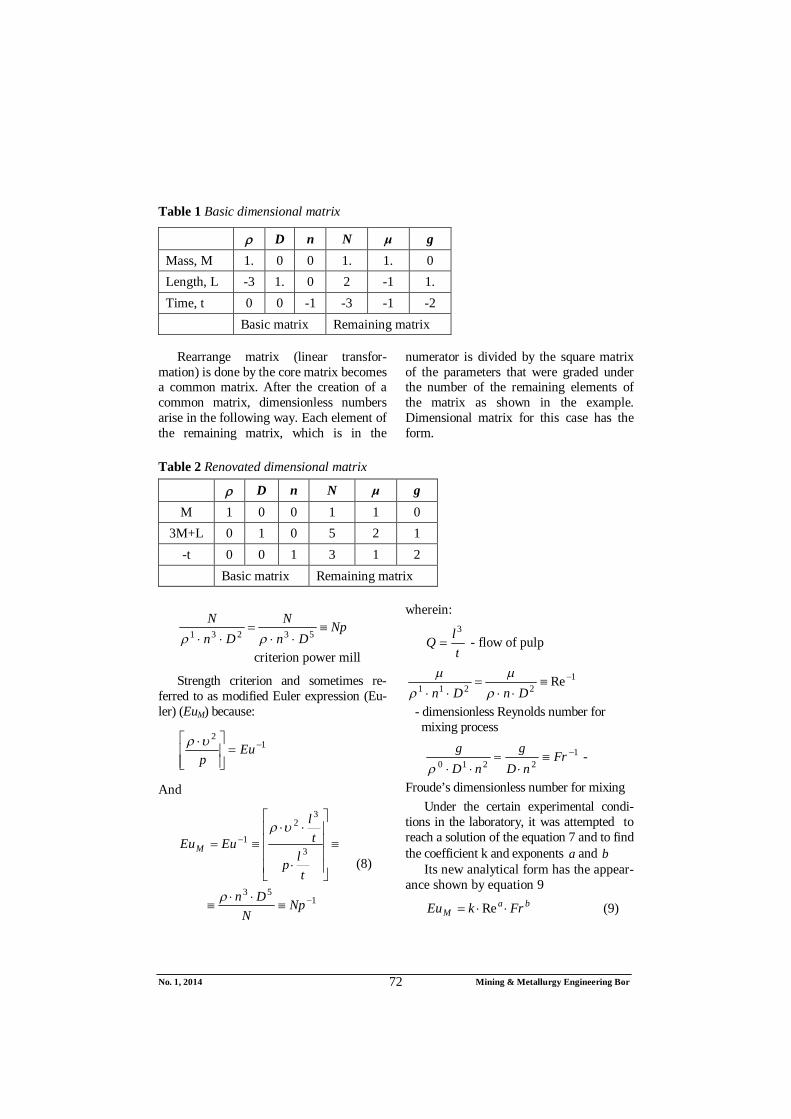
No. 1, 2014 Mining & Metallurgy Engineering Bor 72
Table 1 Basic dimensional matrix
D n N μ g Mass, M 1. 0 0 1. 1. 0 Length, L -3 1. 0 2 -1 1. Time, t 0 0 -1 -3 -1 -2 Basic matrix Remaining matrix
Rearrange matrix (linear transfor-
mation) is done by the core matrix becomes a common matrix. After the creation of a common matrix, dimensionless numbers arise in the following way. Each element of the remaining matrix, which is in the
numerator is divided by the square matrix of the parameters that were graded under the number of the remaining elements of the matrix as shown in the example. Dimensional matrix for this case has the form.
Table 2 Renovated dimensional matrix
D n N μ g M 1 0 0 1 1 0
3M+L 0 1 0 5 2 1 -t 0 0 1 3 1 2
Basic matrix Remaining matrix
NpDn
NDn
N
53231
criterion power mill
Strength criterion and sometimes re-ferred to as modified Euler expression (Eu-ler) (EuM) because:
12
Eup
And
153
3
32
1
NpN
Dnt
lp
tl
EuEuM
(8)
wherein:
tlQ
3 - flow of pulp
12211 Re
DnDn
- dimensionless Reynolds number for mixing process
12210
FrnD
gnD
g
-
Froude’s dimensionless number for mixing Under the certain experimental condi-
tions in the laboratory, it was attempted to reach a solution of the equation 7 and to find the coefficient k and exponents a and b
Its new analytical form has the appear-ance shown by equation 9
baM FrkEu Re (9)
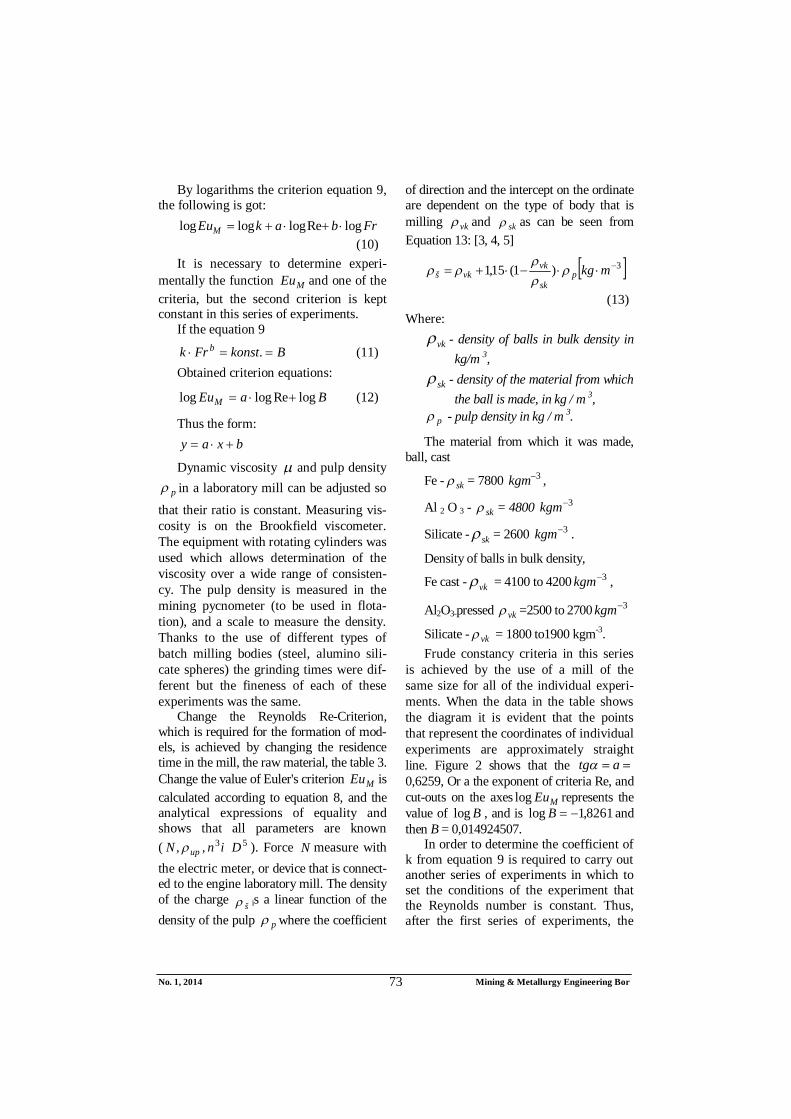
No. 1, 2014 Mining & Metallurgy Engineering Bor 73
By logarithms the criterion equation 9, the following is got:
FrbakEuM logRelogloglog (10)
It is necessary to determine experi-mentally the function MEu and one of the criteria, but the second criterion is kept constant in this series of experiments.
If the equation 9
BkonstFrk b . (11) Obtained criterion equations:
BaEuM logReloglog (12)
Thus the form: bxay
Dynamic viscosity and pulp density
p in a laboratory mill can be adjusted so
that their ratio is constant. Measuring vis-cosity is on the Brookfield viscometer. The equipment with rotating cylinders was used which allows determination of the viscosity over a wide range of consisten-cy. The pulp density is measured in the mining pycnometer (to be used in flota-tion), and a scale to measure the density. Thanks to the use of different types of batch milling bodies (steel, alumino sili-cate spheres) the grinding times were dif-ferent but the fineness of each of these experiments was the same.
Change the Reynolds Re-Criterion, which is required for the formation of mod-els, is achieved by changing the residence time in the mill, the raw material, the table 3. Change the value of Euler's criterion MEu is calculated according to equation 8, and the analytical expressions of equality and shows that all parameters are known ( 53,, DinN up ). Force N measure with the electric meter, or device that is connect-ed to the engine laboratory mill. The density of the charge š is a linear function of the density of the pulp p where the coefficient
of direction and the intercept on the ordinate are dependent on the type of body that is milling vk and sk as can be seen from Equation 13: [3, 4, 5]
3)1(15,1 mkgpsk
vkvkš
(13) Where:
vk - density of balls in bulk density in kg/m 3,
sk - density of the material from which the ball is made, in kg / m 3,
p - pulp density in kg / m 3.
The material from which it was made, ball, cast
Fe - sk = 7800 3kgm ,
Al 2 O 3 - sk = 4800 3kgm Silicate - sk = 2600 3kgm .
Density of balls in bulk density,
Fe cast - vk = 4100 to 4200 3kgm ,
Al2O3-pressed vk =2500 to 2700 3kgm Silicate - vk = 1800 to1900 kgm-3. Frude constancy criteria in this series
is achieved by the use of a mill of the same size for all of the individual experi-ments. When the data in the table shows the diagram it is evident that the points that represent the coordinates of individual experiments are approximately straight line. Figure 2 shows that the atg0,6259, Or a the exponent of criteria Re, and cut-outs on the axes MEulog represents the value of Blog , and is 8261,1log B and then B = 0,014924507.
In order to determine the coefficient of k from equation 9 is required to carry out another series of experiments in which to set the conditions of the experiment that the Reynolds number is constant. Thus, after the first series of experiments, the
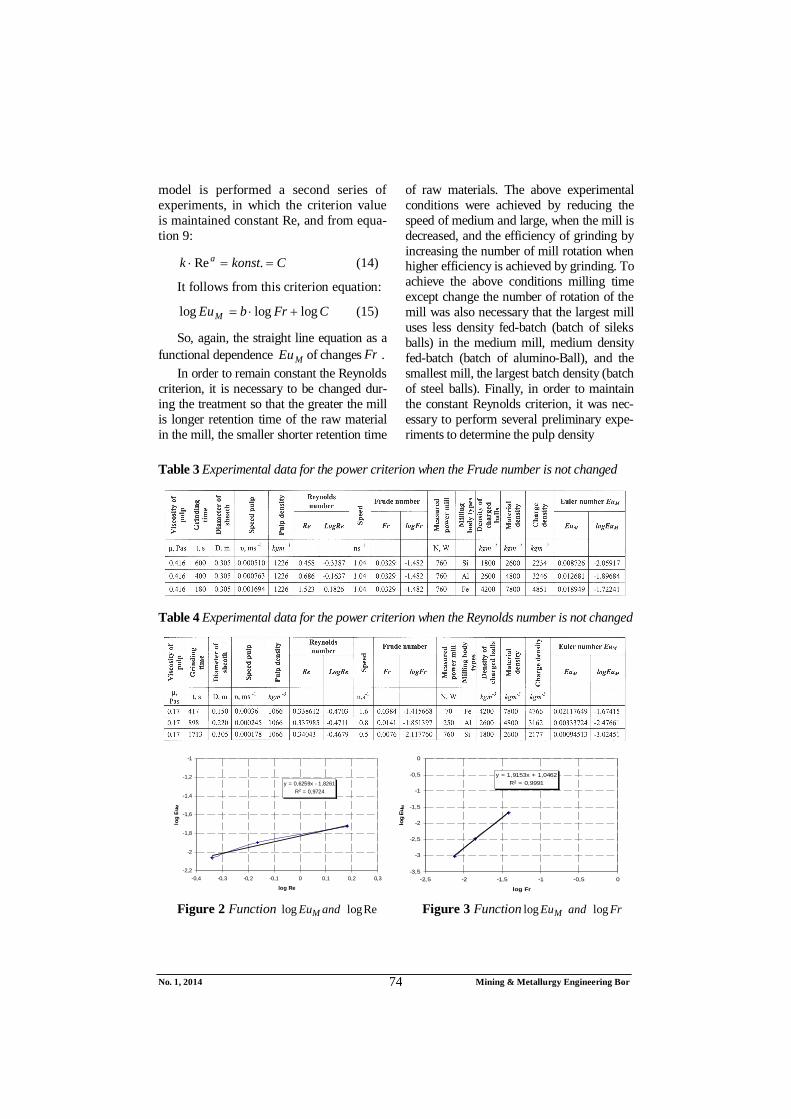
No. 1, 2014 Mining & Metallurgy Engineering Bor 74
model is performed a second series of experiments, in which the criterion value is maintained constant Re, and from equa-tion 9:
Ckonstk a .Re (14)
It follows from this criterion equation:
CFrbEuM logloglog (15)
So, again, the straight line equation as a functional dependence MEu of changes Fr .
In order to remain constant the Reynolds criterion, it is necessary to be changed dur-ing the treatment so that the greater the mill is longer retention time of the raw material in the mill, the smaller shorter retention time
of raw materials. The above experimental conditions were achieved by reducing the speed of medium and large, when the mill is decreased, and the efficiency of grinding by increasing the number of mill rotation when higher efficiency is achieved by grinding. To achieve the above conditions milling time except change the number of rotation of the mill was also necessary that the largest mill uses less density fed-batch (batch of sileks balls) in the medium mill, medium density fed-batch (batch of alumino-Ball), and the smallest mill, the largest batch density (batch of steel balls). Finally, in order to maintain the constant Reynolds criterion, it was nec-essary to perform several preliminary expe-riments to determine the pulp density
Table 3 Experimental data for the power criterion when the Frude number is not changed
Table 4 Experimental data for the power criterion when the Reynolds number is not changed
Figure 2 Function Reloglog andEuM Figure 3 Function FrandEuM loglog
y = 0,6259x - 1,8261R2 = 0,9724
-2,2
-2
-1,8
-1,6
-1,4
-1,2
-1
-0,4 -0,3 -0,2 -0,1 0 0,1 0,2 0,3
log Re
log
Eu M
y = 1,9153x + 1,0462R2 = 0,9991
-3,5
-3
-2,5
-2
-1,5
-1
-0,5
0
-2,5 -2 -1,5 -1 -0,5 0
log Fr
log
Eu M
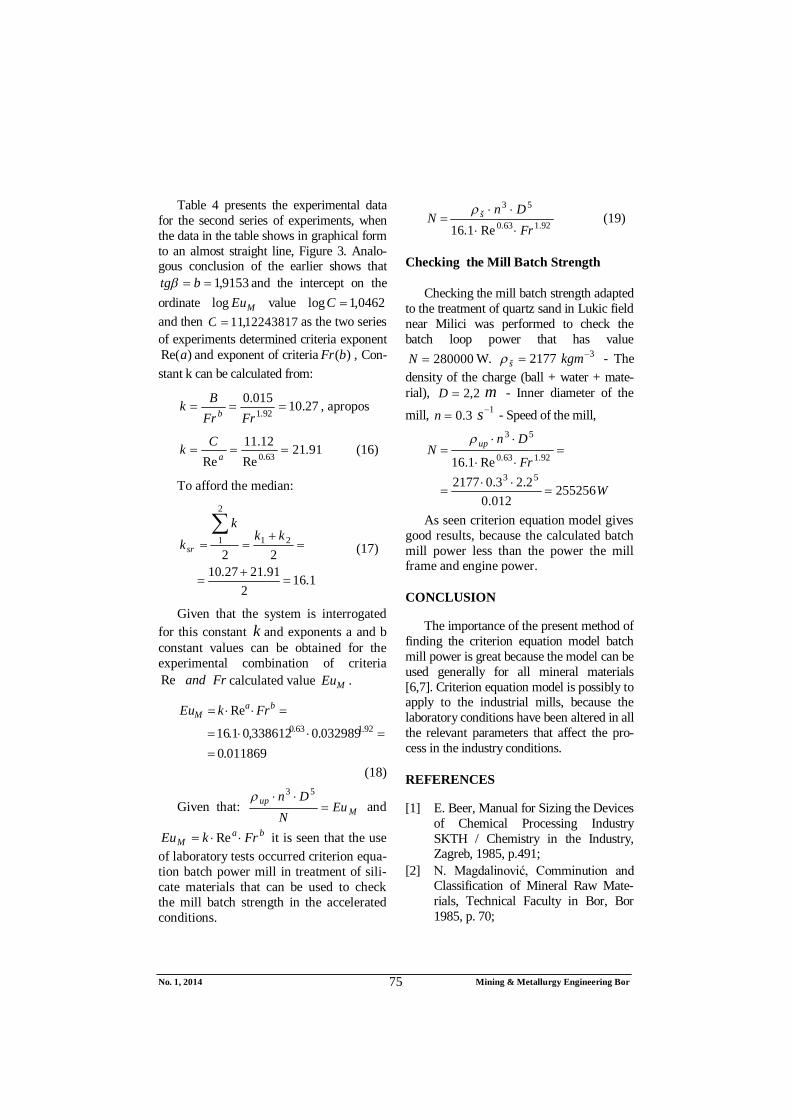
No. 1, 2014 Mining & Metallurgy Engineering Bor 75
Table 4 presents the experimental data
for the second series of experiments, when the data in the table shows in graphical form to an almost straight line, Figure 3. Analo-gous conclusion of the earlier shows that
9153,1 btg and the intercept on the ordinate MEulog value 0462,1log C and then 12243817,11C as the two series of experiments determined criteria exponent
)Re(a and exponent of criteria )(bFr , Con-stant k can be calculated from:
27.10015.092.1
FrFrBk b , apropos
91.21Re
12.11Re 63.0 aCk (16)
To afford the median:
1.162
91.2127.1022
21
2
1
kk
kk sr (17)
Given that the system is interrogated for this constant k and exponents a and b constant values can be obtained for the experimental combination of criteria
FrandRe calculated value MEu .
011869.0032989.0338612,01.16
Re92.163.0
baM FrkEu
(18)
Given that: Mup Eu
NDn
53
and
baM FrkEu Re it is seen that the use
of laboratory tests occurred criterion equa-tion batch power mill in treatment of sili-cate materials that can be used to check the mill batch strength in the accelerated conditions.
92.163.0
53
Re1.16 FrDn
N š
(19)
Checking the Mill Batch Strength
Checking the mill batch strength adapted to the treatment of quartz sand in Lukic field near Milici was performed to check the batch loop power that has value
280000N W. 2177š3kgm - The
density of the charge (ball + water + mate-rial), 2,2D m - Inner diameter of the
mill, 3.0n 1s - Speed of the mill,
W
Fr
DnN up
255256012.0
2.23.02177Re1.16
53
92.163.0
53
As seen criterion equation model gives good results, because the calculated batch mill power less than the power the mill frame and engine power.
CONCLUSION
The importance of the present method of finding the criterion equation model batch mill power is great because the model can be used generally for all mineral materials [6,7]. Criterion equation model is possibly to apply to the industrial mills, because the laboratory conditions have been altered in all the relevant parameters that affect the pro-cess in the industry conditions.
REFERENCES
[1] E. Beer, Manual for Sizing the Devices of Chemical Processing Industry SKTH / Chemistry in the Industry, Zagreb, 1985, p.491;
[2] N. Magdalinović, Comminution and Classification of Mineral Raw Mate-rials, Technical Faculty in Bor, Bor 1985, p. 70;
No. 1, 2014 Mining & Metallurgy Engineering Bor 76
[3] M. Petrov et al., Technical-techno-logical Solution, "Development of Software Systems for Grinding the Quartz Sand from the Deposit Skočić for the Needs of Chemical I of the Birač - Zvornik Silica Plant Obtained Using the Criterion of Equation Modeling", ITNMS Belgrade, 2012;
[4] M. Petrov et al., Technical-techno-logical Solution, "The New Techno-logy of Wet Grinding of Quartz Sand in Boksit a.d. Milici and Determination the Specific Capacity of Mill with Silex Balls." ITNMS Belgrade, 2012;
[5] S. Rozgaj, Processing Apparatus and Devices, IGKRO "Svjetlost", Sarajevo, 1980, p. 63;
[6] M. Grbović, N. Magdalinović, Proce-ssing Equipment for Crushing and Grinding of Mineral Raw Materials, "Copper", Bor, 1980, p. 88;
[7] S. Puštrić, Selection and Calculation of Machinery and Equipment for Crushing, Screening and Grinding of Mineral Raw Materials, Mining and Geology, Belgrade 1974, p. 48.
Broj 1, 2014. Mining & Metallurgy Engineering Bor 77
INSTITUT ZA RUDARSTVO I METALURGIJU BOR ISSN: 2334-8836 UDK: 622
UDK: 622.73(045)=861 DOI:10.5937/MMEB1401069P
Milan Petrov*, Ljubiša Andrić*, Živko Sekulić*, Zoran Bartulović*
MODELOVANJE ŠARŽNE SNAGE MLINA**
Izvod
U radu je prikazana nova metoda modelovanja šaržne snage mlina na bazi dimenzione analize i kriterijumskih jednačina. Šaržu predstavljaju meljuća tela materijal i medijum koji se koristi ba bi se obezbedijo protok sirovine kroz mlin, a najčešće je to voda ili vazduh. Brzina trošenja energije u mlinu se reguliše gustinom šarže i predstavlja šaržnu snagu. Šaržna snaga zavisi od vrste meljućih tela i medija u kojem se vrši tretman mineralne sirovine. Okvirna snaga mlina definisana snagom motora predstavlja šaržnu snagu mlina za najveću gustinu šarže. U radu je varirana gustina šarže u laboratorijskim mlinovima i definisan model šaržne snage mlina kojeg smo primenili kod adaptacije mlinskog postrojenja u novi industrijski pogon. Prikazani model šaržne snage mlina proveren je u industrijskim uslovima ekspoloatacije kvarcne sirovine u Lukića polju kod Milića. Proces mehano-hemijskog tretmana definše se kao poduhvat mlevenja sa dužim vremenom boravka materijala u mlinu i manjim šaržnim gustinama, a sve sa ciljem da se smanji sila kojom šarža deluje na zrna mineralne sirovine. Radikalnost usitnjavanja se menja sa promenom gustine šarže tako što se sa manjim gustinama dobijaju posebne karakteristike krupnoće proizvoda mlevenja sa užim dijapazonom uskih klasa krupnoće i time uvećanom specifičnom površinom i reaktivnošću.
Ključne reči: šaržna snaga, gustina šarže, mehanohemijski tretman, reaktivnost
*Institut za tehnologiju nuklearnih i drugih mineralnih sirovina, e-mail: [email protected] **Prikazani rezultati predstavljaju deo istraživanja u okviru projekta TR 34006 “Mehanohemijski
tretman nedovoljno kvalitetnih mineralnih sirovina“ i TR 34013 „Osvajanje tehnoloških postupaka dobijanja ekoloških materijala na bazi nemetaličnih mineralnih sirovina“ čiju realizaciju finansira Ministarstvo prosvete, nauke i tehnološkog razvoja republike Srbije.
UVOD
Modelovanje šaržne snage mlina prika-zano u radu urađeno je na osnovu teorijskih razmatranja i pomoću dimenzione analize kriterijumskih jednačina. U radu je korišćen laboratorijski model i dimenziona analiza, a na osnovi invarijante dinamičke sličnosti razvien je model mehanohemijskog tret-mana u industrijskom mlinu. U radu je prikazan tok procesa fizičkog modelovanja i određivanja snage motora za manju gustinu šarže mlina š s obzirom da se mlevenje vrši sa sileks kuglama a ne sa metalnim
kuglama. Ovako razvijen model daje odgo-vore na pitanje potrebne šaržne snage mlevenja kvarcnog peska u adaptiranom postrojenju za takozvane nekonvencionalne uslove mlevenja odnosno mehanohemijski tretman.
TEORIJSKA RAZMATRANJA
Teorijska razmatranja vezuju se za model strujanja u mlinu kao strujanje nekog medija kroz cev sa određenim ka-
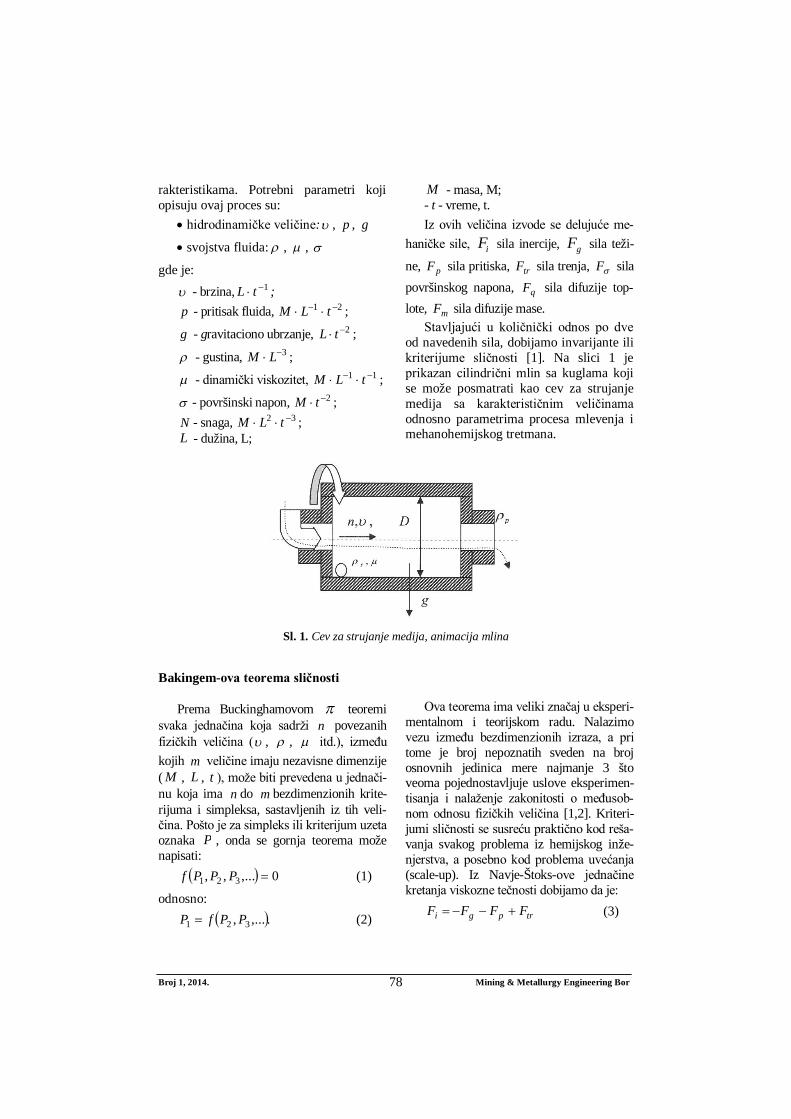
Broj 1, 2014. Mining & Metallurgy Engineering Bor 78
rakteristikama. Potrebni parametri koji opisuju ovaj proces su:
hidrodinamičke veličine: , p , g
svojstva fluida: , ,
gde je:
- brzina, 1 tL ; p - pritisak fluida, 21 tLM ;
g - gravitaciono ubrzanje, 2 tL ;
- gustina, 3 LM ;
- dinamički viskozitet, 11 tLM ;
- površinski napon, 2 tM ; N - snaga, 32 tLM ; L - dužina, L;
M - masa, M; - t - vreme, t. Iz ovih veličina izvode se delujuće me-
haničke sile, iF sila inercije, gF sila teži-
ne, pF sila pritiska, trF sila trenja, F sila površinskog napona, qF sila difuzije top-lote, mF sila difuzije mase.
Stavljajući u količnički odnos po dve od navedenih sila, dobijamo invarijante ili kriterijume sličnosti [1]. Na slici 1 je prikazan cilindrični mlin sa kuglama koji se može posmatrati kao cev za strujanje medija sa karakterističnim veličinama odnosno parametrima procesa mlevenja i mehanohemijskog tretmana.
Sl. 1. Cev za strujanje medija, animacija mlina
Bakingem-ova teorema sličnosti
Prema Buckinghamovom teoremi svaka jednačina koja sadrži n povezanih fizičkih veličina ( , , itd.), između kojih m veličine imaju nezavisne dimenzije ( M , L , t ), može biti prevedena u jednači-nu koja ima n do m bezdimenzionih krite-rijuma i simpleksa, sastavljenih iz tih veli-čina. Pošto je za simpleks ili kriterijum uzeta oznaka P , onda se gornja teorema može napisati:
0,...,, 321 PPPf (1)
odnosno: .,..., 321 PPfP (2)
Ova teorema ima veliki značaj u eksperi-
mentalnom i teorijskom radu. Nalazimo vezu između bezdimenzionih izraza, a pri tome je broj nepoznatih sveden na broj osnovnih jedinica mere najmanje 3 što veoma pojednostavljuje uslove eksperimen-tisanja i nalaženje zakonitosti o međusob-nom odnosu fizičkih veličina [1,2]. Kriteri-jumi sličnosti se susreću praktično kod reša-vanja svakog problema iz hemijskog inže-njerstva, a posebno kod problema uvećanja (scale-up). Iz Navje-Štoks-ove jednačine kretanja viskozne tečnosti dobijamo da je:
trpgi FFFF (3)
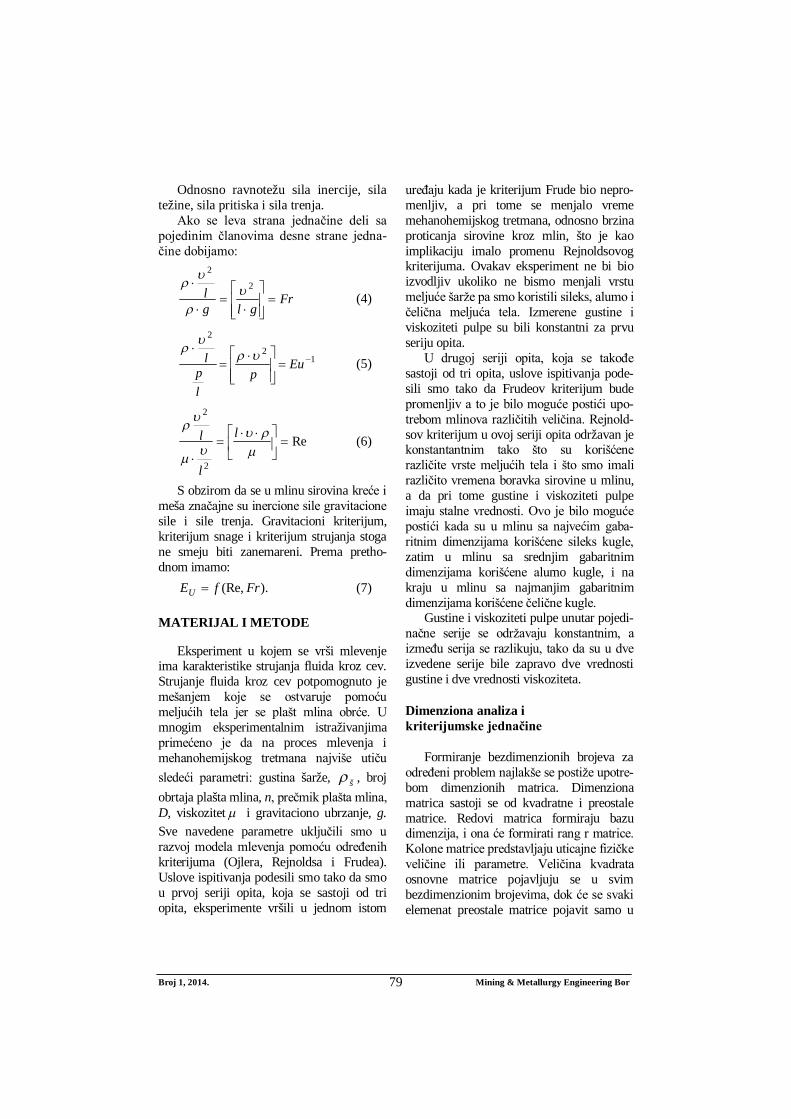
Broj 1, 2014. Mining & Metallurgy Engineering Bor 79
Odnosno ravnotežu sila inercije, sila težine, sila pritiska i sila trenja.
Ako se leva strana jednačine deli sa pojedinim članovima desne strane jedna-čine dobijamo:
Frglg
l
2
2
(4)
12
2
Eu
plp
l
(5)
Re
2
2
l
l
l (6)
S obzirom da se u mlinu sirovina kreće i meša značajne su inercione sile gravitacione sile i sile trenja. Gravitacioni kriterijum, kriterijum snage i kriterijum strujanja stoga ne smeju biti zanemareni. Prema pretho-dnom imamo:
).(Re, FrfEU (7)
MATERIJAL I METODE
Eksperiment u kojem se vrši mlevenje ima karakteristike strujanja fluida kroz cev. Strujanje fluida kroz cev potpomognuto je mešanjem koje se ostvaruje pomoću meljućih tela jer se plašt mlina obrće. U mnogim eksperimentalnim istraživanjima primećeno je da na proces mlevenja i mehanohemijskog tretmana najviše utiču sledeći parametri: gustina šarže, š , broj obrtaja plašta mlina, n, prečmik plašta mlina, D, viskozitet i gravitaciono ubrzanje, g. Sve navedene parametre uključili smo u razvoj modela mlevenja pomoću određenih kriterijuma (Ojlera, Rejnoldsa i Frudea). Uslove ispitivanja podesili smo tako da smo u prvoj seriji opita, koja se sastoji od tri opita, eksperimente vršili u jednom istom
uređaju kada je kriterijum Frude bio nepro-menljiv, a pri tome se menjalo vreme mehanohemijskog tretmana, odnosno brzina proticanja sirovine kroz mlin, što je kao implikaciju imalo promenu Rejnoldsovog kriterijuma. Ovakav eksperiment ne bi bio izvodljiv ukoliko ne bismo menjali vrstu meljuće šarže pa smo koristili sileks, alumo i čelična meljuća tela. Izmerene gustine i viskoziteti pulpe su bili konstantni za prvu seriju opita.
U drugoj seriji opita, koja se takođe sastoji od tri opita, uslove ispitivanja pode-sili smo tako da Frudeov kriterijum bude promenljiv a to je bilo moguće postići upo-trebom mlinova različitih veličina. Rejnold-sov kriterijum u ovoj seriji opita održavan je konstantantnim tako što su korišćene različite vrste meljućih tela i što smo imali različito vremena boravka sirovine u mlinu, a da pri tome gustine i viskoziteti pulpe imaju stalne vrednosti. Ovo je bilo moguće postići kada su u mlinu sa najvećim gaba-ritnim dimenzijama korišćene sileks kugle, zatim u mlinu sa srednjim gabaritnim dimenzijama korišćene alumo kugle, i na kraju u mlinu sa najmanjim gabaritnim dimenzijama korišćene čelične kugle.
Gustine i viskoziteti pulpe unutar pojedi-načne serije se održavaju konstantnim, a između serija se razlikuju, tako da su u dve izvedene serije bile zapravo dve vrednosti gustine i dve vrednosti viskoziteta.
Dimenziona analiza i kriterijumske jednačine
Formiranje bezdimenzionih brojeva za određeni problem najlakše se postiže upotre-bom dimenzionih matrica. Dimenziona matrica sastoji se od kvadratne i preostale matrice. Redovi matrica formiraju bazu dimenzija, i ona će formirati rang r matrice. Kolone matrice predstavljaju uticajne fizičke veličine ili parametre. Veličina kvadrata osnovne matrice pojavljuju se u svim bezdimenzionim brojevima, dok će se svaki elemenat preostale matrice pojavit samo u
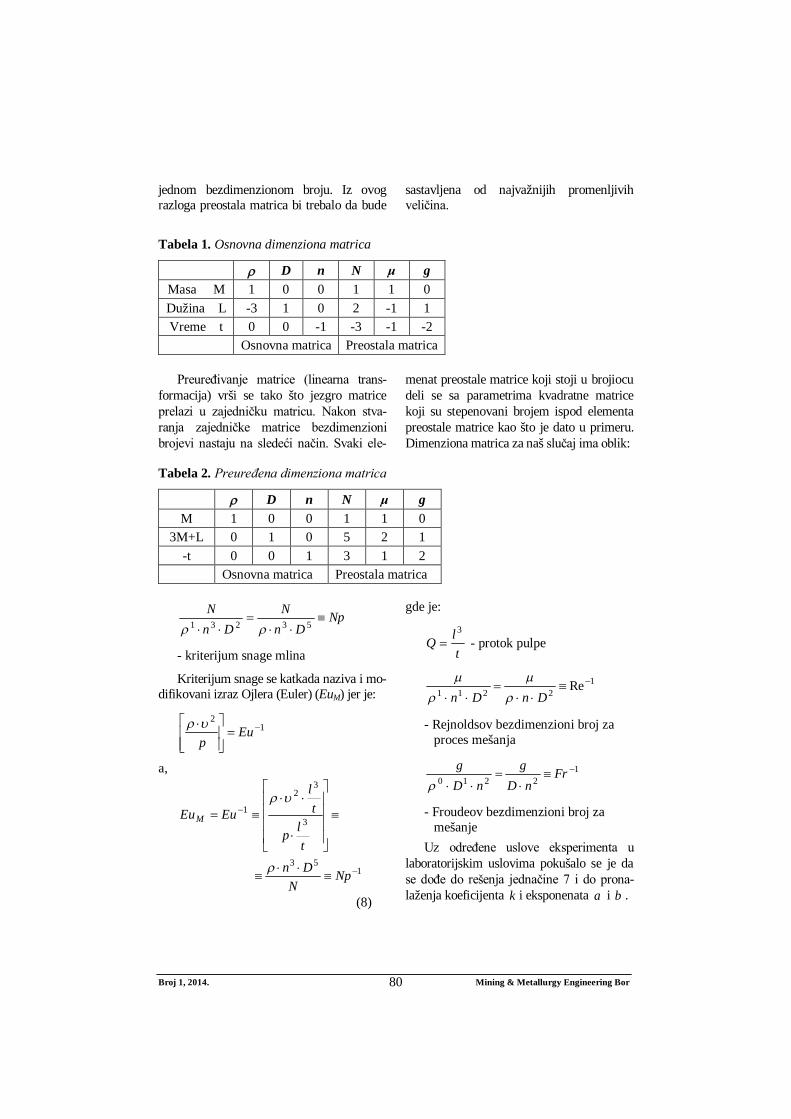
Broj 1, 2014. Mining & Metallurgy Engineering Bor 80
jednom bezdimenzionom broju. Iz ovog razloga preostala matrica bi trebalo da bude
sastavljena od najvažnijih promenljivih veličina.
Tabela 1. Osnovna dimenziona matrica
D n N μ g Masa M 1 0 0 1 1 0 Dužina L -3 1 0 2 -1 1 Vreme t 0 0 -1 -3 -1 -2
Osnovna matrica Preostala matrica Preuređivanje matrice (linearna trans-
formacija) vrši se tako što jezgro matrice prelazi u zajedničku matricu. Nakon stva-ranja zajedničke matrice bezdimenzioni brojevi nastaju na sledeći način. Svaki ele-
menat preostale matrice koji stoji u brojiocu deli se sa parametrima kvadratne matrice koji su stepenovani brojem ispod elementa preostale matrice kao što je dato u primeru. Dimenziona matrica za naš slučaj ima oblik:
Tabela 2. Preuređena dimenziona matrica
D n N μ g M 1 0 0 1 1 0
3M+L 0 1 0 5 2 1 -t 0 0 1 3 1 2
Osnovna matrica Preostala matrica
NpDn
NDn
N
53231
- kriterijum snage mlina
Kriterijum snage se katkada naziva i mo-difikovani izraz Ojlera (Euler) (EuM) jer je:
12
Eup
a,
tlp
tl
EuEuM 3
32
1
153
NpN
Dn
(8)
gde je:
tlQ
3 - protok pulpe
12211 Re
DnDn
- Rejnoldsov bezdimenzioni broj za proces mešanja
12210
FrnD
gnD
g
- Froudeov bezdimenzioni broj za mešanje
Uz određene uslove eksperimenta u laboratorijskim uslovima pokušalo se je da se dođe do rešenja jednačine 7 i do prona-laženja koeficijenta k i eksponenata a i b .
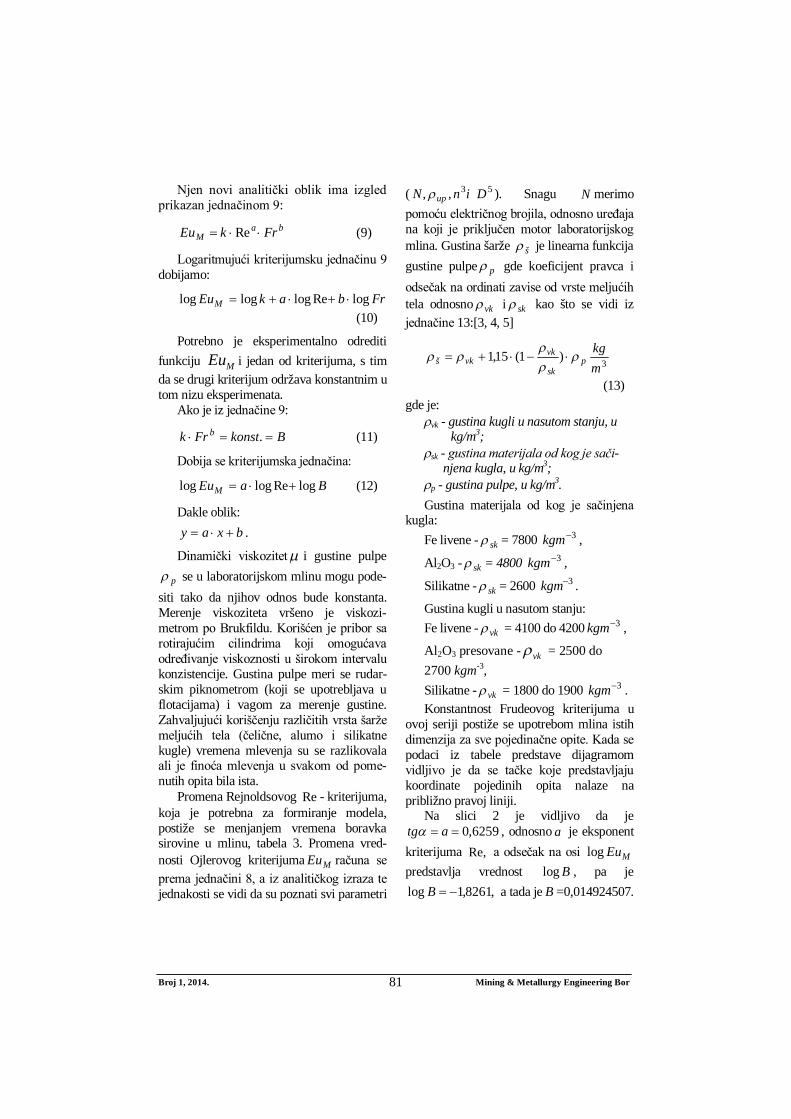
Broj 1, 2014. Mining & Metallurgy Engineering Bor 81
Njen novi analitički oblik ima izgled prikazan jednačinom 9:
baM FrkEu Re (9)
Logaritmujući kriterijumsku jednačinu 9 dobijamo:
FrbakEuM logRelogloglog (10)
Potrebno je eksperimentalno odrediti funkciju MEu i jedan od kriterijuma, s tim da se drugi kriterijum održava konstantnim u tom nizu eksperimenata.
Ako je iz jednačine 9:
BkonstFrk b . (11)
Dobija se kriterijumska jednačina:
BaEuM logReloglog (12)
Dakle oblik: bxay .
Dinamički viskozitet i gustine pulpe
p se u laboratorijskom mlinu mogu pode-siti tako da njihov odnos bude konstanta. Merenje viskoziteta vršeno je viskozi-metrom po Brukfildu. Korišćen je pribor sa rotirajućim cilindrima koji omogućava određivanje viskoznosti u širokom intervalu konzistencije. Gustina pulpe meri se rudar-skim piknometrom (koji se upotrebljava u flotacijama) i vagom za merenje gustine. Zahvaljujući koriščenju različitih vrsta šarže meljućih tela (čelične, alumo i silikatne kugle) vremena mlevenja su se razlikovala ali je finoća mlevenja u svakom od pome-nutih opita bila ista.
Promena Rejnoldsovog Re - kriterijuma, koja je potrebna za formiranje modela, postiže se menjanjem vremena boravka sirovine u mlinu, tabela 3. Promena vred-nosti Ojlerovog kriterijuma MEu računa se prema jednačini 8, a iz analitičkog izraza te jednakosti se vidi da su poznati svi parametri
( 53,, DinN up ). Snagu N merimo pomoću električnog brojila, odnosno uređaja na koji je priključen motor laboratorijskog mlina. Gustina šarže š je linearna funkcija gustine pulpe p gde koeficijent pravca i odsečak na ordinati zavise od vrste meljućih tela odnosno vk i sk kao što se vidi iz jednačine 13:[3, 4, 5]
3)1(15,1mkg
psk
vkvkš
(13) gde je:
vk - gustina kugli u nasutom stanju, u kg/m3;
sk - gustina materijala od kog je sači-njena kugla, u kg/m3;
p - gustina pulpe, u kg/m3. Gustina materijala od kog je sačinjena
kugla: Fe livene - sk = 7800 3kgm ,
Al2O3 - sk = 4800 3kgm ,
Silikatne - sk = 2600 3kgm .
Gustina kugli u nasutom stanju: Fe livene - vk = 4100 do 4200 3kgm ,
Al2O3 presovane - vk = 2500 do 2700 kgm-3, Silikatne - vk = 1800 do 1900 3kgm . Konstantnost Frudeovog kriterijuma u
ovoj seriji postiže se upotrebom mlina istih dimenzija za sve pojedinačne opite. Kada se podaci iz tabele predstave dijagramom vidljivo je da se tačke koje predstavljaju koordinate pojedinih opita nalaze na približno pravoj liniji.
Na slici 2 je vidljivo da je 6259,0 atg , odnosno a je eksponent
kriterijuma Re, a odsečak na osi MEulogpredstavlja vrednost Blog , pa je
,8261,1log B a tada je B =0,014924507.
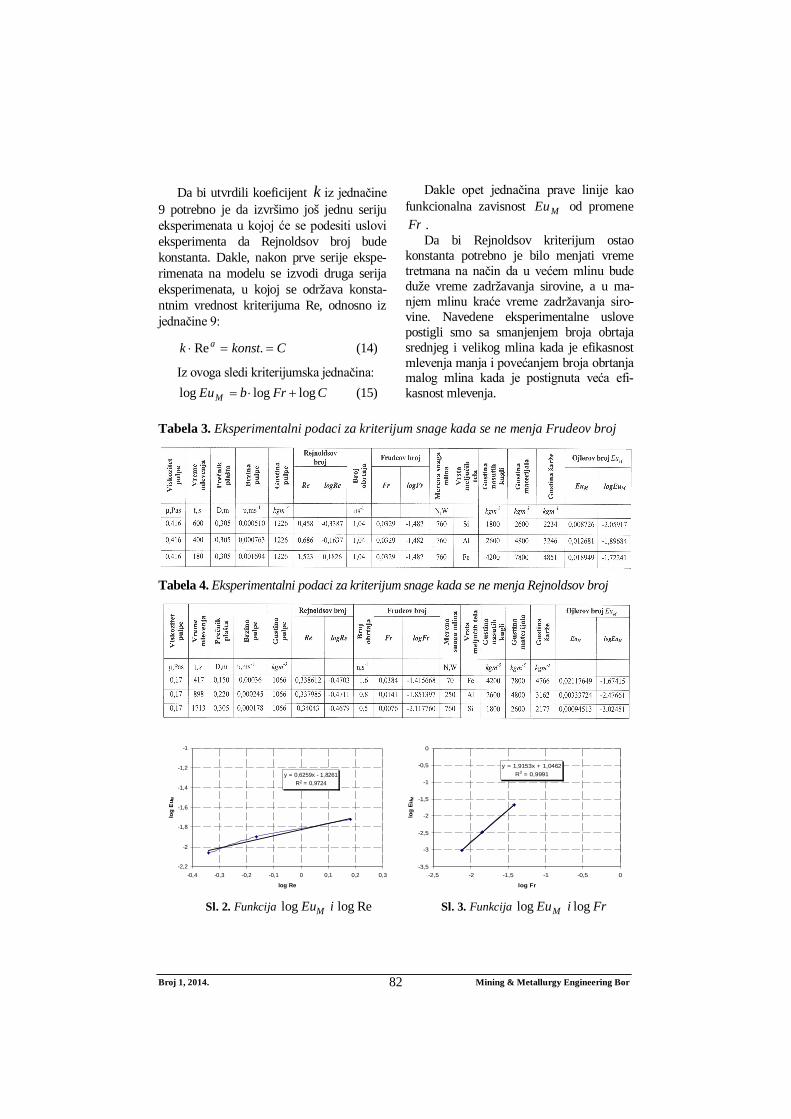
Broj 1, 2014. Mining & Metallurgy Engineering Bor 82
Da bi utvrdili koeficijent k iz jednačine 9 potrebno je da izvršimo još jednu seriju eksperimenata u kojoj će se podesiti uslovi eksperimenta da Rejnoldsov broj bude konstanta. Dakle, nakon prve serije ekspe-rimenata na modelu se izvodi druga serija eksperimenata, u kojoj se održava konsta-ntnim vrednost kriterijuma Re, odnosno iz jednačine 9:
Ckonstk a .Re (14)
Iz ovoga sledi kriterijumska jednačina: CFrbEuM logloglog (15)
Dakle opet jednačina prave linije kao funkcionalna zavisnost MEu od promene Fr .
Da bi Rejnoldsov kriterijum ostao konstanta potrebno je bilo menjati vreme tretmana na način da u većem mlinu bude duže vreme zadržavanja sirovine, a u ma-njem mlinu kraće vreme zadržavanja siro-vine. Navedene eksperimentalne uslove postigli smo sa smanjenjem broja obrtaja srednjeg i velikog mlina kada je efikasnost mlevenja manja i povećanjem broja obrtanja malog mlina kada je postignuta veća efi-kasnost mlevenja.
Tabela 3. Eksperimentalni podaci za kriterijum snage kada se ne menja Frudeov broj
Tabela 4. Eksperimentalni podaci za kriterijum snage kada se ne menja Rejnoldsov broj
Sl. 2. Funkcija Reloglog iEuM Sl. 3. Funkcija FriEuM loglog
y = 0,6259x - 1,8261R2 = 0,9724
-2,2
-2
-1,8
-1,6
-1,4
-1,2
-1
-0,4 -0,3 -0,2 -0,1 0 0,1 0,2 0,3
log Re
log
Eu M
y = 1,9153x + 1,0462R2 = 0,9991
-3,5
-3
-2,5
-2
-1,5
-1
-0,5
0
-2,5 -2 -1,5 -1 -0,5 0
log Fr
log
EuM
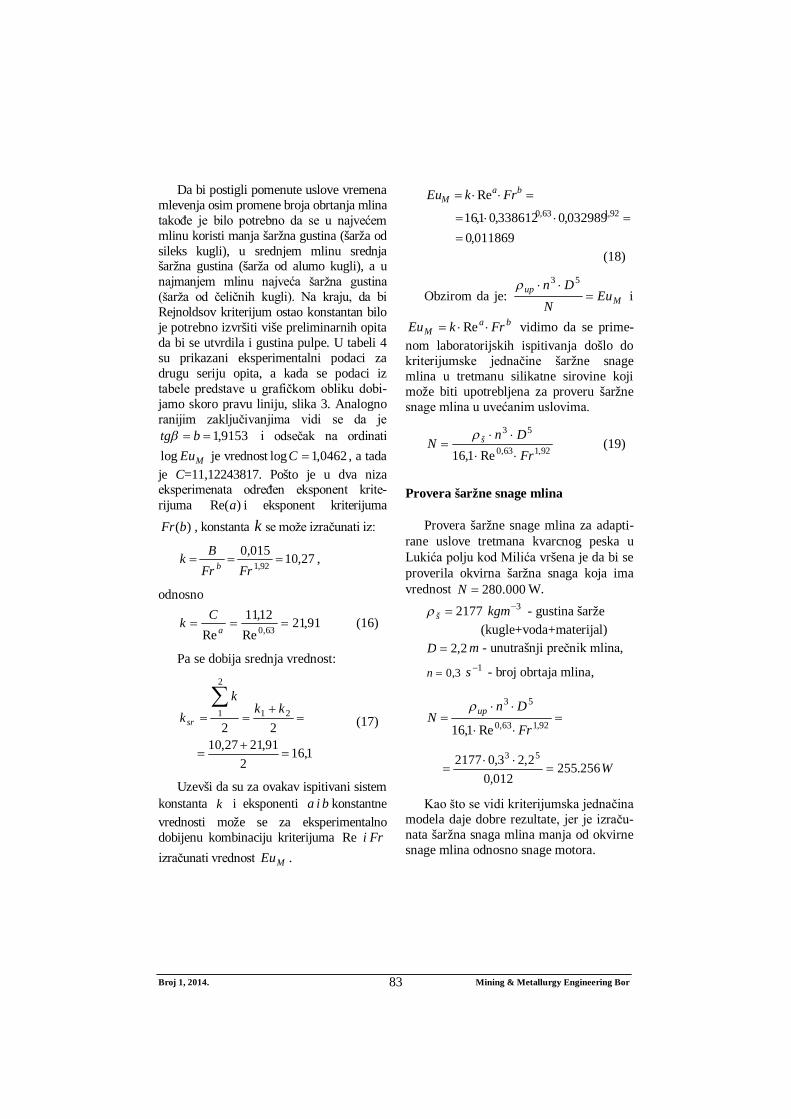
Broj 1, 2014. Mining & Metallurgy Engineering Bor 83
Da bi postigli pomenute uslove vremena mlevenja osim promene broja obrtanja mlina takođe je bilo potrebno da se u najvećem mlinu koristi manja šaržna gustina (šarža od sileks kugli), u srednjem mlinu srednja šaržna gustina (šarža od alumo kugli), a u najmanjem mlinu najveća šaržna gustina (šarža od čeličnih kugli). Na kraju, da bi Rejnoldsov kriterijum ostao konstantan bilo je potrebno izvršiti više preliminarnih opita da bi se utvrdila i gustina pulpe. U tabeli 4 su prikazani eksperimentalni podaci za drugu seriju opita, a kada se podaci iz tabele predstave u grafičkom obliku dobi-jamo skoro pravu liniju, slika 3. Analogno ranijim zaključivanjima vidi se da je
9153,1 btg i odsečak na ordinati
MEulog je vrednost 0462,1log C , a tada je C=11,12243817. Pošto je u dva niza eksperimenata određen eksponent krite-rijuma )Re(a i eksponent kriterijuma
)(bFr , konstanta k se može izračunati iz:
27,10015,092,1
FrFrBk b ,
odnosno
91,21Re
12,11Re 63,0 aCk (16)
Pa se dobija srednja vrednost:
1,162
91,2127,1022
21
2
1
kk
kk sr (17)
Uzevši da su za ovakav ispitivani sistem konstanta k i eksponenti bia konstantne vrednosti može se za eksperimentalno dobijenu kombinaciju kriterijuma FriRe izračunati vrednost MEu .
011869,0032989,0338612,01,16
Re92,163,0
baM FrkEu
(18)
Obzirom da je: Mup Eu
NDn
53
i
baM FrkEu Re vidimo da se prime-
nom laboratorijskih ispitivanja došlo do kriterijumske jednačine šaržne snage mlina u tretmanu silikatne sirovine koji može biti upotrebljena za proveru šaržne snage mlina u uvećanim uslovima.
92,163,0
53
Re1,16 FrDn
N š
(19)
Provera šaržne snage mlina
Provera šaržne snage mlina za adapti-rane uslove tretmana kvarcnog peska u Lukića polju kod Milića vršena je da bi se proverila okvirna šaržna snaga koja ima vrednost 000.280N W.
2177š3kgm - gustina šarže
(kugle+voda+materijal) 2,2D m - unutrašnji prečnik mlina,
3,0n 1s - broj obrtaja mlina,
92,163,0
53
Re1,16 Fr
DnN up
W256.255
012,02,23,02177 53
Kao što se vidi kriterijumska jednačina modela daje dobre rezultate, jer je izraču-nata šaržna snaga mlina manja od okvirne snage mlina odnosno snage motora.
Broj 1, 2014. Mining & Metallurgy Engineering Bor 84
ZAKLJUČAK
Značaj prikazanog postupka iznalaženja kriterijumskih jednačina modela šaržne snage mlina je velik jer se model može koristiti uopšteno za sve mineralne sirovine [6,7]. Kriterijumske jednačina modela mo-guće je primeniti i na industrijskim mlino-vima zato što su u laboratorijskim uslovima menjani svi relevantni parametri koji utiču na proces i u industrijskim uslovima.
LITERATURA
[1] E. Beer, Priručnik za dimenzioniranje uređaja kemijske procesne industrije SKTH/kemija u industriji, Zagreb 1985, str. 491.
[2] N. Magdalinović, Usitnjavanje i klasi-ranje mineralnih sirovina, Tehnički fakultet u Boru, 1985, Bor, str. 70.
[3] M. Petrov i ostali autori Tehničko tehnološkog rešenje: “Razvoj program-skog sistema mlevenja kvarcnog peska
ležišta Skočić za potrebe hemijske industrije fabrike glinice Birač - Zvor-nik dobijen korišćenjem kriterijumskih jednačina modeliranja“, ITNMS Beograd, 2012.
[4] M. Petrov i ostali autori Tehničko tehnološkog rešenje: “Nova tehno-logija mokrog mlevenja kvarcnog peska u Ad-Boksit Milići i određivanje specifičnog kapaciteta mlina sa sileks kuglama“, ITNMS Beograd, 2012.
[5] S. Rozgaj, Procesni aparati i uređaji, IGKRO “Svjetlost”, Sarajevo, 1980, str. 63.
[6] M. Grbović, N. Magdalinović, Proce-sna oprema drobljenja i mlevenja mineralnih sirovina, “Bakar”, Bor, 1980, str. 88.
[7] S. Puštrić, Izbor i proračun mašina i uređaja za drobljenje prosejavanje i mlevenje mineralnih sirovina, RGF, Beograd, 1974, str. 48.
No. 1, 2014 Mining & Metallurgy Engineering Bor 85
MINING AND METALLURGY INSTITUTE BOR ISSN: 2334-8836 UDK: 622
UDK: 658.567:502/504(045)=20 DOI:10.5937/MMEB1401085I
Biljana Ilić*, Dragan Mihajlović*
RECYCLING IN THE FUNCTION OF SAVINGS AND GREEN ECONOMY OF MINERAL RESOURCES
Abstract
Recycling means the separation of materials from waste and reusing the same. It involves the collec-tion, separation, processing and manufacturing the new products from already used parts. This work will provide the basic concepts of recycling in the function of savings the mineral resources. Savings of mineral resources, in this way, present one of the goals of green economy and the green economy im-plies the widespread use of renewable energy sources with as less as possible emission or occurrence and production of harmful substances into the environment. Savings of metallic mineral resources are mostly achieved by recycling, and therefore the recycling is a priority for achievement the sustainable development.
Key words: recycling, savings, mineral resources, green economy
* Faculty of Management, Zaječar, [email protected]
INTRODUCTION
Recycling is a term which describes the process “waste” converting into raw materi-als from which the new products are formed. As such, it is a part of an integrated waste management system, and it is on the third place in the hierarchy of waste management. System of management and recycling the various types of waste is not only the envi-ronmental issue, but also became a part of the economic and energy potential of a country. Recycling has the economic, envi-ronmental, but also the social importance because it affects the raising of environmen-tal awareness, helping the prevention in en-vironmental pollution, saving the natural resources, consuming less energy in waste processing, from energy that is consumed for obtaining the products from raw materi-als, and at the end, the amount of waste is reduced by recycling. The most widespread distribution of waste includes the two cate
gories: the industrial waste, generated in the industrial processes, and municipal waste, generated in households. Besides the harm-ful effects of waste on the environment, it is also very important the secondary source of metals as well as the other products, ob-tained by recycling. Statistical indicators of recycling in the world are different, ranging from Japan, which recycles 80-90% of waste, across the EU, which recycles 30-40% of waste, to small Serbia. which has the present recycling of waste, only 6-8%. Based on the above data, it can be concluded that Serbia is still far from establishing an environmentally safe and efficient manage-ment system with certain types of waste.
This especially refers to the municipal waste, considering that today in Serbia almost a half of the amount of generated waste from households ends on the illegal landfills, what is a constant source of soil,
No. 1, 2014 Mining & Metallurgy Engineering Bor 86
air and water pollution. Therefore, it is necessary for Serbia to make more effort for achieving better waste management as well as more efforts to introduce the new technologies that would enable this ma-nagement. In terms of recycling, and tech-nologies related to recycling, there is the concept of green technologies. The con-cept of green technology, which is a part of the green economy concept, has shown a sudden growth in recent years. In gene-ral, the "green trends" in 2012 has resulted into reduction of waste, recycling and reu-sing of processed products. Trend of sus-tainable development is present in the world for a long time as the trend of sus-tainable economy, ecology, i.e. social de-velopment. At the global level, the green economy is seen as the economy in which the economic solutions and innovations allows the society to use efficiently the resources, improving the welfare of peo-ple by the inclusive way with preserving the natural systems that sustain the aware-ness and mankind (UNEP, United Nations Environment Program, 2010).
WASTE CLASSIFICATION
Waste characterization is the process of testing which determines the physico-chemical, chemical and biological properties and composition of t waste, i.e. determines whether the waste contains or does not con-tain one or more hazardous characteristics. Waste classification is the process of classi-fying the waste into one or more waste lists, which are regulated by separate regulations, and according to its origin, composition, and further purpose; (Waste Catalogue, 2010). The Act on Waste Management requires that the waste would be described in a way that allows the safe handling and waste man-agement, as well as any change of owner-ship of waste would be accompanied by appropriate documentation that necessarily include the waste index number. The waste is classified according to the Waste Cata
logue that is consistent with the European Waste Catalogue (European List of Waste/European Waste Catalogue). Within the Catalogue, the waste is systematized primarily according to the activities within which it is generated, but also according to the type of waste, materials or processes. The Waste Catalogue includes systematical-ly more than 800 types of waste, divided into 20 groups, which are indicated by two-digit numbers and divided as follows:
1. Waste generated from exploration, exploration from mines or quarries and physical and chemical treat-ment of minerals;
2. Waste generated from agriculture, horticulture, forestry, hunting and fishing, food preparation and pro-cessing;
3. Waste generated from wood proce-ssing and production of paper, car-dboard, pulp, panels and furniture;
4. Waste generated from leather, fur and textile industries;
5. Waste generated from petroleum refining, natural gas purification and pyrolytic treatment of coal;
6. Waste generated from inorganic chemical processing;
7. Waste generated from organic chemical processing;
8. Waste generated from manufactu-ring, supplying and use of coatings (paints, varnishes and vitreous ena-mels), adhesives, seals and printing inks);
9. Waste generated from photo-graphic industry;
10. Waste generated from thermal processes;
11. Waste generated from chemical surface treatment and coating of metals and other materials; hy-drometallurgy of ferrous metals;
12. Waste generated from shaping the physical and mechanical surface treatment of metals and plastics;
No. 1, 2014 Mining & Metallurgy Engineering Bor 87
13. Waste generated from oil and res-idues of liquid fuels (except edi-ble oils);
14. Waste generated from organic sub-stances used as solvents, coolants as well as propellant gases;
15. Waste generated from packaging; 16. Waste not otherwise specified in
the Catalogue; 17. Construction waste and demolition
waste (including soil from contam-inated sites);
18. Waste from health care of people and animals from system-related research;
19. Waste from the waste treatment plants for waste water treatment, off-site production and water treat-ment intended for human con-sumption and water for industrial usage;
20. Municipal waste (household waste and similar commercial, industrial and institutional waste) including separately collecting fractions.
From the above mentioned categories of waste, the next following sub-groups are separated: plastic, metal, wood, organic waste, paper, electronics, rubber, glass and waste oil. Listed wastes represent the sec-ondary raw material for the new products. Solid waste is important in the recycling of waste. The solid waste is municipal, indus-trial and commercial, packaging and con-struction waste. Industrial and commercial waste are the most desirable, also the most wanted type of waste in the market. Without this kind of waste, the operators of private sector cannot survive. Items and devices of metals that have lost their value in use, often end up on landfill, and so actively pollute the environment. This type of waste is the sec-ondary raw material for metal obtaining, because the new products are obtained by collecting and returning into recycling and, at the same time, the primary resources are
saved and thus extending the life of the pri-mary reserves of raw materials. The envi-ronmental pollution is reduced by this way. For example, it is estimated that 15% is lost of the total amount of produced copper, while the remaining amount is built into items and objects that serve to reusing. It is similar to steel, which is illustrated by data that nearly 75% of is nowadays obtained by recycling. The fact that total amount of mu-nicipal waste in the world has reached a worryingly high level, indicates the urgent taking of actions that lead to the waste re-duction.
It can be noted, that the amount of waste is directly related to the production volume, and also development of the country. Devel-oped countries produce more waste, due to higher production, but, on the other hand, these countries lead in development of tech-nologies for waste suppression. In these countries, municipal waste is treated in the plant for sorting. For example, in the EU, the total amount of municipal waste that is burnt is 33%. After such treatment, the remainder of waste is quantitatively less, so it is easier to deposit it. Considering all presented facts regarding to the waste, hereinafter, the im-portance of including the external costs will be present, which are directly related to the exploitation of mineral resources. It will be further clarify the importance of recycling to reduce the costs of metal obtaining and its economic justification.
IMPORTANCE OF INCLUDING THE EXTERNAL COSTS IN THE EXPLOITATION OF MINERAL RESOURCES
Externalities are the effects of positive or negative character, arising from the certain activities, while at the same they are not the result of acting the price mechanism. The term "external effect" was first used by the theorist of welfare economics, AS Pigou (1912), who set the foundations for the
No. 1, 2014 Mining & Metallurgy Engineering Bor 88
standard theory of externalities. Starting from market failures, Pigou made a setting on necessity of state intervention, which should ensure that market prices reflect the full social cost. Viewed from a theoretical point of view, in order to avoid transmitting of external costs to the entire community, their internalization is necessary, or inclu-sion the pollution costs into the price of products that cause pollution (Ilic et al., 2013). In the economic theory and practice, there are two groups of measures for regula-tion the externalities (Stanic, 2012):
1. Command-control (standards or constraints), and
2. Market measures (taxes and trans-ferable licenses).
It should be noted that the external posi-tive effects may exist both in production and consumption, and that they can be positive and negative. Positive externalities are bene-fits to the third parties and they are not in-cluded in the price of product. In the case of external effects in consumption, a subject of brings benefits to any person by his con-sumption, in order that it happens without creating the additional costs for this second person. Hence, he is not ready to recognize them in the price of goods that he buys for consumption purposes.
On the other hand with the positive ex-ternalities in production, a manufacturer provides benefits to the third party with its activity, but not to the people whom he sales his goods, so he does not charge any fees from the third parties for this activity (Ilic-Popov, 2000). An example of positive exter-nalities is education. Negative externalities mean the costs of legal entity or individual causes, i.e. imposed by the other members of society, who are not included in the product price. Due to the scale of the negative exter-nal effects of their larger and more far-reaching consequences, this type of external effects is paid much more attention.
Sustainable management of mineral re-sources has indicated that the price of metal is one of the main instruments for achieving this sustainability. If the classical economic model of supply and demand is taken into consideration, it can be concluded that the same includes a supply and demand curve, which defines the marginal costs of labor and capital. However, metal production from primary mineral resources results into costs incurred by direct or indirect damage and pollution of natural environment, but which the manufacturer does not include that in his forms of costs. If those costs are omitted, it certainly will not be the real and fair view of the state of modern human ac-tivity and in the action that costs arise. Therefore, the classical model of supply and demand has to include externalities, or ex-ternal costs, which are expressed in the monetary or financial value of environmen-tal pollution. But, how the environmental damage has to be determined? This question is imposed due to a reason of impossible accurately determining the damages caused by the environmental pollution. If the relief or air quality is violated, it is difficult to es-timate the amount of losses as compared to the potential benefits of these natural condi-tions. It is easier to estimate the amount of loss on degradation the certain area of soil, on the basis of lost potential profit from the yield of crops grown or could be grown on them. The costs incurred due to the health problems of population can be also easier monetary expressed and displayed. Viewed both from environmental and financial side, certainly that no damages to the environ-ment are desirable. But these damages are real and really exist, except that some dam-ages cannot be removed, while some can be remediated. If the environmental pollutions do not have any value and as such do not appear in the economic model of supply and demand, it might be practical and their mar-ket value is zero. No matter how hard it is to determine the values of these damages, in
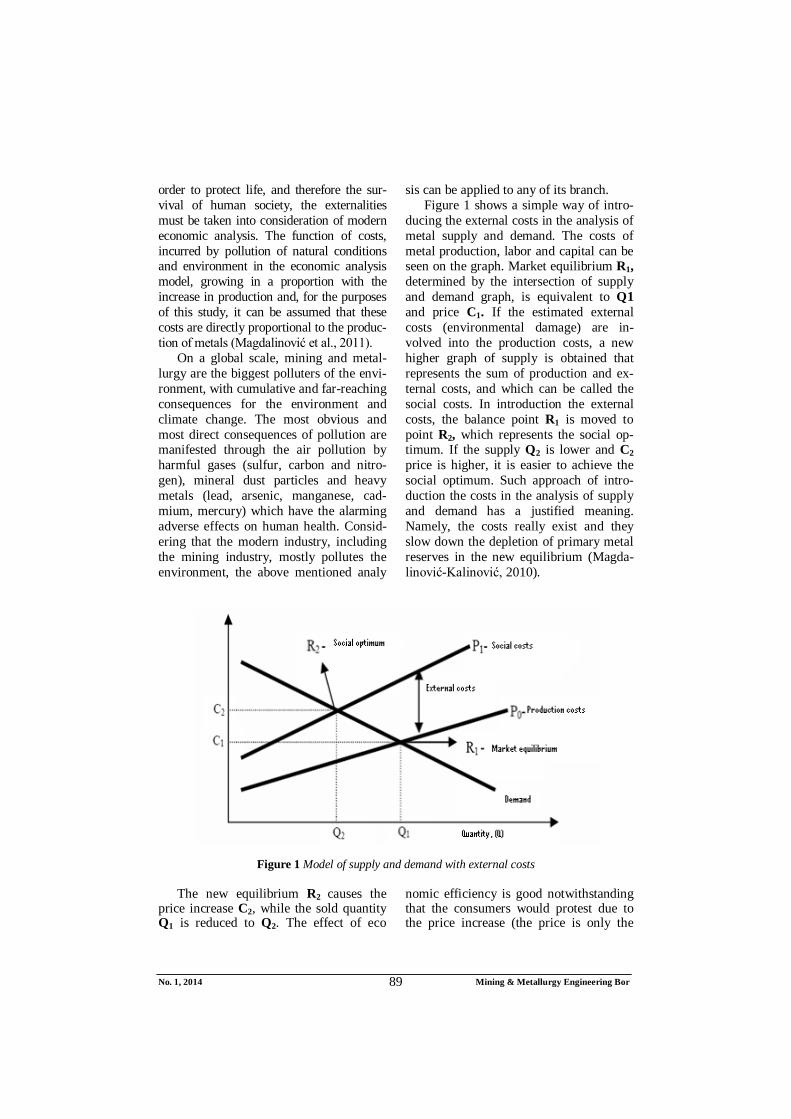
No. 1, 2014 Mining & Metallurgy Engineering Bor 89
order to protect life, and therefore the sur-vival of human society, the externalities must be taken into consideration of modern economic analysis. The function of costs, incurred by pollution of natural conditions and environment in the economic analysis model, growing in a proportion with the increase in production and, for the purposes of this study, it can be assumed that these costs are directly proportional to the produc-tion of metals (Magdalinović et al., 2011).
On a global scale, mining and metal-lurgy are the biggest polluters of the envi-ronment, with cumulative and far-reaching consequences for the environment and climate change. The most obvious and most direct consequences of pollution are manifested through the air pollution by harmful gases (sulfur, carbon and nitro-gen), mineral dust particles and heavy metals (lead, arsenic, manganese, cad-mium, mercury) which have the alarming adverse effects on human health. Consid-ering that the modern industry, including the mining industry, mostly pollutes the environment, the above mentioned analy
sis can be applied to any of its branch. Figure 1 shows a simple way of intro-
ducing the external costs in the analysis of metal supply and demand. The costs of metal production, labor and capital can be seen on the graph. Market equilibrium R1, determined by the intersection of supply and demand graph, is equivalent to Q1 and price C1. If the estimated external costs (environmental damage) are in-volved into the production costs, a new higher graph of supply is obtained that represents the sum of production and ex-ternal costs, and which can be called the social costs. In introduction the external costs, the balance point R1 is moved to point R2, which represents the social op-timum. If the supply Q2 is lower and C2 price is higher, it is easier to achieve the social optimum. Such approach of intro-duction the costs in the analysis of supply and demand has a justified meaning. Namely, the costs really exist and they slow down the depletion of primary metal reserves in the new equilibrium (Magda-linović-Kalinović, 2010).
Figure 1 Model of supply and demand with external costs
The new equilibrium R2 causes the
price increase C2, while the sold quantity Q1 is reduced to Q2. The effect of eco
nomic efficiency is good notwithstanding that the consumers would protest due to the price increase (the price is only the
No. 1, 2014 Mining & Metallurgy Engineering Bor 90
result of the real costs of production). If the sale is less, the production is also re-duced and such production will reduce the environmental damage. On the other hand, the saving will be on the primary metal resources because their depletion will re-sult into reduction. Such approach, i.e. the obtained new graphic, is approximate to the efficient equilibrium, i.e. the social optimum of metal production (from the primary reserves). Introducing the exter-nalities into the classical model of supply and demand can be done in different ways, depending both on mineral resour-ces and the way in which the same pol-lutes the environment. Tax on pollution presents one of the ways of introducing the external costs, which affect not only filling the state cash register, but also the awareness of producers on the natural environment, is really polluted. With hig-her tax on pollution, the supply of raw materials in the market is lower and higher raw material prices. This situation corre-sponds to the ecologists, because it is in favor of reduced environmental pollution, as the producers, in this manner, would be forced to produce less. However, the ques-tion may be freely asked about what the highest metal price to which the producers can go or that consumers can accept and pay. This is because the amount of pollu-tion is associated with the technology that has to be changed and improved. If it is left the unchanged, the tax will only have a role in reduced supply and higher prices.
Recycling may be the answer to this and similar questions. If the metal price in the market achieves the upper critical level, the consumers will search for the new ways to substitute the same, i.e. they will turn to re-cycling. The metal is obtained from recy-cling process with less costs, and also lower pollution of the environment. From the standpoint of sustainable development, this is the most favorable option since it extends the life time of primary reserves for metal production at the same time reducing bad effects on the environment.
Therefore, it can be said that it is nece-ssary to find the optimal level of pollution and harmonize the tax rates to that level. However, is the optimal pollution that which does not exist? The paradox is to use the word optimal when talking about pollution, considering the real awareness that optimal pollution is zero pollution. But, if it is taken into account that every, even the smallest production causes it, from an economic point of view, it is necessary that the produ-ction is zero, i.e. that does not exist. The society in any case has to decide what level of pollution is ready to accept. If the certain level of optimality is established, it is nece-ssary to strive also the reduction of these "optimal" harmful effects. Such reduction can only be achieved applying the new tech-nologies.
It can be stated that as long as there is production, there will be a level of pollution. To determine the optimal level, the econo-mists have introduced into analysis a com-parison the marginal costs of pollution BCP, with the marginal costs of damage from pollution, which in this case will be marked with BCD. Figure 2 shows curves of these costs, and it can be concluded that the reduc-tion of pollution is profitable while the costs of pollution control are less than benefits obtained from reduced damage.
The point Qmax, as maximum level of pollution, is the amount of pollution which has not been controlled. If, the pollution is reduced by taking the measures, the margi-nal costs of environmental damage will be decreased too. However, the less each pollu-tion unit, the greater unit of control costs, that is, the marginal control costs are in-creased. In the convergence point of the graphic of the marginal pollution costs and marginal control costs, there is the point of optimum level of pollution, QOZ. This point determines the amount of tax - p on pollu-tion (Figure 2) (Magdalinović-Kalinović, 2010).
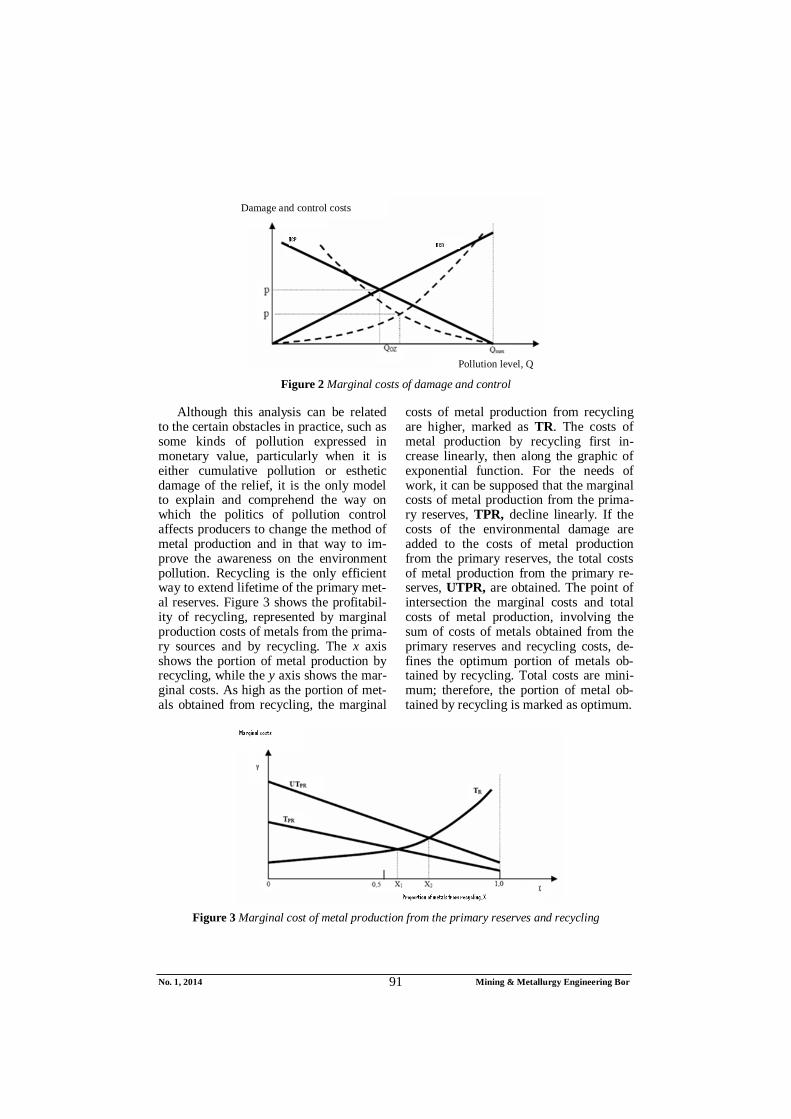
No. 1, 2014 Mining & Metallurgy Engineering Bor 91
Figure 2 Marginal costs of damage and control
Although this analysis can be related
to the certain obstacles in practice, such as some kinds of pollution expressed in monetary value, particularly when it is either cumulative pollution or esthetic damage of the relief, it is the only model to explain and comprehend the way on which the politics of pollution control affects producers to change the method of metal production and in that way to im-prove the awareness on the environment pollution. Recycling is the only efficient way to extend lifetime of the primary met-al reserves. Figure 3 shows the profitabil-ity of recycling, represented by marginal production costs of metals from the prima-ry sources and by recycling. The x axis shows the portion of metal production by recycling, while the y axis shows the mar-ginal costs. As high as the portion of met-als obtained from recycling, the marginal
costs of metal production from recycling are higher, marked as TR. The costs of metal production by recycling first in-crease linearly, then along the graphic of exponential function. For the needs of work, it can be supposed that the marginal costs of metal production from the prima-ry reserves, TPR, decline linearly. If the costs of the environmental damage are added to the costs of metal production from the primary reserves, the total costs of metal production from the primary re-serves, UTPR, are obtained. The point of intersection the marginal costs and total costs of metal production, involving the sum of costs of metals obtained from the primary reserves and recycling costs, de-fines the optimum portion of metals ob-tained by recycling. Total costs are mini-mum; therefore, the portion of metal ob-tained by recycling is marked as optimum.
Figure 3 Marginal cost of metal production from the primary reserves and recycling
Damage and control costs
Pollution level, Q
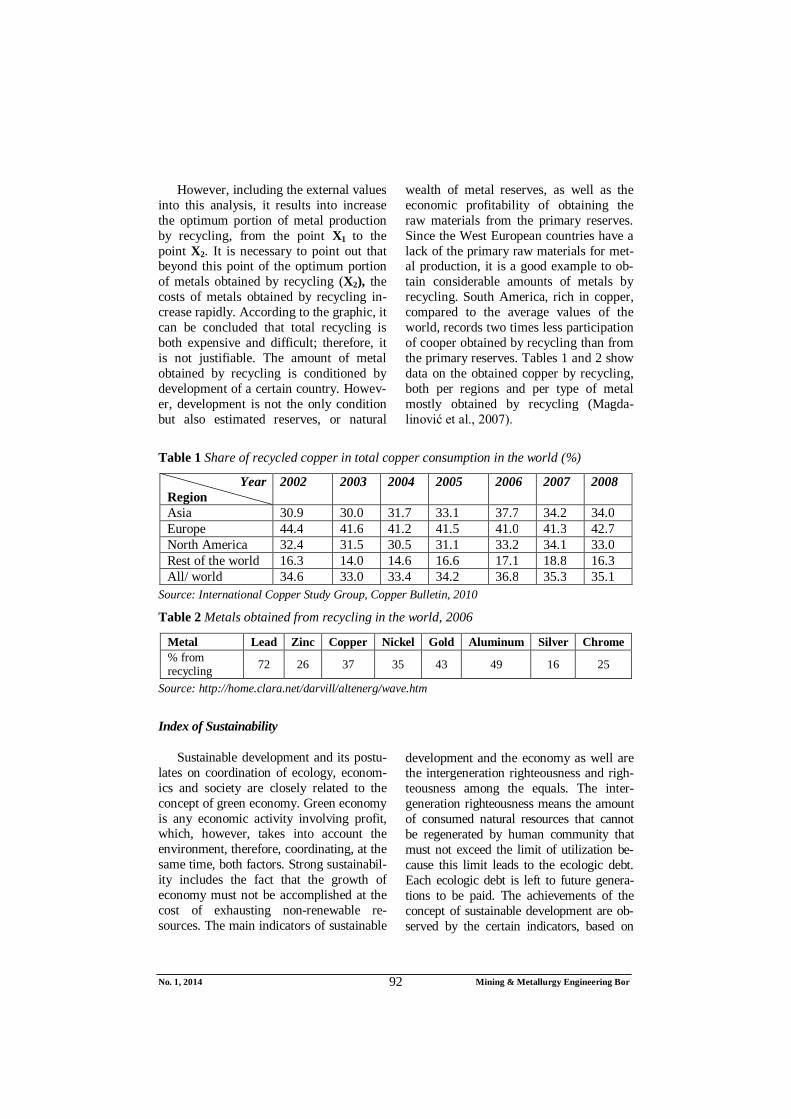
No. 1, 2014 Mining & Metallurgy Engineering Bor 92
However, including the external values into this analysis, it results into increase the optimum portion of metal production by recycling, from the point X1 to the point X2. It is necessary to point out that beyond this point of the optimum portion of metals obtained by recycling (X2), the costs of metals obtained by recycling in-crease rapidly. According to the graphic, it can be concluded that total recycling is both expensive and difficult; therefore, it is not justifiable. The amount of metal obtained by recycling is conditioned by development of a certain country. Howev-er, development is not the only condition but also estimated reserves, or natural
wealth of metal reserves, as well as the economic profitability of obtaining the raw materials from the primary reserves. Since the West European countries have a lack of the primary raw materials for met-al production, it is a good example to ob-tain considerable amounts of metals by recycling. South America, rich in copper, compared to the average values of the world, records two times less participation of cooper obtained by recycling than from the primary reserves. Tables 1 and 2 show data on the obtained copper by recycling, both per regions and per type of metal mostly obtained by recycling (Magda-linović et al., 2007).
Table 1 Share of recycled copper in total copper consumption in the world (%)
Year Region
2002 2003 2004 2005 2006 2007 2008
Asia 30.9 30.0 31.7 33.1 37.7 34.2 34.0 Europe 44.4 41.6 41.2 41.5 41.0 41.3 42.7 North America 32.4 31.5 30.5 31.1 33.2 34.1 33.0 Rest of the world 16.3 14.0 14.6 16.6 17.1 18.8 16.3 All/ world 34.6 33.0 33.4 34.2 36.8 35.3 35.1
Source: International Copper Study Group, Copper Bulletin, 2010
Table 2 Metals obtained from recycling in the world, 2006
Metal Lead Zinc Copper Nickel Gold Aluminum Silver Chrome % from recycling 72 26 37 35 43 49 16 25
Source: http://home.clara.net/darvill/altenerg/wave.htm
Index of Sustainability
Sustainable development and its postu-lates on coordination of ecology, econom-ics and society are closely related to the concept of green economy. Green economy is any economic activity involving profit, which, however, takes into account the environment, therefore, coordinating, at the same time, both factors. Strong sustainabil-ity includes the fact that the growth of economy must not be accomplished at the cost of exhausting non-renewable re-sources. The main indicators of sustainable
development and the economy as well are the intergeneration righteousness and righ-teousness among the equals. The inter-generation righteousness means the amount of consumed natural resources that cannot be regenerated by human community that must not exceed the limit of utilization be-cause this limit leads to the ecologic debt. Each ecologic debt is left to future genera-tions to be paid. The achievements of the concept of sustainable development are ob-served by the certain indicators, based on
No. 1, 2014 Mining & Metallurgy Engineering Bor 93
modern ecologic postulates which identify the causal and consequential connections between the economic politics and politics of environmental protection and impro-vement. Realiable indicator warns to the problem before it becomes too serious, directing to the measures that are nece-ssary to be undertaken so that the problem can be solved. The indicators of sustai-nable development point to the weakness of causal and consequential connections between economy, the environment and society. Although they have some common properties, characteristic for their efficiency, they differ among themselves. Sustainable development defines the idea of the sustainability index in exploitation the mineral resources as the rate of production and consumption of metals, and it is determined in relation to the consumption of the primary reserves. Strategy of sustainable development means a continued, longterm reduction of consumption the primary re-serves of metals with simultaneous increase of metal production by recycling. Hence, it leads to the rate of metal production by re-cycling and their consumption. The index of sustainable development, defined in this way, can range within the interval from 0 to 1. The higher index value, that is, closer to 1, the better conditions for realization the sus-tainable development. Higher index of sus-tainability matches the positive contribution of the environment protection, since in the case of recycling, the amount of municipal waste is reduced and also the metal produc-tion from the primary, non-renewable, sources. The index of sustainable develop-ment can be 0 if obtaining of metals by re-cycling is 0. The index can have the highest value, 1, if the metal production by recycling is equal to its consumption. Regardless the fact that the index of sustainable develop-ment is defined in relation to the preserva-tion of primary reserves, it points out the level of negative effect of metal production on the environment. The higher the index, the stronger sustainability, i.e., greater sa-
vings of primary reserves and, therefore, better protection of the environment.
CONCLUSION
Taking into consideration the fact that population growth worldwide causes in-crease the amount of produced waste, the mankind is forced to pay the greatest possi-ble attention to solving the problem of prop-er waste management. Rapid development of industrial production has caused increas-ingly greater consumption of the primary sources of raw materials for obtaining ener-gy. Metals are consumed rapidly, and, if such rate is going to continue, the primary reserves will be consumed in a relatively short time. To bring down the consumption at the optimum level, and aiming to reduce the pollution of the environment, which has been considerably damaged by rapid indus-trialization, it is necessary to include the category of external costs in the convention-nal model of offer and demand of metals. These costs somehow express and evaluate the pollution of the environment. That is the way to establish the socially optimum bal-ance on trade, resulting thus with higher price and less offer of metals from the pri-mary reserves. Less production of metals from the primary reserves is positive from the point of view of sustainable development because it extends life time of the primary reserves and reduces the environmental po-llution. Higher price of metals, as conse-quence of involvement the external costs, encourages producers to turn to higher metal production by recycling, the process from which they are obtained with significantly lower costs of production. Higher metal production by recycling leads to reduction of metal production from the primary reserves and in that way extends their existence. Re-cycling contributes to reduction of waste, resulting in reduction of environmental po-llution. Reduction the environmental pollu-tion is a positive, so-called “green“trend, involving the concept of “green economy“.
No. 1, 2014 Mining & Metallurgy Engineering Bor 94
REFERENCES
[1] Ilić B., Stojanović D., Simeonović N. (2013): Trade of Transferable Permits in the Stock Market in the Function of Improvement the Environmental, Journal of Economics Niš, No. 4, pp. 172-185; (in Serbian)
[2] Ilić-Popov, G.: Environmental Taxes, Faculty of Law, University of Belgrade (2000), pp. 36; (in Serbian)
[3] Waste Catalogue Ministry of Environ-ment and Spatial Planning, Agency for Environmental Protection of Serbia, Belgrade; (2010), (in Serbian)
[4] Magdalinović-Kalinović M.,: Magi-starski rad, Technical Faculty Bor (2010); (in Serbian)
[5] Magdalinović-Kalinović M., Magda-linović N., Economic Model of Metal Recyclling, 5th Symposium on Recy-cling Technology and Sustainable Development, Soko Banja (2010); pp. 106-117 (in Serbian)
[6] Magdalinović N., Magdalinović-Kali-nović M., Mihajlović D.: An Addition
to the Definition of the Sustainable Development Index in the Field of Metal Raw Materials, 3rd International Conference on Sustainable Deve-lopment Indicators in the Mining Industry, Milos Island, Greece (2007); pp. 97-107.
[7] Magdalinović N., Magdalinović- Kali-nović M., Popović G.: Facts and Principles for Establishing the Mana-gement of Mineral Resources of Metals, 3-13. The First Symposium on Management the Mineral Resources with International Participation, Fa-culty of Management, Zaječar; (2011), pp. 3-15. (in Serbian)
[8] Stanić M., Public Measures and Instruments in the Environmental Policy, 10th International Symposium Synergy, Bijeljina; (2012), pp. 413-420 (in Serbian)
[9] http://home.clara.net/darvill/altenerg/ wave.htm. Report of the U.S. Geolo-gical Society for 2007.
Broj 1, 2014. Mining & Metallurgy Engineering Bor 95
INSTITUT ZA RUDARSTVO I METALURGIJU BOR ISSN: 2334-8836 UDK: 622
UDK: 658.567:502/504(045)=861 DOI:10.5937/MMEB1401085I
Biljana Ilić*, Dragan Mihajlović*
RECIKLAŽA U FUNKCIJI ŠTEDNJE I ODRŽIVE EKONOMIJE MINERALNIH SIROVINA
Izvod
Pod reciklažom se podrazumeva izdvajanje materijala iz otpada i ponovno korišćenje istog. Ona podrazumeva sakupljanje, izdvajanje, preradu i izradu novih proizvoda od već korišćenih delova. U radu će se dati osnovni pojmovi reciklaže u funkciji štednje mineralnih sirovina. Štednja mineralnih sirovina, na ovaj način predstavlja jedan od ciljeva zelene ekonomije, a zelena ekonomija podrazumeva široko korišćenje obnovljivih izvora energije uz što manju emisiju, odnosno pojavu i proizvodnju štetnih materija u prirodnu sredinu. Štednja metaličnih mineralnih resursa najviše se ostvaruje reciklažom, a samim tim predstavlja prioritet za ostvarenje održivog razvoja.
Ključne reči: reciklaža, štednja, mineralne sirovine, zelena ekonomija
* Fakultet za menadžment, Zaječar, [email protected]
UVOD
Reciklaža je pojam kojim se može opisati proces pretvaranja „otpada“ u sirovine od kojih nastaju novi proizvodi. Kao takva, predstavlja deo integralnog sistema upravljanja otpadom, te se nalazi na trećem mestu u hijerariji upravljanja otpadom. Sistem upravljanja i recikliranja različitih vrsta otpada nije samo ekološko pitanje, već ujedno ulazi u sastav ekonom-skog i energetskog potencijala jedne zemlje. Reciklaža ima ekonomski, ekološki, ali i društveni značaj jer utiče na podizanje ekološke svesti, pomaže u sprečavanju zegađenja prirodne sredine, štedi prirodne resurse, troši manje energije prilikom prerade otpada, od energije koja se utroši za dobijanje proizvoda od sirovina, na kraju, recikliranjem se smanjuje i količina otpada. Najrasprostranjenija podela, ubraja dve kategorije otpada i to industrijski, koji nastaje u industrijskim procesima i komunalni, koji nastaje u domaćinstvu.
Otpad je pored svoje štetnosti, koju ima na prirodnu sredinu, vrlo značajan sekundarni izvor metala, kao i drugih proizvoda koji se dobijaju reciklažom. Statistički pokazatelji reciklaže u svetu su različiti, te idu od Japana koji reciklira 80-90% otpada, preko zemalja EU koja reciklira 30-40% otpada, sve do male Srbije koja ima zastupljenu reciklažu otpada, svega 6-8%. Na osnovu iznetih podataka može se zaključiti da je Srbija još uvek daleko od uspostavljanja ekološki bezbednog i efikasnog sistema upravljanja određenim vrstama otpada.
Ovo se posebno odnosi na komunalni otpad, obzirom da danas u Srbiji skoro upola količine prozvedenog otpada iz domaćin-stva, završava na divljim deponijama, gde predstavljaju konstantni izvor zagađenja zemlje, vazduha i vode. Uputno bi bilo za Srbiju, da je potrebno da uloži više napora u postizanju boljeg upravljanju otpadom, te i više napora za uvođenje novih tehnologija
Broj 1, 2014. Mining & Metallurgy Engineering Bor 96
koje bi to upravljanje i omogućile. U smislu recikliranja i tehnologija koje su vezane za reciklažu, nastao je i koncept zelenih tehno-logija. Koncept zelena tehnologija, koji predstavlja deo koncepta zelene ekonomije, pokazao je nagli rast tokom proteklih godina. Uopšteno gledajući, „zeleni tren-dovi“ u 2012. godini uticali su na smanjenje otpada, reciklažu i ponovno korišćenje pre-rađenih proizvoda. Trend održivog razvoja već duže vreme je prisutan u svetu, kao trend održive ekonomije, ekologije, odnosno društvenog razvoja. Na globalnom nivou, zelena ekonomija posmatra se kao ekono-mija u kojoj ekonomska rešenja i inovacije omogućavaju društvu da efikasno koristi resurse, poboljšavajući dobrobit ljudi na inkluzivan način, uz očuvanje prirodnih sistema koji održavaju svet i čovečanstvo (UNEP, United Nations Enviroment Programme, 2010).
KLASIFIKACIJA OTPADA
Karakterizacija otpada predstavlja postupak ispitivanja kojim se utvrđuju fizičko - hemijske, hemijske i biološke oso-bine i sastav otpada, odnosno određuje se da li otpad sadrži ili ne sadrži jednu ili više opasnih karakteristika. Klasifikacija otpada predstavlja postupak svrstavanja otpada na jednu ili više lista otpada koje su utvrđene posebnim propisom, a prema njegovom poreklu, sastavu i daljoj nameni; (Katalog otpada, 2010) Zakon o upravljanju otpadom zahteva da otpad bude opisan na način koji omogućava sigurno rukovanje i upravljanje predmetnim otpadom, kao i da bilo koja promena vlasništva otpada bude propraćena odgovarajućom dokumentacijom koja obavezno uključuje indeksni broj otpada. Otpad se razvrstava prema Katalogu otpada koji je usklađen s Evropskim katalogom otpada (European List of Waste/European Waste Catalog). U okviru Kataloga, otpad je sistematizovan, prvenstveno, prema delatno-stima u okviru kojih je generisan, ali i prema tipu otpada, materijalima ili procesima. U
Katalogu otpada je sistematizovano više od 800 vrsta otpada, podeljenih u 20 grupa, koje se označavaju dvocifrenim brojevima, te se dele na sledeći način:
1. Otpadi koji potiču od istraživanja, iskopavanja iz rudnika ili kameno-loma i fizičkog i hemijskog tret-mana minerala
2. Otpadi iz poljoprvrede, holtikultu-re, avakulture, šumarstva, lova i ribolova, pripreme i prerade hrane
3. Otpadi od prerade drveta i proizvo-dnje papira, kartona, pulpe, panel i nameštaja
4. Otpadi iz kožne, krznarske i tekstilne industrije
5. Otpadi od rafinisanja nafte, preči-šćavanja prirodnog gasa i piroli-tičkog tretmana uglja
6. Otpadi od neorganske hemijske prerade
7. Otpadi od organske hemijske pre-rade
8. Otpadi od izrade, formulacije, pri-bavljanja i upotrebe premaza (boje, lakovi i staklene glazure), lepkovi, zaptivači i štamparska mastila
9. Otpadi iz fotografske industrije 10. Otpadi iz termičkih procesa 11. Otpadi od hemijskog tretmana
površine i premazivanja metala i drugih materijala; hidrometalurgija obojenih metala
12. Otpadi od oblikovanja fizičke i me-haničke površinske obrade metala i plastike
13. Otpadi od ulja i ostataka tečnih goriva (osim jestivih ulja)
14. Otpadi od organskih supstanci koje se koriste kao rastvarači, sredstva za hlađenje i kao pogonski gasovi
15. Otpadi od ambalaže 16. Otpadi koji nisu drugačije specifi-
cirani u katalogu 17. Građevisnki otpad i otpad od ruše-
nja (uključujući i zemlju sa konta-miniranih lokacija)
Broj 1, 2014. Mining & Metallurgy Engineering Bor 97
18. Otpadi od zdravstvene zaštite ljudi i životinja - iz sistema povezanog istraživnja
19. Otpadi iz objekata za obradu otpada, pogona za tretman otpa-dnih voda, dalje od lokacije proiz-vodnje i pripremu vode name-njenoj ljudskoj upotrebi i vode za industrijsku upotrebu
20. Opštinski otpadi (kućni otpad i slični komercijalni industrijski otpadi), uključujući odvojeno sakupljajuće frakcije
Iz nabrojanih kategorija otpada izdvajaju se sledeće podgrupe i to: plastika, metal, drvo, organski otpad, papir, elektronika, gume, staklo i otpadna ulja. Nabrojane vrste otpada, predstavljaju sekundarnu sirovinu za dobijanje novih proizvoda. Značajna uloga u recikliranju otpada pripada čvrstom otpadu. U čvrsti otpad spada komunalni, indistrijski i komercijalni, ambalažni i građevinski otpad. Industrijski i komercijalni otpad spadaju u najpoželjnije i najtraženije vrste otpada na tržištu. Bez ove vrste otpada ne mogu opstati operateri privatnog sektora. Predmeti i uređaji od metala koji su izgubili svoju upotrebnu vrednost, neretko završavaju na otpadu, te tako aktivno zagađuju životnu sredinu. Ova vrsta otpada predstavlja sekundarnu sirovinu za dobijanje metala, jer se sakupljanjem i vraćanjem u ponovnu preradu, dobijaju novi proizvodi, ujedno se štede primarni resursi, a samim tim i produžava vek primarnih rezervi sirovina. Na taj način se smanjuje zagađenje životne sredine. Primera radi, od ukupne količine proizvedenog bakra, procenjuje se da se izgubi 15%, dok se preostala količina ugrađuje u stvari i predmete koje služe ponovnoj upotrebi. Slično je i sa čelikom, o čemu govori podatak da se danas skoro 75% čelika dobija recikliranjem. Činjenica da je ukupna količina komunalnog otpada u svetu dostigla zabrinjavajuće visok nivo, ukazuje da je urgentno preduzeti akcije koje vode smanjenju istog.
Može se konstatovati da je količina otpada u direktnoj vezi sa obimom proizvo-dnje i sa razvijenošću zemlje. Razvijenije zemlje više proizvode otpad, zbog veće proizvodnje, ali sa druge strane prednjače u razvoju tehnologije za suzbijanje otpada. U ovim zemljama komunalni otpad se tretira u postrojenjim za sortiranje. Primera radi, u zemljama EU ukupno količina komunalnog otpada koji se sagoreva iznosi 33%. Nakon takvog tretmana, preostali deo otpada je količinski manji, te ga je lakše deponovati. Obzirom na sve iznete činjenice vezane za otpad, u daljem tekstu predstaviće se važnost uključivanja eksternih troškova, koji su u direktnoj vezi sa eksploatacijom mineralnih sirovina. To će dalje rasvetliti značaj reciklaže u smanjenju troškova za dobijanje metala i u njenoj ekonomskoj oprav-danosti.
NEOPHODNOST UKLJUČIVANJA EKSTERNIH TROŠKOVA U EKSPLOATACIJI MINERALNIH SIROVINA
Eksternalije predstavljaju učinke, pozi-tivnog ili negativnog karaktera, koje proizilaze iz određene aktivnosti, a da pri tome nisu rezultat delovanja mehanizma cena. Termin „eksterni učinak“ prvi je upotrebio teoretičar ekonomije blagostanja A. S. Pigou (1912) koji je postavio osnove standardne teorije eksternalija. Polazeći od tržišnih nedostataka, Pigou je izneo postavku o neophodnosti državne intervencije koja bi trebala da obezbedi da tržišne cene odražavaju pun društveni trošak. Posma-trano sa teorijskog stanovišta, kako bi se izbeglo prenošenje eksternih troškova na celokupnu društvenu zajednicu, neophodna je njihova internalizacija, odnosno uklju-čivanje troškova zagađenja u cenu proizvoda koje uzrokuju zagađenje (Ilić i drugi, 2013). U ekonomskoj teoriji i praksi postoje dve grupacije mera kojima se regulišu ekste-rnalije: (Stanić, 2012)
Broj 1, 2014. Mining & Metallurgy Engineering Bor 98
1) komandno-kontrolne (standardi ili ograničenja) i
2) tržišne mere (porezi i prenosive dozvole).
Potrebno je istaći da eksterni efekti mogu da postoje kako u proizvodnji, tako i u potrošnji, te da mogu biti pozitivni i negativani. Pozitivni eksterni efekti predstav-ljaju koristi za treća lica i nisu uključeni u cenu proizvoda. U slučaju eksternih efekata u potrošnji, jedan subjekat svojom potro-šnjom donosi koristi nekom licu, s tim što se to dešava bez stvaranja dodatnih troškova za to drugo lice. Otuda, on nije spreman da ih prizna u ceni robe koju kupuje radi potrošnje.
S druge strane, kod pozitivnih eksternih efekata u proizvodnji, jedan proizvođač svojom aktivnošću pruža koristi nekom trećem licu, a ne onim licima kojima prodaje svoju robu, tako da za tu aktivnost ne napla-ćuje nikakvu naknadu od trećih lica (Ilić - Popov, 2000). Primer pozitivnih eksternih efekata je obrazovanje. Negativni eksterni efekti označavaju troškove koje pravno ili fizičko lice uzrokuje, tj. nameće drugim članovima društva, a koji nisu uključeni u cenu proizvoda. S obzirom da su razmere negativnih eksternih efekata veće i njihove posledice dalekosežnije, ovoj vrsti eksternih efekata se posvećuje mnogo veća pažnja.
Prilikom održivog upravljanja mineral-nim resursima, proizilazi da je cena metala jedan od glavnih ekonomskih instrumenata za dostizanje te održivosti. Ukoliko se u razmatranje uzme klasični ekonomski model ponude i tražnje, može se konstatovati da isti uključuje krivu ponude i tražnje, koje su definisane graničnim troškovima rada i kapitala. Međutim, proizvodnjom metala iz primarnih sirovina, nastaju troškovi koji su nastali posrednim ili neposrednim ošteće-njem, odnosno zagađenjem, prirodne ili životne sredine, a koje proizvođač ne uključuje u svoje obrasce troškova. Ukoliko se oni izostave, to svakako neće biti stvarno stanje i objektivna slika savremenog ljud-
skog delovanja i troškova koji pri tom delovanju nastaju. S toga je u klasični model ponude i tražnje neophodno uključiti i eksternalije, odnosno eksterne troškove, koji predstavljaju monetarno ili finansijski izraženu vrednost zagađenja životne sredine. Ali, na koji način monetarno odrediti ošte-ćenja životne sredine? Ovo pitanje se nameće iz razloga što se ne može tačno utvrditi koliko zaista iznose štete nastale od zagađenja sredine. Ukoliko se naruši reljef ili kvalitet vazduha, teško je proceniti koliko iznose gubici u odnosu na moguće koristi od ovih prirodnih uslova. Lakše je proceniti koliko iznosi gubitak od degradacije odre-đene površine zemljišta, na osnovu izgub-ljene potencijalne dobiti od prinosa kultura koje se na njima gaje, ili bi se mogle gajiti. Troškovi nastali usled zdravstvenih prob-lema stanovništva, mogu se takođe lakše monetarno izraziti i prikazati. Posmatrano kako sa ekološke, tako i sa finansijske strane, svakako da nikakva oštećenja životne sredine nisu poželjna. Ali su ta oštećenja realna i zaista postoje, sa tom razlikom što je neka nemoguće otkloniti, dok je pojedine moguće sanirati. Ukoliko se zagađenjima prirodne sredine ne dodeli nikava vrednost, te se kao takvi ne pojavljuju u ekonomskom modelu ponude i tražnje, onda bi praktično i njihova tržišna vrednost bila jednaka nuli. Bez obzira na to koliko je teško zaista odrediti vrednost pomenutih oštećenja, u cilju zaštite života, a samim tim i opstanka ljudskog društva, eksternailje se moraju uzeti u razmatranje savremene ekonomske analize. Funkcija troškova nastalih zagađe-njem prirodnih uslova i sredine u ekonom-skom modelu analize, proporcionlano raste sa porastom proizvodnje, te se za potrebe ovog rada može pretpostaviti da su ovi troškovi direktno proporcionalni proizvodnji metala (Magdalinović i drugi, 2011). U glo-balnim razmerama rudarstvo i metalurgija su najveći zagađivači životne sredine, sa kumu-lativnim i dalekosežnim posledicama po životnu sredinu i klimatske promene.
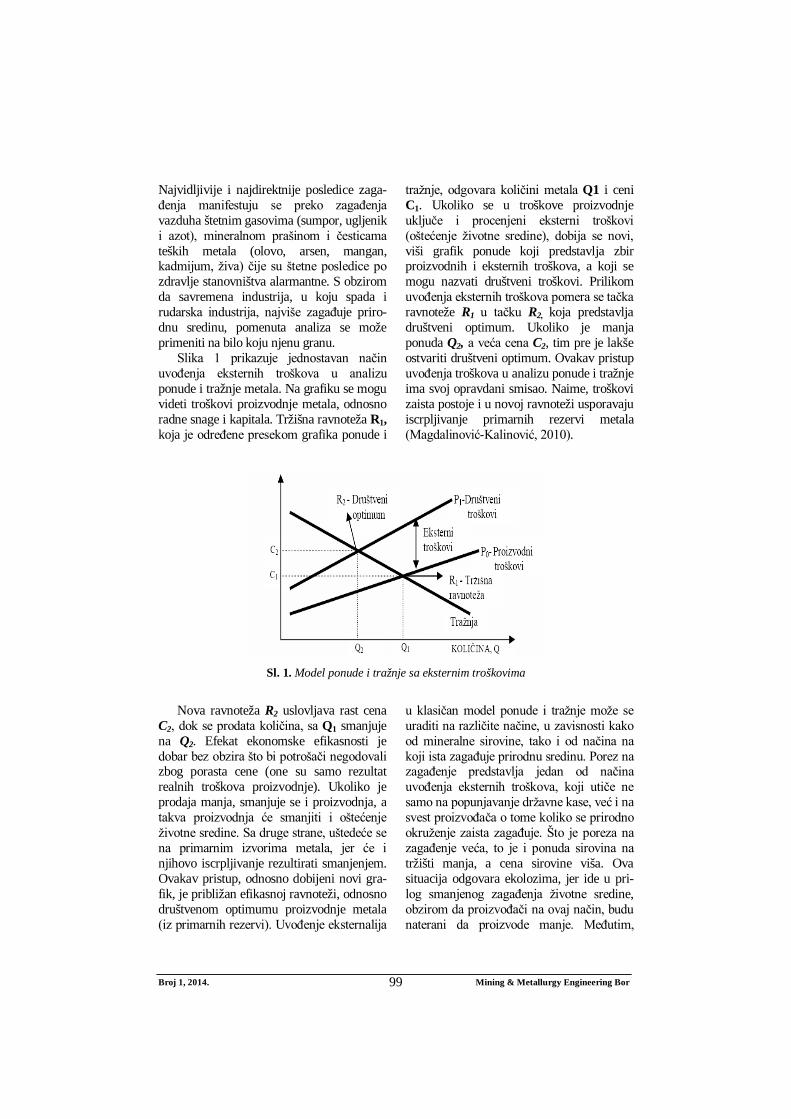
Broj 1, 2014. Mining & Metallurgy Engineering Bor 99
Najvidljivije i najdirektnije posledice zaga-đenja manifestuju se preko zagađenja vazduha štetnim gasovima (sumpor, ugljenik i azot), mineralnom prašinom i česticama teških metala (olovo, arsen, mangan, kadmijum, živa) čije su štetne posledice po zdravlje stanovništva alarmantne. S obzirom da savremena industrija, u koju spada i rudarska industrija, najviše zagađuje priro-dnu sredinu, pomenuta analiza se može primeniti na bilo koju njenu granu.
Slika 1 prikazuje jednostavan način uvođenja eksternih troškova u analizu ponude i tražnje metala. Na grafiku se mogu videti troškovi proizvodnje metala, odnosno radne snage i kapitala. Tržišna ravnoteža R1, koja je određene presekom grafika ponude i
tražnje, odgovara količini metala Q1 i ceni C1. Ukoliko se u troškove proizvodnje uključe i procenjeni eksterni troškovi (oštećenje životne sredine), dobija se novi, viši grafik ponude koji predstavlja zbir proizvodnih i eksternih troškova, a koji se mogu nazvati društveni troškovi. Prilikom uvođenja eksternih troškova pomera se tačka ravnoteže R1 u tačku R2, koja predstavlja društveni optimum. Ukoliko je manja ponuda Q2, a veća cena C2, tim pre je lakše ostvariti društveni optimum. Ovakav pristup uvođenja troškova u analizu ponude i tražnje ima svoj opravdani smisao. Naime, troškovi zaista postoje i u novoj ravnoteži usporavaju iscrpljivanje primarnih rezervi metala (Magdalinović-Kalinović, 2010).
Sl. 1. Model ponude i tražnje sa eksternim troškovima
Nova ravnoteža R2 uslovljava rast cena
C2, dok se prodata količina, sa Q1 smanjuje na Q2. Efekat ekonomske efikasnosti je dobar bez obzira što bi potrošači negodovali zbog porasta cene (one su samo rezultat realnih troškova proizvodnje). Ukoliko je prodaja manja, smanjuje se i proizvodnja, a takva proizvodnja će smanjiti i oštećenje životne sredine. Sa druge strane, uštedeće se na primarnim izvorima metala, jer će i njihovo iscrpljivanje rezultirati smanjenjem. Ovakav pristup, odnosno dobijeni novi gra-fik, je približan efikasnoj ravnoteži, odnosno društvenom optimumu proizvodnje metala (iz primarnih rezervi). Uvođenje eksternalija
u klasičan model ponude i tražnje može se uraditi na različite načine, u zavisnosti kako od mineralne sirovine, tako i od načina na koji ista zagađuje prirodnu sredinu. Porez na zagađenje predstavlja jedan od načina uvođenja eksternih troškova, koji utiče ne samo na popunjavanje državne kase, već i na svest proizvođača o tome koliko se prirodno okruženje zaista zagađuje. Što je poreza na zagađenje veća, to je i ponuda sirovina na tržišti manja, a cena sirovine viša. Ova situacija odgovara ekolozima, jer ide u pri-log smanjenog zagađenja životne sredine, obzirom da proizvođači na ovaj način, budu naterani da proizvode manje. Međutim,
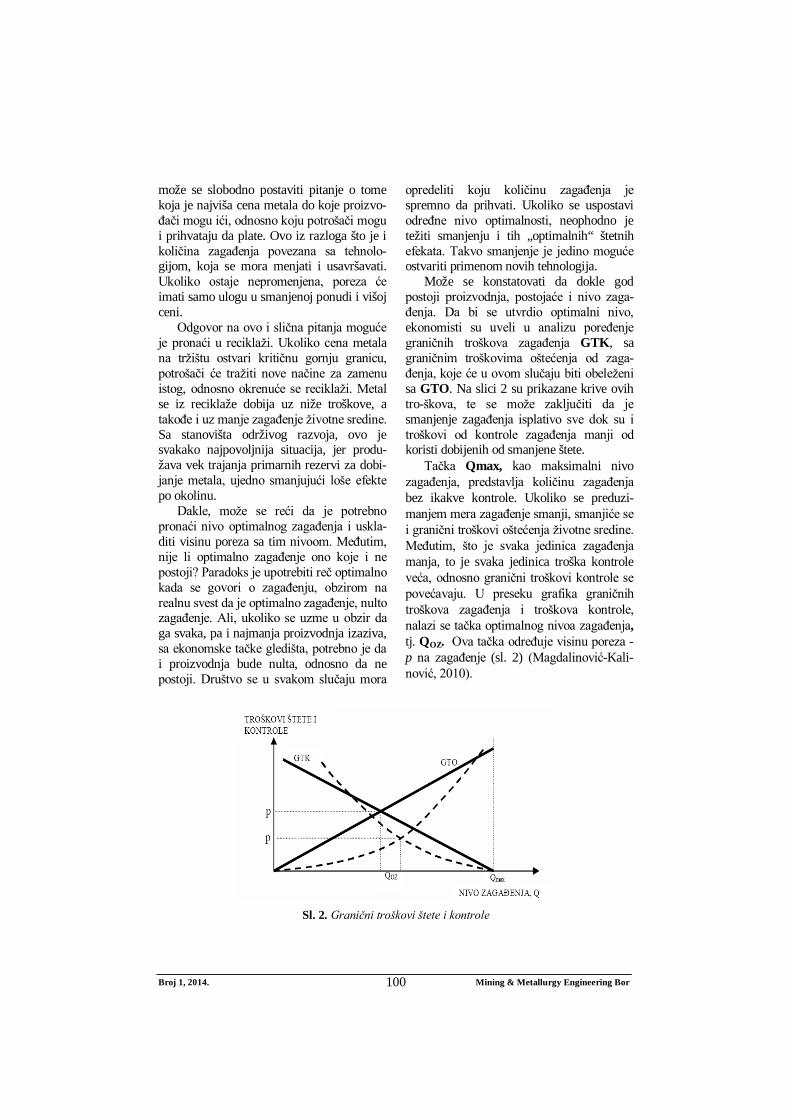
Broj 1, 2014. Mining & Metallurgy Engineering Bor 100
može se slobodno postaviti pitanje o tome koja je najviša cena metala do koje proizvo-đači mogu ići, odnosno koju potrošači mogu i prihvataju da plate. Ovo iz razloga što je i količina zagađenja povezana sa tehnolo-gijom, koja se mora menjati i usavršavati. Ukoliko ostaje nepromenjena, poreza će imati samo ulogu u smanjenoj ponudi i višoj ceni.
Odgovor na ovo i slična pitanja moguće je pronaći u reciklaži. Ukoliko cena metala na tržištu ostvari kritičnu gornju granicu, potrošači će tražiti nove načine za zamenu istog, odnosno okrenuće se reciklaži. Metal se iz reciklaže dobija uz niže troškove, a takođe i uz manje zagađenje životne sredine. Sa stanovišta održivog razvoja, ovo je svakako najpovoljnija situacija, jer produ-žava vek trajanja primarnih rezervi za dobi-janje metala, ujedno smanjujući loše efekte po okolinu.
Dakle, može se reći da je potrebno pronaći nivo optimalnog zagađenja i uskla-diti visinu poreza sa tim nivoom. Međutim, nije li optimalno zagađenje ono koje i ne postoji? Paradoks je upotrebiti reč optimalno kada se govori o zagađenju, obzirom na realnu svest da je optimalno zagađenje, nulto zagađenje. Ali, ukoliko se uzme u obzir da ga svaka, pa i najmanja proizvodnja izaziva, sa ekonomske tačke gledišta, potrebno je da i proizvodnja bude nulta, odnosno da ne postoji. Društvo se u svakom slučaju mora
opredeliti koju količinu zagađenja je spremno da prihvati. Ukoliko se uspostavi određne nivo optimalnosti, neophodno je težiti smanjenju i tih „optimalnih“ štetnih efekata. Takvo smanjenje je jedino moguće ostvariti primenom novih tehnologija.
Može se konstatovati da dokle god postoji proizvodnja, postojaće i nivo zaga-đenja. Da bi se utvrdio optimalni nivo, ekonomisti su uveli u analizu poređenje graničnih troškova zagađenja GTK, sa graničnim troškovima oštećenja od zaga-đenja, koje će u ovom slučaju biti obeleženi sa GTO. Na slici 2 su prikazane krive ovih tro-škova, te se može zaključiti da je smanjenje zagađenja isplativo sve dok su i troškovi od kontrole zagađenja manji od koristi dobijenih od smanjene štete.
Tačka Qmax, kao maksimalni nivo zagađenja, predstavlja količinu zagađenja bez ikakve kontrole. Ukoliko se preduzi-manjem mera zagađenje smanji, smanjiće se i granični troškovi oštećenja životne sredine. Međutim, što je svaka jedinica zagađenja manja, to je svaka jedinica troška kontrole veća, odnosno granični troškovi kontrole se povećavaju. U preseku grafika graničnih troškova zagađenja i troškova kontrole, nalazi se tačka optimalnog nivoa zagađenja, tj. QOZ. Ova tačka određuje visinu poreza - p na zagađenje (sl. 2) (Magdalinović-Kali-nović, 2010).
Sl. 2. Granični troškovi štete i kontrole
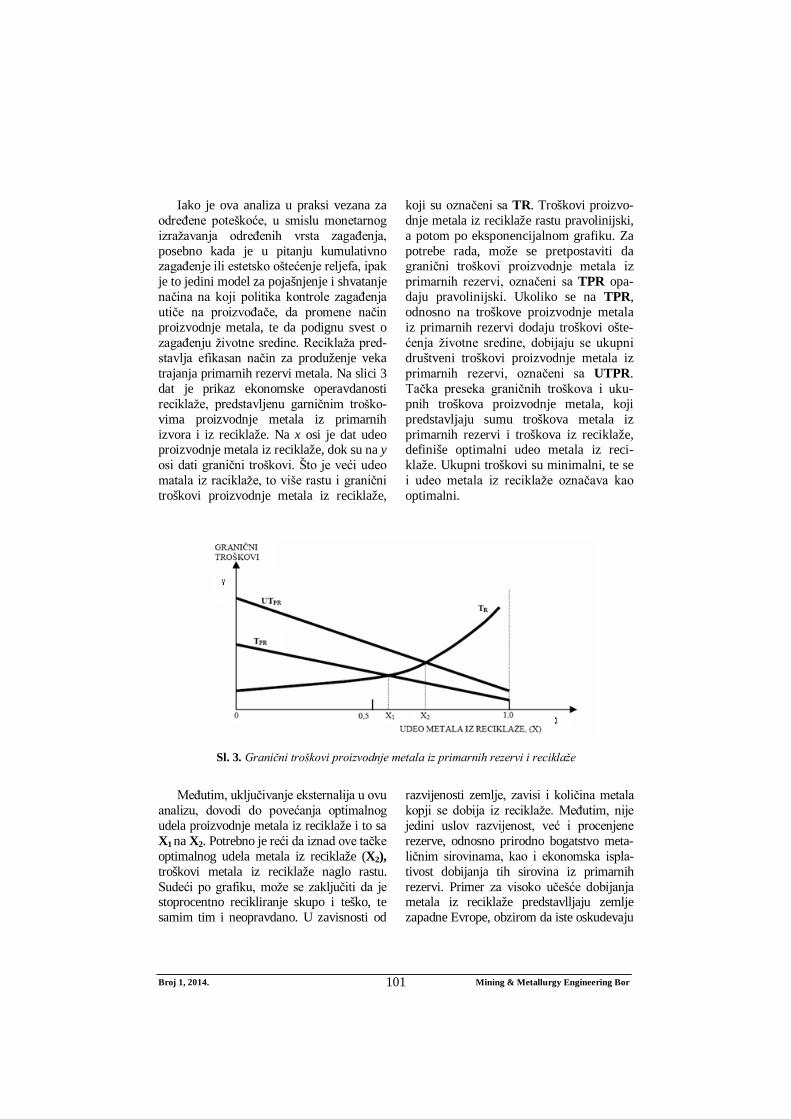
Broj 1, 2014. Mining & Metallurgy Engineering Bor 101
Iako je ova analiza u praksi vezana za
određene poteškoće, u smislu monetarnog izražavanja određenih vrsta zagađenja, posebno kada je u pitanju kumulativno zagađenje ili estetsko oštećenje reljefa, ipak je to jedini model za pojašnjenje i shvatanje načina na koji politika kontrole zagađenja utiče na proizvođače, da promene način proizvodnje metala, te da podignu svest o zagađenju životne sredine. Reciklaža pred-stavlja efikasan način za produženje veka trajanja primarnih rezervi metala. Na slici 3 dat je prikaz ekonomske operavdanosti reciklaže, predstavljenu garničnim troško-vima proizvodnje metala iz primarnih izvora i iz reciklaže. Na x osi je dat udeo proizvodnje metala iz reciklaže, dok su na y osi dati granični troškovi. Što je veći udeo matala iz raciklaže, to više rastu i granični troškovi proizvodnje metala iz reciklaže,
koji su označeni sa TR. Troškovi proizvo-dnje metala iz reciklaže rastu pravolinijski, a potom po eksponencijalnom grafiku. Za potrebe rada, može se pretpostaviti da granični troškovi proizvodnje metala iz primarnih rezervi, označeni sa TPR opa-daju pravolinijski. Ukoliko se na TPR, odnosno na troškove proizvodnje metala iz primarnih rezervi dodaju troškovi ošte-ćenja životne sredine, dobijaju se ukupni društveni troškovi proizvodnje metala iz primarnih rezervi, označeni sa UTPR. Tačka preseka graničnih troškova i uku-pnih troškova proizvodnje metala, koji predstavljaju sumu troškova metala iz primarnih rezervi i troškova iz reciklaže, definiše optimalni udeo metala iz reci-klaže. Ukupni troškovi su minimalni, te se i udeo metala iz reciklaže označava kao optimalni.
Sl. 3. Granični troškovi proizvodnje metala iz primarnih rezervi i reciklaže
Međutim, uključivanje eksternalija u ovu
analizu, dovodi do povećanja optimalnog udela proizvodnje metala iz reciklaže i to sa X1 na X2. Potrebno je reći da iznad ove tačke optimalnog udela metala iz reciklaže (X2), troškovi metala iz reciklaže naglo rastu. Sudeći po grafiku, može se zaključiti da je stoprocentno recikliranje skupo i teško, te samim tim i neopravdano. U zavisnosti od
razvijenosti zemlje, zavisi i količina metala kopji se dobija iz reciklaže. Međutim, nije jedini uslov razvijenost, već i procenjene rezerve, odnosno prirodno bogatstvo meta-ličnim sirovinama, kao i ekonomska ispla-tivost dobijanja tih sirovina iz primarnih rezervi. Primer za visoko učešće dobijanja metala iz reciklaže predstavlljaju zemlje zapadne Evrope, obzirom da iste oskudevaju
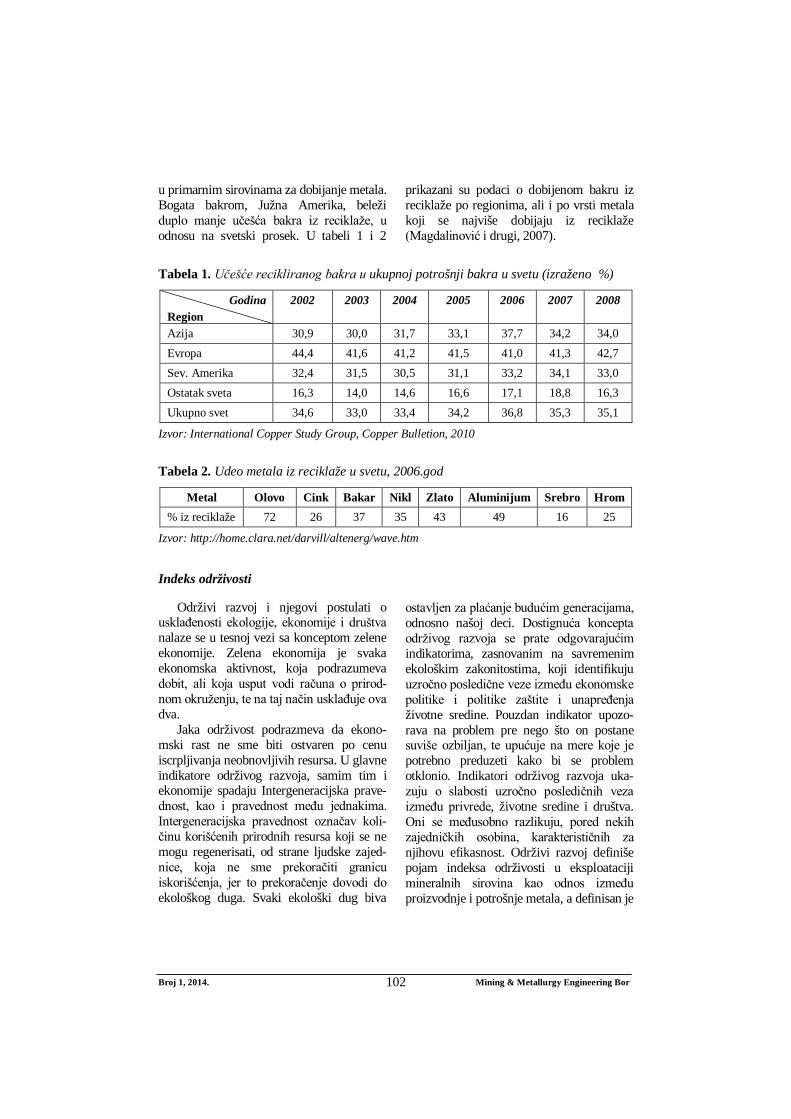
Broj 1, 2014. Mining & Metallurgy Engineering Bor 102
u primarnim sirovinama za dobijanje metala. Bogata bakrom, Južna Amerika, beleži duplo manje učešća bakra iz reciklaže, u odnosu na svetski prosek. U tabeli 1 i 2
prikazani su podaci o dobijenom bakru iz reciklaže po regionima, ali i po vrsti metala koji se najviše dobijaju iz reciklaže (Magdalinović i drugi, 2007).
Tabela 1. Učešće recikliranog bakra u ukupnoj potrošnji bakra u svetu (izraženo %)
Godina Region
2002 2003 2004 2005 2006 2007 2008
Azija 30,9 30,0 31,7 33,1 37,7 34,2 34,0 Evropa 44,4 41,6 41,2 41,5 41,0 41,3 42,7 Sev. Amerika 32,4 31,5 30,5 31,1 33,2 34,1 33,0 Ostatak sveta 16,3 14,0 14,6 16,6 17,1 18,8 16,3 Ukupno svet 34,6 33,0 33,4 34,2 36,8 35,3 35,1
Izvor: International Copper Study Group, Copper Bulletion, 2010
Tabela 2. Udeo metala iz reciklaže u svetu, 2006.god
Metal Olovo Cink Bakar Nikl Zlato Aluminijum Srebro Hrom % iz reciklaže 72 26 37 35 43 49 16 25
Izvor: http://home.clara.net/darvill/altenerg/wave.htm
Indeks održivosti
Održivi razvoj i njegovi postulati o usklađenosti ekologije, ekonomije i društva nalaze se u tesnoj vezi sa konceptom zelene ekonomije. Zelena ekonomija je svaka ekonomska aktivnost, koja podrazumeva dobit, ali koja usput vodi računa o prirod-nom okruženju, te na taj način usklađuje ova dva.
Jaka održivost podrazmeva da ekono-mski rast ne sme biti ostvaren po cenu iscrpljivanja neobnovljivih resursa. U glavne indikatore održivog razvoja, samim tim i ekonomije spadaju Intergeneracijska prave-dnost, kao i pravednost među jednakima. Intergeneracijska pravednost označav koli-činu korišćenih prirodnih resursa koji se ne mogu regenerisati, od strane ljudske zajed-nice, koja ne sme prekoračiti granicu iskorišćenja, jer to prekoračenje dovodi do ekološkog duga. Svaki ekološki dug biva
ostavljen za plaćanje budućim generacijama, odnosno našoj deci. Dostignuća koncepta održivog razvoja se prate odgovarajućim indikatorima, zasnovanim na savremenim ekološkim zakonitostima, koji identifikuju uzročno posledične veze između ekonomske politike i politike zaštite i unapređenja životne sredine. Pouzdan indikator upozo-rava na problem pre nego što on postane suviše ozbiljan, te upućuje na mere koje je potrebno preduzeti kako bi se problem otklonio. Indikatori održivog razvoja uka-zuju o slabosti uzročno posledičnih veza između privrede, životne sredine i društva. Oni se međusobno razlikuju, pored nekih zajedničkih osobina, karakterističnih za njihovu efikasnost. Održivi razvoj definiše pojam indeksa održivosti u eksploataciji mineralnih sirovina kao odnos između proizvodnje i potrošnje metala, a definisan je
Broj 1, 2014. Mining & Metallurgy Engineering Bor 103
u odnosu na trošenje primarnih rezervi. Strategija održivog razvoja svodi se na kontinuirano, dugoročno smanjivanje potro-šnje primarnih rezervi metala, uz istovre-meno povećanje proizvodnje metala iz reciklaže. Samim tim dolazi se do odnosa proizvodnje metala iz reciklaže i njegove potrošnje. Indeks održivog razvoja, definisan na ovaj način se može kretati u intervalu od 0 do 1. Ukoliko je vrednost indeksa veća, odnosno bliža jedinici, to su i bolji uslovi za ostvarenje održivog razvoja. Veći indeks održivosti, odgovara pozitivnom doprinosu očuvanja prirodne sredine, jer se u datom slučaju, kada je u pitanju reciklaža količina komunalnog otpada smanjuje, kao i proiz-vodnja metala iz primarnih, neobnovljivih izvora. Indeks održivog razvoja može biti jednak nuli, ukoliko je i dobijanje metala iz reciklaže jednako nuli. A najveću vrednost, odnosno jedinicu, može imati ukoliko je proizvodnja metala iz reciklaže jednaka njegovoj potrošnji. Bez obzira što je indeks održivog razvoja definisan u odnosu na očuvanje primarnih rezervi, on ukazuje i na stepen negativnog uticaja proizvodnje metala na životnu sredinu. Što je ovaj indeks veći, to ukazuje na jaču održivost, odnosno na veću uštedu primarnih rezervi, a implicitno i na bolju zaštitu prirodne sredine.
ZAKLJUČAK
S obzirom na činjenično stanje, da se sa porastom broja stanovništva u Svetu, beleži i porast količine proizvedenog otpada, čove-čanstvo je primorano da maksimalno posveti pažnju rešavanju problema pravilnog uprav-ljanja otpadom. Nagli razvoj industrijske proizvodnje je doprineo i sve većoj potrošnji primarnih izvora energetskih sirovina. Ubrzano se troše i metali, a ukoliko se takva stopa nastavi, doći će se do potrošnje primarnih rezervi i to za relativno kratak vremenski period. Kako bi se potrošnja svela na neki optimalni nivo, a i u cilju smanjenja zagađenja životne sredine, koja je poprilično oštećena naglom industrijalizacijom, potre-
bno je u klasičan model ponude i tražnje metala, uvesti i kategoriju eksternih troš-kova. Ovi troškovi na određeni način iskazuju i vrednuju zagađenje životne sredine. Time se uspostavlja društveno optimalna tržišna ravnoteža, koja rezultira višom cenom i manjom ponudom metala iz primarnih rezervi. Manja proizvodnja metala iz primarnih rezervi je pozitivno sa stanovišta održivog razvoja, jer produžava vek trajanja primarnih rezervi i smanjuje zagađenje životne sredine. Viša cena metala, kao posledica uvođenja eksternih troškova, podstiče proizvođače da se okrenu većoj proizvodnji metala iz reciklaže, odakle se on dobija uz značajno niže troškove proiz-vodnje. Veća proizvodnja metala iz reci-klaže dovodi do smanjenja proizvodnje metala iz primarnih rezervi, te tako produ-žava njihov vek trajanja. Reciklaža doprinosi i smanjenju otpada, što rezultira smanjenju zagađenja životne sredine. Samo smanjenje životne sredine, predstavlja pozitivan, odnosno zeleni trend, u koji se ubraja i koncept zelene ekonomije.
LITERATURA
[1] Ilić B., Stojanović D., Simeonović N.: Trgovina prenosivim dozvolama na berzanskom tržištu u funkciji poboljšanja kvaliteta životne sredine, Časopis Ekonomika Niš, broj 4, 2013, str. 172-185.
[2] Ilić-Popov, G.: Ekološki porezi, Pravni fakultet Univerziteta Beograd, 2000, str. 36.
[3] Katalog otpada Ministarstvo životne sredine i prostorno planiranje, Agen-cija za zaštitu životne sredine Srbije, Beograd, 2010
[4] Magdalinović-Kalinović M.: Magis-tarski rad, Tehnički fakultet Bor, 2010.
[5] Magdalinović - Kalinović M., Magda-linović N., Ekonomski model reciklaže metala. 5. Simpozijum Reciklažne tehnologije i održivi razvoj, Soko Banja, 2010, str. 106-117.
Broj 1, 2014. Mining & Metallurgy Engineering Bor 104
[6] Magdalinović N., Magdalinović-Kali-nović M., Mihajlović D.: An Addition to the Definition of the Sustainable Development Index in the Field of Metal Raw Materials. 3rd Inter. Conf. on Sustainable Development Indica-tors in the Min. Ind., Milos island, Greece, 2007, str. 97-107.
[7] Magdalinović N., Magdalinović - Kali-nović M., Popović G.: Činjenice i prin-cipi na kojima treba zasnivati uprav-ljanje mineralnim resursima metala
3-13. Prvi simpozijum o upravljanju prirodnim resursima, sa međunarod-nim učešćem, Fakultet za mena-džment, Zaječar, 2011, str. 3-15.
[8] Stanić M., Javne mjere i instrumenti u politici zaštite životne sredine, 10. Međunarodni naučni skup Sinergija, Bijeljina, 2012, str. 413-420.
[9] http://home.clara.net/darvill/altenerg/ wave.htm. Izveštaj američkog geolo-škog društva za 2007. god.
No. 1, 2014 Mining & Metallurgy Engineering Bor 105
MINING AND METALLURGY INSTITUTE BOR ISSN: 2334-8836 UDK: 622
UDK: 626.877:662.613:666.952(045)=20 DOI:10.5937/MMEB1401105M
Miomir Mikić*, Ivana Jovanović*, Daniela Urošević*
RECLAMATION OF THE ASH AND SLAG LANDFILL GACKO - B&H**
Abstract
Technological process of coal combustion in thermal power plants produces the certain amounts of ash and slag that have to be transported and disposed at the selected location - landfill. Disposal of ash and slag from the power plant Gacko in Gacko, Bosnia and Herzegovina, was done in the cassette II, formed in the excavation area of the open pit Gračanica. With the need for a new space for disposal of ash and slag, the solution was found in forming the cassette III below the existing cassette II. After com-pletion of exploitation and achieving the designed elevation of 940 meters above the sea level, the rec-lamation is carried out of all cassettes, which permanently eliminate any negative impact of ash from the landfill on the surrounding living space and air.
Key words: reclamation, landfill, ash, slag.
* Mining and Metallurgy Institute Bor ** This work is the results of the Project No. TR33021 “Research and Monitoring the Changes of Stress-
strain State in the Rock Massif „in-situ“ Around the Underground Rooms with Development a Model With a Special Review to the Tunnel of the Krivelj River and Jama Bor“, funded by the Ministry of Education, Science and Technological Development of the Republic of Serbia.
INTRODUCTION
Thermal power plant Gacko since 1995 has made a disposal of ash on the ash land-fill - the first phase, cassette I, in the exca-vated area of the open pit mine Gračanica in a part of exploitation field A. After filling the cassette I, acontinuation of ash and slag disposal was carried out in a continuation of cassette II, in the excavation area of the open pit Gračanica, which was formed in a con-tinuation of cassette I. After many-year dis-posal of ash and slag in cassette II, there was a reduction of landfill area and it was neces-sary to provide a new area for disposal of
ash and slag, and thus to ensure a continuous operation of power plant Gacko. Andequate solution was found in formation of landfill in cassette III, in the excavation area of the open pit Gračanica. Cassette III is formed in a continuation of cassette II to the southern final slope of the open pit (Figure 1). Loca-tion of the landfill of ash and slag in cassette III was selected as the best techno-economic solution for disposal of ash and slag from the power plant Gacko with respect to the loca-tion of the settlement Gacko, developed infrastructure, availability of space, etc.
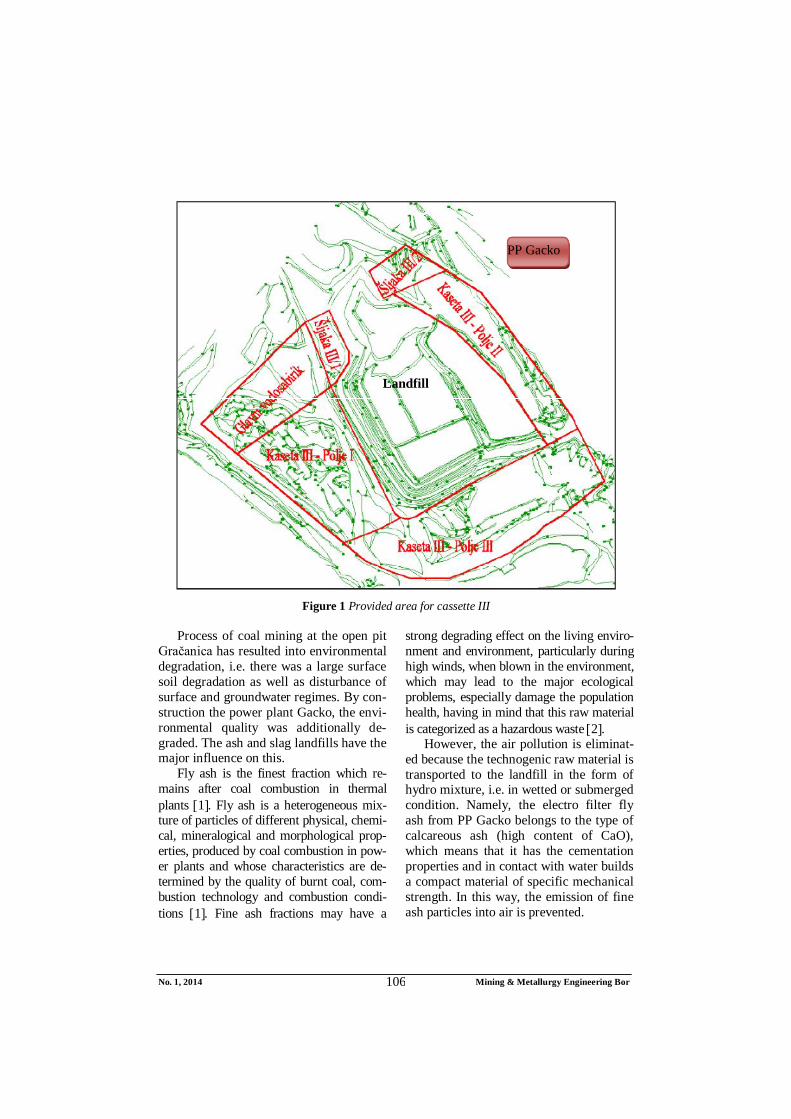
No. 1, 2014 Mining & Metallurgy Engineering Bor 106
Figure 1 Provided area for cassette III
Process of coal mining at the open pit
Gračanica has resulted into environmental degradation, i.e. there was a large surface soil degradation as well as disturbance of surface and groundwater regimes. By con-struction the power plant Gacko, the envi-ronmental quality was additionally de-graded. The ash and slag landfills have the major influence on this.
Fly ash is the finest fraction which re-mains after coal combustion in thermal plants 1. Fly ash is a heterogeneous mix-ture of particles of different physical, chemi-cal, mineralogical and morphological prop-erties, produced by coal combustion in pow-er plants and whose characteristics are de-termined by the quality of burnt coal, com-bustion technology and combustion condi-tions 1. Fine ash fractions may have a
strong degrading effect on the living enviro-nment and environment, particularly during high winds, when blown in the environment, which may lead to the major ecological problems, especially damage the population health, having in mind that this raw material is categorized as a hazardous waste 2.
However, the air pollution is eliminat-ed because the technogenic raw material is transported to the landfill in the form of hydro mixture, i.e. in wetted or submerged condition. Namely, the electro filter fly ash from PP Gacko belongs to the type of calcareous ash (high content of CaO), which means that it has the cementation properties and in contact with water builds a compact material of specific mechanical strength. In this way, the emission of fine ash particles into air is prevented.
PP Gacko
Landfill
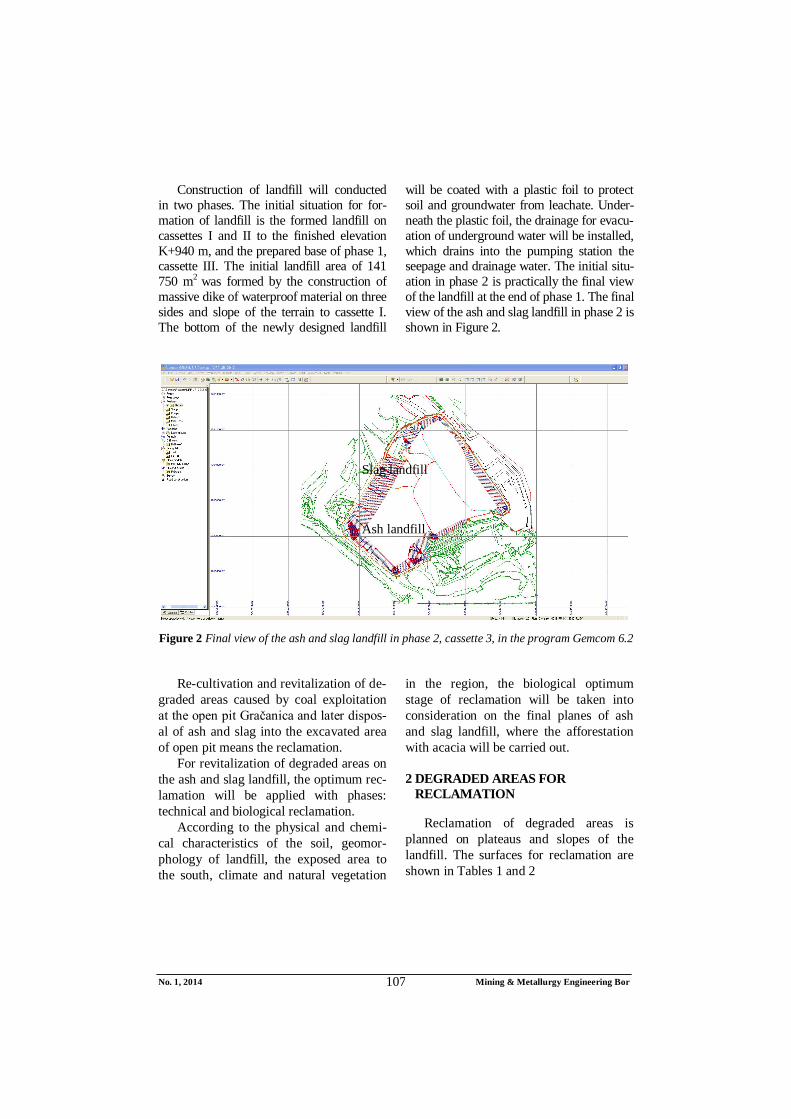
No. 1, 2014 Mining & Metallurgy Engineering Bor 107
Construction of landfill will conducted in two phases. The initial situation for for-mation of landfill is the formed landfill on cassettes I and II to the finished elevation K+940 m, and the prepared base of phase 1, cassette III. The initial landfill area of 141 750 m2 was formed by the construction of massive dike of waterproof material on three sides and slope of the terrain to cassette I. The bottom of the newly designed landfill
will be coated with a plastic foil to protect soil and groundwater from leachate. Under-neath the plastic foil, the drainage for evacu-ation of underground water will be installed, which drains into the pumping station the seepage and drainage water. The initial situ-ation in phase 2 is practically the final view of the landfill at the end of phase 1. The final view of the ash and slag landfill in phase 2 is shown in Figure 2.
Figure 2 Final view of the ash and slag landfill in phase 2, cassette 3, in the program Gemcom 6.2
Re-cultivation and revitalization of de-
graded areas caused by coal exploitation at the open pit Gračanica and later dispos-al of ash and slag into the excavated area of open pit means the reclamation.
For revitalization of degraded areas on the ash and slag landfill, the optimum rec-lamation will be applied with phases: technical and biological reclamation.
According to the physical and chemi-cal characteristics of the soil, geomor-phology of landfill, the exposed area to the south, climate and natural vegetation
in the region, the biological optimum stage of reclamation will be taken into consideration on the final planes of ash and slag landfill, where the afforestation with acacia will be carried out.
2 DEGRADED AREAS FOR RECLAMATION
Reclamation of degraded areas is planned on plateaus and slopes of the landfill. The surfaces for reclamation are shown in Tables 1 and 2
Slag landfill
Ash landfill
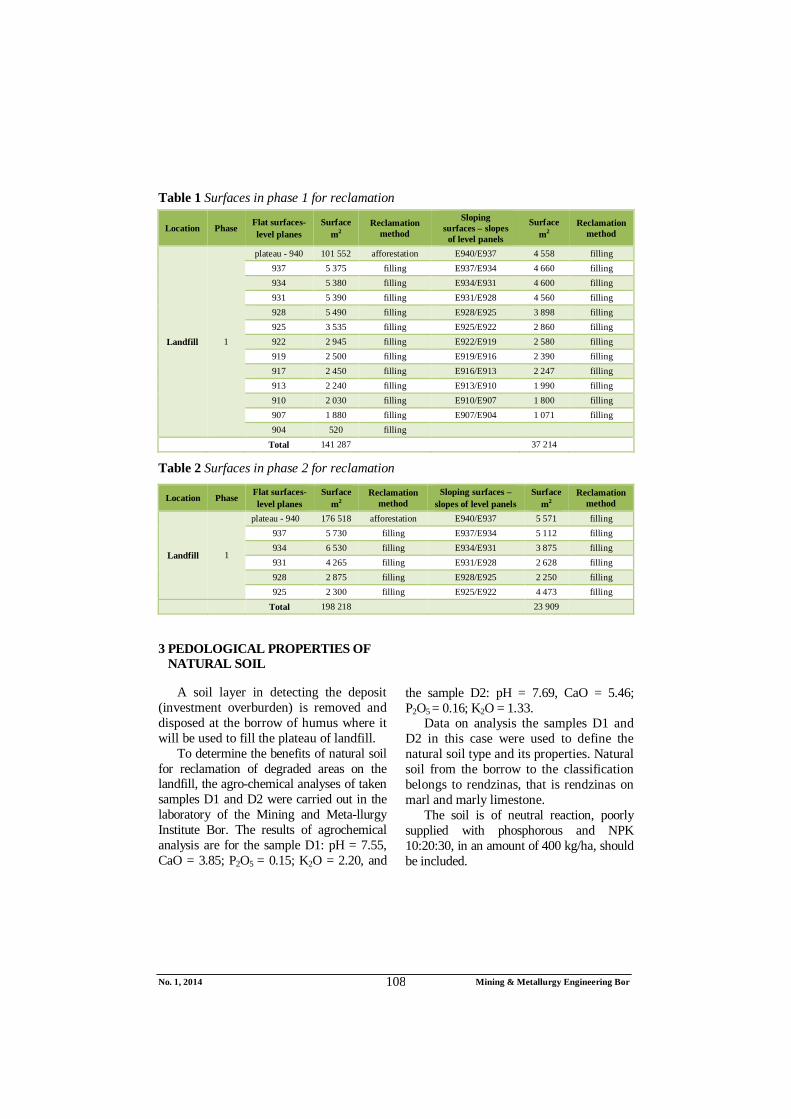
No. 1, 2014 Mining & Metallurgy Engineering Bor 108
Table 1 Surfaces in phase 1 for reclamation
Location Phase Flat surfaces- level planes
Surface m2
Reclamation method
Sloping surfaces – slopes
of level panels
Surface m2
Reclamation method
Landfill 1
plateau - 940 101 552 afforestation E940/E937 4 558 filling 937 5 375 filling E937/E934 4 660 filling 934 5 380 filling E934/E931 4 600 filling 931 5 390 filling E931/E928 4 560 filling 928 5 490 filling E928/E925 3 898 filling 925 3 535 filling E925/E922 2 860 filling 922 2 945 filling E922/E919 2 580 filling 919 2 500 filling E919/E916 2 390 filling 917 2 450 filling E916/E913 2 247 filling 913 2 240 filling E913/E910 1 990 filling 910 2 030 filling E910/E907 1 800 filling 907 1 880 filling E907/E904 1 071 filling 904 520 filling
Total 141 287
37 214
Table 2 Surfaces in phase 2 for reclamation
Location Phase Flat surfaces- level planes
Surface m2
Reclamation method
Sloping surfaces – slopes of level panels
Surface m2
Reclamation method
Landfill 1
plateau - 940 176 518 afforestation E940/E937 5 571 filling 937 5 730 filling E937/E934 5 112 filling 934 6 530 filling E934/E931 3 875 filling 931 4 265 filling E931/E928 2 628 filling 928 2 875 filling E928/E925 2 250 filling 925 2 300 filling E925/E922 4 473 filling
Total 198 218
23 909
3 PEDOLOGICAL PROPERTIES OF NATURAL SOIL
A soil layer in detecting the deposit (investment overburden) is removed and disposed at the borrow of humus where it will be used to fill the plateau of landfill.
To determine the benefits of natural soil for reclamation of degraded areas on the landfill, the agro-chemical analyses of taken samples D1 and D2 were carried out in the laboratory of the Mining and Meta-llurgy Institute Bor. The results of agrochemical analysis are for the sample D1: pH = 7.55, CaO = 3.85; P2O5 = 0.15; K2O = 2.20, and
the sample D2: pH = 7.69, CaO = 5.46; P2O5 = 0.16; K2O = 1.33.
Data on analysis the samples D1 and D2 in this case were used to define the natural soil type and its properties. Natural soil from the borrow to the classification belongs to rendzinas, that is rendzinas on marl and marly limestone.
The soil is of neutral reaction, poorly supplied with phosphorous and NPK 10:20:30, in an amount of 400 kg/ha, should be included.
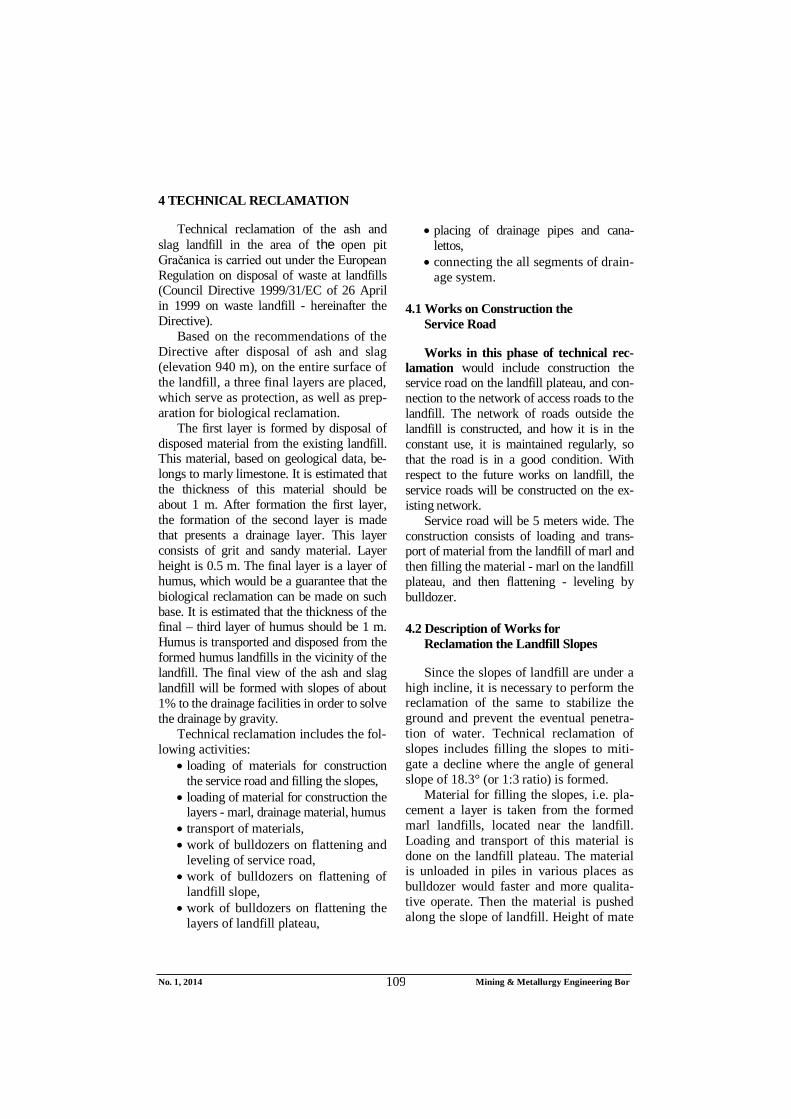
No. 1, 2014 Mining & Metallurgy Engineering Bor 109
4 TECHNICAL RECLAMATION
Technical reclamation of the ash and slag landfill in the area of the open pit Gračanica is carried out under the European Regulation on disposal of waste at landfills (Council Directive 1999/31/EC of 26 April in 1999 on waste landfill - hereinafter the Directive).
Based on the recommendations of the Directive after disposal of ash and slag (elevation 940 m), on the entire surface of the landfill, a three final layers are placed, which serve as protection, as well as prep-aration for biological reclamation.
The first layer is formed by disposal of disposed material from the existing landfill. This material, based on geological data, be-longs to marly limestone. It is estimated that the thickness of this material should be about 1 m. After formation the first layer, the formation of the second layer is made that presents a drainage layer. This layer consists of grit and sandy material. Layer height is 0.5 m. The final layer is a layer of humus, which would be a guarantee that the biological reclamation can be made on such base. It is estimated that the thickness of the final – third layer of humus should be 1 m. Humus is transported and disposed from the formed humus landfills in the vicinity of the landfill. The final view of the ash and slag landfill will be formed with slopes of about 1% to the drainage facilities in order to solve the drainage by gravity.
Technical reclamation includes the fol-lowing activities:
loading of materials for construction the service road and filling the slopes,
loading of material for construction the layers - marl, drainage material, humus
transport of materials, work of bulldozers on flattening and
leveling of service road, work of bulldozers on flattening of
landfill slope, work of bulldozers on flattening the
layers of landfill plateau,
placing of drainage pipes and cana-
lettos, connecting the all segments of drain-
age system.
4.1 Works on Construction the Service Road
Works in this phase of technical rec-lamation would include construction the service road on the landfill plateau, and con-nection to the network of access roads to the landfill. The network of roads outside the landfill is constructed, and how it is in the constant use, it is maintained regularly, so that the road is in a good condition. With respect to the future works on landfill, the service roads will be constructed on the ex-isting network.
Service road will be 5 meters wide. The construction consists of loading and trans-port of material from the landfill of marl and then filling the material - marl on the landfill plateau, and then flattening - leveling by bulldozer.
4.2 Description of Works for Reclamation the Landfill Slopes
Since the slopes of landfill are under a high incline, it is necessary to perform the reclamation of the same to stabilize the ground and prevent the eventual penetra-tion of water. Technical reclamation of slopes includes filling the slopes to miti-gate a decline where the angle of general slope of 18.3° (or 1:3 ratio) is formed.
Material for filling the slopes, i.e. pla-cement a layer is taken from the formed marl landfills, located near the landfill. Loading and transport of this material is done on the landfill plateau. The material is unloaded in piles in various places as bulldozer would faster and more qualita-tive operate. Then the material is pushed along the slope of landfill. Height of mate
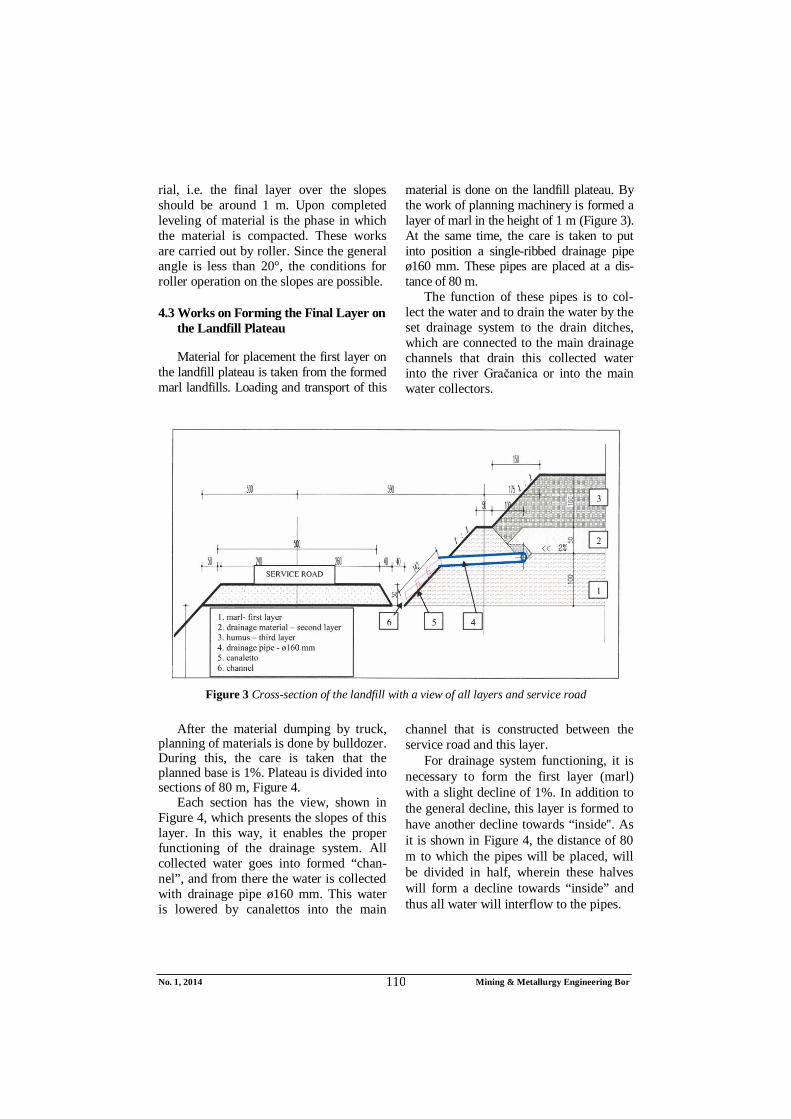
No. 1, 2014 Mining & Metallurgy Engineering Bor 110
rial, i.e. the final layer over the slopes should be around 1 m. Upon completed leveling of material is the phase in which the material is compacted. These works are carried out by roller. Since the general angle is less than 20°, the conditions for roller operation on the slopes are possible.
4.3 Works on Forming the Final Layer on the Landfill Plateau
Material for placement the first layer on the landfill plateau is taken from the formed marl landfills. Loading and transport of this
material is done on the landfill plateau. By the work of planning machinery is formed a layer of marl in the height of 1 m (Figure 3). At the same time, the care is taken to put into position a single-ribbed drainage pipe ø160 mm. These pipes are placed at a dis-tance of 80 m.
The function of these pipes is to col-lect the water and to drain the water by the set drainage system to the drain ditches, which are connected to the main drainage channels that drain this collected water into the river Gračanica or into the main water collectors.
Figure 3 Cross-section of the landfill with a view of all layers and service road
After the material dumping by truck,
planning of materials is done by bulldozer. During this, the care is taken that the planned base is 1%. Plateau is divided into sections of 80 m, Figure 4.
Each section has the view, shown in Figure 4, which presents the slopes of this layer. In this way, it enables the proper functioning of the drainage system. All collected water goes into formed “chan-nel”, and from there the water is collected with drainage pipe ø160 mm. This water is lowered by canalettos into the main
channel that is constructed between the service road and this layer.
For drainage system functioning, it is necessary to form the first layer (marl) with a slight decline of 1%. In addition to the general decline, this layer is formed to have another decline towards “inside''. As it is shown in Figure 4, the distance of 80 m to which the pipes will be placed, will be divided in half, wherein these halves will form a decline towards “inside” and thus all water will interflow to the pipes.
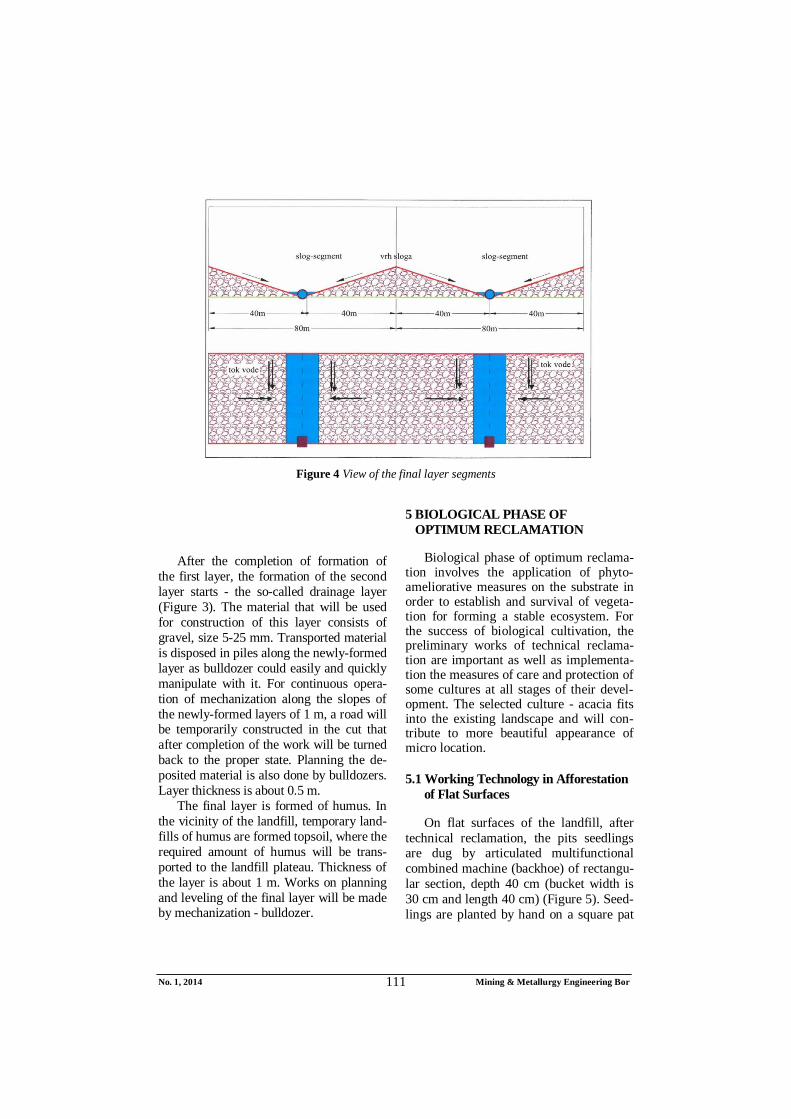
No. 1, 2014 Mining & Metallurgy Engineering Bor 111
Figure 4 View of the final layer segments
After the completion of formation of
the first layer, the formation of the second layer starts - the so-called drainage layer (Figure 3). The material that will be used for construction of this layer consists of gravel, size 5-25 mm. Transported material is disposed in piles along the newly-formed layer as bulldozer could easily and quickly manipulate with it. For continuous opera-tion of mechanization along the slopes of the newly-formed layers of 1 m, a road will be temporarily constructed in the cut that after completion of the work will be turned back to the proper state. Planning the de-posited material is also done by bulldozers. Layer thickness is about 0.5 m.
The final layer is formed of humus. In the vicinity of the landfill, temporary land-fills of humus are formed topsoil, where the required amount of humus will be trans-ported to the landfill plateau. Thickness of the layer is about 1 m. Works on planning and leveling of the final layer will be made by mechanization - bulldozer.
5 BIOLOGICAL PHASE OF OPTIMUM RECLAMATION
Biological phase of optimum reclama-tion involves the application of phyto-ameliorative measures on the substrate in order to establish and survival of vegeta-tion for forming a stable ecosystem. For the success of biological cultivation, the preliminary works of technical reclama-tion are important as well as implementa-tion the measures of care and protection of some cultures at all stages of their devel-opment. The selected culture - acacia fits into the existing landscape and will con-tribute to more beautiful appearance of micro location.
5.1 Working Technology in Afforestation of Flat Surfaces
On flat surfaces of the landfill, after technical reclamation, the pits seedlings are dug by articulated multifunctional combined machine (backhoe) of rectangu-lar section, depth 40 cm (bucket width is 30 cm and length 40 cm) (Figure 5). Seed-lings are planted by hand on a square pat
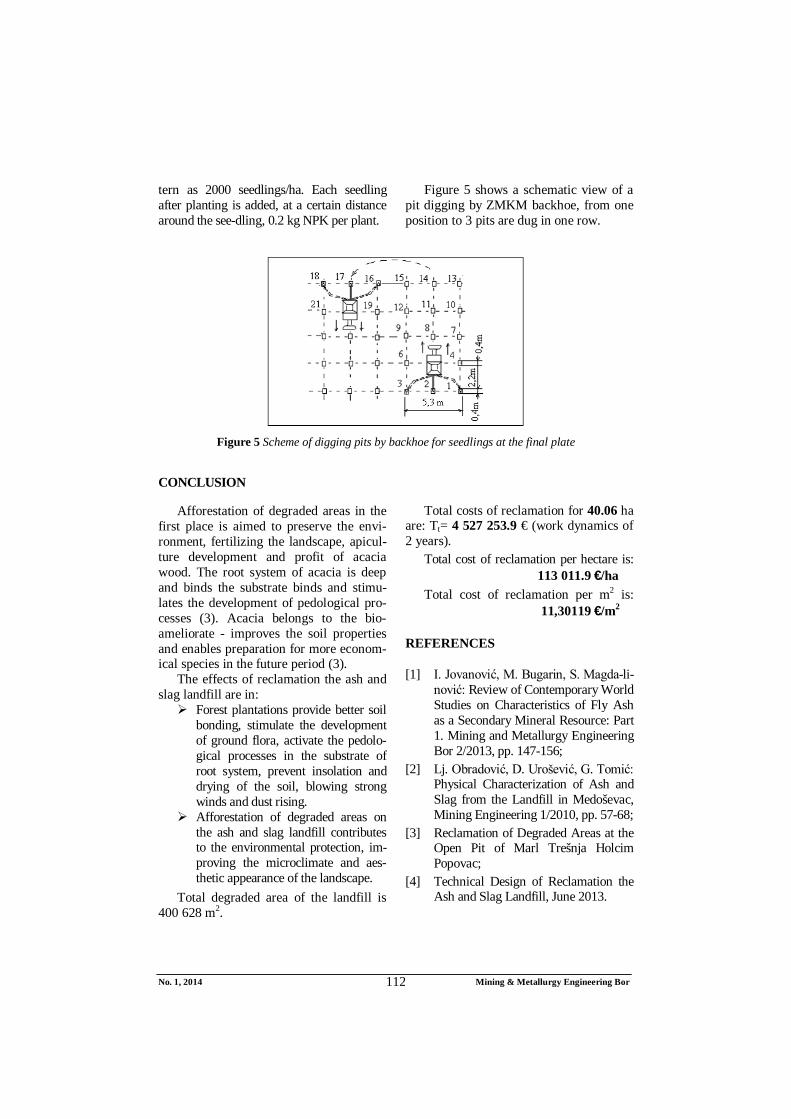
No. 1, 2014 Mining & Metallurgy Engineering Bor 112
tern as 2000 seedlings/ha. Each seedling after planting is added, at a certain distance around the see-dling, 0.2 kg NPK per plant.
Figure 5 shows a schematic view of a pit digging by ZMKM backhoe, from one position to 3 pits are dug in one row.
Figure 5 Scheme of digging pits by backhoe for seedlings at the final plate
CONCLUSION
Afforestation of degraded areas in the first place is aimed to preserve the envi-ronment, fertilizing the landscape, apicul-ture development and profit of acacia wood. The root system of acacia is deep and binds the substrate binds and stimu-lates the development of pedological pro-cesses (3). Acacia belongs to the bio-ameliorate - improves the soil properties and enables preparation for more econom-ical species in the future period (3).
The effects of reclamation the ash and slag landfill are in: Forest plantations provide better soil
bonding, stimulate the development of ground flora, activate the pedolo-gical processes in the substrate of root system, prevent insolation and drying of the soil, blowing strong winds and dust rising.
Afforestation of degraded areas on the ash and slag landfill contributes to the environmental protection, im-proving the microclimate and aes-thetic appearance of the landscape.
Total degraded area of the landfill is 400 628 m2.
Total costs of reclamation for 40.06 ha
are: Tt= 4 527 253.9 € (work dynamics of 2 years).
Total cost of reclamation per hectare is: 113 011.9 €/ha
Total cost of reclamation per m2 is: 11,30119 €/m2
REFERENCES
[1] I. Jovanović, M. Bugarin, S. Magda-li-nović: Review of Contemporary World Studies on Characteristics of Fly Ash as a Secondary Mineral Resource: Part 1. Mining and Metallurgy Engineering Bor 2/2013, pp. 147-156;
[2] Lj. Obradović, D. Urošević, G. Tomić: Physical Characterization of Ash and Slag from the Landfill in Medoševac, Mining Engineering 1/2010, pp. 57-68;
[3] Reclamation of Degraded Areas at the Open Pit of Marl Trešnja Holcim Popovac;
[4] Technical Design of Reclamation the Ash and Slag Landfill, June 2013.
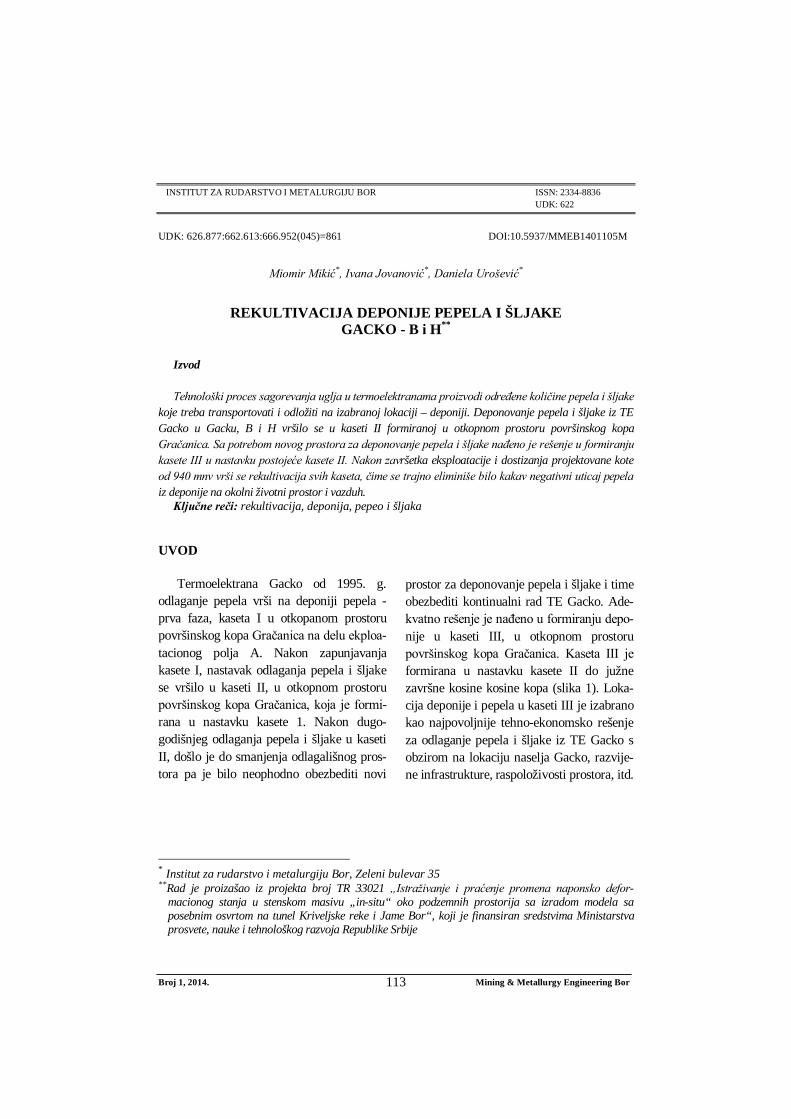
Broj 1, 2014. Mining & Metallurgy Engineering Bor 113
INSTITUT ZA RUDARSTVO I METALURGIJU BOR ISSN: 2334-8836 UDK: 622
UDK: 626.877:662.613:666.952(045)=861 DOI:10.5937/MMEB1401105M
Miomir Mikić*, Ivana Jovanović*, Daniela Urošević*
REKULTIVACIJA DEPONIJE PEPELA I ŠLJAKE GACKO - B i H**
Izvod
Tehnološki proces sagorevanja uglja u termoelektranama proizvodi određene količine pepela i šljake koje treba transportovati i odložiti na izabranoj lokaciji – deponiji. Deponovanje pepela i šljake iz TE Gacko u Gacku, B i H vršilo se u kaseti II formiranoj u otkopnom prostoru površinskog kopa Gračanica. Sa potrebom novog prostora za deponovanje pepela i šljake nađeno je rešenje u formiranju kasete III u nastavku postojeće kasete II. Nakon završetka eksploatacije i dostizanja projektovane kote od 940 mnv vrši se rekultivacija svih kaseta, čime se trajno eliminiše bilo kakav negativni uticaj pepela iz deponije na okolni životni prostor i vazduh.
Ključne reči: rekultivacija, deponija, pepeo i šljaka
* Institut za rudarstvo i metalurgiju Bor, Zeleni bulevar 35 **Rad je proizašao iz projekta broj TR 33021 „Istraživanje i praćenje promena naponsko defor-
macionog stanja u stenskom masivu „in-situ“ oko podzemnih prostorija sa izradom modela sa posebnim osvrtom na tunel Kriveljske reke i Jame Bor“, koji je finansiran sredstvima Ministarstva prosvete, nauke i tehnološkog razvoja Republike Srbije
UVOD
Termoelektrana Gacko od 1995. g. odlaganje pepela vrši na deponiji pepela - prva faza, kaseta I u otkopanom prostoru površinskog kopa Gračanica na delu ekploa-tacionog polja A. Nakon zapunjavanja kasete I, nastavak odlaganja pepela i šljake se vršilo u kaseti II, u otkopnom prostoru površinskog kopa Gračanica, koja je formi-rana u nastavku kasete 1. Nakon dugo-godišnjeg odlaganja pepela i šljake u kaseti II, došlo je do smanjenja odlagališnog pros-tora pa je bilo neophodno obezbediti novi
prostor za deponovanje pepela i šljake i time obezbediti kontinualni rad TE Gacko. Ade-kvatno rešenje je nađeno u formiranju depo-nije u kaseti III, u otkopnom prostoru površinskog kopa Gračanica. Kaseta III je formirana u nastavku kasete II do južne završne kosine kosine kopa (slika 1). Loka-cija deponije i pepela u kaseti III je izabrano kao najpovoljnije tehno-ekonomsko rešenje za odlaganje pepela i šljake iz TE Gacko s obzirom na lokaciju naselja Gacko, razvije-ne infrastrukture, raspoloživosti prostora, itd.
Broj 1, 2014. Mining & Metallurgy Engineering Bor 114
Sl. 1. Prostor predviđen za kasetu III
Procesom eksploatacije uglja na povr-
šinskom kopu Gračanica došlo je do narušavanja životne sredine tj. došlo je do degradiranja velikih povšina zemljišta kao i poremećaja režima površinskih i podzemnih voda. Izgradnjom termoelektrane TE Gacko kvalitet životne sredine se još više naru-šavao. Veliki uticaj na to su imale deponije pepela i šljake.
Leteći pepeo predstavlja najfiniju frakciju koja zaostaje nakon sagorevanja uglja u termalnim postrojenjima. 1. Leteći pepeo je heterogena mešavina čestica različitih fizičkih, hemijskih, mineroloških i morfoloških osobina, koja nastaje sagore-vanjem uglja u termoelektranama i čije su karakteristike određene kvalitetom izgorelog uglja, tehnologijom sagorevanja i uslovima sagorevanja. 1. Fine frakcije pepela mogu imati jak degradirajući uticaj na životnu
sredinu i okolinu, posebno u periodu jakih vetrova, kada se raznose po okolini, što može dovesti do velikih ekoloških problema, a pre svega narušavanja zdravlja stanov-ništva, imajući u vidu da je ova sirovina kategorisana kao opasan otpad. 2
Međutim, aerozagađenje je eliminisano jer se tehnogena sirovina transportuje na deponiju u vidu hidromešavine tj. u okva-šenom, odnosno potopljenom stanju. Naime, elektrofilterski pepeo iz TE Gacko pripada tipu karbonatnih pepela (visok sadržaj CaO), što znači da poseduje cementaciona svojstva i u kontaktu sa vodom gradi kompaktan materijal određene mehaničke čvrstoće. Na taj način sprečena je emisija finih čestica pepela u vazduh.
Izrada deponije će se odvijati u dve faze. Početna situacija za formiranje deponije je formirana deponija na kasetama I i II do
TE Gacko
Deponija
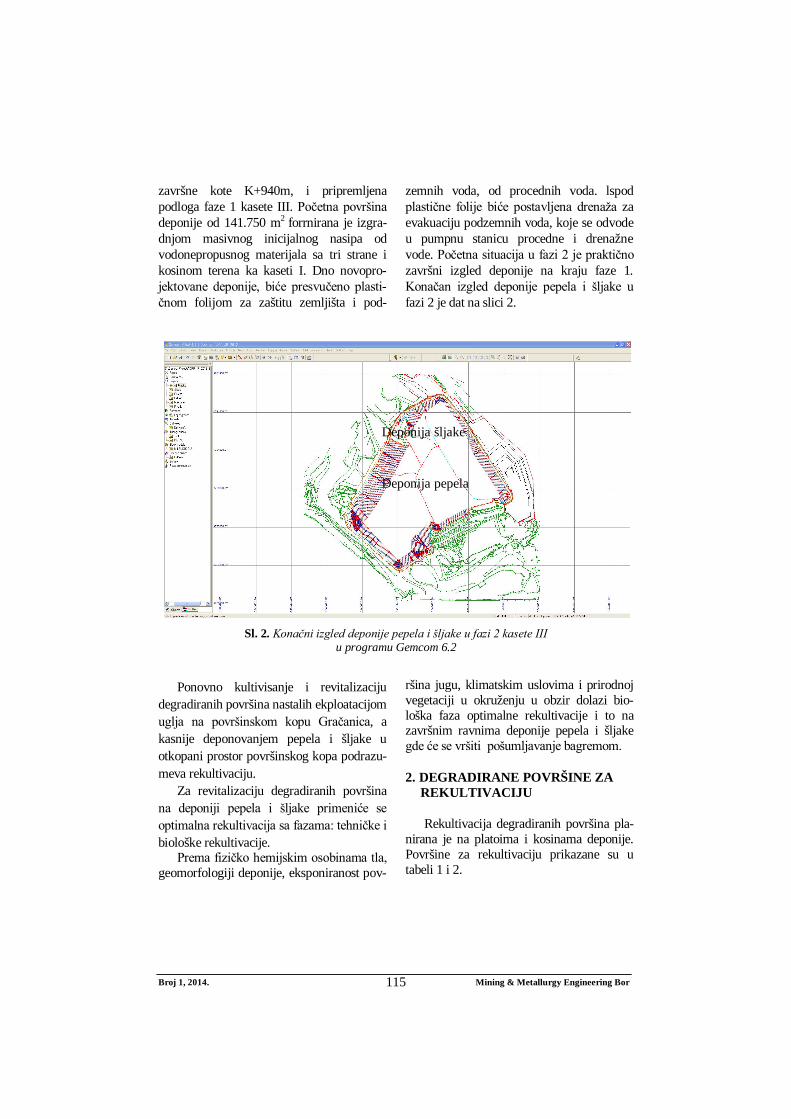
Broj 1, 2014. Mining & Metallurgy Engineering Bor 115
završne kote K+940m, i pripremljena podloga faze 1 kasete III. Početna površina deponije od 141.750 m2 forrnirana je izgra-dnjom masivnog inicijalnog nasipa od vodonepropusnog materijala sa tri strane i kosinom terena ka kaseti I. Dno novopro-jektovane deponije, biće presvučeno plasti-čnom folijom za zaštitu zemljišta i pod-
zemnih voda, od procednih voda. lspod plastične folije biće postavljena drenaža za evakuaciju podzemnih voda, koje se odvode u pumpnu stanicu procedne i drenažne vode. Početna situacija u fazi 2 je praktično završni izgled deponije na kraju faze 1. Konačan izgled deponije pepela i šljake u fazi 2 je dat na slici 2.
Sl. 2. Konačni izgled deponije pepela i šljake u fazi 2 kasete III
u programu Gemcom 6.2
Ponovno kultivisanje i revitalizaciju
degradiranih površina nastalih ekploatacijom uglja na površinskom kopu Gračanica, a kasnije deponovanjem pepela i šljake u otkopani prostor površinskog kopa podrazu-meva rekultivaciju.
Za revitalizaciju degradiranih površina na deponiji pepela i šljake primeniće se optimalna rekultivacija sa fazama: tehničke i biološke rekultivacije.
Prema fizičko hemijskim osobinama tla, geomorfologiji deponije, eksponiranost pov-
ršina jugu, klimatskim uslovima i prirodnoj vegetaciji u okruženju u obzir dolazi bio-loška faza optimalne rekultivacije i to na završnim ravnima deponije pepela i šljake gde će se vršiti pošumljavanje bagremom.
2. DEGRADIRANE POVRŠINE ZA REKULTIVACIJU
Rekultivacija degradiranih površina pla-nirana je na platoima i kosinama deponije. Površine za rekultivaciju prikazane su u tabeli 1 i 2.
Deponija šljake
Deponija pepela
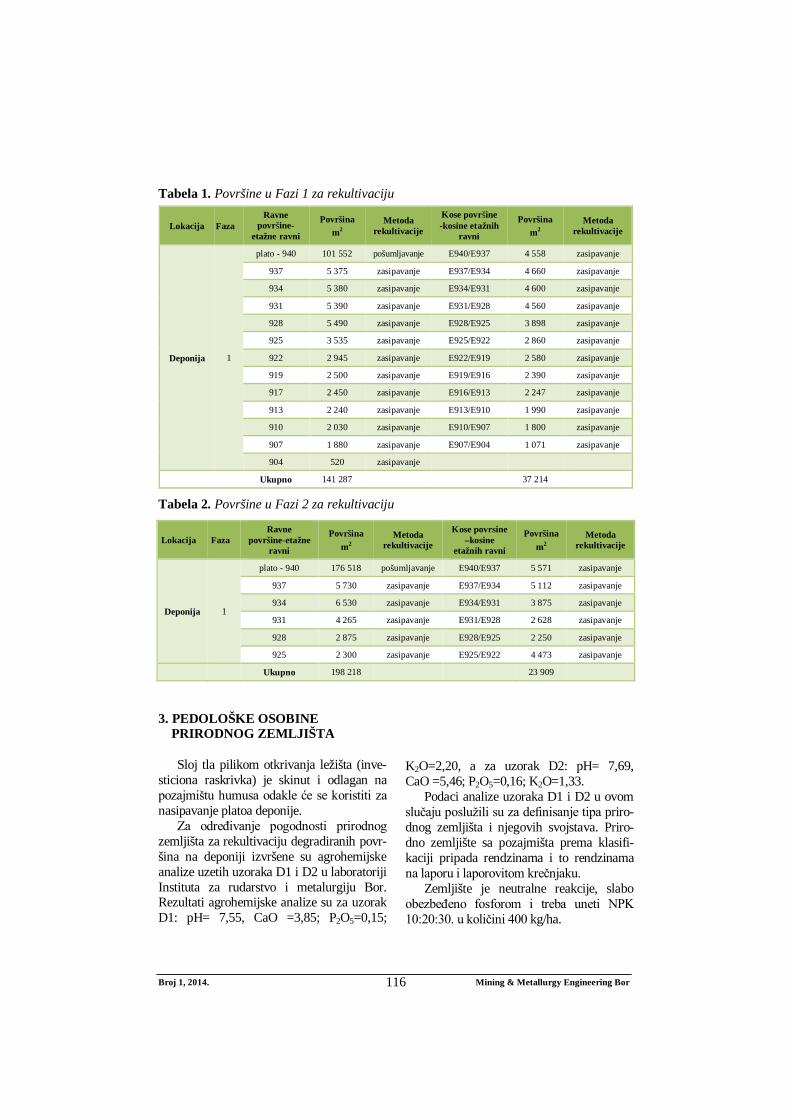
Broj 1, 2014. Mining & Metallurgy Engineering Bor 116
Tabela 1. Površine u Fazi 1 za rekultivaciju
Lokacija Faza Ravne
površine-etažne ravni
Površina m2
Metoda rekultivacije
Kose površine -kosine etažnih
ravni
Površina m2
Metoda rekultivacije
Deponija 1
plato - 940 101 552 pošumljavanje E940/E937 4 558 zasipavanje
937 5 375 zasipavanje E937/E934 4 660 zasipavanje
934 5 380 zasipavanje E934/E931 4 600 zasipavanje
931 5 390 zasipavanje E931/E928 4 560 zasipavanje
928 5 490 zasipavanje E928/E925 3 898 zasipavanje
925 3 535 zasipavanje E925/E922 2 860 zasipavanje
922 2 945 zasipavanje E922/E919 2 580 zasipavanje
919 2 500 zasipavanje E919/E916 2 390 zasipavanje
917 2 450 zasipavanje E916/E913 2 247 zasipavanje
913 2 240 zasipavanje E913/E910 1 990 zasipavanje
910 2 030 zasipavanje E910/E907 1 800 zasipavanje
907 1 880 zasipavanje E907/E904 1 071 zasipavanje
904 520 zasipavanje
Ukupno 141 287
37 214
Tabela 2. Površine u Fazi 2 za rekultivaciju
Lokacija Faza Ravne
površine-etažne ravni
Površina m2
Metoda rekultivacije
Kose povrsine –kosine
etažnih ravni
Površina m2
Metoda rekultivacije
Deponija 1
plato - 940 176 518 pošumljavanje E940/E937 5 571 zasipavanje
937 5 730 zasipavanje E937/E934 5 112 zasipavanje
934 6 530 zasipavanje E934/E931 3 875 zasipavanje
931 4 265 zasipavanje E931/E928 2 628 zasipavanje
928 2 875 zasipavanje E928/E925 2 250 zasipavanje
925 2 300 zasipavanje E925/E922 4 473 zasipavanje
Ukupno 198 218
23 909
3. PEDOLOŠKE OSOBINE PRIRODNOG ZEMLJIŠTA
Sloj tla pilikom otkrivanja ležišta (inve-sticiona raskrivka) je skinut i odlagan na pozajmištu humusa odakle će se koristiti za nasipavanje platoa deponije.
Za određivanje pogodnosti prirodnog zemljišta za rekultivaciju degradiranih povr-šina na deponiji izvršene su agrohemijske analize uzetih uzoraka D1 i D2 u laboratoriji Instituta za rudarstvo i metalurgiju Bor. Rezultati agrohemijske analize su za uzorak D1: pH= 7,55, CaO =3,85; P2O5=0,15;
K2O=2,20, a za uzorak D2: pH= 7,69, CaO =5,46; P2O5=0,16; K2O=1,33.
Podaci analize uzoraka D1 i D2 u ovom slučaju poslužili su za definisanje tipa priro-dnog zemljišta i njegovih svojstava. Priro-dno zemljište sa pozajmišta prema klasifi-kaciji pripada rendzinama i to rendzinama na laporu i laporovitom krečnjaku.
Zemljište je neutralne reakcije, slabo obezbeđeno fosforom i treba uneti NPK 10:20:30. u količini 400 kg/ha.
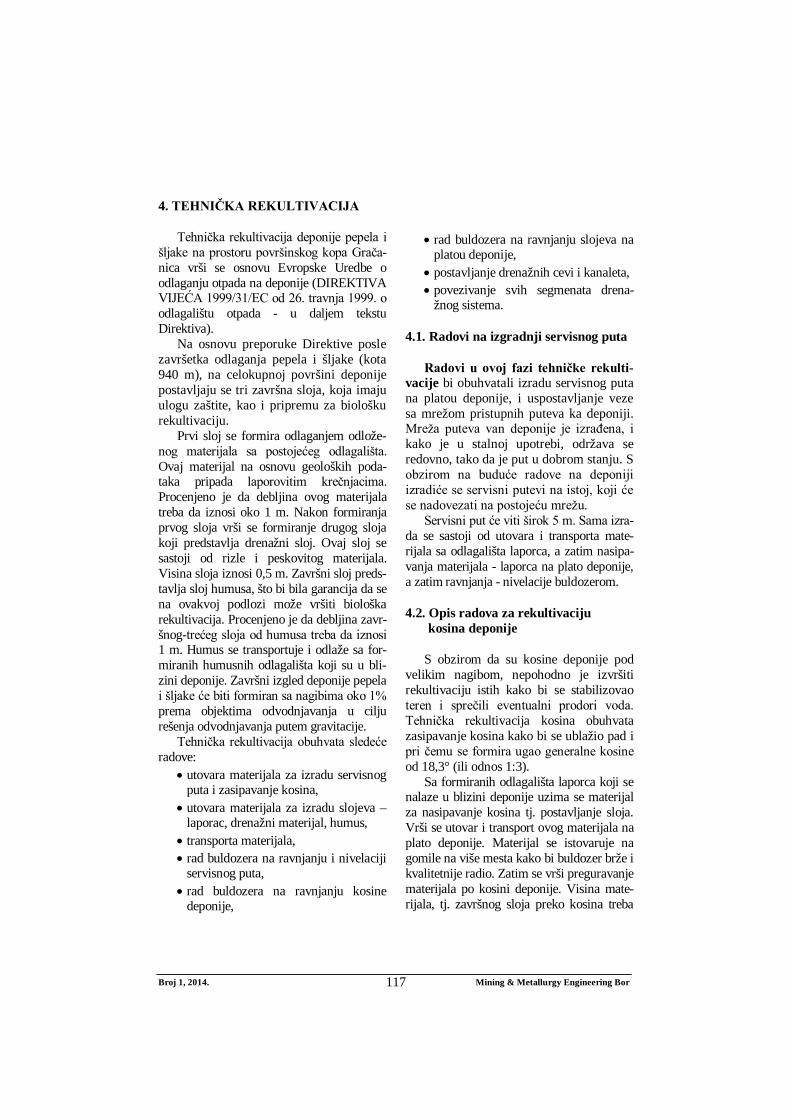
Broj 1, 2014. Mining & Metallurgy Engineering Bor 117
4. TEHNIČKA REKULTIVACIJA
Tehnička rekultivacija deponije pepela i šljake na prostoru površinskog kopa Grača-nica vrši se osnovu Evropske Uredbe o odlaganju otpada na deponije (DIREKTIVA VIJEĆA 1999/31/EC od 26. travnja 1999. o odlagalištu otpada - u daljem tekstu Direktiva).
Na osnovu preporuke Direktive posle završetka odlaganja pepela i šljake (kota 940 m), na celokupnoj površini deponije postavljaju se tri završna sloja, koja imaju ulogu zaštite, kao i pripremu za biološku rekultivaciju.
Prvi sloj se formira odlaganjem odlože-nog materijala sa postojećeg odlagališta. Ovaj materijal na osnovu geoloških poda-taka pripada laporovitim krečnjacima. Procenjeno je da debljina ovog materijala treba da iznosi oko 1 m. Nakon formiranja prvog sloja vrši se formiranje drugog sloja koji predstavlja drenažni sloj. Ovaj sloj se sastoji od rizle i peskovitog materijala. Visina sloja iznosi 0,5 m. Završni sloj preds-tavlja sloj humusa, što bi bila garancija da se na ovakvoj podlozi može vršiti biološka rekultivacija. Procenjeno je da debljina zavr-šnog-trećeg sloja od humusa treba da iznosi 1 m. Humus se transportuje i odlaže sa for-miranih humusnih odlagališta koji su u bli-zini deponije. Završni izgled deponije pepela i šljake će biti formiran sa nagibima oko 1% prema objektima odvodnjavanja u cilju rešenja odvodnjavanja putem gravitacije.
Tehnička rekultivacija obuhvata sledeće radove:
utovara materijala za izradu servisnog puta i zasipavanje kosina,
utovara materijala za izradu slojeva – laporac, drenažni materijal, humus,
transporta materijala, rad buldozera na ravnjanju i nivelaciji
servisnog puta, rad buldozera na ravnjanju kosine
deponije,
rad buldozera na ravnjanju slojeva na
platou deponije, postavljanje drenažnih cevi i kanaleta, povezivanje svih segmenata drena-
žnog sistema.
4.1. Radovi na izgradnji servisnog puta
Radovi u ovoj fazi tehničke rekulti-vacije bi obuhvatali izradu servisnog puta na platou deponije, i uspostavljanje veze sa mrežom pristupnih puteva ka deponiji. Mreža puteva van deponije je izrađena, i kako je u stalnoj upotrebi, održava se redovno, tako da je put u dobrom stanju. S obzirom na buduće radove na deponiji izradiće se servisni putevi na istoj, koji će se nadovezati na postojeću mrežu.
Servisni put će viti širok 5 m. Sama izra-da se sastoji od utovara i transporta mate-rijala sa odlagališta laporca, a zatim nasipa-vanja materijala - laporca na plato deponije, a zatim ravnjanja - nivelacije buldozerom.
4.2. Opis radova za rekultivaciju kosina deponije
S obzirom da su kosine deponije pod velikim nagibom, nepohodno je izvršiti rekultivaciju istih kako bi se stabilizovao teren i sprečili eventualni prodori voda. Tehnička rekultivacija kosina obuhvata zasipavanje kosina kako bi se ublažio pad i pri čemu se formira ugao generalne kosine od 18,3° (ili odnos 1:3).
Sa formiranih odlagališta laporca koji se nalaze u blizini deponije uzima se materijal za nasipavanje kosina tj. postavljanje sloja. Vrši se utovar i transport ovog materijala na plato deponije. Materijal se istovaruje na gomile na više mesta kako bi buldozer brže i kvalitetnije radio. Zatim se vrši preguravanje materijala po kosini deponije. Visina mate-rijala, tj. završnog sloja preko kosina treba
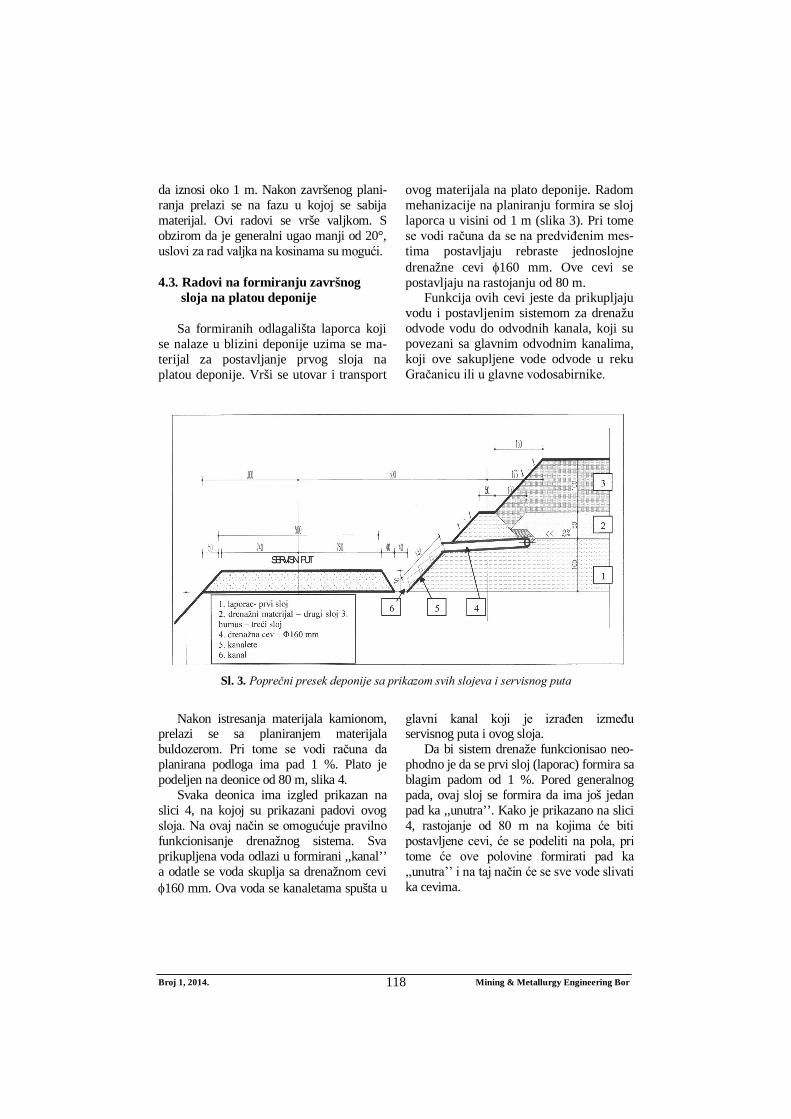
Broj 1, 2014. Mining & Metallurgy Engineering Bor 118
da iznosi oko 1 m. Nakon završenog plani-ranja prelazi se na fazu u kojoj se sabija materijal. Ovi radovi se vrše valjkom. S obzirom da je generalni ugao manji od 20°, uslovi za rad valjka na kosinama su mogući.
4.3. Radovi na formiranju završnog sloja na platou deponije
Sa formiranih odlagališta laporca koji se nalaze u blizini deponije uzima se ma-terijal za postavljanje prvog sloja na platou deponije. Vrši se utovar i transport
ovog materijala na plato deponije. Radom mehanizacije na planiranju formira se sloj laporca u visini od 1 m (slika 3). Pri tome se vodi računa da se na predviđenim mes-tima postavljaju rebraste jednoslojne drenažne cevi 160 mm. Ove cevi se postavljaju na rastojanju od 80 m.
Funkcija ovih cevi jeste da prikupljaju vodu i postavljenim sistemom za drenažu odvode vodu do odvodnih kanala, koji su povezani sa glavnim odvodnim kanalima, koji ove sakupljene vode odvode u reku Gračanicu ili u glavne vodosabirnike.
Sl. 3. Poprečni presek deponije sa prikazom svih slojeva i servisnog puta
Nakon istresanja materijala kamionom,
prelazi se sa planiranjem materijala buldozerom. Pri tome se vodi računa da planirana podloga ima pad 1 %. Plato je podeljen na deonice od 80 m, slika 4.
Svaka deonica ima izgled prikazan na slici 4, na kojoj su prikazani padovi ovog sloja. Na ovaj način se omogućuje pravilno funkcionisanje drenažnog sistema. Sva prikupljena voda odlazi u formirani ,,kanal’’ a odatle se voda skuplja sa drenažnom cevi 160 mm. Ova voda se kanaletama spušta u
glavni kanal koji je izrađen između servisnog puta i ovog sloja.
Da bi sistem drenaže funkcionisao neo-phodno je da se prvi sloj (laporac) formira sa blagim padom od 1 %. Pored generalnog pada, ovaj sloj se formira da ima još jedan pad ka ,,unutra’’. Kako je prikazano na slici 4, rastojanje od 80 m na kojima će biti postavljene cevi, će se podeliti na pola, pri tome će ove polovine formirati pad ka ,,unutra’’ i na taj način će se sve vode slivati ka cevima.
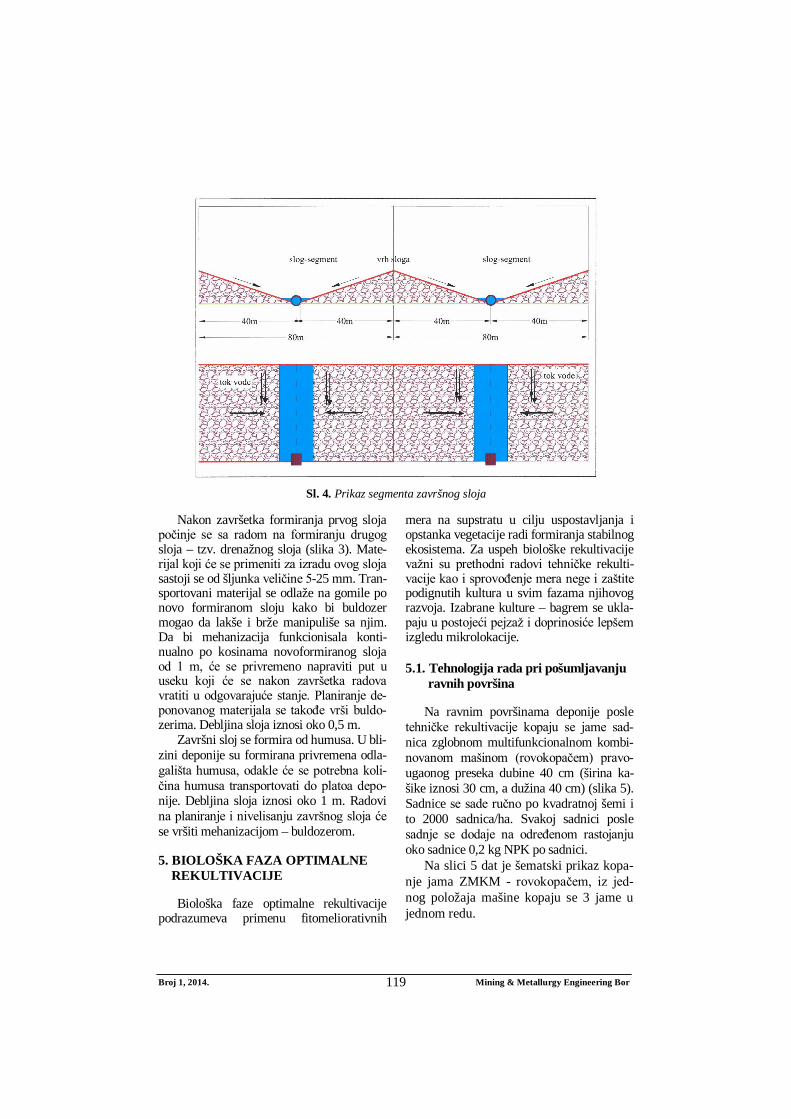
Broj 1, 2014. Mining & Metallurgy Engineering Bor 119
Sl. 4. Prikaz segmenta završnog sloja
Nakon završetka formiranja prvog sloja
počinje se sa radom na formiranju drugog sloja – tzv. drenažnog sloja (slika 3). Mate-rijal koji će se primeniti za izradu ovog sloja sastoji se od šljunka veličine 5-25 mm. Tran-sportovani materijal se odlaže na gomile po novo formiranom sloju kako bi buldozer mogao da lakše i brže manipuliše sa njim. Da bi mehanizacija funkcionisala konti-nualno po kosinama novoformiranog sloja od 1 m, će se privremeno napraviti put u useku koji će se nakon završetka radova vratiti u odgovarajuće stanje. Planiranje de-ponovanog materijala se takođe vrši buldo-zerima. Debljina sloja iznosi oko 0,5 m.
Završni sloj se formira od humusa. U bli-zini deponije su formirana privremena odla-gališta humusa, odakle će se potrebna koli-čina humusa transportovati do platoa depo-nije. Debljina sloja iznosi oko 1 m. Radovi na planiranje i nivelisanju završnog sloja će se vršiti mehanizacijom – buldozerom.
5. BIOLOŠKA FAZA OPTIMALNE REKULTIVACIJE
Biološka faze optimalne rekultivacije podrazumeva primenu fitomeliorativnih
mera na supstratu u cilju uspostavljanja i opstanka vegetacije radi formiranja stabilnog ekosistema. Za uspeh biološke rekultivacije važni su prethodni radovi tehničke rekulti-vacije kao i sprovođenje mera nege i zaštite podignutih kultura u svim fazama njihovog razvoja. Izabrane kulture – bagrem se ukla-paju u postojeći pejzaž i doprinosiće lepšem izgledu mikrolokacije.
5.1. Tehnologija rada pri pošumljavanju ravnih površina
Na ravnim površinama deponije posle tehničke rekultivacije kopaju se jame sad-nica zglobnom multifunkcionalnom kombi-novanom mašinom (rovokopačem) pravo-ugaonog preseka dubine 40 cm (širina ka-šike iznosi 30 cm, a dužina 40 cm) (slika 5). Sadnice se sade ručno po kvadratnoj šemi i to 2000 sadnica/ha. Svakoj sadnici posle sadnje se dodaje na određenom rastojanju oko sadnice 0,2 kg NPK po sadnici.
Na slici 5 dat je šematski prikaz kopa-nje jama ZMKM - rovokopačem, iz jed-nog položaja mašine kopaju se 3 jame u jednom redu.
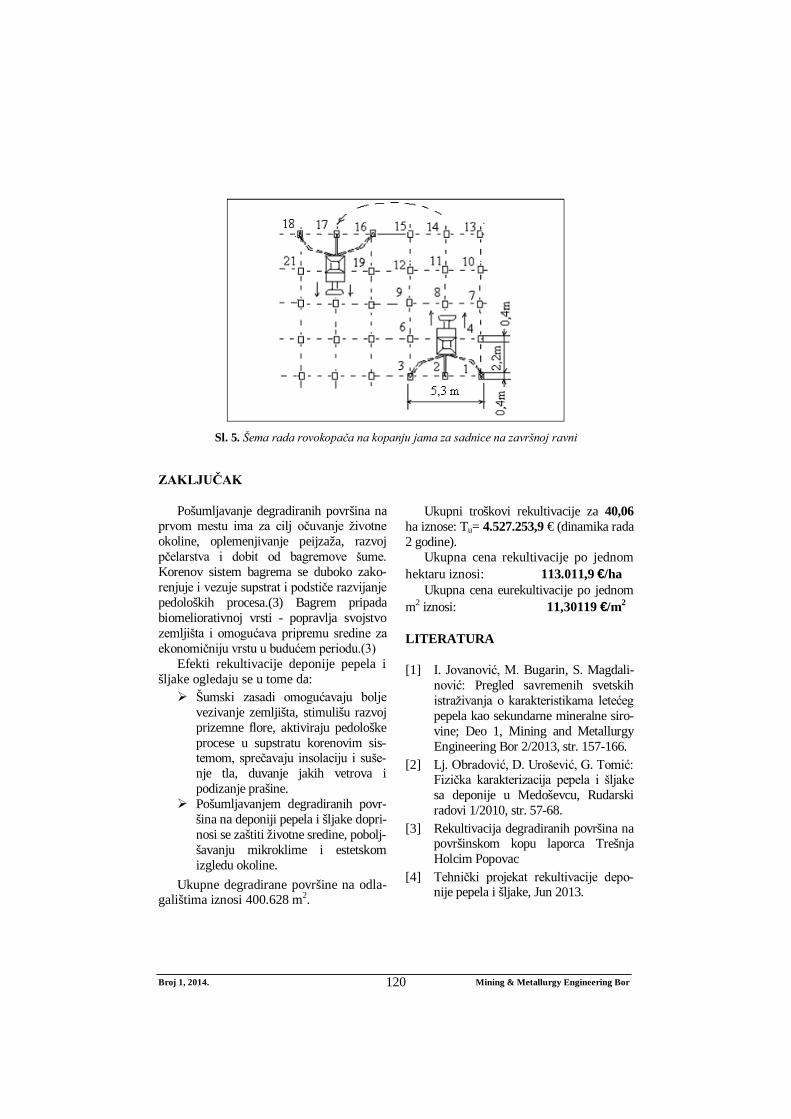
Broj 1, 2014. Mining & Metallurgy Engineering Bor 120
Sl. 5. Šema rada rovokopača na kopanju jama za sadnice na završnoj ravni
ZAKLJUČAK
Pošumljavanje degradiranih površina na prvom mestu ima za cilj očuvanje životne okoline, oplemenjivanje peijzaža, razvoj pčelarstva i dobit od bagremove šume. Korenov sistem bagrema se duboko zako-renjuje i vezuje supstrat i podstiče razvijanje pedoloških procesa.(3) Bagrem pripada biomeliorativnoj vrsti - popravlja svojstvo zemljišta i omogućava pripremu sredine za ekonomičniju vrstu u budućem periodu.(3)
Efekti rekultivacije deponije pepela i šljake ogledaju se u tome da: Šumski zasadi omogućavaju bolje
vezivanje zemljišta, stimulišu razvoj prizemne flore, aktiviraju pedološke procese u supstratu korenovim sis-temom, sprečavaju insolaciju i suše-nje tla, duvanje jakih vetrova i podizanje prašine.
Pošumljavanjem degradiranih povr-šina na deponiji pepela i šljake dopri-nosi se zaštiti životne sredine, pobolj-šavanju mikroklime i estetskom izgledu okoline.
Ukupne degradirane površine na odla-galištima iznosi 400.628 m2.
Ukupni troškovi rekultivacije za 40,06
ha iznose: Tu= 4.527.253,9 € (dinamika rada 2 godine).
Ukupna cena rekultivacije po jednom hektaru iznosi: 113.011,9 €/ha
Ukupna cena eurekultivacije po jednom m2 iznosi: 11,30119 €/m2
LITERATURA
[1] I. Jovanović, M. Bugarin, S. Magdali-nović: Pregled savremenih svetskih istraživanja o karakteristikama letećeg pepela kao sekundarne mineralne siro-vine; Deo 1, Mining and Metallurgy Engineering Bor 2/2013, str. 157-166.
[2] Lj. Obradović, D. Urošević, G. Tomić: Fizička karakterizacija pepela i šljake sa deponije u Medoševcu, Rudarski radovi 1/2010, str. 57-68.
[3] Rekultivacija degradiranih površina na površinskom kopu laporca Trešnja Holcim Popovac
[4] Tehnički projekat rekultivacije depo-nije pepela i šljake, Jun 2013.
No. 1, 2014 Mining & Metallurgy Engineering Bor 121
MINING AND METALLURGY INSTITUTE BOR ISSN: 2334-8836 UDK: 622
UDK: 622.73(045)=20 DOI:10.5937/MMEB1401121P
Milan Petrov*, Ljubiša Andrić*, Živko Sekulić*, Vladimir Jovanović*
MODELING THE MILL OPERATION ACCORDING TO DENSITY OF MILL BATCH AND SPECIFIC CAPACITY**
Abstract
This paper presents a new method of modeling the technological parameters of mill for the new con-ditions of mechanochemical treatment of mineral resources based on the Buckingham hypothesis. The specific volume of designed mill is changed if there is a change in the charge density of the mill, and dependence of the change is determined using a criterion equation. After examining the most well-known dimensional criteria, it was observed that Damkohler's criterion would quantitatively model the specific volume and density of the mill batch.
Keywords: specific volume, batch density, Damkohler’s criterion
* Institute for Technology of Nuclear and Other Mineral Raw Materials, [email protected] ** The presented results are a part of research within the Projects TR 34006 “Mechanochemistry treat-
ment of low quality mineral raw materials” and TR 34013 “Development of technological processes for obtaining of ecological materials based on nonmetallic minerals” whose implementation is funded by the Ministry of Education, Science and Technological Development of the Republic of Serbia.
INTRODUCTION
It is known that by changing the type of the milling bodies is different efficiency of grinding of mineral raw material and thus different grinding fineness. In this paper, a hypothesis on the density of the charge of the mill as an influential factor in the specific capacity of grinding certain mineral deposits. The aim of this modeling is the ability to predict the capacity of the mill in terms of changes in the charge density of the mill. Density of the batch mill is the sum of densities of balls in bulk density, material density and the density of water, which is located in the gaps between the spheres. The density of the charge depends on the type of milling body, and grinding efficiency is increased with the use of the higher density spheres. This paper studies the effect of changes in the specific capacity [1] of the
industrial mills in operation of the mill charge density and the possibility of adaptation of the mill plant to increase the capacity of the mill. Variations in the specific capacity of the mill was carried out to determine the Damkohler criterion [2]. The good factor regarding the specific mill that was built in the silica sand separation plant in Lukic polje near Milici, on which are carried out tests, is that the motor of the mill can support higher density batch milling body, so that the realized tests can be carried out in practice.
MATERIALS AND METHODS
Plant for grinding the quartz raw mate-rials in Milici operates with the following operating characteristics [3]: the mill ca
No. 1, 2014 Mining & Metallurgy Engineering Bor 122
pacity is q = 10 t/h with the grain size is 90% - 600 m Power of mill motor is N=280 kW, and mill volume is V = 13 m3. Mass of silex milling bodies in the mill is 9000 kg. The mill rpm is 17.8 mills/min. The mill is discharged through a branch, and the pulp density in the outlet is 1.125 kg/l which means that it has 18% solid in the pulp, (C: T is then 1:4.94). Material mass in the mill is 2.34 t. Grinding time is 14 minutes. Value of the Bond work index for quartz sand is 15.0 kWh/t. Variations in the specific capacity of the mill was carried out to determine the Damkohler criterion.
Density of mill batch
In order to carry out the grinding pro-cess in a mill the amount of material that is mechano-chemically treated have to be present to such an extent that the filling of empty space between balls is larger from 5 to 10% by volume relative to the volume of empty space in the mill, when the balls are present without material. Density of mill batch is the sum of ball densities in bulk state, material density and water den-sity, which is located in the gaps between the balls, Equation 1. Density of filled gaps between the balls is actually the se-cond summand in Equation 1 and it is expressed through the pulp density p .
Density of charge in the mill [4] is p :
3,)1(15,1mkg
psk
vkvks
(1)
Where: vk - Density of balls in bulk state in
kg/m3 sk - Density of material from which
the ball is made, in kg/m3 p
- Pulp density in kg/m3
Density of material from which the ball is made;
Fe cast - sk = 7800 kg/m3 Silicate - sk = 2600 kg/m3
Density of balls in bulk state; Fe cast - vk = 4100 to 4200 kg/m3 Silicate - vk = 1800 to 1900 kg/m3
Calculating the Density Values of Mill Batch in the Site of Quartz Sand Separation "Lukic polje" near Milici
Density of mill batch in the industrial process of mill operation in the site of sepa-ration Milici, was calculated according to Equation 1
32198
1125)260018001(15.11800
)1(15.1
mkg
psk
vkvks
The pulp density p
is measured by mining pycnometer and scale for measuring of density. The pulp density p cannot be high when the charge is of the same materi-al, or when balls and raw materials to be crushed are the same material. Experimen-tally, it was found that the required optimum thickness of the pulp is p = 1125 kg/m3 or 18% Č, in order to ensure the movement of material through the mill. This fact was ob-tained visually recognizing higher viscosity of batches if the pulp density increases, which causes release of balls from mill when the effects of mechano-chemical treatment cease. Density of mill batch can be increased if the type of grinding bodies is changed and the steel balls with higher density are adopt-ed instead of silex balls, and then the pulp density can be increased what is a prerequi-site for increasing the specific capacity [4,5].
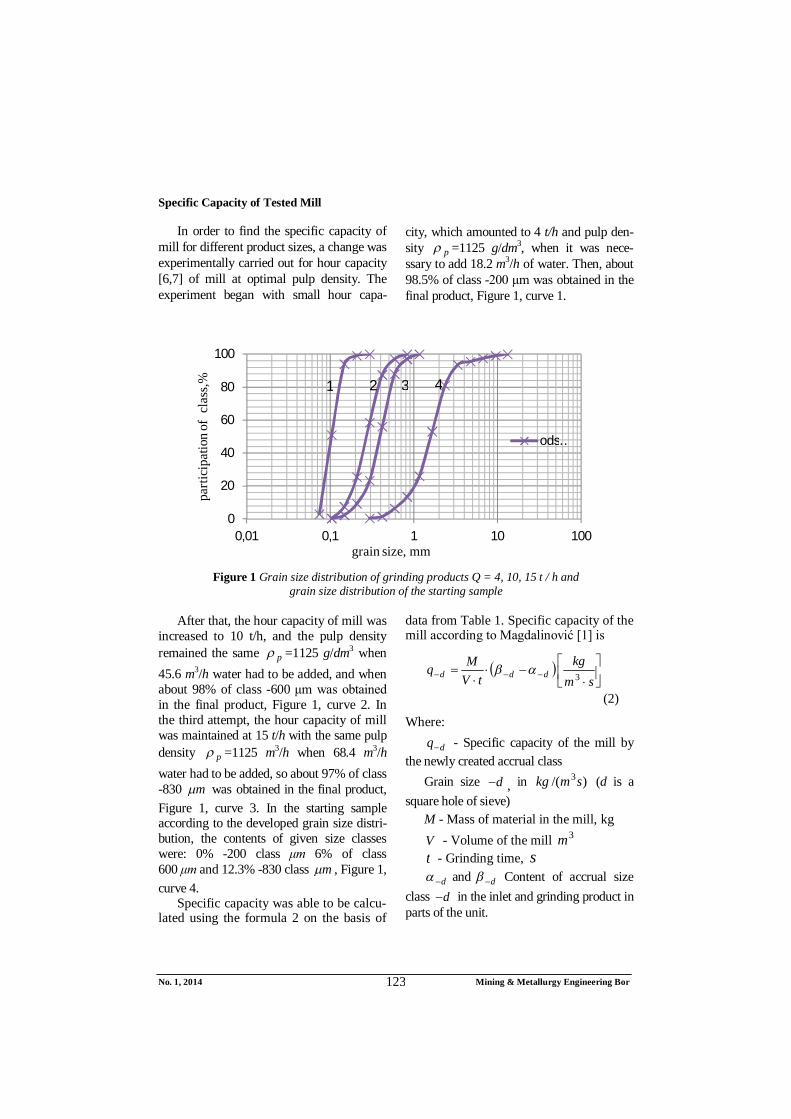
No. 1, 2014 Mining & Metallurgy Engineering Bor 123
Specific Capacity of Tested Mill
In order to find the specific capacity of mill for different product sizes, a change was experimentally carried out for hour capacity [6,7] of mill at optimal pulp density. The experiment began with small hour capa-
city, which amounted to 4 t/h and pulp den-sity p =1125 g/dm3, when it was nece-ssary to add 18.2 m3/h of water. Then, about 98.5% of class -200 μm was obtained in the final product, Figure 1, curve 1.
Figure 1 Grain size distribution of grinding products Q = 4, 10, 15 t / h and
grain size distribution of the starting sample
After that, the hour capacity of mill was increased to 10 t/h, and the pulp density remained the same p =1125 g/dm3 when 45.6 m3/h water had to be added, and when about 98% of class -600 μm was obtained in the final product, Figure 1, curve 2. In the third attempt, the hour capacity of mill was maintained at 15 t/h with the same pulp density p =1125 m3/h when 68.4 m3/h water had to be added, so about 97% of class -830 m was obtained in the final product, Figure 1, curve 3. In the starting sample according to the developed grain size distri-bution, the contents of given size classes were: 0% -200 class μm 6% of class 600 μm and 12.3% -830 class m , Figure 1, curve 4.
Specific capacity was able to be calcu-lated using the formula 2 on the basis of
data from Table 1. Specific capacity of the mill according to Magdalinović [1] is
smkg
tVMq ddd 3
(2)
Where:
dq - Specific capacity of the mill by the newly created accrual class
Grain size d , in )/( 3smkg (d is a square hole of sieve)
M - Mass of material in the mill, kg V - Volume of the mill 3m t - Grinding time, s
d and d Content of accrual size class d in the inlet and grinding product in parts of the unit.
0
20
40
60
80
100
0,01 0,1 1 10 100
parti
cipa
tion
of c
lass
,%
grain size, mm
ods…
1 2 3 4
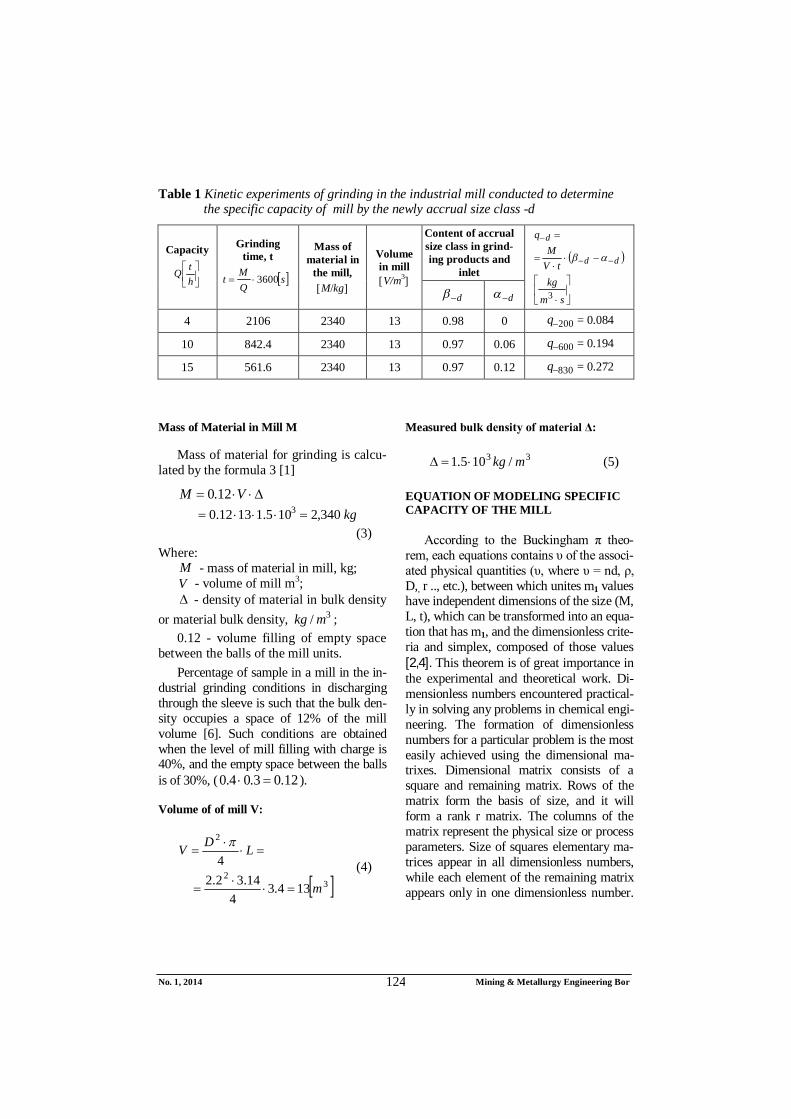
No. 1, 2014 Mining & Metallurgy Engineering Bor 124
Table 1 Kinetic experiments of grinding in the industrial mill conducted to determine the specific capacity of mill by the newly accrual size class -d
Capacity
htQ
Grinding time, t
sQM
t 3600
Mass of material in
the mill, M/kg
Volume in mill V/m3
Content of accrual size class in grind-ing products and
inlet
smkg
tVM
q
dd
d
3
d d
4 2106 2340 13 0.98 0 200q = 0.084
10 842.4 2340 13 0.97 0.06 600q = 0.194
15 561.6 2340 13 0.97 0.12 830q = 0.272
Mass of Material in Mill M
Mass of material for grinding is calcu-lated by the formula 3 [1]
VM 12.0kg340,2105.11312.0 3
(3) Where:
M - mass of material in mill, kg; V - volume of mill m3; - density of material in bulk density
or material bulk density, 3/ mkg ; 0.12 - volume filling of empty space
between the balls of the mill units. Percentage of sample in a mill in the in-
dustrial grinding conditions in discharging through the sleeve is such that the bulk den-sity occupies a space of 12% of the mill volume [6]. Such conditions are obtained when the level of mill filling with charge is 40%, and the empty space between the balls is of 30%, ( 12.03.04.0 ).
Volume of of mill V:
32
2
134.34
14.32.24
m
LDV
(4)
Measured bulk density of material Δ:
33 /105.1 mkg (5)
EQUATION OF MODELING SPECIFIC CAPACITY OF THE MILL
According to the Buckingham π theo-rem, each equations contains υ of the associ-ated physical quantities (υ, where υ = nd, ρ, D,, r .., etc.), between which unites m1 values have independent dimensions of the size (M, L, t), which can be transformed into an equa-tion that has m1, and the dimensionless crite-ria and simplex, composed of those values [2,4]. This theorem is of great importance in the experimental and theoretical work. Di-mensionless numbers encountered practical-ly in solving any problems in chemical engi-neering. The formation of dimensionless numbers for a particular problem is the most easily achieved using the dimensional ma-trixes. Dimensional matrix consists of a square and remaining matrix. Rows of the matrix form the basis of size, and it will form a rank r matrix. The columns of the matrix represent the physical size or process parameters. Size of squares elementary ma-trices appear in all dimensionless numbers, while each element of the remaining matrix appears only in one dimensionless number.
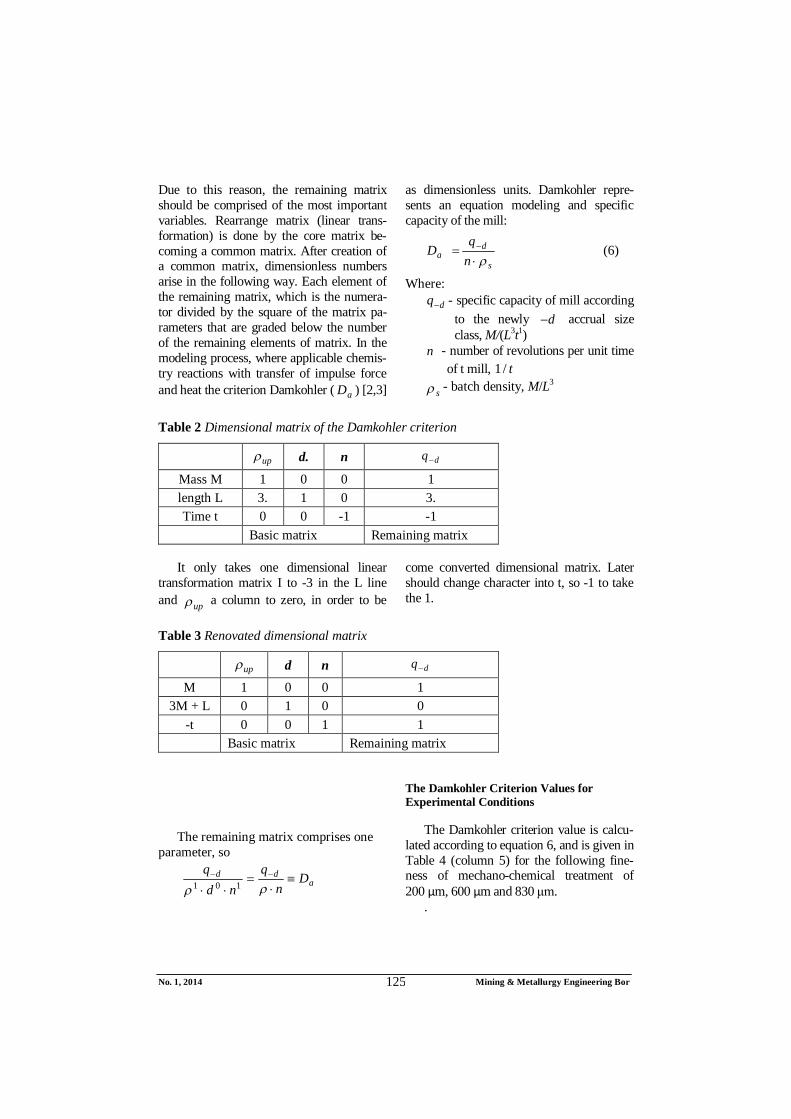
No. 1, 2014 Mining & Metallurgy Engineering Bor 125
Due to this reason, the remaining matrix should be comprised of the most important variables. Rearrange matrix (linear trans-formation) is done by the core matrix be-coming a common matrix. After creation of a common matrix, dimensionless numbers arise in the following way. Each element of the remaining matrix, which is the numera-tor divided by the square of the matrix pa-rameters that are graded below the number of the remaining elements of matrix. In the modeling process, where applicable chemis-try reactions with transfer of impulse force and heat the criterion Damkohler ( aD ) [2,3]
as dimensionless units. Damkohler repre-sents an equation modeling and specific capacity of the mill:
s
da n
qD
(6)
Where: dq - specific capacity of mill according
to the newly d accrual size class, M/(L3t1)
n - number of revolutions per unit time of t mill, t/1
s - batch density, M/L3
Table 2 Dimensional matrix of the Damkohler criterion
up d. n dq
Mass M 1 0 0 1 length L 3. 1 0 3. Time t 0 0 -1 -1
Basic matrix Remaining matrix
It only takes one dimensional linear transformation matrix I to -3 in the L line and up
a column to zero, in order to be
come converted dimensional matrix. Later should change character into t, so -1 to take the 1.
Table 3 Renovated dimensional matrix
up d n dq
M 1 0 0 1 3M + L 0 1 0 0
-t 0 0 1 1 Basic matrix Remaining matrix
The remaining matrix comprises one
parameter, so
add Dn
qnd
q
101
The Damkohler Criterion Values for Experimental Conditions
The Damkohler criterion value is calcu-lated according to equation 6, and is given in Table 4 (column 5) for the following fine-ness of mechano-chemical treatment of 200 μm, 600 μm and 830 μm.
.
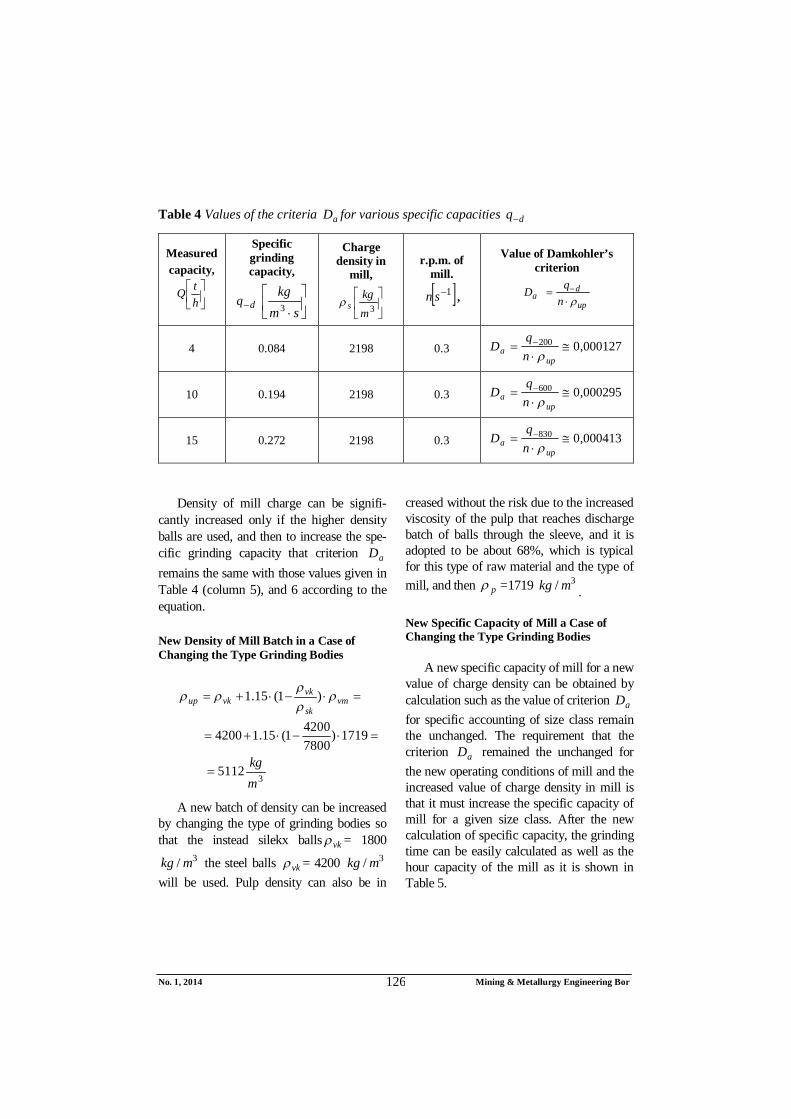
No. 1, 2014 Mining & Metallurgy Engineering Bor 126
Table 4 Values of the criteria aD for various specific capacities dq
Measured capacity,
htQ
Specific grinding capacity,
dq
smkg3
Charge density in
mill,
3m
kgs
r.p.m. of mill.
1sn ,
Value of Damkohler’s criterion
up
da n
qD
4 0.084 2198 0.3 000127,0200
upa n
qD
10 0.194 2198 0.3 000295,0600
upa n
qD
15 0.272 2198 0.3 000413,0830
upa n
qD
Density of mill charge can be signifi-cantly increased only if the higher density balls are used, and then to increase the spe-cific grinding capacity that criterion aD remains the same with those values given in Table 4 (column 5), and 6 according to the equation.
New Density of Mill Batch in a Case of Changing the Type Grinding Bodies
35112
1719)780042001(15.14200
)1(15.1
mkg
vmsk
vkvkup
A new batch of density can be increased by changing the type of grinding bodies so that the instead silekx balls vk = 1800
3/ mkg the steel balls vk = 4200 3/ mkg will be used. Pulp density can also be in
creased without the risk due to the increased viscosity of the pulp that reaches discharge batch of balls through the sleeve, and it is adopted to be about 68%, which is typical for this type of raw material and the type of mill, and then p =1719 3/ mkg .
New Specific Capacity of Mill a Case of Changing the Type Grinding Bodies
A new specific capacity of mill for a new value of charge density can be obtained by calculation such as the value of criterion aD for specific accounting of size class remain the unchanged. The requirement that the criterion aD remained the unchanged for the new operating conditions of mill and the increased value of charge density in mill is that it must increase the specific capacity of mill for a given size class. After the new calculation of specific capacity, the grinding time can be easily calculated as well as the hour capacity of the mill as it is shown in Table 5.
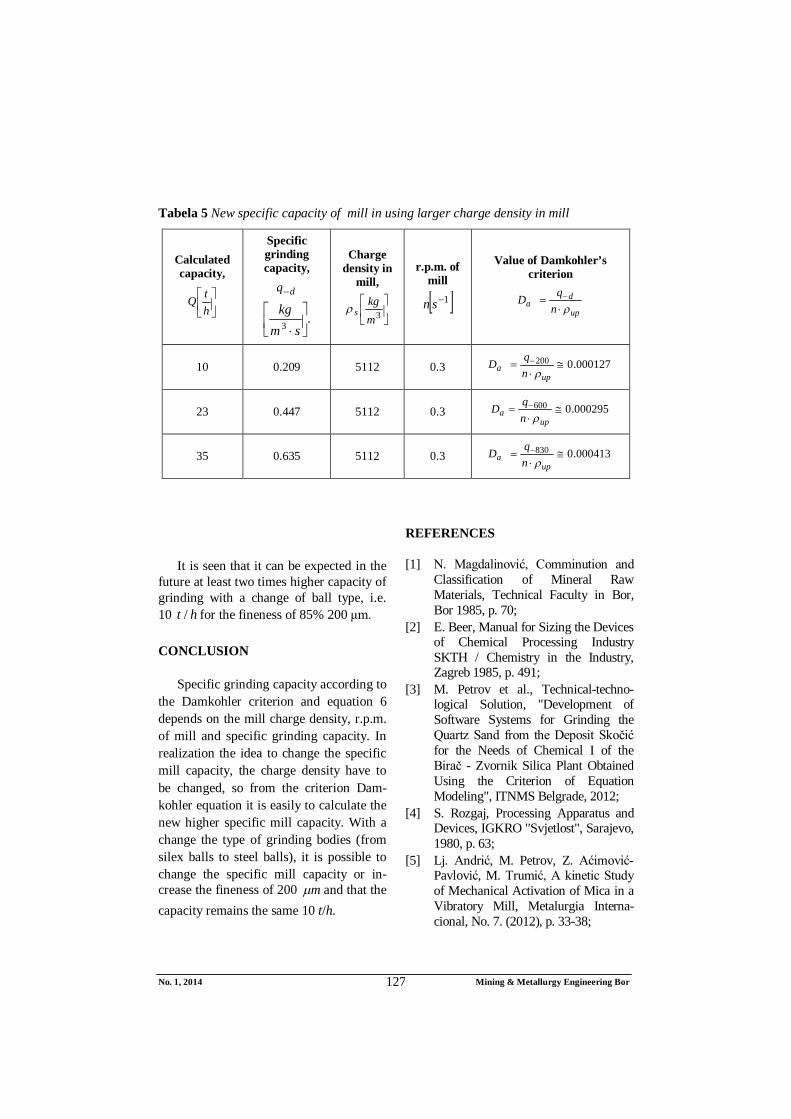
No. 1, 2014 Mining & Metallurgy Engineering Bor 127
Tabela 5 New specific capacity of mill in using larger charge density in mill
Calculated capacity,
htQ
Specific grinding capacity,
dq
.3
smkg
Charge density in
mill,
3m
kgs
r.p.m. of mill
1sn
Value of Damkohler’s criterion
up
da n
qD
10 0.209 5112 0.3 000127.0200
upa n
qD
23 0.447 5112 0.3 000295.0600
upa n
qD
35 0.635 5112 0.3 000413.0830
upa n
qD
It is seen that it can be expected in the
future at least two times higher capacity of grinding with a change of ball type, i.e. 10 ht / for the fineness of 85% 200 μm.
CONCLUSION
Specific grinding capacity according to the Damkohler criterion and equation 6 depends on the mill charge density, r.p.m. of mill and specific grinding capacity. In realization the idea to change the specific mill capacity, the charge density have to be changed, so from the criterion Dam-kohler equation it is easily to calculate the new higher specific mill capacity. With a change the type of grinding bodies (from silex balls to steel balls), it is possible to change the specific mill capacity or in-crease the fineness of 200 m and that the capacity remains the same 10 t/h.
REFERENCES
[1] N. Magdalinović, Comminution and Classification of Mineral Raw Materials, Technical Faculty in Bor, Bor 1985, p. 70;
[2] E. Beer, Manual for Sizing the Devices of Chemical Processing Industry SKTH / Chemistry in the Industry, Zagreb 1985, p. 491;
[3] M. Petrov et al., Technical-techno-logical Solution, "Development of Software Systems for Grinding the Quartz Sand from the Deposit Skočić for the Needs of Chemical I of the Birač - Zvornik Silica Plant Obtained Using the Criterion of Equation Modeling", ITNMS Belgrade, 2012;
[4] S. Rozgaj, Processing Apparatus and Devices, IGKRO "Svjetlost", Sarajevo, 1980, p. 63;
[5] Lj. Andrić, M. Petrov, Z. Aćimović-Pavlović, M. Trumić, A kinetic Study of Mechanical Activation of Mica in a Vibratory Mill, Metalurgia Interna-cional, No. 7. (2012), p. 33-38;

No. 1, 2014 Mining & Metallurgy Engineering Bor 128
[6] M. Grbović, N. Magdalinović, Proce-ssing Equipment for Crushing and Grinding of Mineral Raw Materials, "Copper", Bor, 1980, p. 88;
[7] S. Puštrić, Selection and Calculation of Machinery and Equipment for Crushing, Screening and Grinding of Mineral Raw Materials, Mining and Geology, Belgrade 1974, p. 48.
Broj 1, 2014. Mining & Metallurgy Engineering Bor 129
INSTITUT ZA RUDARSTVO I METALURGIJU BOR ISSN: 2334-8836 UDK: 622
UDK: 622.73(045)=861 DOI:10.5937/MMEB1401121P
Milan Petrov*, Ljubiša Andrić*, Živko Sekulić*, Vladimir Jovanović*
MODELOVANJE RADA MLINA PREMA GUSTINI ŠARŽE MLINA I SPECIFIČNOM KAPACITETU**
Izvod
U radu je prikazana nova metoda modelovanja tehnoloških parametara rada mlina za nove uslove mehano-hemijskog tretmana mineralne sirovine na bazi hipoteze Buckinghama. Specifični kapacitet projektovanog mlina menja se ukoliko dolazi do promene gustine šarže mlina, a zavisnost te promene određuje se upotrebom kriterijumskih jednačina. Uvidom u većinu poznatih dimenzionih kriterijuma uočeno je da bi Damkohler-ov kriterijum mogao kvantitativno da modeluje specifični kapacitet i gustinu šarže mlina.
Ključne reči: specifični kapacitet, gustina šarže, Damkohler-ov kriterijum
*Institut za tehnologiju nuklearnih i drugih mineralnih sirovina, e-mail: [email protected] **Prikazani rezultati predstavljaju deo istraživanja u okviru projekta TR 34006 “Mehanohemijski
tretman nedovoljno kvalitetnih mineralnih sirovina“ i TR 34013 „Osvajanje tehnoloških postupaka dobijanja ekoloških materijala na bazi nemetaličnih mineralnih sirovina“ čiju realizaciju finansira Ministarstvo prosvete, nauke i tehnološkog razvoja republike Srbije.
UVOD
Poznato je da se promenom vrste meljućih tela ostvaruju različite efikasnosti mlevenja mineralne sirovine i time različita finoća mlevenja. U radu je postavljena hipoteza o gustini šarže mlina kao uticajnom faktoru na specifični kapacitet mlevenja odredjene mineralne sirovine. Cilj ovakvog modelovanja je mogućnost predviđanja kapaciteta mlina u uslovima promene gustine šarže mlina. Gustina šarže mlina jeste zbir gustine kugli u nasutom stanju, gustine materijala i gustine vode koja se nalazi u praznini između kugli. Gustina šarže najviše zavisi od vrste meljućih tela, a efikasnost mlevenja se povećava sa upotrebom kugli veće gustine. U ovom radu je ispitivan uticaj promene specifičnog kapaciteta [1] industrijskog mlina u funkciji
gustine šarže mlina i mogućnosti adaptacije mlinskog postrojenja da bi se povećao kapacitet mlina. Variranje specifičnog kapaciteta mlina vršeno je da bi se utvrdio kriterijum Damkohlera [2]. Dobra okolnost u vezi sa konkretnim mlinom koji je ugrađen u pogonu separacije kvarcnog peska u Lukića polju kod Milića, i na kojem su izvršena ispitivanja, je ta što motor mlina može da podrži veću gustinu šarže meljućih tela, tako da se realizovana ispitivanja mogu sprovesti u praksi.
MATERIJAL I METODE
Postrojenje za mlevenje kvarcne sirovine u Milićima radi sa sledećim radnim karakte-ristikama [3]: kapacitet mlina je q = 10 t/h
Broj 1, 2014. Mining & Metallurgy Engineering Bor 130
pri krupnoći od 90% - 600 μm. Snaga motora mlina je N=280 kW, a zapremina mlina je V = 13 m3. Masa sileks meljućih tela u mlinu je 9.000 kg. Broj obrtaja mlina je 17,8 o/min. Mlin se prazni kroz rukavac, a gustina pulpe na izlazu je 1,125 kg/l što znači da ima 18% čvrstoga u pulpi, (Č:T je tada 1:4,94). Masa materijala u mlinu je 2,34 t. Vreme mlevenja je 14 minuta. Vrednost Bondovog radnog indeksa za kvarcni pesak je 15,0 kWh/t. Variranje specifičnog kapa-citeta mlina vršeno je da bi se utvrdio kriterijum Damkohlera.
Gustina šarže mlina
Da bi se vršio proces mlevenja u mlinu količina materijala koji se mehano hemijski tretira mora biti zastupljena u takvoj meri da je zapunjenost praznog prostora između kugli veća za 5 do 10% zapreminski u odnosu na zapreminu praznog prostora u mlinu kada su prisutne samo kugle bez materijala. Gustina n šarže mlina jeste zbir gustine kugli u nasutom stanju, gustine materijala i gustine vode koja se nalazi u praznini između kugli, jednačina 1. Gustina popunjene praznine između kugli je zapravo drugi sabirak u jednačini 1 i izražena je preko gustine pulpe p . G gustina šarže u
mlinu [4] je s :
3,)1(15,1mkg
psk
vkvks
(1)
gde je:
vk - gustina kugli u nasutom stanju, u kg/m3
sk - gustina materijala od kog je sačinjena kugla, u kg/m3
p - gustina pulpe, u kg/m3
Gustina materijala od kog je sačinjena kugla;
Fe livene - sk = 7800 kg/m3
Silikatne - sk = 2600 kg/m3
Gustina kugli u nasutom stanju;
Fe livene - vk = 4100 do 4200 kg/m3
Silikatne - vk = 1800 do 1900 kg/m3
Izračunavanje vrednosti gustine šarže mlina u pogonu separacije kvarcnog peska „Lukića polje“ kod Milića
Gustinu šarže mlina u industrijskom procesu rada mlina u pogonu separacije Milići izračunali smo prema jednačini 1.
32198
1125)260018001(15,11800
)1(15,1
mkg
psk
vkvks
Gustina pulpe p meri se rudarskim piknometrom i vagom za merenje gustine. Gustina pulpe p ne može biti velika kada je šarža od istog materijala, odnosno kada su kugle i sirovina koja se usitnjava od istog materijala. Eksperimentalno smo utvrdili da je potrebna optimalna gustina pulpe p = 1125 kg/m3 ili 18% Č, da bi se obezbedilo kretanje materijala kroz mlin. Do ovakvog saznanja smo došli vizuelno uočavajući veću viskoznost šarže ukoliko se povećava gustina pulpe, a koja prouzro-kuje izlazak kugli iz mlina kada prestaju efekti mehano-hemijskog tretmana. Gus-tina šarže mlina može da se poveća ukoliko se promeni vrsta meljućih tela i umesto sileks kugli usvoje čelične kugle sa većom gustinom, a tada može da se poveća i gustina pulpe što je preduslov za povećanje specifičnog kapaciteta [4,5].
Specifični kapacitet testiranog mlina
U cilju iznalaženja specifičnog kapa-citeta mlina za različite finoće proizvoda
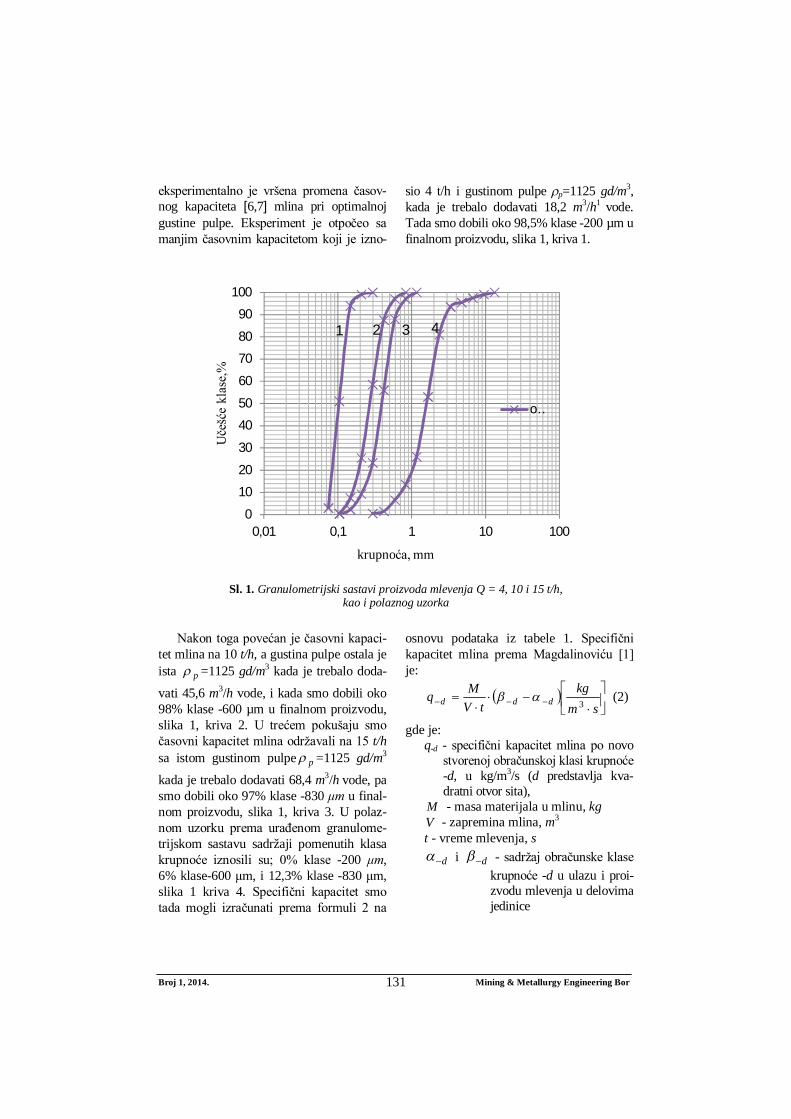
Broj 1, 2014. Mining & Metallurgy Engineering Bor 131
eksperimentalno je vršena promena časov-nog kapaciteta [6,7] mlina pri optimalnoj gustine pulpe. Eksperiment je otpočeo sa manjim časovnim kapacitetom koji je izno-
sio 4 t/h i gustinom pulpe p=1125 gd/m3,
kada je trebalo dodavati 18,2 m3/h1 vode. Tada smo dobili oko 98,5% klase -200 µm u finalnom proizvodu, slika 1, kriva 1.
Sl. 1. Granulometrijski sastavi proizvoda mlevenja Q = 4, 10 i 15 t/h,
kao i polaznog uzorka Nakon toga povećan je časovni kapaci-
tet mlina na 10 t/h, a gustina pulpe ostala je ista p =1125 gd/m3 kada je trebalo doda-
vati 45,6 m3/h vode, i kada smo dobili oko 98% klase -600 µm u finalnom proizvodu, slika 1, kriva 2. U trećem pokušaju smo časovni kapacitet mlina održavali na 15 t/h sa istom gustinom pulpe p =1125 gd/m3
kada je trebalo dodavati 68,4 m3/h vode, pa smo dobili oko 97% klase -830 μm u final-nom proizvodu, slika 1, kriva 3. U polaz-nom uzorku prema urađenom granulome-trijskom sastavu sadržaji pomenutih klasa krupnoće iznosili su; 0% klase -200 μm, 6% klase-600 μm, i 12,3% klase -830 μm, slika 1 kriva 4. Specifični kapacitet smo tada mogli izračunati prema formuli 2 na
osnovu podataka iz tabele 1. Specifični kapacitet mlina prema Magdalinoviću [1] je:
smkg
tVMq ddd 3
(2)
gde je: q-d - specifični kapacitet mlina po novo
stvorenoj obračunskoj klasi krupnoće -d, u kg/m3/s (d predstavlja kva-dratni otvor sita),
M - masa materijala u mlinu, kg V - zapremina mlina, m3 t - vreme mlevenja, s
d i d - sadržaj obračunske klase krupnoće -d u ulazu i proi-zvodu mlevenja u delovima jedinice
0
10
20
30
40
50
60
70
80
90
100
0,01 0,1 1 10 100
Uče
šće
klas
e,%
krupnoća, mm
o…
1 2 3 4
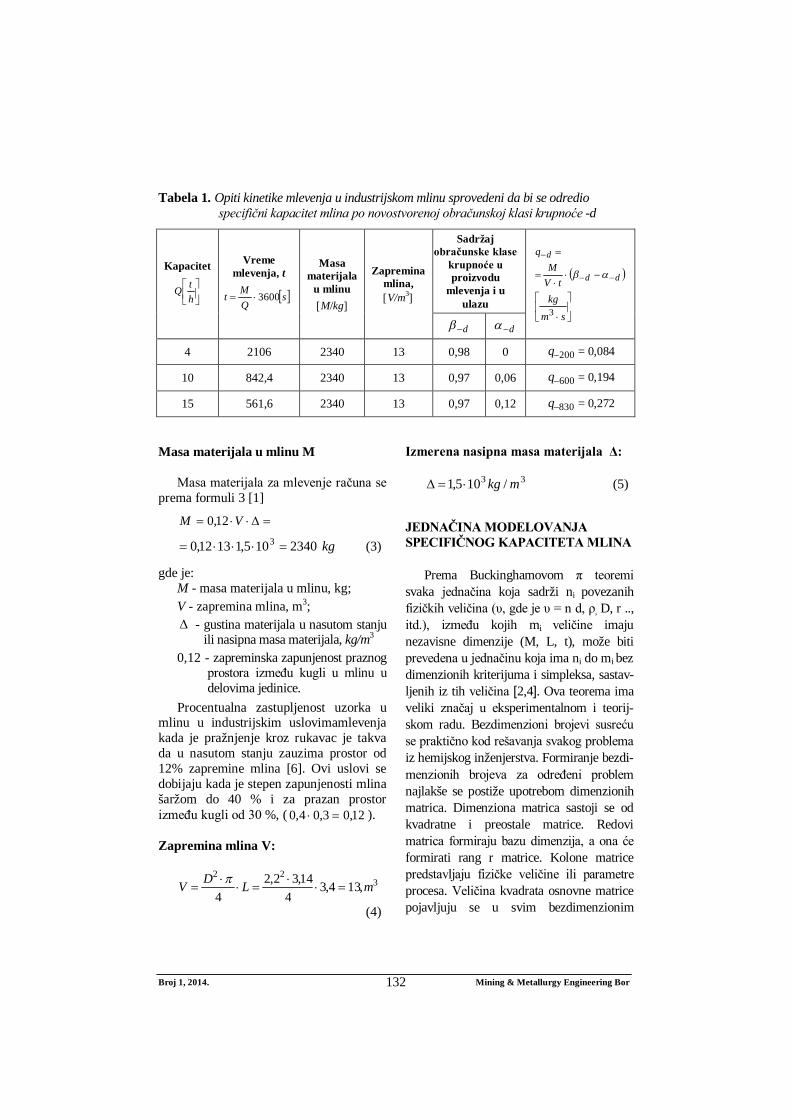
Broj 1, 2014. Mining & Metallurgy Engineering Bor 132
Tabela 1. Opiti kinetike mlevenja u industrijskom mlinu sprovedeni da bi se odredio specifični kapacitet mlina po novostvorenoj obračunskoj klasi krupnoće -d
Kapacitet
htQ
Vreme mlevenja, t
sQM
t 3600
Masa materijala
u mlinu M/kg
Zapremina mlina, V/m3
Sadržaj obračunske klase
krupnoće u proizvodu
mlevenja i u ulazu
smkg
tVM
q
dd
d
3
d d
4 2106 2340 13 0,98 0 200q = 0,084
10 842,4 2340 13 0,97 0,06 600q = 0,194
15 561,6 2340 13 0,97 0,12 830q = 0,272
Masa materijala u mlinu M
Masa materijala za mlevenje računa se prema formuli 3 [1]
VM 12,0
kg2340105,11312,0 3 (3)
gde je: M - masa materijala u mlinu, kg; V - zapremina mlina, m3; - gustina materijala u nasutom stanju
ili nasipna masa materijala, kg/m3 0,12 - zapreminska zapunjenost praznog
prostora između kugli u mlinu u delovima jedinice.
Procentualna zastupljenost uzorka u mlinu u industrijskim uslovimamlevenja kada je pražnjenje kroz rukavac je takva da u nasutom stanju zauzima prostor od 12% zapremine mlina [6]. Ovi uslovi se dobijaju kada je stepen zapunjenosti mlina šaržom do 40 % i za prazan prostor između kugli od 30 %, ( 12,03,04,0 ).
Zapremina mlina V:
322
,134,34
14,32,24
mLDV
(4)
Izmerena nasipna masa materijala Δ:
33 /105,1 mkg (5)
JEDNAČINA MODELOVANJA SPECIFIČNOG KAPACITETA MLINA
Prema Buckinghamovom π teoremi svaka jednačina koja sadrži ni povezanih fizičkih veličina (υ, gde je υ = n d, ρ, D, r .., itd.), između kojih mi veličine imaju nezavisne dimenzije (M, L, t), može biti prevedena u jednačinu koja ima ni do mi bez dimenzionih kriterijuma i simpleksa, sastav-ljenih iz tih veličina [2,4]. Ova teorema ima veliki značaj u eksperimentalnom i teorij-skom radu. Bezdimenzioni brojevi susreću se praktično kod rešavanja svakog problema iz hemijskog inženjerstva. Formiranje bezdi-menzionih brojeva za određeni problem najlakše se postiže upotrebom dimenzionih matrica. Dimenziona matrica sastoji se od kvadratne i preostale matrice. Redovi matrica formiraju bazu dimenzija, a ona će formirati rang r matrice. Kolone matrice predstavljaju fizičke veličine ili parametre procesa. Veličina kvadrata osnovne matrice pojavljuju se u svim bezdimenzionim
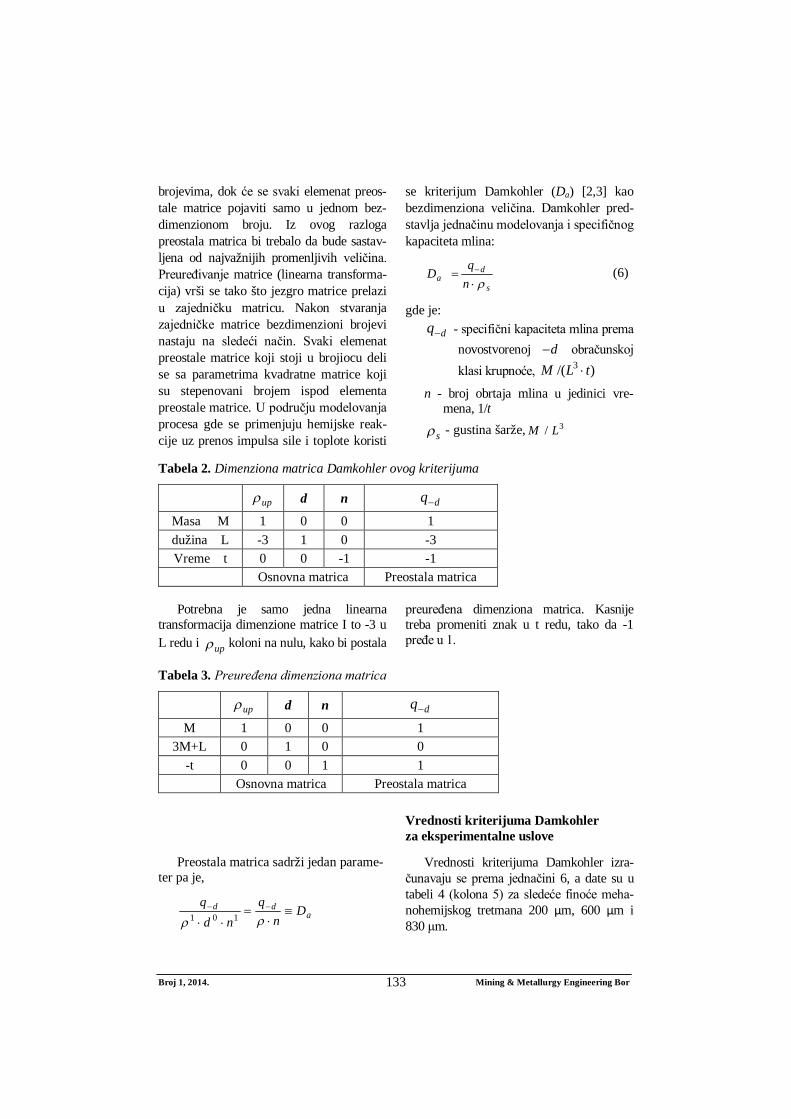
Broj 1, 2014. Mining & Metallurgy Engineering Bor 133
brojevima, dok će se svaki elemenat preos-tale matrice pojaviti samo u jednom bez-dimenzionom broju. Iz ovog razloga preostala matrica bi trebalo da bude sastav-ljena od najvažnijih promenljivih veličina. Preuređivanje matrice (linearna transforma-cija) vrši se tako što jezgro matrice prelazi u zajedničku matricu. Nakon stvaranja zajedničke matrice bezdimenzioni brojevi nastaju na sledeći način. Svaki elemenat preostale matrice koji stoji u brojiocu deli se sa parametrima kvadratne matrice koji su stepenovani brojem ispod elementa preostale matrice. U području modelovanja procesa gde se primenjuju hemijske reak-cije uz prenos impulsa sile i toplote koristi
se kriterijum Damkohler (Da) [2,3] kao bezdimenziona veličina. Damkohler pred-stavlja jednačinu modelovanja i specifičnog kapaciteta mlina:
s
da n
qD
(6)
gde je:
dq - specifični kapaciteta mlina prema novostvorenoj d obračunskoj klasi krupnoće, )/( 3 tLM
n - broj obrtaja mlina u jedinici vre-mena, 1/t
s - gustina šarže, 3/ LM
Tabela 2. Dimenziona matrica Damkohler ovog kriterijuma
up d n dq
Masa M 1 0 0 1 dužina L -3 1 0 -3 Vreme t 0 0 -1 -1
Osnovna matrica Preostala matrica Potrebna je samo jedna linearna
transformacija dimenzione matrice I to -3 u L redu i up koloni na nulu, kako bi postala
preuređena dimenziona matrica. Kasnije treba promeniti znak u t redu, tako da -1 pređe u 1.
Tabela 3. Preuređena dimenziona matrica
up d n dq
M 1 0 0 1 3M+L 0 1 0 0
-t 0 0 1 1 Osnovna matrica Preostala matrica
Preostala matrica sadrži jedan parame-
ter pa je,
add Dn
qnd
q
101
Vrednosti kriterijuma Damkohler za eksperimentalne uslove
Vrednosti kriterijuma Damkohler izra-čunavaju se prema jednačini 6, a date su u tabeli 4 (kolona 5) za sledeće finoće meha-nohemijskog tretmana 200 μm, 600 μm i 830 μm.
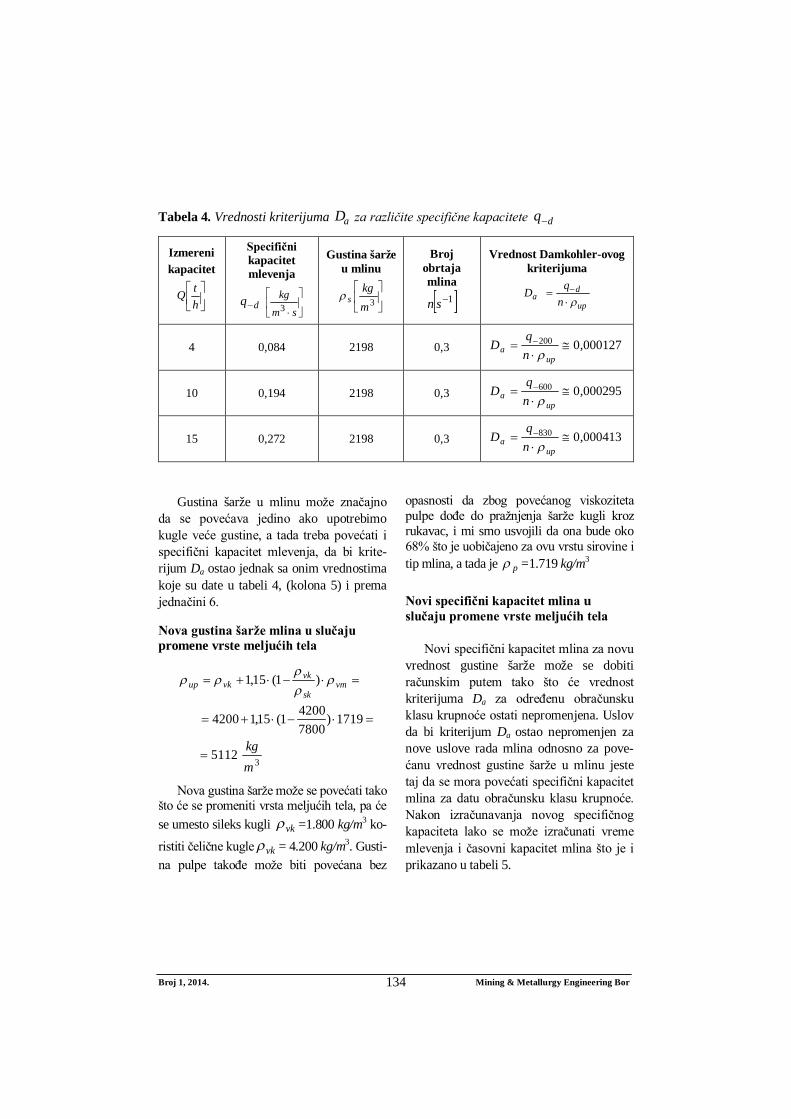
Broj 1, 2014. Mining & Metallurgy Engineering Bor 134
Tabela 4. Vrednosti kriterijuma aD za različite specifične kapacitete dq
Izmereni kapacitet
htQ
Specifični kapacitet mlevenja
dq
smkg3
Gustina šarže u mlinu
3m
kgs
Broj obrtaja mlina
1sn
Vrednost Damkohler-ovog kriterijuma
up
da n
qD
4 0,084 2198 0,3 000127,0200
upa n
qD
10 0,194 2198 0,3 000295,0600
upa n
qD
15 0,272 2198 0,3 000413,0830
upa n
qD
Gustina šarže u mlinu može značajno
da se povećava jedino ako upotrebimo kugle veće gustine, a tada treba povećati i specifični kapacitet mlevenja, da bi krite-rijum Da ostao jednak sa onim vrednostima koje su date u tabeli 4, (kolona 5) i prema jednačini 6.
Nova gustina šarže mlina u slučaju promene vrste meljućih tela
35112
1719)780042001(15,14200
)1(15,1
mkg
vmsk
vkvkup
Nova gustina šarže može se povećati tako što će se promeniti vrsta meljućih tela, pa će se umesto sileks kugli vk =1.800 kg/m3 ko-
ristiti čelične kugle vk = 4.200 kg/m3. Gusti-na pulpe takođe može biti povećana bez
opasnosti da zbog povećanog viskoziteta pulpe dođe do pražnjenja šarže kugli kroz rukavac, i mi smo usvojili da ona bude oko 68% što je uobičajeno za ovu vrstu sirovine i tip mlina, a tada je p =1.719 kg/m3
Novi specifični kapacitet mlina u slučaju promene vrste meljućih tela
Novi specifični kapacitet mlina za novu vrednost gustine šarže može se dobiti računskim putem tako što će vrednost kriterijuma Da za određenu obračunsku klasu krupnoće ostati nepromenjena. Uslov da bi kriterijum Da ostao nepromenjen za nove uslove rada mlina odnosno za pove-ćanu vrednost gustine šarže u mlinu jeste taj da se mora povećati specifični kapacitet mlina za datu obračunsku klasu krupnoće. Nakon izračunavanja novog specifičnog kapaciteta lako se može izračunati vreme mlevenja i časovni kapacitet mlina što je i prikazano u tabeli 5.
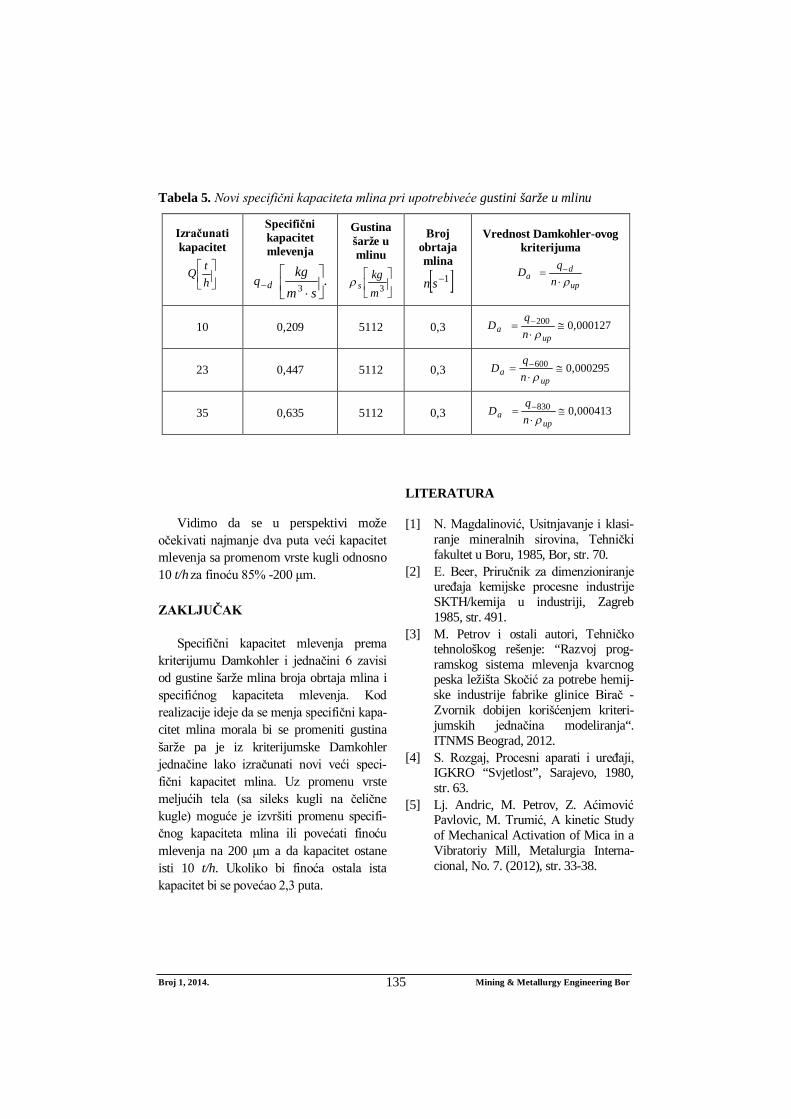
Broj 1, 2014. Mining & Metallurgy Engineering Bor 135
Tabela 5. Novi specifični kapaciteta mlina pri upotrebiveće gustini šarže u mlinu
Izračunati kapacitet
htQ
Specifični kapacitet mlevenja
dq .3
smkg
Gustina šarže u mlinu
3m
kgs
Broj obrtaja mlina
1sn
Vrednost Damkohler-ovog kriterijuma
up
da n
qD
10 0,209 5112 0,3 000127,0200
upa n
qD
23 0,447 5112 0,3 000295,0600
upa n
qD
35 0,635 5112 0,3 000413,0830
upa n
qD
Vidimo da se u perspektivi može
očekivati najmanje dva puta veći kapacitet mlevenja sa promenom vrste kugli odnosno 10 t/h za finoću 85% -200 μm.
ZAKLJUČAK
Specifični kapacitet mlevenja prema kriterijumu Damkohler i jednačini 6 zavisi od gustine šarže mlina broja obrtaja mlina i specifićnog kapaciteta mlevenja. Kod realizacije ideje da se menja specifični kapa-citet mlina morala bi se promeniti gustina šarže pa je iz kriterijumske Damkohler jednačine lako izračunati novi veći speci-fični kapacitet mlina. Uz promenu vrste meljućih tela (sa sileks kugli na čelične kugle) moguće je izvršiti promenu specifi-čnog kapaciteta mlina ili povećati finoću mlevenja na 200 μm a da kapacitet ostane isti 10 t/h. Ukoliko bi finoća ostala ista kapacitet bi se povećao 2,3 puta.
LITERATURA
[1] N. Magdalinović, Usitnjavanje i klasi-ranje mineralnih sirovina, Tehnički fakultet u Boru, 1985, Bor, str. 70.
[2] E. Beer, Priručnik za dimenzioniranje uređaja kemijske procesne industrije SKTH/kemija u industriji, Zagreb 1985, str. 491.
[3] M. Petrov i ostali autori, Tehničko tehnološkog rešenje: “Razvoj prog-ramskog sistema mlevenja kvarcnog peska ležišta Skočić za potrebe hemij-ske industrije fabrike glinice Birač - Zvornik dobijen korišćenjem kriteri-jumskih jednačina modeliranja“. ITNMS Beograd, 2012.
[4] S. Rozgaj, Procesni aparati i uređaji, IGKRO “Svjetlost”, Sarajevo, 1980, str. 63.
[5] Lj. Andric, M. Petrov, Z. Aćimović Pavlovic, M. Trumić, A kinetic Study of Mechanical Activation of Mica in a Vibratoriy Mill, Metalurgia Interna-cional, No. 7. (2012), str. 33-38.

Broj 1, 2014. Mining & Metallurgy Engineering Bor 136
[6] M. Grbović, N. Magdalinović, Pro-cesna oprema drobljenja i mlevenja mineralnih sirovina, “Bakar”, Bor, 1980, str. 88.
[7] S. Puštrić, Izbor i proračun mašina i uređaja za drobljenje prosejavanje i mlevenje mineralnih sirovina, RGF, Beograd, 1974, str 48.
No. 1, 2014 Mining & Metallurgy Engineering Bor 137
MINING AND METALLURGY INSTITUTE BOR ISSN: 2334-8836 UDK: 622
UDK: 669.7.018/.721:658.567(045)=20 DOI:10.5937/MMEB1401137A
Zagorka Aćimović, Anja Terzić**, Ljubiša Andrić***, Vera Stojanović****, Marko Pavlović*
THE FLAWS OF ALUMINIUM-MAGNESIUM ALLOY ELEMENTS – INFLUENCE OF INCLUSIONS*****
Abstract
The investigation results of gas removal from smelted metal and the effect on performances of alu-minium-magnesium alloy cast elements are presented in this paper. The investigated alloy is based on recycled material. The obtained results define the specific procedure which is used for removal and reduction the presence of inclusions of various types in the cast elements, which is the basic step in achieving the designed quality of cast material and quality final products. Kinetics and mechanisms of degasification process were investigated, parameters of degasification procedures were defined, and the new agents for degasification of alloy cast were implemented. The results of this investigation are significant from the aspect of sustainable development the production of cast elements of aluminium alloys.
Keywords: aluminium-magnesium alloys, inclusions, cast quality, secondary raw materials
University of Belgrade, Faculty of Technology and Metallurgy, Karnegy 4, Belgrade, Serbia ** Institute IMS, Vojvode Mišića Blv. 43, Belgrade, Serbia, [email protected] ***Institute ITNMS, Franchet d’Esperey st. 96, Belgrade, Serbia ****University of Belgrade, Belgrade, Serbia, [email protected] *****This investigation was supported and funded by the Ministry of Education, Science and Technolo-
gical Development of the Republic of Serbia and it was conducted under the Projects: 33007 “Implementation of Modern Technical-technological and Environmental Solutions in the Existing Production Systems of the Copper Mine Bor and Copper Mine Majdanpek“, 172057 and 45008.
1 INTRODUCTION
The goal of modern casting procedure is to meet the proposed requirements for com-position, structure, properties, and quality of cast material. The final product should not have any flaws which could limit its usage 1. The structure of cast material is shaped by cooling conditions, and in addition it affects the final properties of cast elements. On the other hand, the quality of cast is sig-nificantly affected by the parameters of cas-ting technology. Detection and evaluation of flaws in casts has to be performed systema-tically during developmental phase of the process, using preventive measures to avoid
them 2. Aluminuim- magnesium alloys are a significant group of alloys, primarily be-cause their high mechanical strength was achieved without thermal processing, then their high corrosion resistance, good weta-bility, etc. 3, 4. The investigation the effect of non-metal inclusions and gases on the quality of elements made of aluminium AlMg3 alloy, obtained by semi-continuous casting, was conducted. Since the recycled raw materials were used in production of the Al-Mg alloy, the certain flaws of gas type or inclusions occurred in the casts. Flaws were positioned internally as a substructure of the
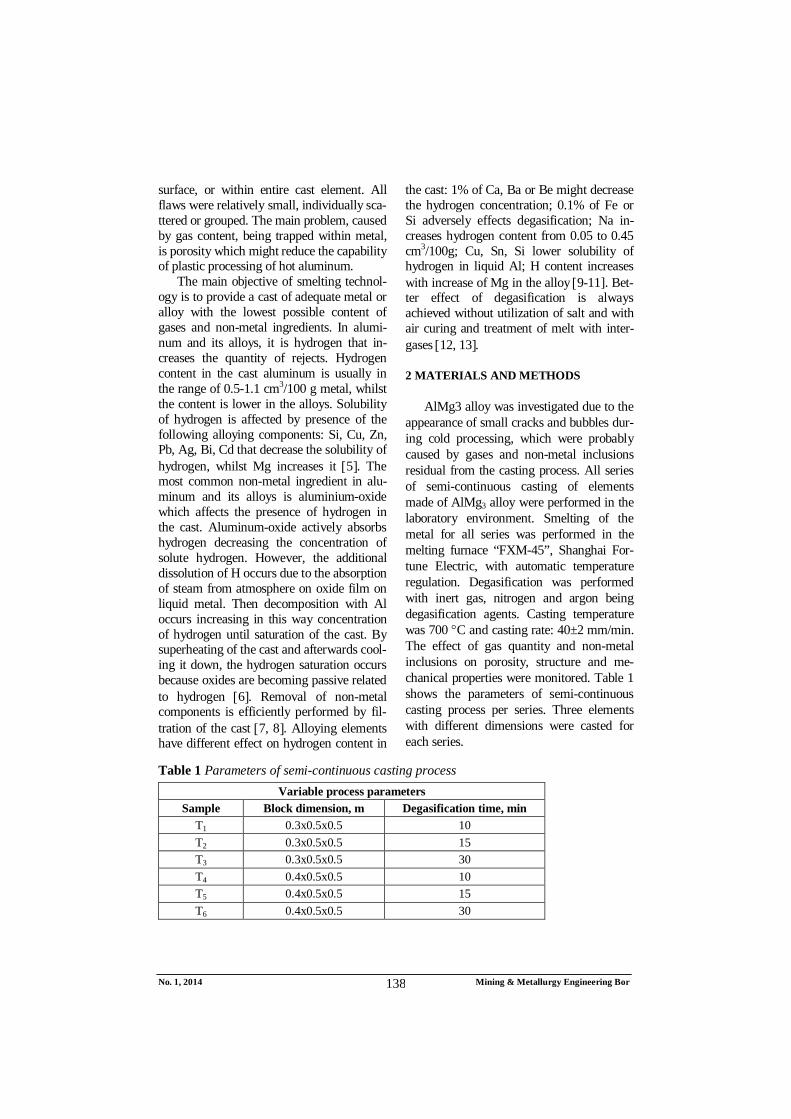
No. 1, 2014 Mining & Metallurgy Engineering Bor 138
surface, or within entire cast element. All flaws were relatively small, individually sca-ttered or grouped. The main problem, caused by gas content, being trapped within metal, is porosity which might reduce the capability of plastic processing of hot aluminum.
The main objective of smelting technol-ogy is to provide a cast of adequate metal or alloy with the lowest possible content of gases and non-metal ingredients. In alumi-num and its alloys, it is hydrogen that in-creases the quantity of rejects. Hydrogen content in the cast aluminum is usually in the range of 0.5-1.1 cm3/100 g metal, whilst the content is lower in the alloys. Solubility of hydrogen is affected by presence of the following alloying components: Si, Cu, Zn, Pb, Ag, Bi, Cd that decrease the solubility of hydrogen, whilst Mg increases it 5. The most common non-metal ingredient in alu-minum and its alloys is aluminium-oxide which affects the presence of hydrogen in the cast. Aluminum-oxide actively absorbs hydrogen decreasing the concentration of solute hydrogen. However, the additional dissolution of H occurs due to the absorption of steam from atmosphere on oxide film on liquid metal. Then decomposition with Al occurs increasing in this way concentration of hydrogen until saturation of the cast. By superheating of the cast and afterwards cool-ing it down, the hydrogen saturation occurs because oxides are becoming passive related to hydrogen 6. Removal of non-metal components is efficiently performed by fil-tration of the cast 7, 8. Alloying elements have different effect on hydrogen content in
the cast: 1% of Ca, Ba or Be might decrease the hydrogen concentration; 0.1% of Fe or Si adversely effects degasification; Na in-creases hydrogen content from 0.05 to 0.45 cm3/100g; Cu, Sn, Si lower solubility of hydrogen in liquid Al; H content increases with increase of Mg in the alloy 9-11]. Bet-ter effect of degasification is always achieved without utilization of salt and with air curing and treatment of melt with inter-gases 12, 13.
2 MATERIALS AND METHODS
AlMg3 alloy was investigated due to the appearance of small cracks and bubbles dur-ing cold processing, which were probably caused by gases and non-metal inclusions residual from the casting process. All series of semi-continuous casting of elements made of AlMg3 alloy were performed in the laboratory environment. Smelting of the metal for all series was performed in the melting furnace “FXM-45”, Shanghai For-tune Electric, with automatic temperature regulation. Degasification was performed with inert gas, nitrogen and argon being degasification agents. Casting temperature was 700 C and casting rate: 40±2 mm/min. The effect of gas quantity and non-metal inclusions on porosity, structure and me-chanical properties were monitored. Table 1 shows the parameters of semi-continuous casting process per series. Three elements with different dimensions were casted for each series.
Table 1 Parameters of semi-continuous casting process
Variable process parameters Sample Block dimension, m Degasification time, min
T1 0.3x0.5x0.5 10 T2 0.3x0.5x0.5 15 T3 0.3x0.5x0.5 30 T4 0.4x0.5x0.5 10 T5 0.4x0.5x0.5 15 T6 0.4x0.5x0.5 30
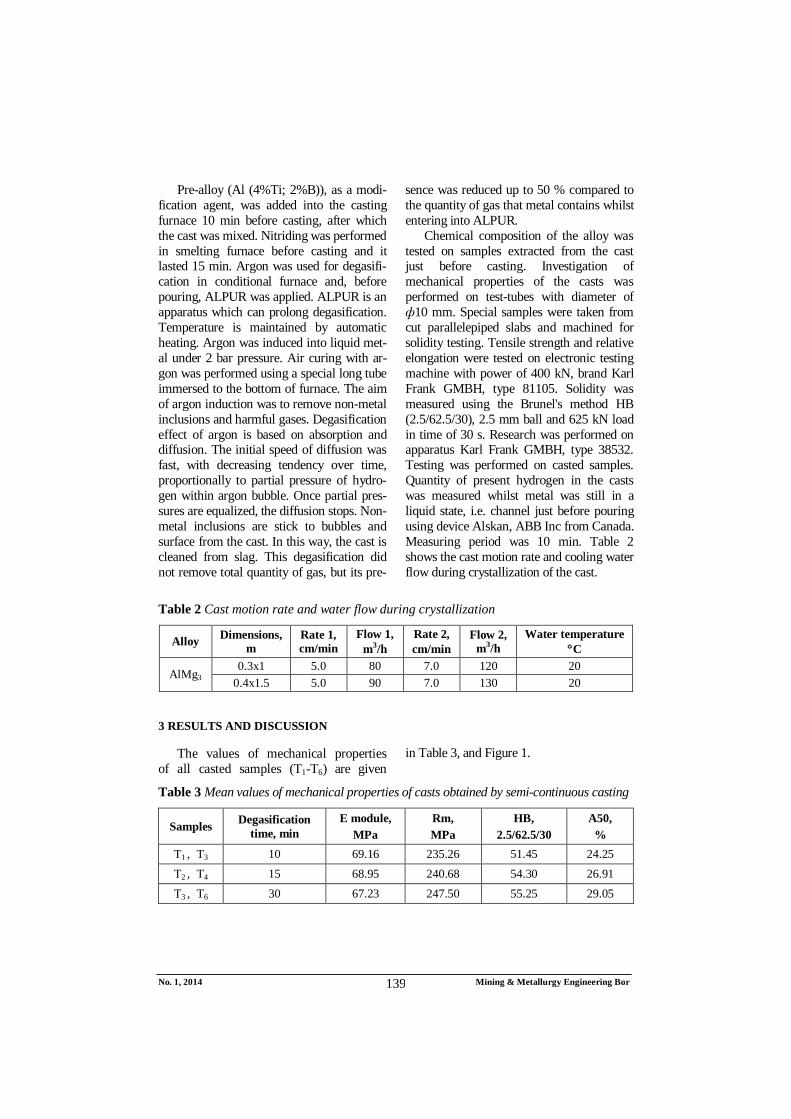
No. 1, 2014 Mining & Metallurgy Engineering Bor 139
Pre-alloy (Al (4%Ti; 2%B)), as a modi-fication agent, was added into the casting furnace 10 min before casting, after which the cast was mixed. Nitriding was performed in smelting furnace before casting and it lasted 15 min. Argon was used for degasifi-cation in conditional furnace and, before pouring, ALPUR was applied. ALPUR is an apparatus which can prolong degasification. Temperature is maintained by automatic heating. Argon was induced into liquid met-al under 2 bar pressure. Air curing with ar-gon was performed using a special long tube immersed to the bottom of furnace. The aim of argon induction was to remove non-metal inclusions and harmful gases. Degasification effect of argon is based on absorption and diffusion. The initial speed of diffusion was fast, with decreasing tendency over time, proportionally to partial pressure of hydro-gen within argon bubble. Once partial pres-sures are equalized, the diffusion stops. Non-metal inclusions are stick to bubbles and surface from the cast. In this way, the cast is cleaned from slag. This degasification did not remove total quantity of gas, but its pre-
sence was reduced up to 50 % compared to the quantity of gas that metal contains whilst entering into ALPUR.
Chemical composition of the alloy was tested on samples extracted from the cast just before casting. Investigation of mechanical properties of the casts was performed on test-tubes with diameter of ф10 mm. Special samples were taken from cut parallelepiped slabs and machined for solidity testing. Tensile strength and relative elongation were tested on electronic testing machine with power of 400 kN, brand Karl Frank GMBH, type 81105. Solidity was measured using the Brunel's method HB (2.5/62.5/30), 2.5 mm ball and 625 kN load in time of 30 s. Research was performed on apparatus Karl Frank GMBH, type 38532. Testing was performed on casted samples. Quantity of present hydrogen in the casts was measured whilst metal was still in a liquid state, i.e. channel just before pouring using device Alskan, ABB Inc from Canada. Measuring period was 10 min. Table 2 shows the cast motion rate and cooling water flow during crystallization of the cast.
Table 2 Cast motion rate and water flow during crystallization
Alloy Dimensions, m
Rate 1, cm/min
Flow 1, m3/h
Rate 2, cm/min
Flow 2, m3/h
Water temperature C
AlMg3 0.3x1 5.0 80 7.0 120 20
0.4x1.5 5.0 90 7.0 130 20
3 RESULTS AND DISCUSSION
The values of mechanical properties of all casted samples (T1-T6) are given
in Table 3, and Figure 1.
Table 3 Mean values of mechanical properties of casts obtained by semi-continuous casting
Samples Degasification time, min
E module, MPa
Rm, MPa
HB, 2.5/62.5/30
A50, %
T1 , T3 10 69.16 235.26 51.45 24.25 T2 , T4 15 68.95 240.68 54.30 26.91 T3 , T6 30 67.23 247.50 55.25 29.05
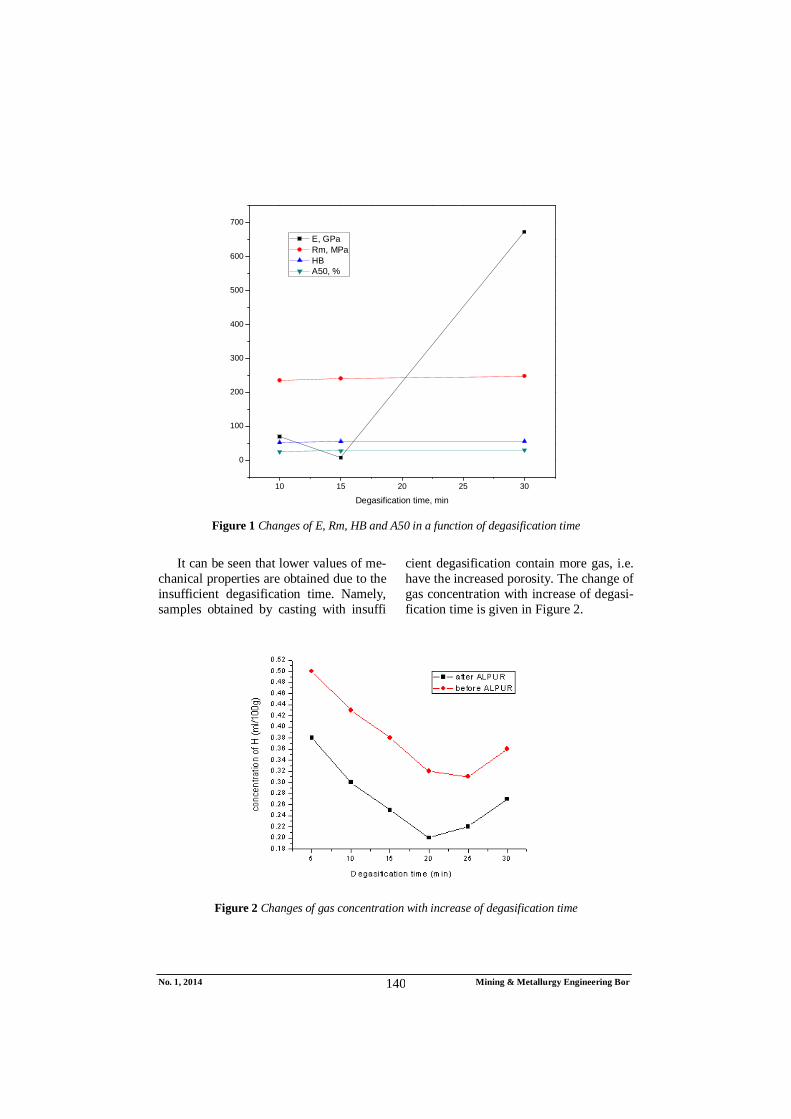
No. 1, 2014 Mining & Metallurgy Engineering Bor 140
10 15 20 25 30
0
100
200
300
400
500
600
700
Degasification time, min
E, GPa Rm, MPa HB A50, %
Figure 1 Changes of E, Rm, HB and A50 in a function of degasification time
It can be seen that lower values of me-
chanical properties are obtained due to the insufficient degasification time. Namely, samples obtained by casting with insuffi
cient degasification contain more gas, i.e. have the increased porosity. The change of gas concentration with increase of degasi-fication time is given in Figure 2.
Figure 2 Changes of gas concentration with increase of degasification time
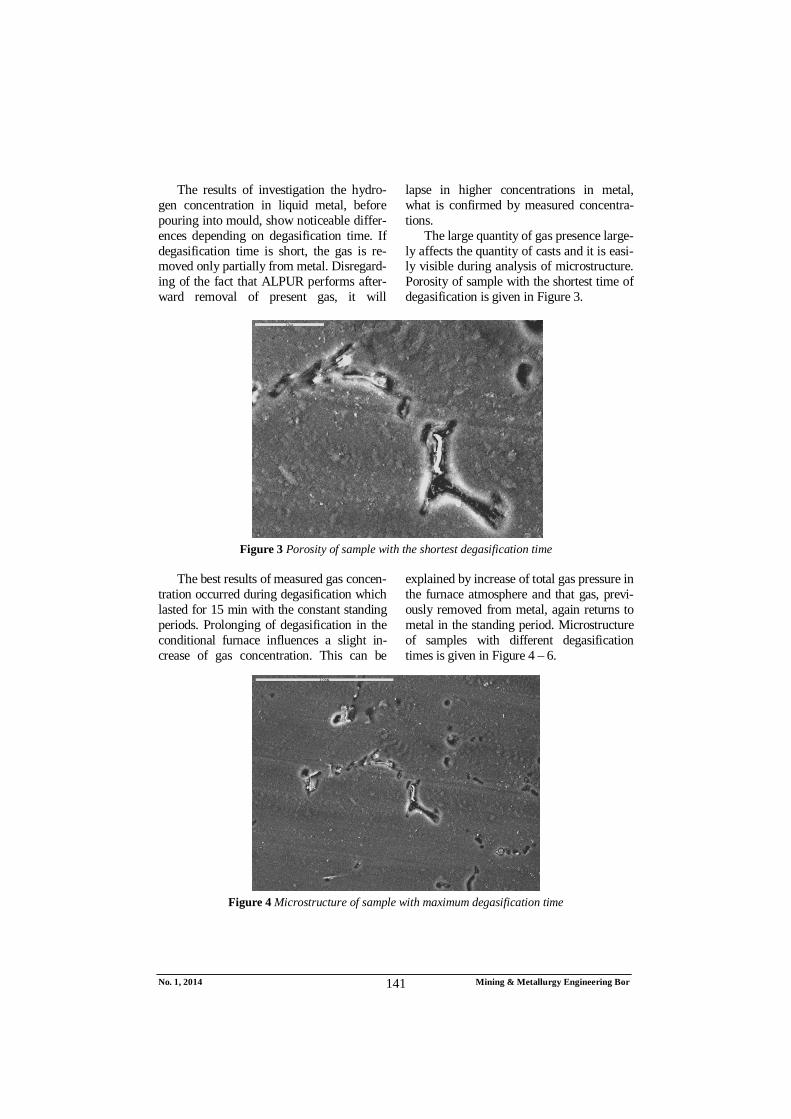
No. 1, 2014 Mining & Metallurgy Engineering Bor 141
The results of investigation the hydro-gen concentration in liquid metal, before pouring into mould, show noticeable differ-ences depending on degasification time. If degasification time is short, the gas is re-moved only partially from metal. Disregard-ing of the fact that ALPUR performs after-ward removal of present gas, it will
lapse in higher concentrations in metal, what is confirmed by measured concentra-tions.
The large quantity of gas presence large-ly affects the quantity of casts and it is easi-ly visible during analysis of microstructure. Porosity of sample with the shortest time of degasification is given in Figure 3.
Figure 3 Porosity of sample with the shortest degasification time
The best results of measured gas concen-
tration occurred during degasification which lasted for 15 min with the constant standing periods. Prolonging of degasification in the conditional furnace influences a slight in-crease of gas concentration. This can be
explained by increase of total gas pressure in the furnace atmosphere and that gas, previ-ously removed from metal, again returns to metal in the standing period. Microstructure of samples with different degasification times is given in Figure 4 – 6.
Figure 4 Microstructure of sample with maximum degasification time
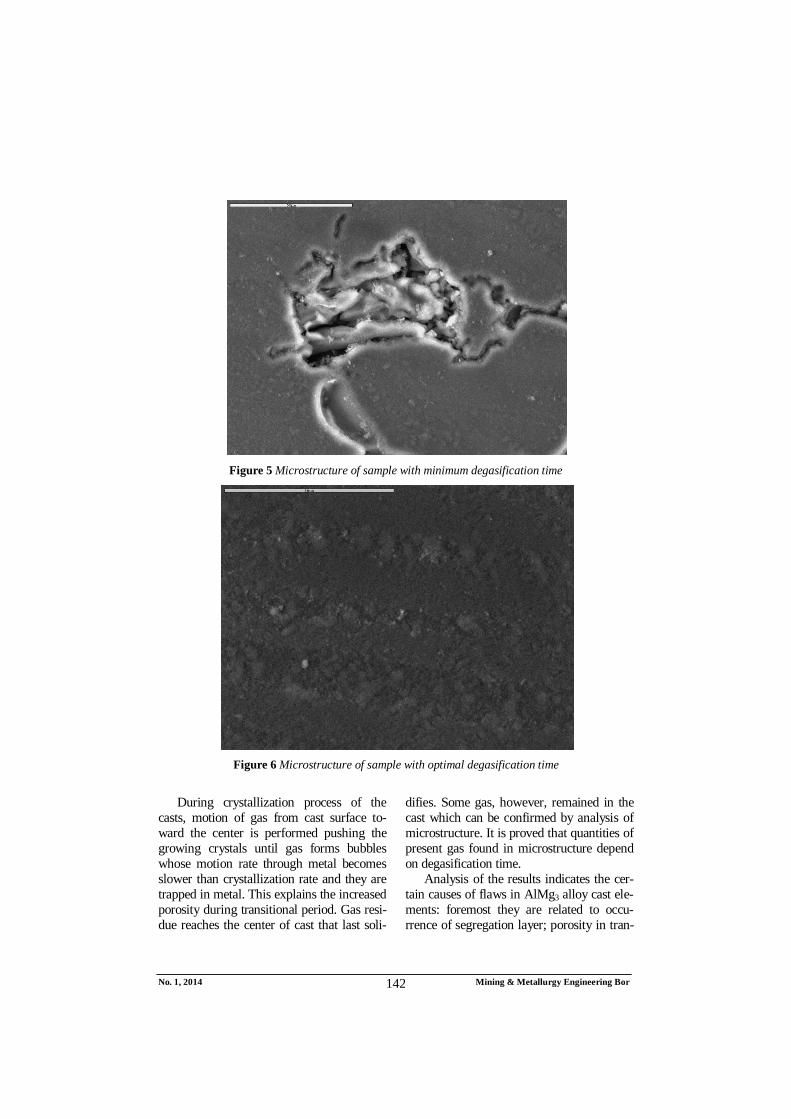
No. 1, 2014 Mining & Metallurgy Engineering Bor 142
Figure 5 Microstructure of sample with minimum degasification time
Figure 6 Microstructure of sample with optimal degasification time
During crystallization process of the
casts, motion of gas from cast surface to-ward the center is performed pushing the growing crystals until gas forms bubbles whose motion rate through metal becomes slower than crystallization rate and they are trapped in metal. This explains the increased porosity during transitional period. Gas resi-due reaches the center of cast that last soli-
difies. Some gas, however, remained in the cast which can be confirmed by analysis of microstructure. It is proved that quantities of present gas found in microstructure depend on degasification time.
Analysis of the results indicates the cer-tain causes of flaws in AlMg3 alloy cast ele-ments: foremost they are related to occu-rrence of segregation layer; porosity in tran-
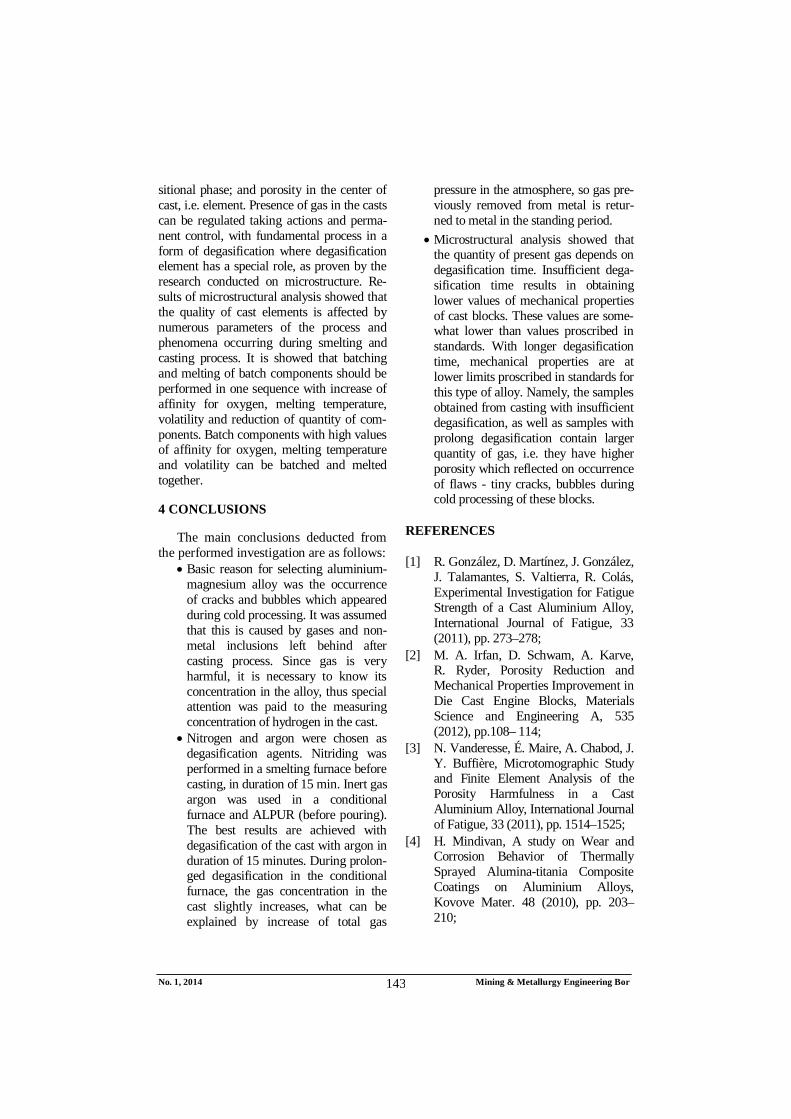
No. 1, 2014 Mining & Metallurgy Engineering Bor 143
sitional phase; and porosity in the center of cast, i.e. element. Presence of gas in the casts can be regulated taking actions and perma-nent control, with fundamental process in a form of degasification where degasification element has a special role, as proven by the research conducted on microstructure. Re-sults of microstructural analysis showed that the quality of cast elements is affected by numerous parameters of the process and phenomena occurring during smelting and casting process. It is showed that batching and melting of batch components should be performed in one sequence with increase of affinity for oxygen, melting temperature, volatility and reduction of quantity of com-ponents. Batch components with high values of affinity for oxygen, melting temperature and volatility can be batched and melted together.
4 CONCLUSIONS
The main conclusions deducted from the performed investigation are as follows:
Basic reason for selecting aluminium-magnesium alloy was the occurrence of cracks and bubbles which appeared during cold processing. It was assumed that this is caused by gases and non-metal inclusions left behind after casting process. Since gas is very harmful, it is necessary to know its concentration in the alloy, thus special attention was paid to the measuring concentration of hydrogen in the cast.
Nitrogen and argon were chosen as degasification agents. Nitriding was performed in a smelting furnace before casting, in duration of 15 min. Inert gas argon was used in a conditional furnace and ALPUR (before pouring). The best results are achieved with degasification of the cast with argon in duration of 15 minutes. During prolon-ged degasification in the conditional furnace, the gas concentration in the cast slightly increases, what can be explained by increase of total gas
pressure in the atmosphere, so gas pre-viously removed from metal is retur-ned to metal in the standing period.
Microstructural analysis showed that the quantity of present gas depends on degasification time. Insufficient dega-sification time results in obtaining lower values of mechanical properties of cast blocks. These values are some-what lower than values proscribed in standards. With longer degasification time, mechanical properties are at lower limits proscribed in standards for this type of alloy. Namely, the samples obtained from casting with insufficient degasification, as well as samples with prolong degasification contain larger quantity of gas, i.e. they have higher porosity which reflected on occurrence of flaws - tiny cracks, bubbles during cold processing of these blocks.
REFERENCES
[1] R. González, D. Martínez, J. González, J. Talamantes, S. Valtierra, R. Colás, Experimental Investigation for Fatigue Strength of a Cast Aluminium Alloy, International Journal of Fatigue, 33 (2011), pp. 273–278;
[2] M. A. Irfan, D. Schwam, A. Karve, R. Ryder, Porosity Reduction and Mechanical Properties Improvement in Die Cast Engine Blocks, Materials Science and Engineering A, 535 (2012), pp.108– 114;
[3] N. Vanderesse, É. Maire, A. Chabod, J. Y. Buffière, Microtomographic Study and Finite Element Analysis of the Porosity Harmfulness in a Cast Aluminium Alloy, International Journal of Fatigue, 33 (2011), pp. 1514–1525;
[4] H. Mindivan, A study on Wear and Corrosion Behavior of Thermally Sprayed Alumina-titania Composite Coatings on Aluminium Alloys, Kovove Mater. 48 (2010), pp. 203–210;
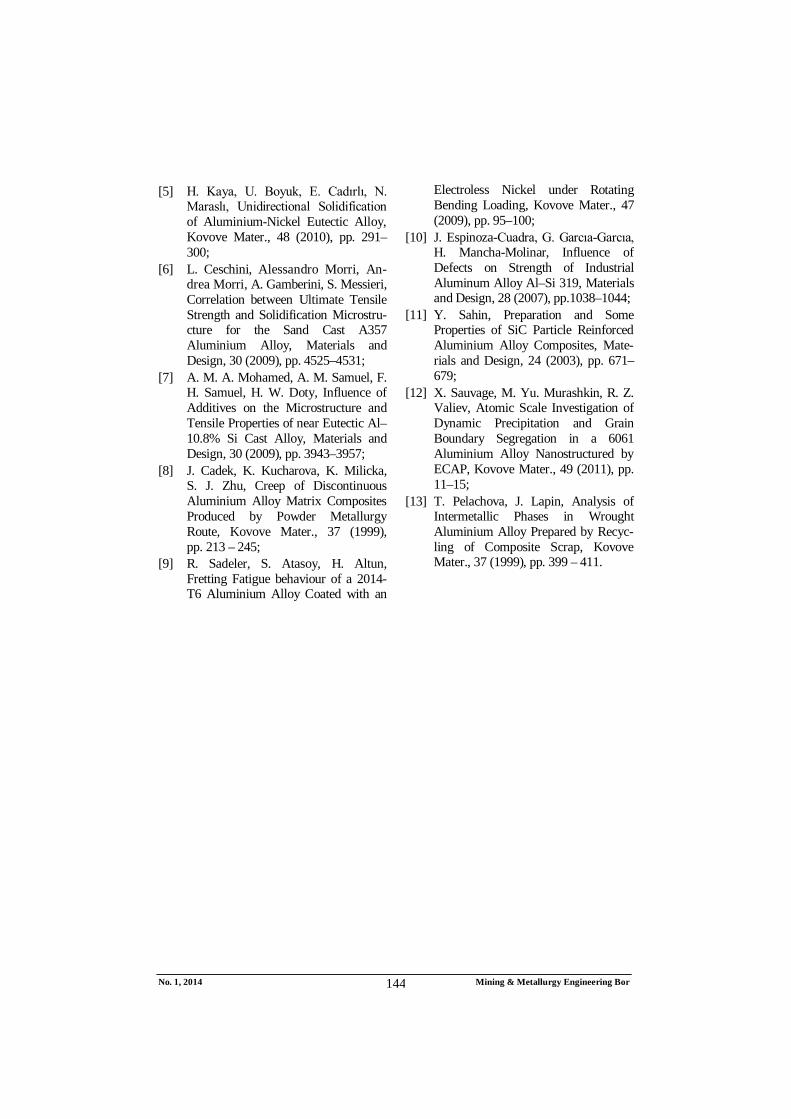
No. 1, 2014 Mining & Metallurgy Engineering Bor 144
[5] H. Kaya, U. Boyuk, E. Cadırlı, N. Maraslı, Unidirectional Solidification of Aluminium-Nickel Eutectic Alloy, Kovove Mater., 48 (2010), pp. 291–300;
[6] L. Ceschini, Alessandro Morri, An-drea Morri, A. Gamberini, S. Messieri, Correlation between Ultimate Tensile Strength and Solidification Microstru-cture for the Sand Cast A357 Aluminium Alloy, Materials and Design, 30 (2009), pp. 4525–4531;
[7] A. M. A. Mohamed, A. M. Samuel, F. H. Samuel, H. W. Doty, Influence of Additives on the Microstructure and Tensile Properties of near Eutectic Al–10.8% Si Cast Alloy, Materials and Design, 30 (2009), pp. 3943–3957;
[8] J. Cadek, K. Kucharova, K. Milicka, S. J. Zhu, Creep of Discontinuous Aluminium Alloy Matrix Composites Produced by Powder Metallurgy Route, Kovove Mater., 37 (1999), pp. 213 – 245;
[9] R. Sadeler, S. Atasoy, H. Altun, Fretting Fatigue behaviour of a 2014-T6 Aluminium Alloy Coated with an
Electroless Nickel under Rotating Bending Loading, Kovove Mater., 47 (2009), pp. 95–100;
[10] J. Espinoza-Cuadra, G. Garcıa-Garcıa, H. Mancha-Molinar, Influence of Defects on Strength of Industrial Aluminum Alloy Al–Si 319, Materials and Design, 28 (2007), pp.1038–1044;
[11] Y. Sahin, Preparation and Some Properties of SiC Particle Reinforced Aluminium Alloy Composites, Mate-rials and Design, 24 (2003), pp. 671–679;
[12] X. Sauvage, M. Yu. Murashkin, R. Z. Valiev, Atomic Scale Investigation of Dynamic Precipitation and Grain Boundary Segregation in a 6061 Aluminium Alloy Nanostructured by ECAP, Kovove Mater., 49 (2011), pp. 11–15;
[13] T. Pelachova, J. Lapin, Analysis of Intermetallic Phases in Wrought Aluminium Alloy Prepared by Recyc-ling of Composite Scrap, Kovove Mater., 37 (1999), pp. 399 – 411.
Broj 1, 2014. Mining & Metallurgy Engineering Bor 145
INSTITUT ZA RUDARSTVO I METALURGIJU BOR ISSN: 2334-8836 UDK: 622
UDK: 669.7.018/.721:658.567(045)=861 DOI:10.5937/MMEB1401137A
Zagorka Aćimović*, Anja Terzić**, Ljubiša Andrić***, Vera Stojanović****, Marko Pavlović*
GREŠKE NA ELEMENTIMA OD ALUMINIJUM-MAGNEZIJUM LEGURE - UTICAJ UKLJUČAKA*****
Izvod
Rezultati ispitivanja uticaja uklanjanja gasa iz tečnog metala na kvalitet livenih elemenata od aluminijum-magnezijum legure, a na bazi recikliranih materijala su dati ovom radu. Dobijeni rezultati praktično definišu proceduru livenja kojom se može umanjiti prisustvo uključaka i gasova u livenim elementima, što je osnovni preduslov za postizanje projektovanog kvaliteta livenog materijala i krajnjih proizvoda. Ispitivani su kinetika i mehanizmi procesa degasifikacije, zatim su definisani parametri procesa degasifikacije, i na posletku primenjeni novi agensi za degasifikaciju legura. Rezultati ovog ispitivanja su značajni sa ekološkog aspekta i sa aspekta održivog razvoja proizvodnje livenih elemenata od aluminijumskih legura.
Ključne reči: aluminijum-magnezijum legure, ukljičci, kvalitet odlivaka, otpadne sirovine
* Beogradski Univerzitet, TMF, Karnegijeva 4, Beograd, Srbija ** Institut IMS, Vojvode Mišića Blv. 43, Beograd, Srbija, [email protected] *** Institut ITNMS, Franchet d’Esperey st. 96, Beograd, Srbija **** Beogradski Univerzitet, Beograd, Srbija, [email protected] ***** Ovo istraživanje je sprovedeno zahvaljujući podršci Ministarstva prosvete, nauke i tehnološkog
razvoja RS, a u okviru projekata: 33007 „Implementacija savremenijih tehničko-tehnoloških i ekoloških rešenja u postojećim proizvodnim sistemima Rudnika bakra Bor i Rudnika bakra Majdanpek“, 172057 i 45008.
1. UVOD
Cilj u savremenom livarstvu je ispu-njenje zahteva u pogledu sastava, strukture, svojstava, i kvaliteta odlivka. Odlivak ne sme imati nikakve greške koje bi mogle da ograniče njegovu upotrebu 1. Struktura koja se formira pod različitim uslovima hlađenja, u nekoj određenoj metodi livenje, utiče na razilčita krajnja, upotrebna svojstva dobijenih odlivaka. Isto tako, na kvalitet odlivaka utiču i parametri tehnologije livenja. Otkrivanje i evaluacija grešaka pri livenju mora da se obavlja sistematično u razvojnoj etapi procesa kako bi se izbegle
greške 2. Aluminijum-magnezijum legure su značajna grupa legura, najpre zbog visoke mehaničke čvrstoće postignute bez termičke obrade, a zatim i zbog visoke otpornosti na koroziju, dobre prionljivosti, itd 3, 4. Ispi-tivan je uticaj nemetalnih uključaka i gasova na kvalitet aluminijumskih elemenata dobi-jenih na bazi AlMg3 legure metodom polu-kontinualnog livenja. Pošto su u proizvodnji Al-Mg legura korišćene reciklažne sirovine, određene greške kao što su zarobljeni gasovi ili uključci, su se pojavljivale u odlivcima tokom ispitivanja. Greške su pozicionirane
Broj 1, 2014. Mining & Metallurgy Engineering Bor 146
interno - kao substruktura površine ili greške rasprostranjene po celom elementu. U pog-ledu veličine greške su bile male, ili pojedi-načno rasute, ili u grupama. Osnovni prob-lem koji prouzrokuje prisustvo gasa u meta-lu je nastanak različitih oblika poroznosti koji umanjuju sposobnost plastičnog preso-vanja vrućeg aluminijuma.
Jedan od glavnih ciljeva tehnologije topljenja je: dobiti rastop metala ili legure sa najnižim mogućim sadržajem gasa i nemetalnih konstituenata. U aluminijumu i njegovim legurama, vodonik direktno uti-če na formiranje škartova. Sadržaj vodo-nika u livenom aluminijumu je obično u granicama 0,5-1,1cm3/100 g metala, dok je u legurama sadržaj nešto niži. Rastvorljivost vodonika je određena prisustvom sledećih legirajućih kompomentui: Si, Cu, Zn, Pb, Ag, Bi, Cd uslovljava smanjenje rastvorlji-vosti vodonika; dok je Mg povećava 5. Najčešći nemetalni sastojak u aluminijumu i njegovim legurama je aluminijum-oksid, koji utiče na prisustvo vodonika u rastopu legure. Aluminijum-oksid aktivno apsorbuje vodonik u toku livenja, što dalje umanjuje koncentraciju rastvorenog vodonika. Među-tim, dolazi do dodatnog rastvaranja H usled apsorpcije pare iz atmosfere na filmu oksida koji se formirao na na rastopu metala. Zatim dolazio do njegovog razgrađivanje sa Al, povećavajući na taj način koncentraciju vodonika do saturacije. Pregrevanjem rastopa i potom hlađenjem dolazi do saturacije, jer oksidi postaju pasivni prema vodoniku 6. Uklanjanje nemetalnih sas-tojaka se efikasno obavlja filtracijom
odlivka 7, 8. Legirajući elementi imaju različiti uticaj na sadržaj vodonika u odlivku: 1% Ca, Ba ili Be utiče na uma-njenje sadržaja vodonika; 0,1 % Fe ili Si ima suprotan efekat na degasifikaciju; Na utiče na povećavnje sadržaja vodonika u količini 0,05 do 0,45 cm3/100 g; Cu, Sn, Si smanjuju rastvorljivost vodonika u tečnom Al. Sadržaj vodonika se povećava sa povećanjem sadržaja Mg u leguri 9-11. Bolji efekat degasifikacije se postiže bez primene soli i tretiranjem rastopa internim gasovima 12,13.
2. MATERIJALI I METODE
AlMg3 legura je ispitivana zbog pojave sitnih pukotina ili mehurića u toku hladne obrade legure, koji su najverovatnije prouz-rokovani zaostatkom gasova i nemetalnih uključaka u toku livenja. Sve serije polu-kontinualo livenih elemenata od legure AlMg3 spravljene su u laboratorijskim uslovima. Topljenje metala za sve serije obavljeno je u peći za “FXM-45”, Shanghai Fortune Electric, sa automatskom regu-lacijom temperature. Degasifikacija je obavljena pomoću inertnog gasa, azot i argon su korišćeni kao degasifikacioni agensi. Temperatura livenja je bila 700 C a brzina livenja 40±2 mm/min. Praćen je uticaj količine gasa i nemetalnih uključaka na pojavu poroznosti, strukturu i mehanička svojstva. U Tabeli 1. su dati procesni parametri polu-kontinuiranog livenja po serijama. Za svaku seriju livena su po tri elementa različitih dimenzija.
Tabela 1. Parametri procesa polu-kontinualnog livenja Promenjivi parametri procesa
Uzorci Dimenzije, m Vreme degasifikacije, min T1 0.3x0.5x0.5 10 T2 0.3x0.5x0.5 15 T3 0.3x0.5x0.5 30 T4 0.4x0.5x0.5 10 T5 0.4x0.5x0.5 15 T6 0.4x0.5x0.5 30
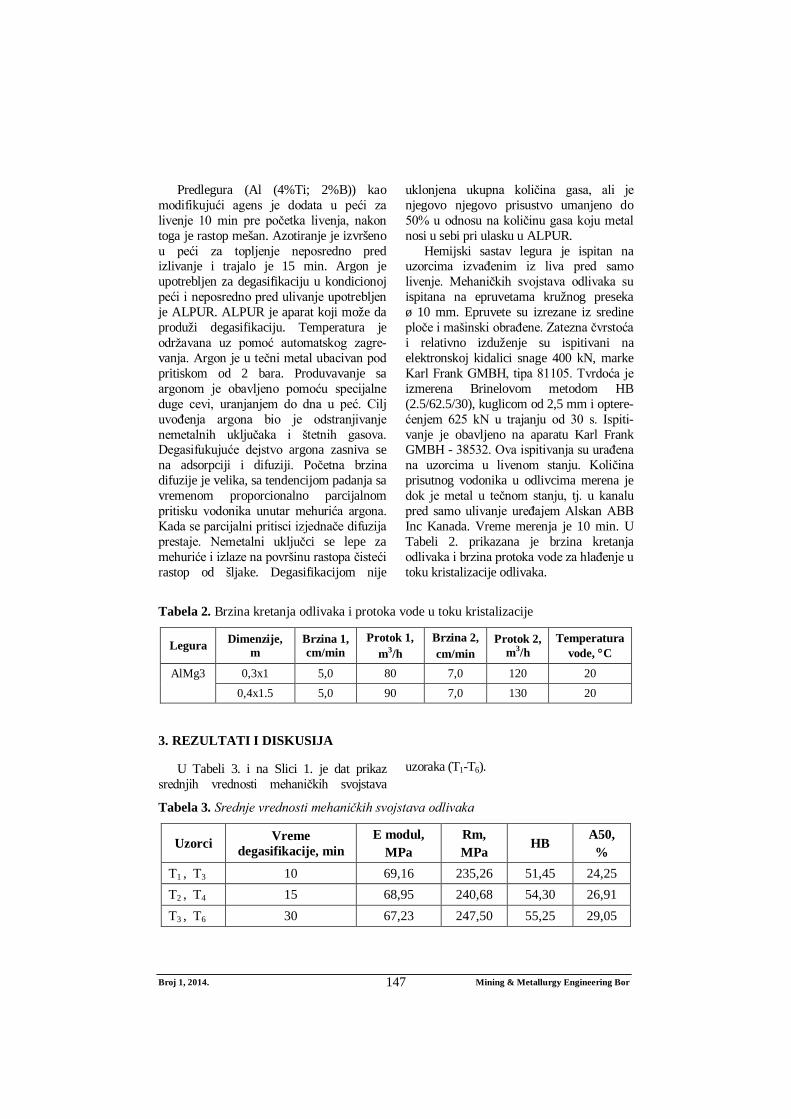
Broj 1, 2014. Mining & Metallurgy Engineering Bor 147
Predlegura (Al (4%Ti; 2%B)) kao modifikujući agens je dodata u peći za livenje 10 min pre početka livenja, nakon toga je rastop mešan. Azotiranje je izvršeno u peći za topljenje neposredno pred izlivanje i trajalo je 15 min. Argon je upotrebljen za degasifikaciju u kondicionoj peći i neposredno pred ulivanje upotrebljen je ALPUR. ALPUR je aparat koji može da produži degasifikaciju. Temperatura je održavana uz pomoć automatskog zagre-vanja. Argon je u tečni metal ubacivan pod pritiskom od 2 bara. Produvavanje sa argonom je obavljeno pomoću specijalne duge cevi, uranjanjem do dna u peć. Cilj uvođenja argona bio je odstranjivanje nemetalnih uključaka i štetnih gasova. Degasifukujuće dejstvo argona zasniva se na adsorpciji i difuziji. Početna brzina difuzije je velika, sa tendencijom padanja sa vremenom proporcionalno parcijalnom pritisku vodonika unutar mehurića argona. Kada se parcijalni pritisci izjednače difuzija prestaje. Nemetalni uključci se lepe za mehuriće i izlaze na površinu rastopa čisteći rastop od šljake. Degasifikacijom nije
uklonjena ukupna količina gasa, ali je njegovo njegovo prisustvo umanjeno do 50% u odnosu na količinu gasa koju metal nosi u sebi pri ulasku u ALPUR.
Hemijski sastav legura je ispitan na uzorcima izvađenim iz liva pred samo livenje. Mehaničkih svojstava odlivaka su ispitana na epruvetama kružnog preseka ø 10 mm. Epruvete su izrezane iz sredine ploče i mašinski obrađene. Zatezna čvrstoća i relativno izduženje su ispitivani na elektronskoj kidalici snage 400 kN, marke Karl Frank GMBH, tipa 81105. Tvrdoća je izmerena Brinelovom metodom HB (2.5/62.5/30), kuglicom od 2,5 mm i optere-ćenjem 625 kN u trajanju od 30 s. Ispiti-vanje je obavljeno na aparatu Karl Frank GMBH - 38532. Ova ispitivanja su urađena na uzorcima u livenom stanju. Količina prisutnog vodonika u odlivcima merena je dok je metal u tečnom stanju, tj. u kanalu pred samo ulivanje uređajem Alskan ABB Inc Kanada. Vreme merenja je 10 min. U Tabeli 2. prikazana je brzina kretanja odlivaka i brzina protoka vode za hlađenje u toku kristalizacije odlivaka.
Tabela 2. Brzina kretanja odlivaka i protoka vode u toku kristalizacije
Legura Dimenzije, m
Brzina 1, cm/min
Protok 1, m3/h
Brzina 2, cm/min
Protok 2, m3/h
Temperatura vode, C
AlMg3 0,3x1 5,0 80 7,0 120 20 0,4x1.5 5,0 90 7,0 130 20
3. REZULTATI I DISKUSIJA
U Tabeli 3. i na Slici 1. je dat prikaz srednjih vrednosti mehaničkih svojstava
uzoraka (T1-T6).
Tabela 3. Srednje vrednosti mehaničkih svojstava odlivaka
Uzorci Vreme degasifikacije, min
E modul, MPa
Rm, MPa
HB A50, %
T1 , T3 10 69,16 235,26 51,45 24,25 T2 , T4 15 68,95 240,68 54,30 26,91 T3 , T6 30 67,23 247,50 55,25 29,05
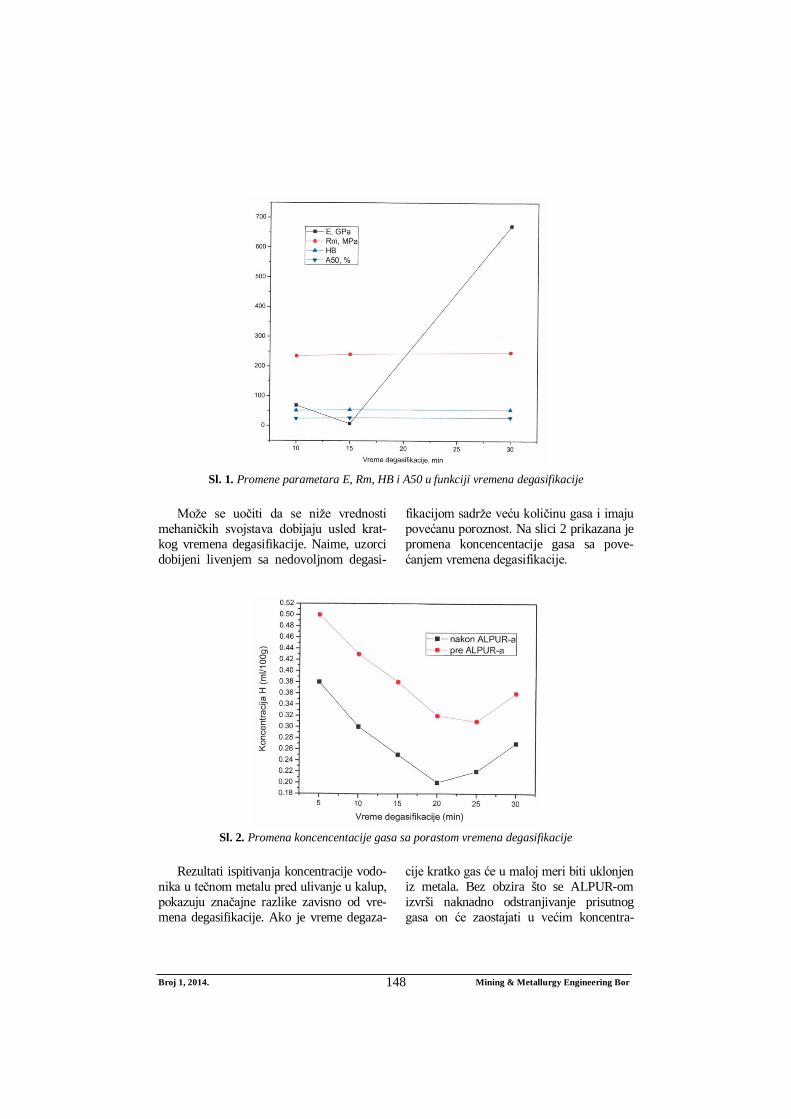
Broj 1, 2014. Mining & Metallurgy Engineering Bor 148
Sl. 1. Promene parametara E, Rm, HB i A50 u funkciji vremena degasifikacije
Može se uočiti da se niže vrednosti
mehaničkih svojstava dobijaju usled krat-kog vremena degasifikacije. Naime, uzorci dobijeni livenjem sa nedovoljnom degasi-
fikacijom sadrže veću količinu gasa i imaju povećanu poroznost. Na slici 2 prikazana je promena koncencentacije gasa sa pove-ćanjem vremena degasifikacije.
Sl. 2. Promena koncencentacije gasa sa porastom vremena degasifikacije
Rezultati ispitivanja koncentracije vodo-
nika u tečnom metalu pred ulivanje u kalup, pokazuju značajne razlike zavisno od vre-mena degasifikacije. Ako je vreme degaza-
cije kratko gas će u maloj meri biti uklonjen iz metala. Bez obzira što se ALPUR-om izvrši naknadno odstranjivanje prisutnog gasa on će zaostajati u većim koncentra-
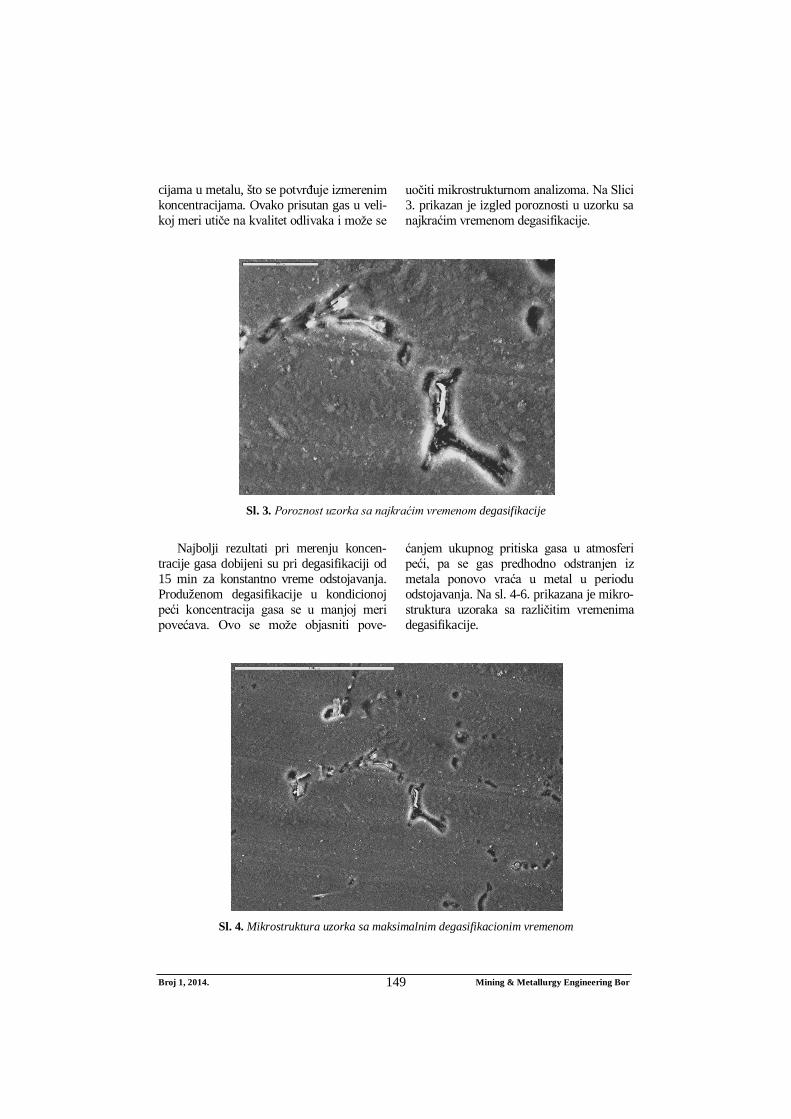
Broj 1, 2014. Mining & Metallurgy Engineering Bor 149
cijama u metalu, što se potvrđuje izmerenim koncentracijama. Ovako prisutan gas u veli-koj meri utiče na kvalitet odlivaka i može se
uočiti mikrostrukturnom analizoma. Na Slici 3. prikazan je izgled poroznosti u uzorku sa najkraćim vremenom degasifikacije.
Sl. 3. Poroznost uzorka sa najkraćim vremenom degasifikacije
Najbolji rezultati pri merenju koncen-
tracije gasa dobijeni su pri degasifikaciji od 15 min za konstantno vreme odstojavanja. Produženom degasifikacije u kondicionoj peći koncentracija gasa se u manjoj meri povećava. Ovo se može objasniti pove-
ćanjem ukupnog pritiska gasa u atmosferi peći, pa se gas predhodno odstranjen iz metala ponovo vraća u metal u periodu odstojavanja. Na sl. 4-6. prikazana je mikro-struktura uzoraka sa različitim vremenima degasifikacije.
Sl. 4. Mikrostruktura uzorka sa maksimalnim degasifikacionim vremenom
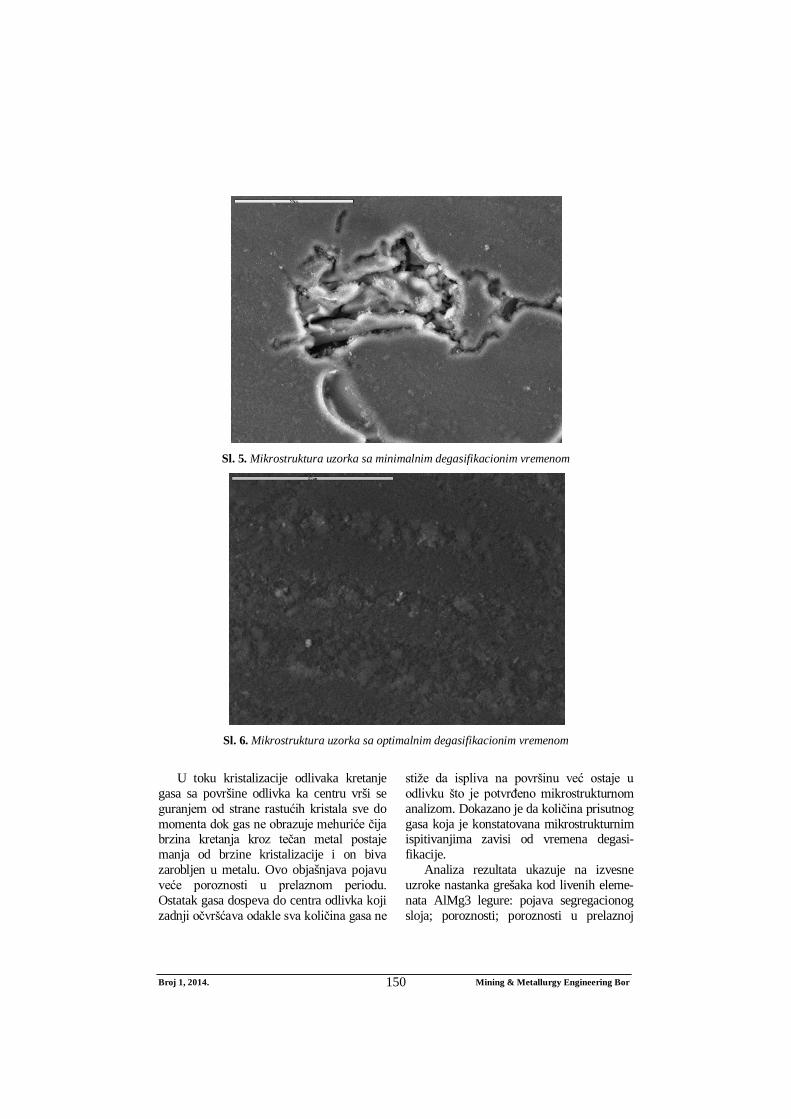
Broj 1, 2014. Mining & Metallurgy Engineering Bor 150
Sl. 5. Mikrostruktura uzorka sa minimalnim degasifikacionim vremenom
Sl. 6. Mikrostruktura uzorka sa optimalnim degasifikacionim vremenom
U toku kristalizacije odlivaka kretanje
gasa sa površine odlivka ka centru vrši se guranjem od strane rastućih kristala sve do momenta dok gas ne obrazuje mehuriće čija brzina kretanja kroz tečan metal postaje manja od brzine kristalizacije i on biva zarobljen u metalu. Ovo objašnjava pojavu veće poroznosti u prelaznom periodu. Ostatak gasa dospeva do centra odlivka koji zadnji očvršćava odakle sva količina gasa ne
stiže da ispliva na površinu već ostaje u odlivku što je potvrđeno mikrostrukturnom analizom. Dokazano je da količina prisutnog gasa koja je konstatovana mikrostrukturnim ispitivanjima zavisi od vremena degasi-fikacije.
Analiza rezultata ukazuje na izvesne uzroke nastanka grešaka kod livenih eleme-nata AlMg3 legure: pojava segregacionog sloja; poroznosti; poroznosti u prelaznoj
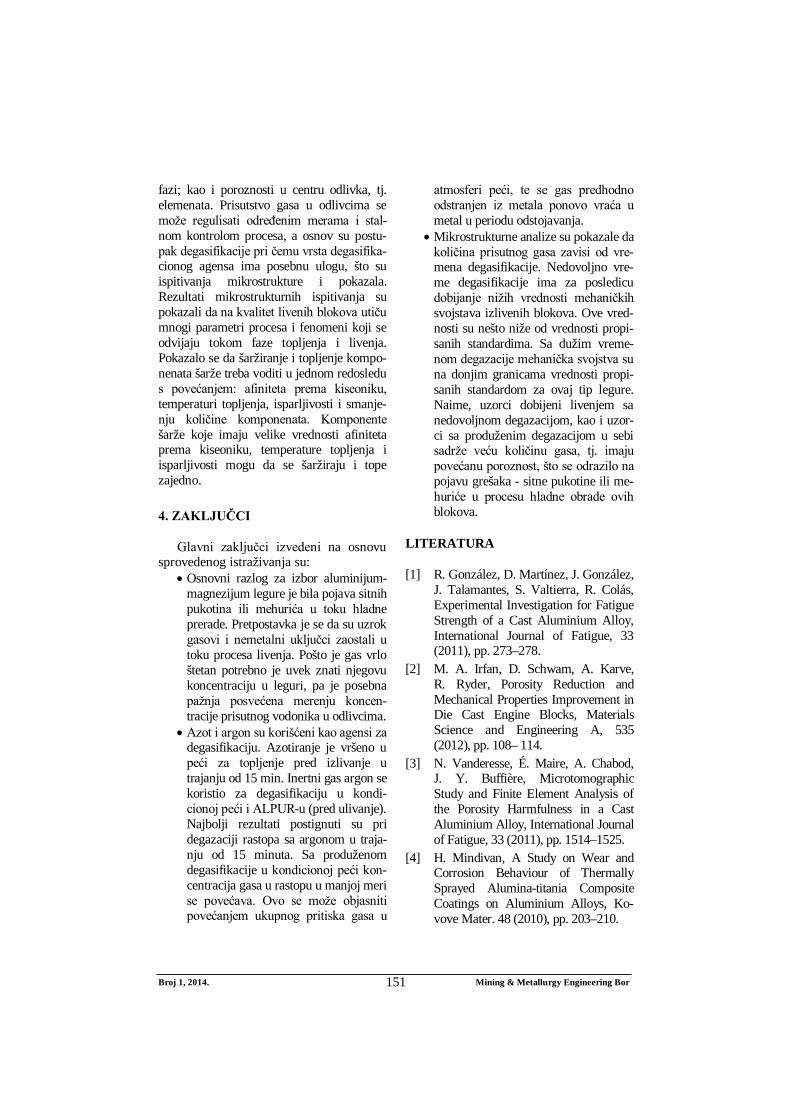
Broj 1, 2014. Mining & Metallurgy Engineering Bor 151
fazi; kao i poroznosti u centru odlivka, tj. elemenata. Prisutstvo gasa u odlivcima se može regulisati određenim merama i stal-nom kontrolom procesa, a osnov su postu-pak degasifikacije pri čemu vrsta degasifika-cionog agensa ima posebnu ulogu, što su ispitivanja mikrostrukture i pokazala. Rezultati mikrostrukturnih ispitivanja su pokazali da na kvalitet livenih blokova utiču mnogi parametri procesa i fenomeni koji se odvijaju tokom faze topljenja i livenja. Pokazalo se da šaržiranje i topljenje kompo-nenata šarže treba voditi u jednom redosledu s povećanjem: afiniteta prema kiseoniku, temperaturi topljenja, isparljivosti i smanje-nju količine komponenata. Komponente šarže koje imaju velike vrednosti afiniteta prema kiseoniku, temperature topljenja i isparljivosti mogu da se šaržiraju i tope zajedno.
4. ZAKLJUČCI
Glavni zaključci izvedeni na osnovu sprovedenog istraživanja su:
Osnovni razlog za izbor aluminijum-magnezijum legure je bila pojava sitnih pukotina ili mehurića u toku hladne prerade. Pretpostavka je se da su uzrok gasovi i nemetalni uključci zaostali u toku procesa livenja. Pošto je gas vrlo štetan potrebno je uvek znati njegovu koncentraciju u leguri, pa je posebna pažnja posvećena merenju koncen-tracije prisutnog vodonika u odlivcima.
Azot i argon su korišćeni kao agensi za degasifikaciju. Azotiranje je vršeno u peći za topljenje pred izlivanje u trajanju od 15 min. Inertni gas argon se koristio za degasifikaciju u kondi-cionoj peći i ALPUR-u (pred ulivanje). Najbolji rezultati postignuti su pri degazaciji rastopa sa argonom u traja-nju od 15 minuta. Sa produženom degasifikacije u kondicionoj peći kon-centracija gasa u rastopu u manjoj meri se povećava. Ovo se može objasniti povećanjem ukupnog pritiska gasa u
atmosferi peći, te se gas predhodno odstranjen iz metala ponovo vraća u metal u periodu odstojavanja.
Mikrostrukturne analize su pokazale da količina prisutnog gasa zavisi od vre-mena degasifikacije. Nedovoljno vre-me degasifikacije ima za posledicu dobijanje nižih vrednosti mehaničkih svojstava izlivenih blokova. Ove vred-nosti su nešto niže od vrednosti propi-sanih standardima. Sa dužim vreme-nom degazacije mehanička svojstva su na donjim granicama vrednosti propi-sanih standardom za ovaj tip legure. Naime, uzorci dobijeni livenjem sa nedovoljnom degazacijom, kao i uzor-ci sa produženim degazacijom u sebi sadrže veću količinu gasa, tj. imaju povećanu poroznost, što se odrazilo na pojavu grešaka - sitne pukotine ili me-huriće u procesu hladne obrade ovih blokova.
LITERATURA
[1] R. González, D. Martínez, J. González, J. Talamantes, S. Valtierra, R. Colás, Experimental Investigation for Fatigue Strength of a Cast Aluminium Alloy, International Journal of Fatigue, 33 (2011), pp. 273–278.
[2] M. A. Irfan, D. Schwam, A. Karve, R. Ryder, Porosity Reduction and Mechanical Properties Improvement in Die Cast Engine Blocks, Materials Science and Engineering A, 535 (2012), pp. 108– 114.
[3] N. Vanderesse, É. Maire, A. Chabod, J. Y. Buffière, Microtomographic Study and Finite Element Analysis of the Porosity Harmfulness in a Cast Aluminium Alloy, International Journal of Fatigue, 33 (2011), pp. 1514–1525.
[4] H. Mindivan, A Study on Wear and Corrosion Behaviour of Thermally Sprayed Alumina-titania Composite Coatings on Aluminium Alloys, Ko-vove Mater. 48 (2010), pp. 203–210.
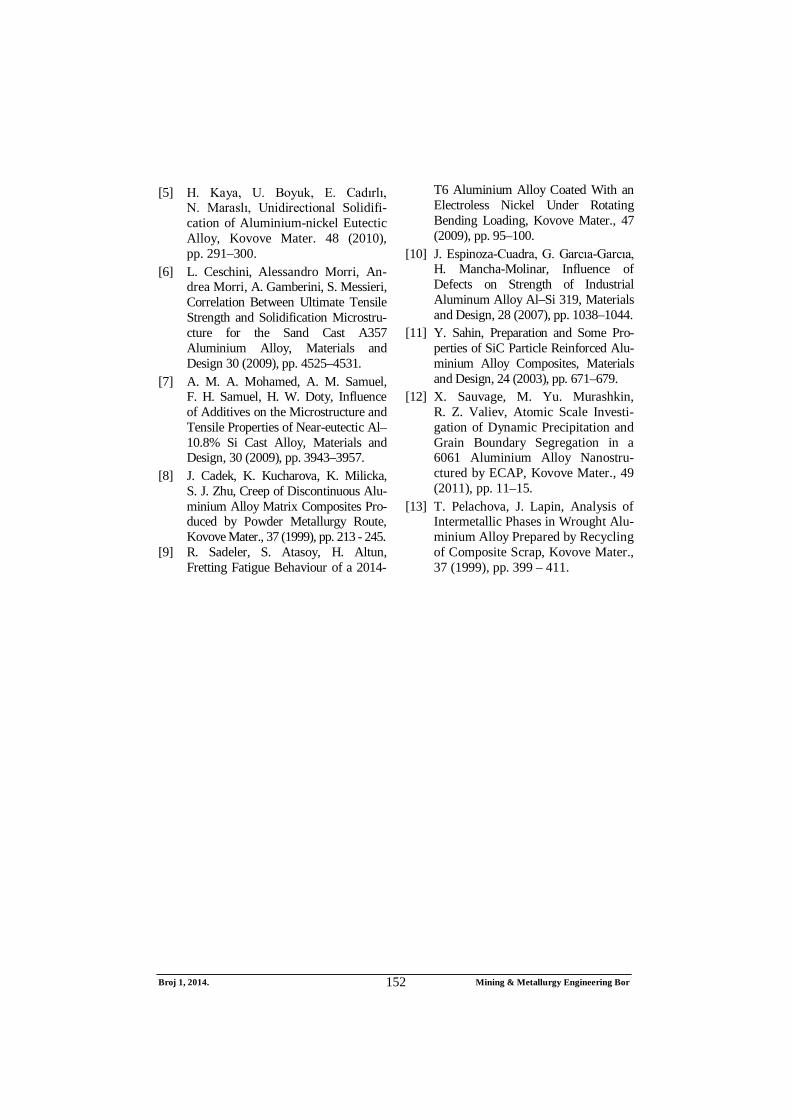
Broj 1, 2014. Mining & Metallurgy Engineering Bor 152
[5] H. Kaya, U. Boyuk, E. Cadırlı, N. Maraslı, Unidirectional Solidifi-cation of Aluminium-nickel Eutectic Alloy, Kovove Mater. 48 (2010), pp. 291–300.
[6] L. Ceschini, Alessandro Morri, An-drea Morri, A. Gamberini, S. Messieri, Correlation Between Ultimate Tensile Strength and Solidification Microstru-cture for the Sand Cast A357 Aluminium Alloy, Materials and Design 30 (2009), pp. 4525–4531.
[7] A. M. A. Mohamed, A. M. Samuel, F. H. Samuel, H. W. Doty, Influence of Additives on the Microstructure and Tensile Properties of Near-eutectic Al–10.8% Si Cast Alloy, Materials and Design, 30 (2009), pp. 3943–3957.
[8] J. Cadek, K. Kucharova, K. Milicka, S. J. Zhu, Creep of Discontinuous Alu-minium Alloy Matrix Composites Pro-duced by Powder Metallurgy Route, Kovove Mater., 37 (1999), pp. 213 - 245.
[9] R. Sadeler, S. Atasoy, H. Altun, Fretting Fatigue Behaviour of a 2014-
T6 Aluminium Alloy Coated With an Electroless Nickel Under Rotating Bending Loading, Kovove Mater., 47 (2009), pp. 95–100.
[10] J. Espinoza-Cuadra, G. Garcıa-Garcıa, H. Mancha-Molinar, Influence of Defects on Strength of Industrial Aluminum Alloy Al–Si 319, Materials and Design, 28 (2007), pp. 1038–1044.
[11] Y. Sahin, Preparation and Some Pro-perties of SiC Particle Reinforced Alu-minium Alloy Composites, Materials and Design, 24 (2003), pp. 671–679.
[12] X. Sauvage, M. Yu. Murashkin, R. Z. Valiev, Atomic Scale Investi-gation of Dynamic Precipitation and Grain Boundary Segregation in a 6061 Aluminium Alloy Nanostru-ctured by ECAP, Kovove Mater., 49 (2011), pp. 11–15.
[13] T. Pelachova, J. Lapin, Analysis of Intermetallic Phases in Wrought Alu-minium Alloy Prepared by Recycling of Composite Scrap, Kovove Mater., 37 (1999), pp. 399 – 411.
No. 1, 2014 Mining & Metallurgy Engineering Bor 153
MINING AND METALLURGY INSTITUTE BOR ISSN: 2334-8836 UDK: 622
UDK: 622.012:65.01(045)=20 DOI:10.5937/MMEB1401153R
Vladimir Radovanović*, Ljiljana Savić**
KNOWLEDGE AND INNOVATIONS - KEY FACTORS OF DEVELOPMENT AND EMPLOYMENT IN THE MINING COMPANIES
Abstract
The epoch of modern economic development particularly emphasized in the nineties of the twentieth century has a special feature in developed world through development of science and technology whose creator is the man. The intensive model of economic growth, based on the comparative advantages of natural resources and unskilled labor force, is more and more abandoned. Today, this place is taken by a new form of economic creativity that increasingly inaugurates non-material resources: knowledge, innovation, information, quality, standards, time, design, speed, know-how and other. The quality of success of developed economies in the world today is convincingly reflected to the rest of the world, with a desire for rapid and better integration of that part. The level of business success depends primarily on the quality of human resources-central resources available to companies and especially today's mining companies in view of the specificity and nature of the work being carried out. New knowledge about the job and the people are resources of a completely new business philosophy, driver of the new changes and risk bearer, creator of innovation and resource allocation, creator of the new quality and values, creator of jobs and new working places in the mining companies, which is the basic need of our time. That time is the time of our Serbian economy and society that is going through the transition process in the pursuit of European integration.
Keywords: human resources, knowledge, education, creativity, innovation, growth and employment
* Faculty of Technical Science, Čačak ** Faculty of Technical Sciences, Kosovska Mitrovica
1 INTRODUCTION
The economy of our time and economic development are growing fast in very com-plex and turbulent environment. In analy-zing the competitive factors, more prevalent notion is that a man with his values and his position is not only the structure but the ba-sis from which all began and from whom everything depends. Changing the role and functioning of today's mining companies is conditioned by the radical change in the role and importance of their employees. It is ne-cessary to create the new, modern and quali-tative human resources, which can provide an efficient realization the objectives of
business and development policies of mi-ning companies in the conditions of great economic uncertainty, rapid technological change, dynamic transformation and proper-ty relations changes. On the social scene is the civilization whose foundation is in the education and development system, which requires that every person works in a scien-tific manner in order to participate actively in the social and economic reality, creating the social and personal wealth. The competi-tive position of any business system, in the global business environment, depends on its flexibility, inventiveness and focus on the
No. 1, 2014 Mining & Metallurgy Engineering Bor 154
quality of its employees. Knowledge, as the result of development of employees, has become a strategic resource and source of competitive advantage of mining companies and their differentiation in today's economy. The whole process of globalization in all its complexity, which has caused all stronger interdependence of various economy branches and companies on the worldwide basis, leads to actualization the new issues related to human resources and their knowledge as the only creative factor creat-ing new values and profits. Due to the dy-namic changes that take place, it can be con-cluded that all is changeable, but only learn-ing is permanent. This is the most important resource which can have one company, op-erating system, or individual. The new mar-ket positioning requires the growth and de-velopment of mining enterprises. Bearer of the growth is competitiveness of companies in this field, and source of growth in them are high- quality human resources, i.e. their knowledge creating the new values.
In development of today's society, the following participate: knowledge, people who know how to apply that knowledge, focus of business systems and whole soci-ety to permanent learning and develop-ment. Modern developments will be em-bodied in mining companies with the speed and efficiency that is allowed by development of human resources and speed of adoption the new creative knowledge, skills, habits required by busi-ness environment. Development and hu-man labor are categories that complement and condition each other, separated mean nothing. Care and development of human resources can be achieved everywhere where there are employees who need a new and high-quality knowledge by per-manent organization of educational pro-cess in the business system. The concern about the quality of human resources and their development is reflected through the acquisition of the new innovative know-ledge, where the focus of national econo-my is transferred to the level of business
system, which is a feature of the global business economy and global economic development. Business systems, including mining companies, increasingly become the “learning organizations" , which are organized, systematic learning and devel-opment at every organizational level, in every workplace and everywhere where they become the slightest need .
2 KNOWLEDGE - RESORCE OF THE NEW CENTURY
Knowledgebased economy is a modern economy; it is where the value of produced and realized goods and services is created on the basis of applied knowledge which is to say that the exploitation of knowledge play a dominant role in creation of material goods and social wealth. That is why it is said that the world today came into a new era - the era of knowledge. The basic infrastructure ele-ments of prosperity in a knowledge econo-my are: knowledge as a source of economic development, innovation - as the most value-ble source of creating new values and mak-ing changes. The era of knowledge lays the foundation of a new economic order and opportunity to create the future that is in-creasingly reliant on the value of human resources. The new economic era is defined by many scientists, one of them is Peter Drucker, who points out that in the knowledge economy natural resources and labor are no longer the main economic re-sources, but also the intellectual capital, which is defined as "knowledge that flows through the technology and is in the people." It follows that knowledge is a priority factor of competitiveness. In the global economy, competitiveness in the know-ledge economy becomes tied to the individual businesses, companies and other organizational systems, rather than to the national economy. Globa-lization as the universal process permeates all aspects of society, it crosses boundaries and establishes the new connections and relationships, creating conditions for faster and more efficient exchange of people, capi
No. 1, 2014 Mining & Metallurgy Engineering Bor 155
tal, goods, services, money, information and knowledge. Globalization of knowledge can be understood as the growth, development and exchange of knowledge between differ-ent business entities on the global basis.
In the knowledge economy, know-ledge takes on some specifics, and becomes the focus of interest of economic science and practice. It now becomes an organizational knowledge (at the level of business system) and increasingly becomes an essence and bearer of business development and growth, as well as the structure for creation the new knowledge. Doing business in the know-ledge economy is characterized by large and sudden changes at all levels and in their sec-tors and industries; companies becomes larger (the new products, services, increase market); business has an international char-acter; there are the new forms of cooperation between the business system; the fight in the competition becomes sophisticated and takes on new forms; the market becomes more selectively; there are the new requirements of competitiveness.
Knowledge economy as a whole is trans-formed industrial economy where employ-ees in the industrial economy and all its un-dertakings are treated as a cost generator. In the knowledge economy, they are consid-ered to be a generator of income and wealth and make valuable economic capital, as it is the case with the mining production today. The power of management, in the industrial economy, depends on the level of organiza-tional hierarchy; in the knowledge economy management power depends on the level of knowledge.
The basic form of profit in the industrial economy was "tangible" – money; in the new economy profit becomes the "intangi-ble", "invisible" – learning, new ideas, new quality, new customers and clients because they are the bearers of economic develop-ment. Bottlenecks were money and skills; in the modern economy they are time and knowledge. Era of knowledge brings a whole new perspective on the world econo-my and inaugurates a brand new manage
ment. Man with his knowledge, skills, hab-its, creativit, motivation and energy is the most important factor of the whole human creativity and the holder of the overall eco-nomic development of our time.
2.1 SPIRITUAL CAPITAL
Owing to development of human knowledge, the modern world is found in the scientific and technological revolution, which is characterized by an adequate con-cept of production, exchange and consump-tion. This shows that the contemporary eco-nomic conditions interact with the new forms of organization and management at all levels of business system, branch, national and global economy, where the quality of human resources have a crucial role. The time we live in is, therefore, the time of knowledge, creativity and information. The-se are the resources of modern economies, which are expected to be able to expand the boundaries of knowledge, but also the productivity and business results.
Without the new creativity and know-ledge, restructuring of large systems, resolv-ing redundancies, operation of large mining system, survival of small and medium-sized enterprises, the creation of new jobs is not possible. Creativity and ideas are the most valuable gifts that an individual can possess - the largest social wealth. Therefore, the current economic development focuses on the human side of organizations where hu-man capital is the central to strategic opera-tions. In the current conditions, development the global economy has created an appropri-ate system of international division of labor. Because the world economic experts rightly claim that functioning of the global econo-my is a complex system that every day be-comes more and more advanced. No nation-al economy and industry can ensure their survival and development today without adequate international affirmation and in-volvement in the world economy. All events on the world stage and in the global econo-my as well as all events in the national
No. 1, 2014 Mining & Metallurgy Engineering Bor 156
economy and all businesses depend primari-ly on the knowledge and skills of the human factor. In the world today, most investments are in the labor force as one of basic factors of production, since the economic conditions in the world eco-nomy more and more re-quire increasing knowledge, innovation and motivation to work. The role of human re-sources has crucial role in today's mining systems that work in quite difficult condi-tions. In these systems, it should be done more on implementation of the best possible technologies that will facilitate the work of employees and create as safe as possible working conditions. Every part of develop-ment the mining system directly depends on development of its employees because it is the only way of use the modern mining technology and modern technical achieve-ments in reaching the business goals and personal interests of any individual. In the world despite all revolutions that have oc-curred to date (the industrial revolution, sci-entific-technological revolution, and energy revolution), the “intelligence revolution and profession” is very important. It involves rapid transfer and app-lication of intensive knowledge in deve-lopment of economy and technology. Because nowadays no one and does not question the crucial role of human resources in the entire development. Quality human resources require investment in their development as the "industry knowledge". This is achieved by allocation the funding for human resource development - education and scientific research. Such financial con-tributions to the world are uneven and dif-ferent depending on the development of individual countries, and therefore highly skilled and developed human resources are concentrated in the certain parts of the world.
3 CREATIVITY AND INNOVATION
Creativity, innovation and knowledge have become the infrastructure for economic creation and further economic progress. The gained experience has proven that overall
social and economic development of a coun-try has to bear the entire economically active society (OECD members at their Conference in 1990 proclaimed the "Program of Active Society" as the goal of any national policy). Under this program, all members of the so-ciety according to their abilities and mental and physical characteristics should contrib-ute to economic and social development. In order to achieve the set goal, a creative cli-mate in society should be created. Today, it is equated with political freedom, their de-mocracy and equality before the law and other. To create a creative climate, it needs to have primarily fair and humane relation-ship between: the state - individual, organi-zation - individual, group - individual and individual - individual. The most important relationship, that makes individual act crea-tive and motivated for creativity, is the ratio of state - individual, where the individual feels belonging and freedom. The undisput-ed fact in the world today is the fastest grow-ing company and those industries that use well the creative individuals who have al-ways been the engine of mankind growth. Therefore, the issue has been raised today, both at the national level or at the level of business system, how to identify, develop and use creativity of individuals or groups who have the greatest creative abilities.
Creativity is a set of capabilities that en-able an individual in certain circumstances to create the new products, expand the new ideas in order to progress the wider commu-nity. The basic philosophy of human re-source management in this case is to treat an individual as a mature person, bearer of ide-as and creativity, productivity and quality. Creative individuals are characterized by: intellectual curiosity, sensitivity to problems at the time, mental openness, restless mind, activity, often dissatisfaction, the ability to see connections between various facts, the tendency to solve problems, rather than to study the phenomena, high intelligence and hunger for creativity. Creativity is caused by the creative climate that should be developed in operating systems, which is reflected in a
No. 1, 2014 Mining & Metallurgy Engineering Bor 157
democratic atmosphere, different types of awards, commendations, and other benefits. Here, in fact, business and healthy creative environment worthy of the man and the treatment of employees as associates is re-quired. In order to develop creativity as an resource of innovation in mining systems, it is necessary to create the motivation for its development and creativity because this area of work is one of the most difficult areas of human creativity, that is, the riskiest area. If employees in these systems are considered to be carriers of development and therefore are adequately rewarded and, if it is invested in their development and creativity, the min-ing systems will develop and the all results will be more productive.
Creativity cannot be expressed by com-mand, under pressure, conditions and under adverse circumstances. In contrast, the hu-mane conditions consistent with human na-ture should be created in mining systems for activation and expression skills, knowledge, intellect, talent and their transferring to the material and social goods, which is the goal of the individual and mining system. Here is the important question of how the objectives of the business system will be aligned with the goals and needs of the individual and its employees. Individual will be creative at work until he/she has a corresponding bene-fit in return, compensation, reward or recog-nition in response to their contribution and will remain on it until he/she is able to prove himself professionally and as such achieves individual and organizational interests. Type of creativity that will be present in an indi-vidual (innovative, productive, inventive or emergent top - revolutionary creativity), is caused by a number of specific characteris-tics, abilities and personality traits as well as by characteristics of these business systems and the nature of work in them.
4 INNOVATION - THE WAY TO THE NEW JOBS
Each operating system has a built in system of human resource management.
Regardless of whether the system is de-veloped and a comprehensive or not, whether it is functional or not, it is an in-separable segment of the business system , because it works through purposeful ac-tions of people. This appropriateness, that is, human labor has to be shaped and ena-bled, started and appropriate people should be involved. How the management of human resources will be organized at the level of systemic presence of the man-agement of this key resource, depend on a number of factors. The essence of human resource management in mining systems refers to the “management of employment and development of people“ and "man-agement of people engagement" when they have been formally employed.
Production development of mining sys-tems is determined by condition of the hu-man factors of production. The level of em-ployment in the mining enterprises is seen as a significant factor in the economic growth of these systems. In addition to the level of employment for themselves, an important factor that affects the efficiency and effec-tiveness of the mining system is productive employment, which goes beyond the unpro-ductive employment, and extensive man-agement problem.
Unproductive employment grows, and productive employment decreases if the business system employs an increasing number of people above the level required by the current volume of its production. This often happens due to introduction the new technology and new technological procedure in which highly productive ma-chines, robots and other automated sys-tems replace a large number of previously employed people, but this is how it comes to redundant that remains formally em-ployed in the business system. Similar character is with redundancies resulting from more rational organization of work, changes in productive organization of business systems, as well as reduction the physical volume of production. Unproduc-tive employment in our environment often
No. 1, 2014 Mining & Metallurgy Engineering Bor 158
has been developed and grown for mass employment motivated not by productive but social and political reasons (character-istic of the eighties of the last century). Extensive employment may occur when the business system is not in a position to adequately recruit candidates from inter-nal sources for vacant or new positions and is then sent to an external source. This form of extensive employment is condi-tioned not only by subjective causes, but often by insufficient possibilities for en-gagement the adequate workers on one hand, and on the other avoiding or reduc-ing the possibility for downsizing or re-training the existing employees. Here the problem is that the structure of knowledge of employees in business systems, as well as of those that are available on the job market, more and more is behind the re-quired knowledge structure. In these situa-tions, business systems are in a state of unproductive employment and labor mar-ket is in situation of structural unemploy-ment. Although, it is characteristic for our state of the eighties that problem is present in a somewhat milder varieties today, what is a big problem. This is usually a problem on the global scale, which is une-qually expressed in different parts of the world. The key to solve this important problem can be found in dynamic restruc-turing of knowledge through various forms of professional development and training in both business systems and la-bor markets, and what is their obligation and duty. The problem of the world econ-omy, and our in it, is that in the postwar years hundreds of different occupations disappeared, giving way to hundreds of new jobs that did not find their proper application, all to the detriment of many basic jobs such as miners , metal worker, builders and other basic jobs. This indi-cates that there is a growing disharmony between the production and education system. Education reforms even in many developed countries did not give the ex-pected results and inflexibility of educa
tion acted as a factor slowing down tech-nical and technological development, as it is the case with us. At present time, the situation is much better, but not sufficient. High speed and degree of development of modern science and new technologies as well as increasing use of micro - proces-sors and biotechnology, robotics and other numerous business and economic activi-ties, increasing emphasis is placed on the rigid educational system in order to ade-quately restructure and form a quality pro-file.
These situations increasingly point out to the new shapes and forms of non-formal education and development, as well as self-education which in recent years has received a form of permanent process. Systematic education and additional training for new occupations remain developing the ultimate task in our country.
5 TRANSITION AND EMPLOYMENT
The transition process in which there is Serbia, the transformation of social own-ership in different forms of ownership, participation in global trade flows, foreign investment in the domestic economy and everything else requires a radical change in the attitude toward human resources, in the way of their education, development, use and management. Ways to raise pro-ductive employment are different in dif-ferent countries and different industries. The general trend in developing countries, where our country is, is attractive to the foreign capital, completion of transition process of ownership, transformation of large business systems in more small and medium-sized with integral process of educational restructuring of knowledge, abilities and skills of both those who are employed and those being educated for employment.
Rapid economic development requires the new and modern knowledge which must be in accordance with the innova-tions in the region because it is the only
No. 1, 2014 Mining & Metallurgy Engineering Bor 159
requirement, not only for reducing the gap between developed and underdeveloped, but also for survival in today's global mar-ketplace. That is why today's global econ-omy is called the “knowledge economy", because the resource contained in knowledge becomes the basis of production and source of wealth. The biggest flaw in Serbian development is related to the human resources, and to inadequate education and inadequate training of employees, both at micro and macro level, inadequate care of this factor, as well as inadequate human resources management .Such state of key resource is the base for insufficient competi-tiveness of the local economy, as well as one of its deep, structural caused problems. To get out of those situations in which is the entire Serbian economy, including the min-ing production, it is necessary to turn the scientific and educational system toward the production and diffusion of intensive re-quired knowledge and toward flexible use and benefit of knowledge and continuous improvement. Business systems as the main economic actors need to develop and act on the principles of the new business philoso-phy that is conditioned by radical changes in the role and importance of human factor in them. Today, more and more, the entirely new organizational forms constitute, which in the global economy on the basis of princi-ples of entrepreneurship, provide intensifica-tion of all business resources, especially human resources, as well as the efficient management and use of the same for larger business results and increased market com-petitiveness.
CONCLUSION
The changes are characteristic of the twenty-first century. They are deep and fast covering all areas of work and life. Changes in the environment have a crucial impact on shaping the future goals of economic enti-ties, giving them a new feature and a new approach, which is a strategic approach. The strategic approach is the new, modern and
necessary access to the mining systems management, which implies a continuous process of adaptation to variable operating system environment. This leads to the emer-gence of strategic management, and so hu-man resources have become the main strate-gist and the holder of such management. By focusing on human resources and their de-velopment, the business systems become means of change and creators of their own destiny. Knowledge as the result of deve-lopment of employees has become the stra-tegic resource and source of competitive advantage and differentiation in today's economy. Investment in knowledge become the most lucrative investments in social capi-tal, and the only way out of the economic recession in which the Serbian economy and society is. Only the new and high quality knowledge and creative people can create the new jobs, and thus the new processes and new values making the source of wealth and social well-being. The current level of competitiveness of Serbian economy and mining company does not provide the inter-national positioning. For Serbian overall situation, in which the entire society is found, there is no easy or quick way to re-move barriers of large determinant of un-competitive. In all obstacles, it needs to work intensively, studiously, professionally, with the help of foreign accumulation for which an appropriate business environment should be created. The new environment and new social laws are infrastructure for new economic activity, which requires develop-ment of education system and quality of human resources through large investments in development of innovation and new busi-nesses with respect and integration into the global standards of good management.
REFERENCES
[1] Grozdanić R.: Entrepreneurship, Facu-lty of Technical Science, Čačak, 2005;
[2] Senge P.: The Fifth Discipline, Mosaic Books, Zagreb, 2001;
No. 1, 2014 Mining & Metallurgy Engineering Bor 160
[3] Drucker P.: Managing in the New Society, Adizes, Novi Sad, 2005;
[4] Drucker P.: Innovation and Entre-preneurship, Globus, Zagreb, 1992;
[5] Torrington D.: Human Resource Management, Data Status, Belgrade, 2002;
[6] Janićijević N.: Organizational Beha-vior, Data Status, Belgrade, 2009;
[7] Ćamilović S., Vidojević V.: Funda-mentals of Human Resource Mana-gement, Tekon, Belgrade, 2007;
[8] Bahtijarević - Siber, F.: Human Poten-tial Management, Zagreb, 1999;
[9] Radovanović V.: Human Resource Management, MST Gajic, Belgrade, 2009;
[10] Radovanović V.: Organizational Beha-vior, MST Gajic, Belgrade, 2011;
[11] Stephen P. R.: Organizational Beha-vior, the second edition, Prentice Hall, USA 2003;
[12] Vujic D.: Human Resource Manage-ment and Quality, Center for Applied Psychology, Belgrade 2003.
Broj 1, 2014. Mining & Metallurgy Engineering Bor 161
INSTITUT ZA RUDARSTVO I METALURGIJU BOR ISSN: 2334-8836 UDK: 622
UDK: 622.012:65.01(045)=861 DOI:10.5937/MMEB1401153R
Vladimir Radovanović*, Ljiljana Savić**
ZNANJE I INOVACIJE KLJUČNI FAKTORI RAZVOJA I ZAPOŠLJAVANJA U RUDARSKIM PREDUZEĆIMA
Izvod
Epoha modernog ekonomskog razvoja, posebno potencirana devedesetih godina dvadesetog veka, u razvijenom delu sveta ima posebno obeležje u razvoju nauke i tehnologije čiji je kreator i tvorac čovek. Sve više se napušta intenzivni model ekonomskog rasta zasnovan na komparativnoj prednosti prirodnih resursa i nisko kvalifikovane radne snage. Danas to mesto zauzima jedan novi oblik ekonomskog stvaralaštva koji sve više inauguriše nematerijalne resurse: znanje, inovacije, informacije, kvalitet, standarde, vreme, dizajn, brzinu, know-how i drugo. Kvalitet uspeha razvijenih ekonomija sveta danas se sve ubedljivije reflektuje na ostatak sveta, sa željom na što brže i kvalitetnije integrisanje tog dela. Stepen poslovnog uspeha prvenstveno zavisi od kvaliteta ljudskih resursa-centralnog resursa sa kojima raspolažu privredna društva a naročito današnja rudarska preduzeća sobzirom na specifičnost i prirodu poslova koji se u njima obavljaju. Nova znanja o poslu i ljudima su agens potpuno nove poslovne filozofije, pokretač novih promena i nosilac rizika, tvorac inovacija i alokacije resursa, tvorac novih kvaliteta i vrtednosti, stvaralac poslova i novih radnih mesta u rudarskim preduzećima, što je nasušna potreba današnjeg vremena. To vreme je vreme naše srpske privrede i društva u celini koje prolazi kroz tranzicioni proces u težnji ka evropskim integracijama.
Ključne reči: ljudski resursi, znanje, obrazovanje, kreativnost, inovacije, razvoj, zapošljavanje.
* Fakultet tehničkih nauka Čačak ** Fakultet tehničkih nauka Kosovska Mitrovica
UVOD
Ekonomija današnjeg doba i privredni razvoj nalaze se u brzom usponu i veoma složenom i turbulentnom okruženju. U analizi njihovih konkurentnih faktora, sve više preovladava shvatanje da čovek sa svojim vrednostima i njegov položaj nije samo struktura već osnov od koga sve počinje i od koga sve zavisi. Promena uloge i načina funkcionisanja današnjih rudarskih preduzeća uslovljena je radikalnom prome-nom uloge i značaja zaposlenih u njima. Potrebno je stvoriti nove, savremene i kvalitetnije ljudske resurse, koji mogu da obezbede efikasno ostvarivanje ciljeva poslovne i razvojne politike rudarskih
preduzeća i to u uslovima velike privredne neizvesnosti, brzih tehnoloških promena, dinamične transformacije i promene svojin-skih odnosa. Na društvenu scenu stupa civilizacija čiji se osnov nalazi u obra-zovnom i razvojnom sistemu, koji zahteva da svaki čovek na naučni način radi, kako bi aktivno učestvovao u društvenoj i privrednoj stvarnosti, stvarajući drušveno i lično bogatstvo. Konkurentna pozicija svakog poslovnog sistema, u globalnom poslovnom okruženju, zavisi od njegove fleksibilnosti, invetivnosti i fokusa na kvalitet svojih zaposlenih. Znanje kao rezultat razvoja zaposlenih, postalo je strateški resurs i
Broj 1, 2014. Mining & Metallurgy Engineering Bor 162
izvorište konkurentne prednosti rudarskih preduzeća i njihove diferencijacije u savre-menoj ekonomiji. Čitav proces globalizacije u celoj svojoj kompleksnosti, koji je uslovio sve čvršću međuzavisnost različitih ekono-mija, grana i privrednih subjekata na svet-skom nivou, dovodi do aktuelizacije novih pitanja u vezi sa ljudskim resursima i njihovim znanjima kao jedinim kreativnim faktorom stvaranja nove vrednosti i profita. S obzirom na dinamičnost i promene koje se dešavaju, može se zaključiti da je sve promenljivo samo je sticanje znanja stalno. To je najvažniji resurs kojim može da raspolaže jedno društvo, poslovni sistem ili pojedinac. Novo pozicioniranje na tržištu zahteva rast i razvoj rudarskih preduzeća. Nosilac rasta je konkurentnost preduzeća u ovoj delatnosti, a izvor rasta u njima su kvalitetni ljudski resursi tj. njihova znanja koja stvaraju nove vrednosti
U razvoju današnjeg društva učestvuju: znanje, ljudi koji znaju kako to znanje da primene, usmerenost poslovnih sistema i čitavog društva na permanentno učenje i razvoj. Savremena dostignuća biće opred-mećena u rudarskim preduzećima onom brzinom i efikasnošću koju dopušta razvije-nost ljudskih resursa i brzina usvajanja novih kreativnih znanja, veština, navika, sposob-nosti koje zahteva poslovno okruženje. Razvoj i ljudski rad su kategorije koje se dopunjuju i uslovljavaju, a odvojeno ne znače ništa. Razvoj i briga za ljudske resurse može se postići svuda tamo gde se nalaze zaposleni kojima su potrebna nova i kvalitetna znanja, i to stalnim organizova-njem obrazovnog procesa u poslovnom sistemu. Ovde se briga o kvalitetu ljudskih resursa i njihovom razvoju ogleda preko sticanja novih inovativnih znanja, gde se fokus sa nacionalnih ekonomija prenosi na nivo poslovnog sistema, što je odlika glo-balne poslovne ekomije i globalnog eko-nomskog razvoja. Poslovni sistemi, a među njima i rudarska preduzeća, sve više postaju ”organizacije koje uče”, što podrazumeva organizovano, sistematsko učenje i razvoj
na svakom organizacionom nivou, na sva-kom radnom mestu i svuda tamo gde se za njim ukaže i najmanja potreba.
2. ZNANJE- RESURS NOVOG VEKA
Ekonomija zasnovana na znanju je savremena ekonomija, u njoj je vrednost ukupno proizvedenih i realizovanih roba i usluga stvorena na bazi primenjenog znanja, što će reći da eksploatacija znanja igra dominantnu ulogu u stvaranju materijalnih dobara i društvenog bogatstva. Zato se i kaže da je današnji svet ušao u jedno novo doba – doba znanja. Osnovni ifrastrukturni elementi za prosperitet u ekonomiji znanja su: znanje kao izvor ekonomskog razvoja, inovacije-kao najvredniji izvor stvaranja nove vrednosti i stvaranje promena. Doba znanja postavlja temelje novog ekonomskog poretka i šansu kreiranja nove budućnosti, koja se sve više oslanja na vrednost ljudskog potencijala. Novo ekonomsko doba definišu mnogi naučnici, jedan od njih je Piter Drucker koji ističe da u ekonomiji znanja prirodni resursi i rad nisu više osnovni ekonomski resursi, već je to intelektualni kapital koji definiše kao „znanje koje teče kroz tehnologiju i nalazi se u ljudima“. Iz navedenog proizilazi da je znanje prioritetni faktor konkurentnosti. U globalnom poslo-vanju u ekonomiji znanja konkurentnost postaje vezana za pojedinačne privredne subjekte, preduzeća i druge organizacione sisteme, a sve manje za nacionalne ekono-mije. Globalizacija kao univerzalni proces prožima sve aspekte društva, ona ruši grani-ce i uspostavlja nove veze i odnose stvara-jući uslove za bržu i efikasniju razmenu ljudi, kapitala, roba, usluga, novca, infor-macija i znanja. Globalizaciju znanja može-mo razumeti kao rast, razvoj i razmenu znanja između različitih ekonomskih subje-kata na globalnoj osnovi.
U ekonomiji znanja, znanje poprima neke specifičnosti i postaje fokus intereso-vanja ekonomske nauke i prakse. Ono danas postaje organizacijsko znanje (na nivou
Broj 1, 2014. Mining & Metallurgy Engineering Bor 163
poslovnog sistema) i sve više postaje suština i nosilac poslovnog razvoja i rasta, kao i struktura za stvaranje novih znanja. Poslo-vanje u ekonomiji znanja karakteriše se veli-kim i naglim promenama na svim nivoima i u svom sektorima i granama, privredni subjekti postaju veći (novi proizvodi, usluge, povećanje tržišta), poslovanje ima interna-cionalni karakter, niču novi oblici saradnje između poslovnih sistema, borba u konku-renciji postaje sofisticirana i poprima nove oblike, tržište postaje sve probirljivije, nas-taju novi zahtevi konkurentnosti.
Ekonomija znanja u celini predstavlja transformisanu industrijsku ekonomiju gde se zaposleni u industrijskoj ekonomiji i svim njenim privrednim subjektima tretirani generatorom troška. U ekonomiji znanja oni se smatraju generatorom prihoda i bogatstva i čine najvredniji ekonomski kapital, što je slučaj i sa rudarskom proizvodnjom danas. Moć menadžmenta, u industrijskoj ekono-miji, zavisi od nivoa u organizacionoj hije-rarhiji, u ekonomiji znanja moć menadž-menta zavisi od nivoa znanja.
Osnovni oblik dobiti u industrijskoj ekonomiji bio je „ opipljiv“ – novac, u novoj ekonomiji dobit postaje „neopipljiv“, „nevi-dljiv“- učenje, nove ideje, novi kvaliteti, novi kupci i klijenti, jer su to nosioci privre-dnog razvoja. Uska grla bila su novac i veštine u modernoj ekonomiji to postaju vreme i znanje. Era znanja donosi potpuno nove poglede na svet ekonomije i inauguriše potpuno novi menadžment. Čovek sa svojim znanjima, sposobnostima, navikama, vešti-nama, kreativnošću, motivacijom i energi-jom najbitniji je faktor celokupnog ljudskog stvaralaštva i nosilac celokupnog privre-dnog razvoja današnjeg doba.
2.1. DUHOVNI KAPITAL
Zahvaljujići razvoju ljudskih znanja, savremeni svet se našao u naučno-tehno-loškoj revoluciji koju karakteriše adekvatan koncept proizvodnje, razmene i potrošnje. To pokazuje da su savremeni uslovi
privređivanja u interakciji sa novim oblicima organizovanja i menadžmenta na svim nivoima od poslovnog sistema, granske, nacionalne do svetske privrede, gde presu-dnu ulogu imaju kvalitetni ljudski resursi. Vreme u kome živimo je, dakle, vreme znanja, kreativnosti i informacija. To su resursi savremene ekonomije od kojih se očekuje da mogu proširiti granice saznanja, ali i produktivnosti i poslovnih rezultata.
Bez novih kreativnosti i znanja nije moguće restruktuiranje velikih sistema, rešavanje viškova zaposlenih, funkcioni-sanje velikih rudarskih sistema, opstanka malih i srednjih preduzeća, otvaranje novih radnih mesta. Kreativnost i ideje su najvre-dniji darovi koje pojedinac može posedovati, najveće društveno bogatstvo. Stoga se današnji ekonomski razvoj fokusira na ljudsku stranu organizacije gde ljudski kapital zauzima centralno mesto u strate-škom poslovanju. U današnjim uslovima razvoja globalizacije svetske privrede stvoren je i odgovarajući sistem međuna-rodne podele rada. Zato svetski ekonomski eksperti s punim pravom tvrde da funkcio-nisanje svetske privrede predstavlja najslo-ženiji sistem koji se svakog dana sve više razvija i usavršava. Nijedna nacionalna ekonomija i privredna grana, danas ne može obezbediti svoj opstanak i razvoj bez adekvatne međunarodne afirmacije i uključivanja u svetske privredne tokove. Sva dešavanja na svetskoj sceni i u globalnoj ekonomiji kao i sva dešavanja u nacionalnim ekonomijama i svim privrednim subjektima zavise prvenstveno od znanja i sposobnosti ljudskog faktora. Danas se u svetu od osnovnih faktora proizvodnje najviše ulaže u radnu snagu, pošto uslovi privređivanja u svetskoj ekonomiji sve više zahtevaju sve veća znanja, inovacije i motive za rad. Uloga ljudskog resursa ima presudnu ulogu u današnjim rudarskim sistemima koji rade u dosta teškim uslovima. U ovim sistemima treba sve više raditi na primeni što kvalite-tnije tehnologije kojom će se olakšati rad zaposlenih i stvoriti što bezbedniji uslovi za
Broj 1, 2014. Mining & Metallurgy Engineering Bor 164
rad. Svaki deo razvoja rudarskih sistema u direktnoj je zavisnosti od razvijenosti njegovih zaposlenih, jer je to jedini put i način korišćenja savremene rudarske tehno-logije i savremenih tehničkih dostignuća u ostvarenju poslovnih ciljeva i ličnih interesa svakog pojedinca. U svetu pored svih revolucija koje su se do danas dešavale (industrijska revolucija, naučno-tehnološka revolucija, energetska revolucija), veoma je bitna “revolucija inteligencije i profesije. ”Ona podrazumeva ubrzan transfer i primenu intenzivnih znanja u razvoju ekonomije i tehnologije. Zato danas niko više i ne dovodi u pitanje ključnu ulogu ljudskih resursa u celokupnom razvoju. Kvalitetni ljudski resursi zahtevaju investi-ciona ulaganja u njihov razvoj kao “indu-striju znanja”. To se postiže izdvajanjem finansijskih sredstava za razvoj ljudskih resursa - za obrazovanje i za naučno istraži-vački rad. Ovakva finansijska izdvajanja u svetu su neujednačena i različita što zavisi od razvijenosti pojedinih zemalja, pa su zato visoka znanja i razvijeni ljudski resursi koncentrisani u određenim delovima sveta.
3. KREATIVNOST I INOVATIVNOST
Kretivnost, inovativnost i znanje postali su infrastruktura za ekonomsko stvaralaštvo i dalji ekonomski napredak. Dosadašnje iskustvo dokazalo je da ukupni društveni i ekonomski razvoj jedne zemlje mora da nosi celo radno aktivno društvo, (članice OECD-a su na svojoj konferenciji 1990. godine proklamovale “program aktivnog društva” kao cilj svake nacionalne politike). Po tom programu svi članovi društva prema svojim sposobnostima i psihofizičkim osobinama treba da doprinesu ekonomskom i društve-nom razvoju. Da bi se postavljeni cilj postigao treba stvoriti stvaralačku klimu u društvu. Danas se to izjednačava sa političkim slobodama, demokratičnošću i jednakošću ljudi pred zakonom i dr. Za stvaranje stvaralačke klime potreban je prvenstveno korektan i human odnos na
relaciji: država - pojedinac, organizacija-pojedinac, grupa - pojedinac kao i pojedinac - pojedinac. Najbitniji odnos, kako bi poje-dinac stvaralački delovao i bio motivisan za kreativnost, je odnos država-pojedinac, gde pojedinac oseća pripadnost i slobodu. Neosporna činjenica danas u svetu je da se najbrže razvijaju ona društva i one privredne grane koje najbolje koriste kretivne pojedince, koji su oduvek bili pokretači razvoja čovečanstva. Zato je danas usledilo pitanje, kako na nacionalnom nivou ili na nivou poslovnog sistema prepoznati, razvi-jati i koristiti kreativnost pojedinaca ili grupa koji imaju najveće stvaralačke sposobnosti.
Kreativnost je skup onih sposobnosti koje pojedincu omogućavaju da u određe-nim okolnostima stvara nove proizvode, širi nove ideje u cilju progresa šire društvene zajednice. Osnovna filozofija menadžmenta ljudskih resursa u ovom slučaju je tretiranje pojedinca kao sveukupne, zrele ličnosti, nosioca ideja i kreativnosti, produktivnosti i kvaliteta. Kreativnog pojedinca karakteriše: intelektualna radoznalost, osetljivost za probleme u datom trenutku, mentalna otvo-renost, nemiran um, aktivan, često neza-dovoljan, sposobnost sagledavanja veze između najrazličitijih činjenica, sklonost ka rešavanju problema, umesto ka proučavanju pojava, visoka inteligencija i glad za stvaralaštvom. Kreativnost je uslovljena stvaralačkom klimom koja treba da bude razvijena u poslovnim sistemima, koja se ogleda kroz demokratsku atmosferu, kroz različite vidove nagrada, pohvala, beneficija i dr. Ovde je, u stvari, potrebna poslovna i zdrava stvaralačka sredina dostojna čoveka i tretman zaposlenih kao saradnika. Da bi se razvijala kreativnost kao agens inovacija u rudarskim sistemima, nužno je stvoriti motiv više za njen razvoj i stvaralaštvo iz razloga što ova oblast rada spada u najteže oblasti ljudskog stvaralašta tj u najrizišnije oblasti. Ukoliko se u ovakvim sistemima zaposleni smatraju nosiocem razvoja i shodno tome se nagrađuju i u njihov razvoj i kreativnost se adekvatno ulažu finansijska sredstva rezul-
Broj 1, 2014. Mining & Metallurgy Engineering Bor 165
tati neće izostati, već će se, naprotiv, rudarski sistemi razvijati a njihovi rezultati biti sve produktivniji.
Kreativnost se ne može izraziti naredbom, pod pritiskom, uslovljavanjem i u nepovoljnim okolnostima. Nasuprot tome, u rudarskim sistemima treba stvarati humane uslove usklađene sa prirodom čoveka radi aktiviranja i ispoljavanja sposobnosti, znanja, intelekta, talenta i njihovo pretakanje u materijalna i društvena dobra što je cilj kako pojedinca tako i rudarskih sistema. Ovde je bitno pitanje koliko će ciljevi poslovnog sistema biti usklađeni sa cilje-vima i potrebama pojedinaca i zaposlenih u njoj. Zaposleni pojedinac biće kreativan u svom poslu sve dok za uzvrat ima odgovarajuću korist, nadoknadu, nagradu ili priznanje kao odgovor za svoj doprinos i ostaće na njemu dok mu je omogućeno profesionalno dokazivanje, potvrda sopst-vene vrednosti i dok tako postiže indivi-dualne i organizacione interese. Tip kreativ-nosti koja će biti zastupljena kod pojedinca (inovativna, produktivna, inventivna ili emergentna - vrhunska revolucionarna krea-tivnost), uslovljen je brojnim specifičnim osobinama, sposobnostima i svojstvima ličnosti, kao i karakteristikama samih poslovnih sistema i prirode posla u njima.
4. INOVACIJE PUT DO NOVIH RADNIH MESTA
Svaki poslovni sistem ima izgrađen sistem upravljanja ljudskim resursima. Bez obzira da li je taj sistem razvijen i sveobu-hvatan ili nije, da li je funkcionalan ili nije, on je neodvojiv segment poslovnog sistema, jer on funkcioniše zahvaljujući svrsishod-nom delovanju ljudi. Ta svrsishodnost tj. ljudski rad mora biti oblikovan i omogućen, pokrenut i za njega moraju biti angažovani odgovarajući ljudi. To kako će menadžment ljudskih resursa biti organizovan na nivou svesadržajnom sistemskom prisustvu uprav-
ljanja ovim ključnim resursom, zavisi od brojnih faktora. Suština upravljanja ljudskim resursima u rudarskim sistemima se odnosi na: „upravljanje zapošljavanjem i razvojem ljudi“ i „upravljanje angažovanjem ljudi“ kada su oni formalno već zaposleni.
Proizvodni razvoj rudarskih sistema je uslovljen stanjem ljudskog faktora proizvo-dnje. Sam nivo zaposlenosti u rudarskim preduzećima se pokazuje kao značajan činilac ekonomskog rasta ovih sistema. Pored nivoa zaposlenosti samog za sebe značajan činilac koji utiče na efikasnost i efektivnost rudarskih sistema je produktivna zaposlenost, kojom se prevazilazi neproduk-tivna zaposlenost, odnosno problem eksten-zivnog upravljanja.
Neproduktivna zaposlenost raste, a produktivna zaposlenost opada ako poslovni sistem zapošljava sve veći broj ljudi, iznad nivoa koji zahteva aktuelni obim njene proizvodnje. To se često događa zbog uvo-đenja novih teenologija i novih tehnoloških procedura u kojima visoko produktivne mašine, roboti i drugi automatizovani sistemi, zamenjuju veliki broj ranije zaposle-nih ljudi, ali tako nastaje tehnološki višak koji ostaje formalno zaposlen u poslovnom sistemu. Sličnog karaktera je i višak zaposle-nih koji nastaje racionalnijim organizo-vanjem rada, promenama proizvodno poslovne organizacije poslovnog sistema, kao i smanjivanjem fizičkog obima proizvo-dnje. Neproduktivna zaposlenost u našim uslovima često je nastajala i rasla zbog masovnog zapošljavanja motivisanog ne proizvodnim već socijalnim i političkim razlozima, (karakteristična je za osamdesete godine prošlog veka). Ekstenzivno zapošlja-vanje može nastati i kada poslovni sistem nije u situaciji da iz unutrašnjih izvora adekvatno regrutuje kandidate za upražnjena ili nova radna mesta pa je onda upućen na eksterne izvore. Ovakav oblik ekstenzivog zapošljavanja uslovljeno je ne samo subjek-tivnim uzrocima, već često i nedovoljnim
Broj 1, 2014. Mining & Metallurgy Engineering Bor 166
mogućnostima angažovanja adekvatnih radnika sa jedne strane, a sa druge strane izbegavanjem ili smanjenim mogućnostima otpuštanja ili prekvalifikacije već postojećih zaposlenih. Ovde je problem u tome da struktura znanja zaposlenih u poslovnim sistemima, kao i onih koji su dostupni na tržištu rada, sve više zaostaje za potrebnom strukturom znanja. U ovakvim situacijama poslovni sistemi se nalaze u stanju nepro-duktivne zaposlenosti, a tržište rada u situa-ciji strukturne nezaposlenosti. Taj problem koliko god da je odlika našeg stanja osam-desetih godina prošlog veka on je prisutan u nešto blažoj varijanti i danas, što je veliki problem. Ovo je inače problem u svetskim razmerama, koji je neravromerno izražen u različitim delovima sveta. Ključ razreša-vanja ovog bitnog problema može se naći u dinamičnom restruktuiranju znanja kroz brojne oblike profesionalnog razvoja i treninge kako u poslovnim sistemima, tako i na tržištima rada, što i jeste njihova obaveza i zadatak. Problem svetske ekonomije, a naše u njoj, je u tome što su u posleratnim godinama nestale stotine različitih zanima-nja, ustupajući mesto stotinama novih zanimanja koja nisu našla svoju adekvatnu primenu, a sve na štetu brojnih bazičnih zanimanja kao što su: rudari, metalci, građevinari i druga bazična zanimanja. Ovo ukazuje da je sve veći nesklad između proizvodnog i obrazovnog sistema. Reforme obrazovanja čak u mnogo razvijenim zemljama nisu dale očekivane rezultate, pa je nefleksibilnost obrazovanja delovala kao faktor usporavanja tehničko tehnološkog razvoja, što je slučaj i kod nas. U današnje vreme situacija je znatno bolja, ali ne i zadovoljavajuća. Velika brzina i stepen današnjeg razvoja nauke i novih tehnologija, kao i sve veća primena mikro procesora i biotehnologije, robotike i drugo u brojnim privrednim i neprivrednim delatnostima sve veći akcenat se stavlja na nefleksibilne obrazovne sisteme kako bi se adekvatno restruktuirali i obrazovali kvalitetne profile.
Ovakve situacije sve više upućuju na nove oblike i forme neformalnog obrazo-vanja i razvoja, kao i na samobrazovanje koje je poslednjih godina dobilo oblik permanenog procesa. Sistemsko obrazo-vanje i dopunsko osposobljavanje za nova zanimanja ostaje i dalje razvojni zadatak ultimativnog karaktera i u našoj zemlji.
5. TRANZICIJA I ZAPOŠLJAVANJE
Proces tranzicije u kome se nalazi Srbija, transformacija društvene svojine u drugačije svojinske oblike, uključivanje u svetske trgovinske tokove, strana ulaganja u domaću privredu i sve drugo zahteva korenitu pro-menu i stav prema ljudskim resursima, u na-činu njihovog obrazovanja, razvoja, kori-šćenja i upravljanja. Putevi za podizanje pro-duktivne zaposlenosti su različiti u različi-tim zemljama kao i različitim industrijama. Opšti trend zemalja u razvoju, gde se nalazi i naša zemlja, je privlačenje stranog kapitala, završetak tranzicionog procesa svojine, tran-sformacija velikih poslovnih sistema u više malih i srednjih uz neodvojivi proces obra-zovnog restruktuiranje znanja, sposobnosti i veština kako već zaposlenih tako i onih koji se obrazuju za zaposlenje.
Ubrzan privredni razvoj zahteva nova i savremena znanja koja moraju biti u skladu sa inovacijama iz okruženja jer je to jedini uslov, ne samo smanjenja gepa između razvijenih i nerazvijenih, već i opstanka na današnjem višesfernom globalnom tržištu. Zato se današnja globalna ekonomija naziva, “ekonomijom znanja”, jer resurs sadržan u znanju postaje temelj proizvodnje i izvor bogatstva. Najveće mane u srpskom razvoju tiču se ljudskih resursa, a odnose se na nea-dekvatan sistem obrazovanja i nedovoljan razvoj zaposlenih kako na mikro tako i na makro planu, neadekvatnu brigu o ovom faktoru, kao i neadekvatno upravljanje ljudskim resursima. Tako stanje ključnog resursa osnov je nedovoljne konkurentnosti ovdašnje privrede, kao i jedan je od njenih
Broj 1, 2014. Mining & Metallurgy Engineering Bor 167
dubokih, strukturno uslovljenih problema. Da bi se izašlo iz navedene situacije u kojoj se nalazi čitava srpska privreda uključujući i rudarsku proizvodnju, neophodno je čitav obrazovni i naučni sistem okrenuti prema proizvodnji i difuziji intenzivnih potrebnih nanja kao i fleksibilnom raspolaganju i korišćenju tih znanja i njihovom stalnom usavršavanju. Poslovni sistemi kao osnovni subjekti privređivanja treba da se razvijaju i da deluju na principima nove poslovne filozofije koja je uslovljena radikalnim promenama uloge i značaja ljudskog faktora u njima. Danas se sve više konstituišu sasvim novi organizacioni oblici, koji u uslovima globalne privrede, na principima preduzetništva, obezbeđuju intenziviranje svih poslovnih resursa, a naročito ljudskih resursa, kao i efikasnije upravljanje i korišćenje istih radi većih poslovnih rezultata i veće konkurentnosti na tržištu.
ZAKLJUČAK
Promene su obeležje dvadeset prvog veka. One su duboke i brze, zahvataju sve oblasti delovanja i življenja. Promene u okruženju presudno utiču na oblikovanje budućih ciljeva privrednih subjekta, dajući im jedno novo obeležje i nov pristup, a to je strategijski pristup. Strategijski pristup predstavlja novi, modederan i nužan pristup upravljanja rudarskim sistemima, pod kojim se podrazumeva kontinualan proces prila-gođavanja poslovnih sistema promen-ljivoj okolini. To dovodi do pojave strategijskog menadžmenta, a sa njime ljudski resursi postaju osnovni strateg i nosilac takvog upravljanja. Fokusiranje na ljudske resurse i na njihov razvoj poslovni sistemi postaju nosioci promena i stvaraoci sopstvene sudbine. Znanje kao rezultat razvoja zaposlenih, postalo je strateški resurs i izvorište konkurentne prednosti i diferen-cijacije u savremenoj ekonomiji. Investicije
u znanje postaju najunosnija ulaganja u društveni kapital i jedini put za izlazak iz ekonomske recesije u kojoj se nalazi srpska privreda i društvo. Samo nova i kvalitetna znanja i kreativnost ljudi mogu stvoriti novi posao, nova radna mesta, a time i nove procese i nove vrednosti čineći tako izvor bogastva i društvenog blagostanja. Trenutni nivo konkurentnosti srpske privrede i rudar-skih preduzeća u njoj ne obezbeđuje osmi-šljeno međunarodno pozicioniranje. Za srpsku sveopštu situaciju, u kome se našlo celokupno društvo, nema lakog, niti brzog načina da ukloni barijere krupne determi-nante nekonkurentnosti. Na svim prepreka-ma treba raditi intenzivno, studiozno, stru-čno, kvalitetno i domaćinski, uz pomoć inos-trane akumulacije, za koju je nophodno stvoriti adekvatan privredni ambijent. Nov ambijent i novi društveni zakoni su infra-struktura za novo privredno delovanje, koje zahteva razvoj obrazovnog sistema i kvali-tetnih ljudskih resursa preko velikih investi-cionih ulaganja u razvoj inovativnosti i novih privrednih subjekata s poštovanjem i uklapanjem u svetske standarde dobrog menadžmenta.
LITERATURA
[1] Grozdanić R.: Preduzetništvo, Fakul-tet Tehničkih nauka, Čačak, 2005.
[2] Senge P.: Peta Disciplina, Mozaik knjiga, Zagreb, 2001.
[3] Draker P.: Upravljanje u novom društvu, Adižes, Novi Sad, 2005.
[4] Draker P.: Inovacije i Preduzetništvo, Globus, Zagreb, 1992.
[5] Torrington D.: Menadžment ljudskih resursa, Data Status, Beograd, 2002.
[6] Janićijević N.: Organizaciono pona-šanje, Data Status, Beograd, 2009.
[7] Ćamilović S., Vidojević V.: Osnove menadžmenta ljudskih resursa, Tekon, Beograd, 2007.
Broj 1, 2014. Mining & Metallurgy Engineering Bor 168
[8] Bahtijarević-Šiber F.: Menadžment ljudskih potencijala, Zagreb, 1999.
[9] Radovanović V.: Menadžment ljud-skih resursa, MST Gajić, Beograd, 2009.
[10] Radovanović V.: Organizaciono pona-šanje, MST Gajić, Beograd, 2011.
[11] Stephen P. R.: Organizational Beha-vior, the second edition, prentice Hall, USA, 2003.
[12] Vujić D.: Menadžment ljudskih resursa i Kvalitet, Centar za primenjenu psihologiju, Beograd, 2003.
INSTRUCTIONS FOR THE AUTHORS Journal MINING AND METALLURGY ENGINEERING BOR is published four times per a year and
publishes the scientific, technical and review paper works. Only original works, not previously published and not simultaneously submitted for publication elsewhere, are accepted for publication in the journal. The papers should be submitted in both, Serbian and English language. The papers are anonymously reviewed by the reviewers after that the editors decided to publish. The submitted work for publication should be prepared according to the instructions below as to be included in the procedure of reviewing. Inadequate prepared manuscripts will be returned to the author for finishing.
Volume and Font size. The work needs to be written on A4 paper (210x297 mm), margins (left, right, upper and bottom) with each 25 mm, in the Microsoft Word later version, font Times New Roman, size 12, with 1.5 line spacing, justified to the left and right margins. It is recommended that the entire manuscript cannot be less than 5 pages and not exceed 10 pages.
Title of Work should be written in capital letters, bold, in Serbian and English. Under the title, the names of authors and institutions where they work are written under the title. The author of work, responsible for correspondence with the editorial staff, must provide his/her e-mail address for contact in a footnote.
Abstract is at the beginning of work and should be up to 200 words, include the aim of the work, the applied methods, the main results and conclusions. The font size is 10, italic.
Key words are listed below abstract. They should be minimum 3 and maximum of 6. The font size is 10, italic. Basic text. The papers should be written concisely, in understandable style and logical order that, as a rule, including
the introductory section with a definition of the aim or problem, a description of the methodology, presentation of the results as well as a discussion of the results with conclusions and implications.
Main titles should be done with the font size 12, bold, all capital letters and aligned with the left margin. Subtitles are written with the font size 12, bold, aligned to the left margin, large and small letters. Figure and Tables. Each figure and table must be understandable without reading the text, i.e., must have a serial
number, title and legend (explanation of marks, codes, abbreviations, etc.). The text is stated below the figure and above the table. Serial numbers of figures and tables are given in Arabic numbers.
References in the text are referred to in angle brackets, exp. [1, 3]. References are enclosed at the end in the following way:
[1] Willis B. A., Mineral Procesing Technology, Oxford, Pergamon Press, 1979, pg. 35. (for the chapter in a book) [2] Ernst H., Research Policy, 30 (2001) 143–157. (for the article in a journal) [3] www: http://www.vanguard.edu/psychology/apa.pdf (for web document)
Specifying the unpublished works is not desirable and, if it is necessary, as much as possible data on the source should be listed.
Acknowledgement is given where appropriate, at the end of the work and should include the name of institution that funded the given results in the work, with the name and number of project, or if the work is derived from the master theses or doctoral dissertation, it should give the name of thesis / dissertation, place, year and faculty where it was defended. Font size is 10, italic.
The paper works are primarily sent by e-mail or in other electronic form. Editorial address : Journal MINING AND METALLURGY ENGINEERING BOR
Mining and Metallurgy Institute 35 Zeleni bulevar, 19210 Bor E-mail: [email protected]; [email protected] Telephone: +381 (0) 30/435-164; +381 (0) 30/454-110 We are thankful for all authors on cooperation
UPUTSTVO AUTORIMA
Časopis MINING AND METALLURGY ENGINEERING BOR izlazi četiri puta godišnje i objavljuje
naučne, stručne i pregledne radove. Za objavljivanje u časopisu prihvataju se isključivo originalni radovi koji nisu prethodno objavljivani i nisu istovremeno podneti za objavljivanje negde drugde. Radovi se dostavljaju i na srpskom i na engleskom jeziku. Radovi se anonimno recenziraju od strane recenzenta posle čega uredništvo donosi odluku o objavljivanju. Rad priložen za objavljivanje treba da bude pripremljen prema dole navedenom uputstvu da bi bio uključen u proceduru recenziranja. Neodgovarajuće pripremljeni rukopisi biće vraćeni autoru na doradu.
Obim i font. Rad treba da je napisan na papiru A4 formata (210x297 mm), margine (leva, desna, gornja i donja) sa po 25 mm, u Microsoft Wordu novije verzije, fontom Times New Roman, veličine 12, sa razmakom 1,5 reda, obostrano poravnat prema levoj i desnoj margini. Preporučuje se da celokupni rukopis ne bude manji od 5 strana i ne veći od 10 strana.
Naslov rada treba da je ispisan velikim slovima, bold. Ispod naslova rada pišu se imena autora i institucija u kojoj rade. Autor rada zadužen za korespodenciju sa uredništvom mora da navede svoju e-mail adresu za kontakt u fusnoti.
Izvod se nalazi na početku rada i treba biti dužine do 200 reči, da sadrži cilj rada, primenjene metode, glavne rezultate i zaključke. Veličina fonta je 10, italic.
Ključne reči se navode ispod izvoda. Treba da ih bude minimalno 3, a maksimalno 6. Veličina fonta je 10, italic. Osnovni tekst. Radove treba pisati jezgrovito, razumljivim stilom i logičkim redom koji, po pravilu, uključuje uvodni
deo s određenjem cilja ili problema rada, opis metodologije, prikaz dobijenih rezultata, kao i diskusiju rezultata sa zaključcima i implikacijama.
Glavni naslovi trebaju biti urađeni sa veličinom fonta 12, bold, sve velika slova i poravnati sa levom marginom. Podnaslovi se pišu sa veličinom fonta 12, bold, poravnato prema levoj margini, velikim i malim slovima. Slike i tabele. Svaka ilustracija i tabela moraju biti razumljive i bez čitanja teksta, odnosno, moraju imati redni broj,
naslov i legendu (objašnjenje oznaka, šifara, skraćenica i sl.). Tekst se navodi ispod slike, a iznad tabele. Redni brojevi slika i tabela se daju arapskim brojevima.
Reference u tekstu se navode u ugličastim zagradama, na pr. [1,3]. Reference se prilažu na kraju rada na sledeći način:
[1] B.A. Willis, Mineral Procesing Technology, Oxford, Perganom Press, 1979, str. 35. (za poglavlje u knjizi) [2] H. Ernst, Research Policy, 30 (2001) 143–157. (za članak u časopisu) [3] www: http://www.vanguard.edu/psychology/apa.pdf (za web dokument) Navođenje neobjavljenih radova nije poželjno, a ukoliko je neophodno treba navesti što potpunije podatke o izvoru. Zahvalnost se daje po potrebi, na kraju rada, a treba da sadrži ime institucije koja je finansirala rezultate koji se daju
u radu, sa nazivom i brojem projekta; ili ukoliko rad potiče iz magistarske teze ili doktorske disertacije, treba dati naziv teze/disertacije, mesto, godinu i fakultet na kojem je odbranjena. Veličina fonta 10, italic.
Radovi se šalju prevashodno elektronskom poštom ili u drugom elektronskom obliku. Adresa uredništva je: Časopis MINING AND METALLURGY ENGINEERING BOR
Institut za rudarstvo i metalurgiju Zeleni bulevar 35, 19210 Bor E-mail: [email protected] ; [email protected] Telefon: 030/435-164; 030/454-110
Svim autorima se zahvaljujemo na saradnji.

Related Documents