Mini hCG for Luteal Phase Support- a more Physiologic LPS for ART Treatment Ovarian Club Barcelona 16.09.2017 Robert Fischer MVZ Fertility Center Hamburg [email protected] ISO 9001:2015 ISO 17025

Welcome message from author
This document is posted to help you gain knowledge. Please leave a comment to let me know what you think about it! Share it to your friends and learn new things together.
Transcript
Mini hCG for Luteal Phase Support- a more Physiologic LPS for ART Treatment
Ovarian Club Barcelona
16.09.2017
Robert Fischer
MVZ Fertility Center Hamburg
ISO 9001:2015 ISO 17025
Dr. ROBERT FISCHER
FERTILITY CENTER HAMBURG
Mini hCG for Luteal Phase Support- a more Physiologic LPS for ART Treatment
Disclosure information: Nothing to declare

Outline
• Why is Luteal Phase support (LPS) required
• Luteal Phase after hCG triggering
• New challenges:GnRH-a triggering
• The more physiological LPS –The evidence
- The new option
Conclusions
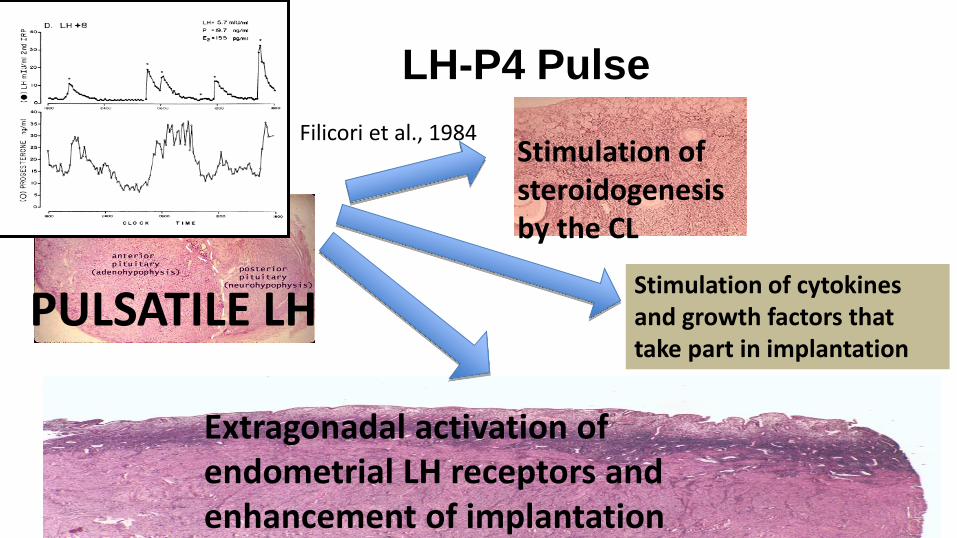
LH-P4 Pulse
PULSATILE LH
Extragonadal activation of endometrial LH receptors and enhancement of implantation
Stimulation of steroidogenesis by the CL
Stimulation of cytokines and growth factors that take part in implantation
Filicori et al., 1984

• LP in ALL stimulated IVF cycles is abnormal
(vs 8.1% natural cycles)
Main reason is the inhibition of LH secretion
(LH pulse frequency and amplitude)
due to supraphysiological steroid levels and distruption of the feedback mechanisms of the Hypothalamo-pituitary-ovarian axis.
an insufficient progesterone
concentration at the time of
implantation or during early pregnancy may cause
early pregnancy loss.
Edwards, 1980; Fatemi, 2007 Tavaniotou, 2001; Fauser and Devroey, 2003;
Is LPS required?

Pregnancy loss in relation to the mid-luteal phase progesterone levels in women undergoing ovulation with an agonist trigger
Higher Progesterone Level Reduce Pregnancy Loss
Results from four independent studies
0
20
40
60
80
100
0 100 200 300 400 500Pre
gnan
cy lo
ss (
%)
Mid-luteal phase progesterone levels (nmol/l)
Results from four independent studies
Humaidan et al. (2005) Hum Reprod. 20:1213-20 Humaidan et al. (2010) Fertil Steril. 93:847-54 Engmann et al. (2008) Fertil Steril. 89:84-91 Humaidan et al. (2013) PMID:23753114
Yding Andersen & Andersen, RBMOnline, 2014; 28:552

Mid-luteal Progesterone levels are associated with increased pregnancy rates
Viable pregnancies had significantly higher mean P4 levels in the early luteal phase than non-pregnant. 73% of viable pregnancies, 42% of clinical abortions and 20% of preclinical abortions had a P4 level exceeding 95 nmol/L in the mid-luteal phase (Liu et al., 1995)
A significant positive association between the mean P4 concentration during the luteal phase and the clinical pregnancy rate in a study of 544 women undergoing IVF treatment (Mitwally MF et al., 2010)
A significant higher P4 concentration in patients that became pregnant compared to those who did not (Ellenborgen A et al., 2004)
Yding Andersen & Andersen, RBMOnline, 2014; 28:552
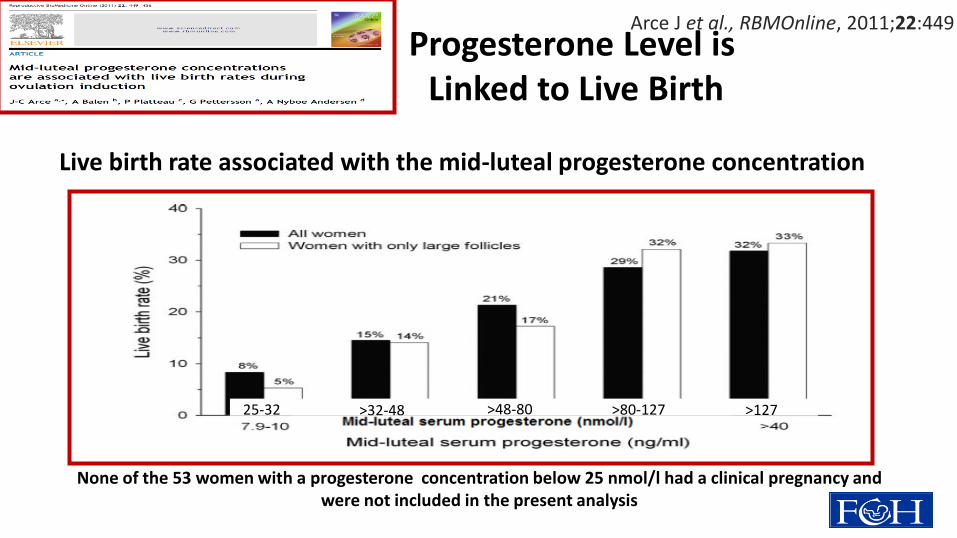
None of the 53 women with a progesterone concentration below 25 nmol/l had a clinical pregnancy and were not included in the present analysis
Live birth rate associated with the mid-luteal progesterone concentration
Arce J et al., RBMOnline, 2011;22:449 Progesterone Level is Linked to Live Birth
25-32 >32-48 >48-80 >80-127 >127

Vaginal progesterone average level ~ 37 nmol/l Vaginal progesterone Cmax ~ 46 nmol/l
Prediction of the chance of a live birth based on the mid-luteal progesterone concentration (multivariate logistic regression model) Arce J et al., RBMOnline, 2011;22:449
Mid-Luteal Phase Progesterone Level as Predictor of Live Birth Rate
020406080
100120140160180200220240260
0 1 2 3 4 5 6 7 8 9 10 11 12
Time (days)
hC
G/L
H (
IU/L
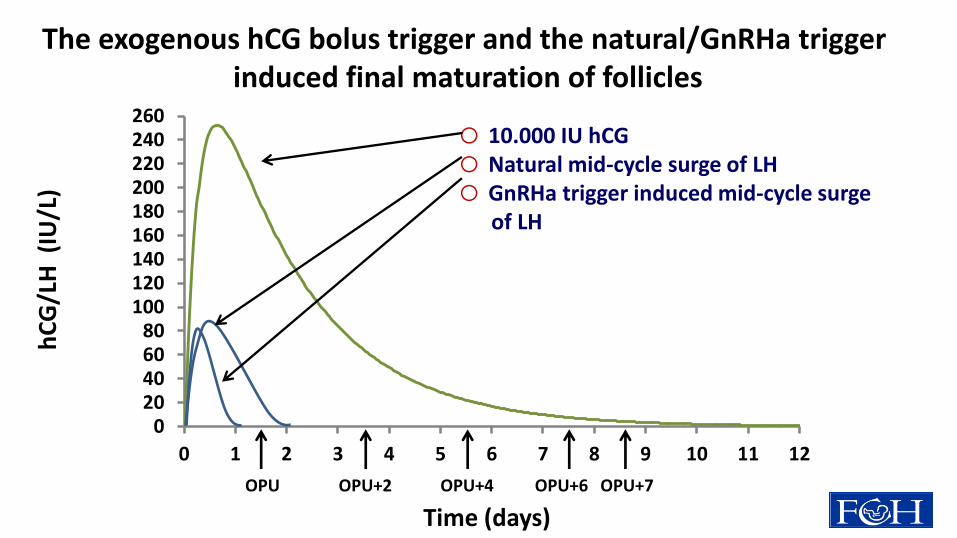
) The exogenous hCG bolus trigger and the natural/GnRHa trigger
induced final maturation of follicles
OPU OPU+2 OPU+4 OPU+6 OPU+7
o 10.000 IU hCG o Natural mid-cycle surge of LH o GnRHa trigger induced mid-cycle surge of LH

Levels of progesterone in the luteal phase following the
natural menstrual cycle or by the use of hCG bolus trigger
10.000 IU hCG
Natural mid-cycle surge
0
20
40
60
80
100
120
140
160
180
200
-5 0 5 10 15 20
Pro
gest
ero
ne
(n
mo
l/L)
Days after OPU
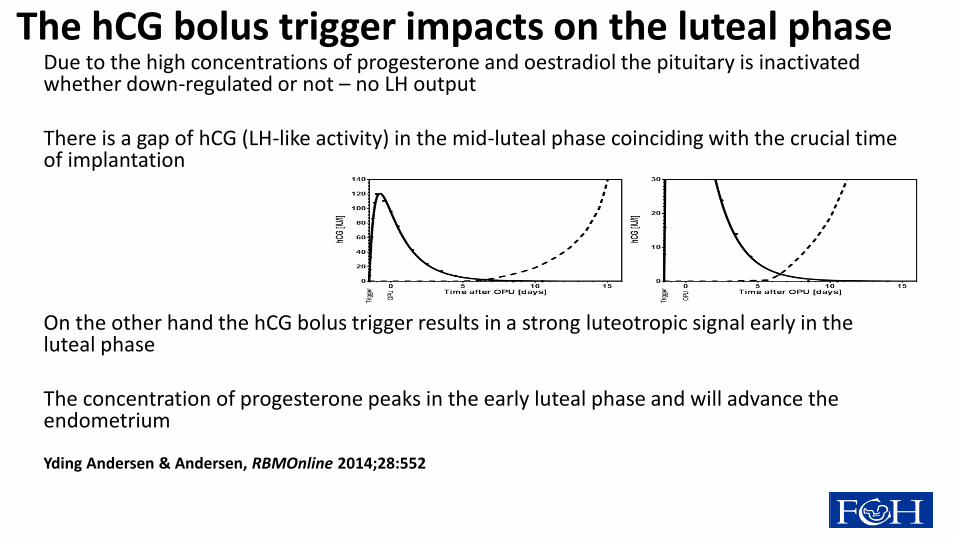
Due to the high concentrations of progesterone and oestradiol the pituitary is inactivated whether down-regulated or not – no LH output There is a gap of hCG (LH-like activity) in the mid-luteal phase coinciding with the crucial time of implantation On the other hand the hCG bolus trigger results in a strong luteotropic signal early in the luteal phase The concentration of progesterone peaks in the early luteal phase and will advance the endometrium
Yding Andersen & Andersen, RBMOnline 2014;28:552
The hCG bolus trigger impacts on the luteal phase

His
tolo
gic
al
da
tin
g
P< 0.001
0
1
2
3
4
5
6
7
8
Day 0 Day 2 Day 7
Natural cycle
Stimulated cycle
Luteal day
P<0.05 (group)
P< 0.001 (interaction)
Day 5
Histological dating in natural and stimulated cycles
Bourgain et al, Fertil Steril 2002
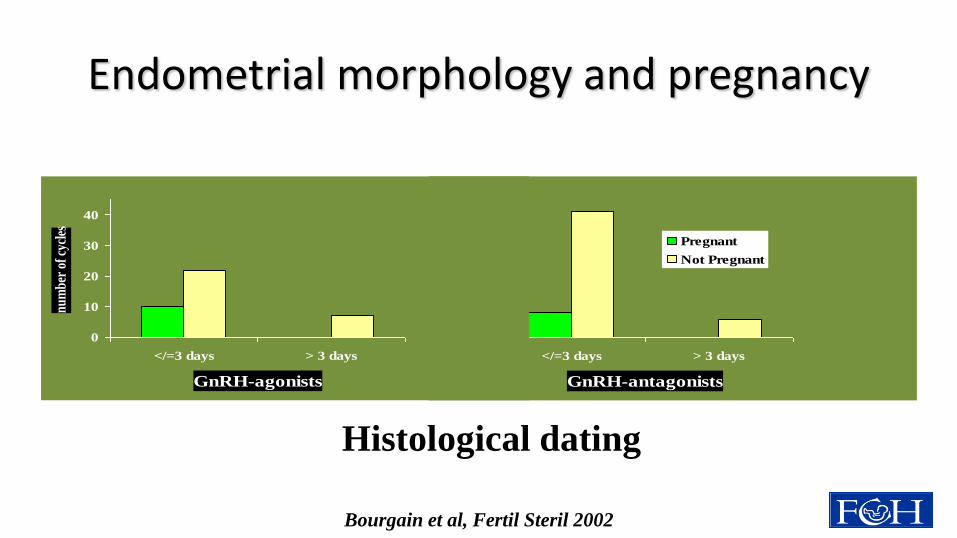
Endometrial morphology and pregnancy
P < 0.05
0
10
20
30
40
</=3 days > 3 days
GnRH-antagonists
Pregnant
Not Pregnant
0
10
20
30
40
</=3 days > 3 days
GnRH-agonists
nu
mb
er o
f cy
cles
Histological dating
Bourgain et al, Fertil Steril 2002

In GnRH antagonist/FSH cycles, advanced endometrial maturation on the day of oocyte retrieval correlates with
altered gene expression
Van Vaerenbergh I, Van Lommel L, Ghislain V, In't Veld P, Schuit F, Fatemi HM, Devroey P, Bourgain C.
According to Noyes' criteria, all endometria taken on the day of oocyte retrieval showed an advanced maturation, ranging from +d2 to +d4. The patients with a
subsequent clinical pregnancy all showed a histological dating corresponding to +d2 or +d3.
When comparing endometria +d2-3 to +d4, the microarray results showed a differential expression of 2550 probe sets.
Significantly up-regulated genes were SERPINB6, FOXO3A, SOX17 and CDC42.
Down-regulated genes of interest were NRP1, HOXA10 and OSF2.
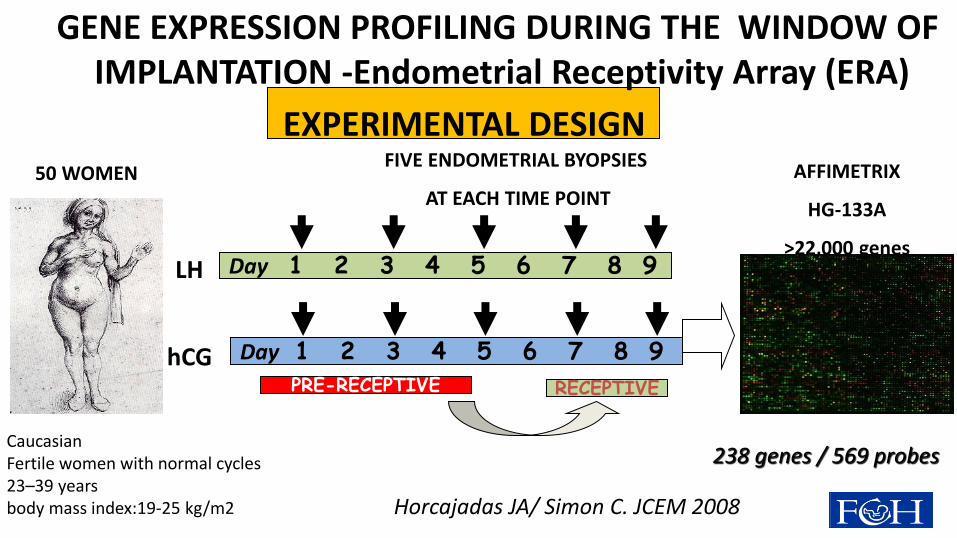
GENE EXPRESSION PROFILING DURING THE WINDOW OF IMPLANTATION -Endometrial Receptivity Array (ERA)
EXPERIMENTAL DESIGN FIVE ENDOMETRIAL BYOPSIES
AT EACH TIME POINT
AFFIMETRIX
HG-133A
>22,000 genes
50 WOMEN
Caucasian Fertile women with normal cycles 23–39 years body mass index:19-25 kg/m2
LH Day 1 2 3 4 5 6 7 8 9
hCG Day 1 2 3 4 5 6 7 8 9
Horcajadas JA/ Simon C. JCEM 2008
PRE-RECEPTIVE RECEPTIVE
238 genes / 569 probes

Day LH/hCG+7
The wide-genomic approach demonstrates
a 2-day difference on the cluster of genes governing endometrial receptivity
15k
8x15K

Too much of the good? Experimental evidence suggests prolonged exposure to hCG is detrimental to endometrial receptivity. (Evans & Salamonsen, Hum.Rerod.2013).
This study found that chronic exposure to normal hCG in vitro mediated a down-regulation of LHR in the endometrial epithelial cells and renders cells refractory to acute hCG. Evidence indicates that supra-physiological levels of hCG during the mid-luteal phase may interfere with successful implantation.

The new challenge: GnRH agonist for triggering of ovulation
and Fresh E.T. First trials low clinical pregnancy rate – high early pregnancy loss (Humaidan et al., 2005; Kolibianakis et al., 2005 Griesinger et al., Fertil Steril 2007; Hum. Rep. Update 2006) Low live birth rate after GnRHa versus hCG triggering (Griesinger et al., Fertil Steril 2007) Low reproductive outcome attributed to a luteal phase insufficiency despite supplementation with progesterone and estradiol GnRHa triggering leads to significantly reduced total amounts of LH released by the pituitary due to profile and duration of surge. (Gonen et al., 1990; Itskovitz et al., 1991) LH mean mid-luteal phase 6.0 IU/l in natural cycle 0,2 IU/I hCG trigger (Tavaniotou and Devroey 2003)
1.5 IU/l in GnRH-a group (Humaidan et al, 2005)

Serum concentrations of LH (hCG), FSH, E2, and P ( during triggering of final stages of oocyte maturation with two GnRH agonist or hCG
Fauser B C et al. JCEM 2002;87:709-715 ©2002 by Endocrine Society

Different Strategies for Lut.Phase Support (after GnRH-a Triggering)
• E2+Progesterone :(i.m.) high dose until 10 weeks pregnancy
(Engmann et al. 2008)
• HCG :Multi Low-Dose 450 I.U. (Krause et al. 2006)
Single- Dose 1500 I.U. /Double Dose (Humaidan et al.2010;2013)
Dual –Triggering (GnRHa+1000 I.U. hCG,if E2<4000pg/ml)
(Shapiro et al.,2011; Engmann et al., 2012 )
Daily Micro-Dose (125 I.U.) hCG (C.Y.Andersen et al. 2015))
• Rec LH: Multiple Dose 300 I.U. (Papanikolaou et al. 2011)
• GnRH –Agonist :Multiple Dose daily (Pirard et al. 2006,2015)
(Bar Hava et al. 2016)
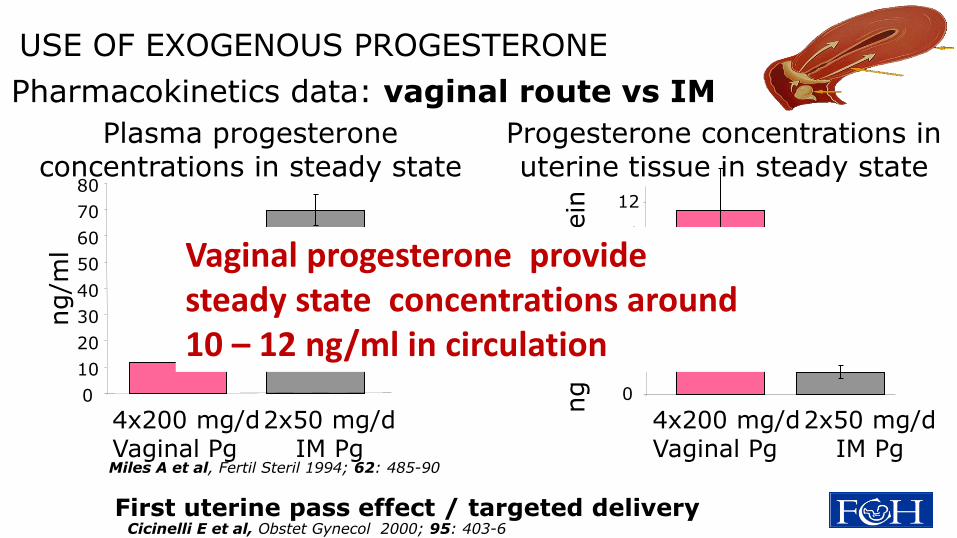
Pharmacokinetics data: vaginal route vs IM
Plasma progesterone concentrations in steady state
0
10
20
30
40
50
60
70
80
ng/m
l
4x200 mg/d Vaginal Pg
2x50 mg/d IM Pg
Progesterone concentrations in uterine tissue in steady state
ng P
g/m
g p
rote
in
0
2
4
6
8
10
12
4x200 mg/d Vaginal Pg
2x50 mg/d IM Pg
Miles A et al, Fertil Steril 1994; 62: 485-90
USE OF EXOGENOUS PROGESTERONE
Vaginal progesterone provide steady state concentrations around 10 – 12 ng/ml in circulation
First uterine pass effect / targeted delivery Cicinelli E et al, Obstet Gynecol 2000; 95: 403-6

Mean P4 concentration in the ovarian vein
was 800-fold higher than mean jugular venous levels Samples from ovarian veins contralateral to CL-bearing ovaries showed a mean P4 concentration 30 times lower (ipsilateral: 1037 ±138 ng/ml ; contralateral: 30 ±11 ng/ml; P < 0.001) Mean progesterone concentration in the uterine vein was approximately 30-fold higher than in jugular and similar in both uterine horns
Ovarian production is more likely to cause a direct uterine effect
than Vaginal route supplementation
Anatomy of progesterone delivery to the uterus Progesterone concentrations
in sheep during the luteal phase
Abecia J et al., Anim. Reprod. Science, 1997;48:209

This is a proof-of-concept study conducted as a three arm RCT with a total of 93 patients
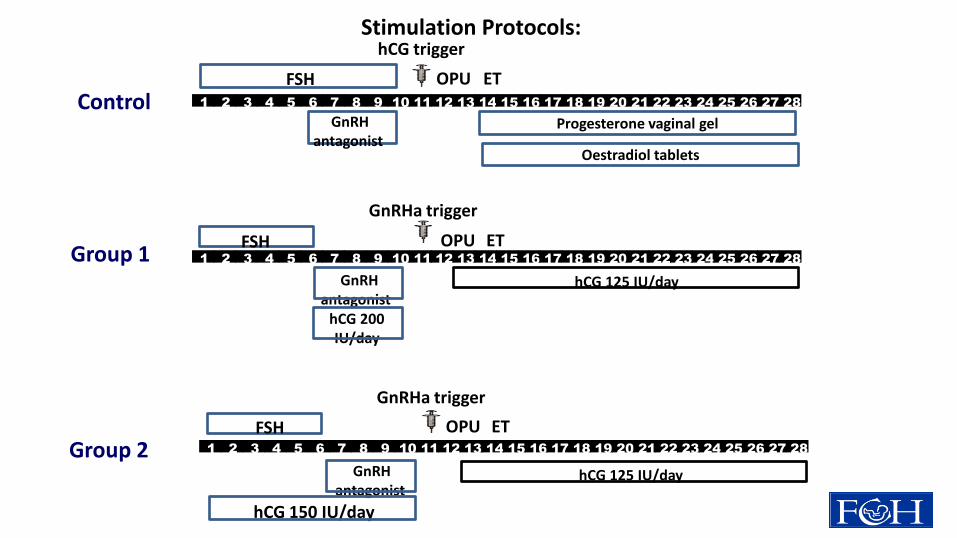
Group 2
Control 1 2 3 4 5 6 7 8 9 10 11 12 13 14 15 16 17 18 19 20 21 22 23 24 25 26 27 28
OPU ET
hCG trigger
Stimulation Protocols:
FSH
GnRH antagonist
Progesterone vaginal gel
Oestradiol tablets
1 2 3 4 5 6 7 8 9 10 11 12 13 14 15 16 17 18 19 20 21 22 23 24 25 26 27 28
OPU ET
GnRH antagonist
hCG 150 IU/day
hCG 125 IU/day
GnRHa trigger
FSH
1 2 3 4 5 6 7 8 9 10 11 12 13 14 15 16 17 18 19 20 21 22 23 24 25 26 27 28
OPU ET
GnRH antagonist
hCG 200 IU/day
hCG 125 IU/day
GnRHa trigger
Group 1 FSH

Endocrine parameters for women in RCT of follicular phase hCG
administration, GnRHa trigger and micro-dose hCG for luteal
phase support as compared to a standard protocol (Mean ±SEM)
Oestradiol (nmol/L) Progesterone (nmol/L) hCG (IU/L)
Control Group1 Group 2 Control Group1 Group 2 Control Group1 Group 2
No. women
32 31 30 ANOVA 32 31 30 ANOVA 32 31 30 ANOVA
Day of OT 7.0 ±0.7 7.7 ±1.0 9.4
±1.0 P>0.10
2.5 ±0.3
3.1 ±0.3
2.6 ±0.2
P>0.10 NM 4.8
±0.6 5.3
±0.5 P>0.10
Day of OPU
NM NM NM 36.7 ±4.7
15.1 ±2.0
11.0 ±1.0
P<0.001 74
±4.4 2.0
±0.2 2,2
±0.2 P<0.001
Day of OPU + 7
4.4 ±0.5
5.7 ±0.8
6,8 ±0.6
P=0.04 170 ±25
301 ±42
277 ±24
P=0.009 1.8
±0.2 3.2
±0.5 3.2
±0.3 P=0.014
Yding Andersen et al., Hum Rep 2015;30:2387

0
50
100
150
200
250
300
0 24 48 72 96 120 144 168 192 216 240 264 288
hC
G (
IU/L
)
Time (hours)
125 IU hCG daily
1.500 IU hCG on OPU and OPU+5
10.000 IU hCG on ovulation trigger GnRHa trigger induced mid-cycle surge of LH
OPU OPU+2 OPU+4 OPU+6 OPU+7
hCG during the luteal phase with different dosing
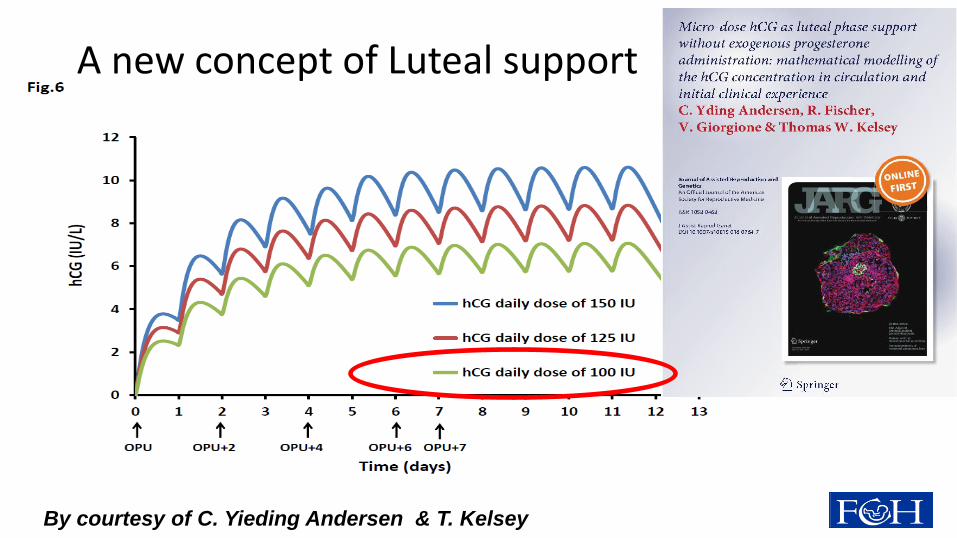
By courtesy of C. Yieding Andersen & T. Kelsey
A new concept of Luteal support

100 IU hCG daily
No exogenous P4
(1 day after OPU for 9 days)
Bolus hCG (1.500 IU)
(OPU + individualized OPU 5)
800 mg P4 vag (Ultrogest)
P-value
Period of treatment June – Oct. 2015 Jan. – Oct. 2015 NA
No. of cycles/women 94/84 150/127 NA
Age (years) 36.55 ± 0.43 37.35 ± 0.33 P>0.10*
Days of stimulation 8.5 ± 0.12 8.5 ± 0.07 P>0.10*
FSH consumption (IU) 2069 ± 75 2020 ± 59 P>0.10*
No. oocytes (per cycle) 9.36 ± 0.42 11.58 ± 0.55 P>0.10*
Normally fertilized (MII oocyte) 478/749 (64%) 925/1411 (66%) P>0.10**
Cryopreserved: 2PNs/embryos 44/65 133/74 NA
No. Embryos for culture 328 610 NA
No. Embryos used for ET 132/80 (1.7) 234/135 (1.7) P>0.10**
Reproductive outcome of IVF/ICSI treatment
in following the antagonist
protocol and receiving GnRHa trigger for final oocyte maturation.
C.Yding Andersen ,R.Fischer et al., JARG, 2016; PMID: 27448021
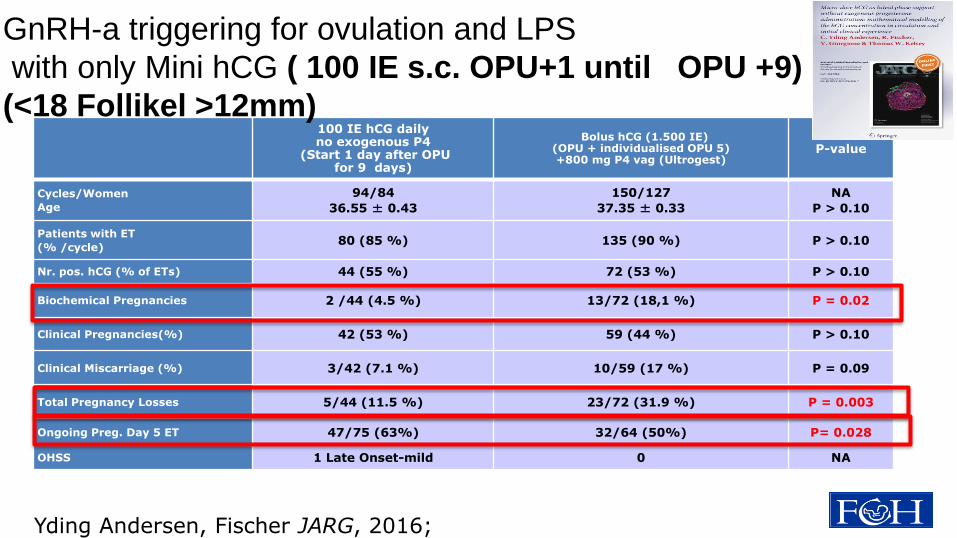
100 IE hCG daily no exogenous P4
(Start 1 day after OPU for 9 days)
Bolus hCG (1.500 IE) (OPU + individualised OPU 5) +800 mg P4 vag (Ultrogest)
P-value
Cycles/Women
Age
94/84
36.55 ± 0.43
150/127
37.35 ± 0.33
NA
P > 0.10
Patients with ET
(% /cycle) 80 (85 %) 135 (90 %) P > 0.10
Nr. pos. hCG (% of ETs) 44 (55 %) 72 (53 %) P > 0.10
Biochemical Pregnancies 2 /44 (4.5 %) 13/72 (18,1 %) P = 0.02
Clinical Pregnancies(%) 42 (53 %) 59 (44 %) P > 0.10
Clinical Miscarriage (%) 3/42 (7.1 %) 10/59 (17 %) P = 0.09
Total Pregnancy Losses 5/44 (11.5 %) 23/72 (31.9 %) P = 0.003
Ongoing Preg. Day 5 ET 47/75 (63%) 32/64 (50%) P= 0.028
OHSS 1 Late Onset-mild 0 NA
GnRH-a triggering for ovulation and LPS
with only Mini hCG ( 100 IE s.c. OPU+1 until OPU +9)
(<18 Follikel >12mm)
Yding Andersen, Fischer JARG, 2016;
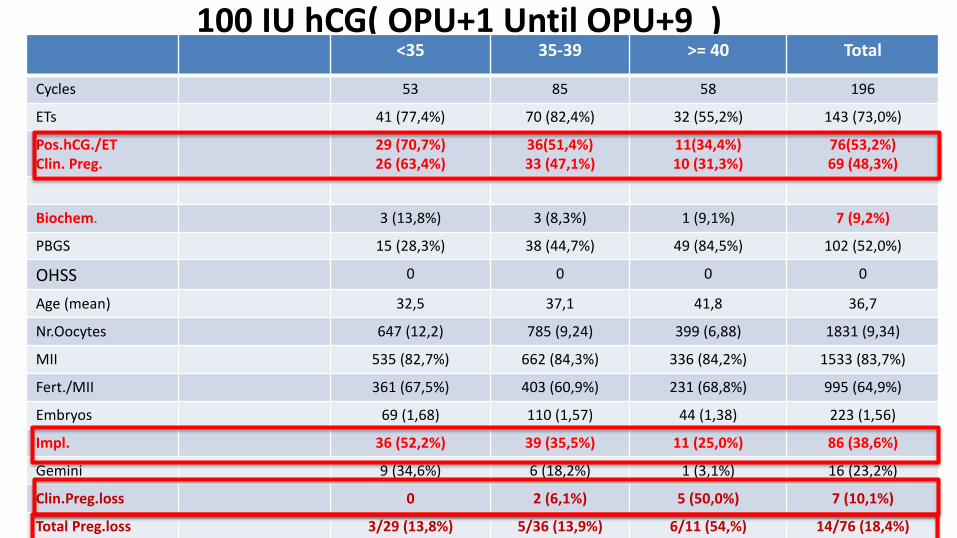
100 IU hCG( OPU+1 Until OPU+9 ) <35 35-39 >= 40 Total
Cycles 53 85 58 196
ETs 41 (77,4%) 70 (82,4%) 32 (55,2%) 143 (73,0%)
Pos.hCG./ET Clin. Preg.
29 (70,7%) 26 (63,4%)
36(51,4%) 33 (47,1%)
11(34,4%) 10 (31,3%)
76(53,2%) 69 (48,3%)
Biochem. 3 (13,8%) 3 (8,3%) 1 (9,1%) 7 (9,2%)
PBGS 15 (28,3%) 38 (44,7%) 49 (84,5%) 102 (52,0%)
OHSS 0 0 0 0
Age (mean) 32,5 37,1 41,8 36,7
Nr.Oocytes 647 (12,2) 785 (9,24) 399 (6,88) 1831 (9,34)
MII 535 (82,7%) 662 (84,3%) 336 (84,2%) 1533 (83,7%)
Fert./MII 361 (67,5%) 403 (60,9%) 231 (68,8%) 995 (64,9%)
Embryos 69 (1,68) 110 (1,57) 44 (1,38) 223 (1,56)
Impl. 36 (52,2%) 39 (35,5%) 11 (25,0%) 86 (38,6%)
Gemini 9 (34,6%) 6 (18,2%) 1 (3,1%) 16 (23,2%)
Clin.Preg.loss 0 2 (6,1%) 5 (50,0%) 7 (10,1%)
Total Preg.loss 3/29 (13,8%) 5/36 (13,9%) 6/11 (54,%) 14/76 (18,4%)

HCG Dosis
Start
Tag
HCG mlU/ml E2 pg/ml P4 ng/ml 17 OHP µg/l
OPU -2 OPU OPU
+5
OPU
+7
OPU -2 OPU OPU
+5
OPU
+7 OPU -
2
OPU OPU
+5
OPU
+7
OPU
-2
OPU OPU
+5
OPU
+7
75 OPU+1 <1.2 <1.2 5,9 6.2
2199 937 1460 1697 0,9 5,4 127 137
1.97 5.81 28.4 33.6
P4 & hCG levels in relation to oocyte pick-up:
hCG l
0
100
200
300
400
OPU -2 OPU OPU +5 OPU +7 OPU +1412704 22818 22312 23008 22993
0
20
40
60
80
100
120
140
160
180
200
-5 0 5 10 15 20
Pro
gest
ero
ne
(n
mo
l/L)
Days after OPU
hCG mIU/ml
Natural cycle
0
50
100
150
200
OPU -2 OPU OPU +5 OPU +7 OPU +14
12704 22818 22312 23008 22993
P4 (ng/ml)
Conclusions The luteal phase following a hCG trigger will induce - high levels of progesterone in the early luteal phase - reduced C.L. stimulation during the mid-luteal phase around implantation In COS a threshold value of P4of around 80—100 nmol/L exists above which early pregnancy loss is reduced The agonist trigger allows a number of new luteal phase protocols to be tested
A new regime using only daily 100 I.U. hCG s.c.from OPU+1 until OPU+9 is sufficent for LPS after GnRH-a ovulation triggering- showing a P4 luteal phase pattern like the natural cycle and reduced pregnancy loss.

Thank you for your time
HAMBURG
Related Documents