MIMER MEDICAL COLLEGE, TALEGAON (D) Index 3.3.3 Average number of research papers published per teacher in the Journals notified on UGC -CARE list in the UGC website/Scopus/ Web of Science/ PubMed during the last five years Sr. No. Publication Title Journal-name Year Page No. 1 Nanocarrier anticancer drug-conjugates cause higher cellular deformations: culpable for mischief Biomaterials Science 2020 3-4 2 Prospective study of gross motor milestones in children with severe Idiopathic club foot treated by pontesi method Indian Journal of Orthopedics 2020 5-9 3 Cellular regeneration and proliferation on polymeric 3D inverse-space substrates and the effect of doxorubicin Nanoscale Advances 2020 10-21 4 Self-Propelling Targeted Magneto-Nanobots for Deep Tumor Penetration and pH-Responsive Intracellular Drug Delivery Scientific Reports 2020 22-37 5 Cell deformation and acquired drug resistance: elucidating the major influence of drug-nanocarrier delivery systems Journal of Materials Chemistry B 2020 38 6 Does the Angle of Rigid Endoscope Makes a Difference in video laryngoscopy? Indian J Otolaryngology Head Neck Surgery 2019 39-43 7 Variability of small bowel length: Correlation with height, waist circumference and gender Italian Journal of Anatomy and Embryology 2018 44-51 8 Effect of physical training on pulmonary function test in young adults of a physical training academy Global journal for research analysis 2018 52-53 9 Morphologic and Cytometric Evaluation of Anemia in geriatric patients International Journal of Scientific Research 2018 54-56 10 Comparison between tamsulosin vs tamsulosin deflazacort in expulsion of lower ureteric calculi Indian Journal of Applied Research 2018 57-58 11 Clinical experience of the Tubeless PCNL using standard equipment’s Indian Journal of Applied Research 2018 59-60 12 Clinico- Pathological Study of Ovarian Tumors at A tertiary Care Institute International Journal of Scientific Research 2018 61-64 13 Do Aesthetic Average Nasal Parameters Matter for Rhinoplasty in India? Indian J Otolaryngology Head Neck Surgery 2018 65-72 14 Minimal Invasive Endoscopic Ear Surgery: A two handed Technique Indian J Otolaryngology Head Neck Surgery 2018 73-81 15 Novel horizontal and vertical integrated bioethics curriculum for medical courses Medical Teacher 2018 82-87 16 Neonatal Screening for Prevalence of Hearing Impairment in Rural Areas Indian J Otolaryngology Head Neck Surgery 2018 88-94 17 Selective Cell Isolation by Transferrin Functionalized Silane– Carbon Soot Mediated Superhydrophobic Micropatterns Advanced Materials Interfaces 2018 95-100 18 An insight into hardiness status of medical undergraduates Indian Journal of Community Health 2017 101-103 19 Biofunctionalized Capillary Flow Channel Platform Integrated 3D Nanostructured Matrix to Capture Circulating Tumor Cells Advanced Materials Interfaces 2017 104-112 20 Epidemiological Study Of Hardiness Profile Of Blind People Annals Of Tropical Medicine And Public health 2017 113-121 21 Pattern of Gastric Cancer at Tertiary Rural Hospital in Central India - 10 Year Retrospective study Paripex- Indian journal of research 2016 122-123 22 Budding trends in integrated pest management using advancedmicro- and nano-materials: Challenges and perspectives Journal of Environmental Management 2016 124-137 23 Novel Concept of Attaching Endoscope Holder to Microscopefor Two Handed Endoscopic Tympanoplasty. Indian Journal of Laryngology and Head andNeck Surgery 2016 138-148

Welcome message from author
This document is posted to help you gain knowledge. Please leave a comment to let me know what you think about it! Share it to your friends and learn new things together.
Transcript
MIMER MEDICAL COLLEGE, TALEGAON (D) Index
3.3.3 Average number of research papers published per teacher in the Journals notified on UGC -CARE list in the UGC website/Scopus/ Web of Science/ PubMed during the last five years
Sr. No.
Publication Title Journal-name Year Page No.
1 Nanocarrier anticancer drug-conjugates cause higher cellular
deformations: culpable for mischief Biomaterials Science 2020 3-4
2 Prospective study of gross motor milestones in children with severe Idiopathic club foot treated by pontesi method
Indian Journal of Orthopedics 2020 5-9
3 Cellular regeneration and proliferation on polymeric 3D
inverse-space substrates and the effect of doxorubicin Nanoscale Advances 2020 10-21
4 Self-Propelling Targeted Magneto-Nanobots for Deep Tumor Penetration and pH-Responsive Intracellular Drug Delivery
Scientific Reports 2020 22-37
5 Cell deformation and acquired drug resistance: elucidating the
major influence of drug-nanocarrier delivery systems Journal of Materials Chemistry B 2020 38
6 Does the Angle of Rigid Endoscope Makes a Difference in
video laryngoscopy? Indian J Otolaryngology Head
Neck Surgery 2019 39-43
7 Variability of small bowel length: Correlation with height, waist
circumference and gender Italian Journal of Anatomy
and Embryology 2018 44-51
8 Effect of physical training on pulmonary function test in young
adults of a physical training academy Global journal for research
analysis 2018 52-53
9 Morphologic and Cytometric Evaluation of Anemia in geriatric
patients International Journal of
Scientific Research 2018 54-56
10 Comparison between tamsulosin vs tamsulosin deflazacort
in expulsion of lower ureteric calculi Indian Journal of Applied
Research 2018 57-58
11 Clinical experience of the Tubeless PCNL using standard
equipment’s Indian Journal of Applied
Research 2018 59-60
12 Clinico- Pathological Study of Ovarian Tumors at A tertiary Care
Institute International Journal of
Scientific Research 2018 61-64
13 Do Aesthetic Average Nasal Parameters Matter for Rhinoplasty
in India? Indian J Otolaryngology Head
Neck Surgery 2018 65-72
14 Minimal Invasive Endoscopic Ear Surgery: A two handed
Technique Indian J Otolaryngology Head
Neck Surgery 2018 73-81
15 Novel horizontal and vertical integrated bioethics
curriculum for medical courses Medical Teacher 2018 82-87
16 Neonatal Screening for Prevalence of Hearing Impairment in
Rural Areas Indian J Otolaryngology Head
Neck Surgery 2018 88-94
17 Selective Cell Isolation by Transferrin Functionalized Silane– Carbon Soot Mediated Superhydrophobic Micropatterns
Advanced Materials Interfaces 2018 95-100
18 An insight into hardiness status of medical undergraduates Indian Journal of Community
Health 2017 101-103
19 Biofunctionalized Capillary Flow Channel Platform Integrated 3D Nanostructured Matrix to Capture Circulating Tumor Cells
Advanced Materials Interfaces 2017 104-112
20 Epidemiological Study Of Hardiness Profile Of Blind People
Annals Of Tropical Medicine And Public health
2017 113-121
21 Pattern of Gastric Cancer at Tertiary Rural Hospital in Central
India - 10 Year Retrospective study Paripex- Indian journal of
research 2016 122-123
22 Budding trends in integrated pest management using advanced micro- and nano-materials: Challenges and perspectives
Journal of Environmental Management
2016 124-137
23 Novel Concept of Attaching Endoscope Holder to Microscope for Two Handed Endoscopic Tympanoplasty.
Indian Journal of Laryngology and Head andNeck Surgery
2016 138-148

24 Endoscopic cartilage tympanoplasty: A two-handed
technique using an endoscope holder. The Laryngoscope 2016 149-150
25 Hepatoprotective effect of Eclipta Alba and Phyllanthus
Fraturnus extract in animal model (Rats) Paripex- Indian journal of
research. 2016 151-152
26 Evaluation of possum score – A clinical predictor of
morbidity and mortality in gastrointestinal surgeries. Paripex- Indian journal of
research. 2016 153-156
27 Endoscopic management of cholesteatoma with Khan's Endo
holder The Journal of Laryngology & Otology
2016 157-158
28 Awareness of Infectious Occupational Health Risks and the
Compliance of Recommended Vaccines Amongst the Medical Interns at Rural Hospital – A Pilot Study
International Journal of Scientific Research
2016 159-161
29 Epidemiological determinants of obesity in adolescent
population
Indian Journal of Community Health
2016 162-167
30 Pirfenidone induced phototoxic reaction in an elderly man Indian Journal of Dermatology, venereology and Leprology (IJDVL)
2016 168-170
31 Cellular cannibalism in giant Cells of central giant cell Granuloma of jaw bones and Giant cell tumors of long bones
Journal of Investigative and clinical dentistry
2016 171-172
Nanocarrier anticancer drug-conjugates cause higher cellular deformations: culpable for mischief†
Narendra Kale, ‡a Semonti Nandi, ‡a Ashwini Patil,a Yuvraj Patil, b Shashwat
Banerjee *b and Jayant Khandare *cd
Author affiliations
*Corresponding authors
aMAEER's Maharashtra Institute of Pharmacy, Kothrud, Pune 411038, India
bMaharashtra Institute of Medical Education and Research, Talegaon Dabhade, Pune 410507, India
E-mail: [email protected]
cSchool of Pharmacy, Dr. Vishwanath Karad Maharashtra Institute of Technology-World Peace University, Kothrud, Pune 411038, India
E-mail: [email protected]
dSchool of Consciousness, Dr. Vishwanath Karad Maharashtra Institute of Technology- World Peace University, Kothrud, Pune 411038, India
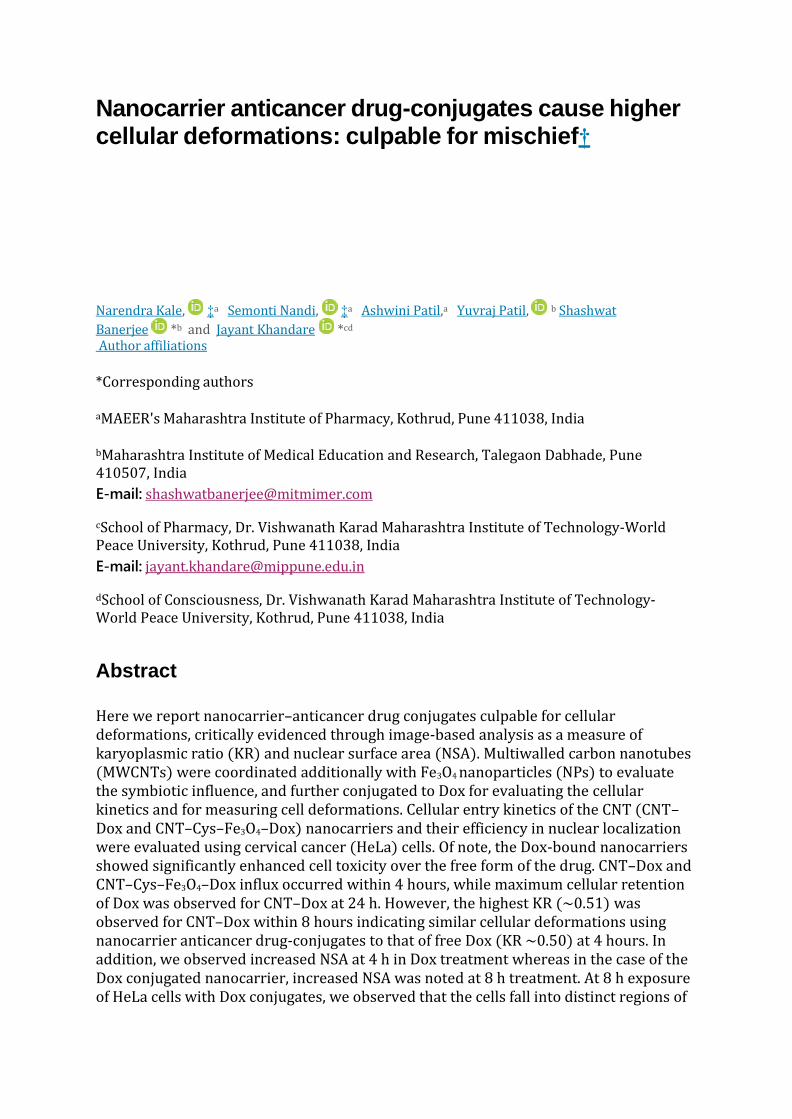
Abstract
Here we report nanocarrier–anticancer drug conjugates culpable for cellular deformations, critically evidenced through image-based analysis as a measure of karyoplasmic ratio (KR) and nuclear surface area (NSA). Multiwalled carbon nanotubes (MWCNTs) were coordinated additionally with Fe3O4 nanoparticles (NPs) to evaluate the symbiotic influence, and further conjugated to Dox for evaluating the cellular kinetics and for measuring cell deformations. Cellular entry kinetics of the CNT (CNT– Dox and CNT–Cys–Fe3O4–Dox) nanocarriers and their efficiency in nuclear localization were evaluated using cervical cancer (HeLa) cells. Of note, the Dox-bound nanocarriers showed significantly enhanced cell toxicity over the free form of the drug. CNT–Dox and CNT–Cys–Fe3O4–Dox influx occurred within 4 hours, while maximum cellular retention of Dox was observed for CNT–Dox at 24 h. However, the highest KR (∼0.51) was observed for CNT–Dox within 8 hours indicating similar cellular deformations using nanocarrier anticancer drug-conjugates to that of free Dox (KR ∼0.50) at 4 hours. In addition, we observed increased NSA at 4 h in Dox treatment whereas in the case of the Dox conjugated nanocarrier, increased NSA was noted at 8 h treatment. At 8 h exposure of HeLa cells with Dox conjugates, we observed that the cells fall into distinct regions of
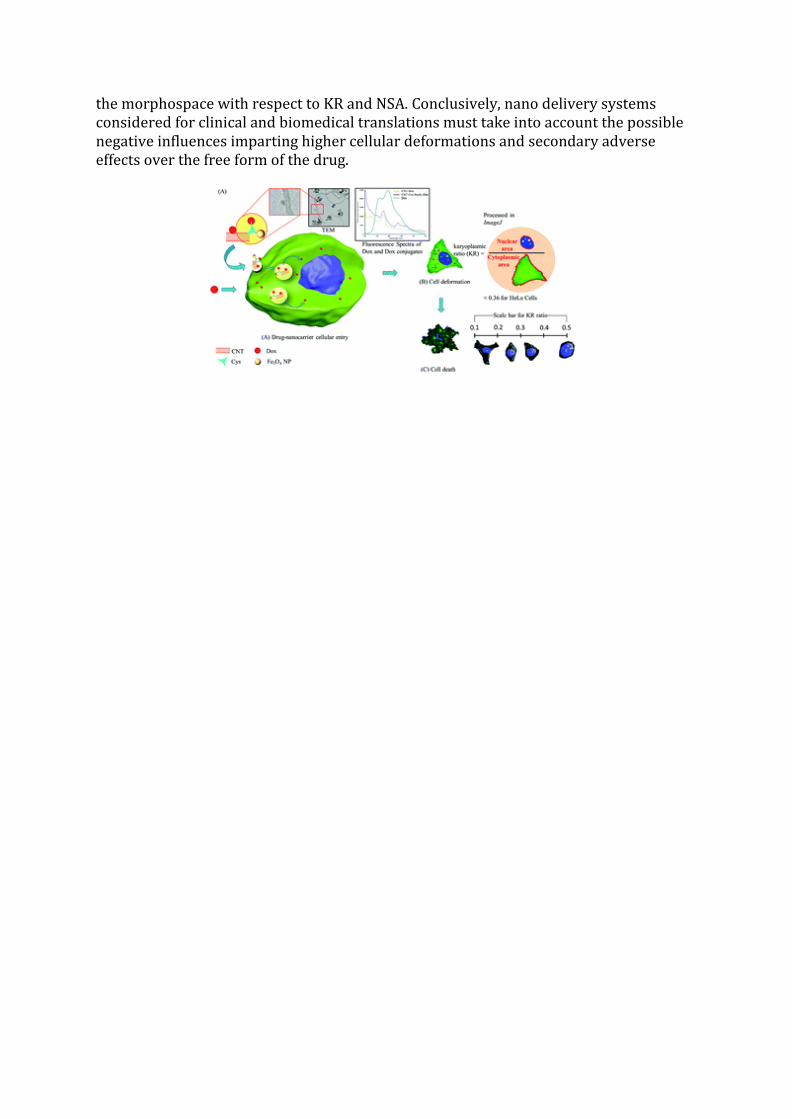
the morphospace with respect to KR and NSA. Conclusively, nano delivery systems considered for clinical and biomedical translations must take into account the possible negative influences imparting higher cellular deformations and secondary adverse effects over the free form of the drug.
Indian Journal of Orthopaedics
1 3
ORIGINAL ARTICLE
https://doi.org/10.1007/s43465-020-00214-3
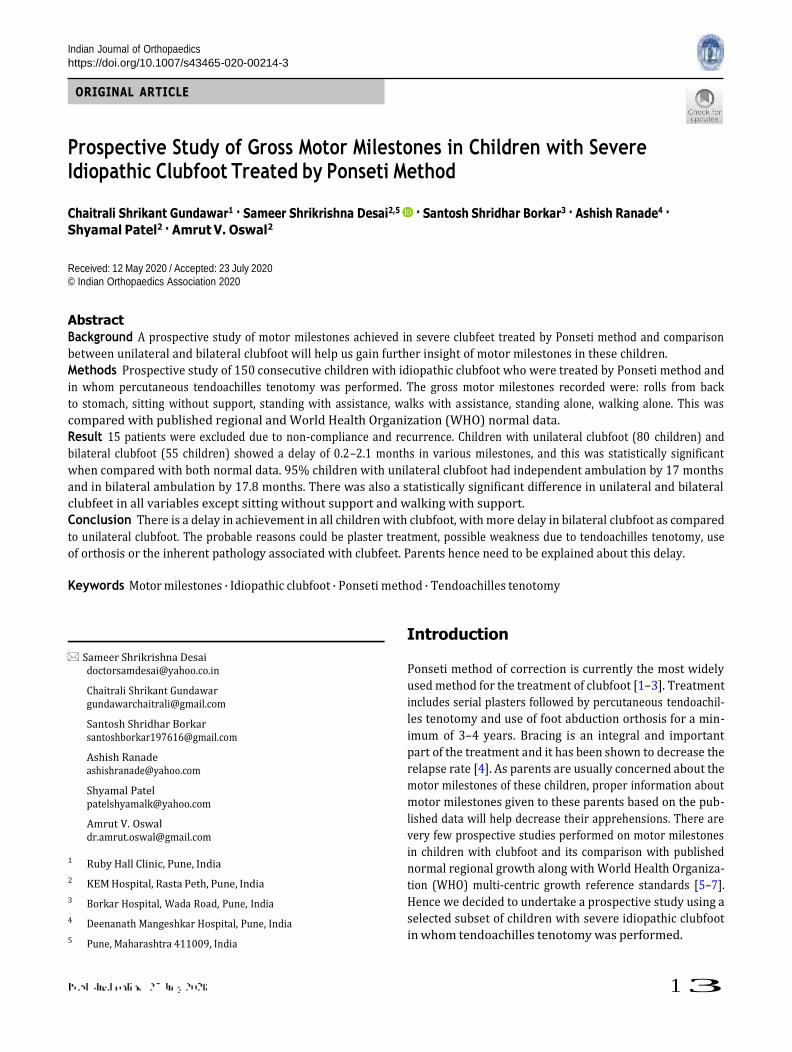
Prospective Study of Gross Motor Milestones in Children with Severe Idiopathic Clubfoot Treated by Ponseti Method
Chaitrali Shrikant Gundawar1 · Sameer Shrikrishna Desai2,5 · Santosh Shridhar Borkar3 · Ashish Ranade4 ·
Shyamal Patel2 · Amrut V. Oswal2
Received: 12 May 2020 / Accepted: 23 July 2020 © Indian Orthopaedics Association 2020
Abstract
Background A prospective study of motor milestones achieved in severe clubfeet treated by Ponseti method and comparison
between unilateral and bilateral clubfoot will help us gain further insight of motor milestones in these children.
Methods Prospective study of 150 consecutive children with idiopathic clubfoot who were treated by Ponseti method and
in whom percutaneous tendoachilles tenotomy was performed. The gross motor milestones recorded were: rolls from back
to stomach, sitting without support, standing with assistance, walks with assistance, standing alone, walking alone. This was
compared with published regional and World Health Organization (WHO) normal data.
Result 15 patients were excluded due to non-compliance and recurrence. Children with unilateral clubfoot (80 children) and
bilateral clubfoot (55 children) showed a delay of 0.2–2.1 months in various milestones, and this was statistically significant
when compared with both normal data. 95% children with unilateral clubfoot had independent ambulation by 17 months
and in bilateral ambulation by 17.8 months. There was also a statistically significant difference in unilateral and bilateral
clubfeet in all variables except sitting without support and walking with support.
Conclusion There is a delay in achievement in all children with clubfoot, with more delay in bilateral clubfoot as compared
to unilateral clubfoot. The probable reasons could be plaster treatment, possible weakness due to tendoachilles tenotomy, use
of orthosis or the inherent pathology associated with clubfeet. Parents hence need to be explained about this delay.
Keywords Motor milestones · Idiopathic clubfoot · Ponseti method · Tendoachilles tenotomy
Introduction
Sameer Shrikrishna Desai [email protected]
Chaitrali Shrikant Gundawar [email protected]
Santosh Shridhar Borkar [email protected]
Ashish Ranade [email protected]
Shyamal Patel [email protected]
Amrut V. Oswal [email protected]
1 Ruby Hall Clinic, Pune, India
2 KEM Hospital, Rasta Peth, Pune, India
3 Borkar Hospital, Wada Road, Pune, India
4 Deenanath Mangeshkar Hospital, Pune, India
5 Pune, Maharashtra 411009, India
Ponseti method of correction is currently the most widely
used method for the treatment of clubfoot [1–3]. Treatment
includes serial plasters followed by percutaneous tendoachil-
les tenotomy and use of foot abduction orthosis for a min-
imum of 3–4 years. Bracing is an integral and important
part of the treatment and it has been shown to decrease the
relapse rate [4]. As parents are usually concerned about the
motor milestones of these children, proper information about
motor milestones given to these parents based on the pub-
lished data will help decrease their apprehensions. There are
very few prospective studies performed on motor milestones
in children with clubfoot and its comparison with published
normal regional growth along with World Health Organiza-
tion (WHO) multi-centric growth reference standards [5–7].
Hence we decided to undertake a prospective study using a
selected subset of children with severe idiopathic clubfoot
in whom tendoachilles tenotomy was performed.
Indian Journal of Orthopaedics
1 3
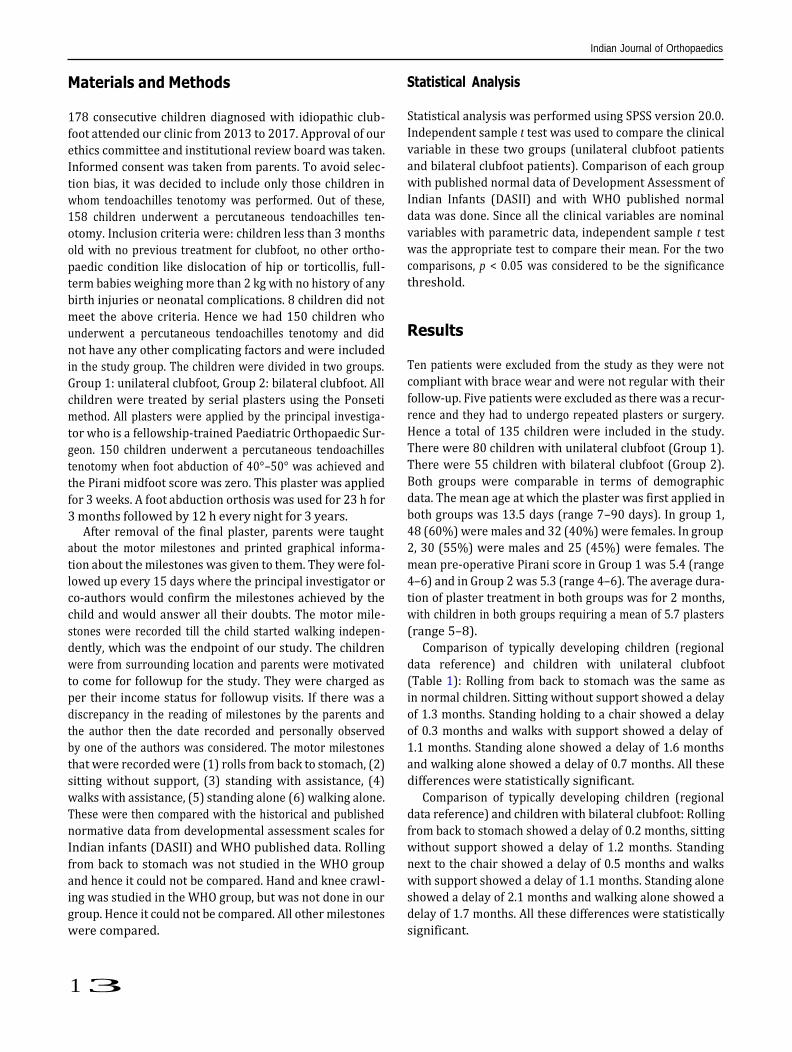
Materials and Methods
178 consecutive children diagnosed with idiopathic club-
foot attended our clinic from 2013 to 2017. Approval of our
ethics committee and institutional review board was taken.
Informed consent was taken from parents. To avoid selec-
tion bias, it was decided to include only those children in
whom tendoachilles tenotomy was performed. Out of these,
158 children underwent a percutaneous tendoachilles ten-
otomy. Inclusion criteria were: children less than 3 months
old with no previous treatment for clubfoot, no other ortho-
paedic condition like dislocation of hip or torticollis, full-
term babies weighing more than 2 kg with no history of any
birth injuries or neonatal complications. 8 children did not
meet the above criteria. Hence we had 150 children who
underwent a percutaneous tendoachilles tenotomy and did
not have any other complicating factors and were included
in the study group. The children were divided in two groups.
Group 1: unilateral clubfoot, Group 2: bilateral clubfoot. All
children were treated by serial plasters using the Ponseti
method. All plasters were applied by the principal investiga-
tor who is a fellowship-trained Paediatric Orthopaedic Sur-
geon. 150 children underwent a percutaneous tendoachilles
tenotomy when foot abduction of 40°–50° was achieved and
the Pirani midfoot score was zero. This plaster was applied
for 3 weeks. A foot abduction orthosis was used for 23 h for
3 months followed by 12 h every night for 3 years. After removal of the final plaster, parents were taught
about the motor milestones and printed graphical informa-
tion about the milestones was given to them. They were fol-
lowed up every 15 days where the principal investigator or
co-authors would confirm the milestones achieved by the
child and would answer all their doubts. The motor mile-
stones were recorded till the child started walking indepen-
dently, which was the endpoint of our study. The children
were from surrounding location and parents were motivated
to come for followup for the study. They were charged as
per their income status for followup visits. If there was a
discrepancy in the reading of milestones by the parents and
the author then the date recorded and personally observed
by one of the authors was considered. The motor milestones
that were recorded were (1) rolls from back to stomach, (2)
sitting without support, (3) standing with assistance, (4)
walks with assistance, (5) standing alone (6) walking alone.
These were then compared with the historical and published
normative data from developmental assessment scales for
Indian infants (DASII) and WHO published data. Rolling
from back to stomach was not studied in the WHO group
and hence it could not be compared. Hand and knee crawl-
ing was studied in the WHO group, but was not done in our
group. Hence it could not be compared. All other milestones
were compared.
Statistical Analysis
Statistical analysis was performed using SPSS version 20.0.
Independent sample t test was used to compare the clinical
variable in these two groups (unilateral clubfoot patients
and bilateral clubfoot patients). Comparison of each group
with published normal data of Development Assessment of
Indian Infants (DASII) and with WHO published normal
data was done. Since all the clinical variables are nominal
variables with parametric data, independent sample t test
was the appropriate test to compare their mean. For the two
comparisons, p < 0.05 was considered to be the significance
threshold.
Results
Ten patients were excluded from the study as they were not
compliant with brace wear and were not regular with their
follow-up. Five patients were excluded as there was a recur-
rence and they had to undergo repeated plasters or surgery.
Hence a total of 135 children were included in the study.
There were 80 children with unilateral clubfoot (Group 1).
There were 55 children with bilateral clubfoot (Group 2).
Both groups were comparable in terms of demographic
data. The mean age at which the plaster was first applied in
both groups was 13.5 days (range 7–90 days). In group 1,
48 (60%) were males and 32 (40%) were females. In group
2, 30 (55%) were males and 25 (45%) were females. The
mean pre-operative Pirani score in Group 1 was 5.4 (range
4–6) and in Group 2 was 5.3 (range 4–6). The average dura-
tion of plaster treatment in both groups was for 2 months,
with children in both groups requiring a mean of 5.7 plasters
(range 5–8).
Comparison of typically developing children (regional
data reference) and children with unilateral clubfoot
(Table 1): Rolling from back to stomach was the same as
in normal children. Sitting without support showed a delay
of 1.3 months. Standing holding to a chair showed a delay
of 0.3 months and walks with support showed a delay of
1.1 months. Standing alone showed a delay of 1.6 months
and walking alone showed a delay of 0.7 months. All these
differences were statistically significant.
Comparison of typically developing children (regional
data reference) and children with bilateral clubfoot: Rolling
from back to stomach showed a delay of 0.2 months, sitting
without support showed a delay of 1.2 months. Standing
next to the chair showed a delay of 0.5 months and walks
with support showed a delay of 1.1 months. Standing alone
showed a delay of 2.1 months and walking alone showed a
delay of 1.7 months. All these differences were statistically
significant.
Indian Journal of Orthopaedics
1 3
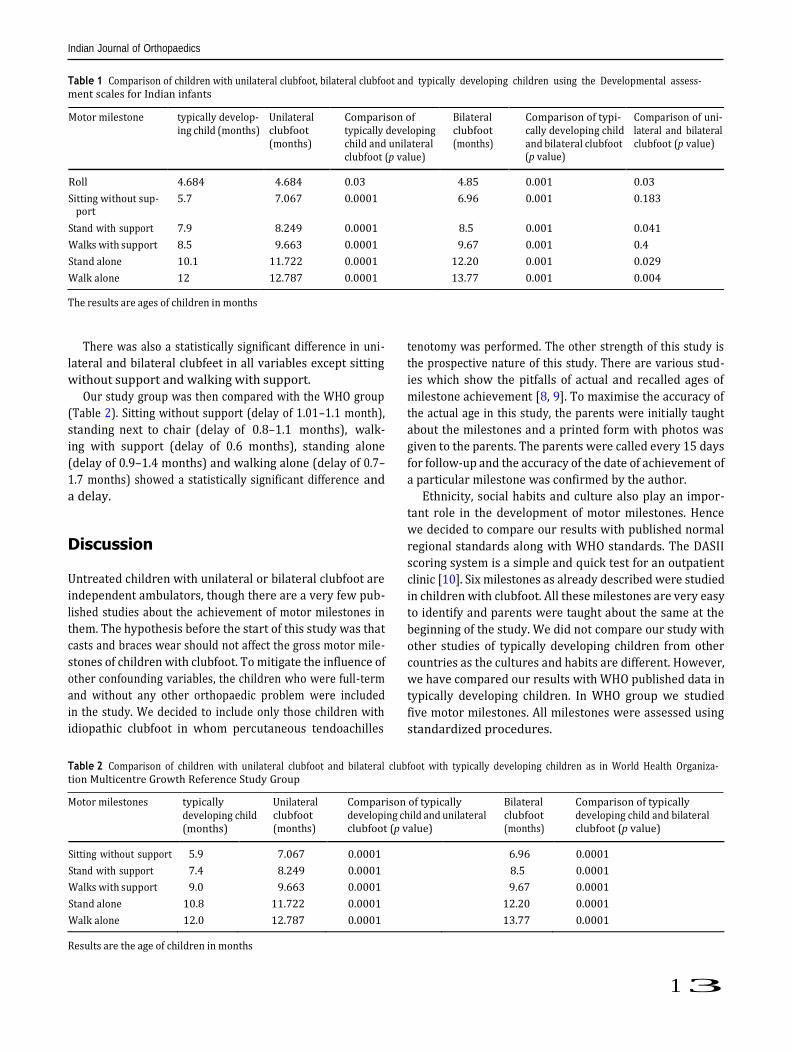
Table 1 Comparison of children with unilateral clubfoot, bilateral clubfoot and typically developing children using the Developmental assess- ment scales for Indian infants
(p value)
port
The results are ages of children in months
There was also a statistically significant difference in uni-
lateral and bilateral clubfeet in all variables except sitting
without support and walking with support.
Our study group was then compared with the WHO group
(Table 2). Sitting without support (delay of 1.01–1.1 month),
standing next to chair (delay of 0.8–1.1 months), walk-
ing with support (delay of 0.6 months), standing alone
(delay of 0.9–1.4 months) and walking alone (delay of 0.7–
1.7 months) showed a statistically significant difference and
a delay.
Discussion
Untreated children with unilateral or bilateral clubfoot are
independent ambulators, though there are a very few pub-
lished studies about the achievement of motor milestones in
them. The hypothesis before the start of this study was that
casts and braces wear should not affect the gross motor mile-
stones of children with clubfoot. To mitigate the influence of
other confounding variables, the children who were full-term
and without any other orthopaedic problem were included
in the study. We decided to include only those children with
idiopathic clubfoot in whom percutaneous tendoachilles
tenotomy was performed. The other strength of this study is
the prospective nature of this study. There are various stud-
ies which show the pitfalls of actual and recalled ages of
milestone achievement [8, 9]. To maximise the accuracy of
the actual age in this study, the parents were initially taught
about the milestones and a printed form with photos was
given to the parents. The parents were called every 15 days
for follow-up and the accuracy of the date of achievement of
a particular milestone was confirmed by the author.
Ethnicity, social habits and culture also play an impor-
tant role in the development of motor milestones. Hence
we decided to compare our results with published normal
regional standards along with WHO standards. The DASII
scoring system is a simple and quick test for an outpatient
clinic [10]. Six milestones as already described were studied
in children with clubfoot. All these milestones are very easy
to identify and parents were taught about the same at the
beginning of the study. We did not compare our study with
other studies of typically developing children from other
countries as the cultures and habits are different. However,
we have compared our results with WHO published data in
typically developing children. In WHO group we studied
five motor milestones. All milestones were assessed using
standardized procedures.
Table 2 Comparison of children with unilateral clubfoot and bilateral clubfoot with typically developing children as in World Health Organiza- tion Multicentre Growth Reference Study Group
Motor milestones typically developing child (months)
Unilateral clubfoot (months)
Comparison of typically developing child and unilateral clubfoot (p value)
Bilateral clubfoot (months)
Comparison of typically developing child and bilateral clubfoot (p value)
Sitting without support 5.9 7.067 0.0001 6.96 0.0001
Stand with support 7.4 8.249 0.0001 8.5 0.0001
Walks with support 9.0 9.663 0.0001 9.67 0.0001
Stand alone 10.8 11.722 0.0001 12.20 0.0001
Walk alone 12.0 12.787 0.0001 13.77 0.0001
Results are the age of children in months
Motor milestone typically develop- ing child (months)
Unilateral clubfoot (months)
Comparison of typically developing child and unilateral clubfoot (p value)
Bilateral clubfoot (months)
Comparison of typi- cally developing child and bilateral clubfoot
Comparison of uni- lateral and bilateral clubfoot (p value)
Roll 4.684 4.684 0.03 4.85 0.001 0.03
Sitting without sup- 5.7 7.067 0.0001 6.96 0.001 0.183
Stand with support 7.9 8.249 0.0001 8.5 0.001 0.041
Walks with support 8.5 9.663 0.0001 9.67 0.001 0.4
Stand alone 10.1 11.722 0.0001 12.20 0.001 0.029
Walk alone 12 12.787 0.0001 13.77 0.001 0.004
Indian Journal of Orthopaedics
1 3
From the current study, we can conclude that there is a
delay in motor milestones in children with unilateral and
bilateral clubfoot. When compared with each other, children
with bilateral clubfoot showed a slight delay as compared
to unilateral clubfoot. However, the reason for the delay in
pre-ambulatory milestones like rolling and sitting without
support cannot be explained. The probable reasons for delay
in milestones in children with clubfoot could be prolonged
immobilization in above knee casts during the treatment,
partial restriction of movement due to use of a brace and the
primary pathology of clubfoot itself.
Sala et al. have published a study on motor milestones
in 51 children with idiopathic clubfoot [11]. They found a
delay of 1.5–2 months in perambulatory and ambulatory
milestones in their group. However, their sample size was
small and they have not studied unilateral and bilateral club-
foot separately. Tendoachilles tenotomy was performed in
only 59% of children studied by them. We have included
only those children in whom a tenotomy was performed.
Zionts et al. also studied walking age in clubfoot children
treated by Ponseti method and they observed that independ-
ent walking was seen approximately 2 months later when
compared to infants without clubfoot [12]. A greater delay
may be expected for those patients who have a very severe
deformity or those who experience a deformity relapse.
However, they did not study other milestones and did not
differentiate between unilateral and bilateral clubfeet.
In a study by Garcia et al., 26 babies with clubfeet treated
with various methods (Ponseti method, French method and
combination) were compared with 26 babies who were typi-
cally developing children. The gross motor performance was
evaluated with the Albert Infant Motor Scale for six motor
milestones. The researchers found that the babies with club-
feet had a mild delay in the gross motor skills and this delay
became apparent around the age of 9 months. Babies without
clubfeet were significantly more likely to walk at 12 months
than babies with clubfoot [13].
Loof has shown that gross motor deficits and asymmetries
are known to be present in children of 5 years of age with
clubfoot. In unilateral clubfoot, the normal foot modifies in
gait and foot motion just as the side with clubfoot. Accord-
ing to them, future studies are needed to prospectively study
gross motor skills in children from the period of infancy
[14].
A possible delay in milestones needs to be explained to
parents before the start of treatment. Though all milestones
are important, usually parents are more concerned about
independent ambulation. There was a delay of 0.7 months
for independent walking in children with unilateral clubfoot.
95% of children were walking independently by 17 months.
There was a delay of 1.7 months for independent walking in
children with bilateral clubfoot. 95% of children were walk-
ing independently by 17.8 months. We have shown that there
is a difference in motor milestones in children with unilat-
eral clubfoot and bilateral clubfoot. We have also compared
our results with both regional and WHO reference standards
and the results show a significant delay in milestones. Par-
ents need to be explained that these delays are mild with no
long-lasting implications and they should adhere to the brace
protocol to avoid recurrences.
Funding None of the authors received financial support for this study.
Compliance with Ethical Standards
Conflict of interest The authors declare no conflicts of interest.
Ethical standard statement This article does not contain any studies with human or animal subjects performed by the any of the authors.
Informed consent Informed consent was obtained of all parents about the study.
References
1. Ponseti, I. V. (1996). Congenital clubfoot. Fundamentals of treat-
ment. New York: Oxford University Press. 2. Laaveg, S. J., & Ponseti, I. V. (1980). Long-term results of treat-
ment of congenital club foot. The Journal of Bone and Joint Sur-
gery American Volume, 62, 23–31. 3. Herzenberg, J. E., Radler, C., & Bor, N. (2002). Ponseti versus
traditional methods of casting for idiopathic clubfoot. Journal of
Pediatric Orthopaedics, 22, 517–521. 4. Thacker, M. M., Scher, D. M., Sala, D. A., et al. (2005). Use of
foot abduction orthosis following Ponseti casts: Is it essential? Journal of Pediatric Orthopaedics, 25, 225–228.
5. Phatak, P. (1998). Developmental assessment scales for Indian
infants. Pune: Anand Agencies. 6. Phatak, A. T., & Khurana, B. (1991). Baroda development screen-
ing test for infants. Indian Pediatrics, 28(1), 31–37. 7. WHO Multicentre Growth Reference Study Group. (2006). WHO
Motor Development Study: Windows of achievement for six gross motor development milestones. Acta Paediatrica Supplement,
450, 86–95. 8. Donoghue, E. C., & Shakespeare, R. A. (1967). The reliability of
paediatric case-history milestones. Developmental Medicine &
Child Neurology, 9, 64–69. 9. Majnemer, A., & Rosenblatt, B. (1994). Reliability of parental
recall of developmental milestones. Pediatric Neurology, 10,
304–308. 10. Phatak, P., Dhapre, M., Pandit, A. N., et al. (1991). A study of
Baroda Development Screening Test for infants. Indian Pediatrics,
28(8), 843–849. 11. Sala, D. A., Chu, A., Lehman, W. B., et al. (2013). Achievement
of gross motor milestones in children with idiopathic clubfoot treated with the Ponseti method. Journal of Pediatric Orthopae-
dics, 33(1), 55–58. 12. Zionts, L. E., Packer, D. F., Cooper, S., et al. (2014). Walking
age of infants with idiopathic clubfoot treated using the ponseti method. The Journal of Bone and Joint Surgery American Vol-
ume, 96(19), e164.

Indian Journal of Orthopaedics
1 3
13. Garcia, N. L., McMulkin, M. L., Tompkins, B. J., et al. (2011). Gross motor development in babies with treated idiopathic club- foot. Pediatric Physical Therapy, 23(4), 347–352.
14. Lööf, E., Andriesse, H., André, M., Böhm, S., et al. (2019). Gross motor skills in children with idiopathic clubfoot and the associa- tion between gross motor skills, foot involvement, gait, and foot motion. Journal of Pediatric Orthopaedics, 39(7), 359–365.
Publisher’s Note Springer Nature remains neutral with regard to jurisdictional claims in published maps and institutional affiliations.
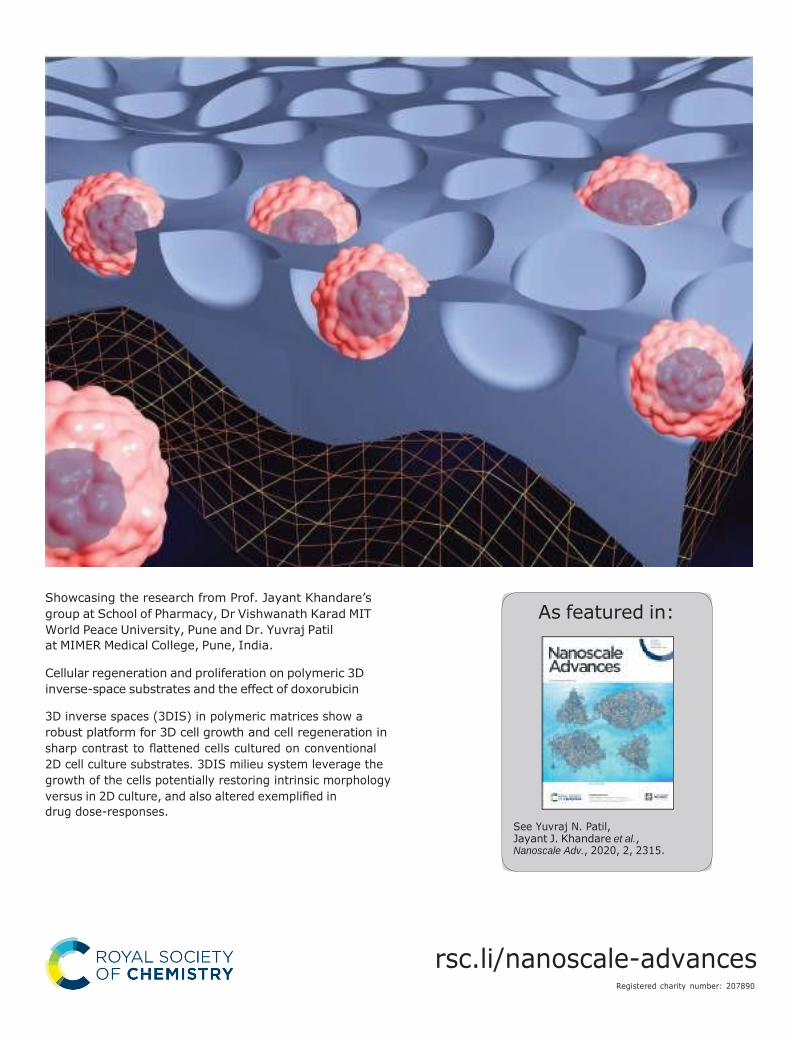
Showcasing the research from Prof. Jayant Khandare’s
group at School of Pharmacy, Dr Vishwanath Karad MIT
World Peace University, Pune and Dr. Yuvraj Patil
at MIMER Medical College, Pune, India.
Cellular regeneration and proliferation on polymeric 3D
inverse-space substrates and the effect of doxorubicin
3D inverse spaces (3DIS) in polymeric matrices show a
robust platform for 3D cell growth and cell regeneration in
sharp contrast to flattened cells cultured on conventional
2D cell culture substrates. 3DIS milieu system leverage the
growth of the cells potentially restoring intrinsic morphology
versus in 2D culture, and also altered exemplified in
drug dose-responses.
rsc.li/nanoscale-advances Registered charity number: 207890
As featured in:
See Yuvraj N. Patil, Jayant J. Khandare et al., Nanoscale Adv., 2020, 2, 2315.
Nanoscale Adv., 2020, 2, 2315–2325 | 2315 This journal is © The Royal Society of Chemistry 2020
Op
en A
cces
s A
rtic
le.
Pu
bli
shed
on
01 A
pri
l 2
020
. D
ow
nlo
aded
on 1
0/2
6/2
02
0 6
:25:3
0 A
M.
Th
is a
rtic
le i
s li
cen
sed
un
der
a C
reat
ive
Co
mm
on
s A
ttri
bu
tio
n-N
onC
om
mer
cial
3.0
Unpo
rted
Lic
ence
.
PAPER View Article Onli View Journal | View Issue
ne
Nanoscale Advances
Cite this: Nanoscale Adv., 2020, 2, 2315
Received 27th January 2020
Accepted 1st April 2020
DOI: 10.1039/d0na00075b
rsc.li/nanoscale-advances
Cellular regeneration and proliferation on polymeric 3D inverse-space substrates and the
effect of doxorubicin†
Chandrashekhar D. Bobade,‡a Semonti Nandi, ‡a Narendra R. Kale,a
Shashwat S. Banerjee, b Yuvraj N. Patil *b and Jayant J. Khandare *c
Spatial arrangement for cells and the opportunity thereof have implications in cell regeneration and cell
proliferation. 3D inverse space (3DIS) substrates with micron-sized pores are fabricated under controlled
environmental conditions from polymers such as poly(lactic-co-glycolic) acid (PLGA), poly(lactic acid)
(PLA) and poly(styrene) (PS). The characterization of 3DIS substrates by optical microscopy, scanning
probe microscopy (SPM), etc. shows pores within 1–18 mm diameter and prominent surface roughness
extending up to 3.9 nm in height over its base. Conversely, to compare two-dimensional (2D) versus
3DIS substrates, the crucial variables of cell height, cell spreading area and cell volume are compared
using lung adenocarcinoma (A549) cells. The results indicate an average cell thickness of ~6 mm on
a glass substrate whereas cells on PLGA 3DIS were ~12 mm in height, occasionally reaching 20 mm, with
a 40% decreased cell spreading area. A549 cells cultured on polymer 3DIS substrates show a cell
regeneration growth pattern, dependent on the available spatial volume. Furthermore, PLGA 3DIS cell
culture systems with and without graded doxorubicin (DOX) pre-treatment result in potent cell inhibition
and cell proliferation, respectively. Additionally, standard DOX administration to A549 cells in the PLGA
3DIS system revealed altered drug sensitivity. 3DIS demonstrates utility in facilitating cellular regeneration
and mimicking cell proliferation in defined spatial arrangements.
Introduction
Synthetic biodegradable polymers such as poly(L-lactic acid)
(PLLA), poly(glycolic acid) (PGA), PLGA, poly(caprolactone)
(PCL) etc. have been previously reported as scaffolding materials
to exhibit cellular behavior and characteristics.1–3 Tissue
regeneration and wound healing has been extensively studied in
cell culture models.4–6 Comparably, the use of 3D cell culture
tools in cell proliferation and drug-mediated cytotoxicity studies
is limited, and is primarily studied using 2D cell cultures.7 An
observable issue with such planar tools as a cell attachment/
proliferation model is the morphological change induced in
2D cultured cells; the cells appear thinly spread with
a predominantly attened pro le.8 While enhanced cell adhe-
sion as a feature is desirable for cell studies, structurally altered
biological features may be responsible for a varied cell response
and function in such cells.8–10 Cell adhesion and interfacial
interactions exert morphological changes based on attachment-
substrate geometry, surface texture and stiffness among
others.11,12
Tissue regeneration/wound healing involves healthy cells
utilizing interactive feedback such as contact inhibition, pre-
venting healthy cells from multiplying and stacking beyond
their physiological role.13,14 On the other hand, cancerous cells
continue to proliferate beyond spatial contact inhibition and
o en grow as uncontrolled tumor masses as well as enable
dissemination of cancerous cells leading to metastasis.13 Planar
cell culture models with enhanced cell adhesion features
signi cantly lack a vertical pro le and may not re ect the ability
of cells to simulate wound closure based on cell–cell interaction
alone.2,15 Furthermore, structural components of in vivo tissues
support a more spatially relaxed cell pro le, compared to glass aMAAER's Maharashtra Institute of Pharmacy, Kothrud, Pune 411038, India
bMaharashtra Institute of Medical Education and Research Medical College, Talegaon-
Dabhade, Pune 410507, India. E-mail: [email protected]
cSchool of Pharmacy, Dr Vishwanath Karad MIT World Peace University, MIT Campus,
S. No. 124, Paud Road, Kothrud, Pune 411038, India. E-mail: jayant.khandare@
mippune.edu.in
† Electronic supplementary information (ESI) available: Fig. S1, Fig. S2, Fig. S3,
video 1, video 2, video 3 and video 4. See DOI: 10.1039/d0na00075b
‡ C. D. B. and S. N. contributed equally to this work.
or compatible planar surfaces, where tissue sections reveal
more geometrically shaped cells which can stack against each
other.16,17
3DIS is a lm-embedded negative or ‘inverted’ space,
embodied by porous cavities. While true 3D structures have
mass and distinct spatial coordinates, 3DIS presents a niche
which can be exploited for cell attachment, growth and culture.
The lm matrix surrounding the 3DIS pore constitutes the cell
2316 | Nanoscale Adv., 2020, 2, 2315–2325 This journal is © The Royal Society of Chemistry 2020
View Article Online
Paper Nanoscale Advances
Op
en A
cces
s A
rtic
le.
Pu
bli
shed
on
01 A
pri
l 2
020
. D
ow
nlo
aded
on 1
0/2
6/2
02
0 6
:25:3
0 A
M.
Th
is a
rtic
le i
s li
cen
sed
un
der
a C
reat
ive
Co
mm
on
s A
ttri
bu
tio
n-N
onC
om
mer
cial
3.0
Unpo
rted
Lic
ence
.
×
scaffolding. We hypothesize that the 3DIS substrates and the
corresponding cell culturing strategies may offer greater spatial
opportunity compared to 2D substrates. 3DIS substrates with
their predicted optimal cell attachment properties are further
hypothesized to retain cell topography to mimic ex vivo cells in
their natural environment. In the present study, the correlation
of chemotherapy failure due to sub-lethal anticancer therapy
leading to tumor cell regression and cell proliferation, there-
a er using 3DIS ex vivo polymeric systems, is envisioned. Thus,
the objectives of the study were (a) to design 3DIS substrates
composed of PS, PLA and PLGA and characterize the same; (b)
to demonstrate the utility of spatial scaffolding to allow cells to
grow freely in a 3D microenvironment, thereby enabling a near-
physiological outcome of DOX exposure to cancerous cells and
(c) to compare the differences in 2D and 3DIS cell cultures, with
regard to their effect on cell morphology and the effect of the
substrate juxtaposed with DOX exposure and the fate of the cells
thereof.
Experimental section Materials
PLGA with lactide : glycolide (ratio 75 : 25) and a Mw ~ 66–107
kDa and PLA with an average Mn ~ 40 kDa were obtained from
Sigma Aldrich, PS with a Mw ~ 40–60 kDa was obtained from
Analab Fine Chemicals, India. Doxorubicin hydrochloride
(DOX) was obtained from Sigma Aldrich. Toluidine blue O
(TBO) was obtained from SRL Pvt. Ltd, India. Methanol, chlo-
roform, and dimethylsulfoxide (DMSO) were of analytical grade.
Preparation of glass, PLGA, PS and PLA substrates
Plane, unmodi ed microscopic cover glasses were obtained and
used as substrates for cell culture post sterilization. PLGA, PS
and PLA 3DIS substrates were prepared through a typical breath
gure approach. First, 18 mm 18 mm glass cover slips were
washed with methanol to remove impurities. 5 mg. ml—1 poly-
mer solution of PLGA, PS and PLA was prepared in chloroform;
50 ml of the resultant polymer solution was placed with the aid
of a pipette slowly onto the glass slide under humid atmo-
spheric conditions (~80–90% Relative Humidity (RH) and
temperature 22.5 to 23.5 ◦C) in a sealed acrylic chamber. The
prepared 3DIS polymeric substrates were observed under
bright eld microscopy. The smooth polymeric substrates
(lacking inverted 3D structures) were prepared using the same
method under dry conditions (40% RH and temperature 26 ◦C).
Characterization of the polymeric scaffold
Morphological characters such as pore diameter, rim width and
substrate thickness of PLGA, PS and PLA substrates were
determined by calculating the average of three-point measure-
ments. The surface area for smooth and 3DIS substrates was
determined by image analysis. SPM (JSPM-5200, JEOL) analysis
provided the topography data of the designed polymer
substrates. Other parameters noted were polymer substrate
stability in various exposure conditions such as chemical
reagents, pH sensitivity, ultraviolet radiation etc.
Determination of surface carboxyl (–COOH) groups using the
TBO assay
The substrates were immersed in 1.5 ml of 2 mM TBO solution
for 24 h at room temperature (25 ◦C), during which the dye
bound via electrostatic interaction to the ionized acidic charges.
Substrates were thoroughly rinsed with 0.015 M NaCl at pH 11.0
to wash away the unbound dye molecules. Once air dried, the
substrates were placed in 1 ml of 0.2 M NaCl solution at pH 2.0
for 60 min while stirring. During this step, the TBO molecules
bound to the acidic groups of the substrate were eluted from the
analyzed surface and diffused into the solution, coloring it blue.
The light absorbance of the solutions at 630.8 nm wavelength
was measured. The blank consisted of a 0.2 M NaCl solution at
pH 2.0.
Measurement of wettability
The contact angle (q) of the prepared substrates was studied and
correlated with the structural geometry and wettability charac-
teristics of the prepared substrates. A deionized water drop of 5
ml, (n ¼ 6) was placed on dry substrates (PLGA, PS and PLA
smooth and 3DIS architecture) at room temperature and images
of the wetting process of the placed water drop were captured
with a high speed digital camera. The captured images were
processed using LBDSA Drop Shape plug-in the image analysis
so ware ImageJ (NIH, Bethesda, MD) for q determination.
Preparation of Dox pre-treated PLGA substrates
DOX solution volumes which are mole-identical to IC50 and IC25
of free DOX were pipetted onto PLGA (smooth and 3DIS)
substrates and air dried to leave a DOX coat onto the lm. These
prepared substrates were further used for A549 cell culturing
and analyzed for morphological parameters.
Cell culture
The prepared substrates were rinsed in 70% ethanol solution
and kept for 30 min under UV light to sterilize before cell
seeding. The substrates were immersed in Dulbecco's Modi ed
Eagle's Media (DMEM) supplemented with 10% fetal bovine
serum (FBS) and 1% penicillin–streptomycin. A549 cells
(National Center for Cell Science, Pune) were used for the cell
study. A er rinsing cells in the ask with phosphate buffered
saline (PBS) (pH 7.4), cells were harvested with trypsin (0.5%)
ethylenediaminetetraacetic acid (EDTA). A549 cells were seeded
at a high density (400 000 cells per ml) on the substrates in 12
well plates and cultured for 3, 6, 24 and 48 h in 5% CO2 in
a humidi ed incubator.
Cell imaging and quanti cation
Cell morphology was characterized using an inverted uores-
cence microscope Axio Observer A1 (Carl Zeiss, Germany). The
cells were xed with 4% paraformaldehyde for 20 min. The
substrates were mounted on glass slides and observed under
20× magni cation. The microscopic images of cell morphology
were visualized with uorescent dyes FITC (cytoplasm) and 40,6-
diamidino-2-phenylindole(DAPI) (nuclei) and were
View Article Online
Nanoscale Advances Paper
Nanoscale Adv., 2020, 2, 2315–2325 | 2317 This journal is © The Royal Society of Chemistry 2020
Op
en A
cces
s A
rtic
le.
Pu
bli
shed
on
01 A
pri
l 2
020
. D
ow
nlo
aded
on 1
0/2
6/2
02
0 6
:25:3
0 A
M.
Th
is a
rtic
le i
s li
cen
sed
un
der
a C
reat
ive
Co
mm
on
s A
ttri
bu
tio
n-N
onC
om
mer
cial
3.0
Unpo
rted
Lic
ence
.
quantitatively analyzed using ImageJ® so ware (NIH, Bethesda,
MD). High resolution images were obtained using a Confocal
Laser Scanning Microscope (Leica Microsystems); Z-stack
images for spatial data were obtained for all samples. Quanti-
cation and visual data were extracted with Fiji® so ware (NIH,
Bethesda, MD). The volume of cells was obtained by de ning
speci c regions of interest, followed by signal thresholding. The
resulting spatial signal was compiled with the Voxel Counter
plug-in in Fiji® and calculated as the volume in cubic microns.
Imaging was carried out four separate times with multiple
samples. The calculated data is expressed as the mean data with
a standard error of mean.
Biocompatibility/cell viability test
The cell viability of A549 cells on glass and PLGA polymer
substrate samples, both smooth and 3DIS, was quantitatively
determined by the 3-(4,5-dimethylthiazol-2-yl)-2,5-diphenyl
tetrazolium bromide (MTT) assay. Brie y, 10 000 cells per well
were seeded on each substrate in a 48-well plate and maintained
for 24 h at 37 ◦C in 180 ml DMEM supplemented with 10% FBS,
following which a stock MTT reagent, (20 ml) was added and
cells were incubated for 4 h. A er 4 h, the entire media was
aspirated and DMSO (100 ml) was added to each well. DMSO
dissolved the precipitate following which the absorbance was
measured at 570 nm. Background readings (blank) were ob-
tained from cell-free wells containing only DMSO. A549 cells
grown on glass substrates were considered as the control.
Percentage cell viability was calculated as
(A × 100)/C (1)
where, A ¼ polymer substrate MTT absorbance and C ¼ glass
control MTT absorbance.
PLGA-3DIS DOX release study
PLGA substrates (smooth and 3DIS) were surface coated with
200 mg DOX and dried. PBS (pH 7.4) was used as the dissolution
media of which 1 ml was added to the substrates and aliquots
were collected at xed time intervals (1, 3, 6, 24 and 48 h). Fresh
PBS was replaced at every time point to maintain constant
media volume. Fluorescence emission intensity was measured
at 590 nm upon excitation at 480 nm. The DOX released was
calculated as the % cumulative release against all time points.
All experiments were performed in triplicate.
Statistical analysis
A student t-test was performed on the data sets to determine the
p-value for testing the signi cance of quanti ed data (volume,
area, height, drug concentration etc.). A p-value of 0.05 was
assumed as the limit of signi cance. Statistical processing was
carried out with GraphPadPrism, GraphPad So ware, San
Diego, California, USA.
Results
The complex model for tissue repair or regeneration utilizing
multiple cell types and signaling components, as depicted in
Fig. 1A, may not be easily replicated in vitro; however, the ability
of epithelial cells to mimic the gap-bridging may be studied in
vitro using appropriate 3D substrate architecture. Conversely,
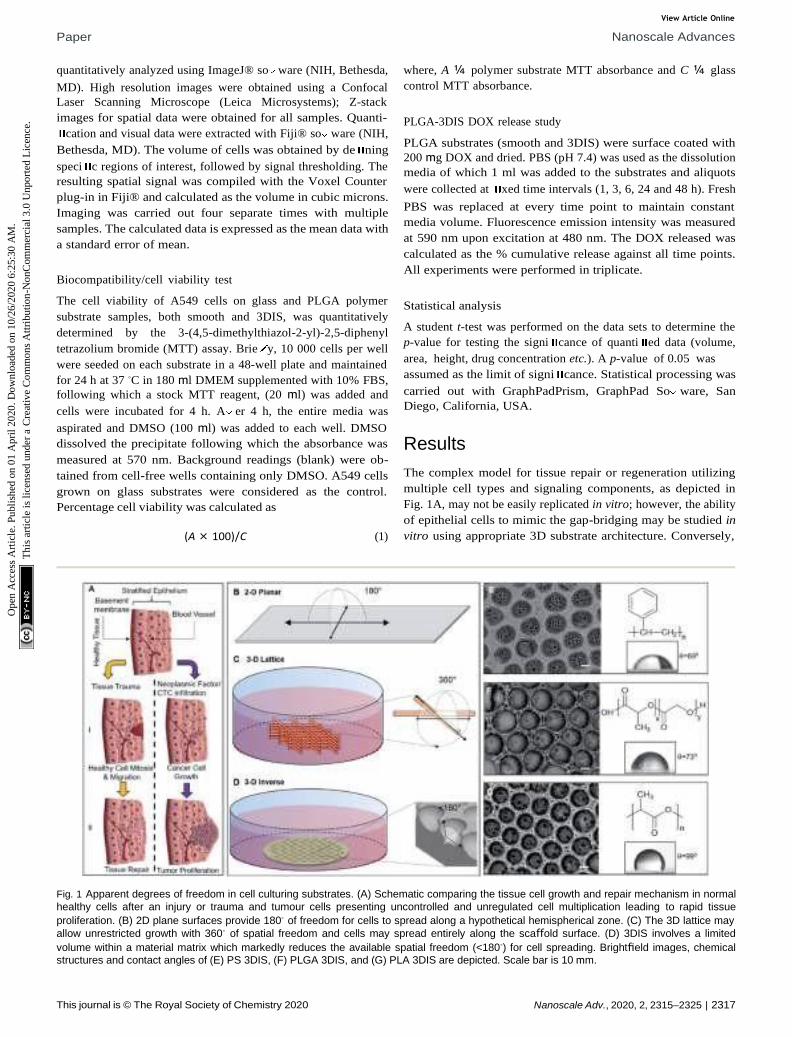
Fig. 1 Apparent degrees of freedom in cell culturing substrates. (A) Schematic comparing the tissue cell growth and repair mechanism in normal
healthy cells after an injury or trauma and tumour cells presenting uncontrolled and unregulated cell multiplication leading to rapid tissue
proliferation. (B) 2D plane surfaces provide 180◦ of freedom for cells to spread along a hypothetical hemispherical zone. (C) The 3D lattice may
allow unrestricted growth with 360◦ of spatial freedom and cells may spread entirely along the scaffold surface. (D) 3DIS involves a limited
volume within a material matrix which markedly reduces the available spatial freedom (<180◦) for cell spreading. Brightfield images, chemical
structures and contact angles of (E) PS 3DIS, (F) PLGA 3DIS, and (G) PLA 3DIS are depicted. Scale bar is 10 mm.
View Article Online
Paper Nanoscale Advances
2318 | Nanoscale Adv., 2020, 2, 2315–2325 This journal is © The Royal Society of Chemistry 2020
Op
en A
cces
s A
rtic
le.
Pu
bli
shed
on
01 A
pri
l 2
020
. D
ow
nlo
aded
on 1
0/2
6/2
02
0 6
:25:3
0 A
M.
Th
is a
rtic
le i
s li
cen
sed
un
der
a C
reat
ive
Co
mm
on
s A
ttri
bu
tio
n-N
onC
om
mer
cial
3.0
Unpo
rted
Lic
ence
.
while cancer cell proliferation also presents a complex model of
unregulated cell division, the changes in cell morphology are
readily observed. Fig. 1A depicts the cellular fates a healthy
tissue may experience upon being subjected to physical injury
or cellular insult with onco-genetic potential, including in l-
tration of circulating or metastatic tumor cells. The 3DIS plat-
form proposed here mimics tissue substratum offering cultured
cancer cells the spatial opportunity for proliferation as well as
presenting a broken surface simulating tissue trauma which in
turn presents a spatial opportunity for studying tissue mono-
layer repair and rebuilding.
Apparent degrees of freedom of cell culturing substrates
2D surfaces such as tissue culture asks or glass offer 180◦ of
spatial freedom for cell growth (Fig. 1B). Some 3D culture
methods utilizing cell substrates as scaffolding may even
approach 360◦ of freedom allowing cells to spread along any
accessible direction (Fig. 1C). Conversely, 3DIS reduces avail-
able spatial freedom (<180◦) and cells are con ned to a
restricted volume while allowing spatial cell adhesion
opportunity (Fig. 1D), virtually absent in the above two models.
Mechanism of formation of 3DIS polymer architecture
The polymer 3DIS lms were generated by a method known as
the ‘breath- gure’ method which exploits higher atmospheric/
environmental moisture content or humidity to accelerate
pore formation on the lm surface during the course of lm
drying. When a drop of polymer solution is cast on a substrate,
the volatile solvent begins to evaporate in the humid atmo-
sphere. During evaporation, the latent heat of vaporization is
absorbed due to which the temperature at the solution surface
decreases to a point at which condensation begins. These
condensed water droplets interact and rearrange on the solu-
tion surface to remain isolated from each other. When the
temperature of the solution surface increases high enough,
further condensation cannot occur. Thus, the water droplets
begin to evaporate from the solution surface and the polymer
precipitates around each water droplet which leaves behind
cavities (pores) in the solid polymer lm, a er complete evap-
oration.18,19 The greater the humidity, the greater is the water
vapor sequestration in the chloroform-polymer slurry leading to
condensation of water droplets onto the drying lm. Thus with
a greater water content, smaller pores coalesce and form larger
pores (>10 mm).
Physicochemical traits of 3DIS substrates
Polymer substrates on glass cover slips were fabricated from PS,
PLGA and PLA (chemical structures depicted in Fig. 1E, F, G
respectively) and analyzed to verify either the smooth or 3DIS
geometry of the substrates (Fig. 1E, F, G). The 3DIS substrates
were distinguished as 3DIS(+) or 3DIS(—) based on their large
(>12 mm) or small (<10 mm) pore sizes, respectively. Each of the
substrates showed an even distribution of the 3DIS aspect with
even rim-width and pore sizes (12–18 mm). The pore size of 3DIS
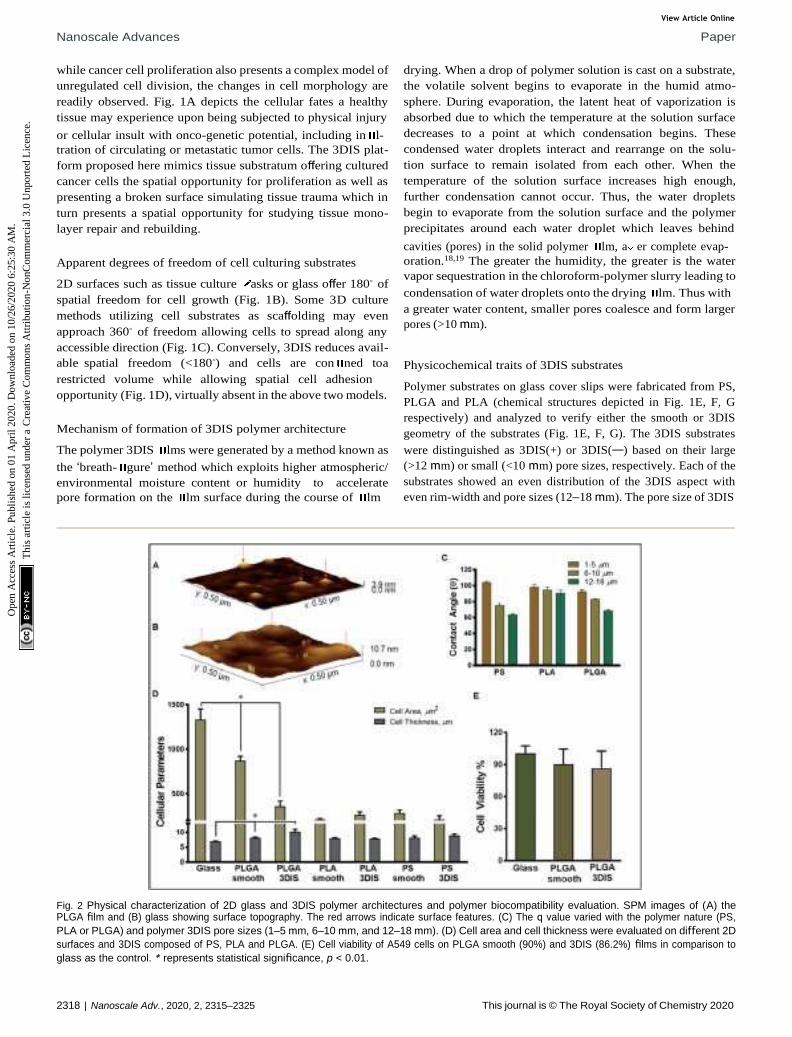
Fig. 2 Physical characterization of 2D glass and 3DIS polymer architectures and polymer biocompatibility evaluation. SPM images of (A) the PLGA film and (B) glass showing surface topography. The red arrows indicate surface features. (C) The q value varied with the polymer nature (PS,
PLA or PLGA) and polymer 3DIS pore sizes (1–5 mm, 6–10 mm, and 12–18 mm). (D) Cell area and cell thickness were evaluated on different 2D
surfaces and 3DIS composed of PS, PLA and PLGA. (E) Cell viability of A549 cells on PLGA smooth (90%) and 3DIS (86.2%) films in comparison to
glass as the control. * represents statistical significance, p < 0.01.
View Article Online
Nanoscale Advances Paper
Nanoscale Adv., 2020, 2, 2315–2325 | 2319 This journal is © The Royal Society of Chemistry 2020
Op
en A
cces
s A
rtic
le.
Pu
bli
shed
on
01 A
pri
l 2
020
. D
ow
nlo
aded
on 1
0/2
6/2
02
0 6
:25:3
0 A
M.
Th
is a
rtic
le i
s li
cen
sed
un
der
a C
reat
ive
Co
mm
on
s A
ttri
bu
tio
n-N
onC
om
mer
cial
3.0
Unpo
rted
Lic
ence
.
increased (1 mm to 18 mm) with increasing polymer strength
(0.3–0.7% w/v) and also with greater environmental moisture
content and temperature (~80–90% RH and 22.5 to 23.5 ◦C,
(Fig. S1A and B†)).The polymer substrates cast on the glass
surface had an average thickness of 25.4 9 mm. The total
surface area of 3DIS substrates was computed using the
following rationale:
[pR2 + (2pr2 × n)] — pr2 × n (2)
where R is radius of the circular cast substrate, r is radius of one
pore, and n is the total number of pores. Thus, for a 3DIS
substrate with an average pore size of 15 mm, the total surface
area was computed to be 89.5 mm2 for a substrate of 1 cm
diameter; with the average distance between pores as 5 mm. The
porous architecture of the polymer substrates increased the
exposed surface area by about 14%.
The roughness of the glass surface and PLGA substrates was
evaluated with SPM. The analyzed area (0.5 mm × 0.5 mm) for
PLGA revealed an intermittently textured area with prominent
outgrowths not greater than 3.9 nm in height over the substrate
base (Fig. 2A). Further, the calculated roughness depicted
smaller features distributed about 10 nm apart. In comparison,
the SPM image of glass showed signi cantly greater surface
roughness with frequent protrusions extending up to 10 nm in
height (Fig. 2B).
Further, we analyzed free active carboxyl groups using titri-
metric analysis of the polymer surfaces which revealed higher
surface carboxylic acid content on 3DIS substrates compared to
smooth substrates (~30% for PLA and ~33% for PLGA). PS
substrates do not carry free carboxyl groups. It was determined
that the test materials, PS, PLA and PLGA were chemically and
physically stable against surface sterilization techniques such
as exposure to 70% ethanol/isopropyl alcohol solution and UV
radiation (l ¼ 253.7 nm) for 30 min. Similarly, 3DIS and smooth
polymer substrates immersed in cell culture media at pH 7.4 for
a period of 30 days failed to demonstrate substrate fractures or
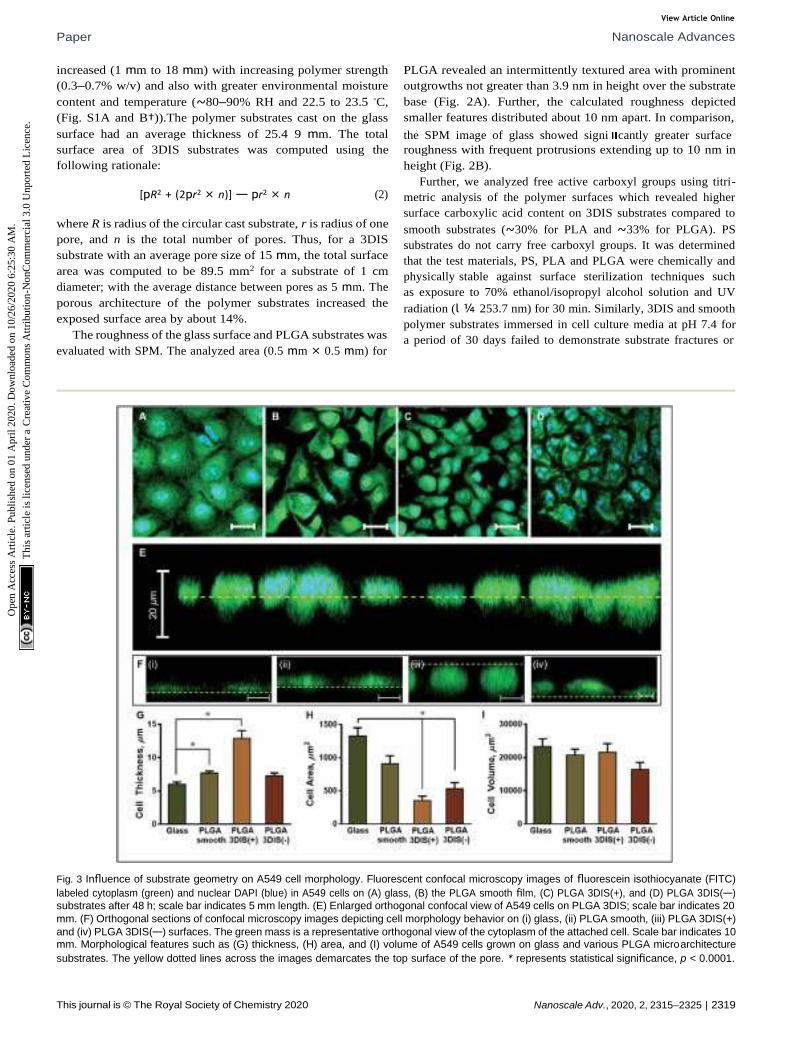
Fig. 3 Influence of substrate geometry on A549 cell morphology. Fluorescent confocal microscopy images of fluorescein isothiocyanate (FITC)
labeled cytoplasm (green) and nuclear DAPI (blue) in A549 cells on (A) glass, (B) the PLGA smooth film, (C) PLGA 3DIS(+), and (D) PLGA 3DIS(—)
substrates after 48 h; scale bar indicates 5 mm length. (E) Enlarged orthogonal confocal view of A549 cells on PLGA 3DIS; scale bar indicates 20
mm. (F) Orthogonal sections of confocal microscopy images depicting cell morphology behavior on (i) glass, (ii) PLGA smooth, (iii) PLGA 3DIS(+)
and (iv) PLGA 3DIS(—) surfaces. The green mass is a representative orthogonal view of the cytoplasm of the attached cell. Scale bar indicates 10 mm. Morphological features such as (G) thickness, (H) area, and (I) volume of A549 cells grown on glass and various PLGA microarchitecture
substrates. The yellow dotted lines across the images demarcates the top surface of the pore. * represents statistical significance, p < 0.0001.
View Article Online
Paper Nanoscale Advances
2320 | Nanoscale Adv., 2020, 2, 2315–2325 This journal is © The Royal Society of Chemistry 2020
Op
en A
cces
s A
rtic
le.
Pu
bli
shed
on
01 A
pri
l 2
020
. D
ow
nlo
aded
on 1
0/2
6/2
02
0 6
:25:3
0 A
M.
Th
is a
rtic
le i
s li
cen
sed
un
der
a C
reat
ive
Co
mm
on
s A
ttri
bu
tio
n-N
onC
om
mer
cial
3.0
Unpo
rted
Lic
ence
.
~
physical deformation, indicating polymer resistance against
mechanical degradation.
Wettability
As Fig. 2C depicts, with an increasing range of pore sizes (1 mm
to 18 mm), PLGA demonstrated a decreased contact angle (q)
from 92.67 2.52◦ to 68.67 1.53◦. Similarly, q for PS at the 1–5
mm pore size was 104.33 1.53◦ which lowered to 75.33 2.52◦
for the 6–10 mm pore size and further decreased to 64.0 1.53◦
for the 12–18 mm pore size range. Interestingly, the PLA
substrate did not display a strong correlation between pore size
and wettability and q ranged between 100.13 2.87◦ to 90.84
3.90◦ for the entire pore size range (1 mm to 18 mm).
PLGA DOX release study
Pretreatment of DOX on PLGA 3DIS followed by cell media
immersion revealed a cumulative DOX release pro le depicting
a biphasic trend suggesting a more rapid drug release in the
rst six hours (~36%) followed by a steady slower release up to
~66% in 48 h (Fig. S2A†).
3DIS architecture mimics in vivo cancer cell
microenvironment
Morphological analysis and polymer biocompatibility eval-
uation. A549 cell spreading was maximum on the glass surface
(1329 122.11 mm2) compared to all test surfaces, evaluated
a er 48 h of incubation (Fig. 2D). Cell thickness was the greatest
in PLGA 3DIS (10.12 0.92 mm) followed by PLGA smooth
substrates (7.7 0.282 mm), whereas cells on glass were the
least thick (6.4 0.35 mm). Among the three polymers studied,
the PLGA-smooth surface demonstrated a notably large cellular
area (867.69 52.31 mm2), compared to PLA (207.59 16.77
mm2) and PS (280.85 38.73 mm2). The biocompatibility of
PLGA for A549 cell proliferation was determined by the statis-
tically similar cell viability on PLGA 3DIS (86.26%) and PLGA
smooth (90.01%) compared to that of A549 control cells
cultured on glass (Fig. 2E).
In uence of substrate geometry on morphology. A549 cells
nucleus was 241 12 mm2. Phalloidin stained actin bers
spanned the volume of the cell attached on the glass cover slip,
and the dense terminal protrusions of the actin bers indicate
the cell adhesion points (Fig. S2B†). However, A549 cells on
PLGA smooth substrates demonstrated comparatively reduced
cellular spreading area with cellular projections indicating
substantial cell adhesion (Fig. 3H).
On 3DIS(—) substrates, the cells appeared to have little to no
access to the depth of the pores, resulting in cells spreading
over the porous structures with cytoplasmic area ~533.6
91.08 mm2 and a corresponding cell thickness of ~7.3 0.41 mm
(ESI video 3†). The surface area of the cells on PLGA 3DIS(+) was
sharply reduced, and compared to glass and PLGA smooth, the
decrease in area was ~74% and ~60% respectively. The cells
cultured on glass and PLGA-smooth substrates showed statis-
tically similar cellular volume (23 424 2243.40 mm3 and
20 798 1729.90 mm3 respectively) (Fig. 3I). PLGA 3DIS(+) cells
showed the maximum thickness which compensated for the
gross decrease in cell area and consequently the cells grown on
glass, PLGA smooth and PLGA 3DIS(+) surfaces were statistically
comparable with cell volumes varying between 23 424 2243.40
mm3 to 21 618 2601.03 mm3.
3DIS as a cell repair/regeneration platform. A549 cells
cultured on PLGA 3DIS substrates over 48 h showed a con u-
ence similar to that seen in culture asks or on glass.
The cells showed a tendency to occupy 3DIS evenly and to
form monolayers, bridging the pore gaps (ESI video 4†). As
depicted in Fig. 4A–D, the ability of the 3D (spatially restored)
cells in bridging small (~15 mm) gaps was demonstrated. In
Fig. 4F, as few as two cells were shown capable of bridging
a micro-gap and forming cell–cell and cell–substrate adhesions.
Multiple cells are shown to ll the large (~65 mm) pores in
Fig. 4G and H effectively demonstrating the ability of PLGA 3DIS
in allowing cells to grow spatially and create cell–cell adhesions
as well. The 3DIS pore-rims serve as foot and hand holds for
cells (Fig. 4G and H).
In uence on the drug-cellular response by cancer cell
morphology. The DOX treatments conducted in this study
were cultured on glass, PLGA smooth substrates, PLGA 3DIS(+)
and 3DIS(—) (Fig. 3A–D). Fig. 3E demonstrates the enlarged
orthogonal confocal view of A549 cells on PLGA 3DIS(+).
Culturing on PLGA 3DIS(+) surfaces virtually doubled the
thickness of the cells, compared to cells grown on glass, PLGA
smooth and 3DIS(—) surfaces as depicted in the orthogonal
projections in Fig. 3F(i–iv).
The orthogonal confocal sectioning of cells on the glass
surface (ESI video 1†) highlighted a thinner spreading of the
attached cells (cell height ¼ 6.4 0.35 mm), whereas the
orthogonal section of PLGA smooth substrates revealed a raised
cell pro le with an increased cell thickness (7.7 0.28 mm)
(Fig. 3G). The sub-surface cytoplasmic regions appeared nestled
inside the pores. The cells on PLGA 3DIS(+) displayed up to 18
mm thickness with an average cell thickness of 12.9 1.15 mm
(ESI video 2†). The quanti cation of the cellular area on the
glass surface a er 48 h revealed a signi cant cytoplasmic area
(1329.68 122.11 mm2) while the dorso-ventrally attened
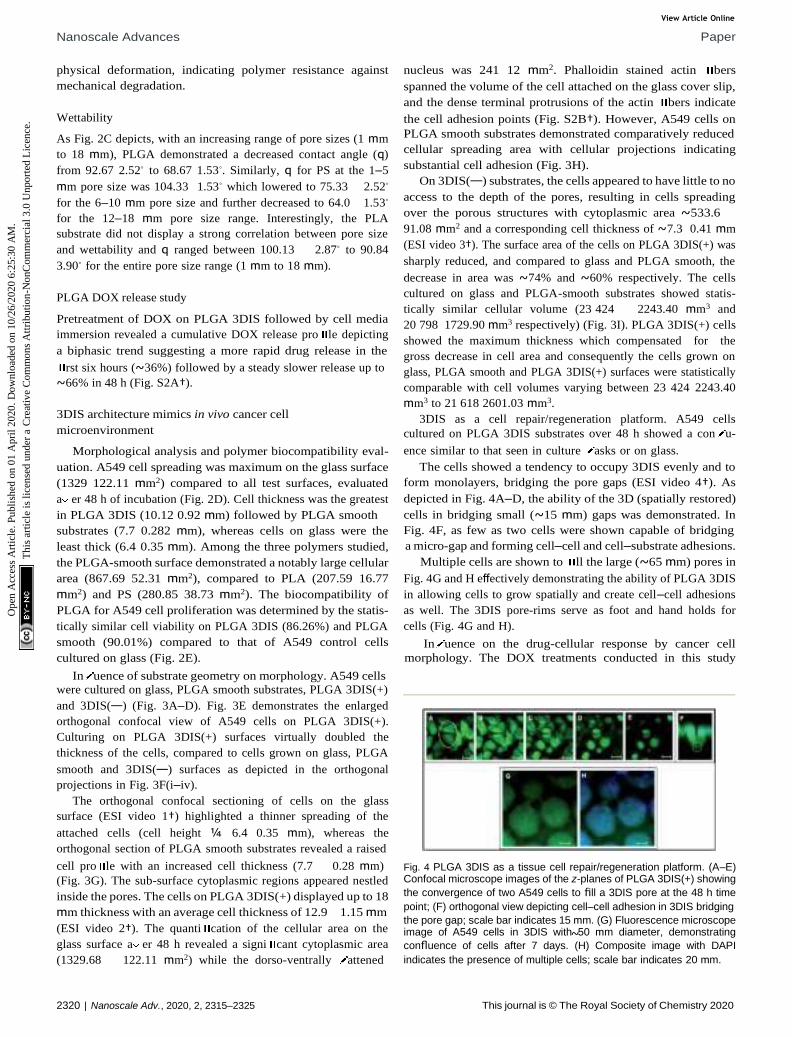
Fig. 4 PLGA 3DIS as a tissue cell repair/regeneration platform. (A–E) Confocal microscope images of the z-planes of PLGA 3DIS(+) showing
the convergence of two A549 cells to fill a 3DIS pore at the 48 h time
point; (F) orthogonal view depicting cell–cell adhesion in 3DIS bridging
the pore gap; scale bar indicates 15 mm. (G) Fluorescence microscope image of A549 cells in 3DIS with 50 mm diameter, demonstrating
confluence of cells after 7 days. (H) Composite image with DAPI
indicates the presence of multiple cells; scale bar indicates 20 mm.
View Article Online
Nanoscale Advances Paper
Nanoscale Adv., 2020, 2, 2315–2325 | 2321 This journal is © The Royal Society of Chemistry 2020
—
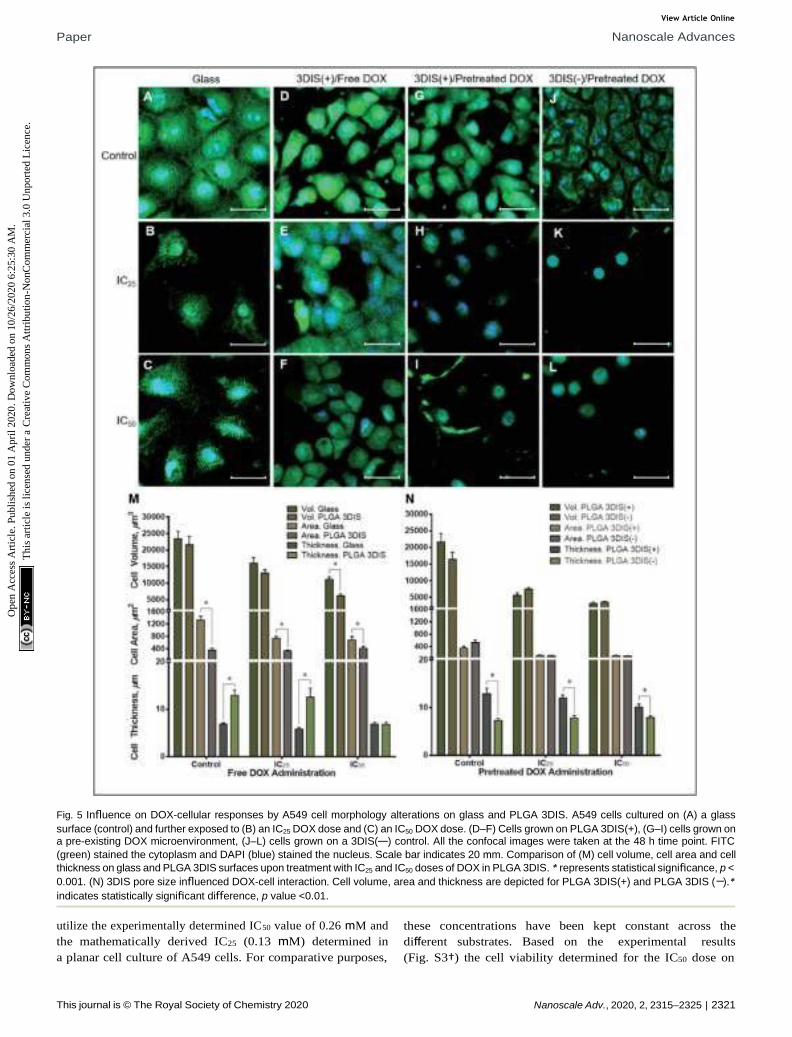
Fig. 5 Influence on DOX-cellular responses by A549 cell morphology alterations on glass and PLGA 3DIS. A549 cells cultured on (A) a glass
surface (control) and further exposed to (B) an IC25 DOX dose and (C) an IC50 DOX dose. (D–F) Cells grown on PLGA 3DIS(+), (G–I) cells grown on a pre-existing DOX microenvironment, (J–L) cells grown on a 3DIS(—) control. All the confocal images were taken at the 48 h time point. FITC
(green) stained the cytoplasm and DAPI (blue) stained the nucleus. Scale bar indicates 20 mm. Comparison of (M) cell volume, cell area and cell
thickness on glass and PLGA 3DIS surfaces upon treatment with IC25 and IC50 doses of DOX in PLGA 3DIS. * represents statistical significance, p <
0.001. (N) 3DIS pore size influenced DOX-cell interaction. Cell volume, area and thickness are depicted for PLGA 3DIS(+) and PLGA 3DIS ( ).*
indicates statistically significant difference, p value <0.01.
utilize the experimentally determined IC50 value of 0.26 mM and
the mathematically derived IC25 (0.13 mM) determined in
a planar cell culture of A549 cells. For comparative purposes,
these concentrations have been kept constant across the
different substrates. Based on the experimental results
(Fig. S3†) the cell viability determined for the IC50 dose on
Op
en A
cces
s A
rtic
le.
Pu
bli
shed
on
01 A
pri
l 2
020
. D
ow
nlo
aded
on 1
0/2
6/2
02
0 6
:25:3
0 A
M.
Th
is a
rtic
le i
s li
cen
sed
un
der
a C
reat
ive
Co
mm
on
s A
ttri
bu
tio
n-N
onC
om
mer
cial
3.0
Unpo
rted
Lic
ence
.
View Article Online
Paper Nanoscale Advances
2322 | Nanoscale Adv., 2020, 2, 2315–2325 This journal is © The Royal Society of Chemistry 2020
various substrates was found to be virtually similar, suggesting
that the DOX IC50 dose determined for planar cultureswas
equivalent to the dose required to demonstrate IC50 lethality
even in 3DIS substrates. Fig. 5A–L show the confocal images of
A549 cells grown on glass substrates, PLGA 3DIS(+) and
3DIS(—), which were further subjected to DOX administration
in cell media conforming to the IC50 and sub-lethal IC25
concentrations. Fig. 5A demonstrates the extensive spreading of
A549 cells on the glass plane; the cells also showed evidence of
cell projections connecting with the glass plane and neigh-
boring cells as well. The cell viability assay showed 47% to 50%
cell viability on PLGA 2D and 3DIS substrates when exposed to
an IC50 concentration of DOX as determined on the glass-
surface cell culture. The drug concentrations were used
considering the cell viability established in the literature and by
us (Fig. S3†).
During the course of treatment with DOX, the cells main-
tained a at pro le (5.79 0.37 mm at IC25 and 6.88 0.34 mm at
IC50) and demonstrated lateral spreading (Fig. 5M). When
exposed to sub-lethal doses (IC25) of DOX, there appeared to be
a mild decrease in the size of the cells (741.07 61.90 mm2) with
a general reduction in the number of cellular projections. A
higher DOX concentration (IC50) in the cell media appeared to
decrease the cell area further (679.83 117.68 mm2) with
a subtle shrinking effect on the nucleus.
Cell volume was reduced by about 30% in sub-lethal doses of
DOX while IC50 caused a roughly 50% drop in cell volume. The
cell area also signi cantly decreased due to DOX exposure
compared to the control but not signi cantly between the two
drug treatments (pretreated DOX, IC25 by ~44% and IC50 by
~48%) suggesting a near-maximal effect at IC25. Interestingly,
cells on PLGA 3DIS(+) dosed with a sub-lethal (IC25) DOX
concentration did not demonstrate a signi cant change in cell
area and cell thickness compared to the control. However, upon
exposure to the IC50 dose of DOX the cells demonstrated
a reduction in cell size such as volume (3548.57 220 mm3) and
height (7.927 0.37 mm). Additionally, the nuclei appeared to
be proportionally shrunk.
In uence of 3DIS dimensions on cancer cell morphology
and cell responses. The dependence upon pore size of the 3DIS
system was also demonstrated for the cytotoxicity of the pre-
treated DOX (Fig. 5N). Interestingly, with pre-treatment of DOX
for 48 h on 3DIS(—), the cells were unable to undergo signi cant
size swelling (cell thickness ~7.83 4.90 mm and ~7.92 3.7
mm for IC25 and IC50 DOX treatments, respectively) and cell
spreading (cell area ~116.50 8.71 mm2 and 101.27 9.83 mm2
for IC25 and IC50 DOX treatments, respectively). Fig. 5G–L
depicts the morphological differences in cells within the two
pre-treatment groups; while the volume and cell area parame-
ters were comparable, there was a signi cant retention of low-
ered cell thickness over the drug course in the 3DIS(—) cells.
Discussion
Enhanced adhesion along a single plane may not allow true
spatial freedom for cell growth and the cell may likely
compensate for the loss of 3D cell architecture by spreading
laterally. On the other hand, planar cell attachment substrates
consequently may not mimic the physiological responses in the
cancer cell microenvironment. Thus, the mechanism by which
cells conform to available spaces and geometry and the speci c
role of the void spaces in enabling cell attachments and
proliferation needed elucidation.
Spatial availability within tissues may likely result in tissue
expansion via cell reorganization or multiplication; however,
the availability may not be perceived in a similar fashion in
conventional cell culture systems. As depicted in Fig. 1, the
unrestricted space around the cells conforming to 180◦ for
a glass surface and 360◦ spatial freedom for the illustrated 3D
culture system respectively, appeared conducive for spatial
growth; however, cells reliant on surface adhesion components
were paradoxically bound to and spread along the available
surface. However, restriction in 3DIS spaces with <180◦ of
spatial freedom provided cell adhesion opportunities across the
available perimeter in 3DIS. Such spatial con nements pre-
vented planar cell adhesion localization and allowed the cells to
grow in 3D spaces and have a raised pro le.
In consequence, the cell and its organelles such as the
nucleus, remained free of the stress ber mediated compres-
sion which in turn restored the in vivo physiological behavior of
cells. 3DIS is thus an interesting and competent model to study
in vivo cell growth patterns, and in addition, it was appropriate
to interpret cell morphology behavior on exposure to cytotoxic
drugs.
Subsequently, PS, PLA and PLGA polymer substrates were
fabricated with 3DIS architecture and subjected to numerous
physicochemical characterization experiments to determine
their compatibility with A549 spatial cell growth. PLGA 3DIS
substrates underwent SPM analysis and the depicted texture in
Fig. 2A was hypothesized to span the substrate top surface and
pore surface and provide adhesion support to adherent cells.
The large protuberances were an indication of a potential cell
adhesion site, with an average cell area of ~400 mm2 (on PLGA
3DIS); it followed that a cell had access to a large number of
adhesion-competent sites on PLGA substrates. However, SPM
analysis of the glass surface demonstrated frequent outgrowths
with greater height than in the PLGA topography. Thus, the
glass surface promoted higher affinity of cells with abundant
cell adhesion features and signi cantly increased the cell
surface area, owing to the presence of highly uneven surface
topography.
It was noted that PLGA and PS had lower contact angles in
the pore size range of 12–18 mm, which indicated higher
wettability. Thus, PLGA and PS polymers were inferred to
possess higher apparent affinity for cells compared to PLA
which was evident for the measured cell surface area (Fig. 2). All
cell studies on glass and polymer surfaces were reported a er a
48 h incubation period for both morphology analysis and Dox
treatment studies. An abundance of the hydrophilic surface
area and compatible functional groups on the glass surface lead
cells such as A549 and HeLa (data not shown) to demonstrate
signi cant cellular spreading. Among the polymers, PS smooth
substrates demonstrated cell attachment and spreading inferior
to PLGA and glass surfaces.
Op
en A
cces
s A
rtic
le.
Pu
bli
shed
on
01 A
pri
l 2
020
. D
ow
nlo
aded
on 1
0/2
6/2
02
0 6
:25:3
0 A
M.
Th
is a
rtic
le i
s li
cen
sed
un
der
a C
reat
ive
Co
mm
on
s A
ttri
bu
tio
n-N
onC
om
mer
cial
3.0
Unpo
rted
Lic
ence
.
View Article Online
Nanoscale Advances Paper
Nanoscale Adv., 2020, 2, 2315–2325 | 2323 This journal is © The Royal Society of Chemistry 2020
The lower wettability of PLA likely reduced its utility in
promoting cell adhesion and spreading making PLA the least
favorable cell substrate among the materials under study.
However, the greater hydrophilicity of PLGA, partially due to
glycolic acid content (25%), resulted in the greater cell affinity of
PLGA compared to PS or PLA. Owing to its superior selective cell
adhesion trait, PLGA was identi ed in this study to further
investigate 3DIS-cell behavior.
The ordering of spatial organization of the polymer substrate
with regard to generation of 3DIS led to signi cant changes in
cell morphology. In comparison to glass-bound A549 cells, cells
cultured on PLGA substrates for 48 h displayed varied
morphological signatures depending on the substrate geom-
etry. Unlike glass, PLGA smooth substrates offered relatively
less cell adhesive or retentive surface chemistry, leading to less
dense cellular con uence. Indeed, a surface retraction of cells
on PLGA smooth substrates was apparently compensated by
increased cell thickness. For example, the orthogonal section in
3DIS(—) despite their restricted spatial con nes allowed the cell
to articulate with the adjoining pore walls and form adhesive
junctions to act as anchors (Fig. 3). Conversely, since the cell
adhesion features were distributed in 3D spaces within the
3DIS, there was conceivably a relaxation of the net-downward
force, allowing the cell to grow while maintaining a tall
pro le, compared to a attened pro le seen on glass-bound
cells.
Furthermore, the inter-pore substrate surface was limited in
area, likely causing the cells to utilize the pores as additional
cell adhesion surfaces. Speci cally, as shown in Fig. 3, the cells
were observed seated on the substrate surface (dotted line)
while a portion of the cells appeared below the surface level.
Thus in a controlled environment without drug pressure, cells
demonstrate the ability to maintain a speci c volume,
comprising of both cytoplasmic and organelle volumes. While
the volume of cells on glass, PLGA smooth and PLGA 3DIS(+)
seemed invariable, cellular areas of cells on PLGA smooth and
PLGA 3DIS(+) showed a marked decrease. In contrast, the cell
height showed an opposing trend and showed increasing values
when grown on PLGA smooth and PLGA 3DIS.
Besides allowing cells, in principle, to bear a more physio-
logically relevant phenotypical form, the 3DIS also generated
a platform to explore cellular regeneration across simulated
gaps (pores). The ability of the epithelial cells in wound closure
was investigated by observing the cells adhere to the pore,
spatially adapt or multiply, thereby lling the pore cavity
(Fig. 4). PLGA 3DIS with tunable pore sizes presented an
appropriate model of small tissue gaps or wounds which was
exploited to determine the regenerative abilities of cells or co-
cultures. The adhesion feature demonstrated here provided
a platform upon which tumor models maybe developed as well.
PLGA 3DIS demonstrated the ability to mimic cells in their near
in vivo morphology; thus, further experiments involved
comparison of the drug effect on cells on 3DIS and on standard
2D cultures to determine if the cells were altered with changes
in their morphology and if these changes depicted in vivo
outcomes.
On the other hand, we did not use collagen coating which
may effectively nullify the polymeric 3DIS geometrical advan-
tages seen in uncoated 3DIS substrates, presumably by
enhanced cell attachment. Thus, we studied the interactions of
A549 cells with the polymer substrate without the interfering
in uence of extra-cellular matrix (ECM) components. Further-
more, collagen and bronectin may eliminate the localized
surface charges of 3DIS polymer substrate structures, decrease
the in uence of 3D substrates and nally reduce the 3D inverse
spaces milieu.
DOX was used in this study to contrast the difference in the
drug effect on cells grown on different attachment substrates
which manipulated cell morphology. The effect of DOX treat-
ment on cells grown on glass and PLGA 3DIS revealed a complex
interplay of the morphological features which were shown in
the confocal microscopy images of cells depicted in Fig. 5; the
cells cultured on glass serve as global controls. Various cell
parameters such as thickness, surface area and volume were
measured and the differences were depicted graphically. The
parameters of cellular area (cytoplasmic area) and cell thickness
(height) were considered distinct dimensions whereas cell
volume was reliant on area as well as cell thickness. This
phenomenon was restricted to the spatially-restored cells on
3DIS substrates and suggested a varied pharmacokinetics/
pharmacodynamics balance as compared to control cells on
2D culture surfaces (glass). It may be inferred that the 3DIS(+)
cells were more resistant to DOX than the results of DOX
treatment on glass-bound cells suggested. The 3DIS platform
exhibited cell adhesion and growth in the context of drug
kinetics and activity in the cell microenvironment that was
otherwise complicated to simulate in 2D cultures. The effect of
altered cell morphology on the sensitivity to cytotoxic drugs was
also explored; the greater surface area of cultured cancer cells
on planar surfaces may likely enhance the capacity of xenobiotic
uptake via multiple pathways including receptor mediated
endocytosis etc.15
When considered in conjugation with upregulated drug
efflux pumps in cancer cells, the 2D planar cell culture model
presents a complex transport system which allows a rapid
internalization and rapid efflux of the administered mole-
cule.20,21 However such models are not expected to provide a true
kinetic pro le for an administered compound in the given
context. Consequently, cells with lesser deviation from their in
vivo cell structure were preferred with limited surface area and
a more elevated 3D pro le. It was likely that 3DIS(+) allowed
cells to brie y adapt spatially despite drug pressure due to the
close proximity of the 3DIS walls leading to cell elongation in
the vertical aspect. The behavior of cells in the pre-treated DOX
context was explained by the slow release of DOX from the
substrate as depicted in Fig. S2A.† The rapid release of DOX in
the initial six hours was expected from rim-surface and
surrounding area-accumulated DOX, whereas the slower release
over 48 h was likely the result of DOX slowly diffusing out of
pores (from the extended surface area as described earlier by
eqn (1)). The slow drug release into the cell media retains the
drug in the immediate substrate vicinity leading to
a pronounced cytotoxic effect.
Op
en A
cces
s A
rtic
le.
Pu
bli
shed
on
01 A
pri
l 2
020
. D
ow
nlo
aded
on 1
0/2
6/2
02
0 6
:25:3
0 A
M.
Th
is a
rtic
le i
s li
cen
sed
un
der
a C
reat
ive
Co
mm
on
s A
ttri
bu
tio
n-N
onC
om
mer
cial
3.0
Unpo
rted
Lic
ence
.
View Article Online
Paper Nanoscale Advances
2324 | Nanoscale Adv., 2020, 2, 2315–2325 This journal is © The Royal Society of Chemistry 2020
Op
en A
cces
s A
rtic
le.
Pu
bli
shed
on
01 A
pri
l 2
020
. D
ow
nlo
aded
on 1
0/2
6/2
02
0 6
:25:3
0 A
M.
Th
is a
rtic
le i
s li
cen
sed
un
der
a C
reat
ive
Co
mm
on
s A
ttri
bu
tio
n-N
onC
om
mer
cial
3.0
Unpo
rted
Lic
ence
.
Indeed, the utility of optimized inhibitory anticancer drug
concentrations at the local site produced a far more
pronounced anticancer effect than that due to drug-infused
media with comparable drug content. The phenomenon
depicted a failure in attachment of cancer cells to the substrate
in addition to cumulative drug pressure over time. It was
conceivable that such a strategy might prevent the attachment
and survival of cancer cells at a given tissue site; stated differ-
ently, it might imply prevention of metastasis at secondary sites
if prophylactically treated in a site-speci c manner. With
a reduced cell surface area, it was likely that the drug uptake
mechanisms were unable to counteract the activity of drug
efflux pumps which resulted in reduced overall cytotoxicity. The
results implied that reduced systemic DOX content in the body
would result in potential failure of anticancer activity and allow
cancer growth and even metastasis. Further, low blood drug
concentrations might occur due to termination of
chemotherapy.
In contrast, the presence of localized content of DOX,
simulating IC50 drug content in the tissue as opposed to
systemic circulation may generate a potent cytotoxic environ-
ment for cancer cells. IC50 and sub-lethal IC25 DOX concentra-
tions were applied directly to PLGA 3DIS substrates instead of
cell media dispersion and the pre-treated 3DIS was used to
culture A549 cells. The presence of a localized, pre-existing drug
environment strongly deterred the growth and spreading of
cells in both sub-lethal and IC50 drug contents as evidenced in
Fig. 5. The cells appeared to be shrunk with an apparently
reduced cytoplasmic compartment.
The toxicity of the treatment resulted in a very small number
of viable but near-apoptotic cells. Cell volumes were drastically
affected for both drug treatments with a roughly 8-fold drop
determined for IC50-treated cells compared to the control. The
cell height showed a modest drop for the sub-lethal dose and
IC50 treatments, which resulted from the severe shrinkage of
volume. It was likely that upon DOX treatment the freshly
seeded cells on the PLGA 3DIS were unable to adapt to the
substrate and consequently failed to adhere fully and spread. As
a result, the cells retained their round shape and likely failed to
deploy cytoskeletal scaffolding to attach and spread, in addition
to undergoing cytotoxic damages, which were more pronounced
for IC50 treated cells. It followed that localized IC50 and even the
sub-lethal IC25 dose, administered as pretreatment upon the
3DIS, were far more effective in eliciting the cytotoxic activity of
DOX in A549 cells than free DOX administration in the cell
media. Overall, anticancer therapy o en fails in achieving
complete tumor regression due to sub-lethal dose concentra-
tions and the cells that survive following the therapy continue to
survive.22 Here we demonstrated the ex vivo effect using poly-
meric 3DIS substrates.
Conclusions
Upon comparison of PS, PLA and PLGA as 3DIS substrates,
PLGA presented a viable 3DIS platform for the study of cancer
cells in a near-in vivo morphological context. The ability of A549
cells to defend their cytoplasmic volume across glass and PLGA
substrates strongly suggested the biocompatibility of PLGA in
the composition of 3DIS, which is supported by the viability
assay comparing the substrates. The superior cellular affinity, as
evidenced by cell spreading, allowed PLGA to support spatial
growth in the con nes of 3DIS. The results presented here
highlighted the behavior of A549 cells in the 3DIS culture in
mimicking physiological responses. While the 3DIS architec-
ture was central to altering cell morphology, it also presented
a discontinuous surface mimicking broken tissue membranes.
PLGA 3DIS served as an appropriate tissue repair model to study
epithelial cell growth and gap-bridging as an index of tissue
repair/regeneration. The A549 cells were shown to grow rapidly
to ll a larger pore thereby forming a continuous cell monolayer
bridging the gap.
The evidence of morphological changes in uencing cellular
responses was demonstrated in the DOX study of cells grown on
PLGA 3DIS. Compared to the PLGA 3DIS control, cells exposed
to a sub-lethal IC25 DOX dose were undeterred. The study
indicated a sustained IC50 dose strategy to elicit a noticeable
anticancer (cytotoxic) effect. With its abnormal attened
morphology, cancer cells on glass lacked the physiological
integrity to depict realistic in vivo responses to drugs. Similarly,
the pre-treatment of DOX on the 3DIS illustrated its ability to
mimic alternative drug dosing conditions which were more
successful in tempering the cancerous growth of cells and in
inhibiting their spread and survival altogether.
Advanced strategies can be adapted for use with 3DIS such as
the use of ow-through analytical chambers with embedded
PLGA 3DIS for real time monitoring of spatially restored cells,
essentially mimicking entire tissues.
Conflicts of interest
There are no con icts to declare.
Acknowledgements
Authors would like to acknowledge the nancial support of DBT-
Nano-Biotechnology, DST-FIST and DST-Nano Mission,
Government of India.
Note and references
1 P. X. Ma and J. W. Choi, Tissue Eng., 2001, 7, 23–33.
2 S. Yang, K. F. Leong, Z. Duo and C. K. Chua, Tissue Eng.,
2001, 7, 679–689.
3 R. Zhang and P. X. Ma, J. Biomed. Mater. Res., 1999, 45, 285–
293.
4 C. C. Liang, A. Y. Park and J. L. Guan, Nat. Protoc., 2007, 2,
329–333.
5 M. Mirbagheri, V. Adibnia, B. R. Hughes, S. D. Waldman,
X. Banquy and D. K. Hwang, Mater. Horiz., 2019, 6, 45–71.
6 Y. Xia, Nat. Mater., 2008, 7, 758.
7 A. S. Curtis, J. V. Forrester, C. McInnes and F. Lawrie, J. Cell
Biol., 1983, 97, 1500–1506.
View Article Online
Nanoscale Advances Paper
Nanoscale Adv., 2020, 2, 2315–2325 | 2325 This journal is © The Royal Society of Chemistry 2020
Op
en A
cces
s A
rtic
le.
Pu
bli
shed
on
01 A
pri
l 2
020
. D
ow
nlo
aded
on 1
0/2
6/2
02
0 6
:25:3
0 A
M.
Th
is a
rtic
le i
s li
cen
sed
un
der
a C
reat
ive
Co
mm
on
s A
ttri
bu
tio
n-N
onC
om
mer
cial
3.0
Unpo
rted
Lic
ence
.
8 A. PrinaMello, N. Jain, B. Liu, J. I. Kilpatrick, M. A. Tutty,
A. P. Bell, S. P. Jarvis, Y. Volkov and D. Movia, Tissue Cell,
2018, 50, 15–30.
9 H. J. Mulhall, M. P. Hughes, B. Kazmi, M. P. Lewis and
F. H. Labeed, Biochim. Biophys. Acta, Gen. Subj., 2013, 1830,
5136–5141.
10 R. Domura, R. Sasaki, Y. Ishikawa and M. Okamoto, J. Funct.
Biomater., 2017, 8, 18.
11 M. Ferrari, F. Cirisano and M. C. Moran, Colloids Interfaces,
2019, 3, 48.
12 J. Rosales-Leal, M. Rodrıguez-Valverde, G. Mazzaglia,
P. Ramon-Torregrosa, L. Dıaz-Rodrıguez, O. Garcıa-
Martınez, M. Vallecillo-Capilla, C. Ruiz and M. Cabrerizo-
Vılchez, Colloids Surf., A, 2010, 365, 222–229.
13 R. Fernandez-Gonzalez and J. A. Zallen, Cell, 2012, 149, 965–
967.
14 K. Pietras and A. Ostman, Exp. Cell Res., 2010, 316, 1324–
1331.
15 I. Levinger, Y. Ventura and R. Vago, Advances in Cancer
Research, ed. K. D. Tew and P. B. Fisher, Academic Press,
2014, vol. 121 pp. 383–414.
16 B. Alberta, J. Lewis, K. Roberta, A. Johnson, M. Raff and
P. Walter, Molecular Biology of the Cell, Garland Pub, USA,
2008.
17 B. Young, P. Woodford and G. O'Dowd, Wheater's Functional
Histology E-Book: A Text and Colour Atlas, Elsevier Health
Sciences, 2013.
18 H. Battenbo, R. Cobley and S. Wilks, So Matter, 2011, 7,
10864–10873.
19 O. Karthaus, N. Maruyama, X. Cieren, M. Shimomura,
H. Hasegawa and T. Hashimoto, Langmuir, 2000, 16(15),
6071–6076.
20 M. M. Gottesman, T. Fojo and S. E. Bates, Nat. Rev. Cancer,
2002, 2, 48–58.
21 J. P. Gillet and M. M. Gottesman, Multi-Drug Resistance in
Cancer, ed. J. Zhou, Humana Press, Totowa, NJ, 2010, pp.
47–76.
22 S. Nandi, N. R. Kale, V. Takale, G. C. Chate, M. Bhave,
S. S. Banerjee and J. J. Khandare, J. Mater. Chem. B, 2020,
8(9), 1852–1862.
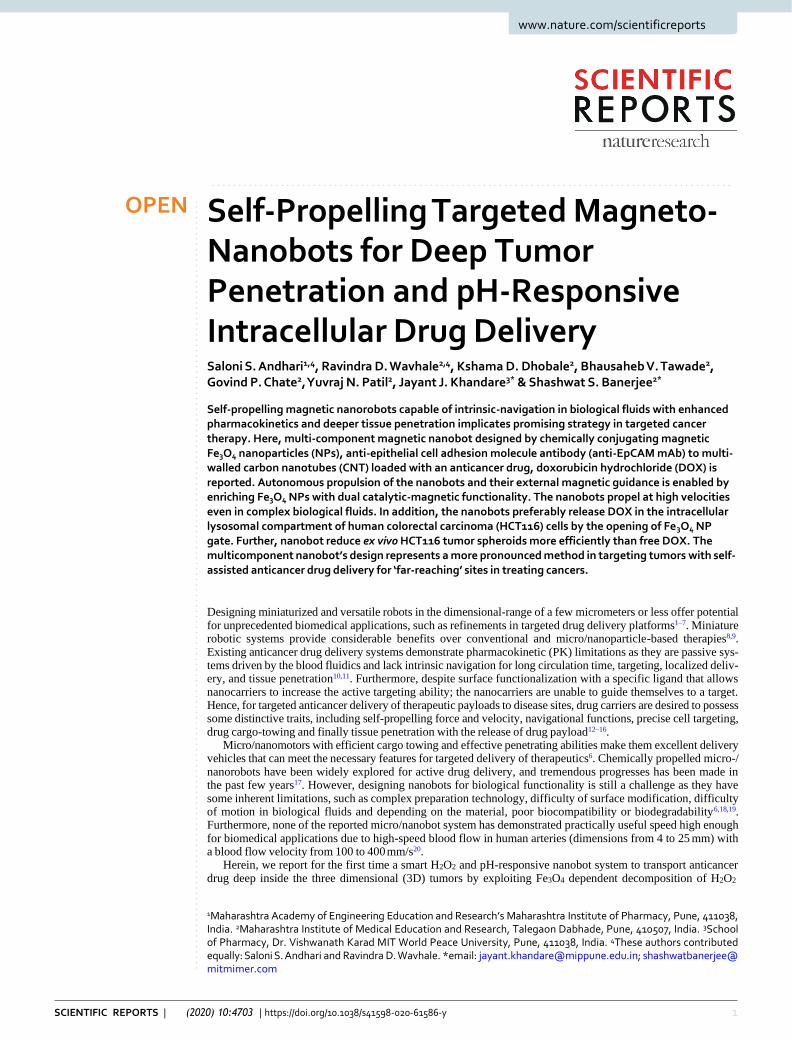
1 SCIENTIFIC REPORTS | (2020) 10:4703 | https://doi.org/10.1038/s41598-020-61586-y
www.nature.com/scientificreports
OPEN Self-Propelling Targeted Magneto- Nanobots for Deep Tumor Penetration and pH-Responsive Intracellular Drug Delivery Saloni S. Andhari1,4, Ravindra D. Wavhale2,4, Kshama D. Dhobale2, Bhausaheb V. Tawade2, Govind P. Chate2, Yuvraj N. Patil2, Jayant J. Khandare3* & Shashwat S. Banerjee2*
Self-propelling magnetic nanorobots capable of intrinsic-navigation in biological fluids with enhanced pharmacokinetics and deeper tissue penetration implicates promising strategy in targeted cancer therapy. Here, multi-component magnetic nanobot designed by chemically conjugating magnetic Fe3O4 nanoparticles (NPs), anti-epithelial cell adhesion molecule antibody (anti-EpCAM mAb) to multi- walled carbon nanotubes (CNT) loaded with an anticancer drug, doxorubicin hydrochloride (DOX) is reported. Autonomous propulsion of the nanobots and their external magnetic guidance is enabled by enriching Fe3O4 NPs with dual catalytic-magnetic functionality. The nanobots propel at high velocities even in complex biological fluids. In addition, the nanobots preferably release DOX in the intracellular lysosomal compartment of human colorectal carcinoma (HCT116) cells by the opening of Fe3O4 NP gate. Further, nanobot reduce ex vivo HCT116 tumor spheroids more efficiently than free DOX. The multicomponent nanobot’s design represents a more pronounced method in targeting tumors with self- assisted anticancer drug delivery for ‘far-reaching’ sites in treating cancers.
Designing miniaturized and versatile robots in the dimensional-range of a few micrometers or less offer potential for unprecedented biomedical applications, such as refinements in targeted drug delivery platforms1–7. Miniature robotic systems provide considerable benefits over conventional and micro/nanoparticle-based therapies8,9. Existing anticancer drug delivery systems demonstrate pharmacokinetic (PK) limitations as they are passive sys- tems driven by the blood fluidics and lack intrinsic navigation for long circulation time, targeting, localized deliv- ery, and tissue penetration10,11. Furthermore, despite surface functionalization with a specific ligand that allows nanocarriers to increase the active targeting ability; the nanocarriers are unable to guide themselves to a target. Hence, for targeted anticancer delivery of therapeutic payloads to disease sites, drug carriers are desired to possess some distinctive traits, including self-propelling force and velocity, navigational functions, precise cell targeting, drug cargo-towing and finally tissue penetration with the release of drug payload12–16.
Micro/nanomotors with efficient cargo towing and effective penetrating abilities make them excellent delivery vehicles that can meet the necessary features for targeted delivery of therapeutics6. Chemically propelled micro-/ nanorobots have been widely explored for active drug delivery, and tremendous progresses has been made in the past few years17. However, designing nanobots for biological functionality is still a challenge as they have some inherent limitations, such as complex preparation technology, difficulty of surface modification, difficulty of motion in biological fluids and depending on the material, poor biocompatibility or biodegradability6,18,19. Furthermore, none of the reported micro/nanobot system has demonstrated practically useful speed high enough for biomedical applications due to high-speed blood flow in human arteries (dimensions from 4 to 25 mm) with a blood flow velocity from 100 to 400 mm/s20.
Herein, we report for the first time a smart H2O2 and pH-responsive nanobot system to transport anticancer drug deep inside the three dimensional (3D) tumors by exploiting Fe3O4 dependent decomposition of H2O2
1Maharashtra Academy of Engineering Education and Research’s Maharashtra Institute of Pharmacy, Pune, 411038, India. 2Maharashtra Institute of Medical Education and Research, Talegaon Dabhade, Pune, 410507, India. 3School of Pharmacy, Dr. Vishwanath Karad MIT World Peace University, Pune, 411038, India. 4These authors contributed equally: Saloni S. Andhari and Ravindra D. Wavhale. *email: [email protected]; shashwatbanerjee@ mitmimer.com
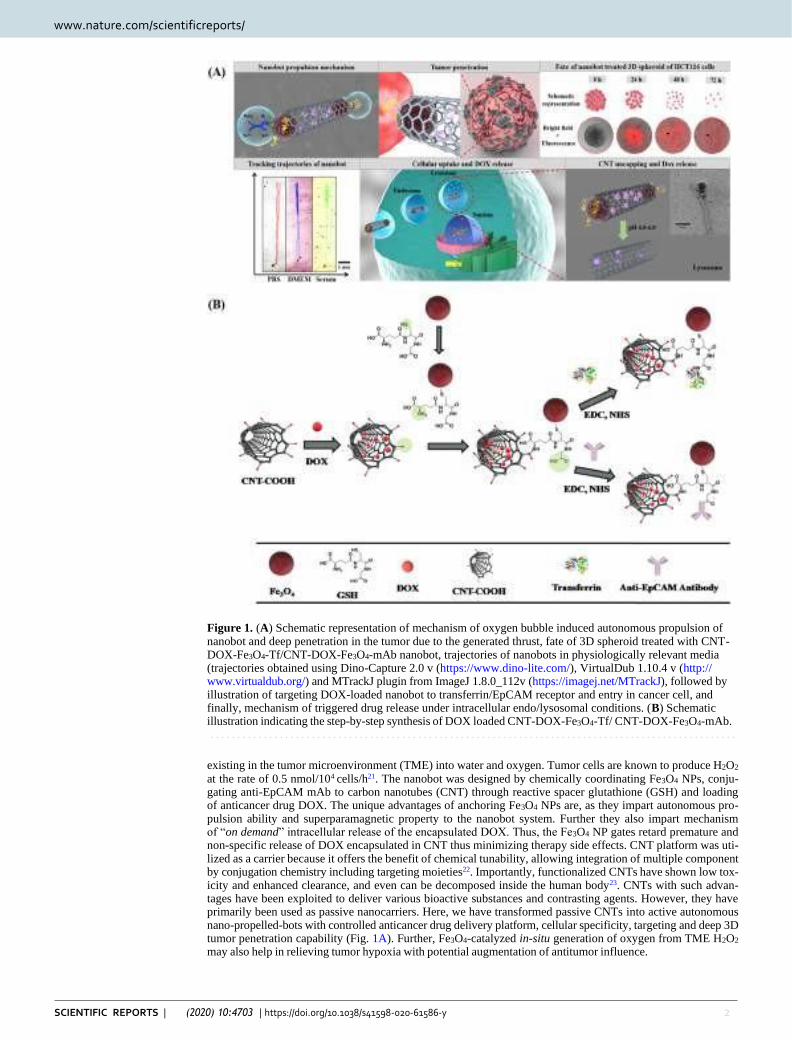
2 SCIENTIFIC REPORTS | (2020) 10:4703 | https://doi.org/10.1038/s41598-020-61586-y
www.nature.com/scientificreports www.nature.com/scientificreports/
Figure 1. (A) Schematic representation of mechanism of oxygen bubble induced autonomous propulsion of nanobot and deep penetration in the tumor due to the generated thrust, fate of 3D spheroid treated with CNT- DOX-Fe3O4-Tf/CNT-DOX-Fe3O4-mAb nanobot, trajectories of nanobots in physiologically relevant media (trajectories obtained using Dino-Capture 2.0 v (https://www.dino-lite.com/), VirtualDub 1.10.4 v (http:// www.virtualdub.org/) and MTrackJ plugin from ImageJ 1.8.0_112v (https://imagej.net/MTrackJ), followed by illustration of targeting DOX-loaded nanobot to transferrin/EpCAM receptor and entry in cancer cell, and finally, mechanism of triggered drug release under intracellular endo/lysosomal conditions. (B) Schematic illustration indicating the step-by-step synthesis of DOX loaded CNT-DOX-Fe3O4-Tf/ CNT-DOX-Fe3O4-mAb.
existing in the tumor microenvironment (TME) into water and oxygen. Tumor cells are known to produce H2O2 at the rate of 0.5 nmol/104 cells/h21. The nanobot was designed by chemically coordinating Fe3O4 NPs, conju- gating anti-EpCAM mAb to carbon nanotubes (CNT) through reactive spacer glutathione (GSH) and loading of anticancer drug DOX. The unique advantages of anchoring Fe3O4 NPs are, as they impart autonomous pro- pulsion ability and superparamagnetic property to the nanobot system. Further they also impart mechanism of “on demand” intracellular release of the encapsulated DOX. Thus, the Fe3O4 NP gates retard premature and non-specific release of DOX encapsulated in CNT thus minimizing therapy side effects. CNT platform was uti- lized as a carrier because it offers the benefit of chemical tunability, allowing integration of multiple component by conjugation chemistry including targeting moieties22. Importantly, functionalized CNTs have shown low tox- icity and enhanced clearance, and even can be decomposed inside the human body23. CNTs with such advan- tages have been exploited to deliver various bioactive substances and contrasting agents. However, they have primarily been used as passive nanocarriers. Here, we have transformed passive CNTs into active autonomous nano-propelled-bots with controlled anticancer drug delivery platform, cellular specificity, targeting and deep 3D tumor penetration capability (Fig. 1A). Further, Fe3O4-catalyzed in-situ generation of oxygen from TME H2O2 may also help in relieving tumor hypoxia with potential augmentation of antitumor influence.
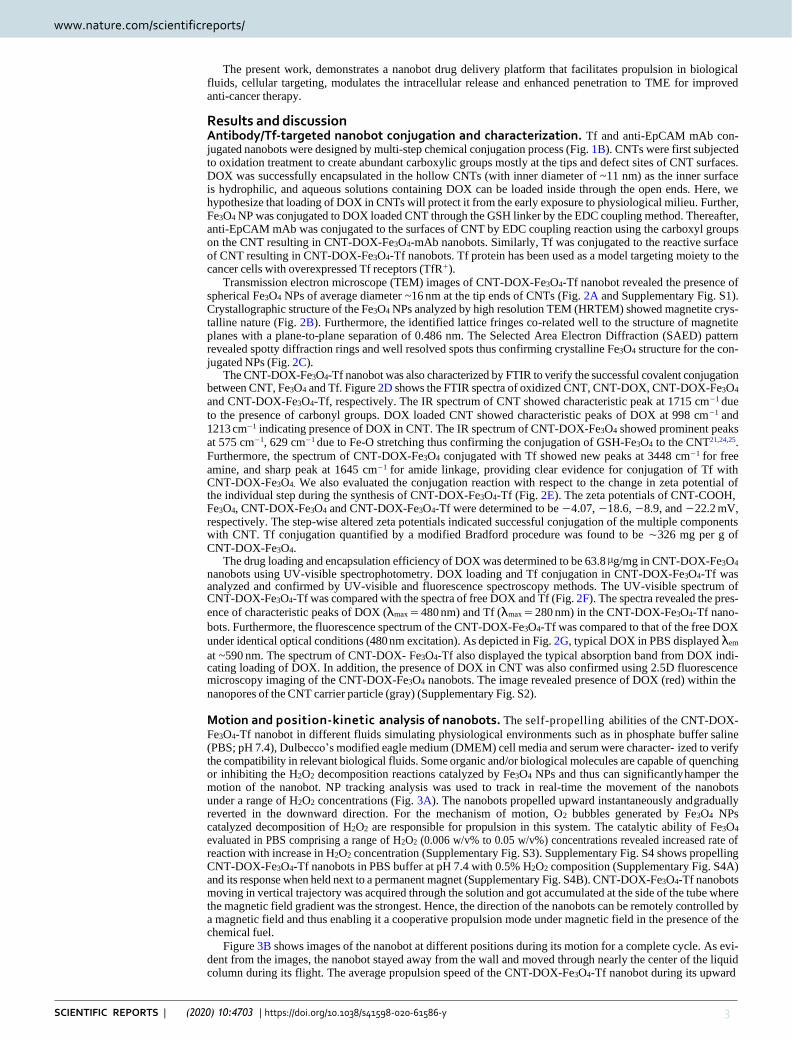
www.nature.com/scientificreports www.nature.com/scientificreports/
3 SCIENTIFIC REPORTS | (2020) 10:4703 | https://doi.org/10.1038/s41598-020-61586-y
The present work, demonstrates a nanobot drug delivery platform that facilitates propulsion in biological fluids, cellular targeting, modulates the intracellular release and enhanced penetration to TME for improved anti-cancer therapy.
Results and discussion Antibody/Tf-targeted nanobot conjugation and characterization. Tf and anti-EpCAM mAb con- jugated nanobots were designed by multi-step chemical conjugation process (Fig. 1B). CNTs were first subjected to oxidation treatment to create abundant carboxylic groups mostly at the tips and defect sites of CNT surfaces. DOX was successfully encapsulated in the hollow CNTs (with inner diameter of ~11 nm) as the inner surface is hydrophilic, and aqueous solutions containing DOX can be loaded inside through the open ends. Here, we hypothesize that loading of DOX in CNTs will protect it from the early exposure to physiological milieu. Further, Fe3O4 NP was conjugated to DOX loaded CNT through the GSH linker by the EDC coupling method. Thereafter, anti-EpCAM mAb was conjugated to the surfaces of CNT by EDC coupling reaction using the carboxyl groups on the CNT resulting in CNT-DOX-Fe3O4-mAb nanobots. Similarly, Tf was conjugated to the reactive surface of CNT resulting in CNT-DOX-Fe3O4-Tf nanobots. Tf protein has been used as a model targeting moiety to the cancer cells with overexpressed Tf receptors (TfR+).
Transmission electron microscope (TEM) images of CNT-DOX-Fe3O4-Tf nanobot revealed the presence of spherical Fe3O4 NPs of average diameter ~16 nm at the tip ends of CNTs (Fig. 2A and Supplementary Fig. S1). Crystallographic structure of the Fe3O4 NPs analyzed by high resolution TEM (HRTEM) showed magnetite crys- talline nature (Fig. 2B). Furthermore, the identified lattice fringes co-related well to the structure of magnetite planes with a plane-to-plane separation of 0.486 nm. The Selected Area Electron Diffraction (SAED) pattern revealed spotty diffraction rings and well resolved spots thus confirming crystalline Fe3O4 structure for the con- jugated NPs (Fig. 2C).
The CNT-DOX-Fe3O4-Tf nanobot was also characterized by FTIR to verify the successful covalent conjugation between CNT, Fe3O4 and Tf. Figure 2D shows the FTIR spectra of oxidized CNT, CNT-DOX, CNT-DOX-Fe3O4 and CNT-DOX-Fe3O4-Tf, respectively. The IR spectrum of CNT showed characteristic peak at 1715 cm−1 due
to the presence of carbonyl groups. DOX loaded CNT showed characteristic peaks of DOX at 998 cm−1 and 1213 cm−1 indicating presence of DOX in CNT. The IR spectrum of CNT-DOX-Fe3O4 showed prominent peaks at 575 cm−1, 629 cm−1 due to Fe-O stretching thus confirming the conjugation of GSH-Fe3O4 to the CNT21,24,25.
Furthermore, the spectrum of CNT-DOX-Fe3O4 conjugated with Tf showed new peaks at 3448 cm−1 for free amine, and sharp peak at 1645 cm−1 for amide linkage, providing clear evidence for conjugation of Tf with CNT-DOX-Fe3O4. We also evaluated the conjugation reaction with respect to the change in zeta potential of the individual step during the synthesis of CNT-DOX-Fe3O4-Tf (Fig. 2E). The zeta potentials of CNT-COOH, Fe3O4, CNT-DOX-Fe3O4 and CNT-DOX-Fe3O4-Tf were determined to be −4.07, −18.6, −8.9, and −22.2 mV, respectively. The step-wise altered zeta potentials indicated successful conjugation of the multiple components with CNT. Tf conjugation quantified by a modified Bradford procedure was found to be ∼326 mg per g of CNT-DOX-Fe3O4.
The drug loading and encapsulation efficiency of DOX was determined to be 63.8 µg/mg in CNT-DOX-Fe3O4 nanobots using UV-visible spectrophotometry. DOX loading and Tf conjugation in CNT-DOX-Fe3O4-Tf was analyzed and confirmed by UV-visible and fluorescence spectroscopy methods. The UV-visible spectrum of CNT-DOX-Fe3O4-Tf was compared with the spectra of free DOX and Tf (Fig. 2F). The spectra revealed the pres-
ence of characteristic peaks of DOX (λmax = 480 nm) and Tf (λmax = 280 nm) in the CNT-DOX-Fe3O4-Tf nano-
bots. Furthermore, the fluorescence spectrum of the CNT-DOX-Fe3O4-Tf was compared to that of the free DOX
under identical optical conditions (480 nm excitation). As depicted in Fig. 2G, typical DOX in PBS displayed λem
at ~590 nm. The spectrum of CNT-DOX- Fe3O4-Tf also displayed the typical absorption band from DOX indi- cating loading of DOX. In addition, the presence of DOX in CNT was also confirmed using 2.5D fluorescence microscopy imaging of the CNT-DOX-Fe3O4 nanobots. The image revealed presence of DOX (red) within the
nanopores of the CNT carrier particle (gray) (Supplementary Fig. S2).
Motion and position-kinetic analysis of nanobots. The self-propelling abilities of the CNT-DOX-
Fe3O4-Tf nanobot in different fluids simulating physiological environments such as in phosphate buffer saline (PBS; pH 7.4), Dulbecco’s modified eagle medium (DMEM) cell media and serum were character- ized to verify the compatibility in relevant biological fluids. Some organic and/or biological molecules are capable of quenching or inhibiting the H2O2 decomposition reactions catalyzed by Fe3O4 NPs and thus can significantly hamper the motion of the nanobot. NP tracking analysis was used to track in real-time the movement of the nanobots under a range of H2O2 concentrations (Fig. 3A). The nanobots propelled upward instantaneously and gradually reverted in the downward direction. For the mechanism of motion, O2 bubbles generated by Fe3O4 NPs catalyzed decomposition of H2O2 are responsible for propulsion in this system. The catalytic ability of Fe3O4 evaluated in PBS comprising a range of H2O2 (0.006 w/v% to 0.05 w/v%) concentrations revealed increased rate of reaction with increase in H2O2 concentration (Supplementary Fig. S3). Supplementary Fig. S4 shows propelling CNT-DOX-Fe3O4-Tf nanobots in PBS buffer at pH 7.4 with 0.5% H2O2 composition (Supplementary Fig. S4A) and its response when held next to a permanent magnet (Supplementary Fig. S4B). CNT-DOX-Fe3O4-Tf nanobots moving in vertical trajectory was acquired through the solution and got accumulated at the side of the tube where the magnetic field gradient was the strongest. Hence, the direction of the nanobots can be remotely controlled by a magnetic field and thus enabling it a cooperative propulsion mode under magnetic field in the presence of the chemical fuel.
Figure 3B shows images of the nanobot at different positions during its motion for a complete cycle. As evi- dent from the images, the nanobot stayed away from the wall and moved through nearly the center of the liquid column during its flight. The average propulsion speed of the CNT-DOX-Fe3O4-Tf nanobot during its upward
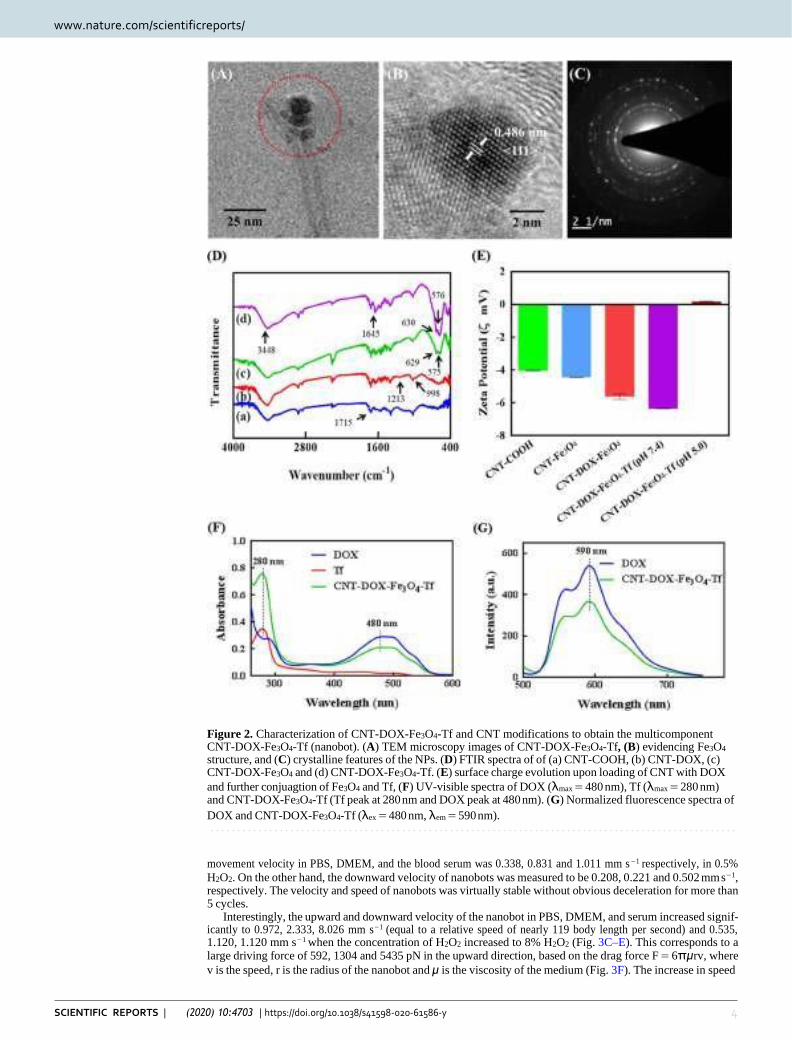
www.nature.com/scientificreports www.nature.com/scientificreports/
4 SCIENTIFIC REPORTS | (2020) 10:4703 | https://doi.org/10.1038/s41598-020-61586-y
Figure 2. Characterization of CNT-DOX-Fe3O4-Tf and CNT modifications to obtain the multicomponent CNT-DOX-Fe3O4-Tf (nanobot). (A) TEM microscopy images of CNT-DOX-Fe3O4-Tf, (B) evidencing Fe3O4 structure, and (C) crystalline features of the NPs. (D) FTIR spectra of of (a) CNT-COOH, (b) CNT-DOX, (c) CNT-DOX-Fe3O4 and (d) CNT-DOX-Fe3O4-Tf. (E) surface charge evolution upon loading of CNT with DOX
and further conjuagtion of Fe3O4 and Tf, (F) UV-visible spectra of DOX (λmax = 480 nm), Tf (λmax = 280 nm) and CNT-DOX-Fe3O4-Tf (Tf peak at 280 nm and DOX peak at 480 nm). (G) Normalized fluorescence spectra of
DOX and CNT-DOX-Fe3O4-Tf (λex = 480 nm, λem = 590 nm).
movement velocity in PBS, DMEM, and the blood serum was 0.338, 0.831 and 1.011 mm s−1 respectively, in 0.5%
H2O2. On the other hand, the downward velocity of nanobots was measured to be 0.208, 0.221 and 0.502 mm s−1, respectively. The velocity and speed of nanobots was virtually stable without obvious deceleration for more than 5 cycles.
Interestingly, the upward and downward velocity of the nanobot in PBS, DMEM, and serum increased signif- icantly to 0.972, 2.333, 8.026 mm s−1 (equal to a relative speed of nearly 119 body length per second) and 0.535, 1.120, 1.120 mm s−1 when the concentration of H2O2 increased to 8% H2O2 (Fig. 3C–E). This corresponds to a large driving force of 592, 1304 and 5435 pN in the upward direction, based on the drag force F = 6πμrv, where
v is the speed, r is the radius of the nanobot and μ is the viscosity of the medium (Fig. 3F). The increase in speed
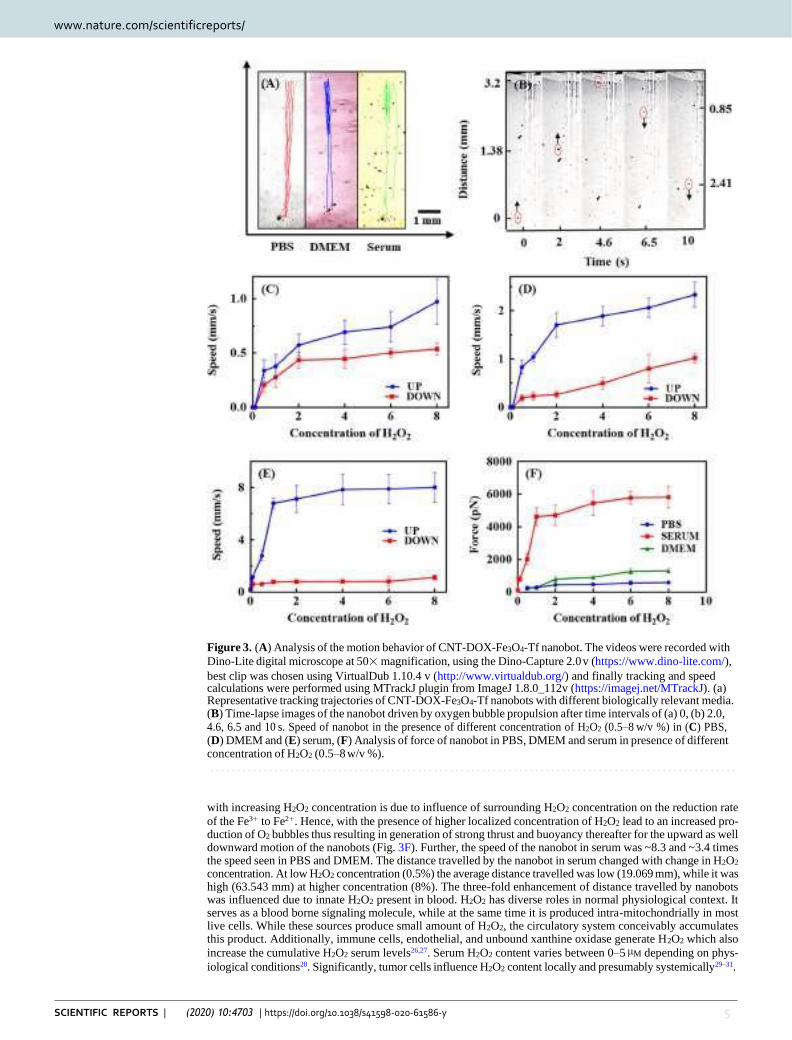
www.nature.com/scientificreports www.nature.com/scientificreports/
5 SCIENTIFIC REPORTS | (2020) 10:4703 | https://doi.org/10.1038/s41598-020-61586-y
Figure 3. (A) Analysis of the motion behavior of CNT-DOX-Fe3O4-Tf nanobot. The videos were recorded with
Dino-Lite digital microscope at 50× magnification, using the Dino-Capture 2.0 v (https://www.dino-lite.com/),
best clip was chosen using VirtualDub 1.10.4 v (http://www.virtualdub.org/) and finally tracking and speed calculations were performed using MTrackJ plugin from ImageJ 1.8.0_112v (https://imagej.net/MTrackJ). (a) Representative tracking trajectories of CNT-DOX-Fe3O4-Tf nanobots with different biologically relevant media. (B) Time-lapse images of the nanobot driven by oxygen bubble propulsion after time intervals of (a) 0, (b) 2.0, 4.6, 6.5 and 10 s. Speed of nanobot in the presence of different concentration of H2O2 (0.5–8 w/v %) in (C) PBS, (D) DMEM and (E) serum, (F) Analysis of force of nanobot in PBS, DMEM and serum in presence of different concentration of H2O2 (0.5–8 w/v %).
with increasing H2O2 concentration is due to influence of surrounding H2O2 concentration on the reduction rate
of the Fe3+ to Fe2+. Hence, with the presence of higher localized concentration of H2O2 lead to an increased pro- duction of O2 bubbles thus resulting in generation of strong thrust and buoyancy thereafter for the upward as well downward motion of the nanobots (Fig. 3F). Further, the speed of the nanobot in serum was ~8.3 and ~3.4 times the speed seen in PBS and DMEM. The distance travelled by the nanobot in serum changed with change in H2O2 concentration. At low H2O2 concentration (0.5%) the average distance travelled was low (19.069 mm), while it was high (63.543 mm) at higher concentration (8%). The three-fold enhancement of distance travelled by nanobots was influenced due to innate H2O2 present in blood. H2O2 has diverse roles in normal physiological context. It serves as a blood borne signaling molecule, while at the same time it is produced intra-mitochondrially in most live cells. While these sources produce small amount of H2O2, the circulatory system conceivably accumulates this product. Additionally, immune cells, endothelial, and unbound xanthine oxidase generate H2O2 which also
increase the cumulative H2O2 serum levels26,27. Serum H2O2 content varies between 0–5 µM depending on phys-
iological conditions28. Significantly, tumor cells influence H2O2 content locally and presumably systemically29–31.
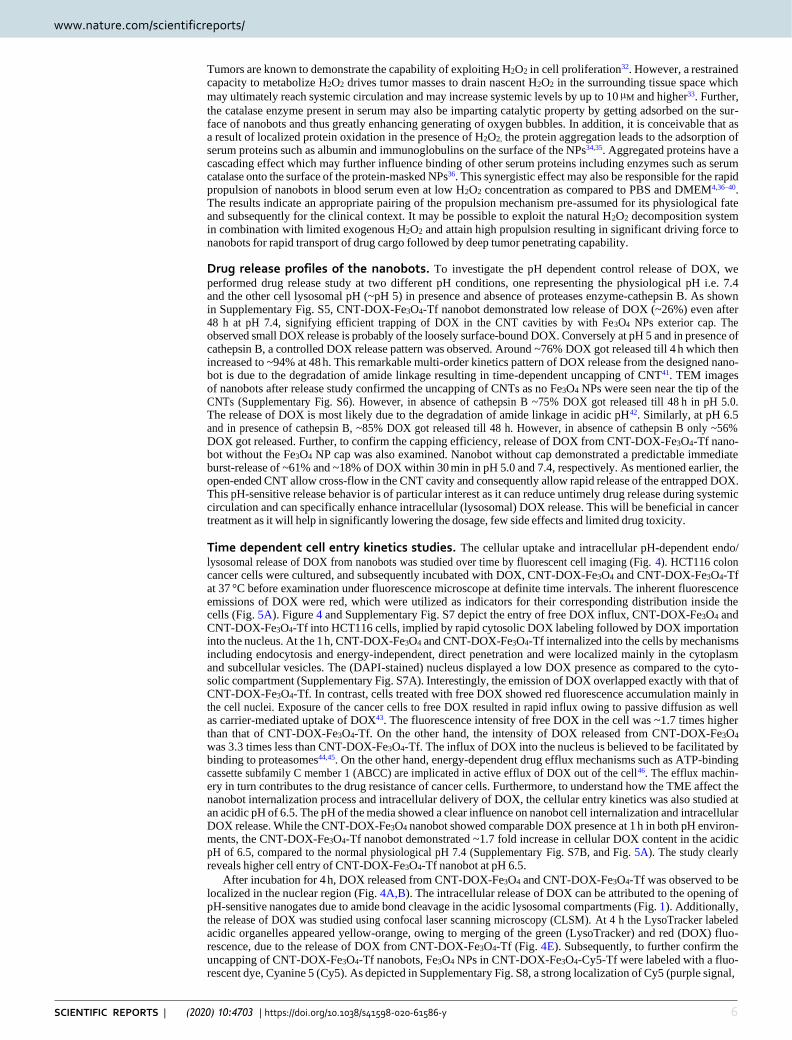
www.nature.com/scientificreports www.nature.com/scientificreports/
6 SCIENTIFIC REPORTS | (2020) 10:4703 | https://doi.org/10.1038/s41598-020-61586-y
Tumors are known to demonstrate the capability of exploiting H2O2 in cell proliferation32. However, a restrained capacity to metabolize H2O2 drives tumor masses to drain nascent H2O2 in the surrounding tissue space which
may ultimately reach systemic circulation and may increase systemic levels by up to 10 µM and higher33. Further,
the catalase enzyme present in serum may also be imparting catalytic property by getting adsorbed on the sur- face of nanobots and thus greatly enhancing generating of oxygen bubbles. In addition, it is conceivable that as a result of localized protein oxidation in the presence of H2O2, the protein aggregation leads to the adsorption of serum proteins such as albumin and immunoglobulins on the surface of the NPs34,35. Aggregated proteins have a cascading effect which may further influence binding of other serum proteins including enzymes such as serum catalase onto the surface of the protein-masked NPs36. This synergistic effect may also be responsible for the rapid propulsion of nanobots in blood serum even at low H2O2 concentration as compared to PBS and DMEM4,36–40. The results indicate an appropriate pairing of the propulsion mechanism pre-assumed for its physiological fate and subsequently for the clinical context. It may be possible to exploit the natural H2O2 decomposition system in combination with limited exogenous H2O2 and attain high propulsion resulting in significant driving force to nanobots for rapid transport of drug cargo followed by deep tumor penetrating capability.
Drug release profiles of the nanobots. To investigate the pH dependent control release of DOX, we
performed drug release study at two different pH conditions, one representing the physiological pH i.e. 7.4 and the other cell lysosomal pH (~pH 5) in presence and absence of proteases enzyme-cathepsin B. As shown in Supplementary Fig. S5, CNT-DOX-Fe3O4-Tf nanobot demonstrated low release of DOX (~26%) even after 48 h at pH 7.4, signifying efficient trapping of DOX in the CNT cavities by with Fe3O4 NPs exterior cap. The observed small DOX release is probably of the loosely surface-bound DOX. Conversely at pH 5 and in presence of cathepsin B, a controlled DOX release pattern was observed. Around ~76% DOX got released till 4 h which then increased to ~94% at 48 h. This remarkable multi-order kinetics pattern of DOX release from the designed nano- bot is due to the degradation of amide linkage resulting in time-dependent uncapping of CNT41. TEM images of nanobots after release study confirmed the uncapping of CNTs as no Fe3O4 NPs were seen near the tip of the CNTs (Supplementary Fig. S6). However, in absence of cathepsin B ~75% DOX got released till 48 h in pH 5.0. The release of DOX is most likely due to the degradation of amide linkage in acidic pH42. Similarly, at pH 6.5 and in presence of cathepsin B, ~85% DOX got released till 48 h. However, in absence of cathepsin B only ~56% DOX got released. Further, to confirm the capping efficiency, release of DOX from CNT-DOX-Fe3O4-Tf nano- bot without the Fe3O4 NP cap was also examined. Nanobot without cap demonstrated a predictable immediate burst-release of ~61% and ~18% of DOX within 30 min in pH 5.0 and 7.4, respectively. As mentioned earlier, the open-ended CNT allow cross-flow in the CNT cavity and consequently allow rapid release of the entrapped DOX. This pH-sensitive release behavior is of particular interest as it can reduce untimely drug release during systemic circulation and can specifically enhance intracellular (lysosomal) DOX release. This will be beneficial in cancer treatment as it will help in significantly lowering the dosage, few side effects and limited drug toxicity.
Time dependent cell entry kinetics studies. The cellular uptake and intracellular pH-dependent endo/
lysosomal release of DOX from nanobots was studied over time by fluorescent cell imaging (Fig. 4). HCT116 colon cancer cells were cultured, and subsequently incubated with DOX, CNT-DOX-Fe3O4 and CNT-DOX-Fe3O4-Tf at 37 °C before examination under fluorescence microscope at definite time intervals. The inherent fluorescence emissions of DOX were red, which were utilized as indicators for their corresponding distribution inside the cells (Fig. 5A). Figure 4 and Supplementary Fig. S7 depict the entry of free DOX influx, CNT-DOX-Fe3O4 and CNT-DOX-Fe3O4-Tf into HCT116 cells, implied by rapid cytosolic DOX labeling followed by DOX importation into the nucleus. At the 1 h, CNT-DOX-Fe3O4 and CNT-DOX-Fe3O4-Tf internalized into the cells by mechanisms including endocytosis and energy-independent, direct penetration and were localized mainly in the cytoplasm and subcellular vesicles. The (DAPI-stained) nucleus displayed a low DOX presence as compared to the cyto- solic compartment (Supplementary Fig. S7A). Interestingly, the emission of DOX overlapped exactly with that of CNT-DOX-Fe3O4-Tf. In contrast, cells treated with free DOX showed red fluorescence accumulation mainly in the cell nuclei. Exposure of the cancer cells to free DOX resulted in rapid influx owing to passive diffusion as well as carrier-mediated uptake of DOX43. The fluorescence intensity of free DOX in the cell was ~1.7 times higher than that of CNT-DOX-Fe3O4-Tf. On the other hand, the intensity of DOX released from CNT-DOX-Fe3O4 was 3.3 times less than CNT-DOX-Fe3O4-Tf. The influx of DOX into the nucleus is believed to be facilitated by binding to proteasomes44,45. On the other hand, energy-dependent drug efflux mechanisms such as ATP-binding cassette subfamily C member 1 (ABCC) are implicated in active efflux of DOX out of the cell46. The efflux machin- ery in turn contributes to the drug resistance of cancer cells. Furthermore, to understand how the TME affect the nanobot internalization process and intracellular delivery of DOX, the cellular entry kinetics was also studied at an acidic pH of 6.5. The pH of the media showed a clear influence on nanobot cell internalization and intracellular DOX release. While the CNT-DOX-Fe3O4 nanobot showed comparable DOX presence at 1 h in both pH environ- ments, the CNT-DOX-Fe3O4-Tf nanobot demonstrated ~1.7 fold increase in cellular DOX content in the acidic pH of 6.5, compared to the normal physiological pH 7.4 (Supplementary Fig. S7B, and Fig. 5A). The study clearly reveals higher cell entry of CNT-DOX-Fe3O4-Tf nanobot at pH 6.5.
After incubation for 4 h, DOX released from CNT-DOX-Fe3O4 and CNT-DOX-Fe3O4-Tf was observed to be localized in the nuclear region (Fig. 4A,B). The intracellular release of DOX can be attributed to the opening of pH-sensitive nanogates due to amide bond cleavage in the acidic lysosomal compartments (Fig. 1). Additionally, the release of DOX was studied using confocal laser scanning microscopy (CLSM). At 4 h the LysoTracker labeled acidic organelles appeared yellow-orange, owing to merging of the green (LysoTracker) and red (DOX) fluo- rescence, due to the release of DOX from CNT-DOX-Fe3O4-Tf (Fig. 4E). Subsequently, to further confirm the uncapping of CNT-DOX-Fe3O4-Tf nanobots, Fe3O4 NPs in CNT-DOX-Fe3O4-Cy5-Tf were labeled with a fluo- rescent dye, Cyanine 5 (Cy5). As depicted in Supplementary Fig. S8, a strong localization of Cy5 (purple signal,
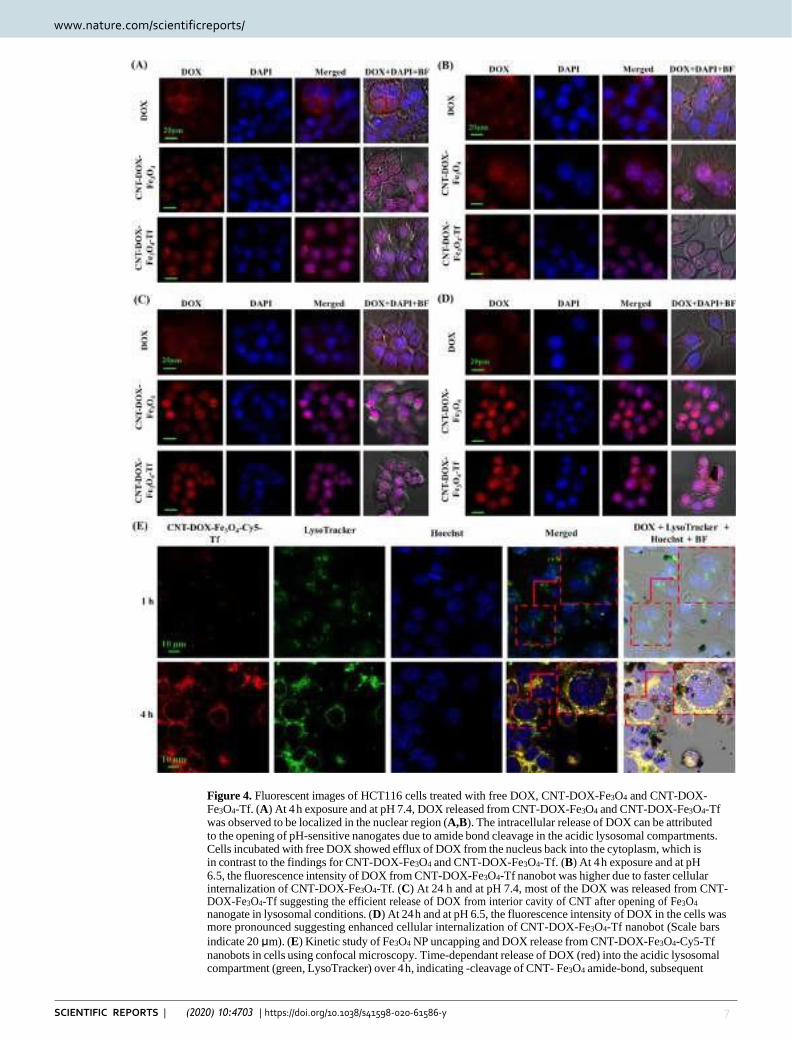
www.nature.com/scientificreports www.nature.com/scientificreports/
7 SCIENTIFIC REPORTS | (2020) 10:4703 | https://doi.org/10.1038/s41598-020-61586-y
Figure 4. Fluorescent images of HCT116 cells treated with free DOX, CNT-DOX-Fe3O4 and CNT-DOX- Fe3O4-Tf. (A) At 4 h exposure and at pH 7.4, DOX released from CNT-DOX-Fe3O4 and CNT-DOX-Fe3O4-Tf was observed to be localized in the nuclear region (A,B). The intracellular release of DOX can be attributed to the opening of pH-sensitive nanogates due to amide bond cleavage in the acidic lysosomal compartments. Cells incubated with free DOX showed efflux of DOX from the nucleus back into the cytoplasm, which is in contrast to the findings for CNT-DOX-Fe3O4 and CNT-DOX-Fe3O4-Tf. (B) At 4 h exposure and at pH 6.5, the fluorescence intensity of DOX from CNT-DOX-Fe3O4-Tf nanobot was higher due to faster cellular internalization of CNT-DOX-Fe3O4-Tf. (C) At 24 h and at pH 7.4, most of the DOX was released from CNT- DOX-Fe3O4-Tf suggesting the efficient release of DOX from interior cavity of CNT after opening of Fe3O4 nanogate in lysosomal conditions. (D) At 24 h and at pH 6.5, the fluorescence intensity of DOX in the cells was more pronounced suggesting enhanced cellular internalization of CNT-DOX-Fe3O4-Tf nanobot (Scale bars
indicate 20 μm). (E) Kinetic study of Fe3O4 NP uncapping and DOX release from CNT-DOX-Fe3O4-Cy5-Tf
nanobots in cells using confocal microscopy. Time-dependant release of DOX (red) into the acidic lysosomal compartment (green, LysoTracker) over 4 h, indicating -cleavage of CNT- Fe3O4 amide-bond, subsequent
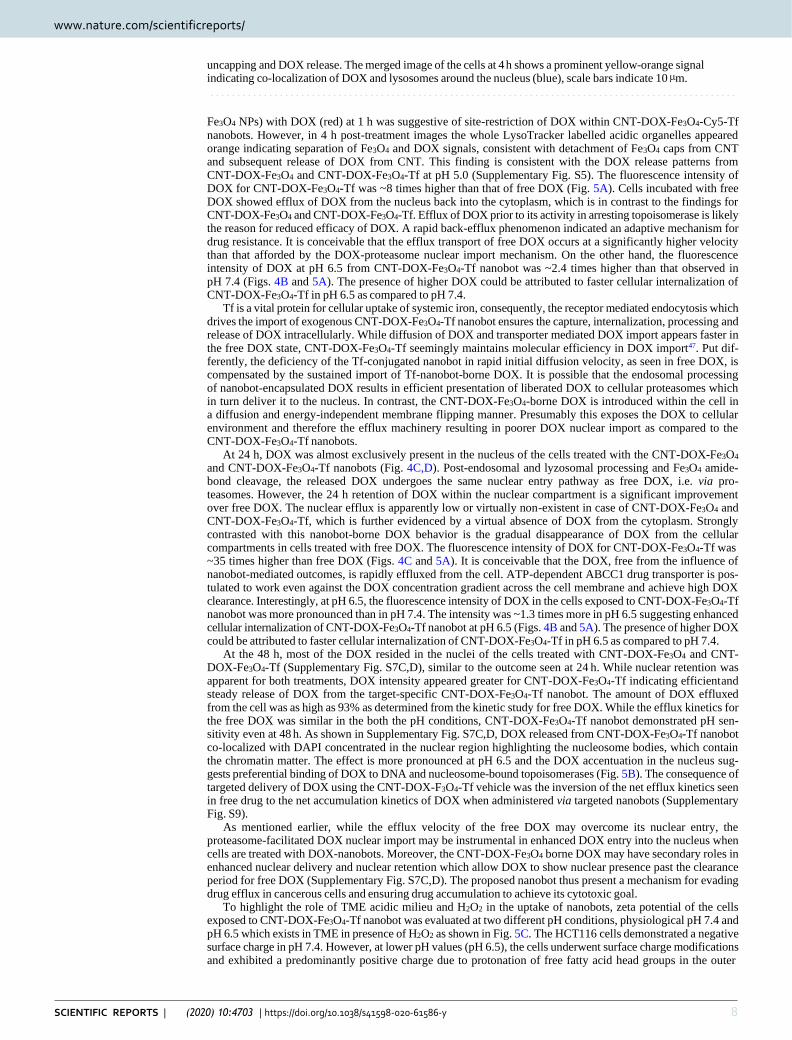
www.nature.com/scientificreports www.nature.com/scientificreports/
8 SCIENTIFIC REPORTS | (2020) 10:4703 | https://doi.org/10.1038/s41598-020-61586-y
uncapping and DOX release. The merged image of the cells at 4 h shows a prominent yellow-orange signal indicating co-localization of DOX and lysosomes around the nucleus (blue), scale bars indicate 10 µm.
Fe3O4 NPs) with DOX (red) at 1 h was suggestive of site-restriction of DOX within CNT-DOX-Fe3O4-Cy5-Tf nanobots. However, in 4 h post-treatment images the whole LysoTracker labelled acidic organelles appeared orange indicating separation of Fe3O4 and DOX signals, consistent with detachment of Fe3O4 caps from CNT and subsequent release of DOX from CNT. This finding is consistent with the DOX release patterns from CNT-DOX-Fe3O4 and CNT-DOX-Fe3O4-Tf at pH 5.0 (Supplementary Fig. S5). The fluorescence intensity of DOX for CNT-DOX-Fe3O4-Tf was ~8 times higher than that of free DOX (Fig. 5A). Cells incubated with free DOX showed efflux of DOX from the nucleus back into the cytoplasm, which is in contrast to the findings for CNT-DOX-Fe3O4 and CNT-DOX-Fe3O4-Tf. Efflux of DOX prior to its activity in arresting topoisomerase is likely the reason for reduced efficacy of DOX. A rapid back-efflux phenomenon indicated an adaptive mechanism for drug resistance. It is conceivable that the efflux transport of free DOX occurs at a significantly higher velocity than that afforded by the DOX-proteasome nuclear import mechanism. On the other hand, the fluorescence intensity of DOX at pH 6.5 from CNT-DOX-Fe3O4-Tf nanobot was ~2.4 times higher than that observed in pH 7.4 (Figs. 4B and 5A). The presence of higher DOX could be attributed to faster cellular internalization of CNT-DOX-Fe3O4-Tf in pH 6.5 as compared to pH 7.4.
Tf is a vital protein for cellular uptake of systemic iron, consequently, the receptor mediated endocytosis which drives the import of exogenous CNT-DOX-Fe3O4-Tf nanobot ensures the capture, internalization, processing and release of DOX intracellularly. While diffusion of DOX and transporter mediated DOX import appears faster in the free DOX state, CNT-DOX-Fe3O4-Tf seemingly maintains molecular efficiency in DOX import47. Put dif- ferently, the deficiency of the Tf-conjugated nanobot in rapid initial diffusion velocity, as seen in free DOX, is compensated by the sustained import of Tf-nanobot-borne DOX. It is possible that the endosomal processing of nanobot-encapsulated DOX results in efficient presentation of liberated DOX to cellular proteasomes which in turn deliver it to the nucleus. In contrast, the CNT-DOX-Fe3O4-borne DOX is introduced within the cell in a diffusion and energy-independent membrane flipping manner. Presumably this exposes the DOX to cellular environment and therefore the efflux machinery resulting in poorer DOX nuclear import as compared to the CNT-DOX-Fe3O4-Tf nanobots.
At 24 h, DOX was almost exclusively present in the nucleus of the cells treated with the CNT-DOX-Fe3O4 and CNT-DOX-Fe3O4-Tf nanobots (Fig. 4C,D). Post-endosomal and lyzosomal processing and Fe3O4 amide-bond cleavage, the released DOX undergoes the same nuclear entry pathway as free DOX, i.e. via pro- teasomes. However, the 24 h retention of DOX within the nuclear compartment is a significant improvement over free DOX. The nuclear efflux is apparently low or virtually non-existent in case of CNT-DOX-Fe3O4 and CNT-DOX-Fe3O4-Tf, which is further evidenced by a virtual absence of DOX from the cytoplasm. Strongly contrasted with this nanobot-borne DOX behavior is the gradual disappearance of DOX from the cellular compartments in cells treated with free DOX. The fluorescence intensity of DOX for CNT-DOX-Fe3O4-Tf was ~35 times higher than free DOX (Figs. 4C and 5A). It is conceivable that the DOX, free from the influence of nanobot-mediated outcomes, is rapidly effluxed from the cell. ATP-dependent ABCC1 drug transporter is pos- tulated to work even against the DOX concentration gradient across the cell membrane and achieve high DOX clearance. Interestingly, at pH 6.5, the fluorescence intensity of DOX in the cells exposed to CNT-DOX-Fe3O4-Tf nanobot was more pronounced than in pH 7.4. The intensity was ~1.3 times more in pH 6.5 suggesting enhanced cellular internalization of CNT-DOX-Fe3O4-Tf nanobot at pH 6.5 (Figs. 4B and 5A). The presence of higher DOX could be attributed to faster cellular internalization of CNT-DOX-Fe3O4-Tf in pH 6.5 as compared to pH 7.4.
At the 48 h, most of the DOX resided in the nuclei of the cells treated with CNT-DOX-Fe3O4 and CNT-DOX-Fe3O4-Tf (Supplementary Fig. S7C,D), similar to the outcome seen at 24 h. While nuclear retention was apparent for both treatments, DOX intensity appeared greater for CNT-DOX-Fe3O4-Tf indicating efficient and steady release of DOX from the target-specific CNT-DOX-Fe3O4-Tf nanobot. The amount of DOX effluxed from the cell was as high as 93% as determined from the kinetic study for free DOX. While the efflux kinetics for the free DOX was similar in the both the pH conditions, CNT-DOX-Fe3O4-Tf nanobot demonstrated pH sen- sitivity even at 48 h. As shown in Supplementary Fig. S7C,D, DOX released from CNT-DOX-Fe3O4-Tf nanobot co-localized with DAPI concentrated in the nuclear region highlighting the nucleosome bodies, which contain the chromatin matter. The effect is more pronounced at pH 6.5 and the DOX accentuation in the nucleus sug- gests preferential binding of DOX to DNA and nucleosome-bound topoisomerases (Fig. 5B). The consequence of targeted delivery of DOX using the CNT-DOX-F3O4-Tf vehicle was the inversion of the net efflux kinetics seen in free drug to the net accumulation kinetics of DOX when administered via targeted nanobots (Supplementary Fig. S9).
As mentioned earlier, while the efflux velocity of the free DOX may overcome its nuclear entry, the proteasome-facilitated DOX nuclear import may be instrumental in enhanced DOX entry into the nucleus when cells are treated with DOX-nanobots. Moreover, the CNT-DOX-Fe3O4 borne DOX may have secondary roles in enhanced nuclear delivery and nuclear retention which allow DOX to show nuclear presence past the clearance period for free DOX (Supplementary Fig. S7C,D). The proposed nanobot thus present a mechanism for evading drug efflux in cancerous cells and ensuring drug accumulation to achieve its cytotoxic goal.
To highlight the role of TME acidic milieu and H2O2 in the uptake of nanobots, zeta potential of the cells exposed to CNT-DOX-Fe3O4-Tf nanobot was evaluated at two different pH conditions, physiological pH 7.4 and pH 6.5 which exists in TME in presence of H2O2 as shown in Fig. 5C. The HCT116 cells demonstrated a negative surface charge in pH 7.4. However, at lower pH values (pH 6.5), the cells underwent surface charge modifications and exhibited a predominantly positive charge due to protonation of free fatty acid head groups in the outer
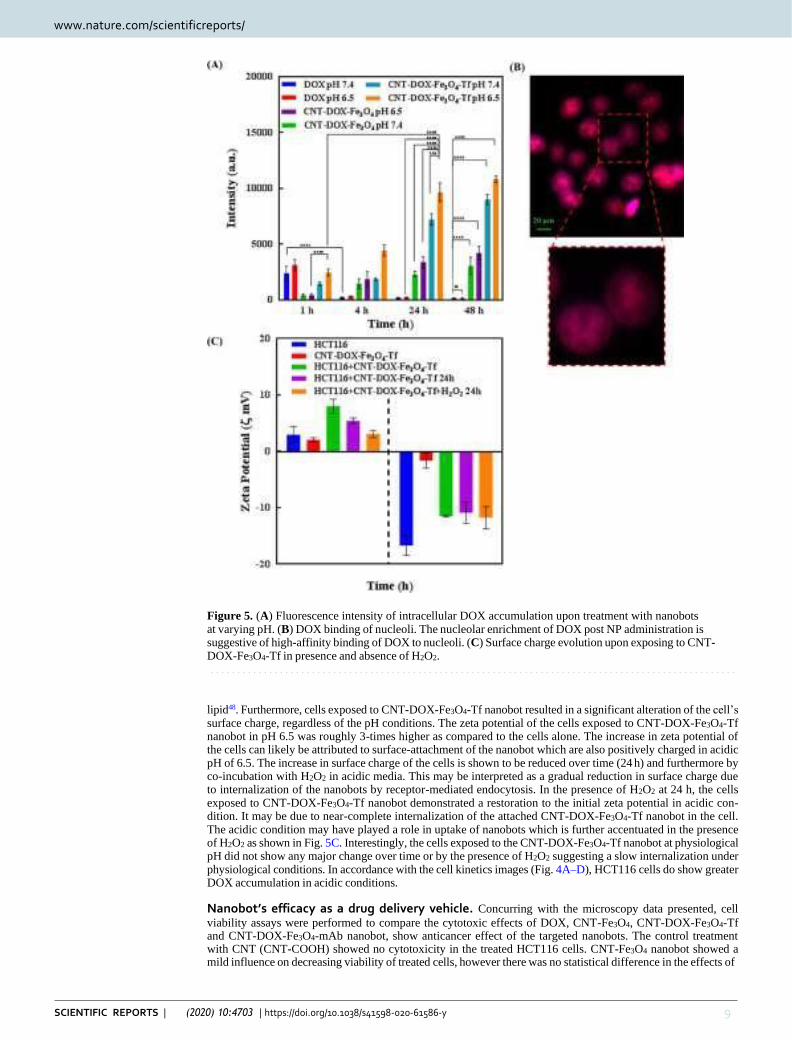
www.nature.com/scientificreports www.nature.com/scientificreports/
9 SCIENTIFIC REPORTS | (2020) 10:4703 | https://doi.org/10.1038/s41598-020-61586-y
Figure 5. (A) Fluorescence intensity of intracellular DOX accumulation upon treatment with nanobots at varying pH. (B) DOX binding of nucleoli. The nucleolar enrichment of DOX post NP administration is suggestive of high-affinity binding of DOX to nucleoli. (C) Surface charge evolution upon exposing to CNT- DOX-Fe3O4-Tf in presence and absence of H2O2.
lipid48. Furthermore, cells exposed to CNT-DOX-Fe3O4-Tf nanobot resulted in a significant alteration of the cell’s surface charge, regardless of the pH conditions. The zeta potential of the cells exposed to CNT-DOX-Fe3O4-Tf nanobot in pH 6.5 was roughly 3-times higher as compared to the cells alone. The increase in zeta potential of the cells can likely be attributed to surface-attachment of the nanobot which are also positively charged in acidic pH of 6.5. The increase in surface charge of the cells is shown to be reduced over time (24 h) and furthermore by co-incubation with H2O2 in acidic media. This may be interpreted as a gradual reduction in surface charge due to internalization of the nanobots by receptor-mediated endocytosis. In the presence of H2O2 at 24 h, the cells exposed to CNT-DOX-Fe3O4-Tf nanobot demonstrated a restoration to the initial zeta potential in acidic con- dition. It may be due to near-complete internalization of the attached CNT-DOX-Fe3O4-Tf nanobot in the cell. The acidic condition may have played a role in uptake of nanobots which is further accentuated in the presence of H2O2 as shown in Fig. 5C. Interestingly, the cells exposed to the CNT-DOX-Fe3O4-Tf nanobot at physiological pH did not show any major change over time or by the presence of H2O2 suggesting a slow internalization under physiological conditions. In accordance with the cell kinetics images (Fig. 4A–D), HCT116 cells do show greater DOX accumulation in acidic conditions.
Nanobot’s efficacy as a drug delivery vehicle. Concurring with the microscopy data presented, cell
viability assays were performed to compare the cytotoxic effects of DOX, CNT-Fe3O4, CNT-DOX-Fe3O4-Tf and CNT-DOX-Fe3O4-mAb nanobot, show anticancer effect of the targeted nanobots. The control treatment with CNT (CNT-COOH) showed no cytotoxicity in the treated HCT116 cells. CNT-Fe3O4 nanobot showed a mild influence on decreasing viability of treated cells, however there was no statistical difference in the effects of
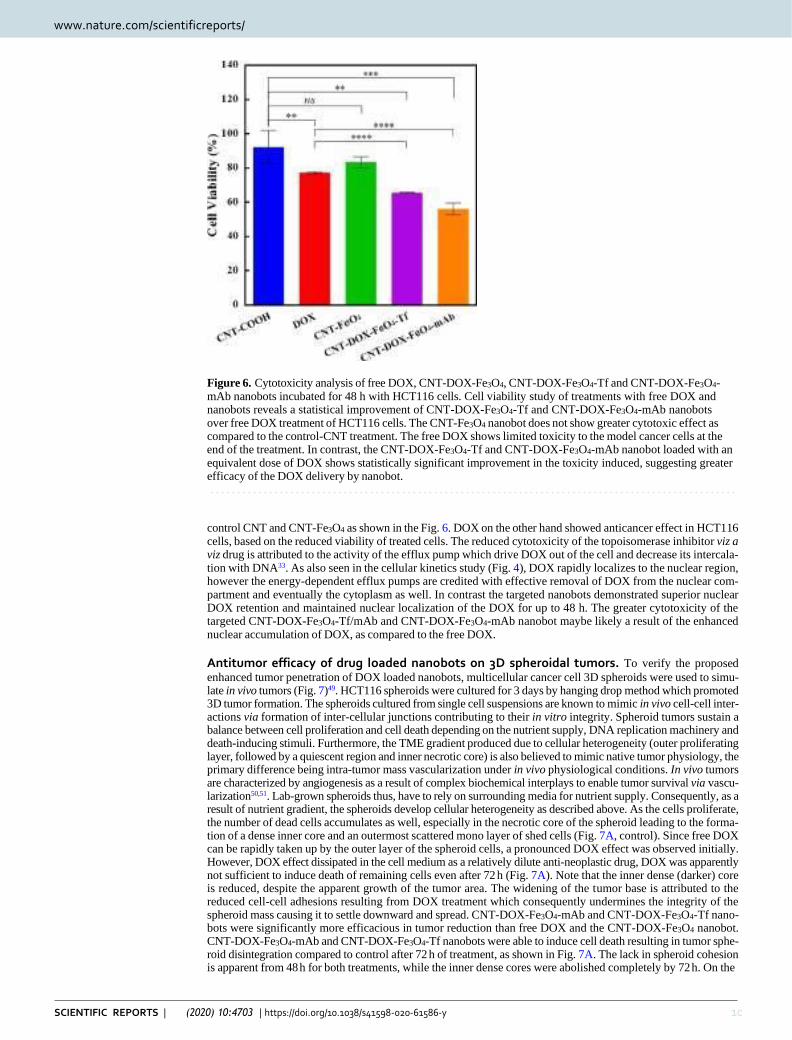
www.nature.com/scientificreports www.nature.com/scientificreports/
10 SCIENTIFIC REPORTS | (2020) 10:4703 | https://doi.org/10.1038/s41598-020-61586-y
Figure 6. Cytotoxicity analysis of free DOX, CNT-DOX-Fe3O4, CNT-DOX-Fe3O4-Tf and CNT-DOX-Fe3O4- mAb nanobots incubated for 48 h with HCT116 cells. Cell viability study of treatments with free DOX and nanobots reveals a statistical improvement of CNT-DOX-Fe3O4-Tf and CNT-DOX-Fe3O4-mAb nanobots over free DOX treatment of HCT116 cells. The CNT-Fe3O4 nanobot does not show greater cytotoxic effect as compared to the control-CNT treatment. The free DOX shows limited toxicity to the model cancer cells at the end of the treatment. In contrast, the CNT-DOX-Fe3O4-Tf and CNT-DOX-Fe3O4-mAb nanobot loaded with an equivalent dose of DOX shows statistically significant improvement in the toxicity induced, suggesting greater efficacy of the DOX delivery by nanobot.
control CNT and CNT-Fe3O4 as shown in the Fig. 6. DOX on the other hand showed anticancer effect in HCT116 cells, based on the reduced viability of treated cells. The reduced cytotoxicity of the topoisomerase inhibitor viz a viz drug is attributed to the activity of the efflux pump which drive DOX out of the cell and decrease its intercala- tion with DNA33. As also seen in the cellular kinetics study (Fig. 4), DOX rapidly localizes to the nuclear region, however the energy-dependent efflux pumps are credited with effective removal of DOX from the nuclear com- partment and eventually the cytoplasm as well. In contrast the targeted nanobots demonstrated superior nuclear DOX retention and maintained nuclear localization of the DOX for up to 48 h. The greater cytotoxicity of the targeted CNT-DOX-Fe3O4-Tf/mAb and CNT-DOX-Fe3O4-mAb nanobot maybe likely a result of the enhanced nuclear accumulation of DOX, as compared to the free DOX.
Antitumor efficacy of drug loaded nanobots on 3D spheroidal tumors. To verify the proposed
enhanced tumor penetration of DOX loaded nanobots, multicellular cancer cell 3D spheroids were used to simu- late in vivo tumors (Fig. 7)49. HCT116 spheroids were cultured for 3 days by hanging drop method which promoted 3D tumor formation. The spheroids cultured from single cell suspensions are known to mimic in vivo cell-cell inter- actions via formation of inter-cellular junctions contributing to their in vitro integrity. Spheroid tumors sustain a balance between cell proliferation and cell death depending on the nutrient supply, DNA replication machinery and death-inducing stimuli. Furthermore, the TME gradient produced due to cellular heterogeneity (outer proliferating layer, followed by a quiescent region and inner necrotic core) is also believed to mimic native tumor physiology, the primary difference being intra-tumor mass vascularization under in vivo physiological conditions. In vivo tumors are characterized by angiogenesis as a result of complex biochemical interplays to enable tumor survival via vascu- larization50,51. Lab-grown spheroids thus, have to rely on surrounding media for nutrient supply. Consequently, as a result of nutrient gradient, the spheroids develop cellular heterogeneity as described above. As the cells proliferate, the number of dead cells accumulates as well, especially in the necrotic core of the spheroid leading to the forma- tion of a dense inner core and an outermost scattered mono layer of shed cells (Fig. 7A, control). Since free DOX can be rapidly taken up by the outer layer of the spheroid cells, a pronounced DOX effect was observed initially. However, DOX effect dissipated in the cell medium as a relatively dilute anti-neoplastic drug, DOX was apparently not sufficient to induce death of remaining cells even after 72 h (Fig. 7A). Note that the inner dense (darker) core is reduced, despite the apparent growth of the tumor area. The widening of the tumor base is attributed to the reduced cell-cell adhesions resulting from DOX treatment which consequently undermines the integrity of the spheroid mass causing it to settle downward and spread. CNT-DOX-Fe3O4-mAb and CNT-DOX-Fe3O4-Tf nano- bots were significantly more efficacious in tumor reduction than free DOX and the CNT-DOX-Fe3O4 nanobot. CNT-DOX-Fe3O4-mAb and CNT-DOX-Fe3O4-Tf nanobots were able to induce cell death resulting in tumor sphe- roid disintegration compared to control after 72 h of treatment, as shown in Fig. 7A. The lack in spheroid cohesion is apparent from 48 h for both treatments, while the inner dense cores were abolished completely by 72 h. On the
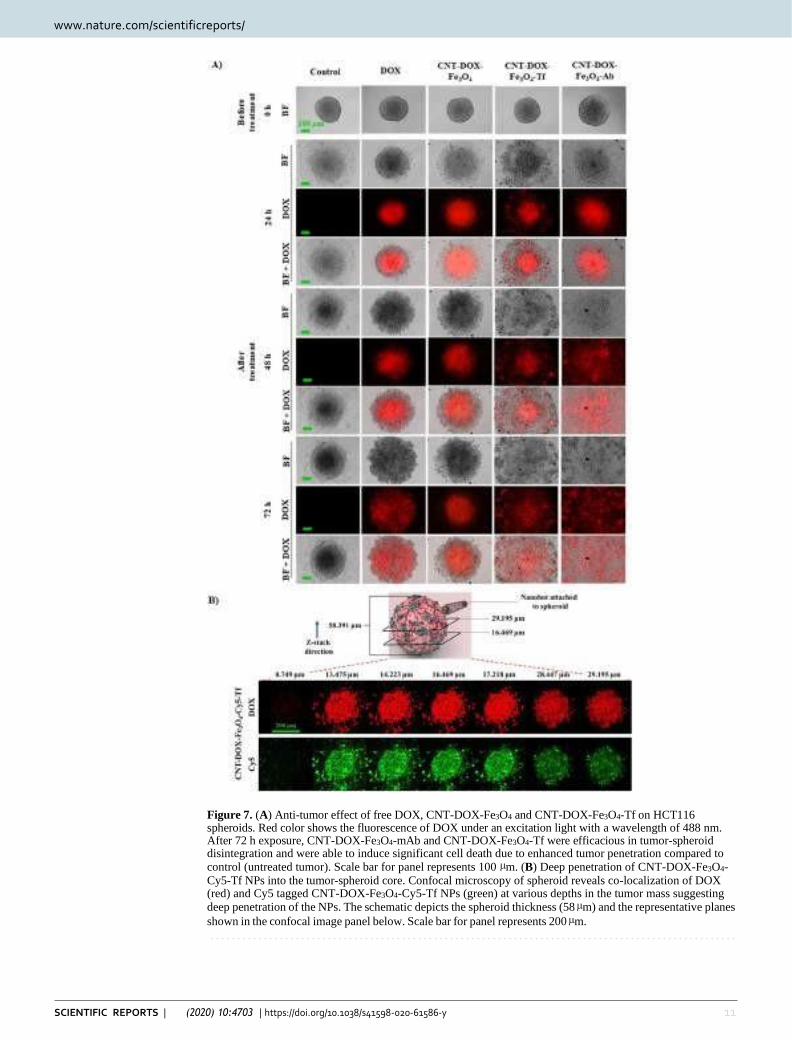
www.nature.com/scientificreports www.nature.com/scientificreports/
11 SCIENTIFIC REPORTS | (2020) 10:4703 | https://doi.org/10.1038/s41598-020-61586-y
Figure 7. (A) Anti-tumor effect of free DOX, CNT-DOX-Fe3O4 and CNT-DOX-Fe3O4-Tf on HCT116 spheroids. Red color shows the fluorescence of DOX under an excitation light with a wavelength of 488 nm. After 72 h exposure, CNT-DOX-Fe3O4-mAb and CNT-DOX-Fe3O4-Tf were efficacious in tumor-spheroid disintegration and were able to induce significant cell death due to enhanced tumor penetration compared to control (untreated tumor). Scale bar for panel represents 100 µm. (B) Deep penetration of CNT-DOX-Fe3O4- Cy5-Tf NPs into the tumor-spheroid core. Confocal microscopy of spheroid reveals co-localization of DOX (red) and Cy5 tagged CNT-DOX-Fe3O4-Cy5-Tf NPs (green) at various depths in the tumor mass suggesting deep penetration of the NPs. The schematic depicts the spheroid thickness (58 µm) and the representative planes
shown in the confocal image panel below. Scale bar for panel represents 200 µm.
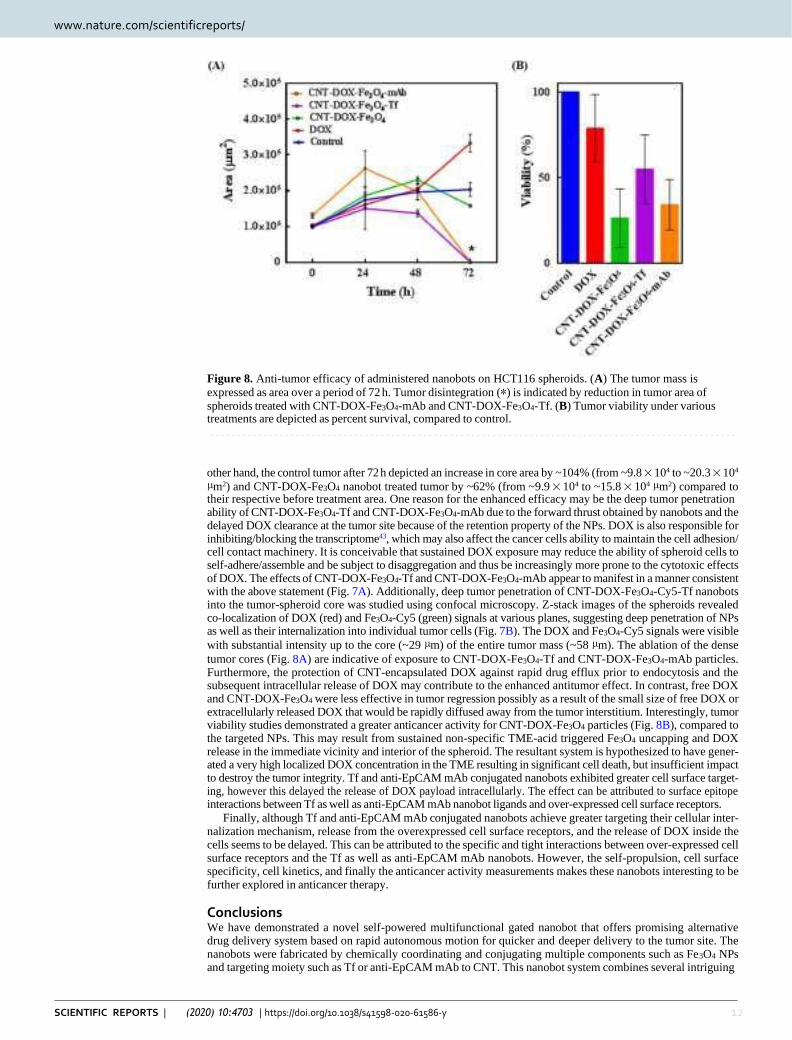
www.nature.com/scientificreports www.nature.com/scientificreports/
12 SCIENTIFIC REPORTS | (2020) 10:4703 | https://doi.org/10.1038/s41598-020-61586-y
Figure 8. Anti-tumor efficacy of administered nanobots on HCT116 spheroids. (A) The tumor mass is
expressed as area over a period of 72 h. Tumor disintegration (*) is indicated by reduction in tumor area of spheroids treated with CNT-DOX-Fe3O4-mAb and CNT-DOX-Fe3O4-Tf. (B) Tumor viability under various treatments are depicted as percent survival, compared to control.
other hand, the control tumor after 72 h depicted an increase in core area by ~104% (from ~9.8 × 10⁴ to ~20.3 × 10⁴
µm2) and CNT-DOX-Fe3O4 nanobot treated tumor by ~62% (from ~9.9 × 10⁴ to ~15.8 × 104 µm2) compared to their respective before treatment area. One reason for the enhanced efficacy may be the deep tumor penetration ability of CNT-DOX-Fe3O4-Tf and CNT-DOX-Fe3O4-mAb due to the forward thrust obtained by nanobots and the delayed DOX clearance at the tumor site because of the retention property of the NPs. DOX is also responsible for inhibiting/blocking the transcriptome43, which may also affect the cancer cells ability to maintain the cell adhesion/ cell contact machinery. It is conceivable that sustained DOX exposure may reduce the ability of spheroid cells to self-adhere/assemble and be subject to disaggregation and thus be increasingly more prone to the cytotoxic effects of DOX. The effects of CNT-DOX-Fe3O4-Tf and CNT-DOX-Fe3O4-mAb appear to manifest in a manner consistent with the above statement (Fig. 7A). Additionally, deep tumor penetration of CNT-DOX-Fe3O4-Cy5-Tf nanobots into the tumor-spheroid core was studied using confocal microscopy. Z-stack images of the spheroids revealed co-localization of DOX (red) and Fe3O4-Cy5 (green) signals at various planes, suggesting deep penetration of NPs as well as their internalization into individual tumor cells (Fig. 7B). The DOX and Fe3O4-Cy5 signals were visible
with substantial intensity up to the core (~29 µm) of the entire tumor mass (~58 µm). The ablation of the dense
tumor cores (Fig. 8A) are indicative of exposure to CNT-DOX-Fe3O4-Tf and CNT-DOX-Fe3O4-mAb particles. Furthermore, the protection of CNT-encapsulated DOX against rapid drug efflux prior to endocytosis and the subsequent intracellular release of DOX may contribute to the enhanced antitumor effect. In contrast, free DOX and CNT-DOX-Fe3O4 were less effective in tumor regression possibly as a result of the small size of free DOX or extracellularly released DOX that would be rapidly diffused away from the tumor interstitium. Interestingly, tumor viability studies demonstrated a greater anticancer activity for CNT-DOX-Fe3O4 particles (Fig. 8B), compared to the targeted NPs. This may result from sustained non-specific TME-acid triggered Fe3O4 uncapping and DOX release in the immediate vicinity and interior of the spheroid. The resultant system is hypothesized to have gener- ated a very high localized DOX concentration in the TME resulting in significant cell death, but insufficient impact to destroy the tumor integrity. Tf and anti-EpCAM mAb conjugated nanobots exhibited greater cell surface target- ing, however this delayed the release of DOX payload intracellularly. The effect can be attributed to surface epitope interactions between Tf as well as anti-EpCAM mAb nanobot ligands and over-expressed cell surface receptors.
Finally, although Tf and anti-EpCAM mAb conjugated nanobots achieve greater targeting their cellular inter- nalization mechanism, release from the overexpressed cell surface receptors, and the release of DOX inside the cells seems to be delayed. This can be attributed to the specific and tight interactions between over-expressed cell surface receptors and the Tf as well as anti-EpCAM mAb nanobots. However, the self-propulsion, cell surface specificity, cell kinetics, and finally the anticancer activity measurements makes these nanobots interesting to be further explored in anticancer therapy.
Conclusions We have demonstrated a novel self-powered multifunctional gated nanobot that offers promising alternative drug delivery system based on rapid autonomous motion for quicker and deeper delivery to the tumor site. The nanobots were fabricated by chemically coordinating and conjugating multiple components such as Fe3O4 NPs and targeting moiety such as Tf or anti-EpCAM mAb to CNT. This nanobot system combines several intriguing
www.nature.com/scientificreports www.nature.com/scientificreports/
13 SCIENTIFIC REPORTS | (2020) 10:4703 | https://doi.org/10.1038/s41598-020-61586-y
features, namely self-propulsion, high DOX loading, tumor targeting and profound penetration ability, in situ pH triggered release of the DOX, and improved drug availability. The CNT-DOX-Fe3O4-Tf nanobots demon-
strated ultrafast self-propulsion (0.972 and 0.535 mm s−1) not only in high ionic media (PBS buffer) but also in
biological media such as DMEM (2.333 and 1.120 mm s−1) and blood serum (8.026 and 1.120 mm s−1), a crucial ability necessary for its use in biomedical applications. The speed of the nanobot in serum was ~8.3 and ~3.4 times the speed seen in PBS and DMEM. The driving force of 592, 1304 and 5435 pN for the nanobot’s upward propulsion was significantly higher. The high driving force and thus higher speed of CNT-DOX-Fe3O4-Tf nano- bot in serum is maybe due to adsorbed serum catalase enzyme which may be imparting additional propulsion by catalytic property and thus enhancing generating of oxygen bubbles. Thus, propulsion of nanobot was also observed in serum with no external H2O2 indicating ability of the nanobot to propel in blood and penetrate tumor by utilizing H2O2 present in the TME. The cellular uptake study showed controlled release of DOX due to opening of pH-sensitive nanogates by cleavage of amide bond in the acidic lysosomal compartments. Further, higher intensity of DOX in nucleus for CNT-DOX-Fe3O4-Tf nanobot indicated not only efficient and steady release of DOX but also superior retentive property of the nanobot carriers. Upon administration to tumor spheroids, CNT-DOX-Fe3O4-Tf and CNT-DOX-Fe3O4-mAb nanobots were significantly more effica- cious in tumor reduction at 72 h than the control groups including free DOX and CNT-DOX-Fe3O4 nanobot. One reason for the enhanced efficacy might be the profound tumor penetration ability due to the propulsion of CNT-DOX-Fe3O4-Tf and CNT-DOX-Fe3O4-mAb nanobots, and the delayed clearance at the tumor site because of the retention property of the NPs. Thus, the synthesized CNT-DOX-Fe3O4-mAb and CNT-DOX-Fe3O4-Tf nanobots would be effective in smaller numbers, designed to selectively and efficaciously deliver the drug pay- load in targeted cancer cells alone within the TME.
Materials and methods Reagents. Multi-walled carbon nanotubes (CNTs) having outer diameter of 10–15 nm; length 1–5 µm; and purity >99%, were purchased from Ad-Nano Technologies, India. Ferric chloride tetrahydrate, ferrous chlo-
ride hexahydrate, transferrin (Tf), N-(3-Dimethylaminopropyl)-N′-ethylcarbodiimide (EDC.HCl), glutathione (GSH) and horeseradish peroxidase (type VI) were purchased from Sigma-Aldrich, USA. Doxorubicin hydro- chloride (DOX) was received as a gift from Naprod Life Sciences, India. Cy5 mono NHS ester was procured from GE Healthcare UK Limited, and LysoTracker Green DND-26 was procured from Invitrogen, Thermo Fisher Scientific. HCT116 cells were obtained from the National Centre for Cell Science, India. McCoy’s 5A, fetal bovine serum (FBS), Penicillin and streptomycin were purchased from Sigma-Aldrich, USA. Ultrapure water (MilliQ) acquired from a Merck Millipore system, Germany, was used throughout. All other chemicals procured were of analytical grade and utilized without further purification.
Functionalization of CNTs (CNT-COOH). CNT was purified and oxidized using a modified literature
procedure52. In brief, 85 mg of CNT was dispersed in 100 mL mixture of H2SO4/HNO3 (3:1) and then sonicated for 6 h. The mixture was diluted with 100 mL ice cold water, concentrated by centrifugation and washed with 5% NaOH solution and ultra-pure water. Resulting functionalized CNT was dried at 80 °C (12 h).
Synthesis of Fe3O4-GSH. Fe3O4 NPs were prepared by co-precipitation of ferric and ferrous ions (2:1) using aqueous ammonium hydroxide solution and then heated at 80 °C for 30 min, washed for several times with ultra-pure water and ethanol and finally dried at 70 °C (4–6 h)53. 5 mg of Fe3O4 NPs were dispersed in 150 µl of
ultra-pure water and 50 µl of methanol and sonicated for 15 min. 4 mg of GSH was dissolved in 50 µl of ultra-pure water, added in above solution and again sonicated for 2 h. The GSH functionalized NPs were then isolated by magnetic separation, washed repeatedly with ultra-pure water and dried well54.
Loading of DOX in CNT-COOH (CNT-DOX). Loading of DOX in CNT-COOH was carried using a mod-
ified procedure previously reported by us24. Briefly, 20 mg of CNT-COOH were suspended in 5 mL solution of DOX (8 mg/mL). The solution was sonicated for 6 h and was allowed to stand for further 12 h. The synthesized product, CNT-DOX was collected by centrifugation and dried well at room temperature.
Synthesis of CNT-DOX-Fe3O4. 20 mg of CNT-DOX and 5 mg of EDC were added in 5 ml of phosphate
buffer (pH 7.4) and then agitated for 30 min. 20 mg of Fe3O4-GSH was added in the same mixture and agitated for another 1 h. The conjugated CNT-DOX-Fe3O4 NPs were magnetically separated, washed extensively with phosphate buffer to remove externally adsorbed DOX and then dried well at 40 °C.
Synthesis of CNT-DOX-Fe3O4-Tf. 10 mg of CNT-DOX-Fe3O4 were treated with 1 mL of EDC and NHS
solution (50 mM each solution in phosphate buffer (pH 7.4). After 30 min of agitation, CNT-DOX-Fe3O4 NPs were separated with magnet and washed with PBS (3 times). 1 mL of Tf solution (5 mg/mL) was added. The reaction was then agitated for 4 h. The synthesized product, CNT-DOX-Fe3O4-Tf NPs were collected by magnetic separa- tion and dried well at room temperature. Similarly, conjugation of anti-EpCAM mAb to CNT-DOX-Fe3O4 NPs was carried out.
Characterization. TEM analysis was carried out using Tecnai FEI G2 (accelerating voltage of 300 kV).
The samples were prepared by placing a drop of CNT-DOX-Fe3O4-Tf suspensions (in DI water) onto a Formvar-covered copper grid. The water was allowed to evaporate in air at room temperature before imaging. FTIR spectral studies were carried out using a Perkin Elmer Fourier Transform Infrared (FTIR) spectrometer,
USA in the range between 4000 and 400 cm−1, with a resolution of 2 cm−1. The UV-Vis absorption spectra were recorded on Agilent Technologies Cary 60 UV spectrophotometer.
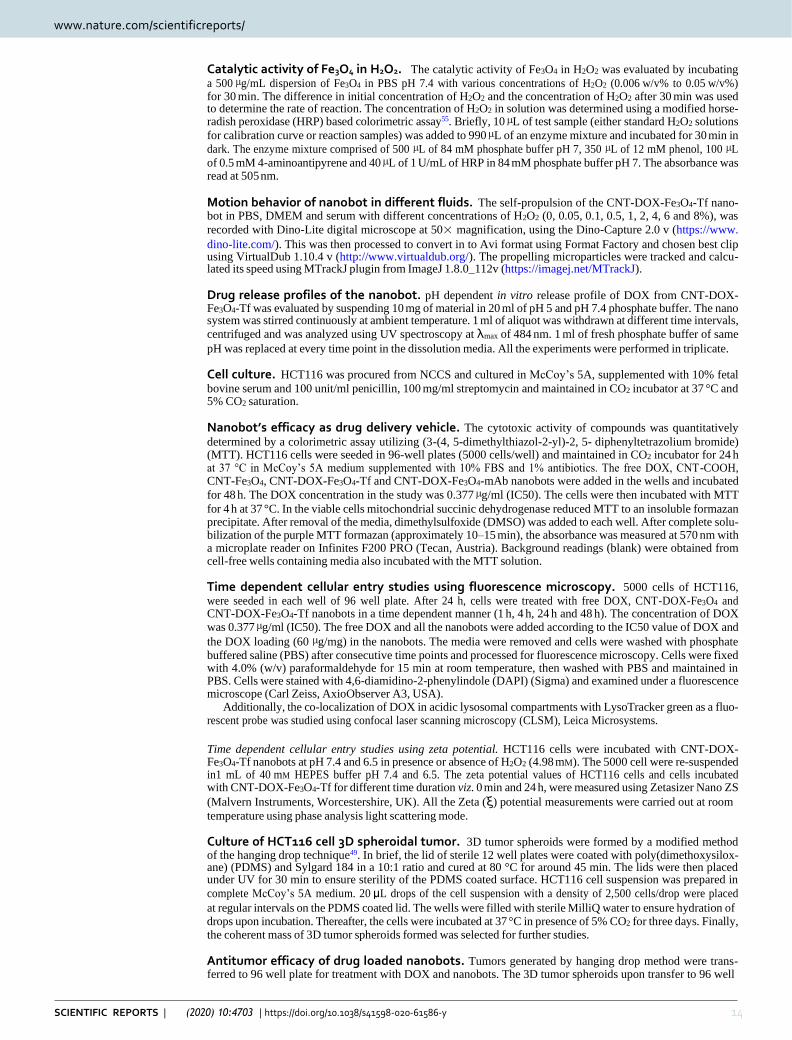
www.nature.com/scientificreports www.nature.com/scientificreports/
14 SCIENTIFIC REPORTS | (2020) 10:4703 | https://doi.org/10.1038/s41598-020-61586-y
Catalytic activity of Fe3O4 in H2O2. The catalytic activity of Fe3O4 in H2O2 was evaluated by incubating
a 500 µg/mL dispersion of Fe3O4 in PBS pH 7.4 with various concentrations of H2O2 (0.006 w/v% to 0.05 w/v%) for 30 min. The difference in initial concentration of H2O2 and the concentration of H2O2 after 30 min was used to determine the rate of reaction. The concentration of H2O2 in solution was determined using a modified horse- radish peroxidase (HRP) based colorimetric assay55. Briefly, 10 µL of test sample (either standard H2O2 solutions
for calibration curve or reaction samples) was added to 990 µL of an enzyme mixture and incubated for 30 min in
dark. The enzyme mixture comprised of 500 µL of 84 mM phosphate buffer pH 7, 350 µL of 12 mM phenol, 100 µL
of 0.5 mM 4-aminoantipyrene and 40 µL of 1 U/mL of HRP in 84 mM phosphate buffer pH 7. The absorbance was read at 505 nm.
Motion behavior of nanobot in different fluids. The self-propulsion of the CNT-DOX-Fe3O4-Tf nano- bot in PBS, DMEM and serum with different concentrations of H2O2 (0, 0.05, 0.1, 0.5, 1, 2, 4, 6 and 8%), was
recorded with Dino-Lite digital microscope at 50× magnification, using the Dino-Capture 2.0 v (https://www.
dino-lite.com/). This was then processed to convert in to Avi format using Format Factory and chosen best clip using VirtualDub 1.10.4 v (http://www.virtualdub.org/). The propelling microparticles were tracked and calcu- lated its speed using MTrackJ plugin from ImageJ 1.8.0_112v (https://imagej.net/MTrackJ).
Drug release profiles of the nanobot. pH dependent in vitro release profile of DOX from CNT-DOX- Fe3O4-Tf was evaluated by suspending 10 mg of material in 20 ml of pH 5 and pH 7.4 phosphate buffer. The nano system was stirred continuously at ambient temperature. 1 ml of aliquot was withdrawn at different time intervals,
centrifuged and was analyzed using UV spectroscopy at λmax of 484 nm. 1 ml of fresh phosphate buffer of same
pH was replaced at every time point in the dissolution media. All the experiments were performed in triplicate.
Cell culture. HCT116 was procured from NCCS and cultured in McCoy’s 5A, supplemented with 10% fetal
bovine serum and 100 unit/ml penicillin, 100 mg/ml streptomycin and maintained in CO2 incubator at 37 °C and 5% CO2 saturation.
Nanobot’s efficacy as drug delivery vehicle. The cytotoxic activity of compounds was quantitatively
determined by a colorimetric assay utilizing (3-(4, 5-dimethylthiazol-2-yl)-2, 5- diphenyltetrazolium bromide) (MTT). HCT116 cells were seeded in 96-well plates (5000 cells/well) and maintained in CO2 incubator for 24 h at 37 °C in McCoy’s 5A medium supplemented with 10% FBS and 1% antibiotics. The free DOX, CNT-COOH, CNT-Fe3O4, CNT-DOX-Fe3O4-Tf and CNT-DOX-Fe3O4-mAb nanobots were added in the wells and incubated
for 48 h. The DOX concentration in the study was 0.377 µg/ml (IC50). The cells were then incubated with MTT
for 4 h at 37 °C. In the viable cells mitochondrial succinic dehydrogenase reduced MTT to an insoluble formazan precipitate. After removal of the media, dimethylsulfoxide (DMSO) was added to each well. After complete solu- bilization of the purple MTT formazan (approximately 10–15 min), the absorbance was measured at 570 nm with a microplate reader on Infinites F200 PRO (Tecan, Austria). Background readings (blank) were obtained from cell-free wells containing media also incubated with the MTT solution.
Time dependent cellular entry studies using fluorescence microscopy. 5000 cells of HCT116,
were seeded in each well of 96 well plate. After 24 h, cells were treated with free DOX, CNT-DOX-Fe3O4 and CNT-DOX-Fe3O4-Tf nanobots in a time dependent manner (1 h, 4 h, 24 h and 48 h). The concentration of DOX was 0.377 µg/ml (IC50). The free DOX and all the nanobots were added according to the IC50 value of DOX and
the DOX loading (60 µg/mg) in the nanobots. The media were removed and cells were washed with phosphate buffered saline (PBS) after consecutive time points and processed for fluorescence microscopy. Cells were fixed with 4.0% (w/v) paraformaldehyde for 15 min at room temperature, then washed with PBS and maintained in PBS. Cells were stained with 4,6-diamidino-2-phenylindole (DAPI) (Sigma) and examined under a fluorescence microscope (Carl Zeiss, AxioObserver A3, USA).
Additionally, the co-localization of DOX in acidic lysosomal compartments with LysoTracker green as a fluo- rescent probe was studied using confocal laser scanning microscopy (CLSM), Leica Microsystems.
Time dependent cellular entry studies using zeta potential. HCT116 cells were incubated with CNT-DOX- Fe3O4-Tf nanobots at pH 7.4 and 6.5 in presence or absence of H2O2 (4.98 mM). The 5000 cell were re-suspended in1 mL of 40 mM HEPES buffer pH 7.4 and 6.5. The zeta potential values of HCT116 cells and cells incubated with CNT-DOX-Fe3O4-Tf for different time duration viz. 0 min and 24 h, were measured using Zetasizer Nano ZS
(Malvern Instruments, Worcestershire, UK). All the Zeta (ξ) potential measurements were carried out at room
temperature using phase analysis light scattering mode.
Culture of HCT116 cell 3D spheroidal tumor. 3D tumor spheroids were formed by a modified method of the hanging drop technique49. In brief, the lid of sterile 12 well plates were coated with poly(dimethoxysilox- ane) (PDMS) and Sylgard 184 in a 10:1 ratio and cured at 80 °C for around 45 min. The lids were then placed under UV for 30 min to ensure sterility of the PDMS coated surface. HCT116 cell suspension was prepared in
complete McCoy’s 5A medium. 20 μL drops of the cell suspension with a density of 2,500 cells/drop were placed
at regular intervals on the PDMS coated lid. The wells were filled with sterile MilliQ water to ensure hydration of drops upon incubation. Thereafter, the cells were incubated at 37 °C in presence of 5% CO2 for three days. Finally, the coherent mass of 3D tumor spheroids formed was selected for further studies.
Antitumor efficacy of drug loaded nanobots. Tumors generated by hanging drop method were trans- ferred to 96 well plate for treatment with DOX and nanobots. The 3D tumor spheroids upon transfer to 96 well
www.nature.com/scientificreports www.nature.com/scientificreports/
15 SCIENTIFIC REPORTS | (2020) 10:4703 | https://doi.org/10.1038/s41598-020-61586-y
plate were immediately treated with free DOX (5 µg/mL) and nanobots containing equivalent DOX for 72 h. The
images of tumors were captured using Carl Zeiss, AxioObserver A3, USA, USA inverted fluorescence micro- scope. The exposure time while capturing bright field images was fixed at 100 ms and the exposure time while capturing fluorescence images was fixed at 400 ms.
Furthermore, the viability of tumors after 72 h was analyzed by MTT assay following similar protocol men- tioned earlier. Similarly, for CLSM the 3D tumor spheroids were transferred to a glass bottom well plate before
capturing z-stack images. The z-stack images were captured at intervals of 0.75 µm.
Received: 20 December 2019; Accepted: 24 February 2020;
References 1. Tu, Y., Peng, F., White, P. B. & Wilson, D. A. Redox-Sensitive Stomatocyte Nanomotors: Destruction and Drug Release in the
Presence of Glutathione. Angew. Chemie Int. Ed. 56, 7620–7624 (2017).
2. Li, J. et al. Micromotors Spontaneously Neutralize Gastric Acid for pH-Responsive Payload Release. Angew. Chemie Int. Ed. 56, 2156–2161 (2017).
3. de Ávila, B. E.-F. et al. Micromotor-enabled active drug delivery for in vivo treatment of stomach infection. Nat. Commun. 8, 272 (2017).
4. Hortelão, A. C., Patiño, T., Perez-Jiménez, A., Blanco, À. & Sánchez, S. Enzyme-Powered Nanobots Enhance Anticancer Drug Delivery. Adv. Funct. Mater. 28, 1705086 (2018).
5. Tu, Y. et al. Biodegradable Hybrid Stomatocyte Nanomotors for Drug Delivery. ACS Nano 11, 1957–1963 (2017).
6. Li, J., Esteban-Fernández de Ávila, B., Gao, W., Zhang, L. & Wang, J. Micro/nanorobots for biomedicine: Delivery, surgery, sensing, and detoxification. Sci. Robot. 2, eaam6431 (2017).
7. Yan, X. et al. Multifunctional biohybrid magnetite microrobots for imaging-guided therapy. Sci. Robot. 2, eaaq1155 (2017).
8. Nelson, B. J., Kaliakatsos, I. K. & Abbott, J. J. Microrobots for Minimally Invasive Medicine. Annu. Rev. Biomed. Eng. 12, 55–85 (2010).
9. Wang, J. & Gao, W. Nano/Microscale Motors: Biomedical Opportunities and Challenges. ACS Nano 6, 5745–5751 (2012).
10. Gao, W. et al. Artificial Micromotors in the Mouse’s Stomach: A Step toward in Vivo Use of Synthetic Motors. ACS Nano 9, 117–123 (2015).
11. Peng, F., Tu, Y., van Hest, J. C. M. & Wilson, D. A. Self-Guided Supramolecular Cargo-Loaded Nanomotors with Chemotactic Behavior towards. Cells. Angew. Chemie 127, 11828–11831 (2015).
12. Wang, H. & Pumera, M. Fabrication of Micro/Nanoscale Motors. Chem. Rev. 115, 8704–8735 (2015). 13. Sánchez, S., Soler, L. & Katuri, J. Chemically Powered Micro- and Nanomotors. Angew. Chemie Int. Ed. 54, 1414–1444 (2015). 14. Wang, H. & Pumera, M. Emerging materials for the fabrication of micro/nanomotors. Nanoscale 9, 2109–2116 (2017).
15. Zhang, Q., Wang, N., Ma, M., Luo, Y. & Chen, H. Transferrin Receptor‐Mediated Sequential Intercellular Nanoparticles Relay for Tumor Deep Penetration and Sonodynamic Therapy. Adv. Ther. 2, 1800152 (2019).
16. Zhang, Q. et al. Inlaying radiosensitizer onto the polypeptide shell of drug-loaded ferritin for imaging and combinational chemo- radiotherapy. Theranostics 9, 2779–2790 (2019).
17. Luo, M., Feng, Y., Wang, T. & Guan, J. Micro-/Nanorobots at Work in Active Drug Delivery. Adv. Funct. Mater. 28, 1706100 (2018).
18. Wu, Y., Wu, Z., Lin, X., He, Q. & Li, J. Autonomous Movement of Controllable Assembled Janus Capsule Motors. ACS Nano 6, 10910–10916 (2012).
19. Peng, F., Tu, Y. & Wilson, D. A. Micro/nanomotors towards in vivo application: cell, tissue and biofluid. Chem. Soc. Rev. 46, 5289–5310 (2017).
20. Sitti, M. et al. Biomedical Applications of Untethered Mobile Milli/Microrobots. Proc. IEEE 103, 205–224 (2015).
21. Szatrowski, T. P. & Nathan, C. F. Production of Large Amounts of Hydrogen Peroxide by Human Tumor Cells. Cancer Res. 51, 794–798 (1991).
22. Sun, Y.-P., Fu, K., Lin, Y. & Huang, W. Functionalized Carbon Nanotubes: Properties and Applications. Acc. Chem. Res. 35, 1096–1104 (2002).
23. Kostarelos, K. The long and short of carbon nanotube toxicity. Nat. Biotechnol. 26, 774–776 (2008).
24. Banerjee, S. S. et al. Calcium phosphate nanocapsule crowned multiwalled carbon nanotubes for pH triggered intracellular anticancer drug release. J. Mater. Chem. B 3, 3931–3939 (2015).
25. Sun, C. et al. PEG-mediated synthesis of highly dispersive multifunctional superparamagnetic nanoparticles: their physicochemical properties and function in vivo. ACS Nano 4, 2402–10 (2010).
26. Halliwell, B., Clement, M. V. & Long, L. H. Hydrogen peroxide in the human body. FEBS Lett. 486, 10–3 (2000). 27. Veal, E. A., Day, A. M. & Morgan, B. A. Hydrogen Peroxide Sensing and Signaling. Mol. Cell 26, 1–14 (2007).
28. Lacy, F., O’Connor, D. T. & Schmid-Schönbein, G. W. Plasma hydrogen peroxide production in hypertensives and normotensive subjects at genetic risk of hypertension. J. Hypertens. 16, 291–303 (1998).
29. Lisanti, M. P. et al. Hydrogen peroxide fuels aging, inflammation, cancer metabolism and metastasis. Cell Cycle 10, 2440–2449 (2011).
30. Vilema-Enríquez, G., Arroyo, A., Grijalva, M., Amador-Zafra, R. I. & Camacho, J. Molecular and Cellular Effects of Hydrogen Peroxide on Human Lung Cancer Cells. Potential Therapeutic Implications. Oxid. Med. Cell. Longev. 2016, 1–12 (2016).
31. Liu, S.-L. et al. Reactive oxygen species stimulated human hepatoma cell proliferation via cross-talk between PI3-K/PKB and JNK signaling pathways. Arch. Biochem. Biophys. 406, 173–82 (2002).
32. Park, I.-J., Hwang, J.-T., Kim, Y. M., Ha, J. & Park, O. J. Differential Modulation of AMPK Signaling Pathways by Low or High Levels of Exogenous Reactive Oxygen Species in Colon Cancer Cells. Ann. N. Y. Acad. Sci. 1091, 102–109 (2006).
33. Dartier, J. et al. ATP-dependent activity and mitochondrial localization of drug efflux pumps in doxorubicin-resistant breast cancer cells. Biochim. Biophys. Acta - Gen. Subj. 1861, 1075–1084 (2017).
34. Mirzaei, H. & Regnier, F. Protein:protein aggregation induced by protein oxidation. J. Chromatogr. B 873, 8–14 (2008). 35. Sabuncu, A. C. et al. Probing nanoparticle interactions in cell culture media. Colloids Surfaces B Biointerfaces 95, 96–102 (2012).
36. Weids, A. J., Ibstedt, S., Tamás, M. J. & Grant, C. M. Distinct stress conditions result in aggregation of proteins with similar properties. Sci. Rep. 6, 24554 (2016).
37. Khandare, J. J. et al. PEG-conjugated highly dispersive multifunctional magnetic multi-walled carbon nanotubes for cellular imaging. Nanoscale 4, 837–844 (2012).
38. Allen, B. L. et al. Mechanistic Investigations of Horseradish Peroxidase-Catalyzed Degradation of Single-Walled Carbon Nanotubes. J. Am. Chem. Soc. 131, 17194–17205 (2009).
39. Ma, X., Hortelão, A. C., Patiño, T. & Sánchez, S. Enzyme Catalysis To Power Micro/Nanomachines. ACS Nano 10, 9111–9122 (2016). 40. Orozco, J. et al. Artificial Enzyme-Powered Microfish for Water-Quality Testing. ACS Nano 7, 818–824 (2013). 41. Shankar, R. et al. Cathepsin B Degradable Star-Shaped Peptidic Macromolecules for Delivery of 2-Methoxyestradiol. Mol. Pharm.
10, 3776–3788 (2013).
Published: xx xx xxxx
www.nature.com/scientificreports www.nature.com/scientificreports/
16 SCIENTIFIC REPORTS | (2020) 10:4703 | https://doi.org/10.1038/s41598-020-61586-y
42. Chae, S. et al. Encapsulation and Enhanced Delivery of Topoisomerase I Inhibitors in Functionalized Carbon Nanotubes. ACS Omega 3, 5938–5945 (2018).
43. Thorn, C. F. et al. Doxorubicin pathways. Pharmacogenet. Genomics 21, 440–446 (2011).
44. Kiyomiya, K., Matsuo, S. & Kurebe, M. Proteasome is a carrier to translocate doxorubicin from cytoplasm into nucleus. Life Sci. 62, 1853–1860 (1998).
45. Liu, J., Zheng, H., Tang, M., Ryu, Y.-C. & Wang, X. A therapeutic dose of doxorubicin activates ubiquitin-proteasome system- mediated proteolysis by acting on both the ubiquitination apparatus and proteasome. Am. J. Physiol. Circ. Physiol. 295, H2541–H2550 (2008).
46. Munoz, M., Henderson, M., Haber, M. & Norris, M. Role of the MRP1/ABCC1 Multidrug Transporter Protein in Cancer. IUBMB Life 59, 752–757 (2007).
47. Thorstensen, K. & Romslo, I. The role of transferrin in the mechanism of cellular iron uptake. Biochem. J. 271, 1–9 (1990).
48. Lähdesmäki, K., Ollila, O. H. S., Koivuniemi, A., Kovanen, P. T. & Hyvönen, M. T. Membrane simulations mimicking acidic pH reveal increased thickness and negative curvature in a bilayer consisting of lysophosphatidylcholines and free fatty acids. Biochim. Biophys. Acta - Biomembr. 1798, 938–946 (2010).
49. Kuo, C.-T. et al. Three-dimensional spheroid culture targeting versatile tissue bioassays using a PDMS-based hanging drop array. Sci. Rep. 7, 4363 (2017).
50. Hillen, F. & Griffioen, A. W. Tumour vascularization: sprouting angiogenesis and beyond. Cancer Metastasis Rev. 26, 489–502 (2007).
51. Liao, D. & Johnson, R. S. Hypoxia: A key regulator of angiogenesis in cancer. Cancer Metastasis Rev. 26, 281–290 (2007).
52. Zhou, M. et al. Doxorubicin-Loaded Single Wall Nanotube Thermo-Sensitive Hydrogel for Gastric Cancer Chemo-Photothermal Therapy. Adv. Funct. Mater. 25, 4730–4739 (2015).
53. Banerjee, S. S. & Chen, D.-H. Magnetic Nanoparticles Grafted with Cyclodextrin for Hydrophobic Drug Delivery. Chem. Mater. 19, 6345–6349 (2007).
54. Polshettiwar, V., Baruwati, B. & Varma, R. S. Magnetic nanoparticle-supported glutathione: A conceptually sustainable organocatalyst. Chem. Commun. 14, 1837–1839 (2009).
55. Fernando, C. D. & Soysa, P. Optimized enzymatic colorimetric assay for determination of hydrogen peroxide (H2O2) scavenging activity of plant extracts. MethodsX 2, 283–291 (2015).
Acknowledgements We acknowledge financial support from Department of Biotechnology, Government of India and Department of Science and Technology, Government of India.
Author contributions S.S.B. and J.J.K. conceived the idea and designed the research. S.S.B., J.J.K., R.D.W., K.D.D. and Y.N.P co-analyzed the experimental and calculated data. S.S.B., J.J.K., S.S.A., R.D.W., G.P.C. and Y.N.P. contributed to the writing and editing of the manuscript. R.D.W. prepared the nanobots and also performed the motion experiments. K.D.D. performed the in vitro cellular entry and cytotoxicity studies. B.V.T. supported the experiments on TEM characterization. S.S.A. supported all in vitro tumor experiments. S.S.B. directed the project. All authors reviewed the manuscript.
Competing interests The authors declare no competing interests.
Additional information Supplementary information is available for this paper at https://doi.org/10.1038/s41598-020-61586-y.
Correspondence and requests for materials should be addressed to J.J.K. or S.S.B.
Reprints and permissions information is available at www.nature.com/reprints.
Publisher’s note Springer Nature remains neutral with regard to jurisdictional claims in published maps and institutional affiliations.
Open Access This article is licensed under a Creative Commons Attribution 4.0 International License, which permits use, sharing, adaptation, distribution and reproduction in any medium or
format, as long as you give appropriate credit to the original author(s) and the source, provide a link to the Cre- ative Commons license, and indicate if changes were made. The images or other third party material in this article are included in the article’s Creative Commons license, unless indicated otherwise in a credit line to the material. If material is not included in the article’s Creative Commons license and your intended use is not per- mitted by statutory regulation or exceeds the permitted use, you will need to obtain permission directly from the copyright holder. To view a copy of this license, visit http://creativecommons.org/licenses/by/4.0/.
© The Author(s) 2020
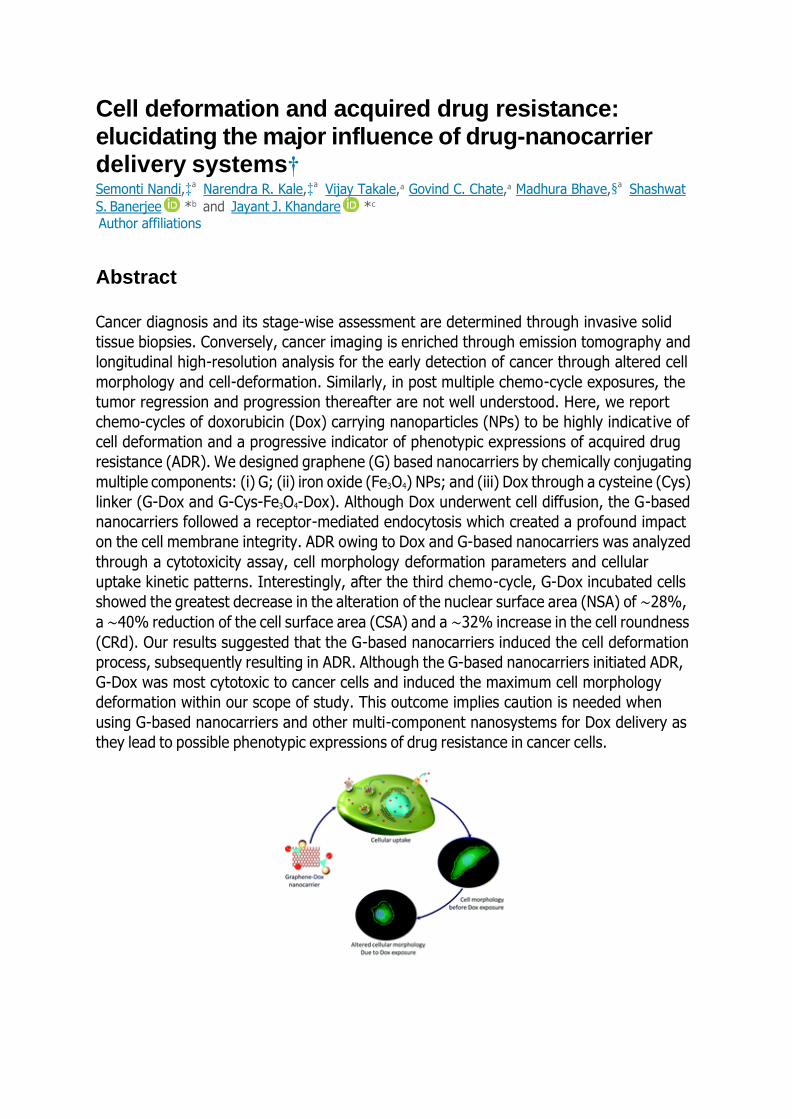
Cell deformation and acquired drug resistance: elucidating the major influence of drug-nanocarrier delivery systems† Semonti Nandi,‡a Narendra R. Kale,‡a Vijay Takale,a Govind C. Chate,a Madhura Bhave,§a Shashwat
S. Banerjee *b and Jayant J. Khandare *c
Author affiliations
Abstract
Cancer diagnosis and its stage-wise assessment are determined through invasive solid
tissue biopsies. Conversely, cancer imaging is enriched through emission tomography and
longitudinal high-resolution analysis for the early detection of cancer through altered cell
morphology and cell-deformation. Similarly, in post multiple chemo-cycle exposures, the
tumor regression and progression thereafter are not well understood. Here, we report
chemo-cycles of doxorubicin (Dox) carrying nanoparticles (NPs) to be highly indicative of
cell deformation and a progressive indicator of phenotypic expressions of acquired drug
resistance (ADR). We designed graphene (G) based nanocarriers by chemically conjugating
multiple components: (i) G; (ii) iron oxide (Fe3O4) NPs; and (iii) Dox through a cysteine (Cys)
linker (G-Dox and G-Cys-Fe3O4-Dox). Although Dox underwent cell diffusion, the G-based
nanocarriers followed a receptor-mediated endocytosis which created a profound impact
on the cell membrane integrity. ADR owing to Dox and G-based nanocarriers was analyzed
through a cytotoxicity assay, cell morphology deformation parameters and cellular
uptake kinetic patterns. Interestingly, after the third chemo-cycle, G-Dox incubated cells
showed the greatest decrease in the alteration of the nuclear surface area (NSA) of ∼28%,
a ∼40% reduction of the cell surface area (CSA) and a ∼32% increase in the cell roundness
(CRd). Our results suggested that the G-based nanocarriers induced the cell deformation
process, subsequently resulting in ADR. Although the G-based nanocarriers initiated ADR,
G-Dox was most cytotoxic to cancer cells and induced the maximum cell morphology
deformation within our scope of study. This outcome implies caution is needed when
using G-based nanocarriers and other multi-component nanosystems for Dox delivery as
they lead to possible phenotypic expressions of drug resistance in cancer cells.
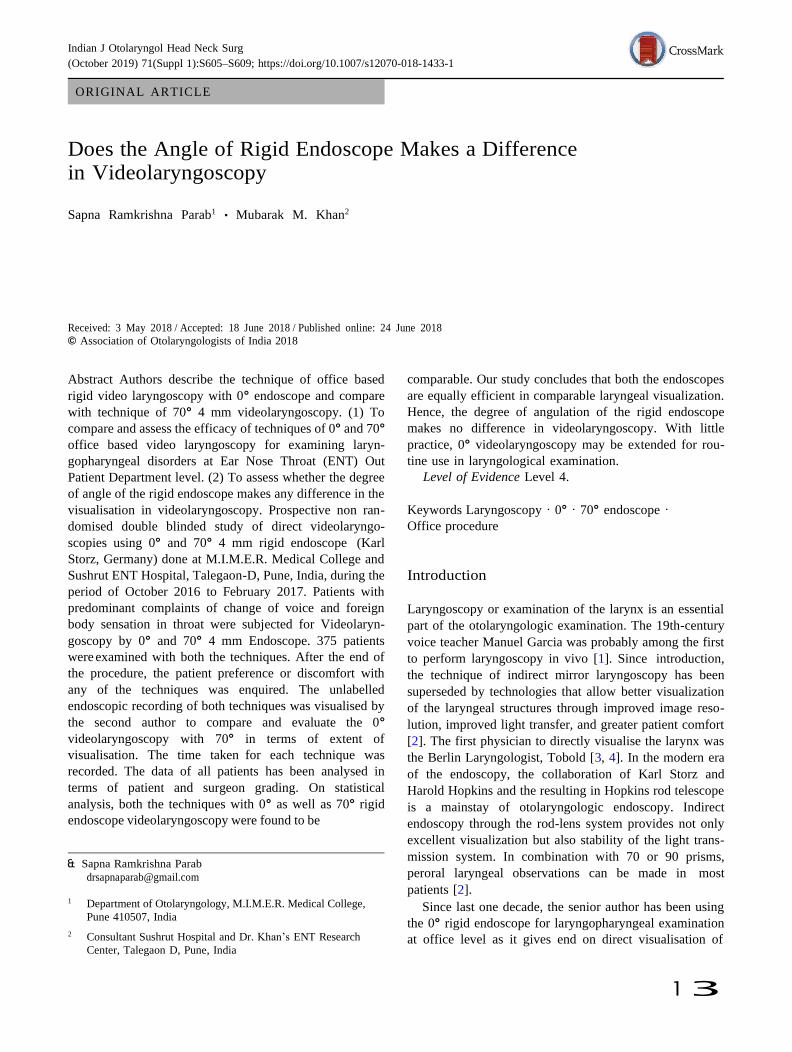
1 3
ORIGINAL ARTICLE
Indian J Otolaryngol Head Neck Surg
(October 2019) 71(Suppl 1):S605–S609; https://doi.org/10.1007/s12070-018-1433-1
Does the Angle of Rigid Endoscope Makes a Difference in Videolaryngoscopy
Sapna Ramkrishna Parab1 • Mubarak M. Khan2
Received: 3 May 2018 / Accepted: 18 June 2018 / Published online: 24 June 2018
© Association of Otolaryngologists of India 2018
Abstract Authors describe the technique of office based
rigid video laryngoscopy with 0° endoscope and compare
with technique of 70° 4 mm videolaryngoscopy. (1) To
compare and assess the efficacy of techniques of 0° and 70°
office based video laryngoscopy for examining laryn-
gopharyngeal disorders at Ear Nose Throat (ENT) Out
Patient Department level. (2) To assess whether the degree
of angle of the rigid endoscope makes any difference in the
visualisation in videolaryngoscopy. Prospective non ran-
domised double blinded study of direct videolaryngo-
scopies using 0° and 70° 4 mm rigid endoscope (Karl
Storz, Germany) done at M.I.M.E.R. Medical College and
Sushrut ENT Hospital, Talegaon-D, Pune, India, during the
period of October 2016 to February 2017. Patients with
predominant complaints of change of voice and foreign
body sensation in throat were subjected for Videolaryn-
goscopy by 0° and 70° 4 mm Endoscope. 375 patients
were examined with both the techniques. After the end of
the procedure, the patient preference or discomfort with
any of the techniques was enquired. The unlabelled
endoscopic recording of both techniques was visualised by
the second author to compare and evaluate the 0°
videolaryngoscopy with 70° in terms of extent of
visualisation. The time taken for each technique was
recorded. The data of all patients has been analysed in
terms of patient and surgeon grading. On statistical
analysis, both the techniques with 0° as well as 70° rigid
endoscope videolaryngoscopy were found to be
& Sapna Ramkrishna Parab
1 Department of Otolaryngology, M.I.M.E.R. Medical College,
Pune 410507, India
2 Consultant Sushrut Hospital and Dr. Khan’s ENT Research
Center, Talegaon D, Pune, India
comparable. Our study concludes that both the endoscopes
are equally efficient in comparable laryngeal visualization.
Hence, the degree of angulation of the rigid endoscope
makes no difference in videolaryngoscopy. With little
practice, 0° videolaryngoscopy may be extended for rou-
tine use in laryngological examination.
Level of Evidence Level 4.
Keywords Laryngoscopy · 0° · 70° endoscope ·
Office procedure
Introduction
Laryngoscopy or examination of the larynx is an essential
part of the otolaryngologic examination. The 19th-century
voice teacher Manuel Garcia was probably among the first
to perform laryngoscopy in vivo [1]. Since introduction,
the technique of indirect mirror laryngoscopy has been
superseded by technologies that allow better visualization
of the laryngeal structures through improved image reso-
lution, improved light transfer, and greater patient comfort
[2]. The first physician to directly visualise the larynx was
the Berlin Laryngologist, Tobold [3, 4]. In the modern era
of the endoscopy, the collaboration of Karl Storz and
Harold Hopkins and the resulting in Hopkins rod telescope
is a mainstay of otolaryngologic endoscopy. Indirect
endoscopy through the rod-lens system provides not only
excellent visualization but also stability of the light trans-
mission system. In combination with 70 or 90 prisms,
peroral laryngeal observations can be made in most
patients [2].
Since last one decade, the senior author has been using
the 0° rigid endoscope for laryngopharyngeal examination
at office level as it gives end on direct visualisation of
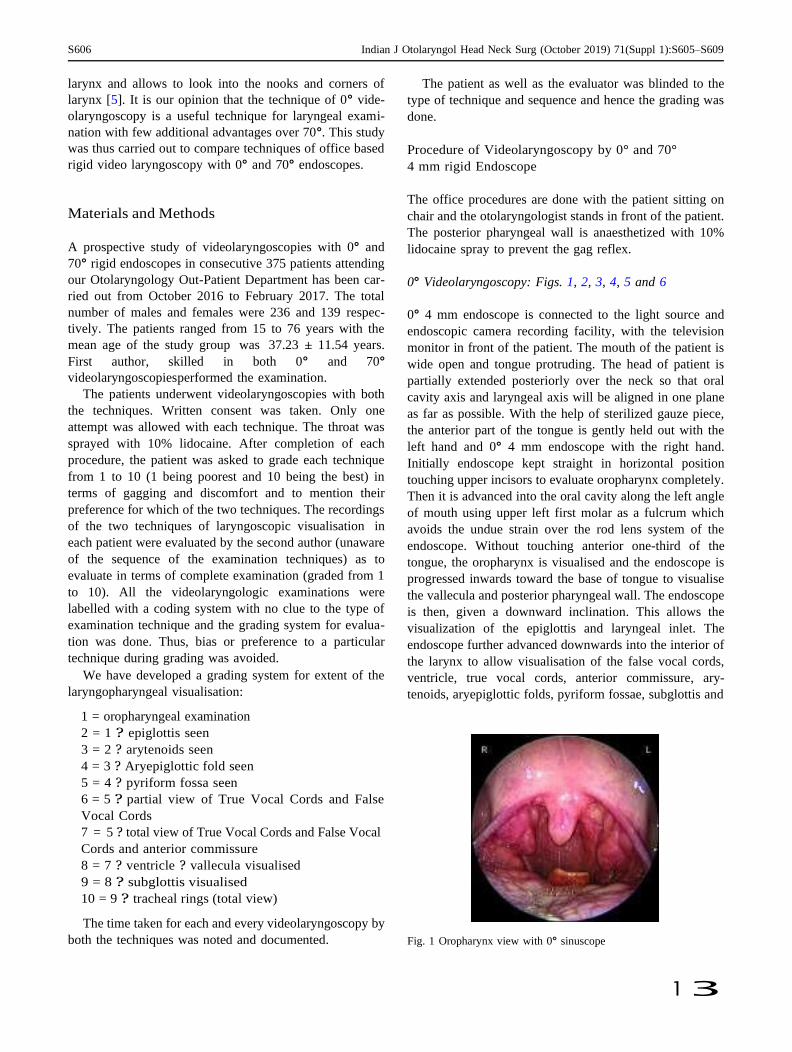
1 3
S606 Indian J Otolaryngol Head Neck Surg (October 2019) 71(Suppl 1):S605–S609
larynx and allows to look into the nooks and corners of
larynx [5]. It is our opinion that the technique of 0° vide-
olaryngoscopy is a useful technique for laryngeal exami-
nation with few additional advantages over 70°. This study
was thus carried out to compare techniques of office based
rigid video laryngoscopy with 0° and 70° endoscopes.
Materials and Methods
A prospective study of videolaryngoscopies with 0° and
70° rigid endoscopes in consecutive 375 patients attending
our Otolaryngology Out-Patient Department has been car-
ried out from October 2016 to February 2017. The total
number of males and females were 236 and 139 respec-
tively. The patients ranged from 15 to 76 years with the
mean age of the study group was 37.23 ± 11.54 years.
First author, skilled in both 0° and 70°
videolaryngoscopies performed the examination.
The patients underwent videolaryngoscopies with both
the techniques. Written consent was taken. Only one
attempt was allowed with each technique. The throat was
sprayed with 10% lidocaine. After completion of each
procedure, the patient was asked to grade each technique
from 1 to 10 (1 being poorest and 10 being the best) in
terms of gagging and discomfort and to mention their
preference for which of the two techniques. The recordings
of the two techniques of laryngoscopic visualisation in
each patient were evaluated by the second author (unaware
of the sequence of the examination techniques) as to
evaluate in terms of complete examination (graded from 1
to 10). All the videolaryngologic examinations were
labelled with a coding system with no clue to the type of
examination technique and the grading system for evalua-
tion was done. Thus, bias or preference to a particular
technique during grading was avoided.
We have developed a grading system for extent of the
laryngopharyngeal visualisation:
1 = oropharyngeal examination
2 = 1 ? epiglottis seen
3 = 2 ? arytenoids seen
4 = 3 ? Aryepiglottic fold seen
5 = 4 ? pyriform fossa seen
6 = 5 ? partial view of True Vocal Cords and False
Vocal Cords
7 = 5 ? total view of True Vocal Cords and False Vocal
Cords and anterior commissure
8 = 7 ? ventricle ? vallecula visualised
9 = 8 ? subglottis visualised
10 = 9 ? tracheal rings (total view)
The time taken for each and every videolaryngoscopy by
both the techniques was noted and documented.
The patient as well as the evaluator was blinded to the
type of technique and sequence and hence the grading was
done.
Procedure of Videolaryngoscopy by 0° and 70°
4 mm rigid Endoscope
The office procedures are done with the patient sitting on
chair and the otolaryngologist stands in front of the patient.
The posterior pharyngeal wall is anaesthetized with 10%
lidocaine spray to prevent the gag reflex.
0° Videolaryngoscopy: Figs. 1, 2, 3, 4, 5 and 6
0° 4 mm endoscope is connected to the light source and
endoscopic camera recording facility, with the television
monitor in front of the patient. The mouth of the patient is
wide open and tongue protruding. The head of patient is
partially extended posteriorly over the neck so that oral
cavity axis and laryngeal axis will be aligned in one plane
as far as possible. With the help of sterilized gauze piece,
the anterior part of the tongue is gently held out with the
left hand and 0° 4 mm endoscope with the right hand.
Initially endoscope kept straight in horizontal position
touching upper incisors to evaluate oropharynx completely.
Then it is advanced into the oral cavity along the left angle
of mouth using upper left first molar as a fulcrum which
avoids the undue strain over the rod lens system of the
endoscope. Without touching anterior one-third of the
tongue, the oropharynx is visualised and the endoscope is
progressed inwards toward the base of tongue to visualise
the vallecula and posterior pharyngeal wall. The endoscope
is then, given a downward inclination. This allows the
visualization of the epiglottis and laryngeal inlet. The
endoscope further advanced downwards into the interior of
the larynx to allow visualisation of the false vocal cords,
ventricle, true vocal cords, anterior commissure, ary-
tenoids, aryepiglottic folds, pyriform fossae, subglottis and
Fig. 1 Oropharynx view with 0° sinuscope
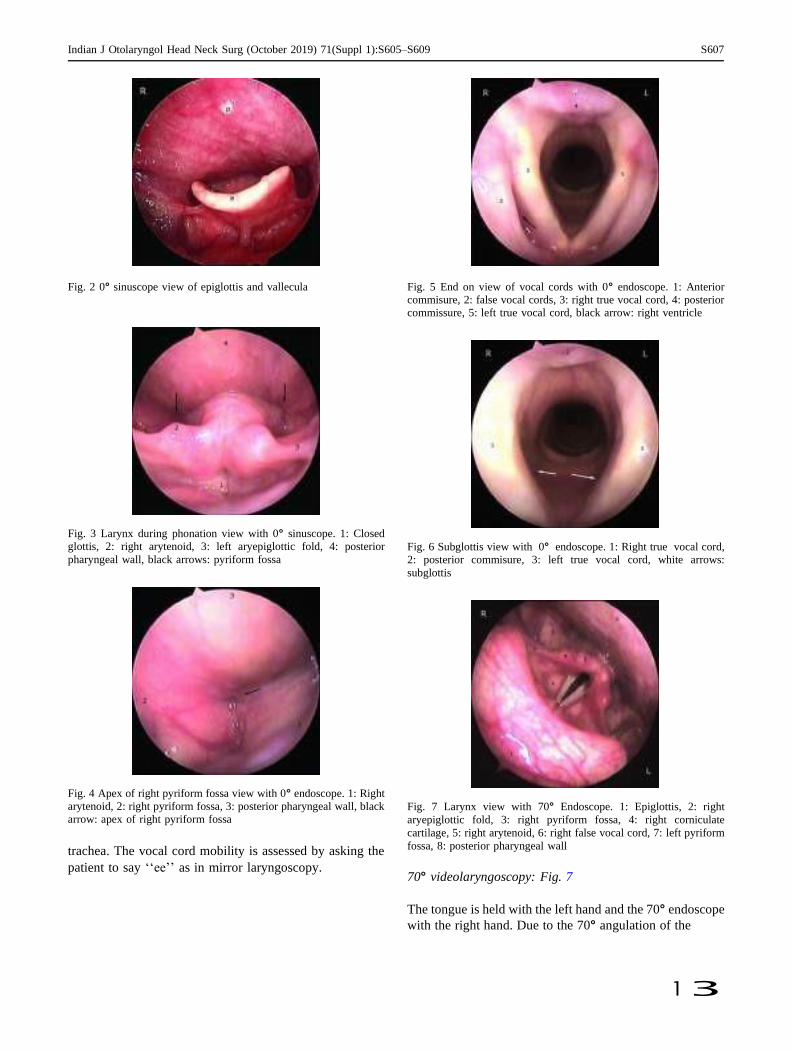
Indian J Otolaryngol Head Neck Surg (October 2019) 71(Suppl 1):S605–S609 S607
1 3
Fig. 2 0° sinuscope view of epiglottis and vallecula
Fig. 3 Larynx during phonation view with 0° sinuscope. 1: Closed
glottis, 2: right arytenoid, 3: left aryepiglottic fold, 4: posterior
pharyngeal wall, black arrows: pyriform fossa
Fig. 4 Apex of right pyriform fossa view with 0° endoscope. 1: Right
arytenoid, 2: right pyriform fossa, 3: posterior pharyngeal wall, black
arrow: apex of right pyriform fossa
trachea. The vocal cord mobility is assessed by asking the
patient to say ‘‘ee’’ as in mirror laryngoscopy.
Fig. 5 End on view of vocal cords with 0° endoscope. 1: Anterior
commisure, 2: false vocal cords, 3: right true vocal cord, 4: posterior
commissure, 5: left true vocal cord, black arrow: right ventricle
Fig. 6 Subglottis view with 0° endoscope. 1: Right true vocal cord,
2: posterior commisure, 3: left true vocal cord, white arrows:
subglottis
Fig. 7 Larynx view with 70° Endoscope. 1: Epiglottis, 2: right
aryepiglottic fold, 3: right pyriform fossa, 4: right corniculate
cartilage, 5: right arytenoid, 6: right false vocal cord, 7: left pyriform
fossa, 8: posterior pharyngeal wall
70° videolaryngoscopy: Fig. 7
The tongue is held with the left hand and the 70° endoscope
with the right hand. Due to the 70° angulation of the
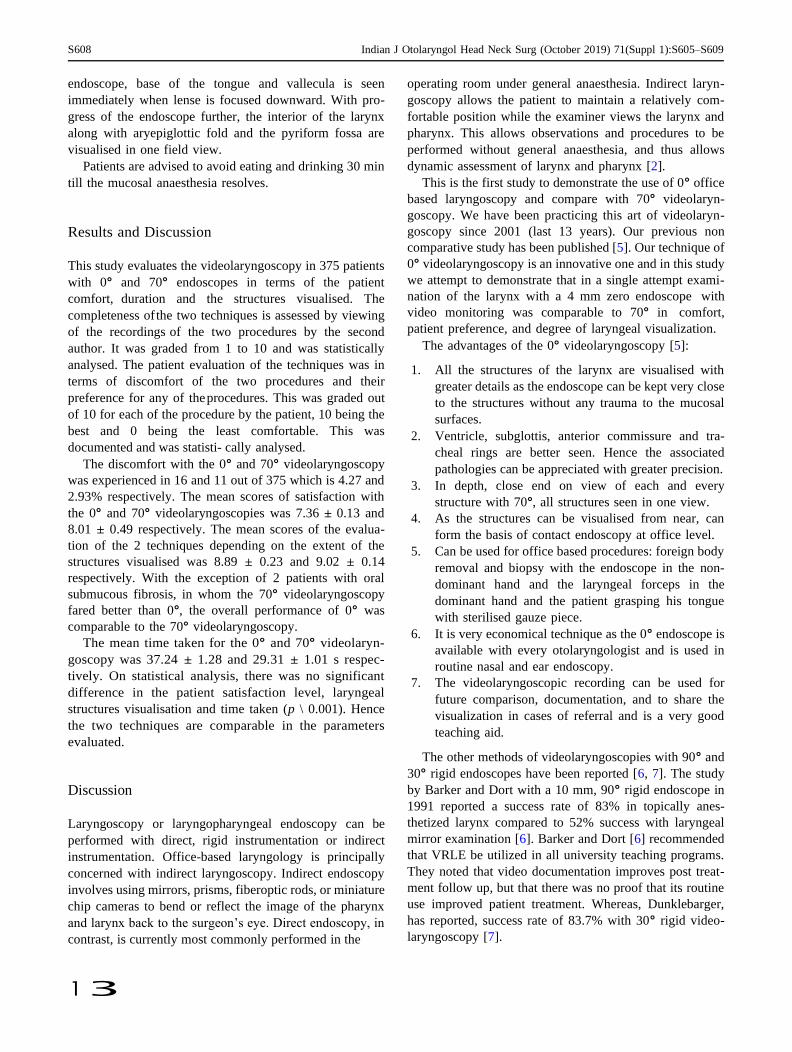
S608 Indian J Otolaryngol Head Neck Surg (October 2019) 71(Suppl 1):S605–S609
1 3
endoscope, base of the tongue and vallecula is seen
immediately when lense is focused downward. With pro-
gress of the endoscope further, the interior of the larynx
along with aryepiglottic fold and the pyriform fossa are
visualised in one field view.
Patients are advised to avoid eating and drinking 30 min
till the mucosal anaesthesia resolves.
Results and Discussion
This study evaluates the videolaryngoscopy in 375 patients
with 0° and 70° endoscopes in terms of the patient
comfort, duration and the structures visualised. The
completeness of the two techniques is assessed by viewing
of the recordings of the two procedures by the second
author. It was graded from 1 to 10 and was statistically
analysed. The patient evaluation of the techniques was in
terms of discomfort of the two procedures and their
preference for any of the procedures. This was graded out
of 10 for each of the procedure by the patient, 10 being the
best and 0 being the least comfortable. This was
documented and was statisti- cally analysed.
The discomfort with the 0° and 70° videolaryngoscopy
was experienced in 16 and 11 out of 375 which is 4.27 and
2.93% respectively. The mean scores of satisfaction with
the 0° and 70° videolaryngoscopies was 7.36 ± 0.13 and
8.01 ± 0.49 respectively. The mean scores of the evalua-
tion of the 2 techniques depending on the extent of the
structures visualised was 8.89 ± 0.23 and 9.02 ± 0.14
respectively. With the exception of 2 patients with oral
submucous fibrosis, in whom the 70° videolaryngoscopy
fared better than 0°, the overall performance of 0° was
comparable to the 70° videolaryngoscopy.
The mean time taken for the 0° and 70° videolaryn-
goscopy was 37.24 ± 1.28 and 29.31 ± 1.01 s respec-
tively. On statistical analysis, there was no significant
difference in the patient satisfaction level, laryngeal
structures visualisation and time taken (p \ 0.001). Hence
the two techniques are comparable in the parameters
evaluated.
Discussion
Laryngoscopy or laryngopharyngeal endoscopy can be
performed with direct, rigid instrumentation or indirect
instrumentation. Office-based laryngology is principally
concerned with indirect laryngoscopy. Indirect endoscopy
involves using mirrors, prisms, fiberoptic rods, or miniature
chip cameras to bend or reflect the image of the pharynx
and larynx back to the surgeon’s eye. Direct endoscopy, in
contrast, is currently most commonly performed in the
operating room under general anaesthesia. Indirect laryn-
goscopy allows the patient to maintain a relatively com-
fortable position while the examiner views the larynx and
pharynx. This allows observations and procedures to be
performed without general anaesthesia, and thus allows
dynamic assessment of larynx and pharynx [2].
This is the first study to demonstrate the use of 0° office
based laryngoscopy and compare with 70° videolaryn-
goscopy. We have been practicing this art of videolaryn-
goscopy since 2001 (last 13 years). Our previous non
comparative study has been published [5]. Our technique of
0° videolaryngoscopy is an innovative one and in this study
we attempt to demonstrate that in a single attempt exami-
nation of the larynx with a 4 mm zero endoscope with
video monitoring was comparable to 70° in comfort,
patient preference, and degree of laryngeal visualization.
The advantages of the 0° videolaryngoscopy [5]:
1. All the structures of the larynx are visualised with
greater details as the endoscope can be kept very close
to the structures without any trauma to the mucosal
surfaces.
2. Ventricle, subglottis, anterior commissure and tra-
cheal rings are better seen. Hence the associated
pathologies can be appreciated with greater precision.
3. In depth, close end on view of each and every
structure with 70°, all structures seen in one view.
4. As the structures can be visualised from near, can
form the basis of contact endoscopy at office level.
5. Can be used for office based procedures: foreign body
removal and biopsy with the endoscope in the non-
dominant hand and the laryngeal forceps in the
dominant hand and the patient grasping his tongue
with sterilised gauze piece.
6. It is very economical technique as the 0° endoscope is
available with every otolaryngologist and is used in
routine nasal and ear endoscopy.
7. The videolaryngoscopic recording can be used for
future comparison, documentation, and to share the
visualization in cases of referral and is a very good
teaching aid.
The other methods of videolaryngoscopies with 90° and
30° rigid endoscopes have been reported [6, 7]. The study
by Barker and Dort with a 10 mm, 90° rigid endoscope in
1991 reported a success rate of 83% in topically anes-
thetized larynx compared to 52% success with laryngeal
mirror examination [6]. Barker and Dort [6] recommended
that VRLE be utilized in all university teaching programs.
They noted that video documentation improves post treat-
ment follow up, but that there was no proof that its routine
use improved patient treatment. Whereas, Dunklebarger,
has reported, success rate of 83.7% with 30° rigid video-
laryngoscopy [7].
Indian J Otolaryngol Head Neck Surg (October 2019) 71(Suppl 1):S605–S609 S609
1 3
At present, the Voice Subspecialty in most of the
institutions utilize video archiving of all laryngeal exami-
nations with either rigid endoscopy, utilizing primarily the
10-mm 90 endoscope or video flexible fiberoptic laryn-
goscopy or both, frequently complemented with strobo-
scopic evaluation [6].
Conclusion
In this non randomised double blinded study, we attempt to
demonstrate the use of 0° videolaryngoscopy at office
setup. Our study concludes that both the endoscopes were
equally efficient in comparable laryngeal visualization.
Though, learning the technique of 0° videolaryngoscopy
requires effort, but definitely can be mastered with practice
as any other art in clinical medicine. Hence it is evident
that the degree of angulation of the rigid endoscope makes
no difference in videolaryngoscopy. With little practice, 0°
videolaryngoscopy use may be extended for routine use in
the Out Patient Department. We believe that this technique
may form the basis for further development of office based
contact laryngoscopy and endoscopic laryngeal surgery
with further study.
Compliance with Ethical Standards
Conflict of interest The authors declare that they have no conflict of
interest.
References
1. Merati AL, Rieder AA (2003) Normal endoscopic anatomy of the
pharynx and larynx. Am J Med 115(3):10–14
2. Rosen CA, Amin MR, Sulica L et al (2009) Advances in office-
based diagnosis and treatment in laryngology. Laryngoscope
119:S185–S212
3. Jahn A, Blitzer A (1996) A short history of laryngoscopy. Logoped
Phonatr Vocol 21(3–4):181–185
4. Tobold A (1863) Lehrbuch Der Laryngoskopie Und Des Local-
therapeutischen Verfahrens Bei Kehlkopfkrankheiten. Verlag von
August Hirschwald, Berlin
5. Khan MM, Parab SR. Office based direct videolaryngoscopy using
a 0° 4 mm sinuscope. World articles in ENT.
http://www.waent.org/archives/2011/Vol4-1/20110201-direct-
laryngoscopy/fiberoptic-direct-largngoscopy.htm
6. Barker M, Dort JC (1991) Laryngeal examination: a comparison of
mirror examination with a rigid lens system. J Otolaryngol
20:100–103
7. Dunklebarger J, Rhee D, Kim S et al (2009) Video rigid laryngeal
endoscopy compared to laryngeal mirror examination: an assess-
ment of patient comfort and clinical visualization. The Laryngo-
scope 119:269–271
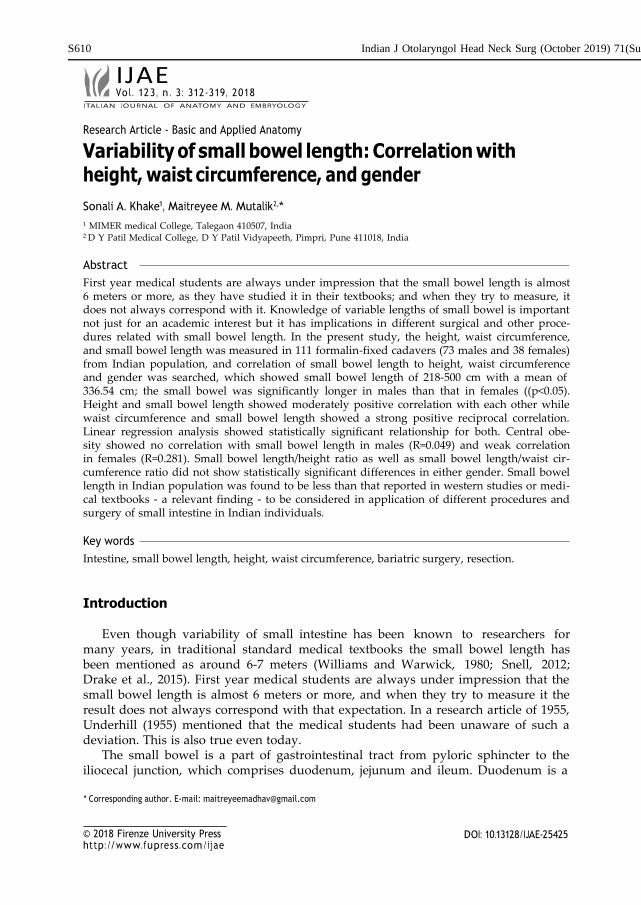
S610 Indian J Otolaryngol Head Neck Surg (October 2019) 71(Suppl 1):S605–S609
ITALIAN JOUR NAL OF ANATOMY AND EMBRYOLOGY
Research Article - Basic and Applied Anatomy
Variability of small bowel length: Correlation with height, waist circumference, and gender
Sonali A. Khake1, Maitreyee M. Mutalik2,*
1 MIMER medical College, Talegaon 410507, India 2 D Y Patil Medical College, D Y Patil Vidyapeeth, Pimpri, Pune 411018, India
Abstract
First year medical students are always under impression that the small bowel length is almost 6 meters or more, as they have studied it in their textbooks; and when they try to measure, it does not always correspond with it. Knowledge of variable lengths of small bowel is important not just for an academic interest but it has implications in different surgical and other proce- dures related with small bowel length. In the present study, the height, waist circumference, and small bowel length was measured in 111 formalin-fixed cadavers (73 males and 38 females) from Indian population, and correlation of small bowel length to height, waist circumference and gender was searched, which showed small bowel length of 218-500 cm with a mean of 336.54 cm; the small bowel was significantly longer in males than that in females ((p<0.05). Height and small bowel length showed moderately positive correlation with each other while waist circumference and small bowel length showed a strong positive reciprocal correlation. Linear regression analysis showed statistically significant relationship for both. Central obe- sity showed no correlation with small bowel length in males (R=0.049) and weak correlation in females (R=0.281). Small bowel length/height ratio as well as small bowel length/waist cir- cumference ratio did not show statistically significant differences in either gender. Small bowel length in Indian population was found to be less than that reported in western studies or medi- cal textbooks - a relevant finding - to be considered in application of different procedures and surgery of small intestine in Indian individuals.
Key words
Intestine, small bowel length, height, waist circumference, bariatric surgery, resection.
Introduction
Even though variability of small intestine has been known to researchers for many years, in traditional standard medical textbooks the small bowel length has been mentioned as around 6-7 meters (Williams and Warwick, 1980; Snell, 2012; Drake et al., 2015). First year medical students are always under impression that the small bowel length is almost 6 meters or more, and when they try to measure it the result does not always correspond with that expectation. In a research article of 1955, Underhill (1955) mentioned that the medical students had been unaware of such a deviation. This is also true even today.
The small bowel is a part of gastrointestinal tract from pyloric sphincter to the iliocecal junction, which comprises duodenum, jejunum and ileum. Duodenum is a
* Corresponding author. E-mail: [email protected]
© 2018 Firenze University Press http: //www.fupress.com/ijae
DOI: 10.13128/IJAE-25425
IJAE Vo l . 123 , n . 3: 312-319, 2018
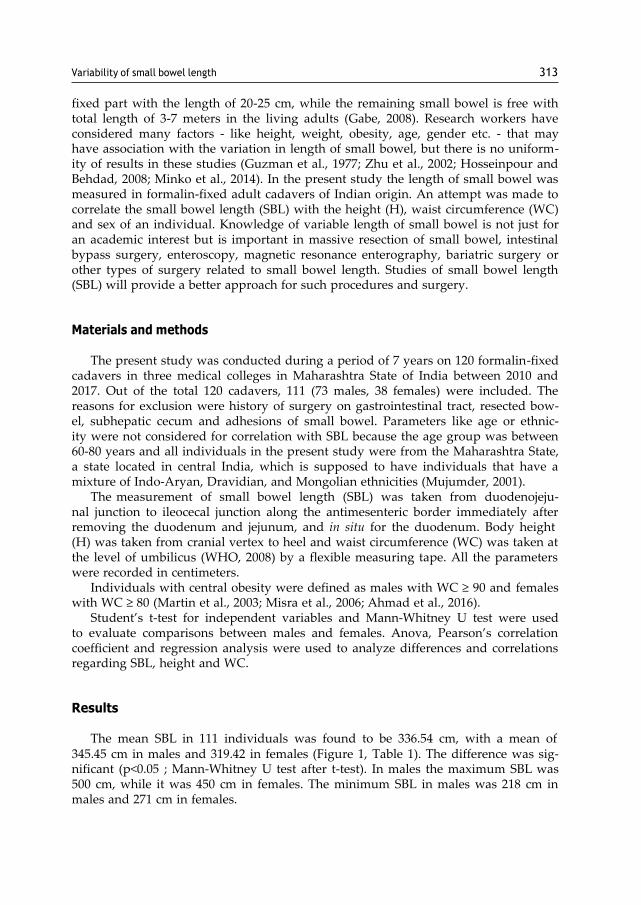
313 Variability of small bowel length
fixed part with the length of 20-25 cm, while the remaining small bowel is free with total length of 3-7 meters in the living adults (Gabe, 2008). Research workers have considered many factors - like height, weight, obesity, age, gender etc. - that may have association with the variation in length of small bowel, but there is no uniform- ity of results in these studies (Guzman et al., 1977; Zhu et al., 2002; Hosseinpour and Behdad, 2008; Minko et al., 2014). In the present study the length of small bowel was measured in formalin-fixed adult cadavers of Indian origin. An attempt was made to correlate the small bowel length (SBL) with the height (H), waist circumference (WC) and sex of an individual. Knowledge of variable length of small bowel is not just for an academic interest but is important in massive resection of small bowel, intestinal bypass surgery, enteroscopy, magnetic resonance enterography, bariatric surgery or other types of surgery related to small bowel length. Studies of small bowel length (SBL) will provide a better approach for such procedures and surgery.
Materials and methods
The present study was conducted during a period of 7 years on 120 formalin-fixed cadavers in three medical colleges in Maharashtra State of India between 2010 and 2017. Out of the total 120 cadavers, 111 (73 males, 38 females) were included. The reasons for exclusion were history of surgery on gastrointestinal tract, resected bow- el, subhepatic cecum and adhesions of small bowel. Parameters like age or ethnic- ity were not considered for correlation with SBL because the age group was between 60-80 years and all individuals in the present study were from the Maharashtra State, a state located in central India, which is supposed to have individuals that have a mixture of Indo-Aryan, Dravidian, and Mongolian ethnicities (Mujumder, 2001).
The measurement of small bowel length (SBL) was taken from duodenojeju- nal junction to ileocecal junction along the antimesenteric border immediately after removing the duodenum and jejunum, and in situ for the duodenum. Body height (H) was taken from cranial vertex to heel and waist circumference (WC) was taken at the level of umbilicus (WHO, 2008) by a flexible measuring tape. All the parameters were recorded in centimeters.
Individuals with central obesity were defined as males with WC ≥ 90 and females with WC ≥ 80 (Martin et al., 2003; Misra et al., 2006; Ahmad et al., 2016).
Student’s t-test for independent variables and Mann-Whitney U test were used to evaluate comparisons between males and females. Anova, Pearson’s correlation coefficient and regression analysis were used to analyze differences and correlations regarding SBL, height and WC.
Results
The mean SBL in 111 individuals was found to be 336.54 cm, with a mean of 345.45 cm in males and 319.42 in females (Figure 1, Table 1). The difference was sig- nificant (p<0.05 ; Mann-Whitney U test after t-test). In males the maximum SBL was 500 cm, while it was 450 cm in females. The minimum SBL in males was 218 cm in males and 271 cm in females.
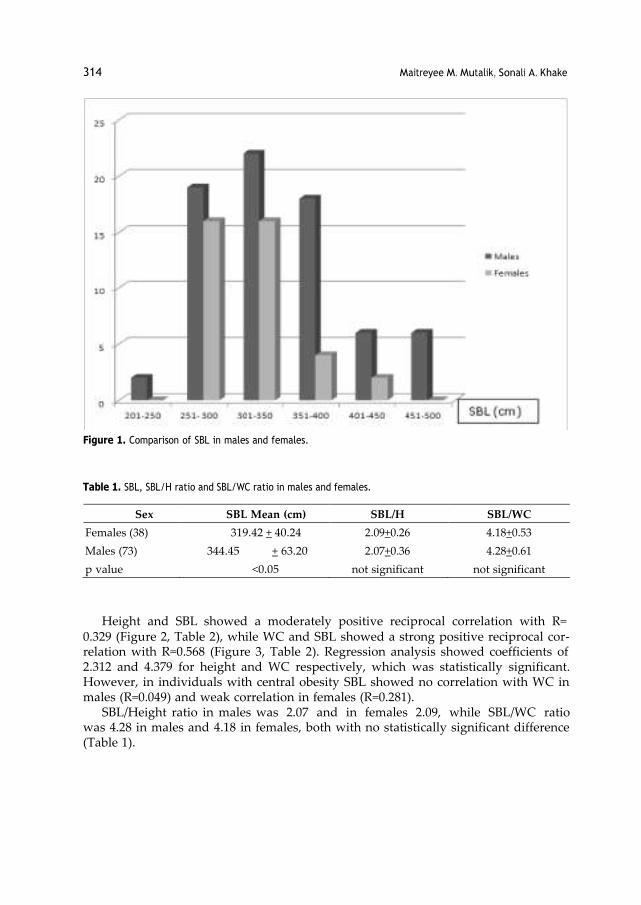
314 Maitreyee M. Mutalik, Sonali A. Khake
Figure 1. Comparison of SBL in males and females.
Table 1. SBL, SBL/H ratio and SBL/WC ratio in males and females.
Sex SBL Mean (cm) SBL/H SBL/WC
Females (38) 319.42 + 40.24 2.09+0.26 4.18+0.53
Males (73) 344.45 + 63.20 2.07+0.36 4.28+0.61
p value <0.05 not significant not significant
Height and SBL showed a moderately positive reciprocal correlation with R=
0.329 (Figure 2, Table 2), while WC and SBL showed a strong positive reciprocal cor- relation with R=0.568 (Figure 3, Table 2). Regression analysis showed coefficients of 2.312 and 4.379 for height and WC respectively, which was statistically significant. However, in individuals with central obesity SBL showed no correlation with WC in males (R=0.049) and weak correlation in females (R=0.281).
SBL/Height ratio in males was 2.07 and in females 2.09, while SBL/WC ratio was 4.28 in males and 4.18 in females, both with no statistically significant difference (Table 1).
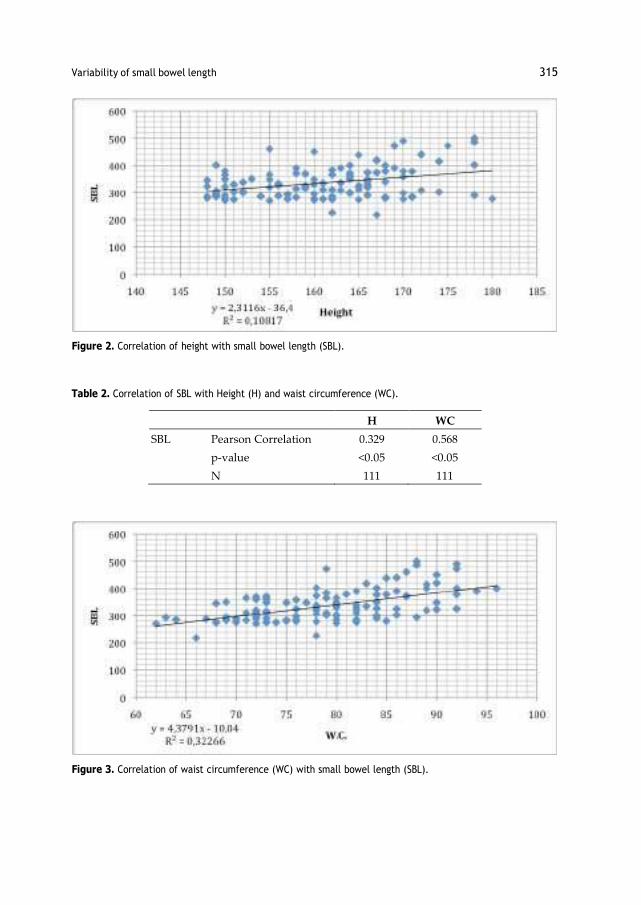
315 Variability of small bowel length
Figure 2. Correlation of height with small bowel length (SBL).
Table 2. Correlation of SBL with Height (H) and waist circumference (WC).
H WC
SBL Pearson Correlation 0.329 0.568
p-value <0.05 <0.05
N 111 111
Figure 3. Correlation of waist circumference (WC) with small bowel length (SBL).

316 Maitreyee M. Mutalik, Sonali A. Khake
Discussion
Gray’s Anatomy, 40th edition, mentions small bowel length of 3-7 meters with an average of 5 meters in living adults (Gabe, 2008). Most of the European or American studies also showed average SBL to be around 6 meters or more e.g. 575 cm (Weav- er et al., 1991), 609.6 cm (Underhill, 1955), 630-1510 cm (Raines et al., 2015), 632.5 + 88.9 (Hosseinpour and Behdad, 2008), 690.1 ± 93.7 cm, 795 ± 129 cm (Hounnou et al., 2005), 1193 cm (Tacchino 2015). These studies showed a wide range of variation in SBL length from a minimum of 201 cm to a maximum of 1510 cm, with a mean around 600 cm (Reiquam et al., 1965; Raines et al., 2015; Tacchino 2015). Such wide variations do not match with the description given in the standard textbooks. In the present study, we did not come across any measurement of small bowel length of more than 5 meters. Another study in Indian population also showed the SBL to be not more than 500 cm (Jadhav et al., 2015). The SBL in Indian population is less in comparison with the textbook figures as well as with the values of SBL mentioned in western studies. The present study in Indian population showed an SBL in the range of 218-500 cm, with an average of 336.54 cm.
Researchers have measured the SBL either in living, during laparotomy or by radiology or magnetic resonance imaging (Guzman et al., 1977; Fanucci et al.,1984; Hosseinpour and Behdad, 2008; Sinha et al., 2014; Raines et al., 2015; Tacchino, 2015), in brain dead (Gondolesi, 2012; Sinha et al., 2014; Tacchino, 2015), in cadavers which are not formalin-fixed (Underhill, 1955; Martin et al., 2003; Misra et al., 2006), or in formalin-fixed cadavers (Minko et al., 2014; Jadhav et al., 2015). It was reported that the bowel is longer in cadavers than the living due to decrease in the muscle tone after death (Gad, Gad 2007; Richards, 2018); however; Smyth (1988) found no signifi- cant increase in bowel length after death. In formalin-fixed cadavers, there is shrink- age due to hardening and dehydration of tissue (Coleman and Kogan, 1998; Clarke et al., 2014; Tran et al., 2015). The variable results may be due the measurements tak- en in different situations. However, as there is a wide variation in the small bowel length in living adults (Gabe, 2008), the same will be reflected during measurements in any particular situation mentioned above. In the present study, measurements of small bowel were taken in formalin-fixed cadavers.
There is no uniformity of results regarding the factors influencing SBL; however, height seems to be a relevant factor, as the higher bodies may need longer bowels.
However, some researchers found weak or no relationship of height with the SBL (Hosseinpour and Behdad, 2008; Minko et al, 2014) and some showed a decrease in SBL/height ratio as the age increases (in infants 4.24, in adults 2.12), as the bowel length does not significantly change after birth (Gondolesi et al., 2012). Some stud- ies showed a significant height – SBL correlation (Raines et al., 2015; Tacchino, 2015; Ahmad et al., 2016). Mean SBL/height ratio in the present study was 2.09, and there was positive correlation between height and SBL.
Normal waist circumference in Indian males and females is 78 cm and 72 cm respectively. Higher WC (90 cm and more in males and 80 cm and more in females) indicates central obesity/abdominal obesity (Martin et al., 2003; Misra et al., 2006; Ahmad et al., 2016). There are studies showing strong positive correlation as well as no correlation between weight and SBL (Guzman et al, 1977; Zhu et al., 2001; Houn- nou et al., 2002; Tacchino, 2015). One study mentions that jejunal length can be a
317 Variability of small bowel length
good predictor of weight (Tacchino, 2015). The present study tried to search the rela- tion between WC (normal values) and SBL, and we found a positive correlation but only in subjects without central obesity. Regression analysis showed statistically sig- nificant coefficients for both height and WC.
Small bowel length is not just an issue of academic discussion. It is of concern for surgeons especially in the procedure of massive resection of small bowel, where large amount of the small bowel is to be resected and can lead to short bowel syn- drome. It is reported that short bowel syndrome can occur following resection of small bowel if the remaining portion is less than 2 meters or 50% of the origi- nal length (Shonyo and Jackson, 1950; Robinson and Wilmore, 2001). If the original length of small bowel is around 3-4 meters, are there more chances of short bowel syndrome in massive resection? Same concern is shown by Tacchino in his research article (Tacchino, 2015). Knowledge of variable length of small bowel is important for intestinal bypass surgery, enteroscopy, magnetic resonance enterography, bariat- ric surgery and any surgery related to small bowel length (Gondolesi et al., 2012; Tacchino, 2015). Bowel length conditions its capacity to absorb micronutrients as well as its caloric absorptive capacity. The relationship between different bowel limb lengths and SBL is valuable for the success of bariatric surgery, which needs an accu- rate evaluation before surgery. The bypass done in bariatric surgery mimics resection of a major portion of proximal bowel (Tacchino, 2015). Studies of SBL will provide a better insight in above mentioned procedures and surgery, this study in particular for Indian population.
Acknowledgments
The authors express their gratitude towards the body donors who donated their bodies to medical colleges, and provided the authors with the opportunity to carry out this research.
The authors have no conflict of interests to declare.
References
Ahmad N., Adam S.I., Nawi A. M., Hassan M. R., Ghazi H.F. (2016) Abdominal obesi- ty Indicators: waist Circumference or waist-to-hip ratio in Malaysian adult popu- lation. Int. J. Prev. Med. 7: 82.
Clarke B.S., Banks T.A., Findji L. (2014) Quantification of tissue shrinkage in canine small intestinal specimens after resection and fixation. Can. J. Vet. Res. 78(1): 46-49.
Coleman R., Kogan I. (1998) An improved low-formaldehyde embalming fluid to pre- serve cadavers for anatomy teaching. J Anat. 192: 443-446.
Drake R., Vogl A.W., Mitchell A.W.M., Veermani R., Holla S., Chand P., Chumber S. (Eds.) (2015) Small Intestine. Chapter 4. In: Gray’s Anatomy for Students. South- east Asia Edition 1. Elsevier-Relx India New Delhi Pp. 346-347.
Fanucci A., Cerro P., Fraracci L., Ietto F. (1984) Small bowel length measured by radi- ography. Gastrointest. Radiol. 9: 349-351.
318 Maitreyee M. Mutalik, Sonali A. Khake
Gad S. (2007) Mechanism of digestion in small intestine. Introduction: The gastroin- testinal tract as a barrier and as absorptive and metabolic organ. Chapter 1. In: Gad S.C.(Ed.) Toxicology of the Gastrointestinal Tract. Edition 1. CRC Press, Lon- don. Pp. 24-25.
Gondolesi G., Ramisch D., Padin J., Almau H., Sandi M., Schelotto P.B., Fernandez A., Rumbo C., Solar H. (2012) What is the normal small bowel length in humans? First donor-based cohort analysis. Am. J. Transplant. 12: S49–S54.
Guzman I.J., Fitch L.L., Varco R.L., Buchwald H. (1977) Small bowel length in hyper- lipidemia and massive obesity. Am. J. Clin. Nutr. 30: 1006-1008.
Hosseinpour M., Behdad A. (2008) Evaluation of small bowel measurement in alive patients. Surg. Radiol. Anat. 30: 653–655.
Hounnou G., Destrieux C., Desme J., Bertrand P., Velut S. (2002) Anatomical study of the length of the human intestine. Surg. Radiol. Anat. 24: 290-294.
Jadhav S.S., Wankhede H.A., Nimje D.A. (2015) Length of small intestine in formalin fixed adult human cadavers. Int. J. Health Sci. Res. 5: 135-139.
Karasov W., Douglas A. (2013) Comparative digestive physiology. Compr. Physiol. 3: 741-783.
Martin A.D., Daniel M., Clarys J.P., Marfell-Jones M.J. (2003) Cadaver-assessed valid- ity of anthropometric indicators of adipose tissue distribution. Int. J. Obes. 27: 1052-1058.
Minko E., Pagano A., Caceres N., Tony Adar T., Márquez S. (2014) Human intestinal tract length and relationship with body height. FASEB J. 28: 916.4.
Misra A., Vikram N.K., Gupta R., Pandey R.M., Wasir J.S., Gupta V.P. (2006) Waist cir- cumference cutoff points and action levels for Asian Indians for identification of abdominal obesity. Int. J. Obes. 30: 106-111.
Mujumder P.P. (2001) Ethnic populations of India as seen from an evolutionary per- spective. J. Biosci. 26: 533-545.
Raines D., Arbour A., Thompson H.W., Figueroa-Bodine J., Joseph S. (2015) Variation in small bowel length: Factor in achieving total enteroscopy? Dig. Endosc. 27: 67-72.
Reiquam C.W., Allen R.P., Akers D.R. (1965) Normal and abnormal small bow- el lengths: An analysis of 389 autopsy cases in infants and children. Am. J. Dis. Child. 109: 447-451.
Richards D. A. (2018) Introduction to the gastrointestinal system. Chapter 43. In: Poc- ock G., Richards C.D., Richards D.A. (Eds.) Human Physiology. Edition 5. Oxford University Press, Oxford. Pp. 674-675.
Robinson M.K., Wilmore D. W. (2001) Short bowel syndrome. In: Holzheimer R.G., Mannick J.A. (Eds.) Surgical Treatment: Evidence-based and Problem-oriented. Munich, W. Zuckschwerdt. Pp. 140-145.
Shonyo E. S., Jackson J. A. (1950) Massive resection of the small intestine; Report of a case. Arch. Surg. 61: 123-130.
Sinha R., Trivedi D., Murphy P.D., Fallis S. (2014) Small intestinal length measure- ment on MR enterography: Comparison with in vivo surgical measurements. AJR Am. J. Roentgenol. 203: W274-W279.
Smyth G.B. (1988) Effects of age, sex, and post mortem interval on intestinal lengths of horses during development. Equine Vet. J. 20: 104-108.
Snell R.S. (2012) Clinical Anatomy by Regions. Chapter 5: The abdomen: Part II – The abdominal cavity. Edition 9. Lippincott, Williams and Wilkins Phildelphia. Pp.177-178.
319 Variability of small bowel length
Standring S., Brown J. L., Moore L.A., Khan N. (2008) Small Intestine. Chapter 66. In:. Standring S. (Ed.) Gray’s Anatomy Edition 40. Churchill-Livingstone-Elsevier, Philadelphia. Pp.1125-1126.
Tacchino R.M. (2015) Bowel length: measurement, predictors, and impact on bariatric and metabolic surgery. Surg. Obes. Relat. Dis. 11: 328-334.
Tran T., Sundaram C.P., Bahler C.D., Eble J.N., Grignon D.J., Monn M.F., Simper N.B., Cheng L. (2015) Correcting the shrinkage effects of formalin fixation and tissue processing for renal tumors: toward standardization of pathological reporting of tumor size. J. Cancer 6: 759-766.
Underhill B.M. (1955) Intestinal length in man. Br. Med. J. 2: 1243-1246. Weaver L.T., Austin S., Cole T.J. (1991) Small intestinal length: a factor essential for
gut adaptation. Gut 32: 1321-1323. Gray H., Williams P., Warwick R. (1980) Gray’s Anatomy. The small intestine. Edition
36. Churchill-Livingstone, Edinburgh. Pp. 1342-1343. World Health Organization (2011) Waist circumference and waist-hip ratio: report of a
WHO expert consultation. Geneva, 8-11 December 2008. Geneva, WHO. Zhu S., Wang Z., Heshka S., Heo M., Faith M.S., Heymsfield S.B. (2002) Waist circum-
ference and obesity-associated risk factors among whites in the third National Health and Nutrition Examination Survey: Clinical action thresholds. Am. J. Clin. Nutr. 76: 743–749.

KEYWORDS : Aerobic exercise, Physical training, FEV1, FVC, PEFR, MVV etc.
FEV1, FVC, MVV, PEFR, FEF 25-75. Cardio-pulmonary efficiency tests help to study aerobic conditioning, which includes lung ventilation.
Lung ventilation, the most important parameter of physical fitness is controlled by skeletal muscle fitness. There are many studies carried
out on defense personals, but very studies about young adults who aspire to take entry in the army, navy or police force. The present study
was aimed to evaluate the importance of physical activity in improving strength and endurance of respiratory muscles. So we measured
various spirometry parameters (PFT) to find out the cardio-respiratory response and blood pressure to study cardio-vascular response in
the individuals who underwent rigorous physical training for 9 months. 30 healthy male subjects between age group of 18-23 years were
selected randomly. Before and after training period of 9 months, spirometry and other parameters like height, weight, body surface area
were recorded. We got statistically significant improvement in parameters like FEV1, FVC, MVV, PEFR and FEF 25-75. We observed
statistically significant reduction in the mean systolic and diastolic resting blood pressure after training. From our results we conclude that
physical training like regular aerobic exercise improves lung function parameters and cardiac efficiency. Regular aerobic exercise improves
cardio-respiratory fitness.
Physical inactivity and low cardio-respiratory fitness are recognized as important causes of morbidity and
mortality. Pulmonary function tests help in monitoring the efficacy of physical training. It includes parameters like ABSTRACT
Meena Agrawal
Deepa Nair
Rupali S Baburdikar*
Assitant Professor, Dept of Physiology, MIMER Medical College, Talegaon D, Pune.
*Corresponding Author
Professor and HOD, Dept of Physiology, MIMER Medical College, Talegaon D, Pune.
Professor, Dept of Physiology, MIMER Medical College, Talegaon D, Pune.
INTRODUCTION: Regular physical activity is an essential component of a healthy
lifestyle that helps to keep fit.1 Physical fitness is the ability to carry
out daily tasks with vigor and alertness without undue fatigue.
Physical inactivity and low cardio-respiratory fitness are recognized
as important causes of morbidity and mortality.2 Aerobic exercise is
physical exercise of relatively low intensity that primarily depending
on the aerobic energy-generating process.3
Pulmonary function tests help in monitoring the efficacy of physical
training. It includes parameters like FEV1, FVC, MVV, PEFR, FEF 25-75.
Various cardio-pulmonary efficiency tests help us to study aerobic
conditioning which includes lung ventilation. Lung ventilation, the
most important parameter of physical fitness is controlled by
skeletal muscle fitness. Lung function is an important predictive tool
of morbidity and mortality in medical practice. Pulmonary function
is a long term predictor of overall survival rates in both genders and
can be used as a tool for general health assessment.4
There have been many studies carried out on defense personals, but
very negligible studies about the young adults who aspire to take
entry in the army, navy or police force.
The present study was aimed to evaluate the importance of physical
activity in improving strength and endurance of respiratory
muscles. So we measured various spirometry parameters (PFT) to
find out the cardio-respiratory responses and blood pressure to
study cardio-vascular responses in the individuals who underwent
rigorous physical training for duration of nine months.
MATERIAL & METHODS: This prospective study was done from January 2017 to January 2018
after approval from institutional ethics committee of the institute.
The study was conducted in career training academy in Pune. The
study participants were healthy young adults aspiring to gain entry
in army, navy or police force.
The trainees included in the study were from different regions of
Maharashtra.
The newly admitted candidates of the academy were screened for
the inclusion and exclusion criteria. Those individuals who gave the
history of smoking, respiratory illness like bronchial asthma, COPD,
pneumonia, history of tuberculosis in past and any cardiovascular
disease or history of congenital heart disease, chest or spinal
deformity, obesity(BMI>32 kg/m2) were excluded. 30 healthy male
subjects between age group of 18-23 years were finally selected
randomly. The individuals who voluntarily agreed to participate in
the study were enrolled. The detailed information of project was
given and procedure was explained.
After taking written informed consent, general examination and
spirometry was done. The parameters recorded were height
(stadiometer), weight (standard scale weighing machine), Body
Surface Area (Dubois nomogram).5
Spirometry was done on computerized spirometry machine Helios
401. It was done in sitting position and in the post-absorptive phase
i.e. 4 hours after lunch. The test was simple, non-invasive easy to perform. It was done in two maneuvers. In First maneuver, Forced
Vital Capacity (FVC), Forced Expiratory Volume in 1 second (FEV1),
Peak Expiratory Flow Rate (PEFR), Forced mid Expiratory Flow Rate
(FEF 25-75) were recorded. Second maneuver included recording of
Maximum Voluntary Ventilation (MVV). Two trials were given to each
participant. For each test the best one out of three test readings
were taken.
The participants in the study underwent vigorous physical training
for duration of 9 months. During the training period, they
performed various forms of exercises for 3 hours in the morning and
2 hours in the evening. The exercises were in the form of running,
resistance exercises and other moderate to severe exercises.
Again after a period of 9 months, Spirometry readings and all the
other parameters were recorded in the same group of subjects
under similar conditions.
Statistical analysis: The results were given as Mean ± Standard Deviation. Comparisons
were performed using paired student's t- test. A p-value of less than
0.05 was considered as statistically significant. Statistical software
graph pad prism was used for the analysis of data. Microsoft word
and Microsoft excel have been used to create text documents and
tables etc.
GJRA - GLOBAL JOURNAL FOR RESEARCH ANALYSIS 29
Original Research Paper Physiology
EFFECT OF PHYSICAL TRAINING ON PULMONARY FUNCTION TEST IN YOUNG
ADULTS OF A PHYSICAL TRAINING ACADEMY
VOLUME-7, ISSUE-10, OCTOBER-2018 • PRINT ISSN No 2277 - 8160
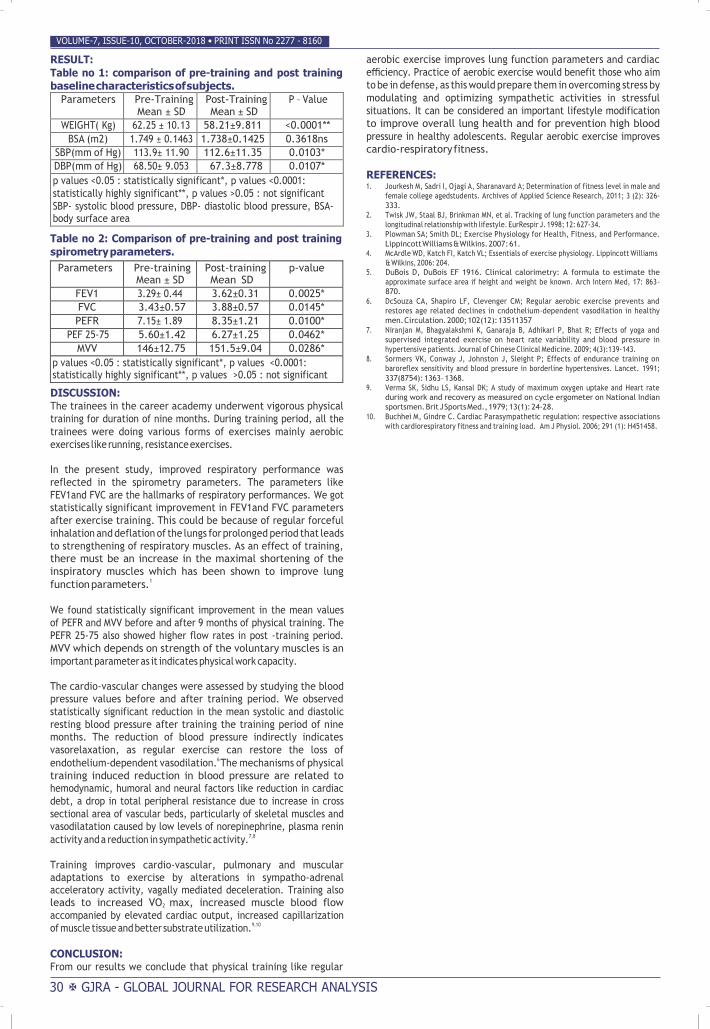
RESULT:
Table no 1: comparison of pre-training and post training
baseline characteristics of subjects.
Parameters Pre-Training Mean ± SD
Post-Training Mean ± SD
P – Value
WEIGHT( Kg) 62.25 ± 10.13 58.21±9.811 <0.0001**
BSA (m2) 1.749 ± 0.1463 1.738±0.1425 0.3618ns
SBP(mm of Hg) 113.9± 11.90 112.6±11.35 0.0103*
DBP(mm of Hg) 68.50± 9.053 67.3±8.778 0.0107*
p values <0.05 : statistically significant*, p values <0.0001:
statistically highly significant**, p values >0.05 : not significant
SBP- systolic blood pressure, DBP- diastolic blood pressure, BSA- body surface area
Table no 2: Comparison of pre-training and post training
spirometry parameters.
aerobic exercise improves lung function parameters and cardiac
efficiency. Practice of aerobic exercise would benefit those who aim
to be in defense, as this would prepare them in overcoming stress by
modulating and optimizing sympathetic activities in stressful
situations. It can be considered an important lifestyle modification
to improve overall lung health and for prevention high blood
pressure in healthy adolescents. Regular aerobic exercise improves
cardio-respiratory fitness.
REFERENCES: 1. Jourkesh M, Sadri I, Ojagi A, Sharanavard A; Determination of fitness level in male and
female college agedstudents. Archives of Applied Science Research, 2011; 3 (2): 326-
333.
2. Twisk JW, Staal BJ, Brinkman MN, et al. Tracking of lung function parameters and the
longitudinal relationship with lifestyle. EurRespir J. 1998; 12: 627-34.
3. Plowman SA; Smith DL; Exercise Physiology for Health, Fitness, and Performance.
Lippincott Williams & Wilkins. 2007: 61.
4. McArdle WD, Katch FI, Katch VL; Essentials of exercise physiology. Lippincott Williams
& Wilkins, 2006: 204.
5. DuBois D, DuBois EF 1916. Clinical calorimetry: A formula to estimate the
approximate surface area if height and weight be known. Arch Intern Med, 17: 863-
870.
DISCUSSION: The trainees in the career academy underwent vigorous physical
training for duration of nine months. During training period, all the
trainees were doing various forms of exercises mainly aerobic
exercises like running, resistance exercises.
In the present study, improved respiratory performance was
reflected in the spirometry parameters. The parameters like
FEV1and FVC are the hallmarks of respiratory performances. We got
statistically significant improvement in FEV1and FVC parameters
after exercise training. This could be because of regular forceful
inhalation and deflation of the lungs for prolonged period that leads
to strengthening of respiratory muscles. As an effect of training,
there must be an increase in the maximal shortening of the
inspiratory muscles which has been shown to improve lung
function parameters.1
We found statistically significant improvement in the mean values
of PEFR and MVV before and after 9 months of physical training. The
PEFR 25-75 also showed higher flow rates in post -training period.
MVV which depends on strength of the voluntary muscles is an
important parameter as it indicates physical work capacity.
The cardio-vascular changes were assessed by studying the blood
pressure values before and after training period. We observed
statistically significant reduction in the mean systolic and diastolic
resting blood pressure after training the training period of nine
months. The reduction of blood pressure indirectly indicates
vasorelaxation, as regular exercise can restore the loss of
endothelium-dependent vasodilation.6 The mechanisms of physical
training induced reduction in blood pressure are related to
hemodynamic, humoral and neural factors like reduction in cardiac
debt, a drop in total peripheral resistance due to increase in cross
sectional area of vascular beds, particularly of skeletal muscles and
vasodilatation caused by low levels of norepinephrine, plasma renin
activity and a reduction in sympathetic activity.7,8
Training improves cardio-vascular, pulmonary and muscular
adaptations to exercise by alterations in sympatho-adrenal acceleratory activity, vagally mediated deceleration. Training also
leads to increased VO2 max, increased muscle blood flow
accompanied by elevated cardiac output, increased capillarization
of muscle tissue and better substrate utilization.9,10
CONCLUSION: From our results we conclude that physical training like regular
6. DcSouza CA, Shapiro LF, Clevenger CM; Regular aerobic exercise prevents and
restores age related declines in cndothelium-dependent vasodilation in healthy
men. Circulation. 2000; 102(12): 13511357
7. Niranjan M, Bhagyalakshmi K, Ganaraja B, Adhikari P, Bhat R; Effects of yoga and
supervised integrated exercise on heart rate variability and blood pressure in
hypertensive patients. Journal of Chinese Clinical Medicine. 2009; 4(3):139-143.
8. Sormers VK, Conway J, Johnston J, Sleight P; Effects of endurance training on
baroreflex sensitivity and blood pressure in borderline hypertensives. Lancet. 1991;
337(8754): 1363– 1368.
9. Verma SK, Sidhu LS, Kansal DK; A study of maximum oxygen uptake and Heart rate
during work and recovery as measured on cycle ergometer on National Indian
sportsmen. Brit J Sports Med., 1979; 13(1): 24-28.
10. Buchhei M, Gindre C. Cardiac Parasympathetic regulation: respective associations
with cardiorespiratory fitness and training load. Am J Physiol. 2006; 291 (1): H451458.
30 GJRA - GLOBAL JOURNAL FOR RESEARCH ANALYSIS
VOLUME-7, ISSUE-10, OCTOBER-2018 • PRINT ISSN No 2277 - 8160
Parameters Pre-training Mean ± SD
Post-training Mean SD
p-value
FEV1 3.29± 0.44 3.62±0.31 0.0025*
FVC 3.43±0.57 3.88±0.57 0.0145*
PEFR 7.15± 1.89 8.35±1.21 0.0100*
PEF 25-75 5.60±1.42 6.27±1.25 0.0462*
MVV 146±12.75 151.5±9.04 0.0286*
p values <0.05 : statistically significant*, p values <0.0001: statistically highly significant**, p values >0.05 : not significant
Smita P.Bhide*
KEYWORDS
Shruti S. Desale Senior Resident Dept of Pathology, MIMER Medical College, Talegaon Dabhade
Professor, Dept of Pathology, MIMER Medical College, Talegaon Dabhade *Corresponding Author
Sneha R. Joshi Professor & Head, Dept of Pathology, MIMER Medical College, Talegaon Dabhade
BACKGROUND: The UN agreed cut off to refer to older patients (i.e. geriatric age group) is 60+ years. Due to the rising tendency of the aging
population in a modern society, the prevalence of anemia is also expected to rise in the future. Geriatric anemia is a unique anemia for several
reasons. Its diagnosis poses a challenge. This is because there are several features of anemia which make it easy to overlook.
OBJECTIVE: To study types of anemia depending upon red cell morphology and red cell indices in geriatric patients.
MATERIALS AND METHODS: The present study was carried in department of pathology of the rural tertiary care
hospital. All the geriatric patients coming to out patient as well as in patient department of the hospital with anemia satisfying the inclusion and
exclusion criteria were included in the study. This study was conducted from October 2015 to August 2017.
RESULTS : Out of 690 total geriatric patients, 414 anemic patients fulfilling inclusion criteria were included in the study. Out of total 414 patients,
220 (67.4 %) were male and 194 (73.7%) were female patients. Majority of the patients were in 60-65 year age group, in both sexes. In present
study, normocytic normochromic was the most common morphological
pattern of anemia found on PBS and anemia of chronic disease was the most common
cause of geriatric anemia, followed by nutritional deficiency.
CONCLUSION : Despite modern diagnostic methods, geriatric anemia still remains underreported and inadequately investigated. There is
clearly a need for greater awareness of anemia in the elderly and of its significance in terms of poorer outcomes, prolonged hospital stay and
increased mortality.
The present study underlines the importance of routine screening and individual assessment of the etiological factors of anemia in elderly allowing
the timely initiation of optimal and appropriate therapy.
Anaemia, Geriatric, Morphological
INTRODUCTION
The UN agreed cut off to refer to older patients (i.e. geriatric age group) is 60+ years.
1 Due to the rising tendency of the aging population in a
modern society, the prevalence of anemia is also expected to rise in the future. Anemia represents a sign of serious disease. Thus, if not treated properly, anemia can cause serious complications, especially among older population.
2 Geriatric anemia is a unique anemia for several
reasons. Its diagnosis poses a challenge. This is because there are several features of anemia which make it easy to overlook.
3
The onset of symptoms and signs is usually insidious and many elderly patients adjust their activities as their bodies make physiologic adaptations for the condition. Typical features of anemia are not specific and in elderly patients tend to be attributed to advancing age.
3
Anemia significantly increases the mortality and morbidity in the elderly. Thus, anemia needs thorough study of its pattern and profiles for proper evaluation and management.
4
The present study is an attempt to study the pattern of anemia encountered in elderly and their association with clinical profile and possible etiological processes. Also it is undertaken to estimate the occurrence of anemia among elderly and to classify the anemia based on red cell morphology and indices.
MATERIALS AND METHODS
The present study was carried in department of pathology of the rural tertiary care hospital. All the geriatric patients coming to outpatient as well as in patient department of the hospital with anemia satisfying the inclusion and exclusion criteria were included in the study. This study was conducted from October 2015 to August 2017.
1) INCLUSION CRITERIA: Male patients aged 60 years and above with Hb % < 13 gm/dL. Female patients aged 60 years and above with Hb% < 12 gm/dL.
2) EXCLUSION CRITERIA: Patients below 60 years of age. Male patients aged 60 years and above with Hb% >13gm/dl. Female patients aged 60 years and above with Hb% >12gm/dl.
A detailed clinical history was taken and a through physical examination was carried out in each patient.The following investigations were done.
A) Hematological Investigations : Venous blood was collected in EDTA bulb and all routine hematological investigations were carried out. The parameters like Hb, HCT, RBC count, RBC indices (MCV, MCH, MCHC) , RDW, TLC & Platelet count were obtained from automated hematology analyzer. We have used 3 part Automated SYSMEX XP-100 blood cell counter & 5 part Automated XS 800i blood cell counter.
PBS Findings were broadly classified into Microcytic hypochromic, Macrocytic, Normocytic normochromic & Dimorphic. Bone marrow aspiration study were done wherever necessary.
B) Non Hematological Investigations: Complete physical and chemical Urine examination were done for every patient. Examination of stool was done in patients wherever indicated. C) Special investigations: Serum Vit. B12/ Folic acid,,Liver function test ,Renal function test,Thyroid profile,Radiological studies & Endoscopic examination were done wherever indicated.
RESULTS
The present study was carried out in a rural tertiary care hospital over a period of 1year 11 months. Out of 690 total geriatric patients, 414 anemic patients fulfilling inclusion criteria were included in the study. Out of total 414 patients, 220 (67.4 %) were male and 194 (73.7%) were female patients.
Fig 1: Occurrence of anemia
ABSTRACT
ORIGINAL RESEARCH PAPER Volume-7 | Issue-10 | October-2018 | PRINT ISSN No 2277 - 8179
INTERNATIONAL JOURNAL OF SCIENTIFIC RESEARCH
MORPHOLOGIC AND CYTOMETRIC EVALUATION OF ANEMIA IN GERIATRIC PATIENTS
Pathology
55 International Journal of Scientific Research
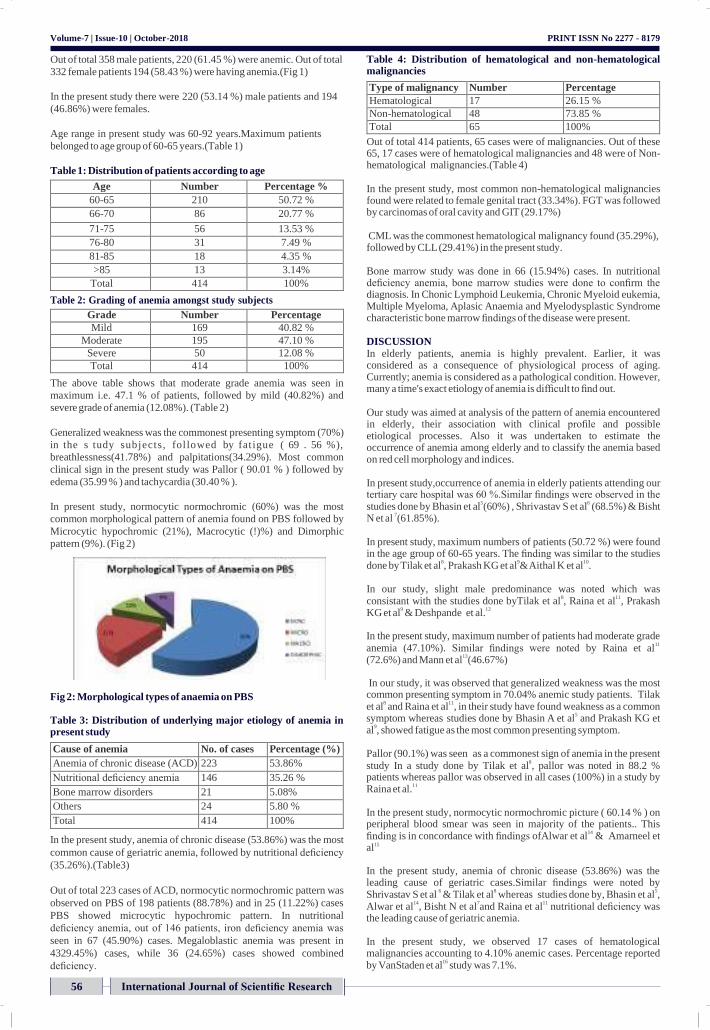
Volume-7 | Issue-10 | October-2018
Out of total 358 male patients, 220 (61.45 %) were anemic. Out of total
332 female patients 194 (58.43 %) were having anemia.(Fig 1)
In the present study there were 220 (53.14 %) male patients and 194
(46.86%) were females.
Age range in present study was 60-92 years.Maximum patients
belonged to age group of 60-65 years.(Table 1)
Table 1: Distribution of patients according to age
Age Number Percentage %
60-65 210 50.72 %
66-70 86 20.77 %
71-75 56 13.53 %
76-80 31 7.49 %
81-85 18 4.35 %
>85 13 3.14%
Total 414 100%
Table 2: Grading of anemia amongst study subjects
Grade Number Percentage
Mild 169 40.82 %
Moderate 195 47.10 %
Severe 50 12.08 %
Total 414 100%
The above table shows that moderate grade anemia was seen in
maximum i.e. 47.1 % of patients, followed by mild (40.82%) and
severe grade of anemia (12.08%). (Table 2)
Generalized weakness was the commonest presenting symptom (70%)
in the s tudy subjects, fol lowed by fat igue ( 69 . 56 %),
breathlessness(41.78%) and palpitations(34.29%). Most common
clinical sign in the present study was Pallor ( 90.01 % ) followed by
edema (35.99 % ) and tachycardia (30.40 % ).
In present study, normocytic normochromic (60%) was the most
common morphological pattern of anemia found on PBS followed by
Microcytic hypochromic (21%), Macrocytic (!)%) and Dimorphic
pattern (9%). (Fig 2)
Fig 2: Morphological types of anaemia on PBS
Table 3: Distribution of underlying major etiology of anemia in present study
Cause of anemia No. of cases Percentage (%)
Anemia of chronic disease (ACD) 223 53.86%
Nutritional deficiency anemia 146 35.26 %
Bone marrow disorders 21 5.08%
Others 24 5.80 %
Total 414 100%
In the present study, anemia of chronic disease (53.86%) was the most
common cause of geriatric anemia, followed by nutritional deficiency
(35.26%).(Table3)
Out of total 223 cases of ACD, normocytic normochromic pattern was
observed on PBS of 198 patients (88.78%) and in 25 (11.22%) cases
PBS showed microcytic hypochromic pattern. In nutritional
deficiency anemia, out of 146 patients, iron deficiency anemia was
seen in 67 (45.90%) cases. Megaloblastic anemia was present in
4329.45%) cases, while 36 (24.65%) cases showed combined
deficiency.
PRINT ISSN No 2277 - 8179
Table 4: Distribution of hematological and non-hematological malignancies
Type of malignancy Number Percentage
Hematological 17 26.15 %
Non-hematological 48 73.85 %
Total 65 100%
Out of total 414 patients, 65 cases were of malignancies. Out of these 65, 17 cases were of hematological malignancies and 48 were of Non- hematological malignancies.(Table 4)
In the present study, most common non-hematological malignancies found were related to female genital tract (33.34%). FGT was followed by carcinomas of oral cavity and GIT (29.17%)
CML was the commonest hematological malignancy found (35.29%), followed by CLL (29.41%) in the present study.
Bone marrow study was done in 66 (15.94%) cases. In nutritional deficiency anemia, bone marrow studies were done to confirm the diagnosis. In Chonic Lymphoid Leukemia, Chronic Myeloid eukemia, Multiple Myeloma, Aplasic Anaemia and Myelodysplastic Syndrome characteristic bone marrow findings of the disease were present.
DISCUSSION
In elderly patients, anemia is highly prevalent. Earlier, it was considered as a consequence of physiological process of aging. Currently; anemia is considered as a pathological condition. However, many a time's exact etiology of anemia is difficult to find out.
Our study was aimed at analysis of the pattern of anemia encountered in elderly, their association with clinical profile and possible etiological processes. Also it was undertaken to estimate the occurrence of anemia among elderly and to classify the anemia based on red cell morphology and indices.
In present study,occurrence of anemia in elderly patients attending our tertiary care hospital was 60 %.Similar findings were observed in the studies done by Bhasin et al
5(60%) , Shrivastav S et al
6 (68.5%) & Bisht
N et al 7(61.85%).
In present study, maximum numbers of patients (50.72 %) were found in the age group of 60-65 years. The finding was similar to the studies done by Tilak et al
8, Prakash KG et al
9& Aithal K et al
10.
In our study, slight male predominance was noted which was consistant with the studies done byTilak et al
8, Raina et al
11, Prakash
KG et al9 & Deshpande et al.
12
In the present study, maximum number of patients had moderate grade anemia (47.10%). Similar findings were noted by Raina et al
11
(72.6%) and Mann et al13(46.67%)
In our study, it was observed that generalized weakness was the most common presenting symptom in 70.04% anemic study patients. Tilak et al
8 and Raina et al
11, in their study have found weakness as a common
symptom whereas studies done by Bhasin A et al5 and Prakash KG et
al9, showed fatigue as the most common presenting symptom.
Pallor (90.1%) was seen as a commonest sign of anemia in the present study In a study done by Tilak et al
8, pallor was noted in 88.2 %
patients whereas pallor was observed in all cases (100%) in a study by Raina et al.
11
In the present study, normocytic normochromic picture ( 60.14 % ) on peripheral blood smear was seen in majority of the patients.. This finding is in concordance with findings ofAlwar et al
14 & Amarneel et
al15
In the present study, anemia of chronic disease (53.86%) was the leading cause of geriatric cases.Similar findings were noted by Shrivastav S et al
6 & Tilak et al
8 whereas studies done by, Bhasin et al
5,
Alwar et al14, Bisht N et al
7and Raina et al
11 nutritional deficiency was
the leading cause of geriatric anemia.
In the present study, we observed 17 cases of hematological malignancies accounting to 4.10% anemic cases. Percentage reported by VanStaden et al
16 study was 7.1%.
International Journal of Scientific Research 56
Volume-7 | Issue-10 | October-2018
In present study, 0.96 % of the patients (4/414), cause of anemia could not be detected. Similar findings were noted by Tilak et al
8. However,
in studies done by DeAmicis et al17
& Prakash KG et al9unexplained
anemia was significantly high. This could be attributed to an incomplete diagnostic evaluation.
CONCLUSION
The incidence of anemia is quite high among elderly patients, more so when associated with chronic diseases and malignancies. Even mild anemia is associated with significant increase in morbidity irrespective of the underlying cause. Identifying and categorizing anemia is essential to direct the investigation towards the underlying etiology and to guide the clinicians for appropriate targeted treatment. Despite modem diagnostic advanced geriatric anemia still remains underreported and inadequately investigated. There is clearly a need for greater awareness of anemia in the elderly and of its significance in terms of poorer outcomes, prolonged hospital stay and increased mortality.
The present study underlines the importance of routine screening and individual assessment of the etiological factors of anemia in elderly allowing the timely initiation of optimal and appropriate therapy.
REFERENCES 1 World Health Organization. Definition of an older or elderly person. Retrieved August
29,2010. Available online: www.who.int/healthinfo/survey/ ageingdfnolder/ en/index. html.
2. Kim H-S, Lee B-K. Cross-sectional study on the prevalence of anemia among rural elderly in Asan. Nutrition Research and Practice. 2008;2(1):8-12. doi:10.4162/ nrp. 2008.2.1.8
3. Smith D.L. Anemia in the elderly. American Family Physician.2000, 62(7):1565-1574.
4. Duh MS, Mody SH, Lefebvre P, Woodman RC, Buteau S, Peich CT. Anemia and the risk of injurious falls in a community- dwelling elderly population. Drugs Ageing 2008,25(4): 325-334.
5. Bhasin A, Rao M Y. Characteristics of anemia in Elderly: A Hospital based study in south India. Indian Journal Of Hematology and Blood Transfusion 2011; 27(1): 26-32.
6. Shrivastav S R, Hippargi S B, Ambali A P, Yelikar B R. Patterns of anemia in geriatric age group. JKIMSU 2013; 2(1): 77-81.
7. Bisht N, Sofia, Neki N.S. et al. Prevalence and pattern of anemia in elderly – a hospital based study. International journal of current research in medical science (2017), Vol.3, Issue 6 , 27-35
8. Tilak V, Rani D, Gambhir IS. Characteristic of geriatric anemia in and around Varanasi: A hospital based study. Indian J. Prev. Soc. Med. Vol. 44 No1-2, 2013
9. Prakash KG, Devendrappa KR, Madhukumar MH, Priyashree R, Avinash B. Clinical Profile of Anemia in Elderly: A Cross Sectional Study from a Tertiary Care Center. Sch J App Med Sci. 2015; 3(3C):1266-1270.
10. Aithal K, Meti K, Jain S et al. A study of pattern of anemia in elderly patients admitted at tertiary centre. Sch. J. App. Med. Sci. 2017; 5(4D) : 1483-1486
11. Raina A, Kumar A, Singh A, Gupta G, Malhotra P, Raina SK. A clinicohaematological profile of elderly patientsbeing investigated for anaemia in a tertiary care centre in north- west India. Egypt J Haematol 2014;39:190-4
12. Deshpande N, Kakade H, Jathar M, Sangle SA, Deshpande N, Shinde A. Anemia in senior citizens. MedPulse – International Medical Journal, March 2017;4(3);349-350
13. Mann S, Kumar A, Singh SK, Katyal S, Chopra G, Varma SK. Clinical Evaluation of Anemia in Geriatric Patients - A Cross Sectional Study Conducted At Tertiary Care Hospital. Natl J Community Med. 2010; 5(3): 316-320.
14. Alwar v, Reethi K, Rameshkumar K. Geriatric Anemia: An Indian perspective. Indian J Hematol Blood Transfus. 2013; 29(2). 126-127
15. Amarneel S, Sheth N, Pattern of anemia in elderly age group. USRR. 2015; 4(2): 51-56. 16. VanStaden AM, Weich DJV. Retrospective analysis of the prevalence and causes of
anaemia in hospitalised elderly patients. S Afr Fam Pract. 2015; 57(5): 297-299. 17. DeAmicis MM, Poggiali E, Motta I, Minonzio F, Fabio G, Hu C et al. Anemia in elderly
hospitalized patients: prevalence and clinical impact. Intern Emerg Med. 2015;l0(5): 581-586
PRINT ISSN No 2277 - 8179
International Journal of Scientific Research
57
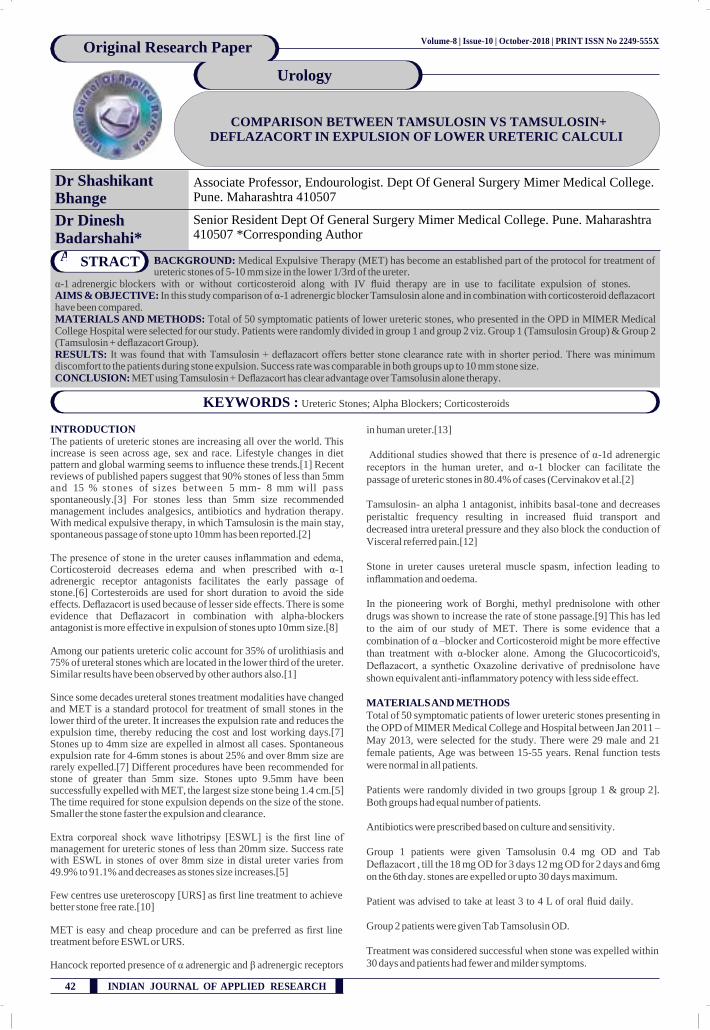
Volume-8 | Issue-10 | October-2018 | PRINT ISSN No 2249-555X Original Research Paper
Urology
42 INDIAN JOURNAL OF APPLIED RESEARCH
COMPARISON BETWEEN TAMSULOSIN VS TAMSULOSIN+
DEFLAZACORT IN EXPULSION OF LOWER URETERIC CALCULI
Dr Shashikant Bhange
STRACT BACKGROUND: Medical Expulsive Therapy (MET) has become an established part of the protocol for treatment of ureteric stones of 5-10 mm size in the lower 1/3rd of the ureter.
α-1 adrenergic blockers with or without corticosteroid along with IV fluid therapy are in use to facilitate expulsion of stones. AIMS & OBJECTIVE: In this study comparison of α-1 adrenergic blocker Tamsulosin alone and in combination with corticosteroid deflazacort have been compared. MATERIALS AND METHODS: Total of 50 symptomatic patients of lower ureteric stones, who presented in the OPD in MIMER Medical College Hospital were selected for our study. Patients were randomly divided in group 1 and group 2 viz. Group 1 (Tamsulosin Group) & Group 2 (Tamsulosin + deflazacort Group). RESULTS: It was found that with Tamsulosin + deflazacort offers better stone clearance rate with in shorter period. There was minimum discomfort to the patients during stone expulsion. Success rate was comparable in both groups up to 10 mm stone size. CONCLUSION: MET using Tamsulosin + Deflazacort has clear advantage over Tamsolusin alone therapy.
AB
Dr Dinesh Badarshahi*
KEYWORDS : Ureteric Stones; Alpha Blockers; Corticosteroids
Associate Professor, Endourologist. Dept Of General Surgery Mimer Medical College. Pune. Maharashtra 410507
Senior Resident Dept Of General Surgery Mimer Medical College. Pune. Maharashtra 410507 *Corresponding Author
INTRODUCTION
The patients of ureteric stones are increasing all over the world. This increase is seen across age, sex and race. Lifestyle changes in diet pattern and global warming seems to influence these trends.[1] Recent reviews of published papers suggest that 90% stones of less than 5mm and 15 % stones of sizes between 5 mm- 8 mm will pass spontaneously.[3] For stones less than 5mm size recommended management includes analgesics, antibiotics and hydration therapy. With medical expulsive therapy, in which Tamsulosin is the main stay, spontaneous passage of stone upto 10mm has been reported.[2]
The presence of stone in the ureter causes inflammation and edema, Corticosteroid decreases edema and when prescribed with α-1 adrenergic receptor antagonists facilitates the early passage of stone.[6] Cortesteroids are used for short duration to avoid the side effects. Deflazacort is used because of lesser side effects. There is some evidence that Deflazacort in combination with alpha-blockers antagonist is more effective in expulsion of stones upto 10mm size.[8]
Among our patients ureteric colic account for 35% of urolithiasis and 75% of ureteral stones which are located in the lower third of the ureter. Similar results have been observed by other authors also.[1]
Since some decades ureteral stones treatment modalities have changed and MET is a standard protocol for treatment of small stones in the lower third of the ureter. It increases the expulsion rate and reduces the expulsion time, thereby reducing the cost and lost working days.[7] Stones up to 4mm size are expelled in almost all cases. Spontaneous expulsion rate for 4-6mm stones is about 25% and over 8mm size are rarely expelled.[7] Different procedures have been recommended for stone of greater than 5mm size. Stones upto 9.5mm have been successfully expelled with MET, the largest size stone being 1.4 cm.[5] The time required for stone expulsion depends on the size of the stone. Smaller the stone faster the expulsion and clearance.
Extra corporeal shock wave lithotripsy [ESWL] is the first line of management for ureteric stones of less than 20mm size. Success rate with ESWL in stones of over 8mm size in distal ureter varies from 49.9% to 91.1% and decreases as stones size increases.[5]
Few centres use ureteroscopy [URS] as first line treatment to achieve better stone free rate.[10]
MET is easy and cheap procedure and can be preferred as first line treatment before ESWL or URS.
Hancock reported presence of α adrenergic and β adrenergic receptors
in human ureter.[13]
Additional studies showed that there is presence of α-1d adrenergic
receptors in the human ureter, and α-1 blocker can facilitate the
passage of ureteric stones in 80.4% of cases (Cervinakov et al.[2]
Tamsulosin- an alpha 1 antagonist, inhibits basal-tone and decreases
peristaltic frequency resulting in increased fluid transport and
decreased intra ureteral pressure and they also block the conduction of
Visceral referred pain.[12]
Stone in ureter causes ureteral muscle spasm, infection leading to
inflammation and oedema.
In the pioneering work of Borghi, methyl prednisolone with other
drugs was shown to increase the rate of stone passage.[9] This has led
to the aim of our study of MET. There is some evidence that a
combination of α –blocker and Corticosteroid might be more effective
than treatment with α-blocker alone. Among the Glucocorticoid's,
Deflazacort, a synthetic Oxazoline derivative of prednisolone have
shown equivalent anti-inflammatory potency with less side effect.
MATERIALS AND METHODS
Total of 50 symptomatic patients of lower ureteric stones presenting in
the OPD of MIMER Medical College and Hospital between Jan 2011 –
May 2013, were selected for the study. There were 29 male and 21
female patients, Age was between 15-55 years. Renal function tests
were normal in all patients.
Patients were randomly divided in two groups [group 1 & group 2].
Both groups had equal number of patients.
Antibiotics were prescribed based on culture and sensitivity.
Group 1 patients were given Tamsolusin 0.4 mg OD and Tab
Deflazacort , till the 18 mg OD for 3 days 12 mg OD for 2 days and 6mg
on the 6th day. stones are expelled or upto 30 days maximum.
Patient was advised to take at least 3 to 4 L of oral fluid daily.
Group 2 patients were given Tab Tamsolusin OD.
Treatment was considered successful when stone was expelled within
30 days and patients had fewer and milder symptoms.
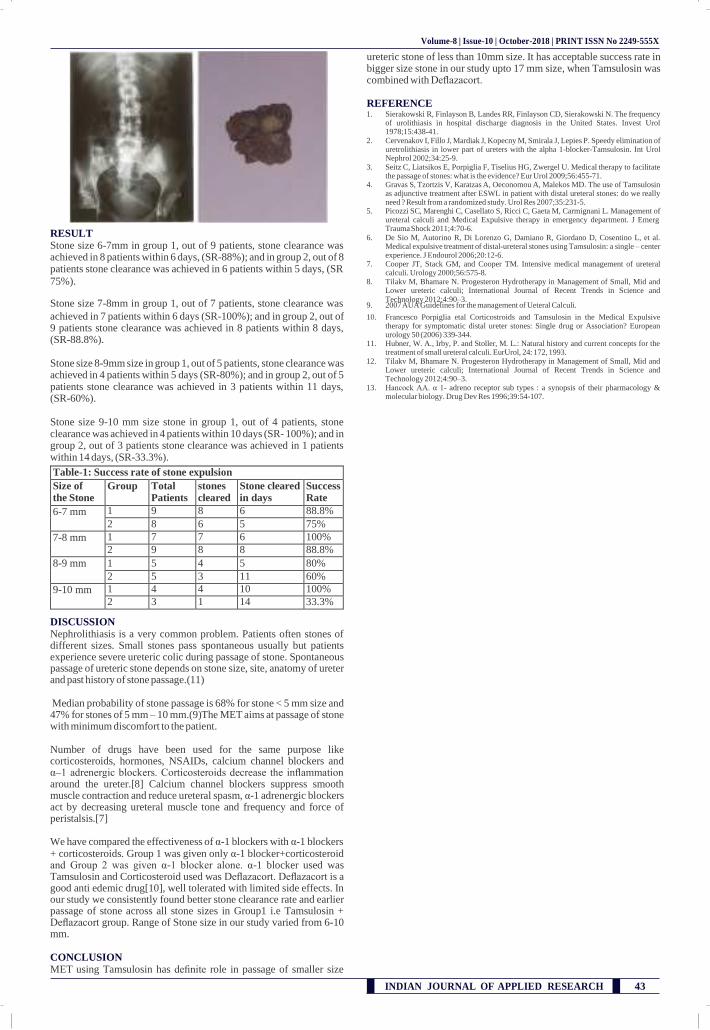
Volume-8 | Issue-10 | October-2018 | PRINT ISSN No 2249-555X
INDIAN JOURNAL OF APPLIED RESEARCH 43
ureteric stone of less than 10mm size. It has acceptable success rate in bigger size stone in our study upto 17 mm size, when Tamsulosin was combined with Deflazacort.
REFERENCE 1. Sierakowski R, Finlayson B, Landes RR, Finlayson CD, Sierakowski N. The frequency
of urolithiasis in hospital discharge diagnosis in the United States. Invest Urol 1978;15:438-41.
2. Cervenakov I, Fillo J, Mardiak J, Kopecny M, Smirala J, Lepies P. Speedy elimination of uretrolithiasis in lower part of ureters with the alpha 1-blocker-Tamsulosin. Int Urol Nephrol 2002;34:25-9.
3. Seitz C, Liatsikos E, Porpiglia F, Tiselius HG, Zwergel U. Medical therapy to facilitate the passage of stones: what is the evidence? Eur Urol 2009;56:455-71.
4. Gravas S, Tzortzis V, Karatzas A, Oeconomou A, Malekos MD. The use of Tamsulosin as adjunctive treatment after ESWL in patient with distal ureteral stones: do we really need ? Result from a randomized study. Urol Res 2007;35:231-5.
5. Picozzi SC, Marenghi C, Casellato S, Ricci C, Gaeta M, Carmignani L. Management of ureteral calculi and Medical Expulsive therapy in emergency department. J Emerg
RESULT
Stone size 6-7mm in group 1, out of 9 patients, stone clearance was achieved in 8 patients within 6 days, (SR-88%); and in group 2, out of 8 patients stone clearance was achieved in 6 patients within 5 days, (SR
Trauma Shock 2011;4:70-6.
6. De Sio M, Autorino R, Di Lorenzo G, Damiano R, Giordano D, Cosentino L, et al. Medical expulsive treatment of distal-ureteral stones using Tamsulosin: a single – center experience. J Endourol 2006;20:12-6.
7. Cooper JT, Stack GM, and Cooper TM. Intensive medical management of ureteral calculi. Urology 2000;56:575-8.
75%).
Stone size 7-8mm in group 1, out of 7 patients, stone clearance was
8. Tilakv M, Bhamare N. Progesteron Hydrotherapy in Management of Small, Mid and Lower ureteric calculi; International Journal of Recent Trends in Science and Technology 2012;4:90–3.
9. 2007 AUA Guidelines for the management of Ueteral Calculi.
achieved in 7 patients within 6 days (SR-100%); and in group 2, out of 9 patients stone clearance was achieved in 8 patients within 8 days, (SR-88.8%).
Stone size 8-9mm size in group 1, out of 5 patients, stone clearance was achieved in 4 patients within 5 days (SR-80%); and in group 2, out of 5 patients stone clearance was achieved in 3 patients within 11 days, (SR-60%).
Stone size 9-10 mm size stone in group 1, out of 4 patients, stone clearance was achieved in 4 patients within 10 days (SR- 100%); and in group 2, out of 3 patients stone clearance was achieved in 1 patients within 14 days, (SR-33.3%).
Table-1: Success rate of stone expulsion
Size of the Stone
Group Total Patients
stones cleared
Stone cleared in days
Success Rate
6-7 mm 1 9 8 6 88.8%
2 8 6 5 75%
7-8 mm 1 7 7 6 100%
2 9 8 8 88.8%
8-9 mm 1 5 4 5 80%
2 5 3 11 60%
9-10 mm 1 4 4 10 100%
2 3 1 14 33.3%
DISCUSSION
Nephrolithiasis is a very common problem. Patients often stones of different sizes. Small stones pass spontaneous usually but patients experience severe ureteric colic during passage of stone. Spontaneous passage of ureteric stone depends on stone size, site, anatomy of ureter and past history of stone passage.(11)
Median probability of stone passage is 68% for stone < 5 mm size and 47% for stones of 5 mm – 10 mm.(9)The MET aims at passage of stone with minimum discomfort to the patient.
Number of drugs have been used for the same purpose like corticosteroids, hormones, NSAIDs, calcium channel blockers and α–1 adrenergic blockers. Corticosteroids decrease the inflammation around the ureter.[8] Calcium channel blockers suppress smooth muscle contraction and reduce ureteral spasm, α-1 adrenergic blockers act by decreasing ureteral muscle tone and frequency and force of peristalsis.[7]
We have compared the effectiveness of α-1 blockers with α-1 blockers + corticosteroids. Group 1 was given only α-1 blocker+corticosteroid and Group 2 was given α-1 blocker alone. α-1 blocker used was Tamsulosin and Corticosteroid used was Deflazacort. Deflazacort is a good anti edemic drug[10], well tolerated with limited side effects. In our study we consistently found better stone clearance rate and earlier passage of stone across all stone sizes in Group1 i.e Tamsulosin + Deflazacort group. Range of Stone size in our study varied from 6-10 mm.
CONCLUSION
MET using Tamsulosin has definite role in passage of smaller size
10. Francesco Porpiglia etal Corticostroids and Tamsulosin in the Medical Expulsive therapy for symptomatic distal ureter stones: Single drug or Association? European urology 50 (2006) 339-344.
11. Hubner, W. A., Irby, P. and Stoller, M. L.: Natural history and current concepts for the treatment of small ureteral calculi. EurUrol, 24: 172, 1993.
12. Tilakv M, Bhamare N. Progesteron Hydrotherapy in Management of Small, Mid and Lower ureteric calculi; International Journal of Recent Trends in Science and Technology 2012;4:90–3.
13. Hancock AA. α 1- adreno receptor sub types : a synopsis of their pharmacology & molecular biology. Drug Dev Res 1996;39:54-107.
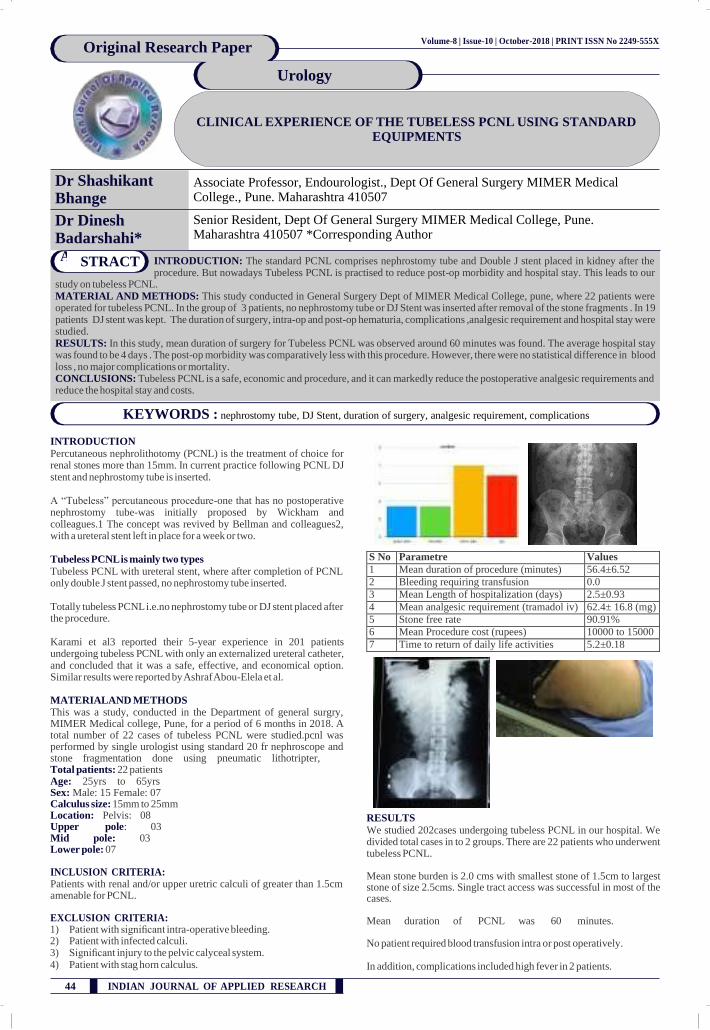
Volume-8 | Issue-10 | October-2018 | PRINT ISSN No 2249-555X Original Research Paper
Urology
44 INDIAN JOURNAL OF APPLIED RESEARCH
CLINICAL EXPERIENCE OF THE TUBELESS PCNL USING STANDARD
EQUIPMENTS
Dr Shashikant Bhange
STRACT INTRODUCTION: The standard PCNL comprises nephrostomy tube and Double J stent placed in kidney after the procedure. But nowadays Tubeless PCNL is practised to reduce post-op morbidity and hospital stay. This leads to our
study on tubeless PCNL. MATERIAL AND METHODS: This study conducted in General Surgery Dept of MIMER Medical College, pune, where 22 patients were operated for tubeless PCNL. In the group of 3 patients, no nephrostomy tube or DJ Stent was inserted after removal of the stone fragments . In 19 patients DJ stent was kept. The duration of surgery, intra-op and post-op hematuria, complications ,analgesic requirement and hospital stay were studied. RESULTS: In this study, mean duration of surgery for Tubeless PCNL was observed around 60 minutes was found. The average hospital stay was found to be 4 days . The post-op morbidity was comparatively less with this procedure. However, there were no statistical difference in blood loss , no major complications or mortality. CONCLUSIONS: Tubeless PCNL is a safe, economic and procedure, and it can markedly reduce the postoperative analgesic requirements and reduce the hospital stay and costs.
KEYWORDS : nephrostomy tube, DJ Stent, duration of surgery, analgesic requirement, complications
AB
Dr Dinesh Badarshahi*
Associate Professor, Endourologist., Dept Of General Surgery MIMER Medical College., Pune. Maharashtra 410507
Senior Resident, Dept Of General Surgery MIMER Medical College, Pune. Maharashtra 410507 *Corresponding Author
INTRODUCTION
Percutaneous nephrolithotomy (PCNL) is the treatment of choice for renal stones more than 15mm. In current practice following PCNL DJ stent and nephrostomy tube is inserted.
A “Tubeless” percutaneous procedure-one that has no postoperative nephrostomy tube-was initially proposed by Wickham and colleagues.1 The concept was revived by Bellman and colleagues2, with a ureteral stent left in place for a week or two.
Tubeless PCNL is mainly two types
Tubeless PCNL with ureteral stent, where after completion of PCNL only double J stent passed, no nephrostomy tube inserted.
Totally tubeless PCNL i.e.no nephrostomy tube or DJ stent placed after the procedure.
Karami et al3 reported their 5-year experience in 201 patients undergoing tubeless PCNL with only an externalized ureteral catheter, and concluded that it was a safe, effective, and economical option. Similar results were reported by Ashraf Abou-Elela et al.
MATERIALAND METHODS This was a study, conducted in the Department of general surgry, MIMER Medical college, Pune, for a period of 6 months in 2018. A total number of 22 cases of tubeless PCNL were studied.pcnl was performed by single urologist using standard 20 fr nephroscope and stone fragmentation done using pneumatic lithotripter, Total patients: 22 patients Age: 25yrs to 65yrs Sex: Male: 15 Female: 07 Calculus size: 15mm to 25mm Location: Pelvis: 08 Upper pole: 03 Mid pole: 03 Lower pole: 07
INCLUSION CRITERIA: Patients with renal and/or upper uretric calculi of greater than 1.5cm amenable for PCNL.
EXCLUSION CRITERIA: 1) Patient with significant intra-operative bleeding. 2) Patient with infected calculi. 3) Significant injury to the pelvic calyceal system. 4) Patient with stag horn calculus.
S No Parametre Values
1 Mean duration of procedure (minutes) 56.4±6.52
2 Bleeding requiring transfusion 0.0
3 Mean Length of hospitalization (days) 2.5±0.93
4 Mean analgesic requirement (tramadol iv) 62.4± 16.8 (mg)
5 Stone free rate 90.91%
6 Mean Procedure cost (rupees) 10000 to 15000
7 Time to return of daily life activities 5.2±0.18
RESULTS
We studied 202cases undergoing tubeless PCNL in our hospital. We divided total cases in to 2 groups. There are 22 patients who underwent tubeless PCNL.
Mean stone burden is 2.0 cms with smallest stone of 1.5cm to largest stone of size 2.5cms. Single tract access was successful in most of the cases.
Mean duration of PCNL was 60 minutes.
No patient required blood transfusion intra or post operatively.
In addition, complications included high fever in 2 patients.
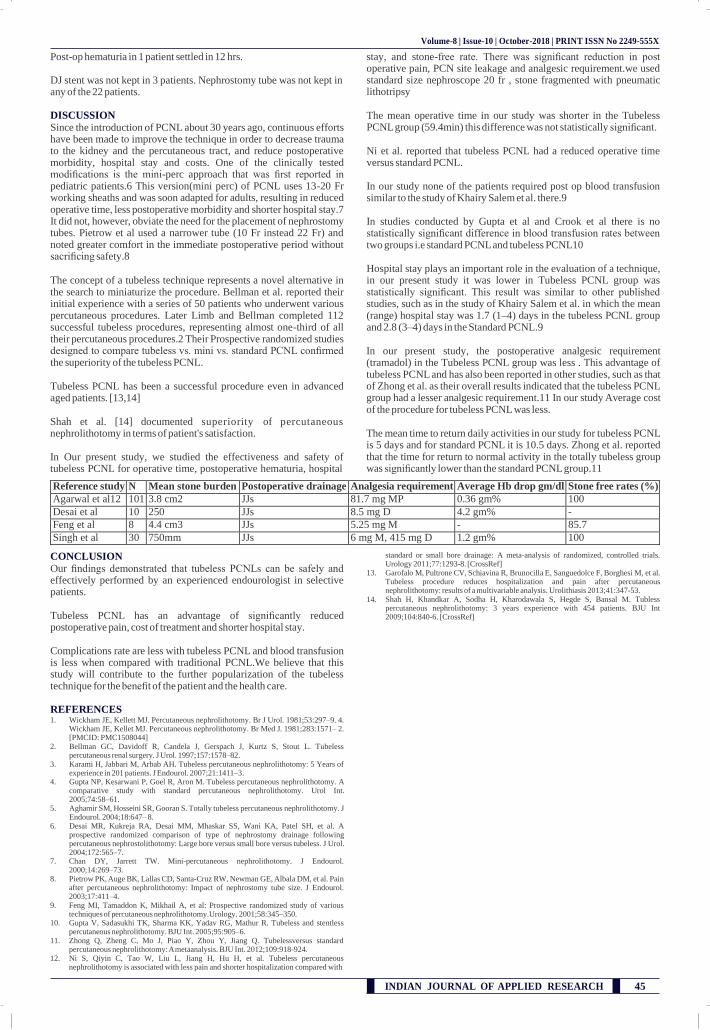
Volume-8 | Issue-10 | October-2018 | PRINT ISSN No 2249-555X
INDIAN JOURNAL OF APPLIED RESEARCH 45
Post-op hematuria in 1 patient settled in 12 hrs.
DJ stent was not kept in 3 patients. Nephrostomy tube was not kept in any of the 22 patients.
DISCUSSION
Since the introduction of PCNL about 30 years ago, continuous efforts have been made to improve the technique in order to decrease trauma to the kidney and the percutaneous tract, and reduce postoperative morbidity, hospital stay and costs. One of the clinically tested modifications is the mini-perc approach that was first reported in pediatric patients.6 This version(mini perc) of PCNL uses 13-20 Fr working sheaths and was soon adapted for adults, resulting in reduced operative time, less postoperative morbidity and shorter hospital stay.7 It did not, however, obviate the need for the placement of nephrostomy tubes. Pietrow et al used a narrower tube (10 Fr instead 22 Fr) and noted greater comfort in the immediate postoperative period without sacrificing safety.8
The concept of a tubeless technique represents a novel alternative in the search to miniaturize the procedure. Bellman et al. reported their initial experience with a series of 50 patients who underwent various percutaneous procedures. Later Limb and Bellman completed 112 successful tubeless procedures, representing almost one-third of all their percutaneous procedures.2 Their Prospective randomized studies designed to compare tubeless vs. mini vs. standard PCNL confirmed the superiority of the tubeless PCNL.
Tubeless PCNL has been a successful procedure even in advanced aged patients. [13,14]
Shah et al. [14] documented superiority of percutaneous nephrolithotomy in terms of patient's satisfaction.
In Our present study, we studied the effectiveness and safety of tubeless PCNL for operative time, postoperative hematuria, hospital
stay, and stone-free rate. There was significant reduction in post operative pain, PCN site leakage and analgesic requirement.we used standard size nephroscope 20 fr , stone fragmented with pneumatic lithotripsy
The mean operative time in our study was shorter in the Tubeless PCNL group (59.4min) this difference was not statistically significant.
Ni et al. reported that tubeless PCNL had a reduced operative time versus standard PCNL.
In our study none of the patients required post op blood transfusion similar to the study of Khairy Salem et al. there.9
In studies conducted by Gupta et al and Crook et al there is no statistically significant difference in blood transfusion rates between two groups i.e standard PCNL and tubeless PCNL10
Hospital stay plays an important role in the evaluation of a technique, in our present study it was lower in Tubeless PCNL group was statistically significant. This result was similar to other published studies, such as in the study of Khairy Salem et al. in which the mean (range) hospital stay was 1.7 (1–4) days in the tubeless PCNL group and 2.8 (3–4) days in the Standard PCNL.9
In our present study, the postoperative analgesic requirement (tramadol) in the Tubeless PCNL group was less . This advantage of tubeless PCNL and has also been reported in other studies, such as that of Zhong et al. as their overall results indicated that the tubeless PCNL group had a lesser analgesic requirement.11 In our study Average cost of the procedure for tubeless PCNL was less.
The mean time to return daily activities in our study for tubeless PCNL is 5 days and for standard PCNL it is 10.5 days. Zhong et al. reported that the time for return to normal activity in the totally tubeless group was significantly lower than the standard PCNL group.11
Reference study N Mean stone burden Postoperative drainage Analgesia requirement Average Hb drop gm/dl Stone free rates (%)
Agarwal et al12 101 3.8 cm2 JJs 81.7 mg MP 0.36 gm% 100
Desai et al 10 250 JJs 8.5 mg D 4.2 gm% -
Feng et al 8 4.4 cm3 JJs 5.25 mg M - 85.7
Singh et al 30 750mm JJs 6 mg M, 415 mg D 1.2 gm% 100
CONCLUSION
Our findings demonstrated that tubeless PCNLs can be safely and effectively performed by an experienced endourologist in selective patients.
Tubeless PCNL has an advantage of significantly reduced postoperative pain, cost of treatment and shorter hospital stay.
Complications rate are less with tubeless PCNL and blood transfusion is less when compared with traditional PCNL.We believe that this study will contribute to the further popularization of the tubeless technique for the benefit of the patient and the health care.
REFERENCES 1. Wickham JE, Kellett MJ. Percutaneous nephrolithotomy. Br J Urol. 1981;53:297–9. 4.
Wickham JE, Kellet MJ. Percutaneous nephrolithotomy. Br Med J. 1981;283:1571– 2. [PMCID: PMC1508044]
2. Bellman GC, Davidoff R, Candela J, Gerspach J, Kurtz S, Stout L. Tubeless percutaneous renal surgery. J Urol. 1997;157:1578–82.
3. Karami H, Jabbari M, Arbab AH. Tubeless percutaneous nephrolithotomy: 5 Years of experience in 201 patients. J Endourol. 2007;21:1411–3.
4. Gupta NP, Kesarwani P, Goel R, Aron M. Tubeless percutaneous nephrolithotomy. A comparative study with standard percutaneous nephrolithotomy. Urol Int. 2005;74:58–61.
5. Aghamir SM, Hosseini SR, Gooran S. Totally tubeless percutaneous nephrolithotomy. J Endourol. 2004;18:647– 8.
6. Desai MR, Kukreja RA, Desai MM, Mhaskar SS, Wani KA, Patel SH, et al. A prospective randomized comparison of type of nephrostomy drainage following percutaneous nephrostolithotomy: Large bore versus small bore versus tubeless. J Urol. 2004;172:565–7.
7. Chan DY, Jarrett TW. Mini-percutaneous nephrolithotomy. J Endourol. 2000;14:269–73.
8. Pietrow PK, Auge BK, Lallas CD, Santa-Cruz RW, Newman GE, Albala DM, et al. Pain after percutaneous nephrolithotomy: Impact of nephrostomy tube size. J Endourol. 2003;17:411–4.
9. Feng MI, Tamaddon K, Mikhail A, et al: Prospective randomized study of various techniques of percutaneous nephrolithotomy.Urology. 2001;58:345–350.
10. Gupta V, Sadasukhi TK, Sharma KK, Yadav RG, Mathur R. Tubeless and stentless percutaneous nephrolithotomy. BJU Int. 2005;95:905–6.
11. Zhong Q, Zheng C, Mo J, Piao Y, Zhou Y, Jiang Q. Tubelessversus standard percutaneous nephrolithotomy: A metaanalysis. BJU Int. 2012;109:918-924.
12. Ni S, Qiyin C, Tao W, Liu L, Jiang H, Hu H, et al. Tubeless percutaneous nephrolithotomy is associated with less pain and shorter hospitalization compared with
standard or small bore drainage: A meta-analysis of randomized, controlled trials. Urology 2011;77:1293-8. [CrossRef]
13. Garofalo M, Pultrone CV, Schiavina R, Brunocilla E, Sanguedolce F, Borghesi M, et al. Tubeless procedure reduces hospitalization and pain after percutaneous nephrolithotomy: results of a multivariable analysis. Urolithiasis 2013;41:347-53.
14. Shah H, Khandkar A, Sodha H, Kharodawala S, Hegde S, Bansal M. Tubless percutaneous nephrolithotomy: 3 years experience with 454 patients. BJU Int 2009;104:840-6. [CrossRef]
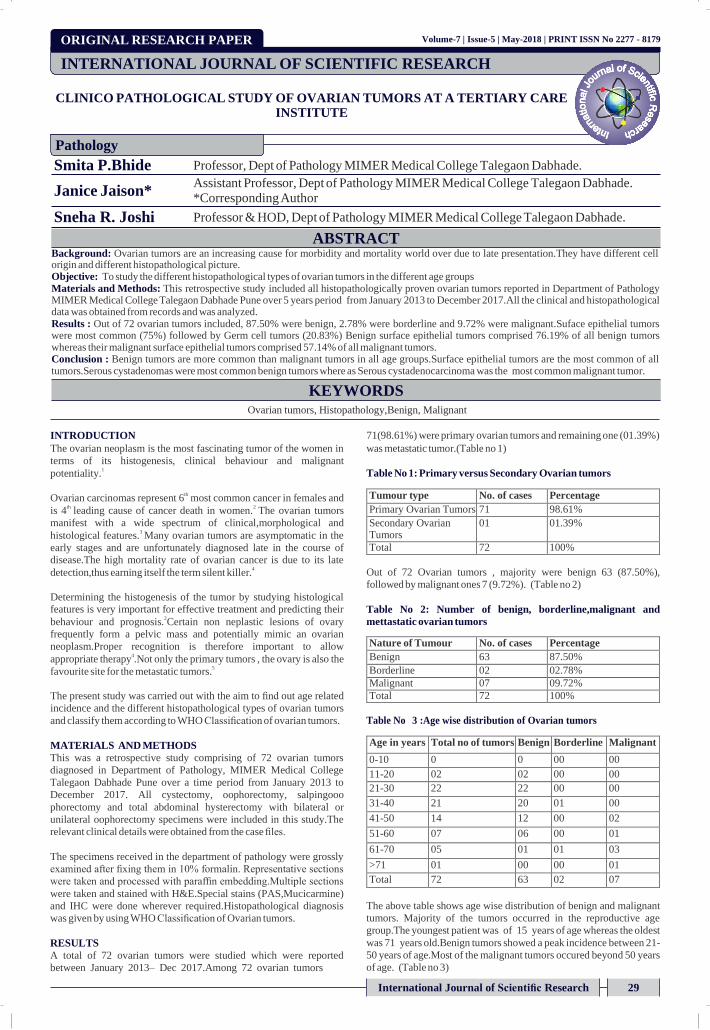
International Journal of Scientific Research 29
Smita P.Bhide Professor, Dept of Pathology MIMER Medical College Talegaon Dabhade.
Assistant Professor, Dept of Pathology MIMER Medical College Talegaon Dabhade. *Corresponding Author
Sneha R. Joshi Professor & HOD, Dept of Pathology MIMER Medical College Talegaon Dabhade.
Background: Ovarian tumors are an increasing cause for morbidity and mortality world over due to late presentation.They have different cell origin and different histopathological picture. Objective: To study the different histopathological types of ovarian tumors in the different age groups Materials and Methods: This retrospective study included all histopathologically proven ovarian tumors reported in Department of Pathology MIMER Medical College Talegaon Dabhade Pune over 5 years period from January 2013 to December 2017.All the clinical and histopathological data was obtained from records and was analyzed. Results : Out of 72 ovarian tumors included, 87.50% were benign, 2.78% were borderline and 9.72% were malignant.Suface epithelial tumors were most common (75%) followed by Germ cell tumors (20.83%) Benign surface epithelial tumors comprised 76.19% of all benign tumors whereas their malignant surface epithelial tumors comprised 57.14% of all malignant tumors. Conclusion : Benign tumors are more common than malignant tumors in all age groups.Surface epithelial tumors are the most common of all tumors.Serous cystadenomas were most common benign tumors where as Serous cystadenocarcinoma was the most common malignant tumor.
INTRODUCTION
Ovarian tumors, Histopathology,Benign, Malignant
71(98.61%) were primary ovarian tumors and remaining one (01.39%)
The ovarian neoplasm is the most fascinating tumor of the women in
terms of its histogenesis, clinical behaviour and malignant
potentiality.1
Ovarian carcinomas represent 6th
most common cancer in females and
is 4th
leading cause of cancer death in women.2 The ovarian tumors
manifest with a wide spectrum of clinical,morphological and
histological features.3 Many ovarian tumors are asymptomatic in the
early stages and are unfortunately diagnosed late in the course of
disease.The high mortality rate of ovarian cancer is due to its late
detection,thus earning itself the term silent killer.4
Determining the histogenesis of the tumor by studying histological features is very important for effective treatment and predicting their
behaviour and prognosis.2Certain non neplastic lesions of ovary
frequently form a pelvic mass and potentially mimic an ovarian
neoplasm.Proper recognition is therefore important to allow
appropriate therapy4.Not only the primary tumors , the ovary is also the
favourite site for the metastatic tumors.5
The present study was carried out with the aim to find out age related
incidence and the different histopathological types of ovarian tumors
and classify them according to WHO Classification of ovarian tumors.
MATERIALS AND METHODS
This was a retrospective study comprising of 72 ovarian tumors
diagnosed in Department of Pathology, MIMER Medical College
Talegaon Dabhade Pune over a time period from January 2013 to
December 2017. All cystectomy, oophorectomy, salpingooo
phorectomy and total abdominal hysterectomy with bilateral or
unilateral oophorectomy specimens were included in this study.The
relevant clinical details were obtained from the case files.
The specimens received in the department of pathology were grossly
examined after fixing them in 10% formalin. Representative sections
were taken and processed with paraffin embedding.Multiple sections
were taken and stained with H&E.Special stains (PAS,Mucicarmine)
and IHC were done wherever required.Histopathological diagnosis
was given by using WHO Classification of Ovarian tumors.
RESULTS
A total of 72 ovarian tumors were studied which were reported
between January 2013– Dec 2017.Among 72 ovarian tumors
was metastatic tumor.(Table no 1)
Table No 1: Primary versus Secondary Ovarian tumors
Tumour type No. of cases Percentage
Primary Ovarian Tumors 71 98.61%
Secondary Ovarian Tumors
01 01.39%
Total 72 100%
Out of 72 Ovarian tumors , majority were benign 63 (87.50%),
followed by malignant ones 7 (9.72%). (Table no 2)
Table No 2: Number of benign, borderline,malignant and
mettastatic ovarian tumors
Nature of Tumour No. of cases Percentage
Benign 63 87.50%
Borderline 02 02.78%
Malignant 07 09.72%
Total 72 100%
Table No 3 :Age wise distribution of Ovarian tumors
Age in years Total no of tumors Benign Borderline Malignant
0-10 0 0 00 00
11-20 02 02 00 00
21-30 22 22 00 00
31-40 21 20 01 00
41-50 14 12 00 02
51-60 07 06 00 01
61-70 05 01 01 03
>71 01 00 00 01
Total 72 63 02 07
The above table shows age wise distribution of benign and malignant
tumors. Majority of the tumors occurred in the reproductive age
group.The youngest patient was of 15 years of age whereas the oldest
was 71 years old.Benign tumors showed a peak incidence between 21-
50 years of age.Most of the malignant tumors occured beyond 50 years
of age. (Table no 3)
KEYWORDS
ABSTRACT
ORIGINAL RESEARCH PAPER Volume-7 | Issue-5 | May-2018 | PRINT ISSN No 2277 - 8179
INTERNATIONAL JOURNAL OF SCIENTIFIC RESEARCH
CLINICO PATHOLOGICAL STUDY OF OVARIAN TUMORS AT A TERTIARY CARE INSTITUTE
Pathology
Janice Jaison*
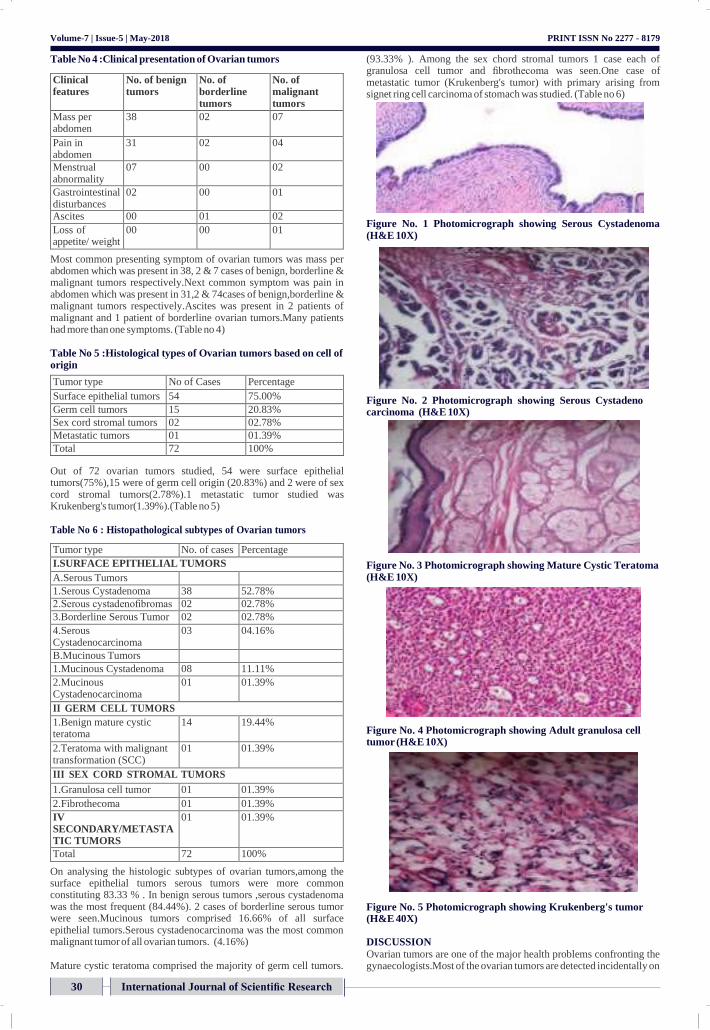
Volume-7 | Issue-5 | May-2018
Table No 4 :Clinical presentation of Ovarian tumors
Clinical features
No. of benign tumors
No. of borderline tumors
No. of malignant tumors
Mass per abdomen
38 02 07
Pain in abdomen
31 02 04
Menstrual abnormality
07 00 02
Gastrointestinal disturbances
02 00 01
Ascites 00 01 02
Loss of appetite/ weight
00 00 01
Most common presenting symptom of ovarian tumors was mass per abdomen which was present in 38, 2 & 7 cases of benign, borderline & malignant tumors respectively.Next common symptom was pain in abdomen which was present in 31,2 & 74cases of benign,borderline & malignant tumors respectively.Ascites was present in 2 patients of malignant and 1 patient of borderline ovarian tumors.Many patients had more than one symptoms. (Table no 4)
Table No 5 :Histological types of Ovarian tumors based on cell of origin
Tumor type No of Cases Percentage
Surface epithelial tumors 54 75.00%
Germ cell tumors 15 20.83%
Sex cord stromal tumors 02 02.78%
Metastatic tumors 01 01.39%
Total 72 100%
Out of 72 ovarian tumors studied, 54 were surface epithelial tumors(75%),15 were of germ cell origin (20.83%) and 2 were of sex cord stromal tumors(2.78%).1 metastatic tumor studied was Krukenberg's tumor(1.39%).(Table no 5)
Table No 6 : Histopathological subtypes of Ovarian tumors
Tumor type No. of cases Percentage
I.SURFACE EPITHELIAL TUMORS
A.Serous Tumors
1.Serous Cystadenoma 38 52.78%
2.Serous cystadenofibromas 02 02.78%
3.Borderline Serous Tumor 02 02.78%
4.Serous Cystadenocarcinoma
03 04.16%
B.Mucinous Tumors
1.Mucinous Cystadenoma 08 11.11%
2.Mucinous Cystadenocarcinoma
01 01.39%
II GERM CELL TUMORS
1.Benign mature cystic teratoma
14 19.44%
2.Teratoma with malignant transformation (SCC)
01 01.39%
III SEX CORD STROMAL TUMORS
1.Granulosa cell tumor 01 01.39%
2.Fibrothecoma 01 01.39%
IV SECONDARY/METASTA TIC TUMORS
01 01.39%
Total 72 100%
On analysing the histologic subtypes of ovarian tumors,among the surface epithelial tumors serous tumors were more common constituting 83.33 % . In benign serous tumors ,serous cystadenoma was the most frequent (84.44%). 2 cases of borderline serous tumor were seen.Mucinous tumors comprised 16.66% of all surface epithelial tumors.Serous cystadenocarcinoma was the most common malignant tumor of all ovarian tumors. (4.16%)
Mature cystic teratoma comprised the majority of germ cell tumors.
PRINT ISSN No 2277 - 8179
(93.33% ). Among the sex chord stromal tumors 1 case each of granulosa cell tumor and fibrothecoma was seen.One case of metastatic tumor (Krukenberg's tumor) with primary arising from signet ring cell carcinoma of stomach was studied. (Table no 6)
Figure No. 1 Photomicrograph showing Serous Cystadenoma (H&E 10X)
Figure No. 2 Photomicrograph showing Serous Cystadeno carcinoma (H&E 10X)
Figure No. 3 Photomicrograph showing Mature Cystic Teratoma (H&E 10X)
Figure No. 4 Photomicrograph showing Adult granulosa cell tumor (H&E 10X)
Figure No. 5 Photomicrograph showing Krukenberg's tumor (H&E 40X)
DISCUSSION
Ovarian tumors are one of the major health problems confronting the gynaecologists.Most of the ovarian tumors are detected incidentally on
International Journal of Scientific Research 30
International Journal of Scientific Research 31
Volume-7 | Issue-5 | May-2018
imaging studies in patients who come to OPD for vague abdominal
PRINT ISSN No 2277 - 8179
4 Vinitha Wills,Rachel Mathew.A study on clinico-histopathological patterns of ovarian
pain. In the early stages ovarian tumors remain silent.The symptoms are nonspecific like abdiminal discomfort,dyspepsia and dull aching
tumors.Int J Reprod Contacept Obstet and Gynecol.2016Aug;5(8):2666-71 5 Gupta N,Bishat D,Agarwal AK, Sharma VK.Retrospective and prospective study of
ovarian tumors and tumor-like lesions. Indian J Pathol Microbiol 2007;50(3):525-7
pain.The symptoms may remain vague till the patient has an acute emergency like torsion or rupture of ovarian tumor.There is marked
6 Monika Malli,Bhavesh Vyas,Sunita Gupta, Hitendra Desai.A Histological Study of Ovarian Tumors in Different Age Groups.International Journal of Medical Science and
variation in the clinical presentation as well as histopathological types of ovarian tumors.
Majority of the ovarian tumors occured during reproductive age group.In the present study , the maximum number ( 59.72% ) of benign tumors were observed between the age group 20-40 years which is the active reproductive life where as majority of malignant tumors ( 71.42%) occurred after 50 years of age.Similar findings were noted by Vissa Shanthi et al2, ,Monica Malli et al6, and Vinitha Wills & Rachel Mathew.4
Most of the benign and malignant ovarian tumors presented with mass per abdomen and pain in abdomen which is comparable with the studies done by Vissa Shanthi et al
2& S Kayastha
1
Out of 72 Ovarian tumors, majority 63(87.50%) were benign, 02 ( 2.78%) were borderline and 7 ( 9.72% ) were malignant. These findings are comparable with Vissa Shanthi et al,
2 Monica Malli et
al6,Vinitha Wills & Rachel Mathew
4 ,S Kayastha
1 and Ghosh A et al
7. In
all these studies majority of the ovarian tumors were benign .
Out of 72 ovarian tumors studied,54 were surface epithelial tumors constituting the commonest type accounting for 75%.Studies done by Vissa Shanthi et al
2 (84.62%),Monica Malli et al
6 (78%),Vinitha Wills
& Rachel Mathew4
(71.42%),S Kayastha1
(72.6%)and Ghosh A7
(52.56%) also showed that surface epithelial tumors were the commonest among ovarian tumors.
In present study serous tumors constituted 83.33 % of surface epithelial ovarian tumors which is in accordance with studies done by Vissa Shanthi et al
2(78.78%) ,Monica Malli et al
6 (61.53%),Vinitha
Wills & Rachel Mathew4(65%) ,S Kayastha
1(55%) and Ghosh A et al
7
(67.44% ).In serous tumors,serous cystadenoma was the most common tumor (84.44%). Studies done by Vissa Shanthi et al
2(83.65%) ,Monica Malli et al
6 (72.91%),Vinitha Wills & Rachel
Mathew4
(96.15%) and Ghosh A et al7
(76.77%) showed similar findings.Serous cyst adenocarcinoma constitued 6.66% of all serous tumors which is comparable with the studies done by Vissa Shanthi et al
2(2.88%) ,Vinitha Wills & Rachel Mathew
4(3.84%).Mucinous
tumors were seen in 16.66% of surface epithelial ovarian tumors where as this figure was 20.45% & 25.58% in studies done by Vissa Shanthi et al
2 and Ghosh A et al
7 respectively.
In present study germ cell tumors constituted 20.83% of cases, and mautre cystic teratoma was the most common germ cell tumor. Similar findings were noted by Vissa Shanthi et al
2(10.90%) ,Monica Malli et
al6
(14%),Vinitha Wills & Rachel Mathew4
(23.20%) and S Kayastha
1(26.31%) .
In present study, sex cord stromal tumors constituted 2.78% of cases where as metastatic tumors comprised 1.39% of cases. Vissa Shanthi et al
2(3.84% & 0.64%),Monica Malli et al
6 (5% &3%), and Ghosh A et al
7
( 1.95 % & 1.71%) showed similar findings.
CONCLUSION
Benign ovarian tumors are more common than malignant tumors for all age groups.Most common histological types are Surface epithelial tumors constituting the bulk of both benign and malignant tumors followed by Germ cell tumors.Benign ovarian tumors occur more commonly in reproductive age group. Most of the malignant tumors occur beyond 50 years of age.Mass per abdomen and pain in abdomen are the most common clinical presentation.Though the imaging techniques and clinical examination help in detecting ovarian tumors, histopathological examination is the gold standerd for the typing of ovarian tumor and its histogenesis which affects the treatment and prognosis of the tumor.
REFERENCES 1 S Kayastha.Study of ovarian tumors in Nepal Medical College Teaching HospitalNepal
Med J 2009:11(3):200-02 2 Vissa Shanthi et al Clinico Pathological Study of Ovarian Tumors – A Retrospective ans
Prospective 5 Years Study.Journal Of Medical Science And Clinical Research.vol June 2016;4(6):10880-85
3 Shah PK,Shroff CP,Deodhar KP,Vaidya PR.Ovarian tumors in childhood and
adolescence.J Obstet & Gynaecol 1991;41(3):394-402

1 3
Public Health.2014;3(3):338-41 7 Ghosh A,Ghartmagar D,Thapa S, Sathian B, Narasimhan R, Talwar op. Ovarian
Tumors: Pattern of Histomorphological Types – 10 Years Study in a Tertiary Referral Center and Review of Literature. Kathmandu Univ Med J 2016;54(2):153-8
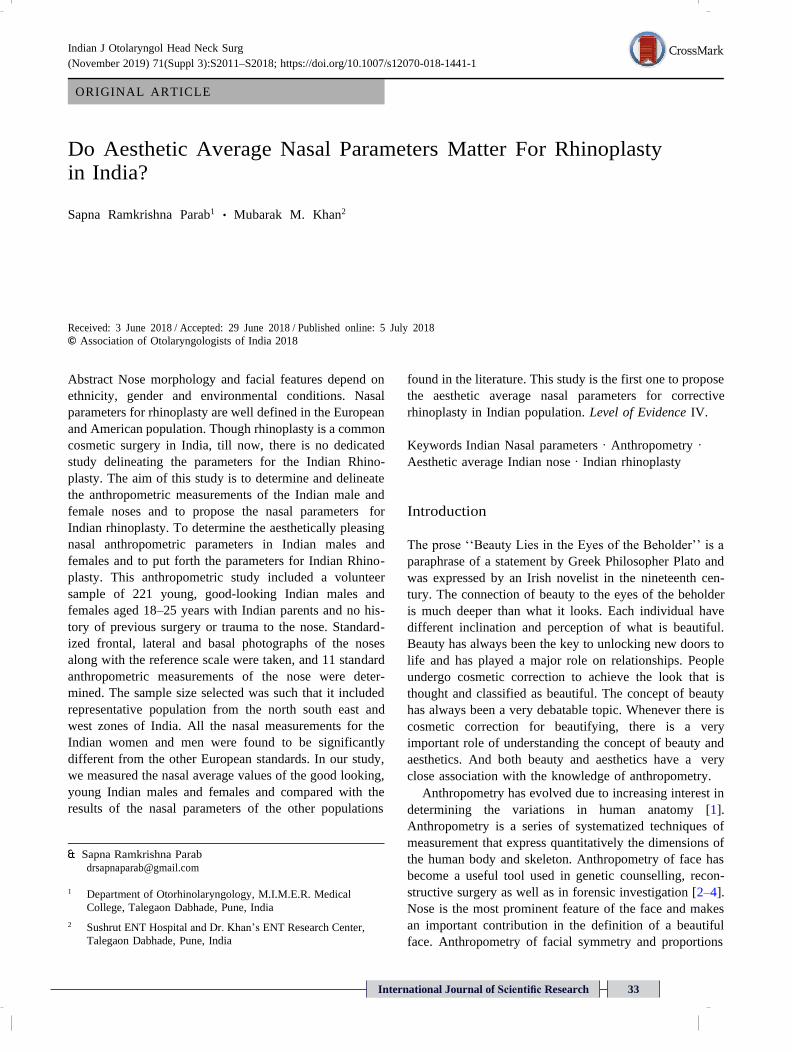
International Journal of Scientific Research 33
ORIGINAL ARTICLE
Indian J Otolaryngol Head Neck Surg
(November 2019) 71(Suppl 3):S2011–S2018; https://doi.org/10.1007/s12070-018-1441-1
Do Aesthetic Average Nasal Parameters Matter For Rhinoplasty in India?
Sapna Ramkrishna Parab1 • Mubarak M. Khan2
Received: 3 June 2018 / Accepted: 29 June 2018 / Published online: 5 July 2018
© Association of Otolaryngologists of India 2018
Abstract Nose morphology and facial features depend on
ethnicity, gender and environmental conditions. Nasal
parameters for rhinoplasty are well defined in the European
and American population. Though rhinoplasty is a common
cosmetic surgery in India, till now, there is no dedicated
study delineating the parameters for the Indian Rhino-
plasty. The aim of this study is to determine and delineate
the anthropometric measurements of the Indian male and
female noses and to propose the nasal parameters for
Indian rhinoplasty. To determine the aesthetically pleasing
nasal anthropometric parameters in Indian males and
females and to put forth the parameters for Indian Rhino-
plasty. This anthropometric study included a volunteer
sample of 221 young, good-looking Indian males and
females aged 18–25 years with Indian parents and no his-
tory of previous surgery or trauma to the nose. Standard-
ized frontal, lateral and basal photographs of the noses
along with the reference scale were taken, and 11 standard
anthropometric measurements of the nose were deter-
mined. The sample size selected was such that it included
representative population from the north south east and
west zones of India. All the nasal measurements for the
Indian women and men were found to be significantly
different from the other European standards. In our study,
we measured the nasal average values of the good looking,
young Indian males and females and compared with the
results of the nasal parameters of the other populations
& Sapna Ramkrishna Parab
1 Department of Otorhinolaryngology, M.I.M.E.R. Medical
College, Talegaon Dabhade, Pune, India
2 Sushrut ENT Hospital and Dr. Khan’s ENT Research Center,
Talegaon Dabhade, Pune, India
found in the literature. This study is the first one to propose
the aesthetic average nasal parameters for corrective
rhinoplasty in Indian population. Level of Evidence IV.
Keywords Indian Nasal parameters · Anthropometry ·
Aesthetic average Indian nose · Indian rhinoplasty
Introduction
The prose ‘‘Beauty Lies in the Eyes of the Beholder’’ is a
paraphrase of a statement by Greek Philosopher Plato and
was expressed by an Irish novelist in the nineteenth cen-
tury. The connection of beauty to the eyes of the beholder
is much deeper than what it looks. Each individual have
different inclination and perception of what is beautiful.
Beauty has always been the key to unlocking new doors to
life and has played a major role on relationships. People
undergo cosmetic correction to achieve the look that is
thought and classified as beautiful. The concept of beauty
has always been a very debatable topic. Whenever there is
cosmetic correction for beautifying, there is a very
important role of understanding the concept of beauty and
aesthetics. And both beauty and aesthetics have a very
close association with the knowledge of anthropometry.
Anthropometry has evolved due to increasing interest in
determining the variations in human anatomy [1].
Anthropometry is a series of systematized techniques of
measurement that express quantitatively the dimensions of
the human body and skeleton. Anthropometry of face has
become a useful tool used in genetic counselling, recon-
structive surgery as well as in forensic investigation [2–4].
Nose is the most prominent feature of the face and makes
an important contribution in the definition of a beautiful
face. Anthropometry of facial symmetry and proportions
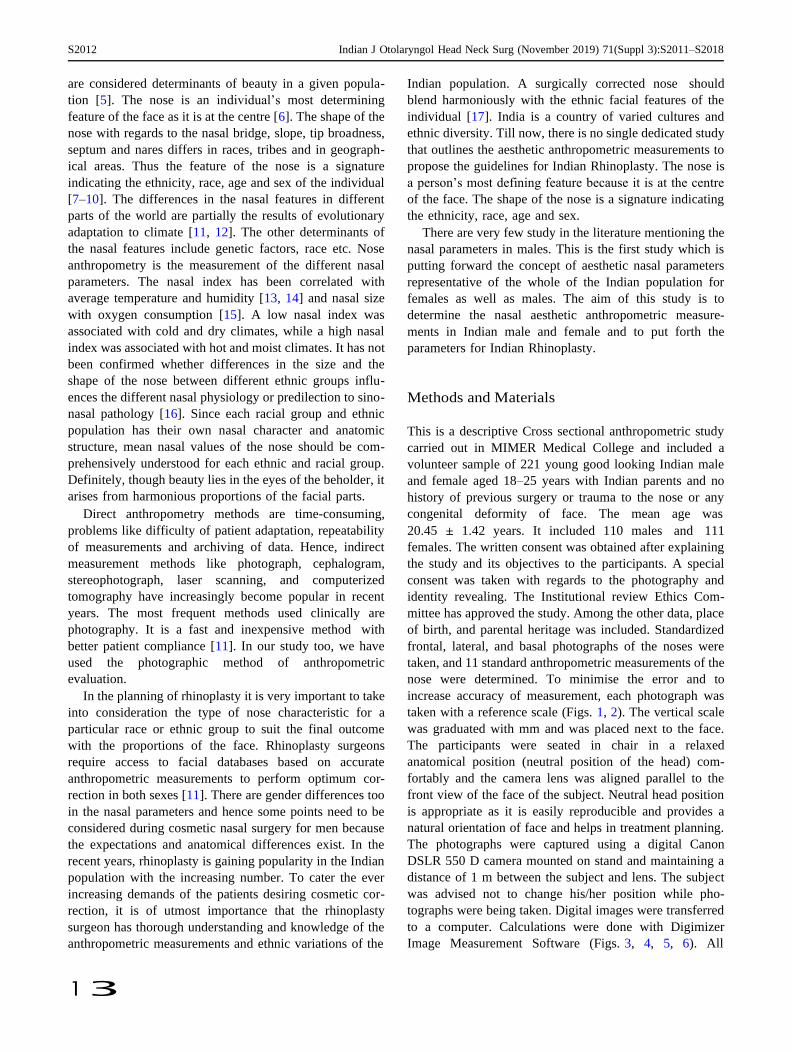
S2012 Indian J Otolaryngol Head Neck Surg (November 2019) 71(Suppl 3):S2011–S2018
1 3
are considered determinants of beauty in a given popula-
tion [5]. The nose is an individual’s most determining
feature of the face as it is at the centre [6]. The shape of the
nose with regards to the nasal bridge, slope, tip broadness,
septum and nares differs in races, tribes and in geograph-
ical areas. Thus the feature of the nose is a signature
indicating the ethnicity, race, age and sex of the individual
[7–10]. The differences in the nasal features in different
parts of the world are partially the results of evolutionary
adaptation to climate [11, 12]. The other determinants of
the nasal features include genetic factors, race etc. Nose
anthropometry is the measurement of the different nasal
parameters. The nasal index has been correlated with
average temperature and humidity [13, 14] and nasal size
with oxygen consumption [15]. A low nasal index was
associated with cold and dry climates, while a high nasal
index was associated with hot and moist climates. It has not
been confirmed whether differences in the size and the
shape of the nose between different ethnic groups influ-
ences the different nasal physiology or predilection to sino-
nasal pathology [16]. Since each racial group and ethnic
population has their own nasal character and anatomic
structure, mean nasal values of the nose should be com-
prehensively understood for each ethnic and racial group.
Definitely, though beauty lies in the eyes of the beholder, it
arises from harmonious proportions of the facial parts.
Direct anthropometry methods are time-consuming,
problems like difficulty of patient adaptation, repeatability
of measurements and archiving of data. Hence, indirect
measurement methods like photograph, cephalogram,
stereophotograph, laser scanning, and computerized
tomography have increasingly become popular in recent
years. The most frequent methods used clinically are
photography. It is a fast and inexpensive method with
better patient compliance [11]. In our study too, we have
used the photographic method of anthropometric
evaluation.
In the planning of rhinoplasty it is very important to take
into consideration the type of nose characteristic for a
particular race or ethnic group to suit the final outcome
with the proportions of the face. Rhinoplasty surgeons
require access to facial databases based on accurate
anthropometric measurements to perform optimum cor-
rection in both sexes [11]. There are gender differences too
in the nasal parameters and hence some points need to be
considered during cosmetic nasal surgery for men because
the expectations and anatomical differences exist. In the
recent years, rhinoplasty is gaining popularity in the Indian
population with the increasing number. To cater the ever
increasing demands of the patients desiring cosmetic cor-
rection, it is of utmost importance that the rhinoplasty
surgeon has thorough understanding and knowledge of the
anthropometric measurements and ethnic variations of the
Indian population. A surgically corrected nose should
blend harmoniously with the ethnic facial features of the
individual [17]. India is a country of varied cultures and
ethnic diversity. Till now, there is no single dedicated study
that outlines the aesthetic anthropometric measurements to
propose the guidelines for Indian Rhinoplasty. The nose is
a person’s most defining feature because it is at the centre
of the face. The shape of the nose is a signature indicating
the ethnicity, race, age and sex.
There are very few study in the literature mentioning the
nasal parameters in males. This is the first study which is
putting forward the concept of aesthetic nasal parameters
representative of the whole of the Indian population for
females as well as males. The aim of this study is to
determine the nasal aesthetic anthropometric measure-
ments in Indian male and female and to put forth the
parameters for Indian Rhinoplasty.
Methods and Materials
This is a descriptive Cross sectional anthropometric study
carried out in MIMER Medical College and included a
volunteer sample of 221 young good looking Indian male
and female aged 18–25 years with Indian parents and no
history of previous surgery or trauma to the nose or any
congenital deformity of face. The mean age was
20.45 ± 1.42 years. It included 110 males and 111
females. The written consent was obtained after explaining
the study and its objectives to the participants. A special
consent was taken with regards to the photography and
identity revealing. The Institutional review Ethics Com-
mittee has approved the study. Among the other data, place
of birth, and parental heritage was included. Standardized
frontal, lateral, and basal photographs of the noses were
taken, and 11 standard anthropometric measurements of the
nose were determined. To minimise the error and to
increase accuracy of measurement, each photograph was
taken with a reference scale (Figs. 1, 2). The vertical scale
was graduated with mm and was placed next to the face.
The participants were seated in chair in a relaxed
anatomical position (neutral position of the head) com-
fortably and the camera lens was aligned parallel to the
front view of the face of the subject. Neutral head position
is appropriate as it is easily reproducible and provides a
natural orientation of face and helps in treatment planning.
The photographs were captured using a digital Canon
DSLR 550 D camera mounted on stand and maintaining a
distance of 1 m between the subject and lens. The subject
was advised not to change his/her position while pho-
tographs were being taken. Digital images were transferred
to a computer. Calculations were done with Digimizer
Image Measurement Software (Figs. 3, 4, 5, 6). All
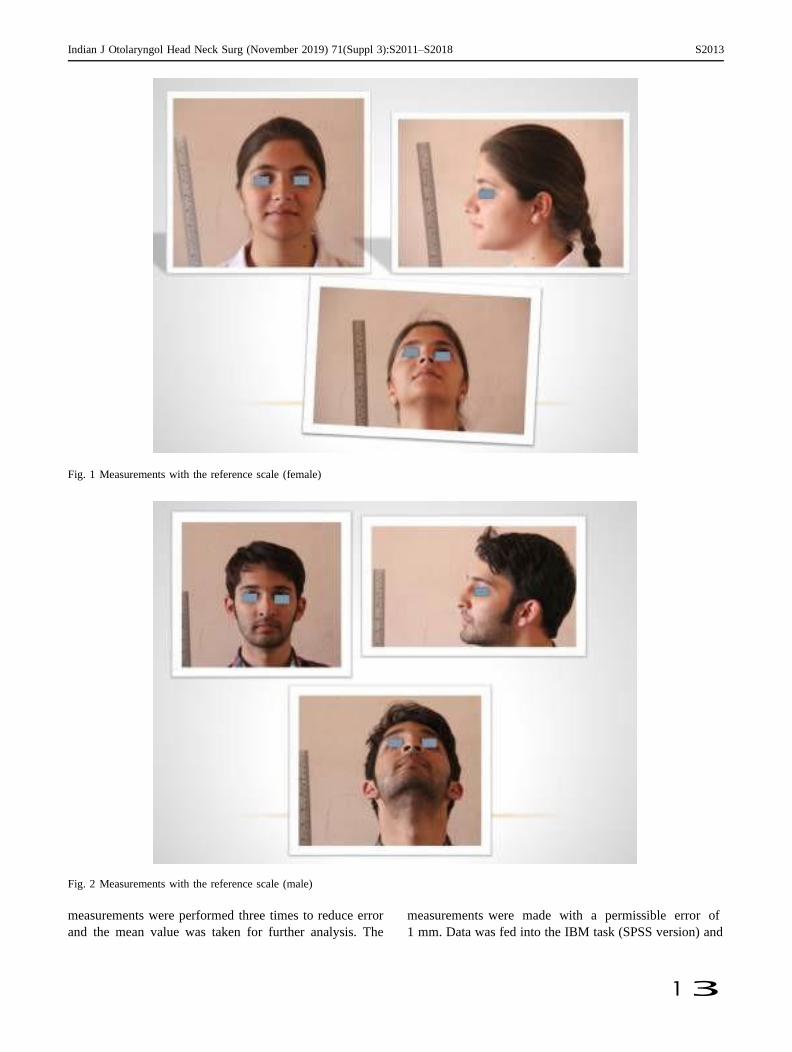
Indian J Otolaryngol Head Neck Surg (November 2019) 71(Suppl 3):S2011–S2018 S2013
1 3
Fig. 1 Measurements with the reference scale (female)
Fig. 2 Measurements with the reference scale (male)
measurements were performed three times to reduce error
and the mean value was taken for further analysis. The
measurements were made with a permissible error of
1 mm. Data was fed into the IBM task (SPSS version) and
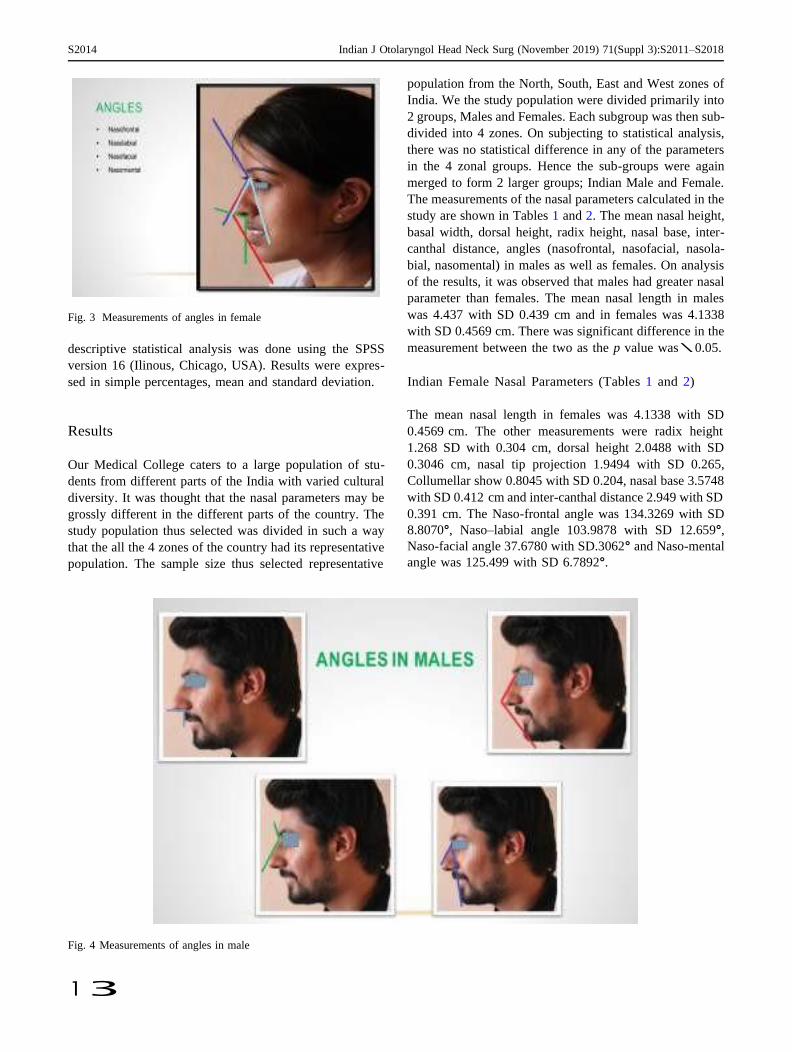
S2014 Indian J Otolaryngol Head Neck Surg (November 2019) 71(Suppl 3):S2011–S2018
1 3
Fig. 3 Measurements of angles in female
descriptive statistical analysis was done using the SPSS
version 16 (Ilinous, Chicago, USA). Results were expres-
sed in simple percentages, mean and standard deviation.
Results
Our Medical College caters to a large population of stu-
dents from different parts of the India with varied cultural
diversity. It was thought that the nasal parameters may be
grossly different in the different parts of the country. The
study population thus selected was divided in such a way
that the all the 4 zones of the country had its representative
population. The sample size thus selected representative
population from the North, South, East and West zones of
India. We the study population were divided primarily into
2 groups, Males and Females. Each subgroup was then sub-
divided into 4 zones. On subjecting to statistical analysis,
there was no statistical difference in any of the parameters
in the 4 zonal groups. Hence the sub-groups were again
merged to form 2 larger groups; Indian Male and Female.
The measurements of the nasal parameters calculated in the
study are shown in Tables 1 and 2. The mean nasal height,
basal width, dorsal height, radix height, nasal base, inter-
canthal distance, angles (nasofrontal, nasofacial, nasola-
bial, nasomental) in males as well as females. On analysis
of the results, it was observed that males had greater nasal
parameter than females. The mean nasal length in males
was 4.437 with SD 0.439 cm and in females was 4.1338
with SD 0.4569 cm. There was significant difference in the
measurement between the two as the p value was \ 0.05.
Indian Female Nasal Parameters (Tables 1 and 2)
The mean nasal length in females was 4.1338 with SD
0.4569 cm. The other measurements were radix height
1.268 SD with 0.304 cm, dorsal height 2.0488 with SD
0.3046 cm, nasal tip projection 1.9494 with SD 0.265,
Collumellar show 0.8045 with SD 0.204, nasal base 3.5748
with SD 0.412 cm and inter-canthal distance 2.949 with SD
0.391 cm. The Naso-frontal angle was 134.3269 with SD
8.8070°, Naso–labial angle 103.9878 with SD 12.659°,
Naso-facial angle 37.6780 with SD.3062° and Naso-mental
angle was 125.499 with SD 6.7892°.
Fig. 4 Measurements of angles in male
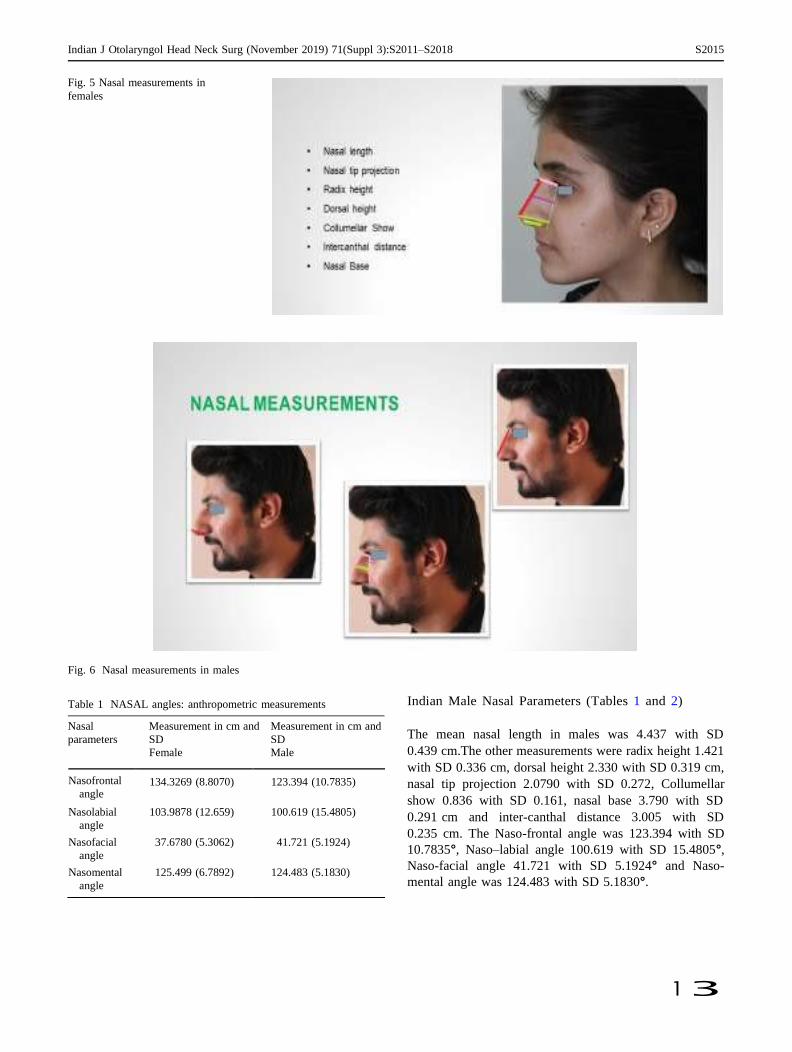
Indian J Otolaryngol Head Neck Surg (November 2019) 71(Suppl 3):S2011–S2018 S2015
1 3
Fig. 5 Nasal measurements in
females
Fig. 6 Nasal measurements in males
Table 1 NASAL angles: anthropometric measurements Indian Male Nasal Parameters (Tables 1 and 2)
Nasal
parameters
Measurement in cm and
SD
Female
Measurement in cm and
SD
Male
The mean nasal length in males was 4.437 with SD
0.439 cm.The other measurements were radix height 1.421
with SD 0.336 cm, dorsal height 2.330 with SD 0.319 cm,
nasal tip projection 2.0790 with SD 0.272, Collumellar
show 0.836 with SD 0.161, nasal base 3.790 with SD
0.291 cm and inter-canthal distance 3.005 with SD
0.235 cm. The Naso-frontal angle was 123.394 with SD
10.7835°, Naso–labial angle 100.619 with SD 15.4805°,
Naso-facial angle 41.721 with SD 5.1924° and Naso-
mental angle was 124.483 with SD 5.1830°.
Nasofrontal
angle 134.3269 (8.8070) 123.394 (10.7835)
Nasolabial
angle
103.9878 (12.659) 100.619 (15.4805)
Nasofacial
angle
37.6780 (5.3062) 41.721 (5.1924)
Nasomental
angle
125.499 (6.7892) 124.483 (5.1830)

S2016 Indian J Otolaryngol Head Neck Surg (November 2019) 71(Suppl 3):S2011–S2018
1 3
Table 2 Nasal anthropometric measurements statistical analysis, zonal variations were not statistically
Nasal
parameters
Discussion
Measurements in cms
with SD
Female
Measurements in cms
with SD
Male
significant (p [ 0.05). Thus the 4 groups were combined to
represent one population to calculate the anthropometric
parameters.
Anthropometric analysis is a step to clarify these
important points and basement for enhancing the plans of
the corrective surgery. Nasal analysis is vital before per-
forming rhinoplasty (plastic surgery). It is also important in
forensic science. Hence research on the nasal parameters of
various ethnic groups is very important. The normal values
of nasal parameters are vital measurements in the evalua-
tion and diagnosis of craniofacial deformities. The aim of
this study is to determine the nasal parameters in male and
female adults of the Indian population.
There are several anthropometric studies related with the
nose, which are bringing forward other different methods.
However we decide to review a landmark-based geometric
Beauty arises from symmetric, balanced and harmonious
proportions of facial parts. Nasal shape gives information
about race, ethnicity, age and sex. The size, shape, and
proportions of the nose provide a visual basis suggesting the
character of the person. Moreover, it is an important key for a
natural and aesthetically pleasing human face [18]. Defini-
tion of beauty and its concepts varies according to ethnicity.
Anthropometric analysis is a method, aiming to achieve the
most reliable comparison of the body forms by using specific
landmarks determined in respect of anatomical prominences.
Photogrammetry is an easier and more effective method for
anthropometric analysis of the nose. Anthropometric anal-
ysis helps in enhancing the plans of the corrective surgery.
Recently, lot of people want to undergo rhinoplasty
operations to improve the shape of nose and attractiveness
of the face. India ranks 7th in the world for the maximum
number of rhinoplasty in 2017 according to the world
rhinoplasty statistics for the year 2017 with 878,180
rhinoplasties being operated with a 3.7% of the world
population [19]. A successful outcome in rhinoplasty
requires thorough and accurate preoperative planning, and
this can only be made possible if one has a thorough pre-
operative planning in mind. Any surgeon who performs
rhinoplasty must be keenly aware of the racial and ethnic
differences in nasal anatomy between male and female of a
particular population. Nasal parameters are well discussed
in the Whites and African Americans. There is no study
which comprehensibly describes the whole of Indian Nose.
Hence European and American standard cannot be applied
for Indian population.
India is a country of cultural diversity, encompassing a
large area. We expected Zonal Variations in the anthro-
pometry of the noses. Hence sample size was selected in
such a way so as to have representative population from all
4 zones– North, South, East and West. However on
morphometric technique which can be easily used to ana-
lyze the nasal shapes in any population.
The mean nasal length in males was 4.437 with SD
0.439 cm and in females was 4.1338 with SD 0.4569 cm.
In the Chinese mean nose length [18] (53.50 mm), Cau-
casian [20] mean (53.00 mm), Afro-American mean values
(52.4 mm), white northern Italian(54.33) [21], and Afro-
Indian [22] mean (54.7 mm) values. In the Turkish popu-
lation, the mean value was 56.92 mm [23].
Nasal Width
In our study, the nasal width was 3.5748 with SD 0.412 cm
in females and nasal base 3.790 with SD 0.291 cm in
males. In Korean American [24] (35.5 ± 3.4) and white
women (31.4 ± 2.0), Afro-American [20] (43.5 mm),
Chinese [18] (39.20 mm), Japanese [9] (36.3 mm), Cana-
dian-Caucasian [25] (36.9 mm), African [22] (45.9 mm),
Afro-Caucasian (39.6 mm), Afro-Indian (42.7 mm) noses
[22], and in young Turkish people [23] (33.63 mm).
Nasofrontal and Nasolabial Angle
In the Turkish study [26], the nasofrontal angle in males
was 123.85 ± 13.23° and in females was 133.16 ± 8.88°.
Whereas the nasolabial angle in male was 97.91 ± 8.78°
and in female was 98.91 ± 10.01°. In Korean female, the
mean nasofrontal angle was 136.8°. In our study, the
nasofrontal angle was (female) and (male) and nasolabial
angle was (female) and (male).
Nasofacial Angle
In Korean [27] female, the nasofacial angle was 32.3°, in
Nigerian [28] Ibo ethnic group was 36.3 ± 0.37° and
Nigerian Yoruba group was 35.5 ± 0.38°.
Nasal length 4.1338 (0.4569) 4.437 (0.439)
Radix height 1.268 (0.304) 1.421 (0.336)
Dorsal height 2.0488 (0.3046) 2.330 (0.319)
Nasal tip 1.9494 (0.265) 2.0790 (0.272)
projection
Collumellar 0.8045 (0.204) 0.836 (0.161)
show
Nasal base 3.5748 (0.412) 3.790 (0.291)
Intercanthal
distance 2.949 (0.391) 3.005 (0.235)
Indian J Otolaryngol Head Neck Surg (November 2019) 71(Suppl 3):S2011–S2018 S2017
1 3
There are multiple Indian studies defining the nasal
parameters [29, 30], but all of them describe the nasal
parameters of state or region wise and not for the country
as a whole. There is also study by Patil et al. [31], but it has
described only the female average nasal parameters. The
concept of average faces is different from that of the
attractive and pleasing face. In other words, it means that
the average nasal parameters are different aesthetically
pleasing attractive nasal parameters for a particular region.
Advantages of Our Study
1. First study to propose the aesthetic average nasal
parameters for Indian rhinoplasty.
2. These parameters can be used for Indians settled in
foreign countries seeking rhinoplasty.
3. It aids in the preoperative plan of cosmetic correction
of nose.
4. The photographic analysis used in this study is easier,
repeatable in measurements unlike the manual
measurements.
5. The parameters provided by our study can be used
even in post-traumatic facial disfigurement.
6. It will help for enhancing the results of the corrective
surgery in Indian Rhinoplasty.
7. It can also be used for genetic counselling and
forensic investigation.
8. Our dedicated anthropometric study of the aestheti-
cally pleasing Indian Nose would thus enable a better
and accurate guidelines for performing cosmetic and
reconstructive rhinoplasty.
Limitations of the Study Small study population.
Conclusion
In India, rhinoplasty is gaining popularity. But till now,
there is no dedicated study with the nasal parameters for
males and females in the Indian population. Our study
shows that nasal measurements of the Indians are different
from European, Chinese, American noses. Hence, the
European and other international nasal parameters should
not be applied for Indians seeking rhinoplasty. The concept
of average faces is different from that of the attractive and
pleasing face. Our study suggests the aesthetic average
nasal parameters for the Indians based in India and those
settled abroad seeking rhinoplasty. The nasal anthropo-
metric norms proposed by our study will serve as a guide
for cosmetic and reconstructive surgery, genetic coun-
selling anthropology and forensic investigation.
In conclusion, we believe that aesthetic average values
of the nose in this population may contribute to attractive
results in Indian reconstructive nasal surgery.
Acknowledgements Dr. Mrs. Swati Raje, Dept Of PSM, MIMER
MC for the statistical analysis.
Compliance with Ethical Standards
Conflict of interest All authors declare that they have no conflict of
interest.
Ethical Approval All procedures performed in studies involving
human participants were in accordance with the ethical standards of
the institutional committee and with the 1964 helsinski declaration
and its later ammendments or comparable ethical standards Institu-
tional Ethics Committee has approved the study.
Informed Consent Informed consent was obtained from all indi-
vidual participants included in the study. Special consent was taken
for photography and identity disclosure.
References
1. Eickstedt EV (1927) The race and types of the western Hima-
layas. Man India 6:237
2. Oladipo GS, Olabiyi AO, Oremosu AA, Noronha CC (2007)
Nasal indices among major ethnic groups in Southern Nigeria.
Sci Res Essay 2(1):20–22
3. Olotu JE, Eroje A, Oladipo GS, Ezon-Ebidor E (2009) Anthro-
pometric study of the facial and nasal length of adult Igbo ethnic
group in Nigeria. Int J Biol Anthropol 2(2):1–6
4. Krishan K (2008) Estimation of stature from cephalo-facial
anthropometry in north Indian population. Forensic Sci Int
181(1–3):52e1–52e6
5. Carvalho B, Ballin AC, Becker RV, Berger CA, Hurtado JG,
Mocellin M (2012) Rhinoplasty and facial asymmetry: analysis of
subjective and anthropometric factors in the Caucasian nose. Int
Arch Otorhinolaryngol 16(4):445–451
6. Romo T 3rd, Abraham MT (2003) The ethnic nose. Fac Plast
Surg 19(3):269–278
7. Milgrim LM (1996) Anthropometric analysis of the female
Latino nose: revised aesthetic concepts and their surgical impli-
cations. Arch Otolaryngol Head Neck Surg 122:1079–1086
8. Mishima K, Mori Y, Yamada T, Sugahara T (2002) An-thropo-
metric analysis of the nose in the Japanese. Cells Tiss Organs
170:198–206
9. Ochi K, Ohashi T (2002) The effects of an external nasaldilator
and nasal dimensions in Asians. Otolarygol Head Neck Surg
126:160–163
10. Ofodile FA, Bokhari F (1995) The African–American nose: part
II. Ann Plast Surg 34:123–129
11. Abdullah Etoz (2011). Anthropometric analysis of the nose. In:
Brenner M (ed) Rhinoplasty. ISBN: 978-953-307-849-6, InTech.
http://www.intechopen.com/books/rhinoplasty/anthropometric-
analysisof-the-nose
12. Davies A (1932) Man’s nasal index in relation to climate. J R
Anthropol Inst GB Irel 29:8–14
13. Balaresque PL, Ballereau SJ, Jobling MA (2007) Challenges in
human genetic diversity: demographic history and adaptation.
Hum Mol Gen 16:R134–R139
S2018 Indian J Otolaryngol Head Neck Surg (November 2019) 71(Suppl 3):S2011–S2018
1 3
14. Thompson A, Dudley Buxton L (1923) Man’s nasal index in
relation to certain climatic conditions. J R Anthropol Inst GB Irel
53:99–122
15. Weiner JS (1954) Nose shape and climate. Am J Phys Anthropol
12:615–618
16. Hall RL (2005) Energetics of nose and mouth breathing, body
size, bod composition and nose volume in young adult males and
females. Am J Hum Biol 17:321–330
17. Trenite´ GJN (2003) The ethnic nose. Facial Plast Surg
19(3):237–238
18. Aung SC, Liam FC, Teik LS (2000) Three dimensional laser scan
assessment of the Oriental nose with a new classification of
Oriental nasal types. Br J Plast Surg 53(2):109–116
19. https://globenewswire.com/news-release/2017/06/27/1029348/0/
en/Demand-for-Cosmetic-Surgery-Procedures-Around-the-World-
Continues-to-Skyrocket-USA-Brazil-Japan-Italy-and-Mexico-Rank
ed-in-the-Top-Five-Countries.html
20. Ofodile FA, Bokhari F (1995) The African–American nose Part
II. Ann Plast Surg 34:123–129
21. Ferrario VF, Sforza C, Poggio C, Schmitz JH (1997) Three–
dimensional study of growth and development of thenose. Cleft
Palate-Craniof J 34:309–317
22. Ofodile FA, Bokhari F, Ellis C (1993) The black American nose.
Ann Plast Surg 31:209–218
23. Uzun A, Akbas H, Bilgic S, Emirzeoglu M, Bostanc O, Sahin B,
Bek Y (2006) The average values of the nasalanthropometric
measurements in 108 young Turkish males. Auris Nasus Larynx
33:31–35
24. Choe KS, Yalamanchili HR, Litner JA, Sclafani AP, Quatela VC
(2006) The Korean American woman’s nose: an in-depth nasal
photogrammatic analysis. Arch Facial Plast Surg 8:319–323
25. Farkas LG, Phillips JH, Katic M (1998) Anthropometric
anatomical and morphological nose widths in Canadian-Cau-
casian adults. Can J Plast Surg 6:149–151
26. Ahmet Uzun, Fikri Ozdemir (2014) Morphometric analysis of
nasal shapes and angles in young adults. Braz J Otorhinolaryngol.
80(5):397–402
27. Choe KS, Sclafani AP, Litner JA, Yu G, Romo T (2004) The
Korean American woman’s face anthropometric measurements
and quantitative analysis of facial aesthetics. Arch Fac Plast Surg
6(4):244–252
28. Eliakim-Ikechukwu CF, Ekpo AS, Etika M, Ihentuge C,
Mesembe OE (2013) Facial aesthetic angles of the Ibo and
Yoruba ethnic groups of Nigeria. IOSR J Pharm Biol Sci (IOSR-
JPBS) 5(5):14–17. e-ISSN: 2278-3008. http://www.iosrjournals.
org/iosr-jpbs/papers/Vol5-issue5/C0551417.pdf
29. Choudhary A, Choudhary DS (2012) Comparative anthropo-
metric study of nasal parameters between two ethnic groups of
Rajasthan State. Int J Med Public health 2(2):46–48
30. Chhabra DN, Bedi DM, Patnaik DVVG (2012) Anthropometric
study of the nose of 600 North Indian Adults (a study done for
forensic identification). NJIRM 3(5):62–68
31. Patil SB, Kale SM, Jaiswal S, Khare N, Math M (2011) The
average Indian female nose. Aesthetic Plast Surg 35(6):1036–
1042
1 3
ORIGINAL ARTICLE
Indian J Otolaryngol Head Neck Surg
(November 2019) 71(Suppl 2):S1334–S1342; https://doi.org/10.1007/s12070-018-1411-7
Minimal Invasive Endoscopic Ear Surgery: A Two Handed Technique
Sapna Ramkrishna Parab1 • Mubarak Muhamed Khan2
Received: 7 May 2018 / Accepted: 22 May 2018 / Published online: 29 May 2018
© Association of Otolaryngologists of India 2018
Abstract To evaluate the surgical outcome of two handed
technique of endoscopic ear surgery with endoscope
holder. Retrospective Non Randomized Clinical Study. A
total of 547 endoscope holder (Justtach) assisted ear
surgeries (331 cartilage tympanoplasties and 216 choles-
teatoma surgeries) were operated with Justtach from July
2013 to April 2016 with a follow up period ranging from
12 to 45 months to evaluate its feasibility and results with
the technique. The design of the endoscope holder, Justtach
is described along with its functioning and maneuvering
techniques. In the endoscopic tympanoplasty group, at
1 year follow up, the graft uptake was seen in 323 ears with
three residual perforation and 5 recurrent perforations
giving a success rate of 97.58%. At the 2 years follow up,
the graft uptake was in 322 ears with 6 recurrent perfora-
tions and 3 residual perforations with a success rate of
97.28%. Whereas in case of endoscopic cholesteatoma
surgery, there was residual cholesteatoma in 5 and recur-
rent in 6 out of 216 cases. The study reports the successful
application and use of endoscope holder in two handed
technique of endoscopic ear surgery.
Level of Evidence Level 4.
Electronic supplementary material The online version of this article (https://doi.org/10.1007/s12070-018-1411-7) contains supple- mentary material, which is available to authorized users.
& Sapna Ramkrishna Parab
1 Department of Otorhinolaryngology, M.I.M.E.R. Medical
College, Pune 410507, India
2 Sushrut ENT Hospital, Dr. Khan’s Creations, Talegaon D,
Pune, India
Keywords Endoscope holder · Justtach ·
Two handed endoscopic ear surgery ·
Endoscopic cartilage tympanoplasty ·
Endoscopic cholesteatoma surgery
Introduction
Minimal invasive surgery has influenced the techniques in
every specialty of surgical medicine. This has led to the
replacement of conventional procedures with minimally
invasive ones, stimulated surgeons to re-evaluate conven-
tional approaches. However, two major drawbacks of the
minimal invasive surgery include the prolonged learning
curve for most surgeons, and secondly, increased costs due
to investment in the equipment required as well as longer
operating times. Since the introduction of microscope in
middle ear surgery, all the well-established techniques in
ear surgery have evolved. However since last decade,
endoscopes have been introduced into ear surgery. Endo-
scopic ear surgery is an evolving science in the field of
otology and provides minimally invasive transcanal
approach to the middle ear. Though endoscopic techniques
are similar to the standard well known microscopic ear
surgery techniques, it differs in its approach to the middle
ear and adds a new perspectives and dimensions to the
understanding of middle ear anatomy and pathology. The
advantages of endoscopes in ear surgery include (1) visu-
alization of the whole tympanic membrane and the ear
canal without manipulation of the patient’s head or the
microscope, (2) extension of the operative field in tran-
scanal procedures into structures usually hidden from the
microscope (anterior tympanic perforation, posterior
retraction pocket, facial recess, and hypotympanum) and
(3) visualization of structures from multiple angles as
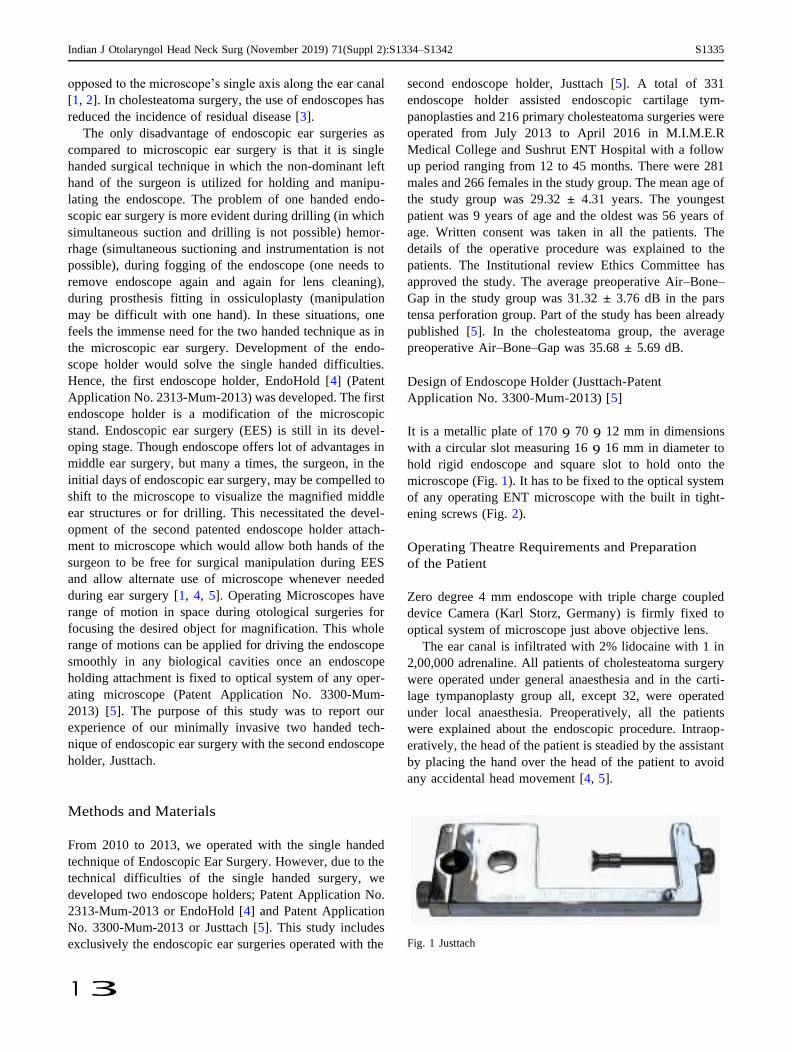
1 3
Indian J Otolaryngol Head Neck Surg (November 2019) 71(Suppl 2):S1334–S1342 S1335
opposed to the microscope’s single axis along the ear canal
[1, 2]. In cholesteatoma surgery, the use of endoscopes has
reduced the incidence of residual disease [3].
The only disadvantage of endoscopic ear surgeries as
compared to microscopic ear surgery is that it is single
handed surgical technique in which the non-dominant left
hand of the surgeon is utilized for holding and manipu-
lating the endoscope. The problem of one handed endo-
scopic ear surgery is more evident during drilling (in which
simultaneous suction and drilling is not possible) hemor-
rhage (simultaneous suctioning and instrumentation is not
possible), during fogging of the endoscope (one needs to
remove endoscope again and again for lens cleaning),
during prosthesis fitting in ossiculoplasty (manipulation
may be difficult with one hand). In these situations, one
feels the immense need for the two handed technique as in
the microscopic ear surgery. Development of the endo-
scope holder would solve the single handed difficulties.
Hence, the first endoscope holder, EndoHold [4] (Patent
Application No. 2313-Mum-2013) was developed. The first
endoscope holder is a modification of the microscopic
stand. Endoscopic ear surgery (EES) is still in its devel-
oping stage. Though endoscope offers lot of advantages in
middle ear surgery, but many a times, the surgeon, in the
initial days of endoscopic ear surgery, may be compelled to
shift to the microscope to visualize the magnified middle
ear structures or for drilling. This necessitated the devel-
opment of the second patented endoscope holder attach-
ment to microscope which would allow both hands of the
surgeon to be free for surgical manipulation during EES
and allow alternate use of microscope whenever needed
during ear surgery [1, 4, 5]. Operating Microscopes have
range of motion in space during otological surgeries for
focusing the desired object for magnification. This whole
range of motions can be applied for driving the endoscope
smoothly in any biological cavities once an endoscope
holding attachment is fixed to optical system of any oper-
ating microscope (Patent Application No. 3300-Mum-
2013) [5]. The purpose of this study was to report our
experience of our minimally invasive two handed tech-
nique of endoscopic ear surgery with the second endoscope
holder, Justtach.
Methods and Materials
From 2010 to 2013, we operated with the single handed
technique of Endoscopic Ear Surgery. However, due to the
technical difficulties of the single handed surgery, we
developed two endoscope holders; Patent Application No.
2313-Mum-2013 or EndoHold [4] and Patent Application
No. 3300-Mum-2013 or Justtach [5]. This study includes
exclusively the endoscopic ear surgeries operated with the
second endoscope holder, Justtach [5]. A total of 331
endoscope holder assisted endoscopic cartilage tym-
panoplasties and 216 primary cholesteatoma surgeries were
operated from July 2013 to April 2016 in M.I.M.E.R
Medical College and Sushrut ENT Hospital with a follow
up period ranging from 12 to 45 months. There were 281
males and 266 females in the study group. The mean age of
the study group was 29.32 ± 4.31 years. The youngest
patient was 9 years of age and the oldest was 56 years of
age. Written consent was taken in all the patients. The
details of the operative procedure was explained to the
patients. The Institutional review Ethics Committee has
approved the study. The average preoperative Air–Bone–
Gap in the study group was 31.32 ± 3.76 dB in the pars
tensa perforation group. Part of the study has been already
published [5]. In the cholesteatoma group, the average
preoperative Air–Bone–Gap was 35.68 ± 5.69 dB.
Design of Endoscope Holder (Justtach-Patent
Application No. 3300-Mum-2013) [5]
It is a metallic plate of 170 9 70 9 12 mm in dimensions
with a circular slot measuring 16 9 16 mm in diameter to
hold rigid endoscope and square slot to hold onto the
microscope (Fig. 1). It has to be fixed to the optical system
of any operating ENT microscope with the built in tight-
ening screws (Fig. 2).
Operating Theatre Requirements and Preparation
of the Patient
Zero degree 4 mm endoscope with triple charge coupled
device Camera (Karl Storz, Germany) is firmly fixed to
optical system of microscope just above objective lens.
The ear canal is infiltrated with 2% lidocaine with 1 in
2,00,000 adrenaline. All patients of cholesteatoma surgery
were operated under general anaesthesia and in the carti-
lage tympanoplasty group all, except 32, were operated
under local anaesthesia. Preoperatively, all the patients
were explained about the endoscopic procedure. Intraop-
eratively, the head of the patient is steadied by the assistant
by placing the hand over the head of the patient to avoid
any accidental head movement [4, 5].
Fig. 1 Justtach
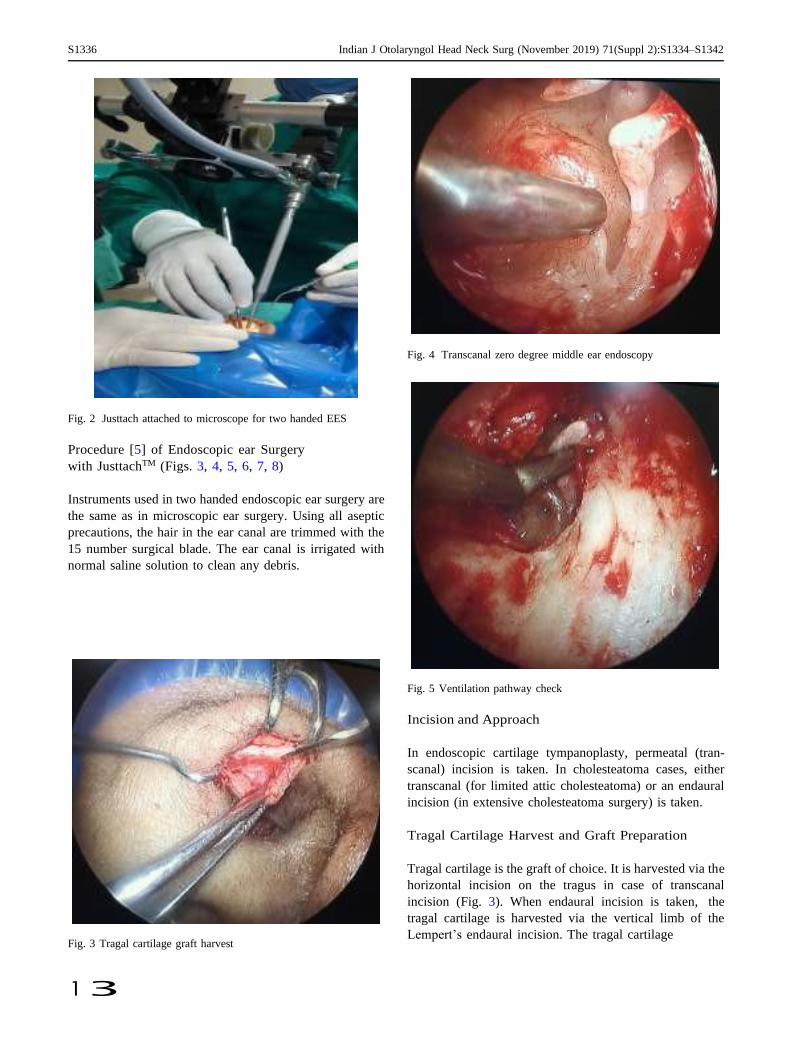
S1336 Indian J Otolaryngol Head Neck Surg (November 2019) 71(Suppl 2):S1334–S1342
1 3
Fig. 2 Justtach attached to microscope for two handed EES
Procedure [5] of Endoscopic ear Surgery
with JusttachTM (Figs. 3, 4, 5, 6, 7, 8)
Instruments used in two handed endoscopic ear surgery are
the same as in microscopic ear surgery. Using all aseptic
precautions, the hair in the ear canal are trimmed with the
15 number surgical blade. The ear canal is irrigated with
normal saline solution to clean any debris.
Fig. 3 Tragal cartilage graft harvest
Fig. 4 Transcanal zero degree middle ear endoscopy
Fig. 5 Ventilation pathway check
Incision and Approach
In endoscopic cartilage tympanoplasty, permeatal (tran-
scanal) incision is taken. In cholesteatoma cases, either
transcanal (for limited attic cholesteatoma) or an endaural
incision (in extensive cholesteatoma surgery) is taken.
Tragal Cartilage Harvest and Graft Preparation
Tragal cartilage is the graft of choice. It is harvested via the
horizontal incision on the tragus in case of transcanal
incision (Fig. 3). When endaural incision is taken, the
tragal cartilage is harvested via the vertical limb of the
Lempert’s endaural incision. The tragal cartilage
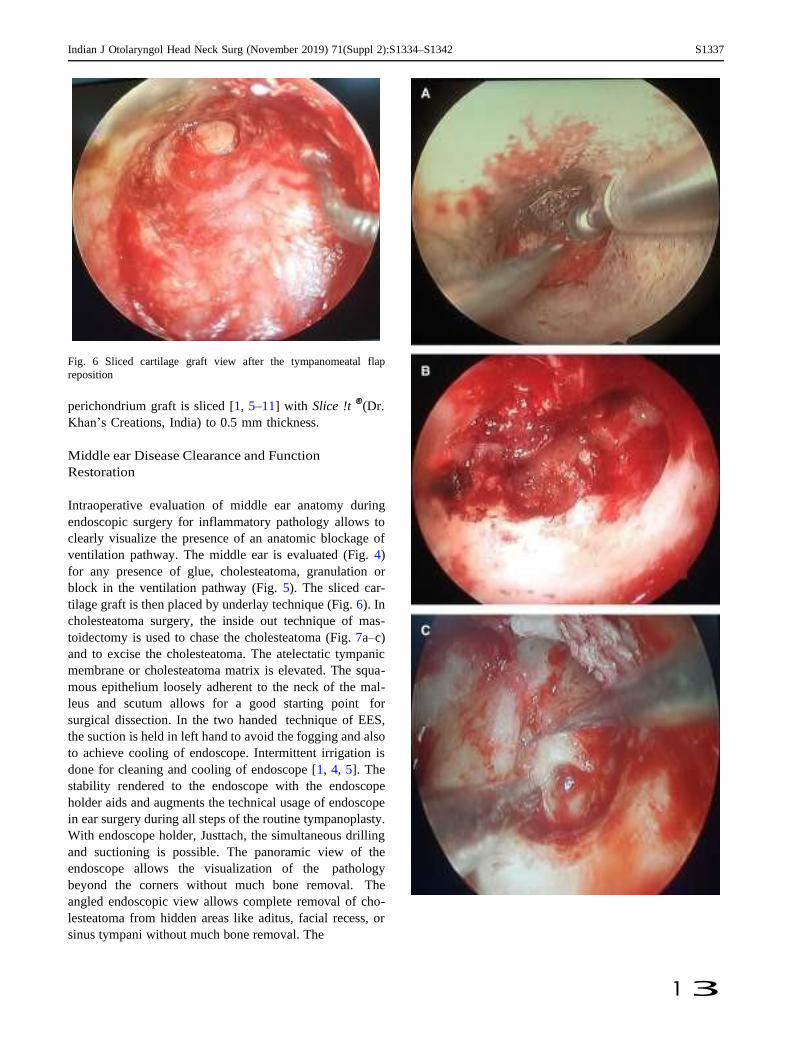
Indian J Otolaryngol Head Neck Surg (November 2019) 71(Suppl 2):S1334–S1342 S1337
1 3
Fig. 6 Sliced cartilage graft view after the tympanomeatal flap
reposition
perichondrium graft is sliced [1, 5–11] with Slice !t ®(Dr.
Khan’s Creations, India) to 0.5 mm thickness.
Middle ear Disease Clearance and Function
Restoration
Intraoperative evaluation of middle ear anatomy during
endoscopic surgery for inflammatory pathology allows to
clearly visualize the presence of an anatomic blockage of
ventilation pathway. The middle ear is evaluated (Fig. 4)
for any presence of glue, cholesteatoma, granulation or
block in the ventilation pathway (Fig. 5). The sliced car-
tilage graft is then placed by underlay technique (Fig. 6). In
cholesteatoma surgery, the inside out technique of mas-
toidectomy is used to chase the cholesteatoma (Fig. 7a–c)
and to excise the cholesteatoma. The atelectatic tympanic
membrane or cholesteatoma matrix is elevated. The squa-
mous epithelium loosely adherent to the neck of the mal-
leus and scutum allows for a good starting point for
surgical dissection. In the two handed technique of EES,
the suction is held in left hand to avoid the fogging and also
to achieve cooling of endoscope. Intermittent irrigation is
done for cleaning and cooling of endoscope [1, 4, 5]. The
stability rendered to the endoscope with the endoscope
holder aids and augments the technical usage of endoscope
in ear surgery during all steps of the routine tympanoplasty.
With endoscope holder, Justtach, the simultaneous drilling
and suctioning is possible. The panoramic view of the
endoscope allows the visualization of the pathology
beyond the corners without much bone removal. The
angled endoscopic view allows complete removal of cho-
lesteatoma from hidden areas like aditus, facial recess, or
sinus tympani without much bone removal. The
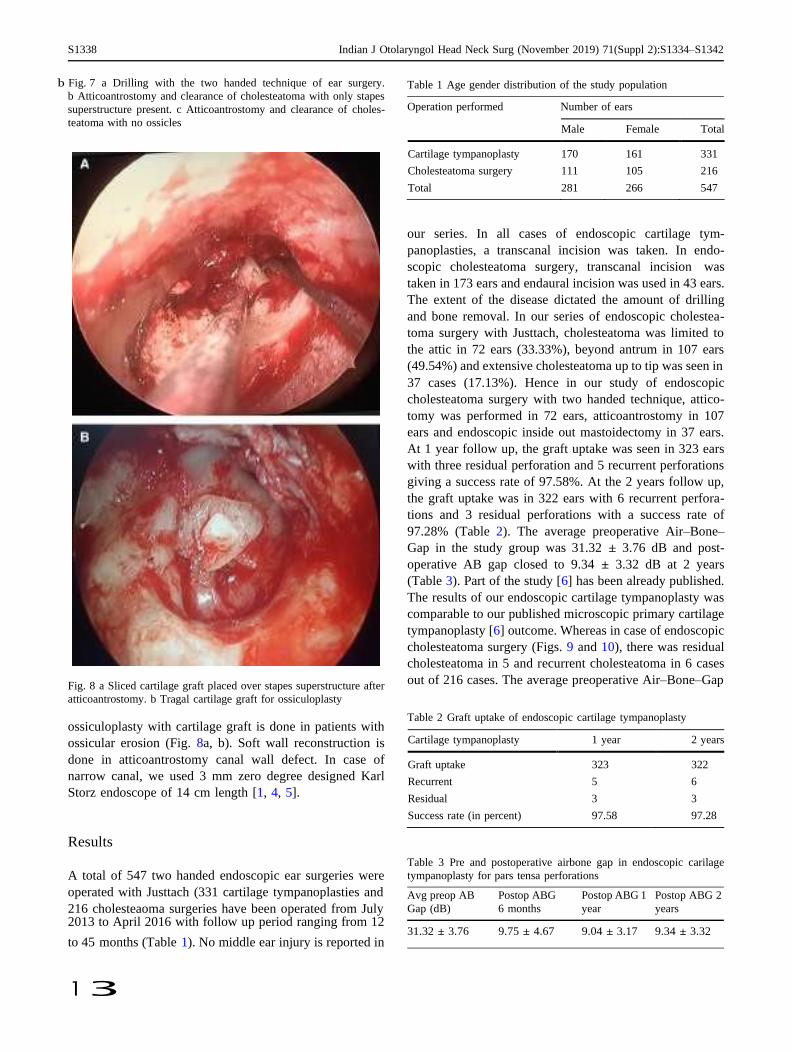
S1338 Indian J Otolaryngol Head Neck Surg (November 2019) 71(Suppl 2):S1334–S1342
1 3
b Fig. 7 a Drilling with the two handed technique of ear surgery.
b Atticoantrostomy and clearance of cholesteatoma with only stapes
superstructure present. c Atticoantrostomy and clearance of choles-
teatoma with no ossicles
Fig. 8 a Sliced cartilage graft placed over stapes superstructure after
atticoantrostomy. b Tragal cartilage graft for ossiculoplasty
ossiculoplasty with cartilage graft is done in patients with
ossicular erosion (Fig. 8a, b). Soft wall reconstruction is
done in atticoantrostomy canal wall defect. In case of
narrow canal, we used 3 mm zero degree designed Karl
Storz endoscope of 14 cm length [1, 4, 5].
Results
A total of 547 two handed endoscopic ear surgeries were
Table 1 Age gender distribution of the study population
Operation performed Number of ears
our series. In all cases of endoscopic cartilage tym-
panoplasties, a transcanal incision was taken. In endo-
scopic cholesteatoma surgery, transcanal incision was
taken in 173 ears and endaural incision was used in 43 ears.
The extent of the disease dictated the amount of drilling
and bone removal. In our series of endoscopic cholestea-
toma surgery with Justtach, cholesteatoma was limited to
the attic in 72 ears (33.33%), beyond antrum in 107 ears
(49.54%) and extensive cholesteatoma up to tip was seen in
37 cases (17.13%). Hence in our study of endoscopic
cholesteatoma surgery with two handed technique, attico-
tomy was performed in 72 ears, atticoantrostomy in 107
ears and endoscopic inside out mastoidectomy in 37 ears.
At 1 year follow up, the graft uptake was seen in 323 ears
with three residual perforation and 5 recurrent perforations
giving a success rate of 97.58%. At the 2 years follow up,
the graft uptake was in 322 ears with 6 recurrent perfora-
tions and 3 residual perforations with a success rate of
97.28% (Table 2). The average preoperative Air–Bone–
Gap in the study group was 31.32 ± 3.76 dB and post-
operative AB gap closed to 9.34 ± 3.32 dB at 2 years
(Table 3). Part of the study [6] has been already published.
The results of our endoscopic cartilage tympanoplasty was
comparable to our published microscopic primary cartilage
tympanoplasty [6] outcome. Whereas in case of endoscopic
cholesteatoma surgery (Figs. 9 and 10), there was residual
cholesteatoma in 5 and recurrent cholesteatoma in 6 cases
out of 216 cases. The average preoperative Air–Bone–Gap
Table 2 Graft uptake of endoscopic cartilage tympanoplasty
Cartilage tympanoplasty 1 year 2 years
Graft uptake 323 322
Recurrent 5 6
Residual 3 3
Success rate (in percent) 97.58 97.28
Table 3 Pre and postoperative airbone gap in endoscopic carilage
tympanoplasty for pars tensa perforations
operated with Justtach (331 cartilage tympanoplasties and
216 cholesteaoma surgeries have been operated from July 2013 to April 2016 with follow up period ranging from 12
Avg preop AB
Gap (dB)
Postop ABG
6 months
Postop ABG 1
year
Postop ABG 2
years
31.32 ± 3.76 9.75 ± 4.67 9.04 ± 3.17 9.34 ± 3.32 to 45 months (Table 1). No middle ear injury is reported in
Male Female Total
Cartilage tympanoplasty 170 161 331
Cholesteatoma surgery 111 105 216
Total 281 266 547
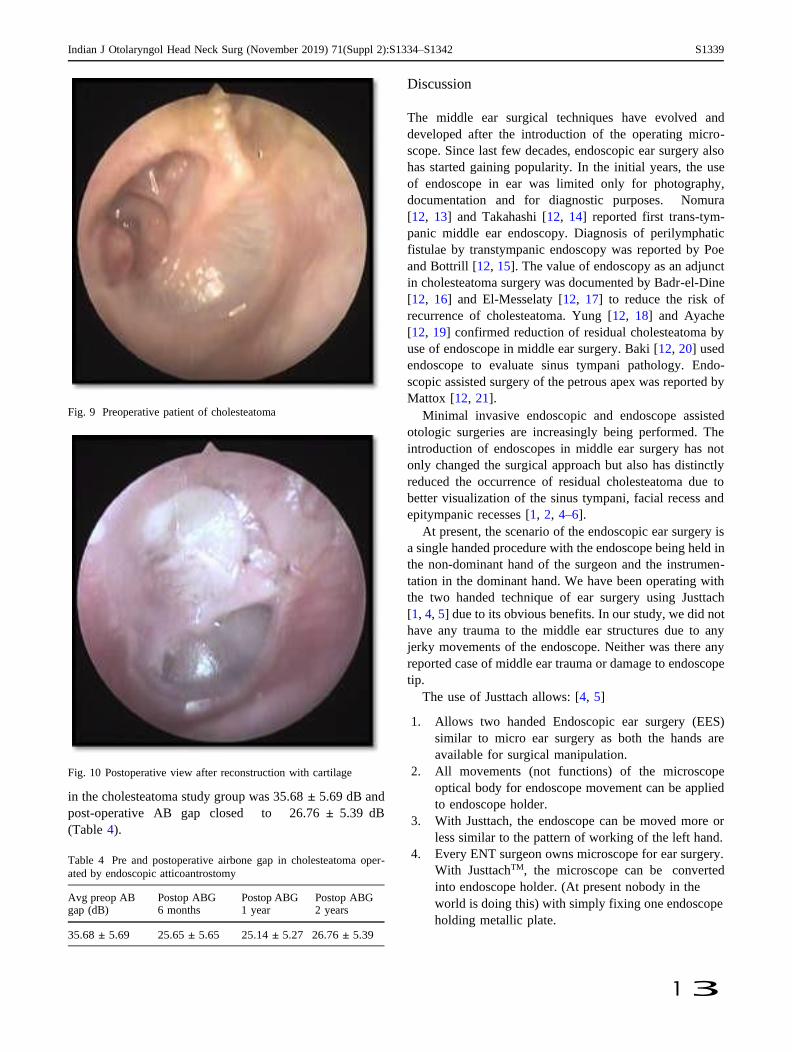
Indian J Otolaryngol Head Neck Surg (November 2019) 71(Suppl 2):S1334–S1342 S1339
1 3
Fig. 9 Preoperative patient of cholesteatoma
Fig. 10 Postoperative view after reconstruction with cartilage
in the cholesteatoma study group was 35.68 ± 5.69 dB and
post-operative AB gap closed to 26.76 ± 5.39 dB
(Table 4).
Table 4 Pre and postoperative airbone gap in cholesteatoma oper-
ated by endoscopic atticoantrostomy
Discussion
The middle ear surgical techniques have evolved and
developed after the introduction of the operating micro-
scope. Since last few decades, endoscopic ear surgery also
has started gaining popularity. In the initial years, the use
of endoscope in ear was limited only for photography,
documentation and for diagnostic purposes. Nomura
[12, 13] and Takahashi [12, 14] reported first trans-tym-
panic middle ear endoscopy. Diagnosis of perilymphatic
fistulae by transtympanic endoscopy was reported by Poe
and Bottrill [12, 15]. The value of endoscopy as an adjunct
in cholesteatoma surgery was documented by Badr-el-Dine
[12, 16] and El-Messelaty [12, 17] to reduce the risk of
recurrence of cholesteatoma. Yung [12, 18] and Ayache
[12, 19] confirmed reduction of residual cholesteatoma by
use of endoscope in middle ear surgery. Baki [12, 20] used
endoscope to evaluate sinus tympani pathology. Endo-
scopic assisted surgery of the petrous apex was reported by
Mattox [12, 21].
Minimal invasive endoscopic and endoscope assisted
otologic surgeries are increasingly being performed. The
introduction of endoscopes in middle ear surgery has not
only changed the surgical approach but also has distinctly
reduced the occurrence of residual cholesteatoma due to
better visualization of the sinus tympani, facial recess and
epitympanic recesses [1, 2, 4–6].
At present, the scenario of the endoscopic ear surgery is
a single handed procedure with the endoscope being held in
the non-dominant hand of the surgeon and the instrumen-
tation in the dominant hand. We have been operating with
the two handed technique of ear surgery using Justtach
[1, 4, 5] due to its obvious benefits. In our study, we did not
have any trauma to the middle ear structures due to any
jerky movements of the endoscope. Neither was there any
reported case of middle ear trauma or damage to endoscope
tip.
The use of Justtach allows: [4, 5]
1. Allows two handed Endoscopic ear surgery (EES)
similar to micro ear surgery as both the hands are
available for surgical manipulation.
2. All movements (not functions) of the microscope
optical body for endoscope movement can be applied
to endoscope holder.
3. With Justtach, the endoscope can be moved more or
less similar to the pattern of working of the left hand.
4. Every ENT surgeon owns microscope for ear surgery.
With JusttachTM, the microscope can be converted
into endoscope holder. (At present nobody in the Avg preop AB gap (dB)
Postop ABG 6 months
Postop ABG 1 year
Postop ABG 2 years
world is doing this) with simply fixing one endoscope
holding metallic plate. 35.68 ± 5.69 25.65 ± 5.65 25.14 ± 5.27 26.76 ± 5.39
S1340 Indian J Otolaryngol Head Neck Surg (November 2019) 71(Suppl 2):S1334–S1342
1 3
5. One can shift to microscopic ear surgery as and when
needed with Justtach.
6. As ENT surgeons are well versed with the two handed
technique of microscopic ear surgery, hence incorpo-
rating the Justtach for two handed EES will not be
difficult.
Advantages of our Justtach [4, 5]
1. Due to endoscope holder there is stability of the
endoscope, camera and image on the monitor is
ensured throughout.
2. No surgeon fatigue in holding the endoscope (as
compared with single handed endoscopic ear
surgery).
3. When angled endoscope (30, 45, 70 degree) is used
with the endoscope holders, it allows better visual-
ization of sinus tympani, facial recess, anterior
tympanic cavity and hypotympanum with just rotation
of the endoscope within the Holder.
4. All the steps of the ear surgery are similar to
Microscopic ear surgery as the left hand holds the
suction cannula continuously and the instruments in
the right hand.
5. Justtach can be used effectively without compromis-
ing the surgical field.
6. As an effective alternative for documentation and a
useful teaching aid.
7. Minimizes the need for assistance.
8. As JusttachTM is designed on the Microscopic Stand,
the fine focus of the microscopic stand can be utilized
for additional advancing into the external auditory
canal.
9. No retro auricular incision.
10. No Mastoid bandage is not required.
11. Lesser duration of surgery as the time required for the
retro auricular incision and suturing is avoided.
12. Fogging of the endoscope is avoided by use of suction
cannula and by irrigation.
13. Canalplasty can be done with the drill in the right
hand and suction in the left hand.
Disadvantages and Our Solutions to It [1, 4, 5]
1. In narrow canal, either 3 mm zero degree endoscope
or canalplasty may be performed.
2. Simple techniques used by us to avoid thermal
damage.
a. The endoscope is kept at the isthmus of external
auditory canal.
b. Continuous suction is held in left hand during the
procedure as suggested in previous study [22].
c. Intermittent irrigation helps in the cooling effect and
cleaning of the tip of the endoscope. It also avoids
frequent taking out of the endoscope for defogging (as
in single handed endoscopic ear surgery) [22].
3. Additional cost of the endoscope holder in addition to
the routine ear instruments.
4. Care is to be taken to avoid accidental injury due to
head movement to the tip of the endoscope. For cases
operated under local anesthesia with intravenous
sedation, the assistant steadies the head of the patient.
Endoscopic techniques permit transcanal exploration of
disease-containing area without opening areas that are not
involved by cholesteatoma. The transcanal endoscopic
approach opens only diseased areas, preserves many heal-
thy air cells, and leaves the cortical bone intact. It also
allows one to create two separate cavities; a small recon-
structed tympanic cavity that conducts sound through the
middle ear and is small enough to be serviced by the
(usually dysfunctional) eustachian tube, and a larger attic,
antrum, and mastoid cavity, which is joined to the ear canal
and exteriorized [2, 12].
Study by Harugop et al. [23] has compared results of
single handed endoscopic tympanoplasty with micro-
scopic tympanoplasty with successful outcome in the 82%
in the endoscope group 86% in the microscopic group.
The surgical outcome was comparable in both the groups,
however in terms of cosmesis and post-operative recov-
ery, the endoscope group fared better. In a study by
Furukawa et al. [24], endoscopic and microscopic view
was analysed. The endoscopic view had clear advantages
in terms of entire tympanic membrane visualization in a
single field with clear visualization of the perforation
edges even when the ear canal was curved. This facili-
tated reliable refreshing of the perforation edges and
grafting. The anterior edge of the perforation was not
visible under microscopy in 5 of 25 ears. They performed
transcanal endoscopic myringoplasty successfully with a
simple underlay technique or with an intracanal incision
in cases of marginal perforation. Till now, all the studies
mentioned in the literature are those of single handed
endoscopic ear surgery. This is the first study which
describes the role of endoscope holder, Justtach in two
handed endoscopic ear surgery.
The learning curve for endoscope holder aided endo-
scopic ear surgery may not as steep as that for routine
endoscopic or microscopic surgery. All of us are trained in
microscopic ear surgery during the post-graduation course
of otolaryngology. The microscopic ear surgery is a two
handed technique in which one holds the suction in the left
hand and the micro ear instruments in the right hand. Our
two handed technique also is similar to the microscopic ear
surgery with the added advantages of the endoscope. With
Indian J Otolaryngol Head Neck Surg (November 2019) 71(Suppl 2):S1334–S1342 S1341
1 3
sufficient training and practice the technique may be
adopted by all. Many experienced with endoscopic surg-
eries will find the technique easy to master, but surgeons
who have limited themselves to an entirely microscopic
otology practice are likely to find endoscope holder aided
endoscopic surgery more difficult or unnecessary to per-
form or master. Before starting the endoscopic ear surgery,
we insist that the surgeon should perform, at least 5
cadaveric endoscopic temporal bone dissection [1, 4, 5].
In the early days of endoscopic ear surgery, the case
selection plays a very important role to develop confidence
and to master the skills. The initial cases should be endo-
scopic ventilation tube insertion (grommet), myringotomy
and then gradually progress and proceed to endoscopic
tympanoplasty for small pars tensa perforations. After the
comfort level with the technique increases, one may pro-
ceed to performing endoscopic tympanoplasty for large
pars tensa perforations and later on to endoscopic choles-
teatoma surgery. In cholesteatoma surgery too, one should
start with limited cholesteatomas and then extensive cho-
lesteatoma surgery. In two handed endoscopic cholestea-
toma surgery, endoscope holder adds to the advantages as
compared to traditional mastoidectomy. It is a minimally
invasive surgical approach in terms of incision, bleeding,
drilling, postoperative pain and healing, and it is curative in
terms of the radical eradication of the pathology including
hidden areas poorly accessible and thus overlooked by a
microscope. As compared to the single handed technique,
drilling simultaneously along with suctioning is possible
with the endoscope holder.
Conclusion
In the era of minimally invasive surgery, we have designed
and developed the endoscope holder, Justtach for over-
coming the disadvantages of the single handed endoscopic
ear surgery. The advantages and disadvantages of the
endoscope holder for two handed endoscopic ear surgery
are well highlighted.
The minimally invasive two handed endoscopic ear
surgery (EES) allows better and panoramic view of the
middle ear structures without much bone removal, no
retroauricular incision and suturing. There is also no fati-
gue involved in long duration surgery as in single handed
EES with the surgeon holding the endoscope in left hand.
Endoscopic cartilage tympanoplasty is operated by
using the sliced tragal cartilage. Whereas for cholesteatoma
surgery, the inside out technique of atticantroscopy is used
with reconstruction of the attic defect.
Use of the endoholder requires the training to acquire
the skills.
Compliance with Ethical Standards
Conflict of interest The authors declare that they have no conflict of
interests.
Ethical Approval All procedures performed in this study involved
human participants and was in accordance with the ethical standards
of the institutional committee and with the 1964 helsinski declaration
and its later ammendments or comparable ethical standards. Institu-
tional Ethics Committee has approved the study.
Informed Consent Informed consent was obtained from all indi-
vidual participants included in the study.
References
1. Khan MM, Parab SR (2016) Endoscopic cartilage tympanoplasty:
a two-handed technique using an endoscope holder. Laryngo-
scope 126:1893–1898. https://doi.org/10.1002/lary.25760
2. Tarabichi M (1999) Endoscopic middle ear surgery. Ann Otol
Rhinol Laryngol 108(1):39–46
3. Migirov L, Wolf M (2015) Minimally invasive transcanal endo-
scopic ear surgery. In: Endoscopy-innovative uses and emerging
technologies 2015. https://doi.org/10.5772/60551 (InTech)
4. Khan MM, Parab SR (2015) Concept, design and development of
innovative endoscope holder system for endoscopic otolaryngo-
logical surgeries. Indian J Otolaryngol Head Neck Surg
67(2):113–119
5. Khan MM, Parab SR (2016) Novel concept of attaching endo-
scope holder to microscope for two handed endoscopic tym-
panoplasty. Indian J Otolaryngol Head Neck Surg 68(2):230–240
6. Khan MM, Parab SR (2011) Primary cartilage tympanoplasty:
our technique and results. Am J Otolaryngol 32(5):381–387
7. Khan MM, Parab SR (2013) Reinforcement of sliced tragal car-
tilage perichondrium composite graft with temporalis fascia in
Type I tympanoplasty: our techniques and results. J Rhinolaryng
Otol 1:57–62
8. Khan MM, Parab SR (2012) Day care ear surgery: our experience
of 4 years. Indian J Otolaryng Head Neck Surg 64(3):280–284
9. Khan MM, Parab SR (2014) Sliced Island tragal cartilage peri-
chondrial composite graft: early results and experience. J Rhino-
laryng Otol 2:4–9
10. Khan MM, Parab SR (2015) Comparative study of sliced tragal
cartilage and temporalis fascia in type I tympanoplasty. J Laryn-
gol Otol 129(1):16–22
11. Khan MM, Parab SR (2015) Average thickness of tragal cartilage
for slicing techniques in tympanoplasty. J Laryngol Otol
129(05):435–439
12. Tarabichi M. Endoscopic Cholesteatoma, Tympanoplasty And
Middle Ear Surgery. Open access atlas of otolaryngology, head &
neck operative surgery.
http://www.endoscopic-earsurgery.com/wp-content/uploads/
2016/07/Endoscopic-cholesteatoma-tympanoplasty-and-middle-
ear-surgery.pdf
13. Nomura Y (1982) Effective photography in otolaryngology-head
and neck surgery: endoscopic photography of the middle ear.
Otolaryngol Head Neck Surg 90:395–398
14. Takahashi H, Honjo I, Fujita A, Kurata K (1990) Transtympanic
endoscopic findings in patients with otitis media with effusion.
Arch Otolaryngol Head Neck Surg 116:1186–1189
15. Poe DS, Bottrill ID (1994) Comparison of endoscopic and sur-
gical explorations for perilymphatic fistulas. Am J Otol 15:735–
738

S1342 Indian J Otolaryngol Head Neck Surg (November 2019) 71(Suppl 2):S1334–S1342
1 3
16. Badr-el-Dine M (2002) Value of ear endoscopy in cholesteatoma
surgery. Otol Neurotol 23:631–635
17. El-Meselaty K, Badr-El-Dine M, Mandour M, Mourad M, Dar-
weesh R (2003) Endoscope affects decision making in choles-
teatoma surgery. Otolaryngol Head Neck Surg 129:490–496
18. Yung MW (2001) The use of middle ear endoscopy: has residual
cholesteatoma been eliminated? J Laryngol Otol 115:958–961
19. Ayache S, Tramier B, Strunski V (2008) Otoendoscopy in cho-
lesteatoma surgery of the middle ear. What benefits can be
expected? Otol Neurotol 29(8):1085–1090
20. Abdel Baki F, Badr-El-Dine M, El Saiid I, Bakry M (2002) Sinus
tympani endoscopic anatomy. Otolaryngol Head Neck Surg
127:158–162
21. Mattox DE (2004) Endoscopy-assisted surgery of the petrous
apex. Otolaryngol Head Neck Surg 130:229–241
22. Kozin ED, Lehman A, Carter M et al (2014) Thermal effects of
endoscopy in a human temporal bone model: implications for
endoscopic ear surgery. Laryngoscope 124(8):E332–E339
23. Harugop AS, Mudhol RS, Godhi RA (2008) A comparative study
of endoscope assisted myringoplasty and micrsoscope assisted
myringoplasty. Indian J Otolaryngol Head Neck Surg 60:298–302
24. Furukawa T, Watanabe T, Ito T, Kubota T, Kakehata S (2014)
Feasibility and advantages of transcanal endoscopic myringo-
plasty. Otol Neurotol 35(4):e140–e145
Medical Teacher
ISSN: 0142-159X (Print) 1466-187X (Online) Journal homepage: http://www.tandfonline.com/loi/imte20
Novel horizontal and vertical integrated bioethics curriculum for medical courses
Russell F. D’Souza, Mary Mathew, Derek S. J. D’Souza & Princy Palatty
To cite this article: Russell F. D’Souza, Mary Mathew, Derek S. J. D’Souza & Princy Palatty
(2018): Novel horizontal and vertical integrated bioethics curriculum for medical courses, Medical
Teacher
To link to this article: https://doi.org/10.1080/0142159X.2018.1442921
Published online: 28 Feb 2018.
Submit your article to this journal
View related articles
View Crossmark data
Full Terms & Conditions of access and use can be found at http://www.tandfonline.com/action/journalInformation?journalCode=imte20
ABSTRACT
Studies conducted by the University of Haifa, Israel in 2001, evaluating the effectiveness of bioethics being taught in medical colleges, suggested that there was a significant lack of translation in clinical care. Analysis also revealed, ineffectiveness with the teaching methodology used, lack of longitudinal integration of bioethics into the undergraduate medical curriculum, and the limited exposure to the technology in decision making when confronting ethical dilemmas. A modern novel bioeth- ics curriculum and innovative methodology for teaching bioethics for the medical course was developed by the UNESCO Chair in Bioethics, Haifa. The horizontal (subject-wise) curriculum was vertically integrated seamlessly through the entire course. An innovative bioethics teaching methodology was employed to implement the curriculum. This new curriculum was piloted in a few medical colleges in India from 2011 to 2015 and the outcomes were evaluated. The evaluation con- firmed gains over the earlier identified translation gap with added high student acceptability and satisfaction. This inte- grated curriculum is now formally implemented in the Indian program’s Health Science Universities which is affiliated with over 200 medical schools in India. This article offers insights from the evaluated novel integrated bioethics curriculum and the innovative bioethics teaching methodology that was used in the pilot program.
MEDICAL TEACHER, 2018
https://doi.org/10.1080/0142159X.2018.1442921
Novel horizontal and vertical integrated bioethics curriculum for medical courses
Russell F. D’Souzaa , Mary Mathewb , Derek S. J. D’Souzac and Princy Palattyd
aInternational Institute of Organizational Psychological Medicine, Dandenong, Australia; bDepartment of Pathology, Kasturba Medical College, Manipal Academy of Higher Education, Manipal, India; cDepartment of Dental Surgery, Maharashtra Institute of Medical Sciences, Pune, India; dDepartment of Pharmacology, Father Muller Medical College, Mangalore, India
Introduction
In recent decades, medical education curricula have under-
gone many modifications for a variety of reasons (Du Bois
and Burkemper 1994). Despite these changes, ethics educa-
tion has not received adequate attention in medical schools
throughout the world. There is an emerging need for the
introduction of teaching medical ethics as a consequence
of several social transitions and scientific advancement.
Scientists, healthcare providers, and members of institu-
tional review board find themselves confronting bioethical
issues without sufficient expertise to address them. In
response to this, academic bioethics programs have prolif-
erated and specialized to meet the needs of diverse profes-
sionals and scholars (Eckles et al. 2005).
In this article, we articulate the general pedagogical
goals for ethics education in undergraduate medical educa-
tion (Dsouza and Mathew 2016) reformed integrated cur-
riculum and innovative tested teaching methodology
proposed for the medical training at universities in the
International program of the UNESCO Chair in Bioethics
(Haifa, Israel). These goals have been influenced by debates
in bioethics literature, scholarly presentations, publications,
and insights gained from designing and piloting curriculum
at medical colleges and universities in the Asia Pacific div-
ision of the UNESCO Chair in Bioethics (Haifa, Israel).
Bioethics education
Bioethics education in the medical training is linked to
various competencies, i.e. behaviors and skills that can
be demonstrated and measured. The emphasis on
measurement can seem to diminish the importance of edu-
cation designed to enrich moral sensibilities.
All bioethics programs must attend to character devel-
opment, knowledge, and skills. Bioethics is taught both in
educational programs and in what might be considered the
as the “hidden curriculum” (Hafferty and Franks 1992). For
example observation of mentors and colleagues undoubt-
edly shapes moral behavior; however, the focus of this art-
icle is on the novel innovative horizontal and vertical
integration of bioethics curriculum in medical training in
which bioethics education occurs by design. The settings
go beyond classrooms and include clinical, research arenas,
and professional contexts. Academic bioethics programs
involve curricula and pedagogical objectives (Dsouza
and Mathew 2016). Further, there is evidence that
CONTACT Mary Mathew [email protected] Department of Pathology, Kasturba Medical College, Manipal Academy of Higher Education, Manipal 576104, Karnataka, India
© 2018 Informa UK Limited, trading as Taylor & Francis Group
Practice points Bioethics should not be taught by traditional ●
●
●
●
teaching methods as they are considered
ineffective.
Case-based Learning used for the initiation of the
discussion is one of the most effective means of
teaching bioethics.
Advanced interactive learning methodology such
as drama and role play should be used.
Undergraduate medical bioethics curriculum
should be integrated throughout the years of
medical education.
2 R. F. D’SOUZA ET AL.
undergraduate medical education that is not assessed is
not learned (Mattick and Bligh 2006). Curriculum develop-
ment is an iterative dynamic process. Program evaluation
must be built in as it gives an impetus to curriculum
designers and other stakeholders. Ethics curriculum must
be seamlessly integrated in a longitudinal manner. The
goals should reflect achieving not only what is right and
wrong but also nurturing the right attitude in medical and
healthcare students. Sowing the ethical seeds early in their
training when they are moldable “like wet clay” would
result in imprinting in early years of their course. The hori-
zontal and vertical integrated bioethics curriculum based
on the UNESCO core curriculum principles, designed,
piloted, and tested at the Indian Program of the UNESCO
Chair in Bioethics (Haifa), and was introduced by the
Association of Indian Health Science Universities (AIHSU)
which accounts for over 200 medical colleges, as a joint
program with the UNESCO Chair in Bioethics. Similarly, a
number of private universities who are part of the inter-
national program of the UNESCO Chair in Bioethics Haifa
have introduced the novel integrated bioethics curriculum
in their medical schools. This is a reference to the seam-
lessly integrated bioethics that traverse through four and
half years of medical training and offering the longitudinal
perspective with evidence of translation of learned ethical
principles being applied to the clinical settings and
beyond.
Background
Two international researches were carried by The
International Centre for Health, Law, and Ethics at the
University of Haifa in 1996 and 2001 (unesco-chair-bioethic-
s.org). The aim of the study was to evaluate the teaching
of ethics in medical schools in the world, where ethics
teaching was an accreditation requirement. The findings
were that teaching ethics did not result in its application at
the doctor-patient clinical interphase. It was found that
there was a lack of translation of bioethics taught to it
being applied to the clinical settings and beyond. Further,
the translation gap was identified to be one of the reasons
for the deterioration of the doctor-patient relationship. This
study was the catalyst to the International Centre for
Health, Law, and Ethics at the University of Haifa program
to advocate for a reformed method for ethics education
and a new modern integrated curriculum of medical ethics
to be taught in medical schools all over the world. The
UNESCO Chair in Bioethics (Haifa, Israel) adopted and estab-
lished this program in UNESCO Bioethics (2001) (unesco-
chair-bioethics.org). They established a network of bioethics
units within universities and research centers in the world
committed to disseminating, improving, and monitoring
education of ethics in medical schools. The modern curricu-
lum reflects the need for integration of ethics in daily prac-
tice, increasing interest and respect to values involved in
health care delivery, ethical decision making, and raising
awareness of the competing interests that the modern
health care delivery has to contend with UNESCO Bioethics
Core Curriculum (2008).
The horizontal curriculum
The horizontal arm of the medical ethics education starts
with student learning of medicine’s long history.
The students are introduced to the codes and oaths that
have influenced medical ethics, the common morality, and
areas that distinguished the commitments of physicians
from those of other professions. Areas included in the hori-
zontal arm are exercises to influence the need to be com-
passionate, caring, respectful, autonomy, informed consent,
and informed refusal. The exposure and learning of the
challenges to professionalism, ethical decision making,
research ethics, and the reflection on practice dilemmas are
introduced in this domain. Further concepts addressed
include the realities of commercially-driven healthcare eth-
ics vs. ethics of healthcare, morality of healthcare providers,
academic integrity, sexual harassment, boundary issues,
standards of care, malpractice, confidentiality, breaking bad
news, errors in healthcare management, truth-telling, cul-
tural issues, and ethical conflicts. Students are introduced
to ethical issues in recordkeeping and documentation, eth-
ical issues in treatment planning, and state law (Fox et al.
1990). The Bioethics Core Curriculum of UNESCO (www.
unesco.org/shs/ethics/eep- Bioethics Core Curriculum))
which is based on the 15 principles of the Universal
Declaration on Bioethics and Human Rights encompasses
almost all of these issues and concerns addressed and is
used as the framework to integrate ethics into the medical
curriculum.
The horizontal arm of the novel curriculum moreover,
addresses the interpersonal and cognitive skills that are
crucial tools for physicians. Students are taught the import-
ance of demonstrating the ethics of caring, compassion,
and respect in their interactions with patients, families, and
colleagues. Exercises are designed to encourage the prac-
tice and mastering of skills of critical reflection and clinical
moral reasoning. The curriculum further validates the
appropriateness to discuss ethical issues in clinical practice
with other health professionals, who cooperate in imple-
menting ethical decisions. In addition to these, the curricu-
lum overall supports the development of the distinctive
character of an exemplary physician in order that they
mature into competent professionals with the appropriate
dispositions and attitudes (i.e. the character and virtues)
essential to be a good physician.
Vertical (subject-wise) curriculum
The vertical curriculum consists of ethical principles of the
core curriculum, as they relate to all the undergraduate
medical subjects in the preclinical, paraclinical, and clinical
phases. This subject ethics curriculum was specially
designed by subject expert committees comprising senior
subject faculty from various medical colleges. This curricu-
lum was further validated through several workshops
where respective subject faculty members assembled in
break-out rooms, to review, refine, and offer practical meth-
ods to integrate subject-related ethics principles, into the
teaching and assessing methodology in use. A pertinent
example of the integrated curriculum in ethics is the cadav-
eric oath in anatomy at the beginning of the placement,
which emphasizes human dignity, respect to the human
body and respect for the dead. The integrated bioethics
MEDICAL TEACHER 3
curriculum is thus incorporated into every undergraduate
medical subject as the student moves through the course.
Integration of bioethics in medical curriculum
This integrated bioethics curriculum is seamlessly incorpo-
rated into the teaching and assessment (both formative
and summative) of the undergraduate subjects.
The students are assessed periodically throughout the
course trajectory in the form of a log book. The summative
component includes a written 3 h paper and viva on a case
discussion. In addition, students are formatively assessed in
feedback for case-based learning. Interest indicators, such
as participation and organizing bioethics programs earn
credit points that translate into grades for the summative
assessment. Although no foolproof mechanism of assess-
ment in affective domain is available as yet, the present
multitude of assessments could bring out a reasonable out-
come. Long-term assessment of the effectiveness of this
program has not yet been fully undertaken and few of the
program effectiveness was drawn from patient comparative
satisfaction indices. It is envisaged to monitor the critical
incident report, future career graph, and personal success.
While this will transcend the challenges of a packed cur-
riculum in the undergraduate teaching program, this
approach further has the advantage of demonstrating that
ethical considerations are important aspects of medicine
and that they need to be considered along with the scien-
tific and clinical decisions that are made. Medical students
are thus open to developing a clear understanding of their
distinctive professional responsibilities, as well as the basic
vocabulary of bioethics. This methodology offers avenues
to master the skill of identifying ethical concerns and
applying ethical concepts to clinical cases. The integrated
approach offers skills in dealing with common moral dilem-
mas that arise in clinical practice and in collaborating with
fellow healthcare providers in moral deliberation and con-
flict resolution. Thus, beyond mastering the basic ethical
concepts that are embedded in the practice of medicine,
students will also need to learn the local and federal laws
that govern their practice, as well as the institutional poli-
cies with which they are required to comply. This may be
especially important because during training, residents and
fellows often work in multiple settings that are governed
by varied laws and policies. This curriculum is vertically
integrated across the longitudinal medical curriculum,
including carrying it over into the clinical years, clinical
seminars, bed-side, and other formal hands-on aspects of
the medical training.
This horizontally and vertically integrated curriculum
design effortlessly integrates the concepts of bioethics into
every undergraduate medical subject in the pre-clinical,
para-clinical, and clinical levels. It makes the graduating
doctor, suitably sensitized and equipped to confront, and
address most of the ethical issues in their subsequent clin-
ical practice.
Innovative teaching-learning methodology for teaching faculty
In this reformed curriculum and teaching methodology, all
medical teaching faculties are qualified to be teachers of
bioethics in their respective subject specialties. The medical
teaching faculty undergoes the accredited specialized train-
ing course for medical teachers – the 3 T-IBHSc Course
(Train, Teach, and Transfer-Integrated Bioethics in Health
Sciences) developed and evaluated by the Department of
education of the UNESCO Chair in Bioethics, Haifa, Israel.
The course uses innovative teaching methodology and has
three components. These are the Principles of Bioethics
and Human Rights, Bioethics knowledge transfer technol-
ogy and Integration of discipline-specific bioethics curricu-
lum in the teaching and assessment of individual subjects
of the medical undergraduate training. At the end of the
30 h contact period of the course, the teaching faculty is
required to participate in a simulated teaching exercise that
is assessed and followed by feedback. Medical teaching fac-
ulty is invited and encouraged to register for an ongoing
12-week international webinar which consists of 12 mod-
ules on the principles of the Universal Declaration on
Bioethics and Human Rights. This course is conducted and
accredited by the Department of Education of the UNESCO
Chair in Bioethics, Haifa, Israel.
Role of workshops, small groups, case-based learning, and role play in teaching
Teaching bioethics by traditional teaching methods is not
recommended as they have been shown to be ineffective.
Use of workshops, small group discussions is a proven
means of facilitating sustained and effective student inter-
action and engagement. It also encourages active research,
reading and is ideal for a discussion of ethical real-life case
scenarios (Christakis and Feudtner 1993). Such interactions
allow the student’s adequate opportunity to introspect,
examine, and defend their own ethical belief systems, while
being open to the ethical perspectives of their fellow learn-
ers. The role of the faculty is to be role models for their
students with respect to demonstrating ethical standards
and behavior.
Role-playing has proved to be another, successful teach-
ing tool in teaching ethics and professionalism. Case-based
learning (CBL) likewise has been effectively used to intro-
duce the concepts of bioethics to medical students. This is
an excellent means of assessment and evaluation of the
students’ understanding by observing their reactions and
responses (Mattick and Bligh 2006).
Case-based learning
A case-based approach to teaching–learning methodology
in the medical field has been shown to improve student–in-
structor interaction, make the learning outcomes more
effective and can be used to assess student learning
(Thistlethwaite et al. 2012). The use of Case-Based Learning
in which real patient cases are used for initiation of the dis-
cussion is one of the most effective means of teaching bio-
ethics. Teachers who have adopted this methodology have
reported that it supports student engagement and enhan-
ces the clinical relevance of the bioethics lesson (Mattick
and Bligh 2006).
4 R. F. D’SOUZA ET AL.
Innovative teaching methodology
Innovative teaching methodologies that are successfully
employed are the screening of movies, and video clips that
encourage ethical debates on the situation or issue in the
video clip. The use of seminars and debates on a specific
ethical situation or principle that the students are likely to
encounter in the future is effective teaching methodology.
Real-life stories, vignettes, or small narratives are used effect-
ively to stimulate student reflection. Students are taught to
reflect on the overall context of ethical situations rather than
just considering ethical issues as mere concepts.
The use of taped and live video of both real patients
and “simulated patients” are found to be effective in maxi-
mizing learning. After the session, the students are asked
to write down their reactions or answer subjective ques-
tions which can also be used for assessment of learning
outcomes (Mattick and Bligh 2006).
Innovative knowledge transfer methodology used for
example in teaching Autonomy and Consent will have a
scripted role play, where a scene of a wrong procedure of
consenting is acted out for a case of appendectomy. This is
followed by a second scene where the correct way of con-
senting is demonstrated which includes the three elements
of the informed consent process. This is followed by a dis-
cussion and an assigned activity. Similarly, to teach vulner-
ability, the film “My Sister’s Keeper” is screened or a
scripted role-play of a family attempting to donate the kid-
ney of their child with mental retardation to the brother
who is the only earning member of the family. This is fol-
lowed by a discussion and an assigned activity for eliciting
types of vulnerable population.
Feedback and reflection
Feedback and personal reflection are incorporated into the
formal teaching of bioethics. These ensure the ability to
utilize both positive and negative feedback for personal
growth and development. Additionally, the students are
encouraged to introspect and intuitively learn from their
clinical experiences on how to be ethically inclined profes-
sionals and to approach ethical dilemmas with confidence
and moral courage (Branch and Paranjape 2002).
Multidisciplinary faculty teaching
Ethical dilemmas are very often of diverse nature involving
many disciplines. Therefore, an interdisciplinary approach
that invites faculty from varied disciplines, such as ethics,
psychology, and law may be used to ensure comprehensive
teaching–learning outcomes in the realm of bioethics. The
application of interdisciplinary consultation and knowledge
bases encourages clinicians to understand the need and
respect the values of other professionals and is an effective
model to emphasize inter-professional consultation in
clinical practice.
The evaluation of the pilot reformed bioethics
curriculum
Medical students who had completed the modern bioethics
curriculum that was integrated over four and half years of
their undergraduate medical training, when assessed were
found to be competent in medical ethics. They demon-
strated a deep understanding of the basic principles of eth-
ics applied in medicine, were able to recognize ethical
issues in clinical scenarios with ethical dilemmas and under-
stand how they might apply these within a clinical context.
They were further able to describe and employ the basic
concepts of medical ethics, identify moral issues and con-
flicts that arose in medical practice and formulate the
dilemma as a question.
A noticeable outcome was the ability to convey compas-
sion, caring, respect, and professionalism, besides demon-
strating skills to deliberate about ethical issues with their
fellow students. They were capable of resolving ethical
dilemmas with supporting reasons.
Further, it was found they were proficient in recognizing
moral conflicts when they arose and had reasonable know-
ledge to navigate their way through an ethical dilemma to
a resolution.
Conclusions
Over the past 30 years, bioethics education has become an
integral part of undergraduate medical education in North
American, Australia, United Kingdom medical schools, and
indeed medical schools around the world. Medical educa-
tion organizations have officially endorsed the incorpor-
ation of bioethics into the required medical school
curriculum.
The curriculum should provide ample opportunities for
students to practice their interpersonal, communication,
and moral reasoning skills (Dsouza and Mathew 2015). An
ideal curriculum should, therefore, help medical students to
understand their professional responsibilities and the dis-
tinctive ethics of medicine, nurture them to become trust-
worthy and exemplary physicians, and provide the tools
required to do what patients and society reasonably expect
of them (Eckles et al. 2005). These requirements suggest
that medical school ethics education should address issues
that physicians are most likely to encounter during their
medical careers. Most bioethics educators agree that the
undergraduate medical course’s bioethics curriculum should
be vertically and horizontally integrated throughout the
medical training program, with ethics teaching included in
both the preclinical years and the clinical years.
This novel horizontal and vertical integrated bioethics
curriculum for undergraduate medical training have been
found to mitigate the gaps that had been identified with
conventional bioethics teaching in medical education and
offers the required competencies to graduating doctors to
provide ethical, value-based quality medical care.
Disclosure statement
The authors report no conflicts of interest. The authors alone are
responsible for the content and writing of the article.
Notes on contributors
Russell F. D’Souza, MD, DSc, DPM, FIIOPM (Australia), MUCB (Haifa,
Israel), is the Head of the Asia Pacific Division and Director of
Education International Network of the UNESCO Chair in Bioethics
Haifa, Israel.
MEDICAL TEACHER 5
Mary Mathew, MD, DCH, PGDMLE is a Professor of Pathology at
Kasturba Medical College, Manipal, Karnataka, India and the Head of
the Indian program of International Network of the UNESCO Chair in
Bioethics, Haifa, Israel.
Derek S. J. D’Souza, MDS, MBA, is the Director, National Bioethics
Curriculum. Implementation Centre & Professor, Department of Dental
Surgery at Maharashtra. Institute of Medical Education and Research,
Pune.
Princy Palatty, MD, is the National Chair Curriculum & Professor,
Department of Pharmacology, Father Muller Medical College,
Mangalore, Karnataka.
ORCID
Russell F. D’Souza http://orcid.org/0000-0002-0125-7161
Mary Mathew http://orcid.org/0000-0002-4048-3567
Derek S. J. D’Souza http://orcid.org/0000-0002-3970-8546
Princy Palatty http://orcid.org/0000-0003-4147-0482
References
Branch WT Jr, Paranjape A. 2002. Feedback and reflection: teaching
methods for clinical settings. Acad Med. 77:1185–1188.
Christakis DA, Feudtner C. 1993. Ethics in a short white coat: the ethical
dilemmas that medical students confront. Acad Med. 68:249–254.
Du Bois JM, Burkemper J. 1994. Ethics education in US. Medical schools
study of syllabi. Acad Med. 69:861–871.
Dsouza R, Mathew M. 2016. Pedagogical goals for Bioethics Programs
of Health Science Universities, Global Bioethics Enquiry. Vol. 4.
Hershey (PA): IGI Global; p. 5–10.
Dsouza R, Mathew M. 2015. Medical education and
ethics, Global Bioethics Enquiry. Vol. 3. Hershey (PA): IGI Global; p.
5–8.
Eckles RE, Meslin EM, Gaffney M, Helft PR. 2005. Medical ethics educa-
tion: where are we? Where should we be going? A review. Acad
Med. 80:1143–1152.
Fox E, Arnold RM, Brody B. 1990. Medical ethics education: past, pre-
sent, future. Acad Med. 70:761–769.
Hafferty FW, Franks R. 1992. The hidden curriculum, ethics teaching,
and the structure of medical education. Acad Med. 69:861–871.
Mattick K, Bligh J. 2006. Teaching and assessing medical ethics: where
are we now? J Med Ethics. 32:181–185.
Thistlethwaite HE, Davies D, Ekeocha S, Kidd JM, MacDougall C,
Matthews P, Purkis J, Clay D. 2012. The effectiveness of case-
based learning in health professional education. A BEME
systematic review: BEME Guide No. 23. Med Teach. 34: e421–
e444.
UNESCO Bioethics. 2001. International network of the UNESCO Chair in
Bioethics Haifa. www.unesco-chair-bioethics.org/
UNESCO Bioethics Core Curriculum. 2008. Section 1: Syllabus Ethics
Education Programme, Sector for Social and Human Sciences;
Division of Ethics of Science and Technology. Haifa: UNESCO. www.
unesco.org/shs/ethics/eep
1 3
ORIGINAL ARTICLE
Indian J Otolaryngol Head Neck Surg
(July–Sept 2018) 70(3):380–386; https://doi.org/10.1007/s12070-018-1386-4
Neonatal Screening for Prevalence of Hearing Impairment in Rural Areas
Sapna R. Parab1 • Mubarak M. Khan1 • Sneha Kulkarni1 • Virendra Ghaisas2 •
Prakash Kulkarni2
Received: 14 May 2017 / Accepted: 28 April 2018 / Published online: 4 May 2018
© Association of Otolaryngologists of India 2018
Abstract Hearing is one of the most important sense
organs for man. Hearing loss is often associated with
delayed speech and language development in young chil-
dren. Early identification and intervention improves the
chance a child gets to lesser delays in development and
improving the overall quality of life. To find out the
prevalence of hearing loss in neonates in the rural taluka of
Maval, Pune, Maharashtra, India. Prospective Non Ran-
domized Clinical Study. The study was carried out between
April 2012 and April 2015. A total of 8192 babies were
screened across various centers around the Maval area. The
babies who had some high risk factors were 1683 in
number and babies who had no high risk factors i.e. well
babies were 6509. In our study, the overall prevalence of
hearing loss in neonates in Maval taluka of Maharashtra
was found to be 3.54 per 1000 live births, in normal born
neonates (well babies) was 1.689 per 1000 births, in high
risk babies was 10.69 per 1000 high risk births. The
prevalence of low birth weight neonates, hyperbilirubine-
mia neonates and neonates with craniofacial abnormalities
developing hearing impairment was found to be 5.9, 3.56
and 1.18 per 1000 high risk births respectively. India is the
second most populated country in the world with nearly a
fifth of the world’s population. There is a need for the
universal neonatal screening for deafness for earlier
detection of deafness and rehabilitation.
Level of Evidence: Level IV.
& Sapna R. Parab
1 Department of Otorhinolaryngology, M.I.M.E.R. Medical
College, Talegaon-D, Pune 410507, India
2 M.I.M.E.R. Medical College, Talegaon-D, Pune, India
Keywords Neonatal screening · Deafness ·
Otoacoustic emission ·
Brainstem evoked response audiometry
Introduction
Hearing is one of the most important sense organs for man
important for normal speech and language acquisition.
Hearing loss is often associated with delayed speech and
language development. This often cause children with
hearing impairment to fall behind their peers in aspects of
literacy, academics and overall social wellbeing. This
indirectly leads to lower educational and employment
levels in adults. It is estimated that 50% of children with
hearing impairment in school dropout at the age of
13 years. The rural areas of India lack in health care
facilities as compared to the urban areas. In a recent survey,
4 out of every 1000 children born in India were found to
have severe, to profound hearing loss. The incidence of
hearing loss could be alarmingly in rural areas where nei-
ther study is done to detect the incidence/prevalence of
hearing loss in infants nor audiological rehabilitation is
provided. This could be either due to lack of awareness
among parents, health care professionals and the society as
a whole. With no dedicated National Health Program to
detect neonatal hearing loss, it becomes all the more
important to us to detect these unfortunate infants with
congenital hearing loss in our rural area of Maval.
Neonatal hearing loss has a prevalence that is more than
twice that of other newborn disorders amenable to
screening such as congenital hypothyroidism and
phenylketonuria [1, 2].

1 3
Indian J Otolaryngol Head Neck Surg (July–Sept 2018) 70(3):380–386 381
World Problem Statement
World Health Organization (WHO) estimates that 5.3% of
the world’s population, 360 million, suffers from disabling
hearing loss with 91% adults and 9% children. Disabling
Hearing Loss is defined as hearing loss greater than 40 dB
in the better hearing ear in adults (15 years or older) and
greater than 30 dB in the better hearing ear in children (0–
14 years). The prevalence of hearing loss in children is
highest in South Asia, Asia Pacific and Sub-Saharan
Africa. India is one of the countries in South Asia [3].
Problem Statement in India
As per National Sample Survey Organization survey, cur-
rently there are 291 persons per one lakh population who
are suffering from severe to profound hearing loss [4]. Out
of this population, a large percentage is children between
the ages of 0–14 years.
Congenital bilateral hearing impairment occurs in
approximately in 1–5 per 1000 live births and when per-
manent unilateral hearing loss is included, the incidence
increases to 8 per 1000 live births [5, 6]. Studies done in
India using different hearing screening protocols have
estimated the neonatal hearing loss to vary between 1 and 8
per 1000 babies screened [7–9]. Early identification and
intervention for hearing loss by 6 months of age provides
better prognosis in language development, academic suc-
cess, social integration and successful participation in the
society [5].
The statistics indicate a huge number of children suffer
from hearing loss which must be detected at an early age to
integrate the children in society. The Joint Committee on
Infant Hearing (JCIH) was established with such points in
mind. The JCIH was established in late 1969 and composed
of representatives from audiology, otolaryngology, pedi-
atrics, and nursing. It was the American Speech Language
Hearing Association (ASHA), the then American Academy
of Ophthalmology and Otolaryngology (AAOO) and the
American Academy of Pediatrics (AAP) who were the
founders. The Committee was charged with a two-fold
responsibility: first, to make recommendations concerning
the early identification of children with, or at-risk for
hearing loss and second, newborn hearing screening. The
first statement issued by the JCIH in 1971 [10], stated that
mass hearing screening could not be justified at that time
because of lack of appropriate test procedures. The state-
ment encouraged ongoing research and acknowledged the
need to detect hearing loss early in life.
The first attempts at hearing screening were behavioural
observation techniques in mid 1960s using the auropalpe-
bral response, startle response and limb and head move-
ments to judge a response to high frequency narrow band
noise at about 90–100 dB SPL. The drawbacks of this
method were that the method was time consuming identi-
fied only infants with bilateral severe to profound high
frequency hearing loss. The method also did not provide
ear and frequency specific information and had a high false
negative rate [11].
The 1971 statement given by JCIH defined the first high-
risk factors for hearing loss and recommended following
infants with these high risk factors: history of hereditary
childhood hearing impairment, congenital perinatal infection
such as rubella or other nonbacterial fetal infection like
cytomegalovirus, and herpes; cran1ofacial anomalies, birth
weight less than 1500 g and a bilirubin level greater than 20. In
1982, bacterial meningitis and severe asphyxia were added.
Additional risk indicators were added between 1982 and 1994.
JCIH in 1994 [12] endorsed universal detection of hear-
ing loss in newborns and infants and stated that all infants
with hearing loss be identified before 3 months of age and
receive intervention by 6 months. In 2000, the focus was
given on quality of the care provided for each infant. JCIH
endorsed the development of early hearing detection and
identification with use of state or universal hearing screening
protocols. JCIH in 2000 provided guidelines for early
hearing detection and identification programs. Recently
JCIH in 2007 issued another position statement which
updated the principles from the 2000 statement. The changes
made were-updating the definition of targeted hearing loss,
issue separate protocols for well-baby nursery and NICU
babies, tests included in diagnostic audiological evaluation,
medical evaluation, early intervention and monitoring and
surveillance of developmental milestones. The position
statement made clear each role and responsibility of each
team member in the early detection and intervention pro-
gram and also the protocol to be followed.
The effectiveness and need for universal hearing
screening in neonates has previously been well proven
[12, 13]. Although hearing screening programs using dif-
ferent screening protocols have been setup in some centers,
procedures for systematic identification and rehabilitation
on a large scale are yet to be tested and implemented in the
Indian setting.
This study was undertaken with the primary objective of
detecting hearing impairment in Maval Taluka with two
stage sequential screening protocol with optoacoustic
emission (OAE) and brainstem evoked response audiom-
etry (BERA).
Materials and Methods
This descriptive study was carried out between April 2012
and April 2015 around the Maval area. The project was
approved by the MIMER ethical committee. Various
382 Indian J Otolaryngol Head Neck Surg (July–Sept 2018) 70(3):380–386
1 3
centers which catered to neonates were selected. A two tier
screening protocol was followed.
All normal new born babies delivered in MIMER
Medical College, Nursing homes around Talegaon, PHC
and private hospitals were screened by the Audiologist
using TEOAE between 24 and 72 h after birth. Newborns
admitted in the Neonatal Intensive Care unit (NICU) were
screened prior to discharge from NICU (once their general
condition was stable). A quiet area was chosen for
screening. The OAE probe was introduced in the neonate’s
ear after examination of the externa ear for debris, wax etc.
The results were saved on the device and later transferred
to a computer for analysis. Mothers of all babies were
counselled regarding the benefits of hearing screening,
procedure of the test, need for follow up and further tests if
neonate failed the screening test, and the interventions
available if hearing loss was confirmed. The first screening
test was done in the post-natal wards or NICU after
obtaining informed consent from the mother. Parents of
babies who failed (‘‘refer’’) screening test once were
counselled and asked to return after 2 weeks for second
screening. These babies underwent a second testing in a
quiet room. Those who passed on the second screening
were discharged from the study while those who failed
second time were called after 2 weeks for ABR testing.
A detailed case history, which included questions relating
to mother’s history, pre, peri and post-natal birth history and
family history was obtained. In addition to this, a detailed
history regarding the high risk factors was also taken. The
high risk factors taken into consideration, on the basis of
JCIH, 1994 position statement were—family history of
hearing loss, maternal infections like TORCH, craniofacial
anomalies, birth weight less than 1500 g, hyperbilirubinemia
at serum level requiring exchange transfusion, ototoxic
medications taken by the mother, bacterial meningitis,
APGAR scores of 0–4 at 1 min or 0–6 at 5 min, mechanical
ventilation lasting for 5 days or longer and syndromes
associated with sensorineural or conductive hearing loss.
The neonate underwent an examination by the ENT surgeon
for outer, middle ear anomalies. Next step of the protocol
was TEOAE screening using LABAT Ecolab-Screener. The
protocol set was as follows:
• Type of stimuli: clicks
• SNR: 3–6 dB
• Frequency: 1–4 kHz.
The Auditory Brainstem Response (ABR) was carried
out using LABAT Epic Plus-ABR system, either under
sedated sleep or natural sleep. The following protocol was
used.
• Type of stimuli: clicks
• Intensity: varying intensity (threshold estimation)
• Polarity: alternating
• Number of clicks: 2000
• Time window: 15 ms
• Filter settings: 30–3000 Hz
• Electrode montage: FPz—M1–M2.
The impedance was kept as low as possible and the
electrical activity was kept at a minimum. The least
intensity at which a replicable and robust wave V was seen
was considered as the threshold. The babies who were
detected with hearing loss with ABR were considered for
hearing rehabilitation either with hearing aids or cochlear
implants.
The data collected was tabulated and analyzed.
Results
The study was carried out between April 2012 and April
2015. The aim of the study was to find out the incidence of
hearing loss in neonates in rural areas of Maval taluka of
Maharashtra. A total of 8192 babies were screened across
various centers around the Maval area. The babies who had
some high risk factors were 1683 in number and babies
who had no high risk factors i.e. well babies were 6509.
In the well-baby group, 4926 passed in the first tier of
screening. The 1583 who were referred in the first phase
underwent another screening after two weeks. At the second
visit, 1454 passed the screening, 105 failed the screening
and 24 were lost to follow up. In the high risk group, 1406
passed in the first tier of screening. The 277 who were
referred in the first phase underwent another screening after
two weeks. At the second visit, 184 passed the screening, 72
failed the screening and 21 were lost to follow up.
A total of 18 out of 72 referred neonates for ABR were
detected with hearing impairment, whereas 54 out of 72
neonates were having hearing sensitivity within normal
limits on ABR. Among the well-baby group, 105 well
babies who were referred for ABR 11 were detected with
hearing impairment, 67 had hearing sensitivity within
normal limits and 27 were lost to follow up. Among the 18
high risk babies detected with hearing loss, 10 had low
birth weight, 6 had hyperbilirubinemia and 2 had cranio-
facial abnormalities (Table 1 and Fig. 1).
In our study, the overall prevalence of hearing loss in
neonates in Maval taluka of Maharashtra was found to be
3.54 per 1000 live births, in normal born neonates (well
babies) was 1.689 per 1000 births, in high risk babies was
10.69 per 1000 high risk births. The prevalence of low birth
weight neonates, hyperbilirubinemia neonates and neonates
with craniofacial abnormalities developing hearing
impairment was found to be 5.9, 3.56 and 1.18 per 1000
high risk births respectively.

Indian J Otolaryngol Head Neck Surg (July–Sept 2018) 70(3):380–386 383
1 3
Total Babies screened
Drop out 21
2nd Screen
Dropout 24 Pass 1454 Refer 105
2nd Screen
Table 1 Table showing the number of babies screened and referred at both stages
No. of babies
screened
Babies referred on
1st screen
Babies who underwent
2nd screen
Babies referred on
2nd screen
Babies who
underwent ABR
Babies with confirmed
hearing loss
Normal 6509 1583 1559 105 78 11
High risk
1683 277 256 72 72 18
Total 8192 1860 1815 177 150 29
Fig. 1 Flow chart depicting the screening protocol and results obtained
Discussion
Many universal screening programs use a two-step protocol
consisting of OAE and Automated ABR (AABR). In
developed nations, testing with either OAE or AABR is
mandatory, or at least encouraged, prior to discharge from
maternity hospital. In the US and UK, it is mandatory for
the newborn to undergo hearing screening either before
leaving the hospital or shortly after discharge from hospi-
tal. However, the scenario in developing nations is differ-
ent. There are often barriers like expensive equipment,
scarcity of trained and skilled personnel, and shortage of
skilled maternal and newborn health workers especially in
rural areas [14]. Additionally, the births may not take place
in a hospital setting where the screening resources are
available. Many infants are also lost for follow up [15].
The Government of India initiated the National Pro-
gramme for Prevention and Control of Deafness (NPPCD)
in 2006 [16]. It was initially started as a pilot project and
was implemented in 25 districts in 10 states and 1 union
territory. The project aims to cover three levels of pre-
vention and care: primary, secondary and tertiary ear care.
It aims at preventing avoidable hearing loss which is due to
disease or injury, early identification and treatment either
medically or by rehabilitation. The programme has four
main components-manpower training and development;
building infrastructure at district hospitals, community
health centers and primary health centers; early detection
Pass 1406 Refer 277
High risk 1683
54 Hearing Sensitivity within Normal limits
18 Hearing loss
Pass 184 Refer 72
Pass 4926 Refer 1583
Well baby 6509
27 Dropouts 67 Hearing Sensitivity within Normal limits
11 Hearing loss
384 Indian J Otolaryngol Head Neck Surg (July–Sept 2018) 70(3):380–386
1 3
and management of hearing and speech impaired cases at
different levels of health care system and fourth component
is the creation of awareness among levels of health care
system. In developing nations particularly where limited
resources are available, use of low cost calibrated
mechanical noisemakers to conduct hearing screening was
studied [17]. They trained six health workers who were
supervised by a qualified audiologist to observe behavioral
responses of neonates using calibrated noisemakers.
Twenty out of 425 neonates with confirmed severe to
profound hearing loss by ABR testing were included. The
mechanical calibrated noisemakers of 50, 60, 70 and 80 dB
(A) were used to elicit behavioral responses. Neonates
were in state of light sleep when the test was performed.
The observer was blinded to the stimulus. The tester pre-
sented the stimulus at a distance of 1 m from the testing ear
which was not in the visual field of observer. The stimuli
was presented 3 times with a 1 min interval. The tester
noted the time at which the stimulus was presented. The
observer noted the response and the time at which it was
observed. A qualified audiologist observed if the health
worker correctly identified the response. The authors found
that the sensitivity and specificity was high for 70 and
80 dB (A) noisemakers with least false positive referrals.
The authors, thus concluded that in controlled settings,
health workers with primary education can be trained by
qualified audiologists to use calibrated noisemakers to
conduct screening for severe to profound hearing loss.
Our study carried out between April 2012 and April
2015 in the Maval taluka of Maharashtra included total of
8192 babies with 1683 neonates having high risk factors
and 6509 well babies. This is the first study in the state of
Maharashtra for screening of deafness in neonates. The
overall prevalence of hearing loss in neonates of Maval
taluka in our study was found to be 3.54 per 1000 live
births; in normal born neonates (well babies) was 1.689 per
1000 births and in high risk babies was 10.69 per 1000 high
risk births. The prevalence of low birth weight neonates,
hyperbilirubinemia neonates and neonates with craniofa-
cial abnormalities developing hearing impairment was
found to be 5.9, 3.56 and 1.18 per 1000 high risk births
respectively.
Tests used for screening newborns for hearing loss
include Otoacoustic Emissions (OAE) and Automated
Auditory Brainstem Evoked Response (aABR). While
OAE is cheap, quick, simple and reliable with a sensitivity
of 100% and specificity of 99% [18–20], ABR has the
additional advantage of identifying neonates with auditory
neuropathy.
The advent of Otoacoustic Emissions (OAE) and
Auditory Brainstem Evoked Response (ABR) has provided
noninvasive recordings of physiologic activity underlying
normal auditory function and both are easily performed in
neonates and infants. Otoacoustic emissions (OAEs) are
sounds given off by the inner ear when the cochlea is
stimulated by a sound. When sound stimulates the cochlea,
the outer hair cells vibrate. The vibration produces a nearly
inaudible sound that echoes back into the middle ear. The
sound can be measured with a small probe inserted into the
ear canal. The auditory brainstem response (ABR) test
gives information about the inner ear (cochlea) and brain
pathways for hearing.
Various studies are published which are constrained to a
particular center usually tertiary care centers
[7, 15, 21–23]. These studies follow different protocols,
screening of at risk versus well baby clinic, difference in
times between re screening and different use of instruments
and tests.
Nagapoornima et al. [20], studied a total of 1769 neonates
from a total of 8192 out of which 6509 were not at risk
babies and 1683 were at risk babies. The babies underwent
Transient evoked Oto Acoustic Emissions (OAE) as the first
level of screening by 6 weeks. The neonates who failed at
the first screening underwent re screening within 3 weeks of
first screening. If neonates failed a second screening, they
underwent an Auditory Brainstem Response and behavioral
audiometry to confirm the hearing loss. Results in the study
reported an incidence of 10 per 1769 infants screened which
is 5.65 per 1000 screened. Out of 1769 infants, 279 were at
risk neonates 3 out of which were detected to have hearing
loss. This puts the incidence to 10.75 per 1000 neonates. Out
of the 1490 who are not at risk, 7 had hearing loss, which
makes the incidence 4.70 per 1000 screened. The authors
extrapolated the findings and found an incidence of 5.60 per
1000 neonates in a tertiary care center. The study also
showed that hearing screening of only high risk neonates can
miss the detection up to 70% of children with hearing
impairment.
John et al. [7] screened 500 neonates with automated
distortion product otoacoustic emission (aDPOAE) fol-
lowed by automated Auditory Brainstem Response (aABR)
on neonates who failed a repeat DPOAE. On the first
screening, 32 failed the screening. On repeat OAE only 8
failed the test, out of which 3 did not pass the aABR test.
The authors thus concluded that the incidence of moderate
to moderately severe sensorineural hearing loss in their
study was 0.6%.
A two tier centralized screening programme which
consisted of otoacoustic emission as first screen followed
by auditory brainstem response for those who failed the
first screen was initiated for all newborns in Cochin. A total
of 10,165 babies were screened using this program which
brought together twenty major hospitals with maternity
units. The incidence of hearing loss in the high risk group
was found to be 10.3 per 1000 and 0.98 per 1000 in the
well-baby group [8].
Indian J Otolaryngol Head Neck Surg (July–Sept 2018) 70(3):380–386 385
1 3
A similar programme was started at Ludhiana [21]. The
screening initially was done by using TOAE after 48 h of
birth. Neonates who failed the initial screen were screened
again after 1 month and those who failed this screening
were referred to Audiologist. Among the 1000 neonates
who were screened initially, 6% failed the initial screen.
Four failed the next screening out of the 42 who reported
for the rescreening out of which 3 had risk factors. Two
babies had severe sensorineural hearing loss and two had
moderate to severe hearing loss.
In spite of the individual regional studies of neonatal
screening for deafness, till now, there is an absence of large
scale studies which target hearing screening of neonates.
Auditory neuropathy is defined as an abnormal or absent
auditory brainstem response but intact OAE or cochlear
microphonics. In our screening protocol like most other
universal screening programs [13, 16–21], OAE was per-
formed first and ABR was performed only when OAE
failed twice. Neonates who undergo automated ABR with
OAE can be screened successfully for auditory neuropathy.
The screening protocols [24, 25], in which ABR is done in
patients with passed OAE in NICU can detect early audi-
tory neuropathy. We did not detect cases of auditory neu-
ropathy in our study.
Conclusion
In our study, the overall prevalence of hearing loss in
neonates in Maval taluka of Maharashtra was found to be
3.54 per 1000 live births, in normal born neonates (well
babies) was 1.689 per 1000 births, in high risk babies was
10.69 per 1000 high risk births.
India is the second most populated country in the world
with nearly a fifth of the world’s population. Rural areas
lack in medical and health care facilities as compared to
urban areas. There is a need for the implementation of the
National Health Programme for neonatal deafness screen-
ing for earlier detection and rehabilitation of these unfor-
tunate neonates so as to allow less delay in development
and to improve the overall quality of life.
Funding ICMR funded.
Compliance with Ethical Standards
Conflict of interest The authors declare that they have no conflict of
interest.
Ethical Approval All procedures performed in studies involving
human participants were in accordance with the ethical standards of
the institutional committee and with the 1964 helsinski declaration
and its later ammendments or comparable ethical standards. Institu-
tional Ethics Committee has approved the study.
Informed Consent Informed consent was obtained from all indi-
vidual participants included in the study.
References
1. Augustine AM, Jana AK, Kuruvilla KA, Danda S, Lepcha A,
Ebenzer J, Paul RR, Tyagi A, Balraj A (2014) Neonatal hearing
screening-experience from a tertiary care hospital in Southern
India. Indian J Pediatr 51:179–183
2. Bickel H, Bachmann C, Beckers R et al (1981) Neonatal mass
screening for metabolic disorders. Eur J Pediatr 137:133.
https://doi.org/10.1007/BF00441305
3. De Capua B, De Felice C, Costantini D, Bagnoli F, Passali D
(2003) Newborn hearing screening by transient evoked otoa-
coustic emissions: analysis of response as a function of risk
factors. Acta Otorhinolaryngol Ital 23:16–20
4. Directorate General of Health Services. Ministry of Health and
Family Welfare, National Program for Prevention and Control of
Deafness, Project Proposal. New Delhi (2006). https://mohfw.
gov.in/sites/default/files/51892751619025258383Operational%
20Guidlines%20for%2012th%20Plan_0.pdf
5. Fisher DA, Dussault JH, Foley TP, Klein AH, LaFranchi S,
Larsen PR et al (1979) Screening for congenital hypothyroidism:
results of screening one million North American infants. J Pediatr
94:700–705
6. Jewel J, Varghese P, Singh T, Varghese A (2013) Newborn
hearing screening—experience at a tertiary hospital in northwest
India. Int J Otolaryngol Head Neck Surg 2(5):211–214.
https://doi.org/10.4236/ijohns.2013.25044
7. John M, Balraj A, Kurien M (2009) Neonatal screening for
hearing loss: pilot study from a tertiary care center. Indian J
Otolaryngol Head Neck Surg 61:23–26
8. Joint Committee on Infant Hearing (1994) 1994 position state-
ment. AAO-HNS Bull. 12:13
9. Joint Committee on Infant Hearing (1994) 1994 position state-
ment. ASHA 36(12):38–41
10. Joint Committee on Infant Hearing (1994) Joint Committee on
Infant Hearing (JICH) 1994 position statement. Pediatrics 95:152
11. Joint Committee on Infant Hearing (2007) Year 2007 position
statement: principles and guidelines for early hearing detection
and intervention programs. Pediatrics 120:898–921
12. Joint Committee on Infant Hearing, American Academy of
Audiology, American Academy of Pediatrics, American Speech-
Language-Hearing Association, Directors of Speech and Hearing
Programs in State Health and Welfare Agencies (2000) Year
2000 position statement: principles and guidelines for early
hearing detection and intervention programs. Pediatrics
2000(106):798–817
13. Judith A, Mason MS, Kenneth R, Herrmann MD (1998)
Universal infant hearing screening by automated auditory brain-
stem response measurement. Pediatrics 101:221–228
14. National Sample Survey Organization (2003) Disabled persons in
India, NSS 58th round (July–December 2002) Report no. 485
(58/26/1). New Delhi: National Sample Survey Organization,
Ministry of Statistics and Programme Implementation, Govern-
ment of India
15. Paul AK (2011) Early identification of hearing loss and central-
ized newborn hearing screening facility—the Cochin experience.
Indian Pediatr 48:355–359
16. Rai N, Thakur N (2013) Universal screening of newborns to
detect hearing impairment—is it necessary? Int J Pediatr
Otorhinolaryngol 77:1036–1041
17. Ramesh A, Jagdish C, Nagapoorinima M, Suman Rao PN,
Ramakrishnan AG, Thomas GC, Dominic M, Swarnarekha A
386 Indian J Otolaryngol Head Neck Surg (July–Sept 2018) 70(3):380–386
1 3
(2012) Low cost calibrated mechanical noise maker for hearing
screening of neonates in resource constrained settings. Indian J
Med Res 135:170–176
18. Maxon AB, White KR, Behrens TR, Vohr BR (1995) Referral
rates and cost efficiency in a universal newborn hearing screening
program using transient evoked optoacoustic emissions. J Am
Acad Audiol 6:271–277
19. Maxon AB, White KR, Vohr BR, Behrens TR (1993) Using
transient evoked otoacoustic emissions for neonatal hearing
screening. Br J Audiol 27:149–153
20. Nagapoornima P, Ramesh A, Rao S, Patricia PL, Gore M et al
(2007) Universal hearing screening. Indian J Pediatr 74:545–549
21. Sanders R, Durieux-Smith A, Hyde M, Jacobson J, Kileny P,
Murnane O (1985) Incidence of hearing loss in high risk and
intensive care nursery infants. J Otolaryngol 14:28–33
22. World Health Organization. Fact sheet. Deafness and hearing
impairment.
http://www.who.int/mediacentre/factsheets/fs300/en/index.html.
Accessed on 10 Jan 2009
23. World Health Organization. State of hearing and ear care in the
South East Asia Region. WHO Regional Office for South East
Asia. WHO-SEARO. SEA/Deaf/9. http://www.searo.
who.int/LinkFiles/Publications_HEARING_&_EAR_CARE.pdf.
Accessed on 10 Jan 2009
24. Berg AL, Spitzer JB, Towers HM, Bartosiewicz C, Diamond BE
(2005) Newborn hearing screening in the NICU: profile of failed
auditory brainstem response/passed otoacoustic emission. Pedi-
atrics 116:933–938
25. Kirkim G, Serbetcioglu B, Erdag TK, Ceryan K (2008) The
frequency of auditory neuropathy detected by universal newborn
hearing screening program. Int J Pediatr Otorhinolaryngol
72:1461–1469
1701581 (1 of 6) Adv. Mater. Interfaces 2018, 1701581 © 2018 WILEY-VCH Verlag GmbH & Co. KGaA, Weinheim
www.advmatinterfaces.de
Selective Cell Isolation by Transferrin Functionalized Silane– Carbon Soot Mediated Superhydrophobic Micropatterns
Govind P. Chate, Narendra R. Kale, Vrushali Khobragade, Chinmay Rahane,
Marcelo Calderón, Shashwat S. Banerjee,* and Jayant J. Khandare*
Designing patterned superhydrophobic (SH) surfaces is highly
challenging, since the fabrication of wettable and biologically
imperative surfaces with functionalized patterns necessitates
control for fluid handling in confined space.[1–7] However,
imparting chemical functionality to wettable microframes sur-
rounded by SH regions is highly challenging. This is because,
few techniques have been proposed to obtain wettable patterned
surfaces by using surface modification techniques namely “ink”
printing. Furthermore, functional groups have been gener-
ated using UV irradiation.[8,9] However, the targeting moieties
have not been conjugated covalently on wettable patterns sur-
rounded by SH region. Therefore, a novel chemical approach is
envisioned to design functionalized micrometer-sized patterns
G. P. Chate, N. R. Kale, V. Khobragade, C. Rahane, Prof. J. J. Khandare MAEER’s Maharashtra Institute of Pharmacy Kothrud, Pune 411038, India E-mail: [email protected]
Prof. M. Calderón Freie Universität Berlin Institut für Chemie und Biochemie Organische Chemie Takustrasse 3, 14195 Berlin, Germany
Dr. S. S. Banerjee Maharashtra Institute of Medical Education and Research Medical College Talegaon Dabhade, Pune 410507, India E-mail: [email protected]
DOI: 10.1002/admi.201701581
embedded with targeting moieties for
selective cell isolation.
We report design and synthesis of func-
tionalized patterns by covalently conju-
gating transferrin (Tf) on silanized glass
surfaces bordered by CS regions. We
hypothesize that the covalently conjugated
Tf on wettable silanized glass surfaces
will demonstrate specific capture of Tf
overexpressing cells. Tf is a serum glyco-
protein that is widely used as a targeting
moiety in cancer therapeutics. Cancer
cells overexpress Tf receptors (TfRs) when
compared with normal cells. The reason
behind overexpressing TfRs by malignant
cells is because they are rapidly dividing
and growing. This property of malignant
cells proves to be their Achilles’ heel.[10]
Recently, we reported the use of Tf as cell
targeting moiety to isolate and capture
cancer cells from cancer patients blood
samples though 3D matrix substrates.[11–14] Similarly, the tar-
geted drug delivery systems designed by Tf-decorated nano-
particles (NPs) demonstrate its cell specific accumulation in
tumor, highlighting the enhanced targeting ability after con-
jugation with Tf.[15–19] It is envisioned that Tf targeting moiety
covalently attached on wettable patterns will target TfRs overex-
pressing cells and shall offer several advantages over surfaces
that have no confined space limited by boundary layer. There-
fore, the uniqueness of such surfaces is fourfold: (a) Tf-medi-
ated wettable cell adhesion sites, (b) nonwettable Cassie–Baxter
state inducing SH regions surrounding adhesion sites for pre-
venting cell attachment, (c) high media holding capacity of pat-
terned wells, and (d) ease of monitoring the cell growth studies
due to translucent surface.
To demonstrate the efficiency of Tf silane (Si-Tf) functional-
ized chip, HCT 116 and HeLa cells were used to evaluate the
cell isolation efficiency from cell enriching medium. Earlier,
Si-Tf chip was prepared by a multistep process as depicted in
Figure 1. Number of wettable patterns per Si-Tf chip can be
increased, depending on the size of the glass substrate used
and the volume of cell suspension from which cell isolation has
to be carried out. The process for preparation of Si-Tf chip with
multiple wettable sites (Figure 1) and Si-Tf chip with single
wettable pattern (Figure 2a) is similar, except the number of
masking beads used. Glass cover slips were silanized to impart
NH2 functional groups for further chemical conjugation.
Each glass slip was estimated to contain 19 amine groups per
nm2.[20] Quantitation of the number of amine groups per nm2
COMMUNICATION
Biomedical Applications
Surfaces that facilitate selective cell adhesion using specific targeting moie-
ties have great implications in diagnostics, tissue engineering, and high
throughput screenings. However, designing robust and spatially confined
micropatterns for selective cell isolation on portable platform is highly chal-
lenging. Here, wettable, silane (Si) micropatterns holding covalently attached
transferrin (Tf ) for targeting Tf overexpressing cancer cells are reported. These
micropatterns are separated by carbon soot based superhydrophobic regions
that turn these targeting sites into surface tension confined “microwells.”
These microwells facilitate capture of human colorectal carcinoma cells (HCT
116) and human cervical adenocarcinoma cells (HeLa) by confining their
attachment to wettable region, thereby making isolation and spotting of the
targeted cells more efficient. In addition, owing to its transparent trait, the Tf
conjugated wettability based patterned chip offer real time optical monitoring
of cell adhesion, cell growth, and cell behavior. The specific cell isolation using
such surface has applications in devising cancer recurrence monitoring tests.
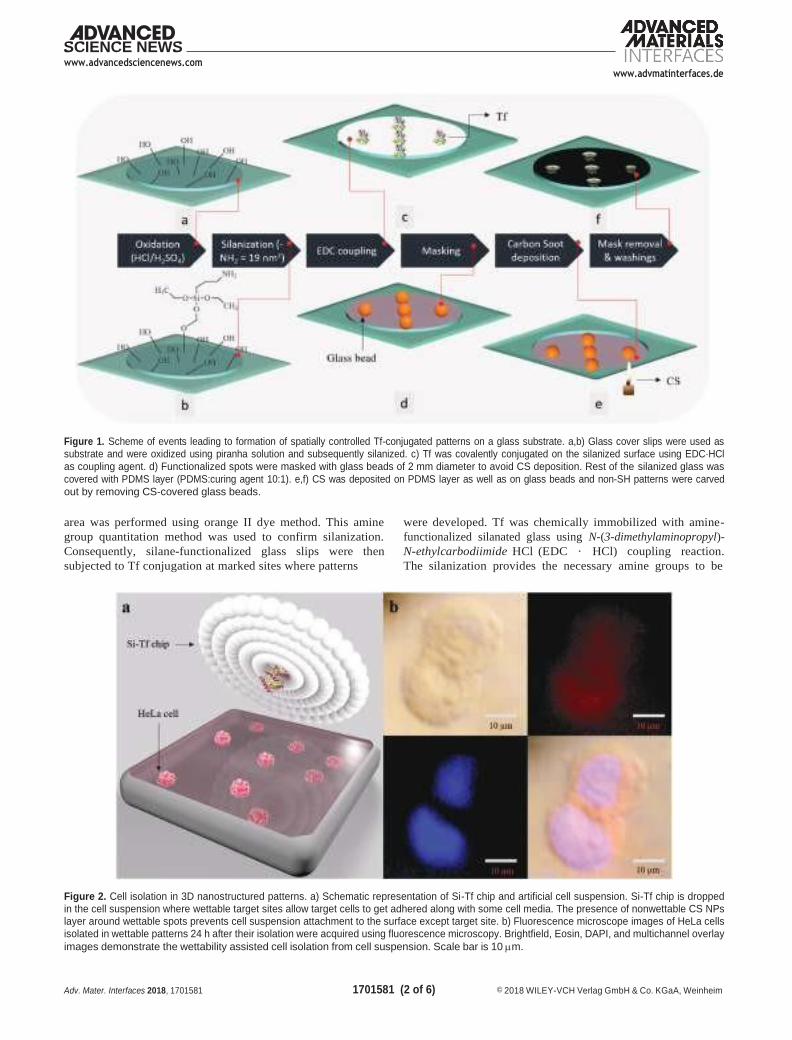
1701581 (2 of 6) Adv. Mater. Interfaces 2018, 1701581 © 2018 WILEY-VCH Verlag GmbH & Co. KGaA, Weinheim
www.advancedsciencenews.com www.advmatinterfaces.de
Figure 1. Scheme of events leading to formation of spatially controlled Tf-conjugated patterns on a glass substrate. a,b) Glass cover slips were used as substrate and were oxidized using piranha solution and subsequently silanized. c) Tf was covalently conjugated on the silanized surface using EDC·HCl
as coupling agent. d) Functionalized spots were masked with glass beads of 2 mm diameter to avoid CS deposition. Rest of the silanized glass was
covered with PDMS layer (PDMS:curing agent 10:1). e,f) CS was deposited on PDMS layer as well as on glass beads and non-SH patterns were carved
out by removing CS-covered glass beads.
area was performed using orange II dye method. This amine
group quantitation method was used to confirm silanization.
Consequently, silane-functionalized glass slips were then
subjected to Tf conjugation at marked sites where patterns
were developed. Tf was chemically immobilized with amine-
functionalized silanated glass using N-(3-dimethylaminopropyl)-
N-ethylcarbodiimide HCl (EDC · HCl) coupling reaction.
The silanization provides the necessary amine groups to be
Figure 2. Cell isolation in 3D nanostructured patterns. a) Schematic representation of Si-Tf chip and artificial cell suspension. Si-Tf chip is dropped in the cell suspension where wettable target sites allow target cells to get adhered along with some cell media. The presence of nonwettable CS NPs layer around wettable spots prevents cell suspension attachment to the surface except target site. b) Fluorescence microscope images of HeLa cells isolated in wettable patterns 24 h after their isolation were acquired using fluorescence microscopy. Brightfield, Eosin, DAPI, and multichannel overlay
images demonstrate the wettability assisted cell isolation from cell suspension. Scale bar is 10 m.
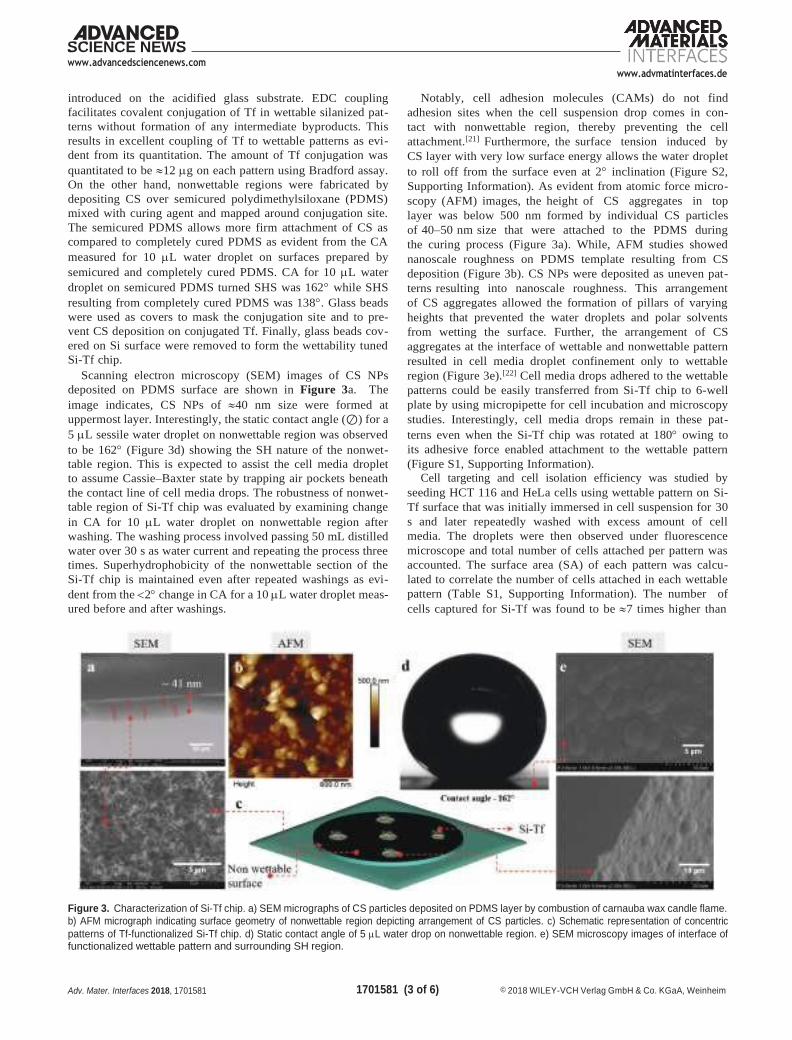
www.advancedsciencenews.com www.advmatinterfaces.de
1701581 (3 of 6) Adv. Mater. Interfaces 2018, 1701581 © 2018 WILEY-VCH Verlag GmbH & Co. KGaA, Weinheim
introduced on the acidified glass substrate. EDC coupling
facilitates covalent conjugation of Tf in wettable silanized pat-
terns without formation of any intermediate byproducts. This
results in excellent coupling of Tf to wettable patterns as evi-
dent from its quantitation. The amount of Tf conjugation was
quantitated to be 12 g on each pattern using Bradford assay.
On the other hand, nonwettable regions were fabricated by
depositing CS over semicured polydimethylsiloxane (PDMS)
mixed with curing agent and mapped around conjugation site.
The semicured PDMS allows more firm attachment of CS as
compared to completely cured PDMS as evident from the CA
measured for 10 L water droplet on surfaces prepared by
semicured and completely cured PDMS. CA for 10 L water
droplet on semicured PDMS turned SHS was 162 while SHS
resulting from completely cured PDMS was 138. Glass beads
were used as covers to mask the conjugation site and to pre-
vent CS deposition on conjugated Tf. Finally, glass beads cov-
ered on Si surface were removed to form the wettability tuned
Si-Tf chip.
Scanning electron microscopy (SEM) images of CS NPs
deposited on PDMS surface are shown in Figure 3a. The
image indicates, CS NPs of 40 nm size were formed at
uppermost layer. Interestingly, the static contact angle (⊘) for a
5 L sessile water droplet on nonwettable region was observed
to be 162 (Figure 3d) showing the SH nature of the nonwet-
table region. This is expected to assist the cell media droplet
to assume Cassie–Baxter state by trapping air pockets beneath
the contact line of cell media drops. The robustness of nonwet-
table region of Si-Tf chip was evaluated by examining change
in CA for 10 L water droplet on nonwettable region after
washing. The washing process involved passing 50 mL distilled
water over 30 s as water current and repeating the process three
times. Superhydrophobicity of the nonwettable section of the
Si-Tf chip is maintained even after repeated washings as evi-
dent from the 2 change in CA for a 10 L water droplet meas-
ured before and after washings.
Notably, cell adhesion molecules (CAMs) do not find
adhesion sites when the cell suspension drop comes in con-
tact with nonwettable region, thereby preventing the cell
attachment.[21] Furthermore, the surface tension induced by
CS layer with very low surface energy allows the water droplet
to roll off from the surface even at 2 inclination (Figure S2,
Supporting Information). As evident from atomic force micro-
scopy (AFM) images, the height of CS aggregates in top
layer was below 500 nm formed by individual CS particles
of 40–50 nm size that were attached to the PDMS during
the curing process (Figure 3a). While, AFM studies showed
nanoscale roughness on PDMS template resulting from CS
deposition (Figure 3b). CS NPs were deposited as uneven pat-
terns resulting into nanoscale roughness. This arrangement
of CS aggregates allowed the formation of pillars of varying
heights that prevented the water droplets and polar solvents
from wetting the surface. Further, the arrangement of CS
aggregates at the interface of wettable and nonwettable pattern
resulted in cell media droplet confinement only to wettable
region (Figure 3e).[22] Cell media drops adhered to the wettable
patterns could be easily transferred from Si-Tf chip to 6-well
plate by using micropipette for cell incubation and microscopy
studies. Interestingly, cell media drops remain in these pat-
terns even when the Si-Tf chip was rotated at 180 owing to
its adhesive force enabled attachment to the wettable pattern
(Figure S1, Supporting Information).
Cell targeting and cell isolation efficiency was studied by
seeding HCT 116 and HeLa cells using wettable pattern on Si-
Tf surface that was initially immersed in cell suspension for 30
s and later repeatedly washed with excess amount of cell
media. The droplets were then observed under fluorescence
microscope and total number of cells attached per pattern was
accounted. The surface area (SA) of each pattern was calcu-
lated to correlate the number of cells attached in each wettable
pattern (Table S1, Supporting Information). The number of
cells captured for Si-Tf was found to be 7 times higher than
Figure 3. Characterization of Si-Tf chip. a) SEM micrographs of CS particles deposited on PDMS layer by combustion of carnauba wax candle flame.
b) AFM micrograph indicating surface geometry of nonwettable region depicting arrangement of CS particles. c) Schematic representation of concentric
patterns of Tf-functionalized Si-Tf chip. d) Static contact angle of 5 L water drop on nonwettable region. e) SEM microscopy images of interface of functionalized wettable pattern and surrounding SH region.
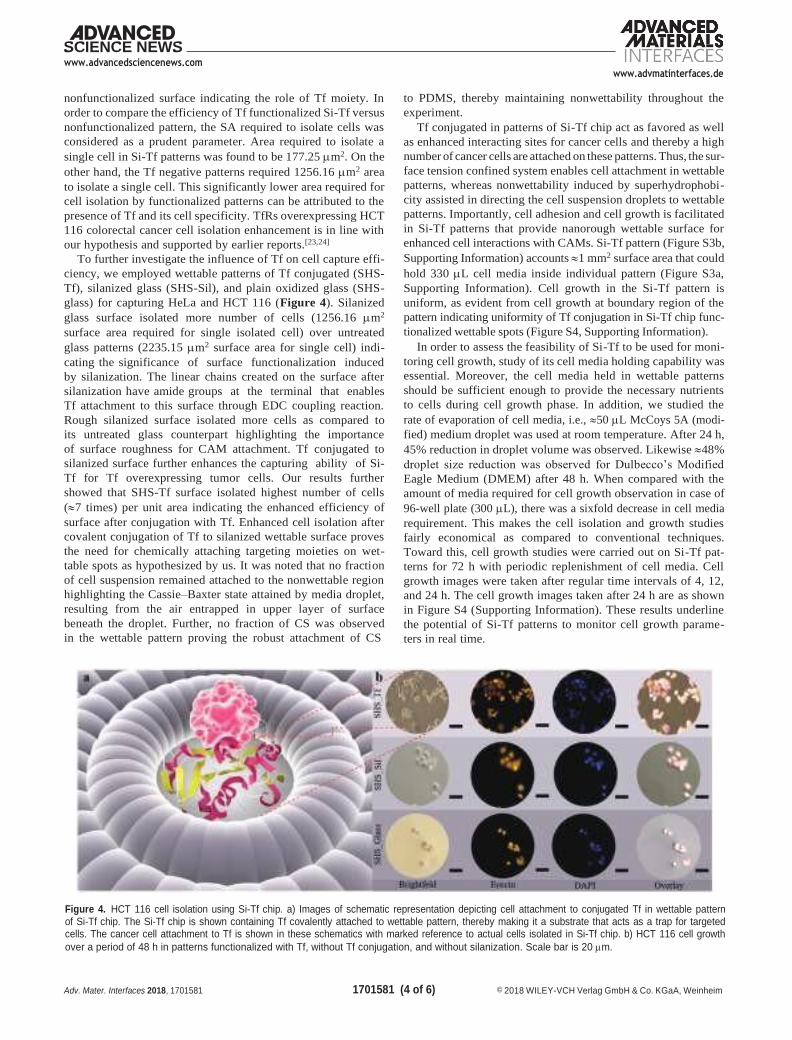
www.advancedsciencenews.com www.advmatinterfaces.de
1701581 (4 of 6) Adv. Mater. Interfaces 2018, 1701581 © 2018 WILEY-VCH Verlag GmbH & Co. KGaA, Weinheim
nonfunctionalized surface indicating the role of Tf moiety. In
order to compare the efficiency of Tf functionalized Si-Tf versus
nonfunctionalized pattern, the SA required to isolate cells was
considered as a prudent parameter. Area required to isolate a
single cell in Si-Tf patterns was found to be 177.25 m2. On the
other hand, the Tf negative patterns required 1256.16 m2 area
to isolate a single cell. This significantly lower area required for
cell isolation by functionalized patterns can be attributed to the
presence of Tf and its cell specificity. TfRs overexpressing HCT
116 colorectal cancer cell isolation enhancement is in line with
our hypothesis and supported by earlier reports.[23,24]
To further investigate the influence of Tf on cell capture effi-
ciency, we employed wettable patterns of Tf conjugated (SHS-
Tf), silanized glass (SHS-Sil), and plain oxidized glass (SHS-
glass) for capturing HeLa and HCT 116 (Figure 4). Silanized
glass surface isolated more number of cells (1256.16 m2
surface area required for single isolated cell) over untreated
glass patterns (2235.15 m2 surface area for single cell) indi-
cating the significance of surface functionalization induced
by silanization. The linear chains created on the surface after
silanization have amide groups at the terminal that enables
Tf attachment to this surface through EDC coupling reaction.
Rough silanized surface isolated more cells as compared to
its untreated glass counterpart highlighting the importance
of surface roughness for CAM attachment. Tf conjugated to
silanized surface further enhances the capturing ability of Si-
Tf for Tf overexpressing tumor cells. Our results further
showed that SHS-Tf surface isolated highest number of cells
(7 times) per unit area indicating the enhanced efficiency of
surface after conjugation with Tf. Enhanced cell isolation after
covalent conjugation of Tf to silanized wettable surface proves
the need for chemically attaching targeting moieties on wet-
table spots as hypothesized by us. It was noted that no fraction
of cell suspension remained attached to the nonwettable region
highlighting the Cassie–Baxter state attained by media droplet,
resulting from the air entrapped in upper layer of surface
beneath the droplet. Further, no fraction of CS was observed
in the wettable pattern proving the robust attachment of CS
to PDMS, thereby maintaining nonwettability throughout the
experiment.
Tf conjugated in patterns of Si-Tf chip act as favored as well
as enhanced interacting sites for cancer cells and thereby a high
number of cancer cells are attached on these patterns. Thus, the sur-
face tension confined system enables cell attachment in wettable
patterns, whereas nonwettability induced by superhydrophobi-
city assisted in directing the cell suspension droplets to wettable
patterns. Importantly, cell adhesion and cell growth is facilitated
in Si-Tf patterns that provide nanorough wettable surface for
enhanced cell interactions with CAMs. Si-Tf pattern (Figure S3b,
Supporting Information) accounts 1 mm2 surface area that could
hold 330 L cell media inside individual pattern (Figure S3a,
Supporting Information). Cell growth in the Si-Tf pattern is
uniform, as evident from cell growth at boundary region of the
pattern indicating uniformity of Tf conjugation in Si-Tf chip func-
tionalized wettable spots (Figure S4, Supporting Information).
In order to assess the feasibility of Si-Tf to be used for moni-
toring cell growth, study of its cell media holding capability was
essential. Moreover, the cell media held in wettable patterns
should be sufficient enough to provide the necessary nutrients
to cells during cell growth phase. In addition, we studied the
rate of evaporation of cell media, i.e., 50 L McCoys 5A (modi-
fied) medium droplet was used at room temperature. After 24 h,
45% reduction in droplet volume was observed. Likewise 48%
droplet size reduction was observed for Dulbecco’s Modified
Eagle Medium (DMEM) after 48 h. When compared with the
amount of media required for cell growth observation in case of
96-well plate (300 L), there was a sixfold decrease in cell media
requirement. This makes the cell isolation and growth studies
fairly economical as compared to conventional techniques.
Toward this, cell growth studies were carried out on Si-Tf pat-
terns for 72 h with periodic replenishment of cell media. Cell
growth images were taken after regular time intervals of 4, 12,
and 24 h. The cell growth images taken after 24 h are as shown
in Figure S4 (Supporting Information). These results underline
the potential of Si-Tf patterns to monitor cell growth parame-
ters in real time.
Figure 4. HCT 116 cell isolation using Si-Tf chip. a) Images of schematic representation depicting cell attachment to conjugated Tf in wettable pattern of Si-Tf chip. The Si-Tf chip is shown containing Tf covalently attached to wettable pattern, thereby making it a substrate that acts as a trap for targeted cells. The cancer cell attachment to Tf is shown in these schematics with marked reference to actual cells isolated in Si-Tf chip. b) HCT 116 cell growth
over a period of 48 h in patterns functionalized with Tf, without Tf conjugation, and without silanization. Scale bar is 20 m.
www.advancedsciencenews.com www.advmatinterfaces.de
1701581 (5 of 6) Adv. Mater. Interfaces 2018, 1701581 © 2018 WILEY-VCH Verlag GmbH & Co. KGaA, Weinheim
In another set of experiments, we evaluated the cell media
evaporation rate in Si-Tf patterns to be used as prospective
platform for cell aggregation studies (Figure S5, Supporting
Information). Cell suspension droplet adhered to Si-Tf pattern
has fixed contact line spanning across the diameter of wet-
table pattern. 10–50 L cell suspension droplets when placed
on the wettable patterns assume a convex shape with their
boundaries lying completely within the wettable region. But as
the volume of droplets is increased, although the contact line
remains fixed, the droplet starts spreading over to the nonwet-
table region. The nonwettable region has low surface energy,
which in combination with surface tension of water makes the
droplet assume semispherical shape (Figure S3, Supporting
Information). When cell suspension droplet is placed in wet-
table pattern, the cells start settling at the bottom under the
influence of gravitational pull. Meanwhile, the droplet starts
shrinking as the evaporation starts, bringing the cells settled
on the concave portion of the droplet toward the fixed contact
line. This ultimately resulted into aggregation of cells specifi-
cally limited to area of contact line. The shape of the sediment
changed with the number of cells present in the droplet. In
this study, we observed the shrinking pattern of the droplet
as well as the reduction in its area. 100 L cell suspension
droplet shrinks 70% in volume after 80 min. The contact line
of the droplet remains fixed during evaporation (Figure S5,
Supporting Information). In order to carry out cell growth of
the aggregated cells, it is necessary that cell media volume
is maintained which changes during evaporation. Si-Tf chip
facilitates compensation of loss of media through evapora-
tion by manually adding fresh cell media during cell growth
studies. These results indicate the feasibility of using Si-Tf as
a platform for cell aggregation studies for prolonged duration.
Cell media droplet can be held in inverted state as shown in
Figure S1a (Supporting Information). This makes the Si-Tf
chip, a prospective platform for studying 3D tumor spheroid
formation. Cell aggregate formation studied by us yielded
clustered cells in wettable patterns (Figure S1b, Supporting
Information), but further studies are needed to be carried out
using the Si-Tf chip in inverted state holding cells suspended
in anchored droplet.
In summary, we have prepared a novel Si-Tf cell targeting
and isolation chip where wettable patterns are formed by func-
tionalization of glass substrates to covalently attach a targeting
moiety, Tf. This covalent attachment binds the Tf in targeting
spots, allows selective capturing of Tf overexpressing cancer
cells when Si-Tf is exposed to cell suspension. We demon-
strated that Tf can be covalently conjugated to functionalized
wettable patterns through EDC coupling reaction carried out on
silanized glass pattern surrounded by CS NPs induced supe-
rhydrophobicity. CS-based SH layer surrounding the wettable
pattern facilitates surface tension induced confinement of cell
suspension drop. We effectively isolated 55 HCT 116 cells in
Si-Tf patterns spanning cumulative area of 9749 m2 spread
over four wettable spots. In comparison, number of cells iso-
lated in Si-Tf wettable patterns without Tf, was 9 in 4 spots
with cumulative area of 11305 m2. Ease of cell media transfer
to and from the wettable spot allows cell growth studies to be
conducted for 48 h. The cell suspension droplet evaporation
studies revealed that the droplet shrinking takes place along
the fixed contact line, thereby facilitating the cell aggregation
in wettable spot.
We conclude that transferrin functionalized silane–carbon
soot mediated superhydrophobic micropattern is a potential
platform for cell targeting which can be developed into a diag-
nostic tool to isolate cells of interest in confined space. Various
other biologically implicated targeting moieties can be conju-
gated to the functionalized glass substrates by altering the func-
tionality imparted to wettable spots, which provide confined
sites for cell growth parameter studies. In addition, results pre-
sented here also highlight that designing wettability controlled
patterns can prove to be a choice of surface patterning for con-
tainment and confinement of fluids and their motion, which
will act as guiding template for bio-functionalized materials.
Overall, this study present the feasibility of chemically attaching
targeting moieties with spatial conformities coupled with pros-
pect of selecting targeting moiety for specific cell isolation.
Experimental Section
Preparation of Functionalized Glass Substrates: Glass cover slips were procured from a local supplier and treated with Piranha solution (conc.
H2SO4 and H2O2 in 3:1 proportion) at 80 C for 2 h with constant stirring. Treated cover slips were washed thoroughly by double distilled
water and dried in oven at 40 C. The oxidized cover slips were further
functionalized with 3% (3-aminopropyl) trimethoxysilane in toluene. After overnight stirring, silanized glass substrates were washed with double distilled water and dried at room temperature.
Attaching Tf to Silanized Glass: EDC.HCl and Tf (30 g mL−1) were
mixed at pH 6.0 for 30 min. 500 L of Tf and EDC.HCl solution were
placed on the sites of pattern formation and incubated at room temperature for 3 h. The glass substrate was washed with DI water to remove any unattached Tf from the sites and subsequently dried at room temperature. These Tf functionalized wettable patterned cover slips were UV sterilized for 15 min and stored in sterile conditions to be used for cell capture studies.
PDMS-Glass Bead Mask Formation: Sylgard 184 elastomer base and curing agent were mixed in a proportion of 10:1. Silanized glass slips were covered with thin layer PDMS except for the sites of Tf conjugation. Tf conjugated sites were masked with glass beads surrounded by PDMS
layer. Uniformly spread PDMS layer is allowed to cure at 80 C for
30 min and cooled to room temperature.
Wettability Controlled Confined Pattern Formation on Silanized Glass: Masked silanized glass was deposited with nonwettable CS layer using
carnauba wax candle flame. CS started emitting from candle flame
during wax combustion in oxygen-deprived state resulting from glass slip
capping the flame tip. After CS deposition, the glass slip was exposed
to water current to remove excess and unbound CS. Glass beads were
removed leaving behind Tf spots surrounded by CS layer.
Evaluation of Contact Angle of Silanized Glass and Patterned Surface: Contact angle Goniometer was used to evaluate the static contact angle
of silanized glass as well as functionalized glass substrate. A 5 L water
drop was placed on the nonwettable region and the angle at the three- phase contact line was measured by the software interface. Captured images were further processed with image processing freeware ImageJ using Low Bond Axisymmetrical Drop Shape Analysis (LB-ADSA) plugin of ImageJ.
Cell Suspension Preparation: HCT 116 colorectal cancer cell line and HeLa cervical cancer cell line were used to evaluate Si-Tf chip. HCT 116 cell line was maintained in 90% McCoy’s 5A medium in addition to 9% fetal bovine serum and 1% antibiotic in cell culture flask. HeLa cell line was maintained in DMEM supplemented with 9% fetal bovine
serum and 1% antibiotic; incubated at 37 C and 5% CO2 concentration.
These cell lines were periodically inspected for contamination. Cells in
www.advancedsciencenews.com www.advmatinterfaces.de
1701581 (6 of 6) Adv. Mater. Interfaces 2018, 1701581 © 2018 WILEY-VCH Verlag GmbH & Co. KGaA, Weinheim
suspension were maintained in a suspended state by transferring to
multiwell plates prior to isolation process using Si-Tf.
Evaluation of Cell Targeting and Isolation: HCT 116 cell suspension with
cell concentration of 2 106 cells mL−1 and HeLa cell suspension with
4 105 cells mL−1 were maintained separately in a 35 mL disposable petri dish in a biosafety cabinet as shown using schematics in Si-Tf chips were dipped in both cell suspensions with wettable functionalized patterns facing the suspension (Figure 4a). Si-Tf chip was moved through the suspension for 30 s and taken out using tweezers. PBS was used to remove the unattached cells. Adhered cell suspension droplets were
stained with 1 L nuclear staining dye 4,6-diamidino-2-phenylindole
(DAPI) (0.5 mg mL−1) and 1 L cytoplasm staining dye Eosin (5 mg mL−1)
and incubated for 30 min. After washing with PBS, the number of attached cells in each pattern was observed under fluorescence microscope (Carl Zeiss Axio Observer A1) as shown in Figure 4b.
Comparison of Cell Adhesion on Silanized Glass versus Tf Functionalized
Glass: HCT 116 and HeLa cells adhered on Si-Tf chip patterns were
observed under fluorescence microscope. Number of cells adhered
in patterns with conjugated Tf and non-Tf conjugated patterns were
compared. Area of each pattern was measured using Zeiss Core (blue
edition) software to calculate the number of cells adhered per pattern
on Si-Tf chip and control surface. Efficiency of Si-Tf chip patterns was
calculated by measuring the area of each pattern and comparing the
number of cells per pattern.
Observation of Cell Growth in Wettable, Functionalized Patterns: Si-Tf chip and control surface with adhered cell suspension drops were
transferred to a 6-well plate. 50 L McCoys 5A medium was added to
HCT 116 cell suspension drops and 50 L Dulbecco’s Modified Eagle’s
medium was added to HeLa cell suspension drops. The 6-well plate containing the patterns was transferred to a bioincubator maintained at
37 C and 5% CO2 concentration. Cell growth was observed at every 3 h
interval. Attachment of Cells on Nonwettable Region: In a control experiment,
cell attachment to nonwettable CS layer was observed by placing 10 L
of HCT 116 cell suspension with 2 106 cells mL−1 concentration on
CS layer for 2 h. 1 L nuclear staining dye DAPI (0.5 mg mL−1) and
1 L cytoplasm staining dye Eosin (5 mg mL−1) were added to the drop and incubated for 30 min and subsequently washed with phosphate buffer. Cell suspension drop was removed from the surface to observe the number of cells attached to CS layer. CS pattern was observed under fluorescence microscope for detection of attached cells.
SEM Characterization of Nonwettable and Boundary Regions on Si-Tf Chip: The morphology of CS particles forming the nonwettable part
of the chip was characterized by SEM (FEI, Quanta 200-USA). The
functionalized patterned wells and CS particles present at the interface
were also observed. The morphology of the CS particles attached to
PDMS that form the nanoaggregates to accommodate the air pockets
imparting nonwettability was observed.
AFM Characterization of CS Layer: Patterned Tf nonwettable surfaces
were characterized using the Park XE 150 Atomic Force Microscope
attached to a Labram high-resolution spectrometer. CS NPs attached
to the PDMS layer on the silanized glass were evaluated for their
attachment to assess the formation of air pockets which imparts superhydrophobicity through their arrangement.
Supporting Information
Supporting Information is available from the Wiley Online Library or
from the author.
Acknowledgements
The authors acknowledge the financial support of the Department
of Science and Technology, Government of India for the Fund for
Improvement of Science and Technology infrastructure (FIST-DST)
and the Department of Biotechnology (DBT) grant. The authors
also appreciate Freie Universitat, Berlin, Alumni research grant and
Prof. Marcelo Calderón Group’s support for SEM and AFM studies.
Conflict of Interest
The authors declare no conflict of interest.
Keywords
cell isolation, conjugation, superhydrophobic, transferrin, wettability
Received: December 3, 2017
Published online:
[1] L. Wen, Y. Tian, L. Jiang, Angew. Chem., Int. Ed. 2015, 54, 3387.
[2] I. You, N. Yun, H. Lee, ChemPhysChem 2013, 14, 471.
[3] J. Ziauddin, D. M. Sabatini, Nature 2001, 411, 107.
[4] H. Erfle, B. Neumann, U. Liebel, P. Rogers, M. Held, T. Walter,
J. Ellenberg, R. Pepperkok, Nat. Protoc. 2007, 2, 392.
[5] E. Palmer, Cell-Based Microarrays: Methods and Protocols, (Eds: E. Palmer)
Humana Press, Springer Science, LLC New York, US, 2011, p. 1.
[6] J. H. Butler, M. Cronin, K. M. Anderson, G. M. Biddison,
F. Chatelain, M. Cummer, D. J. Davi, L. Fisher, A. W. Frauendorf,
F. W. Frueh, J. Am. Chem. Soc. 2001, 123, 8887.
[7] F. L. Geyer, E. Ueda, U. Liebel, N. Grau, P. A. Levkin, Angew. Chem.,
Int. Ed. 2011, 50, 8424.
[8] L. Zhang, J. Wu, M. N. Hedhili, X. Yang, P. Wang, J. Mater. Chem. A
2015, 3, 2844.
[9] Y. Liu, K. Ai, L. Lu, Chem. Rev. 2014, 114, 5057.
[10] S. Banerjee, K. Todkar, G. Chate, J. Khandare, in Targeted Drug
Delivery: Concepts and Design (Eds: P. V. Devarajan, S. Jain), Springer
Cham, Switzerland 2015, p. 367.
[11] S. S. Banerjee, A. Jalota-Badhwar, S. D. Satavalekar, S. G. Bhansali,
N. D. Aher, R. R. Mascarenhas, D. Paul, S. Sharma, J. J. Khandare,
Adv. Healthcare Mater. 2013, 2, 800.
[12] S. S. Banerjee, G. V. Khutale, V. Khobragade, N. R. Kale, M. Pore,
G. P. Chate, A. Jalota-Badhwar, M. Dongare, J. J. Khandare, Adv.
Mater. Int. 2017, 4, 1600934.
[13] S. S. Banerjee, D. Paul, S. G. Bhansali, N. D. Aher, A. Jalota-
Badhwar, J. Khandare, Small 2012, 8, 1657.
[14] M. Asadian-Birjand, C. Biglione, J. Bergueiro, A. Cappelletti,
C. Rahane, G. Chate, J. Khandare, B. Klemke, M. C. Strumia,
M. Calderón, Macromol. Rapid Commun. 2016, 37, 439.
[15] W. Faulk, C. Taylor, C. Yeh, J. McIntyre, Mol. Biother. 1990, 2, 57.
[16] J. F. Head, F. Wang, R. L. Elliott, Adv. Enzyme Regul. 1997, 37, 147.
[17] N. G. Rainov, A. Söling, Curr. Opin. Mol. Ther. 2005, 7, 483.
[18] N. C. Bellocq, S. H. Pun, G. S. Jensen, M. E. Davis, Bioconjugate
Chem. 2003, 14, 1122.
[19] S. H. Pun, F. Tack, N. C. Bellocq, J. Cheng, B. H. Grubbs,
G. S. Jensen, M. E. Davis, M. Brewster, M. Janicot, B. Janssens,
Cancer Biol. Ther. 2004, 3, 641.
[20] S. Noel, B. Liberelle, L. Robitaille, G. De Crescenzo, Bioconjugate
Chem. 2011, 22, 1690.
[21] L. Shapiro, A. M. Fannon, P. D. Kwong, A. Thompson, Nature 1995,
374, 327.
[22] W. M. Sigmund, S.-H. Hsu, in Encyclopedia of Membranes (Eds:
E. Drioli, L. Giorno), Springer-Verlag, Berlin Heidelberg 2016, p. 310.
[23] J. Wu, Y. Lu, A. Lee, X. Pan, X. Yang, X. Zhao, R. J. Lee, J. Pharm.
Pharm. Sci. 2007, 10, 350.
[24] C. H. J. Choi, C. A. Alabi, P. Webster, M. E. Davis, Proc. Natl. Acad.
Sci. USA 2010, 107, 1235.
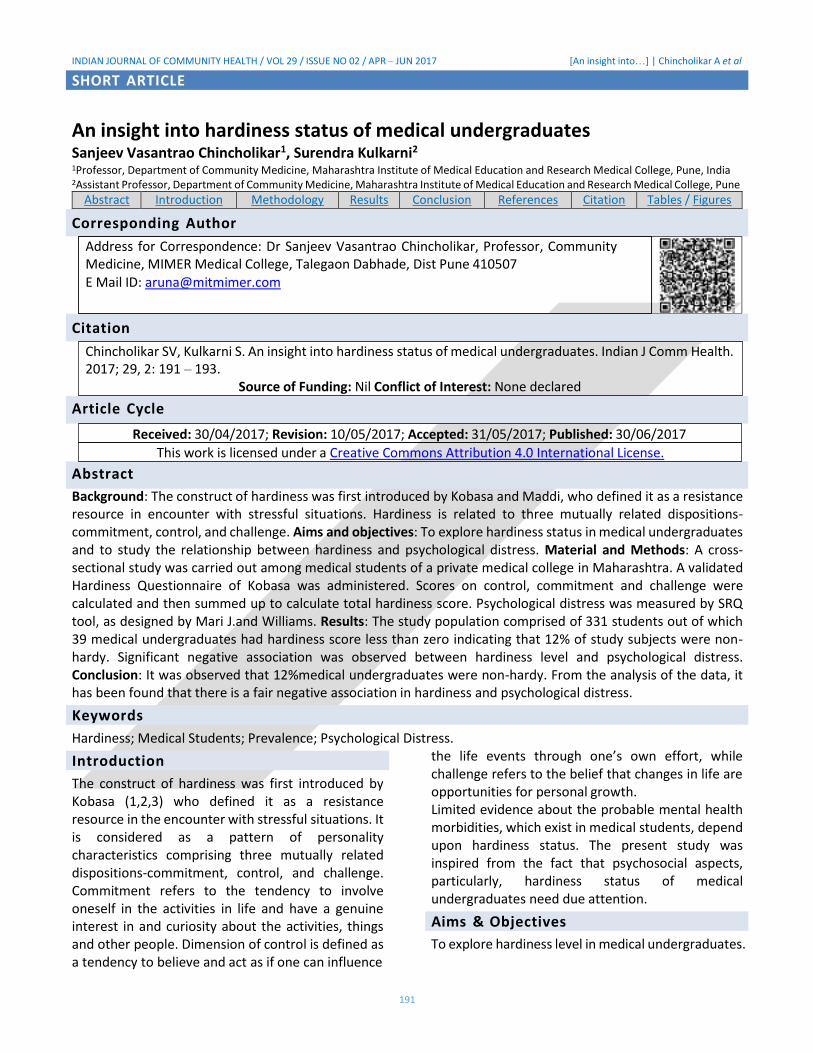
INDIAN JOURNAL OF COMMUNITY HEALTH / VOL 29 / ISSUE NO 02 / APR – JUN 2017 [An insight into…] | Chincholikar A et al
191
Address for Correspondence: Dr Sanjeev Vasantrao Chincholikar, Professor, Community Medicine, MIMER Medical College, Talegaon Dabhade, Dist Pune 410507 E Mail ID: [email protected]
Chincholikar SV, Kulkarni S. An insight into hardiness status of medical undergraduates. Indian J Comm Health. 2017; 29, 2: 191 – 193.
Source of Funding: Nil Conflict of Interest: None declared
This work is licensed under a Creative Commons Attribution 4.0 International License.
Received: 30/04/2017; Revision: 10/05/2017; Accepted: 31/05/2017; Published: 30/06/2017
SHORT ARTICLE
An insight into hardiness status of medical undergraduates Sanjeev Vasantrao Chincholikar1, Surendra Kulkarni2 1Professor, Department of Community Medicine, Maharashtra Institute of Medical Education and Research Medical College, Pune, India 2Assistant Professor, Department of Community Medicine, Maharashtra Institute of Medical Education and Research Medical College, Pune
Abstract Introduction Methodology Results Conclusion References Citation Tables / Figures
Background: The construct of hardiness was first introduced by Kobasa and Maddi, who defined it as a resistance resource in encounter with stressful situations. Hardiness is related to three mutually related dispositions- commitment, control, and challenge. Aims and objectives: To explore hardiness status in medical undergraduates and to study the relationship between hardiness and psychological distress. Material and Methods: A cross- sectional study was carried out among medical students of a private medical college in Maharashtra. A validated Hardiness Questionnaire of Kobasa was administered. Scores on control, commitment and challenge were calculated and then summed up to calculate total hardiness score. Psychological distress was measured by SRQ tool, as designed by Mari J.and Williams. Results: The study population comprised of 331 students out of which 39 medical undergraduates had hardiness score less than zero indicating that 12% of study subjects were non- hardy. Significant negative association was observed between hardiness level and psychological distress. Conclusion: It was observed that 12%medical undergraduates were non-hardy. From the analysis of the data, it has been found that there is a fair negative association in hardiness and psychological distress.
Keywords
Hardiness; Medical Students; Prevalence; Psychological Distress.
Introduction
The construct of hardiness was first introduced by Kobasa (1,2,3) who defined it as a resistance resource in the encounter with stressful situations. It is considered as a pattern of personality characteristics comprising three mutually related dispositions-commitment, control, and challenge. Commitment refers to the tendency to involve oneself in the activities in life and have a genuine interest in and curiosity about the activities, things and other people. Dimension of control is defined as a tendency to believe and act as if one can influence
the life events through one’s own effort, while challenge refers to the belief that changes in life are opportunities for personal growth. Limited evidence about the probable mental health morbidities, which exist in medical students, depend upon hardiness status. The present study was inspired from the fact that psychosocial aspects, particularly, hardiness status of medical undergraduates need due attention.
Aims & Objectives
To explore hardiness level in medical undergraduates.
Abstract
Article Cycle
Citation
Corresponding Author
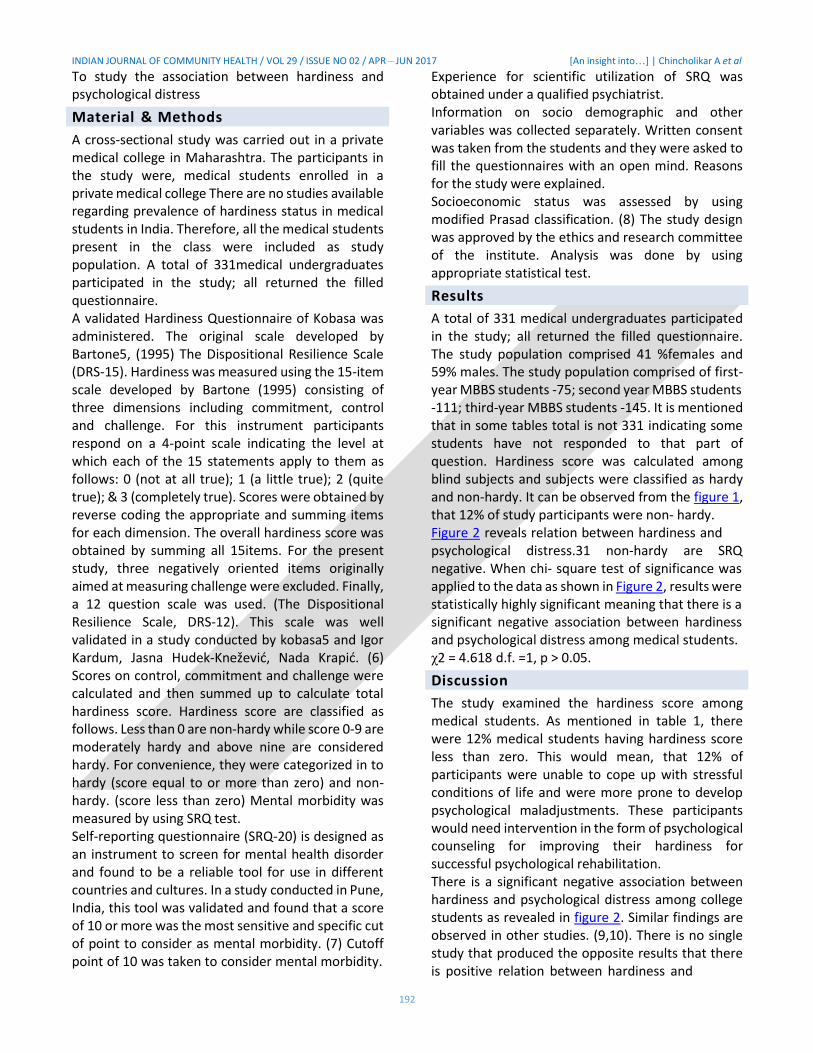
INDIAN JOURNAL OF COMMUNITY HEALTH / VOL 29 / ISSUE NO 02 / APR – JUN 2017 [An insight into…] | Chincholikar A et al
To study the association between hardiness and psychological distress
Material & Methods
A cross-sectional study was carried out in a private medical college in Maharashtra. The participants in the study were, medical students enrolled in a private medical college There are no studies available regarding prevalence of hardiness status in medical students in India. Therefore, all the medical students present in the class were included as study population. A total of 331medical undergraduates participated in the study; all returned the filled questionnaire. A validated Hardiness Questionnaire of Kobasa was administered. The original scale developed by Bartone5, (1995) The Dispositional Resilience Scale (DRS-15). Hardiness was measured using the 15-item scale developed by Bartone (1995) consisting of three dimensions including commitment, control and challenge. For this instrument participants respond on a 4-point scale indicating the level at which each of the 15 statements apply to them as follows: 0 (not at all true); 1 (a little true); 2 (quite true); & 3 (completely true). Scores were obtained by reverse coding the appropriate and summing items for each dimension. The overall hardiness score was obtained by summing all 15items. For the present study, three negatively oriented items originally aimed at measuring challenge were excluded. Finally, a 12 question scale was used. (The Dispositional Resilience Scale, DRS-12). This scale was well validated in a study conducted by kobasa5 and Igor Kardum, Jasna Hudek-Knežević, Nada Krapić. (6) Scores on control, commitment and challenge were calculated and then summed up to calculate total hardiness score. Hardiness score are classified as follows. Less than 0 are non-hardy while score 0-9 are moderately hardy and above nine are considered hardy. For convenience, they were categorized in to hardy (score equal to or more than zero) and non- hardy. (score less than zero) Mental morbidity was measured by using SRQ test. Self-reporting questionnaire (SRQ-20) is designed as an instrument to screen for mental health disorder and found to be a reliable tool for use in different countries and cultures. In a study conducted in Pune, India, this tool was validated and found that a score of 10 or more was the most sensitive and specific cut of point to consider as mental morbidity. (7) Cutoff point of 10 was taken to consider mental morbidity.
Experience for scientific utilization of SRQ was obtained under a qualified psychiatrist. Information on socio demographic and other variables was collected separately. Written consent was taken from the students and they were asked to fill the questionnaires with an open mind. Reasons for the study were explained. Socioeconomic status was assessed by using modified Prasad classification. (8) The study design was approved by the ethics and research committee of the institute. Analysis was done by using appropriate statistical test.
Results
A total of 331 medical undergraduates participated in the study; all returned the filled questionnaire. The study population comprised 41 %females and 59% males. The study population comprised of first- year MBBS students -75; second year MBBS students -111; third-year MBBS students -145. It is mentioned that in some tables total is not 331 indicating some students have not responded to that part of question. Hardiness score was calculated among blind subjects and subjects were classified as hardy and non-hardy. It can be observed from the figure 1, that 12% of study participants were non- hardy. Figure 2 reveals relation between hardiness and psychological distress.31 non-hardy are SRQ negative. When chi- square test of significance was applied to the data as shown in Figure 2, results were statistically highly significant meaning that there is a significant negative association between hardiness and psychological distress among medical students. χ2 = 4.618 d.f. =1, p > 0.05.
Discussion
The study examined the hardiness score among medical students. As mentioned in table 1, there were 12% medical students having hardiness score less than zero. This would mean, that 12% of participants were unable to cope up with stressful conditions of life and were more prone to develop psychological maladjustments. These participants would need intervention in the form of psychological counseling for improving their hardiness for successful psychological rehabilitation. There is a significant negative association between hardiness and psychological distress among college students as revealed in figure 2. Similar findings are observed in other studies. (9,10). There is no single study that produced the opposite results that there is positive relation between hardiness and
192
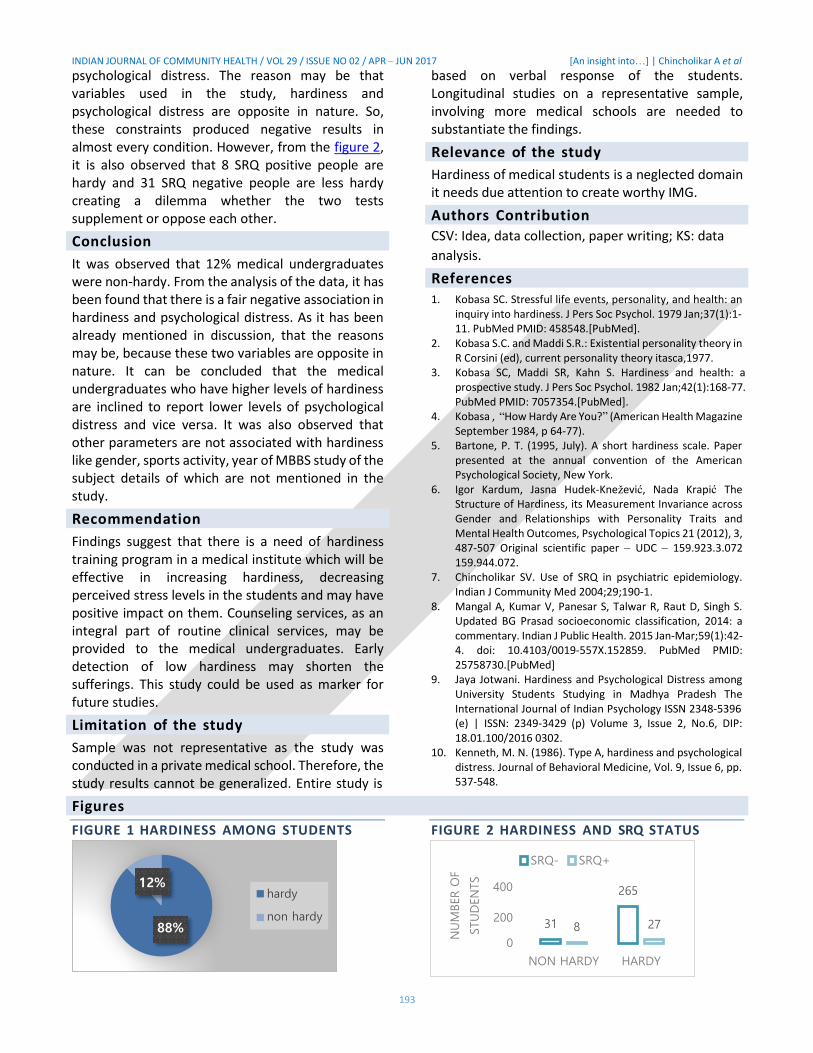
INDIAN JOURNAL OF COMMUNITY HEALTH / VOL 29 / ISSUE NO 02 / APR – JUN 2017 [An insight into…] | Chincholikar A et al
193
psychological distress. The reason may be that variables used in the study, hardiness and psychological distress are opposite in nature. So, these constraints produced negative results in almost every condition. However, from the figure 2, it is also observed that 8 SRQ positive people are hardy and 31 SRQ negative people are less hardy creating a dilemma whether the two tests supplement or oppose each other.
Conclusion
It was observed that 12% medical undergraduates were non-hardy. From the analysis of the data, it has been found that there is a fair negative association in hardiness and psychological distress. As it has been already mentioned in discussion, that the reasons may be, because these two variables are opposite in nature. It can be concluded that the medical undergraduates who have higher levels of hardiness are inclined to report lower levels of psychological distress and vice versa. It was also observed that other parameters are not associated with hardiness like gender, sports activity, year of MBBS study of the subject details of which are not mentioned in the study.
Recommendation
Findings suggest that there is a need of hardiness training program in a medical institute which will be effective in increasing hardiness, decreasing perceived stress levels in the students and may have positive impact on them. Counseling services, as an integral part of routine clinical services, may be provided to the medical undergraduates. Early detection of low hardiness may shorten the sufferings. This study could be used as marker for future studies.
Limitation of the study
Sample was not representative as the study was conducted in a private medical school. Therefore, the study results cannot be generalized. Entire study is
based on verbal response of the students. Longitudinal studies on a representative sample, involving more medical schools are needed to substantiate the findings.
Relevance of the study
Hardiness of medical students is a neglected domain it needs due attention to create worthy IMG.
Authors Contribution
CSV: Idea, data collection, paper writing; KS: data
analysis.
References 1. Kobasa SC. Stressful life events, personality, and health: an
inquiry into hardiness. J Pers Soc Psychol. 1979 Jan;37(1):1- 11. PubMed PMID: 458548.[PubMed].
2. Kobasa S.C. and Maddi S.R.: Existential personality theory in R Corsini (ed), current personality theory itasca,1977.
3. Kobasa SC, Maddi SR, Kahn S. Hardiness and health: a prospective study. J Pers Soc Psychol. 1982 Jan;42(1):168-77. PubMed PMID: 7057354.[PubMed].
4. Kobasa , “How Hardy Are You?” (American Health Magazine September 1984, p 64-77).
5. Bartone, P. T. (1995, July). A short hardiness scale. Paper presented at the annual convention of the American Psychological Society, New York.
6. Igor Kardum, Jasna Hudek-Knežević, Nada Krapić The Structure of Hardiness, its Measurement Invariance across Gender and Relationships with Personality Traits and Mental Health Outcomes, Psychological Topics 21 (2012), 3, 487-507 Original scientific paper – UDC – 159.923.3.072 159.944.072.
7. Chincholikar SV. Use of SRQ in psychiatric epidemiology. Indian J Community Med 2004;29;190-1.
8. Mangal A, Kumar V, Panesar S, Talwar R, Raut D, Singh S. Updated BG Prasad socioeconomic classification, 2014: a commentary. Indian J Public Health. 2015 Jan-Mar;59(1):42- 4. doi: 10.4103/0019-557X.152859. PubMed PMID: 25758730.[PubMed]
9. Jaya Jotwani. Hardiness and Psychological Distress among University Students Studying in Madhya Pradesh The International Journal of Indian Psychology ISSN 2348-5396 (e) | ISSN: 2349-3429 (p) Volume 3, Issue 2, No.6, DIP: 18.01.100/2016 0302.
10. Kenneth, M. N. (1986). Type A, hardiness and psychological distress. Journal of Behavioral Medicine, Vol. 9, Issue 6, pp. 537-548.
Figures
FIGURE 1 HARDINESS AMONG STUDENTS FIGURE 2 HARDINESS AND SRQ STATUS
12%
88%
hardy
non hardy
SRQ- SRQ+
400 265
200
0
31 8 27
NON HARDY HARDY
NU
MBER O
F
STU
DEN
TS

(194 of 9) 1600934
Adv. Mater. Interfaces 2017, 1600934 © 2017 WILEY-VCH Verlag GmbH & Co. KGaA, Weinheim wileyonlinelibrary.com
www.advancedsciencenews.com
www.advmatinterfaces.de
Biofunctionalized Capillary Flow Channel Platform Integrated with 3D Nanostructured Matrix to Capture Circulating Tumor Cells
Shashwat S. Banerjee,* Ganesh V. Khutale, Vrushali Khobragade, Narendra R. Kale,
Milind Pore, Govind P. Chate, Archana Jalota-Badhwar, Manoj Dongare,
and Jayant J. Khandare*
Dr. S. S. Banerjee,[+] G. V. Khutale,[++] V. Khobragade, M. Pore, Dr. A. Jalota-Badhwar Actorius Innovations and Research (AIR) 100 NCL Innovation Park, Pune 411 008, India E-mail: [email protected]
N. R. Kale, G. P. Chate, Prof. J. J. Khandare Maharashtra Institute of Pharmacy MIT Campus Paud Road, Pune 411 038, India E-mail: [email protected]
M. Dongare Manik Hospital and Research Center Aurangabad 431001, India
[+]Present address: Maharashtra Institute of Medical Education and Re-
search Medical College, Talegaon Dabhade, Pune 410 507, India [++]Present address: Nanolab Focas Research Institute, Dublin Institute of Technology, Dublin, 8, Ireland
DOI: 10.1002/admi.201600934
1. Introduction
Circulating tumor cells (CTCs) dis-
seminate from the primary tumor and
migrate in peripheral blood of cancer
patients.[1–4] CTCs play an important role
in metastases and are primarily respon-
sible for the growth of secondary tumors
and spread of cancer in distant part of
the body.[5–7] Besides conventional diag-
nostic approaches (e.g., tumor biopsy,
anatomical/molecular imaging, and
serum marker detection), detecting CTCs
in peripheral blood is of prognostic value
to predict disease progression, response
to treatment, relapse, and overall sur-
vival.[8–10] However, the detection and
characterization of CTCs have been tech-
nically challenging due to their extremely
low occurrence (10–100 mL−1) among a
high number (109 cells mL−1) of hemato-
logic cells in blood.[7,8] In recent years, a
diversity of diagnostic methods have been
developed for CTC detection and enrich-
ment that principally include immuno-
magnetic separation,[2,11] microfluidic
platforms,[8,12,13] and microfilter devices.[14] Microfluidic approaches require precise control over opera-
tional parameters and often involve complex designs besides
being slow due to lower fluid transfer rates, thus limiting them
in time efficiency and high throughput analysis. On the other
hand, immunomagnetic methods for separation of CTCs are
simple to use but suffer relatively low separation efficiency
and require pretreatment of blood to remove hematogenic
cells.[15] Food and Drug Administration-approved CellSearch
Technology uses markers with immunomagnetic beads to iso-
late CTCs. To enhance CTC capturing efficiency and to reduce
cost, researchers have been exploring new platforms including
microrockets.[2,5,8,16,17]
Here, we report the use of glass capillary-flow channel func-
tionalized with 3D antibody matrix impinged with magnetic
nanoparticles for simultaneous isolation and detection of CTCs
from clinical samples. Nanostructure materials such as nanopil-
lars, graphene sheets, and nanoparticles enhance biomolecule
Circulating tumor cells (CTCs) from peripheral blood account genetic informa-
tion for cancer diagnosis and overall disease monitoring. Analysis of “liquid
biopsy” holds immense promise as it may lead to new approaches for cancer
treatment. The study reports effective and continuous flow microchannel
system for isolating CTCs using transferrin conjugated 3D matrix synthe-
sized by crosslinking polyethylene glycol-Fe3O4 nanostructures for rapid and
efficient capturing of CTCs. The platform provides option of using multiple
microchannel units in series that can influence higher cell-capture efficiency
due to increasing cell-substrate contact frequency. CTCs are captured with
high efficiency even at low concentration of target cells (~90% at 25 cells
per mL blood). Furthermore, the study demonstrates that the cell-capture
performance is influenced by topographic interactions between nanostructure
based matrix and cancer cells of interest. In addition, this study demonstrates
the “proof of concept” using 3D microchannel system having capacity of
simultaneously capturing and permanently eliminating CTCs from peripheral
blood samples. Further, the study evaluates clinical samples of colon and
breast cancer patients for rapid isolation of CTCs. Conclusively, the present
platform demonstrates inordinate capacity for cancer cell sorting, biological
studies of CTCs, and cancer metastasis, potentially benefiting the real time
liquid biopsy and early prognosis of cancer.
FU
LL P
AP
ER
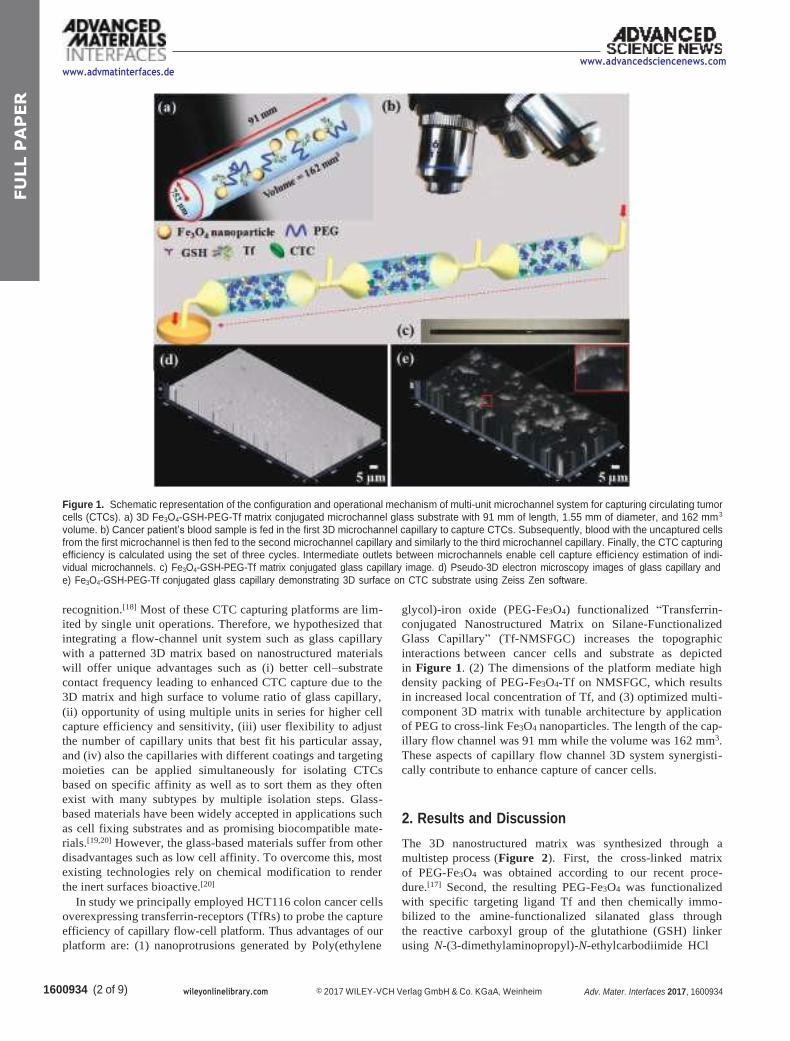
1600934 (2 of 9) wileyonlinelibrary.com © 2017 WILEY-VCH Verlag GmbH & Co. KGaA, Weinheim Adv. Mater. Interfaces 2017, 1600934
www.advmatinterfaces.de www.advancedsciencenews.com
Figure 1. Schematic representation of the configuration and operational mechanism of multi-unit microchannel system for capturing circulating tumor
cells (CTCs). a) 3D Fe3O4-GSH-PEG-Tf matrix conjugated microchannel glass substrate with 91 mm of length, 1.55 mm of diameter, and 162 mm3
volume. b) Cancer patient’s blood sample is fed in the first 3D microchannel capillary to capture CTCs. Subsequently, blood with the uncaptured cells
from the first microchannel is then fed to the second microchannel capillary and similarly to the third microchannel capillary. Finally, the CTC capturing efficiency is calculated using the set of three cycles. Intermediate outlets between microchannels enable cell capture efficiency estimation of indi-
vidual microchannels. c) Fe3O4-GSH-PEG-Tf matrix conjugated glass capillary image. d) Pseudo-3D electron microscopy images of glass capillary and
e) Fe3O4-GSH-PEG-Tf conjugated glass capillary demonstrating 3D surface on CTC substrate using Zeiss Zen software.
recognition.[18] Most of these CTC capturing platforms are lim-
ited by single unit operations. Therefore, we hypothesized that
integrating a flow-channel unit system such as glass capillary
with a patterned 3D matrix based on nanostructured materials
will offer unique advantages such as (i) better cell–substrate
contact frequency leading to enhanced CTC capture due to the
3D matrix and high surface to volume ratio of glass capillary,
(ii) opportunity of using multiple units in series for higher cell
capture efficiency and sensitivity, (iii) user flexibility to adjust
the number of capillary units that best fit his particular assay,
and (iv) also the capillaries with different coatings and targeting
moieties can be applied simultaneously for isolating CTCs
based on specific affinity as well as to sort them as they often
exist with many subtypes by multiple isolation steps. Glass-
based materials have been widely accepted in applications such
as cell fixing substrates and as promising biocompatible mate-
rials.[19,20] However, the glass-based materials suffer from other
disadvantages such as low cell affinity. To overcome this, most
existing technologies rely on chemical modification to render
the inert surfaces bioactive.[20]
In study we principally employed HCT116 colon cancer cells
overexpressing transferrin-receptors (TfRs) to probe the capture
efficiency of capillary flow-cell platform. Thus advantages of our
platform are: (1) nanoprotrusions generated by Poly(ethylene
glycol)-iron oxide (PEG-Fe3O4) functionalized “Transferrin-
conjugated Nanostructured Matrix on Silane-Functionalized
Glass Capillary” (Tf-NMSFGC) increases the topographic
interactions between cancer cells and substrate as depicted
in Figure 1. (2) The dimensions of the platform mediate high
density packing of PEG-Fe3O4-Tf on NMSFGC, which results
in increased local concentration of Tf, and (3) optimized multi-
component 3D matrix with tunable architecture by application
of PEG to cross-link Fe3O4 nanoparticles. The length of the cap-
illary flow channel was 91 mm while the volume was 162 mm3.
These aspects of capillary flow channel 3D system synergisti-
cally contribute to enhance capture of cancer cells.
2. Results and Discussion
The 3D nanostructured matrix was synthesized through a
multistep process (Figure 2). First, the cross-linked matrix
of PEG-Fe3O4 was obtained according to our recent proce-
dure.[17] Second, the resulting PEG-Fe3O4 was functionalized
with specific targeting ligand Tf and then chemically immo-
bilized to the amine-functionalized silanated glass through
the reactive carboxyl group of the glutathione (GSH) linker
using N-(3-dimethylaminopropyl)-N-ethylcarbodiimide HCl
FU
LL P
AP
ER
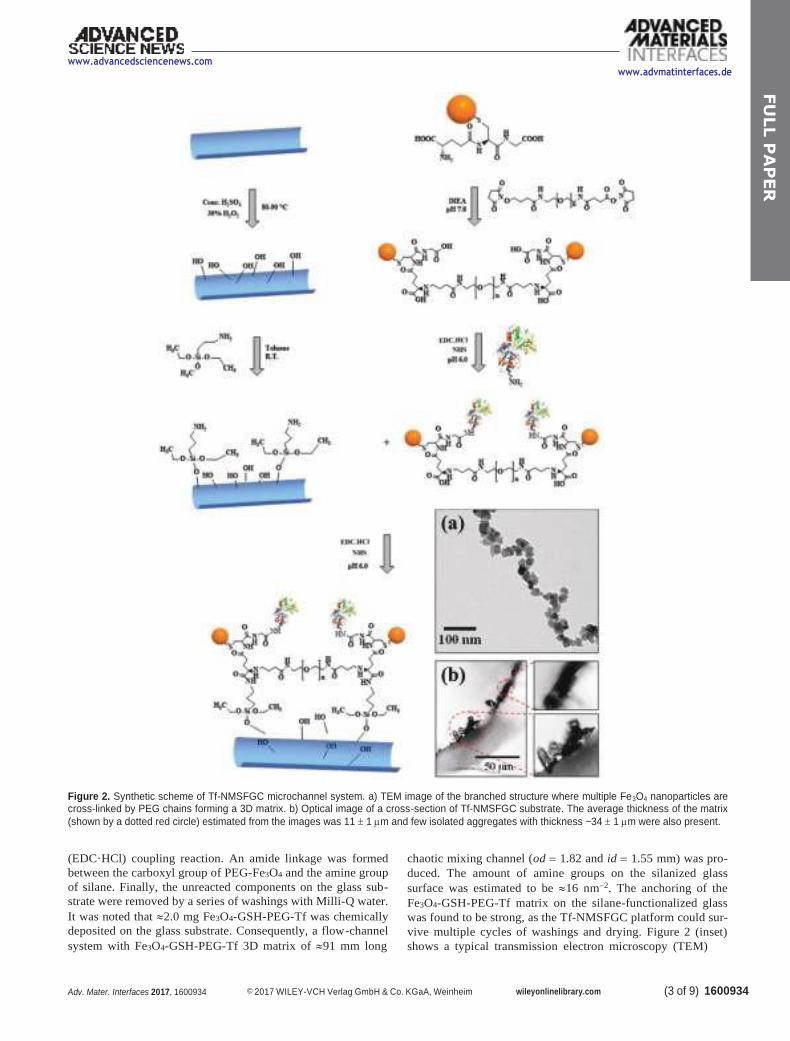
(3 of 9) 1600934 Adv. Mater. Interfaces 2017, 1600934 © 2017 WILEY-VCH Verlag GmbH & Co. KGaA, Weinheim wileyonlinelibrary.com
www.advancedsciencenews.com
www.advmatinterfaces.de
Figure 2. Synthetic scheme of Tf-NMSFGC microchannel system. a) TEM image of the branched structure where multiple Fe3O4 nanoparticles are cross-linked by PEG chains forming a 3D matrix. b) Optical image of a cross-section of Tf-NMSFGC substrate. The average thickness of the matrix
(shown by a dotted red circle) estimated from the images was 11 1 m and few isolated aggregates with thickness ~34 1 m were also present.
(EDC·HCl) coupling reaction. An amide linkage was formed
between the carboxyl group of PEG-Fe3O4 and the amine group
of silane. Finally, the unreacted components on the glass sub-
strate were removed by a series of washings with Milli-Q water.
It was noted that 2.0 mg Fe3O4-GSH-PEG-Tf was chemically
deposited on the glass substrate. Consequently, a flow-channel
system with Fe3O4-GSH-PEG-Tf 3D matrix of 91 mm long
chaotic mixing channel (od = 1.82 and id = 1.55 mm) was pro-
duced. The amount of amine groups on the silanized glass
surface was estimated to be 16 nm−2. The anchoring of the
Fe3O4-GSH-PEG-Tf matrix on the silane-functionalized glass
was found to be strong, as the Tf-NMSFGC platform could sur-
vive multiple cycles of washings and drying. Figure 2 (inset)
shows a typical transmission electron microscopy (TEM)
FU
LL P
AP
ER
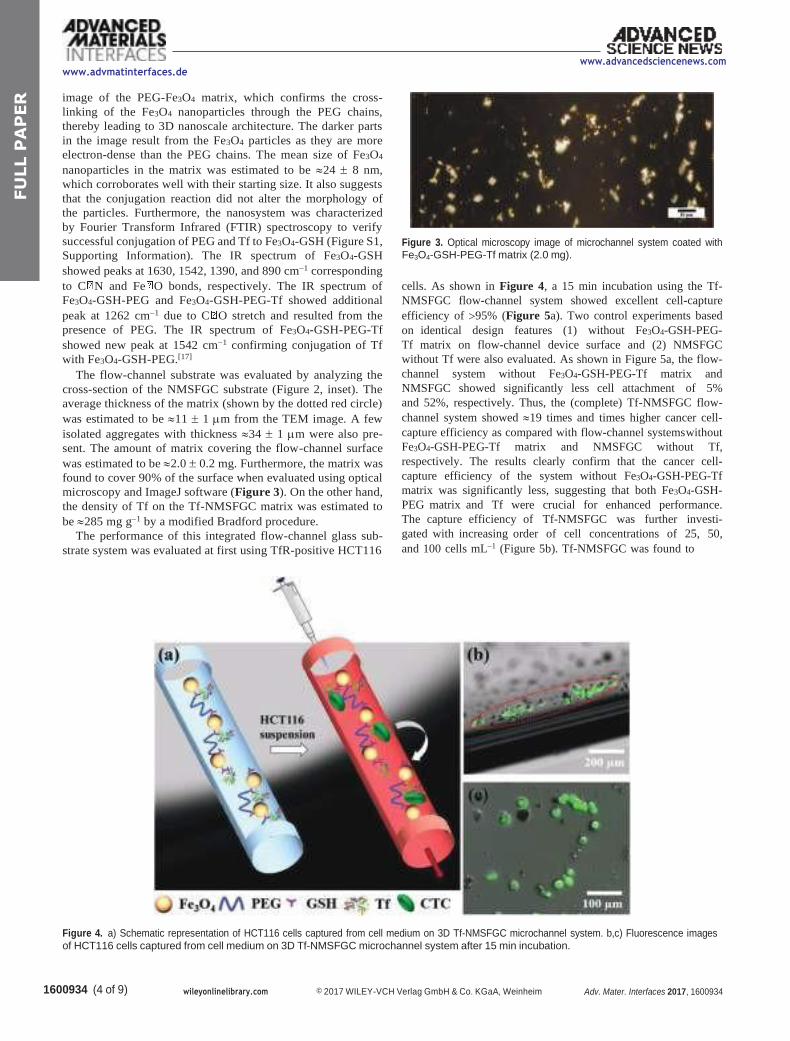
1600934 (4 of 9) wileyonlinelibrary.com © 2017 WILEY-VCH Verlag GmbH & Co. KGaA, Weinheim Adv. Mater. Interfaces 2017, 1600934
www.advmatinterfaces.de
image of the PEG-Fe3O4 matrix, which confirms the cross-
linking of the Fe3O4 nanoparticles through the PEG chains,
thereby leading to 3D nanoscale architecture. The darker parts
in the image result from the Fe3O4 particles as they are more
electron-dense than the PEG chains. The mean size of Fe3O4
nanoparticles in the matrix was estimated to be 24 8 nm,
which corroborates well with their starting size. It also suggests
that the conjugation reaction did not alter the morphology of
the particles. Furthermore, the nanosystem was characterized
by Fourier Transform Infrared (FTIR) spectroscopy to verify
successful conjugation of PEG and Tf to Fe3O4-GSH (Figure S1,
Supporting Information). The IR spectrum of Fe3O4-GSH
showed peaks at 1630, 1542, 1390, and 890 cm−1 corresponding
to C N and Fe O bonds, respectively. The IR spectrum of
Fe3O4-GSH-PEG and Fe3O4-GSH-PEG-Tf showed additional
peak at 1262 cm−1 due to C O stretch and resulted from the
presence of PEG. The IR spectrum of Fe3O4-GSH-PEG-Tf
showed new peak at 1542 cm−1 confirming conjugation of Tf
with Fe3O4-GSH-PEG.[17]
The flow-channel substrate was evaluated by analyzing the
cross-section of the NMSFGC substrate (Figure 2, inset). The
average thickness of the matrix (shown by the dotted red circle)
was estimated to be 11 1 m from the TEM image. A few
isolated aggregates with thickness 34 1 m were also pre-
sent. The amount of matrix covering the flow-channel surface
was estimated to be 2.0 0.2 mg. Furthermore, the matrix was
found to cover 90% of the surface when evaluated using optical
microscopy and ImageJ software (Figure 3). On the other hand,
the density of Tf on the Tf-NMSFGC matrix was estimated to
be 285 mg g−1 by a modified Bradford procedure.
The performance of this integrated flow-channel glass sub-
strate system was evaluated at first using TfR-positive HCT116
www.advancedsciencenews.com
Figure 3. Optical microscopy image of microchannel system coated with Fe3O4-GSH-PEG-Tf matrix (2.0 mg).
cells. As shown in Figure 4, a 15 min incubation using the Tf-
NMSFGC flow-channel system showed excellent cell-capture
efficiency of 95% (Figure 5a). Two control experiments based
on identical design features (1) without Fe3O4-GSH-PEG-
Tf matrix on flow-channel device surface and (2) NMSFGC
without Tf were also evaluated. As shown in Figure 5a, the flow-
channel system without Fe3O4-GSH-PEG-Tf matrix and
NMSFGC showed significantly less cell attachment of 5%
and 52%, respectively. Thus, the (complete) Tf-NMSFGC flow-
channel system showed 19 times and times higher cancer cell-
capture efficiency as compared with flow-channel systems without
Fe3O4-GSH-PEG-Tf matrix and NMSFGC without Tf,
respectively. The results clearly confirm that the cancer cell-
capture efficiency of the system without Fe3O4-GSH-PEG-Tf
matrix was significantly less, suggesting that both Fe3O4-GSH-
PEG matrix and Tf were crucial for enhanced performance.
The capture efficiency of Tf-NMSFGC was further investi-
gated with increasing order of cell concentrations of 25, 50,
and 100 cells mL−1 (Figure 5b). Tf-NMSFGC was found to
Figure 4. a) Schematic representation of HCT116 cells captured from cell medium on 3D Tf-NMSFGC microchannel system. b,c) Fluorescence images
of HCT116 cells captured from cell medium on 3D Tf-NMSFGC microchannel system after 15 min incubation.
FU
LL P
AP
ER
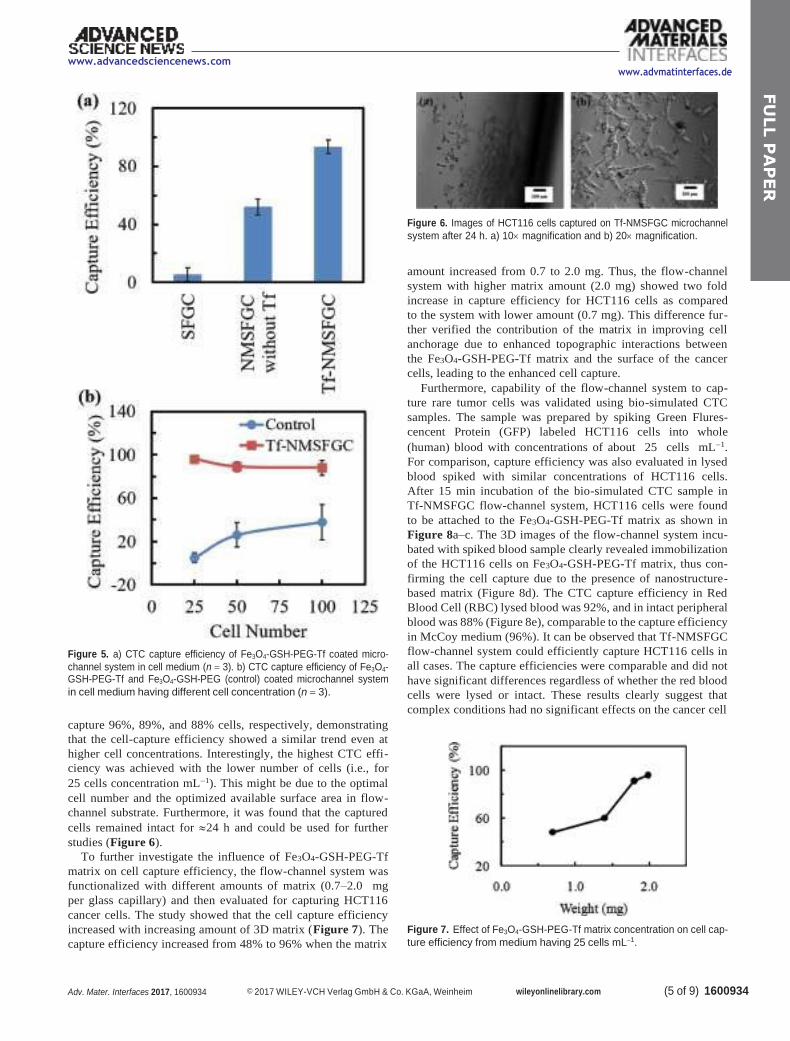
(5 of 9) 1600934 Adv. Mater. Interfaces 2017, 1600934 © 2017 WILEY-VCH Verlag GmbH & Co. KGaA, Weinheim wileyonlinelibrary.com
www.advancedsciencenews.com
Figure 5. a) CTC capture efficiency of Fe3O4-GSH-PEG-Tf coated micro-
channel system in cell medium (n = 3). b) CTC capture efficiency of Fe3O4- GSH-PEG-Tf and Fe3O4-GSH-PEG (control) coated microchannel system
in cell medium having different cell concentration (n = 3).
capture 96%, 89%, and 88% cells, respectively, demonstrating
that the cell-capture efficiency showed a similar trend even at
higher cell concentrations. Interestingly, the highest CTC effi-
ciency was achieved with the lower number of cells (i.e., for
25 cells concentration mL−1). This might be due to the optimal
cell number and the optimized available surface area in flow-
channel substrate. Furthermore, it was found that the captured
cells remained intact for 24 h and could be used for further
studies (Figure 6).
To further investigate the influence of Fe3O4-GSH-PEG-Tf
matrix on cell capture efficiency, the flow-channel system was
functionalized with different amounts of matrix (0.7–2.0 mg
per glass capillary) and then evaluated for capturing HCT116
cancer cells. The study showed that the cell capture efficiency
increased with increasing amount of 3D matrix (Figure 7). The
capture efficiency increased from 48% to 96% when the matrix
www.advmatinterfaces.de
Figure 6. Images of HCT116 cells captured on Tf-NMSFGC microchannel
system after 24 h. a) 10 magnification and b) 20 magnification.
amount increased from 0.7 to 2.0 mg. Thus, the flow-channel
system with higher matrix amount (2.0 mg) showed two fold
increase in capture efficiency for HCT116 cells as compared
to the system with lower amount (0.7 mg). This difference fur-
ther verified the contribution of the matrix in improving cell
anchorage due to enhanced topographic interactions between
the Fe3O4-GSH-PEG-Tf matrix and the surface of the cancer
cells, leading to the enhanced cell capture.
Furthermore, capability of the flow-channel system to cap-
ture rare tumor cells was validated using bio-simulated CTC
samples. The sample was prepared by spiking Green Flures-
cencent Protein (GFP) labeled HCT116 cells into whole
(human) blood with concentrations of about 25 cells mL−1.
For comparison, capture efficiency was also evaluated in lysed
blood spiked with similar concentrations of HCT116 cells.
After 15 min incubation of the bio-simulated CTC sample in
Tf-NMSFGC flow-channel system, HCT116 cells were found
to be attached to the Fe3O4-GSH-PEG-Tf matrix as shown in
Figure 8a–c. The 3D images of the flow-channel system incu-
bated with spiked blood sample clearly revealed immobilization
of the HCT116 cells on Fe3O4-GSH-PEG-Tf matrix, thus con-
firming the cell capture due to the presence of nanostructure-
based matrix (Figure 8d). The CTC capture efficiency in Red
Blood Cell (RBC) lysed blood was 92%, and in intact peripheral
blood was 88% (Figure 8e), comparable to the capture efficiency
in McCoy medium (96%). It can be observed that Tf-NMSFGC
flow-channel system could efficiently capture HCT116 cells in
all cases. The capture efficiencies were comparable and did not
have significant differences regardless of whether the red blood
cells were lysed or intact. These results clearly suggest that
complex conditions had no significant effects on the cancer cell
Figure 7. Effect of Fe3O4-GSH-PEG-Tf matrix concentration on cell cap-
ture efficiency from medium having 25 cells mL−1.
FU
LL P
AP
ER
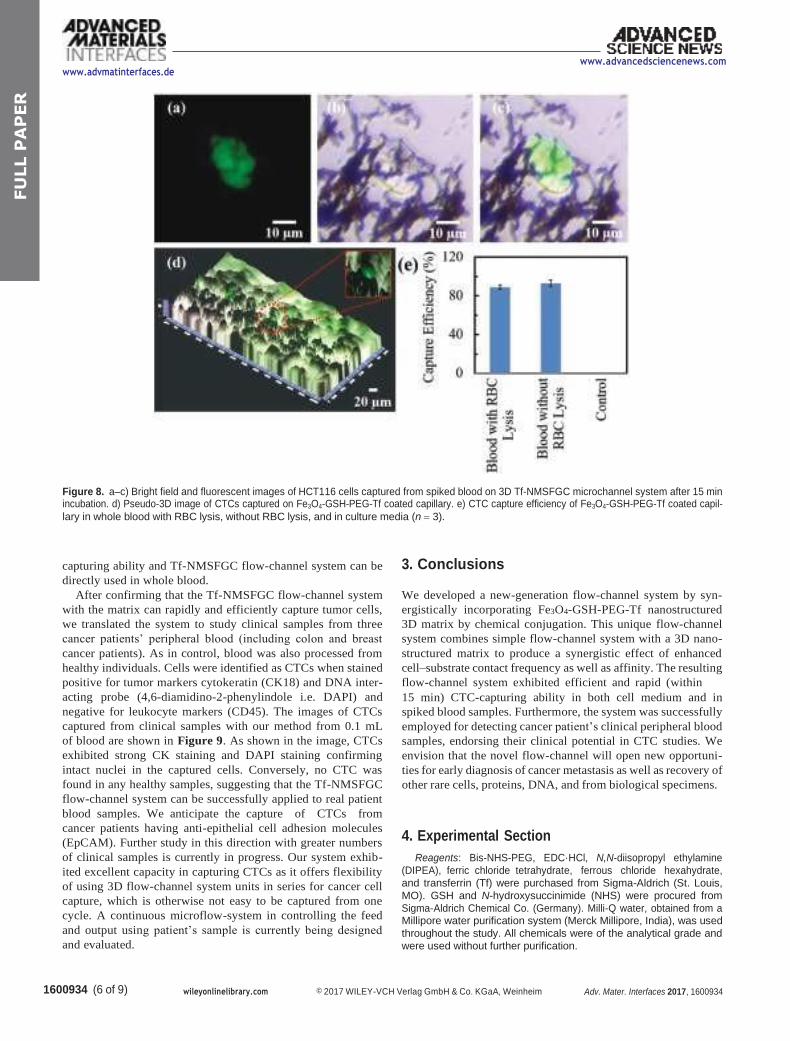
1600934 (6 of 9) wileyonlinelibrary.com © 2017 WILEY-VCH Verlag GmbH & Co. KGaA, Weinheim Adv. Mater. Interfaces 2017, 1600934
www.advmatinterfaces.de www.advancedsciencenews.com
Figure 8. a–c) Bright field and fluorescent images of HCT116 cells captured from spiked blood on 3D Tf-NMSFGC microchannel system after 15 min incubation. d) Pseudo-3D image of CTCs captured on Fe3O4-GSH-PEG-Tf coated capillary. e) CTC capture efficiency of Fe3O4-GSH-PEG-Tf coated capil-
lary in whole blood with RBC lysis, without RBC lysis, and in culture media (n = 3).
capturing ability and Tf-NMSFGC flow-channel system can be
directly used in whole blood.
After confirming that the Tf-NMSFGC flow-channel system
with the matrix can rapidly and efficiently capture tumor cells,
we translated the system to study clinical samples from three
cancer patients’ peripheral blood (including colon and breast
cancer patients). As in control, blood was also processed from
healthy individuals. Cells were identified as CTCs when stained
positive for tumor markers cytokeratin (CK18) and DNA inter-
acting probe (4,6-diamidino-2-phenylindole i.e. DAPI) and
negative for leukocyte markers (CD45). The images of CTCs
captured from clinical samples with our method from 0.1 mL
of blood are shown in Figure 9. As shown in the image, CTCs
exhibited strong CK staining and DAPI staining confirming
intact nuclei in the captured cells. Conversely, no CTC was
found in any healthy samples, suggesting that the Tf-NMSFGC
flow-channel system can be successfully applied to real patient
blood samples. We anticipate the capture of CTCs from
cancer patients having anti-epithelial cell adhesion molecules
(EpCAM). Further study in this direction with greater numbers
of clinical samples is currently in progress. Our system exhib-
ited excellent capacity in capturing CTCs as it offers flexibility
of using 3D flow-channel system units in series for cancer cell
capture, which is otherwise not easy to be captured from one
cycle. A continuous microflow-system in controlling the feed
and output using patient’s sample is currently being designed
and evaluated.
3. Conclusions
We developed a new-generation flow-channel system by syn-
ergistically incorporating Fe3O4-GSH-PEG-Tf nanostructured
3D matrix by chemical conjugation. This unique flow-channel
system combines simple flow-channel system with a 3D nano-
structured matrix to produce a synergistic effect of enhanced
cell–substrate contact frequency as well as affinity. The resulting
flow-channel system exhibited efficient and rapid (within
15 min) CTC-capturing ability in both cell medium and in
spiked blood samples. Furthermore, the system was successfully
employed for detecting cancer patient’s clinical peripheral blood
samples, endorsing their clinical potential in CTC studies. We
envision that the novel flow-channel will open new opportuni-
ties for early diagnosis of cancer metastasis as well as recovery of
other rare cells, proteins, DNA, and from biological specimens.
4. Experimental Section
Reagents: Bis-NHS-PEG, EDC·HCl, N,N-diisopropyl ethylamine
(DIPEA), ferric chloride tetrahydrate, ferrous chloride hexahydrate,
and transferrin (Tf) were purchased from Sigma-Aldrich (St. Louis,
MO). GSH and N-hydroxysuccinimide (NHS) were procured from
Sigma-Aldrich Chemical Co. (Germany). Milli-Q water, obtained from a Millipore water purification system (Merck Millipore, India), was used
throughout the study. All chemicals were of the analytical grade and
were used without further purification.
FU
LL P
AP
ER
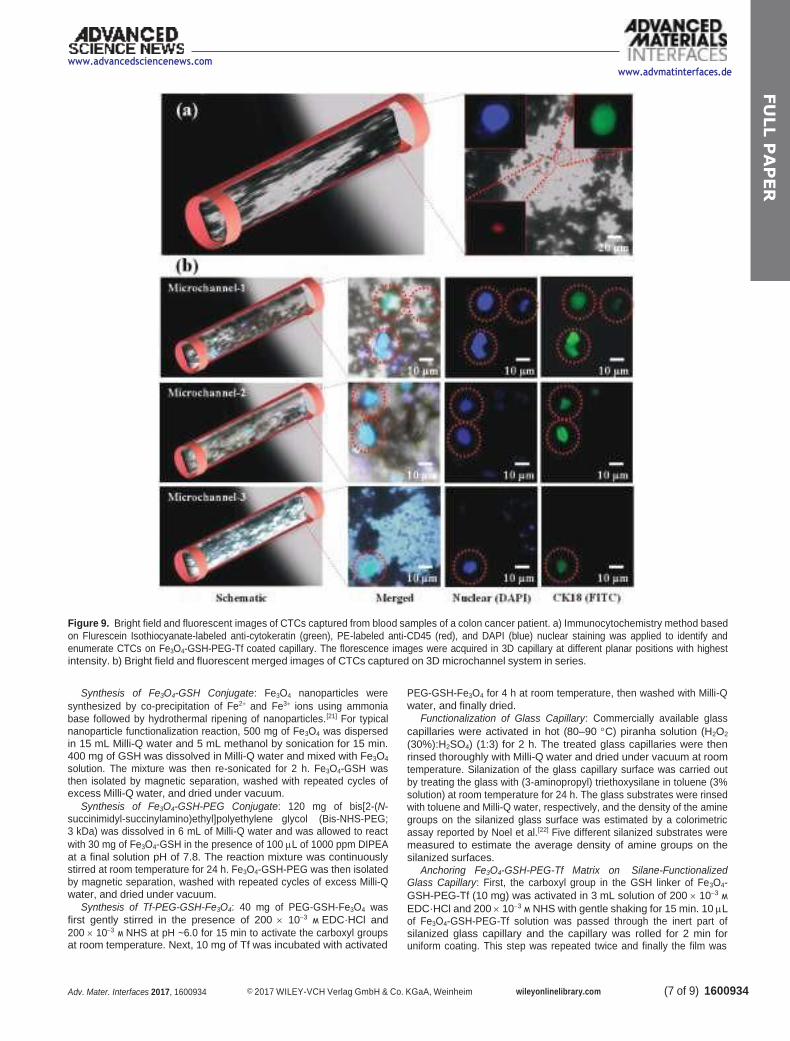
(7 of 9) 1600934 Adv. Mater. Interfaces 2017, 1600934 © 2017 WILEY-VCH Verlag GmbH & Co. KGaA, Weinheim wileyonlinelibrary.com
www.advancedsciencenews.com
www.advmatinterfaces.de
Figure 9. Bright field and fluorescent images of CTCs captured from blood samples of a colon cancer patient. a) Immunocytochemistry method based
on Flurescein Isothiocyanate-labeled anti-cytokeratin (green), PE-labeled anti-CD45 (red), and DAPI (blue) nuclear staining was applied to identify and
enumerate CTCs on Fe3O4-GSH-PEG-Tf coated capillary. The florescence images were acquired in 3D capillary at different planar positions with highest intensity. b) Bright field and fluorescent merged images of CTCs captured on 3D microchannel system in series.
Synthesis of Fe3O4-GSH Conjugate: Fe3O4 nanoparticles were
synthesized by co-precipitation of Fe2+ and Fe3+ ions using ammonia
base followed by hydrothermal ripening of nanoparticles.[21] For typical nanoparticle functionalization reaction, 500 mg of Fe3O4 was dispersed in 15 mL Milli-Q water and 5 mL methanol by sonication for 15 min. 400 mg of GSH was dissolved in Milli-Q water and mixed with Fe3O4 solution. The mixture was then re-sonicated for 2 h. Fe3O4-GSH was then isolated by magnetic separation, washed with repeated cycles of excess Milli-Q water, and dried under vacuum.
Synthesis of Fe3O4-GSH-PEG Conjugate: 120 mg of bis[2-(N- succinimidyl-succinylamino)ethyl]polyethylene glycol (Bis-NHS-PEG; 3 kDa) was dissolved in 6 mL of Milli-Q water and was allowed to react
with 30 mg of Fe3O4-GSH in the presence of 100 L of 1000 ppm DIPEA
at a final solution pH of 7.8. The reaction mixture was continuously stirred at room temperature for 24 h. Fe3O4-GSH-PEG was then isolated by magnetic separation, washed with repeated cycles of excess Milli-Q water, and dried under vacuum.
Synthesis of Tf-PEG-GSH-Fe3O4: 40 mg of PEG-GSH-Fe3O4 was
first gently stirred in the presence of 200 10−3 M EDC·HCl and
200 10−3 M NHS at pH ~6.0 for 15 min to activate the carboxyl groups at room temperature. Next, 10 mg of Tf was incubated with activated
PEG-GSH-Fe3O4 for 4 h at room temperature, then washed with Milli-Q
water, and finally dried.
Functionalization of Glass Capillary: Commercially available glass
capillaries were activated in hot (80–90 C) piranha solution (H2O2
(30%):H2SO4) (1:3) for 2 h. The treated glass capillaries were then
rinsed thoroughly with Milli-Q water and dried under vacuum at room
temperature. Silanization of the glass capillary surface was carried out
by treating the glass with (3-aminopropyl) triethoxysilane in toluene (3%
solution) at room temperature for 24 h. The glass substrates were rinsed with toluene and Milli-Q water, respectively, and the density of the amine
groups on the silanized glass surface was estimated by a colorimetric
assay reported by Noel et al.[22] Five different silanized substrates were
measured to estimate the average density of amine groups on the
silanized surfaces.
Anchoring Fe3O4-GSH-PEG-Tf Matrix on Silane-Functionalized Glass Capillary: First, the carboxyl group in the GSH linker of Fe3O4-
GSH-PEG-Tf (10 mg) was activated in 3 mL solution of 200 10−3 M
EDC·HCl and 200 10−3 M NHS with gentle shaking for 15 min. 10 L of Fe3O4-GSH-PEG-Tf solution was passed through the inert part of silanized glass capillary and the capillary was rolled for 2 min for uniform coating. This step was repeated twice and finally the film was
FU
LL P
AP
ER
1600934 (8 of 9) wileyonlinelibrary.com © 2017 WILEY-VCH Verlag GmbH & Co. KGaA, Weinheim Adv. Mater. Interfaces 2017, 1600934
www.advmatinterfaces.de www.advancedsciencenews.com
dried under vacuum at room temperature. The coated glass capillary
(NMSFGC) was then repeatedly washed with Milli-Q water to remove any noncovalently attached material and again re-dried under vacuum at
room temperature.
Cell Culture and Patients: HCT116 cells (ATCC) were cultured in McCoy’s cell culture medium (Invitrogen) supplemented with 10% fetal calf serum (Invitrogen), 100 units penicillin (Invitrogen), and
100 g mL−1 streptomycin (Invitrogen) in 25 cm2 flask. After incubation
for 4 d at 37 C and 5% CO2, cells were trypsinized, stained with 1
Trypan blue, and counted using Neubauer chamber. Blood from healthy volunteer was obtained by strictly following protocols and guidelines of the ethics committee. All cancer patient samples included in this study were collected at Manik Hospital and Research Center, Aurangabad, India with their informed consent. The Manik Hospital and Research Center ethics committee approved the study and consent forms. The conducted study strictly adhered to the approved protocols and the guidelines of the ethics committee.
Capture of Cancer Cells in McCoy Medium: Preliminary studies revealed that the optimal volume of the glass capillary to hold cell medium was
100 L. This optimal condition was employed in further studies for CTC
capture and isolation from McCoy medium. 100 L of McCoy medium
containing low concentration of HCT116 cells (25 cells mL−1) was
introduced in Tf-NMSFGC using micropipette and then rolled inside the capillary for 5 min in order to initiate the interaction between the cells and Fe3O4-GSH-PEG-Tf. After 5 min the sample was collected from the capillary using micropipette and transferred to another Tf-NMSFGC and again rolled inside it for another 5 min. This procedure was repeated one more time. The sample was then collected in 96-well plates using micropipette. The capillaries were rinsed with PBS at least three times in order to remove unattached cells. The number of uncaptured cells was counted using the Zeiss Axio Observer A1 fluorescence microscope. Also, the capture efficiency in medium with different cell concentrations
of 25, 50, and 100 cells 100 L−1 was also evaluated. Capture of Cancer Cells from Cancer Cell-Spiked Blood Samples: 25 dual
fluorescent HCT116 cells were spiked in 100 L of blood from healthy
person. Then the blood was lysed using RBC lysis buffer using 1:3
blood:RBC lysis buffer proportion. The sample was incubated at room
temperature on rotator at 50 rpm for 5 min, followed by centrifugation
at 2000 rpm for 3 min. The supernatant was discarded and pellet was
re-suspended in 100 L PBS. This PBS was inserted in Tf-NMSFGC and
rolled inside the capillary for 5 min in order to initiate the artificial CTC
sample and Fe3O4-GSH-PEG-Tf interaction. After 5 min the sample was
collected from the capillary using micropipette and transferred to another
Tf-NMSFGC and rolled inside it for another 5 min. This procedure was
repeated one more time. The sample was then collected in 96-well plates
using micropipette followed by rinsing of the capillaries with PBS at least
three times. The number of uncaptured cells was counted using the Zeiss
Axio Observer A1 fluorescence microscope fluorescence microscope.
Capture of CTC Cells from Clinical Colon Cancer Patient Sample: Peripheral blood obtained from clinically advanced cancer patients (including colon and breast cancer patients) in the age group of 45–60 years was used for the experiment. 1 mL of the blood was lysed in 3 mL RBC lysis buffer at room temperature for 15 min on rotator at 50 rpm. The sample was centrifuged at 2000 rpm for 15 min at room temperature. The supernatant was discarded and pellet was
resuspended in 500 L PBS. This was followed by fixation of the
sample by incubating with 4% paraformaldehyde (500 L) for 10 min
on rotator at 50 rpm. The sample was then centrifuged at 2000 rpm for 15 min at room temperature. The supernatant was discarded and
pellet was resuspended in 300 L PBS. Finally, the sample was stained
with anitcytokeratin18 (Abcam) and anti CD45 antibodies (Santa Cruz
Biotechnology) for 1 h at room temperature and DAPI (0.5 mg mL−1)
for 10 min at room temperature and visualized in 96-well plates under the fluorescence microscope (Zeiss Axio Observer A1 fluorescence microscope). After confirming that the stained/tested blood fraction contains cancer cell, the blood was inserted in the Tf-NMSFGC flow channel and rolled inside the capillary for 5 min in order to initiate the blood and Fe3O4-GSH-PEG-Tf interaction. After 5 min the sample
was collected from the capillary using micropipette and transferred to
another Tf-NMSFGC and again rolled inside it for another 5 min. This
procedure was repeated one more time. The blood sample was then collected in 96-well plates using micropipette. The capillaries were rinsed
with PBS at least three times to get rid of unattached cells. The number
of uncaptured cells was counted using the fluorescence microscope.
Characterization: TEM analysis was performed using a Philips (CM
200) TEM machine set at an accelerating voltage of 200 kV. Samples
for TEM were prepared by placing a drop of the Fe3O4-GSH-PEG-Tf
suspension in deionized water on a Formvar-covered copper grid and
then evaporating the water at room temperature. Conjugation of protein (Tf) to Fe3O4-GSH-PEG was confirmed by a modified Bradford assay.
Fluorescence imaging and counting of cells were performed using Zeiss
Axio Observer A1miscroscope (Carl Zeiss, Jena, Germany).
Supporting Information
Supporting Information is available from the Wiley Online Library or
from the author.
Acknowledgements
The authors would like to acknowledge the financial support from the
Biotechnology Ignition Grant (BIG), Biotechnology Industry Research Assistance Council (BIRAC), Department of Biotechnology (DBT). J.J.K.
acknowledges nanobiotechnology research grant from the Department
of Biotechnology and funds for improvement of science and technology
infrastructure from the Department of Science and Technology
(FIST-DST).
Received: September 29, 2016
Revised: November 15, 2016
Published online:
[1] K. Pantel, R. H. Brakenhoff, B. Brandt, Nat. Rev. Cancer 2008, 8, 329.
[2] S. S. Banerjee, A. Jalota-Badhwar, S. D. Satavalekar, S. G. Bhansali,
N. D. Aher, R. R. Mascarenhas, D. Paul, S. Sharma, J. J. Khandare,
Adv. Healthcare Mater. 2013, 2, 800.
[3] J. Kaiser, Science 2010, 327, 1074.
[4] S. S. Banerjee, A. Jalota-Badhwar, K. R. Zope, K. J. Todkar,
R. R. Mascarenhas, G. P. Chate, G. V. Khutale, A. Bharde,
M. Calderon, J. J. Khandare, Nanoscale 2015, 7, 8684.
[5] K. Pantel, R. H. Brakenhoff, Nat. Rev. Cancer 2004, 4, 448.
[6] A. H. Kuo, M. F. Clarke, Nat. Biotechnol. 2013, 31, 504.
[7] C. A. Klein, Science 2008, 321, 1785.
[8] S. Nagrath, L. V. Sequist, S. Maheswaran, D. W. Bell, D. Irimia,
L. Ulkus, M. R. Smith, E. L. Kwak, S. Digumarthy, A. Muzikansky,
P. Ryan, U. J. Balis, R. G. Tompkins, D. A. Haber, M. Toner, Nature
2007, 450, 1235.
[9] E. I. Galanza, E. V. Shashkov, T. Kelly, J. W. Kim, L. Yang, V. P. Zharov,
Nat. Nanotechnol. 2009, 4, 855.
[10] Q. Shen, L. Xu, L. Zhao, D. Wu, Y. Fan, Y. Zhou, W. H. OuYang,
X. Xu, Z. Zhang, M. Song, T. Lee, M. A. Garcia, B. Xiong, S. Hou,
H. R. Tseng, X. Fang, Adv. Mater. 2013, 25, 2368.
[11] A. H. Talasaz, A. A. Powell, D. E. Huber, J. G. Berbee, K. H. Roh,
W. Yu, W. Xiao, M. M. Davis, R. F. Pease, M. N. Mindrinos,
S. S. Jeffrey, R. W. Davis, Proc. Natl. Acad. Sci. USA 2009, 106, 3970.
[12] A. Adams, P. I. Okagbare, J. Feng, M. L. Hupert, D. Patterson,
J. Gttert, R. L. McCarley, D. Nikitopoulos, M. C. Murphy, S. A. Soper,
J. Am. Chem. Soc. 2008, 130, 8633.
[13] S. Wang, K. Liu, J. Liu, Z. T. F. Yu, X. Xu, L. Zhao, T. Lee, E. K. Lee,
J. Reiss, Y. K. Lee, L. W. K. Chung, J. Huang, M. Rettig, D. Seligson,
FU
LL P
AP
ER

(9 of 9) 1600934 Adv. Mater. Interfaces 2017, 1600934 © 2017 WILEY-VCH Verlag GmbH & Co. KGaA, Weinheim wileyonlinelibrary.com
www.advancedsciencenews.com
K. N. Duraiswamy, C. K. F. Shen, H. R. Tseng, Angew. Chem. Int. Ed.
2011, 50, 3084.
[14] S. Zheng, H. Lin, J. Q. Liu, M. Balic, R. Datar, R. J. Cote, Y. C. Tai,
J. Chromatogr. A 2007, 1162, 154.
[15] Z. A. Nima, M. Mahmood, Y. Xu, T. Mustafa, F. Watanabe,
D. A. Nedosekin, M. A. Juratli, T. Fahmi, E. I. Galanzha, J. P. Nolan,
A. G. Basnakian, V. P. Zharov, A. S. Biris, Sci. Rep. 2014, 4, 4752.
[16] G. Vona, A. Sabile, M. Louha, V. Sitruk, S. Romana, K. Schutze,
F. Capron, D. Franco, M. Pazzagli, M. Vekemans, B. Lacour,
C. Brechot, P. Paterlini-Brechot, Am. J. Pathol. 2000, 156, 57.
[17] S. S. Banerjee, D. Paul, S. G. Bhansali, N. D. Aher,
A. Jalota-Badhwar, J. Khandare, Small 2012, 8, 1657.
www.advmatinterfaces.de
[18] E. Reátegui, N. Aceto, E. J. Lim, J. P. Sullivan, A. E. Jensen,
M. Zeinali, J. M. Martel, A. J. Aranyosi, W. Li, S. Castleberry,
A. Bardia, L. V. Sequist, D. A. Haber, S. Maheswaran,
P. T. Hammond, M. Toner, S. L. Stott, Adv. Mater. 2015, 27, 1593.
[19] J. S. Miller, K. R. Stevens, M. T. Yang, B. M. Baker, D. H. T. Nguyen,
D. M. Cohen, E. Toro, A. A. Chen, P. A. Galie, X. Yu, R. Chaturvedi,
S. N. Bhatia, C. S. Chen, Nat. Mater. 2012, 11, 768.
[20] G. Yang, Y. Cao, J. Fan, H. Liu, F. Zhang, P. Zhang, C. Huang,
L. Jiang, S. Wang, Angew. Chem., Int. Ed. 2014, 53, 2915.
[21] S. S. Banerjee, D. H. Chen, Chem. Mater. 2007, 19, 6345.
[22] S. Noel, B. Liberelle, L. Robitaille, G. De Crescenzo, Bioconjugate
Chem. 2011, 22,1690.
FU
LL P
AP
ER
ORIGINAL ARTICLE
Year : 2017 | Volume : 10 | Issue : 1 | Page : 129-133
Epidemiological study of hardiness profile of blind people
Sanjeev Vasantrao Chincholikar
Professor, Community Medicine, MIMER Medical College, Talegaon Dabhade, Pune,
Maharashtra, India
Click here for correspondence address and email
Date of Web
Publication
5-May-
2017
Abstract
Objective: To study the risk factors in psychosocial profile of blind people undergoing
vocational training. using a screening test ,Personality based hardiness index and suggest
recommendations if any. Study design: Cross sectional study. Participants: Blind people.
Study Variables: Sex, socioeconomic status, literacy, psychiatric morbidity. Statistical
analysis: Fishers Exact test, χ2 test. Results: Recently introduced technique of Personality
based hardiness index was tested for its utility for screening of blind persons to detect possible
psychological maladjustments and hardiness. Analysis of results of Personality based hardiness
index revealed that 9% subjects were non hardy. Most of the non hardy subjects were
1. males 13% as compared to females 3%
2. belonging to lower socioeconomic class (100%)
3. illiterates 34.3% as compared to literates 2%
4. residing in rural area (12.7%) as compared to person in urban area (0%)
The overall results of the above detailed tests brought some salient risk factors that can be
strongly associated with psychosocial maladjustments and hardiness in the handicapped
persons. These risk factors are Lower socioeconomic class, Rural residence, Illiteracy, Sex
These risk factors that emerged out of the statistical analysis of the data can be immensely
useful in the planning stages of rehabilitation.
Keywords: Literacy, socioeconomic class, personality based hardiness index, rural area, males

How to cite this article:
Chincholikar SV. Epidemiological study of hardiness profile of blind people. Ann Trop Med
Public Health 2017;10:129-33
How to cite this URL:
Chincholikar SV. Epidemiological study of hardiness profile of blind people. Ann Trop Med
Public Health [serial online] 2017 [cited 2018 Oct 18];10:129-33. Available
from: http://www.atmph.org/text.asp?2017/10/1/129/196522
Introduction
The psychiatric research for decades was confined to mental hospitals and psychiatric clinics,
and was characterized by lengthy interviews, case records, and case studies. The application of
public health principles to mental disorders was tried only recently, with the aim of expanding
the mental health research beyond the mental health hospital and the psychiatric clinics. It is at
stage of implementation in field that the difficulties in practicing these scientific principles are
experienced. Resource crunch, in respect of technical manpower, poses the main hurdle among
other things, especially in a developing country like India. It is generally agreed that
psychological aspects are the common victims of these circumstances. A very substantial lack
of manpower trained in psychology, psychiatry, social sciences, and related fields has been the
real hurdle in this respect.[1]
The Personality based hardiness index is the measurable personality characteristics and
dynamics of those who appear immune to the development of stress related disorders, and
comprises a variable personality based hardiness index .The notion of hardness is derived from
existential theories of psychology, which states that individuals require meaning and
commitment in their life to become fulfilled and psychologically healthy. In the Intrinsic Indies
existential theories, the three factors, which are considered to be important for the actualization
for the fulfillment of an individual, are : commitment, control, and challenge.
Commitment: The ability to believe in the truth, importance, and interest value of when is and
what one is doing, and thereby the tendency to fully involve oneself in many situations of life
including work, family, interpersonal relationship, and social institutions. It is also described as
the tendency to be curious about and involve oneself in whatever is happening rather than avoid
doing vigorous interaction with the environment.
Control: The tendency to believe and act as if one can influence the course of events rather than
feeling like the passive victim of circumstances. The persons high in control seek explanation
for why something is happening not with respect to others' action or fate but rather with an
emphasis on their own responsibility.
Challenge: The belief that the change rather than stability is the normative mode of life. From a
challenge's perspective , much of the disruption associated with the occurrence of a stressful life
events can be anticipated as an opportunity and incentive for personal growth rather than a
simple threat to security. The challenge leads a person to be a catalyst in the environment, and
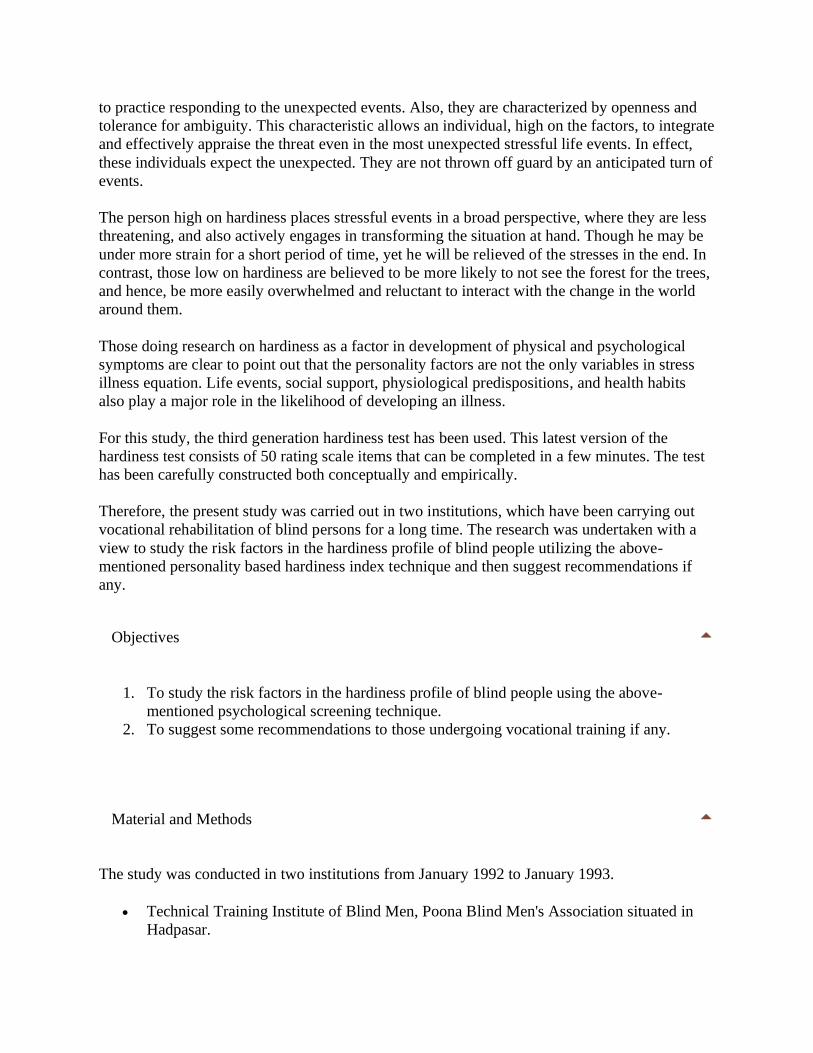
to practice responding to the unexpected events. Also, they are characterized by openness and
tolerance for ambiguity. This characteristic allows an individual, high on the factors, to integrate
and effectively appraise the threat even in the most unexpected stressful life events. In effect,
these individuals expect the unexpected. They are not thrown off guard by an anticipated turn of
events.
The person high on hardiness places stressful events in a broad perspective, where they are less
threatening, and also actively engages in transforming the situation at hand. Though he may be
under more strain for a short period of time, yet he will be relieved of the stresses in the end. In
contrast, those low on hardiness are believed to be more likely to not see the forest for the trees,
and hence, be more easily overwhelmed and reluctant to interact with the change in the world
around them.
Those doing research on hardiness as a factor in development of physical and psychological
symptoms are clear to point out that the personality factors are not the only variables in stress
illness equation. Life events, social support, physiological predispositions, and health habits
also play a major role in the likelihood of developing an illness.
For this study, the third generation hardiness test has been used. This latest version of the
hardiness test consists of 50 rating scale items that can be completed in a few minutes. The test
has been carefully constructed both conceptually and empirically.
Therefore, the present study was carried out in two institutions, which have been carrying out
vocational rehabilitation of blind persons for a long time. The research was undertaken with a
view to study the risk factors in the hardiness profile of blind people utilizing the above-
mentioned personality based hardiness index technique and then suggest recommendations if
any.
Objectives
1. To study the risk factors in the hardiness profile of blind people using the above-
mentioned psychological screening technique.
2. To suggest some recommendations to those undergoing vocational training if any.
Material and Methods
The study was conducted in two institutions from January 1992 to January 1993.
• Technical Training Institute of Blind Men, Poona Blind Men's Association situated in
Hadpasar.
• The Poona School and Home for the blind girls situated near Kothrud.
The respective authorities of above institutions admit blind subjects having inability to count
fingers at a distance of 6 meters as certified by Civil Surgeon of the concerned district.
The permission was obtained from respective authorities of above two institutions for
conducting this study.
All the blinds enrolled in above two institutions at the time of the study were included.
The information regarding the types of questions was given to all blinds included in the study,
and the answers were obtained by interview technique.
For the present study, the personality hardiness index followed by Kobasa and Maddi[1],[2],[3]
was used .The index consisted of 50 scale rating items.
For the present study, 47 of these 50 items were selected, as 3 of them were deemed by
consulting psychiatrist to be ambiguous. The 47 selected item consisted of 14 positive and 33
negative statements. Each statement was read and explained to the subject to elicit answers. All
subjects above the age of 14 years were considered for hardiness test as recommended by
Kobasa and Maddi.
For the 14 positive statements scoring was done as follows:
For the choice, score 0 was given because of complete disagreement with a correct statement.
For choice,[1] score 1 and for choice,[2] scores 2 were given, respectively. For choice,[3] the
subject was given score 3 because of complete agreement with a correct statement.
The scoring system was exactly reverse for the 33 negative statements therefore, response 0 got
score 3, and response 3 got score 0. At the end, the scores obtained by a given subject for all 47
statements were totaled. A subject scoring equal to or more than 50% of the maximum possible
score, that is 47x3 =141, was classified as hardy, which means well-equipped to cope up with
psychological stresses. While the one whose score was less than 50% was labeled as non hardy.
The experience for scientific utilization of personality hardiness was obtained by working in the
psychiatry department under the guidance of qualified psychiatrist. The Personality based
hardiness index was used in the present study for screening of blind subjects to study the risk
factors in the psychosocial profile of blind people.
Results and Discussion
The Hardiness score was calculated among blind subjects, and subjects were classified as hardy

and non hardy. It can be observed from [Table 1] that 8.88% of study subjects were non hardy.
This would mean, that 8.88% of study subjects were ill-equipped to cope up with the stressful
conditions of life, and were more prone to develop psychological maladjustments. These
subjects would need intervention in the form of psychological counseling for improving their
hardiness for a successful psychological rehabilitation.
Table 1: Personality Based Hardiness Status Amongblind
Subjects
Click here to view
When hardiness results were co-related with the sex of the subjects by using the test of
significance, as observed from [Table 2], there was, statistically, a significant difference
between the two at 95% confidence limit.
Table 2: Hardiness Results According To Sex
Click here to view
χ2=4.35,D.F.=1, P<0.05
It would appear that males are relatively less hardy than females. The observed difference in the
hardiness in both the sexes could perhaps be due to the difference in levels of exposure to
socioeconomic stresses and frustrations outside the protection of the home.
Ray in 1962[4] and Sethe in 1977[5] observed higher percentage of male population registered at
psychiatric facilities in India.
Rudolf Pinter et al[6] in their study of deaf observed that men were more neurotic and introvert
than women.
Springer and Rosler[7] in their study of deaf observed that deaf boys were more neurotic than
girls.
It can be observed from [Table 3] that there was, statistically, a significant difference between
the two groups at 95% confidence limit.
Table 3: Hardiness Results As Per Urban And Rural Residence
Click here to view
Applying Fishers exact test P=0.003424
This would mean that blind subjects in rural area were more prone to get psychological

maladjustments than their urban counterparts.
All 51 urban dwellers showed presence of hardiness.
This would mean that blind subjects in rural area need more careful attention especially in the
area of psychological counseling for ensuring better results of rehabilitation process. The mental
morbidity revealed in various rural surveys among general population varies from 18.24 per
thousand to 102.8 per thousand. The mental morbidity revealed in various urban surveys among
general population, varies from 0 per thousand to 38 per thousand.[8],[9]
[Table 4] shows the hardiness results as per socioeconomic status. None of the subjects from
class II and class III showed non hardiness. Owing to unacceptably small values in some of the
cells of the table, which would undermine the utility of χ2 test, the data for class II, class III
(upper and lower middle class), class IV, and class V were pooled for statistical analysis.
Table 4: Hardiness Results as Per Socioeconomic Status
Click here to view
When hardiness results were co-related with socioeconomic status of the subjects by using the
test of significance, as observed from the table, there was, statistically, a significant difference
between the two at 95% confidence limit.
χ2=4.964, D.F.=1, P<0.05
It appears that hardiness of an individual varies according to socio-economic status, as none of
the blind subjects in class II and class III were non hardy, and 27.08% of those in class V
showed non hardiness.
It would mean that as socio-economic status become better, hardiness increases, that is, the
subjects belonging to lower socio-economic classes may have more risk of getting psychiatric
maladjustments than those in the higher classes. This confirms that socio-economic status is one
of the important factors in deciding the probable psychological maladjustment among blind
subjects.
It is a known fact that even in case of persons without any disabilities, the adverse socio-cultural
factors present in the lower socio-economic classes make the subjects more vulnerable to
psychiatric morbidities. Blindness or other handicaps further complicate the picture.
Several studies made in different parts of world have shown that lower socio-economic classes
have a higher rate of mental disorders.
B. Sen. et al.[10] in their study observed that more than half of the families of social class V had
psychiatric morbidity.
Tanksale[11] in her study of blind observed a significant relationship between better self-
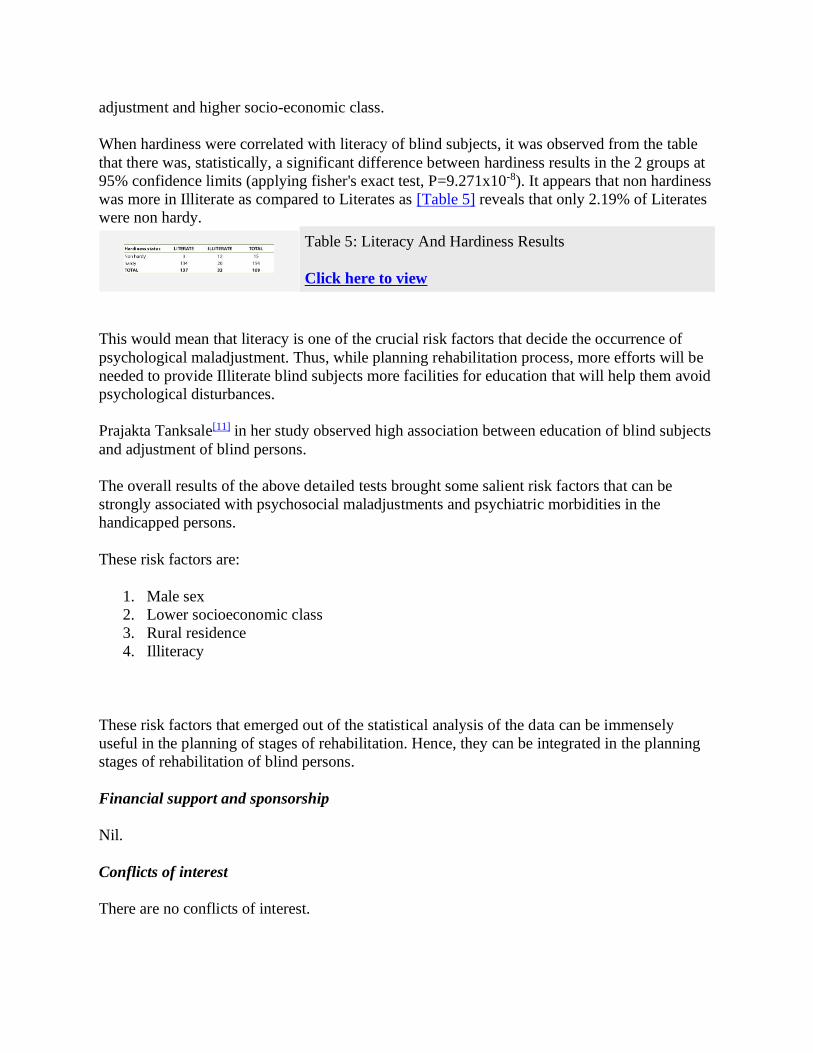
adjustment and higher socio-economic class.
When hardiness were correlated with literacy of blind subjects, it was observed from the table
that there was, statistically, a significant difference between hardiness results in the 2 groups at
95% confidence limits (applying fisher's exact test, P=9.271x10⁻⁸). It appears that non hardiness
was more in Illiterate as compared to Literates as [Table 5] reveals that only 2.19% of Literates
were non hardy.
Table 5: Literacy And Hardiness Results
Click here to view
This would mean that literacy is one of the crucial risk factors that decide the occurrence of
psychological maladjustment. Thus, while planning rehabilitation process, more efforts will be
needed to provide Illiterate blind subjects more facilities for education that will help them avoid
psychological disturbances.
Prajakta Tanksale[11] in her study observed high association between education of blind subjects
and adjustment of blind persons.
The overall results of the above detailed tests brought some salient risk factors that can be
strongly associated with psychosocial maladjustments and psychiatric morbidities in the
handicapped persons.
These risk factors are:
1. Male sex
2. Lower socioeconomic class
3. Rural residence
4. Illiteracy
These risk factors that emerged out of the statistical analysis of the data can be immensely
useful in the planning of stages of rehabilitation. Hence, they can be integrated in the planning
stages of rehabilitation of blind persons.
Financial support and sponsorship
Nil.
Conflicts of interest
There are no conflicts of interest.
References
1. Kobasa SC. Stressful life events, prersonality and health, an enquiry into hardiness. Journal
of personality and social psychology 1979;37:1-11.
[PUBMED]
2. Kobasa SC. Maddi SR. Existential personality theory in R Corsini (ed), current personality
theory itasca, 1977.
3. Maddi SR, Kobasa SC, Kahn S. Hardiness and health: A prospective study. Journal of
personality and social psychology 1982;42:168-77.
[PUBMED]
4. Dattas Ray. Social stratification of mental patients. Indian J Psychiatry 1962;4:3.
5. Sethi BB, Manchanda R. Social factors and mental illness, an analysis of first admission to
a psychiatric hospital. The International journal of social psychiatry 1980;26:200-7.
6. Pinter R, Eisenson R, Stranton M. The psychology of the physically handicapped.
Newyork Appleton Centry Crofts, INC.
7. Springer NN, Rosler. A comparative study of deaf and hearing children. Jeducatioal
psychology 1938;29:459-66.
8. Surya Mental morbidity in Pondicherry. All India Institute of Mental Health 1964;9:56.
9. Nandi DN, Ajmary S, Ganhuli H, Banerjee G, Boral GC, Ghosh A. Sarkars The incidence
of mental disorders in one year in a rural community in west Bengal. Ind j psychiatry
1976;18:79.
10. Sen B, Nandi DN, Mukherjee SP, Mishra DC, Banerjee G, Sarkar S. Psychiatric morbidity
in an urban slum dwelling community. Indian journal of psychiatry 1984;28:p185-93.
11. Prajakta Tanksale. The problem of social adjustment and rehabilitation of the blind A
dissertation submitted to Nagpur University Nagpur for Degree of Doctor of philosophy, in
the faculty of social sciences April 1988. 22-35.
Correspondence Address:
Dr. Sanjeev Vasantrao Chincholikar
Professor, Community Medicine, MIMER Medical College, Talegaon Dabhade, Pune,
Maharashtra
India

Source of Support: None, Conflict of Interest: None
Check
DOI: 10.4103/1755-6783.196522
Tables
[Table 1], [Table 2], [Table 3], [Table 4], [Table 5]
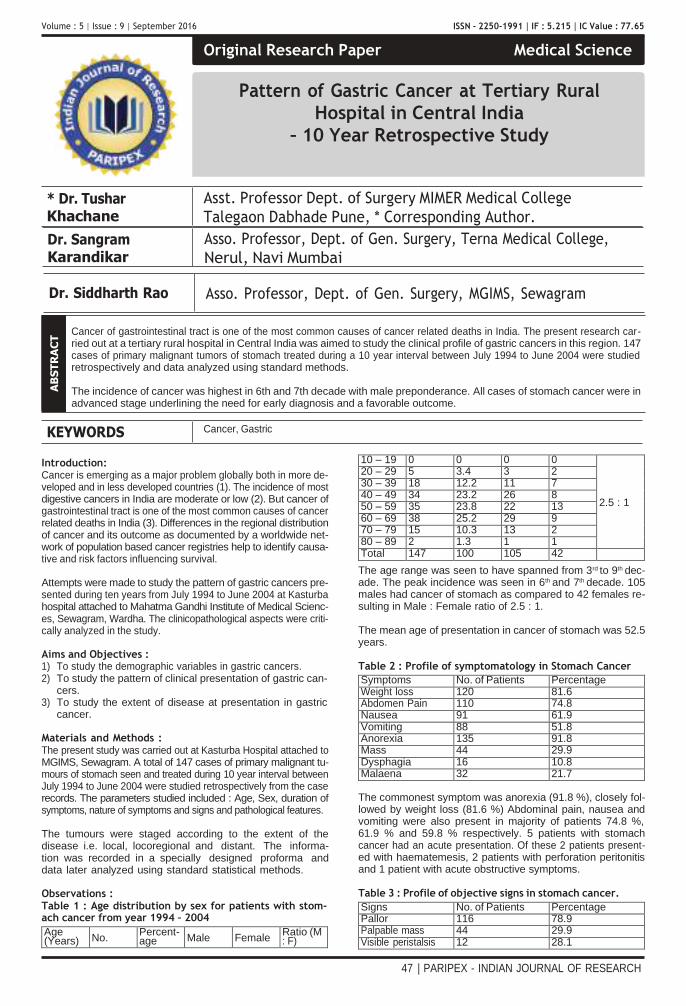
Original Research Paper Medical Science
* Dr. Tushar Khachane
Asst. Professor Dept. of Surgery MIMER Medical College
Talegaon Dabhade Pune, * Corresponding Author.
KEYWORDS Cancer, Gastric
Volume : 5 | Issue : 9 | September 2016 ISSN - 2250-1991 | IF : 5.215 | IC Value : 77.65
Introduction: Cancer is emerging as a major problem globally both in more de- veloped and in less developed countries (1). The incidence of most digestive cancers in India are moderate or low (2). But cancer of gastrointestinal tract is one of the most common causes of cancer related deaths in India (3). Differences in the regional distribution of cancer and its outcome as documented by a worldwide net- work of population based cancer registries help to identify causa- tive and risk factors influencing survival.
Attempts were made to study the pattern of gastric cancers pre- sented during ten years from July 1994 to June 2004 at Kasturba hospital attached to Mahatma Gandhi Institute of Medical Scienc- es, Sewagram, Wardha. The clinicopathological aspects were criti- cally analyzed in the study.
Aims and Objectives : 1) To study the demographic variables in gastric cancers. 2) To study the pattern of clinical presentation of gastric can-
cers. 3) To study the extent of disease at presentation in gastric
cancer.
Materials and Methods : The present study was carried out at Kasturba Hospital attached to MGIMS, Sewagram. A total of 147 cases of primary malignant tu- mours of stomach seen and treated during 10 year interval between July 1994 to June 2004 were studied retrospectively from the case records. The parameters studied included : Age, Sex, duration of symptoms, nature of symptoms and signs and pathological features.
The tumours were staged according to the extent of the disease i.e. local, locoregional and distant. The informa- tion was recorded in a specially designed proforma and data later analyzed using standard statistical methods.
Observations : Table 1 : Age distribution by sex for patients with stom- ach cancer from year 1994 – 2004
Age (Years) No.
Percent- age Male Female
Ratio (M : F)
10 – 19 0 0 0 0
2.5 : 1
20 – 29 5 3.4 3 2 30 – 39 18 12.2 11 7 40 – 49 34 23.2 26 8 50 – 59 35 23.8 22 13 60 – 69 38 25.2 29 9 70 – 79 15 10.3 13 2 80 – 89 2 1.3 1 1 Total 147 100 105 42
The age range was seen to have spanned from 3rd to 9th dec- ade. The peak incidence was seen in 6th and 7th decade. 105 males had cancer of stomach as compared to 42 females re- sulting in Male : Female ratio of 2.5 : 1.
The mean age of presentation in cancer of stomach was 52.5 years.
Table 2 : Profile of symptomatology in Stomach Cancer
Symptoms No. of Patients Percentage Weight loss 120 81.6 Abdomen Pain 110 74.8 Nausea 91 61.9 Vomiting 88 51.8 Anorexia 135 91.8 Mass 44 29.9 Dysphagia 16 10.8 Malaena 32 21.7
The commonest symptom was anorexia (91.8 %), closely fol- lowed by weight loss (81.6 %) Abdominal pain, nausea and vomiting were also present in majority of patients 74.8 %, 61.9 % and 59.8 % respectively. 5 patients with stomach cancer had an acute presentation. Of these 2 patients present- ed with haematemesis, 2 patients with perforation peritonitis and 1 patient with acute obstructive symptoms.
Table 3 : Profile of objective signs in stomach cancer.
Signs No. of Patients Percentage Pallor 116 78.9 Palpable mass 44 29.9 Visible peristalsis 12 28.1
47 | PARIPEX - INDIAN JOURNAL OF RESEARCH
Dr. Siddharth Rao Asso. Professor, Dept. of Gen. Surgery, MGIMS, Sewagram
Dr. Sangram Karandikar
Asso. Professor, Dept. of Gen. Surgery, Terna Medical College,
Nerul, Navi Mumbai
Pattern of Gastric Cancer at Tertiary Rural
Hospital in Central India
– 10 Year Retrospective Study
Cancer of gastrointestinal tract is one of the most common causes of cancer related deaths in India. The present research car- ried out at a tertiary rural hospital in Central India was aimed to study the clinical profile of gastric cancers in this region. 147 cases of primary malignant tumors of stomach treated during a 10 year interval between July 1994 to June 2004 were studied retrospectively and data analyzed using standard methods.
The incidence of cancer was highest in 6th and 7th decade with male preponderance. All cases of stomach cancer were in advanced stage underlining the need for early diagnosis and a favorable outcome.
AB
ST
RA
CT
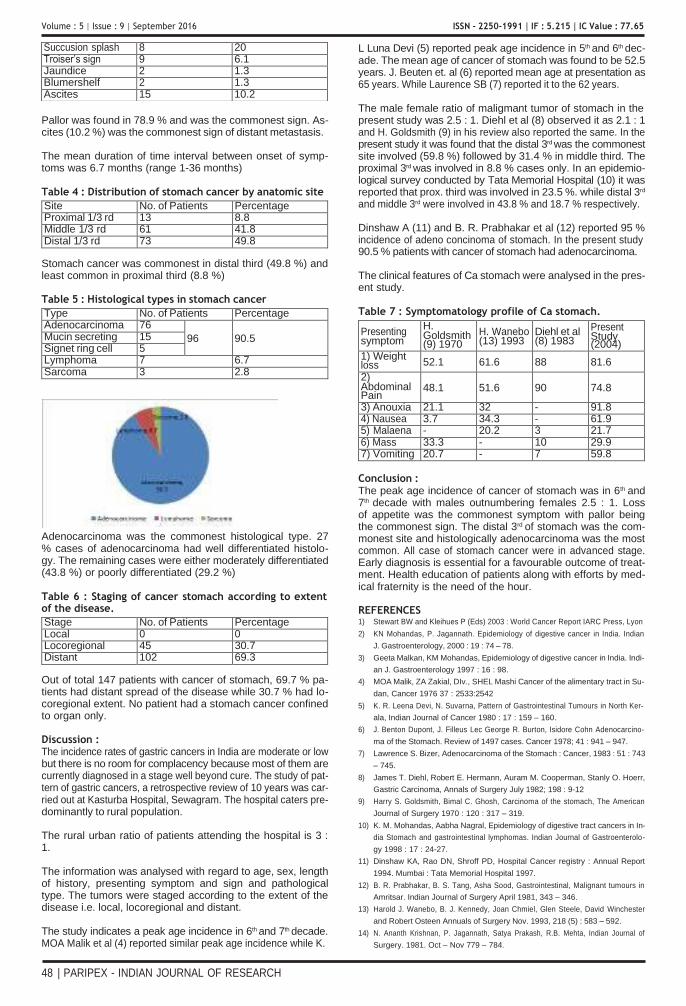
Volume : 5 | Issue : 9 | September 2016 ISSN - 2250-1991 | IF : 5.215 | IC Value : 77.65
L Luna Devi (5) reported peak age incidence in 5th and 6th dec- ade. The mean age of cancer of stomach was found to be 52.5 years. J. Beuten et. al (6) reported mean age at presentation as 65 years. While Laurence SB (7) reported it to the 62 years.
The male female ratio of maligmant tumor of stomach in the Pallor was found in 78.9 % and was the commonest sign. As- cites (10.2 %) was the commonest sign of distant metastasis.
The mean duration of time interval between onset of symp- toms was 6.7 months (range 1-36 months)
Table 4 : Distribution of stomach cancer by anatomic site
Site No. of Patients Percentage Proximal 1/3 rd 13 8.8 Middle 1/3 rd 61 41.8 Distal 1/3 rd 73 49.8
Stomach cancer was commonest in distal third (49.8 %) and least common in proximal third (8.8 %)
Table 5 : Histological types in stomach cancer
Type No. of Patients Percentage Adenocarcinoma 76
96
90.5 Mucin secreting 15 Signet ring cell 5 Lymphoma 7 6.7 Sarcoma 3 2.8
Adenocarcinoma was the commonest histological type. 27 % cases of adenocarcinoma had well differentiated histolo- gy. The remaining cases were either moderately differentiated (43.8 %) or poorly differentiated (29.2 %)
Table 6 : Staging of cancer stomach according to extent of the disease.
Stage No. of Patients Percentage Local 0 0 Locoregional 45 30.7 Distant 102 69.3
Out of total 147 patients with cancer of stomach, 69.7 % pa- tients had distant spread of the disease while 30.7 % had lo- coregional extent. No patient had a stomach cancer confined to organ only.
Discussion : The incidence rates of gastric cancers in India are moderate or low but there is no room for complacency because most of them are currently diagnosed in a stage well beyond cure. The study of pat- tern of gastric cancers, a retrospective review of 10 years was car- ried out at Kasturba Hospital, Sewagram. The hospital caters pre- dominantly to rural population.
The rural urban ratio of patients attending the hospital is 3 : 1.
The information was analysed with regard to age, sex, length of history, presenting symptom and sign and pathological type. The tumors were staged according to the extent of the disease i.e. local, locoregional and distant.
The study indicates a peak age incidence in 6th and 7th decade. MOA Malik et al (4) reported similar peak age incidence while K.
present study was 2.5 : 1. Diehl et al (8) observed it as 2.1 : 1 and H. Goldsmith (9) in his review also reported the same. In the present study it was found that the distal 3rd was the commonest site involved (59.8 %) followed by 31.4 % in middle third. The proximal 3rd was involved in 8.8 % cases only. In an epidemio- logical survey conducted by Tata Memorial Hospital (10) it was reported that prox. third was involved in 23.5 %. while distal 3rd
and middle 3rd were involved in 43.8 % and 18.7 % respectively.
Dinshaw A (11) and B. R. Prabhakar et al (12) reported 95 % incidence of adeno concinoma of stomach. In the present study 90.5 % patients with cancer of stomach had adenocarcinoma.
The clinical features of Ca stomach were analysed in the pres- ent study.
Table 7 : Symptomatology profile of Ca stomach.
Presenting symptom
H. Goldsmith (9) 1970
H. Wanebo (13) 1993
Diehl et al (8) 1983
Present Study (2004)
1) Weight loss 52.1 61.6 88 81.6
2) Abdominal Pain
48.1 51.6 90 74.8
3) Anouxia 21.1 32 - 91.8 4) Nausea 3.7 34.3 - 61.9 5) Malaena - 20.2 3 21.7 6) Mass 33.3 - 10 29.9 7) Vomiting 20.7 - 7 59.8
Conclusion : The peak age incidence of cancer of stomach was in 6th and 7th decade with males outnumbering females 2.5 : 1. Loss of appetite was the commonest symptom with pallor being the commonest sign. The distal 3rd of stomach was the com- monest site and histologically adenocarcinoma was the most common. All case of stomach cancer were in advanced stage. Early diagnosis is essential for a favourable outcome of treat- ment. Health education of patients along with efforts by med- ical fraternity is the need of the hour.
REFERENCES 1) Stewart BW and Kleihues P (Eds) 2003 : World Cancer Report IARC Press, Lyon
2) KN Mohandas, P. Jagannath. Epidemiology of digestive cancer in India. Indian
J. Gastroenterology, 2000 : 19 : 74 – 78.
3) Geeta Malkan, KM Mohandas, Epidemiology of digestive cancer in India. Indi-
an J. Gastroenterology 1997 : 16 : 98.
4) MOA Malik, ZA Zakial, DIv., SHEL Mashi Cancer of the alimentary tract in Su-
dan, Cancer 1976 37 : 2533:2542
5) K. R. Leena Devi, N. Suvarna, Pattern of Gastrointestinal Tumours in North Ker-
ala, Indian Journal of Cancer 1980 : 17 : 159 – 160.
6) J. Benton Dupont, J. Filleus Lec George R. Burton, Isidore Cohn Adenocarcino-
ma of the Stomach. Review of 1497 cases. Cancer 1978; 41 : 941 – 947.
7) Lawrence S. Bizer, Adenocarcinoma of the Stomach : Cancer, 1983 : 51 : 743
– 745.
8) James T. Diehl, Robert E. Hermann, Auram M. Cooperman, Stanly O. Hoerr,
Gastric Carcinoma, Annals of Surgery July 1982; 198 : 9-12
9) Harry S. Goldsmith, Bimal C. Ghosh, Carcinoma of the stomach, The American
Journal of Surgery 1970 : 120 : 317 – 319.
10) K. M. Mohandas, Aabha Nagral, Epidemiology of digestive tract cancers in In-
dia Stomach and gastrointestinal lymphomas. Indian Journal of Gastroenterolo-
gy 1998 : 17 : 24-27.
11) Dinshaw KA, Rao DN, Shroff PD, Hospital Cancer registry : Annual Report
1994. Mumbai : Tata Memorial Hospital 1997.
12) B. R. Prabhakar, B. S. Tang, Asha Sood, Gastrointestinal, Malignant tumours in
Amritsar. Indian Journal of Surgery April 1981, 343 – 346.
13) Harold J. Wanebo, B. J. Kennedy, Joan Chmiel, Glen Steele, David Winchester
and Robert Osteen Annuals of Surgery Nov. 1993, 218 (5) : 583 – 592.
14) N. Ananth Krishnan, P. Jagannath, Satya Prakash, R.B. Mehta, Indian Journal of
Surgery. 1981. Oct – Nov 779 – 784.
48 | PARIPEX - INDIAN JOURNAL OF RESEARCH
Succusion splash 8 20 Troiser’s sign 9 6.1 Jaundice 2 1.3 Blumershelf 2 1.3 Ascites 15 10.2
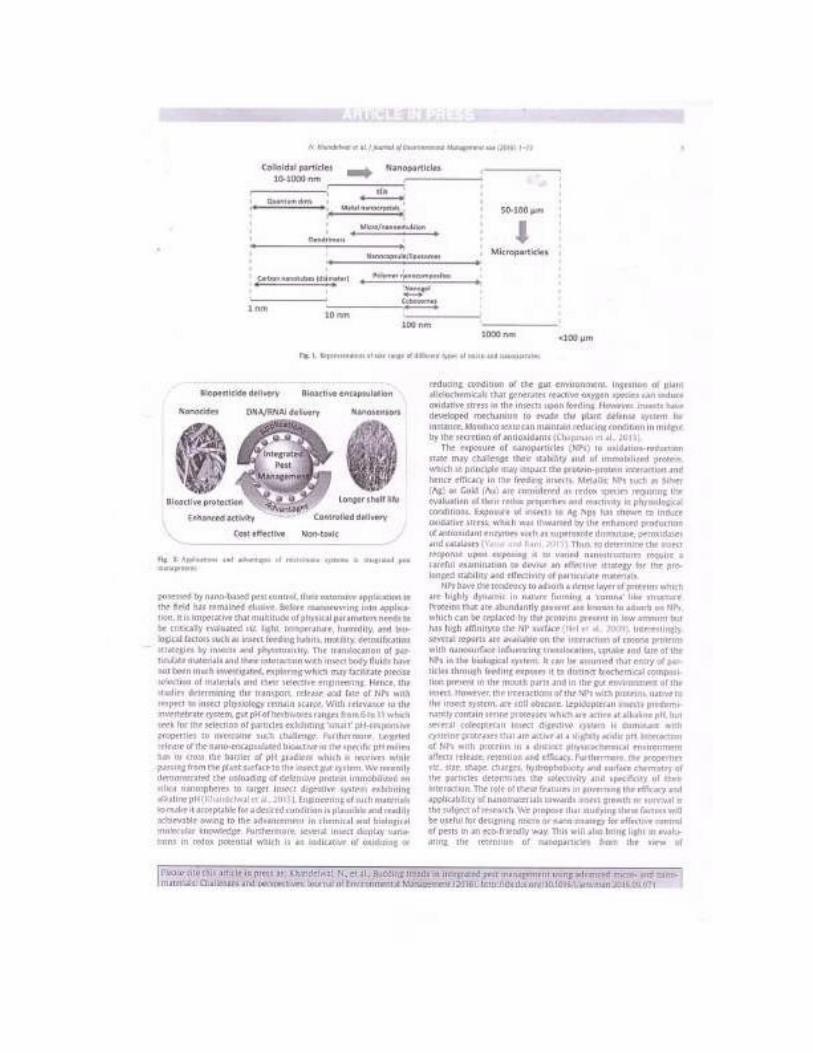
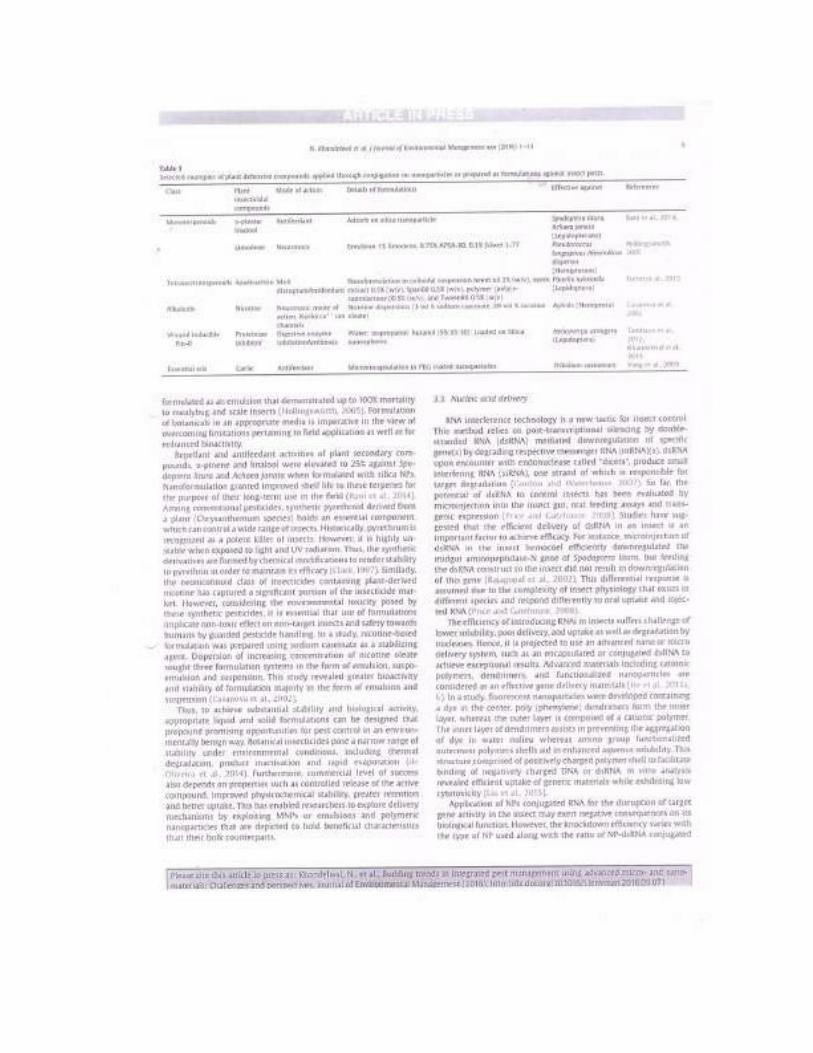

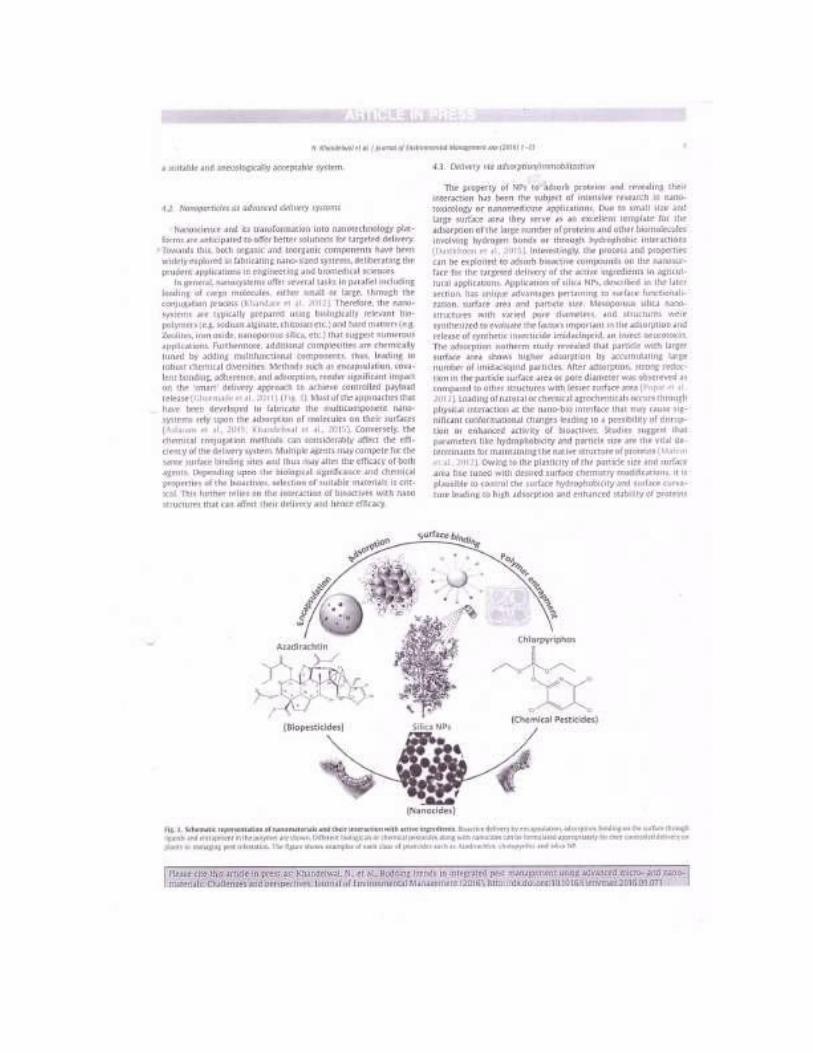
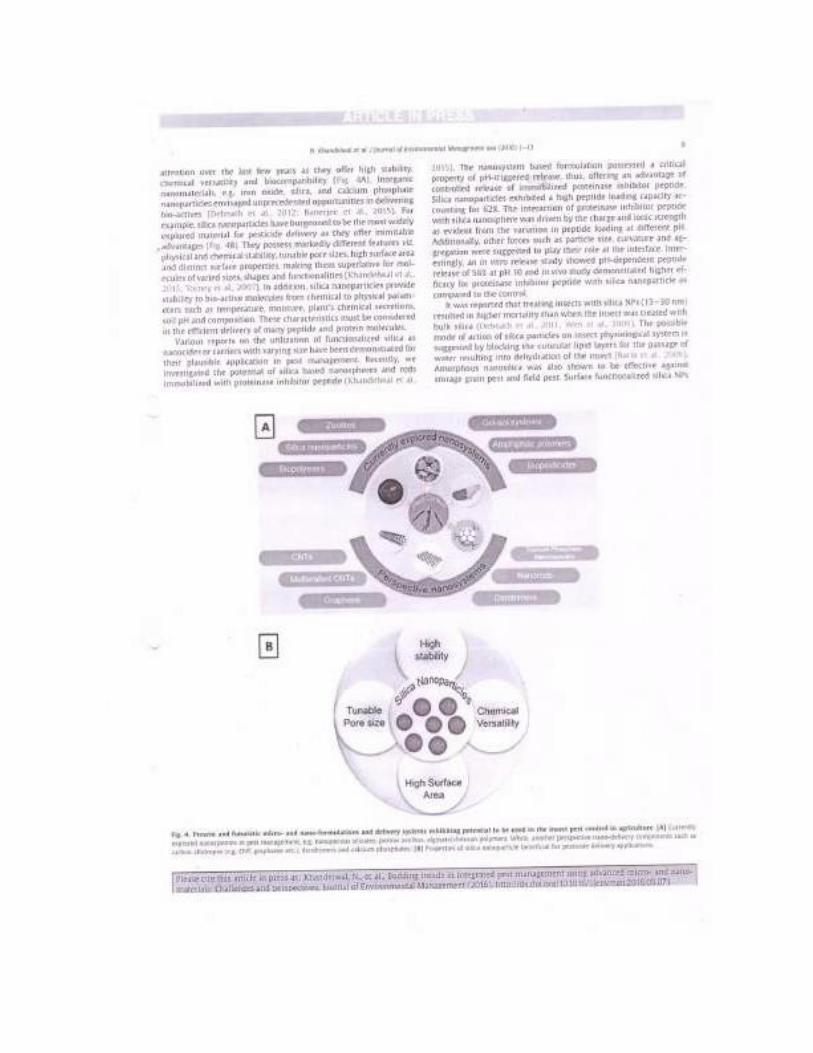
1 3
Novel Concept of Attaching Endoscope Holder to Microscope for Two Handed Endoscopic Tympanoplasty
Mubarak M. Khan1 • Sapna R. Parab1
Received: 6 July 2015 / Accepted: 17 September 2015 / Published online: 6 November 2015
© Association of Otolaryngologists of India 2015
Abstract The well established techniques in tym-
panoplasty are routinely performed with operating micro-
scopes for many decades now. Endoscopic ear surgeries
provide minimally invasive approach to the middle ear and
evolving new science in the field of otology. The disad-
vantage of endoscopic ear surgeries is that it is one-handed
surgical technique as the non-dominant left hand of the
surgeon is utilized for holding and manipulating the
endoscope. This necessitated the need for development of
the endoscope holder which would allow both hands of
surgeon to be free for surgical manipulation and also allow
alternate use of microscope during tympanoplasty. To
report the preliminary utility of our designed and devel-
oped endoscope holder attachment gripping to microscope
for two handed technique of endoscopic tympanoplasty.
Prospective Non Randomized Clinical Study. Our endo-
scope holder attachment for microscope was designed and
developed to aid in endoscopic ear surgery and to over-
come the disadvantage of single handed endoscopic sur-
gery. It was tested for endoscopic Tympanoplasty. The
design of the endoscope holder attachment is described in
detail along with its manipulation and manoeuvreing. A
total of 78 endoholder assisted type 1 endoscopic cartilage
tympanoplasties were operated to evaluate its feasibility for
the two handed technique and to evaluate the results of
endoscopic type 1 cartilage tympanoplasty. In early follow
Electronic supplementary material The online version of this article (doi:10.1007/s12070-015-0916-6) contains supplementary material, which is available to authorized users.
& Mubarak M. Khan
[email protected]; [email protected]
1 Department of Otorhinolaryngology, M.I.M.E.R. Medical
College, Pune 410507, India
up period ranging from 6 to 20 months, the graft uptake
was seen in 76 ears with one residual perforation and 1
recurrent perforations giving a success rate of 97.435 %.
Our endocsope holder attachment for gripping microscope
is a good option for two handed technique in endoscopic
type 1 cartilage tympanoplasty. The study reports the
successful application and use of our endoscope holder
attachment for gripping microscope in two handed tech-
nique of endoscopic type 1 cartilage tympanoplasty and
comparable results with microscopic techniques.
Level of evidence: IV.
Keywords Justtach · Endoscope holder ·
Endoscopic cartilage tympanoplasty
Introduction
Endoscopic surgeries have gained popularity not only in
Otolaryngology but also in other surgical fields. Endo-
scopes and the Hopkins rod lens system have revolution-
ized the medical field in last half century. Endoscopic
approach for paranasal sinuses is well known. The well
established techniques in tympanoplasty are routinely
performed with operating microscopes for many decades
now. Endoscopic ear surgeries provide minimally invasive
approach to the middle ear and evolving new science in the
field of otology which is in its nascent stage. Migrating
from classical Wullstein’s microscopic tympanoplasty
techniques to endoscopic tympanoplasty techniques is slow
and tough but still a new horizon rising in the field of
otology. Rigid endoscopes have been used by otorhino-
laryngologists for sinus surgery and recently even for
otologic surgeries. The advantages of endoscopic sinus
surgeries are well known. In otologic surgery too,
Indian J Otolaryngol Head Neck Surg
(Apr–June 2016) 68(2):230–240; DOI 10.1007/s12070-015-0916-6
ORIGINAL ARTICLE
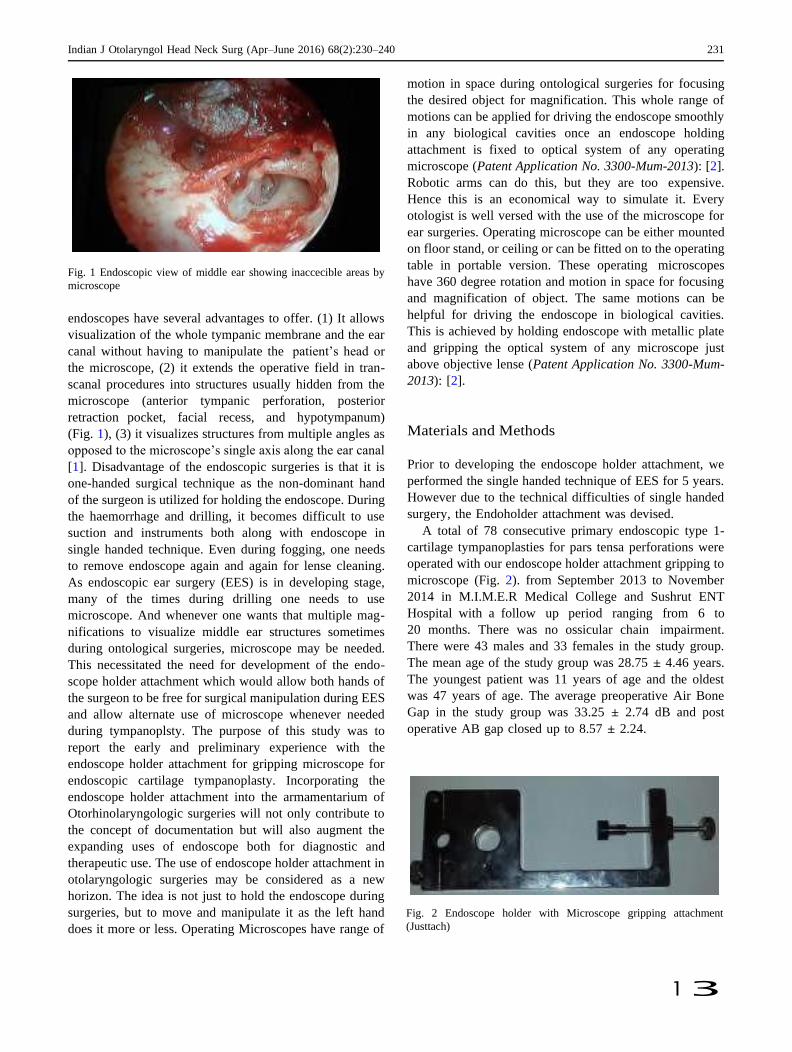
1 3
Indian J Otolaryngol Head Neck Surg (Apr–June 2016) 68(2):230–240 231
Fig. 1 Endoscopic view of middle ear showing inaccecible areas by
microscope
endoscopes have several advantages to offer. (1) It allows
visualization of the whole tympanic membrane and the ear
canal without having to manipulate the patient’s head or
the microscope, (2) it extends the operative field in tran-
scanal procedures into structures usually hidden from the
microscope (anterior tympanic perforation, posterior
retraction pocket, facial recess, and hypotympanum)
(Fig. 1), (3) it visualizes structures from multiple angles as
opposed to the microscope’s single axis along the ear canal
[1]. Disadvantage of the endoscopic surgeries is that it is
one-handed surgical technique as the non-dominant hand
of the surgeon is utilized for holding the endoscope. During
the haemorrhage and drilling, it becomes difficult to use
suction and instruments both along with endoscope in
single handed technique. Even during fogging, one needs
to remove endoscope again and again for lense cleaning.
As endoscopic ear surgery (EES) is in developing stage,
many of the times during drilling one needs to use
microscope. And whenever one wants that multiple mag-
nifications to visualize middle ear structures sometimes
during ontological surgeries, microscope may be needed.
This necessitated the need for development of the endo-
scope holder attachment which would allow both hands of
the surgeon to be free for surgical manipulation during EES
and allow alternate use of microscope whenever needed
during tympanoplsty. The purpose of this study was to
report the early and preliminary experience with the
endoscope holder attachment for gripping microscope for
endoscopic cartilage tympanoplasty. Incorporating the
endoscope holder attachment into the armamentarium of
Otorhinolaryngologic surgeries will not only contribute to
the concept of documentation but will also augment the
expanding uses of endoscope both for diagnostic and
therapeutic use. The use of endoscope holder attachment in
otolaryngologic surgeries may be considered as a new
horizon. The idea is not just to hold the endoscope during
surgeries, but to move and manipulate it as the left hand
does it more or less. Operating Microscopes have range of
motion in space during ontological surgeries for focusing
the desired object for magnification. This whole range of
motions can be applied for driving the endoscope smoothly
in any biological cavities once an endoscope holding
attachment is fixed to optical system of any operating
microscope (Patent Application No. 3300-Mum-2013): [2].
Robotic arms can do this, but they are too expensive.
Hence this is an economical way to simulate it. Every
otologist is well versed with the use of the microscope for
ear surgeries. Operating microscope can be either mounted
on floor stand, or ceiling or can be fitted on to the operating
table in portable version. These operating microscopes
have 360 degree rotation and motion in space for focusing
and magnification of object. The same motions can be
helpful for driving the endoscope in biological cavities.
This is achieved by holding endoscope with metallic plate
and gripping the optical system of any microscope just
above objective lense (Patent Application No. 3300-Mum-
2013): [2].
Materials and Methods
Prior to developing the endoscope holder attachment, we
performed the single handed technique of EES for 5 years.
However due to the technical difficulties of single handed
surgery, the Endoholder attachment was devised.
A total of 78 consecutive primary endoscopic type 1-
cartilage tympanoplasties for pars tensa perforations were
operated with our endoscope holder attachment gripping to
microscope (Fig. 2). from September 2013 to November
2014 in M.I.M.E.R Medical College and Sushrut ENT
Hospital with a follow up period ranging from 6 to
20 months. There was no ossicular chain impairment.
There were 43 males and 33 females in the study group.
The mean age of the study group was 28.75 ± 4.46 years.
The youngest patient was 11 years of age and the oldest
was 47 years of age. The average preoperative Air Bone
Gap in the study group was 33.25 ± 2.74 dB and post
operative AB gap closed up to 8.57 ± 2.24.
Fig. 2 Endoscope holder with Microscope gripping attachment
(Justtach)

232 Indian J Otolaryngol Head Neck Surg (Apr–June 2016) 68(2):230–240
1 3
Design of Our Endoscope Holder Attachment
to Microscope (Patent Application No. 3300-Mum-
2013): [2]
The object of the present innovation is to create a device of
simple construction, and therefore low cost, which makes it
possible
(a) To easily hold any rigid endoscope to any medical
operating microscope’s optical body
(b) To use endoscope and operating microscope alter-
nately during surgery
The innovation achieves this objective by using a piece
of a metallic plate of 170 9 70 9 12 mm in dimensions
with a circular slot measuring 16 9 16 mm in diameter
(Fig. 3C) and square slot (Fig. 3A) is rigid endoscopic
holder can be affixed to optical system of any operating
ENT microscope with 1 tightening screw (Fig. 3B) with
the optical observation instrument of the microscope intact.
Fig. 3 Diagrams of endoscope
holder with Microscope
gripping attachment (Justtach)
submitted to patent office
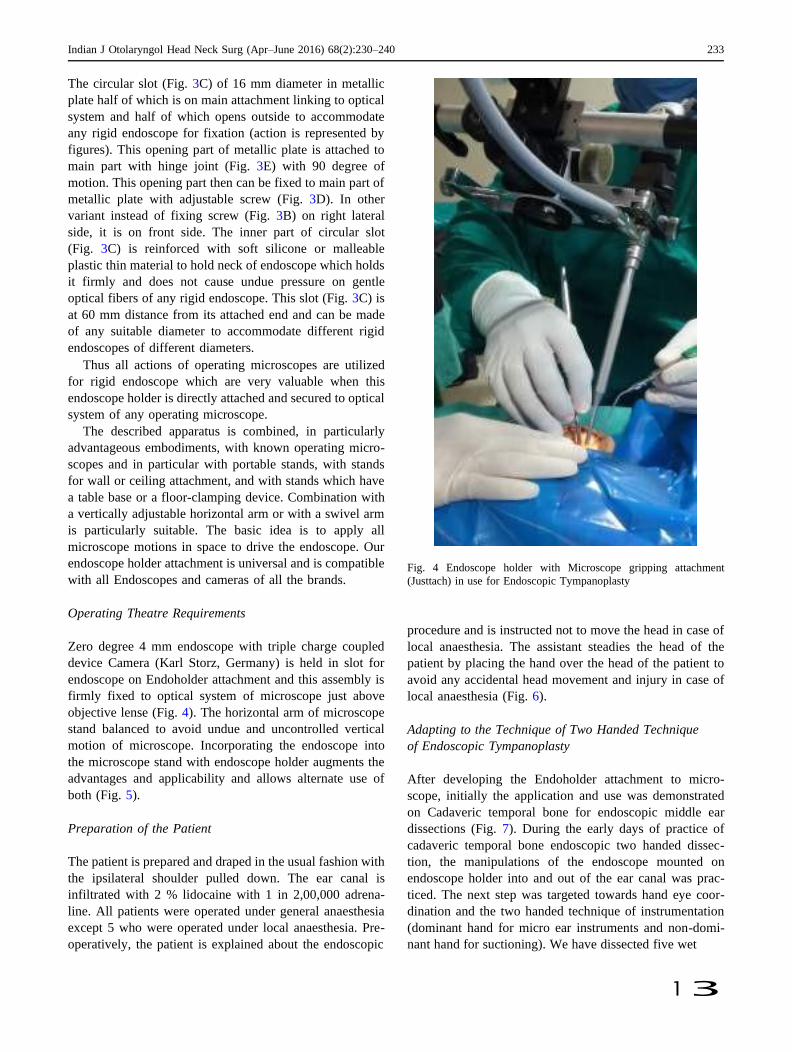
Indian J Otolaryngol Head Neck Surg (Apr–June 2016) 68(2):230–240 233
1 3
The circular slot (Fig. 3C) of 16 mm diameter in metallic
plate half of which is on main attachment linking to optical
system and half of which opens outside to accommodate
any rigid endoscope for fixation (action is represented by
figures). This opening part of metallic plate is attached to
main part with hinge joint (Fig. 3E) with 90 degree of
motion. This opening part then can be fixed to main part of
metallic plate with adjustable screw (Fig. 3D). In other
variant instead of fixing screw (Fig. 3B) on right lateral
side, it is on front side. The inner part of circular slot
(Fig. 3C) is reinforced with soft silicone or malleable
plastic thin material to hold neck of endoscope which holds
it firmly and does not cause undue pressure on gentle
optical fibers of any rigid endoscope. This slot (Fig. 3C) is
at 60 mm distance from its attached end and can be made
of any suitable diameter to accommodate different rigid
endoscopes of different diameters.
Thus all actions of operating microscopes are utilized
for rigid endoscope which are very valuable when this
endoscope holder is directly attached and secured to optical
system of any operating microscope.
The described apparatus is combined, in particularly
advantageous embodiments, with known operating micro-
scopes and in particular with portable stands, with stands
for wall or ceiling attachment, and with stands which have
a table base or a floor-clamping device. Combination with
a vertically adjustable horizontal arm or with a swivel arm
is particularly suitable. The basic idea is to apply all
microscope motions in space to drive the endoscope. Our
endoscope holder attachment is universal and is compatible
with all Endoscopes and cameras of all the brands.
Operating Theatre Requirements
Zero degree 4 mm endoscope with triple charge coupled
device Camera (Karl Storz, Germany) is held in slot for
endoscope on Endoholder attachment and this assembly is
firmly fixed to optical system of microscope just above
objective lense (Fig. 4). The horizontal arm of microscope
stand balanced to avoid undue and uncontrolled vertical
motion of microscope. Incorporating the endoscope into
the microscope stand with endoscope holder augments the
advantages and applicability and allows alternate use of
both (Fig. 5).
Preparation of the Patient
The patient is prepared and draped in the usual fashion with
the ipsilateral shoulder pulled down. The ear canal is
infiltrated with 2 % lidocaine with 1 in 2,00,000 adrena-
line. All patients were operated under general anaesthesia
except 5 who were operated under local anaesthesia. Pre-
operatively, the patient is explained about the endoscopic
Fig. 4 Endoscope holder with Microscope gripping attachment
(Justtach) in use for Endoscopic Tympanoplasty
procedure and is instructed not to move the head in case of
local anaesthesia. The assistant steadies the head of the
patient by placing the hand over the head of the patient to
avoid any accidental head movement and injury in case of
local anaesthesia (Fig. 6).
Adapting to the Technique of Two Handed Technique
of Endoscopic Tympanoplasty
After developing the Endoholder attachment to micro-
scope, initially the application and use was demonstrated
on Cadaveric temporal bone for endoscopic middle ear
dissections (Fig. 7). During the early days of practice of
cadaveric temporal bone endoscopic two handed dissec-
tion, the manipulations of the endoscope mounted on
endoscope holder into and out of the ear canal was prac-
ticed. The next step was targeted towards hand eye coor-
dination and the two handed technique of instrumentation
(dominant hand for micro ear instruments and non-domi-
nant hand for suctioning). We have dissected five wet
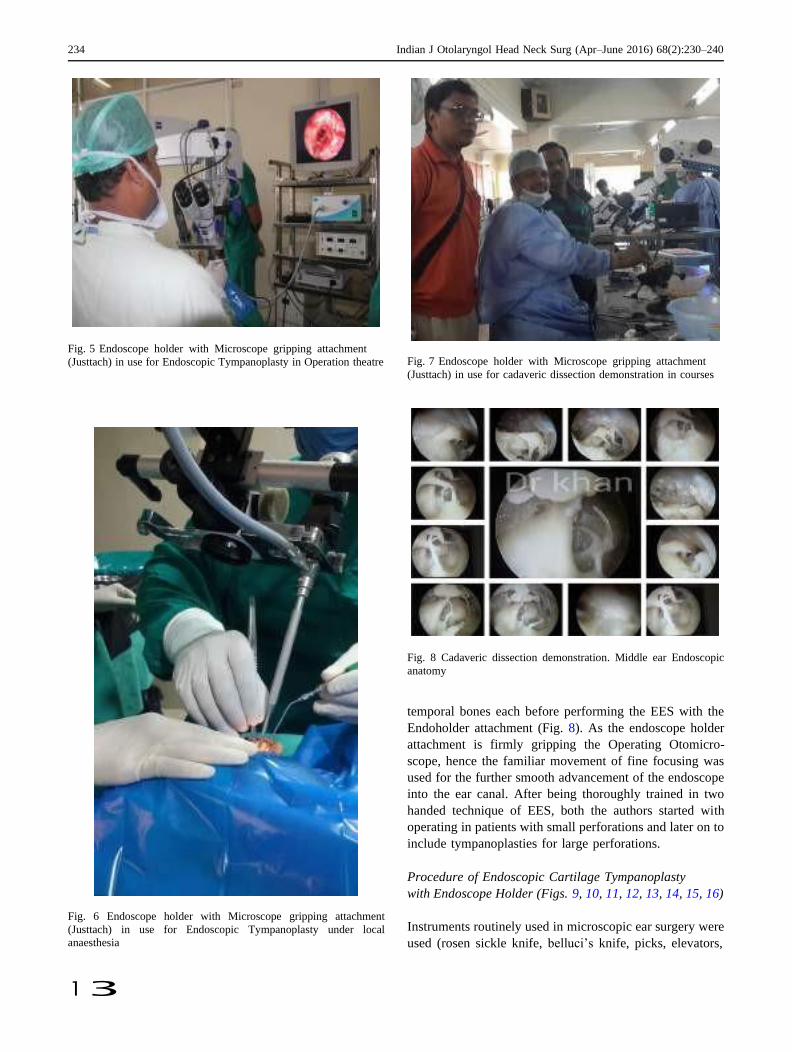
234 Indian J Otolaryngol Head Neck Surg (Apr–June 2016) 68(2):230–240
1 3
Fig. 5 Endoscope holder with Microscope gripping attachment
(Justtach) in use for Endoscopic Tympanoplasty in Operation theatre
Fig. 7 Endoscope holder with Microscope gripping attachment
(Justtach) in use for cadaveric dissection demonstration in courses
Fig. 6 Endoscope holder with Microscope gripping attachment
(Justtach) in use for Endoscopic Tympanoplasty under local
anaesthesia
Fig. 8 Cadaveric dissection demonstration. Middle ear Endoscopic
anatomy
temporal bones each before performing the EES with the
Endoholder attachment (Fig. 8). As the endoscope holder
attachment is firmly gripping the Operating Otomicro-
scope, hence the familiar movement of fine focusing was
used for the further smooth advancement of the endoscope
into the ear canal. After being thoroughly trained in two
handed technique of EES, both the authors started with
operating in patients with small perforations and later on to
include tympanoplasties for large perforations.
Procedure of Endoscopic Cartilage Tympanoplasty
with Endoscope Holder (Figs. 9, 10, 11, 12, 13, 14, 15, 16)
Instruments routinely used in microscopic ear surgery were
used (rosen sickle knife, belluci’s knife, picks, elevators,
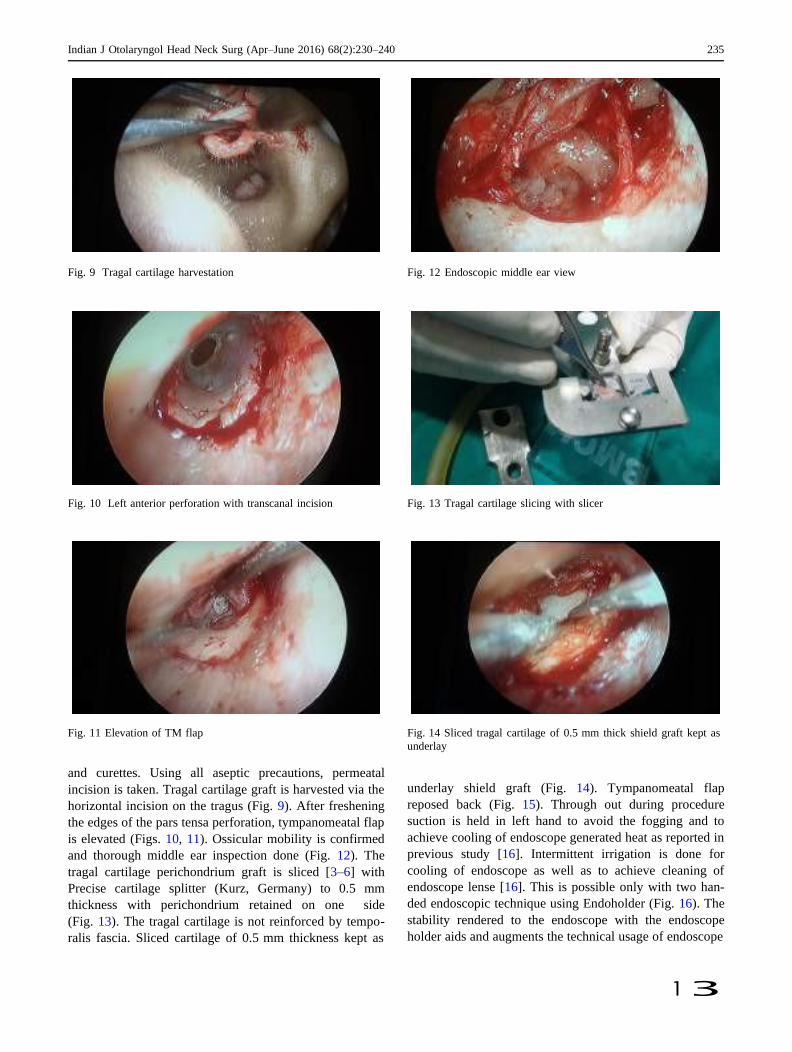
Indian J Otolaryngol Head Neck Surg (Apr–June 2016) 68(2):230–240 235
1 3
Fig. 9 Tragal cartilage harvestation Fig. 12 Endoscopic middle ear view
Fig. 10 Left anterior perforation with transcanal incision Fig. 13 Tragal cartilage slicing with slicer
Fig. 11 Elevation of TM flap Fig. 14 Sliced tragal cartilage of 0.5 mm thick shield graft kept as
underlay
and curettes. Using all aseptic precautions, permeatal
incision is taken. Tragal cartilage graft is harvested via the
horizontal incision on the tragus (Fig. 9). After freshening
the edges of the pars tensa perforation, tympanomeatal flap
is elevated (Figs. 10, 11). Ossicular mobility is confirmed
and thorough middle ear inspection done (Fig. 12). The
tragal cartilage perichondrium graft is sliced [3–6] with
Precise cartilage splitter (Kurz, Germany) to 0.5 mm
thickness with perichondrium retained on one side
(Fig. 13). The tragal cartilage is not reinforced by tempo-
ralis fascia. Sliced cartilage of 0.5 mm thickness kept as
underlay shield graft (Fig. 14). Tympanomeatal flap
reposed back (Fig. 15). Through out during procedure
suction is held in left hand to avoid the fogging and to
achieve cooling of endoscope generated heat as reported in
previous study [16]. Intermittent irrigation is done for
cooling of endoscope as well as to achieve cleaning of
endoscope lense [16]. This is possible only with two han-
ded endoscopic technique using Endoholder (Fig. 16). The
stability rendered to the endoscope with the endoscope
holder aids and augments the technical usage of endoscope
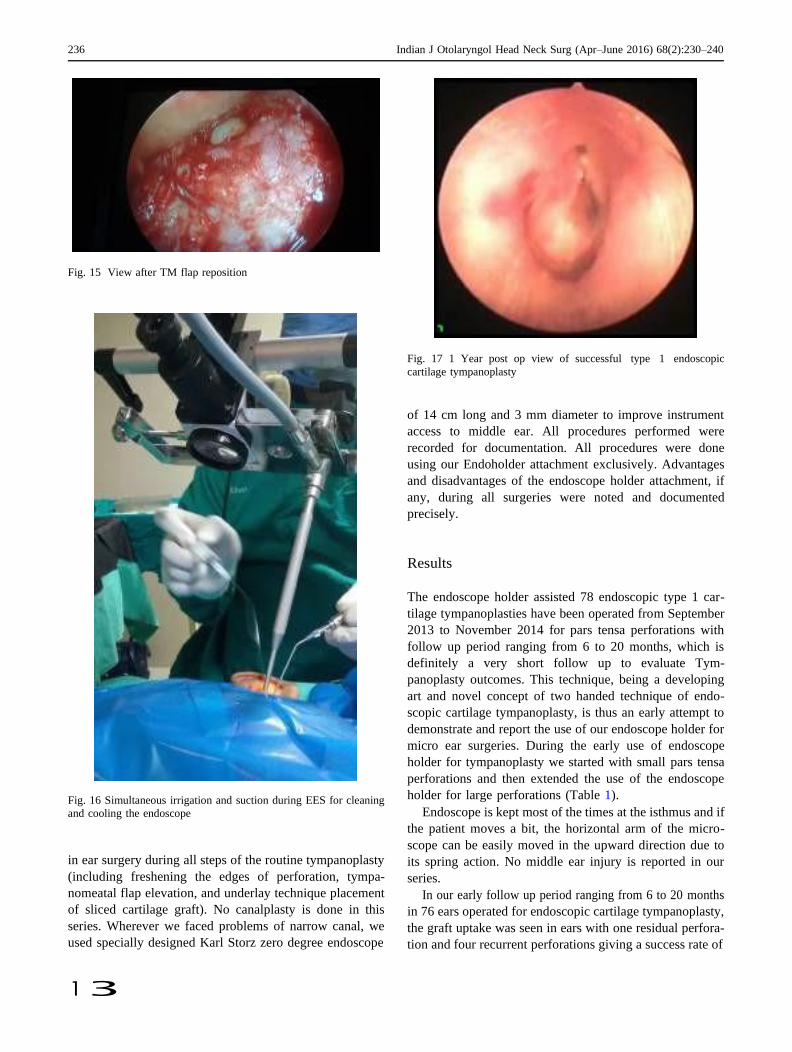
236 Indian J Otolaryngol Head Neck Surg (Apr–June 2016) 68(2):230–240
1 3
Fig. 15 View after TM flap reposition
Fig. 16 Simultaneous irrigation and suction during EES for cleaning
and cooling the endoscope
in ear surgery during all steps of the routine tympanoplasty
(including freshening the edges of perforation, tympa-
nomeatal flap elevation, and underlay technique placement
of sliced cartilage graft). No canalplasty is done in this
series. Wherever we faced problems of narrow canal, we
used specially designed Karl Storz zero degree endoscope
Fig. 17 1 Year post op view of successful type 1 endoscopic
cartilage tympanoplasty
of 14 cm long and 3 mm diameter to improve instrument
access to middle ear. All procedures performed were
recorded for documentation. All procedures were done
using our Endoholder attachment exclusively. Advantages
and disadvantages of the endoscope holder attachment, if
any, during all surgeries were noted and documented
precisely.
Results
The endoscope holder assisted 78 endoscopic type 1 car-
tilage tympanoplasties have been operated from September
2013 to November 2014 for pars tensa perforations with
follow up period ranging from 6 to 20 months, which is
definitely a very short follow up to evaluate Tym-
panoplasty outcomes. This technique, being a developing
art and novel concept of two handed technique of endo-
scopic cartilage tympanoplasty, is thus an early attempt to
demonstrate and report the use of our endoscope holder for
micro ear surgeries. During the early use of endoscope
holder for tympanoplasty we started with small pars tensa
perforations and then extended the use of the endoscope
holder for large perforations (Table 1).
Endoscope is kept most of the times at the isthmus and if
the patient moves a bit, the horizontal arm of the micro-
scope can be easily moved in the upward direction due to
its spring action. No middle ear injury is reported in our
series.
In our early follow up period ranging from 6 to 20 months
in 76 ears operated for endoscopic cartilage tympanoplasty,
the graft uptake was seen in ears with one residual perfora-
tion and four recurrent perforations giving a success rate of
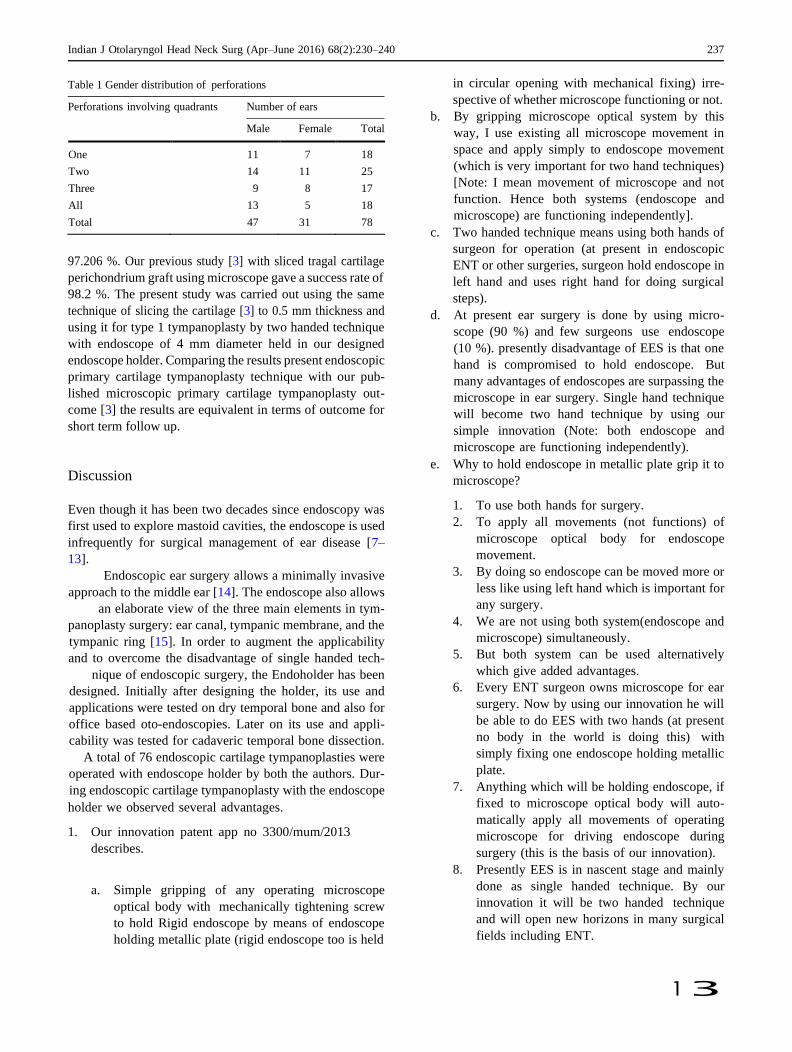
Indian J Otolaryngol Head Neck Surg (Apr–June 2016) 68(2):230–240 237
1 3
Table 1 Gender distribution of perforations
Perforations involving quadrants Number of ears
Male Female Total
One 11 7 18
Two 14 11 25
Three 9 8 17
All 13 5 18
Total 47 31 78
97.206 %. Our previous study [3] with sliced tragal cartilage
perichondrium graft using microscope gave a success rate of
98.2 %. The present study was carried out using the same
technique of slicing the cartilage [3] to 0.5 mm thickness and
using it for type 1 tympanoplasty by two handed technique
with endoscope of 4 mm diameter held in our designed
endoscope holder. Comparing the results present endoscopic
primary cartilage tympanoplasty technique with our pub-
lished microscopic primary cartilage tympanoplasty out-
come [3] the results are equivalent in terms of outcome for
short term follow up.
Discussion
Even though it has been two decades since endoscopy was
first used to explore mastoid cavities, the endoscope is used
infrequently for surgical management of ear disease [7–
13].
Endoscopic ear surgery allows a minimally invasive
approach to the middle ear [14]. The endoscope also allows
an elaborate view of the three main elements in tym-
panoplasty surgery: ear canal, tympanic membrane, and the
tympanic ring [15]. In order to augment the applicability
and to overcome the disadvantage of single handed tech-
nique of endoscopic surgery, the Endoholder has been
designed. Initially after designing the holder, its use and
applications were tested on dry temporal bone and also for
office based oto-endoscopies. Later on its use and appli-
cability was tested for cadaveric temporal bone dissection.
A total of 76 endoscopic cartilage tympanoplasties were
operated with endoscope holder by both the authors. Dur-
ing endoscopic cartilage tympanoplasty with the endoscope
holder we observed several advantages.
1. Our innovation patent app no 3300/mum/2013
describes.
a. Simple gripping of any operating microscope
optical body with mechanically tightening screw
to hold Rigid endoscope by means of endoscope
holding metallic plate (rigid endoscope too is held
in circular opening with mechanical fixing) irre-
spective of whether microscope functioning or not.
b. By gripping microscope optical system by this
way, I use existing all microscope movement in
space and apply simply to endoscope movement
(which is very important for two hand techniques)
[Note: I mean movement of microscope and not
function. Hence both systems (endoscope and
microscope) are functioning independently].
c. Two handed technique means using both hands of
surgeon for operation (at present in endoscopic
ENT or other surgeries, surgeon hold endoscope in
left hand and uses right hand for doing surgical
steps).
d. At present ear surgery is done by using micro-
scope (90 %) and few surgeons use endoscope
(10 %). presently disadvantage of EES is that one
hand is compromised to hold endoscope. But
many advantages of endoscopes are surpassing the
microscope in ear surgery. Single hand technique
will become two hand technique by using our
simple innovation (Note: both endoscope and
microscope are functioning independently).
e. Why to hold endoscope in metallic plate grip it to
microscope?
1. To use both hands for surgery.
2. To apply all movements (not functions) of
microscope optical body for endoscope
movement.
3. By doing so endoscope can be moved more or
less like using left hand which is important for
any surgery.
4. We are not using both system(endoscope and
microscope) simultaneously.
5. But both system can be used alternatively
which give added advantages.
6. Every ENT surgeon owns microscope for ear
surgery. Now by using our innovation he will
be able to do EES with two hands (at present
no body in the world is doing this) with
simply fixing one endoscope holding metallic
plate.
7. Anything which will be holding endoscope, if
fixed to microscope optical body will auto-
matically apply all movements of operating
microscope for driving endoscope during
surgery (this is the basis of our innovation).
8. Presently EES is in nascent stage and mainly
done as single handed technique. By our
innovation it will be two handed technique
and will open new horizons in many surgical
fields including ENT.
238 Indian J Otolaryngol Head Neck Surg (Apr–June 2016) 68(2):230–240
1 3
9. Possibly after my demonstration in many
congresses, microscope manufacturers may
provide inbuilt metallic plate which will be
holding endoscope (very simple but nobody
thought till this date. Our innovation describe
this firstly).
10. Considering the many advantages of two
handed technique in endoscopic surgery, our
innovation is discovery of new thing which
was unknown till this date and very much
applicable in many areas.
f. Our simple innovation is ‘‘holding rigid endoscope
in metallic plate or by any other means and fixing
it to operating microscope’’ the benefits are
described in patent.
g. At present endoscopic Ear Nose Throat surgery or
any other endoscopic surgery is carried out by
holding rigid endoscope in left hand and operating
with right hand. Our innovation will allow both
hands to be used for surgery as endoscope is held
metallic plate and secured to microscope. This
allows application of all movements of micro-
scope to endoscope.
h. Alternately means when I want to operate with
endoscope I may use endoscope and when micro-
scope, I will use microscope. Note here I am not
using both the instruments simultaneously as
described in many patents.
i. In simple ways: hold the rigid endoscope and
secure it by fixing to microscope optical head for
applying all its only mechanical movements to
endoscope as your left hand does during holding
endoscope for surgery.
j. All present patents describes simultaneous obser-
vation through endoscope and microscope. My
purpose is different. Just applying microscope
movements to rigid endoscope moving.
k. To summarize:
1. Simple innovation of holding endoscope in
metallic plate and fixing it to microscope
optical body.
2. By doing this idea is to use all microscope
mechanical movements not functions for
movement of endoscope in space.
3. Instead of developing separate stand to hold
endoscope, it can be held as described in our
innovation. Thus a very cheap but beneficial
alternative.
4. Contemporary single handed technique in
EES will be two handed technique.
5. Both systems (endoscope and Microscope)
works independently with their own
advantages and disadvantage and not remo-
tely related functionally. Only implementation
of microscope stand actions for driving endo-
scope in space mechanically during surgery.
Advantages of Our Endoscope Holder
1. Both the hands of the surgeon are free for operative
intervention which is of paramount importance both
for diagnostic and operative procedure.
2. When angled endoscope (30°, 45°, 70°) is mounted on
the endoscope holder allows better visualisation of
sinus tympani, facial recess, anterior tympanic cavity
and hypotympanum with just rotation of the endoscope
within the Holder.
3. The elevation of the tympanomeatal flap and tympanic
membrane assessment is much better as the left hand
holds the suction cannula continuously (similar to
Microscope ear surgery).
4. It can be used effectively without compromising the
surgical field.
5. As an effective alternative for documentation and a
useful teaching aid.
6. As endoscope is fixed onto the holder, the stability of
the endoscope, camera and image on the monitor is
ensured throughout.
7. Minimizes the need for assistance.
8. No surgeon fatigue in holding the endoscope as the
endoscope is fixed on the endoscope holder (as
compared with single handed EES).
9. As the endoholder attachment is mounted on optical
system of Microscope Stand, the fine focus of the
microscopic stand can be utilized for additional
manipulation/advancing into the external auditory
canal.
10. Mastoid bandage is not required.
11. Success rate is equivalent in early follow up
compared to microscopic technique [3] as the place-
ment of graft is more precise due to the total view of
the tympanic membrane (Fig. 17).
12. Fogging of the endoscope is avoided by use of
suction cannula.
13. Canalplasty can be done with the drill in the right
hand and suction in the left hand.
14. As endoscope and microscope are on same platform,
the alternate use of both is possible. This is very
much necessary for initial training in EES.
Disadvantages
1. At times, narrow canal can pose difficulty during
endoscopic tympanoplasty, but can be circumvented
Indian J Otolaryngol Head Neck Surg (Apr–June 2016) 68(2):230–240 239
1 3
by canalplasty. In this series not a single canalplasty
was carried. We use specially designed Karl Storz
14 cm long, 3 mm diameter 0° endoscope in narrow
canal.
2. During hemorrhage, the manipulation of the endoscope
in and out of the operative field may be time
consuming.
3. Possible potential disadvantage is the thermal damage
to the middle ear due to endoscope light carrying fibres
has been reported previously and measures to avoid
excessive temperature elevation in EES has been
suggested [16]. This is circumvented by following
simple tecniques during the use of our endoholder
assisted transcanal two handed endoscopic tym-
panoplasty.
a. The endoscope is kept at a distance mostly at the
isthmus of external auditory canal.
b. Continuous suction is held in left hand during the
procedure as suggested in previous study [16].
c. Intermittent irrigation gives the cooling effect to
endoscope [16] and added cleaning of the tip of
the endoscope which avoids frequent its removal
for defogging and cooling as done in single handed
EES.
4. Overall cost of the endoscope holder in addition to the
routine ear instruments.
5. Care is to be taken to avoid accidental injury due to
head movement to the tip of the endoscope.
The learning curve for endoscope holder aided endoscopic
tympanoplasty may not as steep as that for routine endo-
scopic or microscopic surgery. Many experienced with
endoscopic surgeries will find the technique easy to master,
but surgeons who have limited themselves to an entirely
microscopic otology practice are likely to find endoscope
holder aided endoscopic surgery more difficult to perform.
Despite this, with sufficient training and practice the
technique may be adopted by all. It is important to
remember that the initial steps of the surgery are the most
difficult. Once comfortable with partial use of the endo-
scope holder movements and manipulation, most surgeons
may prefer to use the endoscope holder aided endoscopic
surgeries.
Extending the Use of Endoscope Holder for Ear Surgeries
At present we have demonstrated the early use of our
endoscope holder for tympanoplasty. The further use and
applicability of endoscope holder needs to be extended to
ossiculoplasty and mastoid surgeries. It will be useful to
collaborate and associate with other, more experienced
surgeons who are more familiar with endoscopic ear, sinus
and laryngeal surgeries to predict its consistent progress.
Conclusion
This Endoholder developed as a modification of micro-
scopic stand, incorporates the endoscope onto the micro-
scope stand and augments the applicability of the
endoscope into ENT practice. With little practice, endo-
scope holder can be used routinely in all ENT surgeries.
endoscope holder is a valuable adjunct to conventional
endoscopic surgeries. The technique though useful has a
different learning curve and training is useful to allow more
familiarity when getting started.
Compliance with Ethical Standards
Conflict of interest Application for Patent in respect of ‘‘Rigid
Endoscope Holder and Endoscope Fixing Method with Microscope
Gripping Attachment’’ bearing Application No. 3300/MUM/2013 in
the name of Dr. Mubarak Khan to Patent controller of India. And
‘‘JUSTTACH’’ is tradename secured for this. Dr Sapna Parab has
helped in preparing the manuscript and evaluated endoscopic holder
actively during various otolaryngological surgeries independently and
along with first author.
Ethical Approval All procedures performed in studies involving
human participants were in accordance with the ethical standards of
the institutional committee and with the 1964 Helsinki declaration
and its later amendments or comparable ethical standards.
Informed Concent Informed consent was obtained from all indi-
vidual participants included in the study.
References
1. Tarabichi M (1999) Endoscopic middle ear surgery. Ann Otol
Rhinol Laryngol 108(1):39–46
2. Khan MM, Parab SR (2014) Concept, design and development of
innovative endoscope holder system for endoscopic otolaryngo-
logical surgeries. Indian J Otolaryngol Head Neck Surg. doi:
10.1007/s12070-014-0738-y
3. Khan MM, Parab SR (2011) Primary cartilage tympanoplasty:
our technique and results. Am J Otolaryngol 32(5):381–387
4. Khan MM, Parab SR (2013) Reinforcement of sliced tragal car-
tilage perichondrium composite graft with temporalis fascia in
type I tympanoplasty: our techniques and results. J Rhinolaryng
Otol 1:57–62
5. Khan MM, Parab SR (2014) Sliced Island tragal cartilage peri-
chondrial composite graft: early results and experience. J Rhino-
laryng Otol 2:4–9
6. Khan MM, Parab SR (2015) Comparative study of sliced tragal
cartilage and temporalis fascia in type I tympanoplasty. J Laryn-
gol Otol 129(1):16–22
7. Tarabichi M. Endoscopic cholesteatoma, tympanoplasty and
middle ear. Open access atlas of otolaryngology, head and neck
operative surgery. https://vula.uct.ac.za/access/content/group/
ba5fb1bd-be95-48e5-81be-586fbaeba29d/Endoscopic%20chole

240 Indian J Otolaryngol Head Neck Surg (Apr–June 2016) 68(2):230–240
1 3
steatoma,%20tympanoplasty%20and%20middle%20ear%20sur
gery.pdf
8. Thomassin JM, Korchia D, Doris JM (1993) Endoscopic-guided
otosurgery in the prevention of residual cholesteatomas. Laryn-
goscope 103:939–943
9. Hawke M (1982) Telescopic otoscopy and photography of the
tympanic membrane. J Otolaryngol 11:35–39
10. Nomura Y (1982) Effective photography in otolaryngology-head
and neck surgery: endoscopic photography of the middle ear.
Otolaryngol Head Neck Surg 90:395–398
11. Takahashi H, Honjo I, Fujita A, Kurata K (1990) Transtympanic
endoscopic findings in patients with otitis media with effusion.
Arch Otolaryngol Head Neck Surg 116:1186–1189
12. Poe DS, Bottrill ID (1994) Comparison of endoscopic and sur-
gical explorations for perilymphatic fistulas. Am J Otol 15:735–
738
13. McKennan KX (1993) Endoscopic ‘second look’ mastoidoscopy
to rule out residual epitympanic/mastoid cholesteatoma. Laryn-
goscope 103:810–814
14. Pothier D (2013) Introducing endoscopic ear surgery into prac-
tice. Otolaryngol Clin N Am 46(2):245–255
15. Tarabichi M (2010) Endoscopic transcanal middle ear surgery.
Indian J Otolaryngol Head Neck Surg 62(1):6–24
16. Kozin ED, Lehman A, Carter M et al (2014) Thermal effects of
endoscopy in a human temporal bone model: implications for
endoscopic ear surgery. Laryngoscope 124(8):E332–E339
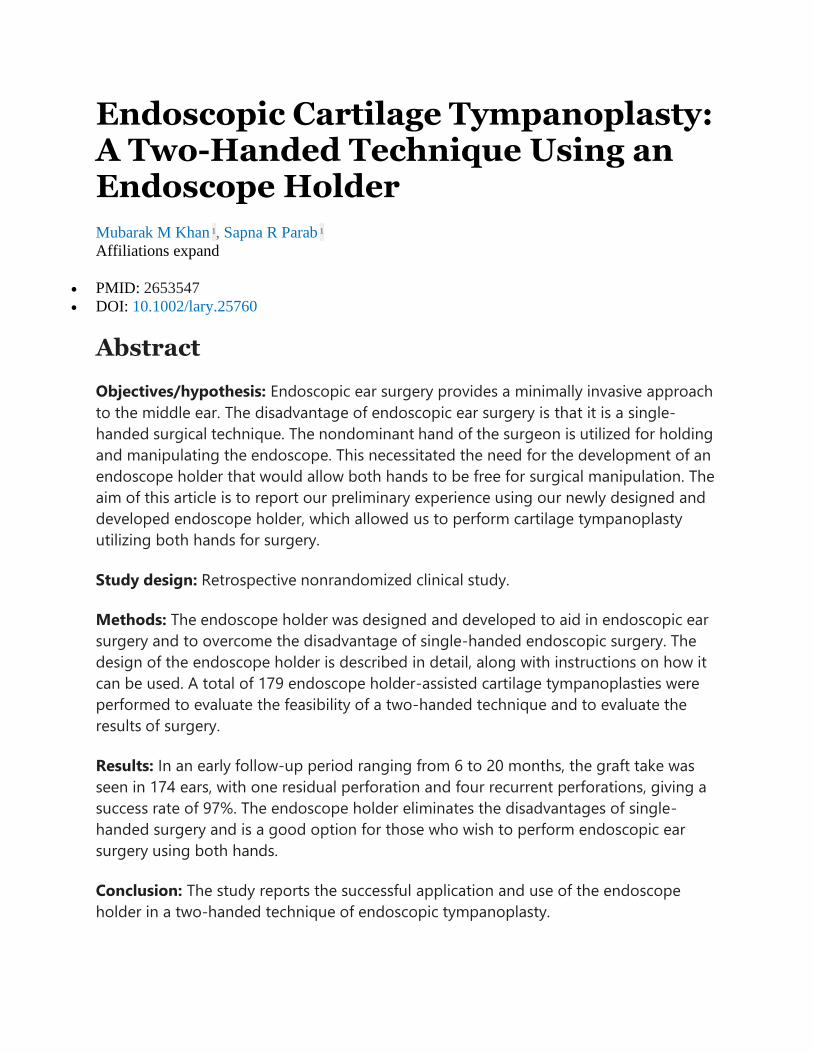
Endoscopic Cartilage Tympanoplasty: A Two-Handed Technique Using an Endoscope Holder
Mubarak M Khan 1, Sapna R Parab 1
Affiliations expand
• PMID: 2653547
• DOI: 10.1002/lary.25760
Abstract
Objectives/hypothesis: Endoscopic ear surgery provides a minimally invasive approach
to the middle ear. The disadvantage of endoscopic ear surgery is that it is a single-
handed surgical technique. The nondominant hand of the surgeon is utilized for holding
and manipulating the endoscope. This necessitated the need for the development of an
endoscope holder that would allow both hands to be free for surgical manipulation. The
aim of this article is to report our preliminary experience using our newly designed and
developed endoscope holder, which allowed us to perform cartilage tympanoplasty
utilizing both hands for surgery.
Study design: Retrospective nonrandomized clinical study.
Methods: The endoscope holder was designed and developed to aid in endoscopic ear
surgery and to overcome the disadvantage of single-handed endoscopic surgery. The
design of the endoscope holder is described in detail, along with instructions on how it
can be used. A total of 179 endoscope holder-assisted cartilage tympanoplasties were
performed to evaluate the feasibility of a two-handed technique and to evaluate the
results of surgery.
Results: In an early follow-up period ranging from 6 to 20 months, the graft take was
seen in 174 ears, with one residual perforation and four recurrent perforations, giving a
success rate of 97%. The endoscope holder eliminates the disadvantages of single-
handed surgery and is a good option for those who wish to perform endoscopic ear
surgery using both hands.
Conclusion: The study reports the successful application and use of the endoscope
holder in a two-handed technique of endoscopic tympanoplasty.

Level of evidence: 4. Laryngoscope, 126:1893-1898, 2016.
Keywords: Endoscope holder; endoscopic cartilage tympanoplasty.
© 2015 The American Laryngological, Rhinological and Otological Society, Inc.
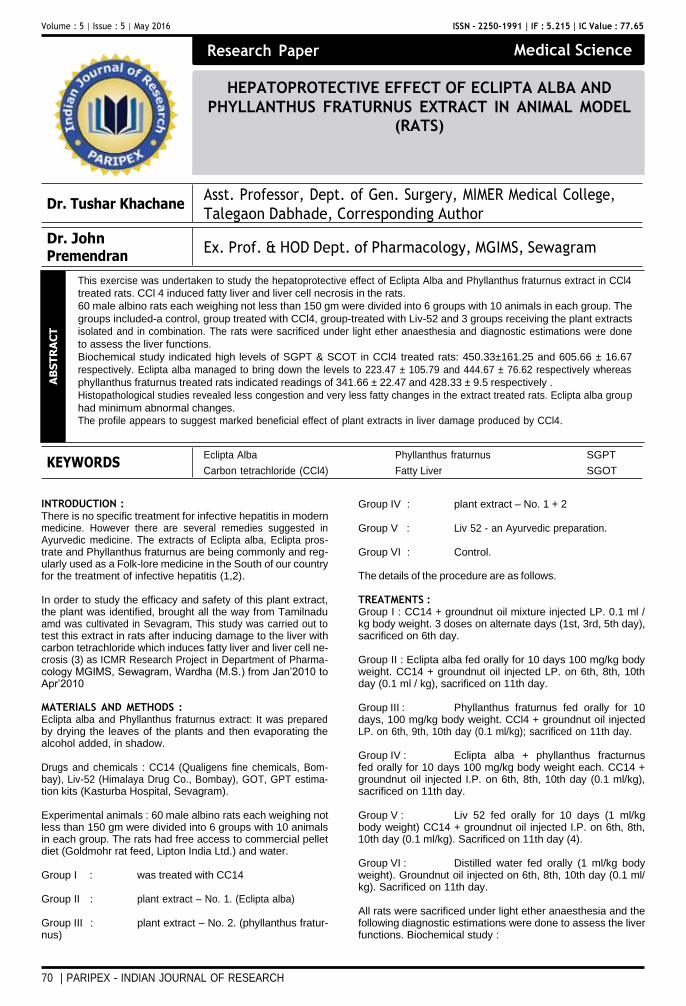
70 | PARIPEX - INDIAN JOURNAL OF RESEARCH
Research Paper Medical Science
Volume : 5 | Issue : 5 | May 2016 ISSN - 2250-1991 | IF : 5.215 | IC Value : 77.65
Dr. Tushar Khachane
Dr. John Premendran
Asst. Professor, Dept. of Gen. Surgery, MIMER Medical College,
Talegaon Dabhade, Corresponding Author
Ex. Prof. & HOD Dept. of Pharmacology, MGIMS, Sewagram
This exercise was undertaken to study the hepatoprotective effect of Eclipta Alba and Phyllanthus fraturnus extract in CCl4
treated rats. CCl 4 induced fatty liver and liver cell necrosis in the rats.
60 male albino rats each weighing not less than 150 gm were divided into 6 groups with 10 animals in each group. The
groups included-a control, group treated with CCl4, group-treated with Liv-52 and 3 groups receiving the plant extracts
isolated and in combination. The rats were sacrificed under light ether anaesthesia and diagnostic estimations were done
to assess the liver functions.
Biochemical study indicated high levels of SGPT & SCOT in CCl4 treated rats: 450.33±161.25 and 605.66 ± 16.67
respectively. Eclipta alba managed to bring down the levels to 223.47 ± 105.79 and 444.67 ± 76.62 respectively whereas
phyllanthus fraturnus treated rats indicated readings of 341.66 ± 22.47 and 428.33 ± 9.5 respectively .
Histopathological studies revealed less congestion and very less fatty changes in the extract treated rats. Eclipta alba group
had minimum abnormal changes.
The profile appears to suggest marked beneficial effect of plant extracts in liver damage produced by CCl4.
Eclipta Alba Phyllanthus fraturnus SGPT
Carbon tetrachloride (CCl4) Fatty Liver SGOT
INTRODUCTION : There is no specific treatment for infective hepatitis in modern medicine. However there are several remedies suggested in Ayurvedic medicine. The extracts of Eclipta alba, Eclipta pros- trate and Phyllanthus fraturnus are being commonly and reg- ularly used as a Folk-lore medicine in the South of our country for the treatment of infective hepatitis (1,2).
In order to study the efficacy and safety of this plant extract, the plant was identified, brought all the way from Tamilnadu amd was cultivated in Sevagram, This study was carried out to test this extract in rats after inducing damage to the liver with carbon tetrachloride which induces fatty liver and liver cell ne- crosis (3) as ICMR Research Project in Department of Pharma- cology MGIMS, Sewagram, Wardha (M.S.) from Jan’2010 to Apr’2010
MATERIALS AND METHODS : Eclipta alba and Phyllanthus fraturnus extract: It was prepared by drying the leaves of the plants and then evaporating the alcohol added, in shadow.
Drugs and chemicals : CC14 (Qualigens fine chemicals, Bom- bay), Liv-52 (Himalaya Drug Co., Bombay), GOT, GPT estima- tion kits (Kasturba Hospital, Sevagram).
Experimental animals : 60 male albino rats each weighing not less than 150 gm were divided into 6 groups with 10 animals in each group. The rats had free access to commercial pellet diet (Goldmohr rat feed, Lipton India Ltd.) and water.
Group I : was treated with CC14
Group II : plant extract – No. 1. (Eclipta alba)
Group III : plant extract – No. 2. (phyllanthus fratur- nus)
Group IV : plant extract – No. 1 + 2
Group V : Liv 52 - an Ayurvedic preparation.
Group VI : Control.
The details of the procedure are as follows.
TREATMENTS : Group I : CC14 + groundnut oil mixture injected LP. 0.1 ml / kg body weight. 3 doses on alternate days (1st, 3rd, 5th day), sacrificed on 6th day.
Group II : Eclipta alba fed orally for 10 days 100 mg/kg body weight. CC14 + groundnut oil injected LP. on 6th, 8th, 10th day (0.1 ml / kg), sacrificed on 11th day.
Group III : Phyllanthus fraturnus fed orally for 10 days, 100 mg/kg body weight. CCl4 + groundnut oil injected LP. on 6th, 9th, 10th day (0.1 ml/kg); sacrificed on 11th day.
Group IV : Eclipta alba + phyllanthus fracturnus fed orally for 10 days 100 mg/kg body weight each. CC14 + groundnut oil injected I.P. on 6th, 8th, 10th day (0.1 ml/kg), sacrificed on 11th day.
Group V : Liv 52 fed orally for 10 days (1 ml/kg body weight) CC14 + groundnut oil injected I.P. on 6th, 8th, 10th day (0.1 ml/kg). Sacrificed on 11th day (4).
Group VI : Distilled water fed orally (1 ml/kg body weight). Groundnut oil injected on 6th, 8th, 10th day (0.1 ml/ kg). Sacrificed on 11th day.
All rats were sacrificed under light ether anaesthesia and the following diagnostic estimations were done to assess the liver functions. Biochemical study :
HEPATOPROTECTIVE EFFECT OF ECLIPTA ALBA AND
PHYLLANTHUS FRATURNUS EXTRACT IN ANIMAL MODEL
(RATS)
AB
ST
RA
CT
KEYWORDS
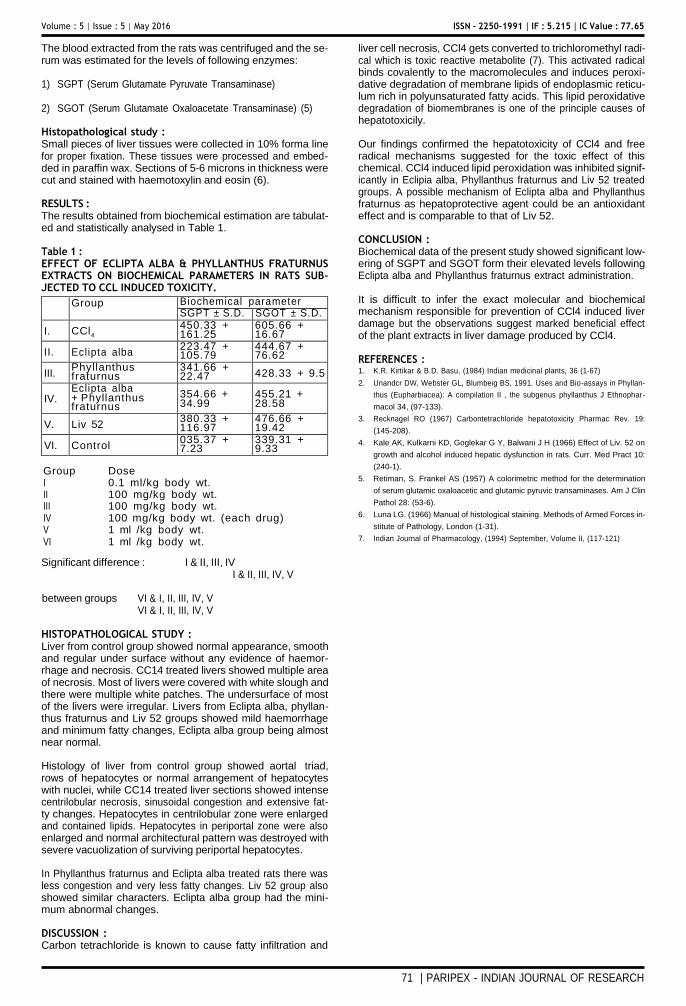
71 | PARIPEX - INDIAN JOURNAL OF RESEARCH
Volume : 5 | Issue : 5 | May 2016 ISSN - 2250-1991 | IF : 5.215 | IC Value : 77.65
The blood extracted from the rats was centrifuged and the se- rum was estimated for the levels of following enzymes:
1) SGPT (Serum Glutamate Pyruvate Transaminase)
2) SGOT (Serum Glutamate Oxaloacetate Transaminase) (5)
Histopathological study : Small pieces of liver tissues were collected in 10% forma line for proper fixation. These tissues were processed and embed- ded in paraffin wax. Sections of 5-6 microns in thickness were cut and stained with haemotoxylin and eosin (6).
RESULTS : The results obtained from biochemical estimation are tabulat- ed and statistically analysed in Table 1.
Table 1 : EFFECT OF ECLIPTA ALBA & PHYLLANTHUS FRATURNUS EXTRACTS ON BIOCHEMICAL PARAMETERS IN RATS SUB- JECTED TO CCL INDUCED TOXICITY.
Group Biochemical parameter SGPT ± S.D. SGOT ± S.D.
I. CCl4 450.33 + 161.25
605.66 + 16.67
II. Eclipta alba 223.47 + 105.79
444.67 + 76.62
III. Phyllanthus fraturnus
341.66 + 22.47 428.33 + 9.5
IV. Eclipta alba + Phyllanthus fraturnus
354.66 + 34.99
455.21 + 28.58
V. Liv 52 380.33 + 116.97
476.66 + 19.42
VI. Control 035.37 + 7.23
339.31 + 9.33
Group Dose I 0.1 ml/kg body wt. II 100 mg/kg body wt. III 100 mg/kg body wt. IV 100 mg/kg body wt. (each drug) V 1 ml /kg body wt. VI 1 ml /kg body wt.
Significant difference : I & II, III, IV I & II, III, IV, V
liver cell necrosis, CCl4 gets converted to trichloromethyl radi- cal which is toxic reactive metabolite (7). This activated radical binds covalently to the macromolecules and induces peroxi- dative degradation of membrane lipids of endoplasmic reticu- lum rich in polyunsaturated fatty acids. This lipid peroxidative degradation of biomembranes is one of the principle causes of hepatotoxicily.
Our findings confirmed the hepatotoxicity of CCl4 and free radical mechanisms suggested for the toxic effect of this chemical. CCl4 induced lipid peroxidation was inhibited signif- icantly in Eclipia alba, Phyllanthus fraturnus and Liv 52 treated groups. A possible mechanism of Eclipta alba and Phyllanthus fraturnus as hepatoprotective agent could be an antioxidant effect and is comparable to that of Liv 52.
CONCLUSION : Biochemical data of the present study showed significant low- ering of SGPT and SGOT form their elevated levels following Eclipta alba and Phyllanthus fraturnus extract administration.
It is difficult to infer the exact molecular and biochemical mechanism responsible for prevention of CCl4 induced liver damage but the observations suggest marked beneficial effect of the plant extracts in liver damage produced by CCl4.
REFERENCES : 1. K.R. Kirtikar & B.D. Basu, (1984) Indian medicinal plants, 36 (1-67)
2. Unandcr DW, Webster GL, Blumbeig BS, 1991. Uses and Bio-assays in Phyllan-
thus (Eupharbiacea): A compilation II , the subgenus phyllanthus J Ethnophar-
macol 34, (97-133).
3. Recknagel RO (1967) Carbontetrachloride hepatotoxicity Pharmac Rev. 19:
(145-208).
4. Kale AK, Kulkarni KD, Goglekar G Y, Balwani J H (1966) Effect of Liv. 52 on
growth and alcohol induced hepatic dysfunction in rats. Curr. Med Pract 10:
(240-1).
5. Retiman, S. Frankel AS (1957) A colorimetric method for the determination
of serum glutamic oxaloacetic and glutamic pyruvic transaminases. Am J Clin
Pathol 28: (53-6).
6. Luna LG. (1966) Manual of histological staining. Methods of Armed Forces in-
stitute of Pathology, London (1-31).
7. Indian Journal of Pharmacology, (1994) September, Volume II, (117-121)
between groups VI & I, II, III, IV, V VI & I, II, III, IV, V
HISTOPATHOLOGICAL STUDY : Liver from control group showed normal appearance, smooth and regular under surface without any evidence of haemor- rhage and necrosis. CC14 treated livers showed multiple area of necrosis. Most of livers were covered with white slough and there were multiple white patches. The undersurface of most of the livers were irregular. Livers from Eclipta alba, phyllan- thus fraturnus and Liv 52 groups showed mild haemorrhage and minimum fatty changes, Eclipta alba group being almost near normal.
Histology of liver from control group showed aortal triad, rows of hepatocytes or normal arrangement of hepatocytes with nuclei, while CC14 treated liver sections showed intense centrilobular necrosis, sinusoidal congestion and extensive fat- ty changes. Hepatocytes in centrilobular zone were enlarged and contained lipids. Hepatocytes in periportal zone were also enlarged and normal architectural pattern was destroyed with severe vacuolization of surviving periportal hepatocytes.
In Phyllanthus fraturnus and Eclipta alba treated rats there was less congestion and very less fatty changes. Liv 52 group also showed similar characters. Eclipta alba group had the mini- mum abnormal changes.
DISCUSSION : Carbon tetrachloride is known to cause fatty infiltration and
Volume : 5 | Issue : 4 | April 2016 ISSN - 2250-1991 | IF : 5.215 | IC Value : 77.65
478 | PARIPEX - INDIAN JOURNAL OF RESEARCH
Evaluation of Possum Score As Predictor of Morbidity
And Mortality in Gastrointestinal Surgeries.
* Dr. Sachin Naik
Dr. Pankaj Nemade
Dr. Sandesh Gawade
Professor and Head, Dept. of Gen. Surgery, MIMER Medical Col-
lege, Talegaon Dabhade, Pune. * Corresponding Author
Senior Resident, Dept. of Gen. Surgery, MIMER Medical College,
Talegaon Dabhade, Pune.
Assistant Professor, Dept. of Gen. Surgery, MIMER Medical Col-
lege, Talegaon Dabhade, Pune.
There is high risk of postoperative complications in patients undergoing abdominal surgery. It may lead to prolonged
hospital stay, disproportionate use of resources and increased mortality and morbidity. We assessed impact of complications
in terms of hospital stay and ICU stay by study of predictive factors, the nature and frequency of postoperative complications
in this retrospective observational study of 100 patients undergoing abdominal surgeries for various diseases in our centre.
The incidence of cardiorespiratory, infective and surgical complications was assessed.
POSSUM (Physiological and Operative Severity Score for the enumeration of Mortality and morbidity) score was used for
evaluation.
High-risk patients could be identified by simple clinical criteria. Development of clinical pathways would prove valuable.
POSSUM may be considered an essential component of surgical audit as it does appear to provide an efficient indicator of
the risk of morbidity and mortality in the general surgical patient.
KEYWORDS POSSUM score, Gastrointestinal surgery, ASA.
Introduction Recovery from surgery is fast and uncomplicated in most pa- tients and the overall mortality rate after non-cardiac surgery is approximately 1-2 percent.1 Established risk factors include increasing age, impaired cardiovascular function and type of surgery.2 In gastroenterological surgery postoperative compli- cations occur more frequently and the postoperative mortal- ity rate is higher (4 percent) than in many other specialties.3
Patients who develop complications and whose hospital stay is prolonged may consume a disproportionately large share of the available resources.4
Definitions of complications and risk factors related to gastro- enterological surgery vary extensively.3 The reported incidence of complications is also greatly dependent on patient selec- tion. Recent studies have shown that preoperative screening may facilitate the selection of patients for appropriate peri- operative management5 Perioperative intervention on high risk patients undergoing major surgery may be beneficial to reduce the postoperative complications, risk of death or the length of hospital stay.
Aims and objectives The objective of this study was to see the feasibility and pre- dictivety of possum score for morbidity and mortality in pa- tients undergoing gastrointestinal surgeries. And further to determine the nature and the frequency of cardiorespiratory, surgical and infective complications after gastroenterological operations; their correlation with the predictive factors and as- sessment of their impact in terms of hospital stay and need for intensive care.
Materials and methods This study was an observational study incorporating 100 pa- tients admitted at MIMER hospital, Pune who underwent gas- troenterological surgeries for various diseases from Feb 2010 to July 2012. We compared our data with that published by other national and international centers.
POSSUM score was used for evaluation of the study patients. POSSUM score consisted of 4 different parameters viz. Physiol- ogy Severity Score, Operative Severity Score, Possum Predict- ed Morbidity and Possum Predicted Mortality scores. Patients with POSSUM Scores <25 were grouped as “low-risk”, those with scores 25-50 were termed “medium risk”, whereas those with scores >50 were considered high risk.
The following predictors were recorded viz. Age(years), Cor- onary heart disease, Heart failure, Hypertension, Diabetes, Duration of operation (min), Duration of intraoperative hypo- tension (min), Blood loss during surgery(ml), COPD/Asthma; and the correlation with the postoperative complications was studied.
Results It was observed that more than 50% of the patients with Age > 60years, history of CAD, Hypertension and COPD/Asthma had postoperative complications, which indicates that these are important predictive factors with positive correlation for complication; although our observation was not statistically significant.
It was observed that the patients with increased duration of surgery, excess blood loss during surgery (> 500ml) and intra- operative hypotension (min) requiring inotropic supports had postoperative complications, with statistically significant P val- ue.
Patients with ASA III or more had postoperative complications, prolonged hospital and ICU stay. This means higher ASA grade is a significant predictor for complications and resource utili- zation.
Maximum complications occurred in patients undergoing exploratory laparotomy whereas 60% of the patients under- going more than one operative procedure had postoperative complications. This indicates that type and number of opera- tive procedures also have positive correlation with postopera-
Research Paper Medical science A
BS
TR
AC
T
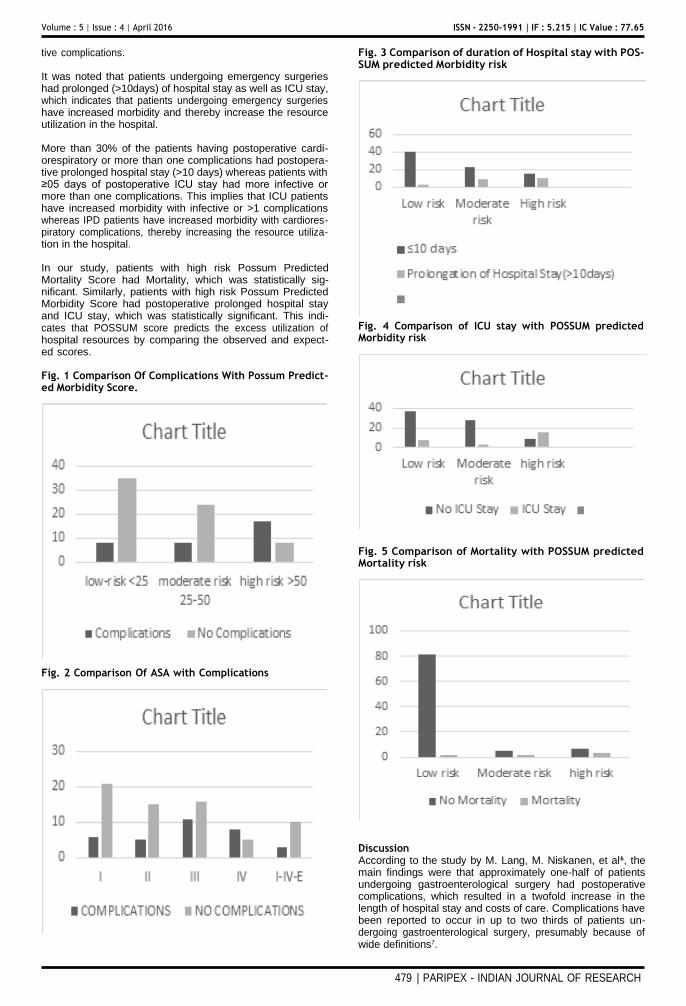
Volume : 5 | Issue : 4 | April 2016 ISSN - 2250-1991 | IF : 5.215 | IC Value : 77.65
479 | PARIPEX - INDIAN JOURNAL OF RESEARCH
tive complications.
It was noted that patients undergoing emergency surgeries had prolonged (>10days) of hospital stay as well as ICU stay, which indicates that patients undergoing emergency surgeries have increased morbidity and thereby increase the resource utilization in the hospital.
More than 30% of the patients having postoperative cardi- orespiratory or more than one complications had postopera- tive prolonged hospital stay (>10 days) whereas patients with ≥05 days of postoperative ICU stay had more infective or more than one complications. This implies that ICU patients have increased morbidity with infective or >1 complications whereas IPD patients have increased morbidity with cardiores- piratory complications, thereby increasing the resource utiliza- tion in the hospital.
In our study, patients with high risk Possum Predicted Mortality Score had Mortality, which was statistically sig- nificant. Similarly, patients with high risk Possum Predicted Morbidity Score had postoperative prolonged hospital stay and ICU stay, which was statistically significant. This indi- cates that POSSUM score predicts the excess utilization of hospital resources by comparing the observed and expect- ed scores.
Fig. 1 Comparison Of Complications With Possum Predict- ed Morbidity Score.
Fig. 2 Comparison Of ASA with Complications
Fig. 3 Comparison of duration of Hospital stay with POS- SUM predicted Morbidity risk
Fig. 4 Comparison of ICU stay with POSSUM predicted Morbidity risk
Fig. 5 Comparison of Mortality with POSSUM predicted Mortality risk
Discussion According to the study by M. Lang, M. Niskanen, et al6, the main findings were that approximately one-half of patients undergoing gastroenterological surgery had postoperative complications, which resulted in a twofold increase in the length of hospital stay and costs of care. Complications have been reported to occur in up to two thirds of patients un- dergoing gastroenterological surgery, presumably because of wide definitions7.
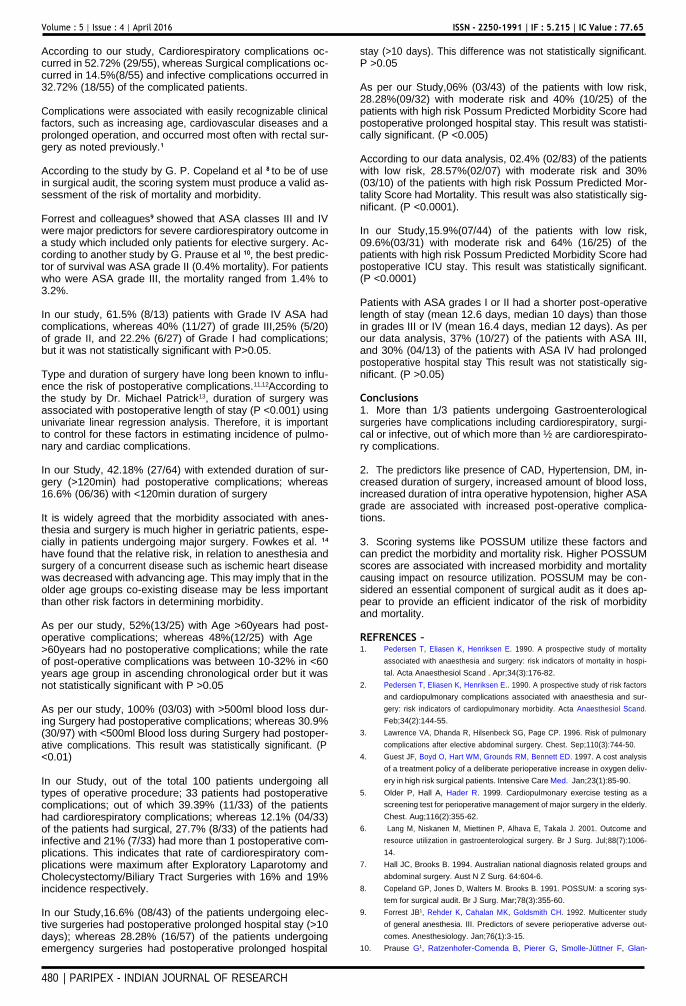
Volume : 5 | Issue : 4 | April 2016 ISSN - 2250-1991 | IF : 5.215 | IC Value : 77.65
480 | PARIPEX - INDIAN JOURNAL OF RESEARCH
According to our study, Cardiorespiratory complications oc- curred in 52.72% (29/55), whereas Surgical complications oc- curred in 14.5%(8/55) and infective complications occurred in 32.72% (18/55) of the complicated patients.
Complications were associated with easily recognizable clinical factors, such as increasing age, cardiovascular diseases and a prolonged operation, and occurred most often with rectal sur- gery as noted previously.1
According to the study by G. P. Copeland et al 8 to be of use in surgical audit, the scoring system must produce a valid as- sessment of the risk of mortality and morbidity.
Forrest and colleagues9 showed that ASA classes III and IV were major predictors for severe cardiorespiratory outcome in a study which included only patients for elective surgery. Ac- cording to another study by G. Prause et al 10, the best predic- tor of survival was ASA grade II (0.4% mortality). For patients who were ASA grade III, the mortality ranged from 1.4% to 3.2%.
In our study, 61.5% (8/13) patients with Grade IV ASA had complications, whereas 40% (11/27) of grade III,25% (5/20) of grade II, and 22.2% (6/27) of Grade I had complications; but it was not statistically significant with P>0.05.
Type and duration of surgery have long been known to influ- ence the risk of postoperative complications.11,12According to the study by Dr. Michael Patrick13, duration of surgery was associated with postoperative length of stay (P <0.001) using univariate linear regression analysis. Therefore, it is important to control for these factors in estimating incidence of pulmo- nary and cardiac complications.
In our Study, 42.18% (27/64) with extended duration of sur- gery (>120min) had postoperative complications; whereas 16.6% (06/36) with <120min duration of surgery
It is widely agreed that the morbidity associated with anes- thesia and surgery is much higher in geriatric patients, espe- cially in patients undergoing major surgery. Fowkes et al. 14
have found that the relative risk, in relation to anesthesia and surgery of a concurrent disease such as ischemic heart disease was decreased with advancing age. This may imply that in the older age groups co-existing disease may be less important than other risk factors in determining morbidity.
As per our study, 52%(13/25) with Age >60years had post- operative complications; whereas 48%(12/25) with Age >60years had no postoperative complications; while the rate of post-operative complications was between 10-32% in <60 years age group in ascending chronological order but it was not statistically significant with P >0.05
As per our study, 100% (03/03) with >500ml blood loss dur- ing Surgery had postoperative complications; whereas 30.9% (30/97) with <500ml Blood loss during Surgery had postoper- ative complications. This result was statistically significant. (P <0.01)
In our Study, out of the total 100 patients undergoing all types of operative procedure; 33 patients had postoperative complications; out of which 39.39% (11/33) of the patients had cardiorespiratory complications; whereas 12.1% (04/33) of the patients had surgical, 27.7% (8/33) of the patients had infective and 21% (7/33) had more than 1 postoperative com- plications. This indicates that rate of cardiorespiratory com- plications were maximum after Exploratory Laparotomy and Cholecystectomy/Biliary Tract Surgeries with 16% and 19% incidence respectively.
In our Study,16.6% (08/43) of the patients undergoing elec- tive surgeries had postoperative prolonged hospital stay (>10 days); whereas 28.28% (16/57) of the patients undergoing emergency surgeries had postoperative prolonged hospital
stay (>10 days). This difference was not statistically significant. P >0.05
As per our Study,06% (03/43) of the patients with low risk, 28.28%(09/32) with moderate risk and 40% (10/25) of the patients with high risk Possum Predicted Morbidity Score had postoperative prolonged hospital stay. This result was statisti- cally significant. (P <0.005)
According to our data analysis, 02.4% (02/83) of the patients with low risk, 28.57%(02/07) with moderate risk and 30% (03/10) of the patients with high risk Possum Predicted Mor- tality Score had Mortality. This result was also statistically sig- nificant. (P <0.0001).
In our Study,15.9%(07/44) of the patients with low risk, 09.6%(03/31) with moderate risk and 64% (16/25) of the patients with high risk Possum Predicted Morbidity Score had postoperative ICU stay. This result was statistically significant. (P <0.0001)
Patients with ASA grades I or II had a shorter post-operative length of stay (mean 12.6 days, median 10 days) than those in grades III or IV (mean 16.4 days, median 12 days). As per our data analysis, 37% (10/27) of the patients with ASA III, and 30% (04/13) of the patients with ASA IV had prolonged postoperative hospital stay This result was not statistically sig- nificant. (P >0.05)
Conclusions 1. More than 1/3 patients undergoing Gastroenterological surgeries have complications including cardiorespiratory, surgi- cal or infective, out of which more than ½ are cardiorespirato- ry complications.
2. The predictors like presence of CAD, Hypertension, DM, in- creased duration of surgery, increased amount of blood loss, increased duration of intra operative hypotension, higher ASA grade are associated with increased post-operative complica- tions.
3. Scoring systems like POSSUM utilize these factors and can predict the morbidity and mortality risk. Higher POSSUM scores are associated with increased morbidity and mortality causing impact on resource utilization. POSSUM may be con- sidered an essential component of surgical audit as it does ap- pear to provide an efficient indicator of the risk of morbidity and mortality.
REFRENCES – 1. Pedersen T, Eliasen K, Henriksen E. 1990. A prospective study of mortality
associated with anaesthesia and surgery: risk indicators of mortality in hospi-
tal. Acta Anaesthesiol Scand . Apr;34(3):176-82.
2. Pedersen T, Eliasen K, Henriksen E.. 1990. A prospective study of risk factors
and cardiopulmonary complications associated with anaesthesia and sur-
gery: risk indicators of cardiopulmonary morbidity. Acta Anaesthesiol Scand.
Feb;34(2):144-55.
3. Lawrence VA, Dhanda R, Hilsenbeck SG, Page CP. 1996. Risk of pulmonary
complications after elective abdominal surgery. Chest. Sep;110(3):744-50.
4. Guest JF, Boyd O, Hart WM, Grounds RM, Bennett ED. 1997. A cost analysis
of a treatment policy of a deliberate perioperative increase in oxygen deliv-
ery in high risk surgical patients. Intensive Care Med. Jan;23(1):85-90.
5. Older P, Hall A, Hader R. 1999. Cardiopulmonary exercise testing as a
screening test for perioperative management of major surgery in the elderly.
Chest. Aug;116(2):355-62.
6. Lang M, Niskanen M, Miettinen P, Alhava E, Takala J. 2001. Outcome and
resource utilization in gastroenterological surgery. Br J Surg. Jul;88(7):1006-
14.
7. Hall JC, Brooks B. 1994. Australian national diagnosis related groups and
abdominal surgery. Aust N Z Surg. 64:604-6.
8. Copeland GP, Jones D, Walters M. Brooks B. 1991. POSSUM: a scoring sys-
tem for surgical audit. Br J Surg. Mar;78(3):355-60.
9. Forrest JB1, Rehder K, Cahalan MK, Goldsmith CH. 1992. Multicenter study
of general anesthesia. III. Predictors of severe perioperative adverse out-
comes. Anesthesiology. Jan;76(1):3-15.
10. Prause G1, Ratzenhofer-Comenda B, Pierer G, Smolle-Jüttner F, Glan-

Volume : 5 | Issue : 4 | April 2016 ISSN - 2250-1991 | IF : 5.215 | IC Value : 77.65
481 | PARIPEX - INDIAN JOURNAL OF RESEARCH
zer H, Smolle J. 1997. Can ASA grade or Goldman’s cardiac risk index
predict peri-operative mortality? A study of 16,227 patients. Anaesthe-
sia. Mar;52(3):203-6.
11. Lubin MF, Walker HK, Smith RB [eds]. 1988. Medical Management of the
surgical patient (2nd ed), Boston: Butterworths.
12. Kroenke K, Lawerence VA, Theroux JF, Tuley MR. 1992. Operative risk in pa-
tients with severe pulmonary disease. Arch Intern Med; 152:967-71.
13. Patrick Michael William. 2010. GROCOTT. Measuring morbidity following
major surgery.
14. Fowkes FG, Lunn JN, Farrow SC, Robertson IB, Samuel P. 1982. Epidemiol-
ogy in anaesthesia. III: Mortality risk in patients with coexisting physical dis-
ease. Br J Anaesth. Aug;54(8):819-25.

SEE PROFILE
See discussions, stats, and author profiles for this publication at: https://www.researchgate.net/publication/303799453
Endoscopic management of cholesteatoma with Khan's Endoholder
Article in The Journal of Laryngology & Otology · May 2016
DOI: 10.1017/S002221511600270X
CITATIONS
0
READS
32
1 author:
Mubarak M Khan
Sushrut ENT Hospital & Dr Khan's Research Centre Talegaon Danhade
58 PUBLICATIONS 440 CITATIONS
Some of the authors of this publication are also working on these related projects:
Human temporal bone View project
ENT Innovations View project
All content following this page was uploaded by Mubarak M Khan on 10 June 2020.
The user has requested enhancement of the downloaded file.
S54
difference seen amongst the varying seniority of clinicians. These findings were corroborated by the sEMG readings.
Conclusions: ENT surgeons who perform prolonged micro- scopic work are at risk of musculoskeletal pain, which correlates with surgical experience suggesting an element of postural adaptation. Our prototype ergonomic support system can help delay the sensations of postural strain.
doi:10.1017/S002221511600270X
doi:10.1017/S0022215116002711
Free Papers (F712)
ID: 712.3
Long term hearing outcomes with the
shape memory Nitinol stapes prosthesis:
10 year results
Presenting Author: Rebecca Heywood
ABSTRACTS
Free Papers (F712)
ID: 712.2
Endoscopic management of cholesteatoma
with Khan’s Endoholder
Presenting Author: Mubarak Khan
Mubarak Khan
Mimer medical college
Learning Objectives: Endoscopic ear surgery provides a minimally invasive approach to the middle ear. The disad- vantage of endoscopic ear surgery is that it is a single- handed surgical technique. The nondominant hand of the surgeon is utilized for holding and manipulating the endoscope. This necessitated the need for the development of an endoscope holder that would allow both hands to be free for surgical manipulation. The aim of this article is to report our preliminary experience using our newly designed and developed endoscope holder, which allowed us to perform cholesteatoma surgery utilizing both hands for surgery.
Study Design: Retrospective nonrandomized clinical study.
Methods: The endoscope holder was designed and devel- oped to aid in endoscopic cholesteatoma surgery and to overcome the disadvantage of single-handed endoscopic surgery. The design of the endoscope holder is described in detail, along with instructions on how it can be used. A total of 87 endoscope holder-assisted cholesteatoma surgeries were performed to evaluate the feasibility of a two-handed technique and to evaluate the results of surgery.
Results: Out of 87 Endoholder assisted cholesteatoma surgeries, 82 surgeries were performed exclusively with Endoholder and 5 needed combined approach
(endoscope + microscope) suggesting 94% success in
using exclusive Endoholder for endoscopic management of cholesteatoma.
The endoscope holder eliminates the disadvantages of single-handed surgery and is a good option for those who wish to perform endoscopic cholesteatoma surgery using both hands.
Conclusion: The study reports the successful application and use of the endoscope holder in a two-handed technique of endoscopic cholesteatoma management.
Rebecca Heywood1, Mark Quick2, Marcus Atlas3 1Ng Teng Fong General Hospital, 2Sir Charles
Gairdner Hospital, 3Ear Science Institute
Australia
Learning objectives:
1. Understand the variability that ensues during crimping
of stapes prostheses 2. Understand the benefits conferred by self-crimping
shape memory prostheses 3. Learn about long term stability of hearing outcomes
using self-crimping shape memory prostheses
Introduction: Self-crimping stapes pistons were introduced to remove the manual component of the crimping process during stapedectomy with a view to producing stable long term hearing improvement in a reproducible manner and reducing trauma to the middle and inner ear. The objective of this study was to assess the long term clinical hearing outcomes and their stability following stapedectomy using a self-crimping shape memory Nitinol prosthesis over a 10 year period.
Methods: Retrospective case review was performed in a tertiary referral centre. Thirteen adult patients underwent fourteen stapedectomy procedures using a self-crimping shape memory Nitinol prosthesis between November 2003 and February 2005. Pure tone audiometry was per- formed preoperatively, at three monthly intervals up to two years and at five and ten years postoperatively.
Results: Mean postoperative air conduction (0.5, 1, 2 and 3kHz) was 24.4 dB (standard deviation 8.3) at 1 year and 29.6 dB (11.2) at 10 years. Mean postoperative bone conduc- tion (0.5, 1, 2 and 3kHz) was 18.6 (8.0) at 1 year and 25.0 (12.0) at 10 years. Mean postoperative air bone gap (0.5, 1, 2 and 3kHz) was 5.5 dB (3.0) at 1 year and 4.8 dB (3.9) at 10 years. Mean air bone gap closure was 23.3 (12.6) at 1 year and 24.2 (9.9) at 10 years. Mean change in high tone bone conduction level (1, 2 and 4kHz) was 5.4 dB (6.0) at 1 year and -0.2 dB (7.0) at 10 years, a mean deterioration of 5.6 dB (0.6 dB per year).
Conclusions: Excellent closure of the air bone gap is demon- strated and it remains stable over at least ten years. There is no evidence that circumferential firm fixation of the pros- thesis hook around the long process of incus has a detrimen- tal effect in the long term.
Downloaded from https://www.cambridge.org/core. IP address: 178.171.65.64, on 10 Jun 2020 at 15:11:45, subject to the Cambridge Core terms of use, available at
https://www.cambridge.org/core/terms. https://doi.org/10.1017/S002221511600270X
View publication stats
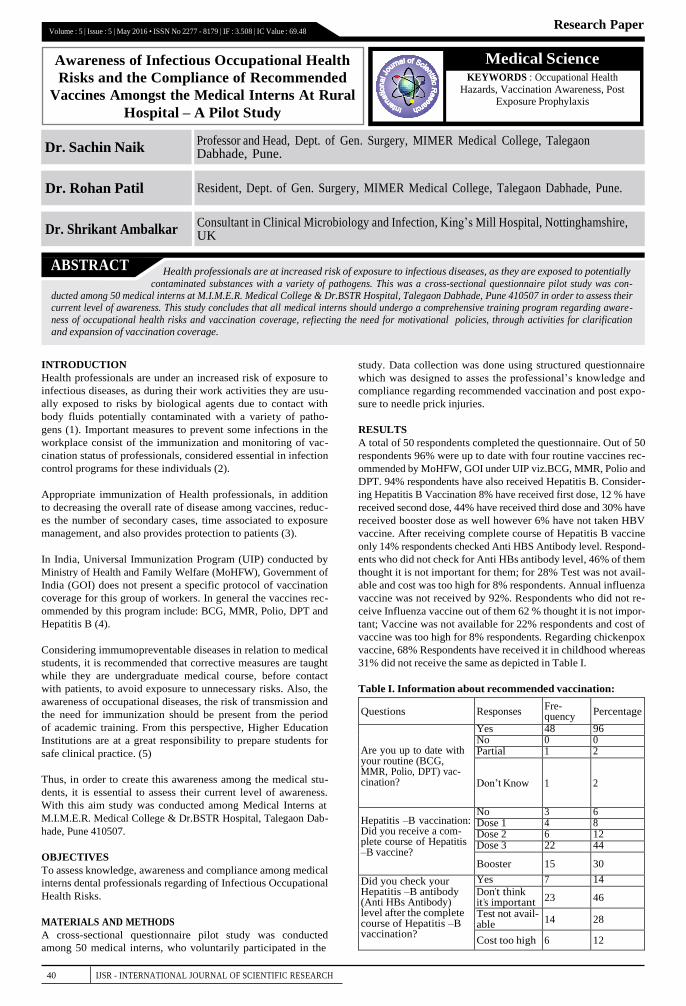
Research Paper Volume : 5 | Issue : 5 | May 2016 • ISSN No 2277 - 8179 | IF : 3.508 | IC Value : 69.48
40 IJSR - INTERNATIONAL JOURNAL OF SCIENTIFIC RESEARCH
INTRODUCTION
Health professionals are under an increased risk of exposure to
infectious diseases, as during their work activities they are usu-
ally exposed to risks by biological agents due to contact with
body fluids potentially contaminated with a variety of patho-
gens (1). Important measures to prevent some infections in the
workplace consist of the immunization and monitoring of vac-
cination status of professionals, considered essential in infection
control programs for these individuals (2).
Appropriate immunization of Health professionals, in addition
to decreasing the overall rate of disease among vaccines, reduc-
es the number of secondary cases, time associated to exposure
management, and also provides protection to patients (3).
In India, Universal Immunization Program (UIP) conducted by
Ministry of Health and Family Welfare (MoHFW), Government of
India (GOI) does not present a specific protocol of vaccination
coverage for this group of workers. In general the vaccines rec-
ommended by this program include: BCG, MMR, Polio, DPT and
Hepatitis B (4).
Considering immumopreventable diseases in relation to medical
students, it is recommended that corrective measures are taught
while they are undergraduate medical course, before contact
with patients, to avoid exposure to unnecessary risks. Also, the
awareness of occupational diseases, the risk of transmission and
the need for immunization should be present from the period
of academic training. From this perspective, Higher Education
Institutions are at a great responsibility to prepare students for
safe clinical practice. (5)
Thus, in order to create this awareness among the medical stu-
dents, it is essential to assess their current level of awareness.
With this aim study was conducted among Medical Interns at
M.I.M.E.R. Medical College & Dr.BSTR Hospital, Talegaon Dab-
hade, Pune 410507.
OBJECTIVES
To assess knowledge, awareness and compliance among medical
interns dental professionals regarding of Infectious Occupational
Health Risks.
MATERIALS AND METHODS
A cross-sectional questionnaire pilot study was conducted
among 50 medical interns, who voluntarily participated in the
study. Data collection was done using structured questionnaire
which was designed to asses the professional’s knowledge and
compliance regarding recommended vaccination and post expo-
sure to needle prick injuries.
RESULTS
A total of 50 respondents completed the questionnaire. Out of 50
respondents 96% were up to date with four routine vaccines rec-
ommended by MoHFW, GOI under UIP viz.BCG, MMR, Polio and
DPT. 94% respondents have also received Hepatitis B. Consider-
ing Hepatitis B Vaccination 8% have received first dose, 12 % have
received second dose, 44% have received third dose and 30% have
received booster dose as well however 6% have not taken HBV
vaccine. After receiving complete course of Hepatitis B vaccine
only 14% respondents checked Anti HBS Antibody level. Respond-
ents who did not check for Anti HBs antibody level, 46% of them
thought it is not important for them; for 28% Test was not avail-
able and cost was too high for 8% respondents. Annual influenza
vaccine was not received by 92%. Respondents who did not re-
ceive Influenza vaccine out of them 62 % thought it is not impor-
tant; Vaccine was not available for 22% respondents and cost of
vaccine was too high for 8% respondents. Regarding chickenpox
vaccine, 68% Respondents have received it in childhood whereas
31% did not receive the same as depicted in Table I.
Table I. Information about recommended vaccination:
Questions Responses Fre- quency
Percentage
Are you up to date with your routine (BCG, MMR, Polio, DPT) vac- cination?
Yes 48 96 No 0 0 Partial 1 2
Don’t Know
1
2
Hepatitis –B vaccination: Did you receive a com- plete course of Hepatitis –B vaccine?
No 3 6 Dose 1 4 8 Dose 2 6 12 Dose 3 22 44
Booster 15 30
Did you check your Hepatitis –B antibody (Anti HBs Antibody) level after the complete course of Hepatitis –B vaccination?
Yes 7 14
Don’t think it’s important 23 46
Test not avail- able
14 28
Cost too high 6 12
ABSTRACT Health professionals are at increased risk of exposure to infectious diseases, as they are exposed to potentially
contaminated substances with a variety of pathogens. This was a cross-sectional questionnaire pilot study was con- ducted among 50 medical interns at M.I.M.E.R. Medical College & Dr.BSTR Hospital, Talegaon Dabhade, Pune 410507 in order to assess their current level of awareness. This study concludes that all medical interns should undergo a comprehensive training program regarding aware-
ness of occupational health risks and vaccination coverage, refiecting the need for motivational policies, through activities for clarification and expansion of vaccination coverage.
Consultant in Clinical Microbiology and Infection, King’s Mill Hospital, Nottinghamshire, UK Dr. Shrikant Ambalkar
Resident, Dept. of Gen. Surgery, MIMER Medical College, Talegaon Dabhade, Pune. Dr. Rohan Patil
Professor and Head, Dept. of Gen. Surgery, MIMER Medical College, Talegaon Dabhade, Pune. Dr. Sachin Naik
Medical Science KEYWORDS : Occupational Health
Hazards, Vaccination Awareness, Post Exposure Prophylaxis
Awareness of Infectious Occupational Health
Risks and the Compliance of Recommended
Vaccines Amongst the Medical Interns At Rural
Hospital – A Pilot Study
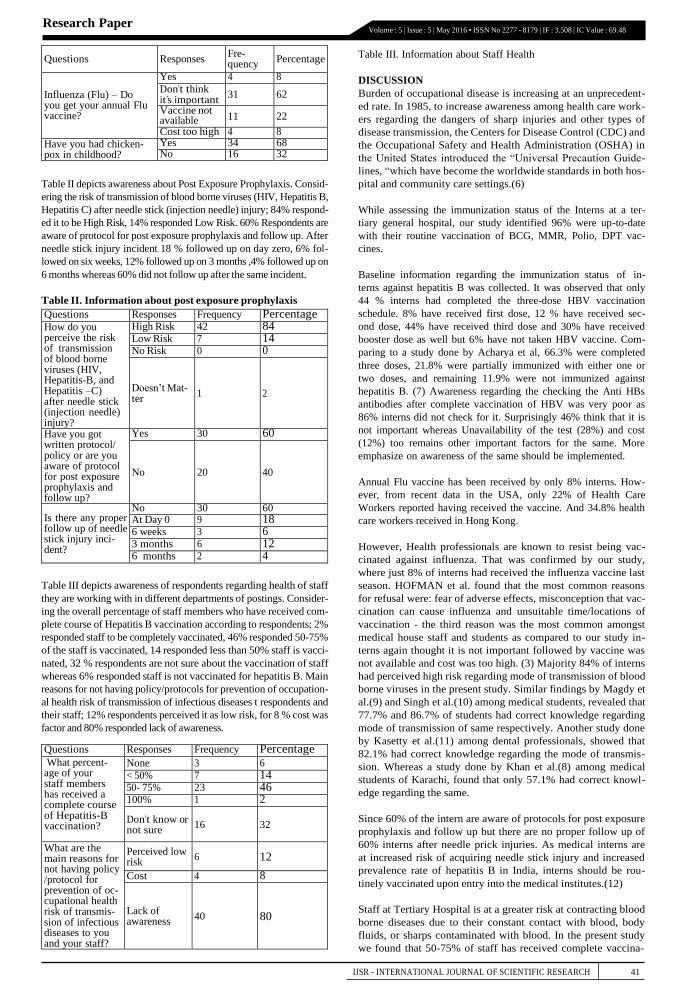
Questions Responses Fre- quency
Percentage
Influenza (Flu) – Do you get your annual Flu vaccine?
Yes 4 8
Don’t think it’s important
31 62
Vaccine not available 11 22
Cost too high 4 8
Have you had chicken- pox in childhood?
Yes 34 68 No 16 32
Table II depicts awareness about Post Exposure Prophylaxis. Consid-
ering the risk of transmission of blood borne viruses (HIV, Hepatitis B,
Hepatitis C) after needle stick (injection needle) injury; 84% respond-
ed it to be High Risk, 14% responded Low Risk. 60% Respondents are
aware of protocol for post exposure prophylaxis and follow up. After
needle stick injury incident 18 % followed up on day zero, 6% fol-
lowed on six weeks, 12% followed up on 3 months ,4% followed up on
6 months whereas 60% did not follow up after the same incident.
Table II. Information about post exposure prophylaxis
Questions Responses Frequency Percentage How do you perceive the risk of transmission of blood borne viruses (HIV, Hepatitis-B, and Hepatitis –C) after needle stick (injection needle) injury?
High Risk 42 84 Low Risk 7 14 No Risk 0 0
Doesn’t Mat- ter
1
2
Have you got written protocol/ policy or are you aware of protocol for post exposure prophylaxis and follow up?
Yes 30 60
No
20
40
Is there any proper follow up of needle stick injury inci- dent?
No 30 60 At Day 0 9 18 6 weeks 3 6 3 months 6 12 6 months 2 4
Table III depicts awareness of respondents regarding health of staff
they are working with in different departments of postings. Consider-
ing the overall percentage of staff members who have received com-
plete course of Hepatitis B vaccination according to respondents; 2%
responded staff to be completely vaccinated, 46% responded 50-75%
of the staff is vaccinated, 14 responded less than 50% staff is vacci-
nated, 32 % respondents are not sure about the vaccination of staff
whereas 6% responded staff is not vaccinated for hepatitis B. Main
reasons for not having policy/protocols for prevention of occupation-
al health risk of transmission of infectious diseases t respondents and
their staff; 12% respondents perceived it as low risk, for 8 % cost was
factor and 80% responded lack of awareness.
Questions Responses Frequency Percentage What percent-
age of your staff members has received a complete course of Hepatitis-B vaccination?
None 3 6
< 50% 7 14 50- 75% 23 46 100% 1 2
Don’t know or not sure
16
32
What are the main reasons for not having policy /protocol for prevention of oc- cupational health risk of transmis- sion of infectious diseases to you and your staff?
Perceived low risk
6 12
Cost 4 8
Lack of awareness
40
80
Table III. Information about Staff Health
DISCUSSION
Burden of occupational disease is increasing at an unprecedent-
ed rate. In 1985, to increase awareness among health care work-
ers regarding the dangers of sharp injuries and other types of
disease transmission, the Centers for Disease Control (CDC) and
the Occupational Safety and Health Administration (OSHA) in
the United States introduced the “Universal Precaution Guide-
lines, “which have become the worldwide standards in both hos-
pital and community care settings.(6)
While assessing the immunization status of the Interns at a ter-
tiary general hospital, our study identified 96% were up-to-date
with their routine vaccination of BCG, MMR, Polio, DPT vac-
cines.
Baseline information regarding the immunization status of in-
terns against hepatitis B was collected. It was observed that only
44 % interns had completed the three-dose HBV vaccination
schedule. 8% have received first dose, 12 % have received sec-
ond dose, 44% have received third dose and 30% have received
booster dose as well but 6% have not taken HBV vaccine. Com-
paring to a study done by Acharya et al, 66.3% were completed
three doses, 21.8% were partially immunized with either one or
two doses, and remaining 11.9% were not immunized against
hepatitis B. (7) Awareness regarding the checking the Anti HBs
antibodies after complete vaccination of HBV was very poor as
86% interns did not check for it. Surprisingly 46% think that it is
not important whereas Unavailability of the test (28%) and cost
(12%) too remains other important factors for the same. More
emphasize on awareness of the same should be implemented.
Annual Flu vaccine has been received by only 8% interns. How-
ever, from recent data in the USA, only 22% of Health Care
Workers reported having received the vaccine. And 34.8% health
care workers received in Hong Kong.
However, Health professionals are known to resist being vac-
cinated against influenza. That was confirmed by our study,
where just 8% of interns had received the influenza vaccine last
season. HOFMAN et al. found that the most common reasons
for refusal were: fear of adverse effects, misconception that vac-
cination can cause influenza and unsuitable time/locations of
vaccination - the third reason was the most common amongst
medical house staff and students as compared to our study in-
terns again thought it is not important followed by vaccine was
not available and cost was too high. (3) Majority 84% of interns
had perceived high risk regarding mode of transmission of blood
borne viruses in the present study. Similar findings by Magdy et
al.(9) and Singh et al.(10) among medical students, revealed that
77.7% and 86.7% of students had correct knowledge regarding
mode of transmission of same respectively. Another study done
by Kasetty et al.(11) among dental professionals, showed that
82.1% had correct knowledge regarding the mode of transmis-
sion. Whereas a study done by Khan et al.(8) among medical
students of Karachi, found that only 57.1% had correct knowl-
edge regarding the same.
Since 60% of the intern are aware of protocols for post exposure
prophylaxis and follow up but there are no proper follow up of
60% interns after needle prick injuries. As medical interns are
at increased risk of acquiring needle stick injury and increased
prevalence rate of hepatitis B in India, interns should be rou-
tinely vaccinated upon entry into the medical institutes.(12)
Staff at Tertiary Hospital is at a greater risk at contracting blood
borne diseases due to their constant contact with blood, body
fluids, or sharps contaminated with blood. In the present study
we found that 50-75% of staff has received complete vaccina-
IJSR - INTERNATIONAL JOURNAL OF SCIENTIFIC RESEARCH 41
Research Paper Volume : 5 | Issue : 5 | May 2016 • ISSN No 2277 - 8179 | IF : 3.508 | IC Value : 69.48
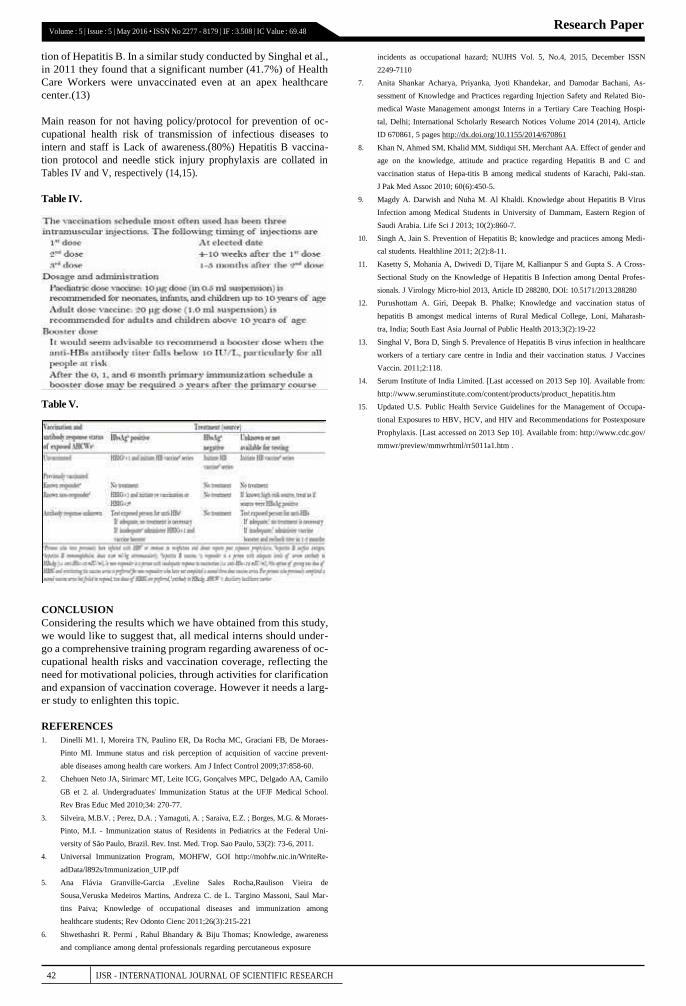
Research Paper Volume : 5 | Issue : 5 | May 2016 • ISSN No 2277 - 8179 | IF : 3.508 | IC Value : 69.48
42 IJSR - INTERNATIONAL JOURNAL OF SCIENTIFIC RESEARCH
tion of Hepatitis B. In a similar study conducted by Singhal et al.,
in 2011 they found that a significant number (41.7%) of Health
Care Workers were unvaccinated even at an apex healthcare
center.(13)
Main reason for not having policy/protocol for prevention of oc-
cupational health risk of transmission of infectious diseases to
intern and staff is Lack of awareness.(80%) Hepatitis B vaccina-
tion protocol and needle stick injury prophylaxis are collated in
Tables IV and V, respectively (14,15).
Table IV.
Table V.
CONCLUSION
Considering the results which we have obtained from this study,
we would like to suggest that, all medical interns should under-
go a comprehensive training program regarding awareness of oc-
cupational health risks and vaccination coverage, reflecting the
need for motivational policies, through activities for clarification
and expansion of vaccination coverage. However it needs a larg-
er study to enlighten this topic.
REFERENCES
1. Dinelli M1. I, Moreira TN, Paulino ER, Da Rocha MC, Graciani FB, De Moraes-
Pinto MI. Immune status and risk perception of acquisition of vaccine prevent-
able diseases among health care workers. Am J Infect Control 2009;37:858-60.
2. Chehuen Neto JA, Sirimarc MT, Leite ICG, Gonçalves MPC, Delgado AA, Camilo
GB et 2. al. Undergraduates’ Immunization Status at the UFJF Medical School.
Rev Bras Educ Med 2010;34: 270-77.
3. Silveira, M.B.V. ; Perez, D.A. ; Yamaguti, A. ; Saraiva, E.Z. ; Borges, M.G. & Moraes-
Pinto, M.I. - Immunization status of Residents in Pediatrics at the Federal Uni-
versity of São Paulo, Brazil. Rev. Inst. Med. Trop. Sao Paulo, 53(2): 73-6, 2011.
4. Universal Immunization Program, MOHFW, GOI http://mohfw.nic.in/WriteRe-
adData/l892s/Immunization_UIP.pdf
5. Ana Flávia Granville-Garcia ,Eveline Sales Rocha,Raulison Vieira de
Sousa,Veruska Medeiros Martins, Andreza C. de L. Targino Massoni, Saul Mar-
tins Paiva; Knowledge of occupational diseases and immunization among
healthcare students; Rev Odonto Cienc 2011;26(3):215-221
6. Shwethashri R. Permi , Rahul Bhandary & Biju Thomas; Knowledge, awareness
and compliance among dental professionals regarding percutaneous exposure
incidents as occupational hazard; NUJHS Vol. 5, No.4, 2015, December ISSN
2249-7110
7. Anita Shankar Acharya, Priyanka, Jyoti Khandekar, and Damodar Bachani, As-
sessment of Knowledge and Practices regarding Injection Safety and Related Bio-
medical Waste Management amongst Interns in a Tertiary Care Teaching Hospi-
tal, Delhi; International Scholarly Research Notices Volume 2014 (2014), Article
ID 670861, 5 pages http://dx.doi.org/10.1155/2014/670861
8. Khan N, Ahmed SM, Khalid MM, Siddiqui SH, Merchant AA. Effect of gender and
age on the knowledge, attitude and practice regarding Hepatitis B and C and
vaccination status of Hepa-titis B among medical students of Karachi, Paki-stan.
J Pak Med Assoc 2010; 60(6):450-5.
9. Magdy A. Darwish and Nuha M. Al Khaldi. Knowledge about Hepatitis B Virus
Infection among Medical Students in University of Dammam, Eastern Region of
Saudi Arabia. Life Sci J 2013; 10(2):860-7.
10. Singh A, Jain S. Prevention of Hepatitis B; knowledge and practices among Medi-
cal students. Healthline 2011; 2(2):8-11.
11. Kasetty S, Mohania A, Dwivedi D, Tijare M, Kallianpur S and Gupta S. A Cross-
Sectional Study on the Knowledge of Hepatitis B Infection among Dental Profes-
sionals. J Virology Micro-biol 2013, Article ID 288280, DOI: 10.5171/2013.288280
12. Purushottam A. Giri, Deepak B. Phalke; Knowledge and vaccination status of
hepatitis B amongst medical interns of Rural Medical College, Loni, Maharash-
tra, India; South East Asia Journal of Public Health 2013;3(2):19-22
13. Singhal V, Bora D, Singh S. Prevalence of Hepatitis B virus infection in healthcare
workers of a tertiary care centre in India and their vaccination status. J Vaccines
Vaccin. 2011;2:118.
14. Serum Institute of India Limited. [Last accessed on 2013 Sep 10]. Available from:
http://www.seruminstitute.com/content/products/product_hepatitis.htm
15. Updated U.S. Public Health Service Guidelines for the Management of Occupa-
tional Exposures to HBV, HCV, and HIV and Recommendations for Postexposure
Prophylaxis. [Last accessed on 2013 Sep 10]. Available from: http://www.cdc.gov/
mmwr/preview/mmwrhtml/rr5011a1.htm .
INDIAN JOURNAL OF COMMUNITY HEALTH / VOL 28 / ISSUE NO 02 / APR – JUN 2016 [Determinants of Obesity…] | Chincholikar S et al
43
Citation
Chincholikar S, Sohani A. Epidemiological determinants of obesity in adolescent population, Maharastra, India. Indian J Comm Health. 2016; 28, 2: 157-162.
Source of Funding: Nil Conflict of Interest: None declared
This work is licensed under a Creative Commons Attribution 4.0 International License.
Abstract
ORIGINAL ARTICLE
Epidemiological determinants of obesity in adolescent population Maharastra, India. Sanjeev Chincholikar1, Amit Sohani2 1Professor, Department of Community Medicine, MIMER Medical College, Talegaon Dabhade, Pune – 410507; 2Medical officer, Z.P. Kolhapur, India
Abstract Introduction Methodology Results Conclusion References Citation Tables / Figures
Background: For establishing effective intervention, it is important to identify major determinants in an early stage of life. Effective prevention of adult obesity will require prevention and management of childhood obesity. Aims & Objectives: To study the epidemiological determinants of obesity in adolescent girls. Material & Methods: All adolescent school going boys and girls in the age group between 10 to 19 years were included as per definition of adolescent. 585 students were selected by systematic sample i.e. every 3rd student was included in the study sample. A pretested standardized questionnaire which consisted of questions related to sociodemographic data was used to screen the population for obesity. Results: When body mass index was correlated with various socioeconomic variables, it was found that prevalence of obesity was more in males (overweight- 20.84%;obese- 5.43%) as compared to females (overweight- 16.92%; obese-3.14%),more in the upper socioeconomic status (27.27%) as compared to lower socioeconomic status(15%),more in subjects with more frequency of junk food(30.97%) as compared to having occasional junk food (20.93),more in subjects with more frequency of eating sweets ( 25.73%) as compared to occasional sweet eaters(13.59%). Conclusion: The dietary habits like more frequency of junk food, more sweet consumption, and socioeconomic status had a major impact on body mass index of children.
Keywords
Sex; Socioeconomic Status; Body Mass Index; Junk Food
Introduction
Obesity is widely regarded as a pandemic with potentially disastrous consequences for human health.(1,2) It is perhaps the most prevalent form of malnutrition. 65% of the world's population live in countries where overweight and obesity kills more people than underweight. Available studies from Chennai and Delhi have shown prevalence of childhood obesity 6.2% and 7.4% respectively. (3) According to NHFS 3, in India 12.1% male and 16% female were either overweight or obese.(4) Many studies have shown that the prevalence of overweight among adolescent varies
between 10% to 30%. (5,6) For establishing effective intervention, it is important to identify major determinants in an early stage of life. Effective prevention of adult obesity will require prevention and management of childhood obesity. World Health Organization has also emphasized on urgent need of understanding the prevalence trend, factors contributing and developing strategies for effective intervention.
Aims & Objectives
1. To study the prevalence of overweight and obesity in adolescent population.
Corresponding Author
Address for Correspondence: Dr Sanjeev Chincholikar, Professor, Department of Community Medicine, MIMER Medical College, Talegaon Dabhade, Pune – 410507, Maharashtra, India E Mail ID: [email protected]
Received: 20/04/2016; Revision: 10/05/2016; Accepted: 26/05/2016; Published: 30/06/2016
Article Cycle
INDIAN JOURNAL OF COMMUNITY HEALTH / VOL 28 / ISSUE NO 02 / APR – JUN 2016 [Determinants of Obesity…] | Chincholikar S et al
158
2. To determine the association of obesity with some epidemiological determinants
Material & Methods
It was a cross sectional observational study that was carried out in 4 institutions (3 schools and 1 college) of semi-urban area of Maharashtra from Jan 2013 to Jan 2014. A pilot study of 100 adolescents was carried out for determining sample size and validating the questionnaire. Sample Size: It was found that the prevalence of obesity was 15%. Prevalence of obesity is between 10% to 30% in India as reported by various studies (10,11,12,13). Finding of pilot study confirm the prevalence as 15% in the reference population also. Therefore, considering prevalence of obesity in adolescent as 15%, with 95% confidence interval (α =0.05) power of test=80% (β=0.2), estimated sample size for adolescent population including 5% non- responsive error was 575. Actual study was carried out on 585 students. Out of all the schools and colleges which provided education up to 10th standard or above 10th standard were considered as reference population. As there were no government schools or colleges providing teaching up to 10th standard or above, thus only private schools and colleges were represented in data. Thus, reference population consisted of 17 schools and 3 colleges, all private. 3 schools and 1 college were selected by simple random sampling. 585 students were selected by systematic sample i.e. every 3rd student was included in the study sample. A pretested standardized questionnaire was used. Inclusion Criteria: All adolescent school going boys and girls in the age group between 10 to 19 years were included as per definition of adolescent. Definition: Height and weight of each individual was measured with the help of fiber plastic measuring tape up to the nearest millimeters and weighing scale up to the 0.5 kg respectively. Height was measured by asking the subject to stand erect without footwear on flat surface with heels together and upper limbs hanging closely to the sides of the body with the investigator standing on the left side of the subject. By placing hard cardboard on the head of the subject marking was made on the wall and later with the help of measuring tape height was calculated to the nearest millimeters. Before making the markings the head of the subject was positioned in such a way that the imaginary line drawn from tragus of the ear to the infra-orbital margin was
parallel to the ground. For the weight measurement standardized calibrated spring balance was used and subject was made to stand on platform of the balance without footwear. The weight was recorded nearest to 0.5 kg. Body mass index was calculated by dividing the weight in kilogram by square of height in meter. Ethical Clearance: The study was reviewed and approved by ethical committee of parent institute approved the study. It was also approved by the concerned committee of the Maharashtra University of Health Sciences Nashik. Permission for the study was obtained from respective in-charges of schools and colleges.
Results
It can be observed from table I that Prevalence of obesity was 4.5% while there were 20% overweight subjects. Prevalence of overweight and obesity was studied according to sex also and has been depicted in table II. It was observed from the table that prevalence of obesity in a male population was more as compared to females. Similarly, prevalence of overweight was also found more in male population. Majority of the male and female were in the age group 10 to 13 years of age i.e. early adolescent. Modified B.G. Prasad classification (2013), most widely used socio economic status classification, revealed that majority of the study population was from the upper socio economic status class. Only 6.49% subjects were from class IV. None belonged to class V. The table itself reflect the obvious reduction in obesity as socioeconomic class decrease. Owing to the unacceptable small value in one of the cells of the table, which would undermine the utility of chi- square test the data for class IV and class V were pooled for statistical analysis. As revealed from the table III, there was a statistically significant difference between socioeconomic status and prevalence of either overweight or obesity. χ2 = 10.1504, df=3, p < 0.05. Type of diet and frequency of meal has been studied with respect to prevalence of overweight and obesity. When association between prevalence of obesity and overweight with type of diet of study subjects was studied, it was observed from table IV that there was no statistically significant difference between the two, meaning that type of diet may not be related to overweight and obesity. χ2 = 0.31, df= 1, >0.05.

INDIAN JOURNAL OF COMMUNITY HEALTH / VOL 28 / ISSUE NO 02 / APR – JUN 2016 [Determinants of Obesity…] | Chincholikar S et al
159
It was observed that out of 165 students taking vegetarian diet, 21.82% students were either overweight or obesity. It was also found that 420 students were taking mixed diet but out of them only 24.29% were either overweight or obese. As mentioned in review of literature use of junk food is reported to be associated with obesity. Association of frequency of junk food with prevalence of overweight and obesity in study subjects is given in table. It can be seen from table V that use of junk food frequently has a role in development of overweight and obesity. It was observed that overweight and obesity was relatively less in those who take junk food occasionally (once in a week or less). It can be seen that 30.97% overweight subjects had frequent junk food. There was a significant association between frequency of junk food and prevalence of overweight as well as obesity. χ2 = 4.865957, df=1, p < 0.05. From table VI, It can be seen that consumption of junk food and sweets, frequently has a role in development of overweight and obesity. χ2 = 5.296657, df= 1, p < 0.05.
Discussion
The detailed study brought out some salient features about demographic information, social status and nutritional status of the study subjects which has been discussed as below. As revealed in table II, Prevalence of obesity in a male population was more as compared to females. Similarly, prevalence of overweight was also found more in male population. Goyal et al7in their study in 2010 found that age-adjusted prevalence of overweight was 14.3% among boys and 9.2% among girls. They also observed that prevalence of obesity was 2.9% in boys and 1.5% in girls. Kotian MS et al.(8) in their study in 2010, reported that, the prevalence of overweight among adolescents in both sexes was 9.9% and obesity was 4.8%. The prevalence of overweight was 9.3% among boys and 10.5% among girls; 5.2 and 4.3% were obese, respectively, which is comparable to our study. Arpita Mandal et al.(9) in their study recently, in Kolkata, India, evaluated 571 girls in the age group of 12 to 18 years. They observed that prevalence of overweight and obesity was 28.5% and 4.2% respectively. This prevalence of obesity in the above study is comparable to the prevalence of obesity among girls in our study. In a recently conducted study by Tabassum Nawab et al
(10) in Uttar Pradesh, it was found that prevalence of overweight and obesity was 9.8% and 4.8%, respectively. Prevalence of both overweight and obesity was higher among males. Similar findings are observed in our study. Considering the different opinions among various researchers regarding which sex is more commonly affected group, it appears that a large representative sample will be required for settling this question. It appears that occurrence of obesity varies according to socioeconomic status; very few subjects are from class IV showed presence of either overweight or obesity. It would mean that subjects belonging to upper socioeconomic class may have more risk of becoming obese than those in lower classes. This confirms that socioeconomic status is one of the important factors in deciding the obesity among the adolescent population. Several studies in different part of the world including India showed that higher socioeconomic class have higher rate of overweight and obesity. In developing countries it has been observed that children from the upper socio- economic strata are more likely to be obese than children from the lower socio-economic strata.(11) Marwaha et al.(12) in a study carried out in Delhi, observed that, among the upper socio-economic status children, prevalence of overweight and obesity was 17% and 5.6% in boys and 19% and 5.7% in girls, respectively, whereas in the lower socio economic status it was 2.7% and 0.4% in boys and 2.1% and 0.5% in girls, respectively. Unnithan and Syamakumari (13) also reported that the prevalence of overweight and obesity were higher among urban children. Goyal RK et al.(7) in their study in western India, observed that prevalence of overweight among children was higher in middle socioeconomic status as compared to high socioeconomic status group in both boys and girls whereas the prevalence of obesity was higher in high socio-economic status group as compared to middle socioeconomic status group. The prevalence of obesity as well as overweight in low socioeconomic status group was the lowest as compared to other group. One possible explanation for the different socioeconomic status - overweight and obesity relationship in developing countries such as India is that the influence of socioeconomic status on people’s lifestyles such as diet, food consumption patterns, and public services such as health care and transportation and physical activity may differ.
INDIAN JOURNAL OF COMMUNITY HEALTH / VOL 28 / ISSUE NO 02 / APR – JUN 2016 [Determinants of Obesity…] | Chincholikar S et al
160
Richer people have better access to meat and other energy-dense foods (which are much more expensive than other foods such as vegetables) than the poor. Middle socioeconomic status groups usually consume more vegetables and fruits. As revealed from table VI, there was statistically significant difference between frequency of eating sweets and prevalence of overweight as well as obesity. Obesity was more in study subjects who ate sweets frequently. 25.73% Students with overweight and obese subjects were frequent sweet eaters. Caprio S. et al (14) from America reported a strong association between sugar-sweetened beverages and prevalence of childhood obesity. Andrew A (15) in his study observed that overweight and obesity decreases as sugar-sweetened beverage consumption is reduced. Eating habits and prevalence of overweight and obesity: According to the WHO expert committee (16), high intakes of energy-dense micronutrient poor foods which is the case in most of fast food is convincingly related with unhealthy weight gain and there is a possible relation between the high proportion of intake of food prepared outside home and unhealthy weight gain. Increased intake of energy-dense foods that are high in sugars and fat but low in proteins, micronutrients, vitamins and minerals play important role in childhood obesity. (17) A diet containing more energy than needed may lead to prolonged postprandial hyperlipidemia and deposition of triglycerides in adipose tissue resulting in obesity. (18) From a practical point of view all hypothesis concerning the genesis of obesity could be put down to over-nutrition, to a hyper energy food intake. This is a sound basis for preventive and therapeutic recommendations. (19) There was a significant association between frequency of junk food, sweets with prevalence of overweight as well as obesity. These results correlate well with previous reports which suggest that junk food (bakery items, pizza, burger, cheese, butter, oily items) chocolate intake tends to be more common among overweight and obese adolescents than among normal-weight adolescents. (20,21) Hanley JG et al (22) concluded that low consumption of fruits, green vegetables, and milk; increasing consumption of snacks, sweets, and soft drinks; and skipping breakfast; these eating habits result in continuous increase in adiposity among children. Tarek Tawfi, K Amin et al (23) in their study revealed that lean students consumed
more servings of fruits; vegetables; and dairy products, including milk, while overweight and obese children consumed significantly higher servings of egg, potato (especially fried), carbonated soft drinks, sugary drinks, and sweets per day. They also observed frequency of eating out was high among overweight and obese children. Berkey CS et al (24) in their longitudinal study of preadolescent and adolescent boys and girls observed association between frequency of restaurant visit and obesity. Kotian MS et al (8) found that prevalence of overweight was higher in those adolescents who ate chocolates daily. Sameer H and Ghamdi Al (25) found a higher BMI in adolescent population who, ate more than three snacks per day. Goyal et al, (7) found a correlation between frequency of eating and overweight as well as obesity in adolescent population. They also observed correlation between junk food consumption and overweight as well as obesity
Conclusion
One thing that can be mentioned from the present study is that, as age increased gradually, students may have become cautious about their figure and health, and may have tried to consume less amounts of junk food, which was reflected in the lower prevalence rate of overweight, as well as obesity, in the higher age groups It can be concluded that the dietary habits like more frequency of junk food, more sweet consumption, and socioeconomic status are the factors which had a major impact on body mass index of children. These risk factors may be considered as potential determinants of obesity.
Recommendation
Obese students should be counselled for nutrition, psychological changes, behavioural changes, pharmacological management and surgical intervention if necessary.
Limitation of the study
Out of all the schools and colleges which provided education up to 10th standard or above 10th standard were considered as reference population. As there were no government schools or colleges providing teaching up to 10th standard or above, thus only private schools and colleges were represented in data. Moreover, this being institutionalized study, community based studies on a larger representative sample of adolescent children will be needed for
INDIAN JOURNAL OF COMMUNITY HEALTH / VOL 28 / ISSUE NO 02 / APR – JUN 2016 [Determinants of Obesity…] | Chincholikar S et al
161
confirming and quantifying the epidemiological determinants of obesity. The responses given by the study subjects at that were relied upon. Lastly, being a multifactorial disease all the associated risk factors could not be studied.
Authors Contribution
All the authors had made substantial contributions to conception, design, data collection, analysis and interpretation of data; drafting the article, revising it critically for important intellectual content; and final approval of the version to be published.
References 1. Park’s textbook of Preventive and Social Medicine: 22nd
Edition. Jabalpur India: BanarsidasBhanot Publishers; 2013; P. 367- 69.
2. Davidsons, Principles and Practice of Medicine. 21st edition, Churchill Livingstone Elsevierpublissher; 2011; P. 110.
3. Sidhu S, Kaur N, Kaur R. Overweight and obesity in affluent school children of Punjab. Ann Hum Biol. 2006 Mar- Apr;33(2):255-9. PubMed PMID: 16684697.[PubMed].
4. Bose K, Bisai S, Mukhopadhyay A, Bhadra M. Overweight and obesity among affluent Bengalee schoolgirls of Lake Town, Kolkata, India. Matern Child Nutr. 2007 Apr;3(2):141- 5. PubMed PMID: 17355446.[PubMed].
5. Aggarwal T, Bhatia RC, Singh D, Sobti PC. Prevalence of obesity and overweight in affluent adolescents from Ludhiana, Punjab. Indian Pediatr. 2008 Jun;45(6):500-2. PubMed PMID: 18599939.[PubMed].
6. Kaneriya Y, Singh P, Sharma D. Prevalence overweight and obesity in relation to socio economic conditions in two different groups of school age children of Udaypur city (Rajasthan). J Indian Assoc. community med 2006; 7:133-5.
7. Goyal RK, Shah VN, Saboo BD, Phatak SR, Shah NN, Gohel MC, Raval PB, Patel SS. Prevalence of overweight and obesity in Indian adolescent school going children: its relationship with socioeconomic status and associated lifestyle factors. J Assoc Physicians India. 2010 Mar;58:151- 8. PubMed PMID: 20848812.[PubMed].
8. Kotian MS, S GK, Kotian SS. Prevalence and determinants of overweight and obesity among adolescent school children of South karnataka, India. Indian J Community Med. 2010 Jan;35(1):176-8. doi: 10.4103/0970-0218.62587. PubMed PMID: 20606948; PubMed Central PMCID: PMC2888353.[PubMed].
9. Arpita M, Gopal Chandra M. Prevalence of overweight and obesity among the urban adolescent English Medium School girls of Kolkata, India. IJPH 2012;9(3):1-6
10. Nawab T, Khan Z, Khan IM, Ansari MA. Influence of behavioral determinants on the prevalence of overweight and obesity among school going adolescents of Aligarh. Indian J Public Health. 2014 Apr-Jun;58(2):121-4. doi: 10.4103/0019-557X.132289. PubMed PMID: 24820987.[PubMed]
11. Raj M, Sundaram KR, Paul M, Deepa AS, Kumar RK. Obesity in Indian children: time trends and relationship with hypertension. Natl Med J India. 2007 Nov-Dec;20(6):288- 93. PubMed PMID: 18335794.[PubMed].
12. Marwaha RK, Tandon N, Singh Y, Aggarwal R, Grewal K, Mani K. A study of growth parameters and prevalence of overweight and obesity in school children from delhi. Indian Pediatr. 2006 Nov;43(11):943-52. PubMed PMID: 17151397.[PubMed].
13. Unnithan AG, Syamakumari S. Prevalence of Overweight, Obesity and Underweight among School Going Children in Rural and Urban areas of Thiruvananthapuram Educational District, Kerala State (India). Internet J Nutr Wellness 2008.p. 6.Available from http://ispub.com/IJNW/6/2/7073.
14. Caprio S. Calories from soft drinks--do they matter? N Engl J Med. 2012 Oct 11;367(15):1462-3. doi: 10.1056/NEJMe1209884. Epub 2012 Sep 21. PubMed PMID: 22998341.[PubMed].
15. Bremer AA, Lustig RH. Effects of sugar-sweetened beverages on children. Pediatr Ann. 2012 Jan;41(1):26-30. doi: 10.3928/00904481-20111209-09. PubMed PMID: 22224718.[PubMed].
16. Diet, nutrition and the prevention of chronic diseases. World Health Organ Tech Rep Ser 2003;916:61-7.
17. Global Strategy on Diet, Physical Activity and Health. Available from: http://www.who.int/dietphysicalactivity/childhood_why/e n/index.html
18. Oliver M.Br. Med. Bull. 1981;37(1):49-58. 19. Oliver MF. Diet and coronary heart disease. Br Med Bull.
1981 Jan;37(1):49-58. Review. PubMed PMID: 7020866.[PubMed]
20. Klesges RC, Klesges LM, Eck LH, Shelton ML. A longitudinal analysis of accelerated weight gain in preschool children. Pediatrics. 1995 Jan;95(1):126-30. PubMed PMID: 7770289.[PubMed].
21. Wolfe WS, Campbell CC, Frongillo EA Jr, Haas JD, Melnik TA. Overweight schoolchildren in New York State: prevalence and characteristics. Am J Public Health. 1994 May;84(5):807-13. Erratum in: Am J Public Health. 2005 Jul;95(7):1093. PubMed PMID: 8179053; PubMed Central PMCID: PMC1615049.[PubMed].
22. Hanley AJ, Harris SB, Gittelsohn J, Wolever TM, Saksvig B, Zinman B. Overweight among children and adolescents in a Native Canadian community: prevalence and associated factors. Am J Clin Nutr. 2000 Mar;71(3):693-700. PubMed PMID: 10702161.[PubMed].
23. Amin TT, Al-Sultan AI, Ali A. Overweight and Obesity and their Association with Dietary Habits, and Sociodemographic Characteristics Among Male Primary School Children in Al-Hassa, Kingdom of Saudi Arabia. Indian J Community Med. 2008 Jul;33(3):172-81. doi: 10.4103/0970-0218.42058. PubMed PMID: 19876479; PubMed Central PMCID: PMC2763675.[PubMed].
24. Berkey CS, Rockett HR, Field AE, Gillman MW, Frazier AL, Camargo CA Jr, Colditz GA. Activity, dietary intake, and weight changes in a longitudinal study of preadolescent and adolescent boys and girls. Pediatrics. 2000 Apr;105(4):E56. PubMed PMID: 10742377.[PubMed].
25. Al-Ghamdi SH. The association between watching television and obesity in children of school-age in Saudi Arabia. J Family Community Med. 2013 May;20(2):83-9. doi: 10.4103/2230-8229.114767. PubMed PMID: 23983559; PubMed Central PMCID: PMC3748652.[PubMed].
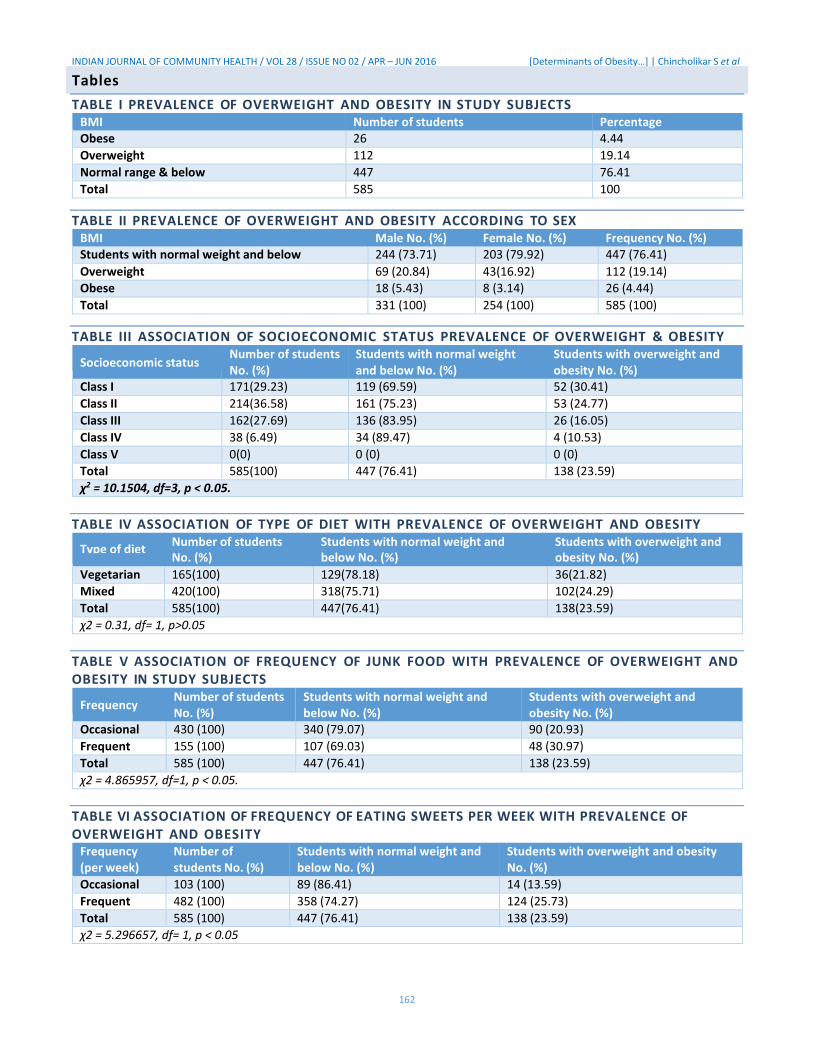
INDIAN JOURNAL OF COMMUNITY HEALTH / VOL 28 / ISSUE NO 02 / APR – JUN 2016 [Determinants of Obesity…] | Chincholikar S et al
162
TABLE I PREVALENCE OF OVERWEIGHT AND OBESITY IN STUDY SUBJECTS
BMI Number of students Percentage Obese 26 4.44
Overweight 112 19.14
Normal range & below 447 76.41
Total 585 100
TABLE II PREVALENCE OF OVERWEIGHT AND OBESITY ACCORDING TO SEX BMI Male No. (%) Female No. (%) Frequency No. (%) Students with normal weight and below 244 (73.71) 203 (79.92) 447 (76.41)
Overweight 69 (20.84) 43(16.92) 112 (19.14)
Obese 18 (5.43) 8 (3.14) 26 (4.44)
Total 331 (100) 254 (100) 585 (100)
TABLE III ASSOCIATION OF SOCIOECONOMIC STATUS PREVALENCE OF OVERWEIGHT & OBESITY
Socioeconomic status Number of students No. (%)
Students with normal weight and below No. (%)
Students with overweight and obesity No. (%)
Class I 171(29.23) 119 (69.59) 52 (30.41)
Class II 214(36.58) 161 (75.23) 53 (24.77)
Class III 162(27.69) 136 (83.95) 26 (16.05)
Class IV 38 (6.49) 34 (89.47) 4 (10.53)
Class V 0(0) 0 (0) 0 (0)
Total 585(100) 447 (76.41) 138 (23.59)
χ2 = 10.1504, df=3, p < 0.05.
TABLE IV ASSOCIATION OF TYPE OF DIET WITH PREVALENCE OF OVERWEIGHT AND OBESITY
Type of diet Number of students Students with normal weight and Students with overweight and No. (%) below No. (%) obesity No. (%)
Vegetarian 165(100) 129(78.18) 36(21.82)
Mixed 420(100) 318(75.71) 102(24.29)
Total 585(100) 447(76.41) 138(23.59)
χ2 = 0.31, df= 1, p>0.05
TABLE V ASSOCIATION OF FREQUENCY OF JUNK FOOD WITH PREVALENCE OF OVERWEIGHT AND OBESITY IN STUDY SUBJECTS
Frequency Number of students No. (%)
Students with normal weight and below No. (%)
Students with overweight and obesity No. (%)
Occasional 430 (100) 340 (79.07) 90 (20.93)
Frequent 155 (100) 107 (69.03) 48 (30.97)
Total 585 (100) 447 (76.41) 138 (23.59)
χ2 = 4.865957, df=1, p < 0.05.
TABLE VI ASSOCIATION OF FREQUENCY OF EATING SWEETS PER WEEK WITH PREVALENCE OF OVERWEIGHT AND OBESITY
Frequency (per week)
Number of students No. (%)
Students with normal weight and below No. (%)
Students with overweight and obesity No. (%)
Occasional 103 (100) 89 (86.41) 14 (13.59)
Frequent 482 (100) 358 (74.27) 124 (25.73)
Total 585 (100) 447 (76.41) 138 (23.59)
χ2 = 5.296657, df= 1, p < 0.05
Tables

Letters to the Editor
Indian Journal of Dermatology, Venereology, and Leprology | January-February 2016 | Vol 82 | Issue 1 101
Prognostically, primary cutaneous anaplastic large-cell 1996;87:3437-41.
lymphoma has low malignant potential despite the 5. ten Berge RL, Oudejans JJ, Ossenkoppele GJ, Pulford K, Willemze R, Falini B, et al. ALK expression in extranodal
morphologic features of non-Hodgkin’s lymphoma and anaplastic large cell lymphoma favours systemic disease
the high-grade histological appearance. Nevertheless, in with (primary) nodal involvement and a good prognosis and
view of the poorly understood prognostic factors, rapid occurs before dissemination. J Clin Pathol 2000;53:445-50.
6. Kumaran MS, Jithendriya M, Nagaraj P, Tirumalae R, disease progression and recurrences, early and effective Jayaseelan E. Anaplastic lymphoma kinase-positive primary
treatment may result in favorable long-term prognosis. cutaneous anaplastic large cell lymphoma – Is it a new variant?
Moreover, systemic anaplastic large-cell lymphoma Indian J Dermatol Venereol Leprol 2012;78:354-7.
7. Cerroni L, Gatter K, Kerl H, editors. Primary cutaneous
may initially present as isolated cutaneous lesions CD30+lymphoproliferative disorderes. In: Skin Lymphoma:
progressing to extra-cutaneous disease with regional The Illustrated Guide. 3rd ed. Oxford: Wiley-Blackwell; 2009.
nodal involvement, similar to our case, and eventually p. 66-86.
8. Massone C, El-Shabrawi-Caelen L, Kerl H, Cerroni L. The
with systemic disease from retrograde spread. morphologic spectrum of primary cutaneous anaplastic large T-cell lymphoma: A histopathologic study on 66 biopsy
Financial support and sponsorship specimens from 47 patients with report of rare variants. J Cutan Pathol 2008;35:46-53.
Nil. 9. Beljaards RC, Kaudewitz P, Berti E, Gianotti R, Neumann C, Rosso R, et al. Primary cutaneous CD30-positive large cell
Conflicts of interest lymphoma: Definition of a new type of cutaneous lymphoma with a favorable prognosis. A European Multicenter Study of
There are no conflicts of interest. 47 patients. Cancer 1993;71:2097-104. 10. MacKie RM, editor. Cutaneous lymphomas, pseudolymphomas
and histiocytosis X: Hodgkin’s disease. In: Skin Cancer: An Vikram K. Mahajan, Rashmi JindalVikram K. Mahajan, Rashmi Jindal Illustrated Guide to the Aetiology, Clinical Features, Pathology
Department of Dermatology, Venereology and Leprosy, Indira Gandhi and Management of Benign and Malignant Cutaneous Tumours. Medical College, Shimla, Himachal Pradesh, India 2nd ed. London: Martin Dunitz Ltd., 1996. p. 231-3.
11. Mukesh M, Shuttleworth D, Murray P. Primary cutaneous
AddressAddress forfor correspondence:correspondence: Dr. Vikram K. Mahajan, Hodgkin’s lymphoma. Clin Exp
Dermatol 2009;34:e673-5.
Department of Dermatology, Venereology and Leprosy, 12. Cerroni L, Gatter K, Kerl H, editors. Cutaneous manifestations
Dr. R. P. Govt. Medical College, (Tanda) - 176 001, of Hodgkin’s lymphoma. In: Skin Lymphoma: The Illustrated
Himachal Pradesh, India. Guide. 3 ed. Oxford: Wiley-Blackwell; 2009. p. 225-8. rd
E-mail: [email protected] This is an open access article distributed under the terms of the Creative Commons Attribution-NonCommercial-ShareAlike 3.0 License, which allows
RREFERENCESEFERENCES others to remix, tweak, and build upon the work non-commercially, as long as the
author is credited and the new creations are licensed under the identical terms.
1. Stein H, Mason DY, Gerdes J, O’Connor N, Wainscoat J, Pallesen G, et al. The expression of the Hodgkin’s disease Access this article online associated antigen Ki-1 in reactive and neoplastic lymphoid
tissue: Evidence that Reed-Sternberg cells and histiocytic Quick Response Code: Website:
malignancies are derived from activated lymphoid cells. Blood www.ijdvl.com 1985;66:848-58.
2. Newlove T, Loyd A, Patel R, Jelinek J, Latkowski JA. Primary DOI:
cutaneous anaplastic large-cell lymphoma. Dermatol Online J 10.4103/0378-6323.171643
2010;16:2. 3. Kempf W, Pfaltz K, Vermeer MH, Cozzio A, Ortiz-Romero PL,
Bagot M, et al. EORTC, ISCL, and USCLC consensus CD-30 positive lymphoproliferative disorders: Lymphomatoid papulosis and primary cutaneous anaplastic large-cell How to cite this article: Mahajan VK, Jindal R. Primary cutaneous lymphomas. Blood 2011;118:4024-35. anaplastic large cell lymphoma in a child simulating primary
4. DeCoteau JF, Butmarc JR, Kinney MC, Kadin ME. The t(2;5) cutaneous Hodgkin's disease. Indian J Dermatol Venereol Leprol chromosomal translocation is not a common feature of primary 2016;82:98-101. cutaneous CD30 lymphoproliferative disorders: Comparison
with anaplastic large-cell lymphoma of nodal origin. Blood Received: April, 2014. Accepted: May, 2015.
Pirfenidone induced phototoxic
reaction in an elderly man
Sir,
Pirfenidone is an antifibrotic and anti-inflammatory
agent used in the treatment of idiopathic pulmonary
fibrosis. It reduces fibroblast proliferation, inhibits
transforming growth factor- stimulated collagen
production and reduces the production of fibrogenic
mediators. Although photosensitivity and rash are
reported side effects in clinical trials, we were able to
find only a few previously published reports of this
adverse effect.[1]
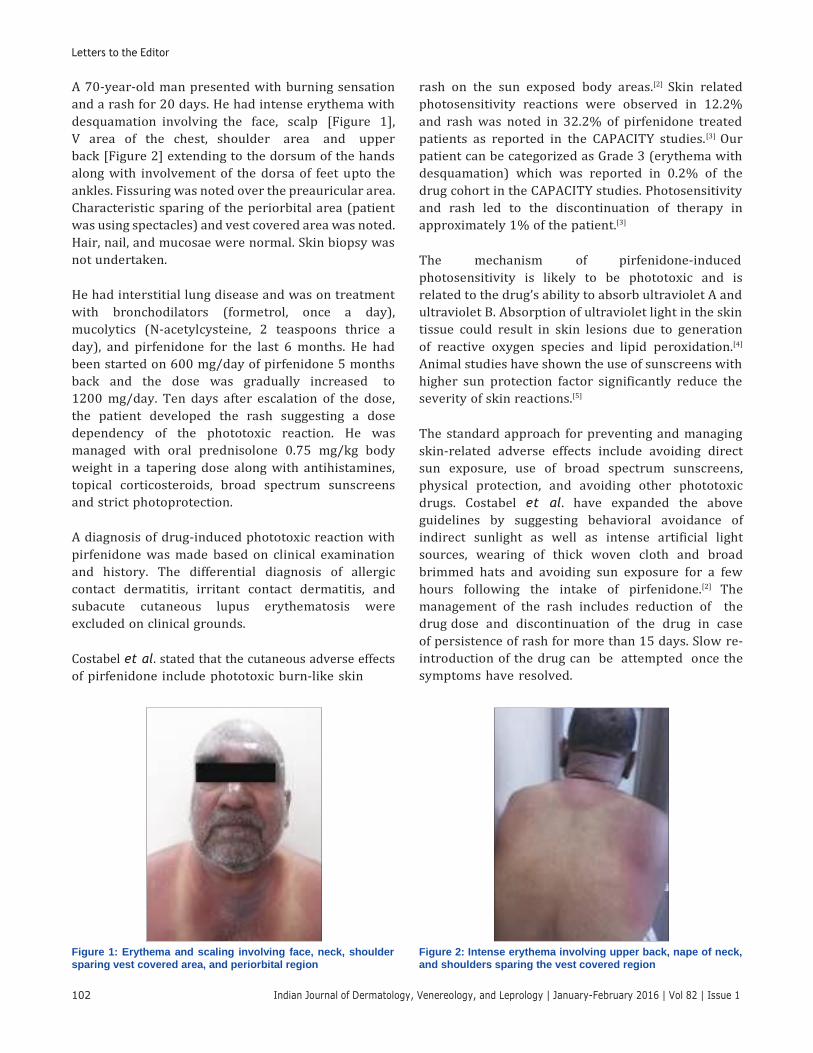
Letters to the Editor
A 70-year-old man presented with burning sensation
and a rash for 20 days. He had intense erythema with
desquamation involving the face, scalp [Figure 1],
V area of the chest, shoulder area and upper
back [Figure 2] extending to the dorsum of the hands
along with involvement of the dorsa of feet upto the
ankles. Fissuring was noted over the preauricular area.
Characteristic sparing of the periorbital area (patient
was using spectacles) and vest covered area was noted.
Hair, nail, and mucosae were normal. Skin biopsy was
not undertaken.
He had interstitial lung disease and was on treatment
with bronchodilators (formetrol, once a day),
mucolytics (N-acetylcysteine, 2 teaspoons thrice a
day), and pirfenidone for the last 6 months. He had
been started on 600 mg/day of pirfenidone 5 months
back and the dose was gradually increased to
1200 mg/day. Ten days after escalation of the dose,
the patient developed the rash suggesting a dose
dependency of the phototoxic reaction. He was
managed with oral prednisolone 0.75 mg/kg body
weight in a tapering dose along with antihistamines,
topical corticosteroids, broad spectrum sunscreens
and strict photoprotection.
A diagnosis of drug-induced phototoxic reaction with
pirfenidone was made based on clinical examination
and history. The differential diagnosis of allergic
contact dermatitis, irritant contact dermatitis, and
subacute cutaneous lupus erythematosis were
excluded on clinical grounds.
Costabel et al. stated that the cutaneous adverse effects
of pirfenidone include phototoxic burn-like skin
rash on the sun exposed body areas.[2] Skin related
photosensitivity reactions were observed in 12.2%
and rash was noted in 32.2% of pirfenidone treated
patients as reported in the CAPACITY studies.[3] Our
patient can be categorized as Grade 3 (erythema with
desquamation) which was reported in 0.2% of the
drug cohort in the CAPACITY studies. Photosensitivity
and rash led to the discontinuation of therapy in
approximately 1% of the patient.[3]
The mechanism of pirfenidone-induced
photosensitivity is likely to be phototoxic and is
related to the drug’s ability to absorb ultraviolet A and
ultraviolet B. Absorption of ultraviolet light in the skin
tissue could result in skin lesions due to generation
of reactive oxygen species and lipid peroxidation.[4]
Animal studies have shown the use of sunscreens with
higher sun protection factor significantly reduce the
severity of skin reactions.[5]
The standard approach for preventing and managing
skin-related adverse effects include avoiding direct
sun exposure, use of broad spectrum sunscreens,
physical protection, and avoiding other phototoxic
drugs. Costabel et al. have expanded the above
guidelines by suggesting behavioral avoidance of
indirect sunlight as well as intense artificial light
sources, wearing of thick woven cloth and broad
brimmed hats and avoiding sun exposure for a few
hours following the intake of pirfenidone.[2] The
management of the rash includes reduction of the
drug dose and discontinuation of the drug in case
of persistence of rash for more than 15 days. Slow re-
introduction of the drug can be attempted once the
symptoms have resolved.
Figure 1: Erythema and scaling involving face, neck, shoulder
sparing vest covered area, and periorbital region
Figure 2: Intense erythema involving upper back, nape of neck,
and shoulders sparing the vest covered region
102 Indian Journal of Dermatology, Venereology, and Leprology | January-February 2016 | Vol 82 | Issue 1
Letters to the Editor
Indian Journal of Dermatology, Venereology, and Leprology | January-February 2016 | Vol 82 | Issue 1 103
AAnal canal adenocarcinoma in a nal canal adenocarcinoma in a treatmentsmay be associated with an increased risk
of malignancy because of their immunosuppressive
patient with psoriasis treated withpatient with psoriasis treated with properties. Various case reports have linked them to
eetanercepttanercept the development of malignancies such as skin cancers
and lymphoma.[1] We report a case of anal canal
adenocarcinoma that developed after 10 months of
Sir, twice weekly etanercept for psoriasis.
Psoriasis is a chronic inflammatory disease that can
affect the skin and joints. The treatment of psoriasis A 58-year-old man was diagnosed with psoriasis 3 years
varies depending on disease severity and includes ago. The patient underwent a number of systemic
topical and systemic therapies. Among the latter are treatments and had not taken any other medication
biological agents that target cellular immunity. The except etanercept for about 10 months before the
success of biological treatments in patients with onset of anal symptoms. He had started treatment with
psoriasis has generated much enthusiasm within etanercept, 25 mg twice weekly subcutaneously about
the dermatology community. However, biological 1 year previously and had tolerated etanercept well.
As pirfenidone is also associated with gastrointestinal
and neurological side effects, these also need to be
carefully monitored. Dose reduction can lessen the
gastrointestinal and dermatological side effects.[6]
Declaration of patient consent
The authors certify that they have obtained all
appropriate patient consent forms. In the form the
patient(s) has/have given his/her/their consent for his/
her/their images and other clinical information to be
reported in the journal. The patients understand that
their names and initials will not be published and
due efforts will be made to conceal their identity, but
anonymity cannot be guaranteed.
Financial support and sponsorship
Nil.
Conflicts of interest
The authors have obtained appropriate patient consent
for the information published in this article.
RRohini Pradip Gaikwad, Samipa S. Mukherjee1
Department of Dermatology, Venereology and Leprosy, MIMER
Medical College, Talegaon Dabhade, Maharashtra, 1Department of
Dermatology, Bangalore Medical College and Research Institute,
Bengaluru, Karnataka, India
Address for correspondence: Dr. Rohini Pradip Gaikwad,
Flat Number 5, Hindustan Arcade,
Tingrenagar Road, Vishrantvadi, Pune - 411 015,
Maharashtra, India.
E-mail: [email protected]
fibrosis. Pneumon 2013;26:92. 2. Costabel U, Bendstrup E, Cottin V, Dewint P, Egan JJ,
Ferguson J, et al. Pirfenidone in idiopathic pulmonary fibrosis: Expert panel discussion on the management of drug-related adverse events. Adv Ther 2014;31:375-91.
3. Noble PW, Albera C, Bradford WZ, Costabel U, Glassberg MK, Kardatzke D, et al. Pirfenidone in patients with idiopathic pulmonary fibrosis (CAPACITY): Two randomised trials. Lancet 2011;377:1760-9.
4. Seto Y, Inoue R, Kato M, Yamada S, Onoue S. Photosafety assessments on pirfenidone: Photochemical, photobiological, and pharmacokinetic characterization. J Photochem Photobiol B 2013;120:44-51.
5. Pharmaceuticals and Medical Devices Agency Japan. Pirfenidone Report. Available from: http://www. pmda. go.jp/english/service/pdf/drugs/pirespa_oct2008_e.pdf. [Last accessed on 2014 Mar 18]
6. Jiang C, Huang H, Liu J, Wang Y, Lu Z, Xu Z. Adverse events of pirfenidone for the treatment of pulmonary fibrosis: A meta-analysis of randomized controlled trials. PLoS One 2012;7:e47024.
This is an open access article distributed under the terms of the Creative
Commons Attribution-NonCommercial-ShareAlike 3.0 License, which allows
others to remix, tweak, and build upon the work non-commercially, as long as the
author is credited and the new creations are licensed under the identical terms.
Access this article online
Quick Response Code: Website:
www.ijdvl.com
DOI:
10.4103/0378-6323.172899
REFERENCES
1. Koulelidis A, Zacharis G, Dolios P, Zouvelekis AT. Pirfenidone
photosensitivity rash in a patient with idiopathic pulmonary
How to cite this article: Gaikwad RP, Mukherjee SS. Pirfenidone
induced phototoxic reaction in an elderly man. Indian J Dermatol
Venereol Leprol 2016;82:101-3.
Received: February, 2015. Accepted: September, 2015.
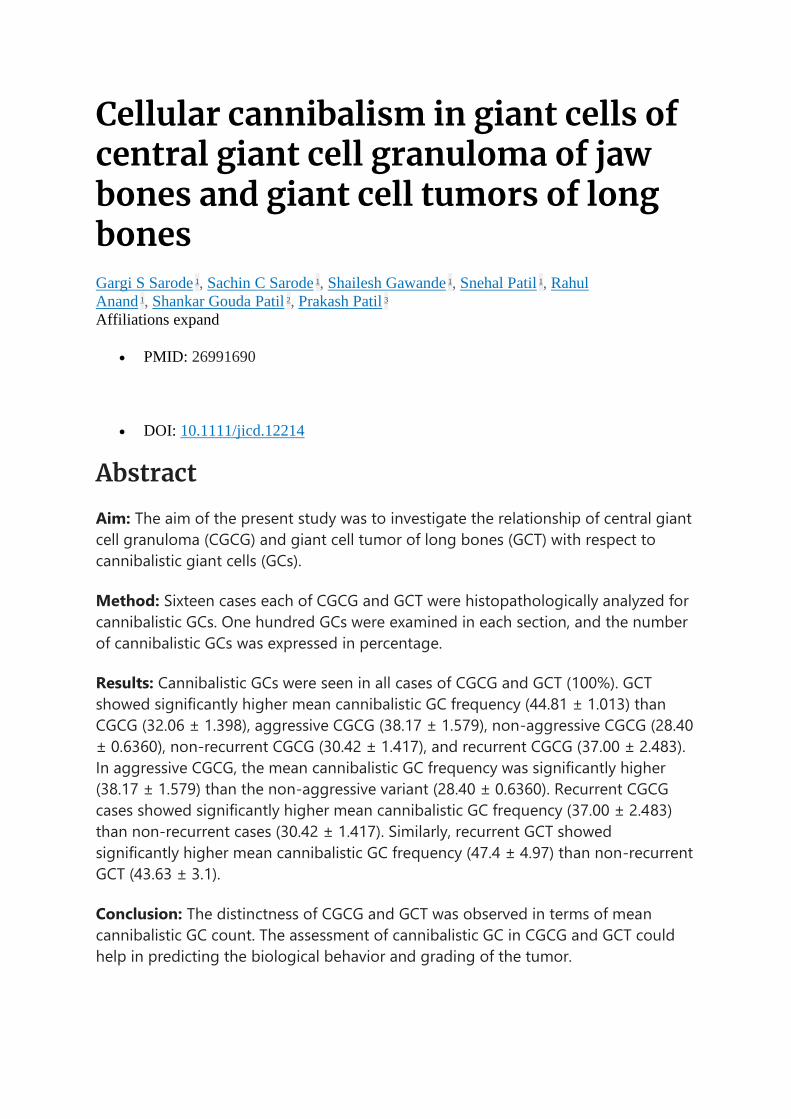
Cellular cannibalism in giant cells of central giant cell granuloma of jaw bones and giant cell tumors of long bones Gargi S Sarode 1, Sachin C Sarode 1, Shailesh Gawande 1, Snehal Patil 1, Rahul
Anand 1, Shankar Gouda Patil 2, Prakash Patil 3
Affiliations expand
• PMID: 26991690
• DOI: 10.1111/jicd.12214
Abstract
Aim: The aim of the present study was to investigate the relationship of central giant
cell granuloma (CGCG) and giant cell tumor of long bones (GCT) with respect to
cannibalistic giant cells (GCs).
Method: Sixteen cases each of CGCG and GCT were histopathologically analyzed for
cannibalistic GCs. One hundred GCs were examined in each section, and the number
of cannibalistic GCs was expressed in percentage.
Results: Cannibalistic GCs were seen in all cases of CGCG and GCT (100%). GCT
showed significantly higher mean cannibalistic GC frequency (44.81 ± 1.013) than
CGCG (32.06 ± 1.398), aggressive CGCG (38.17 ± 1.579), non-aggressive CGCG (28.40
± 0.6360), non-recurrent CGCG (30.42 ± 1.417), and recurrent CGCG (37.00 ± 2.483).
In aggressive CGCG, the mean cannibalistic GC frequency was significantly higher
(38.17 ± 1.579) than the non-aggressive variant (28.40 ± 0.6360). Recurrent CGCG
cases showed significantly higher mean cannibalistic GC frequency (37.00 ± 2.483)
than non-recurrent cases (30.42 ± 1.417). Similarly, recurrent GCT showed
significantly higher mean cannibalistic GC frequency (47.4 ± 4.97) than non-recurrent
GCT (43.63 ± 3.1).
Conclusion: The distinctness of CGCG and GCT was observed in terms of mean
cannibalistic GC count. The assessment of cannibalistic GC in CGCG and GCT could
help in predicting the biological behavior and grading of the tumor.

Keywords: cannibalistic giant cell; cellular cannibalism; central giant cell granuloma;
giant cell; giant cell tumor.
© 2016 John Wiley & Sons Australia, Ltd.
Comment in
Related Documents