Actuarial Study November 20, 2015 Milliman Client Report Nebraska Department of Insurance Affordable Care Act Impact Study Prepared for: Nebraska Department of Insurance Prepared by: Milliman, Inc. Timothy F. Harris, FSA, MAAA Principal & Consulting Actuary Robert M. Damler, FSA, MAAA Principal & Consulting Actuary

Welcome message from author
This document is posted to help you gain knowledge. Please leave a comment to let me know what you think about it! Share it to your friends and learn new things together.
Transcript
Actuarial Study November 20, 2015
Milliman Client Report
Nebraska Department of Insurance Affordable Care Act Impact Study
Prepared for: Nebraska Department of Insurance Prepared by: Milliman, Inc. Timothy F. Harris, FSA, MAAA Principal & Consulting Actuary Robert M. Damler, FSA, MAAA Principal & Consulting Actuary

Milliman Client Report
Actuarial Study Page 1 November 20, 2015
TABLE OF CONTENTS I. EXECUTIVE SUMMARY ................................................................................................... 1
II. PURPOSE AND SCOPE OF THIS STUDY ............................................................................ 4
III. LIMITATIONS AND DATA RELIANCE TO THIS STUDY ........................................................ 5
IV. AFFORDABLE CARE ACT (ACA) ......................................................................................... 6
V. CURRENT NEBRASKA POPULATION DATA ...................................................................... 7
a. Current Health Insurance Status of Population in Nebraska ........................................... 7
b. Current Health Status of Population in Nebraska ......................................................... 14
c. Health Insurance Coverage Affordability in Nebraska .................................................. 16
d. Carrier Market Share by Coverage Type ....................................................................... 18
e. Number Uninsured by Rating Region in Nebraska ........................................................ 24
f. Barriers to Coverage ..................................................................................................... 25
VI. POST‐ACA INSURED/UNINSURED POPULATION PROJECTIONS ..................................... 29
VII. QUALIFICATIONS .......................................................................................................... 35
VIII. APPENDICES
A. Technical Details on Population Modeling
B. Rating Region by Counties
C. Acronyms and Terminology
D. Health and Human Services Enrollment Data Summary for Nebraska
Milliman Client Report
Actuarial Study Page 1 November 20, 2015
I. EXECUTIVE SUMMARY
The Nebraska Department of Insurance (NDOI) engaged Milliman, Inc. (Milliman) to update the demographic portion of a past study titled “Health Insurance Exchange Planning Overview and Recommendations”. The past study also included actuarial projections of the insured status of Nebraska’s population. The current report provides a detailed overview of the 2014 and 2015 health insurance market in Nebraska and the potential impacts that the Federally Facilitated Marketplace (FFM) may have in the years following its introduction. The results shown in this report represent an estimate of the future market projections; and, there is still significant uncertainty surrounding these projections. This uncertainty stems from many sources, including the use of existing data sources with potential imperfections, evolving legislative, regulatory and judicial guidance, changing economic conditions, and unpredictable reactions of the many stakeholders within the health insurance market. One or a combination of any of these factors could result in actual experience differing from our projections. The current report is subject to the caveats and limitations described in Section III of this report. In addition, readers should not solely rely on the following executive summary, but should instead consider the entirety of the full report prior to drawing any conclusions. AFFORDABLE CARE ACT (ACA)
The ACA requires health insurance plans both inside and outside the FFM and Federally Facilitated Small‐Business Health Options Program (FF‐SHOP) to offer health insurance to individuals regardless of health status and to cover a minimal set of services. Health insurance premiums variations are now limited to age, location, family status, and tobacco usage. The ACA also introduced penalties to individuals for not obtaining health insurance coverage and to employers for not covering their full‐time employees. On November 14, 2013 the United State Federal Government announced that it would allow non‐ACA compliant plans to continue into 2014 as long as they were purchased prior to January 1, 2014. More recently, this transitional policy was extended to allow these plans to exist until October 1, 2016. Each state was allowed to approve or deny the provision to allow transitional policies in their state. Nebraska has chosen to allow those who purchased and still hold health insurance plans prior to January 1, 2014 to continue to hold these plans until October 1, 2016. The ACA also includes an option for states to expand their Medicaid programs. The possible expansion includes all U.S. citizens and qualified legal immigrants who are not eligible for Medicare and with household income up to 133% of the federal poverty level (FPL) based on modified adjusted gross income (MAGI), or 138% of FPL including a 5% income disregard. This report acknowledges that Nebraska is one of 19 states that declined to expand Medicaid.
Milliman Client Report
Actuarial Study Page 2 November 20, 2015
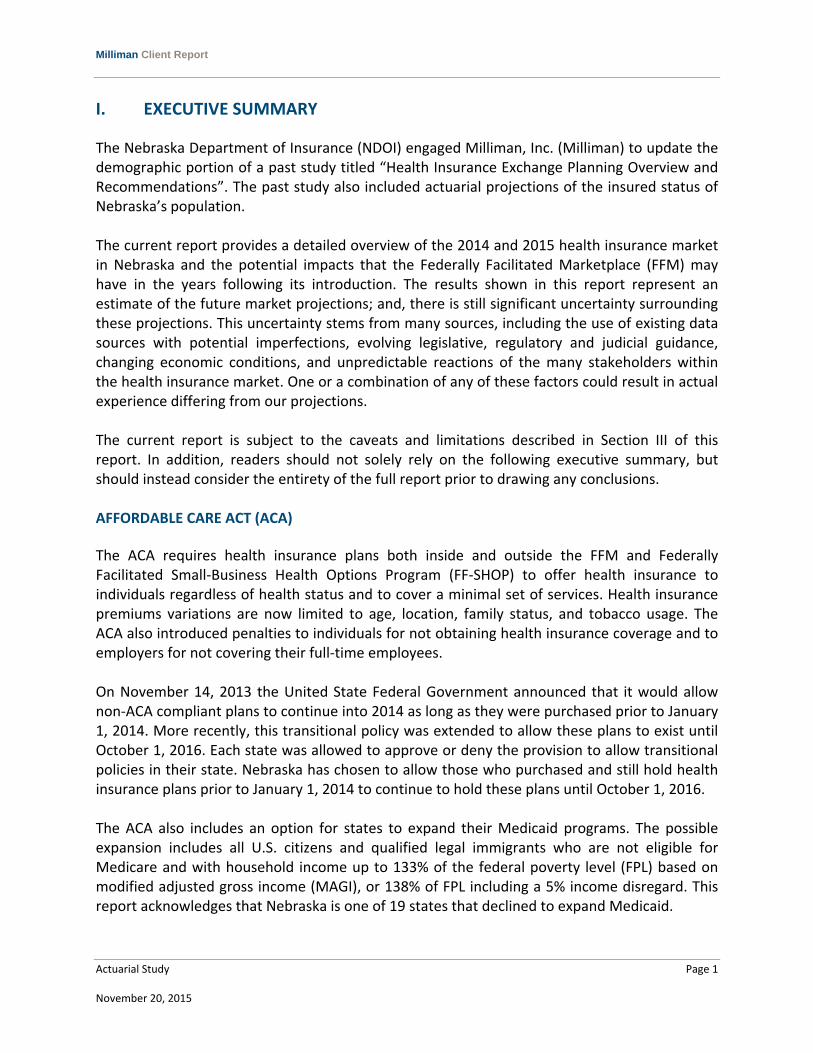
The graph in Figure 1 shows the distribution of the health insurance market of Nebraska and the United States for calendar years 2013 and 2014. The percentage distribution is based on the total population for the particular year.
Source: U.S. Census: Current Population Survey (CPS). http://www.census.gov/cps/data/cpstablecreator.html CHIP (Children’s Health Insurance Program) VA (U.S. Department of Veterans Affairs) Note: “Private” refers to those who self‐reported private health insurance, but did not specify which type of private health insurance.
0%
5%
10%
15%
20%
25%
30%
35%
Percentage
of To
tal Population
Figure 1Nebraska and U.S. Distribution of Health insurance Market
By Total Population for 2013 and 2014
NE 2013 Est. Total Pop. 1,849,000 US 2013 Est. Total Pop. 310,647,000
NE 2014 Est. Total Pop. 1,838,000 US 2014 Est. Total Pop. 312,966,000

Milliman Client Report
Actuarial Study Page 3 November 20, 2015
KEY OBSERVATIONS
Some key observations regarding Nebraska’s sources of health insurance coverage include:
From 2013 to 2014, U.S. Census Data reported that the number of uninsured dropped by 26.4%. The entirety of this reduction cannot be attributed to the introduction of the FFM nor to the individual mandate, however the influence of the ACA was likely the primary reason for the decline.
During that same time period, individual coverage for those inside and outside of the FFM increased by 21.4%. Participation in individual coverage increased in all income levels above 100% FPL.
Premiums in the FFM increased significantly after the first open enrollment in 2014. From early 2014 to early 2015, the average premium offered in the FFM increased from 15% to 34% depending on the rating region.
The FFM offers a new level of affordability for a subset of the population. In 2015, the average silver‐tiered health insurance plan offered in the FFM for someone 40 years of age had a premium ranging from $331.52 per month to $369.06, as premiums vary by region within Nebraska. According to the Center for Medicare and Medicaid Services (CMS) Office of The Assistant Secretary for Planning and Evaluation (ASPE) Issue Brief released in March of 2015, of those that enrolled in the FFM 59% paid less than $100 per month after considering federal premium subsidies, also known as advanced premium tax credits (APTC).1
According to U.S. Census Data, enrollment in individual coverage varied greatly by age. Between 2013 and 2014, the number covered by individual coverage between the age of 35 and 64 increased by 51% while enrollment decreased for those under the age of 35.
Despite the individual mandate, federal subsidies, and the FFM’s introduction our projections estimate over 70,000 Nebraskans will remain uninsured by 2025 due to a number of factors. The most prominent of these factors include the presence of undocumented people living in Nebraska, the coverage gap for those under 100% FPL who do not qualify for Medicaid, and the presence of political and/or belief systems that do not permit health insurance coverage.
Implementation of the ACA, has impacted, and will continue to impact, how healthcare is accessed for a large number of Nebraska residents. While the exact impacts of the ACA are not known, this study uses a model developed by Milliman to illustrate the potential landscape of the Nebraska Health Insurance Market once aspects of both the FFM and FF‐SHOP are established and enrollment has settled. Our estimates take into account the potential behavior of individuals and employers based on their income level, age, and health status.
1 Health Insurance Marketplaces 2015 Open Enrollment Period: March Enrollment Report http://aspe.hhs.gov/health/reports/2015/MarketPlaceEnrollment/Mar2015/ib_2015mar_enrollment.pdf

Milliman Client Report
Actuarial Study Page 4 November 20, 2015
II. PURPOSE AND SCOPE OF THIS STUDY While the full impact of the Affordable Care Act (ACA) is still unknown to a great extent, this study uses a model developed by Milliman to illustrate the potential landscape of the health insurance market after full implementation and effects of the ACA are realized. These estimates take into account the potential behavior of individuals and employers based on their income level, age, and health status. Health status is a relative measure that considers illness burden after controlling for other variables, including age/gender distribution, provider reimbursement levels, access to providers, and benefit plan coverage.
Milliman Client Report
Actuarial Study Page 5 November 20, 2015
III. LIMITATIONS AND DATA RELIANCE FOR THIS STUDY
This report is intended to provide actuarial projections of health insurance coverage in the State of Nebraska in the years following the introduction of the ACA. It is Milliman’s understanding that the Nebraska Department of Insurance (NDOI) will use this report to understand the potential impacts of the ACA on certain NDOI programs and the services they provide. The report may not be suitable for other purposes. This report has been prepared solely for the internal use of, and is only to be relied upon by, the NDOI. Although Milliman understands that this report may be distributed to third parties, Milliman does not intend to benefit, or create a legal duty to, any third party recipient of its work. If this report is distributed to third parties, it should be distributed only in its entirety.
The results in this report are technical in nature and dependent upon specific assumptions and methods. No party should rely upon this report without a thorough understanding of those assumptions and methods.
Differences between the projections contained in this analysis and actual future experience depend on the extent to which future experience conforms to the assumptions made for this analysis. It is certain that actual experience will not conform exactly to the assumptions used in this analysis. Actual experience will deviate from these projections because of a variety of influences, including emerging experience, changes in enrollee and eligible activities, changes in health insurance products and practices, and adjustments to reflect new regulations. The projections included in this report are based on Milliman’s understanding of the ACA and its associated regulations issued to date. Forthcoming ACA‐related regulations and additional legislation may materially change the impact of the ACA, necessitating an update to the projections included in this report. For this reason, this report should be considered time‐sensitive material, which may change as new information becomes available. In developing the projections, Milliman relied on data and other information provided by NDOI, Nebraska’s health insurance carriers and other public sources of information. Milliman did not audit or verify this data and other information. Milliman performed a limited review of the data used directly in its analysis for reasonableness and consistency. If the underlying data or information is inaccurate or incomplete, the results of the analysis may likewise be inaccurate or incomplete. Milliman’s consultants are not attorneys and are not qualified to give legal advice. Milliman recommends that users of this report consult with their own legal counsel regarding interpretation of legislation and administrative rules, possible implications of specific ACA‐required features, or other legal issues related to the implementation of an ACA‐compliant entity.
Milliman Client Report
Actuarial Study Page 6 November 20, 2015
IV. AFFORDABLE CARE ACT (ACA) The primary ACA requirements for the commercial employer‐sponsored health insurance (ESI) small group and individual health insurance markets, both inside and outside the Federally Facilitated Marketplace (FFM), include:
Guaranteed issue of health insurance coverage regardless of preexisting medical conditions or health status.
Adjusted community rating with premium rate variations only for benefit plan design, geographic location, age rating (limited to ratio of 3:1), family status, and tobacco usage (limited to ratio of 1.5:1).
Premium rate consistency among plans offered inside and outside the FFM.
Definition and requirements of the Essential Health Benefits (EHB) which are necessary for a plan to be considered qualified health insurance.
Individual tax penalty if not covered by minimum essential health insurance coverage. The tax penalty is the larger of 1% of household income or $95 per year for an uninsured adult in 2014, the larger of 2% of household income or $325 per year for an uninsured adult in 2015. The penalty then increases to the larger of 2.5% of household income or $695 in 2016 and then remains at that level. Each uninsured child in the household is penalized half as much. Note a delay has been introduced for this rule allowing health insurance companies to continue plans that do not meet these requirements into 2016 to those that were already enrolled in the plans by January, 2014. The EHBs will be required for all plans renewed on or after October 1, 2016.
Employer tax penalty if not offering qualified health insurance coverage (groups under 50 employees are exempt). The employer tax penalty is designed to penalize companies of a particular size for not providing health insurance to its full time workers. The penalty can vary from $2,000 to $3,000 for each employee that receives a federal subsidy for coverage per year. Note the implementation of this penalty was recently delayed until 2015 for large employers. Employers with between 50 and 99 employees are exempt until their plan year starting in 2016.
Milliman Client Report
Actuarial Study Page 7 November 20, 2015
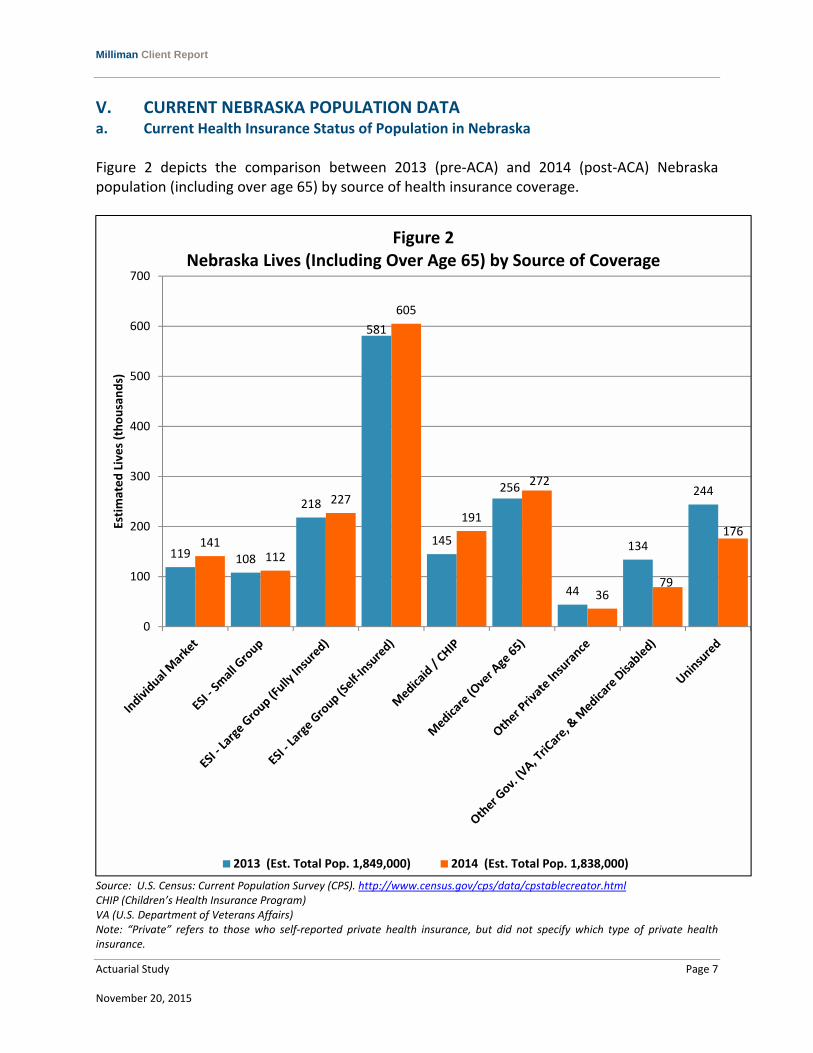
V. CURRENT NEBRASKA POPULATION DATA a. Current Health Insurance Status of Population in Nebraska Figure 2 depicts the comparison between 2013 (pre‐ACA) and 2014 (post‐ACA) Nebraska population (including over age 65) by source of health insurance coverage.
Source: U.S. Census: Current Population Survey (CPS). http://www.census.gov/cps/data/cpstablecreator.html CHIP (Children’s Health Insurance Program) VA (U.S. Department of Veterans Affairs) Note: “Private” refers to those who self‐reported private health insurance, but did not specify which type of private health insurance.
119 108
218
581
145
256
44
134
244
141112
227
605
191
272
3679
176
0
100
200
300
400
500
600
700
Estimated Lives (thousands)
Figure 2Nebraska Lives (Including Over Age 65) by Source of Coverage
2013 (Est. Total Pop. 1,849,000) 2014 (Est. Total Pop. 1,838,000)

Milliman Client Report
Actuarial Study Page 8 November 20, 2015
Employer coverage is comprised of small groups under 50 employees and large groups over 50 employees. Large group contains both fully insured and self‐insured groups. From the Center for Medicare and Medicaid Services (CMS) Medical Loss Ratio (MLR) data, Milliman derived a ratio to break down the employer category into small group, large group fully insured, and large group self‐insured. For the small group, Milliman used the ratio of the total number of covered lives from the MLR small group data set to the total covered by employers. Likewise Milliman derived the ratio for large group fully insured in the same manner. To determine the percentage for large group self‐insured, Milliman subtracted both the small group and large group fully insured percentages from the total covered by employers from U.S. Census Data. All three of these ratios have been applied to Figures 1‐6 to determine the population in the categories of small group, large group fully insured, and large group self‐insured. Figure 3 provides the total market population and the percentage of the total population for each health insurance market for Nebraska and the United States.
Source: U.S. Census: Current Population Survey. http://www.census.gov/cps/data/cpstablecreator.html * Large Group is broken down into Fully Insured and Self‐Insured. ** Includes VA, TriCare, and Medicare Disabled. Note: “Private” refers to those who self‐reported private health insurance, but did not specify which type of private health insurance. Compared to the national average, Nebraska had a larger percentage of the population attain their insurance coverage through individual coverage, and in 2014 the size of the individual market increased at a higher rate in Nebraska. The uninsured rate in Nebraska decreased by 3.6% from 2013 to 2014 compared to a 2.0% decrease in the national uninsured rate. Future census data will better discern the actual reduction in uninsured rate realized in 2014 from statistical noise.
NE US NE US NE US NE US
Individual 118,897 11,079,447 6.4% 3.6% 141,412 13,024,369 7.7% 4.2%
Small Group (0‐50) 107,828 17,046,417 5.8% 5.5% 112,270 17,012,181 6.1% 5.4%
Large Group (51+)*
Fully Insured 218,131 34,484,065 11.8% 11.1% 227,116 34,414,807 12.4% 11.0%
Self‐Insured 580,595 91,785,615 31.4% 29.5% 604,512 91,601,272 32.9% 29.3%
Medicaid/CHIP 145,308 43,374,117 7.9% 14.0% 190,827 48,597,331 10.4% 15.5%
Medicare (Aged) 256,341 43,287,435 13.9% 13.9% 271,624 44,507,600 14.8% 14.2%
Private 44,316 4,879,275 2.4% 1.6% 35,895 5,579,654 2.0% 1.8%
Other Government** 133,835 17,474,910 7.2% 5.6% 78,637 17,004,390 4.3% 5.4%
Uninsured 243,552 47,236,398 13.2% 15.2% 176,167 41,223,695 9.6% 13.2%
Total 1,848,803 310,647,679 1,838,460 312,965,299
Figure 3
Nebraska (NE) and United States (US) Population (Including Over Age 65)
By Market Population and Percentage of Total Population
Calendar Year 2013 (pre‐ACA) & 2014 (post‐ACA)
Market2013 2013 (%) 2014 2014 (%)
Milliman Client Report
Actuarial Study Page 9 November 20, 2015
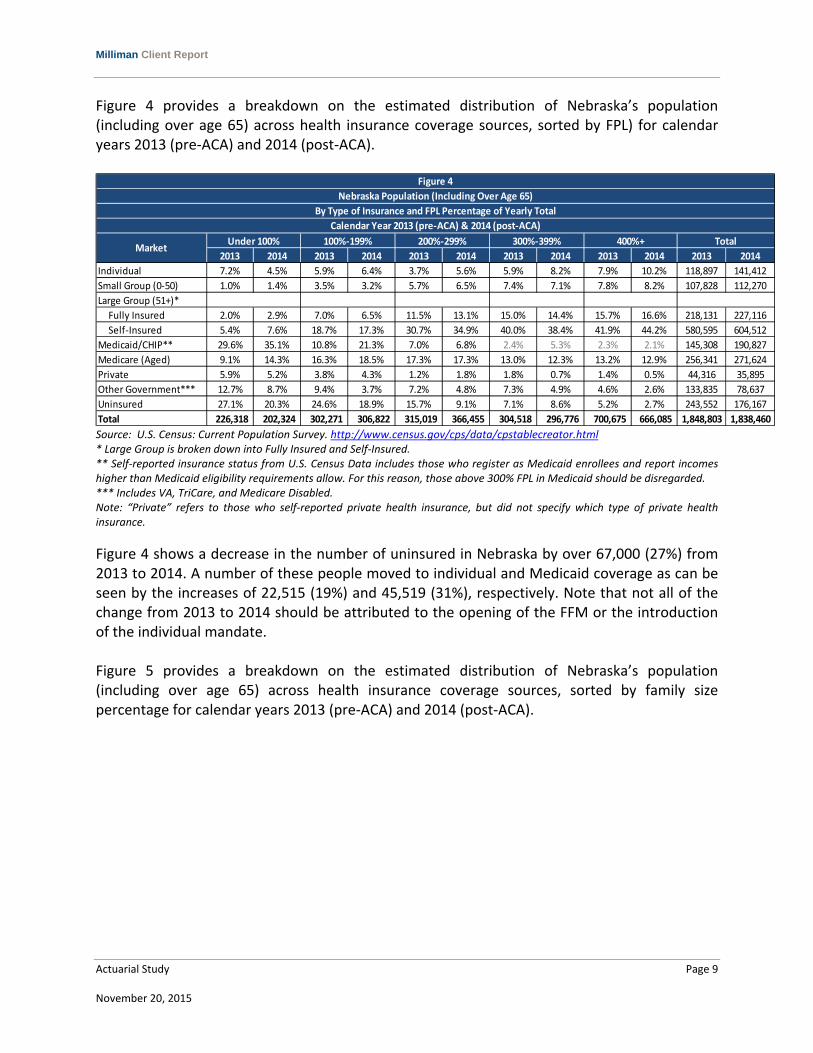
Figure 4 provides a breakdown on the estimated distribution of Nebraska’s population (including over age 65) across health insurance coverage sources, sorted by FPL) for calendar years 2013 (pre‐ACA) and 2014 (post‐ACA).
Source: U.S. Census: Current Population Survey. http://www.census.gov/cps/data/cpstablecreator.html * Large Group is broken down into Fully Insured and Self‐Insured. ** Self‐reported insurance status from U.S. Census Data includes those who register as Medicaid enrollees and report incomes higher than Medicaid eligibility requirements allow. For this reason, those above 300% FPL in Medicaid should be disregarded. *** Includes VA, TriCare, and Medicare Disabled. Note: “Private” refers to those who self‐reported private health insurance, but did not specify which type of private health insurance.
Figure 4 shows a decrease in the number of uninsured in Nebraska by over 67,000 (27%) from 2013 to 2014. A number of these people moved to individual and Medicaid coverage as can be seen by the increases of 22,515 (19%) and 45,519 (31%), respectively. Note that not all of the change from 2013 to 2014 should be attributed to the opening of the FFM or the introduction of the individual mandate. Figure 5 provides a breakdown on the estimated distribution of Nebraska’s population (including over age 65) across health insurance coverage sources, sorted by family size percentage for calendar years 2013 (pre‐ACA) and 2014 (post‐ACA).
2013 2014 2013 2014 2013 2014 2013 2014 2013 2014 2013 2014
Individual 7.2% 4.5% 5.9% 6.4% 3.7% 5.6% 5.9% 8.2% 7.9% 10.2% 118,897 141,412
Small Group (0‐50) 1.0% 1.4% 3.5% 3.2% 5.7% 6.5% 7.4% 7.1% 7.8% 8.2% 107,828 112,270
Large Group (51+)*
Fully Insured 2.0% 2.9% 7.0% 6.5% 11.5% 13.1% 15.0% 14.4% 15.7% 16.6% 218,131 227,116
Self‐Insured 5.4% 7.6% 18.7% 17.3% 30.7% 34.9% 40.0% 38.4% 41.9% 44.2% 580,595 604,512
Medicaid/CHIP** 29.6% 35.1% 10.8% 21.3% 7.0% 6.8% 2.4% 5.3% 2.3% 2.1% 145,308 190,827
Medicare (Aged) 9.1% 14.3% 16.3% 18.5% 17.3% 17.3% 13.0% 12.3% 13.2% 12.9% 256,341 271,624
Private 5.9% 5.2% 3.8% 4.3% 1.2% 1.8% 1.8% 0.7% 1.4% 0.5% 44,316 35,895
Other Government*** 12.7% 8.7% 9.4% 3.7% 7.2% 4.8% 7.3% 4.9% 4.6% 2.6% 133,835 78,637
Uninsured 27.1% 20.3% 24.6% 18.9% 15.7% 9.1% 7.1% 8.6% 5.2% 2.7% 243,552 176,167
Total 226,318 202,324 302,271 306,822 315,019 366,455 304,518 296,776 700,675 666,085 1,848,803 1,838,460
Calendar Year 2013 (pre‐ACA) & 2014 (post‐ACA)
100%‐199% 200%‐299% 300%‐399% 400%+ Total
Figure 4
Nebraska Population (Including Over Age 65)
By Type of Insurance and FPL Percentage of Yearly Total
MarketUnder 100%

Milliman Client Report
Actuarial Study Page 10 November 20, 2015
Source: U.S. Census: Current Population Survey. http://www.census.gov/cps/data/cpstablecreator.html * When splitting U.S. Census Data into increasingly smaller/more specific subsets, some zeroes occur. These occurrences should be considered data anomalies and should not influence the reader’s conclusions. ** Large Group is broken down into Fully Insured and Self‐Insured. *** Includes VA, TriCare, and Medicare Disabled. Note: “Private” refers to those who self‐reported private health insurance, but did not specify which type of private health insurance.
The number of zeroes in Figure 5 demonstrates the lack of data available for the smallest breakdowns of U.S. Census Data. For this reason, the data presented on the larger families in Figure 5 should be interpreted with caution.
2013 2014 2013 2014 2013 2014 2013 2014 2013 2014 2013 2014 2013 2014
Individual 5.8% 4.1% 4.0% 9.9% 6.5% 7.0% 7.1% 11.2% 9.6% 6.3% 9.7% 5.9% 118,897 141,412
Small Group (0‐50) 4.3% 4.7% 5.3% 4.7% 6.6% 7.2% 7.5% 7.8% 6.5% 7.5% 5.5% 6.7% 107,828 112,270
Large Group (51+)**
Fully Insured 8.7% 9.4% 10.7% 9.5% 13.3% 14.5% 15.1% 15.7% 13.2% 15.1% 11.2% 13.5% 218,131 227,116
Self‐Insured 23.0% 25.0% 28.4% 25.3% 35.4% 38.5% 40.1% 41.9% 35.0% 40.3% 29.8% 35.8% 580,595 604,512
Medicaid/CHIP 2.1% 3.5% 4.6% 4.4% 12.6% 18.7% 10.8% 11.7% 13.4% 13.8% 8.7% 23.5% 145,308 190,827
Medicare (Aged) 26.5% 23.9% 28.7% 33.3% 3.6% 4.4% 1.2% 2.8% 1.8% 0.3% 0.5% 0.4% 256,341 271,624
Private 8.4% 7.6% 1.2% 0.8% 1.7% 0.7% 0.5% 0* 1.0% 0* 0* 0* 44,316 35,895
Other Gov.*** 4.9% 5.1% 6.0% 5.6% 8.0% 1.5% 7.0% 1.6% 11.8% 7.4% 9.5% 3.9% 133,835 78,637
Uninsured 16.3% 16.6% 11.1% 6.3% 12.3% 7.5% 10.8% 7.4% 7.7% 9.2% 25.0% 10.3% 243,552 176,167
Total 352,178 392,667 500,324 466,430 307,514 262,628 320,045 329,611 197,280 230,729 171,462 156,395 1,848,803 1,838,460
Figure 5
Nebraska Population (Including Over Age 65)
By Type of Insurance and Family Size Percentage of Yearly Total
Calendar Year 2013 (pre‐ACA) & 2014 (post‐ACA)
Market1 2 3 4 5 6+ Total
Milliman Client Report
Actuarial Study Page 11 November 20, 2015
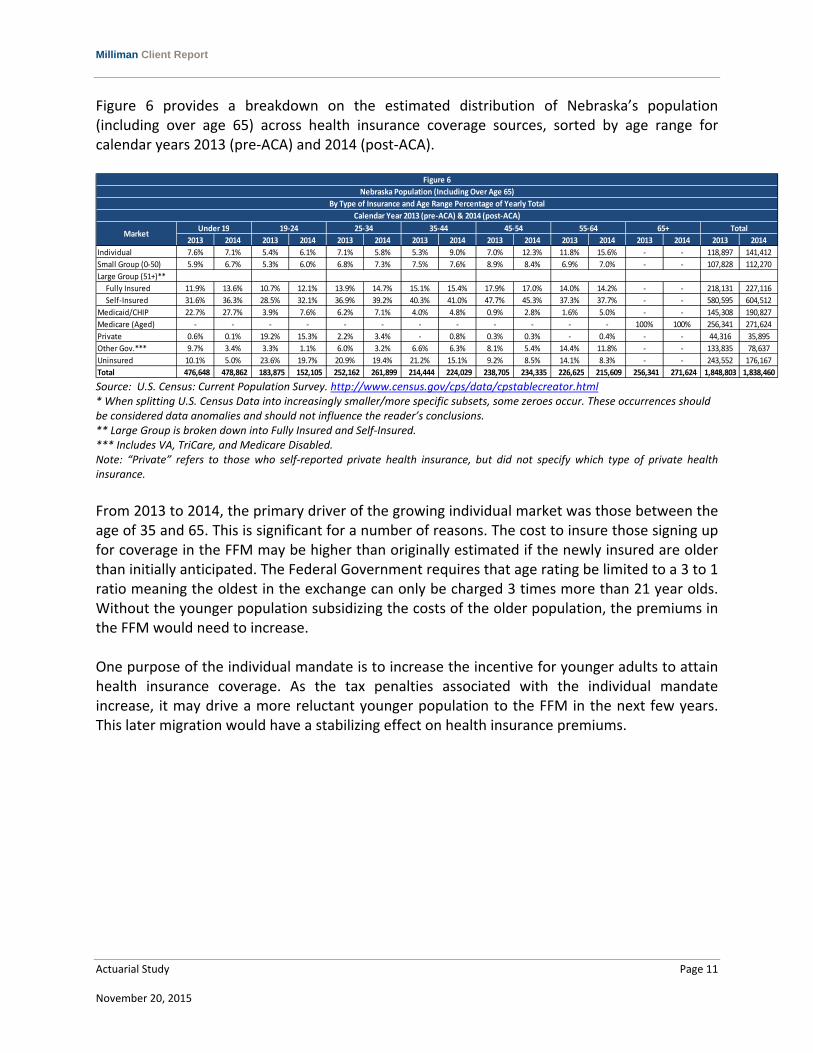
Figure 6 provides a breakdown on the estimated distribution of Nebraska’s population (including over age 65) across health insurance coverage sources, sorted by age range for calendar years 2013 (pre‐ACA) and 2014 (post‐ACA).
Source: U.S. Census: Current Population Survey. http://www.census.gov/cps/data/cpstablecreator.html * When splitting U.S. Census Data into increasingly smaller/more specific subsets, some zeroes occur. These occurrences should be considered data anomalies and should not influence the reader’s conclusions. ** Large Group is broken down into Fully Insured and Self‐Insured. *** Includes VA, TriCare, and Medicare Disabled. Note: “Private” refers to those who self‐reported private health insurance, but did not specify which type of private health insurance.
From 2013 to 2014, the primary driver of the growing individual market was those between the age of 35 and 65. This is significant for a number of reasons. The cost to insure those signing up for coverage in the FFM may be higher than originally estimated if the newly insured are older than initially anticipated. The Federal Government requires that age rating be limited to a 3 to 1 ratio meaning the oldest in the exchange can only be charged 3 times more than 21 year olds. Without the younger population subsidizing the costs of the older population, the premiums in the FFM would need to increase. One purpose of the individual mandate is to increase the incentive for younger adults to attain health insurance coverage. As the tax penalties associated with the individual mandate increase, it may drive a more reluctant younger population to the FFM in the next few years. This later migration would have a stabilizing effect on health insurance premiums.
2013 2014 2013 2014 2013 2014 2013 2014 2013 2014 2013 2014 2013 2014 2013 2014
Individual 7.6% 7.1% 5.4% 6.1% 7.1% 5.8% 5.3% 9.0% 7.0% 12.3% 11.8% 15.6% ‐ ‐ 118,897 141,412
Small Group (0‐50) 5.9% 6.7% 5.3% 6.0% 6.8% 7.3% 7.5% 7.6% 8.9% 8.4% 6.9% 7.0% ‐ ‐ 107,828 112,270
Large Group (51+)**
Fully Insured 11.9% 13.6% 10.7% 12.1% 13.9% 14.7% 15.1% 15.4% 17.9% 17.0% 14.0% 14.2% ‐ ‐ 218,131 227,116
Self‐Insured 31.6% 36.3% 28.5% 32.1% 36.9% 39.2% 40.3% 41.0% 47.7% 45.3% 37.3% 37.7% ‐ ‐ 580,595 604,512
Medicaid/CHIP 22.7% 27.7% 3.9% 7.6% 6.2% 7.1% 4.0% 4.8% 0.9% 2.8% 1.6% 5.0% ‐ ‐ 145,308 190,827
Medicare (Aged) ‐ ‐ ‐ ‐ ‐ ‐ ‐ ‐ ‐ ‐ ‐ ‐ 100% 100% 256,341 271,624
Private 0.6% 0.1% 19.2% 15.3% 2.2% 3.4% ‐ 0.8% 0.3% 0.3% ‐ 0.4% ‐ ‐ 44,316 35,895
Other Gov.*** 9.7% 3.4% 3.3% 1.1% 6.0% 3.2% 6.6% 6.3% 8.1% 5.4% 14.4% 11.8% ‐ ‐ 133,835 78,637
Uninsured 10.1% 5.0% 23.6% 19.7% 20.9% 19.4% 21.2% 15.1% 9.2% 8.5% 14.1% 8.3% ‐ ‐ 243,552 176,167
Total 476,648 478,862 183,875 152,105 252,162 261,899 214,444 224,029 238,705 234,335 226,625 215,609 256,341 271,624 1,848,803 1,838,460
Figure 6
Nebraska Population (Including Over Age 65)
By Type of Insurance and Age Range Percentage of Yearly Total
Calendar Year 2013 (pre‐ACA) & 2014 (post‐ACA)
MarketUnder 19 19‐24 25‐34 35‐44 45‐54 55‐64 65+ Total

Milliman Client Report
Actuarial Study Page 12 November 20, 2015
Figure 7 provides a breakdown on the estimated distribution of Nebraska’s population (including over age 65) across health insurance coverage sources, categorized by race/ethnicity for calendar years 2013 (pre‐ACA) and 2014 (post‐ACA).
Source: U.S. Census: Current Population Survey. http://www.census.gov/cps/data/cpstablecreator.html * When splitting U.S. Census Data into increasingly smaller/more specific subsets, some zeroes occur. These occurrences should be considered data anomalies and should not influence the reader’s conclusions. ** Large Group is broken down into Fully Insured and Self‐Insured. *** Includes VA, TriCare, and Medicare Disabled. Note: “Private” refers to those who self‐reported private health insurance, but did not specify which type of private health insurance.
From 2013 to 2014, Figure 7 shows a decrease in the number of uninsured across all defined races. The largest percentage decrease in the uninsured rate occurred in the Black/African American and Hispanic races (26% and 43%, respectively).
2013 2014 2013 2014 2013 2014 2013 2014 2013 2014 2013 2014
Individual 7.5% 8.4% 1.3% 6.4% 2.7% 4.7% 4.2% 3.9% 3.1% 4.9% 118,897 141,412
Small Group (0‐50) 6.2% 6.4% 4.4% 4.2% 4.3% 5.3% 2.4% 5.8% 5.5% 4.7% 107,828 112,270
Large Group (51+)**
Fully Insured 12.6% 12.9% 8.8% 8.6% 8.7% 10.7% 4.9% 11.7% 11.1% 9.5% 218,131 227,116
Self‐Insured 33.5% 34.3% 23.5% 22.8% 23.0% 28.6% 13.1% 31.2% 29.6% 25.2% 580,595 604,512
Medicaid/CHIP 5.4% 7.7% 17.8% 28.5% 10.3% 19.3% 63.9% 37.3% 20.4% 15.1% 145,308 190,827
Medicare (Aged) 16.5% 17.0% 8.3% 8.8% 3.6% 5.0% 2.3% 2.0% 4.1% 5.6% 256,341 271,624
Private 2.5% 2.3% 5.0% 0* 1.1% 1.0% 0* 0* 1.7% 0* 44,316 35,895
Other Gov.*** 6.6% 3.9% 13.0% 7.5% 12.1% 5.9% 0* 0* 2.6% 5.5% 133,835 78,637
Uninsured 9.3% 7.2% 17.8% 13.2% 34.3% 19.5% 9.2% 8.0% 22.0% 29.5% 243,552 176,167
Total 1,441,835 1,473,353 78,745 65,904 214,592 218,265 20,004 20,388 93,625 60,548 1,848,803 1,838,460
Figure 7
Nebraska Population (Including Over Age 65)
By Type of Insurance and Race/Ethnicity Percentage of Yearly Total
Calendar Year 2013 (pre‐ACA) & 2014 (post‐ACA)
MarketWhite
Black/African
AmericanHispanic
Multiracial, Non‐
HispanicAll Other Total
Milliman Client Report
Actuarial Study Page 13 November 20, 2015
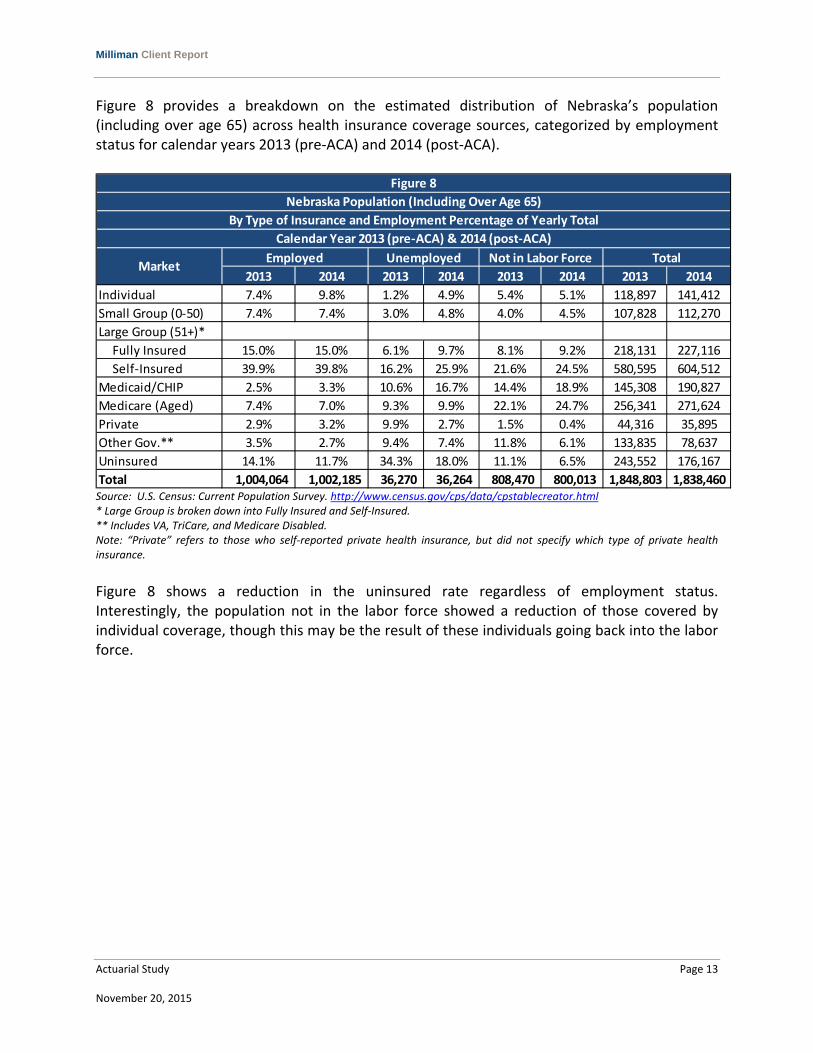
Figure 8 provides a breakdown on the estimated distribution of Nebraska’s population (including over age 65) across health insurance coverage sources, categorized by employment status for calendar years 2013 (pre‐ACA) and 2014 (post‐ACA).
Source: U.S. Census: Current Population Survey. http://www.census.gov/cps/data/cpstablecreator.html * Large Group is broken down into Fully Insured and Self‐Insured. ** Includes VA, TriCare, and Medicare Disabled. Note: “Private” refers to those who self‐reported private health insurance, but did not specify which type of private health insurance. Figure 8 shows a reduction in the uninsured rate regardless of employment status. Interestingly, the population not in the labor force showed a reduction of those covered by individual coverage, though this may be the result of these individuals going back into the labor force.
2013 2014 2013 2014 2013 2014 2013 2014
Individual 7.4% 9.8% 1.2% 4.9% 5.4% 5.1% 118,897 141,412
Small Group (0‐50) 7.4% 7.4% 3.0% 4.8% 4.0% 4.5% 107,828 112,270
Large Group (51+)*
Fully Insured 15.0% 15.0% 6.1% 9.7% 8.1% 9.2% 218,131 227,116
Self‐Insured 39.9% 39.8% 16.2% 25.9% 21.6% 24.5% 580,595 604,512
Medicaid/CHIP 2.5% 3.3% 10.6% 16.7% 14.4% 18.9% 145,308 190,827
Medicare (Aged) 7.4% 7.0% 9.3% 9.9% 22.1% 24.7% 256,341 271,624
Private 2.9% 3.2% 9.9% 2.7% 1.5% 0.4% 44,316 35,895
Other Gov.** 3.5% 2.7% 9.4% 7.4% 11.8% 6.1% 133,835 78,637
Uninsured 14.1% 11.7% 34.3% 18.0% 11.1% 6.5% 243,552 176,167
Total 1,004,064 1,002,185 36,270 36,264 808,470 800,013 1,848,803 1,838,460
Figure 8
Nebraska Population (Including Over Age 65)
By Type of Insurance and Employment Percentage of Yearly Total
Calendar Year 2013 (pre‐ACA) & 2014 (post‐ACA)
MarketEmployed Unemployed Not in Labor Force Total

Milliman Client Report
Actuarial Study Page 14 November 20, 2015
b. Current Health Status of Population in Nebraska Figures 9A and 9B provide a breakdown of the estimated health status of Nebraska’s population compared to the United States population (including over age 65), across health insurance coverage sources by FPL for calendar years 2013 (pre‐ACA) and 2014 (post‐ACA). The U.S. Census Current Population Survey (CPS) classifies an individual’s health status as excellent, very good, good, fair, or poor. In a proprietary report, Milliman derived a morbidity ratio based on the U.S. Census’s self‐reported health status. Milliman used the weighted average of the health status in each category to develop Figures 9A and 9B. This calculation is taking the sum of, the product of the number in each health status category and the corresponding morbidity ratio, then dividing the result by the total in that category. The lower the morbidity factor result, the closer it is to a health status of excellent. As an example from Figure 9A, if we compare the morbidity factor for Nebraska of “Private Market Under 100%” to “Other Gov. Market Under 100%”, the result is that individuals in the “Private Market Under 100%” have a lower morbidity rating and an expected lower cost of care. A morbidity factor cannot have a value of zero.

Milliman Client Report
Actuarial Study Page 15 November 20, 2015
Figure 9A
Nebraska (NE) and United States (US) Population (Including Over Age 65)
By Morbidity Ratio and FPL
Calendar Year 2013 (pre‐ACA)
Market Under 100% 100%‐199% 200%‐299% 300%‐399% 400%+
NE US NE US NE US NE US NE US
Individual 0.837 0.881 0.855 0.859 0.665 0.772 0.545 0.739 0.641 0.740
Employer* 0.708 0.883 0.712 0.803 0.714 0.798 0.820 0.757 0.687 0.690
Medicaid/CHIP** 0.843 1.132 0.806 1.030 0.717 0.985 0.895 1.041 0.884 0.990
Medicare (Aged) 2.223 2.294 1.625 2.048 1.573 1.740 1.567 1.630 1.039 1.289
Private 0.526 0.683 0.662 0.751 0.595 0.744 0.609 0.667 0.468 0.715
Other Gov. 1.445 2.518 1.816 2.373 1.348 1.779 0.890 1.624 0.990 1.243
Uninsured 0.963 1.155 0.902 1.017 0.927 0.941 1.222 0.899 0.785 0.839
Figure 9B
Nebraska (NE) and United States (US) Population (Including Over Age 65)
By Morbidity Ratio and FPL
Calendar Year 2014 (post‐ACA)
Market Under 100% 100%‐199% 200%‐299% 300%‐399% 400%+
NE US NE US NE US NE US NE US
Individual 1.100 0.842 0.835 0.873 0.588 0.791 0.609 0.801 0.759 0.708
Employer* 0.976 0.934 0.693 0.833 0.782 0.786 0.695 0.768 0.660 0.699
Medicaid/CHIP** 1.125 1.178 0.834 0.988 0.921 1.005 0.826 0.955 0.689 1.024
Medicare (Aged) 1.478 2.239 2.070 2.092 1.820 1.755 1.614 1.611 0.954 1.321
Private 0.523 0.734 0.821 0.695 0.664 0.690 0.431 0.682 0.550 0.603
Other Gov. 2.243 2.598 2.104 2.398 1.252 1.708 0.812 1.541 1.515 1.167
Uninsured 1.121 1.178 0.661 0.966 1.257 0.970 0.716 0.875 0.529 0.832 Source: U.S. Census: Current Population Survey. http://www.census.gov/cps/data/cpstablecreator.html * Includes Large and Small Group. Milliman was unable to attain Morbidity Factors for Large and Small Groups separately. ** Self‐reported insurance status from U.S. Census Data includes those who register as Medicaid enrollees and report incomes higher than Medicaid eligibility requirements allow. For this reason, those above 300% FPL in Medicaid should be disregarded. Note: “Private” refers to those who self‐reported private health insurance, but did not specify which type of private health insurance.
Milliman Client Report
Actuarial Study Page 16 November 20, 2015
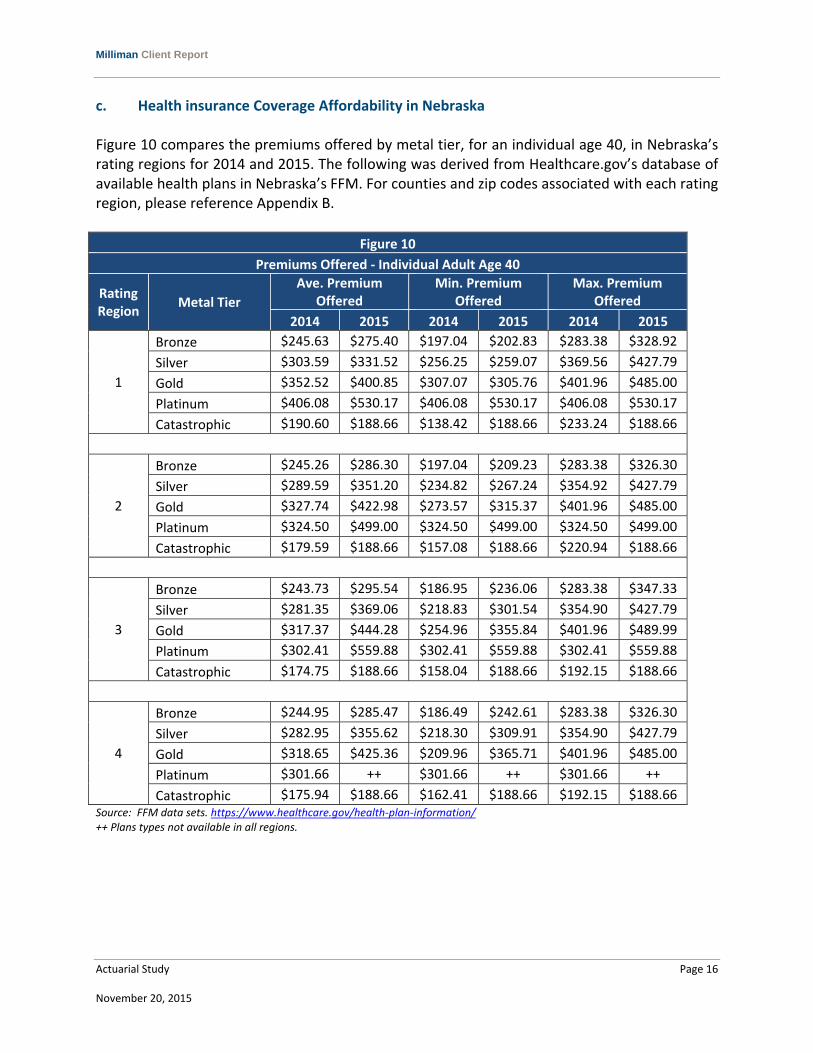
c. Health insurance Coverage Affordability in Nebraska Figure 10 compares the premiums offered by metal tier, for an individual age 40, in Nebraska’s rating regions for 2014 and 2015. The following was derived from Healthcare.gov’s database of available health plans in Nebraska’s FFM. For counties and zip codes associated with each rating region, please reference Appendix B.
Figure 10
Premiums Offered ‐ Individual Adult Age 40
Rating Region
Metal Tier
Ave. Premium Offered
Min. Premium Offered
Max. Premium Offered
2014 2015 2014 2015 2014 2015
1
Bronze $245.63 $275.40 $197.04 $202.83 $283.38 $328.92
Silver $303.59 $331.52 $256.25 $259.07 $369.56 $427.79
Gold $352.52 $400.85 $307.07 $305.76 $401.96 $485.00
Platinum $406.08 $530.17 $406.08 $530.17 $406.08 $530.17
Catastrophic $190.60 $188.66 $138.42 $188.66 $233.24 $188.66
2
Bronze $245.26 $286.30 $197.04 $209.23 $283.38 $326.30
Silver $289.59 $351.20 $234.82 $267.24 $354.92 $427.79
Gold $327.74 $422.98 $273.57 $315.37 $401.96 $485.00
Platinum $324.50 $499.00 $324.50 $499.00 $324.50 $499.00
Catastrophic $179.59 $188.66 $157.08 $188.66 $220.94 $188.66
3
Bronze $243.73 $295.54 $186.95 $236.06 $283.38 $347.33
Silver $281.35 $369.06 $218.83 $301.54 $354.90 $427.79
Gold $317.37 $444.28 $254.96 $355.84 $401.96 $489.99
Platinum $302.41 $559.88 $302.41 $559.88 $302.41 $559.88
Catastrophic $174.75 $188.66 $158.04 $188.66 $192.15 $188.66
4
Bronze $244.95 $285.47 $186.49 $242.61 $283.38 $326.30
Silver $282.95 $355.62 $218.30 $309.91 $354.90 $427.79
Gold $318.65 $425.36 $209.96 $365.71 $401.96 $485.00
Platinum $301.66 ++ $301.66 ++ $301.66 ++
Catastrophic $175.94 $188.66 $162.41 $188.66 $192.15 $188.66 Source: FFM data sets. https://www.healthcare.gov/health‐plan‐information/ ++ Plans types not available in all regions.

Milliman Client Report
Actuarial Study Page 17 November 20, 2015
Figure 11 compares the overall premiums offered for an individual adult age 40, in Nebraska’s Rating Regions for 2014 and 2015. The following was derived from Healthcare.gov’s database of available health plans in Nebraska’s FFM.
Figure 11
Premiums Offered ‐ Individual Adult Age 40
Rating Region
Ave. Premium Offered Min. Premium Offered Max. Premium Offered
2014 2015 2014 2015 2014 2015
1 $273.76 $313.89 $138.42 $188.66 $406.08 $530.17
2 $263.22 $329.37 $157.08 $188.66 $401.96 $499.00
3 $257.13 $345.24 $158.04 $188.66 $401.96 $559.88
4 $258.44 $316.37 $162.41 $188.66 $401.96 $485.00 Source: FFM data sets. https://www.healthcare.gov/health‐plan‐information/
Figure 11 shows that there is little variance in the premium rates offered from region to region. It does however show a significant increase in the premiums from 2014 to 2015. The average premium offered increased from 15% to 34% varying by rating region. Earlier in this report, U.S. Census Data suggested that the majority of those signing up for FFM plans were over 35. An older less healthy population is likely a primary driver of the increased premiums. If the individual mandate performs as intended, it is assumed that the younger population will begin to enroll in FFM plans and slow the rate of premium inflation.
Figure 12 shows the enrollment by metal tier in 2014 and 2015 within the FFM. The following was derived from Healthcare.gov’s database of available health plans in Nebraska’s FFM.
Figure 12
Metal Tier Enrollment
Metal Tier 2014 Total 2014 % of Total 2015 Total* 2015 % of Total
Bronze 9,763 22.7% 25,130 33.9%
Silver 26,619 61.9% 43,792 59.1%
Gold 3,361 7.8% 4,444 6.0%
Platinum 2,555 5.9% 177 0.2%
Catastrophic 806 1.9% 611 0.8%
Total 42,975 74,152 Source: Kaiser Family Foundation (KFF). http://kff.org/state‐category/health‐reform/ *Milliman applied the percentage of plans selected by metal tier, attained from KFF, to healthcare.gov’s total plans selected in Nebraska in 2015.
Milliman Client Report
Actuarial Study Page 18 November 20, 2015
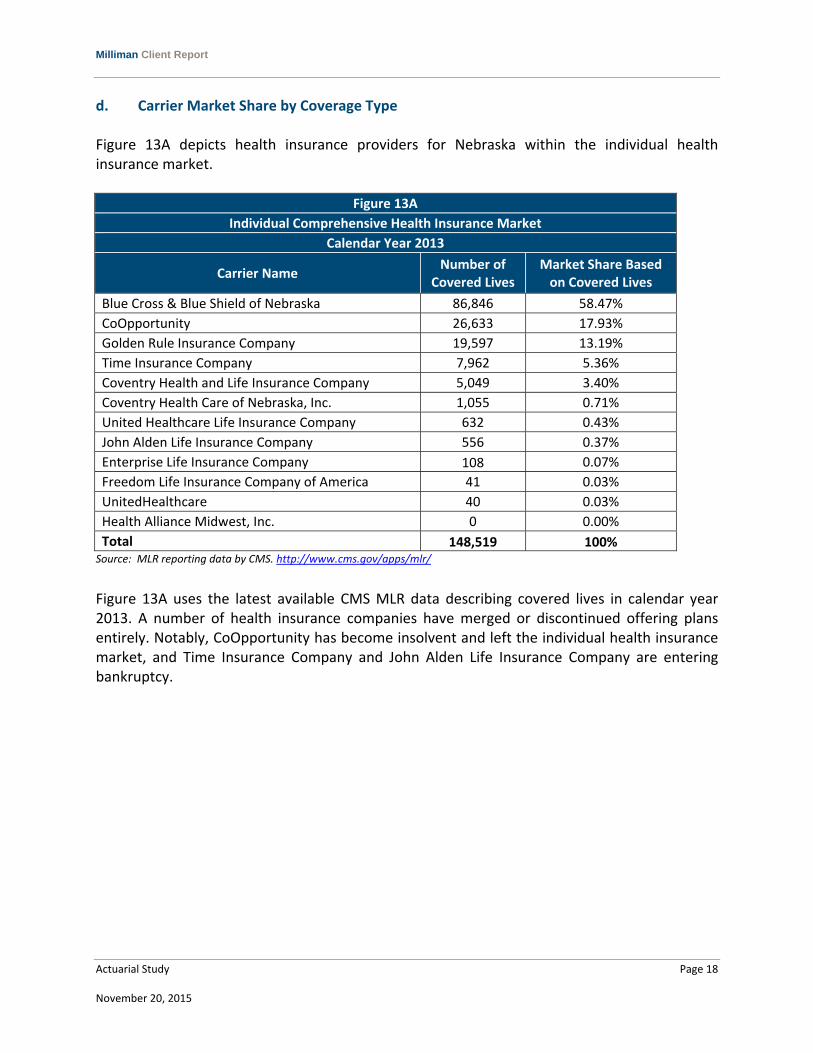
d. Carrier Market Share by Coverage Type Figure 13A depicts health insurance providers for Nebraska within the individual health insurance market.
Figure 13A
Individual Comprehensive Health Insurance Market
Calendar Year 2013
Carrier Name Number of
Covered Lives Market Share Based on Covered Lives
Blue Cross & Blue Shield of Nebraska 86,846 58.47%
CoOpportunity 26,633 17.93%
Golden Rule Insurance Company 19,597 13.19%
Time Insurance Company 7,962 5.36%
Coventry Health and Life Insurance Company 5,049 3.40%
Coventry Health Care of Nebraska, Inc. 1,055 0.71%
United Healthcare Life Insurance Company 632 0.43%
John Alden Life Insurance Company 556 0.37%
Enterprise Life Insurance Company 108 0.07%
Freedom Life Insurance Company of America 41 0.03%
UnitedHealthcare 40 0.03%
Health Alliance Midwest, Inc. 0 0.00%
Total 148,519 100% Source: MLR reporting data by CMS. http://www.cms.gov/apps/mlr/
Figure 13A uses the latest available CMS MLR data describing covered lives in calendar year 2013. A number of health insurance companies have merged or discontinued offering plans entirely. Notably, CoOpportunity has become insolvent and left the individual health insurance market, and Time Insurance Company and John Alden Life Insurance Company are entering bankruptcy.
Milliman Client Report
Actuarial Study Page 19 November 20, 2015
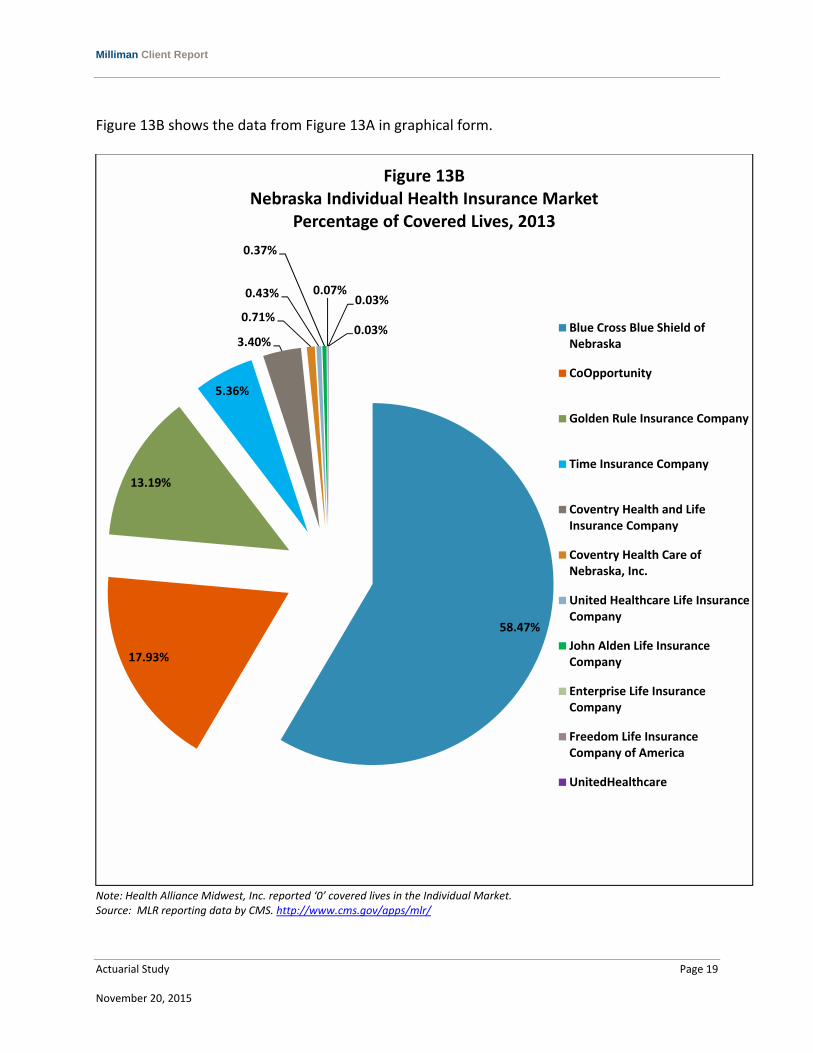
Figure 13B shows the data from Figure 13A in graphical form.
Note: Health Alliance Midwest, Inc. reported ‘0’ covered lives in the Individual Market. Source: MLR reporting data by CMS. http://www.cms.gov/apps/mlr/
58.47%
17.93%
13.19%
5.36%
3.40%
0.71%
0.43%
0.37%
0.07%0.03%
0.03%
Figure 13BNebraska Individual Health Insurance Market
Percentage of Covered Lives, 2013
Blue Cross Blue Shield ofNebraska
CoOpportunity
Golden Rule Insurance Company
Time Insurance Company
Coventry Health and LifeInsurance Company
Coventry Health Care ofNebraska, Inc.
United Healthcare Life InsuranceCompany
John Alden Life InsuranceCompany
Enterprise Life InsuranceCompany
Freedom Life InsuranceCompany of America
UnitedHealthcare

Milliman Client Report
Actuarial Study Page 20 November 20, 2015
Figure 14A depicts health insurance providers for Nebraska within the small group health insurance market.
Figure 14A
Small Group Comprehensive Health Insurance Market
Calendar Year 2013
Carrier Name Number of
Covered Lives Market Share Based on Covered Lives
Blue Cross & Blue Shield of Nebraska 57,545 54.49%
UnitedHealthcare 14,869 14.08%
CoOpportunity 14,708 13.93%
Coventry Health Care of Nebraska, Inc. 10,180 9.64%
Coventry Health and Life Insurance Company 4,709 4.46%
Time Insurance Company 3,193 3.02%
John Alden Life Insurance Company 397 0.38%
Freedom Life Insurance Company of America 0 0.00%
Health Alliance Midwest, Inc. 0 0.00%
United Healthcare Life Insurance Company 0 0.00%
Golden Rule Insurance Company 0 0.00%
Enterprise Life Insurance Company 0 0.00%
Total 105,601 100% Source: MLR reporting data by CMS. http://www.cms.gov/apps/mlr/mlr‐search.aspx#/?state=NE&reporting_year=2013
Figure 14A uses the latest available CMS MLR data describing covered lives in calendar year 2013. A number of health insurance companies have merged or discontinued offering plans entirely. Notably, CoOpportunity has become insolvent and left the small group health insurance market, and Time Insurance Company and John Alden Life Insurance Company are entering bankruptcy.

Milliman Client Report
Actuarial Study Page 21 November 20, 2015
Figure 14B shows the data from Figure 14A in graphical form.
Note: Freedom Life Insurance Company of America, Health Alliance Midwest Inc., United Healthcare Life Insurance Company, Golden Rule Insurance Company, and Enterprise Life Insurance Company all reported ‘0’ covered lives in the Small Group Market. Source: MLR reporting data by CMS. http://www.cms.gov/apps/mlr/mlr‐search.aspx#/?state=NE&reporting_year=2013
54.49%
14.08%
13.93%
9.64%
4.46%
3.02%0.38%
Figure 14BNebraska Small Group Health Insurance Market
Percentage of Covered Lives, 2013
Blue Cross Blue Shield ofNebraska
UnitedHealthcare
CoOpportunity
Coventry Health Care ofNebraska, Inc.
Coventry Health and LifeInsurance Company
Time Insurance Company
John Alden Life InsuranceCompany

Milliman Client Report
Actuarial Study Page 22 November 20, 2015
Figure 15 depicts health insurance providers for Nebraska within the large group health insurance market.
Figure 15A
Large Group Comprehensive Health Insurance Market
Calendar Year 2013
Carrier Name Number of
Covered Lives Market Share Based on Covered Lives
Blue Cross & Blue Shield of Nebraska 172,251 77.11%
UnitedHealthcare 23,679 10.60%
Coventry Health Care of Nebraska, Inc. 13,653 6.11%
Coventry Health and Life Insurance Company 9,295 4.16%
CoOpportunity 4,413 1.98%
Time Insurance Company 100 0.04%
John Alden Life Insurance Company 0 0.00%
Freedom Life Insurance Company of America 0 0.00%
Health Alliance Midwest, Inc. 0 0.00%
United Healthcare Life Insurance Company 0 0.00%
Golden Rule Insurance Company 0 0.00%
Enterprise Life Insurance Company 0 0.00%
Total 223,391 100% Source: MLR reporting data by CMS. http://www.cms.gov/apps/mlr/mlr‐search.aspx#/?state=NE&reporting_year=2013
Figure 15A uses the latest available CMS MLR data describing covered lives in calendar year 2013. A number of health insurance companies have merged or discontinued offering plans entirely. Notably, CoOpportunity has become insolvent and left the large group health insurance market, and Time Insurance Company is entering bankruptcy.
Milliman Client Report
Actuarial Study Page 23 November 20, 2015
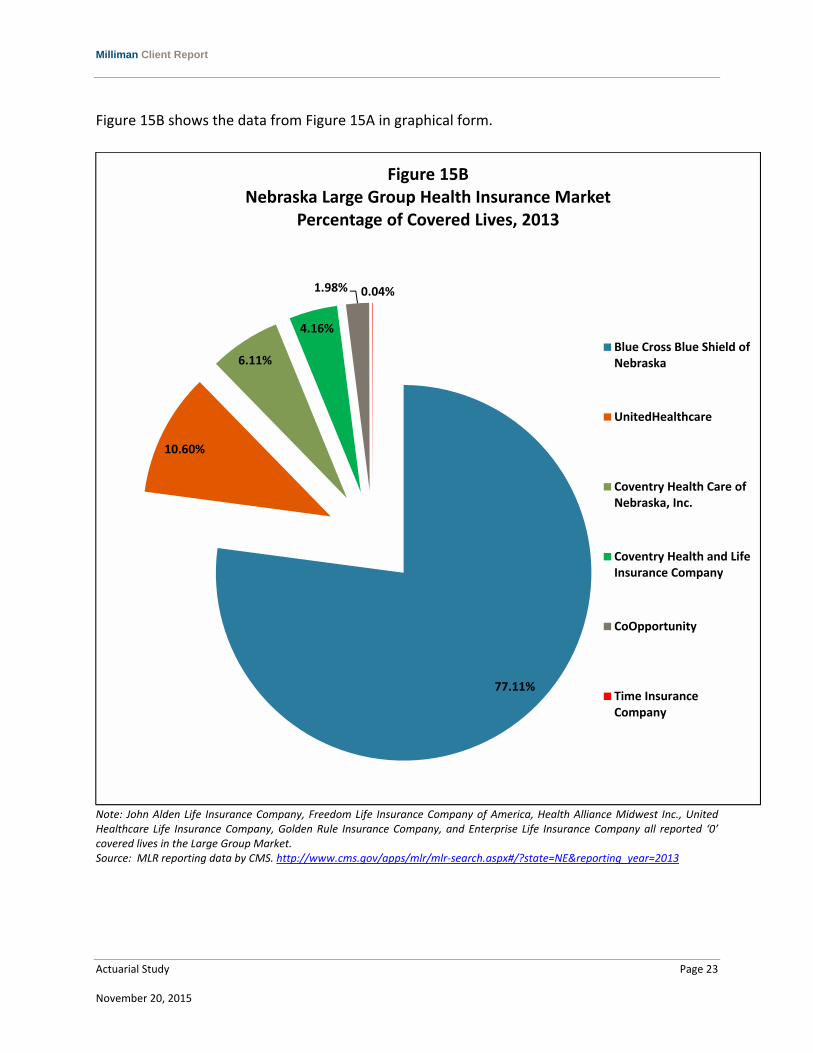
Figure 15B shows the data from Figure 15A in graphical form.
Note: John Alden Life Insurance Company, Freedom Life Insurance Company of America, Health Alliance Midwest Inc., United Healthcare Life Insurance Company, Golden Rule Insurance Company, and Enterprise Life Insurance Company all reported ‘0’ covered lives in the Large Group Market. Source: MLR reporting data by CMS. http://www.cms.gov/apps/mlr/mlr‐search.aspx#/?state=NE&reporting_year=2013
77.11%
10.60%
6.11%
4.16%
1.98% 0.04%
Figure 15BNebraska Large Group Health Insurance Market
Percentage of Covered Lives, 2013
Blue Cross Blue Shield ofNebraska
UnitedHealthcare
Coventry Health Care ofNebraska, Inc.
Coventry Health and LifeInsurance Company
CoOpportunity
Time InsuranceCompany

Milliman Client Report
Actuarial Study Page 24 November 20, 2015
e. Number Uninsured in Nebraska by Rating Region Figures 16A and 16B show the total population of Nebraska with and without health insurance coverage by rating region in 2013 and 2014 respectively. The information in Figures 16A and 16B is the result of combining U.S. Census Data by county into each county’s corresponding FFM rating region. A breakdown of rating region by county is displayed in Appendix B.
Figure 16A
Totals Within Rating Region (2013)
Rating Region
Number of
Counties
Total Pop. Per Rating Region
% Pop. Per Rating Region
Total With Health Ins.
% With Health Ins.
Total Without Health Ins.
% Without Health Ins.
1 8 781,640 43.5% 692,864 88.6% 88,776 11.4%
2 13 403,395 22.4% 363,441 90.1% 39,954 9.9%
3 44 444,053 24.7% 390,041 87.8% 54,012 12.2%
4 28 168,853 9.4% 146,791 86.9% 22,062 13.1%
Total 93 1,797,941 100% 1,593,137 88.6% 204,804 11.4%
Figure 16B
Totals Within Rating Region (2014)
Rating Region
Number of
Counties
Total Pop. Per Rating Region
% Pop. Per Rating Region
Total With Health Ins.
% With Health Ins.
Total Without Health Ins.
% Without Health Ins.
1 8 792,034 43.7% 702,132 88.6% 89,902 11.4%
2 13 406,730 22.4% 365,144 89.8% 41,586 10.2%
3 44 445,545 24.6% 391,830 87.9% 53,715 12.1%
4 28 168,644 9.3% 146,254 86.7% 22,390 13.3%
Total 93 1,812,953 100% 1,605,360 88.5% 207,593 11.5% Source: American FactFinder. http://factfinder.census.gov/faces/nav/jsf/pages/searchresults.xhtml?refresh=t As Figures 16A and 16B show, the uninsured rate does not vary greatly by rating region. The higher uninsured rate of region 4 could be attributed to the increased variability of a smaller sample size as Region 4 only represents 9% of Nebraska’s population. It should be noted that these totals do not equal the totals presented in earlier figures due to the use of different sources.
Milliman Client Report
Actuarial Study Page 25 November 20, 2015
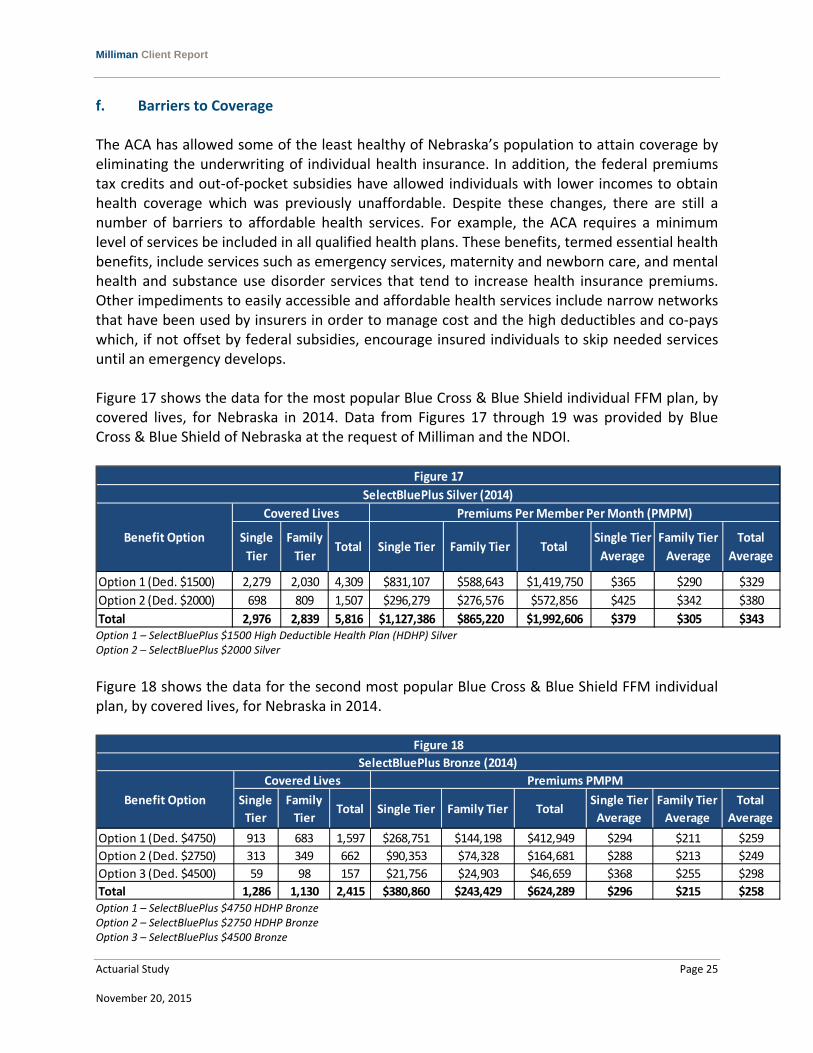
f. Barriers to Coverage The ACA has allowed some of the least healthy of Nebraska’s population to attain coverage by eliminating the underwriting of individual health insurance. In addition, the federal premiums tax credits and out‐of‐pocket subsidies have allowed individuals with lower incomes to obtain health coverage which was previously unaffordable. Despite these changes, there are still a number of barriers to affordable health services. For example, the ACA requires a minimum level of services be included in all qualified health plans. These benefits, termed essential health benefits, include services such as emergency services, maternity and newborn care, and mental health and substance use disorder services that tend to increase health insurance premiums. Other impediments to easily accessible and affordable health services include narrow networks that have been used by insurers in order to manage cost and the high deductibles and co‐pays which, if not offset by federal subsidies, encourage insured individuals to skip needed services until an emergency develops. Figure 17 shows the data for the most popular Blue Cross & Blue Shield individual FFM plan, by covered lives, for Nebraska in 2014. Data from Figures 17 through 19 was provided by Blue Cross & Blue Shield of Nebraska at the request of Milliman and the NDOI.
Option 1 – SelectBluePlus $1500 High Deductible Health Plan (HDHP) Silver Option 2 – SelectBluePlus $2000 Silver
Figure 18 shows the data for the second most popular Blue Cross & Blue Shield FFM individual plan, by covered lives, for Nebraska in 2014.
Option 1 – SelectBluePlus $4750 HDHP Bronze Option 2 – SelectBluePlus $2750 HDHP Bronze Option 3 – SelectBluePlus $4500 Bronze
Option 1 (Ded. $1500) 2,279 2,030 4,309 $831,107 $588,643 $1,419,750 $365 $290 $329
Option 2 (Ded. $2000) 698 809 1,507 $296,279 $276,576 $572,856 $425 $342 $380
Total 2,976 2,839 5,816 $1,127,386 $865,220 $1,992,606 $379 $305 $343
Figure 17
SelectBluePlus Silver (2014)
Covered Lives
Single
Tier
Benefit Option Total
Average
Family Tier
Average
Single Tier
Average
Premiums Per Member Per Month (PMPM)
Family
TierTotal Single Tier Family Tier Total
Option 1 (Ded. $4750) 913 683 1,597 $268,751 $144,198 $412,949 $294 $211 $259
Option 2 (Ded. $2750) 313 349 662 $90,353 $74,328 $164,681 $288 $213 $249
Option 3 (Ded. $4500) 59 98 157 $21,756 $24,903 $46,659 $368 $255 $298
Total 1,286 1,130 2,415 $380,860 $243,429 $624,289 $296 $215 $258
TotalBenefit Option Single Tier
Average
Premiums PMPM
Single Tier Family Tier TotalTotal
Average
Family Tier
Average
Single
Tier
Family
Tier
SelectBluePlus Bronze (2014)
Covered Lives
Figure 18
Milliman Client Report
Actuarial Study Page 26 November 20, 2015
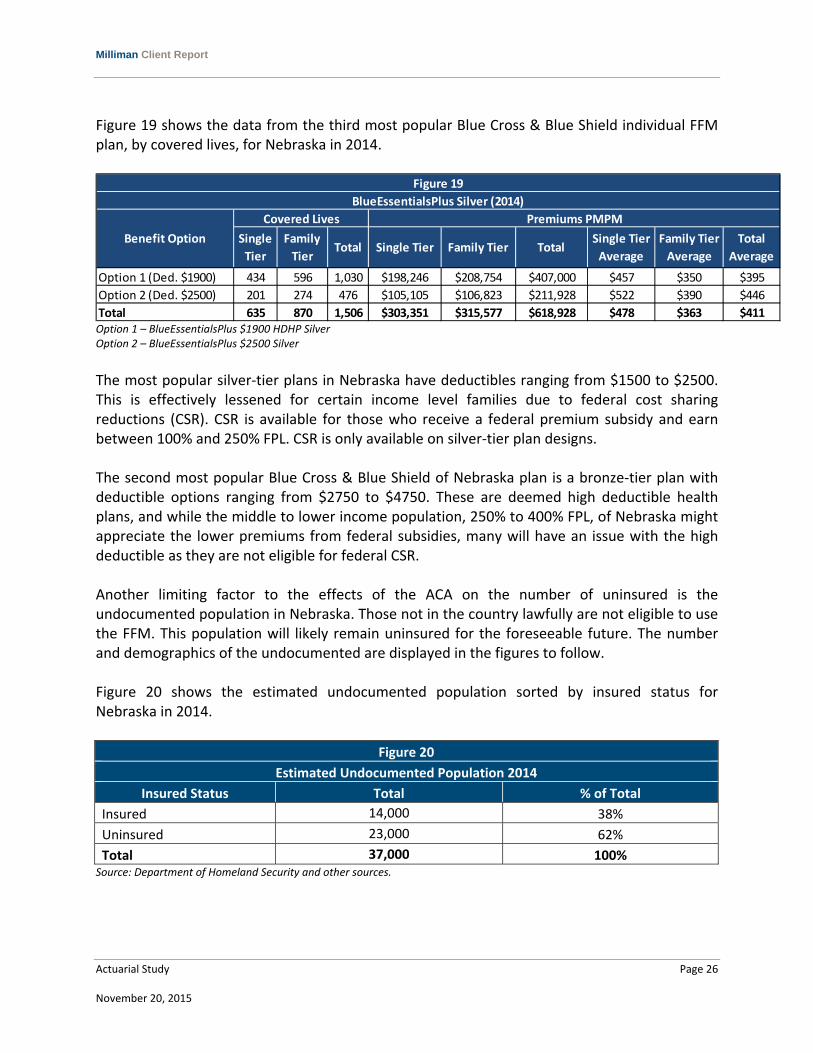
Figure 19 shows the data from the third most popular Blue Cross & Blue Shield individual FFM plan, by covered lives, for Nebraska in 2014.
Option 1 – BlueEssentialsPlus $1900 HDHP Silver Option 2 – BlueEssentialsPlus $2500 Silver
The most popular silver‐tier plans in Nebraska have deductibles ranging from $1500 to $2500. This is effectively lessened for certain income level families due to federal cost sharing reductions (CSR). CSR is available for those who receive a federal premium subsidy and earn between 100% and 250% FPL. CSR is only available on silver‐tier plan designs. The second most popular Blue Cross & Blue Shield of Nebraska plan is a bronze‐tier plan with deductible options ranging from $2750 to $4750. These are deemed high deductible health plans, and while the middle to lower income population, 250% to 400% FPL, of Nebraska might appreciate the lower premiums from federal subsidies, many will have an issue with the high deductible as they are not eligible for federal CSR. Another limiting factor to the effects of the ACA on the number of uninsured is the undocumented population in Nebraska. Those not in the country lawfully are not eligible to use the FFM. This population will likely remain uninsured for the foreseeable future. The number and demographics of the undocumented are displayed in the figures to follow. Figure 20 shows the estimated undocumented population sorted by insured status for Nebraska in 2014.
Figure 20
Estimated Undocumented Population 2014
Insured Status Total % of Total
Insured 14,000 38%
Uninsured 23,000 62%
Total 37,000 100% Source: Department of Homeland Security and other sources.
Option 1 (Ded. $1900) 434 596 1,030 $198,246 $208,754 $407,000 $457 $350 $395
Option 2 (Ded. $2500) 201 274 476 $105,105 $106,823 $211,928 $522 $390 $446
Total 635 870 1,506 $303,351 $315,577 $618,928 $478 $363 $411
Family Tier
Average
Single Tier
Average
Figure 19
BlueEssentialsPlus Silver (2014)
Premiums PMPM
Single Tier Family Tier TotalTotal
Average
Covered Lives
Single
Tier
Family
TierTotal
Benefit Option
Milliman Client Report
Actuarial Study Page 27 November 20, 2015
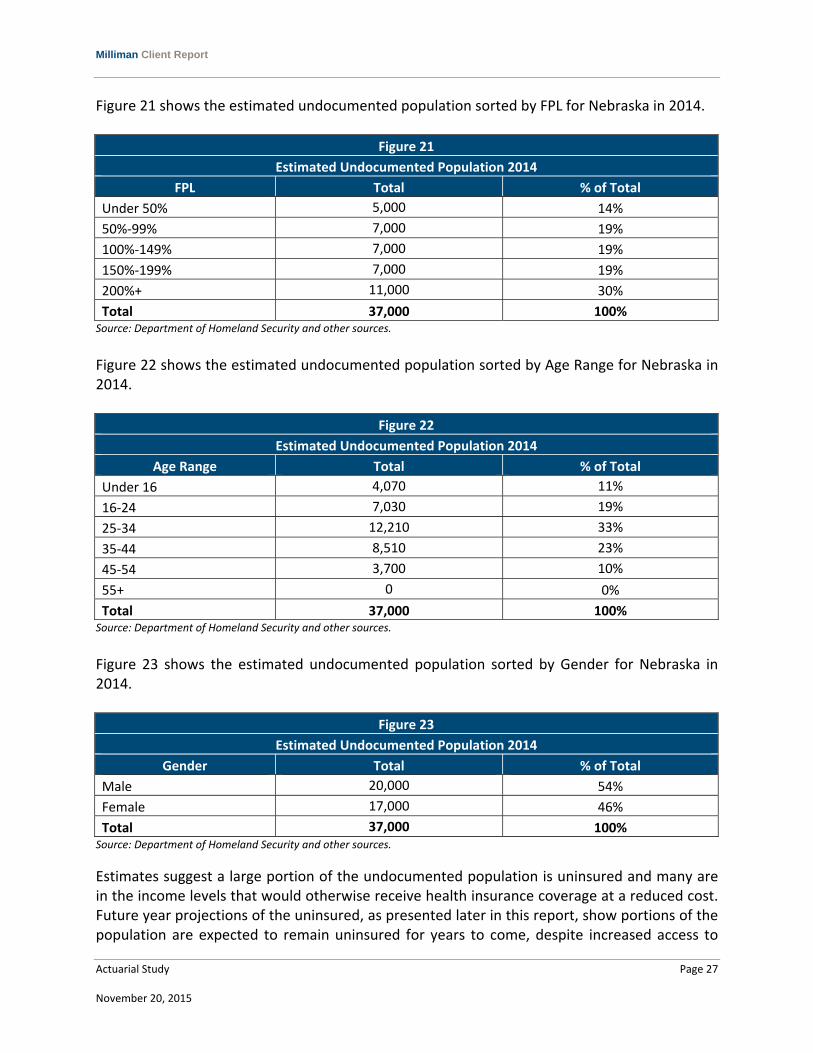
Figure 21 shows the estimated undocumented population sorted by FPL for Nebraska in 2014.
Figure 21
Estimated Undocumented Population 2014
FPL Total % of Total
Under 50% 5,000 14%
50%‐99% 7,000 19%
100%‐149% 7,000 19%
150%‐199% 7,000 19%
200%+ 11,000 30%
Total 37,000 100% Source: Department of Homeland Security and other sources.
Figure 22 shows the estimated undocumented population sorted by Age Range for Nebraska in 2014.
Figure 22
Estimated Undocumented Population 2014
Age Range Total % of Total
Under 16 4,070 11%
16‐24 7,030 19%
25‐34 12,210 33%
35‐44 8,510 23%
45‐54 3,700 10%
55+ 0 0%
Total 37,000 100% Source: Department of Homeland Security and other sources.
Figure 23 shows the estimated undocumented population sorted by Gender for Nebraska in 2014.
Figure 23
Estimated Undocumented Population 2014
Gender Total % of Total
Male 20,000 54%
Female 17,000 46%
Total 37,000 100% Source: Department of Homeland Security and other sources.
Estimates suggest a large portion of the undocumented population is uninsured and many are in the income levels that would otherwise receive health insurance coverage at a reduced cost. Future year projections of the uninsured, as presented later in this report, show portions of the population are expected to remain uninsured for years to come, despite increased access to

Milliman Client Report
Actuarial Study Page 28 November 20, 2015
affordable care and the increasing individual mandate penalty. As the undocumented population are not eligible for the subsidized coverage and are not affected by the individual mandate, the undocumented population accounts for a portion of the projected population that remains uninsured. There are other factors that cause individuals to remain uninsured. These can include a belief system, political view, and/or a perceived lack of necessity despite the individual mandate. The ACA will not greatly influence these populations’ choices to attain coverage.

Milliman Client Report
Actuarial Study Page 29 November 20, 2015
VI. POST‐ACA INSURED/UNINSURED POPULATION PROJECTIONS This section addresses the following topics as they relate to the establishment of the FFM:
“Best estimate scenario” projections of the health insurance market
Projected results in a “high take‐up” or “low take‐up” scenario resulting in higher and lower enrollment shifts to the FFM, respectively
Data sources and assumptions underlying these projections “Best Estimate Scenario” Projections of the Health insurance Market Figure 24A provides the best estimate of projected population by insured status from 2015 through 2025.
* Large Group is broken down into Fully Insured and Self‐Insured. ** Includes VA, TriCare, and Medicare Disabled. Note: “Private” refers to those who self‐reported private health insurance, but did not specify which type of private health insurance.
In 2016, federal regulations will allow states to determine the size of employers that are categorized as small group. While currently companies who employ 50 or less employees are classified small group, Nebraska can decide to increase this limit to 100 employees. As Nebraska’s decision about small group size has not been finalized, this change has not been included in Milliman’s projections.
Market
2015 2016 2017 2018 2019 2020 2021 2022 2023 2024 2025
Individual Market 158,470 182,299 200,619 214,963 226,359 235,524 242,978 249,105 254,194 258,470 262,102
ESI ‐ Small Group (0‐50) 111,099 112,075 112,710 113,182 113,579 113,948 114,311 114,679 115,058 115,448 115,850
ESI ‐ Large Group (51+)*
Fully Insured 224,747 224,892 224,895 224,920 225,032 225,252 225,578 226,003 226,513 227,097 227,743
Self‐Insured 598,206 593,568 590,052 587,564 585,961 585,099 584,849 585,099 585,756 586,745 588,002
Other Private Insurance 36,041 36,185 36,330 36,475 36,621 36,767 36,914 37,062 37,210 37,359 37,509
Medicaid / CHIP 202,006 204,177 205,982 207,542 208,929 210,192 211,364 212,469 213,522 214,536 215,522
Other Government Programs** 78,953 79,113 79,186 79,301 79,454 79,637 79,846 80,077 80,326 80,589 80,865
Uninsured 163,582 147,219 136,073 128,243 122,623 118,532 115,531 113,324 111,710 110,542 109,716
Total Non‐Aged Population 1,573,103 1,579,528 1,585,846 1,592,189 1,598,558 1,604,952 1,611,372 1,617,817 1,624,288 1,630,785 1,637,308
Figure 24A
Total Projected Population per Year
Milliman Client Report
Actuarial Study Page 30 November 20, 2015
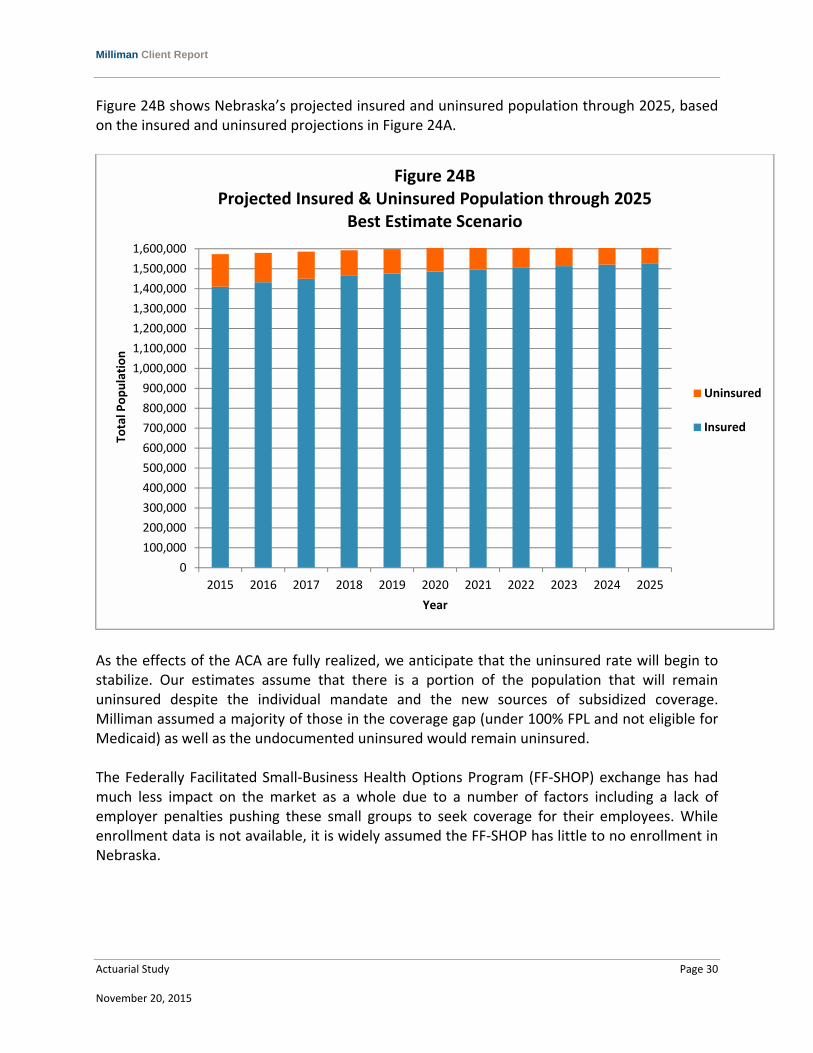
Figure 24B shows Nebraska’s projected insured and uninsured population through 2025, based on the insured and uninsured projections in Figure 24A.
As the effects of the ACA are fully realized, we anticipate that the uninsured rate will begin to stabilize. Our estimates assume that there is a portion of the population that will remain uninsured despite the individual mandate and the new sources of subsidized coverage. Milliman assumed a majority of those in the coverage gap (under 100% FPL and not eligible for Medicaid) as well as the undocumented uninsured would remain uninsured. The Federally Facilitated Small‐Business Health Options Program (FF‐SHOP) exchange has had much less impact on the market as a whole due to a number of factors including a lack of employer penalties pushing these small groups to seek coverage for their employees. While enrollment data is not available, it is widely assumed the FF‐SHOP has little to no enrollment in Nebraska.
0
100,000
200,000
300,000
400,000
500,000
600,000
700,000
800,000
900,000
1,000,000
1,100,000
1,200,000
1,300,000
1,400,000
1,500,000
1,600,000
2015 2016 2017 2018 2019 2020 2021 2022 2023 2024 2025
Total Population
Year
Figure 24BProjected Insured & Uninsured Population through 2025
Best Estimate Scenario
Uninsured
Insured
Milliman Client Report
Actuarial Study Page 31 November 20, 2015
Projected Results in a “High Take‐Up” or “Low Take‐Up” Scenario Resulting in Higher and Lower Enrollment Shifts to the FFM, Respectively The projection of Nebraskan’s insured status into 2015 and beyond is dependent of a number of factors: For the time period up to the enrollment deadline of February 15, 2015:
Estimated market breakdowns are consistent across all the scenarios (“best estimate”, “high take‐up”, and “low take‐up”.
A portion of the individual market is supported by the Department of Health and Human Services (HHS) FFM enrollment data for the 2013‐2014 and 2014‐2015 open enrollment periods.
For the time period after February, 2015:
Estimated market breakdowns will vary by scenario.
FFM participation is modeled for the 2016 through 2025 enrollment periods. While the results shown in Figure 24 demonstrate what Milliman believes to be a best estimate of the number of people to enroll through the FFM for individual and small group lines of business, there are several external factors that could result in greater or lesser FFM enrollment in subsequent years. For example, in 2014, complications, delays, and law changes associated with the healthcare reform implementation have led to many people who are eligible for subsidized coverage to remain uninsured. Similarly, the level of marketing associated with the FFM and socioeconomic factors can drastically affect the enrollment through the FFM. Considering these unknowns, Milliman has developed a number of scenarios to better reflect the possible enrollment rates through 2025. If external factors encourage less participation in the FFM by the uninsured, by 2025 the insurance coverage landscape would be significantly different. To illustrate this scenario Milliman assumed that, compared to the “best estimate”:
People in the individual market were less likely to enroll through the FFM from 2015 onwards.
People in the uninsured market were less likely to enroll through the FFM from 2015 onwards.

Milliman Client Report
Actuarial Study Page 32 November 20, 2015
Figure 26A provides a low FFM enrollment scenario projection by insured status from 2015 through 2025.
* Large Group is broken down into Fully Insured and Self‐Insured. ** Includes VA, TriCare, and Medicare Disabled. Note: “Private” refers to those who self‐reported private health insurance, but did not specify which type of private health insurance.
Figure 25B shows Nebraska’s projected insured and uninsured population through 2025, based on the insured and uninsured projections in Figure 25A.
Market
2015 2016 2017 2018 2019 2020 2021 2022 2023 2024 2025
Individual Market 158,470 165,721 171,469 176,108 179,909 183,069 185,733 188,009 189,982 191,715 193,260
ESI ‐ Small Group (0‐50) 111,099 113,224 114,876 116,213 117,331 118,295 119,147 119,917 120,625 121,286 121,912
ESI ‐ Large Group (51+)*
Fully Insured 224,747 227,218 229,197 230,866 232,329 233,654 234,883 236,046 237,160 238,240 239,295
Self‐Insured 598,206 599,758 601,286 602,883 604,583 606,393 608,309 610,319 612,413 614,578 616,805
Other Private Insurance 36,041 36,185 36,330 36,475 36,621 36,767 36,915 37,062 37,210 37,359 37,509
Medicaid / CHIP 202,006 204,176 206,005 207,593 209,009 210,299 211,494 212,618 213,688 214,716 215,713
Other Government Programs** 78,953 79,421 79,845 80,240 80,616 80,979 81,334 81,682 82,027 82,369 82,709
Uninsured 163,582 153,693 146,706 141,680 138,027 135,362 133,424 132,030 131,049 130,386 129,970
Total Non‐Aged Population 1,573,103 1,579,396 1,585,713 1,592,056 1,598,424 1,604,818 1,611,237 1,617,683 1,624,153 1,630,649 1,637,172
Figure 25A
Total Projected Population per Year (Low Scenario)
0
100,000
200,000
300,000
400,000
500,000
600,000
700,000
800,000
900,000
1,000,000
1,100,000
1,200,000
1,300,000
1,400,000
1,500,000
1,600,000
2015 2016 2017 2018 2019 2020 2021 2022 2023 2024 2025
Total Population
Year
Figure 25BProjected Insured & Uninsured Population through 2025
Low Scenario
Uninsured
Insured
Milliman Client Report
Actuarial Study Page 33 November 20, 2015
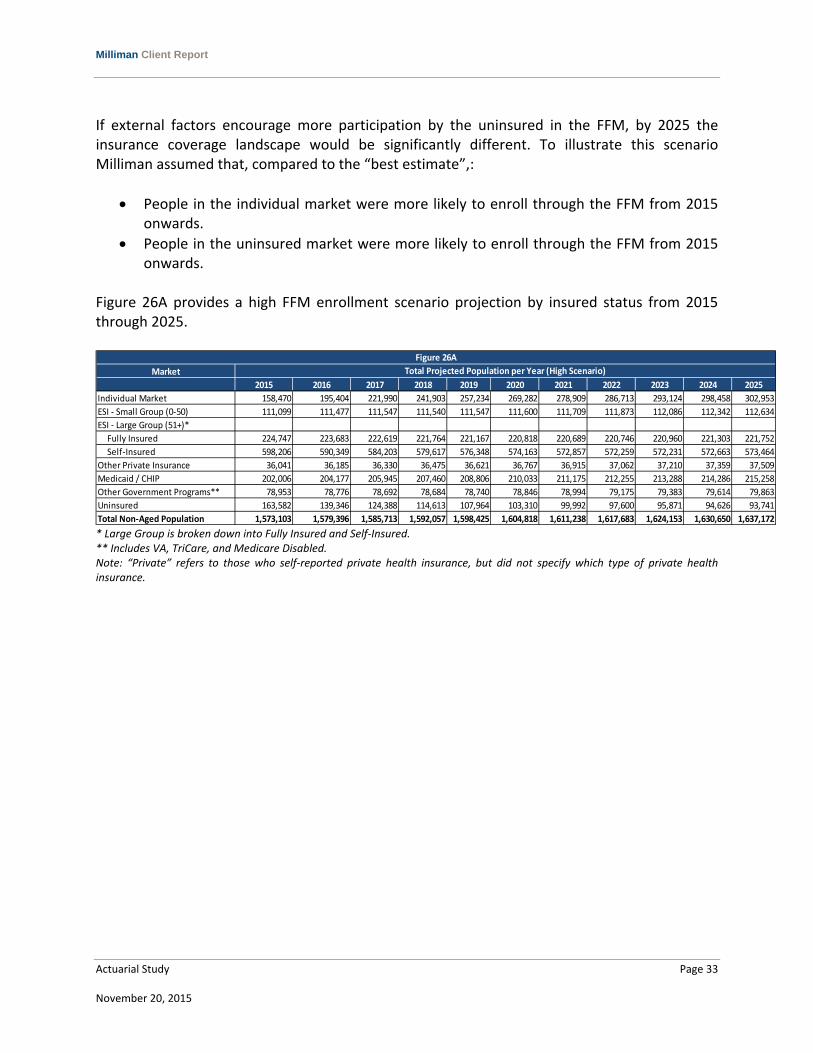
If external factors encourage more participation by the uninsured in the FFM, by 2025 the insurance coverage landscape would be significantly different. To illustrate this scenario Milliman assumed that, compared to the “best estimate”,:
People in the individual market were more likely to enroll through the FFM from 2015 onwards.
People in the uninsured market were more likely to enroll through the FFM from 2015 onwards.
Figure 26A provides a high FFM enrollment scenario projection by insured status from 2015 through 2025.
* Large Group is broken down into Fully Insured and Self‐Insured. ** Includes VA, TriCare, and Medicare Disabled. Note: “Private” refers to those who self‐reported private health insurance, but did not specify which type of private health insurance.
Market
2015 2016 2017 2018 2019 2020 2021 2022 2023 2024 2025
Individual Market 158,470 195,404 221,990 241,903 257,234 269,282 278,909 286,713 293,124 298,458 302,953
ESI ‐ Small Group (0‐50) 111,099 111,477 111,547 111,540 111,547 111,600 111,709 111,873 112,086 112,342 112,634
ESI ‐ Large Group (51+)*
Fully Insured 224,747 223,683 222,619 221,764 221,167 220,818 220,689 220,746 220,960 221,303 221,752
Self‐Insured 598,206 590,349 584,203 579,617 576,348 574,163 572,857 572,259 572,231 572,663 573,464
Other Private Insurance 36,041 36,185 36,330 36,475 36,621 36,767 36,915 37,062 37,210 37,359 37,509
Medicaid / CHIP 202,006 204,177 205,945 207,460 208,806 210,033 211,175 212,255 213,288 214,286 215,258
Other Government Programs** 78,953 78,776 78,692 78,684 78,740 78,846 78,994 79,175 79,383 79,614 79,863
Uninsured 163,582 139,346 124,388 114,613 107,964 103,310 99,992 97,600 95,871 94,626 93,741
Total Non‐Aged Population 1,573,103 1,579,396 1,585,713 1,592,057 1,598,425 1,604,818 1,611,238 1,617,683 1,624,153 1,630,650 1,637,172
Figure 26A
Total Projected Population per Year (High Scenario)
Milliman Client Report
Actuarial Study Page 34 November 20, 2015
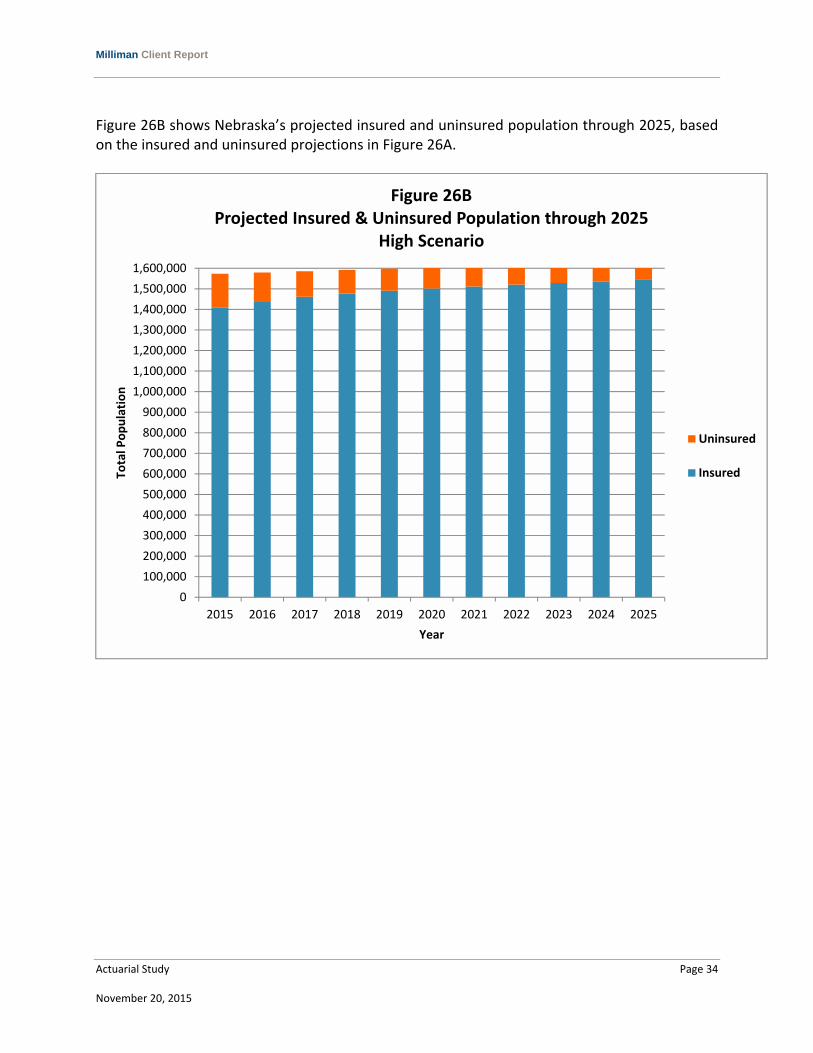
Figure 26B shows Nebraska’s projected insured and uninsured population through 2025, based on the insured and uninsured projections in Figure 26A.
0
100,000
200,000
300,000
400,000
500,000
600,000
700,000
800,000
900,000
1,000,000
1,100,000
1,200,000
1,300,000
1,400,000
1,500,000
1,600,000
2015 2016 2017 2018 2019 2020 2021 2022 2023 2024 2025
Total Population
Year
Figure 26BProjected Insured & Uninsured Population through 2025
High Scenario
Uninsured
Insured

Milliman Client Report
Actuarial Study Page 35 November 20, 2015
VII. QUALIFICATIONS This report was created by Timothy F. Harris. Mr. Harris is a principal and consulting actuary in the St. Louis office of Milliman and the author of “Health Care Coverage and Financing in the United States.” He is a Fellow of the Society of Actuaries and a Member of the American Academy of Actuaries. As such, he meets the qualification standards for performing the analyses contained in this report.
Appendix A Technical Details on Population Modeling
Actuarial Study Page A‐1 November 20, 2015
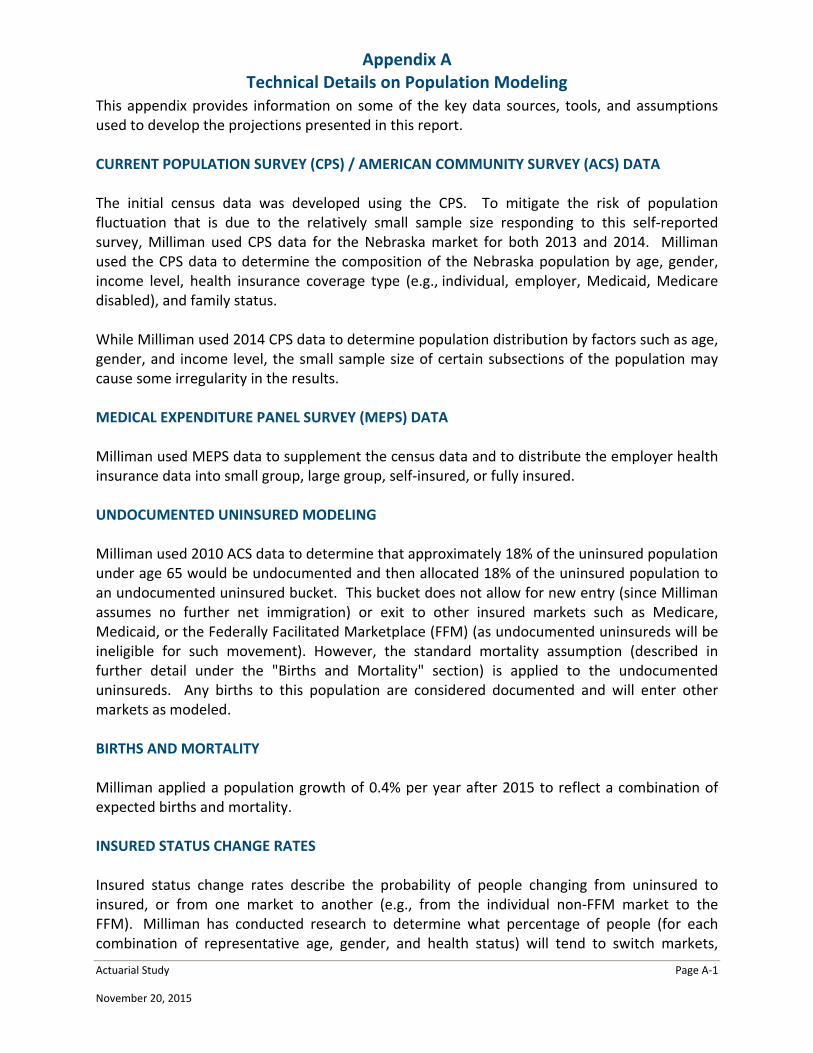
This appendix provides information on some of the key data sources, tools, and assumptions used to develop the projections presented in this report. CURRENT POPULATION SURVEY (CPS) / AMERICAN COMMUNITY SURVEY (ACS) DATA The initial census data was developed using the CPS. To mitigate the risk of population fluctuation that is due to the relatively small sample size responding to this self‐reported survey, Milliman used CPS data for the Nebraska market for both 2013 and 2014. Milliman used the CPS data to determine the composition of the Nebraska population by age, gender, income level, health insurance coverage type (e.g., individual, employer, Medicaid, Medicare disabled), and family status. While Milliman used 2014 CPS data to determine population distribution by factors such as age, gender, and income level, the small sample size of certain subsections of the population may cause some irregularity in the results. MEDICAL EXPENDITURE PANEL SURVEY (MEPS) DATA Milliman used MEPS data to supplement the census data and to distribute the employer health insurance data into small group, large group, self‐insured, or fully insured. UNDOCUMENTED UNINSURED MODELING Milliman used 2010 ACS data to determine that approximately 18% of the uninsured population under age 65 would be undocumented and then allocated 18% of the uninsured population to an undocumented uninsured bucket. This bucket does not allow for new entry (since Milliman assumes no further net immigration) or exit to other insured markets such as Medicare, Medicaid, or the Federally Facilitated Marketplace (FFM) (as undocumented uninsureds will be ineligible for such movement). However, the standard mortality assumption (described in further detail under the "Births and Mortality" section) is applied to the undocumented uninsureds. Any births to this population are considered documented and will enter other markets as modeled. BIRTHS AND MORTALITY Milliman applied a population growth of 0.4% per year after 2015 to reflect a combination of expected births and mortality. INSURED STATUS CHANGE RATES Insured status change rates describe the probability of people changing from uninsured to insured, or from one market to another (e.g., from the individual non‐FFM market to the FFM). Milliman has conducted research to determine what percentage of people (for each combination of representative age, gender, and health status) will tend to switch markets,
Appendix A Technical Details on Population Modeling
Actuarial Study Page A‐2 November 20, 2015
based on the ACA provisions and the modeled individual’s expected healthcare costs, subsidies, and premium rate choices. Using that research, Milliman modeled the projected population’s movements between the various health insurance coverage types. INSURED STATUS CHANGE RATE DISTRIBUTION FOR THE THREE MARKET SCENARIOS (BEST ESTIMATE, HIGH TAKE‐UP, AND LOW TAKE‐UP) In order to model the three different scenarios underlying Milliman’s Nebraska reform projections (best estimate, high, and low), Milliman estimated insured status change rates for three key market‐to‐market movements. Using the research Milliman developed to estimate the percentage of people who will move from one market to another based on their demographics, costs, subsidies, etc. (as described above), Milliman modeled a variety of possible movements, including the movement from uninsured to FFM coverage; the movement from uninsured to individual non‐FFM coverage; the movement from individual coverage to FFM coverage, etc. In creating the three scenarios, Milliman was most interested in investigating the affordability of healthcare and, thus, the likelihood that people would need some form of coverage to meet their healthcare needs in the future. The three movements Milliman focused on when creating Milliman’s projection scenarios are described in further detail below:
1. The movement from employer coverage (small group and large group) to the FFM in 2016. The high enrollment scenario assumes more people would go to the FFM in these earlier years as they lose coverage in the group market and the low enrollment scenario assumes fewer people go to the FFM in 2016 with the best‐estimate scenario approximately in the center.
2. The movement from an uninsured status to employer coverage in 2016 and thereafter. This movement was reflected in years 2016 through 2025 and again the high enrollment scenario shows the largest percentage of people moving to individual coverage in the FFM with the best estimate scenario to follow and the low enrollment rate scenario with the smallest percentage movement. The insured status change rate varied from year to year to reflect the initial wave of enrollees in 2016, but also the effect of the increasing individual mandate tax penalty.
3. The movement from an uninsured status to FFM coverage in 2016 and thereafter. This movement was reflected in years 2016 through 2025 and again the high enrollment scenario shows the largest percentage of people moving to FFM coverage with the best estimate scenario to follow and the low enrollment scenario with the smallest percentage movement. Also, Milliman assumed that the first year of eligibility (2014) resulted in the largest shift in members from the uninsured population, which would then taper off in subsequent years.

Appendix B Rating Region by Counties
Actuarial Study Page B‐1 November 20, 2015
MOVEMENT BETWEEN MARKETS THAT IS DUE TO AGING The causes of age‐related movements between markets include formerly dependent children who reach an age where they are emancipated to other markets, adults who reach age 65 and join the Medicare market (Milliman assumed 100% of documented individuals who are not already enrolled in the Medicare disabled market join the Medicare market at age 65), and individuals in other markets who lapse to the uninsured market because of premium rate increases. Figure 27A shows the percentage change from our estimates of low and high compared to the best estimate projection for the individual market and uninsured. The individual market and the uninsured population had the largest percentage change from low and high projections.
2015 2016 2017 2018 2019 2020 2021 2022 2023 2024 2025
% Change
Low0.0% ‐9.1% ‐14.5% ‐18.1% ‐20.5% ‐22.3% ‐23.6% ‐24.5% ‐25.3% ‐25.8% ‐26.3%
Projected
Population158,470 182,299 200,618 214,961 226,357 235,521 242,975 249,101 254,190 258,465 262,098
% Change
High0.0% 7.2% 10.7% 12.5% 13.6% 14.3% 14.8% 15.1% 15.3% 15.5% 15.6%
% Change
Low0.0% 4.4% 7.8% 10.5% 12.6% 14.2% 15.5% 16.5% 17.3% 18.0% 18.5%
Projected
Population163,582 147,219 136,073 128,243 122,623 118,532 115,531 113,324 111,710 110,542 109,716
% Change
High0.0% ‐5.3% ‐8.6% ‐10.6% ‐12.0% ‐12.8% ‐13.4% ‐13.9% ‐14.2% ‐14.4% ‐14.6%
Figure 27A
MarketPercentage Change in Total Projected Population per Year
Individual
Market
Uninsured
Appendix B Rating Region by Counties
Actuarial Study Page B‐2 November 20, 2015
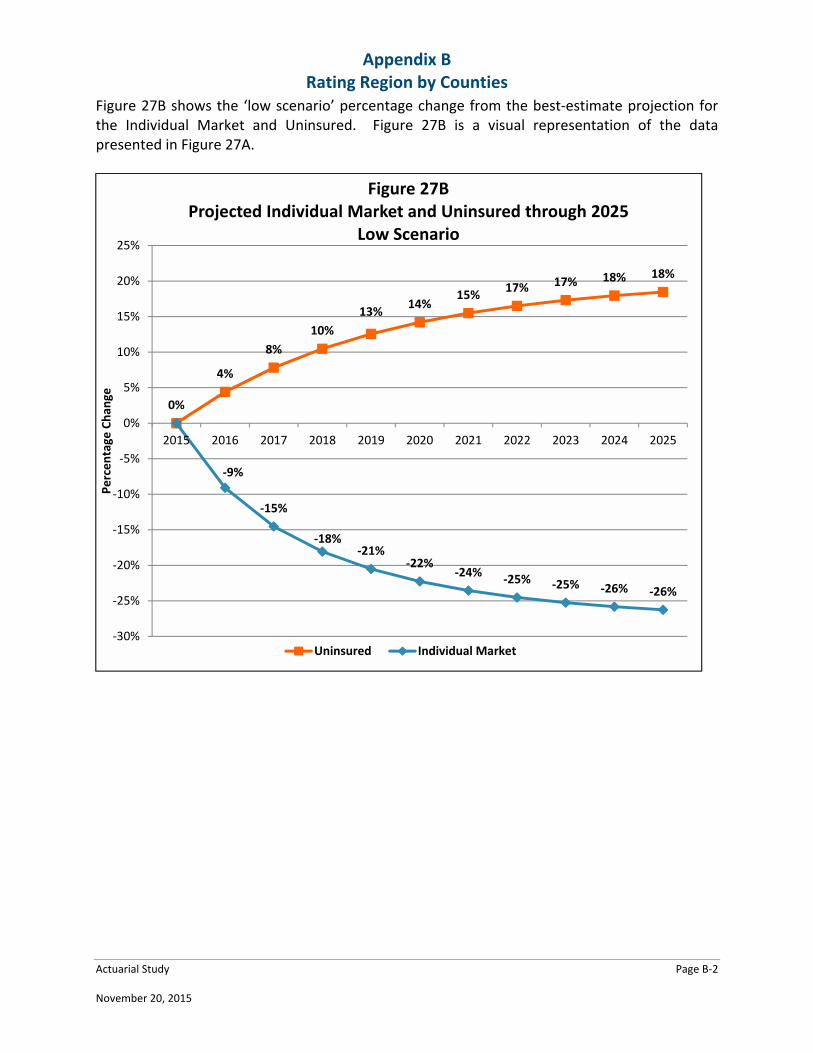
Figure 27B shows the ‘low scenario’ percentage change from the best‐estimate projection for the Individual Market and Uninsured. Figure 27B is a visual representation of the data presented in Figure 27A.
0%
4%
8%
10%
13%14%
15%17% 17% 18% 18%
‐9%
‐15%
‐18%‐21%
‐22%‐24%
‐25% ‐25% ‐26% ‐26%
‐30%
‐25%
‐20%
‐15%
‐10%
‐5%
0%
5%
10%
15%
20%
25%
2015 2016 2017 2018 2019 2020 2021 2022 2023 2024 2025
Percentage
Chan
ge
Figure 27BProjected Individual Market and Uninsured through 2025
Low Scenario
Uninsured Individual Market

Appendix B Rating Region by Counties
Actuarial Study Page B‐3 November 20, 2015
Figure 27C shows the ‘high scenario’ percentage change from the best‐estimate projection for the Individual Market and Uninsured. Figure 27C is a visual representation of the data presented in Figure 27A.
‐5%
‐9%
‐11% ‐12%‐13% ‐13% ‐14% ‐14% ‐14% ‐15%
0%
7%
11%13%
14% 14% 15% 15% 15% 15% 16%
‐20%
‐15%
‐10%
‐5%
0%
5%
10%
15%
20%
2015 2016 2017 2018 2019 2020 2021 2022 2023 2024 2025
Percentage
Chan
ge
Figure 27CProjected Individual Market and Uninsured through 2025
High Scenario
Uninsured Individual Market
Appendix B Rating Region by Counties
Actuarial Study Page B‐4 November 20, 2015
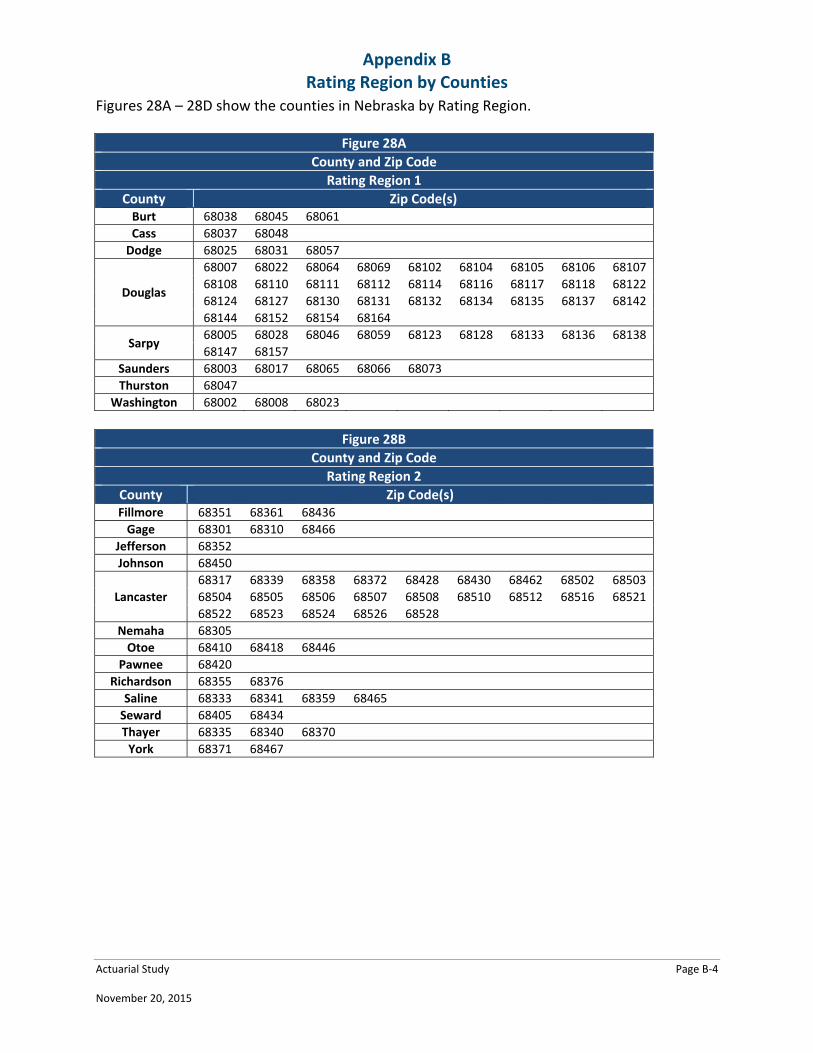
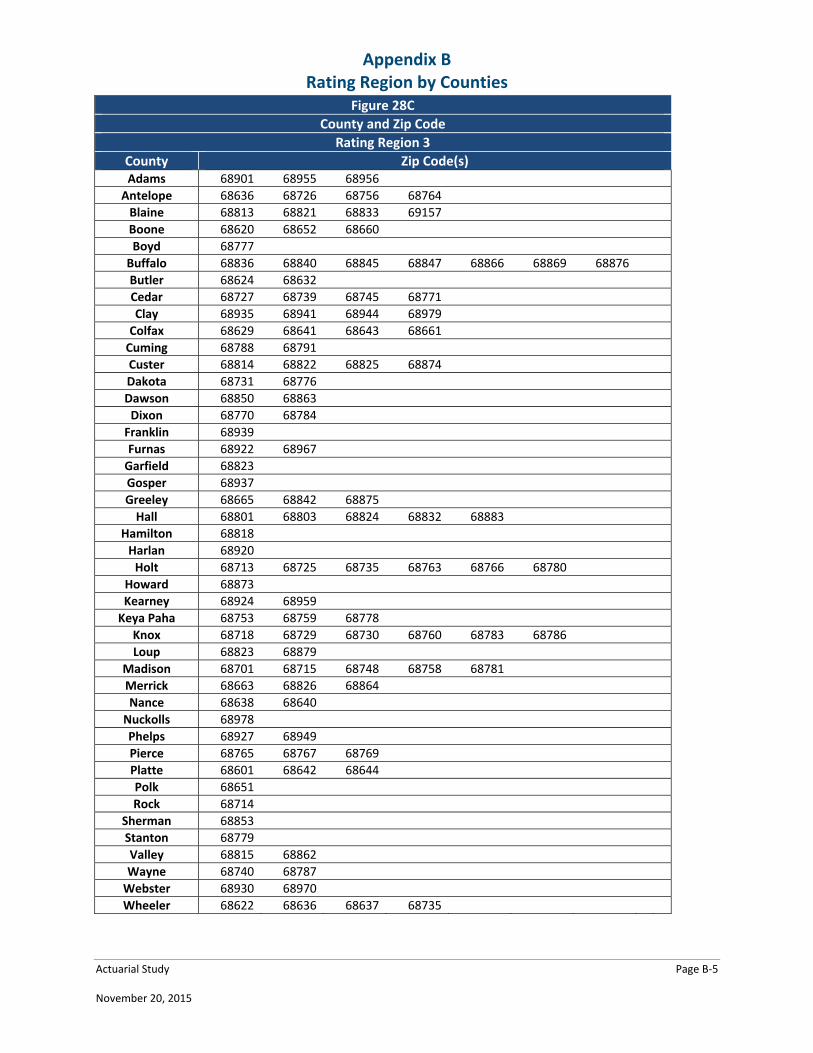
Figures 28A – 28D show the counties in Nebraska by Rating Region.
Figure 28A
County and Zip Code
Rating Region 1
County Zip Code(s) Burt 68038 68045 68061
Cass 68037 68048
Dodge 68025 68031 68057
Douglas
68007 68022 68064 68069 68102 68104 68105 68106 68107
68108 68110 68111 68112 68114 68116 68117 68118 68122
68124 68127 68130 68131 68132 68134 68135 68137 68142
68144 68152 68154 68164
Sarpy 68005 68028 68046 68059 68123 68128 68133 68136 68138
68147 68157
Saunders 68003 68017 68065 68066 68073
Thurston 68047
Washington 68002 68008 68023
Figure 28B
County and Zip Code
Rating Region 2
County Zip Code(s) Fillmore 68351 68361 68436
Gage 68301 68310 68466
Jefferson 68352
Johnson 68450
Lancaster
68317 68339 68358 68372 68428 68430 68462 68502 68503
68504 68505 68506 68507 68508 68510 68512 68516 68521
68522 68523 68524 68526 68528
Nemaha 68305
Otoe 68410 68418 68446
Pawnee 68420
Richardson 68355 68376
Saline 68333 68341 68359 68465
Seward 68405 68434
Thayer 68335 68340 68370
York 68371 68467
Appendix B Rating Region by Counties
Actuarial Study Page B‐5 November 20, 2015
Figure 28C
County and Zip Code
Rating Region 3
County Zip Code(s) Adams 68901 68955 68956
Antelope 68636 68726 68756 68764
Blaine 68813 68821 68833 69157
Boone 68620 68652 68660
Boyd 68777
Buffalo 68836 68840 68845 68847 68866 68869 68876
Butler 68624 68632
Cedar 68727 68739 68745 68771
Clay 68935 68941 68944 68979
Colfax 68629 68641 68643 68661
Cuming 68788 68791
Custer 68814 68822 68825 68874
Dakota 68731 68776
Dawson 68850 68863
Dixon 68770 68784
Franklin 68939
Furnas 68922 68967
Garfield 68823
Gosper 68937
Greeley 68665 68842 68875
Hall 68801 68803 68824 68832 68883
Hamilton 68818
Harlan 68920
Holt 68713 68725 68735 68763 68766 68780
Howard 68873
Kearney 68924 68959
Keya Paha 68753 68759 68778
Knox 68718 68729 68730 68760 68783 68786
Loup 68823 68879
Madison 68701 68715 68748 68758 68781
Merrick 68663 68826 68864
Nance 68638 68640
Nuckolls 68978
Phelps 68927 68949
Pierce 68765 68767 68769
Platte 68601 68642 68644
Polk 68651
Rock 68714
Sherman 68853
Stanton 68779
Valley 68815 68862
Wayne 68740 68787
Webster 68930 68970
Wheeler 68622 68636 68637 68735

Appendix B Rating Region by Counties
Actuarial Study Page B‐6 November 20, 2015
Figure 28D
County and Zip Code
Rating Region 4
County Zip Code(s) Arthur 69121 69146 69165 69350
Banner 69145 69156 69334 69336 69341 69345
Box Butte 69301 69348
Brown 69210 69217
Chase 69033 69045
Cherry 69201
Cheyenne 69162
Dawes 69337 69339
Deuel 69129
Dundy 69021
Frontier 69001 69022 69025 69028 69029 69034 69038 69039 69042
Garden 69147 69154
Grant 69350
Hayes 69024 69032 69038 69040 69045 69134 69169
Hitchcock 69024 69043
Hooker 69152
Keith 69127 69153 69155
Kimball 69145
Lincoln 69101 69123 69143 69165
Logan 69163
McPherson 69101 69165 69167
Morrill 69334 69336
Perkins 69140
Red Willow 69001
Scotts Bluff 69341 69352 69356 69357 69358 69361
Sheridan 69343 69347 69360
Sioux 69346
Thomas 69166

Appendix B Rating Region by Counties
Actuarial Study Page B‐7 November 20, 2015
Figure 29 shows the location of the four Rating Regions in Nebraska.
Appendix C Acronyms and Terminology
Actuarial Study Page C‐1 November 20, 2015
LIST OF ACRONYMS
ACA – Affordable Care Act ACS – American Community Survey APTC – Advanced Premium Tax Credits ASPE – Office of the Assistant Secretary for Planning and Evaluation CHIP – Children’s Health Insurance Program CMS – Center for Medicare and Medicaid Services CPS – Current Population Survey CSR – Cost Sharing Reductions ESI – Employer‐Sponsored Health Insurance EHB – Essential Health Benefits FFM – Federally Facilitated Marketplace FF‐SHOP – Federally Facilitated Small‐Business Health Options Program FPL – Federal Poverty Level HHS – Department of Health and Human Services KFF – Kaiser Family Foundation MAGI – Modified Adjusted Gross Income MEPS – Medical Expenditure Panel Survey MLR – Medical Loss Ratio NDOI – Nebraska Department of Insurance VA – U.S. Department of Veterans Affairs
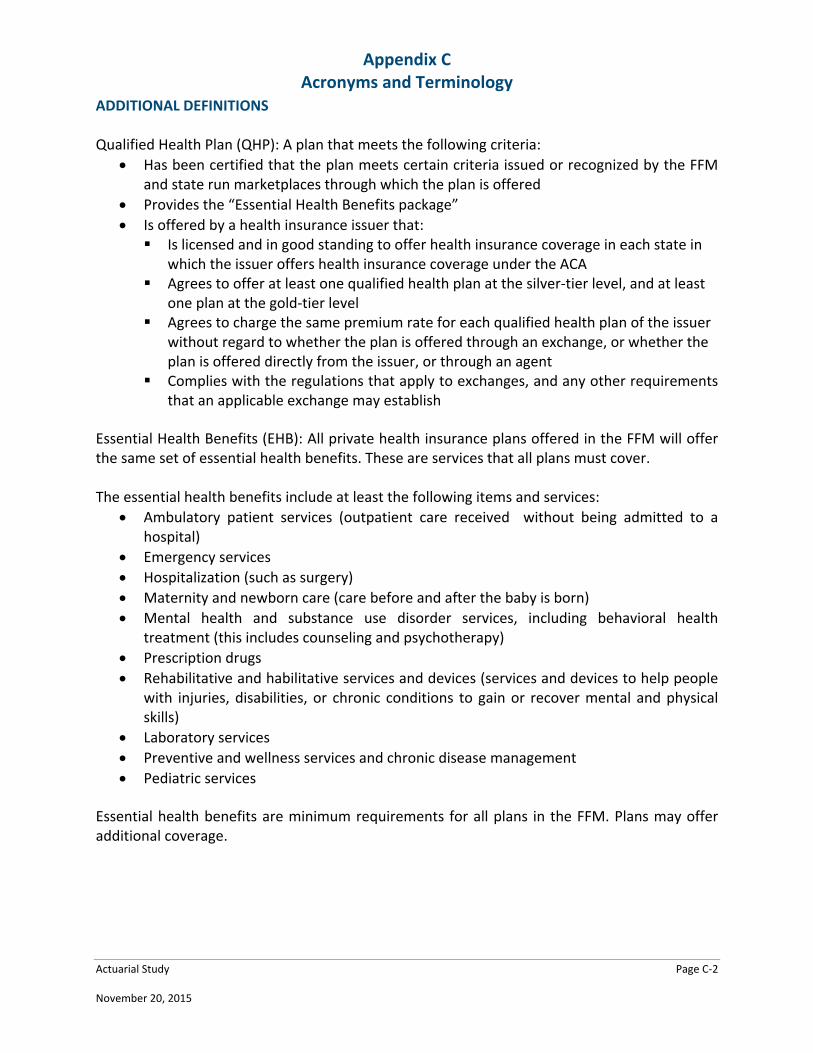
Appendix C Acronyms and Terminology
Actuarial Study Page C‐2 November 20, 2015
ADDITIONAL DEFINITIONS Qualified Health Plan (QHP): A plan that meets the following criteria:
Has been certified that the plan meets certain criteria issued or recognized by the FFM and state run marketplaces through which the plan is offered
Provides the “Essential Health Benefits package”
Is offered by a health insurance issuer that: Is licensed and in good standing to offer health insurance coverage in each state in
which the issuer offers health insurance coverage under the ACA Agrees to offer at least one qualified health plan at the silver‐tier level, and at least
one plan at the gold‐tier level Agrees to charge the same premium rate for each qualified health plan of the issuer
without regard to whether the plan is offered through an exchange, or whether the plan is offered directly from the issuer, or through an agent
Complies with the regulations that apply to exchanges, and any other requirements that an applicable exchange may establish
Essential Health Benefits (EHB): All private health insurance plans offered in the FFM will offer the same set of essential health benefits. These are services that all plans must cover. The essential health benefits include at least the following items and services:
Ambulatory patient services (outpatient care received without being admitted to a hospital)
Emergency services
Hospitalization (such as surgery)
Maternity and newborn care (care before and after the baby is born)
Mental health and substance use disorder services, including behavioral health treatment (this includes counseling and psychotherapy)
Prescription drugs
Rehabilitative and habilitative services and devices (services and devices to help people with injuries, disabilities, or chronic conditions to gain or recover mental and physical skills)
Laboratory services
Preventive and wellness services and chronic disease management
Pediatric services
Essential health benefits are minimum requirements for all plans in the FFM. Plans may offer additional coverage.
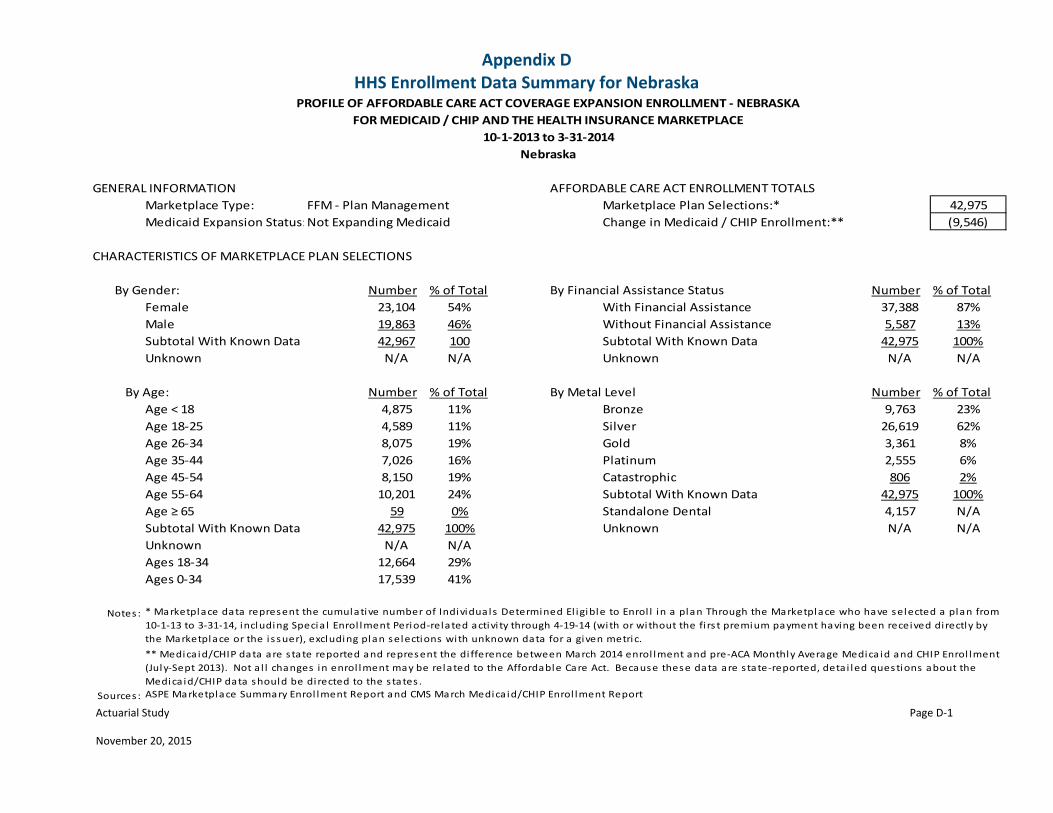
Appendix D HHS Enrollment Data Summary for Nebraska
Actuarial Study Page D‐1
November 20, 2015
GENERAL INFORMATION AFFORDABLE CARE ACT ENROLLMENT TOTALS
Marketplace Type: FFM ‐ Plan Management Marketplace Plan Selections:* 42,975
Medicaid Expansion Status:Not Expanding Medicaid Change in Medicaid / CHIP Enrollment:** (9,546)
CHARACTERISTICS OF MARKETPLACE PLAN SELECTIONS
Number % of Total By Financial Assistance Status Number % of Total
Female 23,104 54% With Financial Assistance 37,388 87%
Male 19,863 46% Without Financial Assistance 5,587 13%
Subtotal With Known Data 42,967 100 Subtotal With Known Data 42,975 100%
Unknown N/A N/A Unknown N/A N/A
Number % of Total By Metal Level Number % of Total
Age < 18 4,875 11% Bronze 9,763 23%
Age 18‐25 4,589 11% Silver 26,619 62%
Age 26‐34 8,075 19% Gold 3,361 8%
Age 35‐44 7,026 16% Platinum 2,555 6%
Age 45‐54 8,150 19% Catastrophic 806 2%
Age 55‐64 10,201 24% Subtotal With Known Data 42,975 100%
Age ≥ 65 59 0% Standalone Dental 4,157 N/A
Subtotal With Known Data 42,975 100% Unknown N/A N/A
Unknown N/A N/A
Ages 18‐34 12,664 29%
Ages 0‐34 17,539 41%
Notes :
Sources :
PROFILE OF AFFORDABLE CARE ACT COVERAGE EXPANSION ENROLLMENT ‐ NEBRASKA
FOR MEDICAID / CHIP AND THE HEALTH INSURANCE MARKETPLACE
10‐1‐2013 to 3‐31‐2014
Nebraska
* Marketplace data represent the cumulative number of Individuals Determined El igible to Enrol l in a plan Through the Marketplace who have selected a plan from
10‐1‐13 to 3‐31‐14, including Specia l Enrol lment Period‐related activi ty through 4‐19‐14 (with or without the fi rs t premium payment having been received directly by
the Marketplace or the i s suer), excluding plan selections with unknown data for a given metric.
** Medica id/CHIP data are state reported and represent the di fference between March 2014 enrol lment and pre‐ACA Monthly Average Medica id and CHIP Enrol lment
(July‐Sept 2013). Not al l changes in enrol lment may be related to the Affordable Care Act. Because these data are state‐reported, detai led questions about the
Medica id/CHIP data should be directed to the states .
ASPE Marketplace Summary Enrol lment Report and CMS March Medica id/CHIP Enrol lment Report
By Gender:
By Age:
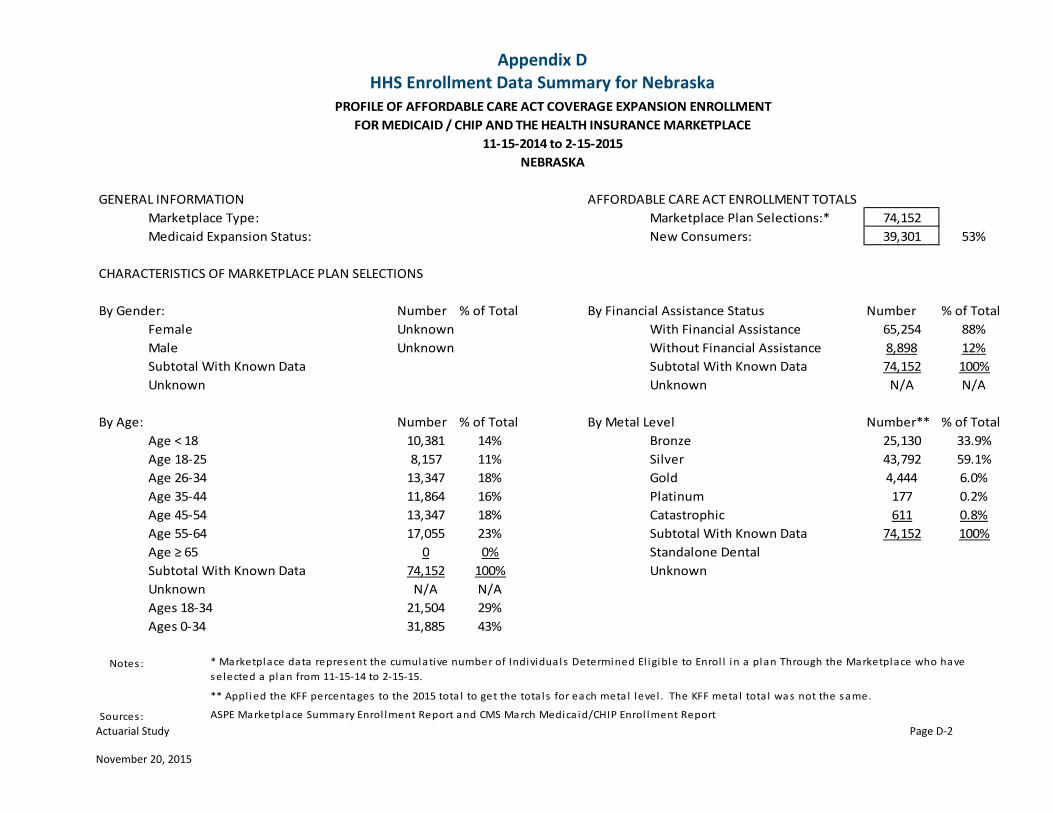
Appendix D HHS Enrollment Data Summary for Nebraska
Actuarial Study Page D‐2 November 20, 2015
GENERAL INFORMATION AFFORDABLE CARE ACT ENROLLMENT TOTALS
Marketplace Type: Marketplace Plan Selections:* 74,152
Medicaid Expansion Status: New Consumers: 39,301 53%
CHARACTERISTICS OF MARKETPLACE PLAN SELECTIONS
Number % of Total By Financial Assistance Status Number % of Total
Female Unknown With Financial Assistance 65,254 88%
Male Unknown Without Financial Assistance 8,898 12%
Subtotal With Known Data Subtotal With Known Data 74,152 100%
Unknown Unknown N/A N/A
By Age: Number % of Total By Metal Level Number** % of Total
Age < 18 10,381 14% Bronze 25,130 33.9%
Age 18‐25 8,157 11% Silver 43,792 59.1%
Age 26‐34 13,347 18% Gold 4,444 6.0%
Age 35‐44 11,864 16% Platinum 177 0.2%
Age 45‐54 13,347 18% Catastrophic 611 0.8%
Age 55‐64 17,055 23% Subtotal With Known Data 74,152 100%
Age ≥ 65 0 0% Standalone Dental
Subtotal With Known Data 74,152 100% Unknown
Unknown N/A N/A
Ages 18‐34 21,504 29%
Ages 0‐34 31,885 43%
Notes :
Sources : ASPE Marketplace Summary Enrol lment Report and CMS March Medica id/CHIP Enrol lment Report
11‐15‐2014 to 2‐15‐2015
NEBRASKA
* Marketplace data represent the cumulative number of Individuals Determined El igible to Enrol l in a plan Through the Marketplace who have
selected a plan from 11‐15‐14 to 2‐15‐15.
** Appl ied the KFF percentages to the 2015 tota l to get the tota ls for each metal level . The KFF metal tota l was not the same.
By Gender:
PROFILE OF AFFORDABLE CARE ACT COVERAGE EXPANSION ENROLLMENT
FOR MEDICAID / CHIP AND THE HEALTH INSURANCE MARKETPLACE
Related Documents