Migration and Development: Recent Evidence and Some Lessons for Africa International Conference Sustainable Growth and Development in Africa Dakar, November 25, 2013 Christian Ebeke International Monetary Fund Washington, D.C., USA

Migration and Development: Recent Evidence and Some Lessons for Africa International Conference Sustainable Growth and Development in Africa Dakar, November.
Dec 24, 2015
Welcome message from author
This document is posted to help you gain knowledge. Please leave a comment to let me know what you think about it! Share it to your friends and learn new things together.
Transcript

Migration and Development: Recent Evidence and Some Lessons for Africa
International Conference Sustainable Growth and Development in Africa
Dakar, November 25, 2013
Christian Ebeke
International Monetary Fund
Washington, D.C., USA
International migration: What’s behind the ramp-up?

Upward trend in migration across destinations …
1990 2000 2010 20130
50,000,000
100,000,000
150,000,000
200,000,000
250,000,000
82 306 645 103 388 690
129 737 280 135 583 436
71 855 339 71 127 043
90 992 020 95 938 779
Less developed regionsMore developed regions
Stock of migrants(by destination regions)
Sources: United Nations.
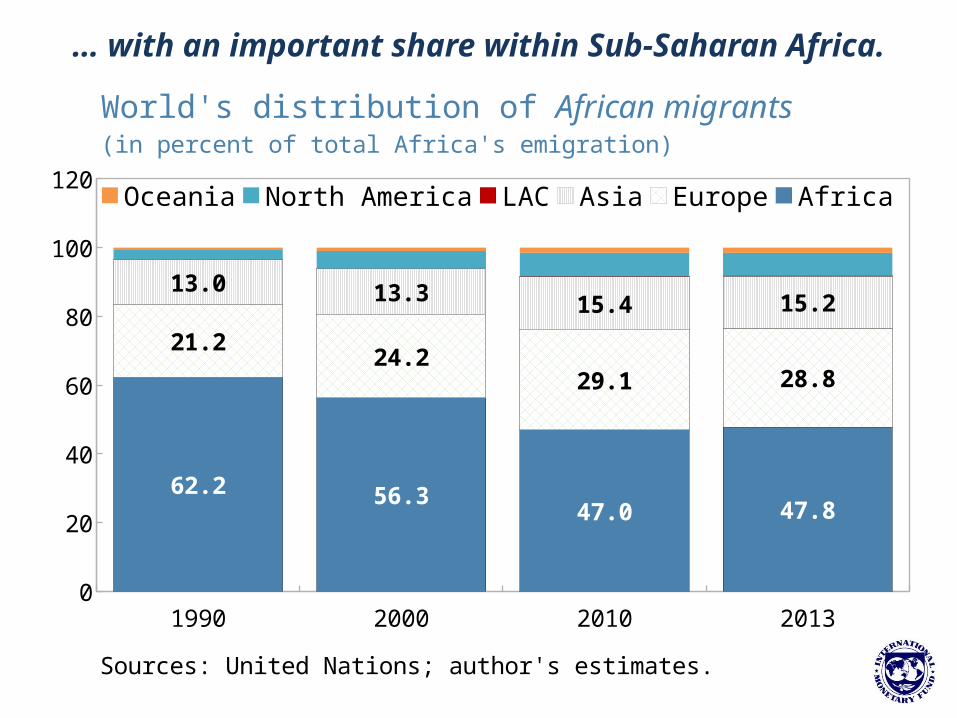
… with an important share within Sub-Saharan Africa.
1990 2000 2010 20130
20
40
60
80
100
120
62.2 56.347.0 47.8
21.224.2
29.1 28.8
13.0 13.3 15.4 15.2
Oceania North America LAC Asia Europe Africa
World's distribution of African migrants(in percent of total Africa's emigration)
Sources: United Nations; author's estimates.
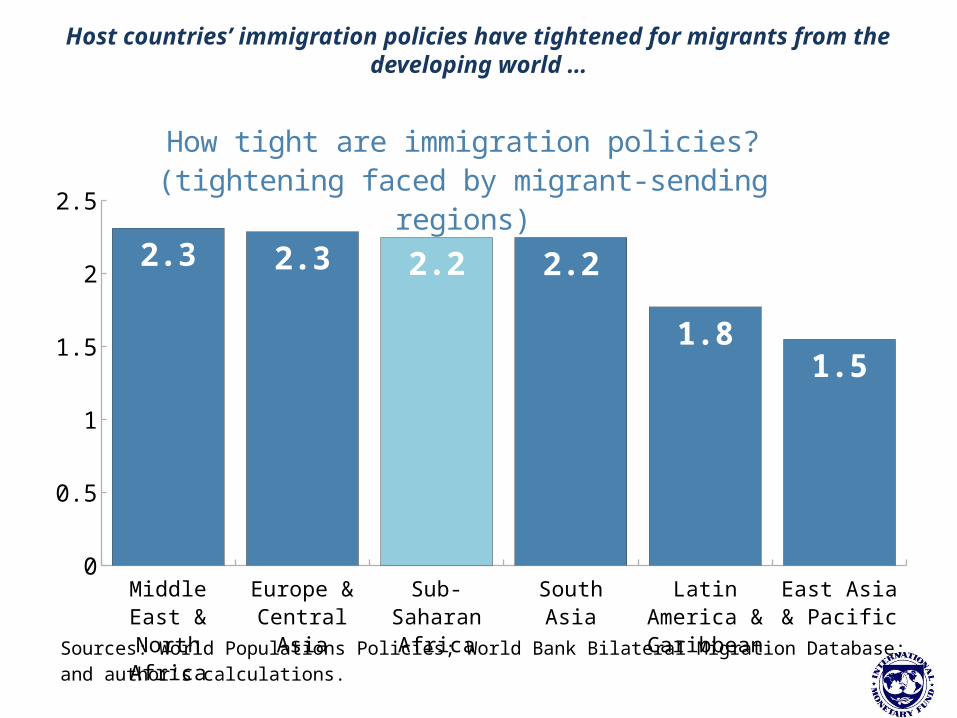
Host countries’ immigration policies have tightened for migrants from the developing world …
Middle East & North Africa
Europe & Central
Asia
Sub-Sa-haran Africa
South Asia Latin Amer-ica & Car-
ibbean
East Asia & Pacific
0
0.5
1
1.5
2
2.5
2.3 2.3 2.2 2.2
1.81.5
How tight are immigration policies?(tightening faced by migrant-sending regions)
Sources: World Populations Policies; World Bank Bilateral Migration Database; and author's calculations.
1990 2000 2010 20130
20
40
60
80
100
120
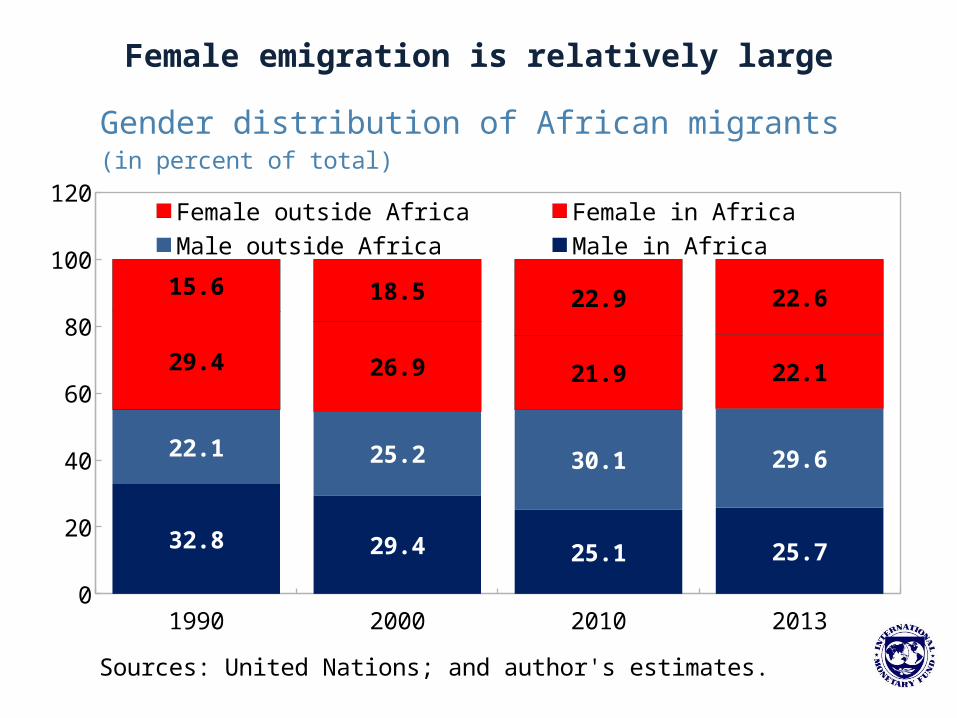
32.8 29.4 25.1 25.7
22.1 25.2 30.1 29.6
29.4 26.9 21.9 22.1
15.6 18.5 22.9 22.6
Female outside Africa Female in Africa Male outside AfricaMale in Africa
Gender distribution of African migrants(in percent of total)
Sources: United Nations; and author's estimates.
Female emigration is relatively large

However, there is a large heterogeneity in emigration intensities in Sub-Saharan Africa.
0
5
10
15
20
25
30
35
40
African migrants living abroad in 2013(as a percentage of total population of the country of origin)
Sources: United Nations; and author's estimates.
Is Sub-Saharan Africa loosing its “Brain”?

Skilled emigration from Africa is not necessarily large compared to other regions …
0
10
20
30
40
50
60
Share of skilled migrants in total emigration in the 2000s(in percent)
Sources: E. Artuc, F. Docquier, C. Ozden, Ch. Parsons (2013)
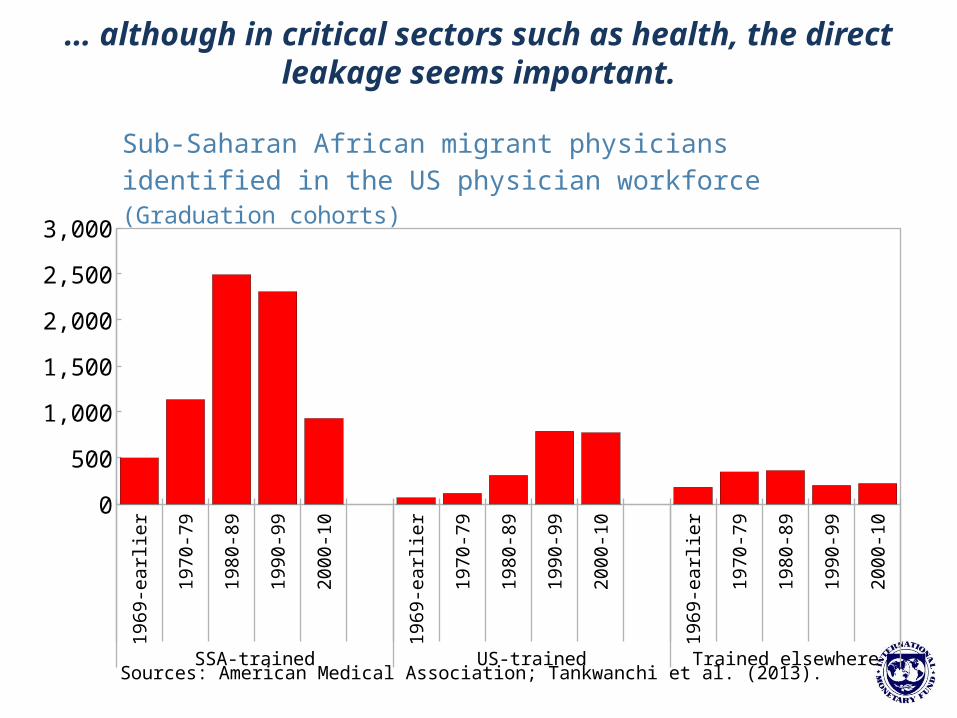
… although in critical sectors such as health, the direct leakage seems important.
19
69
-ea
rlie
r
19
70
-79
19
80
-89
19
90
-99
20
00
-10
19
69
-ea
rlie
r
19
70
-79
19
80
-89
19
90
-99
20
00
-10
19
69
-ea
rlie
r
19
70
-79
19
80
-89
19
90
-99
20
00
-10
SSA-trained US-trained Trained elsewhere
0
500
1,000
1,500
2,000
2,500
3,000
Sub-Saharan African migrant physicians identified in the US physician workforce(Graduation cohorts)
Sources: American Medical Association; Tankwanchi et al. (2013).
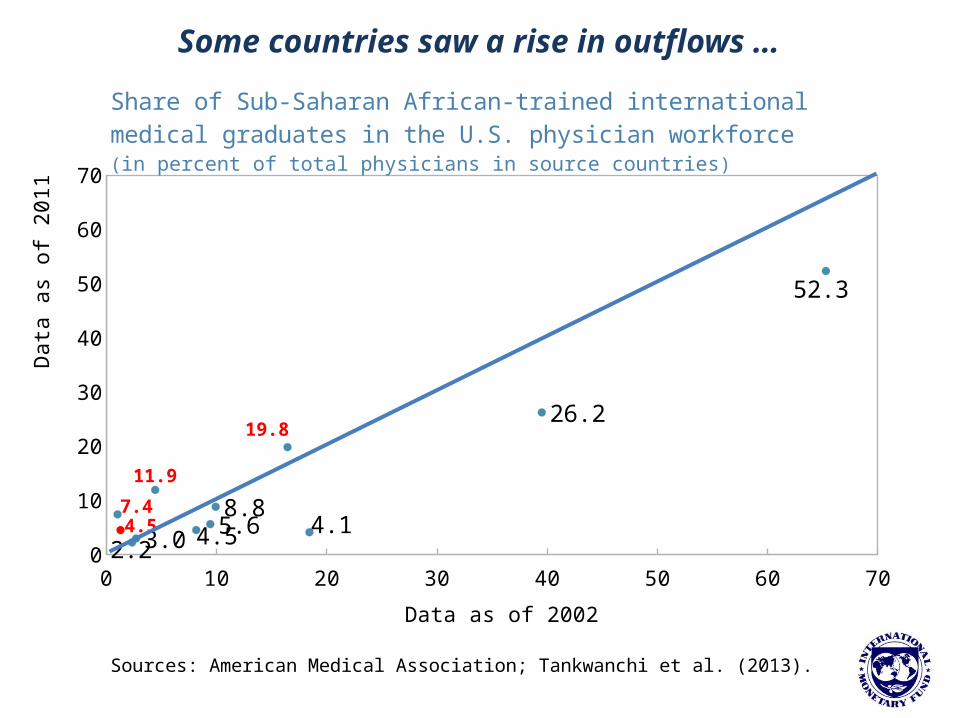
Some countries saw a rise in outflows …
0 10 20 30 40 50 60 700
10
20
30
40
50
60
70
4.53.0
19.8
2.2
7.45.6
26.2
11.9
8.8
52.3
4.14.5
Share of Sub-Saharan African-trained international medical graduates in the U.S. physician workforce(in percent of total physicians in source countries)
Sources: American Medical Association; Tankwanchi et al. (2013).
Data as of 2002
Data
as
of
2011
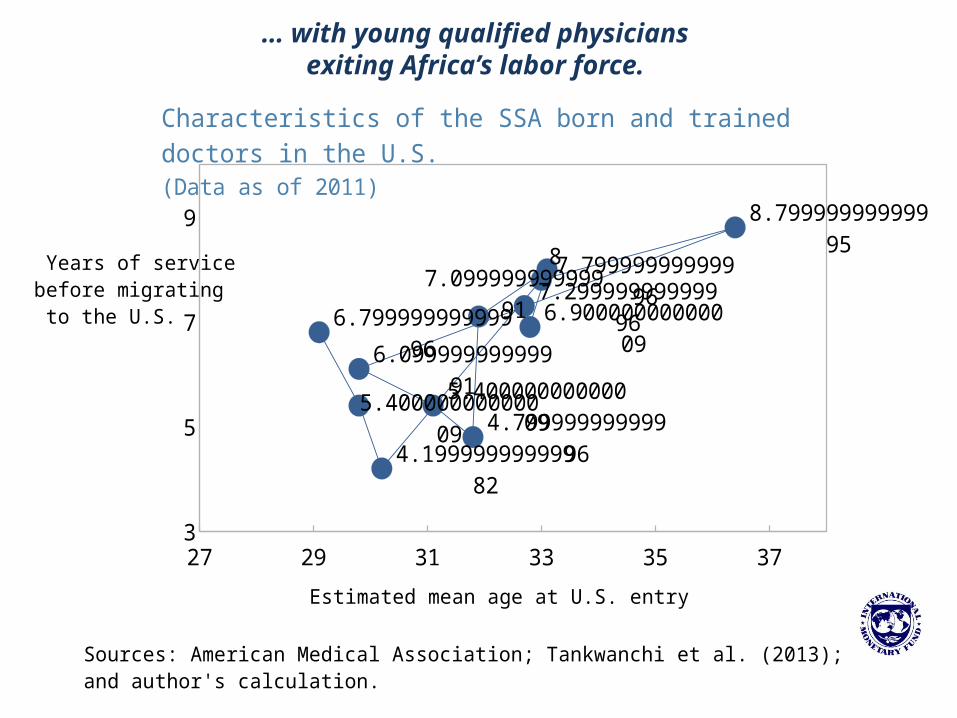
… with young qualified physicians exiting Africa’s labor force.
27 29 31 33 35 373
5
7
9
6.79999999999996
5.40000000000009
4.19999999999982
7.79999999999996
8.79999999999996
6.099999999999915.400000000000
094.79999999999996
7.09999999999991
8
6.90000000000009
7.29999999999996
Characteristics of the SSA born and trained doctors in the U.S.(Data as of 2011)
Sources: American Medical Association; Tankwanchi et al. (2013); and author's calculation.
Estimated mean age at U.S. entry
Years of service before migrating to the U.S.

Is the Sub-Saharan region benefiting from remittances?

Remittance inflows to Sub-Saharan Africa have fully recovered their pre-crisis levels …
2007 2008 2009 2010 2011
100113.0
105.3 110.4118.6
100
113.1123.8 125.1
133.0
Remittance-to-pre-crisis levelAid-to-pre-crisis level
Africa: Remittances and Aid in comparison to pre-crisis levels(2007=100)
Sources: African Development Indicators; author's computation

… and represent an effective insurance mechanism
against disasters events …
-5 -4 -3 -2 -1 0 +1 +2 +3 +4Time
0
0.3
0.600000000000001
0.900000000000001
Remittances inflows around natural disaster events in Sub-Saharan Africa
(median values in percent of GDP; average over 1980-2010)
Sources: EM-DAT CRED; and author's calculations.

… and during political conflicts.
-4 -3 -2 -1 0 +1 +2 +3 +4Time
0
0.5
1
1.5
2
2.5
3
3.5Battle deaths > 100 casualties
Remittances inflows around major conflict events into Africa(median values in percent of GDP; average over 1980-2011)
Sources: African Development Indicators; and author's calcula-tions.
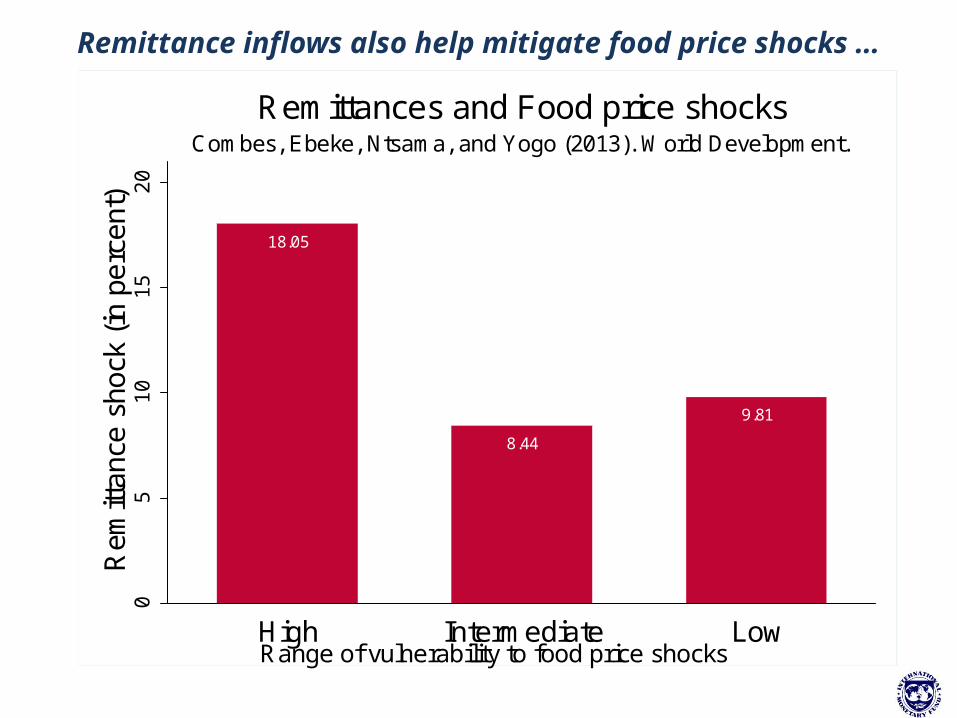
Remittance inflows also help mitigate food price shocks …
18.05
8.44
9.81
05
10
15
20
Rem
ittan
ce s
hock
(in
pe
rcen
t)
High Intermediate Low
Combes, Ebeke, Ntsama, and Yogo (2013). World Development.
Remittances and Food price shocks
Range of vulnerability to food price shocks
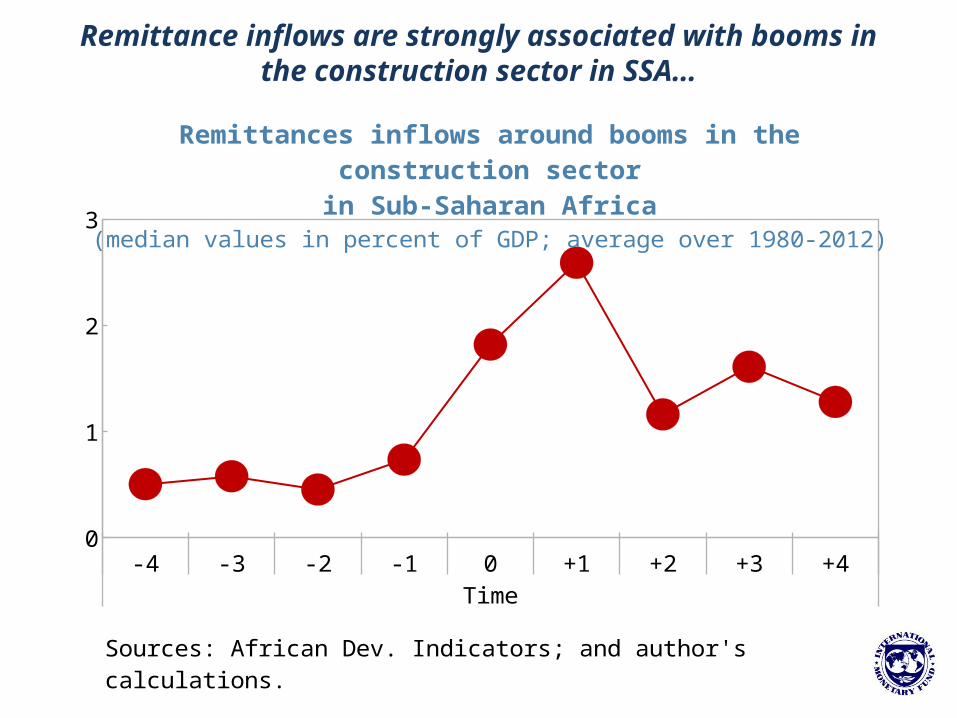
Remittance inflows are strongly associated with booms in the construction sector in SSA…
-4 -3 -2 -1 0 +1 +2 +3 +4Time
0
1
2
3
Remittances inflows around booms in the construc-tion sector
in Sub-Saharan Africa(median values in percent of GDP; average over 1980-2012)
Sources: African Dev. Indicators; and author's calculations.
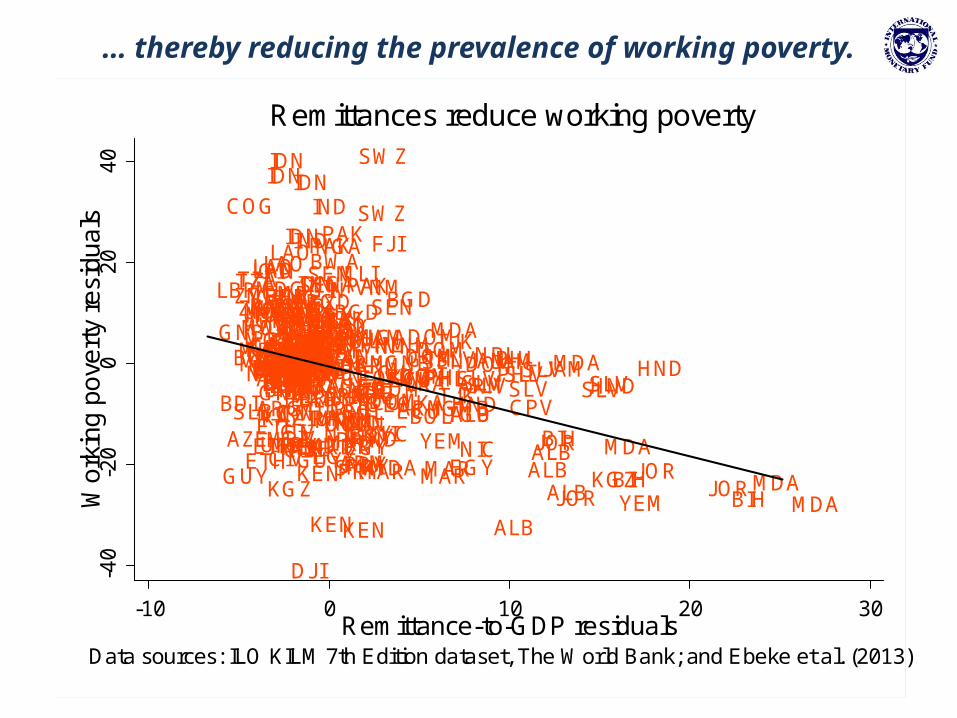
… thereby reducing the prevalence of working poverty.
ALB
ALBALBALB
ALBARGARGARGARGARGARGARG
ARM
ARMARM
ARMARMARM
ARM
AZE AZE
AZEBDI
BENBFABFA
BFA
BGD
BGDBGD
BGD
BIHBIH
BIH
BLR
BLRBLZBLZ
BOLBOL
BOL BOLBRABRABRABRABRABRABRABRABRABRABRABRABRABRABRA
BWA
CAFCHLCHLCHLCHL
CIVCIVCIVCIVCIV
CMR
CMR
COG
COLCOLCOLCOLCOLCOLCOL
CPV
CRICRICRICRICRICRICRICRICRICRI
DJI
DOMDOMDOM
DOM DOMDOMDOMDOM
ECUECUECUECU
ECUECU
EGYEGYEGYEGYETH
ETH
ETH
FJI
GAB
GEOGEOGEO
GEOGHA
GHAGHA
GINGIN
GIN
GMB
GNB
GNBGTMGTM GTM
GUYGUY
HND
HND
HNDHND
HNDHND
HND
IDNIDNIDN
IDN
IDN
IND
IND
IRNIRN
IRN
JAMJAMJAM JAM
JOR JORJOR
JORKAZ
KAZKAZKAZ
KENKEN
KENKEN
KGZ
KGZKGZ
KGZ
KGZ
KHMKHM
LAOLAOLAOLAO
LBR
LKALKALKA
LKA
MAR MARMARMDA
MDA
MDA
MDA
MDAMDA
MDGMDGMDGMDGMDG
MDV
MDV
MEXMEXMEXMEXMEXMEXMEXMEX
MEXMEX
MKD
MKD
MKDMKD
MKD
MLI
MLIMLI
MNG
MOZ
MOZMOZMRT
MRT
MWIMYS
MYSMYSMYSMYS
NAM
NERNERNER
NGA
NGA
NGA
NICNIC NIC
NIC
NPL
NPL
PAKPAK
PAK
PAKPAK
PANPANPAN
PANPANPANPAN
PAN
PANPAN
PERPERPERPERPERPER
PHLPHL
PHLPHL PHLPHL
PNG
PRY
PRY
PRYPRY
PRYPRYPRY
RWARWA
SENSENSEN
SEN
SLB
SLE SLVSLVSLVSLV
SLVSLVSLV
SLVSLVSRB
SUR
SWZ
SWZ
SYR
TGO
THATHATHATHATHATHATHA
TJK
TJKTUNTUNTUR
TURTURTUR
TZATZA
UGAUGAUGA
UGA
UKRUKR
URYURY
VENVENVENVEN
VEN
VNM
VNMVNM
VNM
YEM
YEM
ZAFZAF
ZAFZAF
ZMBZMB
-40
-20
02
04
0W
ork
ing
po
vert
y re
sid
ua
ls
-10 0 10 20 30Remittance-to-GDP residuals
Data sources: ILO KILM 7th Edition dataset, The World Bank; and Ebeke et al. (2013).
Remittances reduce working poverty
Now, let’s discuss some new empirical evidences:
Political and Institutional Effects of Migration
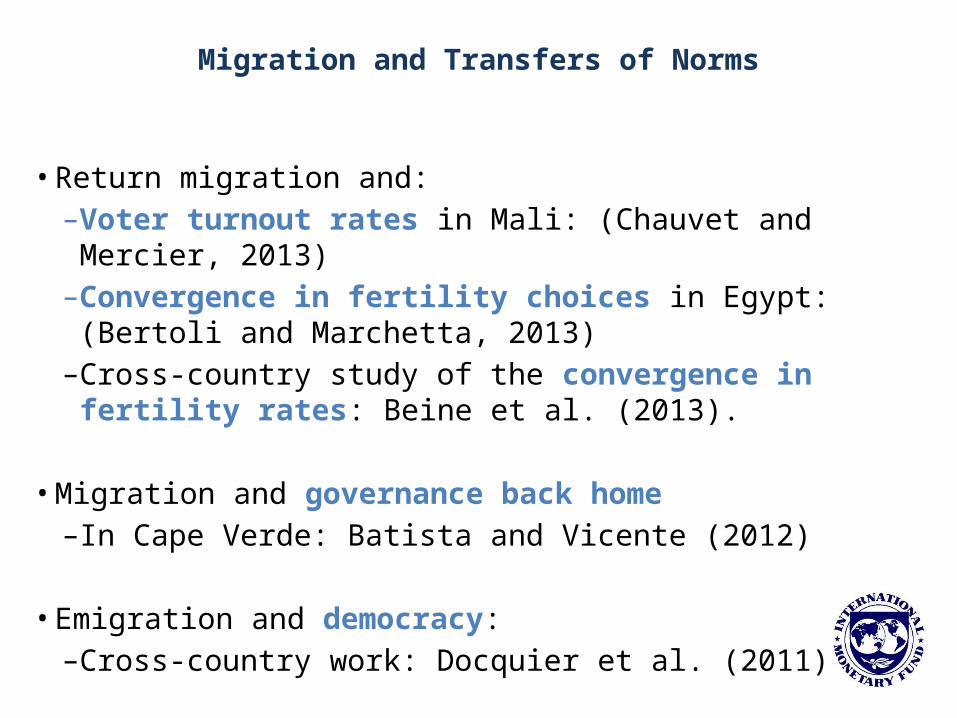
Migration and Transfers of Norms
• Return migration and: – Voter turnout rates in Mali: (Chauvet and Mercier, 2013)– Convergence in fertility choices in Egypt: (Bertoli and
Marchetta, 2013)– Cross-country study of the convergence in fertility rates:
Beine et al. (2013).
• Migration and governance back home– In Cape Verde: Batista and Vicente (2012)
• Emigration and democracy:– Cross-country work: Docquier et al. (2011)
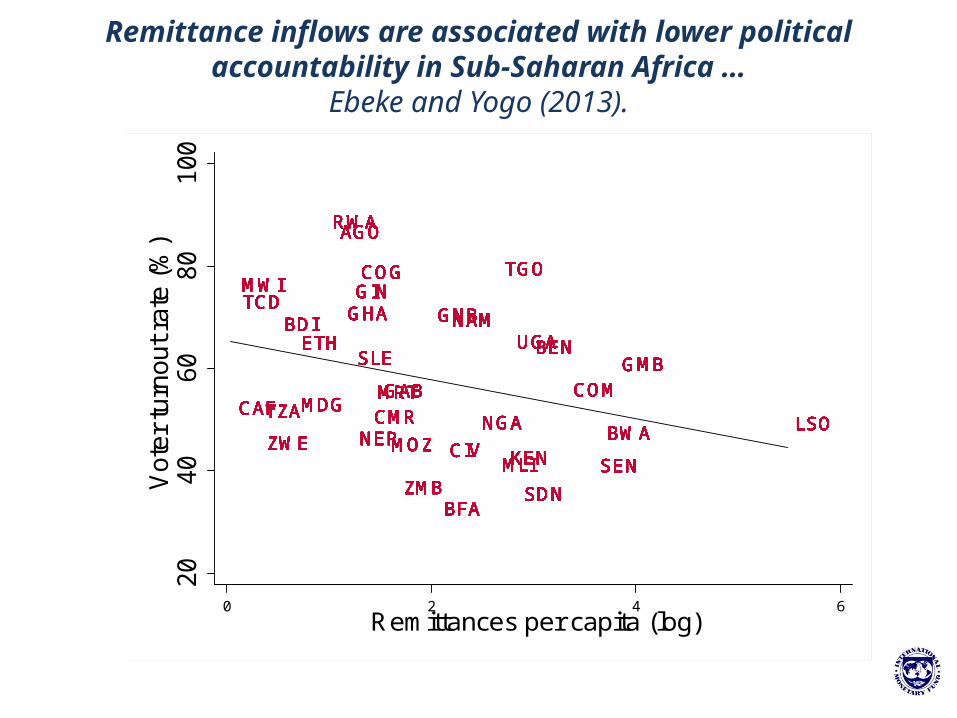
Remittance inflows are associated with lower political accountability in Sub-Saharan Africa …
Ebeke and Yogo (2013).
AGOAGOAGOAGOAGOAGOAGOAGOAGOAGOAGOAGOAGOAGOAGOAGOAGOAGOAGOAGOAGOAGO
BDIBDIBDIBDIBDIBDIBDIBDIBDIBDIBDIBDIBDIBDIBDIBDIBDIBDIBDIBDIBDIBDIBENBENBENBENBENBENBENBENBENBENBENBENBENBENBENBENBENBENBENBENBENBEN
BFABFABFABFABFABFABFABFABFABFABFABFABFABFABFABFABFABFABFABFABFABFA
BWABWABWABWABWABWABWABWABWABWABWABWABWABWABWABWABWABWABWABWABWABWACAFCAFCAFCAFCAFCAFCAFCAFCAFCAFCAFCAFCAFCAFCAFCAFCAFCAFCAFCAFCAFCAF
CIVCIVCIVCIVCIVCIVCIVCIVCIVCIVCIVCIVCIVCIVCIVCIVCIVCIVCIVCIVCIVCIV
CMRCMRCMRCMRCMRCMRCMRCMRCMRCMRCMRCMRCMRCMRCMRCMRCMRCMRCMRCMRCMRCMR
COGCOGCOGCOGCOGCOGCOGCOGCOGCOGCOGCOGCOGCOGCOGCOGCOGCOGCOGCOGCOGCOG
COMCOMCOMCOMCOMCOMCOMCOMCOMCOMCOMCOMCOMCOMCOMCOMCOMCOMCOMCOMCOMCOM
ETHETHETHETHETHETHETHETHETHETHETHETHETHETHETHETHETHETHETHETHETHETH
GABGABGABGABGABGABGABGABGABGABGABGABGABGABGABGABGABGABGABGABGABGAB
GHAGHAGHAGHAGHAGHAGHAGHAGHAGHAGHAGHAGHAGHAGHAGHAGHAGHAGHAGHAGHAGHAGINGINGINGINGINGINGINGINGINGINGINGINGINGINGINGINGINGINGINGINGINGIN
GMBGMBGMBGMBGMBGMBGMBGMBGMBGMBGMBGMBGMBGMBGMBGMBGMBGMBGMBGMBGMBGMB
GNBGNBGNBGNBGNBGNBGNBGNBGNBGNBGNBGNBGNBGNBGNBGNBGNBGNBGNBGNBGNBGNB
KENKENKENKENKENKENKENKENKENKENKENKENKENKENKENKENKENKENKENKENKENKEN
LSOLSOLSOLSOLSOLSOLSOLSOLSOLSOLSOLSOLSOLSOLSOLSOLSOLSOLSOLSOLSOLSOMDGMDGMDGMDGMDGMDGMDGMDGMDGMDGMDGMDGMDGMDGMDGMDGMDGMDGMDGMDGMDGMDG
MLIMLIMLIMLIMLIMLIMLIMLIMLIMLIMLIMLIMLIMLIMLIMLIMLIMLIMLIMLIMLIMLIMOZMOZMOZMOZMOZMOZMOZMOZMOZMOZMOZMOZMOZMOZMOZMOZMOZMOZMOZMOZMOZMOZ
MRTMRTMRTMRTMRTMRTMRTMRTMRTMRTMRTMRTMRTMRTMRTMRTMRTMRTMRTMRTMRTMRT
MWIMWIMWIMWIMWIMWIMWIMWIMWIMWIMWIMWIMWIMWIMWIMWIMWIMWIMWIMWIMWIMWI
NAMNAMNAMNAMNAMNAMNAMNAMNAMNAMNAMNAMNAMNAMNAMNAMNAMNAMNAMNAMNAMNAM
NERNERNERNERNERNERNERNERNERNERNERNERNERNERNERNERNERNERNERNERNERNERNGANGANGANGANGANGANGANGANGANGANGANGANGANGANGANGANGANGANGANGANGANGA
RWARWARWARWARWARWARWARWARWARWARWARWARWARWARWARWARWARWARWARWARWARWA
SDNSDNSDNSDNSDNSDNSDNSDNSDNSDNSDNSDNSDNSDNSDNSDNSDNSDNSDNSDNSDNSDN
SENSENSENSENSENSENSENSENSENSENSENSENSENSENSENSENSENSENSENSENSENSEN
SLESLESLESLESLESLESLESLESLESLESLESLESLESLESLESLESLESLESLESLESLESLE
TCDTCDTCDTCDTCDTCDTCDTCDTCDTCDTCDTCDTCDTCDTCDTCDTCDTCDTCDTCDTCDTCD
TGOTGOTGOTGOTGOTGOTGOTGOTGOTGOTGOTGOTGOTGOTGOTGOTGOTGOTGOTGOTGOTGO
TZATZATZATZATZATZATZATZATZATZATZATZATZATZATZATZATZATZATZATZATZATZA
UGAUGAUGAUGAUGAUGAUGAUGAUGAUGAUGAUGAUGAUGAUGAUGAUGAUGAUGAUGAUGAUGA
ZMBZMBZMBZMBZMBZMBZMBZMBZMBZMBZMBZMBZMBZMBZMBZMBZMBZMBZMBZMBZMBZMB
ZWEZWEZWEZWEZWEZWEZWEZWEZWEZWEZWEZWEZWEZWEZWEZWEZWEZWEZWEZWEZWEZWE
20
40
60
80
100
Vote
r tu
rnout ra
te (
%)
0 2 4 6
Remittances per capita (log)

… therefore reducing the political business cycle.Combes, Ebeke and Maurel (2013).
0.75
0.26
0.17 0.19
0.2
.4.6
.8E
lect
ora
lly-m
otiv
ate
d fis
cal i
mp
uls
e (
in p
erc
en
t o
f G
DP
)
[0, Q1] [Q1, Q2] [Q2, Q3] [Q3, max]Remittance-to-GDP range

How best to maximize the benefits of migration in Sub-Saharan Africa?

More dual-citizenship laws?
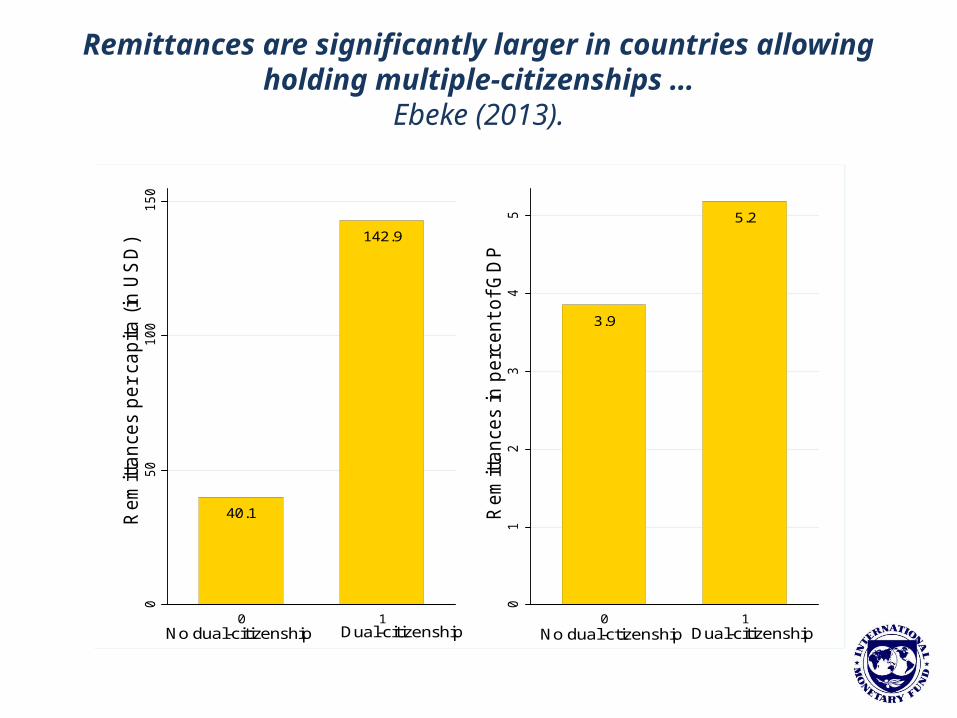
Remittances are significantly larger in countries allowing holding multiple-citizenships …
Ebeke (2013).
40.1
142.9
050
100
150
Rem
itta
nces p
er
ca
pita
(in
US
D)
0 1No dual-citizenship Dual-citizenship
3.9
5.2
01
23
45
Rem
itta
nces in
perc
en
t of G
DP
0 1No dual-ctizenship Dual-citizenship
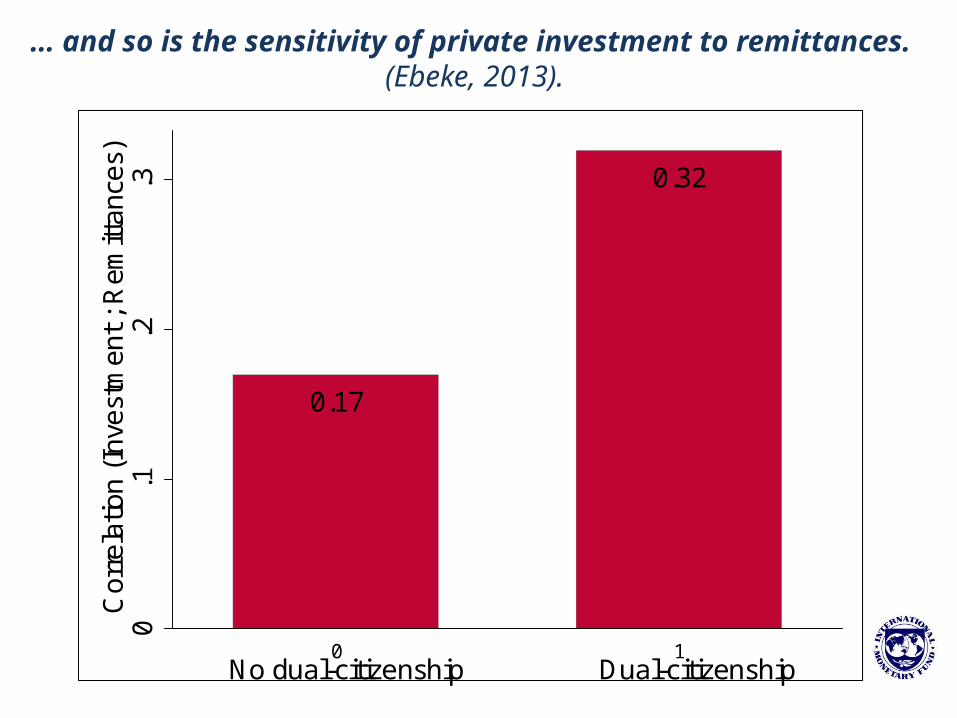
… and so is the sensitivity of private investment to remittances. (Ebeke, 2013).
0.17
0.320
.1.2
.3C
orre
latio
n (I
nves
tmen
t ; R
emitt
ance
s)
0 1No dual-citizenship Dual-citizenship
Barriers to people mobility exist, even in the sending countries! Look at passport costs …
0
10
20
30
40
50
60
70
60.15
50.91
41.45
31.126.3
19.8217.7513.4113.3612.711.49.958.98.78.598.536.676.035.194.854.194.14.023.733.63.583.43.012.92.72.62.52.432.292.232.11.971.911.91.811.711.541.51.491.431.361.291.211.171.11.11.11.031
0.760000000000001
0.700000000000001
0.670000000000001
0.6500000000000010.510.50.50.470.430.410.40.360.320.310.290.270.160.120.1
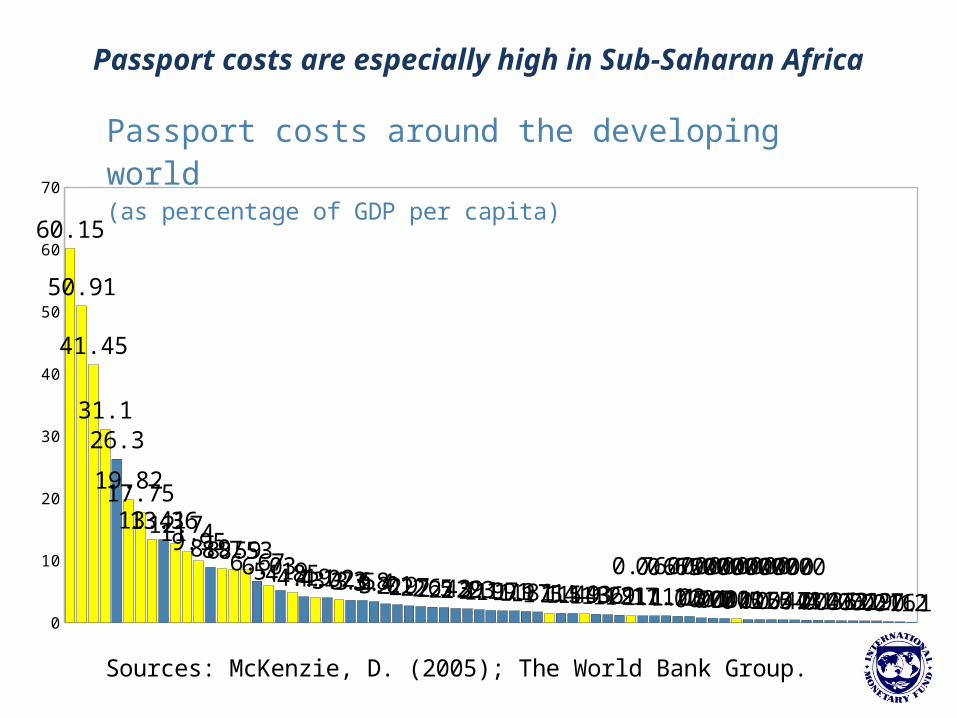
Passport costs around the developing world(as percentage of GDP per capita)
Sources: McKenzie, D. (2005); The World Bank Group.
Passport costs are especially high in Sub-Saharan Africa
How about remittance transaction costs?
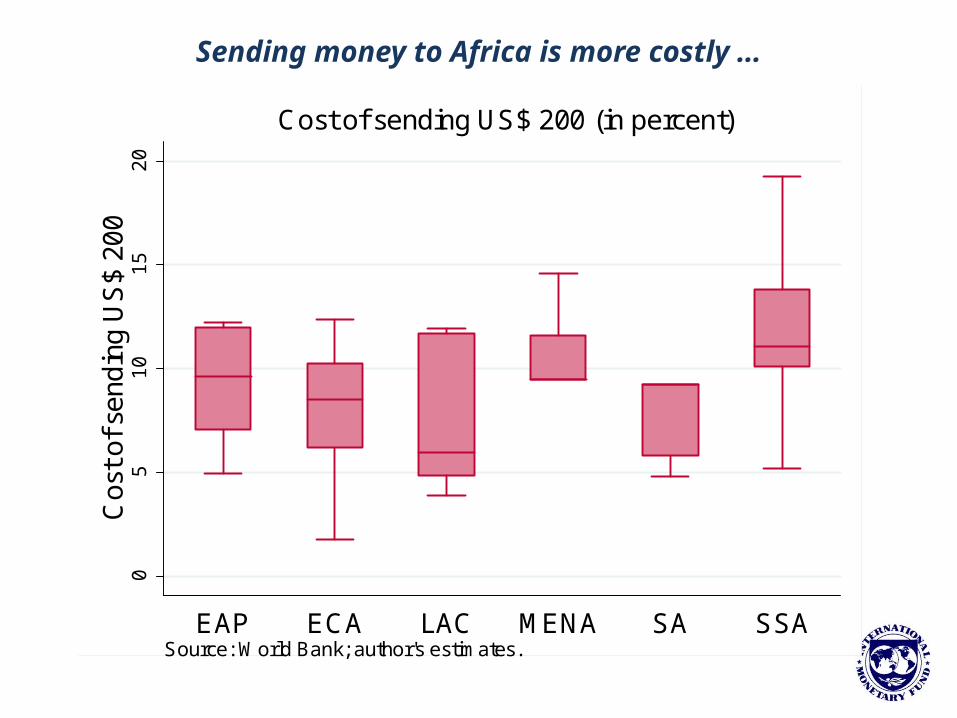
Sending money to Africa is more costly …
05
10
15
20
Cos
t of s
end
ing
US
$ 20
0
EAP ECA LAC MENA SA SSA
Cost of sending US$ 200 (in percent)
Source: World Bank; author's estimates.
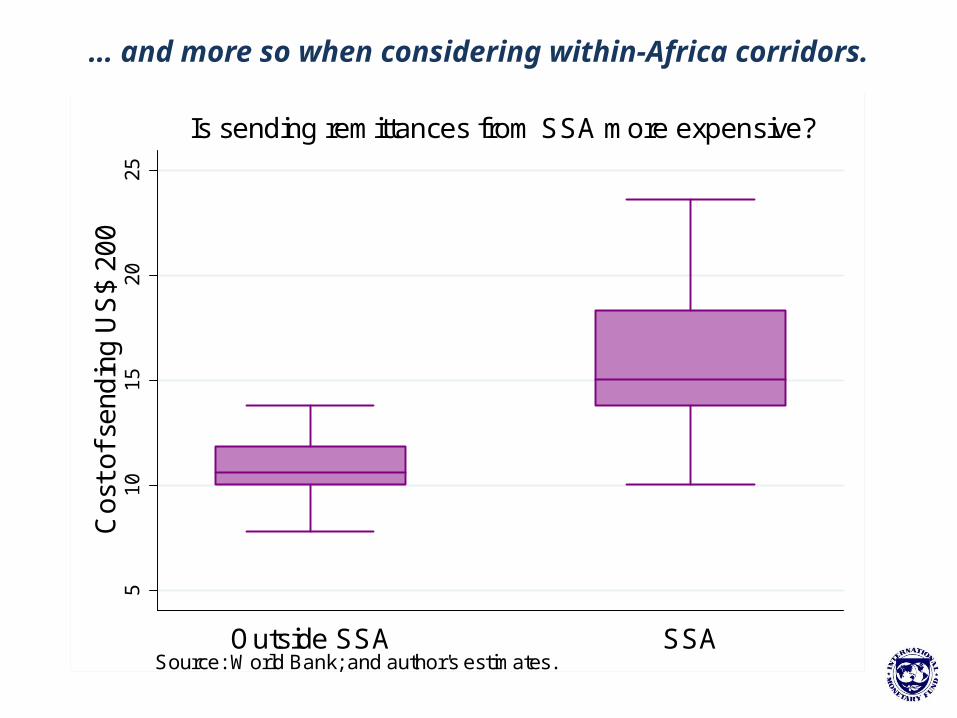
… and more so when considering within-Africa corridors.
51
01
52
02
5C
ost o
f sen
din
g U
S$
200
Outside SSA SSA
Is sending remittances from SSA more expensive?
Source: World Bank; and author's estimates.

Sending money to Africa also takes much more time to arrive…
02
46
Spe
ed o
f tra
nsfe
rs
EAP ECA LAC MENA SA SSA
Remittances: Median speed of transfers
Source: World Bank; and authors' estimates.
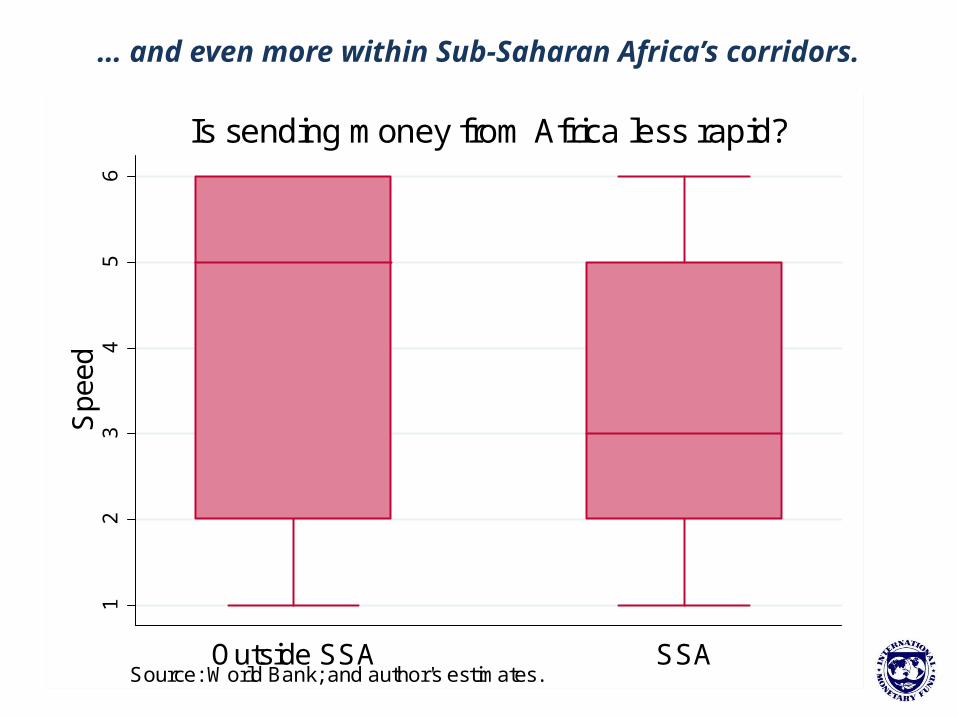
… and even more within Sub-Saharan Africa’s corridors.
12
34
56
Spe
ed
Outside SSA SSA
Is sending money from Africa less rapid?
Source: World Bank; and author's estimates.

Costs are too high across operators, …
51
01
52
0C
ost o
f sen
din
g U
S$
200
Bank MTO Non-Bank FI Post office
(in percent of amount transfered)Cost of sending US$ 200 to Sub-Saharan Africa (SSA)
Source: World Bank; and author's estimates.
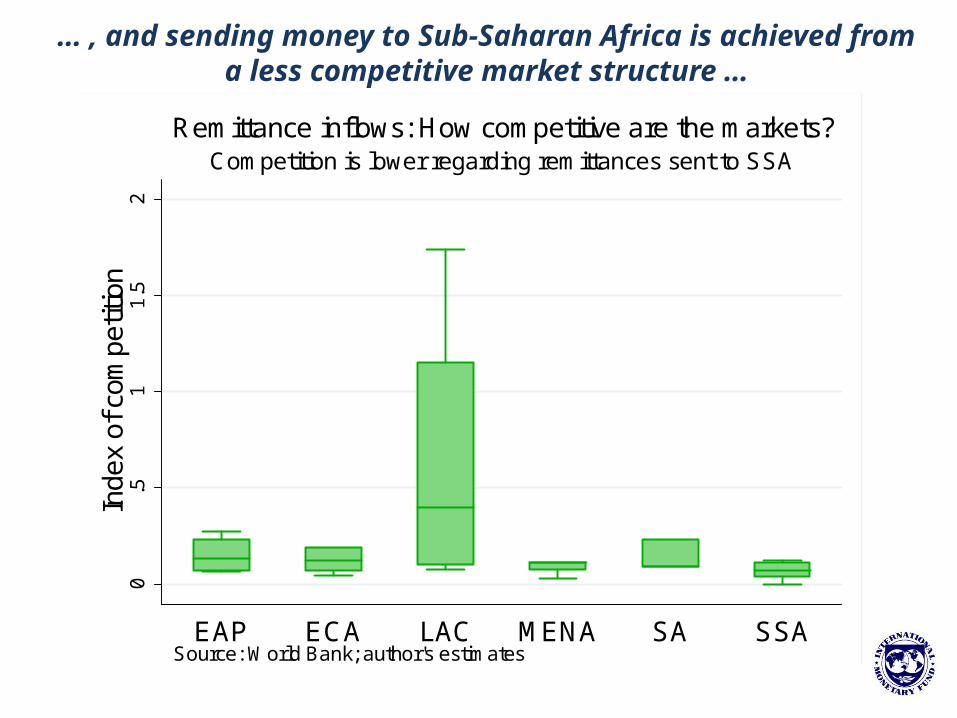
0.5
11
.52
Inde
x of
com
petit
ion
EAP ECA LAC MENA SA SSA
Competition is lower regarding remittances sent to SSARemittance inflows: How competitive are the markets?
Source: World Bank; author's estimates
… , and sending money to Sub-Saharan Africa is achieved from a less competitive market structure …
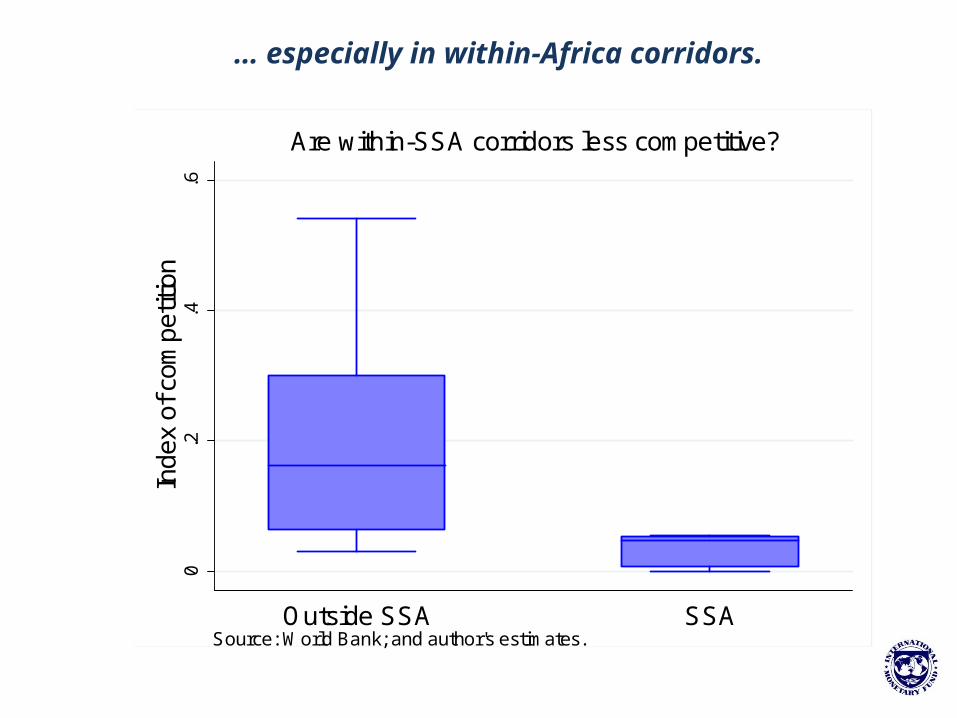
0.2
.4.6
Inde
x of
com
petit
ion
Outside SSA SSA
Are within-SSA corridors less competitive?
Source: World Bank; and author's estimates.
… especially in within-Africa corridors.
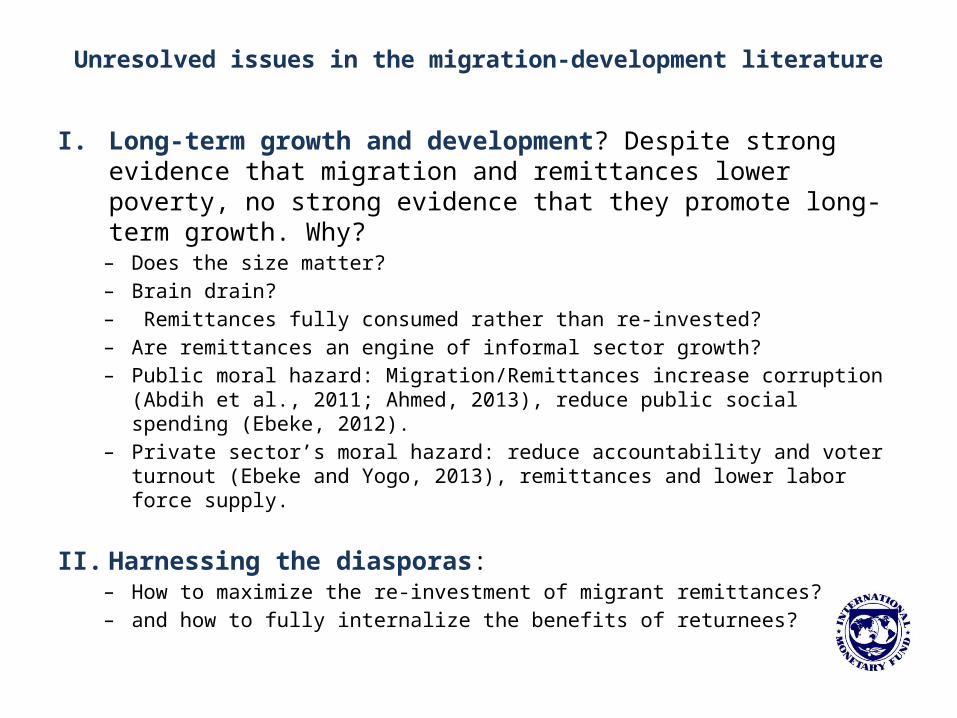
Unresolved issues in the migration-development literature
I. Long-term growth and development? Despite strong evidence that migration and remittances lower poverty, no strong evidence that they promote long-term growth. Why?
– Does the size matter?– Brain drain?– Remittances fully consumed rather than re-invested? – Are remittances an engine of informal sector growth?– Public moral hazard: Migration/Remittances increase corruption (Abdih et al., 2011;
Ahmed, 2013), reduce public social spending (Ebeke, 2012). – Private sector’s moral hazard: reduce accountability and voter turnout (Ebeke and Yogo,
2013), remittances and lower labor force supply.
II. Harnessing the diasporas: – How to maximize the re-investment of migrant remittances? – and how to fully internalize the benefits of returnees?

Thank you for your attention.
Related Documents