“MIERUKA (Visualization)” of IT Projects Summary Author Editor Software Engineering Center Information-Technology Promotion Agency, Japan (IPA)

Welcome message from author
This document is posted to help you gain knowledge. Please leave a comment to let me know what you think about it! Share it to your friends and learn new things together.
Transcript

“MIERUKA (Visualization)” of IT Projects
Summary
AuthorEditor
Software Engineering CenterInformation-Technology Promotion Agency, Japan (IPA)

1
1.1
Actual IT Project Conditions
Information systems are used throughout our society. Not only are they becoming more widely used, but they are also becoming more advanced, more complex, and more versatile. They have become an essential foundation that serves as a lifeline for corporate activities and daily life. At the same time, there is an increasing need for information system reliability and safety.
Meanwhile, the situations at the forefront of IT projects, where these information systems are designed, are becoming increasingly harsh. High quality systems have to be developed in short periods of time, at low cost, in response to the rapidly changing business environment. There is a need for new knowledge and skill acquisition and implementation in system design in order to handle dramatic technological changes.
How can an IT project be handled successfully amidst these unforgiving conditions? The most important point to remember is that it is people that are responsible for actually carrying out IT projects.
Some studies show that 80% of IT project success can be attributable to people. Matters including communication skills involved in inter-member communications, the elimination of misunderstandings caused by differences in common knowledge and culture, and maintaining member motivation are important elements of project management.
For example, during the system development upstream requirements definition process, if customer demands are not clearly understood, and customers and vendors cannot agree on defined requirements, the resulting system that is produced may seem to comply but will actually not meet the requirements.
Not infrequently, the project manager realizes the problem during the downstream qualification test process. The system, nearing completion, is presented to the customer in preparation for actual operation, before it is first pointed out that the system is unusable. The IT project must then either go
1Chapter
MIERUKA (Visualization) Objectives

2
MIERUKA (Visualization) Objectives1
into a rush work, if the customer cannot be told that the project will be delayed, or the system must be presented in its imperfect state. This is the worst possible outcome, as it merely serves to exhaust members and dissatisfy customers.
In order to prevent this, IT project MIERUKA (visualization) is critical.The MIERUKA described in this book extends from information system development requirements
definitions to operation test, as shown in Figure 1-1.System development in this text is separated into three categories: the “upstream process,”
“midstream process,” and “downstream process.” Upstream process refers to grand design processes, including management, including “requirements definition” and “system design.” Midstream process refers to core development processes involving engineers, such as “software design,” “programming,” and “software unit test.” Downstream process refers to final processes, including program “integration test” and “qualification test,” leading to system development and operation. The software test, system test, and operation test shown in Figure 1-1 are synonymous with unit test, integration test, and qualification test.
Figure 1-2 shows the terms involved in these processes, and which SLCP (Software Life Cycle Process) “Common Frame 2007” development processes they correspond to.
One of the issues involved in developing information systems is how to visualize the invisible field of software, a characteristic that sets it apart from the processes involved in manufacturing physical objects. This book proposes the following, for upstream, midstream, and downstream processes, in response to the issues, characteristic of software, of being unable to see requirements, development processes, progress, and the validity of software development results.
Figure 1-1: Project MIERUKA (visualization) scope
Req
uire
men
ts D
efin
ition
Sys
tem
Des
ign
Sof
twar
e D
esig
n
Pro
gram
min
g
Sof
twar
e Te
st
Sys
tem
Tes
t
Ope
ratio
n Te
st
Midstream ProcessUpstream Process
Downstream Process

3
“MIERUKA (Visualization)” of IT ProjectsSummary
(1) Upstream Process ProposalDuring upstream process requirements definition and system design, use a MIERUKA engineering
approach to enable members related to the project to visualize “crisis symptoms” that arise during the implementation of the system development project.
(2) Midstream Process ProposalFor midstream process software design, programming, and software test, design and apply a
system for effective and efficient MIERUKA of upstream process completion levels, and the quality and progress of distributed development, including overseas subcontracting, in order to eliminate the introduction of defects.
Figure 1-2: Common Frame 2007 correspondence to development processes
Requirements Definition
System Design
Software Design
Programming
Unit Test
Integration Test
Qualification Test
Process Start Preparation
System Requirements Definition
Systems Architecture Design
Software Requirements Definition
Software Architecture Design
Software Detailed Design
Software Integration
Software Quality Assurance Test
System Integration
System Quality Assurance Test
Software Installation
Software Acceptance Support
Software Coding And Testing
Process Notation Used in This Text
Common Frame 2007 Development Processes
4
MIERUKA (Visualization) Objectives1
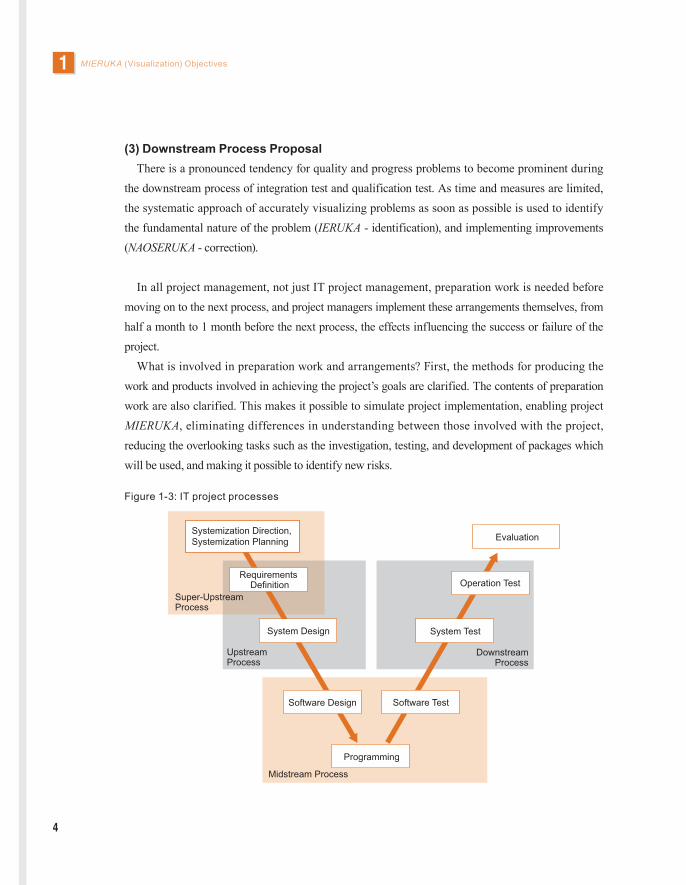
(3) Downstream Process ProposalThere is a pronounced tendency for quality and progress problems to become prominent during
the downstream process of integration test and qualification test. As time and measures are limited, the systematic approach of accurately visualizing problems as soon as possible is used to identify the fundamental nature of the problem (IERUKA - identification), and implementing improvements (NAOSERUKA - correction).
In all project management, not just IT project management, preparation work is needed before moving on to the next process, and project managers implement these arrangements themselves, from half a month to 1 month before the next process, the effects influencing the success or failure of the project.
What is involved in preparation work and arrangements? First, the methods for producing the work and products involved in achieving the project’s goals are clarified. The contents of preparation work are also clarified. This makes it possible to simulate project implementation, enabling project MIERUKA, eliminating differences in understanding between those involved with the project, reducing the overlooking tasks such as the investigation, testing, and development of packages which will be used, and making it possible to identify new risks.
Figure 1-3: IT project processes
Evaluation
Software Design
System Design
Software Test
System Test
Operation Test
Programming
Upstream Process
Midstream Process
Downstream Process
Requirements Definition
Systemization Direction, Systemization Planning
Super-Upstream Process
5
“MIERUKA (Visualization)” of IT ProjectsSummary
1.2
Upstream, Midstream, and Downstream ProcessMIERUKA (Visualization) Objectives
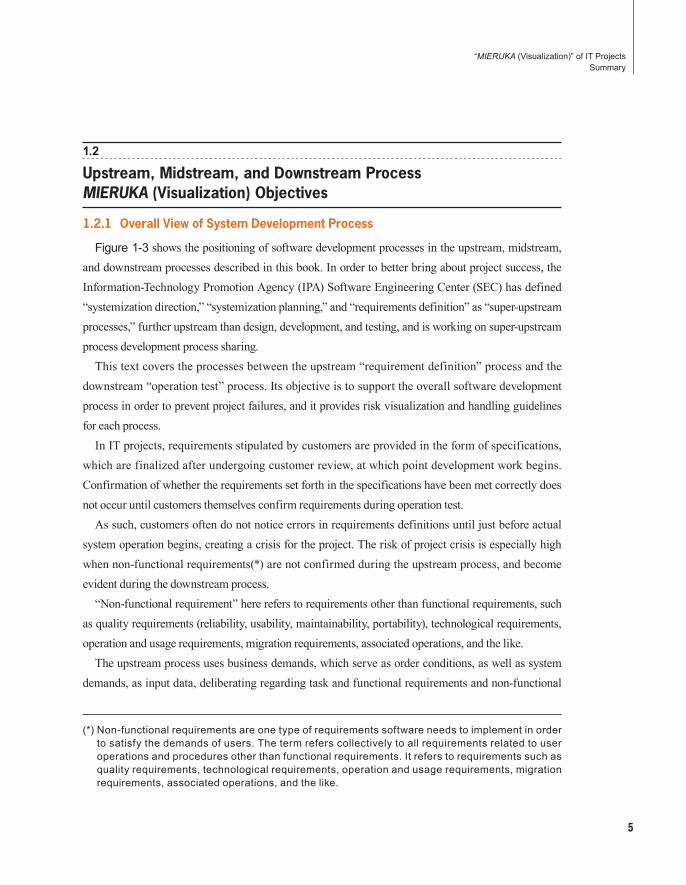
1.2.1 Overall View of System Development Process
Figure 1-3 shows the positioning of software development processes in the upstream, midstream, and downstream processes described in this book. In order to better bring about project success, the Information-Technology Promotion Agency (IPA) Software Engineering Center (SEC) has defined “systemization direction,” “systemization planning,” and “requirements definition” as “super-upstream processes,” further upstream than design, development, and testing, and is working on super-upstream process development process sharing.
This text covers the processes between the upstream “requirement definition” process and the downstream “operation test” process. Its objective is to support the overall software development process in order to prevent project failures, and it provides risk visualization and handling guidelines for each process.
In IT projects, requirements stipulated by customers are provided in the form of specifications, which are finalized after undergoing customer review, at which point development work begins. Confirmation of whether the requirements set forth in the specifications have been met correctly does not occur until customers themselves confirm requirements during operation test.
As such, customers often do not notice errors in requirements definitions until just before actual system operation begins, creating a crisis for the project. The risk of project crisis is especially high when non-functional requirements(*) are not confirmed during the upstream process, and become evident during the downstream process.
“Non-functional requirement” here refers to requirements other than functional requirements, such as quality requirements (reliability, usability, maintainability, portability), technological requirements, operation and usage requirements, migration requirements, associated operations, and the like.
The upstream process uses business demands, which serve as order conditions, as well as system demands, as input data, deliberating regarding task and functional requirements and non-functional
(*) Non-functional requirements are one type of requirements software needs to implement in order to satisfy the demands of users. The term refers collectively to all requirements related to user operations and procedures other than functional requirements. It refers to requirements such as quality requirements, technological requirements, operation and usage requirements, migration requirements, associated operations, and the like.

6
MIERUKA (Visualization) Objectives1
requirements, and creating resulting specifications. Task and functional requirements are subject to excesses, deficiencies, and changes during project implementation. However, this can often be managed during later processes by communicating with the customer. On the other hand, if problems regarding non-functional requirements become evident during the downstream process, since they relate to critical aspects of the system, such as the system type or its architecture, considering that recovery during the remaining period is difficult, it will frequently lead projects into crises.
1.2.2 MIERUKA Objectives
Let’s look at the objectives of MIERUKA in upstream, midstream, and downstream processes.The goal of MIERUKA in the upstream process is to determine, at an early stage, where problems
will occur. It also includes evaluating and judging how long uncertainties may remain uncertainties, in order to cope with handling uncertainties.
The IT project upstream process includes determining, based on conditions such as initially supplied budgets, development scopes, structures, and time periods, whether to commence a project or to cancel it, and, if the decision is made to commence with the project, to advance the project. Expected and unexpected problems may occur during IT projects. When this happens, project managers must make accurate judgments, and respond, flexibly modifying the schedule as needed.
In Figure 1-4, this is compared to an airplane flight. For example, if the pilot notices dangerous thunderclouds within the flight path while a plane is flying, he must change his predetermined flight path, and recalculate things such as the amount of fuel he has and his altitude.
Figure 1-4: Destination setting and flight plan of a flight (an example of objectives of upstream process MIERUKA)
Navigation Time Plan Flight Altitude PlanConfirmation of Conditions at Destination AirportClarification of Turn-Back ConditionsAmount of Cargo
Weather Information
Destination
Amount of FuelFlying Conditions of Other Aircraft

7
“MIERUKA (Visualization)” of IT ProjectsSummary
Figure 1-5: Roles of captains during voyages and project management (an example of objectives of midstream process MIERUKA (Visualization))
1 show the voyage plan.
2. shows midstream process support.
3.This image is intended to provide an overview, and does not reflect all workflows.
Note)
Other ShipsRoute Indications
Way Port B
Social Conditions War, Riots, Dockyard Strikes, etc.
Wireless Contact / Reporting Ship Log
Weather Information
Planned Route
Navigation Route
Plan Change
Ship Company User (Shipper)
GPS
Way Port A
Naval Current
Lighthouse
Destination Port [Downstream Process]
Risk
Time / Quality
ProcurementThe captain manages QCD in order to satisfy customer requirements, and uses regular and ad hoc reports to change way ports or other plans as needed to deliver the cargo safely and surely to the destination.
Marine Accident InquiryIndividual LegislationInternational LawQuarantine Law...
LookoutPilotNaval Chart / Naval Route ChartRadar / LORANGPS / SonarWireless
Basic Operation / Issue Management
Crew Health Management /
Teamwork
(Clarification of Responsibility
Scope)
ScopeCaptain’s Authority
Bill of Loading
Human Resources
Customer Requirements
Request (Charter Contract)
Sailing [Midstream Process]
Departure Port [Upstream Process]
RiskLifesavingMarine AccidentGeneral AverageSignal FlagsLight CharacteristicsWhistle
CostVoyage Profitability (Per Voyage) Ship Costs (Depreciation, Fixed Costs, etc.) Voyage Costs(Fuel, Piloting Costs, etc.) General Management Costs (On-Shore Costs, etc.)
8
MIERUKA (Visualization) Objectives1
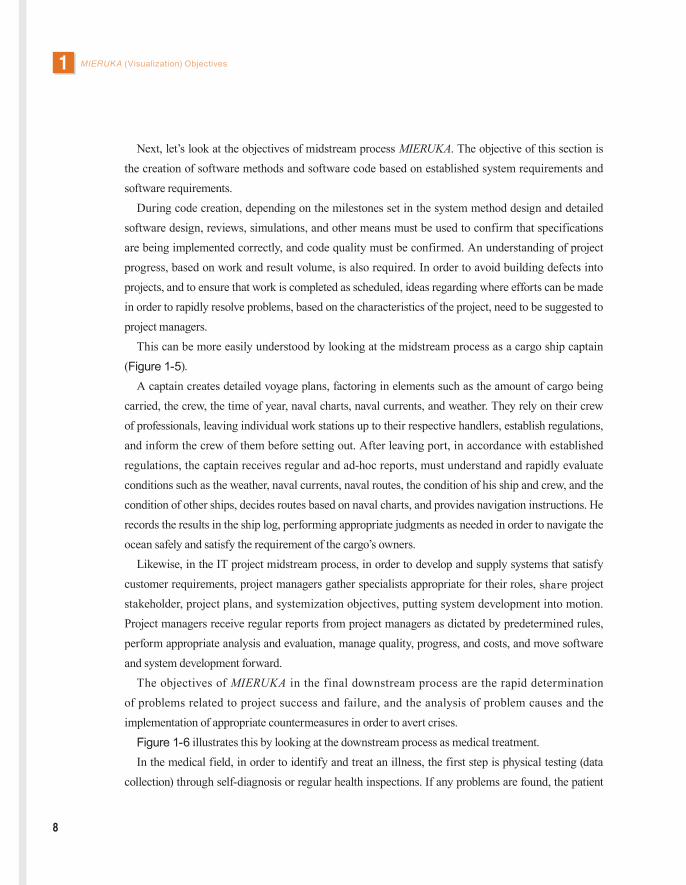
Next, let’s look at the objectives of midstream process MIERUKA. The objective of this section is the creation of software methods and software code based on established system requirements and software requirements.
During code creation, depending on the milestones set in the system method design and detailed software design, reviews, simulations, and other means must be used to confirm that specifications are being implemented correctly, and code quality must be confirmed. An understanding of project progress, based on work and result volume, is also required. In order to avoid building defects into projects, and to ensure that work is completed as scheduled, ideas regarding where efforts can be made in order to rapidly resolve problems, based on the characteristics of the project, need to be suggested to project managers.
This can be more easily understood by looking at the midstream process as a cargo ship captain (Figure 1-5).
A captain creates detailed voyage plans, factoring in elements such as the amount of cargo being carried, the crew, the time of year, naval charts, naval currents, and weather. They rely on their crew of professionals, leaving individual work stations up to their respective handlers, establish regulations, and inform the crew of them before setting out. After leaving port, in accordance with established regulations, the captain receives regular and ad-hoc reports, must understand and rapidly evaluate conditions such as the weather, naval currents, naval routes, the condition of his ship and crew, and the condition of other ships, decides routes based on naval charts, and provides navigation instructions. He records the results in the ship log, performing appropriate judgments as needed in order to navigate the ocean safely and satisfy the requirement of the cargo’s owners.
Likewise, in the IT project midstream process, in order to develop and supply systems that satisfy customer requirements, project managers gather specialists appropriate for their roles, share project stakeholder, project plans, and systemization objectives, putting system development into motion. Project managers receive regular reports from project managers as dictated by predetermined rules, perform appropriate analysis and evaluation, manage quality, progress, and costs, and move software and system development forward.
The objectives of MIERUKA in the final downstream process are the rapid determination of problems related to project success and failure, and the analysis of problem causes and the implementation of appropriate countermeasures in order to avert crises.
Figure 1-6 illustrates this by looking at the downstream process as medical treatment.In the medical field, in order to identify and treat an illness, the first step is physical testing (data
collection) through self-diagnosis or regular health inspections. If any problems are found, the patient

9
“MIERUKA (Visualization)” of IT ProjectsSummary
then goes in for more detailed testing. The doctor then uses those test results to make a diagnosis (analysis), and determines the medical condition and stage of illness. Lastly, the doctor provides treatment (improvement).
In the same way, in order to discover and fix project problems, the first step is data collection.The project manager checks on the status of the project himself (self-diagnosis), or receives regular
checks (health inspections) by evaluation organizations outside the project, such as a PMO (Project Management Office). When the indications of problems in projects are visible externally, external checks are performed. When these checks discover irregularities, detailed inspection is performed by external evaluation organizations.
The results of these inspections are then analyzed, and the project problem (medical condition) and level (stage of illness) are clarified. Then various improvements are made to the project in response to the problems and their levels. Some improvements can be implemented within the project, while others require coordination within the company from outside the project, or after coordination with customers. Furthermore, improvements include problem resolution measures and problem reoccurrence prevention measures.
1.2.3 Standpoint of MIERUKA in Individual Processes
Next, let’s discuss the standpoint of MIERUKA in upstream, midstream, and downstream processes.Upstream process MIERUKA is envisioned as being positioned after requirements definition has
ended, at the point when system design is started. The key feature of upstream process MIERUKA is the use of three approaches (qualitative, quantitative, and integrated) to treat problems which have not yet become evident as project “risks,” visualizing latent project problems.
Midstream process MIERUKA for the software design referred to in this text is envisioned as being positioned after basic design has been completed, at the point when detailed software design is started. At this stage, customer specification confirmation has been completed, and project work has been placed in the hands of specialists. The key feature of midstream process MIERUKA is the use of the same three approaches as were used in the upstream process (qualitative, quantitative, integrated). By unifying individual work, distributed among members and performed in parallel, using patterns based on standardized processes and products (regulation establishment) as well as development environments, homogenous data can be efficiently collected and analyzed, project MIERUKA implemented, and defects prevented from being passed on to the next process.
Downstream process MIERUKA is envisioned in this text as being positioned after integration test has ended, at the point when qualification test is started. The primary features of downstream

10
MIERUKA (Visualization) Objectives1
process MIERUKA are visualization based on birds-eye views, check sheets, measurement items, and failure examples, “IERUKA (identification)” based on an integrated approach, and “NAOSERUKA (correction)” using problem improvement activity patterns, in order to rapidly identify and rapidly handle problems.
Figure 1-6: Downstream process project MIERUKA, IERUKA, NAOSERUKA (visualization, identification, correction) (take medical treatment as an example)
Sel
f Che
ck(S
elf D
iagn
osis
)E
xter
nal C
heck
(Hea
lth In
spec
tion)
Det
aile
d A
naly
sis
(Det
aile
d Te
st)
Pro
blem
Det
ectio
n(D
eter
min
ing
Med
ical
Con
ditio
n)
Pro
blem
Le
vel J
udgm
ent
(Det
erm
inin
g S
tage
of I
llnes
s)
Edu
catio
n / T
rain
ing
(Life
styl
e G
uida
nce)
Issue Management TableProgress ReportScheduleBug Report FormSpecification Document
Check SheetProject ProfileAutomatically Collected Data
Skill MapProject Plan DocumentOrganization StructureSystem Birds-Eye View
InterviewAutomatically Collected DataSimilar Projects DB
Budget and ScheduleManagerial Judgment
AdviceRealization
Customer Budget Coordination
Personnel IncreasePM Support
Self Improvement(Self Treatment)
Internal Coordination(Internal Treatment)
Customer Coordination(External Treatment)
No Problems
No Problems
There Are Problems
Data Acquisition Analysis Improvement
Within Tolerable Range?
11
2.1
MIERUKA (Visualization) in Individual Processes
For IT projects, proper establishment of objectives and plans, and carrying out system development with a firm understanding of deviations from those plans, are critical. The key points leading to success in each process are different. In the upstream process, the key point is risk clarification. In the midstream process, it is fault build-in prevention. In the downstream process, it is rapid identification and handling of problems. Let us look at the MIERUKA (visualization) necessary for each of these in order.
2.1.1 Upstream Process
The upstream process includes the process of defining and deciding on requirements, and performing MIERUKA for project risks. During this process, the emergence of problems is rare, and in the event that a problem does emerge, there is sufficient time to handle it. Risk management, however, is important for carrying out projects. Identifying, analyzing, evaluating, and preparing appropriate countermeasures for risks make the next process progress more smoothly. In order to do this, impediment MIERUKA is performed.
Specifically, dominant items are identified using birds-eye views that show the entire project, and check sheets are used to identify the symptoms of possible future problems, prepare countermeasures in advance, make determinations based on the summary of problem projects, and take the project to the midstream process stage. Dominant items refer to the items which can lead the project to success.
2.1.2 Midstream Process
How can demands and requirements be implemented? How can systemization be verified and implemented? Smooth implementation requires not only MIERUKA, but also IERUKA (identification)
2Chapter
Overall View of MIERUKA (Visualization)

12
Overall View of MIERUKA (Visualization)2
and NAOSERUKA (correction) management.The midstream process is the process where systems are actually built. It requires the confirmation
of whether there were any mistakes or omissions during upstream process requirements definition, whether implementation as an information system is possible, and whether project plans, including risk management, have been created and revised appropriately. MIERUKA is used to perform this. IERUKA serves as the material for evaluation. Project management is carried out for future tasks with a full awareness of NAOSERUKA.
Specifically, the birds-eye view created during the upstream process is used to ensure that problems caused by dominant items are prevented from emerging. Furthermore, the project is carried forward to the downstream process stage through activities such as identifying new risks using check sheets, managing quality based on measurement analysis data obtained while carrying out the project, and implementing ever more appropriate measures, based on the summary of problem projects.
Figure 2-1: The 3 approaches of MIERUKA (Visualization)C
ount
erm
easu
re
*Dominant Item: Dominant factor in determining the success or failure of a project
Measured Analysis Data, Automated Measurement Tool; EPM
Birds-Eye View Self-Check Sheet, Interview Sheet
Summary of Problem Projects
Quantitative MIERUKA (Visualization) Approach
Categorized Item Table
Integrated judgment structure through tying together with “MIERUKA (Visualization)” approach
“MIERUKA (Visualization)” of risks through quantitative information measurement in accordance with measurement analysis items
“MIERUKA (Visualization)” of dominant items* from birds-eye view
Place / Occasion of
Actual Practice (Project)
Integrated ApproachIntegrated Approach
Qualitative MIERUKA (Visualization) Approach
“MIERUKA (Visualization)” of risks using check items
13
“MIERUKA (Visualization)” of IT ProjectsSummary
2.1.3 Downstream Process
During the downstream process, system confirmation and validation are performed in anticipation of actual operation. This brings the successes or failures of upstream and midstream processes into view. If any problems come to the fore, they need to be dealt with quickly. Downstream process MIERUKA is used to determine, at an early stage, problems which might result in project failure.
As there is not enough time at this stage until actual operation begins, in addition to MIERUKA, IERUKA and NAOSERUKA must also be carried out, and any problems resolved by implementing needed measures. Identify dominant items which are residual risks using birds-eye views. Use check sheets and measurement analysis data to confirm the quality of deliverables. Discover potential sources of problems using project performance trails. Eliminate those sources by finding appropriate temporary countermeasures using the summary of problem projects. Implement reoccurrence prevention measures such as regulation and procedure revisions. Lastly, formalize the knowledge you have obtained to serve as a lesson for other projects.
2.2
The Three MIERUKA (Visualization) Techniques
The importance of MIERUKA in each process has been stressed above. Several of the many MIERUKA measures have also been listed.
These measures have been encapsulated in tool form by the IPA. While there are many MIERUKA measures, they can all be divided into one of three technique categories.
These techniques are the qualitative MIERUKA approach, the quantitative MIERUKA approach, and the integrated approach (Figure 2-1). The techniques are effective for understanding “risks” and “plan deviations” in the upstream process, “defect introduction prevention” and “plan deviations” in the midstream process, and “early stage problem discovery and appropriate countermeasures” and “plan deviations” in the downstream process.
(1) The qualitative MIERUKA approach consists of “birds-eye views of the entire project,” “check sheets for identifying locations where problems may be hiding,” and “project case studies of past IT project problems.” These methods can be used to determine where problems lie in projects.
(2) The quantitative MIERUKA approach consists of “measured analysis data lists of items for quantified MIERUKA of the project’s status.” The numerical data serves to illuminate what sort of evaluation is required. They are also used in regular project measurement.
(3) The integrated approach uses a categorized item table which relates various tools (interview

14
Overall View of MIERUKA (Visualization)2
sheets, measured analysis data lists, summary of problem projects) with itemized categories describing what perspectives key experienced project members can use in clarifying project problem points. The categorized item table is utilized to integrate the use of individual tools, resulting in accurate risk and problem clarification.
Figure 2-2 shows the tools used in MIERUKA.

15
“MIERUKA (Visualization)” of IT ProjectsSummary
Figure 2-2: MIERUKA (Visualization) tool listApproach Tool / Material Contents
Qualitative MIERUKA Approach
Birds-Eye View
Used for as an overview of IT project management elements related to innate IT project problems (the large amount of latent problems resulting from IT innovation, the large number of stakeholders involved, the effect of accelerating IT technology and technology usage evolution and transformation).
The birds-eye view is used to predict problems that may occur during the project management process, providing “risk MIERUKA” and risk-inclusive management deployment.
Check Sheet
Check sheets are used for detecting project risks and problems.
There are two types of sheets: self-check sheet and interview sheet. Project managers are made aware of risks and problems based on the gaps between the project manager’s own assessment and interview results by a third party concerning the project manager.
Self-Check Sheet
Check sheet for the project manager to evaluate the status of the project.
Each item is graded on a three point scale, and the results are used to generate a radar chart. This chart shows the items and results which require special attention together with proposed measures.
Interview Sheet
Check sheet for outside specialists to use when conducting an interview with the project manager to evaluate the status of the project.
Each item is graded on a five point scale, and the results are used to generate a radar chart. This chart shows the items which require special attention and proposed measures.
This is used in conjunction with the self-check sheet to produce a radar chart showing the divergence with the project manager’s own assessment.
Summary of Problem Projects
This contains case studies of project failures, categorized by the process in which the problem occurred.
This summary list is used as a reference in order to prevent repeating past mistakes, and as an aid in discovering countermeasures for similar risks and problems.
Quantitative MIERUKA Approach
Measurement Items List
This contains measurement items used in quantitative measurement of project status, measurement methods, and analysis methods.
Measured Analysis Data List
Base Scales List
Integrated Approach Categorized Item Table
The implementation verification categorized item table is used to perform combined analysis of qualitative data, quantitative data, and case studies of problem projects, in order to enable integrated evaluation.
The vertical axis of the implementation verification categorized item table contains the relationships between individual processes. The horizontal axis contains quantitative data, qualitative data, and case studies of problem projects. The table can be used to perform integrated data-related analysis.

16
Overall View of MIERUKA (Visualization)2
2.3
Upstream, Midstream, and Downstream ProcessMIERUKA (Visualization) Techniques
MIERUKA techniques can be used to apply individual approaches for individual processes, or to apply multiple related approaches. Tools used in each approach can be used continuously through the upstream process, midstream process, and downstream process in order to visualize change over time throughout the project. Tools used in MIERUKA approaches in each upstream, midstream, and downstream processes are described below.
2.3.1 Qualitative Approach Techniques
This approach focuses on qualitative items, such as whether there is a plan, and whether the plan is being implemented. It uses the tools of birds-eye views, providing an overview of the entire project, check sheets (self-check sheets and interview sheets), and summaries of problem projects in order to maintain upstream, midstream, and downstream process quality, and prevent schedule delays.
Figure 2-3 shows the types of qualitative tools, from upstream to downstream processes.
Figure 2-3: Qualitative approach tools
Tool Upstream Process Midstream Process Downstream Process1. Birds-Eye View 6 Types 7 Types 4 Types
2. Self-Check Sheet 35 Items 38 Items 40 Items
3. Interview Sheet 74 Items 78 Items 85 Items
4. Summary of Problem Projects 58 Items 58 Items 77 Items
2.3.2 Quantitative Approach Techniques
In order to support the qualitative MIERUKA approach, one must decide the goals and types of quantitative data to be measured through upstream, midstream, and downstream processes.
Other decisions that must be made when performing quantitative measurement include what states measured items correspond to, what formulas will be used to define them, what data will be measured with those formulas, when and how often measurement will be performed, how it will be used, and the like.
Measurement items used for quantitative comprehension of project status are organized in “measurement items lists.” “Measurement items lists” include two types of lists. One is the “measured

17
“MIERUKA (Visualization)” of IT ProjectsSummary
analysis data list,” which contains measured items, measurement methods, and analysis methods. The other is the “base scales list,” which contains a variety of quantitative information that serves as a base when measuring the items in the measured analysis data list.
The quantitative approach uses “management records,” the “EPM tool (automated data acquisition analysis tool)” and “test automation tools” as data collection tools. Figure 2-4 shows quantitative approach measurement items lists for the upstream process, midstream process, and downstream process.
Figure 2-4: Quantitative approach measurement items list
Tool Knowledge Area Upstream Process Midstream Process
Downstream Process
1. Measured Analysis Data List
Scope 9 Items 4 Items 5 ItemsTime 16 Items 12 Items 15 ItemsCost 1 Item 1 Item 4 ItemsQuality 19 Items 38 Items 22 ItemsHuman Resources 10 Items 10 Items 12 ItemsCommunication 4 Items 4 Items 3 ItemsRisk 3 Items 3 Items 1 ItemMotivation 2 Items 2 Items 1 ItemOrganization 6 Items 5 Items 6 ItemsIssue Management 3 Items 3 Items 1 ItemTechnology 2 Items 2 Items -Customer 3 Items - -Total 78 Items 84 Items 70 Items
2. Base Scales List
Scope 20 ItemsTime 29 ItemsCost 2 ItemsQuality 48 ItemsHuman Resources 14 ItemsCommunication 10 ItemsRisk 18 ItemsMotivation 6 ItemsOrganization 16 ItemsIssue Management 6 ItemsTechnology 2 ItemsCustomer 4 ItemsTotal 175 Items
2.3.3 Integrated MIERUKA Approach Techniques
The integrated MIERUKA approach relates the data obtained via the qualitative and quantitative approaches and past project problem cases in order to recognize, from a wider perspective, what kinds of problems are occurring in the project, and what will occur in the future.
18
Overall View of MIERUKA (Visualization)2
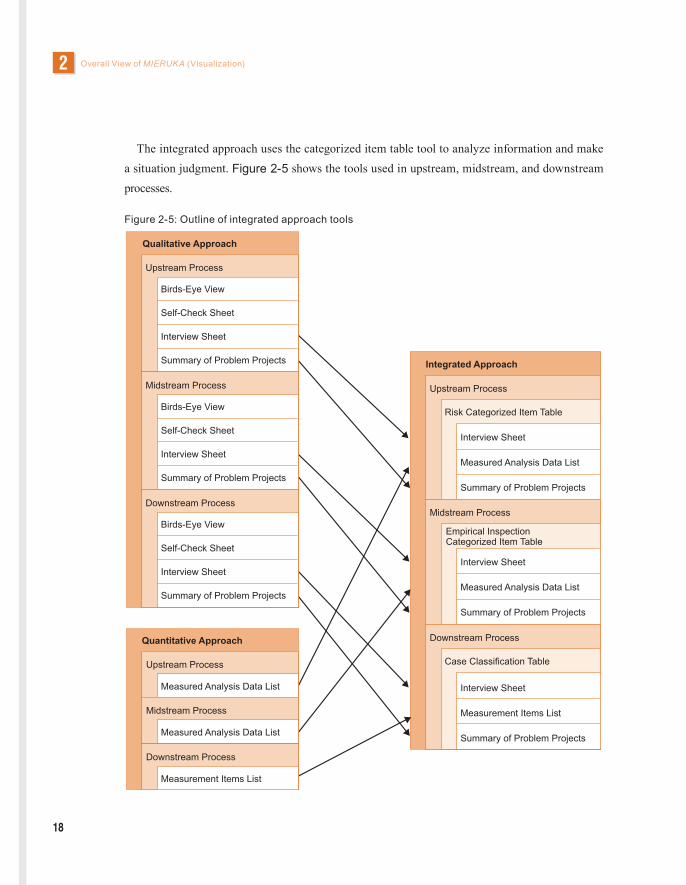
The integrated approach uses the categorized item table tool to analyze information and make a situation judgment. Figure 2-5 shows the tools used in upstream, midstream, and downstream processes.
Figure 2-5: Outline of integrated approach tools
Interview Sheet
Measured Analysis Data List
Summary of Problem Projects
Risk Categorized Item Table
Integrated Approach
Upstream Process
Interview Sheet
Measured Analysis Data List
Summary of Problem Projects
Midstream Process
Empirical Inspection Categorized Item Table
Interview Sheet
Measurement Items List
Summary of Problem Projects
Downstream Process
Case Classification Table
Measured Analysis Data List
Upstream Process
Quantitative Approach
Measurement Items List
Downstream Process
Measured Analysis Data List
Midstream Process
Upstream Process
Qualitative Approach
Birds-Eye View
Self-Check Sheet
Interview Sheet
Summary of Problem Projects
Midstream Process
Birds-Eye View
Self-Check Sheet
Interview Sheet
Summary of Problem Projects
Downstream Process
Birds-Eye View
Self-Check Sheet
Interview Sheet
Summary of Problem Projects
19
For IT project managers, realizing the nature and signs of future problems at an early stage, and determining the impacts of existing problems and measures to resolve them, are critical for leading a project to success. However, accurate problem assessment is no easy task for project managers with little experience, and bad judgments often trigger failure.
In response, this text establishes three qualitative MIERUKA (visualization) tools – birds-eye views that provide an overview of an entire project, check sheets (self-check sheets and interview sheets), and summary of problem projects – in order to simplify and speed up project problem assessment.
These tools are the fruit of careful deliberation of the know-how of participants in the Project MIERUKA committee, based on their individual experience. The project members have extensive experience as project manager of large-scale projects, troubleshooters for problem projects, and project reviewers.
The tools will be described in order below.
3.1
Birds-Eye View
3.1.1 Significance of the Birds-Eye View
A birds-eye view is a top-down view from a high vantage point. It does not consist of merely looking down on the project from above, but of actively using that vantage point to gain an overall view which is difficult to achieve from ground level.
The same thing can be said for projects. On the work floor, it is easy to miss the forest for the trees. People’s attention is captured by their immediate situations and minor problems, and it is easy for them to miss intrinsic problems that may have serious repercussions on the entire project. The birds-eye
3Chapter
Qualitative MIERUKA (Visualization) Tools

Qualitative MIERUKA (Visualization) Tools3
20
view diagram is a tool used to resolve this problem.It is important to remember, though, that even when multiple people look at the same thing, what
they see may differ depending on what their concerns are.There are always factors in system development projects which lead to project success or
failure. These are called “dominant items.” However, each system development project has its own characteristics, and it is difficult to predict what the dominant factors will be, and what results they will bring about.
As such, when creating a birds-eye view, focus needs to be placed on what are likely to be dominant items, and what will need to be seen (and to what extent) in order to prevent risks in advance. Birds-eye views should be continuously refined until they are satisfactory.
Refining a project’s birds-eye view will bring to light dominant items which otherwise would not have been identified, and show where attention will need to be paid in project management in order to lead the project to success.
Once a birds-eye view has been produced which is satisfactory to both a project manager and others, the project manager will have a secure grasp of the project’s dominant item, and will be able to more surely lead the project to fruition.
3.1.2 MIERUKA (Visualization) Using Birds-Eye Views
There are 4 kinds of birds-eye views necessary for each process of system development project management.
(1) Stakeholder birds-eye view: Shows the key personnel involved in the project’s success or failure amongst all the related project stakeholders. Within this category, birds-eye views which pay special attention to key persons involved in overall project implementation are referred to specifically as project promotion structure diagrams.
(2) System structure birds-eye view: Especially for large-scale systems, this view is useful for grasping the overall picture of development system structure and its dominant items. If necessary, a peripheral system structure diagram can be created to show the positioning of systems being developed, including higher level systems.
(3) Schedule birds-eye view: This clarifies which schedules out of the entire project’s schedules require priority management.
(4) Personnel transition birds-eye view: Shows changes in key persons for each phase.

21
“MIERUKA (Visualization)” of IT ProjectsSummary
In addition to the four types of birds-eye views described above, the following are used in the midstream process.
(5) Role allocation table: Used to prevent omissions of necessary organization-wide tasks due to increasing organization structure complexity or scale.
(6) Program relational diagram: Shows overall relationships between elements in complex software structures such as batch processes composed of multiple jobs and programs.
Figure 3-1: Birds-eye view example (stakeholder birds-eye view including project promotion structure)
Ordering Party General Hospital A Order Recipient Company B
Project C a Director (Owner)
c Sales d Upper Manager
b Assistant Director (Project Owner)
Hospital System Innovation Committee
Members: 20 Departments x 2 People
Hospital System Innovation Committee WG
Partner Company Company DSubsystem Development LeaderPMLeader: ××Member: ××….
Partner Company Company ESubsystem Development LeaderPMLeader: ××Member: ××….
Package VendorF Add-onLeader: ××
Package DeveloperAmericaCustomizationLeader: ××
PM: ××PM Assistant: ××Main System Development Leader: ××
Let us consider the example of a hospital system innovation committee that has decided to request the creation of a new hospital system within an extremely short period of time. The birds-eye view shown in Figure 3-1 is the result of investigation into what stakeholders the project has.
As the birds-eye view shows, it is risky to assume that the system innovation committee members alone will be able to immediately finalize requirement specifications. The diagram shows 20 involved departments, and in cases such as this, it is extremely common that the finalization of requirement

Qualitative MIERUKA (Visualization) Tools3
22
specifications which are essential to the success of a project is held up indefinitely due to conflicts between departments.
The diagram also shows that the ultimate authority to finalize requirement specifications does not lie in the people ordering the system (the system innovation committee members), but the person with that authority (the project owner) is in fact the assistant director. Once these facts have been established, the measures needed by the project manager become clear.
For example, project managers should strongly propose that specification decision meetings (steering meetings), including the project owner (assistant director) and related hospital departments, be established from early in the upstream process phase. If that proposal is not met with support, the assistance of upper level the ordered party’s management should be obtained in order to make these steering meetings a reality. Establishing steering meetings can help project managers reduce requirement specification decision delays, as well as the number of specification changes in the midstream and downstream processes, better ensuring the success of the project.
The above showed how creating a stakeholder birds-eye view revealed problems (project owners not being involved in project planning, and no steering meetings being established) within the ordering body’s structure as dominant items.
Keeping this example in mind, below is an explanation of the benefits of birds-eye view utilization.The first benefit is the visualization of dominant items from a wide range of perspectives. By
creating system design birds-eye views, schedule birds-eye views, and personnel transition birds-eye views in addition to stakeholder birds-eye views, dominant items that determine the success or failure of a project can be identified and grasped from a variety of perspectives.
The second benefit is enhanced organizational uptake of dominant items. The dominant items which are identified can not necessarily all be handled by the project manager. Instead of keeping the information contained in the birds-eye view in the project manager’s head, making it visible to third parties makes it possible to gain the cooperation of the project manager’s superiors, sales force, SI vendor management, and order side stakeholders, leading more surely to project success.
3.1.3 Birds-Eye View Details
6 types of birds-eye views have been prepared for use as primary birds-eye views in the upstream process, 7 for the midstream process, and 4 for the downstream process. Figure 3-2 shows overall utilization methods.

23
“MIERUKA (Visualization)” of IT ProjectsSummary
Figure 3-2: Birds-eye view list
Type Usage Method Degree of Usage per Process Phase Upstream Midstream Downstream
Stakeholder Birds-Eye View
Makes it possible to get an overall view of projects involving large numbers of stakeholders with complex intersections of interests. Determine which are the key people in each organization, and enter their names in the birds-eye view. Get these key people on your side when moving forward with the project.
Applied Applied Applied
Project Promotion Structure Birds-Eye View
Projects are composed of multiple organizations and companies. Enter the missions of each organization. This birds-eye view makes it possible to understand the overall project promotion structure. It is important to gain the agreement of key people from each organization with regard to the missions at project initiation such as during kick-off meetings.
Applied Applied Partly applied
Peripheral System Structure Birds-Eye View
This makes it possible to understand the relationships between the developed system and other linked systems. It can be used to identify problems in interfaces between linked systems, to identify the extent of impact caused by system stoppages, to verify the qualification tests and migration plan, to identify performance bottlenecks, and the like.
Applied Partly applied
Partly applied
System Structure Birds-Eye View
This is a graphic schematization of linkage between system components. For example, it can be used to provide a birds-eye view of the relationship between system performance requirements or system failure recovery requirements and related systems, assisting in problem identification.
Applied Applied Applied
Role Allocation Table
This clarifies the work items (role and responsibility scopes) of each organization. There is an especially strong tendency for work division to be vague when it involves multiple organizations. By creating a role allocation table, roles which could be overlooked by falling in between the multiple organizations involved can be identified and verified. (There is an especially large lack of clarity regarding operations during the midstream process, due to the large number of organizations involved.)
N/A Applied N/A
Program Relational Diagram
Looking at the example of batch processing, the structure of a single process may be complex, consisting of multiple jobs and programs. Creating a program relational diagram showing the relationships between jobs and programs can also assist with program creation and test schedule verification.
N/A Applied N/A
Schedule Birds-Eye View
Projects with multiple detailed schedules need a schedule at a level which can be tacked by the project manager. This schedule is limited to critical paths. If integration tests or qualification tests are critical paths, create more detailed schedules in order to narrow the focus to potential problems.
Applied Applied Applied
Personnel Transition Birds-Eye View
This birds-eye view clarifies the retention status of workers and key persons for each process. Quality can be efficiently improved if the same key person handles all production stages, from system design to testing, but these results in an excessive burden being placed on the key person. This birds-eye view can be used to verify if there are any problems that would prevent key people from being positioned in critical operations.
Applied Applied Applied

Qualitative MIERUKA (Visualization) Tools3
24
3.2
Check Sheets(Self-Check Sheet, Interview Sheet)
It is not easy for project managers with little experience to determine not only what problems are currently occurring in a project, but what problems are likely to occur in the future.
These problems could be more accurately understood if experienced project managers were to provide an extensive checklist. As such, two types of check sheets are provided in this text for each of the project processes (the upstream process, midstream process, and downstream process). These are the “self-check sheet,” used by project managers and the like to perform their own evaluations, and the “interview sheet,” used by specialists such as PMO (Project Management Office) specialists to perform interview diagnoses.
“Self-check sheets” can be used by project managers to realize project problems and risks that had not occurred to them.
“Interview sheets” can be used by specialists, from a third-party perspective, to evaluate projects. They clarify problems and risks that were not visible from the project manager’s perspective, and serve to make project managers more perceptive.
The basis for saying that they actually improve perception, as opposed to general check sheets, are that (1) they encompass a body of knowledge based on PMBOK, and (2) they extend this to the body of knowledge particular to software development.
Please pay special note to the fact that (1) above is conformant with an international standard based body of knowledge. The check items in both the “self-check sheet” and the “interview sheet” are not a random collection. They were selected and organized in accordance with a defined system based on the international PMBOK (Project Management Body of Knowledge) standard of project manager processes (PMBOK structures knowledge into 9 knowledge areas: “integration,” “scope,” “time,” “cost,” “quality,” “human resources,” “communication,” “risks,” and “procurement”).
Because PMBOK is not limited to the software management field, but is a common standard for project managers in fields as varied as construction and chemical plants, the knowledge that is unique to the software development field is not included within the PMBOK process regulation scope. The need for a standard process structure like PMBOK’s for the software development field has been proposed, but unfortunately none is in place as of the present time. The first additional knowledge area considered for inclusion in this text was software engineering “technology.” Furthermore, some knowledge cannot be categorized in PMBOK’s knowledge areas, nor does it fall under the umbrella

25
“MIERUKA (Visualization)” of IT ProjectsSummary
of “technology,” and yet is essential for preventing the reoccurrence of past project failures. This knowledge has also been added as a collection of new knowledge areas. These areas are “customer,” “organization,” “basic conduct/action,” “motivation,” and “issue management.” Figure 3-3 shows the 6 extended knowledge areas, including “technology.”
Figure 3-3: Extended knowledge areas for improving project manager perceptivenessExtended
Knowledge Area Definition
Customer
Customers are defined as the people or organizations, among the project’s stakeholders, who have the final word regarding system specifications or budgets. In subcontracted system development projects, consensus with regard to creating the resulting system which is the final deliverable is frequently established in cooperation with the customer.
Organization
Organizations here refer to system development project related organizations. Project member organizations include higher level personnel and sales personnel who have influence on the project. External organizations include partner companies with multi-tiered subcontracting structures, and multi-vendor methods in which multiple development companies participate. In practice, there are limitations, especially in “human resources” and “procurement” approaches, depending on the structures of individual organizations.
Basic Conduct/Action This refers to system development common sense and the obvious actions that should be carried out by developers. This includes system development management matters as well.
Motivation This refers to the motivation of personnel related to system development. It includes not only internal psychological aspects of personnel related to system development, but also work environments and career development related items, such as personal growth objectives.
Technology Items related to the software engineering management of software development technologies and system integration technologies.
Issue Management
Management items concerning issue management of system development project tasks. This corresponds to monitoring and control process management in PMBOK, but was judged that it is more efficient to summarize how issue management should be performed at the system development work site for downstream project processes, so these were added as an extended knowledge area.
3.2.1 MIERUKA (Visualization) Process Using Check Sheets
There are two ways in which check sheets are used.The first is when project managers (or project leaders) decide on their own to apply check sheets
to their project. The other is when specialist teams decide to apply check sheets to a target project in accordance with organization policy. For example, for large scale projects with high risk levels, SI vendors may decide, as directed by their company organization policies, that third-party examination by a dedicated team is required.
Figure 3-4 shows the MIERUKA process using both types of check sheets.

Qualitative MIERUKA (Visualization) Tools3
26
Figure 3-4: MIERUKA (visualization) process using check sheets
(1) Applied by project managers and project leaders to their own projects
Clarification of project problems using “self-check sheets”
Use “self-check sheets” (as necessary) in advance of specialist team interviews in order to identify gaps with project manager understanding
To further clarify problem points, request a hearing by a specialist team
(2) Applied by specialist teams to projects
Use “self-check sheets” (as necessary) in advance of specialist team hearings in order to identify gaps with project manager understanding
Interview Diagnosis by Specialist Team
Self Diagnosis Self Diagnosis
3.2.2 MIERUKA (Visualization) Using Self-Check Sheets
Figure 3-5 shows an example of an upstream process self-check sheet, which is composed of “Check Item,” “Assessment Criteria,” “Management Hints,” “Evaluation Entry Column,” “Judgment,” and “Measures” fields for each knowledge area. Filling in the “Evaluation Entry Column” of the self-check sheet (Excel sheet) makes it possible to create a graphical display of overall judgment results for individual knowledge area units.
This MIERUKA process can provide the following benefits to the project manager.First, it speeds up the time between identifying individual problems and deciding on
countermeasures. In addition to enabling the project manager at an early stage to notice problems and risks that they otherwise would not have noticed, advice from experts with experience with self-check sheets are provided in the form of specific “Management Hint” and “Measures” examples. This makes decision-making both faster and easier than the usual situation where project managers had to deliberate and make decisions entirely on their own.
The second benefit is that it makes it possible to consider countermeasures while taking their priorities into consideration by providing a birds-eye view of overall project problems. Filling in the “Evaluation Entry Column” of the self-check sheet (Excel sheet) formats results graphically, making it possible to see at a glance weaknesses in each knowledge area, and the extent of those weaknesses. Compared to the usual method of going through issues which had been pointed out in order to

27
“MIERUKA (Visualization)” of IT ProjectsSummary
implement appropriate measures one-by-one, this makes it possible to take a focused, prioritized approach to determining which knowledge areas require high priority handling.
Figure 3-5: Example of self-check sheet
Qualitative MIERUKA (Visualization) Tools3
28
3.2.3 MIERUKA (Visualization) Using Interview Sheets
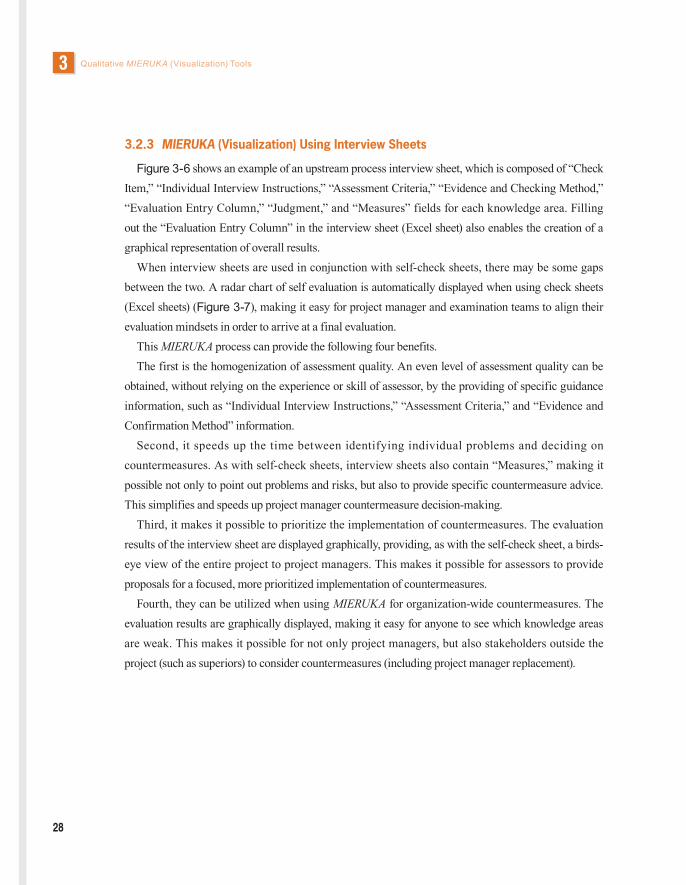
Figure 3-6 shows an example of an upstream process interview sheet, which is composed of “Check Item,” “Individual Interview Instructions,” “Assessment Criteria,” “Evidence and Checking Method,” “Evaluation Entry Column,” “Judgment,” and “Measures” fields for each knowledge area. Filling out the “Evaluation Entry Column” in the interview sheet (Excel sheet) also enables the creation of a graphical representation of overall results.
When interview sheets are used in conjunction with self-check sheets, there may be some gaps between the two. A radar chart of self evaluation is automatically displayed when using check sheets (Excel sheets) (Figure 3-7), making it easy for project manager and examination teams to align their evaluation mindsets in order to arrive at a final evaluation.
This MIERUKA process can provide the following four benefits.The first is the homogenization of assessment quality. An even level of assessment quality can be
obtained, without relying on the experience or skill of assessor, by the providing of specific guidance information, such as “Individual Interview Instructions,” “Assessment Criteria,” and “Evidence and Confirmation Method” information.
Second, it speeds up the time between identifying individual problems and deciding on countermeasures. As with self-check sheets, interview sheets also contain “Measures,” making it possible not only to point out problems and risks, but also to provide specific countermeasure advice. This simplifies and speeds up project manager countermeasure decision-making.
Third, it makes it possible to prioritize the implementation of countermeasures. The evaluation results of the interview sheet are displayed graphically, providing, as with the self-check sheet, a birds-eye view of the entire project to project managers. This makes it possible for assessors to provide proposals for a focused, more prioritized implementation of countermeasures.
Fourth, they can be utilized when using MIERUKA for organization-wide countermeasures. The evaluation results are graphically displayed, making it easy for anyone to see which knowledge areas are weak. This makes it possible for not only project managers, but also stakeholders outside the project (such as superiors) to consider countermeasures (including project manager replacement).

29
“MIERUKA (Visualization)” of IT ProjectsSummary
Figure 3-6: Example of interview sheet

Qualitative MIERUKA (Visualization) Tools3
30
Figure 3-7: MIERUKA (visualization) of gaps between self evaluation and third party evaluation
31
“MIERUKA (Visualization)” of IT ProjectsSummary
3.2.4 Check Sheet Details
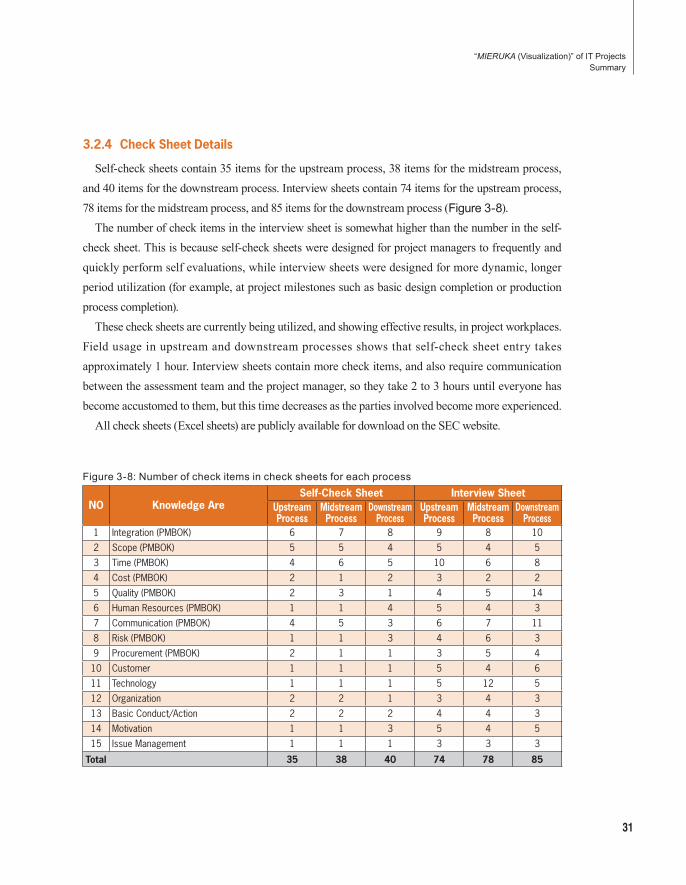
Self-check sheets contain 35 items for the upstream process, 38 items for the midstream process, and 40 items for the downstream process. Interview sheets contain 74 items for the upstream process, 78 items for the midstream process, and 85 items for the downstream process (Figure 3-8).
The number of check items in the interview sheet is somewhat higher than the number in the self-check sheet. This is because self-check sheets were designed for project managers to frequently and quickly perform self evaluations, while interview sheets were designed for more dynamic, longer period utilization (for example, at project milestones such as basic design completion or production process completion).
These check sheets are currently being utilized, and showing effective results, in project workplaces. Field usage in upstream and downstream processes shows that self-check sheet entry takes approximately 1 hour. Interview sheets contain more check items, and also require communication between the assessment team and the project manager, so they take 2 to 3 hours until everyone has become accustomed to them, but this time decreases as the parties involved become more experienced.
All check sheets (Excel sheets) are publicly available for download on the SEC website.
Figure 3-8: Number of check items in check sheets for each process
NO Knowledge AreSelf-Check Sheet Interview Sheet
Upstream Process
Midstream Process
Downstream Process
Upstream Process
Midstream Process
Downstream Process
1 Integration (PMBOK) 6 7 8 9 8 10
2 Scope (PMBOK) 5 5 4 5 4 5
3 Time (PMBOK) 4 6 5 10 6 8
4 Cost (PMBOK) 2 1 2 3 2 2
5 Quality (PMBOK) 2 3 1 4 5 14
6 Human Resources (PMBOK) 1 1 4 5 4 3
7 Communication (PMBOK) 4 5 3 6 7 11
8 Risk (PMBOK) 1 1 3 4 6 3
9 Procurement (PMBOK) 2 1 1 3 5 4
10 Customer 1 1 1 5 4 6
11 Technology 1 1 1 5 12 5
12 Organization 2 2 1 3 4 3
13 Basic Conduct/Action 2 2 2 4 4 3
14 Motivation 1 1 3 5 4 5
15 Issue Management 1 1 1 3 3 3
Total 35 38 40 74 78 85
Qualitative MIERUKA (Visualization) Tools3
32
3.3
Summary of Problem Projects
The summary of problem projects is an extraordinarily useful tool, as it allows project managers to learn from past failures in order to prevent repeating them.
It is a database of what highly experienced Project MIERUKA committee members have learned from their experience with problem projects in the past.
3.3.1 Public Release of Summary of Internal Problem Projects
In the past, SI vendors generally have collected summaries of internal problem projects, but these have been limited to the projects of the specific SI vendor, and it has been very rare that these summaries have been released.
This is a serious loss for the information service industry as a whole. This text collects and provides summary of problem projects, including 193 problem examples taken from the experience of the Project MIERUKA committee.
Figure 3-9 shows a sample problem case study related to the upstream process. This example focuses on the project manager making a determination upon projecting and encountering problems and knowingly leaving the cause of those problems unaddressed. Sometimes, during the upstream process, goals may be vague, but delivery date has been decided, and the project has to be pushed through. The case study examples address what kinds of symptoms environments exhibited, what occurred as a result of which judgments, and what should have been done.

33
“MIERUKA (Visualization)” of IT ProjectsSummary
Figure 3-9: Case sample from summary of problem project database
Case No. 2 Misjudging the Actual UsersSystem construction was requested by the information systems department, and development was conducted under a contract with that department. As such, while there seemed to be a conflict between the user department and the information systems department within the customer, the system specifications were prepared under the initiative of the information systems department who was the ordering party. However, after the specifications were implemented and the user department started to use the new system, issues concerning usability and specifications were raised one after another. The development team became preoccupied with responding to specification changes, and was unable to launch the system as scheduled.
How Matters Were Determined in This Case Examples of Countermeasures The user department had been raising issues about the previous system and making requests for the new system, but t h e y w e r e h a r d l y d i s c u s s e d a n d specifications were determined under the in i t ia t ive o f the in format ion sys tems department. Normally, a member of the user department should also part ic ipate in discussing the specifications, but since the counterparty was the customer’s information systems department, it was assumed that there would be no issues concerning the specifications.
• Make the counterparty clearly acknowledge the requests as specif ication changes, and revise/change the plan according to specification change procedures. If still in the upstream process, major retractions can often be avoided, but reconsiderat ion of speci f icat ions may lead to unexpected expansion of scope. As such, ad hoc changes should be avoided as much as possible.
• If the specifications are not officially acknowledged as “fixed,” and if tasks were undertaken from the point of requirements definition and basic design, in cases where the ordering party insists that “the problem is rooted in the discussion of the specifications,” avoid responding to requests as they are made, and restart at clarifying the requirements specifications with the user department. Ad hoc measures tend to result in the embedding of conflicting specifications, leading to further issues being exposed in subsequent processes.
Indications to Look For Original Concept of How Matters Should be Determined• Discussions are held on system features
only, and not on the actual business• T h e c o u n t e r p a r t y ’s o r g a n i z a t i o n a l
framework does not involve the user department
• The information systems department is not eager to hold meetings together with the user department
• The information systems department tries to restrict questions to the user department
• While it may not be the most respectable way of thinking, if the project manager has reached a consensus with the ordering party that the specifications are “fixed,” further specif ication changes can be handled as separate contracts. As such, measures such as taking minutes for discussions in which specifications were “fixed” should be taken as minimum measures.
• Whether the information systems department can decide on its own on system specifications capable of properly supporting the business will depend heavily on the business experiences and knowledge of the person in change. It is desirable for the information systems department personnel to have a strong trust from the user department.
• If complaints regarding a new system are raised from the end-user user department that “the system is insufficient for the work,” the information systems department will generally be required to address the issues. Therefore, in determining specifications in the upstream process, it is necessary to obtain approval from the user department in addition to the information systems department.

Qualitative MIERUKA (Visualization) Tools3
34
3.3.2 MIERUKA (Visualization) Using the Summary of Problem Projects
The summary of problem projects can be used by the project manager to provide the following MIERUKA benefits.
First, it helps in the visualization of hidden project status judgments. If project managers with little experience consult these case studies of problem projects when they project or encounter problems, they may find hints to resolve those problems, resulting in a higher likelihood of project success.
Second, they serve as a cautionary lesson against slack situation judgments. Project manager with some degree of experience have experience with successful projects to a certain extent. As such, they are inclined to be overconfident, and to not treat risks with enough gravity. Learning about other project failures can provide the benefit of making them take a tighter approach to their own projects.
As described above, project manager can make use of the case studies of problem projects in order to find specific guideposts to guide them out of the cloud of uncertainty, visualizing situations more specifically in order to better lead projects to success.
3.3.3 Details of the Summary of Problem Projects
The summary of problem projects contains a total of 193 examples of problem projects selected and released by the Project MIERUKA committee. It contains case studies of problem projects that the highly experienced committee members have encountered themselves. The breakdown of problem projects by process stage is as follows.
● Upstream process - 58 items● Midstream process - 58 items● Downstream process - 77 itemsThe case studies indicate which process the problem occurred in. It does not contain projects with
multiple causes.Figure 3-9 shows an example problem project that occurred in the upstream process. Examples from
other processes reflect the unique characteristics of their respective processes, and as such the format used may differ slightly.
For example, examples of problems in downstream process are for projects in which problems have already occurred. Instead of providing early signs of the problem, they focus on the causes and recovery measures (emergency preliminary countermeasures and reoccurrence prevention measures). Please refer to the appendices at the end of “IT Project ‘MIERUKA’ Upstream Process”, “IT Project

35
“MIERUKA (Visualization)” of IT ProjectsSummary
‘MIERUKA’ Midstream Process”, and “IT Project ‘MIERUKA’ Downstream Process” for format details and summary contents.
For projects within the case studies with particularly significant impact (major problem project examples), Chapter 6 “Problem Project Example Analysis” delves deeper, containing not only the individual causes and countermeasures for each process, but the overarching problem cause as well.
3.4
Qualitative MIERUKA (Visualization) Tool Summary
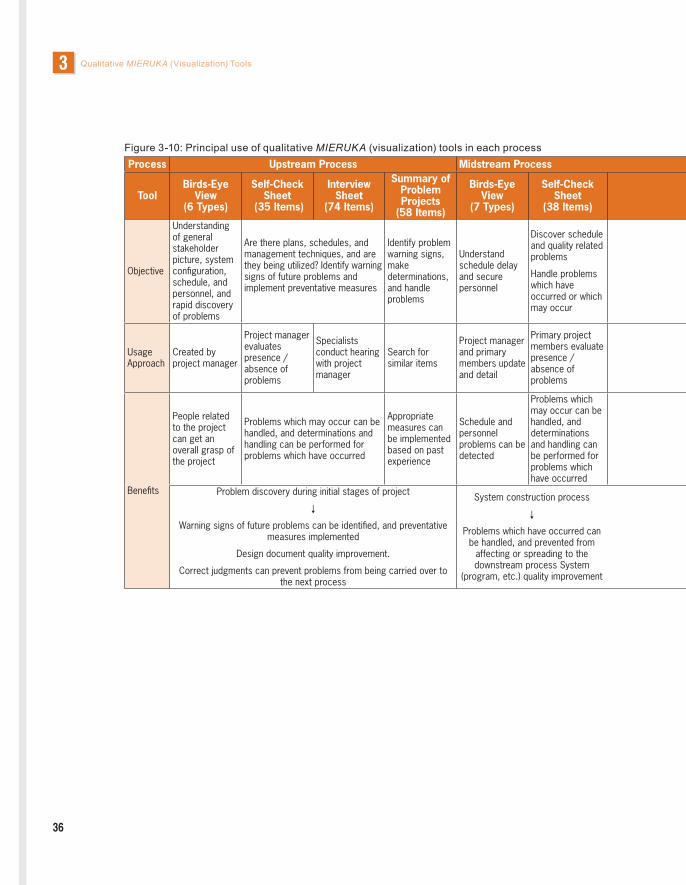
It has been touched on briefly above, but qualitative MIERUKA tools vary depending on the situation (process) in which they are used, their objectives, how they are implemented, and their usage benefits.
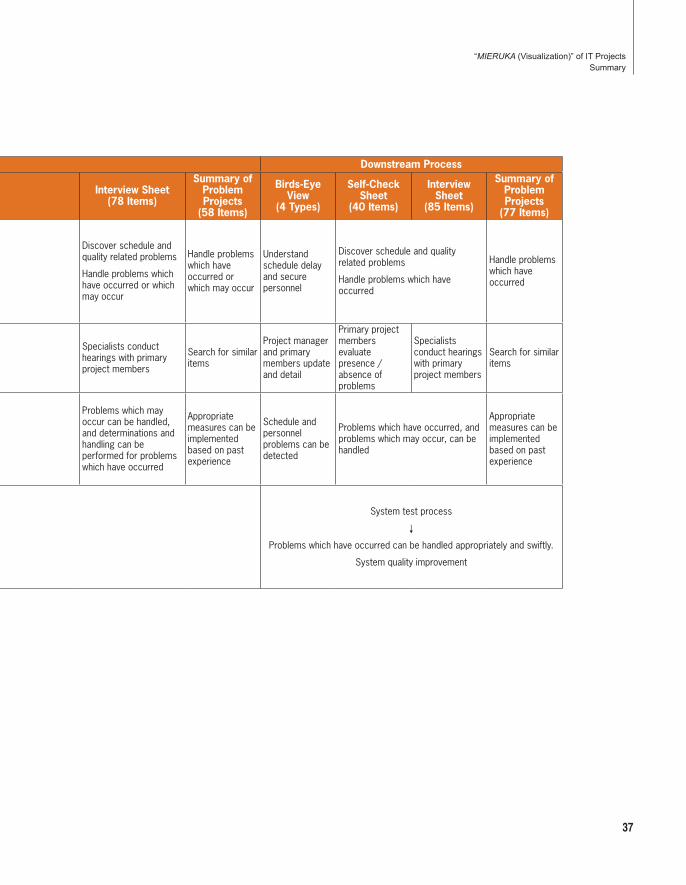
Figure 3-10 provides a summary of all of the qualitative MIERUKA tools’ usages, from the upstream process to the downstream process.
For information regarding detailed qualitative MIERUKA tool usage in each process, and procedures for evaluation using check sheets, please refer to the “Qualitative MIERUKA Tool” chapters and appendices of each of the following texts:
“IT Project ‘MIERUKA’ Upstream Process” “IT Project ‘MIERUKA’ Midstream Process” “IT Project ‘MIERUKA’ Downstream Process”
Qualitative MIERUKA (Visualization) Tools3
36
Figure 3-10: Principal use of qualitative MIERUKA (visualization) tools in each processProcess Upstream Process Midstream Process Downstream Process
Tool Birds-Eye
View (6 Types)
Self-Check Sheet
(35 Items)
Interview Sheet
(74 Items)
Summary of Problem Projects
(58 Items)
Birds-Eye View
(7 Types)
Self-Check Sheet
(38 Items)
Interview Sheet (78 Items)
Summary of Problem Projects
(58 Items)
Birds-Eye View
(4 Types)
Self-Check Sheet
(40 Items)
Interview Sheet
(85 Items)
Summary of Problem Projects
(77 Items)
Objective
Understanding of general stakeholder picture, system configuration, schedule, and personnel, and rapid discovery of problems
Are there plans, schedules, and management techniques, and are they being utilized? Identify warning signs of future problems and implement preventative measures
Identify problem warning signs, make determinations, and handle problems
Understand schedule delay and secure personnel
Discover schedule and quality related problems
Handle problems which have occurred or which may occur
Discover schedule and quality related problems
Handle problems which have occurred or which may occur
Handle problems which have occurred or which may occur
Understand schedule delay and secure personnel
Discover schedule and quality related problems
Handle problems which have occurred
Handle problems which have occurred
Usage Approach
Created by project manager
Project manager evaluates presence / absence of problems
Specialists conduct hearing with project manager
Search for similar items
Project manager and primary members update and detail
Primary project members evaluate presence / absence of problems
Specialists conduct hearings with primary project members
Search for similar items
Project manager and primary members update and detail
Primary project members evaluate presence / absence of problems
Specialists conduct hearings with primary project members
Search for similar items
Benefits
People related to the project can get an overall grasp of the project
Problems which may occur can be handled, and determinations and handling can be performed for problems which have occurred
Appropriate measures can be implemented based on past experience
Schedule and personnel problems can be detected
Problems which may occur can be handled, and determinations and handling can be performed for problems which have occurred
Problems which may occur can be handled, and determinations and handling can be performed for problems which have occurred
Appropriate measures can be implemented based on past experience
Schedule and personnel problems can be detected
Problems which have occurred, and problems which may occur, can be handled
Appropriate measures can be implemented based on past experience
Problem discovery during initial stages of project
Warning signs of future problems can be identified, and preventative measures implemented
Design document quality improvement.
Correct judgments can prevent problems from being carried over to the next process
System construction process
Problems which have occurred can be handled, and prevented from
affecting or spreading to the downstream process System
(program, etc.) quality improvement
System test process
Problems which have occurred can be handled appropriately and swiftly.
System quality improvement
37
“MIERUKA (Visualization)” of IT ProjectsSummary
Figure 3-10: Principal use of qualitative MIERUKA (visualization) tools in each processProcess Upstream Process Midstream Process Downstream Process
Tool Birds-Eye
View (6 Types)
Self-Check Sheet
(35 Items)
Interview Sheet
(74 Items)
Summary of Problem Projects
(58 Items)
Birds-Eye View
(7 Types)
Self-Check Sheet
(38 Items)
Interview Sheet (78 Items)
Summary of Problem Projects
(58 Items)
Birds-Eye View
(4 Types)
Self-Check Sheet
(40 Items)
Interview Sheet
(85 Items)
Summary of Problem Projects
(77 Items)
Objective
Understanding of general stakeholder picture, system configuration, schedule, and personnel, and rapid discovery of problems
Are there plans, schedules, and management techniques, and are they being utilized? Identify warning signs of future problems and implement preventative measures
Identify problem warning signs, make determinations, and handle problems
Understand schedule delay and secure personnel
Discover schedule and quality related problems
Handle problems which have occurred or which may occur
Discover schedule and quality related problems
Handle problems which have occurred or which may occur
Handle problems which have occurred or which may occur
Understand schedule delay and secure personnel
Discover schedule and quality related problems
Handle problems which have occurred
Handle problems which have occurred
Usage Approach
Created by project manager
Project manager evaluates presence / absence of problems
Specialists conduct hearing with project manager
Search for similar items
Project manager and primary members update and detail
Primary project members evaluate presence / absence of problems
Specialists conduct hearings with primary project members
Search for similar items
Project manager and primary members update and detail
Primary project members evaluate presence / absence of problems
Specialists conduct hearings with primary project members
Search for similar items
Benefits
People related to the project can get an overall grasp of the project
Problems which may occur can be handled, and determinations and handling can be performed for problems which have occurred
Appropriate measures can be implemented based on past experience
Schedule and personnel problems can be detected
Problems which may occur can be handled, and determinations and handling can be performed for problems which have occurred
Problems which may occur can be handled, and determinations and handling can be performed for problems which have occurred
Appropriate measures can be implemented based on past experience
Schedule and personnel problems can be detected
Problems which have occurred, and problems which may occur, can be handled
Appropriate measures can be implemented based on past experience
Problem discovery during initial stages of project
Warning signs of future problems can be identified, and preventative measures implemented
Design document quality improvement.
Correct judgments can prevent problems from being carried over to the next process
System construction process
Problems which have occurred can be handled, and prevented from
affecting or spreading to the downstream process System
(program, etc.) quality improvement
System test process
Problems which have occurred can be handled appropriately and swiftly.
System quality improvement

A qualitative approach, such as the use of self-check sheets and interview sheets, is effective for project MIERUKA (visualization), but a quantitative approach is needed for more objective MIERUKA.
Quantitative MIERUKA tools are used to provide data regarding actual project movement. For example, interviews are effective for determining if project planning has been performed, and if the plan is being implemented. Objective data regarding project activity is necessary as evidence of plan implementation, and to visualize to what degree the plan is being implemented.
In the quantitative approach, the situations handled, how they are defined, and what is measured vary depending on the process. Additionally, measurement timing, frequency, and methodology must be decided on.
The guides to each process provide measurement items lists as tools to use in the quantitative approach. Quantitative data is often acquired from management record forms, but can also be obtained using the EPM tool (an automated data collection analysis tool) and test automation tools. Depending on the quantity and volume of data items to be measured, quantitative data collection may require significant labor and tool implementation costs. At the start of the project, project managers must determine to what extent MIERUKA will be used, create measurement plans, and invest sufficiently to cover data acquisition costs.
Figure 4-1: Lists provided in guides
Process Measurement Analysis Data List Base Scales List
Upstream Process X X
Midstream Process X N/A
Downstream Process X N/A
4Chapter
Quantitative MIERUKA (Visualization) Tools
38

4.1
Measurement Items List
Measurement items used for quantitative comprehension of project status are organized in “measurement items lists.” There are two principal types of measurement items list. One is the “measurement analysis data list,” which contains measured items, measurement methods, and analysis methods. The other is the “base scales list,” which contains a quantitative information that serves as a base when performing measurement. However, as conditions differ for upstream, midstream, and downstream processes, a “base scales list” is only provided for the upstream process (Figure 4-1).
4.1.1 Measurement Analysis Data List
The measurement analysis data list provides, for each knowledge area, “measurement objective” information which are the objectives under which project status is measured, and “measurement method” information which are the methods to achieve those objectives.
The measurement method is expressed in terms of “derived scale” items for seeing the status of projects, and “base scale” measurement elements used as a basis of those derived scales. The base scales are those used in actual measurement, representing information obtained from single unique attributes of processes and deliverables. Derived scales, on the other hand, represent information calculated from multiple base scales.
Figure 4-2: Relationship between derived scale and base scales when looking at review work progress in terms of review time
Review Progress Ratio
Actual Review Time / Planned Review Time
Planned Review TimeActual Review Time
Review Plan DocumentReview Record Form
Count Actual Review Time Count Planned Review Time
Measurement Function
Base ScaleBase Scale
Measurement MethodMeasurement Method
Actual SituationActual Situation
Derived Scale
39
“MIERUKA (Visualization)” of IT ProjectsSummary

Quantitative MIERUKA (Visualization) Tools4
Figure 4-3: Examples of measurement analysis data list (quality) from the upstream process volume
Item Number
Knowledge Area
(Main)
Knowledge Area
(Related)
Critical Item User Derived Scale
Base Scales (Measurement Data Used for Derived
Scale on the Left)
Base Scales ID
Scale Collection Source / Method Collector
What to Look For in Derived Scales, and
What They Show Item
Number
Q1 Quality PM, PMO
Requirements definition process standard compliance ratio Standard compliance ratio = Number of compliant items / Number of items for which compliance is necessary
Standards here refer to: - Requirements definition document review plans - Requirements definition document review standards - Requirements definition document format - Requirements definition document entry guidance
(1) Number of standard items which require requirements definition process compliance
(2) Number of standard items complied with by requirements definition process
(1) BQ001 (2) BQ002
(1) Collect from standard list contained in project plan at start of requirements definition
(2) Collect by reviewing management documents at the end of the requirements definition process
Requirements definition member or reviewer
If the standard compliance ratio is low, it may be due to low requirements definition quality, such as insufficient coverage of necessary requirements due to insufficient requirement consideration
Q1
Q2 Quality * PM, PMO
- Number of items pointed out during requirements definition document review
- Number of items pointed out per document page = Number of items pointed out during review / Number of pages
- Number of items pointed out per function point = Number of items pointed out during review / Number of function points
Point out during review any items not compliant with standards
(1) Number of items pointed out during requirements definition document review
(2) Number of requirements definition document pages
(3) Number of function points
(1) BQ003 (2) BQ004 (3) BQ005
(1) (2) Collected from review records after requirements definition process completion
(3) Use RFP and proposal estimate numbers, and numbers from their reviews
PM or reviewer
If the number of issues pointed out, or the number of issues pointed out per document page or per function point are low, review may have been insufficient, leading to low requirements definition document quality
Q2
Q3 Quality * PM, PMO
The following based on review- Number of items pointed out during requirements definition document review which have been revised
- Number of items pointed out during requirements definition document review which have not been revised
Number of unrevised items = Total number of items pointed out during review - Total number of items pointed out which have been revised
- Handling ratio of items pointed out during requirements definition document review
Handling ratio = Total number of items pointed out which have been revised / Total number of items pointed out during review
(Total number of issues pointed out) (1) Number of items pointed out
during requirements definition document review which have been revised
(2) Number of items pointed out during requirements definition document review
(1) BQ006 (2) BQ003
(1) Collected from review records after requirements definition process completion
PM or reviewer
If number of revisions is low, and number of support issues is low, requirements definition document quality is low
Q3
Q4 Quality PM, PMO
The following in the requirements definition document- Presence or absence of analysis of issues pointed out - Presence or absence of countermeasures in response to issue analysis results
(1) Number of times items pointed out during requirements definition document review have been analyzed
(2) Number of countermeasures implemented in response to requirements definition document review point analysis
(1) BQ007 (2) BQ008
(1) Confirm from point analysis report after requirements definition process completion
(2) Collect from work reports after requirements definition completion
PM
If requirements definition document review result point analysis and countermeasures have not been performed, the quality of the requirements definition document may be low
Q4
Q5 Quality PM, PMO Reworking work amount distribution during requirements definition process (Average, distribution, individual, total)
(1) Reworking time during requirements definition process
(1) BQ009
(1) Collect from work records after requirements definition process completion
(1) Collect from review point support report at review time
Requirements definition member or reviewer
If the amount of reworking is high, the review method may be faulty, and the requirements definition quality may be low. The review methods can be reviewed to improve review efficiency and productivity
Q5
40
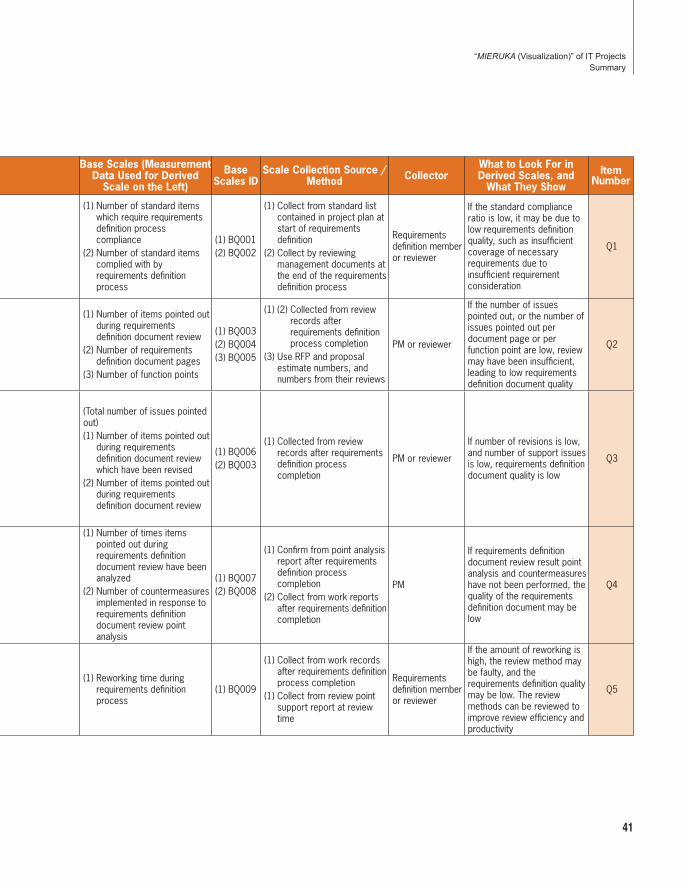
Figure 4-3: Examples of measurement analysis data list (quality) from the upstream process volume
Item Number
Knowledge Area
(Main)
Knowledge Area
(Related)
Critical Item User Derived Scale
Base Scales (Measurement Data Used for Derived
Scale on the Left)
Base Scales ID
Scale Collection Source / Method Collector
What to Look For in Derived Scales, and
What They Show Item
Number
Q1 Quality PM, PMO
Requirements definition process standard compliance ratio Standard compliance ratio = Number of compliant items / Number of items for which compliance is necessary
Standards here refer to: - Requirements definition document review plans - Requirements definition document review standards - Requirements definition document format - Requirements definition document entry guidance
(1) Number of standard items which require requirements definition process compliance
(2) Number of standard items complied with by requirements definition process
(1) BQ001 (2) BQ002
(1) Collect from standard list contained in project plan at start of requirements definition
(2) Collect by reviewing management documents at the end of the requirements definition process
Requirements definition member or reviewer
If the standard compliance ratio is low, it may be due to low requirements definition quality, such as insufficient coverage of necessary requirements due to insufficient requirement consideration
Q1
Q2 Quality * PM, PMO
- Number of items pointed out during requirements definition document review
- Number of items pointed out per document page = Number of items pointed out during review / Number of pages
- Number of items pointed out per function point = Number of items pointed out during review / Number of function points
Point out during review any items not compliant with standards
(1) Number of items pointed out during requirements definition document review
(2) Number of requirements definition document pages
(3) Number of function points
(1) BQ003 (2) BQ004 (3) BQ005
(1) (2) Collected from review records after requirements definition process completion
(3) Use RFP and proposal estimate numbers, and numbers from their reviews
PM or reviewer
If the number of issues pointed out, or the number of issues pointed out per document page or per function point are low, review may have been insufficient, leading to low requirements definition document quality
Q2
Q3 Quality * PM, PMO
The following based on review- Number of items pointed out during requirements definition document review which have been revised
- Number of items pointed out during requirements definition document review which have not been revised
Number of unrevised items = Total number of items pointed out during review - Total number of items pointed out which have been revised
- Handling ratio of items pointed out during requirements definition document review
Handling ratio = Total number of items pointed out which have been revised / Total number of items pointed out during review
(Total number of issues pointed out) (1) Number of items pointed out
during requirements definition document review which have been revised
(2) Number of items pointed out during requirements definition document review
(1) BQ006 (2) BQ003
(1) Collected from review records after requirements definition process completion
PM or reviewer
If number of revisions is low, and number of support issues is low, requirements definition document quality is low
Q3
Q4 Quality PM, PMO
The following in the requirements definition document- Presence or absence of analysis of issues pointed out - Presence or absence of countermeasures in response to issue analysis results
(1) Number of times items pointed out during requirements definition document review have been analyzed
(2) Number of countermeasures implemented in response to requirements definition document review point analysis
(1) BQ007 (2) BQ008
(1) Confirm from point analysis report after requirements definition process completion
(2) Collect from work reports after requirements definition completion
PM
If requirements definition document review result point analysis and countermeasures have not been performed, the quality of the requirements definition document may be low
Q4
Q5 Quality PM, PMO Reworking work amount distribution during requirements definition process (Average, distribution, individual, total)
(1) Reworking time during requirements definition process
(1) BQ009
(1) Collect from work records after requirements definition process completion
(1) Collect from review point support report at review time
Requirements definition member or reviewer
If the amount of reworking is high, the review method may be faulty, and the requirements definition quality may be low. The review methods can be reviewed to improve review efficiency and productivity
Q5
41
“MIERUKA (Visualization)” of IT ProjectsSummary
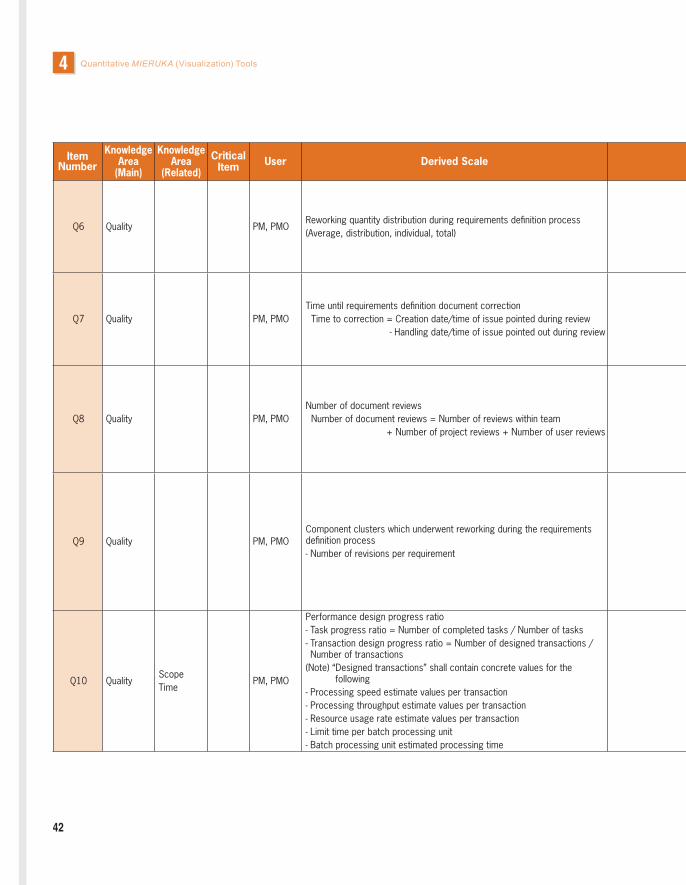
Quantitative MIERUKA (Visualization) Tools4
Item Number
Knowledge Area
(Main)
Knowledge Area
(Related)
Critical Item User Derived Scale
Base Scales (Measurement Data Used for Derived
Scale on the Left)
Base Scales ID
Scale Collection Source / Method Collector
What to Look For in Derived Scales, and
What They Show Item
Number
Q6 Quality PM, PMO Reworking quantity distribution during requirements definition process (Average, distribution, individual, total)
(1) Number of recursions in requirements definition process
(1) BQ010
(1) Collect from work records after requirements definition process completion
(1) Collect from review point support report at review time
Requirements definition member or reviewer
If the amount of reworking is high, the review method may be faulty, and the requirements definition quality may be low. The review methods can be reviewed to improve review efficiency and productivity
Q6
Q7 Quality PM, PMO Time until requirements definition document correction Time to correction = Creation date/time of issue pointed during review
- Handling date/time of issue pointed out during review
(1) Date / time of requirements definition document review point item creation
(2) Date / time of requirements definition document review point item handling
(1) BQ011 (2) BQ012
(1) (2) Collect from review point support report at review time
PM or reviewer
If the restoration time is high, the skill level of requirements definition members may be low. It is also possible that the load placed on them is excessive, such as when they are also performing other duties
Q7
Q8 Quality PM, PMO Number of document reviews Number of document reviews = Number of reviews within team
+ Number of project reviews + Number of user reviews
(1) Number of team reviews of requirements definition document
(2) Number of project reviews of requirements definition document
(3) Number of user reviews of requirements definition document
(1) BQ013 (2) BQ014 (3) BQ015
(1) (2) (3) Collect from review records after requirements definition process completion
PM or reviewer
If the number of reviews is low, the requirements definition quality may be low. Take requirement complexity and difficulty into consideration, and reconfirm the number of reviews
Q8
Q9 Quality PM, PMO Component clusters which underwent reworking during the requirements definition process - Number of revisions per requirement
(1) Number of revisions per requirement (1) BQ016
(1) Collected from component revision records after requirements definition process completion
Requirement definer
Requirements with high revision frequency may have unclear objectives, or objectives which are not appropriate. They may also be subject to change depending on other conditions, and care needs to be paid to them even after the completion of the requirements definition process
Q9
Q10 Quality Scope Time
PM, PMO
Performance design progress ratio - Task progress ratio = Number of completed tasks / Number of tasks - Transaction design progress ratio = Number of designed transactions / Number of transactions
(Note) “ Designed transactions” shall contain concrete values for the following
- Processing speed estimate values per transaction- Processing throughput estimate values per transaction - Resource usage rate estimate values per transaction - Limit time per batch processing unit- Batch processing unit estimated processing time
(1) Number of completed function design related tasks
(2) Number of function design related tasks
(3) Number of designed transactions
(4) Number of transactions
(1) BQ017 (2) BQ018 (3) BQ019 (4) BQ020
(1) (2) Collect from performance design related WBS
(3) (4) Collect from basic design document When a prototype is created and performance base data is acquired from it, use the prototype's results to create an estimate
Basic designer
When the progress ratio is low, performance design may not be sufficient. It is also possible that some performance design problems are preventing the system as a whole from meeting performance requirements
Q10
42

Item Number
Knowledge Area
(Main)
Knowledge Area
(Related)
Critical Item User Derived Scale
Base Scales (Measurement Data Used for Derived
Scale on the Left)
Base Scales ID
Scale Collection Source / Method Collector
What to Look For in Derived Scales, and
What They Show Item
Number
Q6 Quality PM, PMO Reworking quantity distribution during requirements definition process (Average, distribution, individual, total)
(1) Number of recursions in requirements definition process
(1) BQ010
(1) Collect from work records after requirements definition process completion
(1) Collect from review point support report at review time
Requirements definition member or reviewer
If the amount of reworking is high, the review method may be faulty, and the requirements definition quality may be low. The review methods can be reviewed to improve review efficiency and productivity
Q6
Q7 Quality PM, PMO Time until requirements definition document correction Time to correction = Creation date/time of issue pointed during review
- Handling date/time of issue pointed out during review
(1) Date / time of requirements definition document review point item creation
(2) Date / time of requirements definition document review point item handling
(1) BQ011 (2) BQ012
(1) (2) Collect from review point support report at review time
PM or reviewer
If the restoration time is high, the skill level of requirements definition members may be low. It is also possible that the load placed on them is excessive, such as when they are also performing other duties
Q7
Q8 Quality PM, PMO Number of document reviews Number of document reviews = Number of reviews within team
+ Number of project reviews + Number of user reviews
(1) Number of team reviews of requirements definition document
(2) Number of project reviews of requirements definition document
(3) Number of user reviews of requirements definition document
(1) BQ013 (2) BQ014 (3) BQ015
(1) (2) (3) Collect from review records after requirements definition process completion
PM or reviewer
If the number of reviews is low, the requirements definition quality may be low. Take requirement complexity and difficulty into consideration, and reconfirm the number of reviews
Q8
Q9 Quality PM, PMO Component clusters which underwent reworking during the requirements definition process - Number of revisions per requirement
(1) Number of revisions per requirement (1) BQ016
(1) Collected from component revision records after requirements definition process completion
Requirement definer
Requirements with high revision frequency may have unclear objectives, or objectives which are not appropriate. They may also be subject to change depending on other conditions, and care needs to be paid to them even after the completion of the requirements definition process
Q9
Q10 Quality Scope Time
PM, PMO
Performance design progress ratio - Task progress ratio = Number of completed tasks / Number of tasks - Transaction design progress ratio = Number of designed transactions / Number of transactions
(Note) “ Designed transactions” shall contain concrete values for the following
- Processing speed estimate values per transaction- Processing throughput estimate values per transaction - Resource usage rate estimate values per transaction - Limit time per batch processing unit- Batch processing unit estimated processing time
(1) Number of completed function design related tasks
(2) Number of function design related tasks
(3) Number of designed transactions
(4) Number of transactions
(1) BQ017 (2) BQ018 (3) BQ019 (4) BQ020
(1) (2) Collect from performance design related WBS
(3) (4) Collect from basic design document When a prototype is created and performance base data is acquired from it, use the prototype's results to create an estimate
Basic designer
When the progress ratio is low, performance design may not be sufficient. It is also possible that some performance design problems are preventing the system as a whole from meeting performance requirements
Q10
43
“MIERUKA (Visualization)” of IT ProjectsSummary
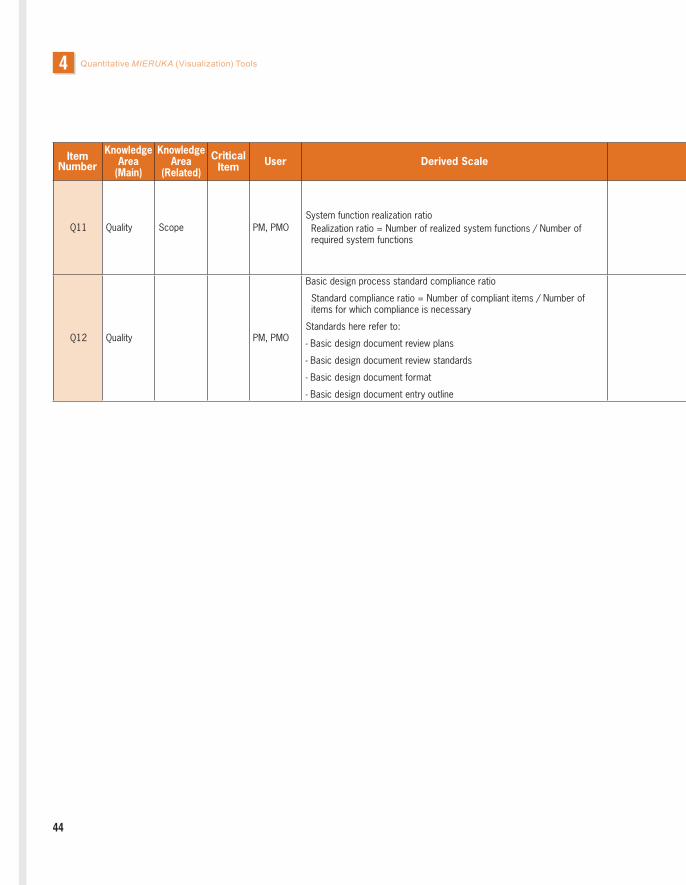
Quantitative MIERUKA (Visualization) Tools4
Item Number
Knowledge Area
(Main)
Knowledge Area
(Related)
Critical Item User Derived Scale
Base Scales (Measurement Data Used for Derived
Scale on the Left)
Base Scales ID
Scale Collection Source / Method Collector
What to Look For in Derived Scales, and
What They Show Item
Number
Q11 Quality Scope PM, PMO System function realization ratio Realization ratio = Number of realized system functions / Number of required system functions
(1) Number of required system functions
(2) Number of realized system functions
(1) BQ021 (2) BQ022
(1) Collect from requirements definition documents after requirements definition process completion
(2) Collect from design documents at regular intervals during and after the basic design process
(1) Requirement definer
(2) Basic designer
If the realization ratio is lower than 1, the required functions may not be realizable. Coordination with the requesting party on a functional level is required.
Q11
Q12 Quality PM, PMO
Basic design process standard compliance ratio
Standard compliance ratio = Number of compliant items / Number of items for which compliance is necessary
Standards here refer to:
- Basic design document review plans
- Basic design document review standards
- Basic design document format
- Basic design document entry outline
(1) Number of standard items requiring basic design process compliance
(2) Number of standard items with which basic design process is compliant
(1) BQ023
(2) BQ024
(1) Collect from standard list contained in project plan at start of basic design
(2) Collect through review of management documents at regular intervals during and after the basic design process
Basic designer or reviewer
If the standard compliance ratio is low, due consideration may not have been paid, and the quality of the basic design document may be low
Q12
44
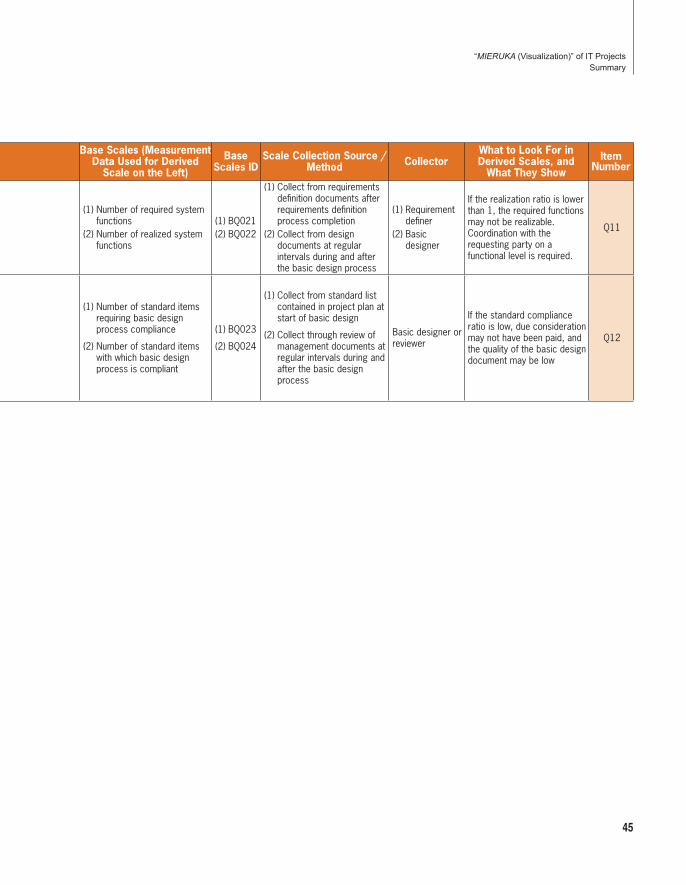
Item Number
Knowledge Area
(Main)
Knowledge Area
(Related)
Critical Item User Derived Scale
Base Scales (Measurement Data Used for Derived
Scale on the Left)
Base Scales ID
Scale Collection Source / Method Collector
What to Look For in Derived Scales, and
What They Show Item
Number
Q11 Quality Scope PM, PMO System function realization ratio Realization ratio = Number of realized system functions / Number of required system functions
(1) Number of required system functions
(2) Number of realized system functions
(1) BQ021 (2) BQ022
(1) Collect from requirements definition documents after requirements definition process completion
(2) Collect from design documents at regular intervals during and after the basic design process
(1) Requirement definer
(2) Basic designer
If the realization ratio is lower than 1, the required functions may not be realizable. Coordination with the requesting party on a functional level is required.
Q11
Q12 Quality PM, PMO
Basic design process standard compliance ratio
Standard compliance ratio = Number of compliant items / Number of items for which compliance is necessary
Standards here refer to:
- Basic design document review plans
- Basic design document review standards
- Basic design document format
- Basic design document entry outline
(1) Number of standard items requiring basic design process compliance
(2) Number of standard items with which basic design process is compliant
(1) BQ023
(2) BQ024
(1) Collect from standard list contained in project plan at start of basic design
(2) Collect through review of management documents at regular intervals during and after the basic design process
Basic designer or reviewer
If the standard compliance ratio is low, due consideration may not have been paid, and the quality of the basic design document may be low
Q12
45
“MIERUKA (Visualization)” of IT ProjectsSummary
Quantitative MIERUKA (Visualization) Tools4
An example of the relationship between a derived scale and base scales when measuring review work progress is shown in Figure 4-2. When looking at the review progress ratio, a comparison of the amount of actual review time to the planned amount of review time, the review progress ratio is defined with the following formula.
Review progress ratio = Actual review time / Planned review time
In this case, both “actual review time” and “planned review time” are base scales, and are calculated using the review times contained in “review record forms” and “review plan documents,” respectively. The “review progress ratio” is a derived scale, calculated (derived) from the base scales of “actual review time” and “planned review time.” The review progress ratio will be indicator which can be used when making judgments.
Quantitative project measurement can be used to visualize to what degree plans have been implemented. This can further be used to implement countermeasures.
The measurement analysis data list “measurement objectives” make it possible to select corresponding necessary derived scales, and show which base scales should be measured. The contents of the “What to Look for in Derived Scales, and What They Show” item make it possible to look at the values and trends of the derived scale in order to determine potential problems in the next process phase, and their causes. In this way, quantitative MIERUKA speeds up the process, from measurement to cause identification.
However, measuring each and all of the items set forth in the measurement analysis data list would result in a significant project operation management burden, and is not practical. As such, “critical items” for which measurement is essential are marked with “ * ” on the measurement analysis data list. Certainly, focusing on only a single derivation criterion might result in incorrect assessment of problems or risks. In order to accurately assess risks, a qualitative, integrated approach to project status evaluation, using multiple criteria, is necessary.
Figure 4-3 shows an example of an upstream process measurement analysis data list. There are no base scales lists for the midstream or downstream processes, so the measurement analysis data list (measurement items list) does not have items for “base scales and base scales ID,” “base scales collection source and method,” or “base scales collector.”
46

4.1.2 Base scales List
Base scales are the measurement items used in actual data measurement. The base scales list contains base scales units, collection processes / period / timing, and collectors for each knowledge area.
The base scales list can be used during quantitative MIERUKA to rapidly create measurement plans appropriate to the project.
Use the base scales list to determine: (1) measured products (granularity: per subsystem and per function), (2) measured process (requirements definition process, basic design process, etc.), (3) measurement period (monthly, weekly, daily), (4) measurement timing (milestones, progress meetings, etc.), and (5) collectors (project managers, PMOs, quality management managers, etc.).
Quantified measurement requires that the derived scale to be used be determined in advance, as well as the base scales related items from (1) to (5) above, and the collection of measurement data. Project measurement plan creation is accomplished through the creation of base scales list that are appropriate to the project.
Analyzing collected quantitative data has the benefit of indicating measures for the improvement of MIERUKA methodology.
Figure 4-4 shows an example of a base scales list.
47
“MIERUKA (Visualization)” of IT ProjectsSummary
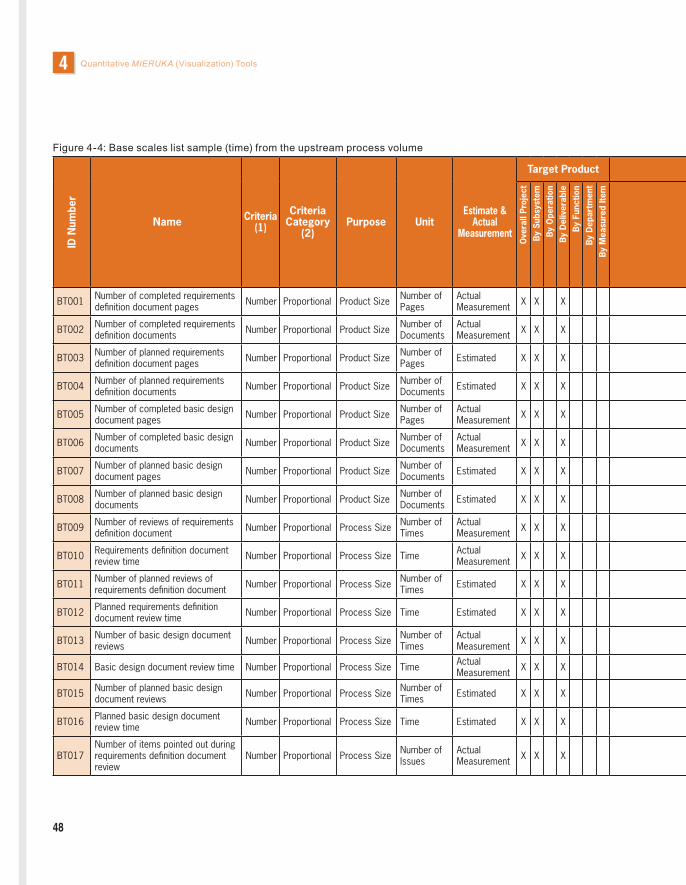
Quantitative MIERUKA (Visualization) Tools4
Figure 4-4: Base scales list sample (time) from the upstream process volume
ID N
umbe
r
Name Criteria (1)
Criteria Category
(2) Purpose Unit
Estimate & Actual
Measurement
Target Product Target Process Target Period
Target Timing orManagement Process Collector
ID N
umbe
r
Ove
rall
Proj
ect
By
Subs
yste
m
By
Ope
ratio
n B
y D
eliv
erab
leB
y Fu
nctio
n B
y D
epar
tmen
t B
y M
easu
red
Item
Each
Pro
cess
(Upo
n C
ompl
etio
n)
Each
Pha
se (U
pon
Com
plet
ion)
Ea
ch W
ork
Pack
age
Estim
ate
Ord
er
Plan
Pr
ojec
t Pla
n R
evie
w
Req
uire
men
ts D
efini
tion
Bas
ic D
esig
n Fu
nctio
n D
esig
n D
etai
led
Des
ign
Soft
war
e C
odin
g U
nit T
est
Inte
grat
ion
Test
Syst
em T
est
Ope
ratio
n Te
st
Veri
ficat
ion
Cus
tom
er A
ccep
tanc
e In
spec
tion
Targ
et P
roce
ss S
tart
Ta
rget
Pro
cess
End
M
onth
ly
Wee
kly
Dai
ly
Estim
ate
Subm
issi
on
Ord
er F
inal
izat
ion
Proj
ect C
ompl
etio
n (A
fter
) M
ilest
one
Prog
ress
Mee
ting
Proj
ect P
lan
Esta
blis
hmen
t As
sess
men
t Tr
aini
ng Im
plem
enta
tion
PM /
PL
PMO
Q
ualit
y As
sura
nce
&
Man
agem
ent (
QA
& Q
M)
Rev
iew
er &
Tar
get
Del
iver
able
Cre
ator
Tech
nica
l Sup
port
BT001 Number of completed requirements definition document pages Number Proportional Product Size Number of
Pages Actual Measurement X X X X X X X BT001
BT002 Number of completed requirements definition documents Number Proportional Product Size Number of
Documents Actual Measurement X X X X X X X BT002
BT003 Number of planned requirements definition document pages Number Proportional Product Size Number of
Pages Estimated X X X X X X X X X BT003
BT004 Number of planned requirements definition documents Number Proportional Product Size Number of
Documents Estimated X X X X X X X X X BT004
BT005 Number of completed basic design document pages Number Proportional Product Size Number of
Pages Actual Measurement X X X X X X X BT005
BT006 Number of completed basic design documents Number Proportional Product Size Number of
Documents Actual Measurement X X X X X X X BT006
BT007 Number of planned basic design document pages Number Proportional Product Size Number of
Documents Estimated X X X X X X X X X BT007
BT008 Number of planned basic design documents Number Proportional Product Size Number of
Documents Estimated X X X X X X X X X BT008
BT009 Number of reviews of requirements definition document Number Proportional Process Size Number of
Times Actual Measurement X X X X X X X BT009
BT010 Requirements definition document review time Number Proportional Process Size Time Actual
Measurement X X X X X X X BT010
BT011 Number of planned reviews of requirements definition document Number Proportional Process Size Number of
Times Estimated X X X X X X X X X BT011
BT012 Planned requirements definition document review time Number Proportional Process Size Time Estimated X X X X X X X X X BT012
BT013 Number of basic design document reviews Number Proportional Process Size Number of
Times Actual Measurement X X X X X X X BT013
BT014 Basic design document review time Number Proportional Process Size Time Actual Measurement X X X X X X X BT014
BT015 Number of planned basic design document reviews Number Proportional Process Size Number of
Times Estimated X X X X X X X X X BT015
BT016 Planned basic design document review time Number Proportional Process Size Time Estimated X X X X X X X X X BT016
BT017 Number of items pointed out during requirements definition document review
Number Proportional Process Size Number of Issues
Actual Measurement X X X X X X X BT017
48

Figure 4-4: Base scales list sample (time) from the upstream process volume
ID N
umbe
r
Name Criteria (1)
Criteria Category
(2) Purpose Unit
Estimate & Actual
Measurement
Target Product Target Process Target Period
Target Timing orManagement Process Collector
ID N
umbe
r
Ove
rall
Proj
ect
By
Subs
yste
m
By
Ope
ratio
n B
y D
eliv
erab
leB
y Fu
nctio
n B
y D
epar
tmen
t B
y M
easu
red
Item
Each
Pro
cess
(Upo
n C
ompl
etio
n)
Each
Pha
se (U
pon
Com
plet
ion)
Ea
ch W
ork
Pack
age
Estim
ate
Ord
er
Plan
Pr
ojec
t Pla
n R
evie
w
Req
uire
men
ts D
efini
tion
Bas
ic D
esig
n Fu
nctio
n D
esig
n D
etai
led
Des
ign
Soft
war
e C
odin
g U
nit T
est
Inte
grat
ion
Test
Syst
em T
est
Ope
ratio
n Te
st
Veri
ficat
ion
Cus
tom
er A
ccep
tanc
e In
spec
tion
Targ
et P
roce
ss S
tart
Ta
rget
Pro
cess
End
M
onth
ly
Wee
kly
Dai
ly
Estim
ate
Subm
issi
on
Ord
er F
inal
izat
ion
Proj
ect C
ompl
etio
n (A
fter
) M
ilest
one
Prog
ress
Mee
ting
Proj
ect P
lan
Esta
blis
hmen
t As
sess
men
t Tr
aini
ng Im
plem
enta
tion
PM /
PL
PMO
Q
ualit
y As
sura
nce
&
Man
agem
ent (
QA
& Q
M)
Rev
iew
er &
Tar
get
Del
iver
able
Cre
ator
Tech
nica
l Sup
port
BT001 Number of completed requirements definition document pages Number Proportional Product Size Number of
Pages Actual Measurement X X X X X X X BT001
BT002 Number of completed requirements definition documents Number Proportional Product Size Number of
Documents Actual Measurement X X X X X X X BT002
BT003 Number of planned requirements definition document pages Number Proportional Product Size Number of
Pages Estimated X X X X X X X X X BT003
BT004 Number of planned requirements definition documents Number Proportional Product Size Number of
Documents Estimated X X X X X X X X X BT004
BT005 Number of completed basic design document pages Number Proportional Product Size Number of
Pages Actual Measurement X X X X X X X BT005
BT006 Number of completed basic design documents Number Proportional Product Size Number of
Documents Actual Measurement X X X X X X X BT006
BT007 Number of planned basic design document pages Number Proportional Product Size Number of
Documents Estimated X X X X X X X X X BT007
BT008 Number of planned basic design documents Number Proportional Product Size Number of
Documents Estimated X X X X X X X X X BT008
BT009 Number of reviews of requirements definition document Number Proportional Process Size Number of
Times Actual Measurement X X X X X X X BT009
BT010 Requirements definition document review time Number Proportional Process Size Time Actual
Measurement X X X X X X X BT010
BT011 Number of planned reviews of requirements definition document Number Proportional Process Size Number of
Times Estimated X X X X X X X X X BT011
BT012 Planned requirements definition document review time Number Proportional Process Size Time Estimated X X X X X X X X X BT012
BT013 Number of basic design document reviews Number Proportional Process Size Number of
Times Actual Measurement X X X X X X X BT013
BT014 Basic design document review time Number Proportional Process Size Time Actual Measurement X X X X X X X BT014
BT015 Number of planned basic design document reviews Number Proportional Process Size Number of
Times Estimated X X X X X X X X X BT015
BT016 Planned basic design document review time Number Proportional Process Size Time Estimated X X X X X X X X X BT016
BT017 Number of items pointed out during requirements definition document review
Number Proportional Process Size Number of Issues
Actual Measurement X X X X X X X BT017
49
“MIERUKA (Visualization)” of IT ProjectsSummary

Quantitative MIERUKA (Visualization) Tools4ID
Num
ber
Name Criteria (1)
Criteria Category
(2) Purpose Unit
Estimate & Actual
Measurement
Target Product Target Process Target Period
Target Timing orManagement Process Collector
ID N
umbe
r
Ove
rall
Proj
ect
By
Subs
yste
m
By
Ope
ratio
n B
y D
eliv
erab
leB
y Fu
nctio
n B
y D
epar
tmen
t B
y M
easu
red
Item
Each
Pro
cess
(Upo
n C
ompl
etio
n)
Each
Pha
se (U
pon
Com
plet
ion)
Ea
ch W
ork
Pack
age
Estim
ate
Ord
er
Plan
Pr
ojec
t Pla
n R
evie
w
Req
uire
men
ts D
efini
tion
Bas
ic D
esig
n Fu
nctio
n D
esig
n D
etai
led
Des
ign
Soft
war
e C
odin
g U
nit T
est
Inte
grat
ion
Test
Syst
em T
est
Ope
ratio
n Te
st
Veri
ficat
ion
Cus
tom
er A
ccep
tanc
e In
spec
tion
Targ
et P
roce
ss S
tart
Ta
rget
Pro
cess
End
M
onth
ly
Wee
kly
Dai
ly
Estim
ate
Subm
issi
on
Ord
er F
inal
izat
ion
Proj
ect C
ompl
etio
n (A
fter
) M
ilest
one
Prog
ress
Mee
ting
Proj
ect P
lan
Esta
blis
hmen
t As
sess
men
t Tr
aini
ng Im
plem
enta
tion
PM /
PL
PMO
Q
ualit
y As
sura
nce
&
Man
agem
ent (
QA
& Q
M)
Rev
iew
er &
Tar
get
Del
iver
able
Cre
ator
Tech
nica
l Sup
port
BT018 Number of items pointed out during requirements definition document review that have been handled
Number Proportional Process Size Number of Issues
Actual Measurement X X X X X X X BT018
BT019 Number of items pointed out during basic design document review Number Proportional Process Size Number of
Issues Actual Measurement X X X X X X X BT019
BT020 Number of items pointed out during basic design document review that have been handled
Number Proportional Process Size Number of Issues
Actual Measurement X X X X X X X BT020
BT021 Number of requirement changes Number Proportional Process Size Number of Issues
Actual Measurement X X X X X X X BT021
BT022 Number of completed requirements definition document revisions due to requirement changes
Number Proportional Process Size Number of Issues
Actual Measurement X X X X X X X BT022
BT023 Number of pages of requirements definition document revisions due to requirement changes
Number Proportional Process Size Number of Issues
Actual Measurement X X X X X X X BT023
BT024 Number of function changes Number Proportional Process Size Number of Issues
Actual Measurement X X X X X X X BT024
BT025 Number of completed basic design document revisions due to function changes
Number Proportional Process Size Number of Issues
Actual Measurement X X X X X X X BT025
BT026 Number of pages of basic design document revisions due to function changes
Number Proportional Process Size Actual Measurement X X X X X X X BT026
BT027 Whether or not critical paths have been specified Attribute Number of
Pages Actual Measurement X X X X X X X X X X BT027
BT028 Number of documents above created, and number of reviews Number Proportional Product Size Number of
Documents Actual Measurement X X X X X X X X BT028
BT029 Whether or not supervisor has been assigned Attribute Actual
Measurement X X X X X X X X X X BT029
50

ID N
umbe
r
Name Criteria (1)
Criteria Category
(2) Purpose Unit
Estimate & Actual
Measurement
Target Product Target Process Target Period
Target Timing orManagement Process Collector
ID N
umbe
r
Ove
rall
Proj
ect
By
Subs
yste
m
By
Ope
ratio
n B
y D
eliv
erab
leB
y Fu
nctio
n B
y D
epar
tmen
t B
y M
easu
red
Item
Each
Pro
cess
(Upo
n C
ompl
etio
n)
Each
Pha
se (U
pon
Com
plet
ion)
Ea
ch W
ork
Pack
age
Estim
ate
Ord
er
Plan
Pr
ojec
t Pla
n R
evie
w
Req
uire
men
ts D
efini
tion
Bas
ic D
esig
n Fu
nctio
n D
esig
n D
etai
led
Des
ign
Soft
war
e C
odin
g U
nit T
est
Inte
grat
ion
Test
Syst
em T
est
Ope
ratio
n Te
st
Veri
ficat
ion
Cus
tom
er A
ccep
tanc
e In
spec
tion
Targ
et P
roce
ss S
tart
Ta
rget
Pro
cess
End
M
onth
ly
Wee
kly
Dai
ly
Estim
ate
Subm
issi
on
Ord
er F
inal
izat
ion
Proj
ect C
ompl
etio
n (A
fter
) M
ilest
one
Prog
ress
Mee
ting
Proj
ect P
lan
Esta
blis
hmen
t As
sess
men
t Tr
aini
ng Im
plem
enta
tion
PM /
PL
PMO
Q
ualit
y As
sura
nce
&
Man
agem
ent (
QA
& Q
M)
Rev
iew
er &
Tar
get
Del
iver
able
Cre
ator
Tech
nica
l Sup
port
BT018 Number of items pointed out during requirements definition document review that have been handled
Number Proportional Process Size Number of Issues
Actual Measurement X X X X X X X BT018
BT019 Number of items pointed out during basic design document review Number Proportional Process Size Number of
Issues Actual Measurement X X X X X X X BT019
BT020 Number of items pointed out during basic design document review that have been handled
Number Proportional Process Size Number of Issues
Actual Measurement X X X X X X X BT020
BT021 Number of requirement changes Number Proportional Process Size Number of Issues
Actual Measurement X X X X X X X BT021
BT022 Number of completed requirements definition document revisions due to requirement changes
Number Proportional Process Size Number of Issues
Actual Measurement X X X X X X X BT022
BT023 Number of pages of requirements definition document revisions due to requirement changes
Number Proportional Process Size Number of Issues
Actual Measurement X X X X X X X BT023
BT024 Number of function changes Number Proportional Process Size Number of Issues
Actual Measurement X X X X X X X BT024
BT025 Number of completed basic design document revisions due to function changes
Number Proportional Process Size Number of Issues
Actual Measurement X X X X X X X BT025
BT026 Number of pages of basic design document revisions due to function changes
Number Proportional Process Size Actual Measurement X X X X X X X BT026
BT027 Whether or not critical paths have been specified Attribute Number of
Pages Actual Measurement X X X X X X X X X X BT027
BT028 Number of documents above created, and number of reviews Number Proportional Product Size Number of
Documents Actual Measurement X X X X X X X X BT028
BT029 Whether or not supervisor has been assigned Attribute Actual
Measurement X X X X X X X X X X BT029
51
“MIERUKA (Visualization)” of IT ProjectsSummary

Quantitative MIERUKA (Visualization) Tools4
4.2
MIERUKA (Visualization) Process Using Tools
Figure 4-5 shows the process of using the measurement items list tools in MIERUKA.First, consider how specialist teams, such as project managers or PMOs, can quantitatively measure
the project status. Measurement places a heavy burden on project members, so deliberation is needed regarding whether or not measurement is to be performed, based on the project status, and, if it is to be performed, it’s scope and degree.
Next, in “Understand items to be measured and items already being measured,” investigate which measurement items are planned, and which are already measured. Each management record contains the measurement items which are necessary.
During the third phase, “Select necessary measurement items,” consider and determine which items, in addition to the planned and actually implemented measurement items, should be measured, using the measurement analysis data list.
During the “Create measurement plan” phase, determine the processes to be measured, the measurement period, the measurement timing, and who will collect the measurement data, and create a base scales list.
During the “Start measurement and evaluate” phase, prepare management records and implement automated measurement tools. After clarifying measurement objectives and operation rules, ensure that this information is thoroughly understood by project members. Once measurement has started, perform data collection, analysis, and evaluation in accordance with the frequency and periods determined in advance.
“Appendix 1. Upstream Process, Midstream Process, and Downstream Process Derived Scale List” shows the derived scale (measurement items) for each knowledge area and each measurable process in the form of a measurement items list in the appendices of the upstream process, midstream process, and downstream process guides. Figure 4-6 shows a partial selection. Critical measurement items for each process are designated with a “B” in the derived scale list. Critical measurement item conformant items are marked with a “C” for the upstream process.
52

Figure 4-5: Overall MIERUKA (visualization) process using measurement items lists
Understand items to be measured and items already being measured
Specialist team considers how to perform quantitative measurement
Select necessary measurement items*1
Create measurement plan*2
Start measurement and evaluate
*1 Use measurement analysis data list *2 Use measurement analysis data list and base scales list
53
“MIERUKA (Visualization)” of IT ProjectsSummary

Quantitative MIERUKA (Visualization) Tools4
Figure 4-6: Derived scale list example
: Upstream A: Measurement Item : Midstream B: Critical Measurement Item C: Critical Measurement Item Conformant Item
Kno
wle
dge
Area
No. Measurement Objectives Derived Scale
Process
Ups
trea
m
Mid
stre
am
Down
stre
am
Scope Up S1
From all requirements- Compare with planning stage scale to determine the requirement scale and degree of change
- Understand the scale and degree of change of pending requirements
- Number of requirements during the planning phase- Transition in number of requirements- Transition in number of finalized requirements- Transition in number of pending requirements Number of pending requirements = Total number of requirements - Total number of finalized requirements
B
Scope Up S2
From the perspective of requirement importance- Understand the scale and degree of change of requirements
- Understand the scale and degree of change of pending requirements
Transition in number of requirements by importance- Transition in number of requirements by importance- Transition in number of finalized requirements by importance- Transition in number of pending requirements by importance Number of pending requirements by importance = Total number of requirements by importance - Total number of finalized requirements by importance
A
Scope Up S3
From the perspective of requirement priority- Understand the scale and degree of change of requirements
- Understand the scale and degree of change of pending requirements
Transition in number of requirements by priority- Transition in number of requirements by priority- Transition in number of finalized requirements by priority- Transition in number of pending requirements by priority Number of pending requirements by priority = Total number of requirements by priority - Total number of finalized requirements by priority
A
Scope Up S4
From the perspective of requirement content change- Understand the scale and degree of change of requirement changes
- Understand requirement change support status
- Transition in number of requirement changes- Transition in number of handled changes- Transition in number of pending changes Number of pending changes = Total number of requirement changes - Total number of requirement changes which have been
handled
C
Scope Up S5
From total number of functions- Compare with planning stage scale to determine the function scale and degree of change
- Understand the scale and degree of change of pending functions
- Number of requirements during the planning phase- Transition in number of functions- Transition in number of finalized functions- Transition in number of pending functions Number of pending functions = Total number of functions - Total number of finalized functions
C B
54
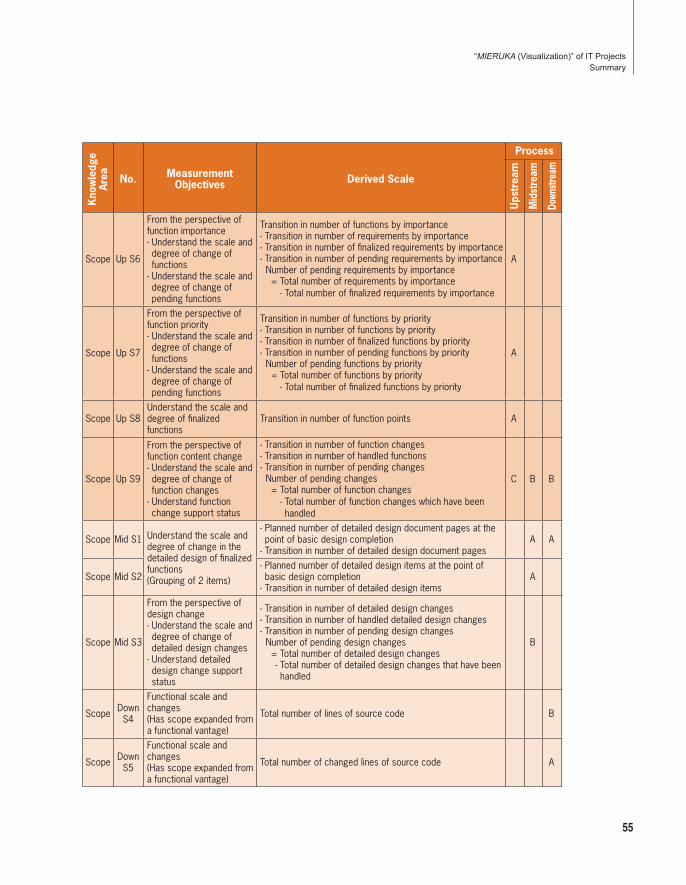
Kno
wle
dge
Area
No. Measurement Objectives Derived Scale
Process
Ups
trea
m
Mid
stre
am
Down
stre
am
Scope Up S6
From the perspective of function importance- Understand the scale and degree of change of functions
- Understand the scale and degree of change of pending functions
Transition in number of functions by importance- Transition in number of requirements by importance- Transition in number of finalized requirements by importance- Transition in number of pending requirements by importance Number of pending requirements by importance = Total number of requirements by importance - Total number of finalized requirements by importance
A
Scope Up S7
From the perspective of function priority- Understand the scale and degree of change of functions
- Understand the scale and degree of change of pending functions
Transition in number of functions by priority- Transition in number of functions by priority- Transition in number of finalized functions by priority- Transition in number of pending functions by priority Number of pending functions by priority = Total number of functions by priority - Total number of finalized functions by priority
A
Scope Up S8 Understand the scale and degree of finalized functions
Transition in number of function points A
Scope Up S9
From the perspective of function content change- Understand the scale and degree of change of function changes
- Understand function change support status
- Transition in number of function changes- Transition in number of handled functions- Transition in number of pending changes Number of pending changes = Total number of function changes - Total number of function changes which have been
handled
C B B
Scope Mid S1 Understand the scale and degree of change in the detailed design of finalized functions(Grouping of 2 items)
- Planned number of detailed design document pages at the point of basic design completion
- Transition in number of detailed design document pagesA A
Scope Mid S2 - Planned number of detailed design items at the point of basic design completion
- Transition in number of detailed design itemsA
Scope Mid S3
From the perspective of design change- Understand the scale and degree of change of detailed design changes
- Understand detailed design change support status
- Transition in number of detailed design changes- Transition in number of handled detailed design changes- Transition in number of pending design changes Number of pending design changes = Total number of detailed design changes - Total number of detailed design changes that have been
handled
B
Scope Down S4
Functional scale and changes(Has scope expanded from a functional vantage)
Total number of lines of source code B
Scope Down S5
Functional scale and changes(Has scope expanded from a functional vantage)
Total number of changed lines of source code A
55
“MIERUKA (Visualization)” of IT ProjectsSummary

Correlating various information and forming an opinion based on them is a natural function of the human mind. However, due to the sheer amount of input information to be correlated, it is often difficult to define and express the relationships between them. As such, the ability to merge multiple information and make judgments based on them has taken the form of “experience and intuition,” and has been reliant on the abilities of individuals. Nonetheless, there must be some sort of bases and principles behind experience and intuition. If one is aware of the tips and know-how involved in selecting information, it should be possible to lower that hurdle significantly.
The “integrated MIERUKA (visualization) approach” described in this text relates the data obtained via the qualitative and quantitative approaches and past project problem cases in order to recognize, from a wider perspective, what kinds of problems are occurring in the project, and what will occur in the future.
Figure 5-1 shows the relationship between the integrated approach and qualitative / quantitative approaches.
5Chapter
Integrated MIERUKA (Visualization) Tools
56

Figure 5-1: Integrated approach positioning
Cou
nter
mea
sure
*Dominant Item: Dominant factor in determining the success or failure of a project
Measurement Analysis Data (Automated data collection analysis tool : EPM)
Birds-Eye View Self-Check Sheet / Interview Sheet
Summary of Problem Projects
Quantitative MIERUKA (Visualization) Approach
Categorized Item Table
Comprehensive judgment mechanism achieved through association with the “MIERUKA” approach
“MIERUKA” of risks through quantitative information measurement in accordance with measurement analysis items
“MIERUKA” of dominant items* from birds-eye view
Place / Occasion of
Actual Practice (Project)
Comprehensive Approach
Comprehensive Approach
Qualitative MIERUKA (Visualization) Approach
“MIERUKA” of list problems using check items
5.1
MIERUKA (Visualization) Using the Categorized Item Table
The integrated approach uses the categorized item table tool to analyze information and make a situation judgment.
During the upstream process, interview sheets, the summary of problem projects, and measurement analysis data are combined to identify high risks that may surface later, and to determine what measures should be taken next. By tying these risks to the summary of problem projects, past project cases can be used as support to prevent the project from stumbling.
As in the upstream process, tools used in the midstream process are also interview sheets, the summary of problem projects, and measurement analysis data. The midstream process versions of
57
“MIERUKA (Visualization)” of IT ProjectsSummary
Integrated MIERUKA (Visualization) Tools5
these tools are used. The midstream process consists of taking conceptual stage requirements and making them a reality. In order to prevent problems from erupting during the downstream process, the midstream process categorized item table is used to manage risks carried over from the upstream process, and to check, in a timely manner, whether defects have been built into the product. If they have, countermeasures are enacted to minimize the likelihood of problems emerging during the downstream process.
If there are any problems in the downstream process, they have already been internalized in the product. During this stage, the categorized item table is used to analyze the project’s current status in order to determine the root of the problems, and enact pinpointed, effective countermeasures. The downstream process categorized item table is called a “case classification table,” which is somewhat similar to the medical process of analyzing symptoms in order to identify an illness.
Figure 5-2 shows the tools used in upstream, midstream, and downstream processes.
58

Figure 5-2: Tools used in the integrated approach
59
“MIERUKA (Visualization)” of IT ProjectsSummary

Integrated MIERUKA (Visualization) Tools5
5.2
Customizing and Using the Categorized Item Table
The categorized item table shows relationships based on collected project cases, and serves as a tool for pointing out resolutions. The categorized item table can be used as-is. However, as different industries and business categories have their own past case experience and perspectives, integrating them can produce a tool even more custom tailored for user projects.
The structure of categorized item tables is simple, making it easy to add project case and perspectives appropriate to the workplace, and to remove perspectives which do not match users’ business processes, thereby increasing the reliability of the information produced by the tool.
There are various methods for understanding risks and problems using this information. Figure 5-3 shows a representative example of tool usage.
Only one use case is presented as an example, but there are as many ways to use the tools as there are tool combinations. It is important to note, though, that the issue is not the number of methods used, but how a project can be understood from an integrated perspective by combining different information, such as qualitative information, quantitative information, and know-how (past project cases). Merely collecting project information is not enough. This information only becomes useful when one considers what this information provides.
Figure 5-3 Representative example of categorized item table use
Upstream Process Midstream Process Downstream Process
Usage Approach 1
Interview Sheet
Risk Categorized Item Table
Summary of Problem Projects
Interview Sheet
Empirical Inspection Categorized Item Table
Summary of Problem Projects
Interview Sheet
Case Classification Table
Summary of Problem Projects
Usage Approach 2
Interview Sheet
Risk Categorized Item Table
Measurement Analysis Data
Interview Sheet
Empirical Inspection Categorized Item Table
Measurement Analysis Data
Interview Sheet
Case Classification Table
Measurement Items List
Usage Approach 3
Summary of Problem Projects
Risk Categorized Item Table
Interview Sheet
Summary of Problem Projects
Empirical Inspection Categorized Item Table
Interview Sheet
Measurement Items List
Case Classification Table
Interview Sheet
60
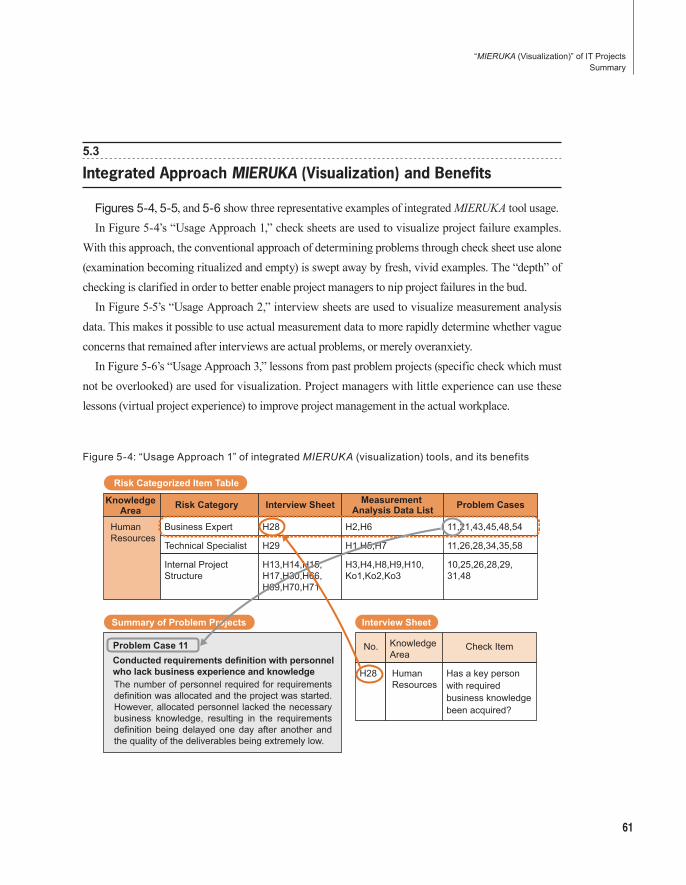
5.3
Integrated Approach MIERUKA (Visualization) and Benefits
Figures 5-4, 5-5, and 5-6 show three representative examples of integrated MIERUKA tool usage.In Figure 5-4’s “Usage Approach 1,” check sheets are used to visualize project failure examples.
With this approach, the conventional approach of determining problems through check sheet use alone (examination becoming ritualized and empty) is swept away by fresh, vivid examples. The “depth” of checking is clarified in order to better enable project managers to nip project failures in the bud.
In Figure 5-5’s “Usage Approach 2,” interview sheets are used to visualize measurement analysis data. This makes it possible to use actual measurement data to more rapidly determine whether vague concerns that remained after interviews are actual problems, or merely overanxiety.
In Figure 5-6’s “Usage Approach 3,” lessons from past problem projects (specific check which must not be overlooked) are used for visualization. Project managers with little experience can use these lessons (virtual project experience) to improve project management in the actual workplace.
Figure 5-4: “Usage Approach 1” of integrated MIERUKA (visualization) tools, and its benefits
Risk Categorized Item Table
Interview Sheet Summary of Problem Projects
Knowledge Area Risk Category Interview Sheet Measurement
Analysis Data List Problem Cases
No. Knowledge Area
Check Item
H28 Human Resources
Has a key person with required business knowledge been acquired?
Human Resources
Business Expert H28 H2,H6 11,21,43,45,48,54
Technical Specialist H29 H1,H5,H7 11,26,28,34,35,58
Internal Project Structure
H13,H14,H15,H17,H30,H66,H69,H70,H71
H3,H4,H8,H9,H10,Ko1,Ko2,Ko3
10,25,26,28,29,31,48
Conducted requirements definition with personnel who lack business experience and knowledge
Problem Case 11
The number of personnel required for requirements definition was allocated and the project was started. However, allocated personnel lacked the necessary business knowledge, resulting in the requirements definition being delayed one day after another and the quality of the deliverables being extremely low.
61
“MIERUKA (Visualization)” of IT ProjectsSummary
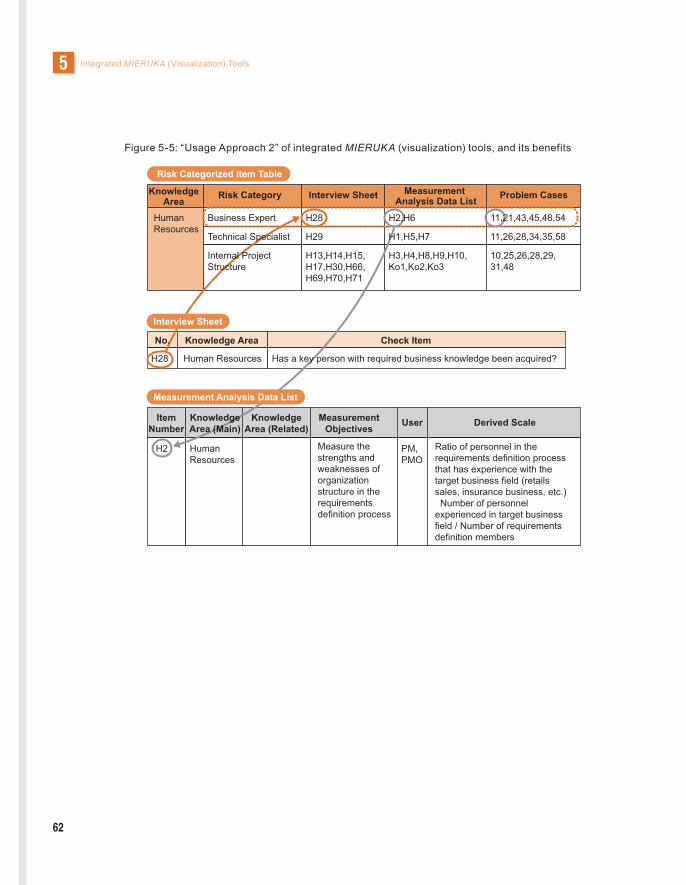
Integrated MIERUKA (Visualization) Tools5
Figure 5-5: “Usage Approach 2” of integrated MIERUKA (visualization) tools, and its benefits
Item Number
Measurement Objectives User
H2 PM,PMO
Derived Scale
Ratio of personnel in the requirements definition process that has experience with the target business field (retails sales, insurance business, etc.) Number of personnel experienced in target business field / Number of requirements definition members
Measure the strengths and weaknesses of organization structure in the requirements definition process
Risk Categorized Item Table
Knowledge Area
Risk Category Interview Sheet Measurement Analysis Data List Problem Cases
Human Resources
Business Expert H28 11,21,43,45,48,54
Technical Specialist H29 11,26,28,34,35,58
Internal Project Structure
H13,H14,H15,H17,H30,H66,H69,H70,H71
H3,H4,H8,H9,H10,Ko1,Ko2,Ko3
10,25,26,28,29,31,48
Interview Sheet
No. Knowledge Area Check Item
H28 Human Resources
H2,H6
Human Resources
H1,H5,H7
Has a key person with required business knowledge been acquired?
Knowledge Area (Main)
Knowledge Area (Related)
Measurement Analysis Data List
62
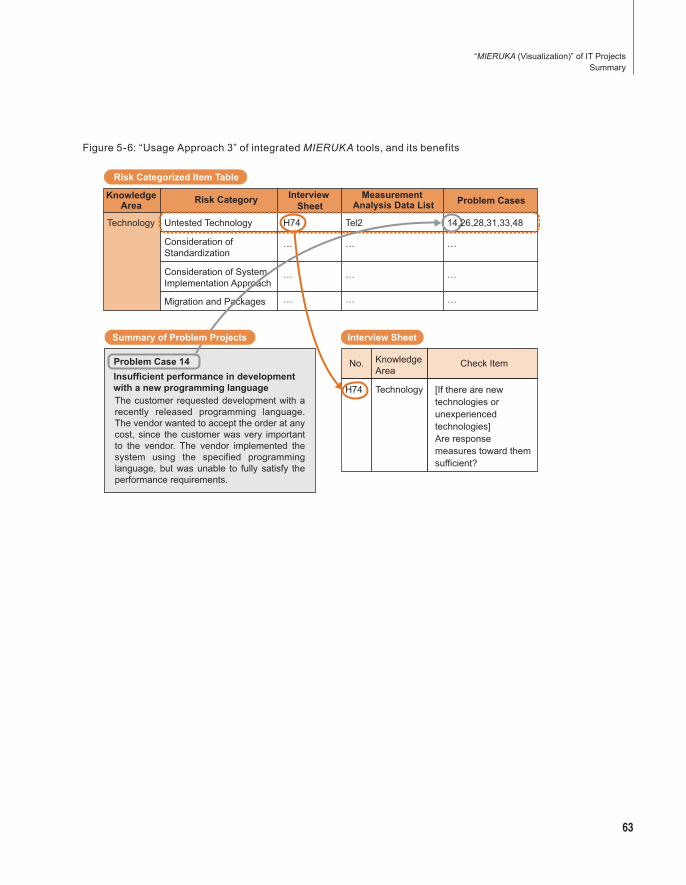
Figure 5-6: “Usage Approach 3” of integrated MIERUKA tools, and its benefits
Technology Untested Technology H74 Tel2 14,26,28,31,33,48
Consideration of Standardization
Migration and Packages
Consideration of System Implementation Approach
Interview Sheet Summary of Problem Projects
Risk Categorized Item Table
Knowledge Area Risk Category Interview
SheetMeasurement
Analysis Data List Problem Cases
No. Knowledge Area
Check Item
H74 Technology Insufficient performance in development with a new programming language
Problem Case 14
The customer requested development with a recently released programming language. The vendor wanted to accept the order at any cost, since the customer was very important to the vendor. The vendor implemented the system using the specified programming language, but was unable to fully satisfy the performance requirements.
[If there are new technologies or unexperienced technologies] Are response measures toward them sufficient?
63
“MIERUKA (Visualization)” of IT ProjectsSummary

64
A: Measurement Item B: Critical Measurement Item C: Critical Measurement Item Conformant Item
: Upstream : Midstream: Downstream : Common
1. Upstream Process, Midstream Process, and Downstream Process Derived Scale ListApp
endix
Kno
wle
dge
Area No. Measurement Objectives Derived Scale
Process
Ups
trea
m
Mid
stre
am
Down
stre
am
Scope Up S1 From all requirements• Compare with planning stage scale to
determine the requirement scale and degree of change
• Understand the scale and degree of change of pending requirements
• Number of requirements during the planning phase• Transition in number of requirements• Transition in number of finalized requirements• Transition in number of pending requirements Number of pending requirements = Total number of requirements - Total number of finalized requirements
B
Scope Up S2 From the perspective of requirement importance• Understand the scale and degree of
change of requirements• Understand the scale and degree of
change of pending requirements
Transition in number of requirements by importance• Transition in number of requirements by importance• Transition in number of finalized requirements by
importance• Transition in number of pending requirements by
importance Number of pending requirements by importance = Total number of requirements by importance - Total number of finalized requirements by importance
A
Scope Up S3 From the perspective of requirement priority• Understand the scale and degree of
change of requirements• Understand the scale and degree of
change of pending requirements
Transition in number of requirements by priority• Transition in number of requirements by priority• Transition in number of finalized requirements by priority• Transition in number of pending requirements by priority Number of pending requirements by priority = Total number of requirements by priority - Total number of finalized requirements by priority
A
Scope Up S4 From the perspective of requirement content change• Understand the scale and degree of
change of requirement changes• Understand requirement change
support status
• Transition in number of requirement changes• Transition in number of handled changes• Transition in number of pending changes Number of pending changes = Total number of requirement changes - Total number of requirement changes which have
been handled
C
Scope Up S5 From total number of functions• Compare with planning stage scale to
determine the function scale and degree of change
• Understand the scale and degree of change of pending functions
• Number of requirements during the planning phase• Transition in number of functions• Transition in number of finalized functions• Transition in number of pending functions Number of pending functions = Total number of functions - Total number of finalized functions
C B

65
“MIERUKA (Visualization)” of IT ProjectsSummary
Kno
wle
dge
Area No. Measurement Objectives Derived Scale
Process
Ups
trea
m
Mid
stre
am
Down
stre
am
Scope Up S6 From the perspective of function importance• Understand the scale and degree of
change of functions• Understand the scale and degree of
change of pending functions
Transition in number of functions by importance• Transition in number of requirements by importance• Transition in number of finalized requirements by
importance• Transition in number of pending requirements by
importance Number of pending requirements by importance = Total number of requirements by importance - Total number of finalized requirements by importance
A
Scope Up S7 From the perspective of function priority• Understand the scale and degree of
change of functions• Understand the scale and degree of
change of pending functions
Transition in number of functions by priority• Transition in number of functions by priority• Transition in number of finalized functions by priority• Transition in number of pending functions by priority Number of pending functions by priority = Total number of functions by priority - Total number of finalized functions by priority
A
Scope Up S8 Understand the scale and degree of finalized functions
Transition in number of function points A
Scope Up S9 From the perspective of function content change• Understand the scale and degree of
change of function changes• Understand function change support
status
• Transition in number of function changes• Transition in number of handled functions• Transition in number of pending changes Number of pending changes = Total number of function changes - Total number of function changes which have been
handled
C B B
Scope Mid S1 Understand the scale and degree of change in the detailed design of finalized functions(Grouping of 2 items)
• Planned number of detailed design document pages at the point of basic design completion
• Transition in number of detailed design document pagesA A
Scope Mid S2 • Planned number of detailed design items at the point of basic design completion
• Transition in number of detailed design itemsA
Scope Mid S3 From the perspective of design change• Understand the scale and degree of
change of detailed design changes• Understand detailed design change
support status
• Transition in number of detailed design changes• Transition in number of handled detailed design changes• Transition in number of pending design changes Number of pending design changes = Total number of detailed design changes - Total number of detailed design changes that have
been handled
B
Scope Down S4
Functional scale and changes(Has scope expanded from a functional vantage?)
Total number of lines of source code B
Scope Down S5
Functional scale and changes(Has scope expanded from a functional vantage?)
Total number of changed lines of source code A
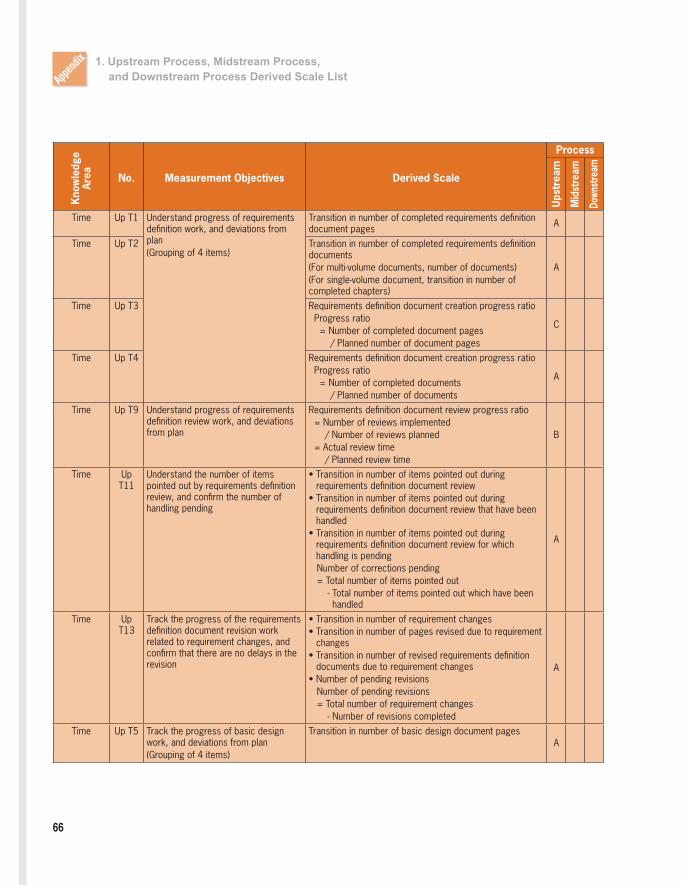
66
1. Upstream Process, Midstream Process, and Downstream Process Derived Scale ListApp
endix
Kno
wle
dge
Area No. Measurement Objectives Derived Scale
Process
Ups
trea
m
Mid
stre
am
Down
stre
am
Time Up T1 Understand progress of requirements definition work, and deviations from plan(Grouping of 4 items)
Transition in number of completed requirements definition document pages A
Time Up T2 Transition in number of completed requirements definition documents(For multi-volume documents, number of documents)(For single-volume document, transition in number of completed chapters)
A
Time Up T3 Requirements definition document creation progress ratio Progress ratio = Number of completed document pages / Planned number of document pages
C
Time Up T4 Requirements definition document creation progress ratio Progress ratio = Number of completed documents / Planned number of documents
A
Time Up T9 Understand progress of requirements definition review work, and deviations from plan
Requirements definition document review progress ratio = Number of reviews implemented / Number of reviews planned = Actual review time / Planned review time
B
Time Up T11
Understand the number of items pointed out by requirements definition review, and confirm the number of handling pending
• Transition in number of items pointed out during requirements definition document review
• Transition in number of items pointed out during requirements definition document review that have been handled
• Transition in number of items pointed out during requirements definition document review for which handling is pending
Number of corrections pending = Total number of items pointed out - Total number of items pointed out which have been
handled
A
Time Up T13
Track the progress of the requirements definition document revision work related to requirement changes, and confirm that there are no delays in the revision
• Transition in number of requirement changes• Transition in number of pages revised due to requirement
changes• Transition in number of revised requirements definition
documents due to requirement changes• Number of pending revisions Number of pending revisions = Total number of requirement changes - Number of revisions completed
A
Time Up T5 Track the progress of basic design work, and deviations from plan(Grouping of 4 items)
Transition in number of basic design document pagesA
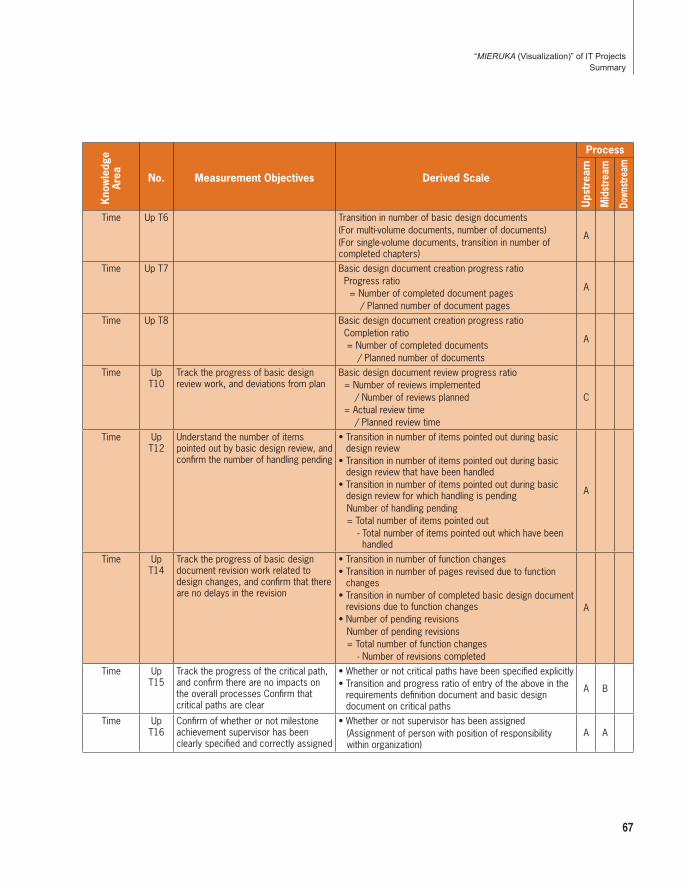
67
“MIERUKA (Visualization)” of IT ProjectsSummary
Kno
wle
dge
Area No. Measurement Objectives Derived Scale
Process
Ups
trea
m
Mid
stre
am
Down
stre
am
Time Up T6 Transition in number of basic design documents(For multi-volume documents, number of documents)(For single-volume documents, transition in number of completed chapters)
A
Time Up T7 Basic design document creation progress ratio Progress ratio = Number of completed document pages / Planned number of document pages
A
Time Up T8 Basic design document creation progress ratio Completion ratio = Number of completed documents / Planned number of documents
A
Time Up T10
Track the progress of basic design review work, and deviations from plan
Basic design document review progress ratio = Number of reviews implemented / Number of reviews planned = Actual review time / Planned review time
C
Time Up T12
Understand the number of items pointed out by basic design review, and confirm the number of handling pending
• Transition in number of items pointed out during basic design review
• Transition in number of items pointed out during basic design review that have been handled
• Transition in number of items pointed out during basic design review for which handling is pending
Number of handling pending = Total number of items pointed out - Total number of items pointed out which have been
handled
A
Time Up T14
Track the progress of basic design document revision work related to design changes, and confirm that there are no delays in the revision
• Transition in number of function changes• Transition in number of pages revised due to function
changes• Transition in number of completed basic design document
revisions due to function changes• Number of pending revisions Number of pending revisions = Total number of function changes - Number of revisions completed
A
Time Up T15
Track the progress of the critical path, and confirm there are no impacts on the overall processes Confirm that critical paths are clear
• Whether or not critical paths have been specified explicitly• Transition and progress ratio of entry of the above in the
requirements definition document and basic design document on critical paths
A B
Time Up T16
Confirm of whether or not milestone achievement supervisor has been clearly specified and correctly assigned
• Whether or not supervisor has been assigned (Assignment of person with position of responsibility
within organization)A A

68
1. Upstream Process, Midstream Process, and Downstream Process Derived Scale ListApp
endix
Kno
wle
dge
Area No. Measurement Objectives Derived Scale
Process
Ups
trea
m
Mid
stre
am
Down
stre
am
Time Mid T1 Track the progress of detailed design work, and deviations from plan(Grouping of 4 items)
Transition in number of detailed design document pages ATime Mid T2 Transition in number of detailed design items created ATime Mid T3 Detailed design document creation progress ratio
Progress ratio = Number of completed document pages / Planned number of document pages
A
Time Mid T4 Detailed design item progress ratio Progress ratio = Number of completed design items / Number of planned items
B
Time Mid T5 Track the progress of detailed design review work, and deviations from plan
Detailed design document review progress ratio = Number of reviews implemented / Number of reviews planned = Actual review time / Planned review time
B
Time Mid T6 Understand the number of items pointed out by detailed design review, and confirm the number of issues for which handling is pending
• Transition in number of items pointed out during detailed design review
• Transition in number of items pointed out during detailed design review that have been handled
• Transition in number of items pointed out during detailed design review for which handling is pending
Number of pending support issues = Total number of items pointed out - Total number of items pointed out which have been
handled
B
Time Mid T7 Track the progress of detailed design document revision work related to design change, and confirm whether or not revision is delayed
• Transition in number of detailed design changes• Transition in number of pages revised due to design
changes• Transition in number of completed detailed design
document revisions due to design changes• Number of pending revisions Number of pending revisions = Total number of design changes - Number of revisions completed
B
Time Mid T8 Track the progress of basic design document revision work related to design change, and confirm whether or not revision is delayed
• Transition in number of basic design changes• Transition in number of pages revised due to basic design
changes• Transition in number of completed basic design document
revisions due to basic design changes• Number of pending revisions Number of pending revisions = Total number of function changes - Number of revisions completed
A
Time Down T1
Milestone achievement status management
Integration test process work unit progress B
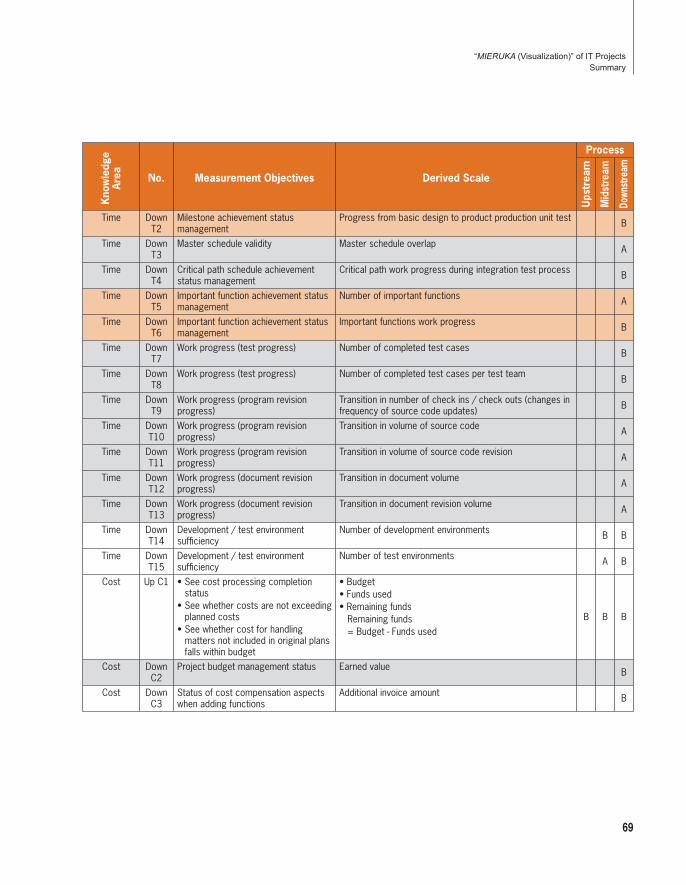
69
“MIERUKA (Visualization)” of IT ProjectsSummary
Kno
wle
dge
Area No. Measurement Objectives Derived Scale
Process
Ups
trea
m
Mid
stre
am
Down
stre
am
Time Down T2
Milestone achievement status management
Progress from basic design to product production unit test B
Time Down T3
Master schedule validity Master schedule overlap A
Time Down T4
Critical path schedule achievement status management
Critical path work progress during integration test process B
Time Down T5
Important function achievement status management
Number of important functions A
Time Down T6
Important function achievement status management
Important functions work progress B
Time Down T7
Work progress (test progress) Number of completed test cases B
Time Down T8
Work progress (test progress) Number of completed test cases per test team B
Time Down T9
Work progress (program revision progress)
Transition in number of check ins / check outs (changes in frequency of source code updates) B
Time Down T10
Work progress (program revision progress)
Transition in volume of source code A
Time Down T11
Work progress (program revision progress)
Transition in volume of source code revision A
Time Down T12
Work progress (document revision progress)
Transition in document volume A
Time Down T13
Work progress (document revision progress)
Transition in document revision volume A
Time Down T14
Development / test environment sufficiency
Number of development environments B B
Time Down T15
Development / test environment sufficiency
Number of test environments A B
Cost Up C1 • See cost processing completion status
• See whether costs are not exceeding planned costs
• See whether cost for handling matters not included in original plans falls within budget
• Budget• Funds used• Remaining funds Remaining funds = Budget - Funds used
B B B
Cost Down C2
Project budget management status Earned value B
Cost Down C3
Status of cost compensation aspects when adding functions
Additional invoice amount B

70
1. Upstream Process, Midstream Process, and Downstream Process Derived Scale ListApp
endix
Kno
wle
dge
Area No. Measurement Objectives Derived Scale
Process
Ups
trea
m
Mid
stre
am
Down
stre
am
Quality Up Q1 [Maintainability / Portability]Understand level of compliance to standards in the requirements definition process • Evaluation based on number of
standards compliant items
Requirements definition process standard compliance ratio Standard compliance ratio = Number of compliant items / Number of items for which compliance is necessaryStandards here refer to:• Requirements definition document review plans• Requirements definition document review standards• Requirements definition document format• Requirements definition document entry guidance
A
Quality Up Q2 [Reliability]Understand whether requirements definition document review is functioning effectively
• Number of items pointed out during requirements definition document review
• Number of items pointed out per document page = Number of items pointed out during review / Number of pages• Number of items pointed out per function point = Number of items pointed out during review / Number of function pointsPoint out during review any items not compliant with standards
B
Quality Up Q3 [Reliability]Understand whether measures are being properly implemented in response to requirements definition document review results
The following based on review:• Number of items pointed out during requirements
definition document review which have been revised• Number of items pointed out during requirements
definition document review which have not been revised Number of unrevised items = Total number of items pointed out during review - Total number of items pointed out which have been
revised• Handling ratio of items pointed out during requirements
definition document review Handling ratio = Total number of items pointed out which have been
revised / Total number of items pointed out during review
B
Quality Up Q4 [Reliability]Confirm that issues pointed out during requirements definition review are not being handled on an individual basis, but a common or fundamental countermeasure approach is being used
The following in the requirements definition document:• Presence or absence of analysis of issues pointed out • Presence or absence of countermeasures in response to
issue analysis results A
Quality Up Q5 [Maintainability / Portability]Understand requirements definition process quality
Reworking work amount distribution during requirements definition process (Average, distribution, individual, total)
A

71
“MIERUKA (Visualization)” of IT ProjectsSummary
Kno
wle
dge
Area No. Measurement Objectives Derived Scale
Process
Ups
trea
m
Mid
stre
am
Down
stre
am
Quality Up Q6 [Maintainability / Portability]Understand requirements definition process quality
Reworking quantity distribution during requirements definition process (Average, distribution, individual, total)
A
Quality Up Q7 [Maintainability / Portability]Understand requirements definition process maintenance capabilities
Time until requirements definition document correction Time to correction = Creation date/time of issue pointed during review - Handling date/time of issue pointed out during
review
A
Quality Up Q8 [Reliability]Understand requirements definition document reliability
Number of document reviews Number of document reviews = Number of reviews within team + Number of project reviews + Number of user reviews
C
Quality Up Q9 [Reliability]Determine requirements with problems regarding their degree of finalization
Component clusters which underwent reworking during the requirements definition process • Number of revisions per requirement
A
Quality Up Q10 [Efficiency]Understand whether performance values which serve as system goals have been designed
Performance design progress ratio • Task progress ratio = Number of completed tasks / Number of tasks • Transaction design progress ratio = Number of designed transactions / Number of transactions Note) “ Designed transactions” shall contain concrete values
for the following • Processing speed estimate values per transaction• Processing throughput estimate values per transaction • Resource usage rate estimate values per transaction • Limit time per batch processing unit• Batch processing unit estimated processing time
C A
Quality Up Q11 [Functionality]Understand the degree to which functions required by the system have been realized
System function realization ratio Realization ratio = Number of realized system functions / Number of required system functions
A A
Quality Up Q12 [Maintainability / Portability]Understand the level compliance of standards in the basic design process• Evaluation based on number of
technical standard conformant items
Basic design process standard compliance ratio Standard compliance ratio = Number of compliant items / Number of items for which compliance is necessary Standards here refer to: • Basic design document review plans • Basic design document review standards • Basic design document format • Basic design document entry outline
C A
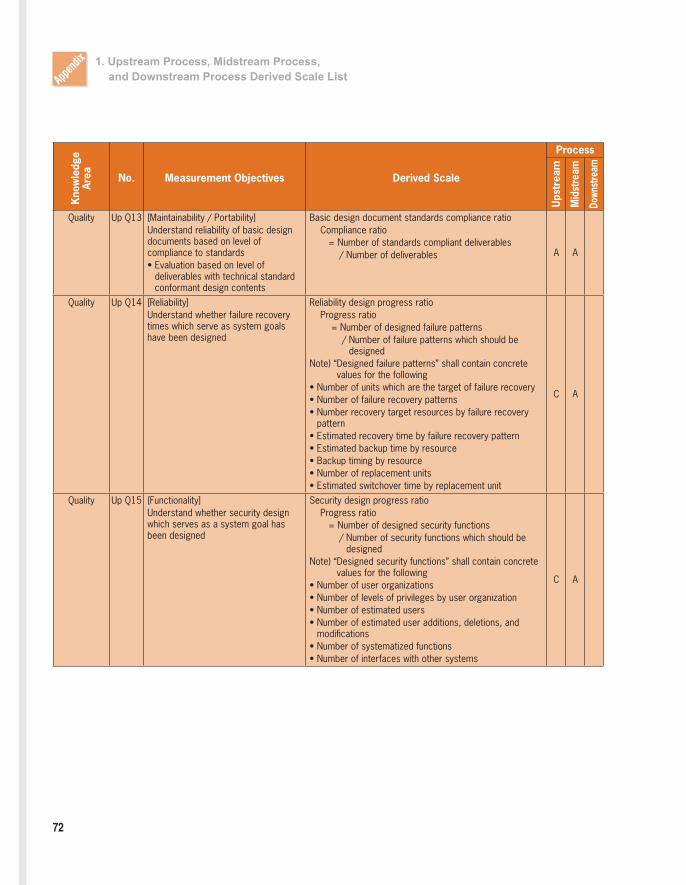
72
1. Upstream Process, Midstream Process, and Downstream Process Derived Scale ListApp
endix
Kno
wle
dge
Area No. Measurement Objectives Derived Scale
Process
Ups
trea
m
Mid
stre
am
Down
stre
am
Quality Up Q13 [Maintainability / Portability]Understand reliability of basic design documents based on level of compliance to standards• Evaluation based on level of
deliverables with technical standard conformant design contents
Basic design document standards compliance ratio Compliance ratio = Number of standards compliant deliverables / Number of deliverables A A
Quality Up Q14 [Reliability]Understand whether failure recovery times which serve as system goals have been designed
Reliability design progress ratio Progress ratio = Number of designed failure patterns / Number of failure patterns which should be
designedNote) “ Designed failure patterns” shall contain concrete
values for the following• Number of units which are the target of failure recovery• Number of failure recovery patterns• Number recovery target resources by failure recovery
pattern• Estimated recovery time by failure recovery pattern• Estimated backup time by resource• Backup timing by resource• Number of replacement units• Estimated switchover time by replacement unit
C A
Quality Up Q15 [Functionality]Understand whether security design which serves as a system goal has been designed
Security design progress ratio Progress ratio = Number of designed security functions / Number of security functions which should be
designedNote) “ Designed security functions” shall contain concrete
values for the following• Number of user organizations• Number of levels of privileges by user organization• Number of estimated users• Number of estimated user additions, deletions, and
modifications• Number of systematized functions• Number of interfaces with other systems
C A

73
“MIERUKA (Visualization)” of IT ProjectsSummary
Kno
wle
dge
Area No. Measurement Objectives Derived Scale
Process
Ups
trea
m
Mid
stre
am
Down
stre
am
Quality Up Q16 [Functionality]Understand whether functions required by the system have been designed
* Note 1: Data items contained in screens, forms, and interfaces
* Note 2: Table includes definitions such as index design and review design
• Screen design progress ratio Progress ratio = Number of designed screens / Number of screens• Form design progress ratio = Number of designed forms / Number of forms• Interface design progress ratio Progress ratio = Number of designed interfaces / Number of total interfaces• Function design progress ratio = Number of designed functions / Number of functions• Data item progress ratio Progress ratio = Number of designed data items / Number of data item*Note 1)• Database design progress ratio Progress ratio = Number of designed tables / Number of tables*Note 2)
A A
Quality Up Q17 [Reliability]Understand whether basic design document review is functioning effectively
• Number of items pointed out during basic design review• Number of items pointed out per document page = Number of items pointed out during review / Number of pages• Number of items pointed out per function point = Number of items pointed out during review / Number of function points
C A
Quality Up Q18 [Reliability]Understand whether measures are being properly implemented in response to basic design document review results
The following based on review:• Number of items pointed out during basic design
document review which have been revised• Number of items pointed out during basic design
document review which have not been revised Number of unrevised items = Total number of items pointed out during review - Total number of items pointed out which have been
revised• Handling ratio of items pointed out in basic design
document review Handling ratio = Total number of items pointed out which have been
revised / Total number of items pointed out during review
A B A

74
1. Upstream Process, Midstream Process, and Downstream Process Derived Scale ListApp
endix
Kno
wle
dge
Area No. Measurement Objectives Derived Scale
Process
Ups
trea
m
Mid
stre
am
Down
stre
am
Quality Up Q19 [Reliability]Confirm that issues pointed out during basic design review are not being handled on an individual basis, but a common or fundamental countermeasure approach is being used
Basic design document• Presence or absence of analysis of issues pointed out• Implementation ratio of countermeasures in response to
issue analysis results
Countermeasure implementation ratio = Number of implemented countermeasures / Number of counter implementation targets
A A
Quality Mid Q1 [Maintainability / Portability]Understand the level of standards compliance in detailed design process• Evaluation based on number of
standard conformant items
Detailed design process standard compliance ratio tandard compliance ratio = Number of compliant items / Number of items for which compliance is necessaryStandards here refer to:• Detailed design document review plans• Detailed design document review standards• Detailed design document format• Detailed design document entry guideline
B
Quality Mid Q2 [Reliability]Understand whether detailed design document review is functioning effectively
• Number of items pointed out during detailed design review
• Number of items pointed out per document page = Number of items pointed out during review / Number of pages• Number of items pointed out per function point = Number of items pointed out during review / Number of function pointsDuring review any items not compliant with standards shall be pointed out
B
Quality Mid Q3 [Reliability]Understand whether measures are being properly implemented in response to detailed design document review results
The following based on review:• Number of items pointed out during detailed design
document review which have been revised• Number of items pointed out during detailed design
document review which have not been revised Number of unrevised items = Total number of items pointed out during review - Total number of items pointed out which have been
revised• Detailed design document review point support ratio Support ratio = Total number of items pointed out which have been
revised / Total number of items pointed out during review
B

75
“MIERUKA (Visualization)” of IT ProjectsSummary
Kno
wle
dge
Area No. Measurement Objectives Derived Scale
Process
Ups
trea
m
Mid
stre
am
Down
stre
am
Quality Mid Q4 [Reliability]Confirm that issues pointed out during detailed design review are not being handled on an individual basis, but a common or fundamental countermeasure approach is being used
Detailed design document• Presence or absence of analysis of issues pointed out• Presence or absence of countermeasures in response to
issue analysis results A
Quality Mid Q5 [Maintainability / Portability]Understand detailed design process quality
Reworking work amount distribution during detailed design process(Average, distribution, individual, total)
A
Quality Mid Q6 [Maintainability / Portability]Understand detailed design process quality
Reworking quantity distribution during detailed design process(Average, distribution, individual, total)
A
Quality Mid Q7 [Maintainability / Portability]Understand detailed design process maintenance capabilities
Time until detailed design document correction Time to correction = Creation date/time of issue pointed during review - Handling date/time of issue pointed out during
review
A
Quality Mid Q8 [Reliability]Understand detailed design document reliability
Number of document reviews Number of document reviews = Number of reviews within team + Number of project reviews + Number of user reviews
B
Quality Mid Q9 [Reliability]Determine requirements with problems regarding their degree of finalization
Component clusters which underwent reworking during the detailed design process• Number of revisions per component
A
Quality Mid Q20 Reliability (Are unit test plans being reviewed?)
Number of unit test plan documents reviews B A
Quality Mid Q21 Reliability (Are unit test plans being reviewed?)
Number of issues pointed out during unit test plan documents review B A
Quality Mid Q22 Reliability (Are unit test cases being reviewed?)
Number of unit test case reviews B A
Quality Mid Q23 Reliability (Are unit test cases being reviewed?)
Number of issues pointed out during unit test case review B A
Quality Mid Q24 Reliability (Is unit test data being reviewed?)
Number of unit test data reviews B A
Quality Mid Q25 Reliability (Is unit test data being reviewed?)
Number of issues pointed out during unit test data review B A
Quality Mid Q26 Reliability (Is the number of unit test cases sufficient for quality confirmation?)
Unit test case density B A
Quality Mid Q27 Reliability (Understand program quality) Number of rework unit tests A AQuality Mid Q28 Reliability (Understand program quality) Number of detected bugs (phenomena) B A
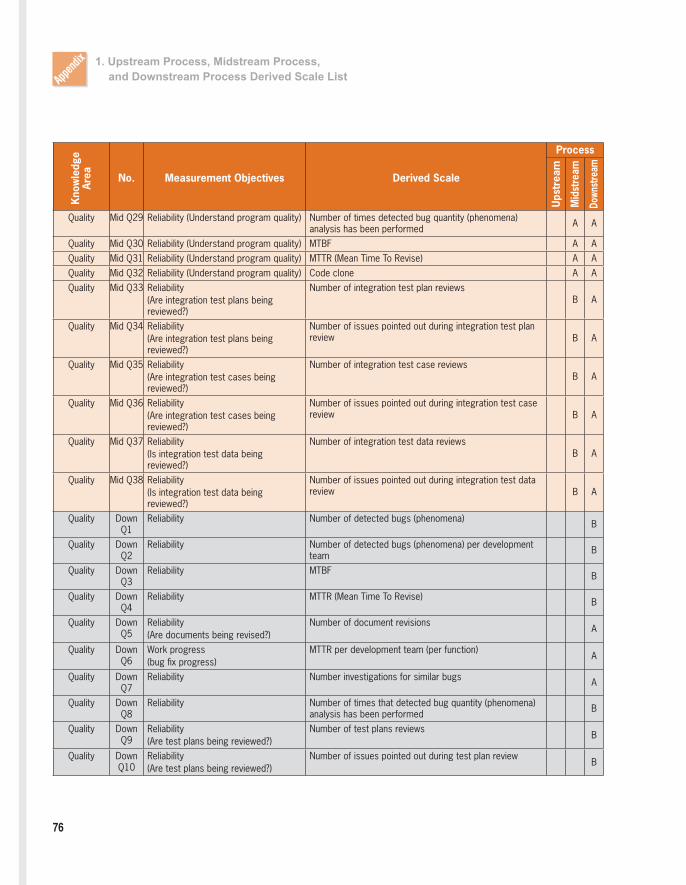
76
1. Upstream Process, Midstream Process, and Downstream Process Derived Scale ListApp
endix
Kno
wle
dge
Area No. Measurement Objectives Derived Scale
Process
Ups
trea
m
Mid
stre
am
Down
stre
am
Quality Mid Q29 Reliability (Understand program quality) Number of times detected bug quantity (phenomena) analysis has been performed A A
Quality Mid Q30 Reliability (Understand program quality) MTBF A AQuality Mid Q31 Reliability (Understand program quality) MTTR (Mean Time To Revise) A AQuality Mid Q32 Reliability (Understand program quality) Code clone A AQuality Mid Q33 Reliability
(Are integration test plans being reviewed?)
Number of integration test plan reviews B A
Quality Mid Q34 Reliability (Are integration test plans being reviewed?)
Number of issues pointed out during integration test plan review B A
Quality Mid Q35 Reliability (Are integration test cases being reviewed?)
Number of integration test case reviews B A
Quality Mid Q36 Reliability (Are integration test cases being reviewed?)
Number of issues pointed out during integration test case review B A
Quality Mid Q37 Reliability (Is integration test data being reviewed?)
Number of integration test data reviews B A
Quality Mid Q38 Reliability (Is integration test data being reviewed?)
Number of issues pointed out during integration test data review B A
Quality Down Q1
Reliability Number of detected bugs (phenomena) B
Quality Down Q2
Reliability Number of detected bugs (phenomena) per development team B
Quality Down Q3
Reliability MTBF B
Quality Down Q4
Reliability MTTR (Mean Time To Revise) B
Quality Down Q5
Reliability (Are documents being revised?)
Number of document revisions A
Quality Down Q6
Work progress (bug fix progress)
MTTR per development team (per function) A
Quality Down Q7
Reliability Number investigations for similar bugs A
Quality Down Q8
Reliability Number of times that detected bug quantity (phenomena) analysis has been performed B
Quality Down Q9
Reliability (Are test plans being reviewed?)
Number of test plans reviewsB
Quality Down Q10
Reliability (Are test plans being reviewed?)
Number of issues pointed out during test plan review B

77
“MIERUKA (Visualization)” of IT ProjectsSummary
Kno
wle
dge
Area No. Measurement Objectives Derived Scale
Process
Ups
trea
m
Mid
stre
am
Down
stre
am
Quality Down Q11
Reliability (Are test cases being reviewed?)
Number of test case reviews B
Quality Down Q12
Reliability (Are test cases being reviewed?)
Number of issues pointed out during test case review B
Quality Down Q13
Reliability (Are test data being reviewed?)
Number of test data reviews B
Quality Down Q14
Reliability (Are test data being reviewed?)
Number of issues pointed out during test data review B
Quality Down Q15
Reliability (Are basic design documents being reviewed?)
Number of basic design document reviews B
Quality Down Q16
Reliability (Are basic design documents being reviewed?)
Number of items pointed out during basic design document review B
Quality Down Q17
Reliability Code clone B B
Quality Down Q18
Reliability Number of data items A
Quality Down Q19
Reliability Number of test cases A
Quality Down Q20
Reliability Density of test cases B
Quality Down Q21
Reliability Number of rework tests B
Quality Down Q22
Reliability Coding convention compliance by program B A
Quality Down Q23
Reliability Unit test case coverage by program B A
Human Resources
Up H1 Measure strengths and weaknesses of requirements definition process organization
Ratio of personnel possessing requirements definition skills (IT coordinators) Number of personnel possessing skills at IT coordinator level
/ Number of requirements definition members
A
Human Resources
Up H2 Measure strengths and weaknesses of requirements definition process organization
Ratio of requirements definition process personnel experienced in the target business field (retails sales, insurance field, etc.) Number of personnel experienced in target business field / Number of requirements definition members
B
Human Resources
Up H3 Measure strengths and weaknesses of requirements definition process organization
Ratio of requirements definition members with duties spanning projects multiple appointment ratio / Number of requirements definition members
A
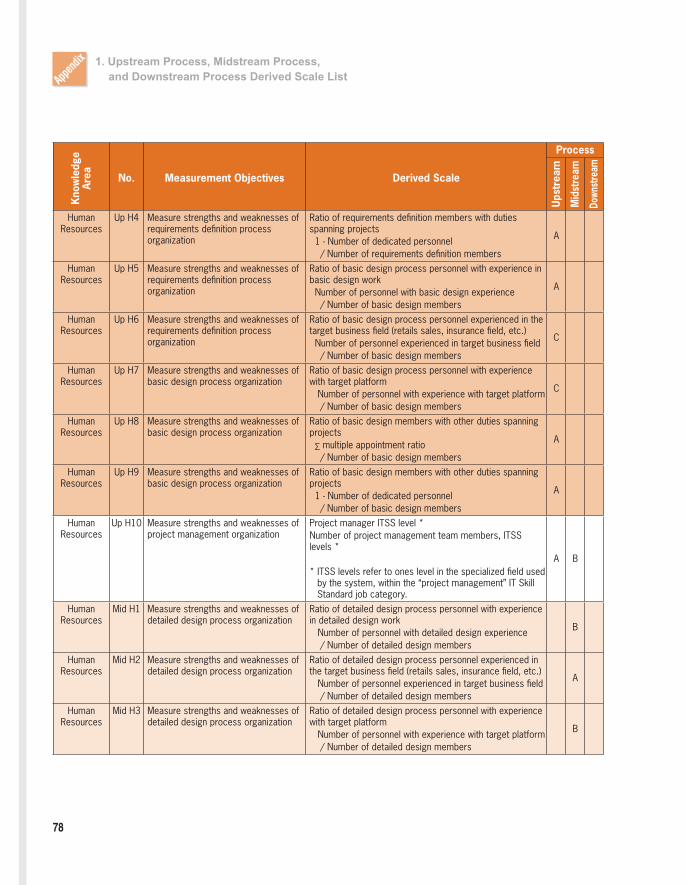
78
1. Upstream Process, Midstream Process, and Downstream Process Derived Scale ListApp
endix
Kno
wle
dge
Area No. Measurement Objectives Derived Scale
Process
Ups
trea
m
Mid
stre
am
Down
stre
am
Human Resources
Up H4 Measure strengths and weaknesses of requirements definition process organization
Ratio of requirements definition members with duties spanning projects 1 - Number of dedicated personnel / Number of requirements definition members
A
Human Resources
Up H5 Measure strengths and weaknesses of requirements definition process organization
Ratio of basic design process personnel with experience in basic design work Number of personnel with basic design experience / Number of basic design members
A
Human Resources
Up H6 Measure strengths and weaknesses of requirements definition process organization
Ratio of basic design process personnel experienced in the target business field (retails sales, insurance field, etc.) Number of personnel experienced in target business field / Number of basic design members
C
Human Resources
Up H7 Measure strengths and weaknesses of basic design process organization
Ratio of basic design process personnel with experience with target platform Number of personnel with experience with target platform / Number of basic design members
C
Human Resources
Up H8 Measure strengths and weaknesses of basic design process organization
Ratio of basic design members with other duties spanning projects multiple appointment ratio / Number of basic design members
A
Human Resources
Up H9 Measure strengths and weaknesses of basic design process organization
Ratio of basic design members with other duties spanning projects 1 - Number of dedicated personnel / Number of basic design members
A
Human Resources
Up H10 Measure strengths and weaknesses of project management organization
Project manager ITSS level *Number of project management team members, ITSS levels *
* ITSS levels refer to ones level in the specialized field used by the system, within the “project management” IT Skill Standard job category.
A B
Human Resources
Mid H1 Measure strengths and weaknesses of detailed design process organization
Ratio of detailed design process personnel with experience in detailed design work Number of personnel with detailed design experience / Number of detailed design members
B
Human Resources
Mid H2 Measure strengths and weaknesses of detailed design process organization
Ratio of detailed design process personnel experienced in the target business field (retails sales, insurance field, etc.) Number of personnel experienced in target business field / Number of detailed design members
A
Human Resources
Mid H3 Measure strengths and weaknesses of detailed design process organization
Ratio of detailed design process personnel with experience with target platform Number of personnel with experience with target platform / Number of detailed design members
B
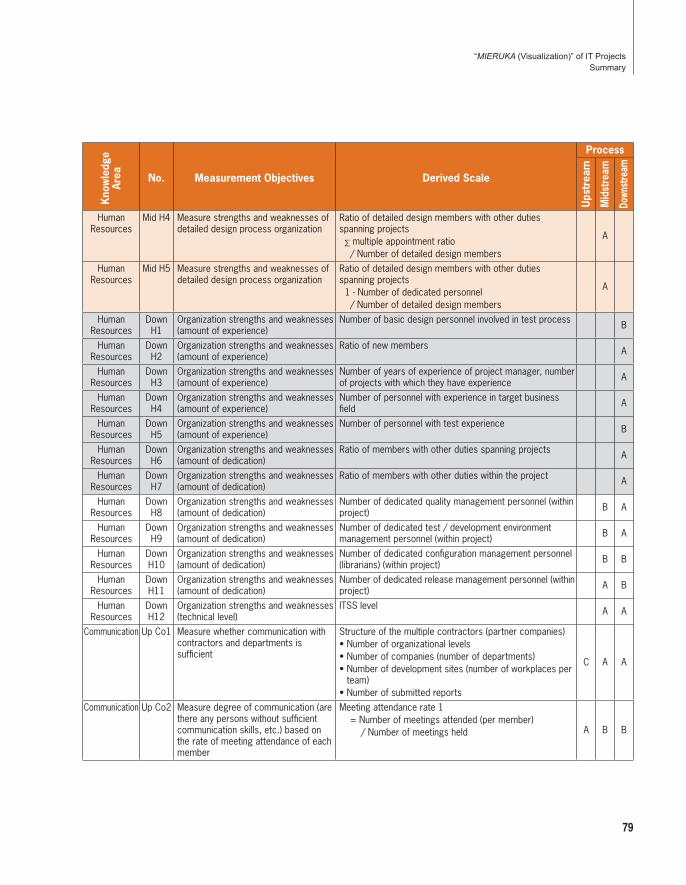
79
“MIERUKA (Visualization)” of IT ProjectsSummary
Kno
wle
dge
Area No. Measurement Objectives Derived Scale
Process
Ups
trea
m
Mid
stre
am
Down
stre
am
Human Resources
Mid H4 Measure strengths and weaknesses of detailed design process organization
Ratio of detailed design members with other duties spanning projects multiple appointment ratio / Number of detailed design members
A
Human Resources
Mid H5 Measure strengths and weaknesses of detailed design process organization
Ratio of detailed design members with other duties spanning projects 1 - Number of dedicated personnel / Number of detailed design members
A
Human Resources
Down H1
Organization strengths and weaknesses (amount of experience)
Number of basic design personnel involved in test process B
Human Resources
Down H2
Organization strengths and weaknesses (amount of experience)
Ratio of new members A
Human Resources
Down H3
Organization strengths and weaknesses (amount of experience)
Number of years of experience of project manager, number of projects with which they have experience A
Human Resources
Down H4
Organization strengths and weaknesses (amount of experience)
Number of personnel with experience in target business field A
Human Resources
Down H5
Organization strengths and weaknesses (amount of experience)
Number of personnel with test experience B
Human Resources
Down H6
Organization strengths and weaknesses (amount of dedication)
Ratio of members with other duties spanning projects A
Human Resources
Down H7
Organization strengths and weaknesses (amount of dedication)
Ratio of members with other duties within the project A
Human Resources
Down H8
Organization strengths and weaknesses (amount of dedication)
Number of dedicated quality management personnel (within project) B A
Human Resources
Down H9
Organization strengths and weaknesses (amount of dedication)
Number of dedicated test / development environment management personnel (within project) B A
Human Resources
Down H10
Organization strengths and weaknesses (amount of dedication)
Number of dedicated configuration management personnel (librarians) (within project) B B
Human Resources
Down H11
Organization strengths and weaknesses (amount of dedication)
Number of dedicated release management personnel (within project) A B
Human Resources
Down H12
Organization strengths and weaknesses (technical level)
ITSS level A A
Communication Up Co1 Measure whether communication with contractors and departments is sufficient
Structure of the multiple contractors (partner companies)• Number of organizational levels• Number of companies (number of departments)• Number of development sites (number of workplaces per
team)• Number of submitted reports
C A A
Communication Up Co2 Measure degree of communication (are there any persons without sufficient communication skills, etc.) based on the rate of meeting attendance of each member
Meeting attendance rate 1 = Number of meetings attended (per member) / Number of meetings held A B B
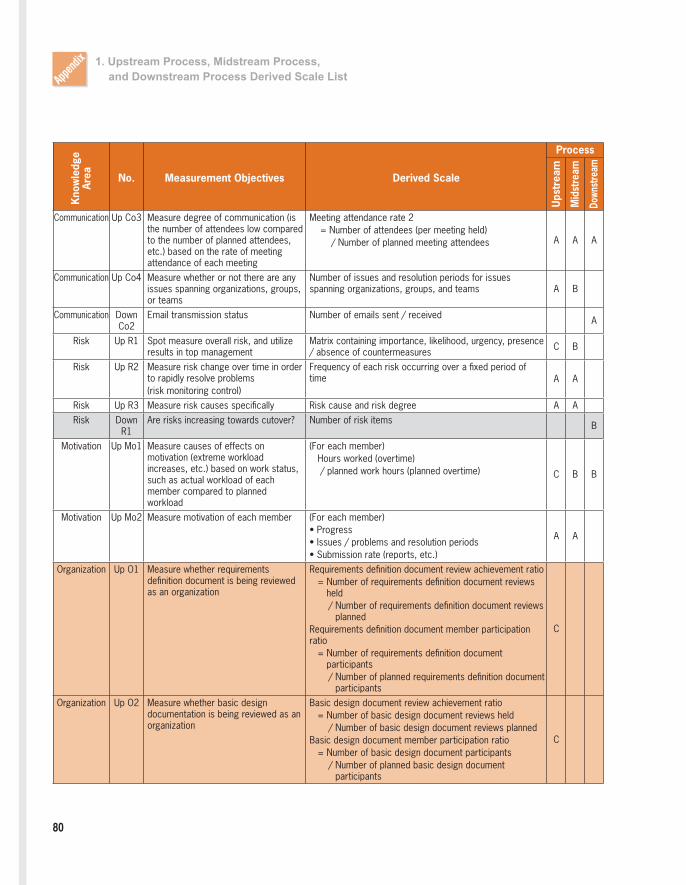
80
1. Upstream Process, Midstream Process, and Downstream Process Derived Scale ListApp
endix
Kno
wle
dge
Area No. Measurement Objectives Derived Scale
Process
Ups
trea
m
Mid
stre
am
Down
stre
am
Communication Up Co3 Measure degree of communication (is the number of attendees low compared to the number of planned attendees, etc.) based on the rate of meeting attendance of each meeting
Meeting attendance rate 2 = Number of attendees (per meeting held) / Number of planned meeting attendees A A A
Communication Up Co4 Measure whether or not there are any issues spanning organizations, groups, or teams
Number of issues and resolution periods for issues spanning organizations, groups, and teams A B
Communication Down Co2
Email transmission status Number of emails sent / received A
Risk Up R1 Spot measure overall risk, and utilize results in top management
Matrix containing importance, likelihood, urgency, presence / absence of countermeasures C B
Risk Up R2 Measure risk change over time in order to rapidly resolve problems(risk monitoring control)
Frequency of each risk occurring over a fixed period of time A A
Risk Up R3 Measure risk causes specifically Risk cause and risk degree A ARisk Down
R1 Are risks increasing towards cutover? Number of risk items B
Motivation Up Mo1 Measure causes of effects on motivation (extreme workload increases, etc.) based on work status, such as actual workload of each member compared to planned workload
(For each member) Hours worked (overtime) / planned work hours (planned overtime) C B B
Motivation Up Mo2 Measure motivation of each member (For each member)• Progress• Issues / problems and resolution periods• Submission rate (reports, etc.)
A A
Organization Up O1 Measure whether requirements definition document is being reviewed as an organization
Requirements definition document review achievement ratio = Number of requirements definition document reviews
held / Number of requirements definition document reviews
plannedRequirements definition document member participation ratio = Number of requirements definition document
participants / Number of planned requirements definition document
participants
C
Organization Up O2 Measure whether basic design documentation is being reviewed as an organization
Basic design document review achievement ratio = Number of basic design document reviews held / Number of basic design document reviews plannedBasic design document member participation ratio = Number of basic design document participants / Number of planned basic design document
participants
C

81
“MIERUKA (Visualization)” of IT ProjectsSummary
Kno
wle
dge
Area No. Measurement Objectives Derived Scale
Process
Ups
trea
m
Mid
stre
am
Down
stre
am
Organization Mid O1 Measure whether detailed design documentation is being reviewed as an organization
Detailed design document review achievement ratio = Number of detailed design document reviews held / Number of detailed design document reviews
plannedDetailed design document member participation ratio = Number of detailed design document participants / Number of planned detailed design document
participants
B
Organization Up O3 Measure whether work is being performed in accordance with process standards specified by the organization
Process conformance ratio = Number of practices being followed / Number of practices defined within all process areas* The process areas which should be covered will vary
depending on the organization and project
C B A
Organization Up O4 Measure whether work is being carried out efficiently as an organization
Transition in productivity = Number of document pages created / Creation person-hours
A A
Organization Up O5 Measure whether configuration management is being performed according to standards as an organization
Transition in number of document check ins / check outs
A A
Organization Up O6 Understand project environment based on work environment sufficiency
Number of requirements for work environments defined by organization standards, and the number of those which have been satisfied
A B
Organization Down O1
Strengths and weaknesses of partner companies
Number of participating companies A
Organization Down O2
Strengths and weaknesses of partner companies
Number of levels A
Organization Down O3
Strengths and weaknesses of partner companies
Number of geographical development sites A
Organization Down O5
Project standard conformance status(Is work being done according to standards?)
Degree of project standard conformance A
Organization Down O6
Process standard conformance status(Is management being done according to standards?)
Number of management indices B
Task Management
Up K1 Measure number of issues generated and number handled in order to understand issue completion status
• Changes in number of issues• Changes in number of issues handled• Changes in number of pending issues Number of pending issues = Total number of issues - Number of issues handled
C B B
Task Management
Up K2 Measure and estimate scope of impact of pending issues
Number of pending issues by degree of impact = Total number of issues by degree of impact - Number of issues handled by degree of impact
A A
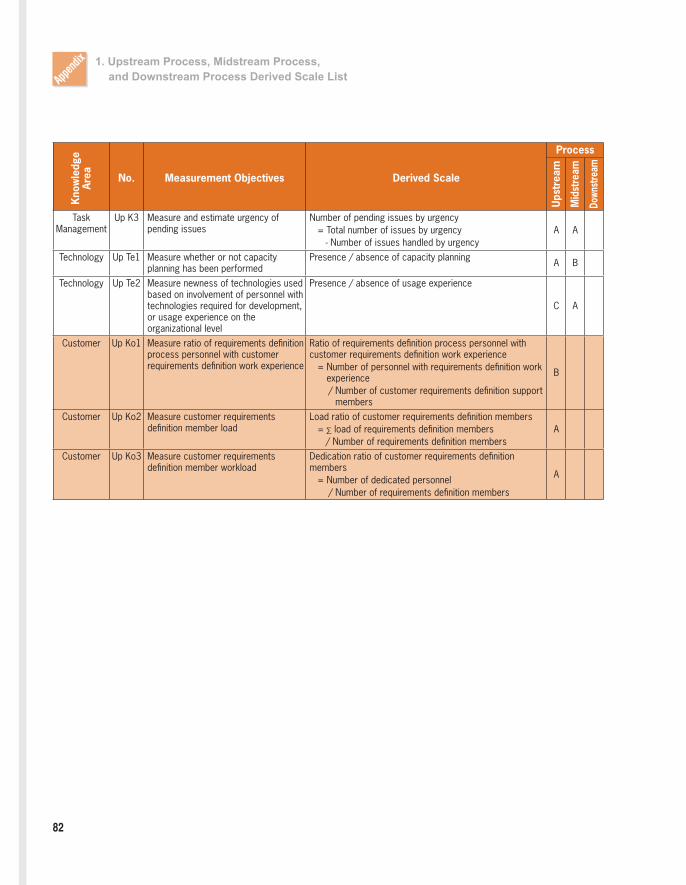
82
1. Upstream Process, Midstream Process, and Downstream Process Derived Scale ListApp
endix
Kno
wle
dge
Area No. Measurement Objectives Derived Scale
Process
Ups
trea
m
Mid
stre
am
Down
stre
am
Task Management
Up K3 Measure and estimate urgency of pending issues
Number of pending issues by urgency = Total number of issues by urgency - Number of issues handled by urgency
A A
Technology Up Te1 Measure whether or not capacity planning has been performed
Presence / absence of capacity planning A B
Technology Up Te2 Measure newness of technologies used based on involvement of personnel with technologies required for development, or usage experience on the organizational level
Presence / absence of usage experience
C A
Customer Up Ko1 Measure ratio of requirements definition process personnel with customer requirements definition work experience
Ratio of requirements definition process personnel with customer requirements definition work experience = Number of personnel with requirements definition work
experience / Number of customer requirements definition support
members
B
Customer Up Ko2 Measure customer requirements definition member load
Load ratio of customer requirements definition members = load of requirements definition members / Number of requirements definition members
A
Customer Up Ko3 Measure customer requirements definition member workload
Dedication ratio of customer requirements definition members = Number of dedicated personnel / Number of requirements definition members
A
Related Documents