Midlatitude cirrus clouds and multiple tropopauses from a 2002–2006 climatology over the SIRTA observatory Vincent Noe ¨l 1 and Martial Haeffelin 1 Received 5 July 2006; revised 10 January 2007; accepted 13 February 2007; published 10 July 2007. [1] This study presents a comparison of lidar observations of midlatitude cirrus clouds over the Site Instrumental de Recherche par Te ´le ´de ´tection Atmosphe ´rique (SIRTA) observatory between 2002 and 2006 with multiple tropopauses (MT) retrieved from radiosounding temperature profiles. The temporal variability of MT properties (frequency, thickness) are discussed. Results show a marked annual cycle, with MT frequency reaching its lowest point in May (18% occurrence of MT) and slowly rising to more than 40% in December, January, and February (DJF). The average thickness of the MT also follows an annual cycle, going from less than 1 km in spring to 1.5 km in late autumn. Comparison with lidar observations show that cirrus clouds show a preference for being located close below the first tropopause. When the cloud top is above the first tropopause (7% of observations), in 20% of cases, the cloud base is above it as well, resulting in a cirrus cloud ‘‘sandwiched’’ between the two tropopauses. Compared with the general distribution of cirrus, cross-tropopause cirrus clouds show a higher frequency of large optical depths, while intertropopause cirrus clouds show almost exclusively low optical depths (t < 0.03 in 90% of cases) typical of subvisible clouds. Results suggest that the occurrence of intertropopause cirrus clouds is correlated with the frequency of multiple tropopauses. Citation: Noe ¨l, V., and M. Haeffelin (2007), Midlatitude cirrus clouds and multiple tropopauses from a 2002 – 2006 climatology over the SIRTA observatory, J. Geophys. Res., 112, D13206, doi:10.1029/2006JD007753. 1. Introduction [2] Clouds have been identified by the Intergovernmental Panel on Climate Change (IPCC) [2001] as one of the most important problems to tackle regarding climate predic- tion [IPCC, 2001], as their radiative and dynamic influence on the Earth’s climate is complex and not yet fully under- stood. Exercises in climate model comparison reveal diver- gences even in the sign of cloud feedback to CO 2 doubling scenarios [e.g., Cess et al., 1990; Bony et al., 2004]. The role of high-altitude ice clouds, hereinafter referred to as cirrus clouds, is particularly difficult to characterize. As they are optically thin (i.e., semitransparent), they often lie below the detection threshold of most passive remote- sensing instruments such as those present on meteorolo- gical and research satellite systems. Recent studies suggest the existence of an entire population of subvisible ice clouds [Nee et al., 1998; Goldfarb et al., 2001] whose radiative influence [Prabhakara et al., 1988] is totally overlooked in current radiative budget calculations. Addi- tionally, the optical and microphysical properties of cirrus clouds are extremely variable [Cantrell and Heymsfield, 2005]. Hence it is difficult to ascertain if their properties can be correctly parameterized at small or large scales, as they strongly depend on local phenomena, even when only considering latitude-constrained areas [Heymsfield and Miloshevich, 2003]. Since recent results suggest that cirrus cloud cover may be increasing because of human activities [Zerefos et al., 2003; Minnis et al., 2004], improving our knowledge of these clouds is a current and important issue. [3] The conditions in terms of thermodynamics, dynamics, and ice-forming nuclei are key elements that influence the formation of high-altitude tropospheric clouds [Sassen, 1992; Mace et al., 2001; Korolev et al., 2003]. Since cirrus clouds are found at high altitudes, their formation process and further evolution can be sensitive to atmospheric conditions in the upper troposphere and lower stratosphere (UTLS). Studying UTLS conditions could give hints on what drives cirrus cloud formation and how to better predict their properties. The tropopause temperature inversion has a constraining effect on cloud altitude, and several studies have focused on the properties of cirrus clouds near the tropopause, especially at tropical latitudes [McFarquhar et al., 2000; Peter et al., 2003; Garrett et al., 2005]. Hence variability in the thermodynamic structure of the tropopause could affect the properties of cirrus clouds near the UTLS transition. One such structure is the occurrence of multiple inversions in the UTLS area resulting in the formation of multiple tropopauses (MT). More than just a theoretical concept, multiple tropopauses are symptoms of actual physical phenomena (section 3) that can help detect and analyze specific atmospheric conditions of cloud formation. JOURNAL OF GEOPHYSICAL RESEARCH, VOL. 112, D13206, doi:10.1029/2006JD007753, 2007 Click Here for Full Articl e 1 Institut Pierre-Simon Laplace/Laboratoire de Me ´te ´orologie Dynamique, Ecole Polytechnique, Palaiseau, France. Copyright 2007 by the American Geophysical Union. 0148-0227/07/2006JD007753$09.00 D13206 1 of 11

Welcome message from author
This document is posted to help you gain knowledge. Please leave a comment to let me know what you think about it! Share it to your friends and learn new things together.
Transcript
Midlatitude cirrus clouds and multiple tropopauses from a
2002–2006 climatology over the SIRTA observatory
Vincent Noel1 and Martial Haeffelin1
Received 5 July 2006; revised 10 January 2007; accepted 13 February 2007; published 10 July 2007.
[1] This study presents a comparison of lidar observations of midlatitude cirrus cloudsover the Site Instrumental de Recherche par Teledetection Atmospherique (SIRTA)observatory between 2002 and 2006 with multiple tropopauses (MT) retrieved fromradiosounding temperature profiles. The temporal variability of MT properties (frequency,thickness) are discussed. Results show a marked annual cycle, with MT frequencyreaching its lowest point in May (�18% occurrence of MT) and slowly rising to more than40% in December, January, and February (DJF). The average thickness of the MT alsofollows an annual cycle, going from less than 1 km in spring to 1.5 km in late autumn.Comparison with lidar observations show that cirrus clouds show a preference forbeing located close below the first tropopause. When the cloud top is above the firsttropopause (7% of observations), in 20% of cases, the cloud base is above it as well,resulting in a cirrus cloud ‘‘sandwiched’’ between the two tropopauses. Compared with thegeneral distribution of cirrus, cross-tropopause cirrus clouds show a higher frequency oflarge optical depths, while intertropopause cirrus clouds show almost exclusively lowoptical depths (t < 0.03 in 90% of cases) typical of subvisible clouds. Results suggest thatthe occurrence of intertropopause cirrus clouds is correlated with the frequency of multipletropopauses.
Citation: Noel, V., and M. Haeffelin (2007), Midlatitude cirrus clouds and multiple tropopauses from a 2002–2006 climatology over
the SIRTA observatory, J. Geophys. Res., 112, D13206, doi:10.1029/2006JD007753.
1. Introduction
[2] Clouds have been identified by the IntergovernmentalPanel on Climate Change (IPCC) [2001] as one of themost important problems to tackle regarding climate predic-tion [IPCC, 2001], as their radiative and dynamic influenceon the Earth’s climate is complex and not yet fully under-stood. Exercises in climate model comparison reveal diver-gences even in the sign of cloud feedback to CO2 doublingscenarios [e.g., Cess et al., 1990; Bony et al., 2004]. Therole of high-altitude ice clouds, hereinafter referred to ascirrus clouds, is particularly difficult to characterize. Asthey are optically thin (i.e., semitransparent), they often liebelow the detection threshold of most passive remote-sensing instruments such as those present on meteorolo-gical and research satellite systems. Recent studies suggestthe existence of an entire population of subvisible iceclouds [Nee et al., 1998; Goldfarb et al., 2001] whoseradiative influence [Prabhakara et al., 1988] is totallyoverlooked in current radiative budget calculations. Addi-tionally, the optical and microphysical properties of cirrusclouds are extremely variable [Cantrell and Heymsfield,2005]. Hence it is difficult to ascertain if their propertiescan be correctly parameterized at small or large scales, as
they strongly depend on local phenomena, even when onlyconsidering latitude-constrained areas [Heymsfield andMiloshevich, 2003]. Since recent results suggest that cirruscloud cover may be increasing because of human activities[Zerefos et al., 2003; Minnis et al., 2004], improving ourknowledge of these clouds is a current and important issue.[3] The conditions in terms of thermodynamics, dynamics,
and ice-forming nuclei are key elements that influence theformation of high-altitude tropospheric clouds [Sassen, 1992;Mace et al., 2001; Korolev et al., 2003]. Since cirrus cloudsare found at high altitudes, their formation process andfurther evolution can be sensitive to atmospheric conditionsin the upper troposphere and lower stratosphere (UTLS).Studying UTLS conditions could give hints on what drivescirrus cloud formation and how to better predict theirproperties. The tropopause temperature inversion has aconstraining effect on cloud altitude, and several studieshave focused on the properties of cirrus clouds near thetropopause, especially at tropical latitudes [McFarquharet al., 2000; Peter et al., 2003; Garrett et al., 2005]. Hencevariability in the thermodynamic structure of the tropopausecould affect the properties of cirrus clouds near the UTLStransition. One such structure is the occurrence of multipleinversions in the UTLS area resulting in the formation ofmultiple tropopauses (MT). More than just a theoreticalconcept, multiple tropopauses are symptoms of actualphysical phenomena (section 3) that can help detect andanalyze specific atmospheric conditions of cloud formation.
JOURNAL OF GEOPHYSICAL RESEARCH, VOL. 112, D13206, doi:10.1029/2006JD007753, 2007ClickHere
for
FullArticle
1Institut Pierre-Simon Laplace/Laboratoire deMeteorologie Dynamique,Ecole Polytechnique, Palaiseau, France.
Copyright 2007 by the American Geophysical Union.0148-0227/07/2006JD007753$09.00
D13206 1 of 11
[4] This paper presents a study of MT at midlatitudes andinvestigates their possible influence on the occurrence, per-sistence, and optical properties of high-altitude troposphericclouds. The observation data set and the retrieval techniquesare presented in section 2. Statistical properties of theretrieved MT are presented in section 3 and compared toexisting literature. The frequency of occurrence and proper-ties of cirrus clouds in case of MT are then compared to therest of the database in section 4. Results are discussed andconclusion is given in section 5.
2. Observations
[5] To investigate a possible relationship between multi-ple tropopauses and ice clouds, the present study usescollocated in situ and remote-sensing observations madebetween 2002 and 2006. Tropopause levels were retrievedfrom temperature profiles obtained through a data set ofradiosoundings launched twice daily (00 and 12 UT) fromthe Meteo France Trappes regional center (48.8�N, 2.0�E),20 km to the west of Paris. The data set contains over 3000radiosonde profiles gathered over the same period. Thesimultaneous study of ice clouds involved finding a datasource suited to the detection and analysis of optically thinclouds.[6] During the past decades, numerous techniques have
been developed to detect cloud occurrences from, forexample, passive remote-sensing observations by space-borne radiometers [Rossow and Garder, 1993]. Thesemethods are generally successful in estimating the spatialand temporal coverage of clouds with moderate to highoptical depths t. However, because of their limited opticalthickness, ice clouds are usually difficult to detect via theseconventional means. Especially in the lower end of opticalthickness, subvisible cirrus (t < 0.03) account for more than20% of cirrus clouds [Goldfarb et al., 2001] but are in effectinvisible to passive remote sensing, typically limited tooptical depths above 0.1 [Stordal et al., 2005]. In addition,several studies have shown that retrievals of high-altitudecloud properties using passive cloud-imager data, such ascloud-top height [e.g., Naud et al., 2004; Daloze andHaeffelin, 2005] or microphysical properties [e.g., Chiriacoet al., 2004], can include significant biases due to thesemitransparent nature of those clouds. This precludes theuse of passive remote-sensing data to study interactionsbetween the thermodynamic structure near the UTLS andcirrus cloud properties. Other observations are thereforerequired to obtain a realistic estimate of the ice cloud cover,and lidar measurements have become the de facto standardwhen considering this particular problem, thanks to theirhigh sensitivity to optically thin atmospheric layers. More-over, most modern lidar systems are equipped with theability to read the polarization state of the backscatteredlight [Sassen, 1991], providing insights into the cloud phase[Wang and Sassen, 2001] and microphysical properties(e.g., ice crystal shapes, Noel et al. [2006]).[7] In the present paper, lidar observations are provided
by the 532-nm Lidar Nuages Aerosols (LNA) lidar systemlocated at the Site Instrumental de Recherche par Tele-detection Atmospherique (SIRTA) Observatory (48.71�N,2.21�E, Haeffelin et al. [2005]), 15 km east of Trappes. Thislidar features a narrow field-of-view telescope (0.5 mrad),
dedicated to the observation of high-altitude troposphericclouds, and is equipped to retrieve 20 vertical profiles ofbackscattered light and depolarization ratio d by second,with a 15-meter resolution. The first lidar observationsstored in the SIRTA database date back to 2002 [Matthiaset al., 2004], and routine operation (5 days a week) wasinitiated in 2004, totaling today more than 500 days ofobservations. The STRAT algorithm [Morille et al., 2006]was applied (1) on the backscattered light profiles toseparate cloud layers from the molecular background (usingwavelet transform analysis) and (2) on the depolarizationratio to unequivocally flag ice clouds (only clouds producingvalues of d >0.2 were considered). Optical depths were thenretrieved for ice cloud layers using a standard transmission-loss algorithm [e.g., Platt, 1973; Platt et al., 1998]. Thisalgorithm derives the extinction produced by a given cloudlayer (hence, its optical depth) by comparing the molecularbackscatter in the free troposphere above and below the layer.This requires a significant signal-to-noise ratio above thegiven layer; that is, only layers that were penetrated all theway through by the lidar were considered. This criterionmeans that a lot of cloud layers were discarded in the process;it is assumed that the volume of observations is still sufficientto paint an accurate representation of cirrus clouds.
3. Multiple Tropopauses Over the SIRTA
[8] Despite its central role in atmospheric sciences, thetropopause can still behave in unusual, surprising ways. Forinstance, depressions at midlatitudes (e.g., on the Eastern UScoast) can drag cold air masses from the arctic, resulting onoccasion in tropopauses as low as 6 km. In the tropics, theseparation between the troposphere and the stratosphere isoften defined as the point of temperature minimum, but inmidlatitude regions, the thermal structure of the tropopauselayer can be quite complex. The thermal or lapse-ratetropopause definition is based on the variability in lapse rate(�dT/dZ) in an atmospheric temperature profile. In the mostcommonly used definition, the conventional tropopause isdefined by the World Meteorological Organization (WMO)[1957] as the ‘‘lowest level at which the lapse rate decreasesto 2�C/km or less, provided also the averaged lapse ratebetween this level and all higher levels within 2 km does notexceed 2�C/km’’. However, the WMO definition also allowsadditional tropopauses above the first one if the average lapserate between any level above the first tropopause and allhigher levels within 1 km exceeds 3�C/km. This technicaldefinition, which is used in the rest of the present study,actually reflects dynamical disturbances to the temperatureprofile (e.g., jet streams or upper-level fronts, Nastrom et al.[1989]) resulting in multiple temperature inversions in theUTLS [Shapiro, 1980] that can lead to tropopause foldings[Sprenger et al., 2003] and mixing of stratospheric andtropospheric air [Hoinka, 1998]. According to a recentclimatology of MT using Global Positioning System radiooccultation data between 2001 and 2004 [Schmidt et al.,2006], MT frequency and thickness (defined as the altitudedifference between the lowest and the highest tropopauses)exhibit a strong dependence on latitude and season. Theirresults show the occurrence of MT is almost null near theequator (20�S to 20�N), while it varies between 80% (DJF)and 45% [June, July, and August (JJA)] at 40�N. The
D13206 NOEL AND HAEFFELIN: CIRRUS CLOUDS AND MULTIPLE TROPOPAUSES
2 of 11
D13206
seasonal dependency is less intense in the southern hemi-sphere, but occurrences of �70% are still reached in thesouthern hemisphere winter (JJA).MT thickness is correlatedto MT occurrence frequency, reaching maxima of 5.2 km at40�N (DJF) and 4.0 km at 40�S (JJA).[9] Analysis of temperature profiles from the Trappes
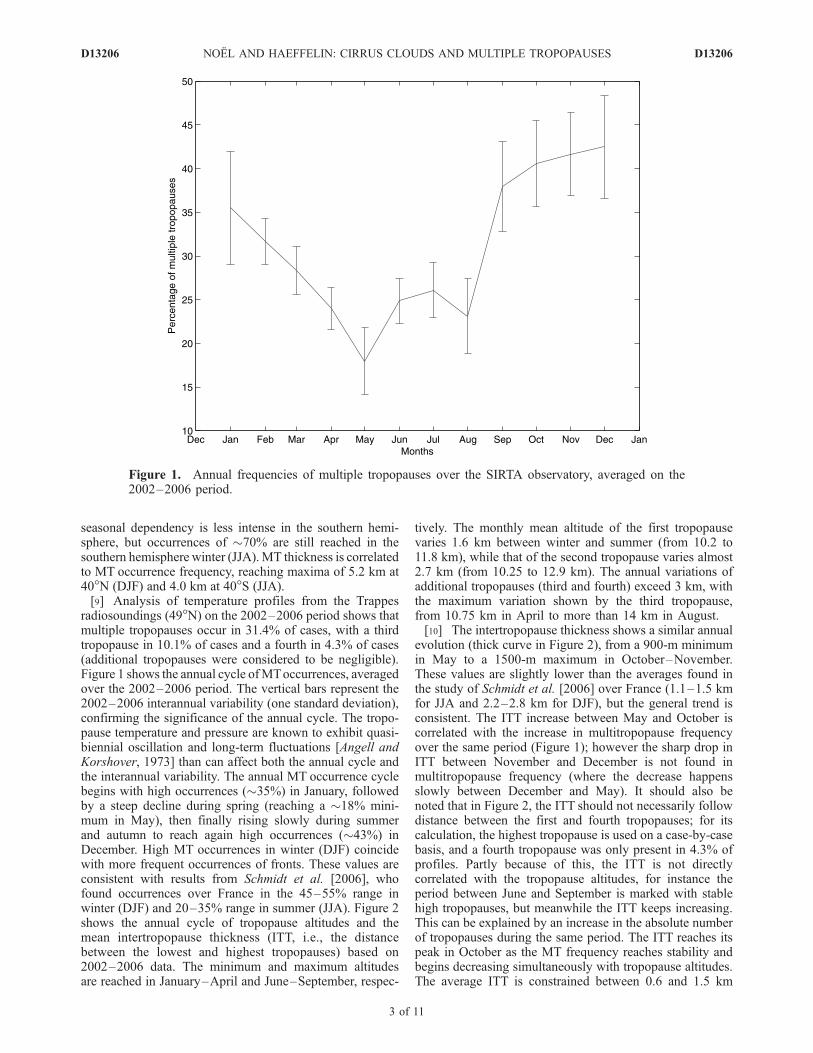
radiosoundings (49�N) on the 2002–2006 period shows thatmultiple tropopauses occur in 31.4% of cases, with a thirdtropopause in 10.1% of cases and a fourth in 4.3% of cases(additional tropopauses were considered to be negligible).Figure 1 shows the annual cycle ofMToccurrences, averagedover the 2002–2006 period. The vertical bars represent the2002–2006 interannual variability (one standard deviation),confirming the significance of the annual cycle. The tropo-pause temperature and pressure are known to exhibit quasi-biennial oscillation and long-term fluctuations [Angell andKorshover, 1973] than can affect both the annual cycle andthe interannual variability. The annual MT occurrence cyclebegins with high occurrences (�35%) in January, followedby a steep decline during spring (reaching a �18% mini-mum in May), then finally rising slowly during summerand autumn to reach again high occurrences (�43%) inDecember. High MT occurrences in winter (DJF) coincidewith more frequent occurrences of fronts. These values areconsistent with results from Schmidt et al. [2006], whofound occurrences over France in the 45–55% range inwinter (DJF) and 20–35% range in summer (JJA). Figure 2shows the annual cycle of tropopause altitudes and themean intertropopause thickness (ITT, i.e., the distancebetween the lowest and highest tropopauses) based on2002–2006 data. The minimum and maximum altitudesare reached in January–April and June–September, respec-
tively. The monthly mean altitude of the first tropopausevaries 1.6 km between winter and summer (from 10.2 to11.8 km), while that of the second tropopause varies almost2.7 km (from 10.25 to 12.9 km). The annual variations ofadditional tropopauses (third and fourth) exceed 3 km, withthe maximum variation shown by the third tropopause,from 10.75 km in April to more than 14 km in August.[10] The intertropopause thickness shows a similar annual
evolution (thick curve in Figure 2), from a 900-m minimumin May to a 1500-m maximum in October–November.These values are slightly lower than the averages found inthe study of Schmidt et al. [2006] over France (1.1–1.5 kmfor JJA and 2.2–2.8 km for DJF), but the general trend isconsistent. The ITT increase between May and October iscorrelated with the increase in multitropopause frequencyover the same period (Figure 1); however the sharp drop inITT between November and December is not found inmultitropopause frequency (where the decrease happensslowly between December and May). It should also benoted that in Figure 2, the ITT should not necessarily followdistance between the first and fourth tropopauses; for itscalculation, the highest tropopause is used on a case-by-casebasis, and a fourth tropopause was only present in 4.3% ofprofiles. Partly because of this, the ITT is not directlycorrelated with the tropopause altitudes, for instance theperiod between June and September is marked with stablehigh tropopauses, but meanwhile the ITT keeps increasing.This can be explained by an increase in the absolute numberof tropopauses during the same period. The ITT reaches itspeak in October as the MT frequency reaches stability andbegins decreasing simultaneously with tropopause altitudes.The average ITT is constrained between 0.6 and 1.5 km
Figure 1. Annual frequencies of multiple tropopauses over the SIRTA observatory, averaged on the2002–2006 period.
D13206 NOEL AND HAEFFELIN: CIRRUS CLOUDS AND MULTIPLE TROPOPAUSES
3 of 11
D13206
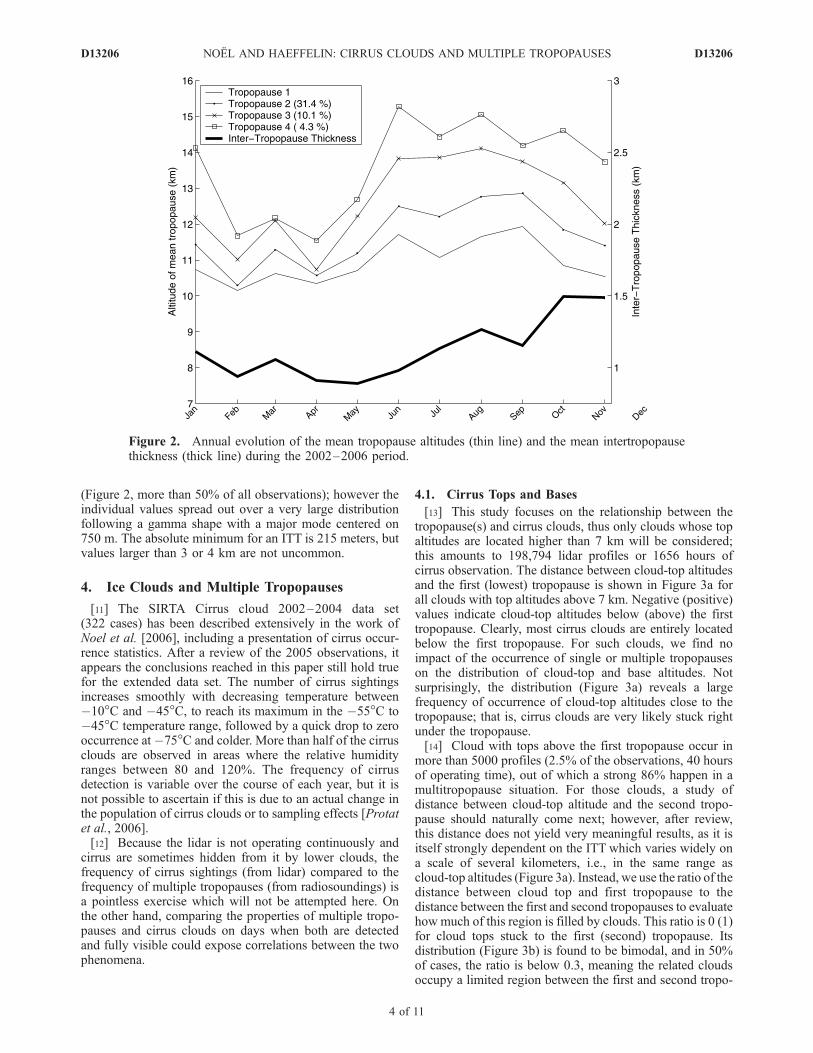
(Figure 2, more than 50% of all observations); however theindividual values spread out over a very large distributionfollowing a gamma shape with a major mode centered on750 m. The absolute minimum for an ITT is 215 meters, butvalues larger than 3 or 4 km are not uncommon.
4. Ice Clouds and Multiple Tropopauses
[11] The SIRTA Cirrus cloud 2002–2004 data set(322 cases) has been described extensively in the work ofNoel et al. [2006], including a presentation of cirrus occur-rence statistics. After a review of the 2005 observations, itappears the conclusions reached in this paper still hold truefor the extended data set. The number of cirrus sightingsincreases smoothly with decreasing temperature between�10�C and �45�C, to reach its maximum in the �55�C to�45�C temperature range, followed by a quick drop to zerooccurrence at�75�C and colder. More than half of the cirrusclouds are observed in areas where the relative humidityranges between 80 and 120%. The frequency of cirrusdetection is variable over the course of each year, but it isnot possible to ascertain if this is due to an actual change inthe population of cirrus clouds or to sampling effects [Protatet al., 2006].[12] Because the lidar is not operating continuously and
cirrus are sometimes hidden from it by lower clouds, thefrequency of cirrus sightings (from lidar) compared to thefrequency of multiple tropopauses (from radiosoundings) isa pointless exercise which will not be attempted here. Onthe other hand, comparing the properties of multiple tropo-pauses and cirrus clouds on days when both are detectedand fully visible could expose correlations between the twophenomena.
4.1. Cirrus Tops and Bases
[13] This study focuses on the relationship between thetropopause(s) and cirrus clouds, thus only clouds whose topaltitudes are located higher than 7 km will be considered;this amounts to 198,794 lidar profiles or 1656 hours ofcirrus observation. The distance between cloud-top altitudesand the first (lowest) tropopause is shown in Figure 3a forall clouds with top altitudes above 7 km. Negative (positive)values indicate cloud-top altitudes below (above) the firsttropopause. Clearly, most cirrus clouds are entirely locatedbelow the first tropopause. For such clouds, we find noimpact of the occurrence of single or multiple tropopauseson the distribution of cloud-top and base altitudes. Notsurprisingly, the distribution (Figure 3a) reveals a largefrequency of occurrence of cloud-top altitudes close to thetropopause; that is, cirrus clouds are very likely stuck rightunder the tropopause.[14] Cloud with tops above the first tropopause occur in
more than 5000 profiles (2.5% of the observations, 40 hoursof operating time), out of which a strong 86% happen in amultitropopause situation. For those clouds, a study ofdistance between cloud-top altitude and the second tropo-pause should naturally come next; however, after review,this distance does not yield very meaningful results, as it isitself strongly dependent on the ITT which varies widely ona scale of several kilometers, i.e., in the same range ascloud-top altitudes (Figure 3a). Instead, we use the ratio of thedistance between cloud top and first tropopause to thedistance between the first and second tropopauses to evaluatehow much of this region is filled by clouds. This ratio is 0 (1)for cloud tops stuck to the first (second) tropopause. Itsdistribution (Figure 3b) is found to be bimodal, and in 50%of cases, the ratio is below 0.3, meaning the related cloudsoccupy a limited region between the first and second tropo-
Figure 2. Annual evolution of the mean tropopause altitudes (thin line) and the mean intertropopausethickness (thick line) during the 2002–2006 period.
D13206 NOEL AND HAEFFELIN: CIRRUS CLOUDS AND MULTIPLE TROPOPAUSES
4 of 11
D13206
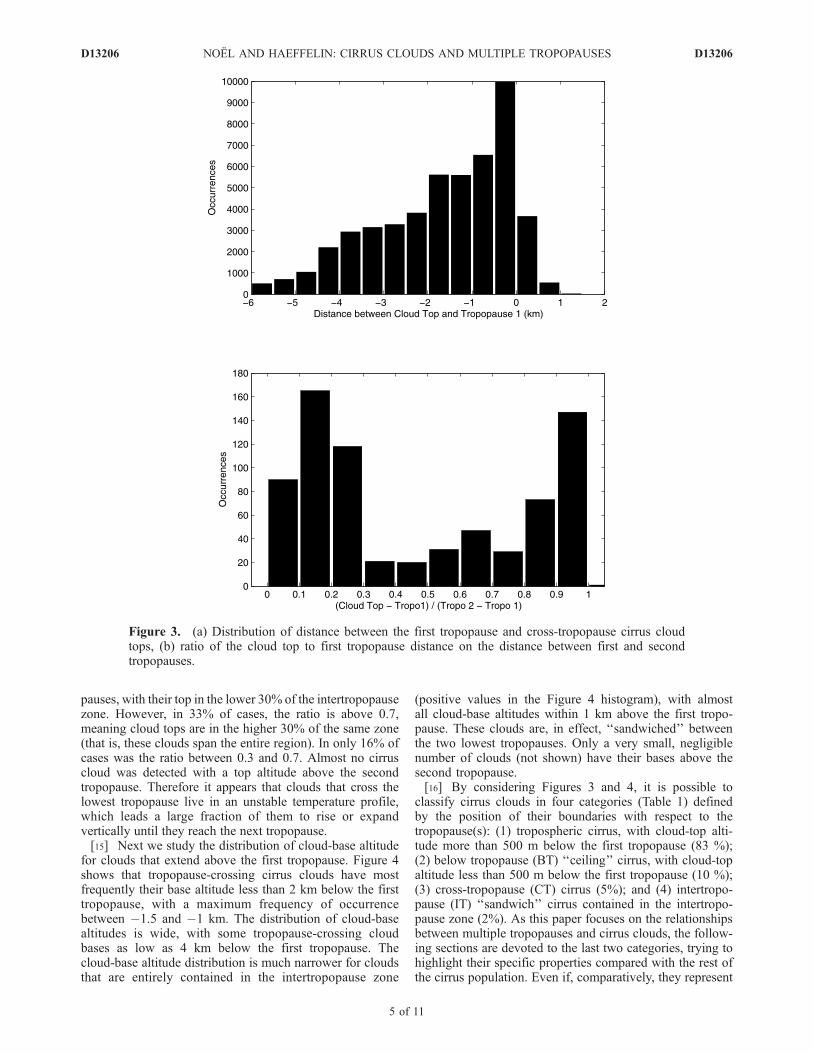
pauses, with their top in the lower 30% of the intertropopausezone. However, in 33% of cases, the ratio is above 0.7,meaning cloud tops are in the higher 30% of the same zone(that is, these clouds span the entire region). In only 16% ofcases was the ratio between 0.3 and 0.7. Almost no cirruscloud was detected with a top altitude above the secondtropopause. Therefore it appears that clouds that cross thelowest tropopause live in an unstable temperature profile,which leads a large fraction of them to rise or expandvertically until they reach the next tropopause.[15] Next we study the distribution of cloud-base altitude
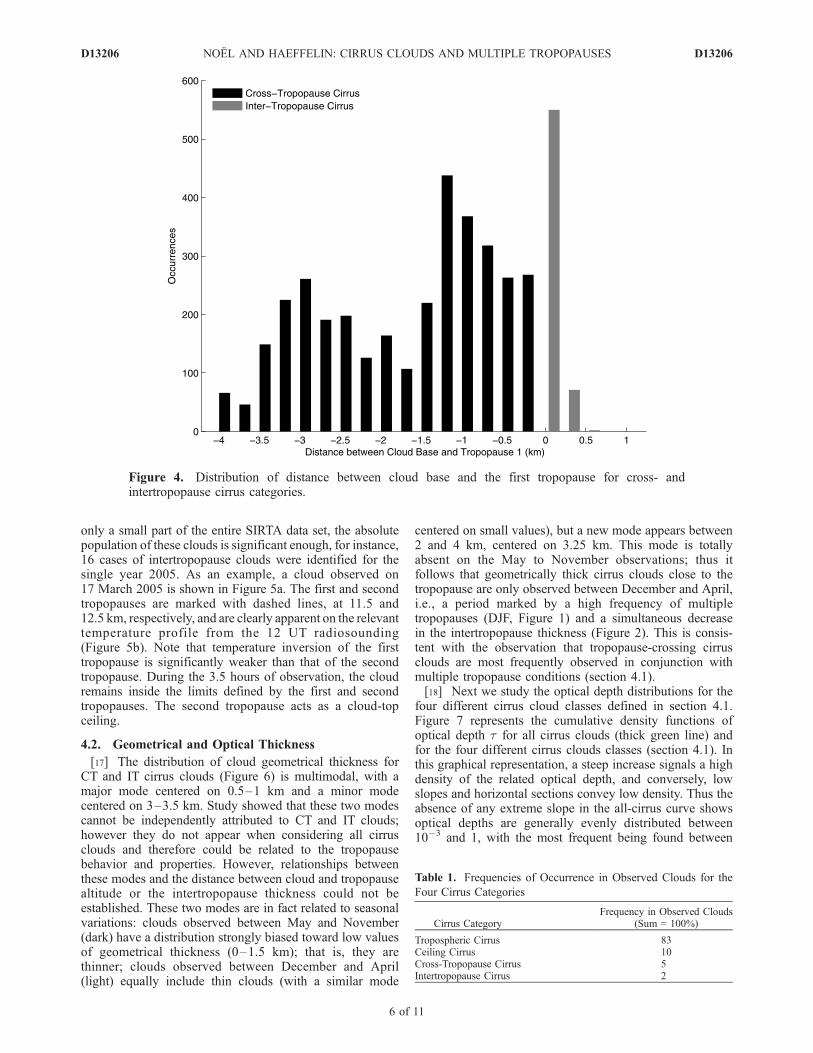
for clouds that extend above the first tropopause. Figure 4shows that tropopause-crossing cirrus clouds have mostfrequently their base altitude less than 2 km below the firsttropopause, with a maximum frequency of occurrencebetween �1.5 and �1 km. The distribution of cloud-basealtitudes is wide, with some tropopause-crossing cloudbases as low as 4 km below the first tropopause. Thecloud-base altitude distribution is much narrower for cloudsthat are entirely contained in the intertropopause zone
(positive values in the Figure 4 histogram), with almostall cloud-base altitudes within 1 km above the first tropo-pause. These clouds are, in effect, ‘‘sandwiched’’ betweenthe two lowest tropopauses. Only a very small, negligiblenumber of clouds (not shown) have their bases above thesecond tropopause.[16] By considering Figures 3 and 4, it is possible to
classify cirrus clouds in four categories (Table 1) definedby the position of their boundaries with respect to thetropopause(s): (1) tropospheric cirrus, with cloud-top alti-tude more than 500 m below the first tropopause (83 %);(2) below tropopause (BT) ‘‘ceiling’’ cirrus, with cloud-topaltitude less than 500 m below the first tropopause (10 %);(3) cross-tropopause (CT) cirrus (5%); and (4) intertropo-pause (IT) ‘‘sandwich’’ cirrus contained in the intertropo-pause zone (2%). As this paper focuses on the relationshipsbetween multiple tropopauses and cirrus clouds, the follow-ing sections are devoted to the last two categories, trying tohighlight their specific properties compared with the rest ofthe cirrus population. Even if, comparatively, they represent
Figure 3. (a) Distribution of distance between the first tropopause and cross-tropopause cirrus cloudtops, (b) ratio of the cloud top to first tropopause distance on the distance between first and secondtropopauses.
D13206 NOEL AND HAEFFELIN: CIRRUS CLOUDS AND MULTIPLE TROPOPAUSES
5 of 11
D13206
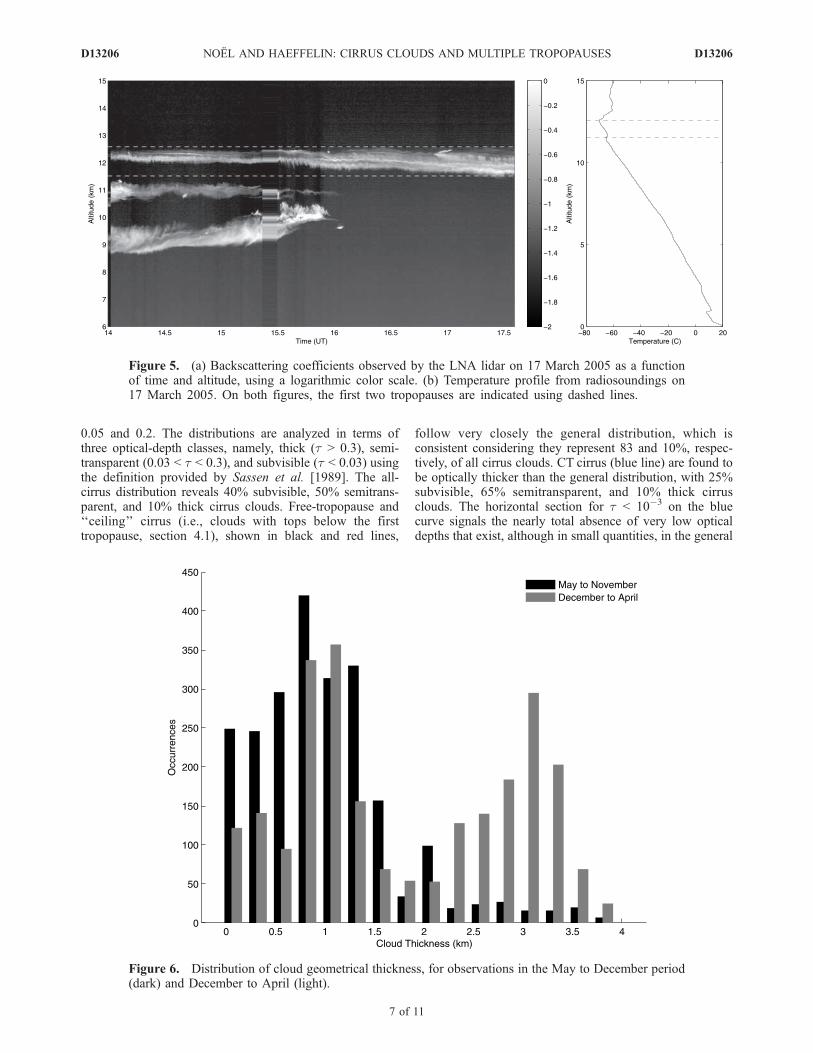
only a small part of the entire SIRTA data set, the absolutepopulation of these clouds is significant enough, for instance,16 cases of intertropopause clouds were identified for thesingle year 2005. As an example, a cloud observed on17 March 2005 is shown in Figure 5a. The first and secondtropopauses are marked with dashed lines, at 11.5 and12.5 km, respectively, and are clearly apparent on the relevanttemperature profile from the 12 UT radiosounding(Figure 5b). Note that temperature inversion of the firsttropopause is significantly weaker than that of the secondtropopause. During the 3.5 hours of observation, the cloudremains inside the limits defined by the first and secondtropopauses. The second tropopause acts as a cloud-topceiling.
4.2. Geometrical and Optical Thickness
[17] The distribution of cloud geometrical thickness forCT and IT cirrus clouds (Figure 6) is multimodal, with amajor mode centered on 0.5–1 km and a minor modecentered on 3–3.5 km. Study showed that these two modescannot be independently attributed to CT and IT clouds;however they do not appear when considering all cirrusclouds and therefore could be related to the tropopausebehavior and properties. However, relationships betweenthese modes and the distance between cloud and tropopausealtitude or the intertropopause thickness could not beestablished. These two modes are in fact related to seasonalvariations: clouds observed between May and November(dark) have a distribution strongly biased toward low valuesof geometrical thickness (0–1.5 km); that is, they arethinner; clouds observed between December and April(light) equally include thin clouds (with a similar mode
centered on small values), but a new mode appears between2 and 4 km, centered on 3.25 km. This mode is totallyabsent on the May to November observations; thus itfollows that geometrically thick cirrus clouds close to thetropopause are only observed between December and April,i.e., a period marked by a high frequency of multipletropopauses (DJF, Figure 1) and a simultaneous decreasein the intertropopause thickness (Figure 2). This is consis-tent with the observation that tropopause-crossing cirrusclouds are most frequently observed in conjunction withmultiple tropopause conditions (section 4.1).[18] Next we study the optical depth distributions for the
four different cirrus cloud classes defined in section 4.1.Figure 7 represents the cumulative density functions ofoptical depth t for all cirrus clouds (thick green line) andfor the four different cirrus clouds classes (section 4.1). Inthis graphical representation, a steep increase signals a highdensity of the related optical depth, and conversely, lowslopes and horizontal sections convey low density. Thus theabsence of any extreme slope in the all-cirrus curve showsoptical depths are generally evenly distributed between10�3 and 1, with the most frequent being found between
Figure 4. Distribution of distance between cloud base and the first tropopause for cross- andintertropopause cirrus categories.
Table 1. Frequencies of Occurrence in Observed Clouds for the
Four Cirrus Categories
Cirrus CategoryFrequency in Observed Clouds
(Sum = 100%)
Tropospheric Cirrus 83Ceiling Cirrus 10Cross-Tropopause Cirrus 5Intertropopause Cirrus 2
D13206 NOEL AND HAEFFELIN: CIRRUS CLOUDS AND MULTIPLE TROPOPAUSES
6 of 11
D13206
0.05 and 0.2. The distributions are analyzed in terms ofthree optical-depth classes, namely, thick (t > 0.3), semi-transparent (0.03 < t < 0.3), and subvisible (t < 0.03) usingthe definition provided by Sassen et al. [1989]. The all-cirrus distribution reveals 40% subvisible, 50% semitrans-parent, and 10% thick cirrus clouds. Free-tropopause and‘‘ceiling’’ cirrus (i.e., clouds with tops below the firsttropopause, section 4.1), shown in black and red lines,
follow very closely the general distribution, which isconsistent considering they represent 83 and 10%, respec-tively, of all cirrus clouds. CT cirrus (blue line) are found tobe optically thicker than the general distribution, with 25%subvisible, 65% semitransparent, and 10% thick cirrusclouds. The horizontal section for t < 10�3 on the bluecurve signals the nearly total absence of very low opticaldepths that exist, although in small quantities, in the general
Figure 6. Distribution of cloud geometrical thickness, for observations in the May to December period(dark) and December to April (light).
Figure 5. (a) Backscattering coefficients observed by the LNA lidar on 17 March 2005 as a functionof time and altitude, using a logarithmic color scale. (b) Temperature profile from radiosoundings on17 March 2005. On both figures, the first two tropopauses are indicated using dashed lines.
D13206 NOEL AND HAEFFELIN: CIRRUS CLOUDS AND MULTIPLE TROPOPAUSES
7 of 11
D13206
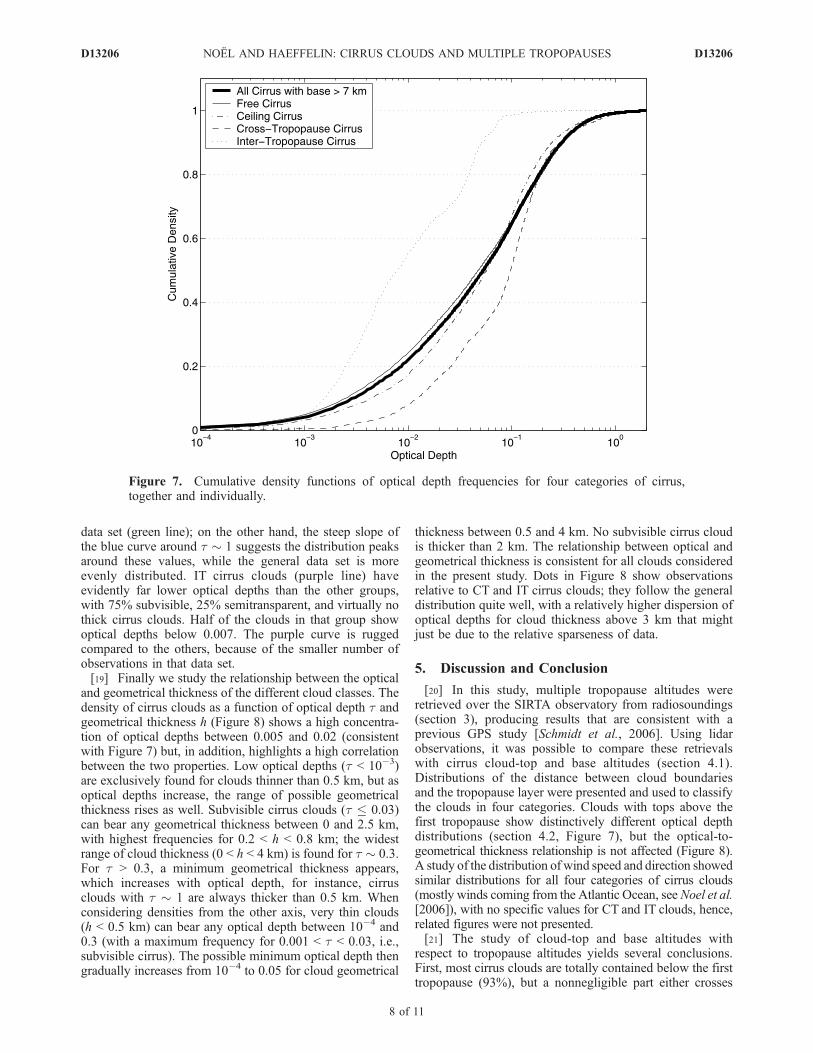
data set (green line); on the other hand, the steep slope ofthe blue curve around t � 1 suggests the distribution peaksaround these values, while the general data set is moreevenly distributed. IT cirrus clouds (purple line) haveevidently far lower optical depths than the other groups,with 75% subvisible, 25% semitransparent, and virtually nothick cirrus clouds. Half of the clouds in that group showoptical depths below 0.007. The purple curve is ruggedcompared to the others, because of the smaller number ofobservations in that data set.[19] Finally we study the relationship between the optical
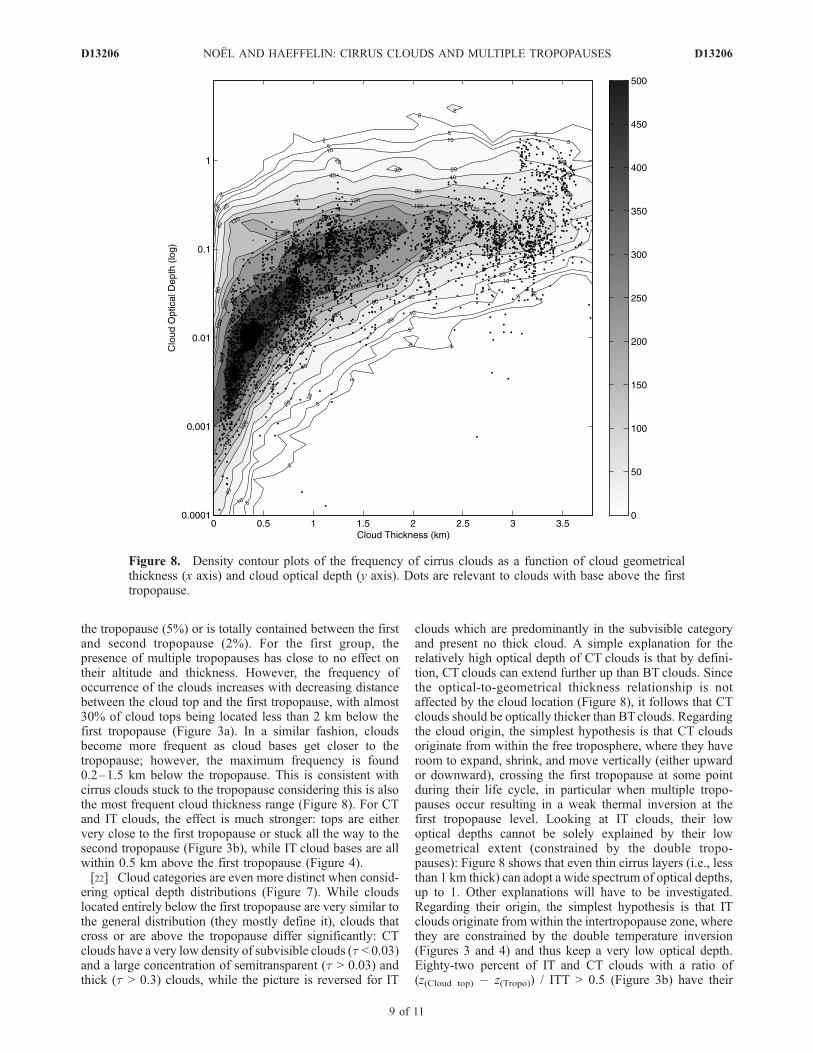
and geometrical thickness of the different cloud classes. Thedensity of cirrus clouds as a function of optical depth t andgeometrical thickness h (Figure 8) shows a high concentra-tion of optical depths between 0.005 and 0.02 (consistentwith Figure 7) but, in addition, highlights a high correlationbetween the two properties. Low optical depths (t < 10�3)are exclusively found for clouds thinner than 0.5 km, but asoptical depths increase, the range of possible geometricalthickness rises as well. Subvisible cirrus clouds (t � 0.03)can bear any geometrical thickness between 0 and 2.5 km,with highest frequencies for 0.2 < h < 0.8 km; the widestrange of cloud thickness (0 < h < 4 km) is found for t � 0.3.For t > 0.3, a minimum geometrical thickness appears,which increases with optical depth, for instance, cirrusclouds with t � 1 are always thicker than 0.5 km. Whenconsidering densities from the other axis, very thin clouds(h < 0.5 km) can bear any optical depth between 10�4 and0.3 (with a maximum frequency for 0.001 < t < 0.03, i.e.,subvisible cirrus). The possible minimum optical depth thengradually increases from 10�4 to 0.05 for cloud geometrical
thickness between 0.5 and 4 km. No subvisible cirrus cloudis thicker than 2 km. The relationship between optical andgeometrical thickness is consistent for all clouds consideredin the present study. Dots in Figure 8 show observationsrelative to CT and IT cirrus clouds; they follow the generaldistribution quite well, with a relatively higher dispersion ofoptical depths for cloud thickness above 3 km that mightjust be due to the relative sparseness of data.
5. Discussion and Conclusion
[20] In this study, multiple tropopause altitudes wereretrieved over the SIRTA observatory from radiosoundings(section 3), producing results that are consistent with aprevious GPS study [Schmidt et al., 2006]. Using lidarobservations, it was possible to compare these retrievalswith cirrus cloud-top and base altitudes (section 4.1).Distributions of the distance between cloud boundariesand the tropopause layer were presented and used to classifythe clouds in four categories. Clouds with tops above thefirst tropopause show distinctively different optical depthdistributions (section 4.2, Figure 7), but the optical-to-geometrical thickness relationship is not affected (Figure 8).A study of the distribution of wind speed and direction showedsimilar distributions for all four categories of cirrus clouds(mostly winds coming from the Atlantic Ocean, seeNoel et al.[2006]), with no specific values for CT and IT clouds, hence,related figures were not presented.[21] The study of cloud-top and base altitudes with
respect to tropopause altitudes yields several conclusions.First, most cirrus clouds are totally contained below the firsttropopause (93%), but a nonnegligible part either crosses
Figure 7. Cumulative density functions of optical depth frequencies for four categories of cirrus,together and individually.
D13206 NOEL AND HAEFFELIN: CIRRUS CLOUDS AND MULTIPLE TROPOPAUSES
8 of 11
D13206
the tropopause (5%) or is totally contained between the firstand second tropopause (2%). For the first group, thepresence of multiple tropopauses has close to no effect ontheir altitude and thickness. However, the frequency ofoccurrence of the clouds increases with decreasing distancebetween the cloud top and the first tropopause, with almost30% of cloud tops being located less than 2 km below thefirst tropopause (Figure 3a). In a similar fashion, cloudsbecome more frequent as cloud bases get closer to thetropopause; however, the maximum frequency is found0.2–1.5 km below the tropopause. This is consistent withcirrus clouds stuck to the tropopause considering this is alsothe most frequent cloud thickness range (Figure 8). For CTand IT clouds, the effect is much stronger: tops are eithervery close to the first tropopause or stuck all the way to thesecond tropopause (Figure 3b), while IT cloud bases are allwithin 0.5 km above the first tropopause (Figure 4).[22] Cloud categories are even more distinct when consid-
ering optical depth distributions (Figure 7). While cloudslocated entirely below the first tropopause are very similar tothe general distribution (they mostly define it), clouds thatcross or are above the tropopause differ significantly: CTclouds have a very low density of subvisible clouds (t < 0.03)and a large concentration of semitransparent (t > 0.03) andthick (t > 0.3) clouds, while the picture is reversed for IT
clouds which are predominantly in the subvisible categoryand present no thick cloud. A simple explanation for therelatively high optical depth of CT clouds is that by defini-tion, CT clouds can extend further up than BT clouds. Sincethe optical-to-geometrical thickness relationship is notaffected by the cloud location (Figure 8), it follows that CTclouds should be optically thicker than BTclouds. Regardingthe cloud origin, the simplest hypothesis is that CT cloudsoriginate from within the free troposphere, where they haveroom to expand, shrink, and move vertically (either upwardor downward), crossing the first tropopause at some pointduring their life cycle, in particular when multiple tropo-pauses occur resulting in a weak thermal inversion at thefirst tropopause level. Looking at IT clouds, their lowoptical depths cannot be solely explained by their lowgeometrical extent (constrained by the double tropo-pauses): Figure 8 shows that even thin cirrus layers (i.e., lessthan 1 km thick) can adopt a wide spectrum of optical depths,up to 1. Other explanations will have to be investigated.Regarding their origin, the simplest hypothesis is that ITclouds originate from within the intertropopause zone, wherethey are constrained by the double temperature inversion(Figures 3 and 4) and thus keep a very low optical depth.Eighty-two percent of IT and CT clouds with a ratio of(z(Cloud top) � z(Tropo)) / ITT > 0.5 (Figure 3b) have their
Figure 8. Density contour plots of the frequency of cirrus clouds as a function of cloud geometricalthickness (x axis) and cloud optical depth (y axis). Dots are relevant to clouds with base above the firsttropopause.
D13206 NOEL AND HAEFFELIN: CIRRUS CLOUDS AND MULTIPLE TROPOPAUSES
9 of 11
D13206
base within 0.5 km of the first tropopause, in other words,clouds that extend up to the second tropopause have, in mostcases, their bases stuck to the first tropopause. This suggeststhat IT clouds very rarely cross the tropopause to extenddownward in the troposphere, confirming the theory that CTclouds originated in the free troposphere and later extendedupward in the intertropopause zone. Of course, these aresimple considerations given the actual observations; cirrus-generation mechanisms involve complex processes, andfurther studies will be required to reliably assess theorigin and formation of each cirrus category.[23] Considering these results, it seems at first glance that
cirrus clouds created in situ in the intertropopause zonedevelop to become almost exclusively subvisible cirrus andnever extend down to develop into optically thicker cloudsystems: their development seems hindered by the twotemperature inversions found in multitropopause situations.Since IT clouds are so high and cold, they have a significantimpact in terms of climate change because of their influenceon the net radiation budget at the top of the atmosphere[Brown and Francis, 1995]. These clouds seem quite rare,at least over the SIRTA (2% of all cirrus occurrences), butsince their formation seems correlated with multiple tropo-pause events, their frequency could increase at other lati-tudes that show much higher occurrences of multipletropopauses (e.g., up to 80% in the Mediterranean regionor the United States, Schmidt et al. [2006]).[24] Finally, it is important to remember that ground-
based lidars alone cannot provide an exhaustive coverage ofcirrus clouds near the tropopause, as (1) some of the cirrusclouds cannot be penetrated all the way through because oftheir high optical depth and were not considered in thepresent study; and (2) an unknown fraction of cirrus cloudsis hidden by optically thick, low-level clouds. This shouldnot modify the optical depth distribution found for cirruscategories in the present study (as cirrus clouds havegenerally low opacity); however, an unknown quantity ofcirrus clouds were not present in the observations and couldsway the importance of a given category one way oranother. A possible way to study the entire population ofcirrus clouds would be to use combined lidar and radarprofiles from spaceborne instruments, i.e., viewing theatmosphere from above. Such observations will soon beavailable from the recently launched Cloud-Aerosol Lidarand Infrared Pathfinder Satellite Observation (CALIPSO)[Winker et al., 2003] and CloudSat [Stephens et al., 2002]spaceborne platforms. In addition to the use of theseobservations, future work include (1) considering a defini-tion of tropopause based on potential vorticity, which mightallow a better understanding of the dynamic features asso-ciated with multiple tropopauses and the occurrence ofcirrus clouds, and (2) investigating if cirrus in each categoryshare common origin and formation mechanisms by corre-lating back-trajectories of air masses in observed cloudswith spatial imagery and models.
ReferencesAngell, J. K., and J. Korshover (1974), Quasi-biennial and long-term fluctua-tions in tropopause pressure and temperature, and the relation to strato-spheric water vapor content, Mon. Weather Rev., 102, 29–34.
Bony, S., et al. (2004), On dynamic and thermodynamic components ofcloud change, Clim. Dyn., 22(2–3), 71–86, doi:10.1007/s00382-003-0369-6.
Brown, P. R. A., and N. Francis (1995), Improved measurements of the icewater content in cirrus using a total water probe, J. Atmos. OceanicTechnol., 12, 410–414.
Cantrell, W., and A. Heymsfield (2005), Production of ice in troposphericclouds: A review, Bull. Am. Meteorol. Soc., 62(7), 2352–2372.
Cess, R., et al. (1990), Intercomparison and interpretation of climate feed-back processes in 19 atmospheric general circulation models, J. Geophys.Res., 95, 16,601–16,615.
Chiriaco, M., H. Chepfer, V. Noel, A. Delaval, M. Haeffelin, P. Dubuisson,and P. Yang (2004), Improving retrievals of cirrus cloud particle sizecoupling lidar and three-channel radiometric techniques, Mon. WeatherRev., 132, 1684–1700.
Daloze, J.-F., and M. Haeffelin (2005), Validation of SAFNWC/MSGcloud top height using ground-based lidar and radar measurements, inVisiting Scientist Report, CMS Lannion. (Available on: http://www.meteorologie.eu.org/safnwc/publis.htm).
Garrett, T. J., et al. (2005), Evolution of a Florida cirrus anvil, J. Atmos.Sci., 62, 2352–2372.
Goldfarb, L., P. Keckhut, M. L. Chanin, and A. Hauchecorne (2001),Cirrus climatological results from lidar measurements at OHP (44N, 6E),Geophys. Res. Lett., 28, 1687–1690.
Haeffelin, M., et al. (2005), SIRTA, a ground-based atmospheric observa-tory for cloud and aerosol research, Ann. Geophys., 23, 253–275.
Heymsfield, A. J., and L. M. Miloshevich (2003), Parameterizations for thecross-sectional area and extinction of cirrus and stratiform ice cloudparticles, J. Atmos. Sci., 60, 936–956.
Hoinka, K. P. (1998), Statistics of the global tropopause pressure, Mon.Weather Rev., 126, 3303–3325.
Intergovernmental Panel on Climate Change (IPCC) (2001), The ScientificBasis, edited by: J. T. Houghton, Y. Ding, D. J. Griggs, M. Noguer, P. J.vand der Linden, X. Dai, K. Maskell, and C. A. Johnson, 881 pp.,Cambridge Univ. Press, New York.
Korolev, A., G. A. Isaac, S. G. Cober, J. W. Strapp, and J. Hallett (2003),Microphysical characterization of mixed-phase clouds, Q. J. R. Meteorol.Soc., 129, 39–65.
Mace, G. G., E. E. Clothiaux, and T. P. Ackerman (2001), The compositecharacteristics of cirrus clouds: Bulk properties revealed by one year ofcontinuous cloud radar data, J. Clim., 14, 2185–2203.
Matthias, V., et al. (2004), Aerosol lidar intercomparison in the frameworkof the EARLINET project: 1 Instruments, Appl. Opt., 43, 961–976.
McFarquhar, G. M., A. J. Heymsfield, J. Spinhirne, and B. Hart (2000),Thin and subvisual tropopause tropical cirrus: Observations and radiativeimpacts, J. Atmos. Sci., 57(12), 1841–1853.
Minnis, P., J. Kirk Ayers, R. Palikonda, and D. Phan (2004), Contrails,cirrus trends, and climate, J. Clim., 17, 1671–1685.
Morille, Y., M. Haeffelin, P. Drobinski, and J. Pelon (2006), STRAT: Anautomated algorithm to retrieve the vertical structure of the atmospherefrom single channel lidar data, J. Atmos. Oceanic Technol., in press.
Naud, N., M. Haeffelin, P. Muller, Y. Morille, and A. Delaval (2004),Assessment of MISR and MODIS cloud top heights through comparisonwith a back-scattering lidar at SIRTA, Geophys. Res. Lett., 31, L04114,doi:10.1029/2003GL018976.
Nastrom, G. D., J. L. Green, M. R. Peterson, and K. S. Gage (1989),Tropopause folding and the variability of the tropopause height as seenby the flatland VHF radar, J. Appl. Meteorol., 28, 1271–1281.
Nee, J. B., C. N. Len, W. N. Chen, and C. I. Lin (1998), Lidar observationsof the cirrus cloud in the tropopause at Chung-Li (25�N, 121�E), J. Atmos.Sci., 55, 2249–2257.
Noel, V., H. Chepfer, M. Haeffelin, and Y. Morille (2006), Classification of icecrystal shapes inmidlatitude ice clouds from three years of lidar observationsover the SIRTA observatory, J. Appl. Meteorol., 63(11), 2978–2991.
Peter, Th., et al. (2003), Ultrathin tropical tropopause clouds (UTTCs):I. Cloudmorphology and occurrence, Atmos. Chem. Phys., 3, 1083–1091.
Platt, C. M. R. (1973), Lidar and radiometric observations of cirrus clouds,J. Atmos. Sci., 30, 1191–1204.
Platt, C. M. R., S. A. Young, P. J. Manson, G. R. Patterson, S. C. Mardsen,and R. T. Austin (1998), The optical properties of equatorial cirrusfrom observations in the ARM Pilot Radiation Observation Experi-ment, J. Atmos. Sci., 55, 77–96.
Prabhakara, C., R. S. Fraser, G. Dalu, M.-L. C. Wu, and R. J. Curran(1988), Thin cirrus clouds: Seasonal distribution over oceans deducedfrom Nimbus-4 IRIS., J. Atmos. Sci., 55, 1977–1996.
Protat, A., M. Haeffelin, A. Armstrong, Y. Morille, J. Pelon, J. Delanoe, andD. Bouniol (2006), Impact of conditional sampling and instrumentallimitations on the statistics of cloud properties derived from cloudradar and lidar at SIRTA, Geophys. Res. Lett., 33, L11805, doi:10.1029/2005GL025340.
Rossow, W. B., and L. C. Garder (1993), Cloud detection using satellitemeasurements of infrared and visible radiances for ISCCP, J. Clim., 6,2341–2369.
D13206 NOEL AND HAEFFELIN: CIRRUS CLOUDS AND MULTIPLE TROPOPAUSES
10 of 11
D13206
Sassen, K. (1991), The polarization lidar technique for cloud research:A review and current assessment, Bull. Am. Meteorol. Soc., 72, 1848–1866.
Sassen, K. (1992), Evidence for liquid-phase cirrus cloud formation fromvolcanic aerosols: Climatic implications, Science, 257, 516–519.
Sassen, K., M. K. Griffin, and G. C. Dodd (1989), Optical scattering andmicrophysical properties of subvisible cirrus clouds, and climatic impli-cations, J. Appl. Meteorol., 28, 91–98.
Sassen, K., G. G. Mace, J. Hallett, and M. R. Poellot (1998), Corona-producing ice clouds: A case study of a cold mid-latitude cirrus layer,Appl. Opt., 37, 1477–1485.
Schmidt, T., G. Beyerle, S. Heise, J. Wickert, and M. Rothacher (2006), Aclimatology of multiple tropopauses derived from GPS radio occultationswith CHAMP and SAC-C.,Geophys. Res. Lett., .33, L04808, doi:10.1029/2005GL024600.
Shapiro, M. A. (1980), Turbulent mixing within tropopause folds as amechanism for the exchange of chemical contituents between the strato-sphere and troposphere, J. Atmos. Sci., 37, 994–1004.
Sprenger, M., et al. (2003), Tropopause folds and cross-tropopauseexchange: A global investigation based upon ECMWF analyses for thetime period March 2000 to February 2001, J. Geophys. Res., 108(D12),8518, doi:10.1029/2002JD002587.
Stephens, G. L., et al. (2002), The CloudSat Mission and the A-Train,B.A.M.S., 83, 1771–1790, doi:10.1175/BAMS-83-12-1771.
Stordal, F., G. Myrhe, E. J. G. Stordal, W. B. Rossow, D. S. Lee, D. W.Arlander, and T. Svendby (2005), Is there a trend in cirrus cloud coverdue to aircraft traffic?, Atmos. Chem. Phys., 5, 2155–2162.
Wang, Z., and K. Sassen (2001), Cloud type and macrophysical propertyretrieval using multiple remote sensors, J. Appl. Meteorol., 40, 1665–1682.
Winker, D. M., J. Pelon, and M. P. McCormick (2003), The CALIPSOmission: Spaceborne lidar for observation of aerosols and clouds, Proc.SPIE-Int. Soc. Opt. Eng., 4893, 1–11.
WMO (1957), Definition of the tropopause, WMO Bull., 6, 136.Zerefos, C. S., K. Eleftheratos, D. S. Balis, P. Zanis, G. Tselioudis, andC. Meleti (2003), Evidence of impact of aviation on cirrus cloud forma-tion, Atmos. Chem. Phys., 3, 1633–1644.
�����������������������M. Haeffelin and V. Noel, Institut Pierre-Simon Laplace/Laboratoire de
Meteorologie Dynamique, Ecole Polytechnique, 91128 Palaiseau, France.([email protected])
D13206 NOEL AND HAEFFELIN: CIRRUS CLOUDS AND MULTIPLE TROPOPAUSES
11 of 11
D13206
Related Documents