Middle Tennessee Forum on Geographic Information Systems November 7 & 8, 2012 Presentations, Training, Free Workshops CALL FOR PAPERS & EXHIBITORS Vendors Contact: Carole Swann at (615) 837-5489 or [email protected] Registration: Gayle Moore at (615) 532-0148 or [email protected] Poster Contest: David McMillen at (615) 278-8052 or [email protected] Free Registration Door Prizes Free Lunch Poster Contest Free Lunch Register ONLINE ONLY @ www.tngic.org Location: Lane Agri Park Community Center, Murfreesboro, TN 37129 Presentations/Abstracts: Marc Pearson at (615) 829-5454 or [email protected] Training: Experience GIS in TN -- $50.00 Limited to first 15 applicants--see flyer below Registration will CLOSE on October 23, 2012 List of Free Workshops--See Flyer Below Sponsored by TNGIC, Inc. anks to our Gold Sponsors:

Welcome message from author
This document is posted to help you gain knowledge. Please leave a comment to let me know what you think about it! Share it to your friends and learn new things together.
Transcript

Middle Tennessee Forum onGeographic Information Systems
November 7 & 8, 2012 Presentations, Training, Free Workshops
CALL FOR PAPERS & EXHIBITORSVendors Contact: Carole Swann at (615) 837-5489 or [email protected]
Registration: Gayle Moore at (615) 532-0148 or [email protected] Contest: David McMillen at (615) 278-8052 or [email protected]
Free Registration
Door Prizes Free Lunch Poster Contest
Free Lunch
Register ONLINE ONLY @ www.tngic.org
Location: Lane Agri Park Community Center, Murfreesboro, TN 37129
Presentations/Abstracts: Marc Pearson at (615) 829-5454 or [email protected]
Training: Experience GIS in TN -- $50.00 Limited to �rst 15 applicants--see �yer below
Registration will CLOSE on October 23, 2012
List of Free Workshops--See Flyer Below
Sponsored by TNGIC, Inc.
�anks to our Gold Sponsors:

Middle Tennessee Forum onGeographic Information Systems
Wednesday, November 7, 2012 - Presentations�ursday, November 8, 2012 - Workshops
Free Registration
Door Prizes Free Lunch Poster Contest Job Board
Free Workshops
Sponsored by TNGIC, Inc.
Location: Lane Agri Park --Community Center Building, 315 John R. Rice Blvd, Murfreesboro, TN 37129
Bring in non-perishable food item(s) for another chance at a door prize!!
The food banks are low. Let’s do ourpart to help restock the shelves. You can bring in your items on both daysof the conference.
THANKS FOR YOUR SUPPORT!!!
Not a TNGIC member? Visit the TNGIC booth and become a member for just $20 Cash/Check only
Register for a chance to win FREE Registration to the TNGIC Conference at Montgomery Bell State ParkYou can also register to become a TNGIC member by visiting: www.tngic.org

The Eleventh Annual
Middle Tennessee Forum On
Geographic Information Systems Sponsored by TNGIC &
Rutherford County
Wednesday - Thursday, November 7-8, 2012
Rutherford County Lane Agriculture Park Murfreesboro, Tennessee
Wednesday, Nov. 7, 2012 7:30 AM Registration, Vendor Booths Open, Refreshments and Coffee 8:30 AM Welcoming Remarks – Justin Graham, TNGIC President; Suzanne White, TNGIC; Mike Curtis, Rutherford County; Van Colebank, Moderator 8:45 AM Keynote - Using GIS in the National Weather Service, James LaRosa, National Weather
Service 9:15 AM Update on the Enhanced Elevation Plan for Tennessee, Dennis Pedersen, State of TN, OIR
GIS Services 9:30 AM Delivering LiDAR based DEMs to a wide audience: Process, Workflow and Dissemination,
Subramanian Swaminathan, Delta State University, Cleveland, MS 10:00 AM 30 minute break – refreshments in vendor hall 10:30 AM Applying Safety and Security Criteria in Routing Hazardous Materials Shipments, Jason
Abkowitz, Vanderbilt University
10:55 AM A GIS Investigation of Regional Geologic Controls on Mercury Deposits in the SW Region
of Arkansas, Lindsey Langsdon, University of Mississippi 11:20 AM Vendor Introductions 11:30 AM Lunch – by Jason’s Deli (registration required) 12:30 PM Gold Sponsor Presentations
1:15 PM Aerial Photograph Quiz Drawing
1:20 PM Geoserver: An Open Source Implementation of a Webserver, Olalekan Sodeinde, TDOT 1:45 PM Using a Fish Finder to Map a Flooded Mine Pit, Greg Rhinehart, Barge Waggoner Sumner &
Cannon, Inc. 2:10 PM GIS for Tennessee K-12, Janey Smith Camp, Vanderbilt University 2:30 PM 30 minute break – refreshments in vendor hall 3:00 PM Helping GIS Help Tennessee – TIPS (Tennessee Information for Public Safety), Andrew
Griswold, State of TN, OIR GIS Services 3:20 PM Census 2010 and the American Community Survey, Peggy Anderson, TDOT 3:45 PM Poster Contest Results, Scavenger Hunt Drawing, and DOOR PRIZES
The Eleventh Annual
Middle Tennessee Forum On
Geographic Information Systems Sponsored by TNGIC &
Rutherford County
Wednesday - Thursday, November 7-8, 2012
Rutherford County Lane Agriculture Park Murfreesboro, Tennessee
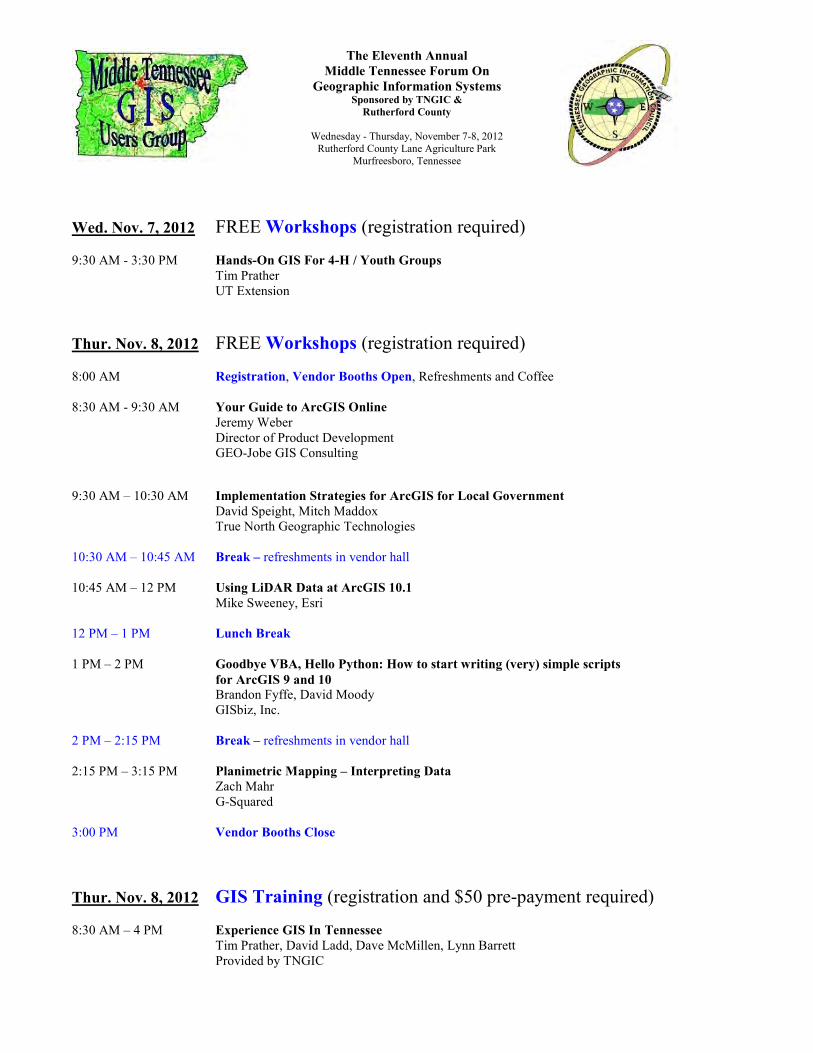
Wed. Nov. 7, 2012 FREE Workshops (registration required)
9:30 AM - 3:30 PM Hands-On GIS For 4-H / Youth Groups Tim Prather UT Extension
Thur. Nov. 8, 2012 FREE Workshops (registration required) 8:00 AM Registration, Vendor Booths Open, Refreshments and Coffee 8:30 AM - 9:30 AM Your Guide to ArcGIS Online
Jeremy Weber Director of Product Development GEO-Jobe GIS Consulting
9:30 AM – 10:30 AM Implementation Strategies for ArcGIS for Local Government
David Speight, Mitch Maddox True North Geographic Technologies
10:30 AM – 10:45 AM Break – refreshments in vendor hall 10:45 AM – 12 PM Using LiDAR Data at ArcGIS 10.1
Mike Sweeney, Esri 12 PM – 1 PM Lunch Break 1 PM – 2 PM Goodbye VBA, Hello Python: How to start writing (very) simple scripts
for ArcGIS 9 and 10
Brandon Fyffe, David Moody GISbiz, Inc. 2 PM – 2:15 PM Break – refreshments in vendor hall 2:15 PM – 3:15 PM Planimetric Mapping – Interpreting Data
Zach Mahr G-Squared
3:00 PM Vendor Booths Close
Thur. Nov. 8, 2012 GIS Training (registration and $50 pre-payment required) 8:30 AM – 4 PM Experience GIS In Tennessee Tim Prather, David Ladd, Dave McMillen, Lynn Barrett
Provided by TNGIC
The Eleventh Annual
Middle Tennessee Forum On
Geographic Information Systems Sponsored by TNGIC &
Rutherford County
Wednesday - Thursday, November 7-8, 2012
Rutherford County Lane Agriculture Park Murfreesboro, Tennessee
Presentation Abstracts
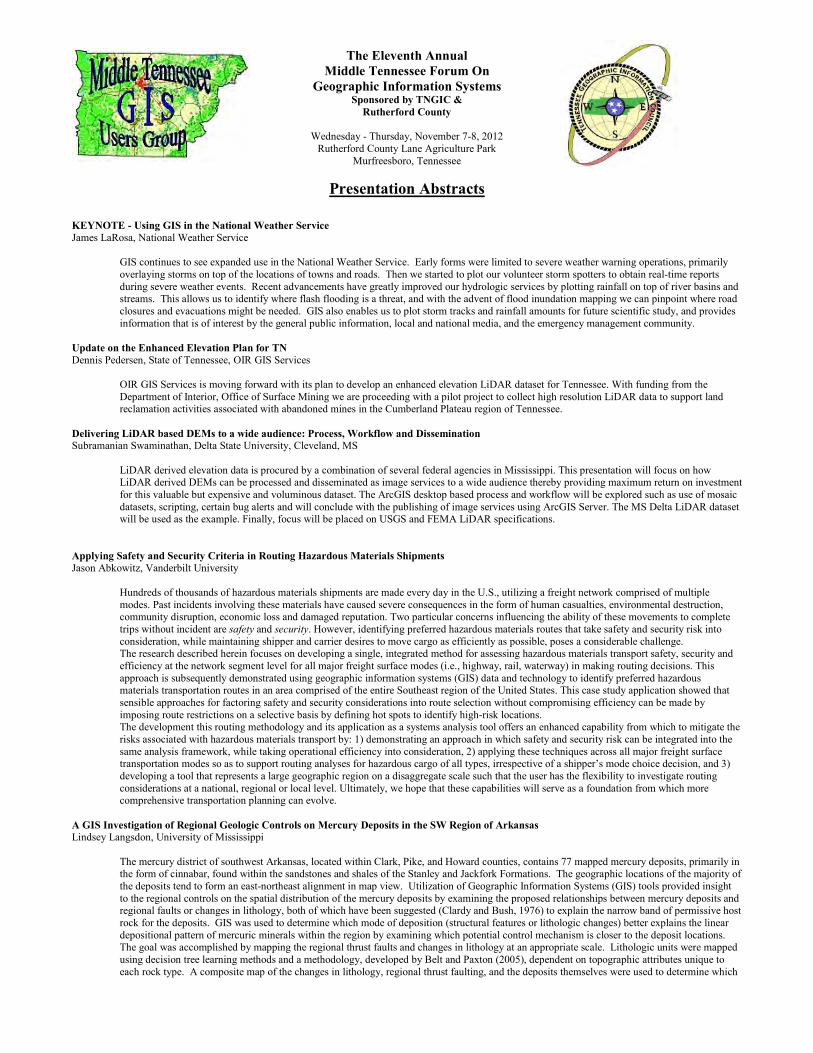
KEYNOTE - Using GIS in the National Weather Service
James LaRosa, National Weather Service
GIS continues to see expanded use in the National Weather Service. Early forms were limited to severe weather warning operations, primarily overlaying storms on top of the locations of towns and roads. Then we started to plot our volunteer storm spotters to obtain real-time reports during severe weather events. Recent advancements have greatly improved our hydrologic services by plotting rainfall on top of river basins and streams. This allows us to identify where flash flooding is a threat, and with the advent of flood inundation mapping we can pinpoint where road closures and evacuations might be needed. GIS also enables us to plot storm tracks and rainfall amounts for future scientific study, and provides information that is of interest by the general public information, local and national media, and the emergency management community.
Update on the Enhanced Elevation Plan for TN
Dennis Pedersen, State of Tennessee, OIR GIS Services
OIR GIS Services is moving forward with its plan to develop an enhanced elevation LiDAR dataset for Tennessee. With funding from the Department of Interior, Office of Surface Mining we are proceeding with a pilot project to collect high resolution LiDAR data to support land reclamation activities associated with abandoned mines in the Cumberland Plateau region of Tennessee.
Delivering LiDAR based DEMs to a wide audience: Process, Workflow and Dissemination
Subramanian Swaminathan, Delta State University, Cleveland, MS
LiDAR derived elevation data is procured by a combination of several federal agencies in Mississippi. This presentation will focus on how LiDAR derived DEMs can be processed and disseminated as image services to a wide audience thereby providing maximum return on investment for this valuable but expensive and voluminous dataset. The ArcGIS desktop based process and workflow will be explored such as use of mosaic datasets, scripting, certain bug alerts and will conclude with the publishing of image services using ArcGIS Server. The MS Delta LiDAR dataset will be used as the example. Finally, focus will be placed on USGS and FEMA LiDAR specifications.
Applying Safety and Security Criteria in Routing Hazardous Materials Shipments
Jason Abkowitz, Vanderbilt University
Hundreds of thousands of hazardous materials shipments are made every day in the U.S., utilizing a freight network comprised of multiple modes. Past incidents involving these materials have caused severe consequences in the form of human casualties, environmental destruction, community disruption, economic loss and damaged reputation. Two particular concerns influencing the ability of these movements to complete trips without incident are safety and security. However, identifying preferred hazardous materials routes that take safety and security risk into consideration, while maintaining shipper and carrier desires to move cargo as efficiently as possible, poses a considerable challenge. The research described herein focuses on developing a single, integrated method for assessing hazardous materials transport safety, security and efficiency at the network segment level for all major freight surface modes (i.e., highway, rail, waterway) in making routing decisions. This approach is subsequently demonstrated using geographic information systems (GIS) data and technology to identify preferred hazardous materials transportation routes in an area comprised of the entire Southeast region of the United States. This case study application showed that sensible approaches for factoring safety and security considerations into route selection without compromising efficiency can be made by imposing route restrictions on a selective basis by defining hot spots to identify high-risk locations. The development this routing methodology and its application as a systems analysis tool offers an enhanced capability from which to mitigate the risks associated with hazardous materials transport by: 1) demonstrating an approach in which safety and security risk can be integrated into the same analysis framework, while taking operational efficiency into consideration, 2) applying these techniques across all major freight surface transportation modes so as to support routing analyses for hazardous cargo of all types, irrespective of a shipper’s mode choice decision, and 3) developing a tool that represents a large geographic region on a disaggregate scale such that the user has the flexibility to investigate routing considerations at a national, regional or local level. Ultimately, we hope that these capabilities will serve as a foundation from which more comprehensive transportation planning can evolve.
A GIS Investigation of Regional Geologic Controls on Mercury Deposits in the SW Region of Arkansas
Lindsey Langsdon, University of Mississippi
The mercury district of southwest Arkansas, located within Clark, Pike, and Howard counties, contains 77 mapped mercury deposits, primarily in the form of cinnabar, found within the sandstones and shales of the Stanley and Jackfork Formations. The geographic locations of the majority of the deposits tend to form an east-northeast alignment in map view. Utilization of Geographic Information Systems (GIS) tools provided insight to the regional controls on the spatial distribution of the mercury deposits by examining the proposed relationships between mercury deposits and regional faults or changes in lithology, both of which have been suggested (Clardy and Bush, 1976) to explain the narrow band of permissive host rock for the deposits. GIS was used to determine which mode of deposition (structural features or lithologic changes) better explains the linear depositional pattern of mercuric minerals within the region by examining which potential control mechanism is closer to the deposit locations. The goal was accomplished by mapping the regional thrust faults and changes in lithology at an appropriate scale. Lithologic units were mapped using decision tree learning methods and a methodology, developed by Belt and Paxton (2005), dependent on topographic attributes unique to each rock type. A composite map of the changes in lithology, regional thrust faulting, and the deposits themselves were used to determine which

The Eleventh Annual
Middle Tennessee Forum On
Geographic Information Systems Sponsored by TNGIC &
Rutherford County
Wednesday - Thursday, November 7-8, 2012
Rutherford County Lane Agriculture Park Murfreesboro, Tennessee
of the suggested relationships exerts more control on the placement of the deposits by being physically closer. Investigation revealed that the faulting is the most controlling feature, on average, and that a regional variation in controlling mechanism exists. Within regions dominated by sandstone, contacts are the more controlling feature. Within shale dominated regions, the faults are the prevailing control feature.
Geoserver: An Open Source Implementation of a Webserver
Olalekan Sodeinde, TDOT With the recent proliferation of web map servers, and the increasing cost of serving maps over the web, organizations may be confused about which web map server to use. Their projects may also be delayed by the high cost of these servers. GeoServer is an easy to use open source web map server that accepts most of the common spatial data formats such as shapefiles, Oracle, PostGIS, SDE, and GeoTIFF and publishes them in formats such as KML/KMZ, WMS, GeoRSS and PDF. Some of the advantages of its functionalities include: ease of use, support for a wide range of data formats, and a low cost of implementation. In this presentation, some of GeoServer’s terminologies will be discussed. The setup and its ease of use will be illustrated, including importing and publishing data from sources such as shapefiles and oracle. In addition, a brief example illustrating customization of GeoServer for a linear referencing conversion tool will be presented.
Using a Fish Finder to Map a Flooded Mine Pit
Greg Rhinehart, Barge Waggoner Sumner & Cannon, Inc.
Using a remote control boat and a recreational grade fish finder to map a flooded, former strip mine on a EPA superfund site. Then utilizing 3d analyst and ArcScene for visualizations.
GIS for Tennessee K-12 Janey Smith Camp, Vanderbilt University
At the spring TNGIC meeting, we provided an update to our pilot project to introduce Metro Nashville Public School teachers to GIS as a tool for problem-based learning related to science, technology, engineering, and math (STEM) courses. Since then, there has been considerable interest and momentum around this effort. We plan to provide an update of activities since the March TNGIC meeting including training for additional teachers within MNPS, efforts to expand the effort to other school systems, and a sustainability plan for a path forward to expose even more teachers and students to GIS and geospatial technologies as a tool to improve student learning. As interest grows and more teachers become aware of the potential, we will need to gain support from the Tennessee GIS community to help with teacher mentoring, data acquisition for use in classrooms, and local partners across the state. The “vision” for a GIS-aware next generation of TN high school graduates will be shared with the group.
Helping GIS Help Tennessee – TIPS (Tennessee Information for Public Safety)
Andrew Griswold, State of TN, OIR GIS Services
This presentation will provide GIS users an opportunity to learn about the different methods being employed by the State of Tennessee OIR-GIS, to work on address point and street centerline data for TIPS (TN Information for Public Safety), and the Next Generation 911 system. With the help of carefully created tools, our group of regional analysts has been working to assist users in the process of refining the GIS data to meet the necessary quality requirements for the Next Generation 911 system. This process, being utilized by all 100 Emergency Communications Districts in an attempt to better serve the citizens of the State of Tennessee, has proved to be very successful in improving the overall quality of data in the State of Tennessee. This will ultimately “Help Tennessee.”
Census 2010 and the American Community Survey
Peggy Anderson, TDOT
TDOT builds roads. In order to do so responsibly our planners need geospatial demographic data to assure that those roads are built to serve all communities and to not disproportionately disadvantage any one group. The US decennial census is a great source for such data, particularly the long form that was sent to 1/6th of the population. In 2010 it was eliminated and replaced by The American Community Survey (ACS). It has been a challenge to provide all the necessary data from the Census and ACS to TDOT in a geospatial form that can be integrated into our workflows.

The Eleventh Annual
Middle Tennessee Forum On
Geographic Information Systems Sponsored by TNGIC &
Rutherford County
Wednesday - Thursday, November 7-8, 2012
Rutherford County Lane Agriculture Park Murfreesboro, Tennessee
Workshop Abstracts
Your Guide to ArcGIS Online
Jeremy Weber, Director of Product Development, GEO-Jobe GIS Consulting Join us as we explore the role ArcGIS Online will play for your organization. The future of the GIS industry is centered on delivering the benefits of GIS to more casual users via focused web and mobile applications over the Internet. In both the public and private sectors, these causal users represent a huge untapped white space of opportunities. As the amount of web-based geographic content (GeoWeb) rapidly expands to capitalize on these opportunities, there has to be a standardized way of organizing, managing, and referencing this content. ArcGIS Online provides a platform for doing this and much more. Learn how it will change the way your organization utilizes GIS and how you can prepare for the future in this fast paced industry.
Implementation Strategies for ArcGIS for Local Government
David Speight, Mitch Maddox, True North Geographic Technologies ArcGIS for Local Government is an initiative to help city and county government implement GIS more quickly and effectively while also using best practices for geodatabase structure, cartography, and application design through freely available maps and templates. This workshop will provide an overview of the program, provide a technical examination of the free resources that are available to local government users, and offer specific strategies for implementation in your organization. In addition to considering adoption of these tools across an entire jurisdiction, we will also cover approaches for more limited implementation in specific departments, including public works, public safety, and land records. Technical topics to be covered include: K Overview of the Local Government Information Model (LGIM) and strategies for migrating your data
K Overview of the basemap templates, their cartographic design and what features and attributes you need to make them most effective.
K Application template configuration tips and tricks
K How to offload portions of your hosted applications to ArcGIS Online and Esri Community Maps.
Using LiDAR Data at ArcGIS 10.1
Mike Sweeney, Esri
This workshop will outline common LiDAR processing tasks and workflows. It will show how ArcGIS can be used to manage large LiDAR point collections and demonstrate approaches for mining information from them. Topics include assessing LiDAR point coverage and sample density, creation of DEM/DSMs, forest canopy density and height estimation, intensity image creation, noise reduction for contouring and slope analysis, and floodplain delineation. ArcGIS 10.1 introduces native support for LiDAR data in the industry standard LAS format. This promises not only to improve existing workflow efficiencies but to expand GIS capabilities in new ways. This session will:
· Present an overview of how LAS Datasets can be used to manage large collections of LAS files · Demonstrate key features such as data cataloging, QA/QC, editing and cleanup, breakline support, on-the-fly surface analysis and 3D point cloud
viewing · Discuss the similarities between LAS Dataset and Terrain and respective usage considerations · Discuss common applications, scalability and storage, a database oriented solution, updating and editing, analytic abilities, and display options for
terrain datasets
Goodbye VBA, Hello Python: How to start writing (very) simple scripts for ArcGIS 9 and 10
Brandon Fyffe, David Moody, GISbiz, Inc.
Planimetric Mapping – Interpreting Data
Zach Mahr, G-Squared Photogrammetrist

The Eleventh Annual
Middle Tennessee Forum On
Geographic Information Systems Sponsored by TNGIC &
Rutherford County
Wednesday - Thursday, November 7-8, 2012
Rutherford County Lane Agriculture Park Murfreesboro, Tennessee
GIS TRAINING
“EXPERIENCE GIS IN TENNESSEE” Instructor(s):
Tim Prather – UT Extension David Ladd – USGS Dave McMillen – NRCS
Lynn Barrett – TWRA Marc Pearson – Stantec Gayle Moore - TDEC
Cost: $50 Registration: contact [email protected] at (615) 532-0148
Make checks payable to TNGIC Send checks to: Gayle Moore, GIS Analyst
401 Church Street, L&C Tower, Dept. of Environment and Conservation ISD, 15th Floor Nashville, TN 37243
Limited to the first 15 students with paid registration Date: Nov. 8, 2012 Time: 8:30 AM to 4 PM Location: Rutherford County Lane Agriculture Park, Murfreesboro, TN Experience GIS in Tennessee is a FREE 1-day training taught by local instructors from various agencies in Tennessee that have extensive experience using Tennessee spatial data. The curriculum was developed for the beginner/intermediate GIS user. Attendees will perform hands-on exercises to demonstrate intermediate level geo-processing, spatial analysis and layout creation/design. The 1-day agenda includes topics such as:
• Software overview
• Geodatabase fundamentals
• Where to Start – Base Layers
• Spatial Transformations
• Data Creation and Editing
• Spatial Data Processing
• Metadata Creation
• Cartographic Design
• Tips and Tricks This course also includes a customized course workbook.

The Eleventh Annual
Middle Tennessee Forum On
Geographic Information Systems Sponsored by TNGIC &
Rutherford County
Wednesday - Thursday, November 7-8, 2012
Rutherford County Lane Agriculture Park Murfreesboro, Tennessee
Thanks to our Sponsors!

HandsHandsHands‐‐‐On GIS On GIS On GIS
For 4For 4For 4‐‐‐H / Youth GroupsH / Youth GroupsH / Youth Groups
Youth in 4‐H and other organiza ons are invited to a free one‐day workshop to explore the
power of GPS and GIS technologies through hands‐on ac vi es to:
learn about careers that use Global Posi oning System (GPS) and Geographic Informa on
System (GIS) technologies, and meet GIS professionals in the region
learn about GIS programs through 4‐H and other organiza ons
use GPS to find geocaches
record your path and loca ons of objects using GPS
import your GPS data to a computer and create a map using GIS
use GIS to make measurements and do simple data analysis with your GPS data
KingsportKingsportKingsport
September 18, 2012September 18, 2012September 18, 2012
Eastman Lodge
404 Bays Mountain Trail
Kingsport, TN 37660
36.497319, ‐82.607937
JacksonJacksonJackson
October 3, 2012October 3, 2012October 3, 2012
West Tennessee Research & Educa on Ctr
605 Airways Blvd
Jackson, TN 38301
35.62332, ‐88.84648
MurfreesboroMurfreesboroMurfreesboro
November 7, 2012November 7, 2012November 7, 2012
Rutherford County Agriculture Center
315 John Rice Blvd.
Murfreeesboro, TN
35.85422, ‐86.44821
Sponsored by UT Extension
in coopera on Tennessee Geographic Informa on Council (TNGIC)
These workshops are open to youth and their adult leaders/teachers. No prior GIS experience required.
Par cipants will a end the opening, lunch and closing sessions of the TNGIC Regional Forum.
Registra on is freefreefree, but is limited to the first 30 to register at each loca on!
Register online only at: h p://tngic.org
For addi onal informa on contact
Tim Prather, Biosystems Engineering & Soil Science Department, UT Extension
865‐974‐7266 • [email protected]

Middle Tennessee GIS Forum Poster Contest - 2012
1. Posters will be limited to 44 X 44 inches paper size. 2. Posters will include at least an abstract, a map, and conclusions.
a. The map(s) must support the conclusions b. The cartographic design of the map(s) portion of the poster will be taken
into account by the judges. c. The attached “Some guidelines . . .” shows how the cartography will be
critiqued. d. Two divisions – Student and Regular
3. Prizes will be awarded at the discretion of the official judges. 4. An easel will be provided to display posters if you reserve a poster site. 5. The deadline to have posters displayed is November 7th at 10 am. 6. To reserve a poster site, contact:
[email protected] before COB November 6th
Some guidelines for crit iquing maps General
• Can you readily underst and t he overall purpose of t he map and how it is t o be read?
• At what dist ance is t he map meant t o be read? One or many? • Is t he medium appropriat e t o t he use? For inst ance, should t he map be
larger/ smaller? Elect ronic rat her t han on paper? Int eract ive? • What is it s int ended use? Does it have one? • St and back f rom t he map. Does your eye fall on import ant element s or an
oversized or overly bright unimport ant element ? • Are all necessary element s included? Are all unnecessary element s excluded?
Are t hese choices appropriat e? • Did t he mapmaker have any inappropriat e assumpt ions or did t hey have
somet hing t o hide? • What kinds of compromises did t he mapmaker have t o make due t o dat a,
medium, print ing, or ot her const raint s?
Color
• Do t he colors clash or clut t er? • Are t here t oo many (most common) or t oo few colors? • Do t hey add emphasis in appropriat e places/ ways? • Do t hey cause vibrat ing or rising/ receding ef fect s? If so, is t hat appropriat e? • Do t he colors help or hinder t he reader in int erpret ing t he map?

• Are any colors t oo close or t oo dif ferent in hue, value and sat urat ion?
Symbology
• Is t he symbology appropriat e t o t he use of t he map? • What was t he main mot ivat ion in choosing t he symbols? • Do t he classif icat ions or color values make sense for dif ferent feat ure t ypes? • Does t he legend have element s t hat are unnecessary for t he int erpret at ion
of t he map? Dat a
• Are t he dat a appropriat e t o t he use and/ or int ended message of t he map? • Is t he scale of t he map appropriat e t o it s int ended use? • Does t he dat a in t he map mat ch t he scale? In ot her words, do t he feat ures
have t oo lit t le det ail ( t hey look blocky) or t oo much ( t heir boundaries are t oo convolut ed)?
Text
• Does t he layout have t oo many font s? Fewer font s and font st yles make for cleaner layout s.
• Is t he choice of font appropriat e t o t he map's use and t o t he feel of t he layout ?
• Are t he labels, t it les, legend labels, et c. in an appropriat e size, locat ion, and/ or color?
• Are all necessary t ext ual element s in t he layout ? • Are t here any unnecessary element s?
Layout
• Are t he element s in t he layout dist ribut ed in a balanced or appropriat e way? • Are t he sizes of t he element s appropriat e and balanced? • Does t he layout have enough or t oo much negat ive space?
Met a Informat ion
• Does t he mapmaker credit appropriat e sources? • Do you have all t he informat ion you will need t o int erpret t he map
appropriat ely?

John Rice BlvdI-24
To NashvilleCommunity Center Building
To Chattanooga
State Hwy 96
Directions to Lane Agri-Park:From Nashville: Take I-24 E, exit 78A. To first light (John R. Rice Blvd), go right. Complex will be .8 miles on the left. From Chattanooga: Take I-24 W, exit 78A. To second light (John R. Rice Blvd), go right. Complex will be .8 miles on the left.
Sam's Club
Tractor Supply
Exit 78A
Related Documents