Middle School Quarter 2 Mathematics Overview 2010 – 2011

Middle School Quarter 2 Mathematics Overview 2010 – 2011.
Dec 14, 2015
Welcome message from author
This document is posted to help you gain knowledge. Please leave a comment to let me know what you think about it! Share it to your friends and learn new things together.
Transcript

Middle SchoolQuarter 2 Mathematics
Overview2010 – 2011

Session Ground Rules
• Respect the value of each individual’s contribution• No sidebars• Share the air • Honor time limits• Participate and take ownership• Turn cell phones on vibrate & close computers• No texting• Parking Lot
2

Session Goals• Review Insight Benchmark Data.• Access resources available to support teaching and learning
Quarter 2 GPS standards.• Provide a broad content overview of the major Georgia
Performance Standards in Quarter 2.
• Discuss the rigor of knowledge and skills expected in each GPS unit.
3
Unit 3: Fractions, Decimals, Ratios, &Percents
Unit 4: One Step Equations
Unit 3: Rational Reasoning
Unit 4: Flip, Slide & Turn
Unit 3: Slippery Slope
Unit 4: Transversing Congruency
Agenda
• Opening (Norms, Goals, & Focus Areas)• Review District 2009-2010 CRCT Data• APS Benchmark Discussion• Learning Village• Quarter Two Model Lesson• Closing
4

5
Our Five Focus Areas
5

6adapted from http://www.svmimac.org/images/AtlantaWorkshop.100109.PM.pdf
Silicon Valley Mathematics Initiative

APS 2010 CRCT Grades 5-8
0%
10%
20%
30%
40%
50%
60%
70%
80%
Number & Operations
Measurement Geometry Algebra Data Analysis & Probablilty
Grade 5
Grade 6
Grade 7
Grade 8
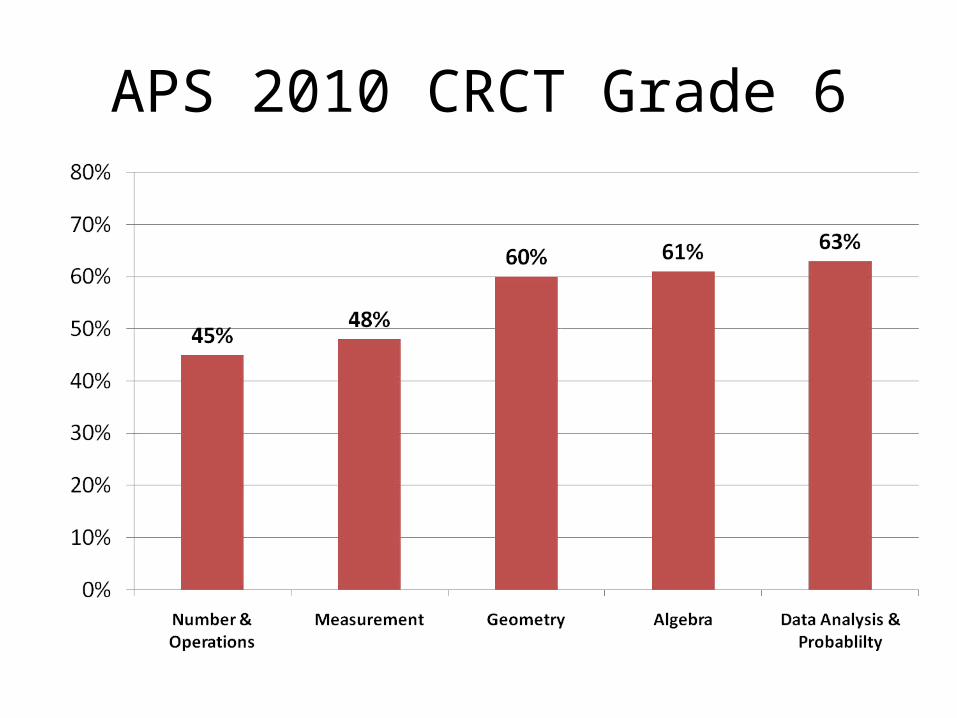
APS 2010 CRCT Grade 6

APS 2010 CRCT Grade 7

APS 2010 CRCT Grade 8
11
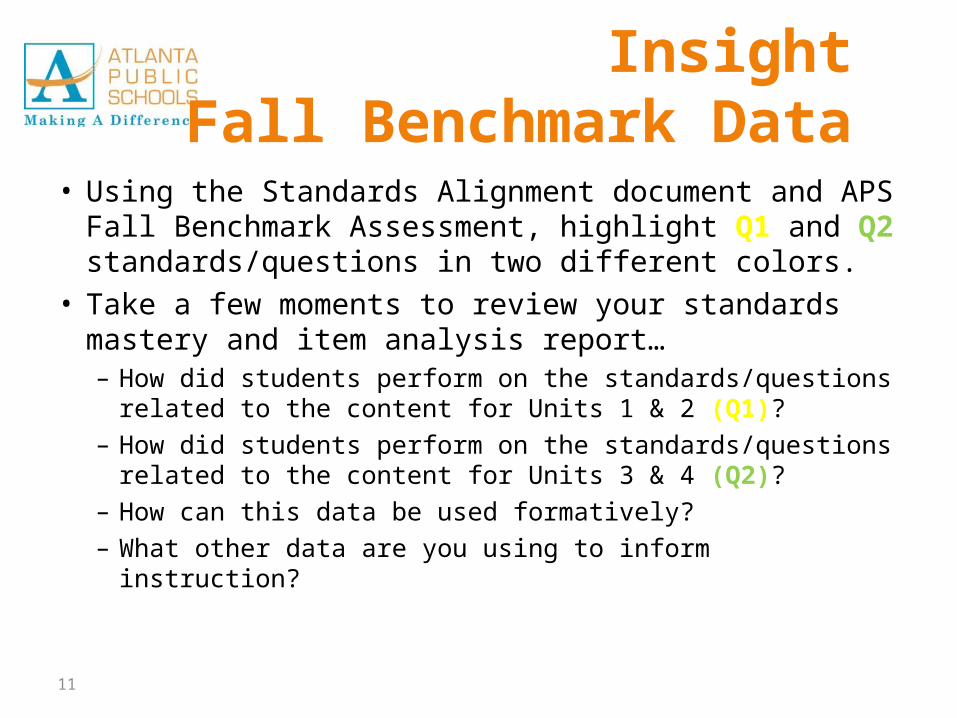
InsightFall Benchmark Data
• Using the Standards Alignment document and APS Fall Benchmark Assessment, highlight Q1 and Q2 standards/questions in two different colors.
• Take a few moments to review your standards mastery and item analysis report…– How did students perform on the standards/questions
related to the content for Units 1 & 2 (Q1)?– How did students perform on the standards/questions
related to the content for Units 3 & 4 (Q2)?– How can this data be used formatively?– What other data are you using to inform instruction?

12
Research Misconceptions and Errors
Misconception Learning verses Remedial Learning: Test Scores
10.4
17.819.1
7.9
15.8
12.7
0
5
10
15
20
25
Pre-test Post-test Delayed Test
Students who weretaught by addressingmisconceptions
Students who weretaught using remedialmeasures
Bell, A.: 1993 “Some experiments in diagnostic teaching”, Educational Studies in Mathematics. 24: 115-137

13
Student Misconception Discussion
One of the benchmark questions is shown below.Look at the possible answer choicesWhy are they good possible answers?What misconceptions are highlighted?
What information can you tell about the graph?A.Terri saved about the same amount of money as Corbin between January and AprilB.Terri spent about the same amount of money as Corbin between January and AprilC.Terri has saved more money than Corbin during the months of January through AprilD.Terri has spent more money than Corbin during the months of January through April

Actual Answers
14
Learning Village
• What is Learning Village• Log into the Learning Village at the GaDOE
website.– https://www.georgiastandards.org/Pages/Default.
aspx
15

Model Lessons
6th 7th 8th
GPS Task•Using the Equation
GPS Task•Sums and Products
GPS Task•Number Tricks
16

Closing
• Give One Get One• Redelivery Materials• Evaluation
17
Related Documents