Mid Range Plan Presentation Fiscal Year 2008 October 2007

Mid Range Plan Presentation Fiscal Year 2008 October 2007.
Dec 22, 2015
Welcome message from author
This document is posted to help you gain knowledge. Please leave a comment to let me know what you think about it! Share it to your friends and learn new things together.
Transcript

Mid Range Plan Presentation Fiscal Year 2008
October 2007

22
Agenda Agenda [Detailed – for reference only]
• Executive Summary– TV; Digital Dist; and Crackle financial bar charts; G&A; HC
• Core Assets– Performance of Seinfeld, Wheel/Jeop, Y&R / Days– Focus on on-air success; touch on digital extensions (iTunes, mobile games)
• Development– Strategy for traditional: genres / format focus for Network and Cable; production
assumptions– Short-form strategy
• Channels– Digital networks including on-line and mobile components (AXN, Funnybone, Screening
Room, Minisodes)– Crackle– GSN / Fearnet
• Distribution– Strategies for approaching Pay TV, PPV / VOD; Free TV, Syndication– Digital licensing (DST and mobile games)
• Ad Sales– Core business– Strategy for expansion (3rd party representation, Mobile, Crackle)– ITN
• Financial Appendix

33
• Executive Summary
• Core Assets
• Programming
• Channels
• Distribution
• Ad Sales
• Financial Appendix
AgendaAgenda

44
How will SPT ensure growth and continued success moving forward?How will SPT ensure growth and continued success moving forward?
Increase library sales revenue
Develop lasting broadcast and cable programs
Establish digital channels as market leading brands
Capitalize on growing demand for digital content to increase digital licensing revenue
Continue to grow Crackle audience and begin monetizing
Grow Advertiser Sales through expansion into digital, 3rd party acquisition and ITN
Significantly improve GSN’s profile and earnings

55
SPT Financial SummarySPT Financial Summary
EBIT Revenue
Sony Pictures Television GSN/FEARnet
Q2/BDGT. MRP/PRIOR MRP/PRIOR MRP Q2/BDGT. MRP/PRIOR MRP/PRIOR MRP
$0
$200
$400
$600
$800
$1,000
$1,200
$1,400
FY07 FY08 FY09 FY10
$1,269
$1,194
$ 1,068$1,065$1,091$1,120 $1,136
$14 $30
$178$178
$184
$236
$5
$2
$194 $183
$231
$(1) $(5) $(1)
($25)
$0
$25
$50
$75
$100
$125
$150
$175
$200
$225
$250
FY07 FY08 FY09 FY10
$238 $230
$183 $178
$198 $193
$208
($ in MM)
($ in MM)
[Old Numbers]

66
$562 $514 $561 $562 $586 $613 $623
$479$486 $438 $453 $434 $422
$474
$445$455
$298 $273$336
$237$274
$84$26
$11
$26$16$34
$18$28$3
$19$52
$0
$200
$400
$600
$800
$1,000
$1,200
$1,400
$1,600
FY07 FY08 FY09 FY10
$1,517$1,473
$1,350$1,304
$1,434
$1,283
$1,481
SPT Total RevenueSPT Total Revenue
Q2/BDGT. MRP/PRIOR MRP/PRIOR MRP
TV Initial Market
TV DistributionMPG SPHE
($ in MM)
Crackle
[James – Add Dummy # Stack forDigital Dist. And Digital Networks]
[Placeholder Numbers]

77
SPT Net G&A Expenses & HeadcountSPT Net G&A Expenses & Headcount
$45$47
$49$48$46
$50$52
$0
$10
$20
$30
$40
$50
$60
FY07 FY08 FY09 FY10
($ in MM) Q2/MRP Budget/Prior MRP
Q2/MRP Proj. Headcount
224
Budget/Prior MRP Headcount
218
Variance 6
224
218
6
224
218
6
224
N/A
N/A
[Old Numbers]

88
Digital Networks & Distribution Financial SummaryDigital Networks & Distribution Financial Summary
EBIT Revenue
Sony Pictures Television GSN/FEARnet
Q2/BDGT. MRP/PRIOR MRP/PRIOR MRP Q2/BDGT. MRP/PRIOR MRP/PRIOR MRP
$0
$200
$400
$600
$800
$1,000
$1,200
$1,400
FY07 FY08 FY09 FY10
$1,269
$1,194
$ 1,068$1,065$1,091$1,120 $1,136
$14 $30
$178$178
$184
$236
$5
$2
$194 $183
$231
$(1) $(5) $(1)
($25)
$0
$25
$50
$75
$100
$125
$150
$175
$200
$225
$250
FY07 FY08 FY09 FY10
$238 $230
$183 $178
$198 $193
$208
($ in MM)
($ in MM)
[James – Replace with Dummy # Stacks: Mobile / Internet Licensing
DSTMemory Card
Rental]
[Placeholder Numbers]

99
Digital Networks & Distribution Net G&A Expenses & HeadcountDigital Networks & Distribution Net G&A Expenses & Headcount
$45$47
$49$48$46
$50$52
$0
$10
$20
$30
$40
$50
$60
FY07 FY08 FY09 FY10
($ in MM) Q2/MRP Budget/Prior MRP
Q2/MRP Proj. Headcount
224
Budget/Prior MRP Headcount
218
Variance 6
224
218
6
224
218
6
224
N/A
N/A
[Placeholder Numbers]

1010
Crackle Financial SummaryCrackle Financial Summary
EBIT Revenue
Sony Pictures Television GSN/FEARnet
Q2/BDGT. MRP/PRIOR MRP/PRIOR MRP Q2/BDGT. MRP/PRIOR MRP/PRIOR MRP
$0
$200
$400
$600
$800
$1,000
$1,200
$1,400
FY07 FY08 FY09 FY10
$1,269
$1,194
$ 1,068$1,065$1,091$1,120 $1,136
$14 $30
$178$178
$184
$236
$5
$2
$194 $183
$231
$(1) $(5) $(1)
($25)
$0
$25
$50
$75
$100
$125
$150
$175
$200
$225
$250
FY07 FY08 FY09 FY10
$238 $230
$183 $178
$198 $193
$208
($ in MM)
($ in MM)
[Make this a single stack]
[Placeholder Numbers]

1111
Crackle Net G&A Expenses & HeadcountCrackle Net G&A Expenses & Headcount
$45$47
$49$48$46
$50$52
$0
$10
$20
$30
$40
$50
$60
FY07 FY08 FY09 FY10
($ in MM) Q2/MRP Budget/Prior MRP
Q2/MRP Proj. Headcount
224
Budget/Prior MRP Headcount
218
Variance 6
224
218
6
224
218
6
224
N/A
N/A
[Placeholder Numbers]

1212
• Executive Summary
• Core Assets
• Programming
• Channels
• Distribution
• Ad Sales
• Financial Appendix
AgendaAgenda

1313
““Seinfeld” Seinfeld”
Strategy
Develop 4th cycle sales strategy
– Station license runs through 3/11
– TBS license runs through 9/11
Maximize DVD release
– Season 7 (11/06)
– Season 8 (06/07)
– Season 9 (11/07)
The DVD packages for the fifth and sixth seasons won top honors at the third annual TV DVD Awards
Release a collector’s edition DVD compilation
Explore potential iTunes deal after the DVD sales window
MRP Assumptions
Despite ad sales inventory being priced among highest in syndication, expect gradual ratings erosion
3rd cycle cleared in 98.6% HH, guaranteed double run in 85%
Domestic DVD sales through FY07:
– $260MM since inception
$38MM from Nov ’06 release
– Projected sales: FY08: $60MM, FY09: $21MM and FY10: $19MM
• 4th cycle license fee renewals of $500K/episode assumed in FY09
EBIT
$25 $24
$20$18
$11
$3
$3
$15
$7
$20$23
$28
$9
$6
$8
$0
$5
$10
$15
$20
$25
$30
$35
$40
$45
FY07 FY08 FY09 FY10
$32
$37
$35
$29 $28
$38
$21
Ad/Promo DVD License Fee
Q2/BDGT. MRP/PRIOR MRP/PRIOR MRP
($ in MM)

1414
““The Young & The Restless/Days of Our Lives” The Young & The Restless/Days of Our Lives”
Strategy
THE YOUNG & THE RESTLESS
Renew license fee agreement with CBS
Finalize terms with Sears on cross-promotional opportunities
Overhaul writing staff
DAYS OF OUR LIVES
Closed a firm 3 year deal through Mar ‘09
Coordinate with NBC to expand website
Digital Strategy:
– iTunes (Subscription)
– AOL Classics (Ad Supported)
– Promotional Clips (Grouper, Mobile)
Work with Beachwood to reduce production costs by $400K a week by the end of 06/07 season
MRP Assumptions
THE YOUNG & THE RESTLESS
Contractual license fees through 06/07
Renewal assumed at 2% annual growth
Costs held at 2% growth
DAYS OF OUR LIVES
Contractual license fees through 08/09
Renewal assumed at 08/09 fee
No production cost growth assumed
EBIT
The Young & The Restless Days of Our Lives
Q2/BDGT. MRP/PRIOR MRP/PRIOR MRP
$29 $28 $27 $27
$15$14 $13
$19
$31$32$30
$15$13
$12
$0
$5
$10
$15
$20
$25
$30
$35
$40
$45
$50
FY07 FY08 FY09 FY10
$48
$45 $43
$45
$41 $43
$40
($ in MM)
[Add language re: iTunes extensions]

1515
““Wheel of Fortune/Jeopardy!” Wheel of Fortune/Jeopardy!”
Strategy
Renewed through 09/10 broadcast season, seek additional 3 year renewal post NAPTE
Renewed contracts with talent through 09/10 (flat cost)
Ad Sales to capitalize on the following milestones:
– 07/08 – Wheel of Fortune 25th
– 08/09 – Jeopardy! 25th
SPE’s development team at IGT working to maintain high placement levels as a result of newly developed machines
Promote & capitalize on High Def market rollout
Increase emphasis on unique ad sales opportunities
Rolling out new versions of Jeopardy! on mobile: Sports Jeopardy! and Rock and Roll Jeopardy!
Embed demo version of Wheel of Fortune on Sony Ericsson handsets in the U.S.
Coordinate licensing and mobile deals internationally with King World
MRP Assumptions
• Assumes slight ratings decline offset by increased CPM
• Contractual licenses through 09/10
• IGT advances earned out in FY10, revenue of $24MM
• Production costs held to no growth until 09/10, at which point it grows at 3%
EBIT
$58 $55 $53
$71
$32$32
$31
$36
$59$63
$58
$38$34
$33
$0
$10
$20
$30
$40
$50
$60
$70
$80
$90
$100
$110
FY07 FY08 FY09 FY10
$94 $96
$87
$97
$85 $92
$102
Q2/BDGT. MRP/PRIOR MRP/PRIOR MRP
Wheel of Fortune Jeopardy!
NOTE: FY08/09 variance to prior plan result of Jan ’06 IGT advance.
($ in MM)
[Add language re: Mobile Games]

1616
• Executive Summary
• Core Assets
• Programming
• Channels
• Distribution
• Ad Sales
• Financial Appendix
AgendaAgenda

1717
SPT’s Programming StrategySPT’s Programming Strategy
Leverage the strength of our POD dealsSign one “big” comedy and one “big” drama writer to an overall term dealExpand our programming into the reality genrePartner with networks to secure the future of our shows through marketing
partnerships and digital initiatives
Create a signature comedy for cableWork with emerging networks to develop their own original content Capitalize on the success of cable dramas to produce more scripted series
Co-develop game shows with King WorldLaunch new 1st run syndication programs with Tribune and other station
groups in order to guarantee access to key time periodsMaximize court TV expertise to create and exploit efficiencies between
multiple programs
Create digital short-form internet content – viral videoUtilize content already created (e.g., Gay Robot, library products) for online
use
Flexible & creative development each season focusing on good ideas and stories, balanced with Flexible & creative development each season focusing on good ideas and stories, balanced with the needs of the networksthe needs of the networks
NetworkNetwork
CableCable
SyndicationSyndication
DigitalDigital
[Update to address targeted genres / formats to address and to avoid]

1818
Kidnapped Days of our Lives
Rules of EngagementKing of Queens
The Young & The Restless Sea Change (MOW)
Comanche Moon (MOW)
SPT’s Current Program LineupSPT’s Current Program Lineup
Big Day Raisin in the Sun (MOW)
Peter Pan (MOW) The Longest Winter (MOW)
Hurricane Katrina (MOW)
‘Til Death
Greg BehrendtJudge Hatchett
Judge Maria LopezWheel of Fortune
Jeopardy!
My Boys10 Items or Less
Dragon TalesRunaway
Rescue MeThe Shield
The Boondocks
Syndication
Kings of South Beach (MOW)Wedding Wars (MOW)
The Company (MOW) A Perfect Day (MOW)

1919
Writer/Producer Current In-Development End Date
Darren Star, Inc. Runaway Manchild, Jenny McCarthy, Notebook Girls, Au Pairs,
Nighty Night 04/30/08
25c (Sarah Timberman) Kidnapped Suspect (Zuckerman), Boots, Pulse (Steinfelds) 06/08/07
Happy Madison Rules of Engagement Untitled Tom Hurtz Program (CBS) 08/04/08
Yuspa/Goldsmith Big Day/’Til Death N/A 06/14/09
Pariah (Gavin Polone) My Boys The Watch (Dector & Stauss), Vigilante (Brancato &
Ferris) 12/31/06
Apostle Rescue Me Second Chances (Don Reo), Fort Pit (Tolan), Never
Better, Untitled Riviera Country Club Project (o. Russel & Lieb)
TBD*
Neal Moritz N/A Not Another Teen Series, Macho Steve (Lobis & Moiselle),
Think Tank (Stolberg & Florscheim), Untitled Divorce Lawyer Project (Horn)
05/31/07
Zadan/Meron Raisin in the
Sun/Wedding March Peter Pan, Blue Lagoon, Billy Bean 07/31/07
Matthew Carlson Big Day N/A 05/29/08
Michael Davies Chain Reaction, World
Series of Pop Culture Power of Ten, College Bowl, ABC blind commitment with
RDF, The Nine 01/01/09
Jeff Rake N/A Boots, Anonymous Lawyer (Krasnoff) 03/19/08
Independent/Premium Scripts
N/A Church of Steve (Chris Henchy/Will Ferrell/Adam McKay),
Fort Pit (Peter Tolan), Lucky Cow (Morgan Spurlock), Untitled Family Show (Sherick & Ronn), Ant Hines
N/A
BBC N/A The Thick of It (Mitch Hurwitz), Viva Black Pool (Bob
Lowry), Cutting It (ABC) N/A
SPT’s Key Writer/Producer DealsSPT’s Key Writer/Producer Deals
*Deal ends at the end of the calendar year of Rescue Me’s last season, plus 3 months.
2020
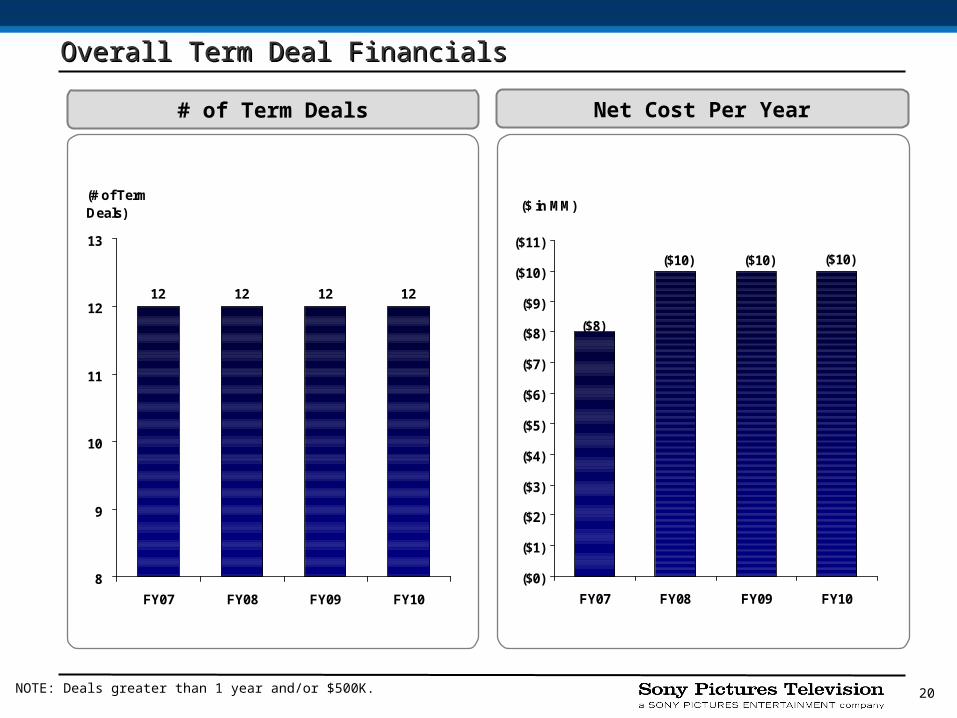
12 12 1212
8
9
10
11
12
13
FY07 FY08 FY09 FY10
(# of Term Deals)
# of Term Deals
Overall Term Deal FinancialsOverall Term Deal Financials
($10)($10)
($8)
($10)
($0)
($1)
($2)
($3)
($4)
($5)
($6)
($7)
($8)
($9)
($10)
($11)
FY07 FY08 FY09 FY10
($ in MM)
Net Cost Per Year
NOTE: Deals greater than 1 year and/or $500K.

2121
Network: DAYS OF OUR LIVES / Y&R continuing throughout plan KING OF QUEENS returns for a 9th season 8 pilots per year, resulting in 2 series per year One series succeeds every other year
– 06/07 TBD (‘TIL DEATH assumed for MRP purposes)– 08/09 TBD (Drama assumed for MRP purposes)
Cable: THE SHIELD is produced for 7 seasons RESCUE ME is produced for 5 seasons THE BOONDOCKS is produced for 5 seasons 4 pilots per year, resulting in 1 series per year One series succeeds every other year
– 06/07 MY BOYS– 08/09 TBD (Drama assumed for MRP purposes)
First Run Syndication: WHEEL OF FORTUNE & JEOPARDY! continue throughout plan JUDGE HATCHETT returns for an 8th season One current 1st run syndicated show continues throughout plan JOKER’S WILD / COMBINATION LOCK launches in 07/08 and continues throughout plan TBD Series launch 09/10Animation: One new season produced each year starting in 06/07Culver Entertainment: Production levels sufficient to generate $2MM in profits per year MOW: 9 movies and 1 miniseries per year
SPT Production AssumptionsSPT Production Assumptions

2222
Programming – New Series Investment & DevelopmentProgramming – New Series Investment & Development
($54)
($37)($33) ($30)
($25)
($25)($25)
($25)
($20)
($22)($24) ($28)
($0)
($20)
($40)
($60)
($80)
($100)
($120)
FY07 FY08 FY09 FY10
($ in MM)
Pilot/ Series Investment Development Allocated Overhead
($82)($84) ($83)
($99)
Budget/Prior MRP ($88)
Variance ($11)
($75)
($9)
($75)
($7)

2323
Release 13 half-hour episodes of the new animated Spider-Man series
Develop a slate of programs geared toward a 50+ audience
– Work in conjunction with AARP to market programs
– Work with pharmaceutical partners to develop ads focused on the target demographic
Pursue Culver Entertainment licensing deal with Starz
Continue to develop series for direct to consumer distribution
Two Dane Cook pilots with added footage released on DVD
Strategy to Grow Culver EntertainmentStrategy to Grow Culver Entertainment

2424
Short-form Programming StrategyShort-form Programming Strategy
• Articulate Short-form Programming Strategy
• Specifically call-out strategy of developing content for our owned digital channels
• Use this slide as transition to next section: “Channels”

2525
• Executive Summary
• Core Assets
• Programming
• Channels: Digital Networks
• Distribution
• Ad Sales
• Financial Appendix
AgendaAgenda

2626
ContentContent
Without Digital Networks, SPT Loses Influence and RevenueWithout Digital Networks, SPT Loses Influence and Revenue
DistributionDistribution
AdvertisingAdvertising
• Traditional networks aggressively build online & mobile audiences, replicating position & distribution advantage in the digital world
• Difficult to secure real estate on digital MSOs for SPT’s a la carte content, with limited spots available in digital MSO tiers
• Digital MSOs increasingly dictate business models and product development without SPT input
• SPT content continues to build and benefit other parties’ networks, replicating the current creation-distribution ecosystem
• Talent, seeking multi-platform exposure and marketing of productions, turns elsewhere
• Opportunity cost to not making library available online
$0
$500
$1,000
$1,500
$2,000
2005 2006 2007 2008 2009 2010 2011
Source: Adams Media Research, 2007
TV: $568 m
MusicVideo: $447 m
News &Sports: $433 m
Other: $145 m
UGV: $137 m
• Ad dollars shifting from traditional TV to online
• By 2011, TV content captures largest share of online ad spending:

2727
Strategy: Create Digital Networks to Address Digital LandscapeStrategy: Create Digital Networks to Address Digital Landscape
Why Digital Networks?Why Digital Networks?
Generate RevenueBuild Assets
• Capture share of developing revenue streams (IP and mobile)
• Unlock and monetize SPT’s vast library
• Give SPT seat at table to shape digital products and business models
• Create program franchises with follow-on windows (e.g. DVD, Direct to Mobile)
• Establish 21st century network / distribution assets for SPT
• Build foundation for SPTAS to bring-in new partners and expand lines of business
• Provide long-term distribution leverage for SPT content
• Provide outlets for new content and talent

2828
Four Networks Will Activate SPT’s Multi-Billion Dollar Library*Four Networks Will Activate SPT’s Multi-Billion Dollar Library*
Your favorite feature length, contemporary classic films across all major genres: comedy, action, drama, family, sci-fi and cult
• Episodes from the heyday of sit-coms
• Outrageous shorts and busted pilots
• Originals by contemporary comedians
• SPT’s “middle tail” content is hard to find
• Deep classic comedy library
• Demand for short form, original comedy exploding online
Classic hard-hitting action TV series and original takes on today’s favorite action movies and stars
• Deep action-themed library
• SPE relationships with
celebrity action stars and film franchises
• Key young male action demo also early adopter of digital tech- nology
• SPE’s 3,500+ feature library
What: 2 Popular Genres, 2 Popular FormatsWhat: 2 Popular Genres, 2 Popular Formats
Why: We matched our assets with market demandWhy: We matched our assets with market demand
Favorite retro TV shows told in in 4-6 minute “minisodes”
• Extensive library of much-loved shows
• Format appeals to today’s “bite sized” video consumption
• Edited to meet the demo’s ironic, camp sensibility
• Popular TV format (Turner, USA, AMC, etc.) embraced by audiences but not yet translated to digital
*Five including SPT’s investment in FearNet and SPT Mobile’s distribution of FearNet Mobile

2929
Programming Philosophy Based on 4 Building Blocks
Acquisition
Original Production
Library
New Shows
Star-Driven
Branded Ent.
Traffic Creating
New Access
SPE Film
SPT TV
Prosumer
Short & longform
Credence WalkerWTF with
Penn Jillette
Busted Pilots
Short-Lived Series

3030
Distribution PhilosophyDistribution Philosophy
Network Distribution Approach
Partners D2C
Online Mobile Online Mobile
• Portals / Aggregators
• Syndicators
• Social Networks
• Virtual Worlds
• Carriers
• Non-Carrier Aggregators
Other
• MSOs & IPTV
• SCE: PS3, PSP
• SEL: Bravia, VAIO
• Vertical sites
• Originals sites
• WAP
• Application
• Text

3131
Digital Networks FinancialsDigital Networks Financials
$5.0
$15.0
$20.0
$10.0
$0
$5
$10
$15
$20
$25
FY07 FY08 FY09 FY10
($ in MM)
$2.0
$8.0
$10.0
$4.0
$0
$2
$4
$6
$8
$10
$12
FY07 FY08 FY09 FY10
($ in MM)
EBIT Revenue
[Placeholder Numbers]

3232
• Executive Summary
• Core Assets
• Programming
• Channels: Crackle
• Distribution
• Ad Sales
• Financial Appendix
AgendaAgenda

3333
Crackle’s Strategic FocusCrackle’s Strategic Focus
Number of Videos in the Category
“Hollywood” Content Viral Video
Nu
mb
er
of
Vie
we
rs
The Opportunity
• High quality content viewed by many
• Less viral and offers less variety than UGV
• Combine the viral nature of user-generated video with the quality of “Hollywood” content
• Unlimited variety of content• Highly viral• Lacks quality of traditional
studio content

3434
Crackle Strategy OverviewCrackle Strategy Overview
Content / ChannelsContent / Channels
Platform / ProductPlatform / Product
Partners / DistributionPartners / Distribution
MonetizationMonetization
Differentiate service
Build audience
Generate revenue
Goals
Summary level strategy for
these key issues

3535
Evolution of Crackle ChannelsEvolution of Crackle Channels
FY07 FY09FY08 FY10
Channels
FamePartners
TBD
TBD
TBD
TBD
TBD
TBDThe
Line-Up
ImprovSPASPT

3636
Crackle Platform DevelopmentCrackle Platform Development
Device Support
New Features
FY07
• Expansion of embedded player
–Integrate search, upload, comments and “shoutout” features into player
• Syndication via 1-Click publishing (e.g., Digg, EBay)
• Online editing functionality
• Branded channel templates (framework for premium producers, sponsors)
• Family Filter
• Initial camera integration (Pure Digital)
• Initial R&D for Sony devices: PS3, VAIO
FY08/09
• Continue expansion of embedded player
–Add real-time community features including chat
• Add geographic data and search
• Personalized recommendations/channel
• Customized functionality
–User profiles, instant messaging
• Mobile phone integration
• Hardware integration (e.g., PCs, Cameras, Camcorders, Cell Phones, Set-top Boxes)

3737
Expansion of Crackle’s Distribution NetworkExpansion of Crackle’s Distribution Network
Cross-Sony Partnerships
MarketingDistribution Partners
User Driven “1 Click”
Digital Imaging
• Power video uploads
• Embed screensaver and software
• Users syndicate playlists via embedded player
• Embed Grouper player on partner sites
• Distribute content “pyramids”
• Purchase advertising on high traffic web sites
• Drive users back to Grouper.com

3838
Crackle Revenue PlanCrackle Revenue Plan
• Overall trends in sales of advertising against UGV content
• Ad units (pre-roll / post-roll, overlays, banners)
• Sales strategy
• Sponsorship concepts
• Traction to-date with advertisers

3939
Growth in Audience and TrafficGrowth in Audience and Traffic
Domestic / International Mix On-Site / Off-Site Mix
3.06.5
8.611.9
15.66.0
9.9
10.0
10.4
10.4
0
5
10
15
20
25
30
Current FY07 FY08 FY09 FY10
(MM) Domestic UU International UU
26.0
9.0
6.17.7
10.213.06.3
10.4
10.9
12.1
13.0
2.70
5
10
15
20
25
30
Current FY07 FY08 FY09 FY10
(MM) On-Site UU Off-Site UU
26.0
9.0
33% 60%% Domestic
30% 50%% On-Site
Growing domestic, on-site user base increases user activity, generates additional inventory, and ultimately drives more revenue
[Placeholder Numbers]
4040
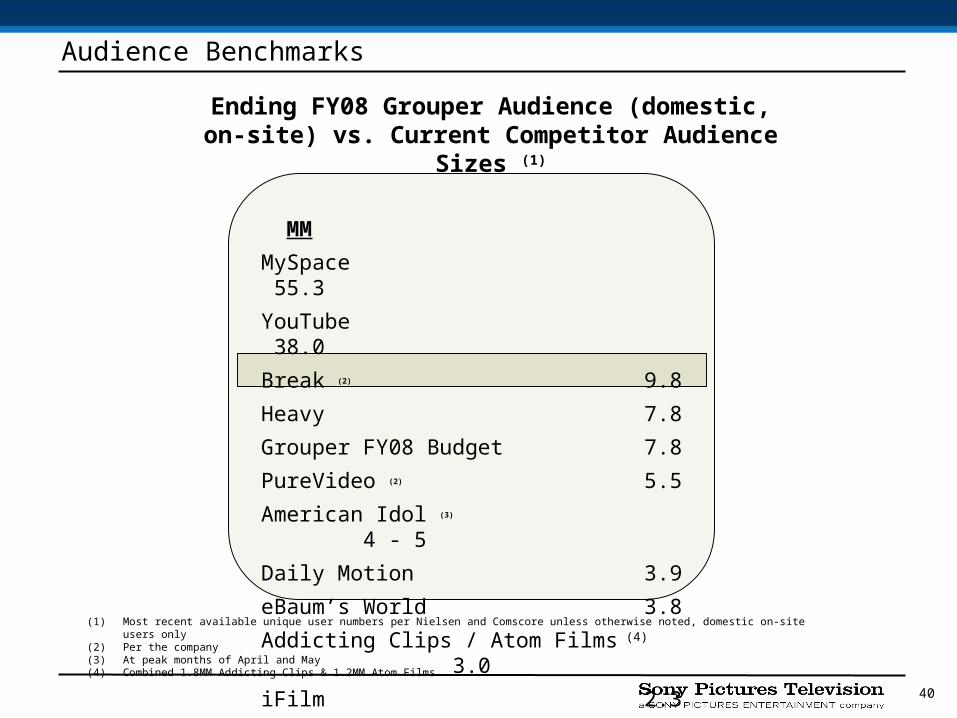
Ending FY08 Grouper Audience (domestic, on-site) vs. Current Competitor Audience Sizes (1)
(1) Most recent available unique user numbers per Nielsen and Comscore unless otherwise noted, domestic on-site users only(2) Per the company(3) At peak months of April and May(4) Combined 1.8MM Addicting Clips & 1.2MM Atom Films
MM
MySpace 55.3
YouTube 38.0
Break (2) 9.8
Heavy 7.8
Grouper FY08 Budget 7.8
PureVideo (2) 5.5
American Idol (3) 4 - 5
Daily Motion 3.9
eBaum’s World 3.8
Addicting Clips / Atom Films (4) 3.0
iFilm 2.3
Audience Benchmarks

4141
Crackle FinancialsCrackle Financials
$5.0
$15.0
$20.0
$10.0
$0
$5
$10
$15
$20
$25
FY07 FY08 FY09 FY10
($ in MM)
-$10.0
$5.0
$10.0
-$5.0
-$15
-$10
-$5
$0
$5
$10
$15
FY07 FY08 FY09 FY10
($ in MM)
EBIT Revenue
[Placeholder Numbers]

4242
• Executive Summary
• Core Assets
• Programming
• Channels: GSN & FEARnet
• Distribution
• Ad Sales
• Financial Appendix
AgendaAgenda

4343
Game Show Network – Financial SummaryGame Show Network – Financial Summary
SPT Share of Net Income SPT Share of Dividends/(Funding)
$9
$15
$7
$21
$31
$12
$7
$0
$5
$10
$15
$20
$25
$30
$35
FY07 FY08 FY09 FY10
($ in MM)
$5 $5$5
($6)
$10
$18
($6)
($10)
($5)
$0
$5
$10
$15
$20
FY07 FY08 FY09 FY10
($ in MM)
Q2/MRP Budget/Prior MRP Q2/MRP Budget/Prior MRP

4444
SPT Share of Net Loss SPT Share of Cash Funding
FEARnet – Financial SummaryFEARnet – Financial Summary
($14)
($10)
($5)
($7)
($1)
($13)
($8)
($0)
($2)
($4)
($6)
($8)
($10)
($12)
($14)
($16)
FY07 FY08 FY09 FY10
($ in MM)
($18)
($17)
($7)
($5)
($3)
$0
($11)
($0)
($2)
($4)
($6)
($8)
($10)
($12)
($14)
($16)
($18)
($20)
FY07 FY08 FY09 FY10
($ in MM)
Q2/MRP Budget/Prior MRP Q2/MRP Budget/Prior MRP

4545
• Executive Summary
• Core Assets
• Programming
• Channels
• Distribution
• Ad Sales
• Financial Appendix
AgendaAgenda

4646
Overview of Distribution ResponsibilitiesOverview of Distribution Responsibilities
Traditional
PPV / VOD
Syndication
Pay TV
Free / Basic
DST
Mobile Games
Rental
Subscription
Digital

4747
Title PPV Pay TV Free TV Title PPV Pay TV Free TV Title PPV Pay TV Free TV
SPIDER-MAN 3 $8,500 $22,500 $50,000 VACANCY $2,500 $9,510 $6,500 PERFECT STRANGER $3,000 $0 $0SUPERBAD $3,000 $10,350 $6,500 RESIDENT EVIL 3 $2,160 $9,510 $4,000 ARE WE DONE YET? $4,880 $0 $0VANTAGE POINT $2,950 $13,450 $11,380 BONE DEEP $2,380 $7,830 $4,880 BROTHERS SOLOMON $1,130 $0 $030 DAYS OF NIGHT $2,160 $9,290 $4,000 UNTRACEABLE $2,500 $9,510 $6,500 NEXT $3,025 $0 $0THE OTHER BOLEYN GIRL $2,500 $9,510 $6,500 THIS CHRISTMAS $1,890 $8,850 $3,060 ACROSS THE UNIVERSE $3,000 $0 $0WALK HARD $3,750 $11,130 $8,130 UNDERWORLD 3 $2,250 $10,460 $7,310 WATERHORSE $3,750 $0 $0
STEP FATHER $2,350 $7,830 $4,880
TOTAL $22,860 $76,230 $86,510 TOTAL $16,030 $63,500 $37,130 TOTAL $18,785 $0 $0
Title PPV Pay TV Free TV Title PPV Pay TV Free TV Title PPV Pay TV Free TV
SURF'S UP $5,000 $18,890 $19,500 TBD#1-2008 $10 $90 $300 A HOPE $700 $2,830 $780TBD#2-2008 $800 $2,560 $300 LUST, CAUTION $300 $1,300 $500
TOTAL $5,000 $18,890 $19,500 TBD#3-2008 $10 $290 $170TBD#4-2008 $5 $190 $80 TOTAL $1,000 $4,130 $1,280
TBD#5-2008 $10 $380 $150TBD#6-2008 $20 $440 $220TBD#7-2008 $800 $2,560 $300TBD#8-2008 $10 $580 $150TBD#9-2008 $10 $90 $190 Title PPV Pay TV Free TV
TBD#10-2008 $10 $290 $170 TBDTBD#11-2008 $5 $190 $80TBD#12-2008 $10 $380 $180TBD#14-2008 $455 $2,340 $250TBD#15-2008 $10 $380 $450TBD#16-2008 $10 $380 $150TBD#17-2008 $10 $180 $190TBD#18-2008 $10 $750 $290TBD#19-2008 $5 $190 $80
TOTAL $2,200 $12,260 $3,700
Distribution Sales – FY2008 SlateDistribution Sales – FY2008 SlateSPT will generate over $389 million in sales from the FY08 slate
LOCAL LANGUAGE PRODUCT
ACQUIRED PRODUCT

4848
Domestic Television Sales Model for Feature FilmsDomestic Television Sales Model for Feature Films
Time from
Theatrical Release
~ 7 Months ~ 1 Year* ~ 2 ½ Years ~ 10 Years
License Term
(Length)1 - 2 Months 14 - 20 Months ~ 6 Years 5+ Years
Sales range from 5% - 7% of DBO
Guarantees ending - revenue split or actual sales
Sales range from 5% - 50% of DBO
Starz/Encore agreement good through 2010**
Sales range from 7% - 13% of DBO depending on genre
Sales range from 2% - 3% of DBO
Stable at 25% of 1st Free TV window
PPV/VODPay TV
(1st and 2nd)
“Network” Window
(1ST Free TV)
“Syndication” Window
(2nd Free TV)
* 2nd Pay TV window begins ~ 8 years from theatrical release.** SPT has a 3 year extension option, which must be exercised no later than 12/31/07.

4949
SPT Library Sales StrategySPT Library Sales Strategy
SPT learned from the MGM experience and has now established annual library sales targets
Library sales defined as follows:
Feature Films:
– Any window subsequent to the 2nd Free TV window
SPHE acquired product:
– All sales
TV Product:
– All 2nd cycle & subsequent sales
SPT is creating a state of the art database unique to the industry to better target customers
– SPT has graded all feature films and tracks open windows (both short & long)
SPT sells current year open windows to the greatest extent possible, since this generates current year revenue
– Networks attempt to buy windows out beyond the current year

5050
$73 $77$66
$77
$20
$17
$8
$90
$77
$102
$5
$5
$60
$5
$6
Forecast $150 +
$0
$20
$40
$60
$80
$100
$120
$140
$160
FY07 FY08 FY09 FY10
($ in MM) Free/Basic Pay TV PPV/VOD
Library Sales Targets by MarketLibrary Sales Targets by Market
3 year annual average of $106MM in FY07-FY09, and $90MM in FY08-FY10
4 year annual average of $105MM
In-House $103MM
Budget $65MM

5151
Library Revenue by DivisionLibrary Revenue by Division
$76
$33
$52
$27
$44
$46
$48
$28
$34
$26
$26
$18
$11
$36$33
$75
$42 $40
$32 $30
$16
$0
$20
$40
$60
$80
$100
$120
$140
$160
FY07 FY08 FY09 FY10
$133
$111
$81
$124
$77
$101
$146
Q2/BDGT. MRP/PRIOR MRP/PRIOR MRP
TV SPHEMPG
In-House
$103MM
In-House $62MM
In-House $77MM
In-House $31MM
NOTE: Assumes a consistent volume and quality of SPHE acquired product.
($ in MM)

5252
Pay Per View/VOD OverviewPay Per View/VOD Overview
$110
$91$75
$107$110
$91$78
$0
$25
$50
$75
$100
$125
FY07 FY08 FY09 FY10
($ in MM)Q2/MRP Budget/Prior MRP
SPT Strategy & Financials
• Leverage day and date negotiations with Dish Network and DIRECTV to:
– Secure premiere channel placement for PPV rental, VOD push, broadband, etc.
– 15% gross revenue dedicated to marketing and promotions
• Close a 3 year iNDEMAND extension without guarantees to maintain licensors’ share, DRP and exhibitions
• Sell library product to VOD providers: Comcast, Time Warner, Cox and Charter
– Customize genre based VOD product offerings (e.g., Spanish/African-American)
• Expand on VOD rights to enable customers to sell on multiple platforms (comcast.net)
Total Revenue

5353
Pay TV OverviewPay TV Overview
$217
$298 $298$285
$216$264
$318
$0
$100
$200
$300
$400
FY07 FY08 FY09 FY10
($ in MM)Q2/MRP Budget/Prior MRP
SPT Strategy & Financials
Develop a strategic plan for exercising the Starz extension option
– Agreement ends on 12/31/2010, with a 3 year extension option if exercised no later than 12/31/07
Leverage Starz’s interest in VONGO to close DST deal
Pursue Culver Entertainment licensing deal with Starz
Pursue library deals with Showtime and HBO
Total Revenue

5454
Free/Basic TV OverviewFree/Basic TV Overview
As cable networks are increasingly looking to original content to differentiate themselves from
competitors - leaving fewer resources and timeslots allocated to movies, SPT must focus on the
following to increase revenue:
– Develop a sophisticated movie database to better position SPE titles vis-à-vis the competition – database will
track movie performance by title, genre, and studio for SPT and competitors’ titles and include SPT research
– Offer shorter windows that allow networks to utilize film product while still investing in original programming
– License multiple rights i.e. VOD rights to help cable networks expand their offering to their customers while
monetizing our assets in a new way
– Pursue non-traditional cable network buyers (e.g., Trinity Networks, Speed, Discovery Networks, OLN, etc.)
SPT Strategy & Financials
$370
$171 $152$190
$377
$286
$210
$0
$100
$200
$300
$400
FY07 FY08 FY09 FY10
($ in MM)Q2/MRP Budget/Prior MRP
Total Distribution Revenue

5555
Syndication OverviewSyndication Overview
$149
$103 $106$113
$164
$113$122
$0
$50
$100
$150
$200
FY07 FY08 FY09 FY10
($ in MM)Q2/MRP Budget/Prior MRP
SPT Strategy & Financials
• Distribute additional 3rd party product
• Co-develop 2 new games shows with King World for 07/08
• Pursue co-development deals with Tribune and other station groups to guarantee access to key
time periods when launching new 1st run programs
• Expand our streaming of products onto Local TV Station websites in conjunction with ODE (e.g.,
Greg Behrendt, Minisodes, etc.)
Total Revenue

5656
Digital Distribution Landscape: GrowDigital Distribution Landscape: Growing ing DemandDemand
• Media conglomerates have licensed their content for digital sell-through
• Networks/labels have extended their brands online
– ABC.com: ad-supported full episodes of primetime shows
– Launched AOL In2TV, ad-supported classic TV episodes
– Warner Music Group to distribute library of music videos via YouTube
– CBS to offer wide variety of short-form video programming (news, sports, entertainment) on YouTube
102
527
1,086
1,864
64
171
348
558
23
45
106
242
6401,070
1,500
2,271
433
2006 2007 2008 2009 2010
U.S. Consumer/Advertiser Spending ($M) CAGR%
$477$477
$829$829
$4,934$4,934
Online videoadvertising
DST
IP-VOD
Subscription VOD
$1,812$1,812
$3,040$3,040
131%131%
120%120%
51%51%
254%254%
Total 79%79%
Source: Adams Media Research, Veronis Suhler, eMarketer

5757
Digital DistributionDigital Distribution
SPT Strategy & Financials
Total Revenue
• Aggressively build the distribution network– Strike partnerships across the complete spectrum of traditional and on-line players
• Continue to expand the overall content offering– Broaden selection of film and TV product– Introduce the most compelling short-form/original content into the offering
• Continue to lead the market in innovating the digital product offering and usage models– Focus on Digital Sell-Through as foundational/core product
• Build a strong, retail-focused organization – Create innovative marketing and promotional programs – Continue to lead the industry with respect to asset delivery and digital operations

5858
Mobile Games and Personalization Products StrategyMobile Games and Personalization Products Strategy
• Focus on two types of products– Tones/graphics based on film/TV properties– Packages based on compelling
brands/themes (e.g., Snoop Dogg)
• Actively manage the roadmap to ensure optimal product mix and timing
• Institute operational excellence– Aggressively optimize deck placement – Keywords to improve search results– Execute flawless content delivery process
Personalization Products
• Launch 1 new game per month
• Strategically manage the portfolio/roadmap
• Aggressively optimize deck placement
• Utilize consumer product marketing approach
• Institute operational excellence -- continually improve production and porting processes
• Assume P&L for all SPE games
Games

5959
Ratchet & Clank
Q*Bert
Balloon Breaker
Elevator Action
Snoop Dogg Boxing
Casino Royale
Wheel of Fortune 2007
Ghostbusters
Launch New Games(current slate)
Grow Distribution for Catalog(carriers, handset, online)
Snoop Dogg Cruisin’
JEOPARDY! 2007
Fish’n Tunes
Spider-Man 3Spider-Man 3
Spider-Man 3 PuzzleSpider-Man 3 Puzzle
Bond vs. Bond Bond vs. Bond
Ivan Moscovich PuzzleIvan Moscovich Puzzle
Jump That CarJump That Car
God of WarGod of War
JEOPARDY – Rock & RollJEOPARDY – Rock & Roll
OCT
MAY
JUNE
JULY
AUG
SEPT
APR
Untold Legends Untold Legends NOV
Q*Bert “2” Q*Bert “2” DEC
Wheel of Fortune Wheel of Fortune JAN
JEOPARDY! JEOPARDY! FEB
Bond Driving Bond Driving MAR
• Launch 1 new game per month; strategically manage the portfolio/roadmap• Aggressively optimize carrier deck placement• Expand existing Motorola and Sony Ericsson embed programs, and land new OEM deals• Utilize consumer product marketing approach• Strike relationship with leading publisher (e.g., Glu) to secure game pipeline• Grow revenue from $7.0M to $13.2M in FY08
’08 Strategy
Mobile Game Slate

6060
Mobile Game FinancialsMobile Game Financials
$5.0
$15.0
$20.0
$10.0
$0
$5
$10
$15
$20
$25
FY07 FY08 FY09 FY10
($ in MM)
$2.0
$8.0
$10.0
$4.0
$0
$2
$4
$6
$8
$10
$12
FY07 FY08 FY09 FY10
($ in MM)
EBIT Revenue
[Placeholder Numbers]

6161
• Executive Summary
• Core Assets
• Programming
• Channels
• Distribution
• Ad Sales
• Financial Appendix
AgendaAgenda

6262
SPT’s Ad Sales Businesses Will Continue to GrowSPT’s Ad Sales Businesses Will Continue to Grow
SyndicationSyndication
The :10 The :10 SolutionSolution
33rdrd Party Party Represent-Represent-
ationation
DigitalDigital
Maximize revenue by expanding higher paying clients in Upfront Develop synergies with :30s and ITN to maximize both businesses Expand portfolio with select program representation opportunities
Expand client list with traditional :30 buyers New programming representation opportunities (Whacked Out Sports) Pitching NBC through production relationship to represent Network :10s
Continue to build High Definition ad sales with INHD Seek opportunities to represent new ad sales businesses
– Including: Satellite, VOD, Cable, Network, etc. MRP includes $10MM in 07/08 sales and $20MM in annual sales
thereafter
Repositioned Strategic Alliances as Digital Ad Sales team Launch ad sales for digital channels on AOL, expand into Grouper Establish SPTAS as SPE’s digital ad sales group

6363
Advertiser Sales Net Revenue (non-Internet)Advertiser Sales Net Revenue (non-Internet)
$273
$236
$205
$263$265
$234$224
$0
$50
$100
$150
$200
$250
$300
FY07 FY08 FY09 FY10
($ in MM)Q2/MRP Budget/Prior MRP

6464
Internet Ad Sales Internet Ad Sales
Incremental Headcount
4
Total G&A Cost $525K
4
$551K
5
$703K
5
$738K
$3
$19
$52
$84
$7
$15
$5
$10
$4
$24
$64
$109
$2
$0.3
$3
$0.2
$0
$20
$40
$60
$80
$100
$120
FY07 FY08 FY09 FY10
($ in MM) Grouper SPT Digital 360 ODE Licenses

6565
• Executive Summary
• Core Assets
• Programming
• Channels
• Distribution
• Ad Sales
• Financial Appendix
AgendaAgenda

6666
SPT – Summary Financials SPT – Summary Financials
($ in MM) FY07 FY08 FY09 FY10
Initial Market Licenses 460$ 445$ 479$ 512$
Off Network Licenses 205 65 132 55
Ad and Promo Sales 268 285 291 318
Co-Distributor Share and Other 26 32 21 45
Domestic Pay TV/VOD - SPT Product 51 51 51 51
Free TV/Cable-MPG/HE/SPTI Product 232 131 154 155
Pay TV/VOD-MPG/HE/SPTI Product 275 341 306 345
SPT Generated Gross Revenue 1,517$ 1,350$ 1,434$ 1,481$
Producer Share (112) (130) (141) (77)
SPTI Contribution - Library 70 74 72 74
SPTI Contribution - Current 144 97 102 109
SPHE Contribution - Library 78 62 69 68
SPHE Contribution - Current 69 94 54 51
CP/SPD Contribution 13 12 13 14
Contribution to Grouper (3) (19) (52) (84)
Contribution to Other SPE Divisions (507) (472) (460) (500)
Total SPT Product Net Revenue 1,269$ 1,068$ 1,091$ 1,136$
EBIT 238$ 183$ 198$ 208$
Operating Margin 19% 17% 18% 18%
Budget/Prior MRP 230$ 178$ 193$
Variance 8$ 5$ 5$

6767
SPT – Major Contributions to EarningsSPT – Major Contributions to Earnings
($ in MM) FY07 FY08 FY09 FY10
Wheel of Fortune 58$ 50% 55$ 48% 53$ 47% 71$ 52%
Jeopardy! 36 44% 32 41% 32 41% 31 40%
Library - SPT 29 57% 22 53% 35 57% 25 57%
Library - HE 19 24% 14 22% 12 18% 11 16%
Library - SPTI 35 50% 36 49% 36 49% 36 49%
The Young and the Restless 29 20% 28 19% 27 18% 27 17%
Days of Our Lives 19 21% 15 17% 14 16% 13 15%
Seinfeld Fee 32 100% 35 100% 38 100% 21 100%
Just Shoot Me 17 49% - - -
King of Queens 44 21% 12 16% 5 11% 4 13%
Rescue Me 5 14% 5 16% 6 18% 5 17%
The Shield 3 17% 2 15% 2 23% -
ENCORE Bonus 47 100% 47 100% 47 100% 47 100%
New Series Investment (99) (84) (82) (83)
All Other Products 8 7% 5 4% 7 5% 20 12%
Net G&A (46) (48) (50) (52)
ITN - 2 2 2
GSN 7 15 21 31
FearNet (5) (10) (7) (1)
Total 238$ 19% 183$ 17% 198$ 18% 208$ 18%

6868
SPT – Earnings Comparison (Year vs. Year)SPT – Earnings Comparison (Year vs. Year)
($ in MM) FY07 to FY08 FY08 to FY09 FY09 to FY10
EBIT 238$ 183$ 198$
King of Queens (32) (7) -
New Series Investments 15 2 (1)
Daytime - primarily Days of Our Lives license fee renegotiations (5) (2) (1)
Wheel of Fortune/Jeopardy! - IGT royalties (6) (2) 18
Just Shoot Me - 2nd cycle sale in FY07 (17) - -
Seinfeld Fee - assumes 4th cycle renewals and HE 2 3 (17)
Library - domestic TV avails and HE re-release vs. initial (12) 11 (11)
GSN / FEARnet / ITN 3 9 16
All Others, Net (3) 1 6
Total Variance (55) 15 10
EBIT 183$ 198$ 208$

6969
SPT – Earnings Comparison (FY07 vs. FY10)SPT – Earnings Comparison (FY07 vs. FY10)
($ in MM)EBIT FY 2007 238$
GSN Performance 17
New Series Investments 16
IGT Royalties 15
King of Queens (40)
Just Shoot Me Syndication (17)
Library - Domestic avails & DVD re-release vs. initial (13)
Jackie Chan JETIX sale in FY07 (4)
The Shield FX sale in FY07 (3)
All Others, Net (1)
Total Variance (30)
EBIT FY 2010 208$

7070
SPT – Earnings Comparison (Plan vs. Plan)SPT – Earnings Comparison (Plan vs. Plan)
($ in MM) FY07 FY08 FY09
Budget / Prior MRP 230$ 178$ 193$
Gameshows
King of Queens - primarily cable and syndication sales 18 7 -
Emily's Reasons Why Not - - (11)
New Series Investements (11) (9) (7)
Huff - (4) (5)
Days of Our Lives - license fee offset by int'l TV and SoapNet revenue 4 2 2
Young and the Restless - int'l distribution and releasing costs (1) (4) (4)
Wheel of Fortune - Jan '06 IGT royalty advance - (8) (6)
Seinfeld Fee - HE and 3rd Cycle Cable Sale (5) 6 10
GSN / FEARnet / ITN 3 12 17
All Others, Net - 3 9
Total Year-to-Year Change 8 5 5
Q2 Forecast / Current MRP 238$ 183$ 198$

7171
SPT – Major Contributions to RevenueSPT – Major Contributions to Revenue
($ in MM) FY07 FY08 FY09 FY10
Wheel of Fortune 115$ 114$ 113$ 137$
Jeopardy! 81 78 79 79
Library SPT 52 42 63 44
Library HE 78 62 69 68
Library SPTI 70 74 72 74
The Young and the Restless 145 148 150 153
Days of Our Lives 91 87 87 88
Seinfeld Fee 32 35 38 21
Just Shoot Me 35 - - -
King of Queens 215 73 40 34
Rescue Me 38 33 33 32
The Shield 18 16 10 1
ENCORE Bonus 47 47 47 47
New Series Investment 165 149 151 199
All Other Products 87 110 139 159
Net G&A - - - -
Total 1,269$ 1,068$ 1,091$ 1,136$

7272
FEARnet – Financial SummaryFEARnet – Financial Summary
($ in 000) CY2006 CY2007 CY2008 CY2009 CY2010KEY STATISTICSYear end Subs (000) 10,922 17,948 21,473 24,784 31,150 Affiliate Rates $0.00 $0.00 $0.00 $0.05 $0.05 Movie Ad Inventory - 86,149 118,529 178,445 233,629Short Form Content Ad Inventory - 86,149 118,529 142,756 186,903Online Monthly Uniques (000) 100 150 600 900 1,100Annual Page Views (000) 7,200 29,700 130,680 215,622 289,892Ad CPM $0.00 $0.00 $0.00 $5.79 $6.08 Video Ad CPM $0.00 $0.00 $0.00 $23.00 $24.00
REVENUE Affiliate Revenue $0 $0 $0 $13,877 $15,876 VOD Advertising Revenue, Net $0 $1,998 $3,315 $6,042 $10,250 On line Advertising Revenue, Net - - - 1,281 2,341 Wireless and Other Revenue, Net 0 35 148 240 318 Net Revenue $0 $2,032 $3,463 $21,440 $28,785
EXPENSES
VOD - Base Content $552 $3,000 $3,214 $3,326 $3,688 Additional Content 0 2,000 2,070 2,600 2,782 Other Programming Costs 1,515 3,301 3,537 4,154 4,720 Total Programming $2,067 $8,301 $8,821 $10,080 $11,191
VOD Costs $125 $852 $886 $917 $1,008 Advertising Sales 166 1,369 1,636 2,095 2,320 Affiliate Sales 0 750 793 839 888 Marketing 770 2,647 2,878 3,233 3,887 Website 740 1,610 1,756 1,821 1,890 General & Administrative 1,050 1,911 2,090 2,265 2,337 LTIP & Equity 32 204 432 631 758 Cost Contingency 0 750 776 803 832 Management Fee 100 250 259 268 277 Total Expenses $5,049 $18,644 $20,326 $22,954 $25,388
EBITDA ($5,049) ($16,612) ($16,863) ($1,514) $3,397
EBIT/Net Income ($5,049) ($16,769) ($17,208) ($1,916) $2,946 EBIT/Net Income Margin N/A N/A N/A N/A 10.2%

7373
Game Show Network – Financial SummaryGame Show Network – Financial Summary
($ in 000) 2006 2007 2008 2009 2010 2011KEY STATISTICSYE Nielsen UE 61,487 63,650 66,416 68,650 71,108 74,084Average HH Rating 0.323 0.358 0.398 0.442 0.490 0.545Effective Avg. CPM $4.35 $4.75 $4.95 $5.17 $5.41 $5.66Online Monthly Uniques (000) 618 1,389 1,858 2,504 3,239 4,102Total Annual Page Views (000) 160,201 382,284 542,413 775,442 1,063,926 1,429,779Online Game Registers (000) 466 1,079 1,486 2,062 2,747 3,584Subscriptions (000) 2 32 74 206 412 717Banner CPM $2.57 $2.70 $5.00 $5.25 $5.51 $5.79Video CPM $0.00 $15.00 $15.75 $16.54 $17.36 $18.23
REVENUEAd Revenue $62,592 $68,286 $78,290 $90,611 $105,795 $113,792Affiliate 61,483 61,483 61,483 69,483 70,483 70,483 Online 741 3,935 9,444 9,932 17,959 29,706 Online Rev Share (333) (1,801) (3,907) (4,223) (7,669) (12,703) All Other (9,587) 6,094 17,163 23,303 31,593 42,239 Total Net Revenue $114,896 $137,997 $162,473 $189,106 $218,161 $243,517
OPERATING COSTSOnline/Interactive 5,725 8,040 8,103 8,584 9,370 9,587 All Other 92,105 107,699 114,134 126,402 137,109 148,427 Total Operating Costs $97,830 $115,739 $122,237 $134,986 $146,479 $158,014EBITDA $17,066 $22,258 $40,236 $54,120 $71,682 $85,503
Depreciation & Amortization (1,693) (1,408) (1,620) (1,467) (1,499) (1,431) EBIT $15,373 $20,850 $38,616 $52,653 $70,183 $84,072
Interest Income 1,478 1,440 1,680 1,920 2,161 2,400
Net Income $16,851 $22,290 $40,296 $54,573 $72,344 $86,472

7474
SPT – Summary Financials SPT – Summary Financials
FY07 Budget FY07 Forecast FY08 MRP Budget FY08
Initial Market Licenses 411$ 463$ 445$ 463$ Off Network Licenses 190 210 65 69 Ad and Promo Sales 273 243 267 261 Co- Distributor Share and Other 44 40 50 38 Domestic Pay TV/VOD - SPT Product 51 51 51 51 Free TV/Cable/VOD - MPG/HE/SPTI Product 227 233 146 150 Pay TV/VOD - MPG/HE/SPTI Product 277 272 325 309 Grouper - - 19 11
SPT Generated Gross Revenue 1,473$ 1,512$ 1,368$ 1,352$
Producer Share (127) (109) (130) (109) SPTI Contribution - Current 125 142 97 129 SPTI Contribution - Library 56 79 74 71 SPHE Contribution - Current 23 36 24 41 SPHE Contribution - Library 83 84 62 59 SPHE Contribution - Seinfeld 57 48 70 54 CP/SPD Contribution 8 12 12 9 Contribution to Grouper - - (19) (11) Contribution to MPG (504) (505) (471) (459)
Total SPT Product Net Revenue 1,194$ 1,299$ 1,087$ 1,136$
EBIT 230$ 254$ 188$ 188$
Operating Margin 19% 20% 17% 17%

7575
SPHE Contribution to SPT ProductSPHE Contribution to SPT Product
Revenue Net Contribution
$78$62 $67 $66
$2 $2
$44 $70
$21 $19
$25$24
$33 $32
$147$156
$123 $119
$0
$20
$40
$60
$80
$100
$120
$140
$160
FY07 FY08 FY09 FY10
($ in MM)
Library DST Seinfeld Current
Budget/Prior MRP
Variance
$163
($16)
$132
$24
$168
($45)
Reduced Blue Ray contribution resulting from slower launch, lower penetration and increased cost
Re-released products have lower volume and pricing
Budget/Prior MRP
Variance
$60
($11)
$56
($12)
$69
($29)
$27$20 $19 $17
$7
$11
$3$3
$15
$13
$17$16
$49
$44
$40$37
$1$1
$0
$10
$20
$30
$40
$50
$60
FY07 FY08 FY09 FY10
($ in MM)
Library DST Seinfeld Current

7676
SPTI Contribution to SPT ProductSPTI Contribution to SPT Product
Revenue EBIT
$144
$97 $102 $109
$74 $72$74
$214
$171 $174$183
$70
$0
$50
$100
$150
$200
$250
FY07 FY08 FY09 FY10
($ in MM)
Current Library
Budget/Prior MRP
Variance
$180
$34
$189
($18)
$198
($24)
$17
$6 $6 $5
$36 $36 $36
$52
$42 $42 $41
$35
$0
$10
$20
$30
$40
$50
$60
FY07 FY08 FY09 FY10
($ in MM)
Current Library
Budget/Prior MRP
Variance
$42
$10
$31
$11
$32
$10

7777
BACKUP

7878
Mobile Distribution StrategyMobile Distribution Strategy
• Carriers: Focus aggressively on building business with top 3 players in the market, plus T-Mobile and additional strategic players
• 3rd Party Retailers: Increase reach by licensing to a select group of top online retailers (e.g., Thumbplay)
• OEMs: Work closely with leading handset OEMs on embedded content deals
• Direct-to-Consumer: Establish direct-do-consumer distribution leveraging SPE assets and touch-points

7979
Mobile Video StrategyMobile Video Strategy
• Extend Digital Channels (e.g., Funny Bone, Now Playing) to secure mobile real estate and address a range of consumer segments and experiences
– Launch Sprint as first priority, with Cingular to follow
– Pursue premium position with Verizon MediaFLO
• Develop and launch multiple revenue models – Fee-per-subscriber
– Ad-supported
– Premium subscription
• Experiment with different content formats (e.g., linear, on-demand, looped), championing long-form content whenever possible
• Utilize a mix of catalog and original programming
• Draft off of marketing for IP-video and other mobile products -- upsell consumers to mobile video offerings from other products
Related Documents


![Mid Range Plan Presentation Fiscal Year 2009-2011 October 2007 [DRAFT 09.19.07]](https://static.cupdf.com/doc/110x72/56649ea45503460f94ba841a/mid-range-plan-presentation-fiscal-year-2009-2011-october-2007-draft-091907.jpg)

