Microwave tomography enhanced GPR surveys in Centaur’s Domus, Regio VI of Pompeii, Italy This article has been downloaded from IOPscience. Please scroll down to see the full text article. 2012 J. Geophys. Eng. 9 S92 (http://iopscience.iop.org/1742-2140/9/4/S92) Download details: IP Address: 140.164.11.228 The article was downloaded on 10/09/2012 at 13:36 Please note that terms and conditions apply. View the table of contents for this issue, or go to the journal homepage for more Home Search Collections Journals About Contact us My IOPscience

Welcome message from author
This document is posted to help you gain knowledge. Please leave a comment to let me know what you think about it! Share it to your friends and learn new things together.
Transcript
Microwave tomography enhanced GPR surveys in Centaur’s Domus, Regio VI of Pompeii,
Italy
This article has been downloaded from IOPscience. Please scroll down to see the full text article.
2012 J. Geophys. Eng. 9 S92
(http://iopscience.iop.org/1742-2140/9/4/S92)
Download details:
IP Address: 140.164.11.228
The article was downloaded on 10/09/2012 at 13:36
Please note that terms and conditions apply.
View the table of contents for this issue, or go to the journal homepage for more
Home Search Collections Journals About Contact us My IOPscience
IOP PUBLISHING JOURNAL OF GEOPHYSICS AND ENGINEERING
J. Geophys. Eng. 9 (2012) S92–S99 doi:10.1088/1742-2132/9/4/S92
Microwave tomography enhanced GPRsurveys in Centaur’s Domus, Regio VI ofPompeii, ItalyI Catapano1, L Crocco1, R Di Napoli1,4, F Soldovieri1, A Brancaccio2,F Pesando3 and A Aiello3
1 Institute for Electromagnetic Sensing of the Environment, National Research Council of Italy, I-80124,Napoli, Italy2 Department of Information Engineering, Second University of Naples, I-80131, Aversa, Italy3 Dipartimento degli Studi del Mondo Classico e del Mediterraneo Antico, University of NaplesOrientale, I-80134, Naples, Italy
E-mail: [email protected]
Received 31 January 2012Accepted for publication 21 May 2012Published 9 August 2012Online at stacks.iop.org/JGE/9/S92
AbstractThe archaeological area of Pompeii (Naples, Italy) is known worldwide as one of the mostremarkable examples of a Roman Empire town, but its origins are prior to the Roman age andthere is a huge archeological interest in discovering the history of the forma urbis. With respectto this framework, the paper presents results from microwave tomography enhanced groundpenetrating radar (GPR) surveys carried out in the Centaur’s Domus, Regio VI, one of the mostancient housing areas of Pompeii. The GPR prospections aimed at addressing and driving thearcheological excavation campaign performed in this area in October 2010. The results ofstratigraphic assays are used to assess the reliability of the tomographic images obtained.
Keywords: ground penetrating radar, microwave tomography, electromagnetic inversescattering problems, archaeological surveys
(Some figures may appear in colour only in the online journal)
1. Introduction
The world-renowned archaeological site of Pompeii (Naples,Italy) is one of the most famous towns of the Roman Empireand provides a detailed example of architectural style as wellas valuable evidence of life in 79 DC. However, the housinghistory of this area goes back to the Sannitic age (thirdcentury AC) and this motivates huge archeological interestin discovering housing structures, as well as decoration andobjects from which one can deduce the history of Pompeiibefore the Roman age.
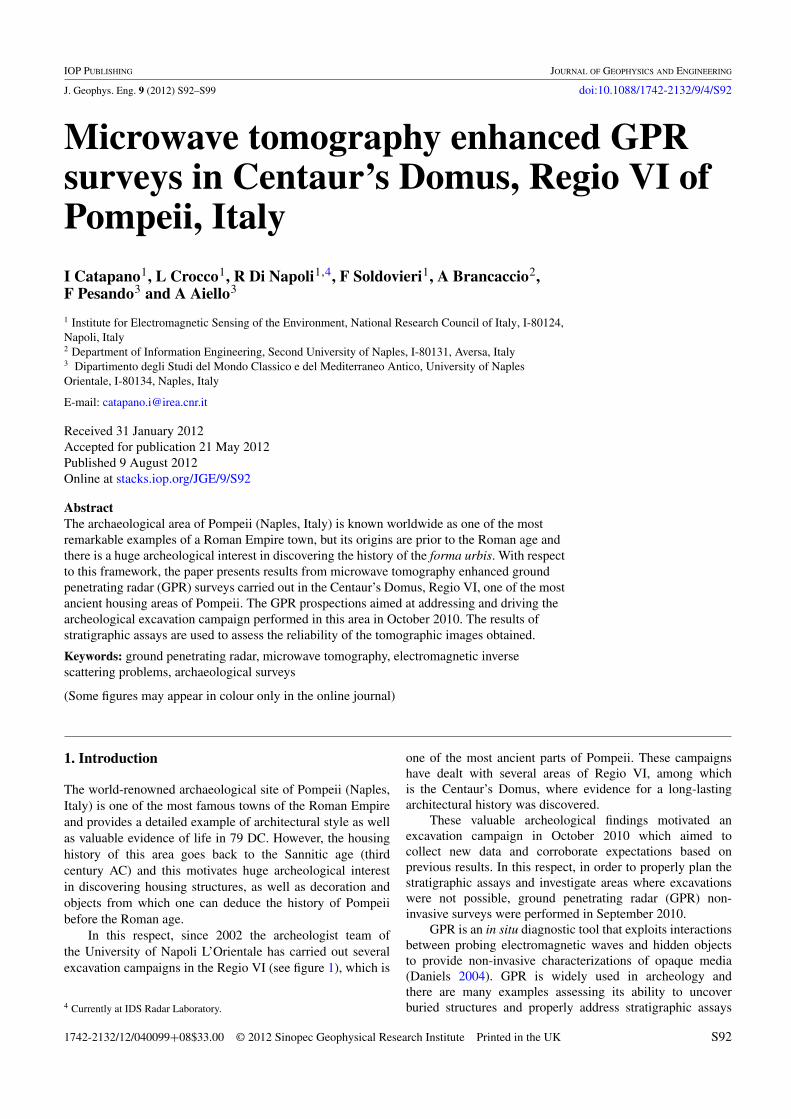
In this respect, since 2002 the archeologist team ofthe University of Napoli L’Orientale has carried out severalexcavation campaigns in the Regio VI (see figure 1), which is
4 Currently at IDS Radar Laboratory.
one of the most ancient parts of Pompeii. These campaignshave dealt with several areas of Regio VI, among whichis the Centaur’s Domus, where evidence for a long-lastingarchitectural history was discovered.
These valuable archeological findings motivated anexcavation campaign in October 2010 which aimed tocollect new data and corroborate expectations based onprevious results. In this respect, in order to properly plan thestratigraphic assays and investigate areas where excavationswere not possible, ground penetrating radar (GPR) non-invasive surveys were performed in September 2010.
GPR is an in situ diagnostic tool that exploits interactionsbetween probing electromagnetic waves and hidden objectsto provide non-invasive characterizations of opaque media(Daniels 2004). GPR is widely used in archeology andthere are many examples assessing its ability to uncoverburied structures and properly address stratigraphic assays
1742-2132/12/040099+08$33.00 © 2012 Sinopec Geophysical Research Institute Printed in the UK S92
Microwave tomography enhanced GPR surveys
Figure 1. Aerial view of the archeological area of Pompeii.
(Sternberg and McGill 1995, Malagodi et al 1996, Conyers2004, Utsi 2004, Grasmueck et al 2004, Leucci and Negri2006, Masini et al 2010, Kadioglu et al 2011, Leucci et al2011, Soldovieri et al 2007). Interpretability of the imagesprovided by commercial GPR systems can be significantlyimproved by using suitable data processing strategies. In thisstudy, we have exploited a microwave tomography approachin which the imaging task is cast mathematically as alinear inverse scattering problem (Leucci et al 2011, Berteroand Boccacci 1998). Such an approach exploits the Bornapproximation (Leone and Soldovieri 2003) to model thescattering phenomenon and is worth considering due to itscapabilities in providing images, which are not only robustwith respect to measurement noise and uncertainties in thescenario, but also more easily interpreted. As a matter of fact,a reliable interpretation of the tomographic reconstructionsobtained can be provided by identifying the spatial variationsof the unknown electromagnetic contrast retrievable under agiven measurement configuration (Leone and Soldovieri 2003,Persico et al 2005, Persico 2006, Soldovieri et al 2006).Examples concerning the use of microwave tomography in theframework of archeological GPR prospections can be foundedin Leucci et al (2011) and Persico et al (2010).
Besides reporting on an interesting study case, theaim of this paper is to further assess the reconstructioncapabilities of microwave tomography enhanced GPR surveysin archeological prospecting. To this end, tomographicreconstructions obtained from GPR data collected inSeptember 2010 at the Centaur’s Domus are presented andtheir effectiveness is discussed on the basis of the outcomesof the following stratigraphic assays performed by thearcheologist team.
The rest of the paper is organized as follows. Thearcheological site, the adopted GPR device and the imagingapproach are described in section 2. In section 3, the GPRsurveys carried out in September 2010 are presented and thereliability of the tomographic images achieved is discussed bycomparing with ground truth. Conclusions then follow.
2. GPR surveys
2.1. Archeological site
Centaur’s Domus fills up the central part of the insula VI,9 and has two front doors in Mercurio street (see figure 2),one of the most famous streets of Pompeii. This house isparticularly important from an archeological point of viewsince its structure as it appeared in 79AC was the result of along architectural history.
Starting from the unpublished results of the surveycarried out by the archeologist H Van der Poel in 1962, theexcavation campaigns performed by the archeologist teamof the University of Napoli L’Orientale from 2002 to 2005allowed us to discover that housing unit 1 (see figure 2) hasbeen present since the fifth century AC (Coarelli and Pesando2004, 2005). As a matter of fact, stratigraphic assays broughtto light the ruins of an archaic wall dating back to the fifthcentury AC and, most important, a sumptuously decoratedhouse, named Protocasa del Centauro, which dated back tothe period between the end of the fourth century AC and thebeginning of the third.
In the middle of the second century AC, maybe dueto significant rebuilding aimed at constructing drain waterpipelines and/or redesigning the streets of the city, Protocasadel Centauro was buried below a ground layer of about 60 cm.In particular, the indoor walls were shaved and covered withfilling materials, while the perimetric wall and the front ofthe domus in opera quadrata were integrally preserved. Thisrestoration led the previous layout of the house to be redefined,which was changed in order to meet the style of an aristocratichouse. Accordingly, a domus with Tuscany atrium and gardenwas built. In the same period, a similar domus also arose inhousing unit 2 (see figure 2), which started its history in thisway.
At the end of the second century AC, these two domuswere merged, giving rise to a big house with a large Tuscanyatrium used as a boardroom. This house was completely
S93
I Catapano et al
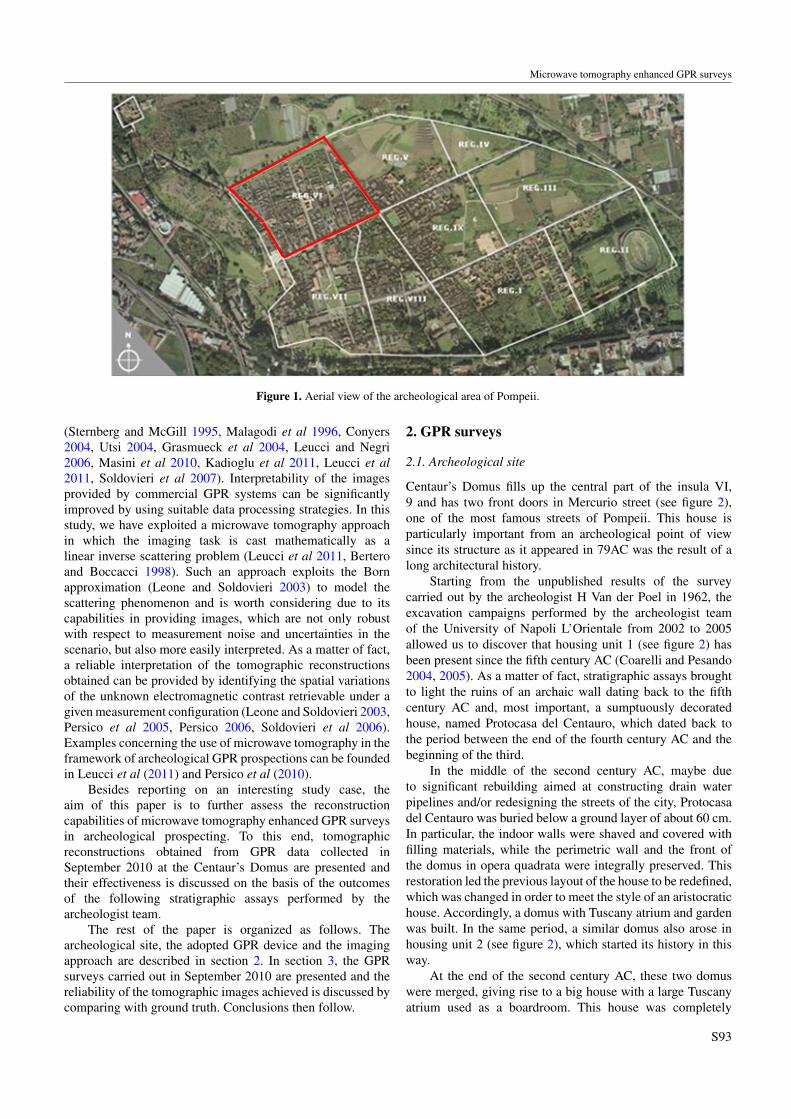
Figure 2. GPR surveyed regions.
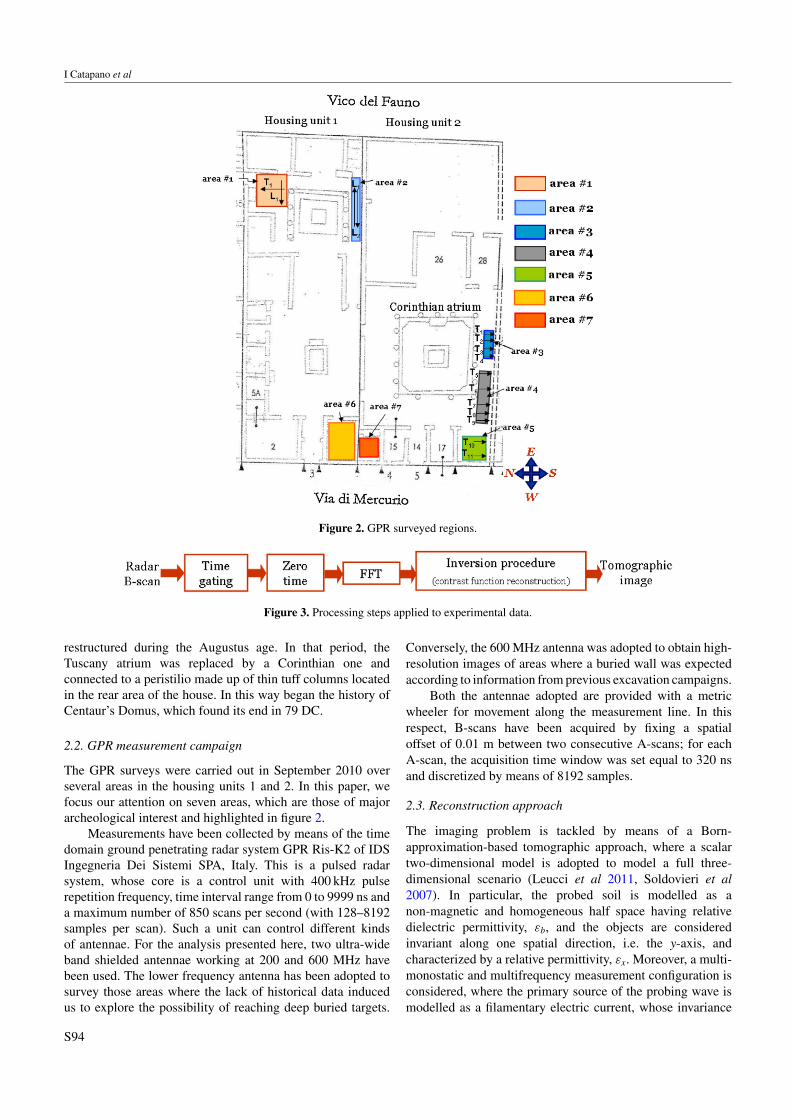
Figure 3. Processing steps applied to experimental data.
restructured during the Augustus age. In that period, theTuscany atrium was replaced by a Corinthian one andconnected to a peristilio made up of thin tuff columns locatedin the rear area of the house. In this way began the history ofCentaur’s Domus, which found its end in 79 DC.
2.2. GPR measurement campaign
The GPR surveys were carried out in September 2010 overseveral areas in the housing units 1 and 2. In this paper, wefocus our attention on seven areas, which are those of majorarcheological interest and highlighted in figure 2.
Measurements have been collected by means of the timedomain ground penetrating radar system GPR Ris-K2 of IDSIngegneria Dei Sistemi SPA, Italy. This is a pulsed radarsystem, whose core is a control unit with 400 kHz pulserepetition frequency, time interval range from 0 to 9999 ns anda maximum number of 850 scans per second (with 128–8192samples per scan). Such a unit can control different kindsof antennae. For the analysis presented here, two ultra-wideband shielded antennae working at 200 and 600 MHz havebeen used. The lower frequency antenna has been adopted tosurvey those areas where the lack of historical data inducedus to explore the possibility of reaching deep buried targets.
Conversely, the 600 MHz antenna was adopted to obtain high-resolution images of areas where a buried wall was expectedaccording to information from previous excavation campaigns.
Both the antennae adopted are provided with a metricwheeler for movement along the measurement line. In thisrespect, B-scans have been acquired by fixing a spatialoffset of 0.01 m between two consecutive A-scans; for eachA-scan, the acquisition time window was set equal to 320 nsand discretized by means of 8192 samples.
2.3. Reconstruction approach
The imaging problem is tackled by means of a Born-approximation-based tomographic approach, where a scalartwo-dimensional model is adopted to model a full three-dimensional scenario (Leucci et al 2011, Soldovieri et al2007). In particular, the probed soil is modelled as anon-magnetic and homogeneous half space having relativedielectric permittivity, εb, and the objects are consideredinvariant along one spatial direction, i.e. the y-axis, andcharacterized by a relative permittivity, εx. Moreover, a multi-monostatic and multifrequency measurement configuration isconsidered, where the primary source of the probing wave ismodelled as a filamentary electric current, whose invariance
S94
Microwave tomography enhanced GPR surveys
(a) (b)
(c) (d)
(e)
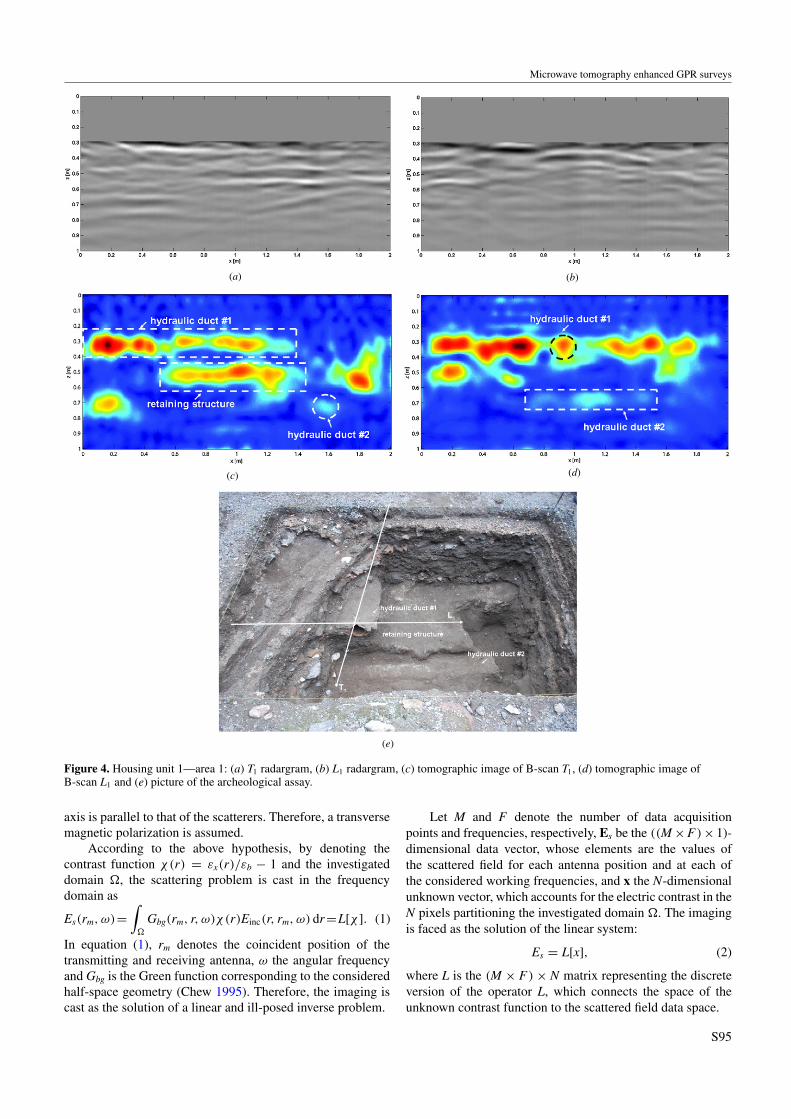
Figure 4. Housing unit 1—area 1: (a) T1 radargram, (b) L1 radargram, (c) tomographic image of B-scan T1, (d) tomographic image ofB-scan L1 and (e) picture of the archeological assay.
axis is parallel to that of the scatterers. Therefore, a transversemagnetic polarization is assumed.
According to the above hypothesis, by denoting thecontrast function χ(r) = εx(r)/εb − 1 and the investigateddomain �, the scattering problem is cast in the frequencydomain as
Es(rm, ω)=∫
�
Gbg(rm, r, ω)χ(r)Einc(r, rm, ω) dr=L[χ ]. (1)
In equation (1), rm denotes the coincident position of thetransmitting and receiving antenna, ω the angular frequencyand Gbg is the Green function corresponding to the consideredhalf-space geometry (Chew 1995). Therefore, the imaging iscast as the solution of a linear and ill-posed inverse problem.
Let M and F denote the number of data acquisitionpoints and frequencies, respectively, Es be the ((M × F )× 1)-dimensional data vector, whose elements are the values ofthe scattered field for each antenna position and at each ofthe considered working frequencies, and x the N-dimensionalunknown vector, which accounts for the electric contrast in theN pixels partitioning the investigated domain �. The imagingis faced as the solution of the linear system:
Es = L[x], (2)
where L is the (M × F ) × N matrix representing the discreteversion of the operator L, which connects the space of theunknown contrast function to the scattered field data space.
S95
I Catapano et al
(a) (b)
(c) (d )
(e)
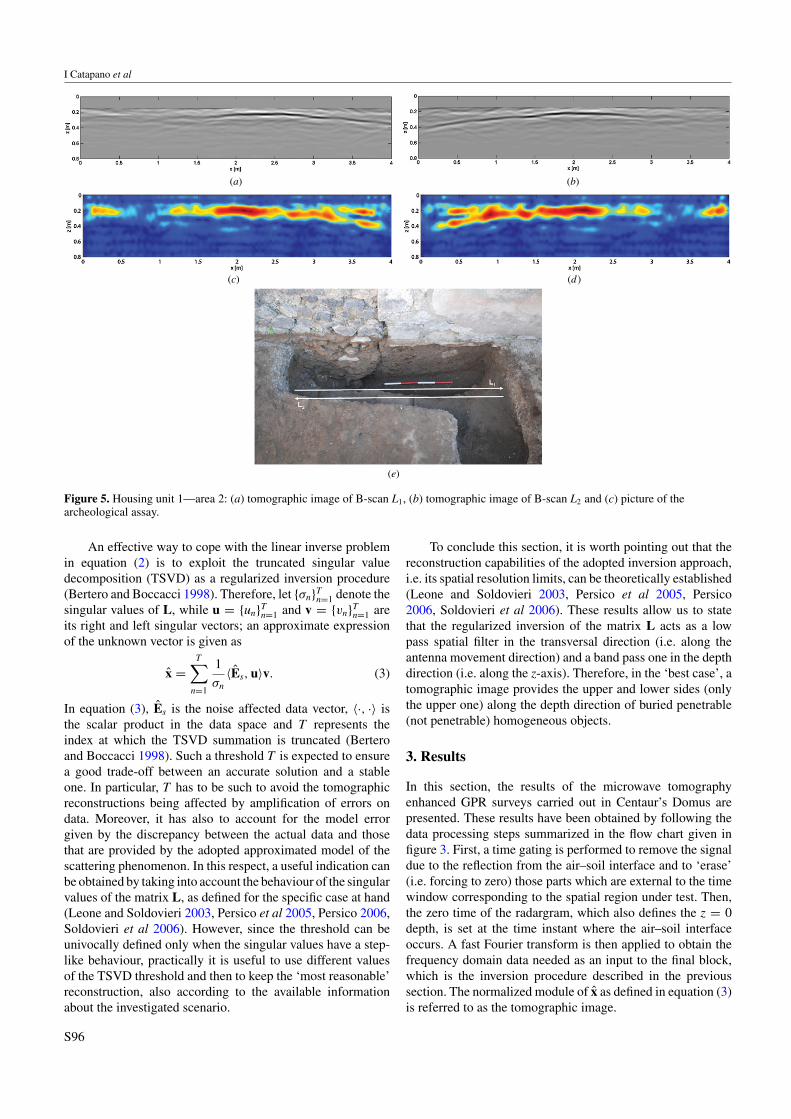
Figure 5. Housing unit 1—area 2: (a) tomographic image of B-scan L1, (b) tomographic image of B-scan L2 and (c) picture of thearcheological assay.
An effective way to cope with the linear inverse problemin equation (2) is to exploit the truncated singular valuedecomposition (TSVD) as a regularized inversion procedure(Bertero and Boccacci 1998). Therefore, let {σn}T
n=1 denote thesingular values of L, while u = {un}T
n=1 and v = {vn}Tn=1 are
its right and left singular vectors; an approximate expressionof the unknown vector is given as
x =T∑
n=1
1
σn〈Es, u〉v. (3)
In equation (3), Es is the noise affected data vector, 〈·, ·〉 isthe scalar product in the data space and T represents theindex at which the TSVD summation is truncated (Berteroand Boccacci 1998). Such a threshold T is expected to ensurea good trade-off between an accurate solution and a stableone. In particular, T has to be such to avoid the tomographicreconstructions being affected by amplification of errors ondata. Moreover, it has also to account for the model errorgiven by the discrepancy between the actual data and thosethat are provided by the adopted approximated model of thescattering phenomenon. In this respect, a useful indication canbe obtained by taking into account the behaviour of the singularvalues of the matrix L, as defined for the specific case at hand(Leone and Soldovieri 2003, Persico et al 2005, Persico 2006,Soldovieri et al 2006). However, since the threshold can beunivocally defined only when the singular values have a step-like behaviour, practically it is useful to use different valuesof the TSVD threshold and then to keep the ‘most reasonable’reconstruction, also according to the available informationabout the investigated scenario.
To conclude this section, it is worth pointing out that thereconstruction capabilities of the adopted inversion approach,i.e. its spatial resolution limits, can be theoretically established(Leone and Soldovieri 2003, Persico et al 2005, Persico2006, Soldovieri et al 2006). These results allow us to statethat the regularized inversion of the matrix L acts as a lowpass spatial filter in the transversal direction (i.e. along theantenna movement direction) and a band pass one in the depthdirection (i.e. along the z-axis). Therefore, in the ‘best case’, atomographic image provides the upper and lower sides (onlythe upper one) along the depth direction of buried penetrable(not penetrable) homogeneous objects.
3. Results
In this section, the results of the microwave tomographyenhanced GPR surveys carried out in Centaur’s Domus arepresented. These results have been obtained by following thedata processing steps summarized in the flow chart given infigure 3. First, a time gating is performed to remove the signaldue to the reflection from the air–soil interface and to ‘erase’(i.e. forcing to zero) those parts which are external to the timewindow corresponding to the spatial region under test. Then,the zero time of the radargram, which also defines the z = 0depth, is set at the time instant where the air–soil interfaceoccurs. A fast Fourier transform is then applied to obtain thefrequency domain data needed as an input to the final block,which is the inversion procedure described in the previoussection. The normalized module of x as defined in equation (3)is referred to as the tomographic image.
S96
Microwave tomography enhanced GPR surveys
(a)
(b)
(c)
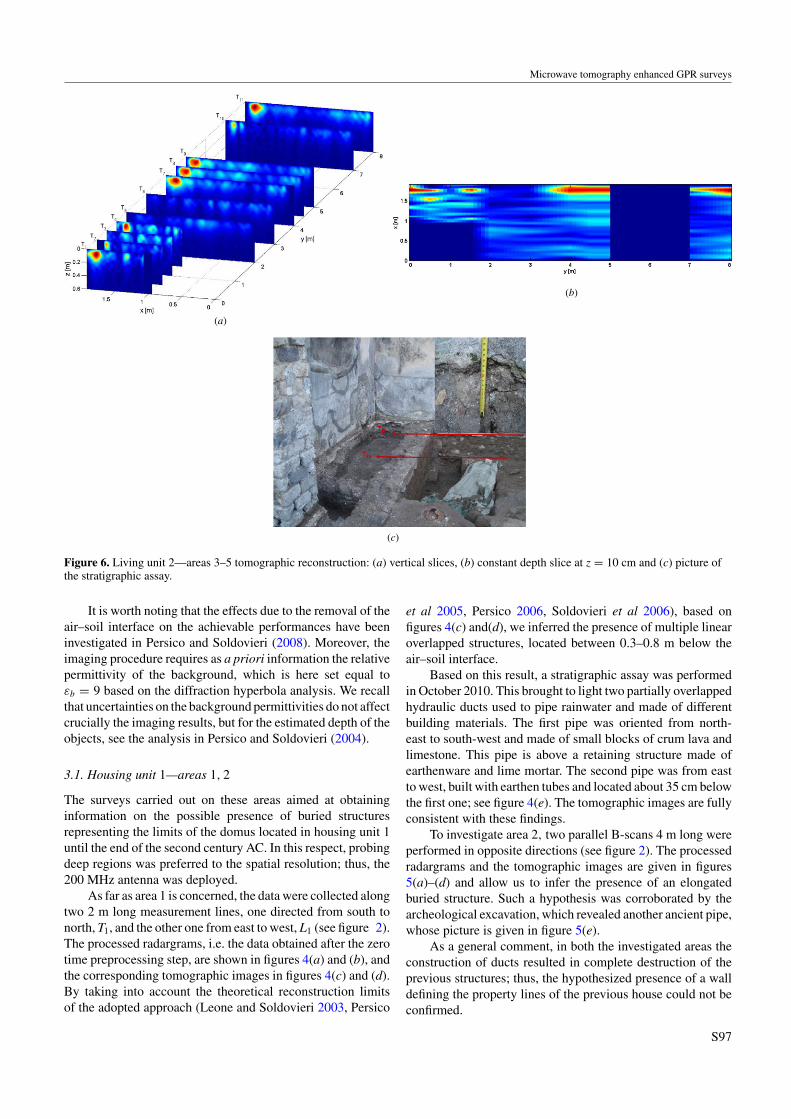
Figure 6. Living unit 2—areas 3–5 tomographic reconstruction: (a) vertical slices, (b) constant depth slice at z = 10 cm and (c) picture ofthe stratigraphic assay.
It is worth noting that the effects due to the removal of theair–soil interface on the achievable performances have beeninvestigated in Persico and Soldovieri (2008). Moreover, theimaging procedure requires as a priori information the relativepermittivity of the background, which is here set equal toεb = 9 based on the diffraction hyperbola analysis. We recallthat uncertainties on the background permittivities do not affectcrucially the imaging results, but for the estimated depth of theobjects, see the analysis in Persico and Soldovieri (2004).
3.1. Housing unit 1—areas 1, 2
The surveys carried out on these areas aimed at obtaininginformation on the possible presence of buried structuresrepresenting the limits of the domus located in housing unit 1until the end of the second century AC. In this respect, probingdeep regions was preferred to the spatial resolution; thus, the200 MHz antenna was deployed.
As far as area 1 is concerned, the data were collected alongtwo 2 m long measurement lines, one directed from south tonorth, T1, and the other one from east to west, L1 (see figure 2).The processed radargrams, i.e. the data obtained after the zerotime preprocessing step, are shown in figures 4(a) and (b), andthe corresponding tomographic images in figures 4(c) and (d).By taking into account the theoretical reconstruction limitsof the adopted approach (Leone and Soldovieri 2003, Persico
et al 2005, Persico 2006, Soldovieri et al 2006), based onfigures 4(c) and(d), we inferred the presence of multiple linearoverlapped structures, located between 0.3–0.8 m below theair–soil interface.
Based on this result, a stratigraphic assay was performedin October 2010. This brought to light two partially overlappedhydraulic ducts used to pipe rainwater and made of differentbuilding materials. The first pipe was oriented from north-east to south-west and made of small blocks of crum lava andlimestone. This pipe is above a retaining structure made ofearthenware and lime mortar. The second pipe was from eastto west, built with earthen tubes and located about 35 cm belowthe first one; see figure 4(e). The tomographic images are fullyconsistent with these findings.
To investigate area 2, two parallel B-scans 4 m long wereperformed in opposite directions (see figure 2). The processedradargrams and the tomographic images are given in figures5(a)–(d) and allow us to infer the presence of an elongatedburied structure. Such a hypothesis was corroborated by thearcheological excavation, which revealed another ancient pipe,whose picture is given in figure 5(e).
As a general comment, in both the investigated areas theconstruction of ducts resulted in complete destruction of theprevious structures; thus, the hypothesized presence of a walldefining the property lines of the previous house could not beconfirmed.
S97
I Catapano et al
(a) (b) (c)
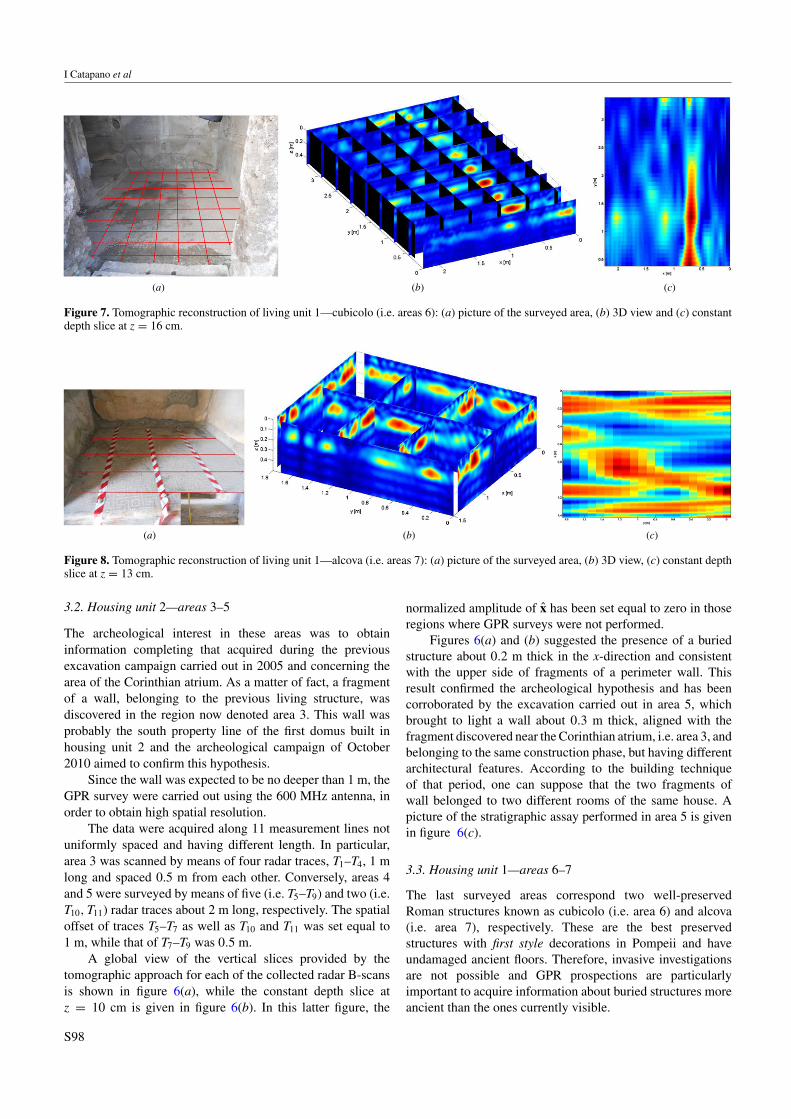
Figure 7. Tomographic reconstruction of living unit 1—cubicolo (i.e. areas 6): (a) picture of the surveyed area, (b) 3D view and (c) constantdepth slice at z = 16 cm.
(a) (b) (c)
Figure 8. Tomographic reconstruction of living unit 1—alcova (i.e. areas 7): (a) picture of the surveyed area, (b) 3D view, (c) constant depthslice at z = 13 cm.
3.2. Housing unit 2—areas 3–5
The archeological interest in these areas was to obtaininformation completing that acquired during the previousexcavation campaign carried out in 2005 and concerning thearea of the Corinthian atrium. As a matter of fact, a fragmentof a wall, belonging to the previous living structure, wasdiscovered in the region now denoted area 3. This wall wasprobably the south property line of the first domus built inhousing unit 2 and the archeological campaign of October2010 aimed to confirm this hypothesis.
Since the wall was expected to be no deeper than 1 m, theGPR survey were carried out using the 600 MHz antenna, inorder to obtain high spatial resolution.
The data were acquired along 11 measurement lines notuniformly spaced and having different length. In particular,area 3 was scanned by means of four radar traces, T1–T4, 1 mlong and spaced 0.5 m from each other. Conversely, areas 4and 5 were surveyed by means of five (i.e. T5–T9) and two (i.e.T10, T11) radar traces about 2 m long, respectively. The spatialoffset of traces T5–T7 as well as T10 and T11 was set equal to1 m, while that of T7–T9 was 0.5 m.
A global view of the vertical slices provided by thetomographic approach for each of the collected radar B-scansis shown in figure 6(a), while the constant depth slice atz = 10 cm is given in figure 6(b). In this latter figure, the
normalized amplitude of x has been set equal to zero in thoseregions where GPR surveys were not performed.
Figures 6(a) and (b) suggested the presence of a buriedstructure about 0.2 m thick in the x-direction and consistentwith the upper side of fragments of a perimeter wall. Thisresult confirmed the archeological hypothesis and has beencorroborated by the excavation carried out in area 5, whichbrought to light a wall about 0.3 m thick, aligned with thefragment discovered near the Corinthian atrium, i.e. area 3, andbelonging to the same construction phase, but having differentarchitectural features. According to the building techniqueof that period, one can suppose that the two fragments ofwall belonged to two different rooms of the same house. Apicture of the stratigraphic assay performed in area 5 is givenin figure 6(c).
3.3. Housing unit 1—areas 6–7
The last surveyed areas correspond two well-preservedRoman structures known as cubicolo (i.e. area 6) and alcova(i.e. area 7), respectively. These are the best preservedstructures with first style decorations in Pompeii and haveundamaged ancient floors. Therefore, invasive investigationsare not possible and GPR prospections are particularlyimportant to acquire information about buried structures moreancient than the ones currently visible.
S98
Microwave tomography enhanced GPR surveys
Accordingly, a large amount of data were acquired in boththe areas by using the 200 MHz shielded antenna.
As far as area 6 is concerned, data were collected alongnine transversal traces 2.3 m long and spaced 0.37 m fromeach other, as well as along six longitudinal traces 3.3 m longwith a spatial offset of 0.38 m.
The investigated structure and the measurement grid areshown in figure 7(a), while figures 7(b) and (c) show the 3Dview of the tomographic reconstructions and the correspondingconstant depth slice at z = 16 cm, respectively. These imagessupport the archeological hypothesis that an ancient wall isburied below the cubicolo.
Finally, area 7 was surveyed by collecting data along threetransversal traces 1.8 m long and spaced 0.37 m from eachother, as well as along four longitudinal traces 1.4 m long witha spatial offset of 0.38 m.
Figures 8(a), (b) and (c) show a picture of the surveyedarea 7, a 3D view of the tomographic reconstructions and theslice at the depth z = 13 cm, respectively. Based on the imagesin figures 8(b) and (c) one can infer the presence of a materialinterface about 13 cm below the air–soil interface, whichis consistent with the hypothesis that one building materialwas placed above another in order to make the step from thecubicolo to the alcova, which is visible in figure 8(a).
4. Conclusions
The results of a microwave tomography enhanced groundpenetrating radar (GPR) campaign carried out at thearcheological site of Pompeii have been presented. The GPRsurveys were carried out to acquire preliminary information inorder to properly address the excavation campaign performedby the archeologist team in October 2010. The imaging was setup as a linear inverse scattering problem and solved by meansof a trunacted single value decomposition based approach.The latter provided tomographic images, which allowed us tolocate several buried structures, whose presence was confirmedby the stratigraphic assays. This represents a valuable proofof the reconstruction capabilities of the adopted imagingapproach.
References
Bertero M and Boccacci P 1998 Introduction to Inverse Problems inImaging (Bristol, UK: Institute of Physics Publishing)
Chew W C 1995 Waves and Fields in Inhomogeneous Media 2ndedn (New York: IEEE)
Coarelli F and Pesando F 2004 Pompei: Progetto Regio VIwww.fastionline.org/docs/Folder-it-2004-26.pdf
Coarelli F and Pesando F 2005 Pompei: Progetto Regio VI.Aggiornamento 2005 www.fastionline.org/docs/Folder-it-2006-54.pdf
Conyers L B 2004 Ground-Penetration Radar for Archaeology(USA: Altamira Press)
Daniels D J 2004 Ground Penetrating Radar (IEE Radar, Sonar andNavigation Series vol 15) (London, UK: IEE)
Grasmueck M, Weger R and Horstmeyer H 2004 Three-dimensionalground-penetrating radar imaging of sedimentary structures,fractures and archaeological features at submeter resolutionGeology 32 933–6
Kadioglu S, Kadioglu Y K and Akyol A A 2011 Monitoring buriedremains with a transparent 3D half bird’s eye view of groundpenetrating radar data in the Zeynel Bey tomb in the ancientcity of Hasankeyf, Turkey J. Geophys. Eng. 8 S61–75
Leone G and Soldovieri F 2003 Analysis of the distorted Bornapproximation for subsurface reconstruction: truncation anduncertainties effect IEEE Trans. Geosci. Remote Sens.41 66–74
Leucci G and Negri S 2006 Use of ground penetrating radar to mapsubsurface archaeological features in an urban areaJ. Archaeological Sci. 33 502–12
Leucci G, Masini N, Persico R and Soldovieri F 2011 GPR andsonic tomography for structural restoration: the case of theCathedral of Tricarico J. Geophys. Eng. 8 S76–92
Malagodi S, Orlando L, Piro S and Rosso F 1996 Location ofarchaeological structures using GPR method:three-dimensional data acquisition and radar signal processingArchaeol. Prospect. 3 13–23
Masini N, Persico R and Rizzo E 2010 Some examples of GPRprospecting for monitoring of the monumental heritageJ. Geophys. Eng. 7 190–9
Persico R and Soldovieri F 2004 Effects of uncertainty onbackground permittivity in one-dimensional linear inversescattering J. Opt. Soc. Am. A 21 2334–43
Persico R and Soldovieri F 2008 Effects of the background removalin linear inverse scattering IEEE Trans. Geosci. Remote Sens.46 1104–14
Persico R 2006 On the role of measurement configuration incontactless GPR data processing by means of linear inversescattering IEEE Trans. Antennas Propag. 54 2062–71
Persico R, Bernini R and Soldovieri F 2005 The role of themeasurement configuration in inverse scattering from buriedobjects under the Born approximation IEEE Trans. AntennasPropag. 53 1875–87
Persico R, Soldovieri F and Utsi E 2010 Microwave tomography forprocessing of GPR data at Ballachulish J. Geophys. Eng.7 164–73
Soldovieri F, Hugenschmidt J, Persico R and Leone G 2007 A linearinverse scattering algorithm for realistic GPR applicationsNear Surf. Geophys. 5 29–41
Soldovieri F, Persico R and Leone G 2006 A microwavetomographic imaging approach for multibistatic configuration:the choice of the frequency step IEEE Trans. Instrum. Meas.55 1926–34
Sternberg B K and McGill J W 1995 Archaeology studies insouthern Arizona using ground penetrating radar J. Appl.Geophys. 33 209–25
Utsi E 2004 Ground-penetrating radar time-slices from NorthBallachulish Moss Archaeol. Prospect. 11 65–75
S99
Related Documents