Microwave Technology for Earth Observation Dr. David Kunkee, The Aerospace Corporation Jeffrey Piepmeier, NASA Goddard Space Flight Center Dr. Gregory Sadowy, Jet Propulsion Laboratory, California Institute of Technology November 20, 2018

Welcome message from author
This document is posted to help you gain knowledge. Please leave a comment to let me know what you think about it! Share it to your friends and learn new things together.
Transcript

Microwave Technologyfor Earth Observation
Dr. David Kunkee, The Aerospace CorporationJeffrey Piepmeier, NASA Goddard Space Flight Center
Dr. Gregory Sadowy, Jet Propulsion Laboratory, California Institute of Technology
November 20, 2018

Microwave Technologyfor Earth Observation
Dr. David Kunkee, The Aerospace CorporationNovember 20, 2018

Microwave Technology for Earth Observation November, 20 2018
• Microwave Technologies for Earth Observation– Microwave Remote Sensing Taxonomy
• Related points from the 2017 Decadal Survey• Examples of Active and Passive Microwave Technology Developments• Questions

• 2016 ESTO Microwave Technologies Review and Strategy– Summarizes the state-of-the-art in microwave technology in support of NASA’s Earth
science measurement goals– JPL and GSFC Face-to-face working group meetings; Town Hall via Webinar: 17 Mar 2016– Report available: https://esto.nasa.gov/files/Microwave_TechStrategy_2016.pdf
• 2017 Decadal Survey for Earth Science and Applications from Space “ESAS 2017”– “Recommendations for the environmental monitoring and Earth science and applications
communities for an integrated and sustainable approach to the conduct of the U.S. government’s civilian space-based Earth-system science programs”
– Over 290 RFI responses were submitted by science community– Report available: http://sites.nationalacademies.org/DEPS/ESAS2017/index.html
• Microwave Technologies for Earth Observation – Investigates links between decadal survey recommendations, target observations and
microwave technology development opportunities – The following charts show some of technology areas identified in the 2016 ESTO report
Microwave Technologies for Earth Observation
Background

• Within NASA Earth Observation is structured around 6 principal focus areas:– Atmospheric Composition; Carbon and Ecosystems; Climate Variability and Change;
Earth Surface and Interior Structure; Water and Energy Cycle; and Weather– Applications and techniques of microwave measurements are summarized in the pictures
https://esto.nasa.gov/files/Microwave_TechStrategy_2016.pdf
• The NASA Earth Science Technology Office (ESTO) has published a Technology development strategy to support key EO target objectives
• Potential to significantly reduce cost of obtaining target measurements Microwave technology development in of support critical Earth observations is an import aspect to achieve and maintain affordable missions
Microwave Based Earth Observation
Active (Radar) Observation Passive (Radiometer) Observation
Repeat Pass Interferometry • Surface deformation• Seismology• Damage Assessment
• Cloud, Ice, Precipitation
• Ocean Winds• Ocean Currents
Synthetic Aperture Radar (SAR)• Sea Ice Ecology • Land Classification• Ecology Sea Ice • Oceanography• Rapid Response (e.g. oil spills, forest fires)

Technology developments required to complete the remaining tiered 2007 NRC decadal survey missions carrying microwave sensors.
Microwave Remote Sensing Taxonomy
Supporting 2007 Decadal Survey missions
https://esto.nasa.gov/files/Microwave_TechStrategy_2016.pdf

Technology developments assessed as valuable for completing remaining tiered 2007 NRC decadal survey missions and may have cost saving opportunities for new missions
Microwave Remote Sensing Taxonomy
Supporting 2007 Decadal Survey missions + potential new missions
https://esto.nasa.gov/files/Microwave_TechStrategy_2016.pdf

2017 NRC Decadal Survey Report
Notes from the Decadal Survey
• National Research Council (NRC) report entitled “Thriving on our changing planet: A decadal strategy for Earth Observations from Space”– Released on January 5, 2018
• Selected Recommendations:– Recommendation 3.2: Implement Space-based observation capabilities (NASA)
• Consistent with the priorities identified in the 2017 report– Recommendation 3.3: Avoiding cost growth:
• Innovative cost reduction, through programmatic or technological advances and partnerships, should be sought and incentivized where possible
– Recommendation 4.7: Increase technology programs: • Small scope increase from 3% to ~5%
– Recommendation 4.12: Co-develop technology that will be used by NOAA• Establish a flexible framework with NASA to accomplish technical development
• URL: http://sites.nationalacademies.org/DEPS/ESAS2017/index.html – This briefing focuses on technology supporting a portion of the objectives outlined in
ESAS 2017

Passive Microwave Instruments and
TechnologyJeffrey Piepmeier
NASA’s Goddard Space Flight CenterNovember 20, 2018
9

Technology developments assessed as valuable for completing remaining tiered 2007 NRC decadal survey missions and may have cost saving opportunities for new missions
Microwave Remote Sensing Taxonomy
Supporting 2007 Decadal Survey missions + potential new missions

Two Major Developments of the Past Decade
11

IceCube: 0.9 THz in Space
https://atmospheres.gsfc.nasa.gov/climate/index.php?section=259
A BA B
Clear Sky
TyphoonCloud Bands
IceCube captured Typhoon Trami’s cloud bands on the typhoon’s top in this scan on September 29, 2018.
Producing useful science and advancing space technology with a low-cost CubeSat developed under an effective government-commercial partnership.
GSFC, WFF & VDI
12

TEMPEST-D 89 GHz Brightness Temperature (K) 10/15 – 10/16
Hurricane Florence
Typhoon Yutu
9/11
10/24
TEMPEST-D captures intense precipitation in
tropical cyclones
TEMPEST-D data show excellent calibration and pointing stability over multiple orbits from a CubeSat platform right out of the box
Remarkable agreement between TEMPEST-D and NOAA
operational MHS sensor from day 1
TEMPEST-D: Good observations can come in small packages JPL & CSU
13

CubeRRT: Realtime RFI Mitigation• CubeRRT’s processor implements complex algorithms on-board to
detect and remove man-made radio frequency interference (RFI) in realtime
• Produces a single output free of RFI that reduces data downlink requirementby more than 100 times
Relative pow
erR
elative power
After RFI flagging
White areas mark RFI removed
128 frequency channelspectrum used onboard
Smoothed CubeRRT radiometer brightness temperatures demonstrate on-board RFI filtering: original RFI corrupted signal (blue) corrected on-orbit to RFI filtered signal (red) that is validated with ground processed data (black). On-board filtering requires 99% less data to be downlinked.
10 minute data collect over Pacific ocean
9/5/1813:15-13:25Z
OSU, JPL & GSFC
14

Signals-of-Opportunity for Root Zone Soil Moisture
• Develop new microwave remote sensing instrument to directly measure root zone soil moisture (RZSM).
• Develop an airborne instrument to demonstrate concepts of SoOp reflectometry at P- and S-band frequency ranges for RZSM.
• Up to 30-cm sensing depth (SMAP is 5-6 cm) and sensitivity of 0.04 (volumetric) below the first few cm of soil.
• Provide improved RZSM product, as compared to those from model assimilation.
• SoOp-AD: Designed and built P/S-band (240 – 270 GHz) receiver system to demonstrate RZSM from B-200 aircraft
• Conducted 6 flights over SMAP USDA/ARS sites in Little Washita watershed, OK to measure reflectivity data over various soils
• Conducted field experiments at Purdue Agronomy Center for Research and Education to characterize the reflected signals to demonstrate soil moisture over bare ground
• Awarded SNOOPI InVEST cubesat from ESTO for flight demo (Purdue, GSFC & JPL).
SoOp-AD utilizes reflected P- and S-band digital signals to measure RZSM. Overlay on first “quick-look” data from Little Washita, OK (10/16)
Field experiment at Purdue
Purdue, GSFC & JPL
15

Passive Microwave in ESAS2017 Examples from Table 3.5
16

Microwave Technology Thrusts• Advance signal processing and machine learning for
radiometer detectors• Miniaturize instruments for mmw and submmw imagers,
sounders and constellations • Increase level of integration for reduction of SWaP• Advance deployable antennas and focal plane arrays for
low-frequency and/or high-performance instruments
17

Active Microwave Instruments (aka Radar)
and TechnologyDr. Gregory Sadowy
Jet Propulsion Laboratory, California Institute of Technology
November 20, 2018
18

Intro to Radar Remote Sensing• Why remote sensing?
– The area to be investigated is too large, inaccessible or hazardous (e.g., the Amazon basin,other bodies in the solar system, around an active volcano) for direct human observation.
– Remote sensing systems are sensitive to aspects of the environment that elude our 5 senses.– Remote sensing provides a mechanism to objectively and quantitatively monitor the
processes that govern changes to the environment either from natural or anthropogeniccauses.
• Radar has several unique features that makes it the sensor of choice for many remote sensingapplications:
– Radar operates in day or night and thus can be deployed at anytime– Radar operates in all weather conditions
• Weather impact on radar signals depends on wavelength – generally as the wavelengthgets smaller the impact is greater
– For Synthetic Aperture Radar (SAR), resolution is independent of range, yielding fineresolution even at large distances with a moderately sized sensor.
– Microwave radar signals of different wavelengths interact uniquely with the environmentand provide information not obtainable by optical sensors.
19Adapted from “Introduction to SAR Technology”, Scott Hensley, APSAR, Seoul South Korea 2011

Radar Imaging• Radars are basically clocks that record the round trip time from electromagnetic
waves to propagate to and from the receiver.
Radar = Radio Detection and Ranging
D = Distance or Range
D
Distance determined from round-trip time it takes microwaves to
travel from antenna to object
Radars emit microwaves, a form oflight with wavelengths about 100000times longer than visible light, andmeasure the reflected signal.
Reflected Signal at anImage Pixel
Strength of reflected signal&
“phase” - encodes sub-wavelength range information
08.4 µs16.6 µs25.0 µs
Echo Travel Time
33.0 µs41.6 µs50.0 µs58.3 µs66.7 µs75.0 µs83.3 µs
Adapted from “Introduction to SAR Technology”, Scott Hensley, APSAR, Seoul South Korea 2011

Radar Range Equation
21
Transmit
Receive
Transmit Power
Transmit Antenna Gain
Power Density &Propagation Loss
BackscatterFrom Scene
Power Density &Propagation Loss
Various Losses ReceiveAntenna Gain
Radar Equation
Noise
Adapted from “Introduction to SAR Technology”, Scott Hensley, APSAR, Seoul South Korea 2011

Radar Remote Sensing Techniques(typical, not comprehensive!)
22
Imaging Radar
• Produces 2D images of a surface• Measures backscatter amplitude and phase
for each pixel• Multiple frequencies/polarizations can be
combined to estimate surface properties (see above)
• Multiple phase images can combined to measure height or height changes (interferometry, see below)
• Typical applications: Mapping, military intelligence, land use, change detection
Scatterometry
• Much like a radar imager a scatterometerproduces a 2D image
• However, a scatterometer produces very precise, calibrated backscatter measurements but perhaps not phase
• Typical applications: Ocean wind speed/direction, ocean salinity, soil moisture
Polarimetric composite image of Mt. St. Helens
Interferometric image of Baja earthquake
Aquarius ocean salinity image
QuikScat winds, hurricane Howard, 2004
Sounding
• Penetrates through the surface to produce an image in a vertical plane
• Antenna scanning can be used to produce 3D volume data
• Typical applications: Ice sounding (Earth, Mars, Europa, comets), cloud and precipitation measurement
CloudSat radar profile of typhoon Dolphin (2005)
SHARAD image of Mars Northern Polar Deposits

Imaging Radar• Imaging radars generally use a side-looking geometry to
create a “swath”• Pixel resolution in the range direction is determined by
the radar pulse bandwidth– more bandwidth = finer resolution
• Pixel resolution in the along-track (azimuth) direction is determined by the antenna size
– bigger antenna = finer resolution– many along track measurements can be combined to approximate a
much larger antenna: Synthetic Aperture Radar (SAR)
• Two phase images collected simultaneously from antennas at different locations can be used to determine the height for each pixel
– This is “cross-track interferometry”
• Two phase images collected from the same location at different times can be used to determine the change in height for each pixel
– This is “repeat-pass interferometry”
• Different frequencies and polarization images can be combined further determine the scattering properties of the surface
– This is very useful for classification of the surface23 Polarimetric SAR image of San Francisco, CA

Radar Scatterometry• Scatterometers collect very precise,
calibrated backscatter images• Often coarser resolution than SAR
– Some scatterometers have used limited SAR processing to improve resolution
• Key design challenges are stability and calibration
– Internal calibration systems are almost always required
– Very careful design is required. Thermally-driven glitches which would be easy to ignore in an imaging radar can destroy science performance
– We care about 0.01 dB!
• Radar system engineers must also analyze and track error budgets much more thoroughly than for a typical imaging radar
24
• Most imaging radars are used to classify a scene
• A scatterometer seeks to quantify the scene
ISS-RapidScat measured ocean winds, November 2015

Sounding Radars• Sounding differs from other types of
radar in that it penetrates through a propagation medium rather than reflecting only from a surface
• Some typical media for sounding– Atmosphere
• Wind measurement (commercial wind profilers)
• Clouds and precipitation (TRMM, GPM, NexRAD, many airborne systems
– Ice• Glaciers on Earth (several airborne radars)• Mars (MARSIS, SHARAD, instruments)• Europa (REASON, in development)• Cometary nuclei (maybe in the future?)
– Earth• Ground Penetrating Radar (commercially
available)
25
• Penetration depth depends strongly on frequency
– For ice and earth, low frequencies are desirable (1-100 MHz)
– For the atmosphere microwave / millimeter-waves are used (2.6 GHz – 95 GHz)
• As for imaging radars, multiple frequencies and polarization can be used to help classify target properties
GPM rain measurements of Typhoon Phanfone, 2014
26
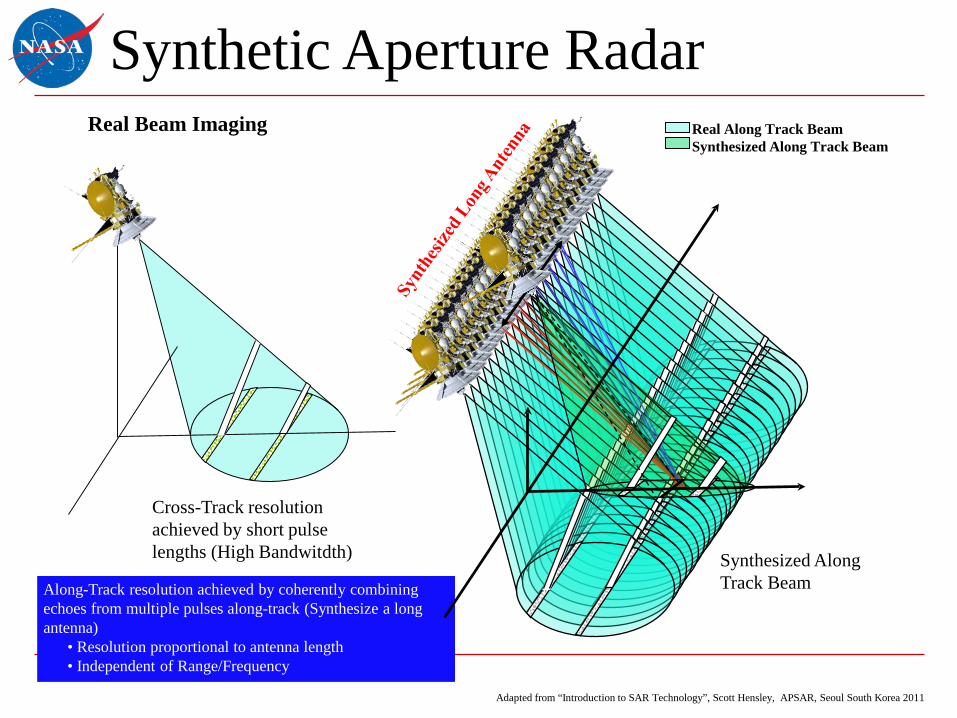
Synthetic Aperture Radar
Cross-Track resolutionachieved by short pulse lengths (High Bandwitdth) Synthesized Along
Track Beam
Real Along Track BeamSynthesized Along Track Beam
Along-Track resolution achieved by coherently combining echoes from multiple pulses along-track (Synthesize a long antenna)
• Resolution proportional to antenna length• Independent of Range/Frequency
Real Beam Imaging
Adapted from “Introduction to SAR Technology”, Scott Hensley, APSAR, Seoul South Korea 2011

Imaging Radar Resolution
Along-Track Resolution• Without SAR:
– Inversely proportional to antenna length– Proportional to range
• With SAR:– resolution ~ antenna length / 2 (strip map geometry)– Independent of range!
• Synthetic aperture length increases with range
Cross-Track Resolution• Beam limited
– Pulse resolution on surface is larger than antenna beam footprint.
– Inversely proportional to antenna width
• Pulse limited– Pulse resolution on surface is smaller than antenna
beam footprint– Inversely proportional to pulse bandwidth– Can use short (time-limited) pulses or longer pulses
with phase or frequency coding (eg. linear FM chirp)– Signal processing can “compress” long pulse to
effectively shorter pulses27
pulse-limited resolution
beam-limited resolution
real-apertureresolution
SARresolution
Synthetic aperture(not to scale)
These principles are described for side-looking geometry but can also be applied to other geometries

Phased Array Antennas• Array of individual radiating elements with controllable phase• Phases are set such that an incoming plane wave at a particular
angle yields receiver signals that constructively add to increase signal power
– Phase can be fixed and set during the design processes– When phase is electronically controlled this is known as an Active
Electronically-Steered Array (AESA)
• Array may take any shape with elements distributed in 3D space. Common configurations
– Linear (1D steering)– Planar (2D steering)– Conformal (eg. follows shape of aircraft fuselage)
• When radiator spacing is greater the 𝜆𝜆2, array is spatially under
sampled (Nyquist theorem) and unwanted “grating lobes” appear in radiation pattern
– This presents technology challenges for millimeter-wave AESA. 𝜆𝜆2
at 94 GHz is only 1.8-mm, so fitting active electronics is such small spacing is difficult!
• Unlike traditional radar power consumption may be dominated by receiver not transmitter
– There are many receivers (instead of just one) and receivers are turned on for longer than transmitter
• NASA AESA examples:– UAVSAR (1.2 GHz), TRMM PR (13.4 GHz), GPM DPR (13.4/35.6
GHz 28
d
𝜙𝜙 = 𝑛𝑛𝑛𝑛𝑛𝑛𝑛𝑛𝑛𝑛𝑛𝑛𝜃𝜃 𝑛𝑛 =2𝜋𝜋𝜆𝜆
𝜆𝜆 = wavelength𝑛𝑛 = element #
16-channel, 35 GHz Array Antenna

Key Radar Technology Areas• Large deployable antennas
– Larger antennas yield a smaller spot size on target. This sets along-track resolution for non-SAR systems
– Antennas must be stowed into a small volume for launch, so deployment is required for antennas larger than ~4m-5m
• Active electronically-steered antennas (AESA)
– Rapid beam steering enables collection of 3D data from a fast moving (7km/s for LEO) platform
– Sampling time is precious, electronic steering allows allocation of sampling time in a way the optimizes science measurements
• High efficiency transmitters– Radars consume much more power than
other instruments and are often limited by available power
– Gains in transmitter efficiency reduce demands on spacecraft power and thermal subsystems
• Digital Radar Transceivers– Convert signals to/from analog to digital
domain as close to the antenna as feasible– Enables more ideal signal processing since
digital operations are mathematically perfect (to a certain precision)
– Pushing functionality into the digital domain also provides flexibility that enables multiple applications for a single instrument or multiple instrument designs from a single hardware design
29
Related Documents