Citation: Chang, D.; Zhong, Z.; Valle, A.; Jin, W.; Jiang, S.; Tang, J.; Hong, Y. Microwave Photonic Signal Generation in an Optically Injected Discrete Mode Semiconductor Laser. Photonics 2022, 9, 171. https:// doi.org/10.3390/photonics9030171 Received: 14 February 2022 Accepted: 7 March 2022 Published: 10 March 2022 Publisher’s Note: MDPI stays neutral with regard to jurisdictional claims in published maps and institutional affil- iations. Copyright: © 2022 by the authors. Licensee MDPI, Basel, Switzerland. This article is an open access article distributed under the terms and conditions of the Creative Commons Attribution (CC BY) license (https:// creativecommons.org/licenses/by/ 4.0/). photonics hv Communication Microwave Photonic Signal Generation in an Optically Injected Discrete Mode Semiconductor Laser Da Chang 1 , Zhuqiang Zhong 1 , Angel Valle 2 , Wei Jin 1 , Shan Jiang 1 , Jianming Tang 1 and Yanhua Hong 1, * 1 School of Computer Science and Electronic Engineering, Bangor University, Bangor LL57 1UT, UK; [email protected] (D.C.); [email protected] (Z.Z.); [email protected] (W.J.); [email protected] (S.J.); [email protected] (J.T.) 2 Instituto de Física de Cantabria (IFCA), Universidad de Cantabria-CSIC, E39005 Santander, Spain; [email protected] * Correspondence: [email protected] Abstract: In this paper, microwave photonic signal generation based on the period-one dynamic of optically injected discrete mode (DM) semiconductor lasers has been experimentally demonstrated and numerically simulated. The results show that the frequency of the generated microwave increases linearly with the frequency detuning or optical injection ratio. In addition, a single optical feedback loop is sufficient to reduce the microwave linewidth without significantly deteriorating side mode suppression. The simulation results using a model considering the nonlinear dependencies of the carrier recombination agree well with the experimental results, which indicates that the nonlinear carrier recombination effect is important in determining the nonlinear dynamics of optically injected DM lasers. Keywords: microwave photonics signal generation; discrete mode semiconductor laser; optical injection 1. Introduction In the fast-developing information society, radio and microwave signals play signifi- cant roles in the field of communication, radar, and sensing systems [1–3]. To implement high-speed transmission in wireless networks as well as high-resolution detection in radar and sensing systems, high-frequency microwave signals with salient features such as ul- tralow phase noise and broad tunable range are highly required. However, it is complicated and costly to generate such desired high-frequency microwaves by multiple frequency dou- bling based on conventional electronic circuits [4]. Moreover, such high-frequency electrical microwave signals inevitably suffer enormous attenuation in coaxial cable transmissions for most practical scenarios [5]. To address these technical challenges, the photonic ap- proach, well known as microwave photonics, has been applied to overcome the bottleneck of microwave generation in the electrical domain. Generally speaking, photonic generation of microwave signals has superior advantages in terms of high frequency (up to millimeter- wave band), broad frequency tunability, low propagation loss in optical fibers, and high robustness to electromagnetic interference [6–36]. Additionally, recently reported InP- and silicon-based photonic integrated devices/circuits [6–8] further expand the perspective of photonic high-frequency microwave, and thus it becomes a very hot research topic in the fields of radio-over-fiber (RoF), optical signal processing, true time delay beamforming, subnoise detection, etc. [9–12]. Compared with microwave synthesis using electronics, which has been extensively explored and developed over the past decades, high-frequency microwave photonic (MWP) signal generation in the optical domain is more convenient and cost-effective. Various approaches of MWP signal generation can generally be classified into optical heterodyn- ing [13,14], direct and external modulation [15–17], self-pulsating and mode-locking [18,19], optoelectronic oscillators (OEOs) [20–24], and laser dynamics of period-one (P1) [25–36]. Photonics 2022, 9, 171. https://doi.org/10.3390/photonics9030171 https://www.mdpi.com/journal/photonics

Welcome message from author
This document is posted to help you gain knowledge. Please leave a comment to let me know what you think about it! Share it to your friends and learn new things together.
Transcript

�����������������
Citation: Chang, D.; Zhong, Z.; Valle,
A.; Jin, W.; Jiang, S.; Tang, J.; Hong, Y.
Microwave Photonic Signal
Generation in an Optically Injected
Discrete Mode Semiconductor Laser.
Photonics 2022, 9, 171. https://
doi.org/10.3390/photonics9030171
Received: 14 February 2022
Accepted: 7 March 2022
Published: 10 March 2022
Publisher’s Note: MDPI stays neutral
with regard to jurisdictional claims in
published maps and institutional affil-
iations.
Copyright: © 2022 by the authors.
Licensee MDPI, Basel, Switzerland.
This article is an open access article
distributed under the terms and
conditions of the Creative Commons
Attribution (CC BY) license (https://
creativecommons.org/licenses/by/
4.0/).
photonicshv
Communication
Microwave Photonic Signal Generation in an Optically InjectedDiscrete Mode Semiconductor LaserDa Chang 1, Zhuqiang Zhong 1 , Angel Valle 2 , Wei Jin 1 , Shan Jiang 1, Jianming Tang 1 and Yanhua Hong 1,*
1 School of Computer Science and Electronic Engineering, Bangor University, Bangor LL57 1UT, UK;[email protected] (D.C.); [email protected] (Z.Z.); [email protected] (W.J.);[email protected] (S.J.); [email protected] (J.T.)
2 Instituto de Física de Cantabria (IFCA), Universidad de Cantabria-CSIC, E39005 Santander, Spain;[email protected]
* Correspondence: [email protected]
Abstract: In this paper, microwave photonic signal generation based on the period-one dynamic ofoptically injected discrete mode (DM) semiconductor lasers has been experimentally demonstratedand numerically simulated. The results show that the frequency of the generated microwave increaseslinearly with the frequency detuning or optical injection ratio. In addition, a single optical feedbackloop is sufficient to reduce the microwave linewidth without significantly deteriorating side modesuppression. The simulation results using a model considering the nonlinear dependencies of thecarrier recombination agree well with the experimental results, which indicates that the nonlinearcarrier recombination effect is important in determining the nonlinear dynamics of optically injectedDM lasers.
Keywords: microwave photonics signal generation; discrete mode semiconductor laser; optical injection
1. Introduction
In the fast-developing information society, radio and microwave signals play signifi-cant roles in the field of communication, radar, and sensing systems [1–3]. To implementhigh-speed transmission in wireless networks as well as high-resolution detection in radarand sensing systems, high-frequency microwave signals with salient features such as ul-tralow phase noise and broad tunable range are highly required. However, it is complicatedand costly to generate such desired high-frequency microwaves by multiple frequency dou-bling based on conventional electronic circuits [4]. Moreover, such high-frequency electricalmicrowave signals inevitably suffer enormous attenuation in coaxial cable transmissionsfor most practical scenarios [5]. To address these technical challenges, the photonic ap-proach, well known as microwave photonics, has been applied to overcome the bottleneckof microwave generation in the electrical domain. Generally speaking, photonic generationof microwave signals has superior advantages in terms of high frequency (up to millimeter-wave band), broad frequency tunability, low propagation loss in optical fibers, and highrobustness to electromagnetic interference [6–36]. Additionally, recently reported InP- andsilicon-based photonic integrated devices/circuits [6–8] further expand the perspective ofphotonic high-frequency microwave, and thus it becomes a very hot research topic in thefields of radio-over-fiber (RoF), optical signal processing, true time delay beamforming,subnoise detection, etc. [9–12].
Compared with microwave synthesis using electronics, which has been extensivelyexplored and developed over the past decades, high-frequency microwave photonic (MWP)signal generation in the optical domain is more convenient and cost-effective. Variousapproaches of MWP signal generation can generally be classified into optical heterodyn-ing [13,14], direct and external modulation [15–17], self-pulsating and mode-locking [18,19],optoelectronic oscillators (OEOs) [20–24], and laser dynamics of period-one (P1) [25–36].
Photonics 2022, 9, 171. https://doi.org/10.3390/photonics9030171 https://www.mdpi.com/journal/photonics

Photonics 2022, 9, 171 2 of 12
The optical heterodyne technique can easily achieve terahertz photonic microwaves bybeating between two optical beams with certain wavelength spacing, as such the techniquehas very wide tunability [13]. However, the inevitable mismatch of optical phases and fluc-tuated amplitudes between two noncoherent lasers results in extremely poor microwavestability, which becomes an Achilles’ heel for applications requiring high stability. Directand external modulation schemes are also very important for high-frequency MWP signalgeneration. The former possesses the simplest architecture for MWP signal generation, butits modulation bandwidth is limited by the relaxation oscillation frequency of the lasers,which is usually less than 15 GHz, and the modulation depth is also relatively low [15].On the other hand, MWP signal generation utilizing external modulation can attain veryhigh frequency and low phase noise microwave signals, but there is a drawback resultingfrom the insertion loss of the modulators [16]. An OEO is another paradigmatic methodto obtain narrow-linewidth microwave signals in both the electrical and optical domainsby introducing a feedback loop as a high-quality-factor optoelectronic oscillating cavityto a pump laser [20–24]. Consequently, the phase noise of generated microwaves can becomparable with that produced by mode-locked lasers [19], but the frequency tunabilityis compromised.
Recently, a competitive approach of MWP signal generation based on the P1 dynamicof semiconductor lasers has been proposed and explored [25–36]. The P1 dynamic ofsemiconductor lasers can be achieved by optical injection under certain injection parameters,which causes the optical output intensity of semiconductor lasers to undergo self-sustainedoscillation at a microwave frequency [25]. The MWP signal is generated when the opticaloutput of semiconductor lasers at P1 dynamic is detected by a photodetector. Due to theinjection pulling effect and the redshift effect, the generated photonic microwave frequencycan be tens of times higher than the relaxation resonance frequency of the semiconductorlaser while a relatively simple system setup still remains to support flexible tunability [26].Therefore, considering the characteristics such as cost, power effectiveness, and all-opticalbroad frequency tunability, MWP signal generation based on P1 dynamic of semiconductorlasers becomes a promising method, and it has been widely studied for different typesof semiconductor lasers. For distributed feedback (DFB) semiconductor lasers, Chanet al. comprehensively studied the P1-dynamic-based photonic microwave generation,transmission, and processing, as well as its single sideband (SSB) characteristics [27–29].Wang et al. reported continuous tunable photonic microwave generation in quantumdot semiconductor lasers [30]. For vertical-cavity surface-emitting lasers (VCSELs), Perezet al. achieved more than 20 GHz MWP signal using a single-mode VCSEL [31]. Lin et al.experimentally demonstrated microwave generation in multi-transverse-mode VCSELs bydual-beam orthogonal optical injection [32]. Li et al. numerically investigated the effectof birefringence-induced oscillation on the photonic microwave in spin VCSELs [33]. Weexperimentally and theoretically studied broad tunable photonic microwaves in opticallyinjected VCSELs and discussed the suppression of second harmonic distortion [34–36].Furthermore, to improve the quality of P1-dynamic-based photonic microwave, extensiveresearch efforts have also been made, which mainly include extra RF source enabledsubharmonic locking and stabilization [37] and optical self-locking methods, such asoptoelectronic feedback [38] and single and double external cavity optical feedback [27].
As a special type of Fabry–Perot semiconductor lasers, discrete mode (DM) lasers havesimilar geometry structures to standard Fabry–Perot lasers but contain a small number ofetching features along the ridge waveguide. This unique feature guarantees that DM laserscan achieve single longitudinal mode operation with high sidemode suppression [39]. DMlasers also have many other impressive characteristics, such as very narrow linewidth,wide temperature operation range, low cost, and easy integration [40]. These salientfeatures undoubtedly imply that DM lasers are a good candidate for P1-dynamic-basedlow-phase-noise photonic microwave generation. However, the previous reports on DMlasers [41,42] do not address the photonic microwave generation in optically injected DMlasers. Therefore, in this paper, we focus on photonic microwave generation based on the

Photonics 2022, 9, 171 3 of 12
period-one dynamic of optically injected DM semiconductor lasers. The main parametersaffecting the fundamental frequency, power, linewidth, and phase noise of the generatedphotonic microwave have been experimentally studied. In addition, optical feedback is alsoadopted to further optimize the linewidth of the generated microwave. Finally, a modifiedrate equation model is proposed to numerically analyze the frequency of the generatedmicrowave in DM lasers.
2. Experimental Setup
The schematic diagram of the experimental setup in a slave–master laser configurationis illustrated in Figure 1. In this experiment, a commercially available TO-56 can-packagedfiber pigtailed DM laser (Eblana Photonics, Dublin, Ireland, EP1550-DM-01-FA) with alasing wavelength of about 1550 nm is used as a slave laser (SL). The DM laser is driven byan ultralow-noise current source (YOKOGAWA, Tokyo, Japan, GS200) and the temperatureis stabilized at 24 ◦C by a temperature controller (Tektronix, Beaverton, OR, USA, TED 200)with an accuracy of 0.01 ◦C. A tunable laser (Agilent, Santa Clara, CA, USA, 8164A) is usedas a master laser (ML). The emission of the ML is injected into the SL after traveling througha polarization controller (PC1), a 50:50 fiber coupler (FC1), and an optical circulator (OC).The PC1 is used to match the polarization of the injection beam to the SL’s polarization.The output of the DM laser passes through the OC and is divided into a feedback path anda detection path by a 90:10 fiber coupler (FC2). The feedback loop is composed of a PC2,a variable attenuator (VA), and FC1. The polarization of the feedback light is controlledby the PC2 to be parallel to the polarization of the DM laser. The detection path is furthersplit by the FC3, and the light beams are detected by a photodetector (PD, Thorlabs,Newton, MA, USA, RXM40AF, 40 GHz bandwidth) and a high-resolution optical spectrumanalyzer (OSA, APEX Technologies, Marcoussis, France, APEX 2070, 4 pm resolution),respectively. The output of the PD is recorded by an electrical spectrum analyzer (ESA,Anritsu, Atsugi, Japan, MS2667C, 30 GHz bandwidth) or an oscilloscope (OSC, Tektronix71254C, 12.5 GHz bandwidth).
Photonics 2022, 9, x FOR PEER REVIEW 3 of 12
on DM lasers [41,42] do not address the photonic microwave generation in optically in-
jected DM lasers. Therefore, in this paper, we focus on photonic microwave generation
based on the period-one dynamic of optically injected DM semiconductor lasers. The main
parameters affecting the fundamental frequency, power, linewidth, and phase noise of the
generated photonic microwave have been experimentally studied. In addition, optical
feedback is also adopted to further optimize the linewidth of the generated microwave.
Finally, a modified rate equation model is proposed to numerically analyze the frequency
of the generated microwave in DM lasers.
2. Experimental Setup
The schematic diagram of the experimental setup in a slave–master laser configura-
tion is illustrated in Figure 1. In this experiment, a commercially available TO-56 can-
packaged fiber pigtailed DM laser (Eblana Photonics, Dublin, Ireland, EP1550-DM-01-FA)
with a lasing wavelength of about 1550 nm is used as a slave laser (SL). The DM laser is
driven by an ultralow-noise current source (YOKOGAWA, Tokyo, Japan, GS200) and the
temperature is stabilized at 24 °C by a temperature controller (Tektronix, Beaverton, OR,
USA, TED 200) with an accuracy of 0.01 °C. A tunable laser (Agilent, Santa Clara, CA,
USA, 8164A) is used as a master laser (ML). The emission of the ML is injected into the SL
after traveling through a polarization controller (PC1), a 50:50 fiber coupler (FC1), and an
optical circulator (OC). The PC1 is used to match the polarization of the injection beam to
the SL’s polarization. The output of the DM laser passes through the OC and is divided
into a feedback path and a detection path by a 90:10 fiber coupler (FC2). The feedback loop
is composed of a PC2, a variable attenuator (VA), and FC1. The polarization of the feed-
back light is controlled by the PC2 to be parallel to the polarization of the DM laser. The
detection path is further split by the FC3, and the light beams are detected by a photode-
tector (PD, Thorlabs, Newton, MA, USA, RXM40AF, 40 GHz bandwidth) and a high-res-
olution optical spectrum analyzer (OSA, APEX Technologies, Marcoussis, France, APEX
2070, 4 pm resolution), respectively. The output of the PD is recorded by an electrical
spectrum analyzer (ESA, Anritsu, Atsugi, Japan, MS2667C, 30 GHz bandwidth) or an os-
cilloscope (OSC, Tektronix 71254C, 12.5 GHz bandwidth).
The DM laser is biased at 30 mA, which is 2.5 times its threshold current. Under this
operation condition, the output power of the free-running DM laser is 0.6 mW, and the
relaxation oscillation frequency is about 6.2 GHz. In this paper, the optical injection ratio
(ξinj) is defined as the optical injection power divided by the output power of the free-
running DM laser, and the injection power is measured just before the injection beam en-
ters the SL. The feedback ratio is defined as the ratio between the feedback power and the
free-running DM laser output power. The feedback power is measured just before the
feedback beam is fed into the DM laser. The frequency detuning (Δf) is defined as finj − fSL,
where finj and fSL are the frequencies of the ML and the free-running SL, respectively. ξinj
and Δf can be tuned by adjusting the output power and the frequency of the ML, respec-
tively, and the feedback ratio is controlled by tuning the VA.
Figure 1. Schematic of the experimental setup. ML: master laser, SL: slave laser, PC: polarization
control, FC: fiber coupler, OC: optical circulator, VA: variable attenuator, PD: photodetector, ESA:
electrical spectrum analyzer, OSA: optical spectrum analyzer, OSC: oscilloscope.
Figure 1. Schematic of the experimental setup. ML: master laser, SL: slave laser, PC: polarizationcontrol, FC: fiber coupler, OC: optical circulator, VA: variable attenuator, PD: photodetector, ESA:electrical spectrum analyzer, OSA: optical spectrum analyzer, OSC: oscilloscope.
The DM laser is biased at 30 mA, which is 2.5 times its threshold current. Underthis operation condition, the output power of the free-running DM laser is 0.6 mW, andthe relaxation oscillation frequency is about 6.2 GHz. In this paper, the optical injectionratio (ξinj) is defined as the optical injection power divided by the output power of thefree-running DM laser, and the injection power is measured just before the injection beamenters the SL. The feedback ratio is defined as the ratio between the feedback power andthe free-running DM laser output power. The feedback power is measured just before thefeedback beam is fed into the DM laser. The frequency detuning (∆f ) is defined as f inj − f SL,where f inj and f SL are the frequencies of the ML and the free-running SL, respectively.ξinj and ∆f can be tuned by adjusting the output power and the frequency of the ML,respectively, and the feedback ratio is controlled by tuning the VA.

Photonics 2022, 9, 171 4 of 12
3. Experimental Results
First, the dynamical evolution of the DM laser subject to optical injection is examined.The DM laser subject to optical injection without applying optical feedback is achieved bydisconnecting PC2 from the rest of the experimental setup. Figure 2 displays the (a) timeseries, (b) power spectra, (c) optical spectra, and (d) phase portraits, of dynamical behaviorsof the DM laser with different ξinj when ∆f is fixed at 10 GHz. The phase portrait isdefined as the local N-th intensity as a function of (N−1)-th intensity. When ξinj = 0.06 (row1), obviously, the DM laser experiences Hopf bifurcation and oscillates at P1 state with afundamental frequency (f 0) of 10.1 GHz. The tunability and quality of microwave generatedin the optically injected DM laser based on P1 dynamic will be discussed in the next section.When ξinj is increased to 0.36 (row 2), the DM laser shows period-two (P2) oscillation. Afterfurther increasing ξinj to 0.56 (row 3), the laser is in chaos dynamic. The above resultsindicate that the optically injected DM laser enters chaos through period doubling.
Photonics 2022, 9, x FOR PEER REVIEW 4 of 12
3. Experimental Results
First, the dynamical evolution of the DM laser subject to optical injection is examined.
The DM laser subject to optical injection without applying optical feedback is achieved by
disconnecting PC2 from the rest of the experimental setup. Figure 2 displays the (a) time
series, (b) power spectra, (c) optical spectra, and (d) phase portraits, of dynamical behav-
iors of the DM laser with different ξinj when Δf is fixed at 10 GHz. The phase portrait is
defined as the local N-th intensity as a function of (N-1)-th intensity. When ξinj = 0.06 (row
1), obviously, the DM laser experiences Hopf bifurcation and oscillates at P1 state with a
fundamental frequency (f0) of 10.1 GHz. The tunability and quality of microwave gener-
ated in the optically injected DM laser based on P1 dynamic will be discussed in the next
section. When ξinj is increased to 0.36 (row 2), the DM laser shows period-two (P2) oscilla-
tion. After further increasing ξinj to 0.56 (row 3), the laser is in chaos dynamic. The above
results indicate that the optically injected DM laser enters chaos through period doubling.
Figure 2. (a) Time series, (b) power spectra, (c) optical spectra, and (d) phase portraits of the DM
laser output when Δf is 10 GHz and ξinj is 0.06 (row 1), 0.36 (row 2), and 0.56 (row 3).
In order to find P1 operation regions, the dynamics of the optically injected DM laser
in a parameter space of frequency detuning Δf and injection ratio ξinj are measured and
plotted in Figure 3. In the map, the stable (S), P1, P2, quasiperiod (QP), and chaos (C)
dynamics are denoted by dark blue, light blue, green, orange, and red, respectively. Two
non-P1 regions over the injection parameter space of 4 GHz < Δf < 14 GHz and 0.2 < ξinj <
1 and −16 GHz < Δf < −8 GHz and 0.1 < ξinj < 1 are larger than those in DFB lasers [28], but
P1 dynamic still dominates on the region above the Hopf bifurcation line.
Figure 3. Dynamical map of the optically injected DM laser.
Figure 2. (a) Time series, (b) power spectra, (c) optical spectra, and (d) phase portraits of the DMlaser output when ∆f is 10 GHz and ξinj is 0.06 (row 1), 0.36 (row 2), and 0.56 (row 3).
In order to find P1 operation regions, the dynamics of the optically injected DM laserin a parameter space of frequency detuning ∆f and injection ratio ξinj are measured andplotted in Figure 3. In the map, the stable (S), P1, P2, quasiperiod (QP), and chaos (C)dynamics are denoted by dark blue, light blue, green, orange, and red, respectively. Twonon-P1 regions over the injection parameter space of 4 GHz < ∆f < 14 GHz and 0.2 < ξinj < 1and −16 GHz < ∆f < −8 GHz and 0.1 < ξinj < 1 are larger than those in DFB lasers [28], butP1 dynamic still dominates on the region above the Hopf bifurcation line.
Photonics 2022, 9, x FOR PEER REVIEW 4 of 12
3. Experimental Results
First, the dynamical evolution of the DM laser subject to optical injection is examined.
The DM laser subject to optical injection without applying optical feedback is achieved by
disconnecting PC2 from the rest of the experimental setup. Figure 2 displays the (a) time
series, (b) power spectra, (c) optical spectra, and (d) phase portraits, of dynamical behav-
iors of the DM laser with different ξinj when Δf is fixed at 10 GHz. The phase portrait is
defined as the local N-th intensity as a function of (N-1)-th intensity. When ξinj = 0.06 (row
1), obviously, the DM laser experiences Hopf bifurcation and oscillates at P1 state with a
fundamental frequency (f0) of 10.1 GHz. The tunability and quality of microwave gener-
ated in the optically injected DM laser based on P1 dynamic will be discussed in the next
section. When ξinj is increased to 0.36 (row 2), the DM laser shows period-two (P2) oscilla-
tion. After further increasing ξinj to 0.56 (row 3), the laser is in chaos dynamic. The above
results indicate that the optically injected DM laser enters chaos through period doubling.
Figure 2. (a) Time series, (b) power spectra, (c) optical spectra, and (d) phase portraits of the DM
laser output when Δf is 10 GHz and ξinj is 0.06 (row 1), 0.36 (row 2), and 0.56 (row 3).
In order to find P1 operation regions, the dynamics of the optically injected DM laser
in a parameter space of frequency detuning Δf and injection ratio ξinj are measured and
plotted in Figure 3. In the map, the stable (S), P1, P2, quasiperiod (QP), and chaos (C)
dynamics are denoted by dark blue, light blue, green, orange, and red, respectively. Two
non-P1 regions over the injection parameter space of 4 GHz < Δf < 14 GHz and 0.2 < ξinj <
1 and −16 GHz < Δf < −8 GHz and 0.1 < ξinj < 1 are larger than those in DFB lasers [28], but
P1 dynamic still dominates on the region above the Hopf bifurcation line.
Figure 3. Dynamical map of the optically injected DM laser. Figure 3. Dynamical map of the optically injected DM laser.

Photonics 2022, 9, 171 5 of 12
Now, we focus on MWP signal generation based on P1 dynamic in the opticallyinjected DM laser. The effects of ∆f and ξinj on the fundamental frequency (f 0) and thepower of the generated microwave are presented in Figure 4. The power of the generatedmicrowave is defined as the peak power at the fundamental frequency. Figure 4a showsthe frequency of the generated microwave as a function of the injection ratio. Threefrequency detunings of 15, 17, and 20 GHz are studied here because the optically injectedDM laser operates at P1 dynamic over a much wider injection ratio range with ∆f ≥ 15 GHz.The results reveal that the microwave frequency increases linearly with the increase ininjection ratio, and the change rate of the microwave frequency drops when the frequencydetuning increases, which is similar to that in the DFB laser and VCSEL [28,34]. Therelationship between the generated microwave power and the injection ratio is shownin Figure 4b, which shows that the power of the generated microwave first increasesas the injection ratio increases, and when ξinj = 0.92, the microwave powers reach theirmaximum values. Upon a further increase in the injection ratio, the microwave powersdecrease again. The reason for the maximum power at the injection ratio of 0.92 is thatthe gain distribution of the semiconductor laser is affected by the optical injection, whichcauses the amplitudes of the redshifted cavity resonance component and the regeneratedinjection component in the optical spectrum of P1 dynamic to change with the injection ratio.When the injection ratio is about 0.92, the amplitudes of the redshifted cavity resonancecomponent and the regenerative injection component are almost the same; therefore, themicrowave power reaches its maximum [28,43]. This phenomenon is similar to that in theDFB laser and VCSELs, where there is a maximum microwave power for a fixed frequencydetuning [28,34]. The impact of ∆f on the frequency and power of the generated microwavephotonic signal is investigated under two injection ratios: a lower injection ratio ξinj = 0.1and a higher injection ratio ξinj = 0.92, as shown in Figure 4c,d. There is no surprise thatthe microwave frequency increases with the increase in the frequency detuning becausethe main contribution of the generated microwave is the frequency beating of the redshiftcavity frequency and the regenerated injection frequency. The microwave power decreaseswith the increase in the frequency detuning due to the decrease in nonlinear frequencymixing effect with increasing ∆f [29].
Photonics 2022, 9, x FOR PEER REVIEW 5 of 12
Now, we focus on MWP signal generation based on P1 dynamic in the optically in-
jected DM laser. The effects of Δf and ξinj on the fundamental frequency (f0) and the power
of the generated microwave are presented in Figure 4. The power of the generated micro-
wave is defined as the peak power at the fundamental frequency. Figure 4a shows the
frequency of the generated microwave as a function of the injection ratio. Three frequency
detunings of 15, 17, and 20 GHz are studied here because the optically injected DM laser
operates at P1 dynamic over a much wider injection ratio range with Δf ≥ 15 GHz. The
results reveal that the microwave frequency increases linearly with the increase in injec-
tion ratio, and the change rate of the microwave frequency drops when the frequency
detuning increases, which is similar to that in the DFB laser and VCSEL [28,34]. The rela-
tionship between the generated microwave power and the injection ratio is shown in Fig-
ure 4b, which shows that the power of the generated microwave first increases as the in-
jection ratio increases, and when ξinj = 0.92, the microwave powers reach their maximum
values. Upon a further increase in the injection ratio, the microwave powers decrease
again. The reason for the maximum power at the injection ratio of 0.92 is that the gain
distribution of the semiconductor laser is affected by the optical injection, which causes
the amplitudes of the redshifted cavity resonance component and the regenerated injec-
tion component in the optical spectrum of P1 dynamic to change with the injection ratio.
When the injection ratio is about 0.92, the amplitudes of the redshifted cavity resonance
component and the regenerative injection component are almost the same; therefore, the
microwave power reaches its maximum [28,43]. This phenomenon is similar to that in the
DFB laser and VCSELs, where there is a maximum microwave power for a fixed frequency
detuning [28,34]. The impact of Δf on the frequency and power of the generated micro-
wave photonic signal is investigated under two injection ratios: a lower injection ratio ξinj
= 0.1 and a higher injection ratio ξinj = 0.92, as shown in Figure 4c,d. There is no surprise
that the microwave frequency increases with the increase in the frequency detuning be-
cause the main contribution of the generated microwave is the frequency beating of the
redshift cavity frequency and the regenerated injection frequency. The microwave power
decreases with the increase in the frequency detuning due to the decrease in nonlinear
frequency mixing effect with increasing Δf [29].
Figure 4. (a) Frequency and (b) power of the generated microwave as a function of injection ratio;
(c) frequency and (d) power of the microwave versus frequency detuning.
The quality of the generated microwave in the optically injected DM laser is exam-
ined by analyzing its linewidth and phase noise. A 3 dB linewidth is adopted to quantify
Figure 4. (a) Frequency and (b) power of the generated microwave as a function of injection ratio;(c) frequency and (d) power of the microwave versus frequency detuning.
The quality of the generated microwave in the optically injected DM laser is examinedby analyzing its linewidth and phase noise. A 3 dB linewidth is adopted to quantify thelinewidth, and the phase noise is obtained by integrating single sideband power spectrum
Photonics 2022, 9, 171 6 of 12
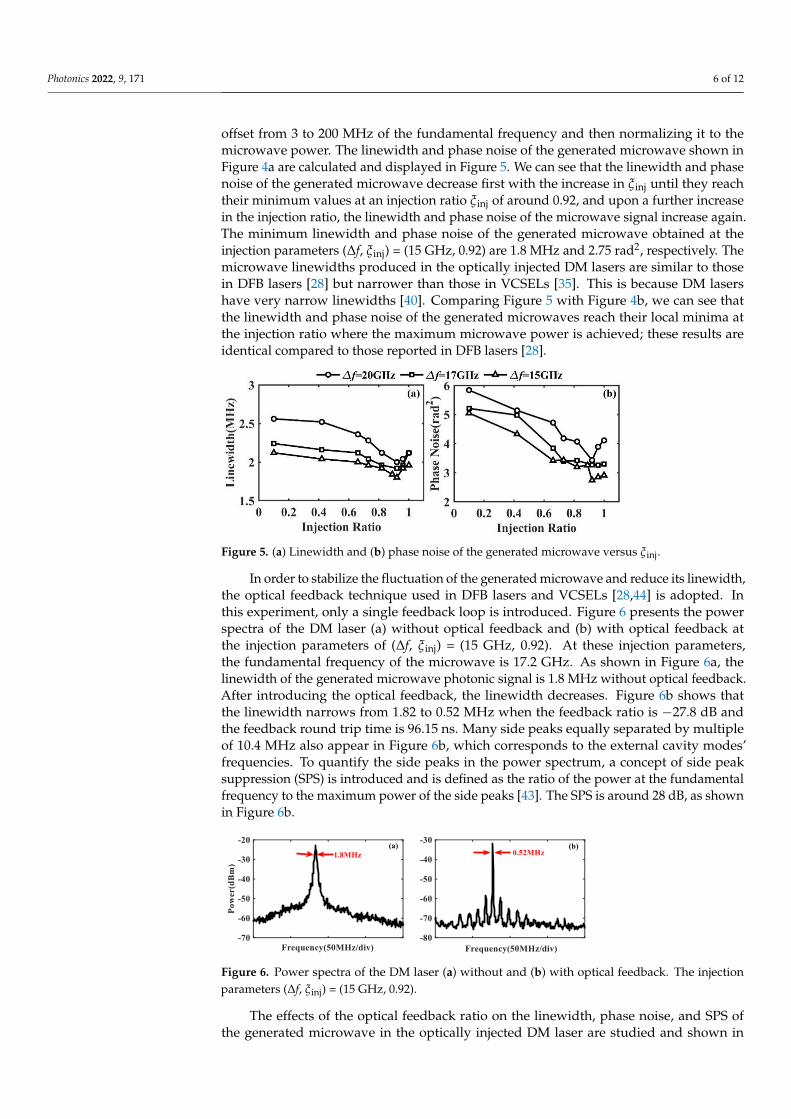
offset from 3 to 200 MHz of the fundamental frequency and then normalizing it to themicrowave power. The linewidth and phase noise of the generated microwave shown inFigure 4a are calculated and displayed in Figure 5. We can see that the linewidth and phasenoise of the generated microwave decrease first with the increase in ξinj until they reachtheir minimum values at an injection ratio ξinj of around 0.92, and upon a further increasein the injection ratio, the linewidth and phase noise of the microwave signal increase again.The minimum linewidth and phase noise of the generated microwave obtained at theinjection parameters (∆f, ξinj) = (15 GHz, 0.92) are 1.8 MHz and 2.75 rad2, respectively. Themicrowave linewidths produced in the optically injected DM lasers are similar to thosein DFB lasers [28] but narrower than those in VCSELs [35]. This is because DM lasershave very narrow linewidths [40]. Comparing Figure 5 with Figure 4b, we can see thatthe linewidth and phase noise of the generated microwaves reach their local minima atthe injection ratio where the maximum microwave power is achieved; these results areidentical compared to those reported in DFB lasers [28].
Photonics 2022, 9, x FOR PEER REVIEW 6 of 12
the linewidth, and the phase noise is obtained by integrating single sideband power spec-
trum offset from 3 to 200 MHz of the fundamental frequency and then normalizing it to
the microwave power. The linewidth and phase noise of the generated microwave shown
in Figure 4a are calculated and displayed in Figure 5. We can see that the linewidth and
phase noise of the generated microwave decrease first with the increase in ξinj until they
reach their minimum values at an injection ratio ξinj of around 0.92, and upon a further
increase in the injection ratio, the linewidth and phase noise of the microwave signal in-
crease again. The minimum linewidth and phase noise of the generated microwave ob-
tained at the injection parameters (Δf, ξinj) = (15 GHz, 0.92) are 1.8 MHz and 2.75 rad2,
respectively. The microwave linewidths produced in the optically injected DM lasers are
similar to those in DFB lasers [28] but narrower than those in VCSELs [35]. This is because
DM lasers have very narrow linewidths [40]. Comparing Figure 5 with Figure 4b, we can
see that the linewidth and phase noise of the generated microwaves reach their local min-
ima at the injection ratio where the maximum microwave power is achieved; these results
are identical compared to those reported in DFB lasers [28].
Figure 5. (a) Linewidth and (b) phase noise of the generated microwave versus ξinj.
In order to stabilize the fluctuation of the generated microwave and reduce its lin-
ewidth, the optical feedback technique used in DFB lasers and VCSELs [28,44] is adopted.
In this experiment, only a single feedback loop is introduced. Figure 6 presents the power
spectra of the DM laser (a) without optical feedback and (b) with optical feedback at the
injection parameters of (Δf, ξinj) = (15 GHz, 0.92). At these injection parameters, the funda-
mental frequency of the microwave is 17.2 GHz. As shown in Figure 6a, the linewidth of
the generated microwave photonic signal is 1.8 MHz without optical feedback. After in-
troducing the optical feedback, the linewidth decreases. Figure 6b shows that the lin-
ewidth narrows from 1.82 to 0.52 MHz when the feedback ratio is −27.8 dB and the feed-
back round trip time is 96.15 ns. Many side peaks equally separated by multiple of 10.4
MHz also appear in Figure 6b, which corresponds to the external cavity modes’ frequen-
cies. To quantify the side peaks in the power spectrum, a concept of side peak suppression
(SPS) is introduced and is defined as the ratio of the power at the fundamental frequency
to the maximum power of the side peaks [43]. The SPS is around 28 dB, as shown in Figure
6b.
Figure 6. Power spectra of the DM laser (a) without and (b) with optical feedback. The injection
parameters (Δf, ξinj) = (15 GHz, 0.92).
Figure 5. (a) Linewidth and (b) phase noise of the generated microwave versus ξinj.
In order to stabilize the fluctuation of the generated microwave and reduce its linewidth,the optical feedback technique used in DFB lasers and VCSELs [28,44] is adopted. Inthis experiment, only a single feedback loop is introduced. Figure 6 presents the powerspectra of the DM laser (a) without optical feedback and (b) with optical feedback atthe injection parameters of (∆f, ξinj) = (15 GHz, 0.92). At these injection parameters,the fundamental frequency of the microwave is 17.2 GHz. As shown in Figure 6a, thelinewidth of the generated microwave photonic signal is 1.8 MHz without optical feedback.After introducing the optical feedback, the linewidth decreases. Figure 6b shows thatthe linewidth narrows from 1.82 to 0.52 MHz when the feedback ratio is −27.8 dB andthe feedback round trip time is 96.15 ns. Many side peaks equally separated by multipleof 10.4 MHz also appear in Figure 6b, which corresponds to the external cavity modes’frequencies. To quantify the side peaks in the power spectrum, a concept of side peaksuppression (SPS) is introduced and is defined as the ratio of the power at the fundamentalfrequency to the maximum power of the side peaks [43]. The SPS is around 28 dB, as shownin Figure 6b.
Photonics 2022, 9, x FOR PEER REVIEW 6 of 12
the linewidth, and the phase noise is obtained by integrating single sideband power spec-
trum offset from 3 to 200 MHz of the fundamental frequency and then normalizing it to
the microwave power. The linewidth and phase noise of the generated microwave shown
in Figure 4a are calculated and displayed in Figure 5. We can see that the linewidth and
phase noise of the generated microwave decrease first with the increase in ξinj until they
reach their minimum values at an injection ratio ξinj of around 0.92, and upon a further
increase in the injection ratio, the linewidth and phase noise of the microwave signal in-
crease again. The minimum linewidth and phase noise of the generated microwave ob-
tained at the injection parameters (Δf, ξinj) = (15 GHz, 0.92) are 1.8 MHz and 2.75 rad2,
respectively. The microwave linewidths produced in the optically injected DM lasers are
similar to those in DFB lasers [28] but narrower than those in VCSELs [35]. This is because
DM lasers have very narrow linewidths [40]. Comparing Figure 5 with Figure 4b, we can
see that the linewidth and phase noise of the generated microwaves reach their local min-
ima at the injection ratio where the maximum microwave power is achieved; these results
are identical compared to those reported in DFB lasers [28].
Figure 5. (a) Linewidth and (b) phase noise of the generated microwave versus ξinj.
In order to stabilize the fluctuation of the generated microwave and reduce its lin-
ewidth, the optical feedback technique used in DFB lasers and VCSELs [28,44] is adopted.
In this experiment, only a single feedback loop is introduced. Figure 6 presents the power
spectra of the DM laser (a) without optical feedback and (b) with optical feedback at the
injection parameters of (Δf, ξinj) = (15 GHz, 0.92). At these injection parameters, the funda-
mental frequency of the microwave is 17.2 GHz. As shown in Figure 6a, the linewidth of
the generated microwave photonic signal is 1.8 MHz without optical feedback. After in-
troducing the optical feedback, the linewidth decreases. Figure 6b shows that the lin-
ewidth narrows from 1.82 to 0.52 MHz when the feedback ratio is −27.8 dB and the feed-
back round trip time is 96.15 ns. Many side peaks equally separated by multiple of 10.4
MHz also appear in Figure 6b, which corresponds to the external cavity modes’ frequen-
cies. To quantify the side peaks in the power spectrum, a concept of side peak suppression
(SPS) is introduced and is defined as the ratio of the power at the fundamental frequency
to the maximum power of the side peaks [43]. The SPS is around 28 dB, as shown in Figure
6b.
Figure 6. Power spectra of the DM laser (a) without and (b) with optical feedback. The injection
parameters (Δf, ξinj) = (15 GHz, 0.92).
Figure 6. Power spectra of the DM laser (a) without and (b) with optical feedback. The injectionparameters (∆f, ξinj) = (15 GHz, 0.92).
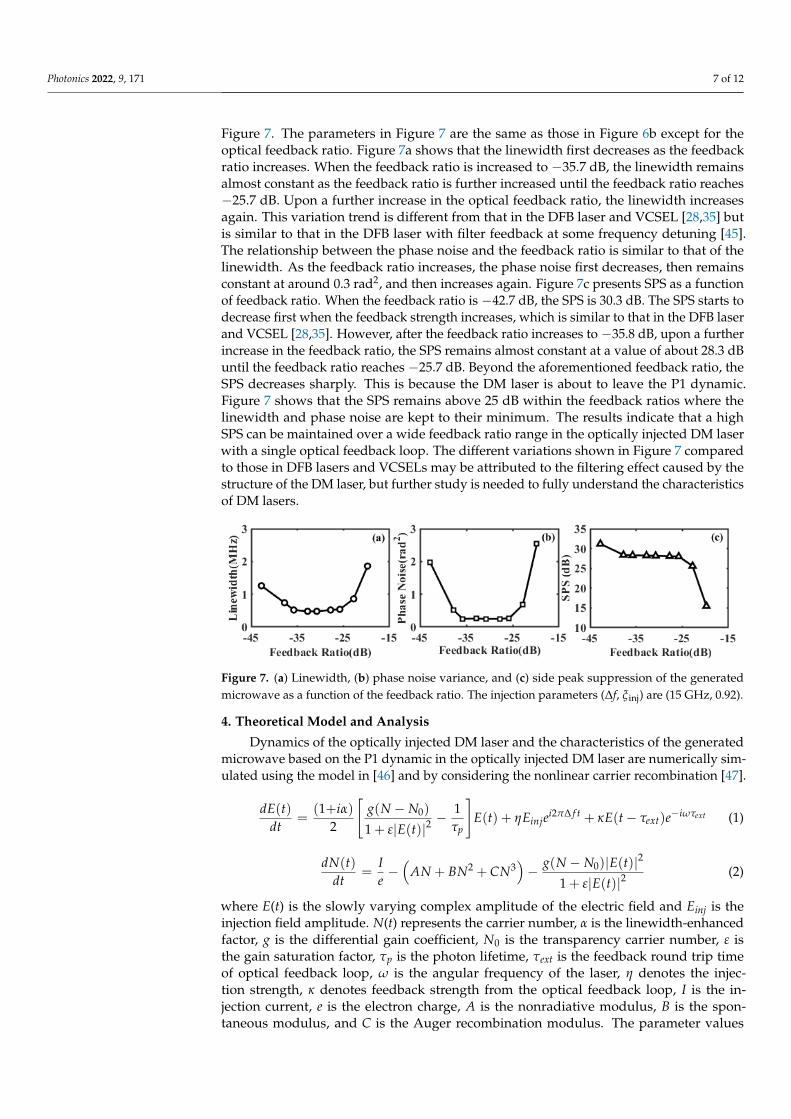
The effects of the optical feedback ratio on the linewidth, phase noise, and SPS ofthe generated microwave in the optically injected DM laser are studied and shown in
Photonics 2022, 9, 171 7 of 12
Figure 7. The parameters in Figure 7 are the same as those in Figure 6b except for theoptical feedback ratio. Figure 7a shows that the linewidth first decreases as the feedbackratio increases. When the feedback ratio is increased to −35.7 dB, the linewidth remainsalmost constant as the feedback ratio is further increased until the feedback ratio reaches−25.7 dB. Upon a further increase in the optical feedback ratio, the linewidth increasesagain. This variation trend is different from that in the DFB laser and VCSEL [28,35] butis similar to that in the DFB laser with filter feedback at some frequency detuning [45].The relationship between the phase noise and the feedback ratio is similar to that of thelinewidth. As the feedback ratio increases, the phase noise first decreases, then remainsconstant at around 0.3 rad2, and then increases again. Figure 7c presents SPS as a functionof feedback ratio. When the feedback ratio is −42.7 dB, the SPS is 30.3 dB. The SPS starts todecrease first when the feedback strength increases, which is similar to that in the DFB laserand VCSEL [28,35]. However, after the feedback ratio increases to −35.8 dB, upon a furtherincrease in the feedback ratio, the SPS remains almost constant at a value of about 28.3 dBuntil the feedback ratio reaches −25.7 dB. Beyond the aforementioned feedback ratio, theSPS decreases sharply. This is because the DM laser is about to leave the P1 dynamic.Figure 7 shows that the SPS remains above 25 dB within the feedback ratios where thelinewidth and phase noise are kept to their minimum. The results indicate that a highSPS can be maintained over a wide feedback ratio range in the optically injected DM laserwith a single optical feedback loop. The different variations shown in Figure 7 comparedto those in DFB lasers and VCSELs may be attributed to the filtering effect caused by thestructure of the DM laser, but further study is needed to fully understand the characteristicsof DM lasers.
Photonics 2022, 9, x FOR PEER REVIEW 7 of 12
The effects of the optical feedback ratio on the linewidth, phase noise, and SPS of the
generated microwave in the optically injected DM laser are studied and shown in Figure
7. The parameters in Figure 7 are the same as those in Figure 6b except for the optical
feedback ratio. Figure 7a shows that the linewidth first decreases as the feedback ratio
increases. When the feedback ratio is increased to −35.7 dB, the linewidth remains almost
constant as the feedback ratio is further increased until the feedback ratio reaches −25.7
dB. Upon a further increase in the optical feedback ratio, the linewidth increases again.
This variation trend is different from that in the DFB laser and VCSEL [28,35] but is similar
to that in the DFB laser with filter feedback at some frequency detuning [45]. The relation-
ship between the phase noise and the feedback ratio is similar to that of the linewidth. As
the feedback ratio increases, the phase noise first decreases, then remains constant at
around 0.3 rad2, and then increases again. Figure 7c presents SPS as a function of feedback
ratio. When the feedback ratio is −42.7 dB, the SPS is 30.3 dB. The SPS starts to decrease
first when the feedback strength increases, which is similar to that in the DFB laser and
VCSEL [28,35]. However, after the feedback ratio increases to −35.8 dB, upon a further
increase in the feedback ratio, the SPS remains almost constant at a value of about 28.3 dB
until the feedback ratio reaches −25.7 dB. Beyond the aforementioned feedback ratio, the
SPS decreases sharply. This is because the DM laser is about to leave the P1 dynamic.
Figure 7 shows that the SPS remains above 25 dB within the feedback ratios where the
linewidth and phase noise are kept to their minimum. The results indicate that a high SPS
can be maintained over a wide feedback ratio range in the optically injected DM laser with
a single optical feedback loop. The different variations shown in Figure 7 compared to
those in DFB lasers and VCSELs may be attributed to the filtering effect caused by the
structure of the DM laser, but further study is needed to fully understand the characteris-
tics of DM lasers.
Figure 7. (a) Linewidth, (b) phase noise variance, and (c) side peak suppression of the generated
microwave as a function of the feedback ratio. The injection parameters (Δf, ξinj) are (15 GHz, 0.92).
4. Theoretical Model and Analysis
Dynamics of the optically injected DM laser and the characteristics of the generated
microwave based on the P1 dynamic in the optically injected DM laser are numerically
simulated using the model in [46] and by considering the nonlinear carrier recombination
[47].
( ) ( ) ( )
( )( ) ( )0 2
2
1+ 1+
2 1
extii ft
inj ext
p
dE t i g N NE t E e E t e
dt E t
− − = − + − +
(1)
( )( )
( ) ( )
( )
2
02 3
2
1
g N N E tdN t IAN BN CN
dt e E t
−= − + + −
+ (2)
where E(t) is the slowly varying complex amplitude of the electric field and Einj is the in-
jection field amplitude. N(t) represents the carrier number, α is the linewidth-enhanced
Figure 7. (a) Linewidth, (b) phase noise variance, and (c) side peak suppression of the generatedmicrowave as a function of the feedback ratio. The injection parameters (∆f, ξinj) are (15 GHz, 0.92).
4. Theoretical Model and Analysis
Dynamics of the optically injected DM laser and the characteristics of the generatedmicrowave based on the P1 dynamic in the optically injected DM laser are numerically sim-ulated using the model in [46] and by considering the nonlinear carrier recombination [47].
dE(t)dt
=(1+iα)
2
[g(N − N0)
1 + ε|E(t)|2− 1
τp
]E(t) + ηEinjei2π∆ f t + κE(t− τext)e−iωτext (1)
dN(t)dt
=Ie−(
AN + BN2 + CN3)− g(N − N0)|E(t)|2
1 + ε|E(t)|2(2)
where E(t) is the slowly varying complex amplitude of the electric field and Einj is theinjection field amplitude. N(t) represents the carrier number, α is the linewidth-enhancedfactor, g is the differential gain coefficient, N0 is the transparency carrier number, ε isthe gain saturation factor, τp is the photon lifetime, τext is the feedback round trip timeof optical feedback loop, ω is the angular frequency of the laser, η denotes the injec-tion strength, κ denotes feedback strength from the optical feedback loop, I is the in-jection current, e is the electron charge, A is the nonradiative modulus, B is the spon-taneous modulus, and C is the Auger recombination modulus. The parameter values

Photonics 2022, 9, 171 8 of 12
used in [47] are adopted, where α = 3, g = 1.48 × 10⁴ s−1, I = 30 mA, N0 = 1.93 × 10⁷,ε = 7.73 × 10⁻⁸, τp = 2.17 ps, A = 2.8 × 10⁸ s−1, B = 9.8 s−1, and C = 3.84 × 10⁻⁷ s−1.The relaxation oscillation frequency of the free-running laser is approximatelyfr = (gE2/τp)1/2/2π = 6.2 GHz. Equations (1) and (2) are solved using the second-orderRunge–Kutta algorithm.
The dynamical map of the DM laser in the parameter space of frequency detuning ∆fand injection strength η is presented in Figure 8a. The result is qualitatively consistent withthe experimental measurements in Figure 3. To validate the model used in the simulation,we also simulated the dynamical map of the DFB laser using the model and parametersof [48], and the results are shown in Figure 8b. Figure 8b shows only one small non-P1 island within the P1 region above the Hopf bifurcation line, which is different fromthe experimental observation. Therefore, it is necessary to include the nonlinear carrierrecombination for the investigation of the nonlinear dynamics of the optically injectedDM laser.
Photonics 2022, 9, x FOR PEER REVIEW 8 of 12
factor, g is the differential gain coefficient, N0 is the transparency carrier number, ε is the
gain saturation factor, τp is the photon lifetime, τext is the feedback round trip time of op-
tical feedback loop, ω is the angular frequency of the laser, η denotes the injection strength,
κ denotes feedback strength from the optical feedback loop, I is the injection current, e is
the electron charge, A is the nonradiative modulus, B is the spontaneous modulus, and C
is the Auger recombination modulus. The parameter values used in [47] are adopted,
where α = 3, g = 1.48 × 10⁴ s−1, I = 30 mA, N0 = 1.93 × 10⁷, ε = 7.73 × 10⁻⁸, τp = 2.17 ps, A = 2.8
× 108 s−1, B = 9.8 s−1, and C = 3.84 × 10⁻⁷ s−1. The relaxation oscillation frequency of the free-
running laser is approximately fr = (gE2/τp)1/2/2π = 6.2 GHz. Equations (1) and (2) are solved
using the second-order Runge–Kutta algorithm.
The dynamical map of the DM laser in the parameter space of frequency detuning Δf
and injection strength η is presented in Figure 8a. The result is qualitatively consistent with
the experimental measurements in Figure 3. To validate the model used in the simulation,
we also simulated the dynamical map of the DFB laser using the model and parameters of
[48], and the results are shown in Figure 8b. Figure 8b shows only one small non-P1 island
within the P1 region above the Hopf bifurcation line, which is different from the experi-
mental observation. Therefore, it is necessary to include the nonlinear carrier recombination
for the investigation of the nonlinear dynamics of the optically injected DM laser.
Figure 8. Numerical simulation of the dynamical maps of (a) the optically injected DM laser with
the consideration of the nonlinear carrier recombination and (b) the optically injected DFB laser.
The SPS as a function of feedback strength for the generated MWP signal in the opti-
cally injected DM laser and DFB laser with single optical feedback is calculated and dis-
played in Figure 9. The injection parameters (Δf, η) are set at (15 GHz, 8 ns−1), and the
feedback round trip time is 10 ns. Figure 9 shows that for the DM laser, the SPS is ~17.1
dB at the feedback strength of 0.32 ns−1. When the feedback strength is increased, the SPS
starts to drop, and when the feedback strength reaches 0.4 ns−1, the SPS decreases to ~14.1
dB. However, when further increasing the feedback strength, the SPS remains almost un-
changed until the feedback strength reaches 0.5 ns−1. When the feedback strength is in-
creased further, the SPS starts to deteriorate again. However, for the DFB laser, the SPS
decreases monotonically with the increase in the feedback strength. These results are qual-
itatively consistent with our experimental results in the DM laser and the reported results
in the DFB laser, which indicates that single optical feedback is sufficient to achieve a nar-
row microwave linewidth in the optically injected DM laser.
Figure 8. Numerical simulation of the dynamical maps of (a) the optically injected DM laser with theconsideration of the nonlinear carrier recombination and (b) the optically injected DFB laser.
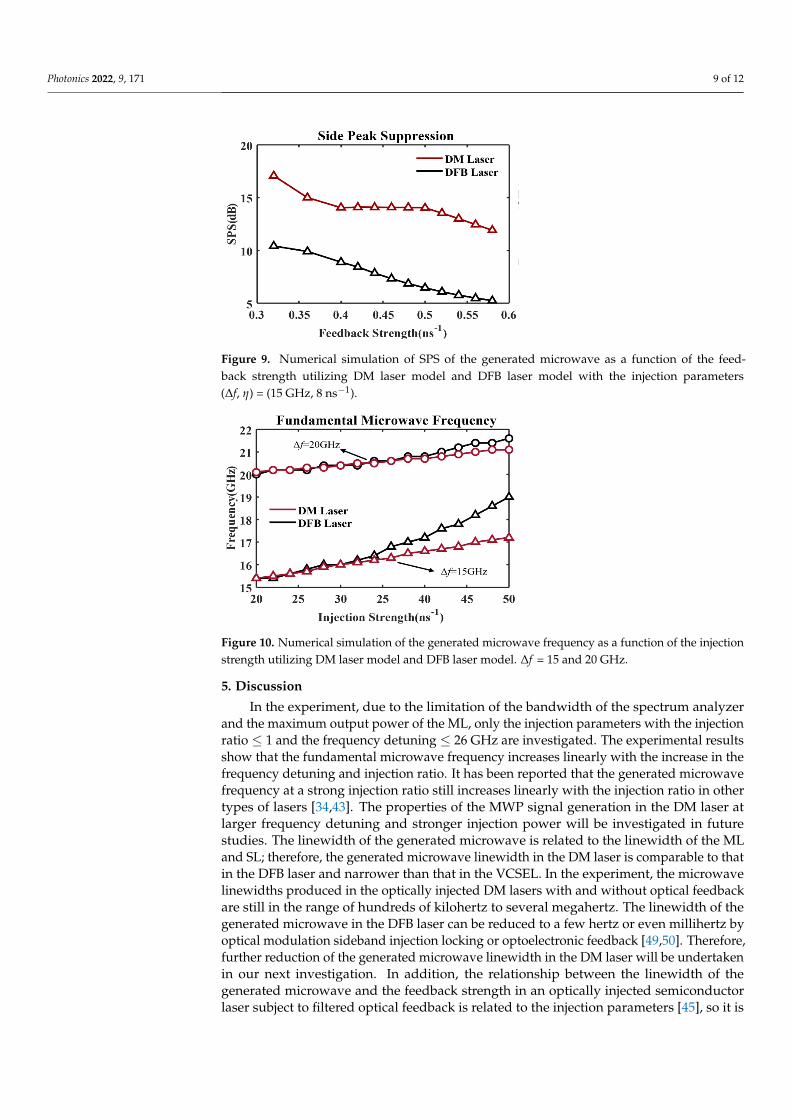
The SPS as a function of feedback strength for the generated MWP signal in theoptically injected DM laser and DFB laser with single optical feedback is calculated anddisplayed in Figure 9. The injection parameters (∆f, η) are set at (15 GHz, 8 ns−1), andthe feedback round trip time is 10 ns. Figure 9 shows that for the DM laser, the SPS is~17.1 dB at the feedback strength of 0.32 ns−1. When the feedback strength is increased,the SPS starts to drop, and when the feedback strength reaches 0.4 ns−1, the SPS decreasesto ~14.1 dB. However, when further increasing the feedback strength, the SPS remainsalmost unchanged until the feedback strength reaches 0.5 ns−1. When the feedback strengthis increased further, the SPS starts to deteriorate again. However, for the DFB laser, theSPS decreases monotonically with the increase in the feedback strength. These results arequalitatively consistent with our experimental results in the DM laser and the reportedresults in the DFB laser, which indicates that single optical feedback is sufficient to achievea narrow microwave linewidth in the optically injected DM laser.
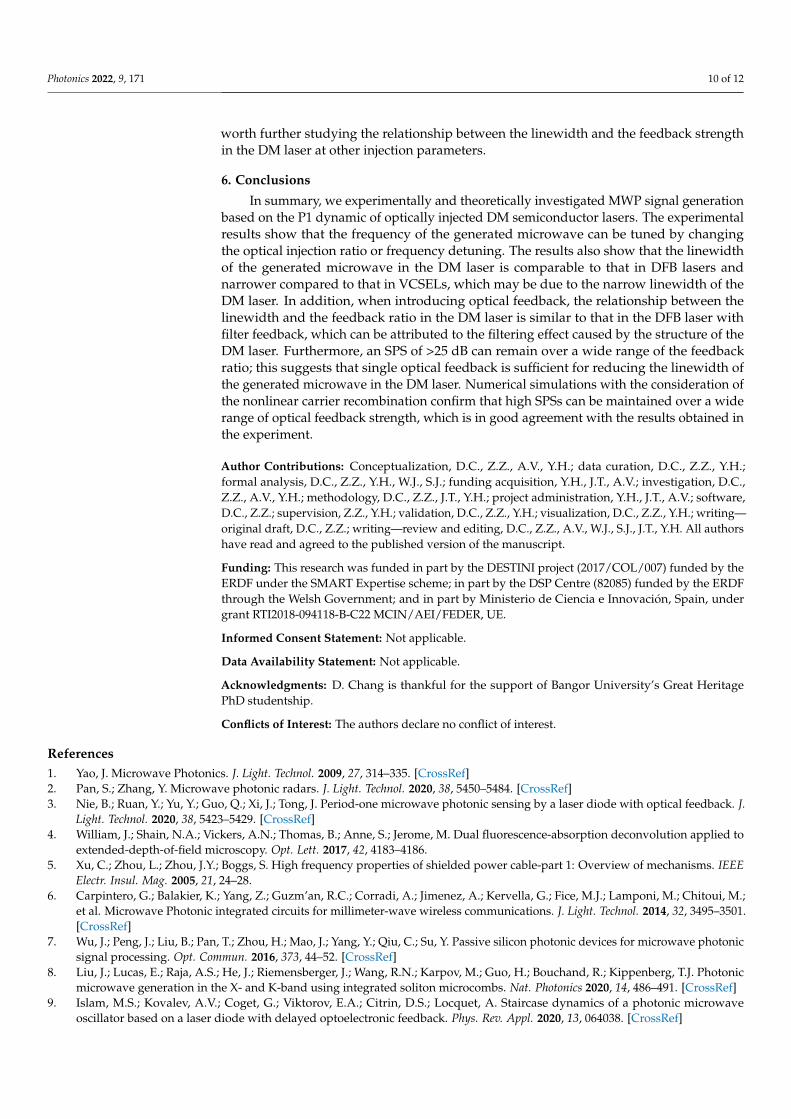
The variations of the fundamental frequency as a function of injection strength undertwo frequency detunings of 15 and 20 GHz are calculated for the optically injected DMlaser and optically injected DFB laser. The different variation of the fundamental frequencybetween the DM laser and DFB laser is illustrated in Figure 10. We can see that for theDFB laser, the fundamental frequency variation with the injection strength is similar tothe report [43], where the frequency change rate for the lower injection strength is smallercompared to that for a higher injection strength. However, for the optically injected DMlaser, the fundamental frequency increases linearly with the injection strength. This linearrelationship implies that DM lasers may be a better candidate for frequency-modulationcontinuous-wave microwave generation based on the P1 dynamic.
Photonics 2022, 9, 171 9 of 12Photonics 2022, 9, x FOR PEER REVIEW 9 of 12
Figure 9. Numerical simulation of SPS of the generated microwave as a function of the feedback
strength utilizing DM laser model and DFB laser model with the injection parameters (Δf, η) = (15
GHz, 8 ns−1).
The variations of the fundamental frequency as a function of injection strength under
two frequency detunings of 15 and 20 GHz are calculated for the optically injected DM
laser and optically injected DFB laser. The different variation of the fundamental fre-
quency between the DM laser and DFB laser is illustrated in Figure 10. We can see that for
the DFB laser, the fundamental frequency variation with the injection strength is similar
to the report [43], where the frequency change rate for the lower injection strength is
smaller compared to that for a higher injection strength. However, for the optically in-
jected DM laser, the fundamental frequency increases linearly with the injection strength.
This linear relationship implies that DM lasers may be a better candidate for frequency-
modulation continuous-wave microwave generation based on the P1 dynamic.
Figure 10. Numerical simulation of the generated microwave frequency as a function of the injection
strength utilizing DM laser model and DFB laser model. Δf = 15 and 20 GHz.
5. Discussion
In the experiment, due to the limitation of the bandwidth of the spectrum analyzer
and the maximum output power of the ML, only the injection parameters with the injec-
tion ratio ≤ 1 and the frequency detuning ≤ 26 GHz are investigated. The experimental
results show that the fundamental microwave frequency increases linearly with the in-
crease in the frequency detuning and injection ratio. It has been reported that the gener-
ated microwave frequency at a strong injection ratio still increases linearly with the injec-
tion ratio in other types of lasers [34,43]. The properties of the MWP signal generation in
the DM laser at larger frequency detuning and stronger injection power will be
Figure 9. Numerical simulation of SPS of the generated microwave as a function of the feed-back strength utilizing DM laser model and DFB laser model with the injection parameters(∆f, η) = (15 GHz, 8 ns−1).
Photonics 2022, 9, x FOR PEER REVIEW 9 of 12
Figure 9. Numerical simulation of SPS of the generated microwave as a function of the feedback
strength utilizing DM laser model and DFB laser model with the injection parameters (Δf, η) = (15
GHz, 8 ns−1).
The variations of the fundamental frequency as a function of injection strength under
two frequency detunings of 15 and 20 GHz are calculated for the optically injected DM
laser and optically injected DFB laser. The different variation of the fundamental fre-
quency between the DM laser and DFB laser is illustrated in Figure 10. We can see that for
the DFB laser, the fundamental frequency variation with the injection strength is similar
to the report [43], where the frequency change rate for the lower injection strength is
smaller compared to that for a higher injection strength. However, for the optically in-
jected DM laser, the fundamental frequency increases linearly with the injection strength.
This linear relationship implies that DM lasers may be a better candidate for frequency-
modulation continuous-wave microwave generation based on the P1 dynamic.
Figure 10. Numerical simulation of the generated microwave frequency as a function of the injection
strength utilizing DM laser model and DFB laser model. Δf = 15 and 20 GHz.
5. Discussion
In the experiment, due to the limitation of the bandwidth of the spectrum analyzer
and the maximum output power of the ML, only the injection parameters with the injec-
tion ratio ≤ 1 and the frequency detuning ≤ 26 GHz are investigated. The experimental
results show that the fundamental microwave frequency increases linearly with the in-
crease in the frequency detuning and injection ratio. It has been reported that the gener-
ated microwave frequency at a strong injection ratio still increases linearly with the injec-
tion ratio in other types of lasers [34,43]. The properties of the MWP signal generation in
the DM laser at larger frequency detuning and stronger injection power will be
Figure 10. Numerical simulation of the generated microwave frequency as a function of the injectionstrength utilizing DM laser model and DFB laser model. ∆f = 15 and 20 GHz.
5. Discussion
In the experiment, due to the limitation of the bandwidth of the spectrum analyzerand the maximum output power of the ML, only the injection parameters with the injectionratio ≤ 1 and the frequency detuning ≤ 26 GHz are investigated. The experimental resultsshow that the fundamental microwave frequency increases linearly with the increase in thefrequency detuning and injection ratio. It has been reported that the generated microwavefrequency at a strong injection ratio still increases linearly with the injection ratio in othertypes of lasers [34,43]. The properties of the MWP signal generation in the DM laser atlarger frequency detuning and stronger injection power will be investigated in futurestudies. The linewidth of the generated microwave is related to the linewidth of the MLand SL; therefore, the generated microwave linewidth in the DM laser is comparable to thatin the DFB laser and narrower than that in the VCSEL. In the experiment, the microwavelinewidths produced in the optically injected DM lasers with and without optical feedbackare still in the range of hundreds of kilohertz to several megahertz. The linewidth of thegenerated microwave in the DFB laser can be reduced to a few hertz or even millihertz byoptical modulation sideband injection locking or optoelectronic feedback [49,50]. Therefore,further reduction of the generated microwave linewidth in the DM laser will be undertakenin our next investigation. In addition, the relationship between the linewidth of thegenerated microwave and the feedback strength in an optically injected semiconductorlaser subject to filtered optical feedback is related to the injection parameters [45], so it is
Photonics 2022, 9, 171 10 of 12
worth further studying the relationship between the linewidth and the feedback strengthin the DM laser at other injection parameters.
6. Conclusions
In summary, we experimentally and theoretically investigated MWP signal generationbased on the P1 dynamic of optically injected DM semiconductor lasers. The experimentalresults show that the frequency of the generated microwave can be tuned by changingthe optical injection ratio or frequency detuning. The results also show that the linewidthof the generated microwave in the DM laser is comparable to that in DFB lasers andnarrower compared to that in VCSELs, which may be due to the narrow linewidth of theDM laser. In addition, when introducing optical feedback, the relationship between thelinewidth and the feedback ratio in the DM laser is similar to that in the DFB laser withfilter feedback, which can be attributed to the filtering effect caused by the structure of theDM laser. Furthermore, an SPS of >25 dB can remain over a wide range of the feedbackratio; this suggests that single optical feedback is sufficient for reducing the linewidth ofthe generated microwave in the DM laser. Numerical simulations with the consideration ofthe nonlinear carrier recombination confirm that high SPSs can be maintained over a widerange of optical feedback strength, which is in good agreement with the results obtained inthe experiment.
Author Contributions: Conceptualization, D.C., Z.Z., A.V., Y.H.; data curation, D.C., Z.Z., Y.H.;formal analysis, D.C., Z.Z., Y.H., W.J., S.J.; funding acquisition, Y.H., J.T., A.V.; investigation, D.C.,Z.Z., A.V., Y.H.; methodology, D.C., Z.Z., J.T., Y.H.; project administration, Y.H., J.T., A.V.; software,D.C., Z.Z.; supervision, Z.Z., Y.H.; validation, D.C., Z.Z., Y.H.; visualization, D.C., Z.Z., Y.H.; writing—original draft, D.C., Z.Z.; writing—review and editing, D.C., Z.Z., A.V., W.J., S.J., J.T., Y.H. All authorshave read and agreed to the published version of the manuscript.
Funding: This research was funded in part by the DESTINI project (2017/COL/007) funded by theERDF under the SMART Expertise scheme; in part by the DSP Centre (82085) funded by the ERDFthrough the Welsh Government; and in part by Ministerio de Ciencia e Innovación, Spain, undergrant RTI2018-094118-B-C22 MCIN/AEI/FEDER, UE.
Informed Consent Statement: Not applicable.
Data Availability Statement: Not applicable.
Acknowledgments: D. Chang is thankful for the support of Bangor University’s Great HeritagePhD studentship.
Conflicts of Interest: The authors declare no conflict of interest.
References1. Yao, J. Microwave Photonics. J. Light. Technol. 2009, 27, 314–335. [CrossRef]2. Pan, S.; Zhang, Y. Microwave photonic radars. J. Light. Technol. 2020, 38, 5450–5484. [CrossRef]3. Nie, B.; Ruan, Y.; Yu, Y.; Guo, Q.; Xi, J.; Tong, J. Period-one microwave photonic sensing by a laser diode with optical feedback. J.
Light. Technol. 2020, 38, 5423–5429. [CrossRef]4. William, J.; Shain, N.A.; Vickers, A.N.; Thomas, B.; Anne, S.; Jerome, M. Dual fluorescence-absorption deconvolution applied to
extended-depth-of-field microscopy. Opt. Lett. 2017, 42, 4183–4186.5. Xu, C.; Zhou, L.; Zhou, J.Y.; Boggs, S. High frequency properties of shielded power cable-part 1: Overview of mechanisms. IEEE
Electr. Insul. Mag. 2005, 21, 24–28.6. Carpintero, G.; Balakier, K.; Yang, Z.; Guzm’an, R.C.; Corradi, A.; Jimenez, A.; Kervella, G.; Fice, M.J.; Lamponi, M.; Chitoui, M.;
et al. Microwave Photonic integrated circuits for millimeter-wave wireless communications. J. Light. Technol. 2014, 32, 3495–3501.[CrossRef]
7. Wu, J.; Peng, J.; Liu, B.; Pan, T.; Zhou, H.; Mao, J.; Yang, Y.; Qiu, C.; Su, Y. Passive silicon photonic devices for microwave photonicsignal processing. Opt. Commun. 2016, 373, 44–52. [CrossRef]
8. Liu, J.; Lucas, E.; Raja, A.S.; He, J.; Riemensberger, J.; Wang, R.N.; Karpov, M.; Guo, H.; Bouchand, R.; Kippenberg, T.J. Photonicmicrowave generation in the X- and K-band using integrated soliton microcombs. Nat. Photonics 2020, 14, 486–491. [CrossRef]
9. Islam, M.S.; Kovalev, A.V.; Coget, G.; Viktorov, E.A.; Citrin, D.S.; Locquet, A. Staircase dynamics of a photonic microwaveoscillator based on a laser diode with delayed optoelectronic feedback. Phys. Rev. Appl. 2020, 13, 064038. [CrossRef]

Photonics 2022, 9, 171 11 of 12
10. Xie, X.; Bouchand, R.; Nicolodi, D.; Giunta, M.; Hänsel, W.; Lezius, M.; Joshi, A.; Datta, S.; Alexandre, C.; Lours, M.; et al. Photonicmicrowave signals with zeptosecond-level absolute timing noise. Nat. Photonics 2017, 11, 44–47. [CrossRef]
11. Xue, X.; Xuan, Y.; Bao, C.; Li, S.; Zheng, X.; Zhou, B.; Qi, M.; Weiner, A.M. Microcomb-based true-time-delay network formicrowave beamforming with arbitrary beam pattern control. J. Light. Technol. 2018, 36, 2312–2321. [CrossRef]
12. Bünermann, O.; Jiang, H.; Dorenkamp, Y.; Kandratsenka, A.; Janke, S.M.; Auerbach, D.J.; Wodtke, A.M. Electron-hole pairexcitation determines the mechanism of hydrogen atom adsorption. Science 2015, 350, 1346–1349. [CrossRef] [PubMed]
13. Gliese, U.; Nielsen, T.N.; Bruun, M.; Christensen, E.L.; Stubkjaer, K.E.; Lindgren, S.; Broberg, B. A wideband heterodyne opticalphase-locked loop for generation of 3-18 GHz microwave carriers. IEEE Photonics Technol. Lett. 1992, 4, 936–938. [CrossRef]
14. Kittlaus, E.A.; Eliyahu, D.; Ganji, S.; Williams, S.; Matsko, A.B.; Cooper, K.B.; Forouhar, S. A low-noise photonic heterodynesynthesizer and its application to millimeter-wave radar. Nat. Commun. 2021, 12, 4397. [CrossRef]
15. Hwang, S.K.; Chan, S.C.; Hsieh, S.C.; Li, C.Y. Photonic microwave generation and transmission using direct modulation of stablyinjection-locked semiconductor lasers. Opt. Commun. 2011, 284, 3581–3589. [CrossRef]
16. Gao, Y.; Wen, A.; Zheng, H.; Liang, D.; Lin, L. Photonic microwave waveform generation based on phase modulation and tunabledispersion. Opt. Express 2016, 24, 12524–12533. [CrossRef]
17. He, Y.; Jiang, Y.; Zi, Y.; Bai, G.; Tian, J.; Xia, Y.; Zhang, X.; Dong, R.; Luo, H. Photonic microwave waveforms generation based ontwo cascaded single-drive Mach-Zehnder modulators. Opt. Express 2018, 26, 7829–7841. [CrossRef]
18. Dal Bosco, A.K.; Kanno, K.; Uchida, A.; Sciamanna, M.; Harayama, T.; Yoshimura, K. Cycles of self-pulsations in a photonicintegrated circuit. Phys. Rev. E 2015, 92, 062905. [CrossRef]
19. Sooudi, E.; Huyet, G.; McInerney, J.G.; Lelarge, F.; Merghem, K.; Martinez, A.; Ramdane, A.; Hegarty, S.P. Observation ofharmonic-mode-locking in a mode-locked InAs/InP-based quantum-dash laser with cw optical injection. IEEE Photonics Technol.Lett. 2011, 23, 549–551. [CrossRef]
20. Zou, X.; Liu, X.; Li, W.; Li, P.; Pan, W.; Yan, L.; Shao, L. Optoelectronic oscillators (OEOs) to sensing, measurement, and detection.IEEE J. Quantum Electron. 2015, 52, 1–16. [CrossRef]
21. Liao, M.L.; Huang, Y.Z.; Weng, H.Z.; Han, J.Y.; Xiao, Z.X.; Xiao, J.L.; Yang, Y.D. Narrow-linewidth microwave generation by anoptoelectronic oscillator with a directly modulated microsquare laser. Opt. Lett. 2017, 42, 4251–4254. [CrossRef] [PubMed]
22. Lin, X.D.; Wu, Z.M.; Deng, T.; Tang, X.; Fan, L.; Gao, Z.Y.; Xia, G.Q. Generation of widely tunable narrow-linewidth photonicmicrowave signals based on an optoelectronic oscillator using an optically injected semiconductor laser as the active tunablemicrowave photonic filter. IEEE Photonics J. 2018, 10, 1–9. [CrossRef]
23. Zhang, W.; Yao, J. Silicon photonic integrated optoelectronic oscillator for frequency-tunable microwave generation. J. Light.Technol. 2018, 36, 4655–4663. [CrossRef]
24. Li, M.; Hao, T.; Li, W.; Dai, Y. Tutorial on optoelectronic oscillators. APL Photonics 2021, 6, 061101. [CrossRef]25. AlMulla, M.; Liu, J.M. Linewidth characteristics of period-one dynamics induced by optically injected semiconductor lasers. Opt.
Express 2020, 28, 14677–14693. [CrossRef] [PubMed]26. Qi, X.; Liu, J.M. Photonic microwave applications of the dynamics of semiconductor lasers. IEEE J. Sel. Top. Quantum Electron.
2011, 17, 1198–1211. [CrossRef]27. Zhuang, J.P.; Chan, S.C. Tunable photonic microwave generation using optically injected semiconductor laser dynamics with
optical feedback stabilization. Opt. Lett. 2013, 38, 344–346. [CrossRef]28. Zhuang, J.P.; Chan, S.C. Phase noise characteristics of microwave signals generated by semiconductor laser dynamics. Opt.
Express 2015, 33, 2777–2797. [CrossRef]29. Zhang, L.; Chan, S.C. Cascaded injection of semiconductor lasers in period-one oscillations for millimeter-wave generation. Opt.
Lett. 2019, 44, 4905–4908. [CrossRef]30. Wang, C.; Raghunathan, R.; Schires, K.; Chan, S.C.; Lester, L.F.; Grillot, F. Optically injected InAs/GaAs quantum dot laser for
tunable photonic microwave generation. Opt. Lett. 2016, 41, 1153–1156. [CrossRef]31. Perez, P.; Quirce, A.; Valle, A.; Consoli, A.; Noriega, I.; Pesquera, L.; Esquivias, I. Photonic generation of microwave signals using
a single-mode VCSEL subject to dual-beam orthogonal optical injection. IEEE Photonics J. 2015, 7, 1–14. [CrossRef]32. Lin, H.; Ourari, S.; Huang, T.; Jha, A.; Briggs, A.; Bigagli, N. Photonic microwave generation in multimode VCSELs subject to
orthogonal optical injection. J. Opt. Soc. Am. B 2017, 34, 2381–2389. [CrossRef]33. Huang, Y.; Zhou, P.; Li, N. Broad tunable photonic microwave generation in an optically pumped spin-VCSEL with optical
feedback stabilization. Opt. Lett. 2021, 46, 3147–3150. [CrossRef] [PubMed]34. Ji, S.; Hong, Y.; Spencer, P.S.; Benedikt, J.; Davies, I. Broad tunable photonic microwave generation based on period-one dy-namics
of optical injection vertical-cavity surface-emitting lasers. Opt. Express 2017, 25, 19863–19871. [CrossRef]35. Ji, S.; Xue, C.P.; Valle, A.; Spencer, P.S.; Li, H.Q.; Hong, Y. Stabilization of photonic microwave generation in vertical-cavity
surface-emitting lasers with optical injection and feedback. J. Light. Technol. 2018, 32, 4660–4666. [CrossRef]36. Valle, A.; Quirce, A.; Ji, S.; Hong, Y. Polarization effects on photonic microwave generation in VCSELs under optical injection.
Photonics Technol. Lett. 2018, 30, 1266–1269. [CrossRef]37. Fan, L.; Wu, Z.M.; Deng, T.; Wu, J.G.; Tang, X.; Chen, J.J.; Mao, S.; Xia, G.Q. Subharmonic microwave modulation stabilization of
tunable photonic microwave generated by period-one nonlinear dynamics of an optically injected semiconductor laser. J. Light.Technol. 2014, 32, 4660–4666. [CrossRef]

Photonics 2022, 9, 171 12 of 12
38. Ma, X.W.; Huang, Y.Z.; Zou, L.X.; Liu, B.W.; Long, H.; Weng, H.Z.; Yang, Y.D.; Xiao, J.L. Narrow-linewidth microwave generationusing AlGaInAs/InP microdisk lasers subject to optical injection and optoelectronic feedback. Opt. Express 2015, 23, 20321–20331.[CrossRef]
39. Osborne, S.; O’Brien, S.; Buckley, K.; Fehse, R.; Amann, A.; Patchell, J.; Kelly, B.; Jones, D.R.; O’Gorman, J.; O’Reilly, E.P. Designof single-mode and two-color Fabry–PÉrot lasers with patterned refractive index. IEEE J. Sel. Top. Quantum Electron. 2007, 13,1157–1163. [CrossRef]
40. Herbert, C.; Jones, D.; Kaszubowska-Anandarajah, A.; Kelly, B.; Rensing, M.; O’Carroll, J.; Phelan, R.; Anandarajah, P.; Perry, P.;Barry, L.P.; et al. Discrete mode lasers for communication applications. IET Optoelectron. 2009, 3, 1–17. [CrossRef]
41. Rosado, A.; Pérez-Serrano, A.; Tijero, J.M.G.; Gutierrez, A.V.; Pesquera, L.; Esquivias, I. Numerical and experimental analysis ofoptical frequency comb generation in gain-switched semiconductor lasers. IEEE J. Quantum Electron. 2019, 55, 1–12. [CrossRef]
42. Zhong, Z.; Chang, D.; Jin, W.; Lee, M.W.; Wang, A.; Jiang, S.; He, J.; Tang, J.; Hong, Y. Intermittent dynamical state switching indiscrete-mode semiconductor lasers subject to optical feedback. Photonics Res. 2021, 9, 1336–1342. [CrossRef]
43. Chan, S.C.; Hwang, S.K.; Liu, J.M. Period-one oscillation for photonic microwave transmission using an optically injectedsemiconductor laser. Opt. Express 2007, 15, 14921–14935. [CrossRef] [PubMed]
44. Xue, C.; Chang, D.; Fan, Y.; Ji, S.; Zhang, Z.; Lin, H.; Spencer, P.S.; Hong, Y. Characteristics of microwave photonic signalgeneration using vertical-cavity surface-emitting lasers with optical injection and feedback. J. Opt. Soc. Am. B 2020, 37, 1394–1400.[CrossRef]
45. Xue, C.; Ji, S.; Hong, Y.; Jiang, N.; Li, H.; Qiu, K. Numerical investigation of photonic microwave generation in an opticallyinjected semiconductor laser subject to filtered optical feedback. Opt. Express 2018, 27, 5065–5082. [CrossRef]
46. Dellunde, J.; Torrent, M.C.; Sancho, J.M.; San, M.M. Frequency dynamics of gain-switched injection-locked semiconductor lasers.IEEE J. Quantum Electron. 1997, 33, 1537–1542. [CrossRef]
47. Valle, A. Statistics of the optical phase of a gain-switched semiconductor laser for fast quantum randomness generation. Photonics2021, 8, 388. [CrossRef]
48. Li, N.; Pan, W.; Locquet, A.; Chizhevsky, V.N.; Citrin, D.S. Statistical properties of an external-cavity semiconductor laser:Experiment and theory. IEEE J. Sel. Top. Quantum Electron. 2015, 21, 553–560.
49. Hung, Y.H.; Hwang, S.K. Photonic microwave stabilization for period-one nonlinear dynamics of semiconductor lasers usingoptical modulation sideband injection locking. Opt. Express 2015, 23, 6520–6532. [CrossRef]
50. Suelzer, J.S.; Simpson, T.B.; Devgan, P.; Usechak, N.G. Tunable, low-phase-noise microwave signals from an optically injectedsemiconductor laser with opto-electronic feedback. Opt. Lett. 2017, 42, 3181–3184. [CrossRef]
Related Documents