MICROWAVE ENABLED SYNTHESIS OF CARBON BASED MATERIALS WITH CONTROLLED STRUCTURES: APPLICATIONS FROM MULTIFUNCTIONAL DRUG DELIVERY TO METAL FREE CATALYSTS by Mehulkumar Patel A Dissertation submitted to the Graduate School-Newark Rutgers, The State University of New Jersey in partial fulfillment of the requirements for the degree of Doctor of Philosophy Graduate Program in Chemistry written under the direction of Professor Huixin He and approved by ________________________ ________________________ ________________________ ________________________ Newark, New Jersey October, 2016

Welcome message from author
This document is posted to help you gain knowledge. Please leave a comment to let me know what you think about it! Share it to your friends and learn new things together.
Transcript
MICROWAVE ENABLED SYNTHESIS OF CARBON BASED MATERIALS
WITH CONTROLLED STRUCTURES: APPLICATIONS FROM
MULTIFUNCTIONAL DRUG DELIVERY TO METAL FREE CATALYSTS
by
Mehulkumar Patel
A Dissertation submitted to the
Graduate School-Newark
Rutgers, The State University of New Jersey
in partial fulfillment of the requirements
for the degree of
Doctor of Philosophy
Graduate Program in Chemistry
written under the direction of
Professor Huixin He
and approved by
________________________
________________________
________________________
________________________
Newark, New Jersey
October, 2016
Copyright Page
Copyright
© 2016
Mehulkumar Patel
ALL RIGHTS RESERVED
ii
ABSTRACT OF THE DISSERTATION
MICROWAVE ENABLED SYNTHESIS OF CARBON BASED MATERIALS WITH CONTROLLED STRUCTURES: APPLICATIONS FROM MULTIFUNCTIONAL
DRUG DELIVERY TO METAL FREE CATALYSIS
By Mehulkumar Patel
Dissertation Director:
Prof. Huixin He
Graphene is a single-layered sheet of sp2- bonded carbon atoms arranged in a honeycomb
structure, whose discovery won the 2010 Nobel Prize in physics. Due to its excellent
electronic, optical, thermal and mechanical properties, and its large surface area and low
mass, graphene holds great potential for a broad range of applications. It seems that the
research in graphene has now proceeded from the initial phase of developing myriad
strategies for the synthesis of graphene sheets to the use of graphene in various research
fields. However, it is still challenging to controllably produce solution processable highly
conductive graphene sheets in large quantity, at low cost, and energy saving process, with
optimal sheet size, layer thickness, defects (vacancies and holes) and molecular structures
(oxygen-containing groups and non-defective graphene domains). All these structural
parameters determine their electronic, thermal and mechanical properties of graphene,
which are key warrants for their practical application in various devices. As examples,
fundamental studies and high-frequency electronics require pristine graphene. However,
“bulk” applications such as flexible macro-electronics, and mechanically and
electronically reinforced composites, require large quantities of solution-processable
highly conductive large graphene sheets manufactured at low cost. On the other hand,
holey graphene, referring to graphene with nanoholes in their basal plane, demonstrates
iii
much better performance in their application as metal-free catalysts and in energy
storage. Finally, there is a surge of interests in nanosized graphene sheets for various
biological applications due to their unique size effects, edge effects, and even quantum
confinement effects.
As one part of this thesis, we have demonstrated that by understanding the
oxidation mechanism of nitronium ions and KMnO4, which were both used in the widely
used Hummers method for fabrication of graphene oxides, we developed various
microwave chemistries for rapid (30-40 seconds) and controllable fabrication of graphene
with controlled lateral sizes, holey structures, and oxidation levels. As examples, by
intentionally excluding KMnO4in the reaction system while controlling the concentration
of nitronium ions and microwave irradiation power and time, we can rapidly and directly
fabricate graphene nanosheets with uniform lateral sizes. The as-fabricated graphene
nanosheets largely retain the intrinsic properties of graphene. These nanosheets exhibit
strong and wavelength-independent absorption in NIR regions, which ensures their
applications in Near-Infrared (NIR) photoacoustic imaging, photothermal treatment, and
multifunctional drug delivery. On the other hand, by including KMnO4in the recipe and
still taking advantage of the unique thermal and kinetic effects of microwave heating, we
developed approaches to directly fabricate micrometer sized graphene oxide with
controlled holey structures. Taking one step further; we have also developed microwave
chemistry to dope these graphene oxide sheets with/without holes in their basal planes
with N controllable bond configurations. We have shown that the N-doping and holey
structure of graphene is important for their excellent electrochemical catalytic
performance in oxygen reduction reaction (ORR).
iv
In the drive towards green and sustainable chemistry, there is an ever-increasing
interest in developing the heteroatom-doped carbon-based catalysts to replace the metal-
based catalysts for organic reactions. Compared to ORR, studies that use doped and/or
co-doped carbon materials as catalysts for selective organic synthesis is in the early
stages of development. This might be due to lack of systematic studies about how the
electronic and geometrical structures, surface functionalities, and therefore, the interface
properties of graphene-based materials determine their catalytic performance. Also
lacking is the inability to synthesize these doped carbon catalysts in bulk quantity with
simple and cost effective approaches. In the second part of this dissertation, we have
reported extremely simple and rapid (seconds) approaches to directly synthesize gram
quantities of single or multiple heteroatom-doped graphitic porous carbon materials from
abundant and cheap biomass molecules (inositol or phytic acid) with controlled doping
configuration. The porous structure of the catalyst is beneficial for efficient mass transport
and dramatically increases edges and surface area, and therefore creates more accessible
catalytic centers. Furthermore, we have also explored the catalytic center of these
heteroatom-doped carbon catalysts (especially phosphorus-doped and phosphorus, sulfur-
codoped) to gain a fundamental understanding of how the heteroatom (P and S) configuration
affect the catalytic properties of carbon material in ORR and industry oxidation reactions,
such as benzyl alcohol oxidation. This fundamental understanding will help us to design
more efficient heteroatom-doped carbon catalysts.
v
Preface
Chapter 1. Figures 1.1.1 is reprinted with permission from the “Mineralogical Society
of America” Figure 1.2.2-A is reprinted with permission from “Akhavan, O. Graphene
nanomesh by ZnO nanorod photocatalysts. ACS nano 2010, 4, 4174-4180”. Copyright
©2014, American Chemical Society. Figure 1.2.2-B is reprinted with permission from
“Mao, S.; Wen, Z.; Kim, H.; Lu, G.; Hurley, P.; Chen, J. A general approach to one-pot
fabrication of crumpled graphene-based nanohybrids for energy applications. ACS nano
2012, 6, 7505-7513”. Copyright ©2012, American Chemical Society. Figure 1.2.2-C and
D is reprinted with permission from “Wu, Z.-S.; Winter, A.; Chen, L.; Sun, Y.;
Turchanin, A.; Feng, X.; Müllen, K. Three-Dimensional Nitrogen and Boron Co-doped
Graphene for High-Performance All-Solid-State Supercapacitors. Adv. Mater. 2012, 24,
5130-5135”. Copyright ©2012, WILEY-VCH Verlag GmbH & Co. Figure 1.4.1 and
1.4.2. are reprinted with permission from “Microwave synthesis: chemistry at the speed
of light. Hayes, Brittany L. (2002)”. Copyright ©2002, CEM Publishing.
Chapter 2. A large portion of this material has been published as a full journal article in
“ACS Nano”. All the figures and text of this published article are reprinted in this chapter
with permission from “Patel, M.; Yang, H.; Chiu, P.; Mastrogiovanni, D.; Flach, C.;
Savaram, K.; Gomez, L.; Hemnarine, A.; Mendelsohn, R.; Garfunkel, E.; Jiang, H. and
He, H., 2013. Direct production of graphene nanosheets for near infrared photoacoustic
imaging. ACS nano, 7(9), pp.8147-8157”. Copyright © 2013, American Chemical
Society. Figure 2.12 is reprinted with permission from the “Taratula, O.; Patel, M.;
Schumann, C.; Naleway, M.; Pang, A.; He, H. and Taratula, O., 2015. Phthalocyanine-
loaded graphene nanoplatform for imaging-guided combinatorial
vi
phototherapy. International journal of nanomedicine, 10, pp.2347-2362”. Copyright ©
2015, Taratula et al.
Chapter 3. A full portion of this material has been published as a full journal article in
“Small”. All the figures and text of this published article are reprinted in this chapter with
permission from “Patel, M.; Feng, W.; Savaram, K.; Khoshi, M.R.; Huang, R.; Sun, J.;
Rabie, E.; Flach, C.; Mendelsohn, R.; Garfunkel, E. and He, H., 2015. Microwave
Enabled One‐Pot, One‐Step Fabrication and Nitrogen Doping of Holey Graphene Oxide
for Catalytic Applications. Small, 11(27), pp.3358-3368.”. Copyright © 2015, John
Wiley & Sons, Inc.
Chapter 4. A full portion of this material has been published as a full journal article in
“ACS Nano”. All the figures and text of this published article are reprinted in this chapter
with permission from “Patel, M.A.; Luo, F.; Khoshi, M.R.; Rabie, E.; Zhang, Q.; Flach,
C.R.; Mendelsohn, R.; Garfunkel, E.; Szostak, M. and He, H., 2015. P-Doped Porous
Carbon as Metal Free Catalysts for Selective Aerobic Oxidation with an Unexpected
Mechanism. ACS nano, 10 (2), 2305-2315”. Copyright © 2016, American Chemical
Society.
Chapter 5. A full portion of this material has been published as a full journal article in
“Journal of Natural Products Research Updates”. All the figures and text in this chapter
are reprinted with permission from “Patel, M.; Savaram, K.; Keating, K. and He, H.,
2015. Rapid Transformation of Biomass Compounds to Metal Free Catalysts via Short
Microwave Irradiation. Journal of Natural Products Research Updates, 1, 18-28”.
Copyright © 2015, Synchro Publisher.

vii
Dedication
This dissertation is dedicated to all my family members for their
abundant love, patience and continuous support
to fulfill my dream.
viii
Acknowledgement
It is with immense gratitude that I acknowledge my Professor, Dr. Huixin He for giving
me a golden opportunity to pursue a Ph.D. research in her lab to fulfill my dream. I would
also like to thank for her invaluable assistance, motivation, advice and guidance
throughout in all phase of my Ph.D. studies. She has always inspired me to become
independent researcher and planted a seed for developing scientific reasoning in my
mind. I would also like to thank her for encouraging and allowing me to grow as a
research scientist.
My sincere thanks also go to all my thesis committee members: Dr. Phillip Huskey, Dr.
Jenny Lockard, and Dr. Xianqin Wang for agreeing to be a member for my Ph.D. defense
committee. I really appreciate all of them for devoting their precious time in reading and
valuable comments to improve my thesis.
I am also more grateful to the collaborators, who have always advice and helped me with
their expertise to solve my scientific and technical problems. So would like share the
credit of my success with them: Prof. Eric Garfunkel and his students (Dr. Daniel
Mastrogiovanni, Dr. Wenchun Feng, Dr. Feixiang Luo and Ms. Qing Zhang) for X-ray
photoelectron spectroscopy (XPS) measurement and data analysis. Prof. Richard
Mendelsohn, Dr. Carol R Flach and their lab members (Ms. Emann Rabie and Dr.
Qihong Zhang) for their help in FT-IR and Raman measurement and analysis of our
graphene samples. Prof. Jenny Lockard and her student (Dr. Pavel Kucheryavy and Mr.
Qiaoqiao Xie) for X-ray absorption spectroscopy (XAS) measurement and data analysis.
Prof. Huabei Jiang and Dr. Hao Yang for their help in photoacoustic measurement. Prof.
ix
Michal Szostak and Dr. Feng Hu for their fruitful collaboration in usefulness of graphene
based material for organic catalysis. Prof. Kristina Keating for surface area measurement
of graphene samples by Brunauer–Emmett–Teller (BET) method. Prof. Theresa Li-Yun
Chang and her group members (Ms. Carley Tasker and Ms. Kimyata Valere) for help in
anti-HIV activity measurement of graphene nanosheets. Prof. Oleh Taratula and Dr.
Olena Taratula for the study of graphene nanosheets in cancer treatment. Dr. Roman
Brukh for his help in Gas Chromatography Mass Spectrometry (GC-MS) and Scanning
electron microscope (SEM) training and measurements.
I cannot forget my friends cum colleagues cum lab mates (Dr. William Cheung, Dr. Pui
Lam Chiu, Ms. Keerthi Savaram, Mr. M Reza Khoshi and Dr. Ruiming Huang) who not
only cheered me for each of my accomplishment but also helped me and inspired me in
my research. My sincere thanks also goes to all the faculties and staff members in
chemistry department for their kind support and making my Ph.D. journey memorable.
I would like to acknowledge the financial support from our chemistry department,
Rutgers university-Newark and National Science Foundation (CHE-0750201, CHE-
1229030, CBET-0933966, CBET 1438493, STTR 1346496, DMR 1507812, and MRI-
1039828).
A special thanks to my family. Words cannot express how grateful I am to my parents
(Arvindbhai and Jayaben), my parents-in-law (Rameshchandra and Aartibahen), my dear
sisters (Nisha and Dharmishtha), and brother-in-law (Parth) for their trust, constant
inspiration and unconditional support. Their prayers for me was what sustained me thus
far. I also want to thank my school time mentor(Mr. Pravinbhai), my uncle Mr.
x
(Parsottambhai) and aunty (Sunitaben), who has always encouraged me by his moral
support and by his unconditional financial support during my transition from India to
USA. I would also like to thanks all my friends for their emotional support.
Finally, this thesis would have remained a dream and had not been possible without
support from my beautiful, lovely wife (Monal). She has always motivated, loved,
supported, entertained me and even digested my frustration. Thanks to her (and her
alone) I have been able to maintain a sustainable level of work/life balance throughout
my Ph.D. You are truly the best companion that I can ever have in my life.
xi
Table of Contents
Copyright Page..................................................................................................................... i
Abstract of The Dissertation ............................................................................................... ii
Preface................................................................................................................................. v
Dedication ......................................................................................................................... vii
Acknowledgement ........................................................................................................... viii
List of Figures .................................................................................................................. xiv
List of Schematic Drawings ............................................................................................ xxv
List of Tables ................................................................................................................. xxvi
Chapter-1. Introduction ....................................................................................................... 1
1.1. Graphene: Background and its properties. ........................................................... 1
1.1.1. Background of graphene. .............................................................................. 1
1.1.2. The unique properties of graphene. .............................................................. 2
1.2. Graphene with controlled morphology ................................................................ 4
1.2.1. The importance of controlling the morphology of graphene sheet. .............. 4
1.2.2. Properties and application of graphene nanosheets: ..................................... 6
1.2.3. Synthesis of graphene nanosheets. ................................................................ 8
1.2.4. Properties and application of porous/holey graphene. ................................ 10
1.2.5. Synthesis of holey graphene sheets............................................................. 12
1.3. Chemical modification of graphene. .................................................................. 16
1.3.1. The Importance of heteroatoms doped graphene and its application. ........ 17
1.3.2. Synthesis of heteroatom-doped graphene/carbon. ...................................... 20
1.3.3. Catalytic applications of heteroatom-doped graphene/carbon material. ..... 27
1.4. Microwave Chemistry. ....................................................................................... 37
1.5. References. ......................................................................................................... 40
Chapter 2. Direct Production of Graphene Nanosheets for Near Infrared Photoacoustic Imaging ............................................................................................................................. 56
2.1. Introduction ............................................................................................................ 56
2.2. Results and Discussion .......................................................................................... 58
2.3. Conclusions ............................................................................................................ 80
xii
2.4. Experimental Section ............................................................................................. 82
2.4.1. Materials ......................................................................................................... 82
2.4.2. Fabrication of ME-LOGr nanosheets.............................................................. 82
2.4.3. Control experiments ........................................................................................ 83
2.4.4. Material Characterization ................................................................................ 84
2.4.5. Photoacoustic characterization ........................................................................ 85
2.5. References .............................................................................................................. 86
Chapter 3. Microwave Enabled One-Pot, One-Step Fabrication and Nitrogen Doping of Holey Graphene Oxide for Catalytic Applications ........................................................... 91
3.1 Introduction ............................................................................................................. 91
3.2 Results and Discussion ........................................................................................... 93
3.3. Conclusions .......................................................................................................... 122
3.4. Experimental Section ........................................................................................... 123
3.4.1. Synthesis of GO and HGO ............................................................................ 123
3.4.2. N doping of GO and HGO ............................................................................ 124
3.4.3. Material Characterization .............................................................................. 124
3.4.4. Surface area measurement of GO, HGO, N-rGO-10 and N-HrGO-10: ....... 125
3.4.5. Electrochemical Measurements .................................................................... 126
3.5. References ............................................................................................................ 128
Chapter 4. P-Doped Porous Carbon as Metal Free Catalysts for Selective Aerobic Oxidation with an Unexpected Mechanism .................................................................... 133
4.1. Introduction .......................................................................................................... 133
4.2. Results and Discussion ........................................................................................ 137
4.3. Conclusions .......................................................................................................... 162
4.4. Experimental Section ........................................................................................... 163
4.4.1. PGc (Phosphorus doped graphitic carbon) fabrication ................................. 163
4.4.2. Fabrication of PGc-30 and PGc-180 ............................................................. 164
4.4.3. Synthesis of GO and rGO for catalysis ......................................................... 165
4.4.4. Catalytic oxidation of primary and secondary alcohol Reaction. ................. 165
4.4.5. Material Characterization .............................................................................. 167
4.5. References ............................................................................................................ 173
xiii
Chapter 5. Rapid Transformation of Biomass Compounds to Metal Free Catalysts via Short Microwave Irradiation ........................................................................................... 178
5.1. Introduction .......................................................................................................... 178
5.2. Results and Discussion ........................................................................................ 183
5.3. Conclusions .......................................................................................................... 199
5.4. Experimental Section ........................................................................................... 200
5.4.1. Synthesis of the PGc (Phosphorus doped graphitic carbon), PGc-30 and PGc-180: ......................................................................................................................... 200
5.4.2. Synthesis of P and other heteroatoms (N, B, S and Si) co-doped catalysts: . 201
5.4.3. Synthesis of P-doped and Non-carbon catalysts using Inositol and phosphoric acid/sulfuric acid for control experiment. ............................................................... 203
5.4.4. Synthesis of sole heteroatoms (B, N, S, or Si) doped carbon materials using Inositol as carbon (C) source. ................................................................................. 203
5.4.5. Electrochemical Characterization: ................................................................ 204
5.4.6. Material Characterization: ............................................................................ 206
5.5. References ............................................................................................................ 207
Chapter 6. Phosphorus and Sulfur Dual-Doped Graphitic Porous Carbon Metal-Free Catalysts for Aerobic Oxidation Reactions: Enhanced Catalytic Activity and Active Sites.......................................................................................................................................... 211
6.1. Introduction .......................................................................................................... 211
6.2. Results and Discussion ........................................................................................ 213
6.3. Conclusions .......................................................................................................... 239
6.4. Experimental Section ........................................................................................... 240
6.4.1. Synthesis of catalysts .................................................................................... 240
6.4.2. Catalytic oxidation of primary and secondary alcohol Reaction. ................. 241
6.4.3. Material characterization .............................................................................. 242
6.5. References ............................................................................................................ 244
xiv
List of Figures
Figure 1.1.1. The structures of different carbon allotropes. ............................................... 1
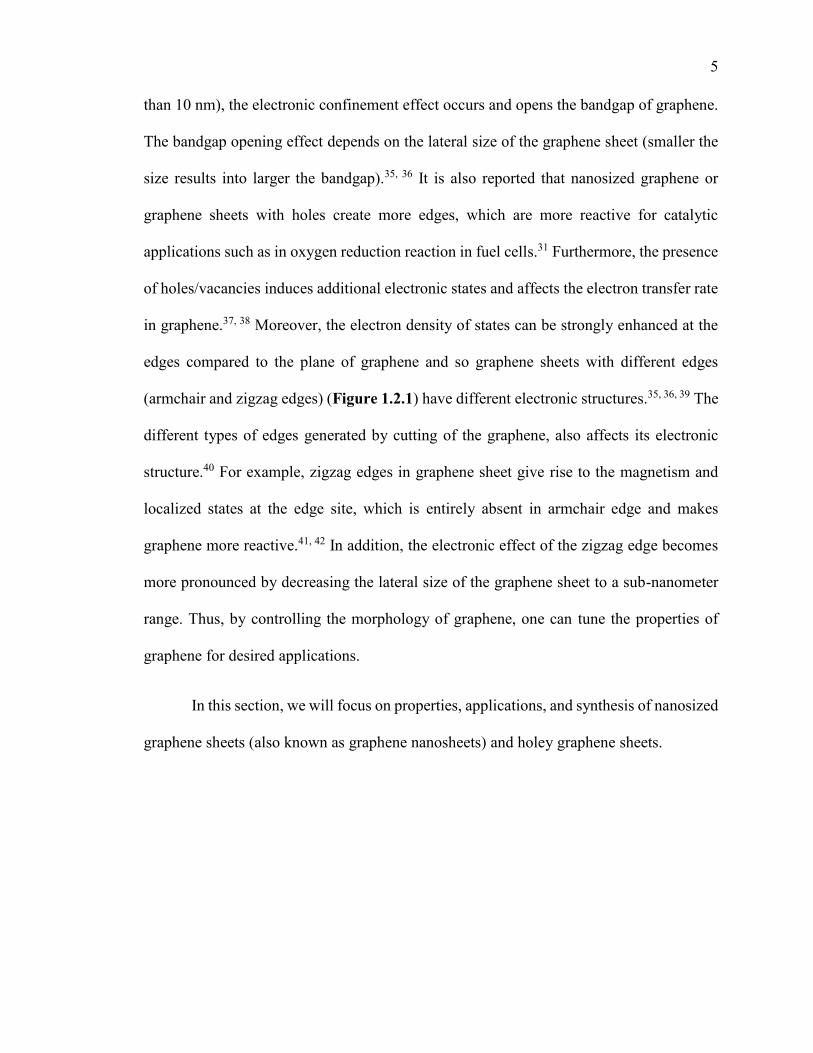
Figure 1.2.1. Schematics of graphene structure with highlighting different type of edge
and hole defect. Carbon atoms on the edges are highlighted with red color to differentiate
it from bulk C atom (gray color). ........................................................................................ 6
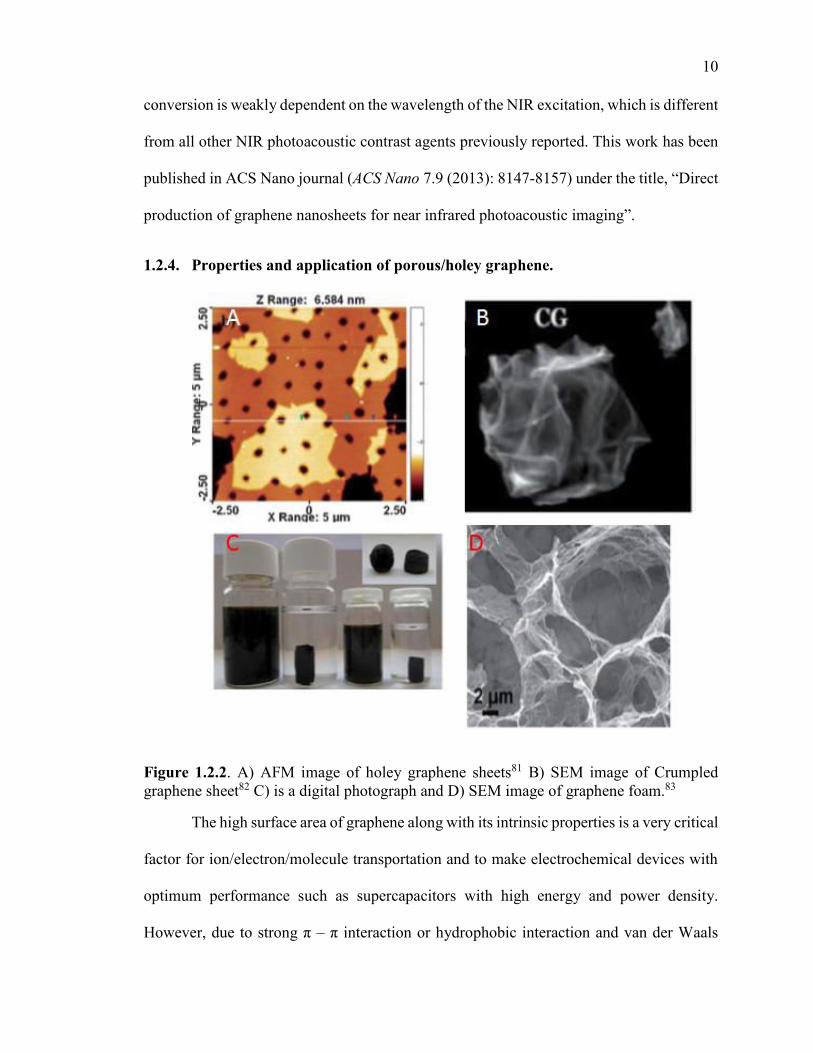
Figure 1.2.2. A) AFM image of holey graphene sheets B) SEM image of Crumpled
graphene sheet C) is a digital photograph and D) SEM image of graphene foam. .......... 10
Figure 1.3.1. The schematic for N-doped graphene (A) and P-doped graphene (B) with
different dopant configurations. Inset of (B) is showing the side view of P-doped
graphene to show that P atom is protruding out of graphene plane. ................................. 19
Figure 1.3.2. Schematics of Fuel cell design. .................................................................. 30
Figure 1.4.1. Electric and magnetic field of Microwave. ............................................... 37
Figure 1.4.2. The electromagnetic spectrum of Microwave. ........................................... 38
Figure 2.1. Digital photographs of stable ME-LOGr solutions in water, N, N-
dimethylformamide (DMF), acetone, pyridine, and acetonitrile. ..................................... 59
Figure 2.2. (A) AFM images of ME-LOGr nanosheets, (B) UV-Vis-NIR spectra of ME-
LOGr nanosheets with concentrations of 20 (pink), 10 (olive), 6.7 (blue), is 5 (red), and
3.3 mg/L (black), respectively. Inset B, a digital picture of an aqueous suspension of ME-
LOGr nanosheets (left) and graphene oxide (GO) nanosheets (right) shows different
colors, indicating they are in different oxidation states. The GO nanosheets were obtained
via Control-A Experiment in which nitronium ions and KMnO4 both act as an oxidant. 60
Figure 2.3. Statistical analysis of the AFM pictures of ME-LOGr nanosheets. .............. 60
Figure 2.4. An x-ray photoelectron spectrum (XPS) of ME-LOGr nanosheets. ............ 61
xv
Figure 2.5. Raman spectra of ME-LOGr nanosheets (red) and GO nanosheets (blue). GO
nanosheets were obtained via Control- A experiment where nitronium ions and KMnO4
both act as an oxidant. ....................................................................................................... 63
Figure 2.6. (A) AFM image of graphene oxide nanosheets obtained via Control-A
experiment. Some of the nanometer gaps between nanosheets and nanoholes generated
during the oxidation reaction were labeled with arrows and circles, respectively. (B) UV-
Vis-NIR spectra of the GO sheets at different concentrations of 133.3 (Wine), 66.7
(olive), 53.3 (blue), 44.4 (red), and 33.3 mg/L (black), respectively. For better
comparison, the pink curve (20mg/L of ME-LOGr nanosheets) in Figure 2.2B is also
displayed in panel B with the same color. Inset (B) shows the linear relationships
between the absorption at 984 nm and the concentration of ME-LOGr nanosheets and
GO. The mass coefficient of the ME-LOGr is 40 fold higher than that of GO. .............. 67
Figure 2.7. (A) UV-Vis-NIR spectrum of the nanosheets obtained via KMnO4 oxidation
(Control-B experiment). The maximum plasmon peak is around 235 nm. Inset (A) is a
picture of the dispersed nanosheet solution. The brownish yellow color and the plasmon
peak at 235 nm collectively demonstrated that the product is highly oxidized. (B) An
AFM image of the nanosheets, majority of which have multiple layers. ......................... 68
Figure 2.8. (A) Raman spectra of different concentrations of nitronium ions produced
with different ratios of concentrated HNO3, H2SO4, and H2O with ratios of (1) 1:1:0; (2)
1:42:7 ; (3) 1:2.5:0.07; (4) 1:17.5:1.5 and (5) 1:4:0, respectively. (B) Digital pictures of
filtrates obtained after graphite particles were oxidized in microwave with different ratios
of HNO3:H2SO4:H2O of (1) to (5), and therefore different concentrations of nitronium
ions. 5-K was obtained with the same ratio as (5), except that KMnO4 was included. (C
xvi
and D) AFM images of porous graphene sheets dispersed with magnetic stirring instead
of sonication to avoid sonication-induced tearing. The graphene sheets in panels C, and D
were obtained with ratio (3) and (4), respectively. ........................................................... 70
Figure 2.9. Raman spectra of the mixture of concentrated H2SO4 and HNO3 and H2O
with different volume ratios of concentrated HNO3, H2SO4, and H2O with ratios of (1)
1:1:0; (2) 1:42:7 ; (3) 1:2.5:0.07; (4) 1:17.5:1.5 and (5) 1:4:0, respectively. The
concentration of the generated nitronium ions by the acid mixtures increases as the ratio
of H2SO4, HNO3, and H2O changes. Peak assignments are labeled on the spectra and
listed in the following Table 2.1....................................................................................... 71
Figure 2.10. (A) An AFM image of nanosheets obtained with traditional heating
(Control-C Experiment). (B)UV-Vis-NIR spectrum of the nanosheets indicates that these
sheets are more oxidized than the ME-LOGr nanosheets fabricated via microwave
heating. .............................................................................................................................. 73
Figure 2.11. Photoacoustic (PA) signal of GO and graphene nanosheets of different
concentrations, illuminated with 700nm and 800nm laser. The color coded vertical bar
represents the strength of the photoacoustic signal generated. GO nanosheets were
obtained via Control-A experiment. ................................................................................. 79
Figure 2.12.Schematic illustration of the multifunctional nanoplatform based on ME-
LOGr nanosheets. A) In Vivo NIR fluorescence imaging of nude mice 12 hours after
injection of saline ME-LOGr-Pc-LHRH. B) Combinatorial (PDT-PTT) therapeutic
effects of ME-LOGr-Pc-LHRH (cyan color) on A2780/AD cell pellets (2,000,000)
irradiated for 10 minutes using a 690 nm laser diode (0.95 W/cm2), compared with
controls- ME-LOGr-LHRH (black) and Pc-LHRH (sky blue).69 ..................................... 80
xvii
Figure 2.13. Schematic of the experimental setup for PA imaging ................................. 85
Figure 3.1. (A) AFM and (C) STEM of GO sheets obtained via 30seconds of microwave
irradiation. (B) AFM and (D) STEM images of HGO sheets obtained via 40 seconds of
microwave irradiation. (E) UV-Vis-NIR spectra of GO sheets (black line) and N-rGO-10
(red line). Inset (E) is a digital picture of an aqueous dispersion of GO (left) and N-rGO-
10(right) shows different colors, indicating they are in different oxidation states. (F) UV-
Vis-NIR spectra of HGO sheets (black line) and N-HrGO-10 (red line). Inset (F) is a
digital picture of an aqueous dispersion of HGO (left), N-HrGO-10(right) shows different
color, indicating their different oxidation states. The red arrows in (B and D) shows hole
on HGO sheet. ................................................................................................................... 95
Figure 3.2. (A) XPS survey scan and (B) O 1s peak of GO, N-rGO-10, HGO and N-
HrGO-10. XPS high resolution C 1s peak analysis of HGO (C), GO (D), N-HrGO-10 (E)
and N-rGO-10(F), where 10 denotes microwave treatment time (in minutes) of HGO/GO
with NH4OH at 120 °C. .................................................................................................... 97
Figure 3.3. (A) AFM and (B) Uv-Vis-NIR spectrum of an aqueous dispersion of HGO
sheets obtained via 45seconds of microwave heating. The inset of (B) shows its digital
picture. (C) is the digital pictures and (D) is the fluorescence emission spectra (λexc =
335nm) of the filtrates, produced after graphite particles were oxidized with different
microwave time: (I) 30seconds, (II) 40seconds, (III) 45seconds, respectively. (IV) is the
filtrate obtained with the same experimental conditions as (I), except that KMnO4 was
excluded and (V) is the filtrate obtained with the same experiment condition as (II),
except the graphite was excluded. .................................................................................. 100
xviii
Figure 3.4. AFM images of the products obtained with different control experimental
conditions. Microwave heating of the mixture of H2SO4, HNO3 and graphite (300W and
30 seconds) in the absence of KMnO4 (A); in the presence of KMnO4 (125wt% of
graphite) (B); traditional heating of the mixture of H2SO4, HNO3 and graphite with
KMnO4 (500wt% of graphite) (C). (D) shows their corresponding UV-VIS-NIR
spectrum: black curve for (A), red curve for (B) and blue curve for (C). The UV peak at
264 nm and the strong NIR absorpton indicate the intrinsic properties of graphene are
largely maintained in product (A); the blue shift of the UV peak to 240 nm and the
decrease in NIR absorption suggest that the product (B) is partially oxidized. The product
(C) shows a typical UV-VIS-NIR spectrum of a highly oxidized graphene oxide. ...... 102
Figure 3.5. Microwave heating temperature (°C) profile with time during GO (black line)
and HGO (red line) synthesis. ......................................................................................... 104
Figure 3.6. (A) FTIR spectrum of GO and N-rGO-10. (B) FTIR spectrum of HGO and
N-HrGO-10. .................................................................................................................... 107
Figure 3.7. Raman spectra of HGO and N-HrGO-5, N-HrGO-10 and N-HrGO-30. .... 109
Figure 3.8. Scanning electron microscopic (SEM) images of N-rGO-10(A and B), N-
HrGO-5(C and D), N-HrGO-10(E and F) and N-HrGO-30(G and H). The yellow arrow
shows hole on N-HrGO’s surface. .................................................................................. 110
Figure 3.9. XPS high resolution N1s peak analysis of N-rGO-10 (A), N-HrGO-10 (c) and
N-HrGO-30 (d), where 10 and 30 denotes microwave treatment time (in minutes) of
GO/HGO with NH4OH at 120 °C. ................................................................................. 111
Figure 3.10. (A) and (B) is CV and LSV curves of Pt/C, EC-HrGO, N-HrGO-10, N-
rGO-10 and bare electrode in O2 saturated 0.1M KOH electrolyte at a scan rate of 50
xix
mV/s and 10 mV/s, respectively. Inset (B) is zoomed in LSV curve of bare electrode, N-
rGO-10 and N-HrGO-10. All potentials are measured using Ag/AgCl as a reference
electrode. (C) CVs of N-HrGO-10 in N2 and O2 saturated 0.1M KOH electrolyte at a scan
rate of 50mv/s. (D) Tafel plots of Pt/C, N-HrGO-10, N-rGO-10, EC-HrGO and bare
electrode derived by the mass-transport correction of corresponding RDE data (Figure
3.10B).............................................................................................................................. 113
Figure 3.11. CV curves (A) and onset potential (B) of N-HrGO-x electrode in O2
saturated 0.1M KOH electrolyte at a scan rate of 50mv/s, where “x” is different
microwave time (0, 5, 10, 15, 30 minutes) used for synthesis of different N-HrGO. All
potentials are measured using Ag/AgCl as a reference electrode. .................................. 115
Figure 3.12. (a) RRDE voltammogram of N-HrGO-10, N-HrGO-30, EC-HrGO, N-rGO-
10 and Pt/C modified electrode in oxygen saturated 0.1M KOH at a scan rate of 10mV/s
and 1600rpm rotation speed. (b) and (c) is the number of electron transfer and relative
peroxide %, respectively, for all catalyst calculated from RRDE voltammogram. All
potentials are measured using Ag/AgCl as a reference electrode. .................................. 118
Figure 3.13. LSV curves of N-HrGO-10(a), N-rGO-10(b) and Pt/C(c) at different
rotation speed in O2 saturated 0.1M KOH solution at 10mV/s. (d) is K-L plot of Pt/C,
obtained based on the LSV data(c).All potentials are measured using Ag/AgCl as a
reference electrode. ......................................................................................................... 119
Figure 3.14. (A) and (B) are K-L plot of N-HrGO-10 and N-rGO-10, obtained based on
the LSV curves at different rotating speeds (Figure 3.13), respectively. (C) is calculated
oxygen diffusion coefficient and (D) is calculated rate constant for ORR, using slope and
xx
intercept from K-L plot of N-HrGO-10, N-rGO-10 and Pt/C. All potentials are measured
using Ag/AgCl as a reference electrode.......................................................................... 120
Figure 3.15. (A) is Nyquist plot of EIS for the oxygen reduction on the bare electrode,
EC-HrGO, N-rGO-10, N-HrGO-10 and Pt/C. (B) is durability testing of the Pt/C and N-
HrGO-10 electrode for ~7 hours at -0.38V and 1000rpm speed. (C) is
chronoamperometric response of the N-HrGO-10 and Pt/C modified electrode for ORR
upon addition of methanol after about ~300seconds at -0.38V. All potentials are
measured using Ag/AgCl as a reference electrode. ........................................................ 121
Figure 3.16. Linear relationships between the concentration of MB and its absorption at
664 nm. ........................................................................................................................... 126
Figure 4.1. Scanning electron microscope (SEM) images of the as-fabricated PGc
catalyst. ........................................................................................................................... 138
Figure 4.2. (A) XPS and (B) EDS spectra of PGc, PGc-30 and PGc-180 catalysts. (C)
The Raman spectra of different catalysts. (D) 12-point BET plot of PGc catalyst. ....... 140
Figure 4.3. TGA (Thermo Gravimetric Analysis) spectra of different phosphorus doped
carbon catalyst and graphite............................................................................................ 141
Figure 4.4. (A) Molarity of benzaldehyde vs reaction time plot at different reaction
temperatures to study the rate of oxidation of benzyl alcohol. Reaction conditions: 7 mg
benzyl alcohol, 10.5 mg PGc catalyst, 10 ml water, 1 atm O2. (B) Arrhenius plot for the
benzyl alcohol oxidation. The rate constant (k) values at different temperature were
regarded as the pseudo-zero-order rate constants (k obs) because the plot of the molarity
of benzaldehyde produced versus time is linear. ............................................................ 143
xxi
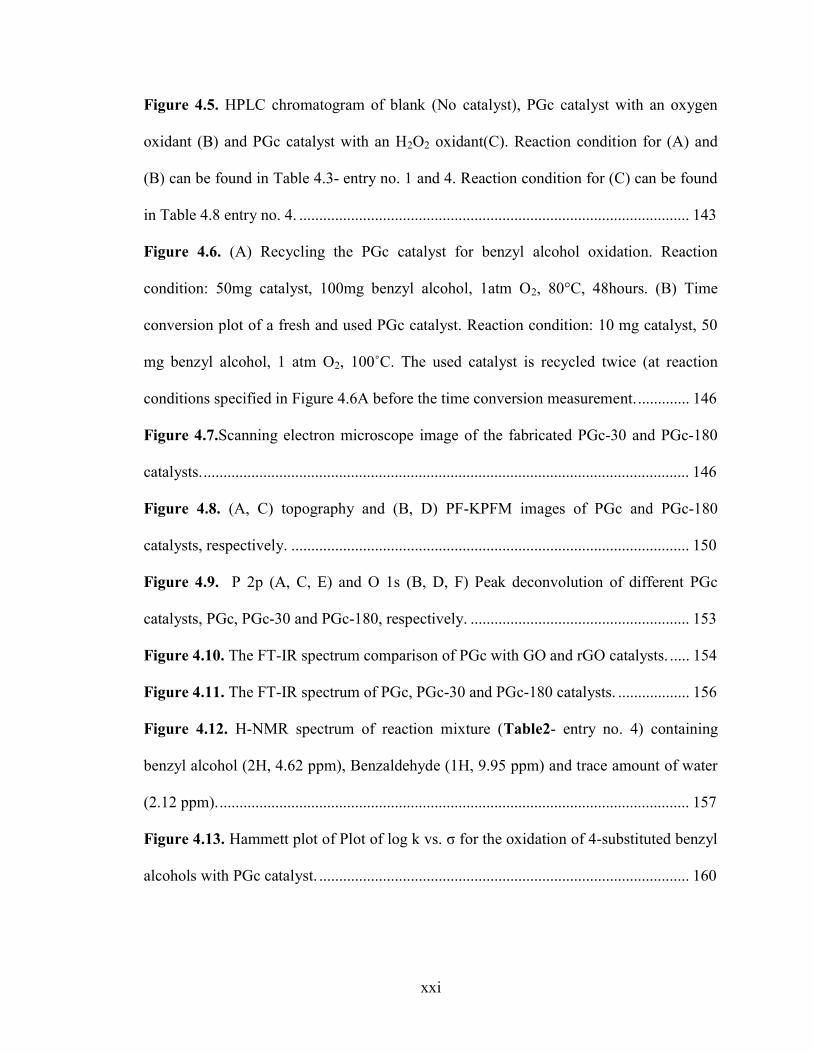
Figure 4.5. HPLC chromatogram of blank (No catalyst), PGc catalyst with an oxygen
oxidant (B) and PGc catalyst with an H2O2 oxidant(C). Reaction condition for (A) and
(B) can be found in Table 4.3- entry no. 1 and 4. Reaction condition for (C) can be found
in Table 4.8 entry no. 4. .................................................................................................. 143
Figure 4.6. (A) Recycling the PGc catalyst for benzyl alcohol oxidation. Reaction
condition: 50mg catalyst, 100mg benzyl alcohol, 1atm O2, 80°C, 48hours. (B) Time
conversion plot of a fresh and used PGc catalyst. Reaction condition: 10 mg catalyst, 50
mg benzyl alcohol, 1 atm O2, 100˚C. The used catalyst is recycled twice (at reaction
conditions specified in Figure 4.6A before the time conversion measurement. ............. 146
Figure 4.7.Scanning electron microscope image of the fabricated PGc-30 and PGc-180
catalysts. .......................................................................................................................... 146
Figure 4.8. (A, C) topography and (B, D) PF-KPFM images of PGc and PGc-180
catalysts, respectively. .................................................................................................... 150
Figure 4.9. P 2p (A, C, E) and O 1s (B, D, F) Peak deconvolution of different PGc
catalysts, PGc, PGc-30 and PGc-180, respectively. ....................................................... 153
Figure 4.10. The FT-IR spectrum comparison of PGc with GO and rGO catalysts. ..... 154
Figure 4.11. The FT-IR spectrum of PGc, PGc-30 and PGc-180 catalysts. .................. 156
Figure 4.12. H-NMR spectrum of reaction mixture (Table2- entry no. 4) containing
benzyl alcohol (2H, 4.62 ppm), Benzaldehyde (1H, 9.95 ppm) and trace amount of water
(2.12 ppm). ...................................................................................................................... 157
Figure 4.13. Hammett plot of Plot of log k vs. σ for the oxidation of 4-substituted benzyl
alcohols with PGc catalyst. ............................................................................................. 160
xxii
Figure 4.14. The FT-IR spectrum of the fresh and used PGc catalyst. The used catalyst
was recycled twice (the reaction conditions were specified in Figure 4.6A caption) before
this FT-IR measurement. ................................................................................................ 160
Figure 4.15. (A, C) AFM Topography and (B, D) PF-KPFM images for the PGc and the
PGc-180 catalysts............................................................................................................ 172
Figure 4.16. X-ray fluorescence spectroscopic (XRF) analysis of standard mixture (rGO
with different % P). The used catalyst is recycled twice (at reaction conditions specified
in the caption of Figure 4.6) before XRF measurement. ................................................ 172
Figure 5.1. The SEM images and EDS spectra of (A) PN-Gc, (B) PS-Gc, (C)PB-Gc,
(D)PSi-Gc, (E)PBN-Gc. The EDS spectra were taken by drop casting each of the co-
doping carbon materials on a Cu tape. ............................................................................ 186
Figure 5.2.The SEM image and EDS spectrum of the PGc (A), Non doped-Gc (B), Si-Gc
(C), N-Gc (D), B-Gc (E), S-Gc (F), which were fabricated by heating the mixture of
inositol and phosphoric acid, inositol and sulfuric acid, inositol + sulfuric acid +
tetraethyl orthosilicate (TES), inositol + sulfuric acid + NH4OH, inositol + sulfuric acid +
boric acid, and inositol + sulfuric acid + amorphous sulfur in microwave, respectively.
The scale bar shown in all SEM images is 2 µm. ........................................................... 189
Figure 5.3. (A) is Cyclic voltammetry (CV) and (B) is Linear sweep voltammetry (LSV)
curves of different phosphorus doped carbon catalyst in O2 saturated 0.1M KOH. LSV
measurements were performed using rotating ring disc (RRDE) electrode at 2000 rpm.
......................................................................................................................................... 190
Figure 5.4. N2 adsorption/desorption isotherms for different phosphorus doped carbon
catalysts. .......................................................................................................................... 192
xxiii
Figure 5.5. (A, B and C) are Linear sweep voltammetry (LSV) curves for PGc, PGc-30
and PGc-180 carbon catalysts, respectively, at different rotating speed in O2 saturated
0.1M KOH solution at 10mV/s. (D) is RRDE curve comparison of PGc, PGc-30 and
PGc-180 modified electrode at 2000 rpm in O2 saturated 0.1M KOH solution at 10mV/s.
Inset (D) is zoom out of ring current comparison of PGc, PGc-30 and PGc-180 catalysts.
......................................................................................................................................... 194
Figure 5.6. Koutecky-Levich (K-L) plots of PGc, PGc-30 and PGc-180 catalysts at
different potentials, calculated from their respective LSV curves at different rotating
speed (rpm). .................................................................................................................... 194
Figure 5.7. The Tafel plot and respective Tafel slopes (b1 and b2) of different P doped
carbon catalysts (A), P and other heteroatoms co-doped carbon catalysts (B), Pt/C
catalyst (C) and Bare electrode(D). ................................................................................ 196
Figure 5.8. (A) Cyclic voltammetry (CV) and (B) is RRDE curves of different
phosphorus (P)and other heteroatoms (B, N, S) co-doped carbon catalysts in O2 saturated
0.1M KOH electrolyte. The RRDE experiment was performed at 2000 rpm using rotating
ring disc (RRDE) electrode in O2 saturated 0.1M KOH solution at 10 mV/s. ............... 197
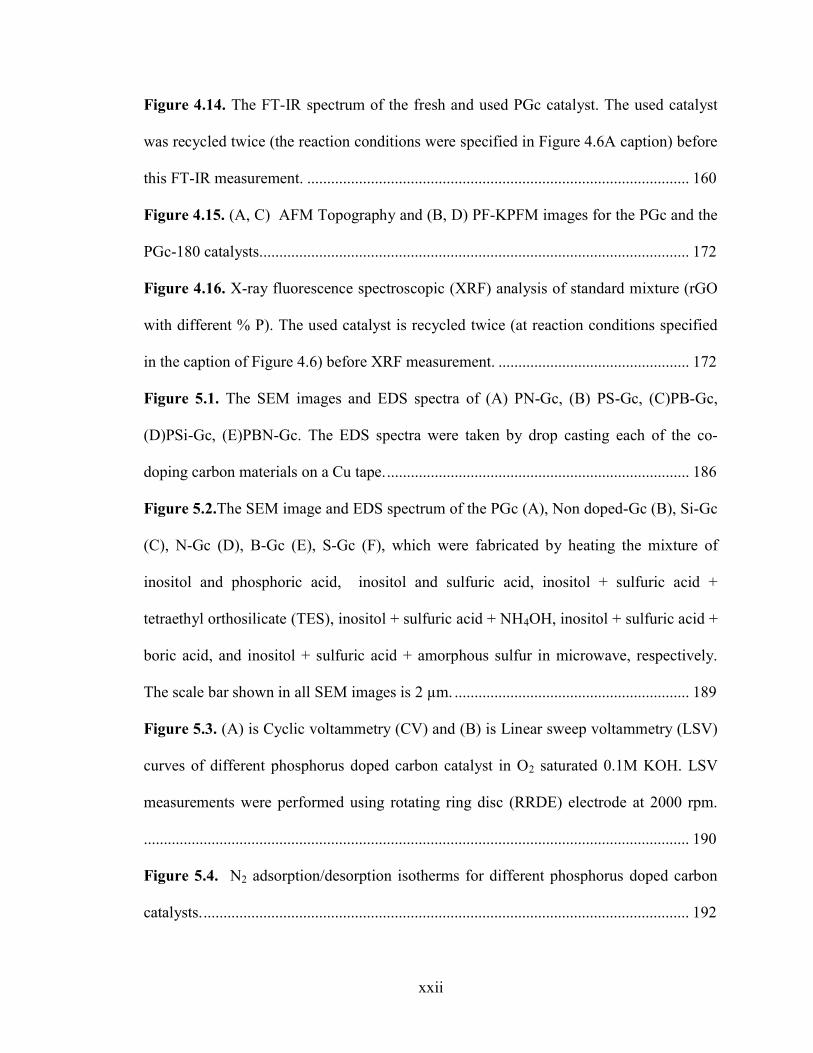
Figure 5.9. (A) is Durability testing of the Pt/C, PGc-180 and PN-Gc catalyst modified
electrode for ~ 7 hours at -0.35V and 2000 rpm rotating speed. (B) is Methanol tolerance
test of the Pt/C, PN-Gc and PGc-180 catalysts, where methanol was added at about 300
seconds of amperometric analysis at -0.35 V. All potentials were measured using
Ag/AgCl as the reference electrode. ............................................................................... 198
Figure 6.1. (A) is scanning electron microscopic (SEM) of PS-Gc and (B) Energy
Dispersive X-ray Spectra (EDS) of PS-Gc. .................................................................... 216
xxiv
Figure 6.2. C1s, O 1s and P2p XPS peak deconvolution of PS-Gc catalyst (A) and PS-
Gc-used catalyst (B). ....................................................................................................... 218
Figure 6.3. S 2p XPS peak deconvolution of PS-Gc catalyst (A), PS-Gc-used catalyst
(B), PS-Gc-TA catalyst (C) and PS-Gc-TA-used (D). ................................................... 219
Figure 6.4. The FT-IR spectra of GO, P-Gc, S-Gc and PS-Gc. ..................................... 220
Figure 6.5. The Raman spectra of PS-Gc, PS-Gc-used, PS-Gc-TA and PS-Gc-TA-used.
......................................................................................................................................... 221
Figure 6.6. (A) The plot of different reaction temperatures versus benzaldehyde
concentration in molarity. Reaction conditions: 10 mg benzyl alcohol, 5 mg PS-Gc
catalyst, 10 ml water, 1 atm O2. (B) Arrhenius plot for the Benzyl alcohol oxidation. The
rate constant (k) values at different temperature were regarded as the pseudo-zero-order
rate constants (k obs) because the plot of the molarity of benzaldehyde versus reaction
time is linear. ................................................................................................................... 228
Figure 6.7. The FT-IR spectra of fresh and used PS-Gc catalysts (A) and PS-GC-TA
catalysts (B). ................................................................................................................... 234
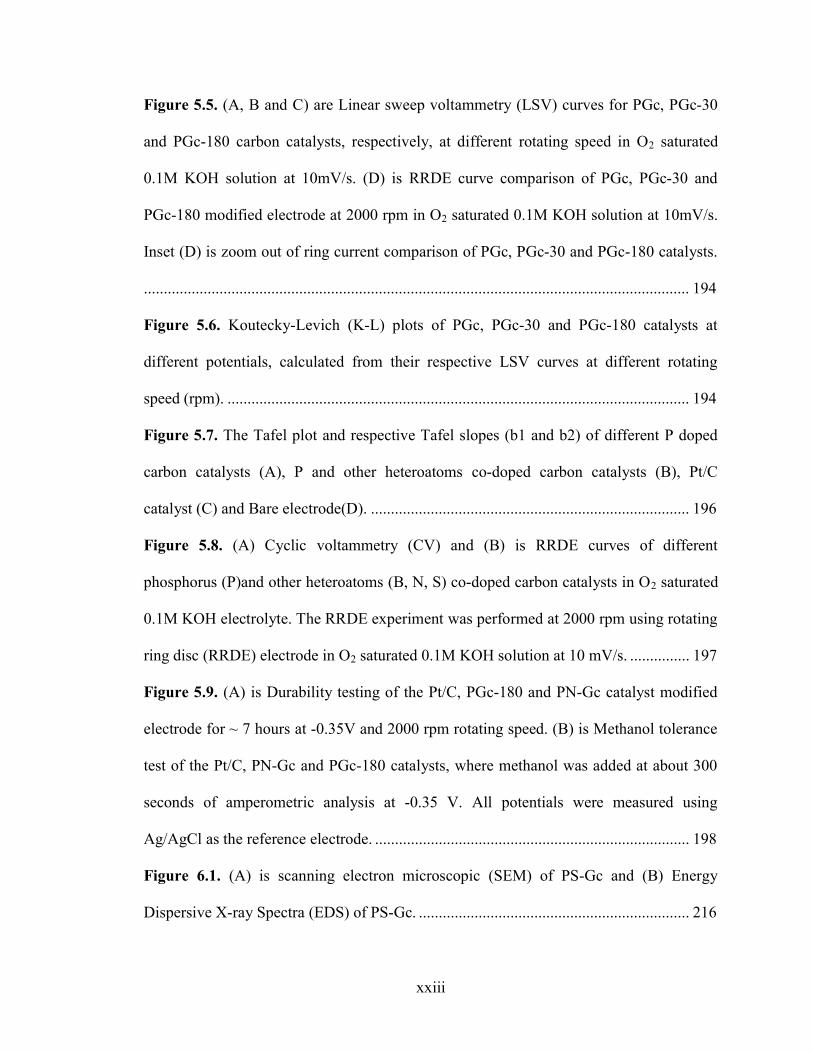
Figure 6.8. The deconvolution of normalized S K-edge XANES spectra of fresh and used
PS-Gc catalysts. .............................................................................................................. 235
xxv
List of Schematic Drawings
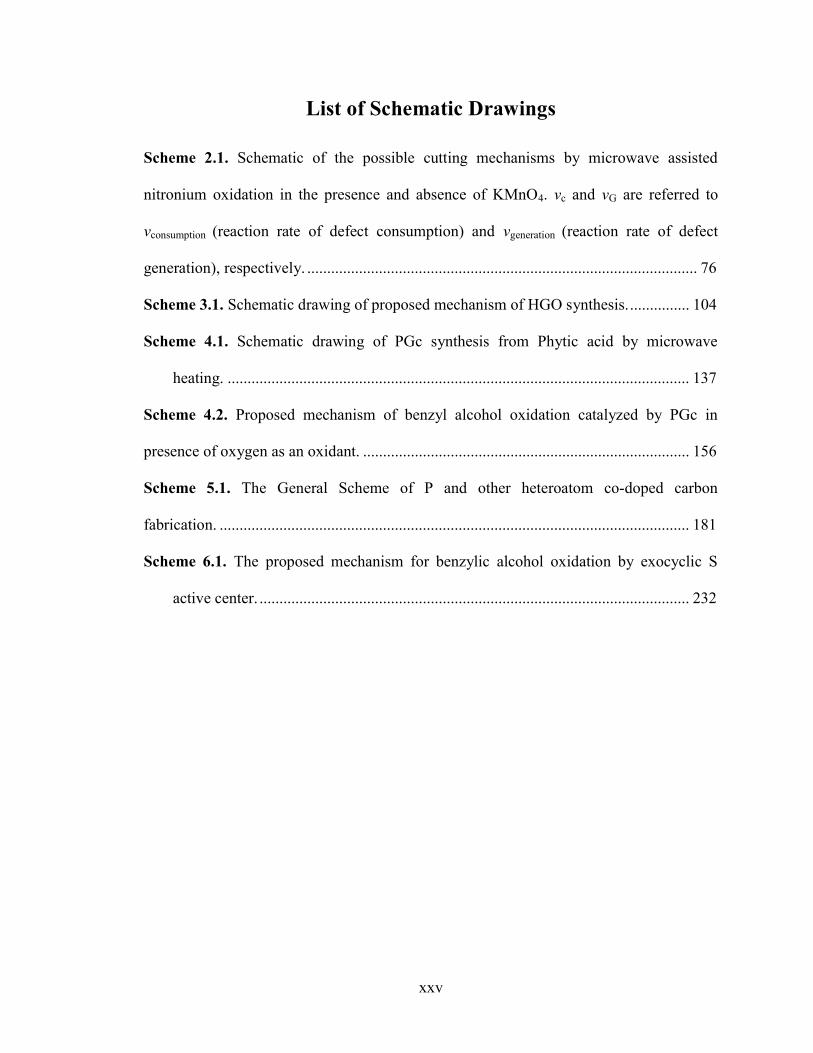
Scheme 2.1. Schematic of the possible cutting mechanisms by microwave assisted
nitronium oxidation in the presence and absence of KMnO4. vc and vG are referred to
vconsumption (reaction rate of defect consumption) and vgeneration (reaction rate of defect
generation), respectively. .................................................................................................. 76
Scheme 3.1. Schematic drawing of proposed mechanism of HGO synthesis. ............... 104
Scheme 4.1. Schematic drawing of PGc synthesis from Phytic acid by microwave
heating. .................................................................................................................... 137
Scheme 4.2. Proposed mechanism of benzyl alcohol oxidation catalyzed by PGc in
presence of oxygen as an oxidant. .................................................................................. 156
Scheme 5.1. The General Scheme of P and other heteroatom co-doped carbon
fabrication. ...................................................................................................................... 181
Scheme 6.1. The proposed mechanism for benzylic alcohol oxidation by exocyclic S
active center. ............................................................................................................ 232
xxvi
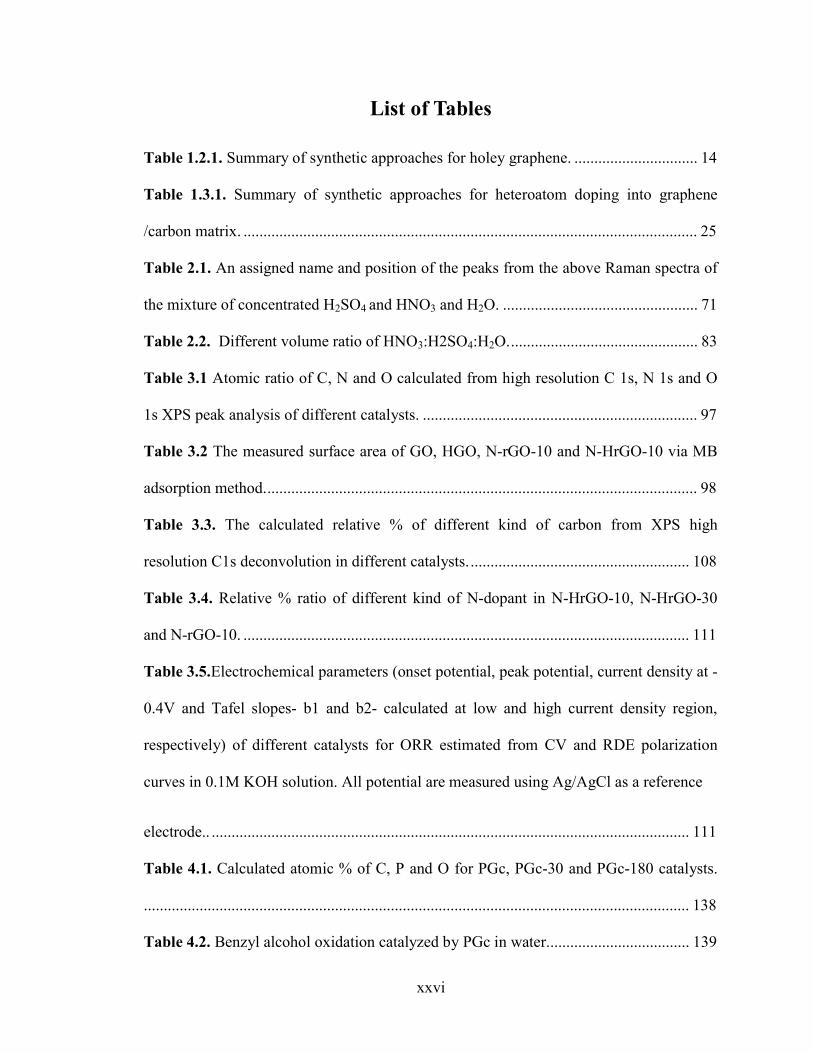
List of Tables
Table 1.2.1. Summary of synthetic approaches for holey graphene. ............................... 14
Table 1.3.1. Summary of synthetic approaches for heteroatom doping into graphene
/carbon matrix. .................................................................................................................. 25
Table 2.1. An assigned name and position of the peaks from the above Raman spectra of
the mixture of concentrated H2SO4 and HNO3 and H2O. ................................................. 71
Table 2.2. Different volume ratio of HNO3:H2SO4:H2O. ............................................... 83
Table 3.1 Atomic ratio of C, N and O calculated from high resolution C 1s, N 1s and O
1s XPS peak analysis of different catalysts. ..................................................................... 97
Table 3.2 The measured surface area of GO, HGO, N-rGO-10 and N-HrGO-10 via MB
adsorption method. ............................................................................................................ 98
Table 3.3. The calculated relative % of different kind of carbon from XPS high
resolution C1s deconvolution in different catalysts. ....................................................... 108
Table 3.4. Relative % ratio of different kind of N-dopant in N-HrGO-10, N-HrGO-30
and N-rGO-10. ................................................................................................................ 111
Table 3.5.Electrochemical parameters (onset potential, peak potential, current density at -
0.4V and Tafel slopes- b1 and b2- calculated at low and high current density region,
respectively) of different catalysts for ORR estimated from CV and RDE polarization
curves in 0.1M KOH solution. All potential are measured using Ag/AgCl as a reference
electrode.. ........................................................................................................................ 111
Table 4.1. Calculated atomic % of C, P and O for PGc, PGc-30 and PGc-180 catalysts.
......................................................................................................................................... 138
Table 4.2. Benzyl alcohol oxidation catalyzed by PGc in water. ................................... 139
xxvii
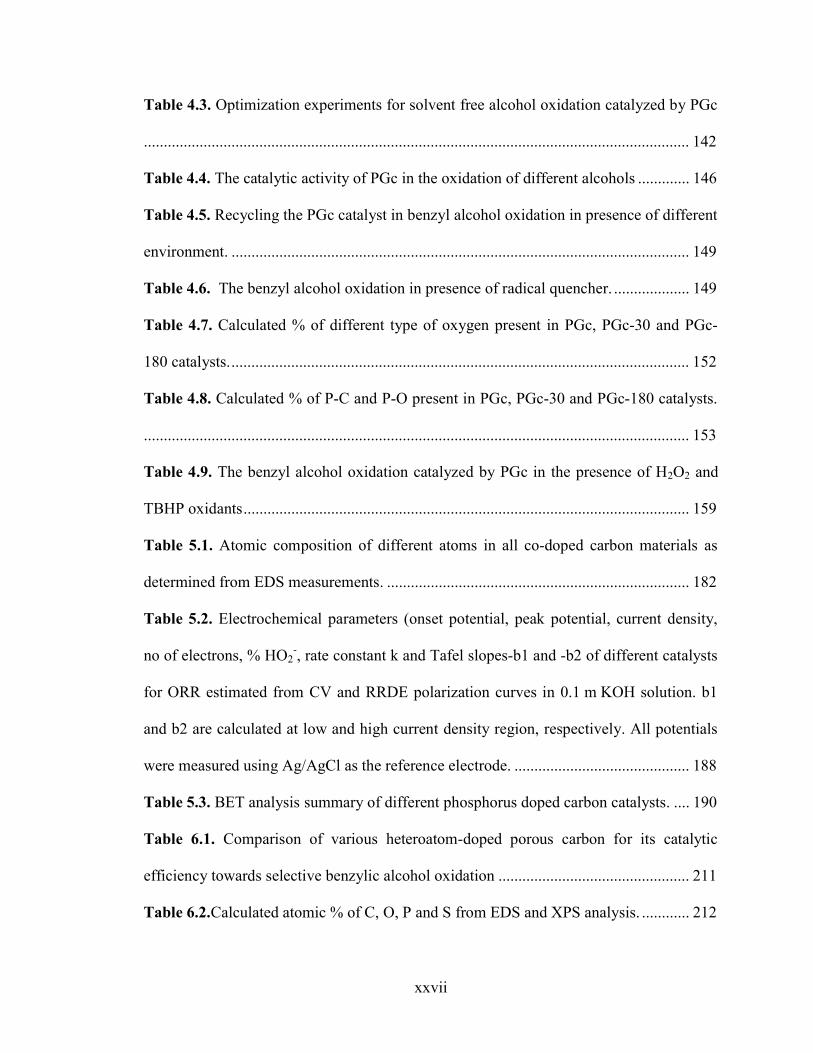
Table 4.3. Optimization experiments for solvent free alcohol oxidation catalyzed by PGc
......................................................................................................................................... 142
Table 4.4. The catalytic activity of PGc in the oxidation of different alcohols ............. 146
Table 4.5. Recycling the PGc catalyst in benzyl alcohol oxidation in presence of different
environment. ................................................................................................................... 149
Table 4.6. The benzyl alcohol oxidation in presence of radical quencher. ................... 149
Table 4.7. Calculated % of different type of oxygen present in PGc, PGc-30 and PGc-
180 catalysts. ................................................................................................................... 152
Table 4.8. Calculated % of P-C and P-O present in PGc, PGc-30 and PGc-180 catalysts.
......................................................................................................................................... 153
Table 4.9. The benzyl alcohol oxidation catalyzed by PGc in the presence of H2O2 and
TBHP oxidants ................................................................................................................ 159
Table 5.1. Atomic composition of different atoms in all co-doped carbon materials as
determined from EDS measurements. ............................................................................ 182
Table 5.2. Electrochemical parameters (onset potential, peak potential, current density,
no of electrons, % HO2-, rate constant k and Tafel slopes-b1 and -b2 of different catalysts
for ORR estimated from CV and RRDE polarization curves in 0.1 m KOH solution. b1
and b2 are calculated at low and high current density region, respectively. All potentials
were measured using Ag/AgCl as the reference electrode. ............................................ 188
Table 5.3. BET analysis summary of different phosphorus doped carbon catalysts. .... 190
Table 6.1. Comparison of various heteroatom-doped porous carbon for its catalytic
efficiency towards selective benzylic alcohol oxidation ................................................ 211
Table 6.2.Calculated atomic % of C, O, P and S from EDS and XPS analysis. ............ 212
xxviii
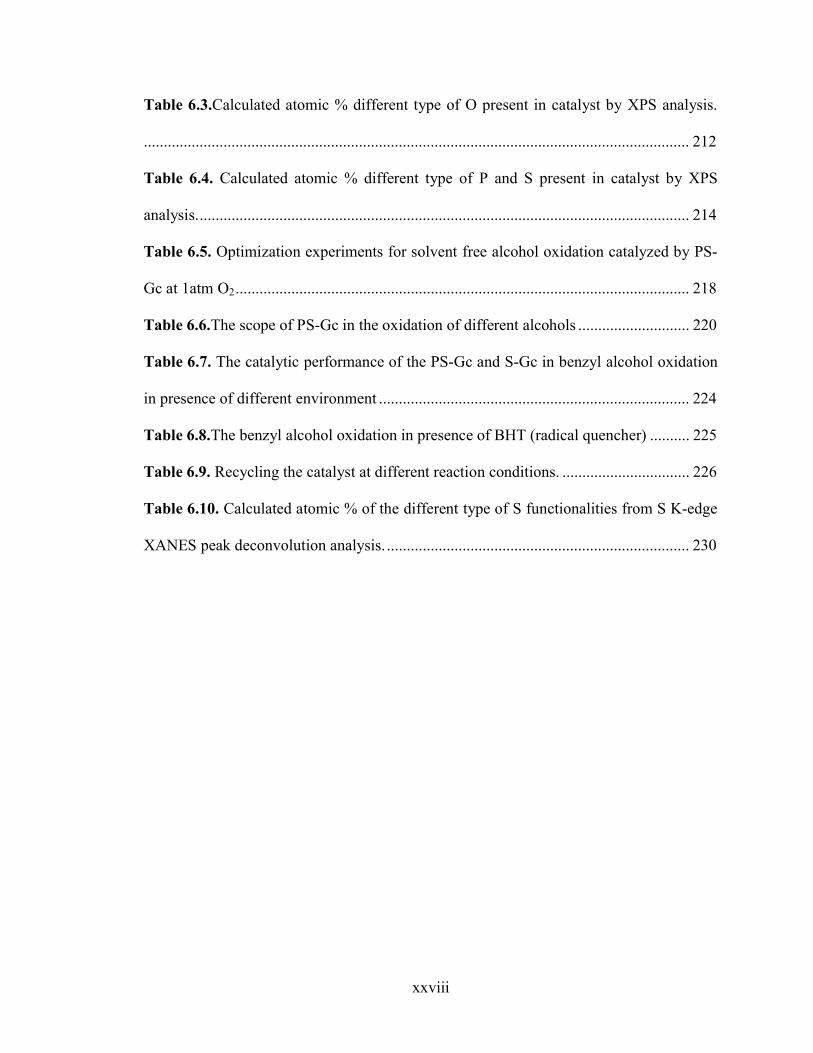
Table 6.3.Calculated atomic % different type of O present in catalyst by XPS analysis.
......................................................................................................................................... 212
Table 6.4. Calculated atomic % different type of P and S present in catalyst by XPS
analysis. ........................................................................................................................... 214
Table 6.5. Optimization experiments for solvent free alcohol oxidation catalyzed by PS-
Gc at 1atm O2 .................................................................................................................. 218
Table 6.6.The scope of PS-Gc in the oxidation of different alcohols ............................ 220
Table 6.7. The catalytic performance of the PS-Gc and S-Gc in benzyl alcohol oxidation
in presence of different environment .............................................................................. 224
Table 6.8.The benzyl alcohol oxidation in presence of BHT (radical quencher) .......... 225
Table 6.9. Recycling the catalyst at different reaction conditions. ................................ 226
Table 6.10. Calculated atomic % of the different type of S functionalities from S K-edge
XANES peak deconvolution analysis. ............................................................................ 230
1
Chapter-1. Introduction
1.1. Graphene: Background and its properties.
1.1.1. Background of graphene.
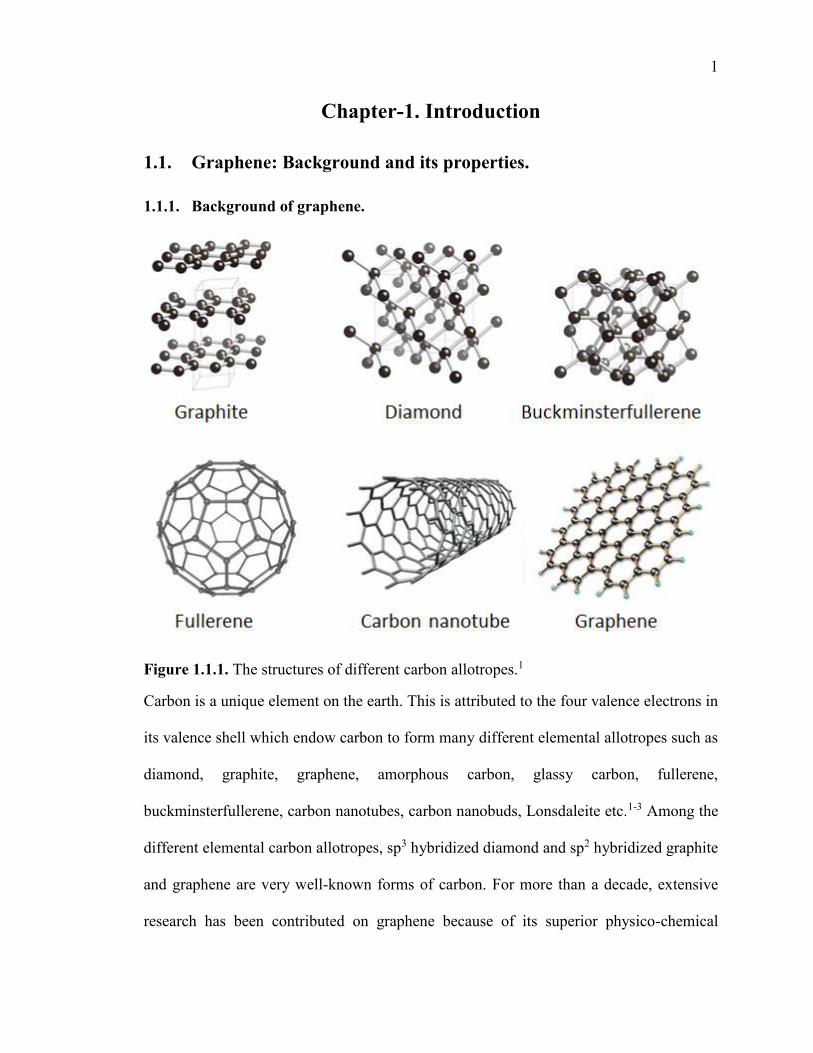
Figure 1.1.1. The structures of different carbon allotropes.1
Carbon is a unique element on the earth. This is attributed to the four valence electrons in
its valence shell which endow carbon to form many different elemental allotropes such as
diamond, graphite, graphene, amorphous carbon, glassy carbon, fullerene,
buckminsterfullerene, carbon nanotubes, carbon nanobuds, Lonsdaleite etc.1-3 Among the
different elemental carbon allotropes, sp3 hybridized diamond and sp2 hybridized graphite
and graphene are very well-known forms of carbon. For more than a decade, extensive
research has been contributed on graphene because of its superior physico-chemical
2
properties. Graphene is a two-dimensional (2D) monolayer sheet consisting of one atom
thick sp2 hybridized carbon atoms arranged in a honeycomb crystal lattice while graphite
is a three-dimensional (3D) crystal made of stacked layers of graphene that interact through
hydrophobic or van der Waals forces (Figure 1.1.1).
1.1.2. The unique properties of graphene.
For an extended period of time, it was believed that this excellent 2D system
(graphene) was thermodynamically unstable and could not exist in free state.4, 5 But, a
groundbreaking experiment in graphene research was achieved in 2004 by Dr. A. Geim
and Dr. K. Novoselov at the University of Manchester, where they discovered that a
monolayer graphene can be isolated from the highly oriented pyrolytic graphite (HOPG)
by mechanical exfoliation using a simple Scotch-tape approach.6 Since then, graphene has
spawned enormous research interest over the past decade due to its many fascinating
physical and chemical properties, which originate from the presence of extensive π-
conjugation in its structure.6, 7 Graphene exhibits many extraordinary physicochemical
properties such as high electric conductivity or charge carrier mobility (theoretically
200,000 cm2 V-1 s-1)3, very large theoretical surface area (2630 m2/g)8, high thermal
conductivity ( ~5000 W/mK)9, 10 and exceptional mechanical strength of 130 GPa (Young’s
modulus ~ 1.0 TPa)11. In addition, graphene also shows excellent stretchability12, 13, optical
transparency (97.7% for single layer graphene below 3 eV light)14 and complete
impermeability to any gases15. Because of these exceptional properties of graphene6, 7, Dr.
A. Geim and Dr. K. Novoselov were awarded a Nobel Prize in Physics in 2010 for their
discovery.
3
The phenomenal properties of graphene offers a vast scope of applications in the
flexible electronic fields such as supercapacitors16, 17, transparent conductors in solar
cells13, 18, 19, organic light emitting diodes (OLEDs)20, touch screens21, field effect
transistors (FETs)22, 23, photodetectors24, 25 etc. Moreover, due to its strong mechanical
properties, chemical inertness and large surface area, graphene can also be used as supports
for catalyst such as metals and metal oxides nanoparticles26 and sensor27 applications. The
above-mentioned properties justify graphene to be the “wonder” or “miracle” material.
The unique properties of graphene, as described above, are not only ideal for
electronics applications but also can be advantageous for other applications such as
biomedical fields, organo, and electrocatalysis.28-30 For example, a high theoretical surface
area (2630 m2/g for single layer graphene), the ease of surface functionalization, chemical
inertness and strong wavelength independent absorption in near infra-red (NIR) properties
of graphene are very important for biomedical applications such as drug/gene carrier,
targeted delivery, photothermal treatment, photodynamic treatment and bio-imaging
applications.28, 29 In addition, the large surface area, great mechanical stability, excellent
electrical and thermal conductivity properties of graphene are also beneficial in the
development of graphene-based catalysts for electrochemical reactions and organic
synthesis.26, 31, 32 Even though graphene shows great potential for the above biomedical and
catalytic applications, pure graphene sheets cannot be used as such for these applications
due to some challenges which needed to be overcome. For example, drug delivery and bio-
imaging applications require uniform nanosized graphene sheets (lateral size 10-50 nm)
with all the intrinsic properties of graphene preserved. Furthermore, the lack of an intrinsic
bandgap near to its Fermi level makes the graphene inert and so largely restricts graphene’s
4
potential in imaging and catalysis fields.7, 26, 28, 32, 33 But, by controlling the morphology
and/or chemical structure of graphene, the physico-chemical properties of graphene can be
tuned, which can help in expanding the potential of graphene in various applications. In
short, the electronic structure of graphene provides both challenges and opportunities for
its potential in catalysis and biomedical field.
In general, the approaches to tune the electronic structures and chemical properties
of graphene can be divided into two categories: 1) Controlling the morphologies of
graphene such as size and shape of the graphene, number of layers, different edges of the
graphene and the presence of vacancy/hole in graphene sheets and 2) Chemical
modification of graphene sheets such as insertion of heteroatoms (N, B, S, P, etc.) into
graphene’s matrix or modification of graphene with different functional groups.31 In the
following sections, the modern development of these approaches will be summarized.
1.2. Graphene with controlled morphology
1.2.1. The importance of controlling the morphology of graphene sheet.
The synthesis of graphene with controlled morphology is one way to satisfy the
need for different applications and thus to expand the graphene’s potential in the different
field. For example, a graphene sheet with larger lateral size (microns to millimeter) is more
suitable for electronics and conductive coating applications, while a nanosized graphene
sheet (10-50 nm lateral size) is important for biomedical applications such as delivery
vehicle for hydrophobic drugs/genes applications.34 Moreover, the chemical and physical
properties of graphene can be tuned by controlling the morphology of graphene such as the
size, shape, thickness or number of layer, edges and presence of vacancies in the graphene
plane. For example, by decreasing the lateral size of graphene to nanometer range (less
5
than 10 nm), the electronic confinement effect occurs and opens the bandgap of graphene.
The bandgap opening effect depends on the lateral size of the graphene sheet (smaller the
size results into larger the bandgap).35, 36 It is also reported that nanosized graphene or
graphene sheets with holes create more edges, which are more reactive for catalytic
applications such as in oxygen reduction reaction in fuel cells.31 Furthermore, the presence
of holes/vacancies induces additional electronic states and affects the electron transfer rate
in graphene.37, 38 Moreover, the electron density of states can be strongly enhanced at the
edges compared to the plane of graphene and so graphene sheets with different edges
(armchair and zigzag edges) (Figure 1.2.1) have different electronic structures.35, 36, 39 The
different types of edges generated by cutting of the graphene, also affects its electronic
structure.40 For example, zigzag edges in graphene sheet give rise to the magnetism and
localized states at the edge site, which is entirely absent in armchair edge and makes
graphene more reactive.41, 42 In addition, the electronic effect of the zigzag edge becomes
more pronounced by decreasing the lateral size of the graphene sheet to a sub-nanometer
range. Thus, by controlling the morphology of graphene, one can tune the properties of
graphene for desired applications.
In this section, we will focus on properties, applications, and synthesis of nanosized
graphene sheets (also known as graphene nanosheets) and holey graphene sheets.
6
Figure 1.2.1. Schematics of graphene structure with highlighting different type of edge and hole defect. Carbon atoms on the edges are highlighted with red color to differentiate it from bulk C atom (gray color).
1.2.2. Properties and application of graphene nanosheets:
Graphene nanosheets or nano-sized graphene derivatives such as graphene oxide or
reduced graphene oxide possess many intrinsic properties of pure graphene, which is
important for various biomedical applications. For example, a very large surface area and
hydrophobic surface of graphene nanosheets offer high loading and delivery of the
aromatic chemotherapy/anti-cancer drug molecules such as doxorubicin43,
camptothecin44 and SN 3845. The surface of graphene nanosheets also provides facile
conjugation/functionalization with various targeting ligands (such as an antibody) via
covalent (using the presence of oxygen functionalities of graphene’s surface) and non-
covalent (using hydrophobic interaction) method for target delivery of the anticancer
drug34, gene44, 46, other macromolecules,28, 29, 47, 48 and even for co-delivering multiple
7
targeting agents/drug molecules for enhanced or synergistic biomedical effects.49 In
addition to that, the drug/gene loaded graphene surface can be further functionalized with
fluorescent dye for tracking the graphene and its uptake at targeting sites by in vivo
fluorescence imaging.50 Another important property of graphene is its intrinsic strong and
wavelength independent near IR (NIR) absorption property, which has been useful in
photothermal treatment of cancer tumors.51-53 The strong NIR absorption properties of
graphene and its hydrophobic surface has also been used for a treatment of cancer by the
synergistic effect of a drug molecule and photothermal therapy.51 In addition, nanosized
graphene or graphene oxide sheet also shows photo-luminescent properties due to the
bandgap opening from size/edge effect or due to the presence of defects,28 thus making
possible applications in biological imaging and image-guided therapy.28 Graphene
nanosheets have also been useful in the detection of small biological molecules, credited
to the intrinsic electronic properties of graphene.29 The graphene’s surface is very sensitive
to foreign molecules, and its electronic structure largely depends on its interaction with
foreign molecules. Based on this principle, it has been used in detection of many biological
substances such as oligonucleotides54, 55, pathogens56, heavy metal ions57, glucose58,
dopamine59, enzymes and proteins47 and many others.29
The advance of graphene in biomedical applications makes it necessary to study its
long-term fate and toxicity in the human body. Many researchers have tried to study the in
vivo toxicity of graphene nanosheets in an animal model and found that the toxicity of
graphene mainly depends on the surface functionalization and lateral size of graphene
sheets.50, 60-62 It was found that functionalization of graphene with biocompatible molecules
or polymers such as polyethyleneimine, polyethylene glycol, chitosan, etc.34 renders it non-
8
toxic. However, graphene sheets with larger lateral sizes (hundreds of nanometers) can
dominantly be accumulated in the lung, resulting in toxic effects after its intravenous
injection into mice/rats.50, 60-62. It was also reported that, if the lateral size of graphene
sheets is well controlled to 10-50 nm, the biocompatibility of graphene sheets was
dramatically improved, and no visible sign of toxic effects were found in cured mice for
40 days.50 Moreover, the radio-isotope labeling of graphene nanosheets shows that the
graphene nanosheets (10 to 50nm) were mainly localized in liver and spleen with negligible
lung accumulation and gradually were excreted from mice within a few months.48, 60
1.2.3. Synthesis of graphene nanosheets.
In past decade, a tremendous amount of effort has been devoted to developing a
straightforward and cheap approach for the large-scale synthesis of graphene nanosheets
for biomedical applications. Graphene nanosheets can be synthesized by two general
methods, bottom-up approach and top-down approach. In bottom-up approach, graphene
nanosheet is synthesized from small carbon molecules (such as methane) by chemical
vapor deposition (CVD) or organic chemical synthesis.63-66 The bottom-up approach gives
precise control on the lateral size of graphene but leads to difficulties in scaling up the
graphene nanosheets synthesis due to complex handling and high-cost issues. In the top-
down approach, firstly, the graphite particles are exfoliated into graphene sheets by
mechanical or chemical approaches.66 Among them, a chemical approach, especially
Hummers or modified Hummers approach, is the most obvious way to exfoliate the
graphite particles into graphene oxide in bulk quantity.67 In the Hummers or modified
Hummers method, the oxidization of graphite powder is performed using the strong oxidant
(KMnO4 + NaNO3 in H2SO4), which results into heavily oxidized graphene sheets termed
9
as graphene oxide (GO).67 This oxidation reaction is a lengthy process (from hours to
several days) and the aggressive oxidation chemistry also leads to uncontrollable cutting
of graphene sheets into small pieces of different sizes and shapes with extensive defects.68,
69 To reach predefined nanometer-sized GO sheets, an extended oxidation and sonication70
or other simultaneous oxidative cutting reactions are required.71, 72 Alternatively, nanosized
GO sheets can also be synthesized using precursors which are already small in lateral sizes
such as graphite nanofibers or carbon fibers.73, 74 Most importantly, in GO, most of the
exotic properties of graphene have vanished due to the high density of oxygen-containing
groups that heavily distort and break up the -conjugated structure. The π-conjugated
structure of graphene can be partially recovered in GO by reducing the GO sheets via
chemical, electrochemical, or hydrothermal methods.75-80
In Hummers’ method, both KMnO4 and NO2+ (nitronium ions) in concentrated
H2SO4 solutions act as oxidants via different oxidation mechanisms. From both
experimental observations and theoretical calculations, it appears that KMnO4 plays a
major role in the observed oxidative cutting and unzipping processes. In Chapter-2, we
find that by intentionally excluding KMnO4 and exploiting pure nitronium ion oxidation,
aided by the unique thermal and kinetic effects induced by microwave heating, graphite
particles can be transformed into graphene nanosheets with their -conjugated aromatic
structures and properties largely retained. Unlike GO, the as-fabricated graphene
nanosheets exhibit strong absorption in the visible and near-infrared (NIR) regions, which
is nearly wavelength independent. This optical property is typical for intrinsic graphene
sheets. Moreover, for the first time, we demonstrated that strong photoacoustic signals can
be generated from these graphene nanosheets with NIR excitation. The photo-to-acoustic
10
conversion is weakly dependent on the wavelength of the NIR excitation, which is different
from all other NIR photoacoustic contrast agents previously reported. This work has been
published in ACS Nano journal (ACS Nano 7.9 (2013): 8147-8157) under the title, “Direct
production of graphene nanosheets for near infrared photoacoustic imaging”.
1.2.4. Properties and application of porous/holey graphene.
Figure 1.2.2. A) AFM image of holey graphene sheets81 B) SEM image of Crumpled graphene sheet82 C) is a digital photograph and D) SEM image of graphene foam.83
The high surface area of graphene along with its intrinsic properties is a very critical
factor for ion/electron/molecule transportation and to make electrochemical devices with
optimum performance such as supercapacitors with high energy and power density.
However, due to strong π – π interaction or hydrophobic interaction and van der Waals
11
interaction between the graphene sheets, it forms irreversible graphite-like agglomerates.84
This results in drastic decrease in the surface area of graphene and limits the cross-plane
ion diffusion or mass transport of reactants or ions. So, to fully utilize the unique properties
of graphene, the morphology of graphene must be tuned such that a high surface area of
graphene can be readily accessible without destroying its inherent properties.
Recently, porous graphene materials such as holey graphene or graphene nanomesh
(graphene sheets with holes in its basal plane), crumpled graphene (bent or folded graphene
sheet) and graphene foam have attracted tremendous research interest due to their high
surface area and the presence of porous structure with inherent properties of graphene.84
Depending on the size of the pore/hole, these porous materials can be microporous (pore
size < 2 nm), mesoporous (2 - 50 nm), and/or macroporous (pore size > 50 nm).84, 85 The
presence of macroporous structure in crumpled graphene and graphene foam makes it very
difficult to gain control of its pore size and volume. Moreover, because of the microporous
structure, the surface area of crumpled graphene and graphene foam cannot be achieved
near to the theoretical surface area of graphene.84 However, the holey graphene (or
sometimes called graphene nanomesh) can have microporous or mesoporous structure
depending on the experimental synthesis technique.84 The presence of porous structure in
the graphene sheets not only provides improved transportation of electrolytes and ions but
also drastically improves its dispersibility in many solvents.84 Because of these unique
advantages of holey graphene compared to original graphene sheet, it has dramatically
enhanced the performance of electronic and energy storage devices.84, 85 For example, Dr.
Ruoff demonstrated that by using the holey graphene for a supercapacitor, they can achieve
ultra-high energy density (70 W.h.kg-1), power density (250 kW. kg-1) and specific
12
capacitance to 166 F/g at 5.7 A/g current density).86 At the same time, Wang et al. reported
that by using a porous structure of graphene as an electrode for the lithium-ion battery, it
can deliver 116 kW.kg-1 power density and 322 W.h.kg-1 energy density.87 Other than its
application in energy-related application, the presence of holes/pore in the graphene sheet
also opens up graphene’s potential in new fields such as gas storage applications88, gas
separation (such as H289, He90, N2
91, NO92, CO293 and CH4
94), electrochemical sensors95,
high oil absorption96, catalyst support8, 97, 98 and others.84
1.2.5. Synthesis of holey graphene sheets.
Many reports were published to synthesize holey graphene and are summarized in
Table 1.2.1. These synthetic approaches can be divided into two main categories 1)
bottom-up approach and 2) top-down approach.
In bottom-up approach, holey graphene sheets are synthesized from small organic
molecules, serving as a carbon source and can be grown on the catalytic template/substrate
at a high temperature in the presence of inert environment.84 The bottom-up approach gives
better control on pore size and pore structure by selecting either specific molecule for
graphene precursor or catalyst substrate or by process parameters. For instance, Bieri et al.
have shown that the holey graphene sheet can be synthesized by aryl- aryl coupling of the
hexa-iodo-substituted macrocycle cyclohexa-m-phenylene (CHP) molecules in the
presence of a silver (Ag) crystal and the hole size can be controlled by the molecular design
of the aryl molecule.99 At the same time, Ning et al. have shown that the holey graphene
can be synthesized by growing the graphene on porous MgO template by chemical vapor
deposition (CVD) technique and the hole size can be control by selecting the MgO template
of varying pore size/structure.100 The surface area and the pore volume of the holey
13
graphene, synthesized by the bottom-up approach, can go up to 3300 m2/g and ~2.4
cm3/g.101 Other reports are summarized in the Table 1.2.1. Even though these bottom-up
approaches gives better control on pore size and structure, it suffers from several
disadvantages such as high energy and inert atmosphere requirement, toxic
chemicals/precursors, high cost and low production yield.
Recently, many reports have been published to synthesize the holey graphene sheet
in a scalable amount from the top-down approach using graphene, graphene oxide (GO) or
reduced graphene oxide (rGO) as a starting material. In this method, the holey graphene is
synthesized via oxidation or degradation of defects, present on graphene sheets, by using
the metal particles102, chemicals86, 103-105, enzymes106, photon81, electron beam107 or oxygen
plasma108 and other porous template87 based etching methods. In the above-listed methods,
photo-, electron beam- and plasma etching approaches are environment-friendly because
they do not require any toxic chemicals. However, these approaches suffer from a
limitation on large scale synthesis, high cost, uncontrollable pore size and its distribution
in the holey graphene. The precise control of the size and shape can be achieved by a
template-based methods. However, the requirement of complex experimental setup and
multiple step procedure impose challenges for the template-based approach. Recently,
chemical based etching of graphene/GO/rGO approaches, which involves KOH or HNO3
activation, are available to synthesize holey graphene in large scale production.
Nevertheless, all these top-down approaches requires either graphene/graphene
oxide/reduced graphene oxide as a precursor, which adds additional steps to synthesize
these precursors for holey graphene fabrication. In summary, these top-down approaches
give ease for the large scale synthesis but also impart several challenges such as multiple
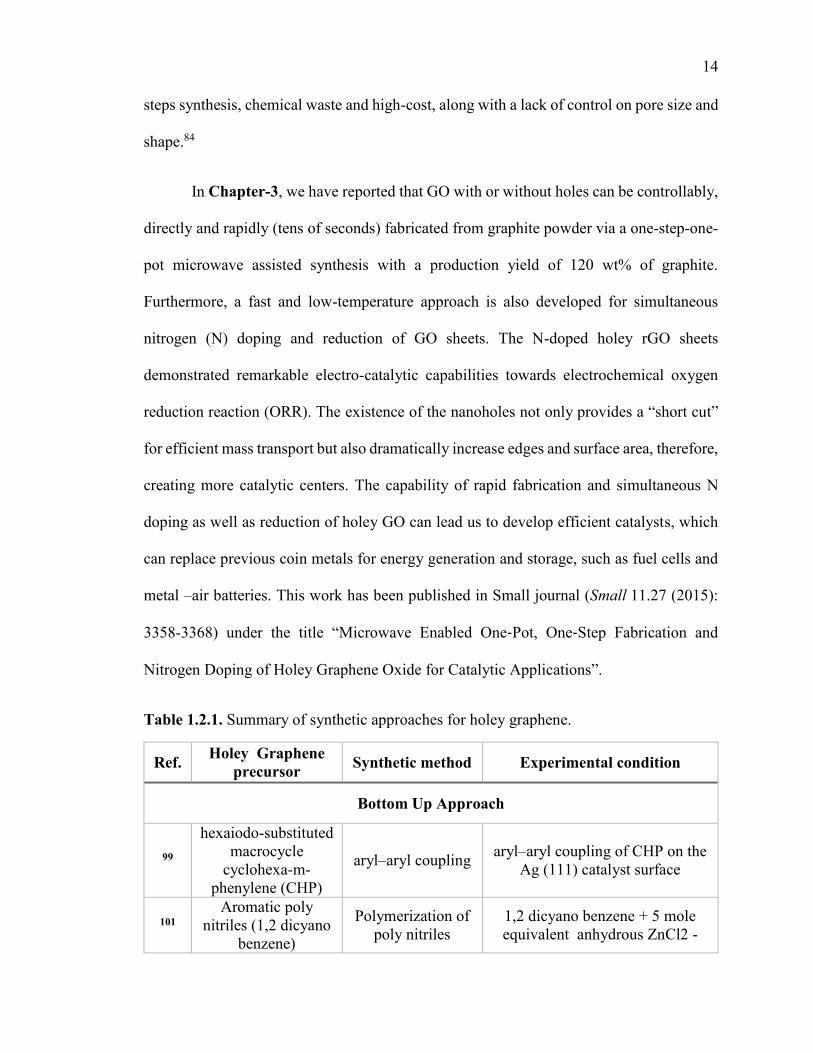
14
steps synthesis, chemical waste and high-cost, along with a lack of control on pore size and
shape.84
In Chapter-3, we have reported that GO with or without holes can be controllably,
directly and rapidly (tens of seconds) fabricated from graphite powder via a one-step-one-
pot microwave assisted synthesis with a production yield of 120 wt% of graphite.
Furthermore, a fast and low-temperature approach is also developed for simultaneous
nitrogen (N) doping and reduction of GO sheets. The N-doped holey rGO sheets
demonstrated remarkable electro-catalytic capabilities towards electrochemical oxygen
reduction reaction (ORR). The existence of the nanoholes not only provides a “short cut”
for efficient mass transport but also dramatically increase edges and surface area, therefore,
creating more catalytic centers. The capability of rapid fabrication and simultaneous N
doping as well as reduction of holey GO can lead us to develop efficient catalysts, which
can replace previous coin metals for energy generation and storage, such as fuel cells and
metal –air batteries. This work has been published in Small journal (Small 11.27 (2015):
3358-3368) under the title “Microwave Enabled One‐Pot, One‐Step Fabrication and
Nitrogen Doping of Holey Graphene Oxide for Catalytic Applications”.
Table 1.2.1. Summary of synthetic approaches for holey graphene.
Ref. Holey Graphene
precursor Synthetic method Experimental condition
Bottom Up Approach
99
hexaiodo-substituted macrocycle
cyclohexa-m-phenylene (CHP)
aryl–aryl coupling aryl–aryl coupling of CHP on the
Ag (111) catalyst surface
101
Aromatic poly nitriles (1,2 dicyano
benzene)
Polymerization of poly nitriles
1,2 dicyano benzene + 5 mole equivalent anhydrous ZnCl2 -
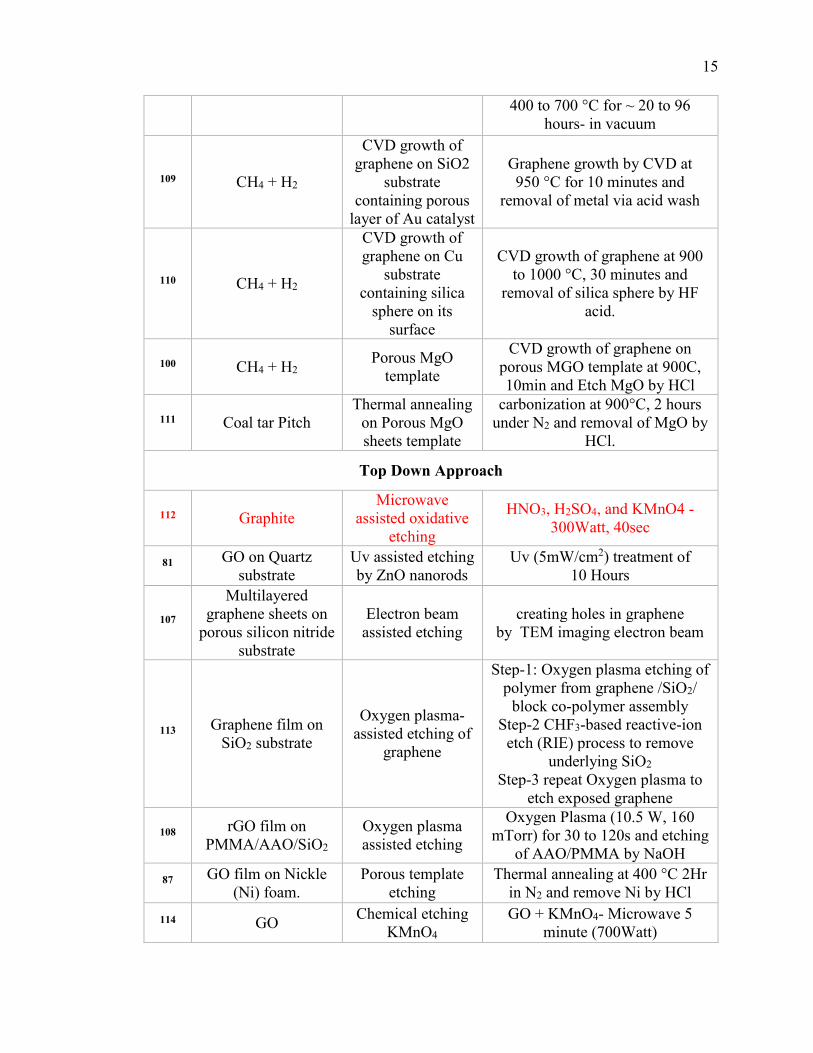
15
400 to 700 °C for ~ 20 to 96 hours- in vacuum
109 CH4 + H2
CVD growth of graphene on SiO2
substrate containing porous
layer of Au catalyst
Graphene growth by CVD at 950 °C for 10 minutes and
removal of metal via acid wash
110 CH4 + H2
CVD growth of graphene on Cu
substrate containing silica
sphere on its surface
CVD growth of graphene at 900 to 1000 °C, 30 minutes and
removal of silica sphere by HF acid.
100 CH4 + H2 Porous MgO
template
CVD growth of graphene on porous MGO template at 900C, 10min and Etch MgO by HCl
111 Coal tar Pitch Thermal annealing
on Porous MgO sheets template
carbonization at 900°C, 2 hours under N2 and removal of MgO by
HCl.
Top Down Approach
112 Graphite Microwave
assisted oxidative etching
HNO3, H2SO4, and KMnO4 -300Watt, 40sec
81 GO on Quartz
substrate Uv assisted etching by ZnO nanorods
Uv (5mW/cm2) treatment of 10 Hours
107
Multilayered graphene sheets on
porous silicon nitride substrate
Electron beam assisted etching
creating holes in graphene by TEM imaging electron beam
113 Graphene film on
SiO2 substrate
Oxygen plasma-assisted etching of
graphene
Step-1: Oxygen plasma etching of polymer from graphene /SiO2/
block co-polymer assembly Step-2 CHF3-based reactive-ion
etch (RIE) process to remove underlying SiO2
Step-3 repeat Oxygen plasma to etch exposed graphene
108 rGO film on
PMMA/AAO/SiO2 Oxygen plasma assisted etching
Oxygen Plasma (10.5 W, 160 mTorr) for 30 to 120s and etching
of AAO/PMMA by NaOH
87 GO film on Nickle
(Ni) foam. Porous template
etching Thermal annealing at 400 °C 2Hr
in N2 and remove Ni by HCl
114 GO Chemical etching
KMnO4 GO + KMnO4- Microwave 5
minute (700Watt)
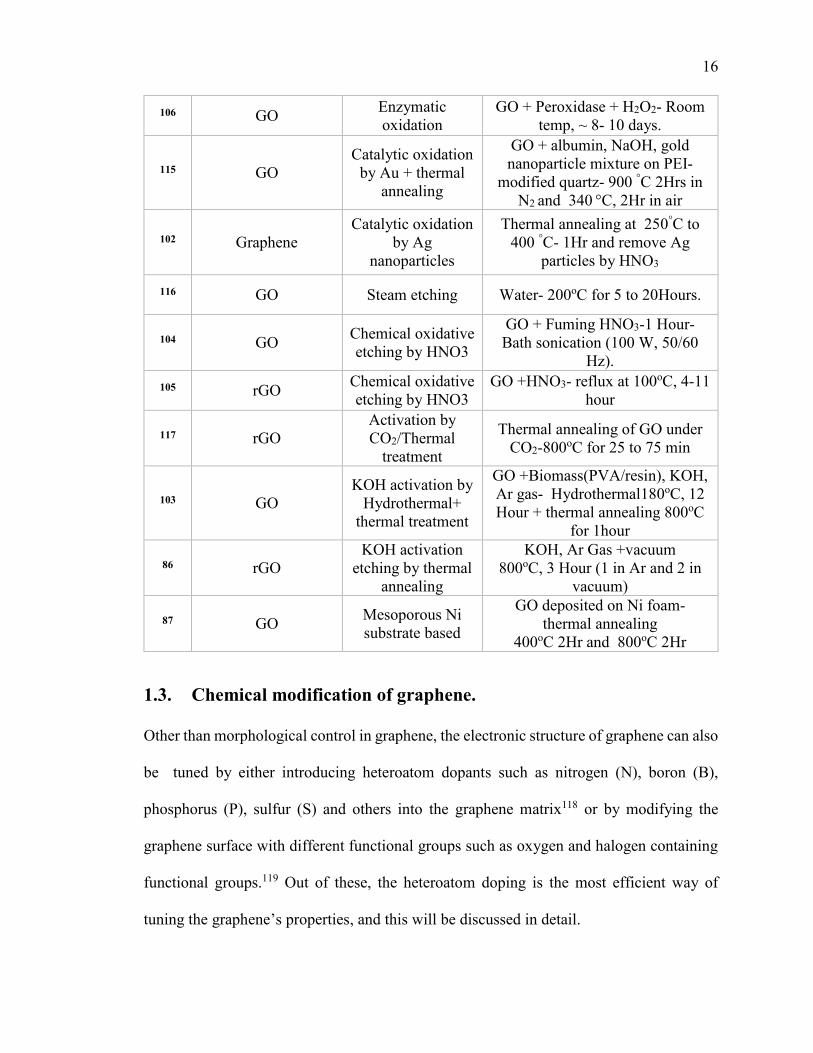
16
106 GO Enzymatic oxidation
GO + Peroxidase + H2O2- Room temp, ~ 8- 10 days.
115 GO Catalytic oxidation
by Au + thermal annealing
GO + albumin, NaOH, gold nanoparticle mixture on PEI-
modified quartz- 900 °C 2Hrs in N2 and 340 °C, 2Hr in air
102 Graphene Catalytic oxidation
by Ag nanoparticles
Thermal annealing at 250°C to 400 °C- 1Hr and remove Ag
particles by HNO3
116 GO Steam etching Water- 200oC for 5 to 20Hours.
104 GO Chemical oxidative etching by HNO3
GO + Fuming HNO3-1 Hour- Bath sonication (100 W, 50/60
Hz).
105 rGO Chemical oxidative etching by HNO3
GO +HNO3- reflux at 100oC, 4-11 hour
117 rGO Activation by CO2/Thermal
treatment
Thermal annealing of GO under CO2-800oC for 25 to 75 min
103 GO KOH activation by
Hydrothermal+ thermal treatment
GO +Biomass(PVA/resin), KOH, Ar gas- Hydrothermal180oC, 12 Hour + thermal annealing 800oC
for 1hour
86 rGO KOH activation
etching by thermal annealing
KOH, Ar Gas +vacuum 800oC, 3 Hour (1 in Ar and 2 in
vacuum)
87 GO Mesoporous Ni substrate based
GO deposited on Ni foam- thermal annealing
400oC 2Hr and 800oC 2Hr
1.3. Chemical modification of graphene.
Other than morphological control in graphene, the electronic structure of graphene can also
be tuned by either introducing heteroatom dopants such as nitrogen (N), boron (B),
phosphorus (P), sulfur (S) and others into the graphene matrix118 or by modifying the
graphene surface with different functional groups such as oxygen and halogen containing
functional groups.119 Out of these, the heteroatom doping is the most efficient way of
tuning the graphene’s properties, and this will be discussed in detail.
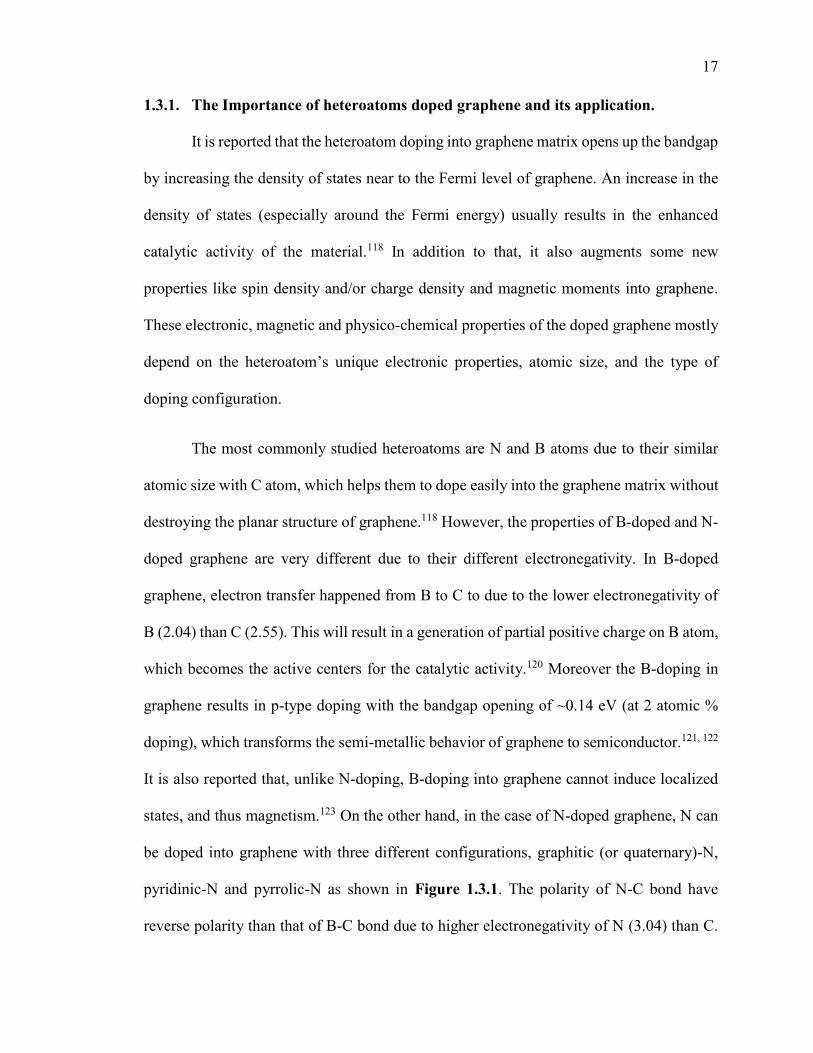
17
1.3.1. The Importance of heteroatoms doped graphene and its application.
It is reported that the heteroatom doping into graphene matrix opens up the bandgap
by increasing the density of states near to the Fermi level of graphene. An increase in the
density of states (especially around the Fermi energy) usually results in the enhanced
catalytic activity of the material.118 In addition to that, it also augments some new
properties like spin density and/or charge density and magnetic moments into graphene.
These electronic, magnetic and physico-chemical properties of the doped graphene mostly
depend on the heteroatom’s unique electronic properties, atomic size, and the type of
doping configuration.
The most commonly studied heteroatoms are N and B atoms due to their similar
atomic size with C atom, which helps them to dope easily into the graphene matrix without
destroying the planar structure of graphene.118 However, the properties of B-doped and N-
doped graphene are very different due to their different electronegativity. In B-doped
graphene, electron transfer happened from B to C to due to the lower electronegativity of
B (2.04) than C (2.55). This will result in a generation of partial positive charge on B atom,
which becomes the active centers for the catalytic activity.120 Moreover the B-doping in
graphene results in p-type doping with the bandgap opening of ~0.14 eV (at 2 atomic %
doping), which transforms the semi-metallic behavior of graphene to semiconductor.121, 122
It is also reported that, unlike N-doping, B-doping into graphene cannot induce localized
states, and thus magnetism.123 On the other hand, in the case of N-doped graphene, N can
be doped into graphene with three different configurations, graphitic (or quaternary)-N,
pyridinic-N and pyrrolic-N as shown in Figure 1.3.1. The polarity of N-C bond have
reverse polarity than that of B-C bond due to higher electronegativity of N (3.04) than C.
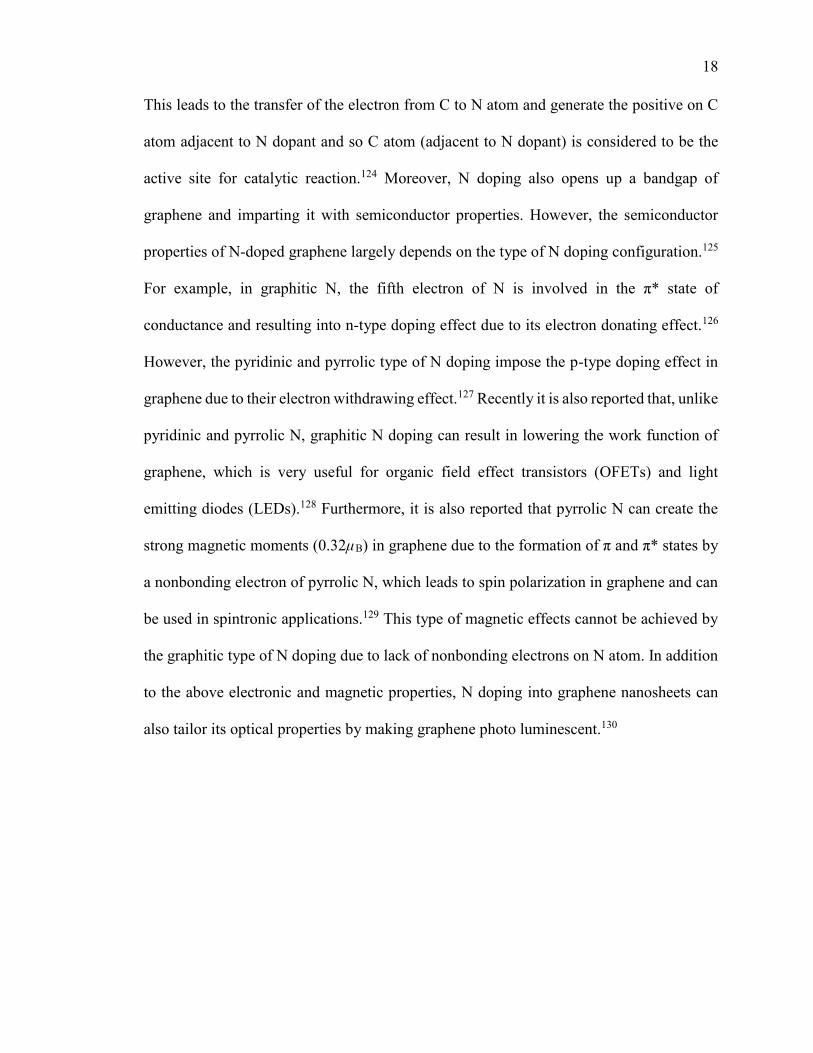
18
This leads to the transfer of the electron from C to N atom and generate the positive on C
atom adjacent to N dopant and so C atom (adjacent to N dopant) is considered to be the
active site for catalytic reaction.124 Moreover, N doping also opens up a bandgap of
graphene and imparting it with semiconductor properties. However, the semiconductor
properties of N-doped graphene largely depends on the type of N doping configuration.125
For example, in graphitic N, the fifth electron of N is involved in the π* state of
conductance and resulting into n-type doping effect due to its electron donating effect.126
However, the pyridinic and pyrrolic type of N doping impose the p-type doping effect in
graphene due to their electron withdrawing effect.127 Recently it is also reported that, unlike
pyridinic and pyrrolic N, graphitic N doping can result in lowering the work function of
graphene, which is very useful for organic field effect transistors (OFETs) and light
emitting diodes (LEDs).128 Furthermore, it is also reported that pyrrolic N can create the
strong magnetic moments (0.32µB) in graphene due to the formation of π and π* states by
a nonbonding electron of pyrrolic N, which leads to spin polarization in graphene and can
be used in spintronic applications.129 This type of magnetic effects cannot be achieved by
the graphitic type of N doping due to lack of nonbonding electrons on N atom. In addition
to the above electronic and magnetic properties, N doping into graphene nanosheets can
also tailor its optical properties by making graphene photo luminescent.130
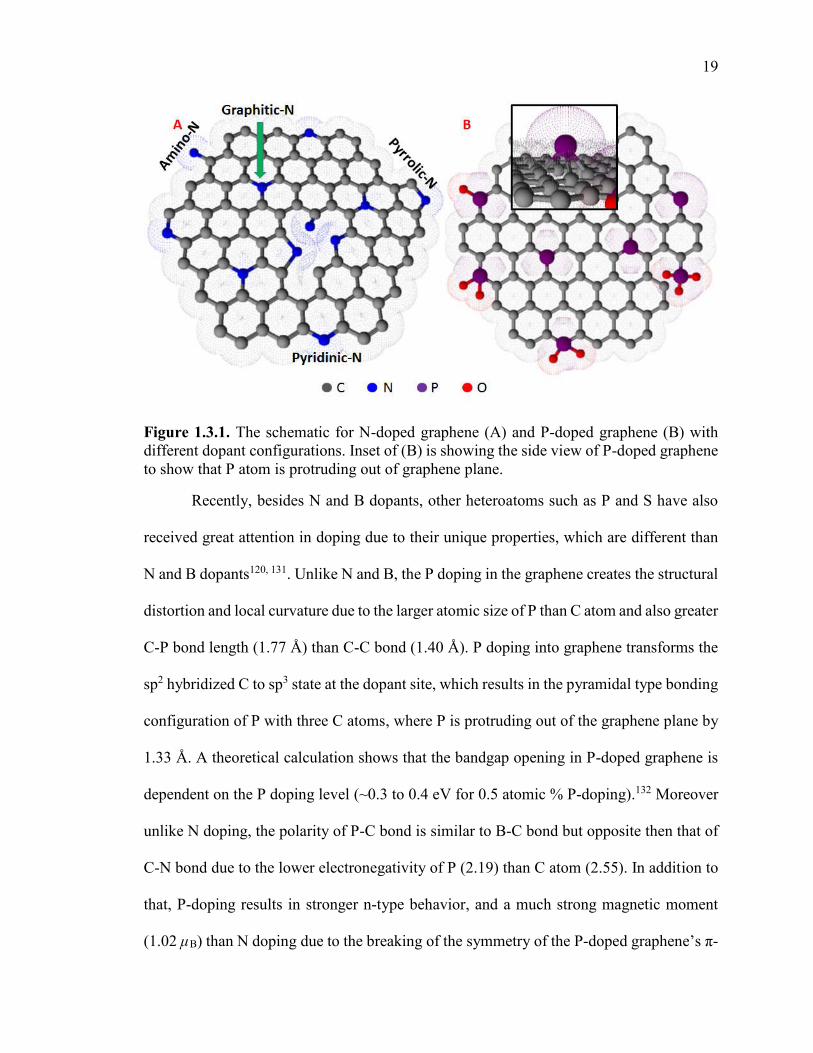
19
Figure 1.3.1. The schematic for N-doped graphene (A) and P-doped graphene (B) with different dopant configurations. Inset of (B) is showing the side view of P-doped graphene to show that P atom is protruding out of graphene plane.
Recently, besides N and B dopants, other heteroatoms such as P and S have also
received great attention in doping due to their unique properties, which are different than
N and B dopants120, 131. Unlike N and B, the P doping in the graphene creates the structural
distortion and local curvature due to the larger atomic size of P than C atom and also greater
C-P bond length (1.77 Å) than C-C bond (1.40 Å). P doping into graphene transforms the
sp2 hybridized C to sp3 state at the dopant site, which results in the pyramidal type bonding
configuration of P with three C atoms, where P is protruding out of the graphene plane by
1.33 Å. A theoretical calculation shows that the bandgap opening in P-doped graphene is
dependent on the P doping level (~0.3 to 0.4 eV for 0.5 atomic % P-doping).132 Moreover
unlike N doping, the polarity of P-C bond is similar to B-C bond but opposite then that of
C-N bond due to the lower electronegativity of P (2.19) than C atom (2.55). In addition to
that, P-doping results in stronger n-type behavior, and a much strong magnetic moment
(1.02 µB) than N doping due to the breaking of the symmetry of the P-doped graphene’s π-
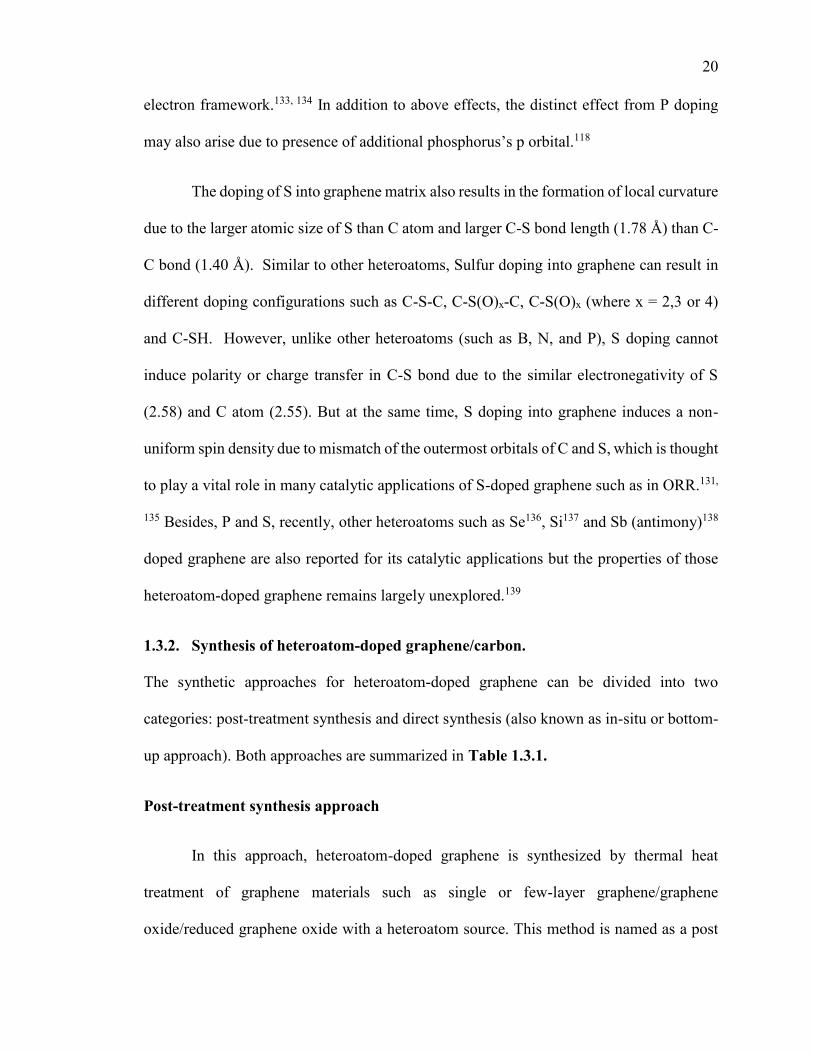
20
electron framework.133, 134 In addition to above effects, the distinct effect from P doping
may also arise due to presence of additional phosphorus’s p orbital.118
The doping of S into graphene matrix also results in the formation of local curvature
due to the larger atomic size of S than C atom and larger C-S bond length (1.78 Å) than C-
C bond (1.40 Å). Similar to other heteroatoms, Sulfur doping into graphene can result in
different doping configurations such as C-S-C, C-S(O)x-C, C-S(O)x (where x = 2,3 or 4)
and C-SH. However, unlike other heteroatoms (such as B, N, and P), S doping cannot
induce polarity or charge transfer in C-S bond due to the similar electronegativity of S
(2.58) and C atom (2.55). But at the same time, S doping into graphene induces a non-
uniform spin density due to mismatch of the outermost orbitals of C and S, which is thought
to play a vital role in many catalytic applications of S-doped graphene such as in ORR.131,
135 Besides, P and S, recently, other heteroatoms such as Se136, Si137 and Sb (antimony)138
doped graphene are also reported for its catalytic applications but the properties of those
heteroatom-doped graphene remains largely unexplored.139
1.3.2. Synthesis of heteroatom-doped graphene/carbon.
The synthetic approaches for heteroatom-doped graphene can be divided into two
categories: post-treatment synthesis and direct synthesis (also known as in-situ or bottom-
up approach). Both approaches are summarized in Table 1.3.1.
Post-treatment synthesis approach
In this approach, heteroatom-doped graphene is synthesized by thermal heat
treatment of graphene materials such as single or few-layer graphene/graphene
oxide/reduced graphene oxide with a heteroatom source. This method is named as a post
21
treatment synthesis approach because the carbon source needs to be synthesized in the first
step and then used for the synthesis of heteroatom-doped graphene. It is reported that the
presence of defects and oxygen functionality in the carbon source is playing a major role
in doping of the heteroatom into graphene. As a result, the heteroatom doping content is
low if the graphene or graphite, which have fewer defects and oxygen functionalities, is
used as a carbon source.30 Apart from graphene, graphene oxide is the most widely used
precursor of carbon due to the presence of abundant oxygen functionalities and defects
which help in the heteroatom doping in an efficient way. The control of doping level and
doping configuration of heteroatom dopant in the graphene plane can be controled by
varying different precursors, thermal annealing temperature and time, and the mass ratio
of graphene oxide with heteroatom precursor.30 For example, it is reported that by heating
GO with melamine, ~10 atomic % N can be doped in N-doped graphene.140 But by using
ammonia as a N precursor, N-doping content is decreased to 5 atomic %.141 For sulfur
doped graphene synthesis, a mixture of graphene oxide and benzyl disulfide (BDS) is
thermally annealed at high temperature under argon environment.131 The thermal annealing
not only helps in heteroatom doping into graphene structure but also helps in reducing the
graphene oxide (due to the high annealing temperature ~ 700 to 1000 °C) to restore the
intrinsic properties of graphene partially in the heteroatom-doped graphene. Other than
thermal annealing, plasma treatment has also been used to synthesize heteroatom-doped
graphene such as N-doped graphene by treating GO/graphene with nitrogen plasma or NH3
plasma. In this approach, even by using graphene as a carbon source, it results in high
atomic heteroatom doping (such as 8.5 atomic % N142) because plasma treatment not only
helps into N doping but also create the defects and oxygen functionalities into graphene.143
22
Recently, the use of strong reducing agents such as N2H4 has been used as a doping agent
for the synthesis of N-doped graphene at relatively low temperature (80 to 160 °C).144 The
post treatment approach often results into agglomeration or restacking of graphene sheets
and thus decreases the specific surface area of the resultant heteroatom-doped graphene
due to the reduction of graphene sheet at high temperature.145 This problem can be solved
by using holey GO as the starting graphene source in heteroatom-doped graphene due to
its unique advantages as described in holey graphene section.
Direct Synthesis Approach
The direct synthesis approach is a type of bottom-up approach where small
molecules of carbon source and heteroatom source are mixed and heated together at high
temperature by different heating approaches such as chemical vapor deposition (CVD),
solvothermal approach, arc discharge approach and microwave approach. In CVD
approach, a carbon and heteroatom precursor (usually gas form) are heated at high
temperature in the presence of a metal substrate, typically Cu or Ni146, 147 in the inert
environment. The CVD method usually results in single or few layer of heteroatom-doped
graphene. Moreover, in CVD approach, the heteroatom doping level can be adjusted by
controlling the flow rate of heteroatom precursor gas or pre-set ratio of carbon and
heteroatom source. While the doping configuration of heteroatom can be controlled by
varying the growth temperature and/or by changing the carbon/heteroatom source and/or
even by selecting appropriate metal substrate.30 For example, It has been reported that by
heating the CH4/NH3 (1:1) precursor on Cu substrate yields N-doped graphene with mainly
graphitic N doping type, while on Ni substrate, pyridinic and pyrrolic type of N doping
become prominent.147 At the same time it is also reported that by changing the C source to
23
C2H4 while keeping Cu as the catalyst, pyridinic-N becomes more prominent.148 Even
though, this CVD approach mostly results in high quality of graphene, the complex
operational procedure, the requirement of an inert environment, use of toxic chemicals
along with high energy demand makes this approach non-scalable, time-consuming and
costly, and hence makes this approach not suitable to synthesize cheap carbon-based
catalysts for catalytic applications. Other than CVD approach, segregation growth
approach and Arc discharge approach are also reported but face similar problems as CVD
approach. Recently, gram scale synthesis of heteroatom-doped graphene is reported by the
solvothermal approach. For example, N-doped graphene can be synthesized by heating a
mixture of lithium nitride with tetrachloromethane at 300 °C.149 However, it is still in
development phase and also requires relatively high temperature and pressure for synthesis,
which raises concern for safety and cost of the catalyst. To solve the above problems,
recently, heating the biomass molecules (such as glucose, fructose, alginate and tannic
acid) with a heteroatom source by thermal annealing are reported.150-152 These methods
result in the fabrication of heteroatom-doped porous graphene-like carbon materials. These
materials are catalytically active due to the presence of graphene-like domains along with
heteroatom doping. In addition, the porous structure of this heteroatom-doped carbon
material can provide a larger surface area, easy access to the active sites and better mass
transport for catalytic applications. Even though these porous heteroatom-doped carbon
materials are synthesized from cheap biomass, it still requires very long synthesis time
(hours), inert environment and high temperature to afford stable materials with the desired
performance. This phenomenon deviates from the original concept of energy saving and
sustainability. To avoid the problems mentioned above, recently, the use of microwave
24
(MW) heating instead of traditional annealing is reported to synthesize heteroatom-doped
porous carbon materials rapidly. However, in these reported approaches, either pre-heating
of the reaction mixture (carbon source and heteroatom source) by thermal treatment or
addition of MW absorbing materials (such as mineral oxides or polyphosphoric acid) is
required because of weak MW absorbing capacity of the biomass molecules.153-155
However, these microwave-absorbing materials may introduce unintentional
contaminations to the obtained carbon materials, which is not desirable for catalytic
applications in organic synthesis. Therefore, choosing the right microwave-adsorbing
biomass material is important to avoid this problem.
In chapter-4, an incredibly simple and rapid (40 seconds) microwave-assisted
carbonization approach is reported to directly synthesize gram quantities of P-doped
graphitic porous carbon materials from the anti-nutrient compound, phytic acid. Phytic acid
strongly absorbs microwave energy and hence the as-purchased phytic acid solution can
be directly used for the fabrication of P-doped graphitic carbon product (PGc) with
microwave energy without the requirement of preheating, drying treatment and without
adding additional microwave absorber. Moreover, by just changing the microwave
irradiation time, PGc with different P bond configurations were fabricated, as determined
by combined FTIR and X-ray photoelectron spectroscopy (XPS). Using microwave
heating instead of traditional heating ensures that this approach is both sustainable and
energy efficient. Furthermore, the fabrication can be performed under ambient conditions
without the requirements of an inert environment, which makes this approach, even more,
cost efficient and convenient.
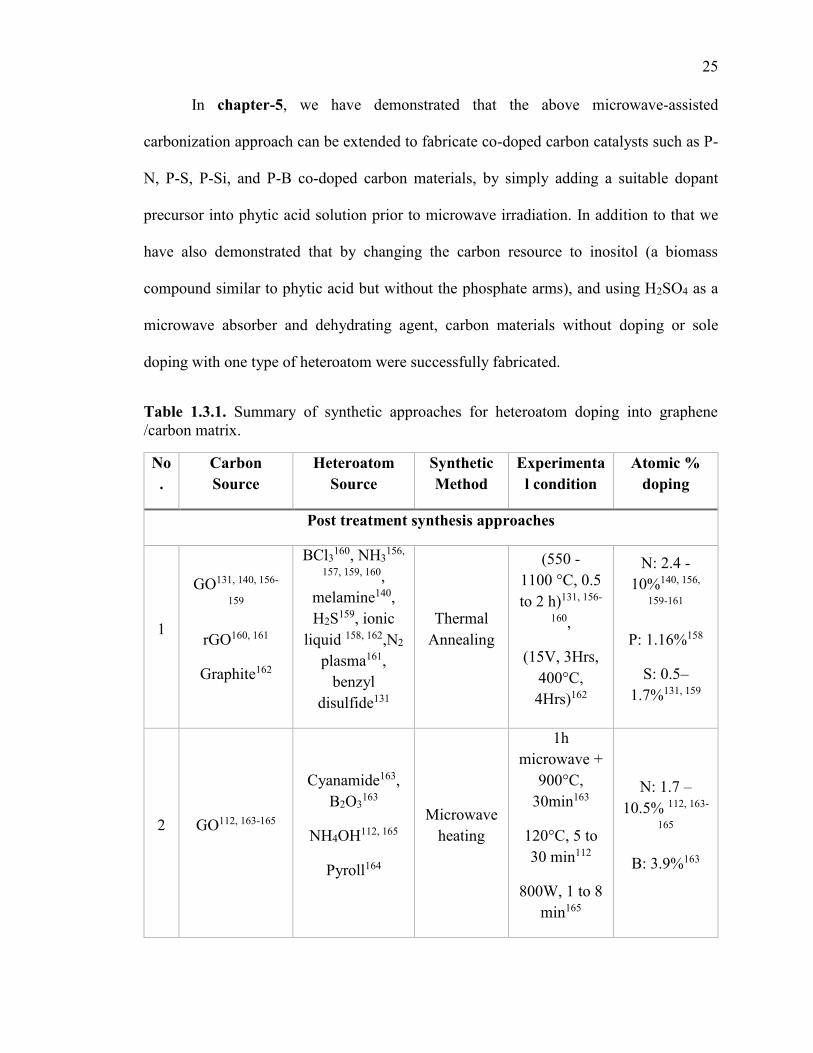
25
In chapter-5, we have demonstrated that the above microwave-assisted
carbonization approach can be extended to fabricate co-doped carbon catalysts such as P-
N, P-S, P-Si, and P-B co-doped carbon materials, by simply adding a suitable dopant
precursor into phytic acid solution prior to microwave irradiation. In addition to that we
have also demonstrated that by changing the carbon resource to inositol (a biomass
compound similar to phytic acid but without the phosphate arms), and using H2SO4 as a
microwave absorber and dehydrating agent, carbon materials without doping or sole
doping with one type of heteroatom were successfully fabricated.
Table 1.3.1. Summary of synthetic approaches for heteroatom doping into graphene /carbon matrix.
No
.
Carbon
Source
Heteroatom
Source
Synthetic
Method
Experimenta
l condition
Atomic %
doping
Post treatment synthesis approaches
1
GO131, 140, 156-
159
rGO160, 161
Graphite162
BCl3160, NH3
156,
157, 159, 160, melamine140, H2S159, ionic
liquid 158, 162,N2 plasma161,
benzyl disulfide131
Thermal Annealing
(550 - 1100 °C, 0.5 to 2 h)131, 156-
160,
(15V, 3Hrs, 400°C, 4Hrs)162
N: 2.4 - 10%140, 156,
159-161
P: 1.16%158
S: 0.5–1.7%131, 159
2 GO112, 163-165
Cyanamide163, B2O3
163
NH4OH112, 165
Pyroll164
Microwave heating
1h microwave +
900°C, 30min163
120°C, 5 to 30 min112
800W, 1 to 8 min165
N: 1.7 – 10.5% 112, 163-
165
B: 3.9%163
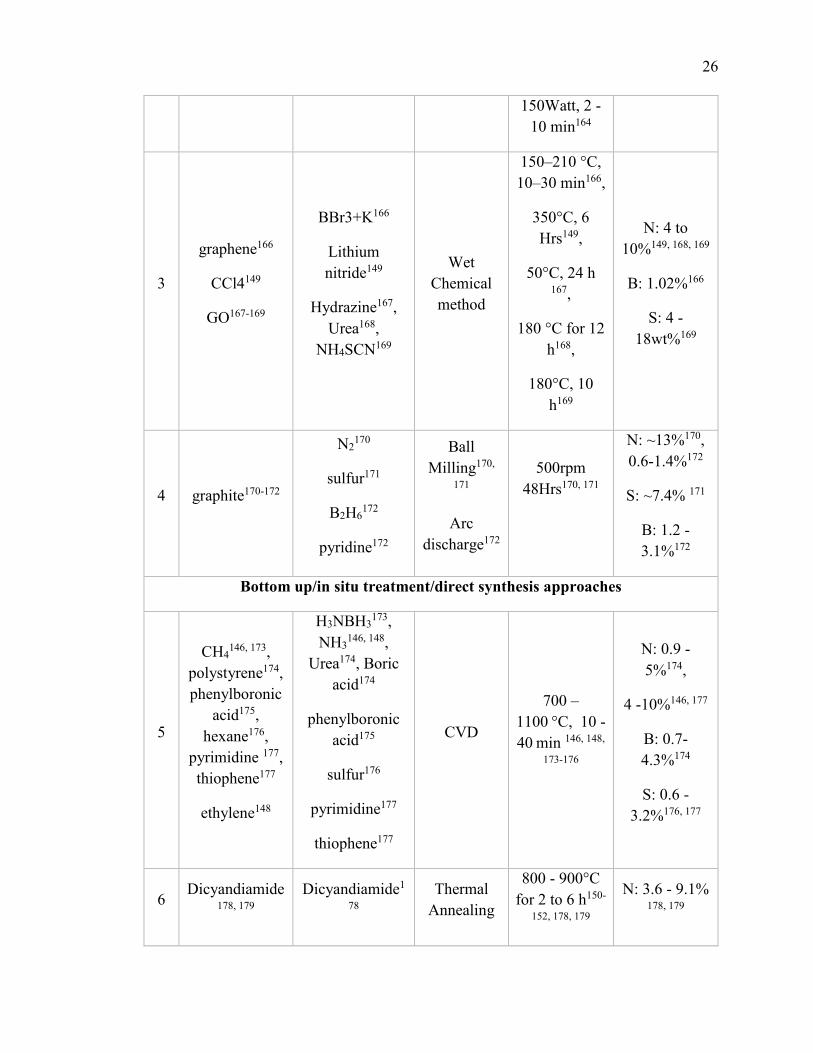
26
150Watt, 2 -10 min164
3
graphene166
CCl4149
GO167-169
BBr3+K166
Lithium nitride149
Hydrazine167, Urea168,
NH4SCN169
Wet Chemical method
150–210 °C, 10–30 min166,
350°C, 6 Hrs149,
50°C, 24 h 167,
180 °C for 12 h168,
180°C, 10 h169
N: 4 to 10%149, 168, 169
B: 1.02%166
S: 4 -18wt%169
4 graphite170-172
N2170
sulfur171
B2H6172
pyridine172
Ball Milling170,
171
Arc discharge172
500rpm 48Hrs170, 171
N: ~13%170, 0.6-1.4%172
S: ~7.4% 171
B: 1.2 -3.1%172
Bottom up/in situ treatment/direct synthesis approaches
5
CH4146, 173,
polystyrene174, phenylboronic
acid175, hexane176,
pyrimidine 177, thiophene177
ethylene148
H3NBH3173,
NH3146, 148,
Urea174, Boric acid174
phenylboronic acid175
sulfur176
pyrimidine177
thiophene177
CVD
700 –1100 °C, 10 -40 min 146, 148,
173-176
N: 0.9 - 5%174,
4 -10%146, 177
B: 0.7- 4.3%174
S: 0.6 - 3.2%176, 177
6 Dicyandiamide
178, 179 Dicyandiamide1
78 Thermal
Annealing
800 - 900°C for 2 to 6 h150-
152, 178, 179
N: 3.6 - 9.1% 178, 179
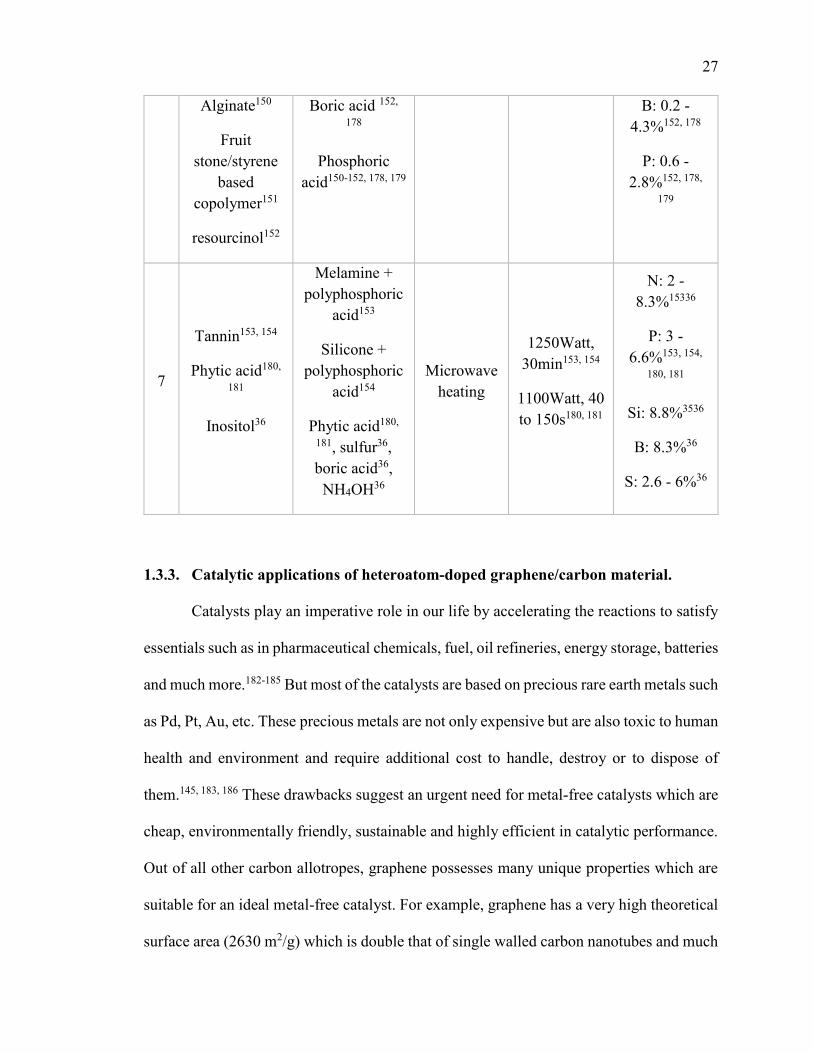
27
Alginate150
Fruit stone/styrene
based copolymer151
resourcinol152
Boric acid 152,
178
Phosphoric acid150-152, 178, 179
B: 0.2 - 4.3%152, 178
P: 0.6 - 2.8%152, 178,
179
7
Tannin153, 154
Phytic acid180,
181
Inositol36
Melamine + polyphosphoric
acid153
Silicone + polyphosphoric
acid154
Phytic acid180,
181, sulfur36, boric acid36, NH4OH36
Microwave heating
1250Watt, 30min153, 154
1100Watt, 40 to 150s180, 181
N: 2 - 8.3%15336
P: 3 - 6.6%153, 154,
180, 181
Si: 8.8%3536
B: 8.3%36
S: 2.6 - 6%36
1.3.3. Catalytic applications of heteroatom-doped graphene/carbon material.
Catalysts play an imperative role in our life by accelerating the reactions to satisfy
essentials such as in pharmaceutical chemicals, fuel, oil refineries, energy storage, batteries
and much more.182-185 But most of the catalysts are based on precious rare earth metals such
as Pd, Pt, Au, etc. These precious metals are not only expensive but are also toxic to human
health and environment and require additional cost to handle, destroy or to dispose of
them.145, 183, 186 These drawbacks suggest an urgent need for metal-free catalysts which are
cheap, environmentally friendly, sustainable and highly efficient in catalytic performance.
Out of all other carbon allotropes, graphene possesses many unique properties which are
suitable for an ideal metal-free catalyst. For example, graphene has a very high theoretical
surface area (2630 m2/g) which is double that of single walled carbon nanotubes and much
28
greater than carbon black and activated carbon.145 Moreover, graphene also has a highly
conjugated structure which can promote the unique substrate-substrate interaction during
catalytic reactions. Another reason is that the structure of graphene and its electronic
properties can be easily tuned based on their specific applications. Moreover, unlike carbon
nanotubes, graphene-based materials have evitable metal impurities and so graphene
purely catalyzes catalytic performance rather than metal contaminants.145 In addition to
that, the superior electronic and thermal conductivity can facilitate the heat and electron
transfer easily on its surface during the catalytic reaction. Last but not least, the strong
mechanical properties, thermal and chemical stability ensure its long lifetime in catalytic
fields. Since the last decade, graphene or chemically modified graphene have shown
promising catalytic performance in the different catalytic applications, which includes
energy-related devices such as fuel cells147, 183, 187-189, solar cells190, water splitting150,
organic synthesis186, photochemical reactions191, electrochemical sensors142, 143, 190, 192-194
and environmental protections. Herein we will mainly focus on catalytic applications in
fuel cell and organic synthesis.
1.3.3.1. Carbon-based Catalysts in Fuel Cells.
A fuel cell is a type of electrochemical energy conversion device that generates the
clean energy by converting the chemical energy from the fuel, where fuel is oxidized at the
anode, and simultaneously oxygen is being reduced at the cathode to generate electricity.195
In the typical fuel cells, hydrogen or methanol, is used as a fuel source and oxygen as an
oxidant. At the anode, a catalyst oxidizes the fuel (usually hydrogen or methanol) to a
positively charged proton/ CO2 (if methanol is used as a fuel source) and negatively
charged electron. The proton ion moves to the cathode through electrolyte where it reacts
29
with oxygen to reduce it to water. The equations for hydrogen/oxygen type fuel cells are
written as follow.
2H2→ 4H+ + 4e- -------------- At anode
O2+ 4e- → 2OH- -------------- At cathode
2H2+ O2→ 2H2O -------------- Overall reaction
Out of both reactions, oxygen reduction reaction (ORR) (E0 = 1.23 V) is more
energy extensive than hydrogen oxidation reaction (E0 = 0.00 V), and expensive Pt-based
catalysts usually catalyze these reactions. However, commercialization of Pt catalyst in
fuel cells are limited due to its limited reserves, high cost, agglomerations, instability in
the presence of methanol or CO and time-dependent drift.196 To promote the large-scale
commercialization of fuel cells in our daily life, the precious metal based catalyst should
be replaced with other cheap and sustainable nonmetal based catalysts. Recent studies have
proven that the heteroatoms (N, B, S, P or Se) doped carbon catalysts shows excellent
electrocatalytic performance for ORR and become a potential candidate for replacing Pt-
based catalysts.32 Due to low cost, excellent durability and environment friendliness of
heteroatom-doped carbon catalysts, they are considered as a great candidate for
replacement of Pt-based catalysts.
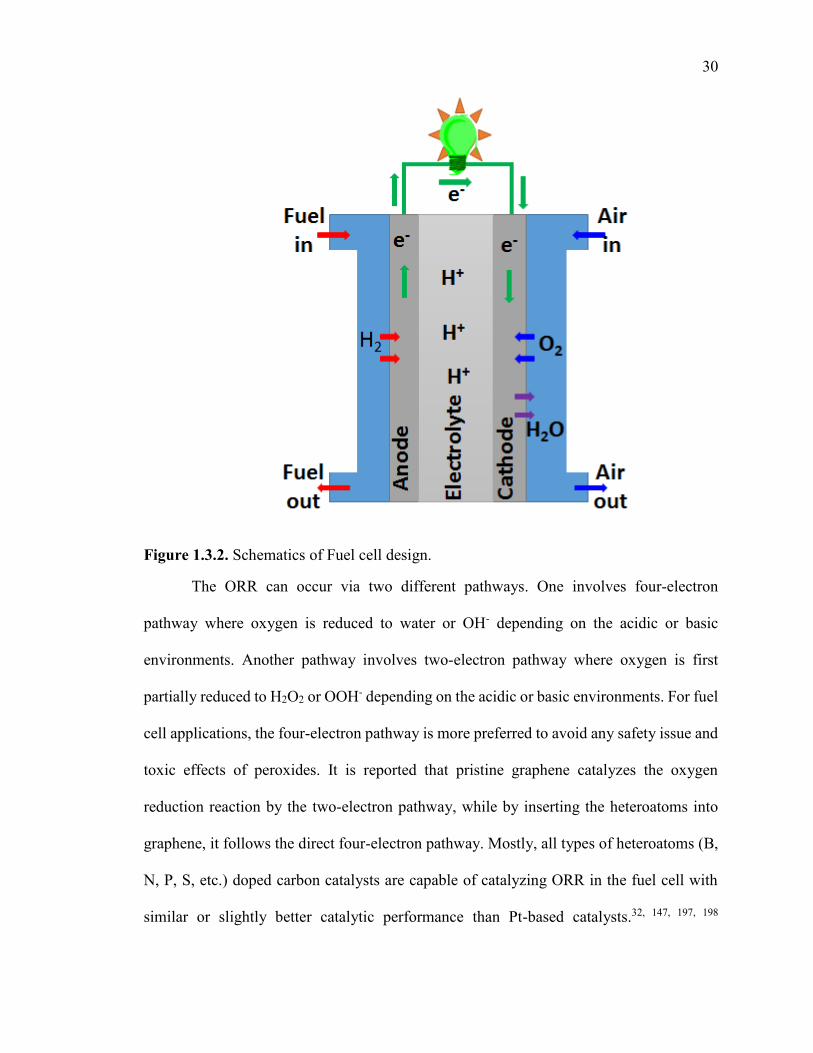
30
Figure 1.3.2. Schematics of Fuel cell design.
The ORR can occur via two different pathways. One involves four-electron
pathway where oxygen is reduced to water or OH- depending on the acidic or basic
environments. Another pathway involves two-electron pathway where oxygen is first
partially reduced to H2O2 or OOH- depending on the acidic or basic environments. For fuel
cell applications, the four-electron pathway is more preferred to avoid any safety issue and
toxic effects of peroxides. It is reported that pristine graphene catalyzes the oxygen
reduction reaction by the two-electron pathway, while by inserting the heteroatoms into
graphene, it follows the direct four-electron pathway. Mostly, all types of heteroatoms (B,
N, P, S, etc.) doped carbon catalysts are capable of catalyzing ORR in the fuel cell with
similar or slightly better catalytic performance than Pt-based catalysts.32, 147, 197, 198
31
However, the ORR performance of heteroatom-doped carbon primarily depends on the
type of dopant configuration while the mechanism of ORR in different heteroatom-doped
carbon depends on the unique electronic properties of heteroatoms dopant configuration.198
For example, some research groups reported that the better ORR performance in N-doped
graphene is mainly attributed to the pyridinic-N, which introduces the high positive spin
density and asymmetric atomic charge density into graphene,140, 157, 187, 189, 199 Whereas
others found that graphitic-N plays a crucial role in ORR 4e- pathway by decreasing the
energy cost at the intermediate steps of ORR. In the latter case, the carbon atom adjacent
to the graphitic-N is considered to act as a catalytic active center.197, 200-202 In short, the
mechanism of ORR on these N-doped carbon catalysts is not clearly understood and still
in debate.198 In the case of B-doped graphene, B plays crucial role in adsorption of O2 and
OOH- either due to its strong electron withdrawing property or due to the formation of
partial positive charge (because of smaller electronegativity of B than C).172, 203 Other than
N and B, P and S-doped carbon catalysts have also been studied for ORR. However, there
are few results reported. This may be because of the difficulty in doping of P and S due to
their relatively large atomic size compared to C atom.198 In S-doped graphene, S can be
doped in two forms- reduced S (or sulfide S) and oxidized S. Both types of doped S can
catalyze ORR by introducing the electronic spin density in graphene matrix due to
mismatch of the outer shell of S and C atoms.32, 145, 188 P-doped graphene is also able to
catalyze the ORR by introducing the larger band gap energy into graphene.20 Other than
the type of the heteroatom dopant, the amount of heteroatom doping is also playing an
important role. For example, one study suggests that N-doped graphene with 16 atomic %
32
of N doping shows poorer ORR activity than the one having 2 atomic % of N doping. This
is may be due to high affinity of oxygen to N which may poison the ORR active center.204
Other than individual heteroatom-doped graphene, co-doping of different
heteroatoms together in the graphene/carbon matrix is also reported to create special
synergistic effects from multiple heteroatom doping. For example, theoretical and
experimental results show that by co-doping B and N into graphene matrix, whose
electronegativity is lower and higher than C atom, respectively, can result in enhanced
ORR catalytic performance.205 similar to that, S, N-codoped graphene and P, N-codoped
graphene also shows improved ORR catalytic performance due to a synergistic effect by
the enhancement of spin density attained by multiple heteroatom co-doping.177, 206
However, the detailed mechanistic study about the co-doping effect is in the primary stage
and needs extensive experiments to understand the effect of co-dopant in graphene.
1.3.3.2. Carbon-based catalysts in organic synthesis.
In the past few years, the carbon-based material has also attracted growing interest
in the organic synthesis of valuable chemicals due to their several advantages over the
traditional transition/noble metal based catalysts.207 For example, carbon-based catalysts
are sustainable, cheap, and can be synthesized from biomass material. In addition to that,
the existence of giant π structures and feasibility of tuning the physicochemical and
electronic properties of carbon materials gives the advantage to promote the interaction of
various organic reactant on the surface of carbon materials.
A majority of the research has been focused on graphene oxide (GO), possibly due
to its easy availability and large scale synthesis.208-210 GO is the oxidized form of graphene
sheet which can be synthesized in large scale by exfoliation of graphite in the presence of
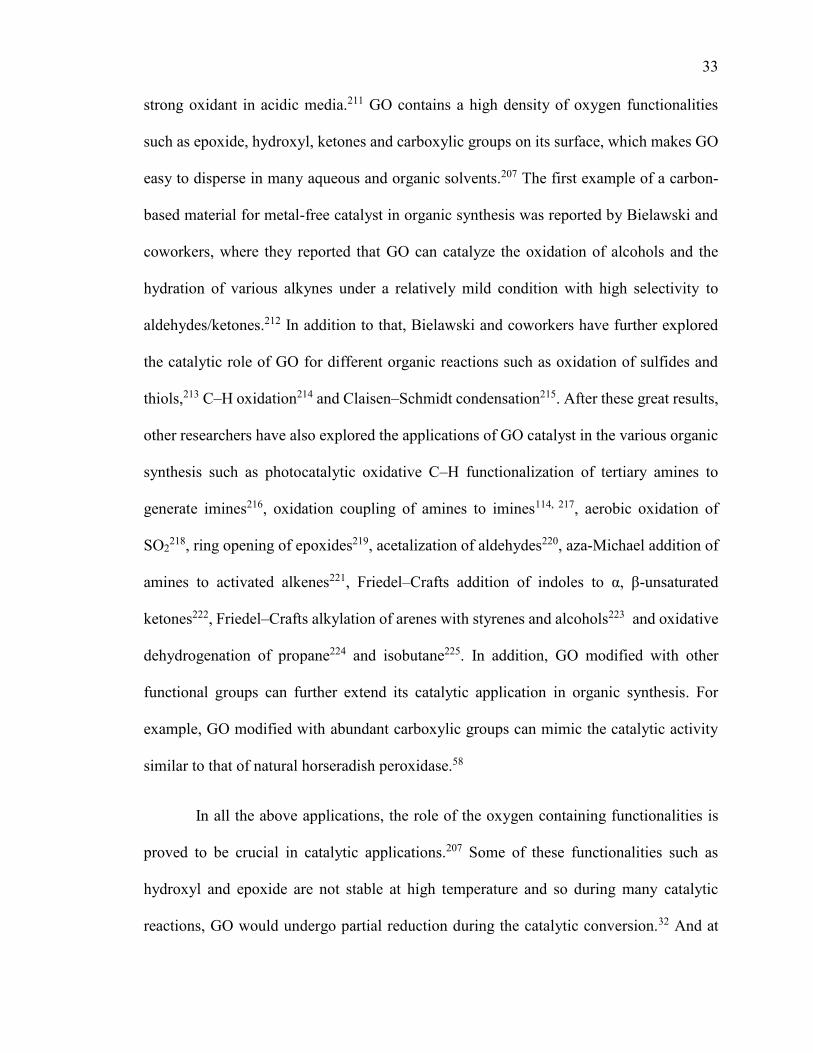
33
strong oxidant in acidic media.211 GO contains a high density of oxygen functionalities
such as epoxide, hydroxyl, ketones and carboxylic groups on its surface, which makes GO
easy to disperse in many aqueous and organic solvents.207 The first example of a carbon-
based material for metal-free catalyst in organic synthesis was reported by Bielawski and
coworkers, where they reported that GO can catalyze the oxidation of alcohols and the
hydration of various alkynes under a relatively mild condition with high selectivity to
aldehydes/ketones.212 In addition to that, Bielawski and coworkers have further explored
the catalytic role of GO for different organic reactions such as oxidation of sulfides and
thiols,213 C–H oxidation214 and Claisen–Schmidt condensation215. After these great results,
other researchers have also explored the applications of GO catalyst in the various organic
synthesis such as photocatalytic oxidative C–H functionalization of tertiary amines to
generate imines216, oxidation coupling of amines to imines114, 217, aerobic oxidation of
SO2218, ring opening of epoxides219, acetalization of aldehydes220, aza-Michael addition of
amines to activated alkenes221, Friedel–Crafts addition of indoles to α, β-unsaturated
ketones222, Friedel–Crafts alkylation of arenes with styrenes and alcohols223 and oxidative
dehydrogenation of propane224 and isobutane225. In addition, GO modified with other
functional groups can further extend its catalytic application in organic synthesis. For
example, GO modified with abundant carboxylic groups can mimic the catalytic activity
similar to that of natural horseradish peroxidase.58
In all the above applications, the role of the oxygen containing functionalities is
proved to be crucial in catalytic applications.207 Some of these functionalities such as
hydroxyl and epoxide are not stable at high temperature and so during many catalytic
reactions, GO would undergo partial reduction during the catalytic conversion.32 And at
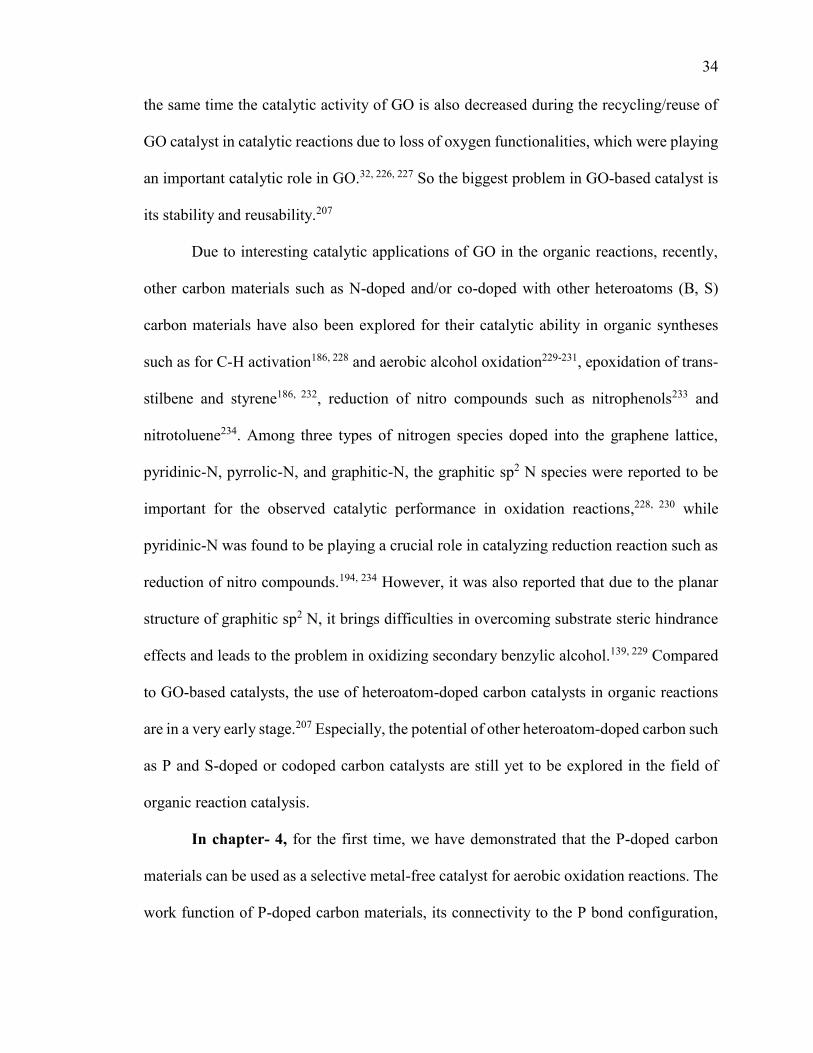
34
the same time the catalytic activity of GO is also decreased during the recycling/reuse of
GO catalyst in catalytic reactions due to loss of oxygen functionalities, which were playing
an important catalytic role in GO.32, 226, 227 So the biggest problem in GO-based catalyst is
its stability and reusability.207
Due to interesting catalytic applications of GO in the organic reactions, recently,
other carbon materials such as N-doped and/or co-doped with other heteroatoms (B, S)
carbon materials have also been explored for their catalytic ability in organic syntheses
such as for C-H activation186, 228 and aerobic alcohol oxidation229-231, epoxidation of trans-
stilbene and styrene186, 232, reduction of nitro compounds such as nitrophenols233 and
nitrotoluene234. Among three types of nitrogen species doped into the graphene lattice,
pyridinic-N, pyrrolic-N, and graphitic-N, the graphitic sp2 N species were reported to be
important for the observed catalytic performance in oxidation reactions,228, 230 while
pyridinic-N was found to be playing a crucial role in catalyzing reduction reaction such as
reduction of nitro compounds.194, 234 However, it was also reported that due to the planar
structure of graphitic sp2 N, it brings difficulties in overcoming substrate steric hindrance
effects and leads to the problem in oxidizing secondary benzylic alcohol.139, 229 Compared
to GO-based catalysts, the use of heteroatom-doped carbon catalysts in organic reactions
are in a very early stage.207 Especially, the potential of other heteroatom-doped carbon such
as P and S-doped or codoped carbon catalysts are still yet to be explored in the field of
organic reaction catalysis.
In chapter- 4, for the first time, we have demonstrated that the P-doped carbon
materials can be used as a selective metal-free catalyst for aerobic oxidation reactions. The
work function of P-doped carbon materials, its connectivity to the P bond configuration,
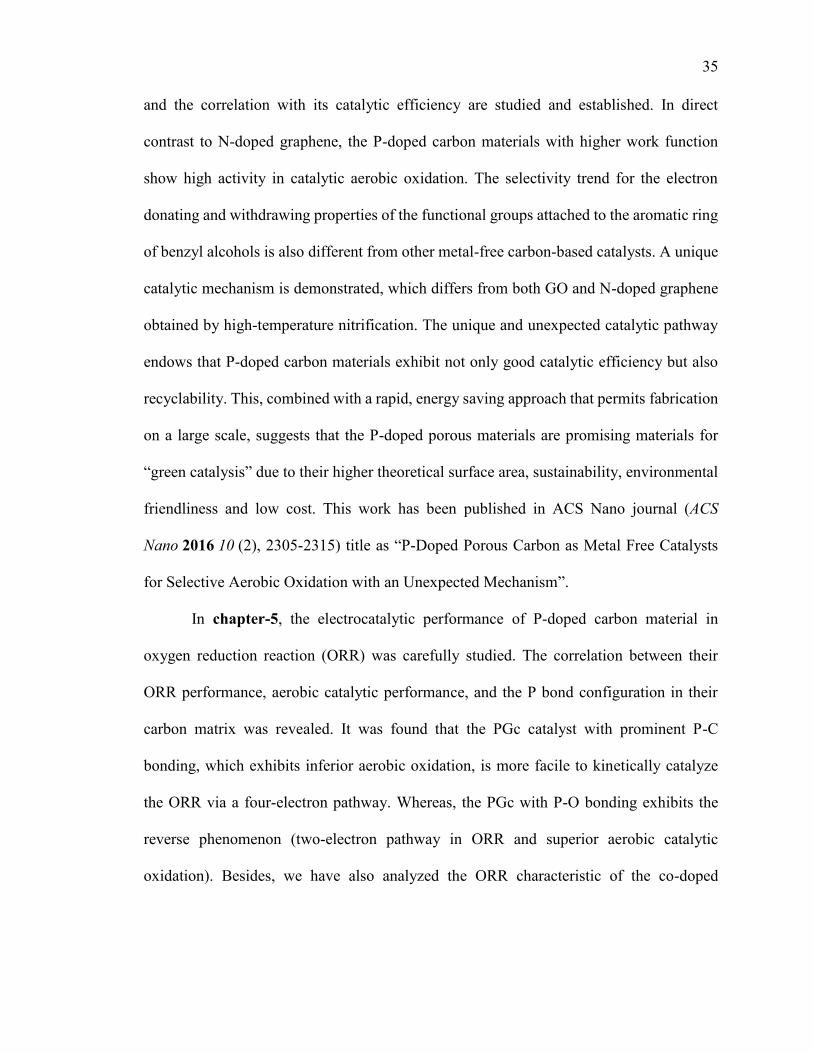
35
and the correlation with its catalytic efficiency are studied and established. In direct
contrast to N-doped graphene, the P-doped carbon materials with higher work function
show high activity in catalytic aerobic oxidation. The selectivity trend for the electron
donating and withdrawing properties of the functional groups attached to the aromatic ring
of benzyl alcohols is also different from other metal-free carbon-based catalysts. A unique
catalytic mechanism is demonstrated, which differs from both GO and N-doped graphene
obtained by high-temperature nitrification. The unique and unexpected catalytic pathway
endows that P-doped carbon materials exhibit not only good catalytic efficiency but also
recyclability. This, combined with a rapid, energy saving approach that permits fabrication
on a large scale, suggests that the P-doped porous materials are promising materials for
“green catalysis” due to their higher theoretical surface area, sustainability, environmental
friendliness and low cost. This work has been published in ACS Nano journal (ACS
Nano 2016 10 (2), 2305-2315) title as “P-Doped Porous Carbon as Metal Free Catalysts
for Selective Aerobic Oxidation with an Unexpected Mechanism”.
In chapter-5, the electrocatalytic performance of P-doped carbon material in
oxygen reduction reaction (ORR) was carefully studied. The correlation between their
ORR performance, aerobic catalytic performance, and the P bond configuration in their
carbon matrix was revealed. It was found that the PGc catalyst with prominent P-C
bonding, which exhibits inferior aerobic oxidation, is more facile to kinetically catalyze
the ORR via a four-electron pathway. Whereas, the PGc with P-O bonding exhibits the
reverse phenomenon (two-electron pathway in ORR and superior aerobic catalytic
oxidation). Besides, we have also analyzed the ORR characteristic of the co-doped
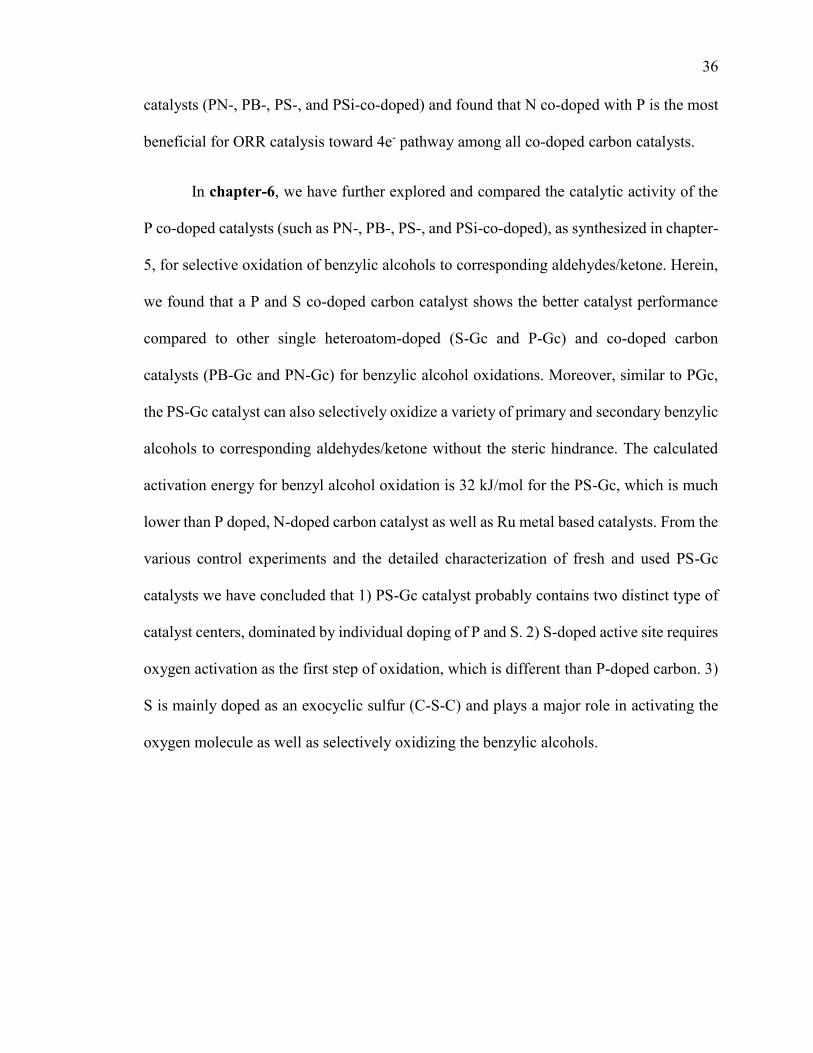
36
catalysts (PN-, PB-, PS-, and PSi-co-doped) and found that N co-doped with P is the most
beneficial for ORR catalysis toward 4e- pathway among all co-doped carbon catalysts.
In chapter-6, we have further explored and compared the catalytic activity of the
P co-doped catalysts (such as PN-, PB-, PS-, and PSi-co-doped), as synthesized in chapter-
5, for selective oxidation of benzylic alcohols to corresponding aldehydes/ketone. Herein,
we found that a P and S co-doped carbon catalyst shows the better catalyst performance
compared to other single heteroatom-doped (S-Gc and P-Gc) and co-doped carbon
catalysts (PB-Gc and PN-Gc) for benzylic alcohol oxidations. Moreover, similar to PGc,
the PS-Gc catalyst can also selectively oxidize a variety of primary and secondary benzylic
alcohols to corresponding aldehydes/ketone without the steric hindrance. The calculated
activation energy for benzyl alcohol oxidation is 32 kJ/mol for the PS-Gc, which is much
lower than P doped, N-doped carbon catalyst as well as Ru metal based catalysts. From the
various control experiments and the detailed characterization of fresh and used PS-Gc
catalysts we have concluded that 1) PS-Gc catalyst probably contains two distinct type of
catalyst centers, dominated by individual doping of P and S. 2) S-doped active site requires
oxygen activation as the first step of oxidation, which is different than P-doped carbon. 3)
S is mainly doped as an exocyclic sulfur (C-S-C) and plays a major role in activating the
oxygen molecule as well as selectively oxidizing the benzylic alcohols.
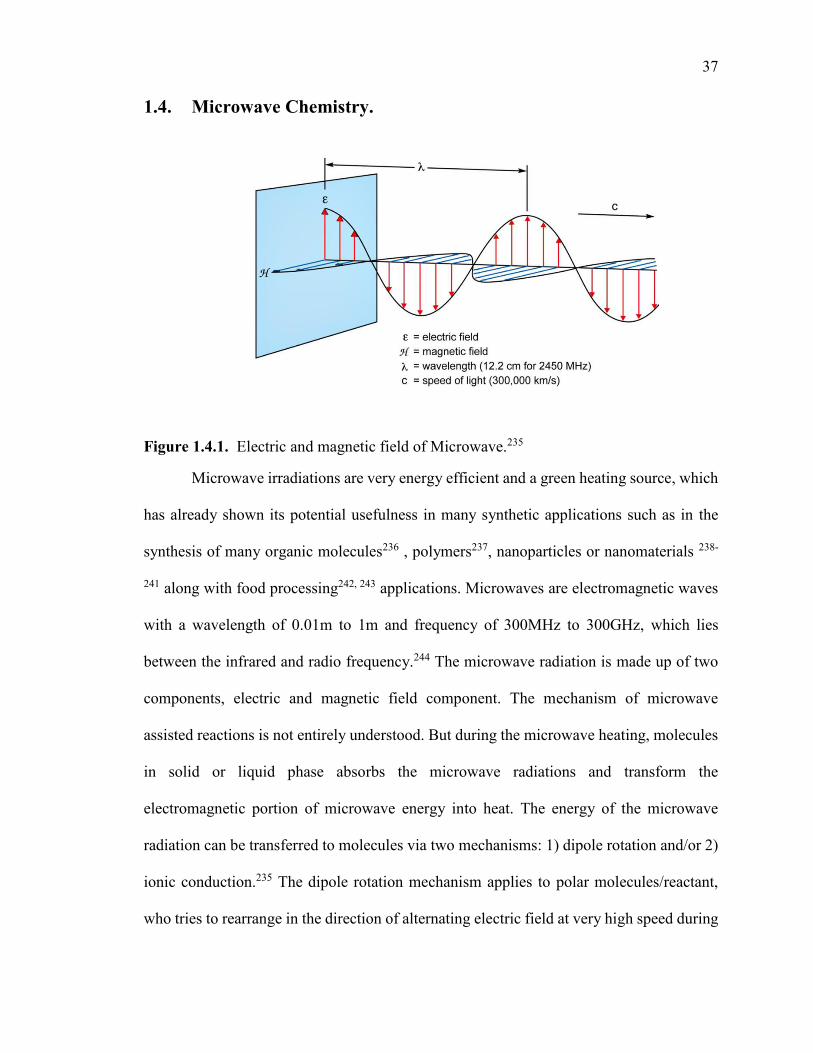
37
1.4. Microwave Chemistry.
Figure 1.4.1. Electric and magnetic field of Microwave.235
Microwave irradiations are very energy efficient and a green heating source, which
has already shown its potential usefulness in many synthetic applications such as in the
synthesis of many organic molecules236 , polymers237, nanoparticles or nanomaterials 238-
241 along with food processing242, 243 applications. Microwaves are electromagnetic waves
with a wavelength of 0.01m to 1m and frequency of 300MHz to 300GHz, which lies
between the infrared and radio frequency.244 The microwave radiation is made up of two
components, electric and magnetic field component. The mechanism of microwave
assisted reactions is not entirely understood. But during the microwave heating, molecules
in solid or liquid phase absorbs the microwave radiations and transform the
electromagnetic portion of microwave energy into heat. The energy of the microwave
radiation can be transferred to molecules via two mechanisms: 1) dipole rotation and/or 2)
ionic conduction.235 The dipole rotation mechanism applies to polar molecules/reactant,
who tries to rearrange in the direction of alternating electric field at very high speed during
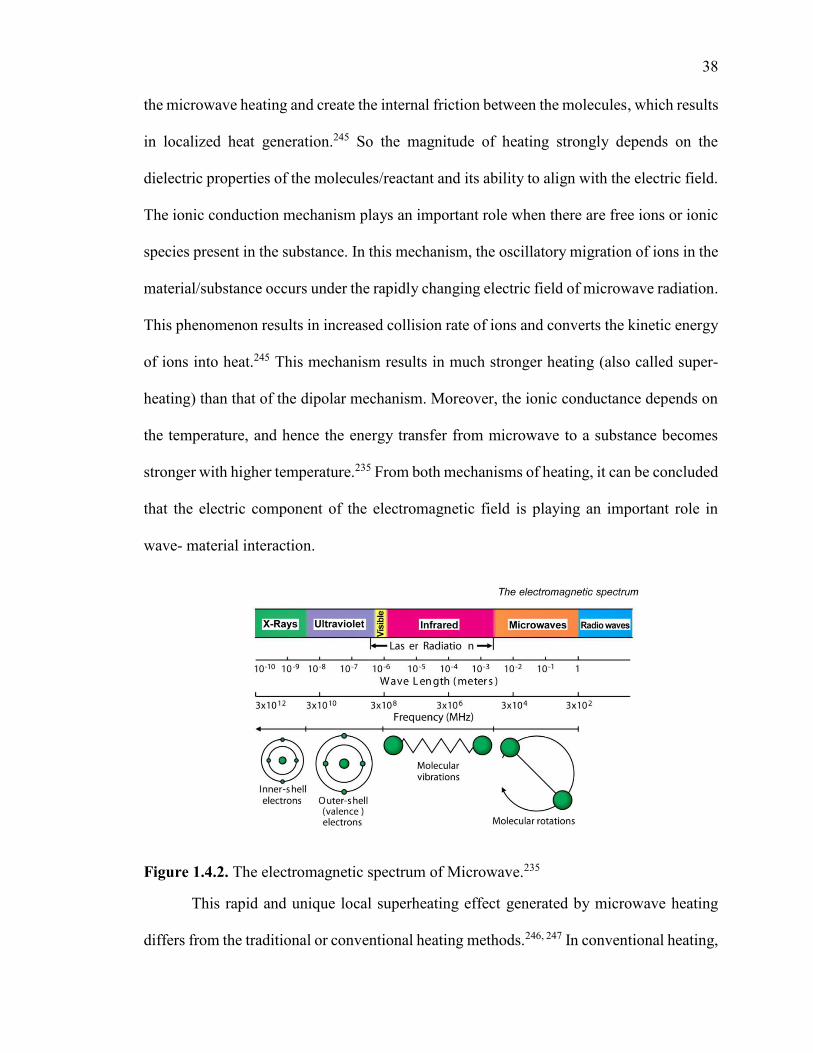
38
the microwave heating and create the internal friction between the molecules, which results
in localized heat generation.245 So the magnitude of heating strongly depends on the
dielectric properties of the molecules/reactant and its ability to align with the electric field.
The ionic conduction mechanism plays an important role when there are free ions or ionic
species present in the substance. In this mechanism, the oscillatory migration of ions in the
material/substance occurs under the rapidly changing electric field of microwave radiation.
This phenomenon results in increased collision rate of ions and converts the kinetic energy
of ions into heat.245 This mechanism results in much stronger heating (also called super-
heating) than that of the dipolar mechanism. Moreover, the ionic conductance depends on
the temperature, and hence the energy transfer from microwave to a substance becomes
stronger with higher temperature.235 From both mechanisms of heating, it can be concluded
that the electric component of the electromagnetic field is playing an important role in
wave- material interaction.
Figure 1.4.2. The electromagnetic spectrum of Microwave.235
This rapid and unique local superheating effect generated by microwave heating
differs from the traditional or conventional heating methods.246, 247 In conventional heating,
39
such as refluxing or oil bath heating, the energy has to pass through the wall of the vessel
and then to the solvent to reach the reactant. Due to this energy flow direction the
temperature of a vessel is higher than the reaction mixture until it reaches the thermal
equilibrium and makes the heating process slow and inefficient. While in the case of
microwave heating, the microwave irradiation can directly interact with the
molecules/reactant and produce rapid and uniform heating without the interference of
reaction vessel or solvent (microwave transparent). Moreover, It should also be noted that
the energy of microwave irradiation is ~37 cal/mole, which is just enough for molecular
rotation but much lower than the typical energy required to break any molecular bonds (~
80,000 to 120,000 cal/mole),248 so it does not affect the chemical structure of the molecule.
Due to these quick energy transfer properties of microwave heating, it not only results in
the rapid rise of the local reaction temperature but also enhances the reaction rate
significantly. Microwave heating method can also be useful in solid phase reactions
because of its superior penetration power and selective heating at adsorption site without
the need for any mechanical agitation and energy loss.236, 238 In addition to that, it is also
possible to selectively heat one material over another due to the different microwave wave-
adsorption ability of different materials.
Even though the microwave radiation covers a broad spectrum of frequency
(300MHz to 300GHz), a microwave oven uses only specific frequency as defined by ISM
(industrial, scientific, medical) bands to avoid the high cost and its interference with other
vital radio services. For example, the domestic microwave owns a frequency of 2.45 GHz
(a wavelength of 12.25 cm), while the industrial microwave usually owns frequencies of
915 MHz and 2.45 GHz.9
40
In summary, microwave assisted heating methods have several advantages such as
quick and time efficient, simple experimental setup, cost-effective and controllable
/selective heating of molecules and unique reaction rate enhancement. 246, 247 Due to the
above advantages, microwave heating, has rapidly grown as one of the important heating
sources in the field of materials science.249, 250
1.5. References.
1. Oganov, A. R.; Hemley, R. J.; Hazen, R. M.; Jones, A. P. Structure, bonding, and mineralogy of carbon at extreme conditions. Rev Mineral Geochem 2013, 75, 47-77. 2. Tripathi, A. C.; Saraf, S. A.; Saraf, S. K. Carbon Nanotropes: A Contemporary Paradigm in Drug Delivery. Materials 2015, 8, 3068-3100. 3. Morozov, S.; Novoselov, K.; Katsnelson, M.; Schedin, F.; Elias, D.; Jaszczak, J.; Geim, A. Giant intrinsic carrier mobilities in graphene and its bilayer. Phys. Rev. Lett.
2008, 100, 016602. 4. Boehm, H. P.; Setton, R.; Stumpp, E. Nomenclature and terminology of graphite intercalation compounds (IUPAC Recommendations 1994). Pure Appl. Chem. 1994, 66, 1893-1901. 5. Lu, X.; Yu, M.; Huang, H.; Ruoff, R. S. Tailoring graphite with the goal of achieving single sheets. Nanotechnology 1999, 10, 269. 6. Novoselov, K. S.; Geim, A. K.; Morozov, S.; Jiang, D.; Zhang, Y.; Dubonos, S. a.; Grigorieva, I.; Firsov, A. Electric field effect in atomically thin carbon films. science 2004, 306, 666-669. 7. Geim, A. K.; Novoselov, K. S. The rise of graphene. Nature materials 2007, 6, 183-191. 8. Stoller, M. D.; Park, S.; Zhu, Y.; An, J.; Ruoff, R. S. Graphene-based ultracapacitors. Nano letters 2008, 8, 3498-3502. 9. Balandin, A. A.; Ghosh, S.; Bao, W.; Calizo, I.; Teweldebrhan, D.; Miao, F.; Lau, C. N. Superior thermal conductivity of single-layer graphene. Nano Lett. 2008, 8, 902-907. 10. Balandin, A. A. Thermal properties of graphene and nanostructured carbon materials. Nature materials 2011, 10, 569-581. 11. Lee, C.; Wei, X.; Kysar, J. W.; Hone, J. Measurement of the elastic properties and intrinsic strength of monolayer graphene. science 2008, 321, 385-388. 12. Erickson, K.; Erni, R.; Lee, Z.; Alem, N.; Gannett, W.; Zettl, A. Determination of the local chemical structure of graphene oxide and reduced graphene oxide. Adv. Mater.
2010, 22, 4467-72. 13. Gomez De Arco, L.; Zhang, Y.; Schlenker, C. W.; Ryu, K.; Thompson, M. E.; Zhou, C. Continuous, highly flexible, and transparent graphene films by chemical vapor deposition for organic photovoltaics. ACS nano 2010, 4, 2865-2873.
41
14. Nair, R.; Blake, P.; Grigorenko, A.; Novoselov, K.; Booth, T.; Stauber, T.; Peres, N.; Geim, A. Fine structure constant defines visual transparency of graphene. Science 2008, 320, 1308-1308. 15. Bunch, J. S.; Verbridge, S. S.; Alden, J. S.; Van Der Zande, A. M.; Parpia, J. M.; Craighead, H. G.; McEuen, P. L. Impermeable atomic membranes from graphene sheets. Nano Lett. 2008, 8, 2458-2462. 16. Wu, Z. S.; Parvez, K.; Feng, X.; Müllen, K. Graphene-based in-plane micro-supercapacitors with high power and energy densities. Nature communications 2013, 4. 17. Yoo, J. J.; Balakrishnan, K.; Huang, J.; Meunier, V.; Sumpter, B. G.; Srivastava, A.; Conway, M.; Mohana Reddy, A. L.; Yu, J.; Vajtai, R. Ultrathin planar graphene supercapacitors. Nano Lett. 2011, 11, 1423-1427. 18. Wang, X.; Zhi, L.; Müllen, K. Transparent, conductive graphene electrodes for dye-sensitized solar cells. Nano Lett. 2008, 8, 323-327. 19. Su, Q.; Pang, S.; Alijani, V.; Li, C.; Feng, X.; Müllen, K. Composites of graphene with large aromatic molecules. Adv. Mater. 2009, 21, 3191-3195. 20. Matyba, P.; Yamaguchi, H.; Eda, G.; Chhowalla, M.; Edman, L.; Robinson, N. D. Graphene and mobile ions: the key to all-plastic, solution-processed light-emitting devices. Acs Nano 2010, 4, 637-642. 21. Bae, S.; Kim, H.; Lee, Y.; Xu, X.; Park, J.-S.; Zheng, Y.; Balakrishnan, J.; Lei, T.; Kim, H. R.; Song, Y. I. Roll-to-roll production of 30-inch graphene films for transparent electrodes. Nature nanotechnology 2010, 5, 574-578. 22. Pang, S.; Tsao, H. N.; Feng, X.; Müllen, K. Patterned Graphene Electrodes from Solution‐ Processed Graphite Oxide Films for Organic Field‐ Effect Transistors. Adv.
Mater. 2009, 21, 3488-3491. 23. Parvez, K.; Li, R.; Puniredd, S. R.; Hernandez, Y.ν Hinkel, F.ν Wang, S.ν Feng, X.ν Mullen, K. Electrochemically exfoliated graphene as solution-processable, highly conductive electrodes for organic electronics. ACS nano 2013, 7, 3598-3606. 24. Cao, Y.; Liu, S.; Shen, Q.; Yan, K.; Li, P.; Xu, J.; Yu, D.; Steigerwald, M. L.; Nuckolls, C.; Liu, Z. High‐ Performance Photoresponsive Organic Nanotransistors with Single‐ Layer Graphenes as Two‐ Dimensional Electrodes. Adv. Funct. Mater. 2009, 19, 2743-2748. 25. Pang, S.; Yang, S.; Feng, X.; Müllen, K. Coplanar asymmetrical reduced graphene oxide–titanium electrodes for polymer photodetectors. Adv. Mater. 2012, 24, 1566-1570. 26. Machado, B. F.; Serp, P. Graphene-based materials for catalysis. Catalysis Science
& Technology 2012, 2, 54-75. 27. Kuila, T.; Bose, S.; Khanra, P.; Mishra, A. K.; Kim, N. H.; Lee, J. H. Recent advances in graphene-based biosensors. Biosens. Bioelectron. 2011, 26, 4637-4648. 28. Li, J.-L.; Tang, B.; Yuan, B.; Sun, L.; Wang, X.-G. A review of optical imaging and therapy using nanosized graphene and graphene oxide. Biomaterials 2013, 34, 9519-9534. 29. Shao, Y.; Wang, J.; Wu, H.; Liu, J.; Aksay, I. A.; Lin, Y. Graphene based electrochemical sensors and biosensors: a review. Electroanalysis 2010, 22, 1027-1036. 30. Wang, H.; Maiyalagan, T.; Wang, X. Review on recent progress in nitrogen-doped graphene: synthesis, characterization, and its potential applications. Acs Catalysis 2012, 2, 781-794.
42
31. Deng, D.; Novoselov, K.; Fu, Q.; Zheng, N.; Tian, Z.; Bao, X. Catalysis with two-dimensional materials and their heterostructures. Nature nanotechnology 2016, 11, 218-230. 32. Kong, X.-K.; Chen, C.-L.; Chen, Q.-W. Doped graphene for metal-free catalysis. Chem. Soc. Rev. 2014, 43, 2841-2857. 33. Neto, A. C.; Guinea, F.; Peres, N.; Novoselov, K. S.; Geim, A. K. The electronic properties of graphene. Reviews of modern physics 2009, 81, 109. 34. Yang, K.; Feng, L.; Shi, X.; Liu, Z. Nano-graphene in biomedicine: theranostic applications. Chem. Soc. Rev. 2013, 42, 530-547. 35. Enoki, T.; Kobayashi, Y.; Fukui, K.-I. Electronic structures of graphene edges and nanographene. Int. Rev. Phys. Chem. 2007, 26, 609-645. 36. Fujii, S.; Enoki, T. Nanographene and Graphene Edges: Electronic Structure and Nanofabrication. Acc. Chem. Res. 2013, 46, 2202-2210. 37. Zhong, J.-H.; Zhang, J.; Jin, X.; Liu, J.-Y.; Li, Q.; Li, M.-H.; Cai, W.; Wu, D.-Y.; Zhan, D.; Ren, B. Quantitative correlation between defect density and heterogeneous electron transfer rate of single layer graphene. J. Am. Chem. Soc. 2014, 136, 16609-16617. 38. Banhart, F.; Kotakoski, J.; Krasheninnikov, A. V. Structural defects in graphene. ACS nano 2010, 5, 26-41. 39. Girit, Ç. Ö.; Meyer, J. C.; Erni, R.; Rossell, M. D.; Kisielowski, C.; Yang, L.; Park, C.-H.; Crommie, M.; Cohen, M. L.; Louie, S. G. Graphene at the edge: stability and dynamics. science 2009, 323, 1705-1708. 40. Zhou, S.; Gweon, G.-H.; Fedorov, A.; First, P.; De Heer, W.; Lee, D.-H.; Guinea, F.; Neto, A. C.; Lanzara, A. Substrate-induced bandgap opening in epitaxial graphene. Nature materials 2007, 6, 770-775. 41. Nakada, K.; Fujita, M.; Dresselhaus, G.; Dresselhaus, M. S. Edge state in graphene ribbons: Nanometer size effect and edge shape dependence. Physical Review B 1996, 54, 17954-17961. 42. Jiang, D.-e.; Sumpter, B. G.; Dai, S. Unique chemical reactivity of a graphene nanoribbon’s zigzag edge. The Journal of chemical physics 2007, 126, 134701. 43. Yang, X.; Zhang, X.; Liu, Z.; Ma, Y.; Huang, Y.; Chen, Y. High-efficiency loading and controlled release of doxorubicin hydrochloride on graphene oxide. The Journal of
Physical Chemistry C 2008, 112, 17554-17558. 44. Bao, H.; Pan, Y.; Ping, Y.; Sahoo, N. G.; Wu, T.; Li, L.; Li, J.; Gan, L. H. Chitosan‐ functionalized graphene oxide as a nanocarrier for drug and gene delivery. Small
2011, 7, 1569-1578. 45. Liu, Z.; Robinson, J. T.; Sun, X.; Dai, H. PEGylated nanographene oxide for delivery of water-insoluble cancer drugs. J. Am. Chem. Soc. 2008, 130, 10876-10877. 46. Yang, X.; Niu, G.; Cao, X.; Wen, Y.; Xiang, R.; Duan, H.; Chen, Y. The preparation of functionalized graphene oxide for targeted intracellular delivery of siRNA. J. Mater.
Chem. 2012, 22, 6649-6654. 47. Lu, C. H.; Yang, H. H.; Zhu, C. L.; Chen, X.; Chen, G. N. A graphene platform for sensing biomolecules. Angew. Chem. 2009, 121, 4879-4881. 48. Liu, Z.; Robinson, J. T.; Tabakman, S. M.; Yang, K.; Dai, H. Carbon materials for drug delivery & cancer therapy. Mater. Today 2011, 14, 316-323.
43
49. Zhang, L.; Lu, Z.; Zhao, Q.; Huang, J.; Shen, H.; Zhang, Z. Enhanced chemotherapy efficacy by sequential delivery of siRNA and anticancer drugs using PEI‐grafted graphene oxide. Small 2011, 7, 460-464. 50. Yang, K.; Zhang, S.; Zhang, G.; Sun, X.; Lee, S.-T.; Liu, Z. Graphene in mice: ultrahigh in vivo tumor uptake and efficient photothermal therapy. Nano Lett. 2010, 10, 3318-3323. 51. Zhang, W.; Guo, Z.; Huang, D.; Liu, Z.; Guo, X.; Zhong, H. Synergistic effect of chemo-photothermal therapy using PEGylated graphene oxide. Biomaterials 2011, 32, 8555-8561. 52. Markovic, Z. M.; Harhaji-Trajkovic, L. M.; Todorovic-Markovic, B. M.ν Kepić, D. P.ν Arsikin, K. M.ν Jovanović, S. P.ν Pantovic, A. C.ν Dramićanin, M. D.ν Trajkovic, V. S. In vitro comparison of the photothermal anticancer activity of graphene nanoparticles and carbon nanotubes. Biomaterials 2011, 32, 1121-1129. 53. Robinson, J. T.; Tabakman, S. M.; Liang, Y.; Wang, H.; Sanchez Casalongue, H.; Vinh, D.; Dai, H. Ultrasmall reduced graphene oxide with high near-infrared absorbance for photothermal therapy. J. Am. Chem. Soc. 2011, 133, 6825-6831. 54. Mohanty, N.; Berry, V. Graphene-based single-bacterium resolution biodevice and DNA transistor: interfacing graphene derivatives with nanoscale and microscale biocomponents. Nano Lett. 2008, 8, 4469-4476. 55. Nelson, T.; Zhang, B.; Prezhdo, O. V. Detection of nucleic acids with graphene nanopores: ab initio characterization of a novel sequencing device. Nano Lett. 2010, 10, 3237-3242. 56. Jung, J. H.; Cheon, D. S.; Liu, F.; Lee, K. B.; Seo, T. S. A Graphene Oxide Based Immuno‐ biosensor for Pathogen Detection. Angew. Chem. Int. Ed. 2010, 49, 5708-5711. 57. Wen, Y.; Xing, F.; He, S.; Song, S.; Wang, L.; Long, Y.; Li, D.; Fan, C. A graphene-based fluorescent nanoprobe for silver (I) ions detection by using graphene oxide and a silver-specific oligonucleotide. Chem. Commun. 2010, 46, 2596-2598. 58. Song, Y.; Qu, K.; Zhao, C.; Ren, J.; Qu, X. Graphene oxide: intrinsic peroxidase catalytic activity and its application to glucose detection. Adv. Mater. 2010, 22, 2206-2210. 59. Wang, Y.; Li, Y.; Tang, L.; Lu, J.; Li, J. Application of graphene-modified electrode for selective detection of dopamine. Electrochem. Commun. 2009, 11, 889-892. 60. Yang, K.; Wan, J.; Zhang, S.; Zhang, Y.; Lee, S.-T.; Liu, Z. In vivo pharmacokinetics, long-term biodistribution, and toxicology of PEGylated graphene in mice. ACS nano 2010, 5, 516-522. 61. Wang, K.; Ruan, J.; Song, H.; Zhang, J.; Wo, Y.; Guo, S.; Cui, D. Biocompatibility of graphene oxide. Nanoscale Res Lett 2011, 6, 1. 62. Zhang, X.; Yin, J.; Peng, C.; Hu, W.; Zhu, Z.; Li, W.; Fan, C.; Huang, Q. Distribution and biocompatibility studies of graphene oxide in mice after intravenous administration. Carbon 2011, 49, 986-995. 63. Yan, X.; Cui, X.; Li, L.-s. Synthesis of large, stable colloidal graphene quantum dots with tunable size. J. Am. Chem. Soc. 2010, 132, 5944-5945. 64. Liu, R.ν Wu, D.ν Feng, X.ν Mullen, K. Bottom-up fabrication of photoluminescent graphene quantum dots with uniform morphology. J. Am. Chem. Soc. 2011, 133, 15221-15223. 65. Zhu, S.; Tang, S.; Zhang, J.; Yang, B. Control the size and surface chemistry of graphene for the rising fluorescent materials. Chem. Commun. 2012, 48, 4527-4539.
44
66. Park, S.; Ruoff, R. S. Chemical methods for the production of graphenes. Nature
nanotechnology 2009, 4, 217-224. 67. Hummers, W. S.; Offeman, R. E. Preparation of Graphitic Oxide. J. Am. Chem.
Soc. 1958, 80, 1339. 68. Erickson, K.; Erni, R.; Lee, Z.; Alem, N.; Cannett, W.; A., Z. Determination of the Local Chemical Structure of Graphene Oxide and Reduced Graphene Oxide. Adv. Mater.
2010, 22, 4467-4472. 69. Li, J.-L.; Kudin, K. N.; McAllister, M. J.; Prud'homme, R. K.; Aksay, I. A.; Car, R. Oxygen-Driven Unzipping of Graphitic Materials Phys. Rev. Lett. 2006, 96, 176101. 70. Zhang, L.; Liang, J. J.; Huang, Y.; Ma, Y. F.; Wang, Y.; Chen, Y. S. Size-controlled synthesis of graphene oxide sheets on a large scale using chemical exfoliation. Carbon
2009, 47, 3365-3368. 71. Zhou, X. J.; Zhang, Y.; Wang, C.; Wu, X. C.; Yang, Y. Q.; Zheng, B.; Wu, H. X.; Guo, S. W.; Zhang, J. Y. Photo-Fenton Reaction of Graphene Oxide: A New Strategy to Prepare Graphene Quantum Dots for DNA Cleavage. Acs Nano 2012, 6, 6592-6599. 72. Wang, D.; Wang, L.; Dong, X. Y.; Shi, Z.; Jin, J. Chemically tailoring graphene oxides into fluorescent nanosheets for Fe3+ ion detection. Carbon 2012, 50, 2147-2154. 73. Luo, J. Y.; Cote, L. J.; Tung, V. C.; Tan, A. T. L.; Goins, P. E.; Wu, J. S.; Huang, J. X. Graphene Oxide Nanocolloids. J. Am. Chem. Soc. 2010, 132, 17667-17669. 74. Peng, J.; Gao, W.; Gupta, B. K.; Liu, Z.; Romero-Aburto, R.; Ge, L. H.; Song, L.; Alemany, L. B.; Zhan, X. B.; Gao, G. H.; Vithayathil, S. A.; Kaipparettu, B. A.; Marti, A. A.; Hayashi, T.; Zhu, J. J.; Ajayan, P. M. Graphene Quantum Dots Derived from Carbon Fibers. Nano Lett. 2012, 12, 844-849. 75. Tian, B.; Wang, C.; Zhang, S.; Feng, L. Z.; Liu, Z. Photothermally Enhanced Photodynamic Therapy Delivered by Nano-Graphene Oxide. Acs Nano 2011, 5, 7000-7009. 76. Yang, K.; Wan, J. M.; Zhang, S.; Tian, B.; Zhang, Y. J.; Liu, Z. The influence of surface chemistry and size of nanoscale graphene oxide on photothermal therapy of cancer using ultra-low laser power. Biomaterials 2012, 33, 2206-2214. 77. Robinson, J. T.; Tabakman, S. M.; Liang, Y. Y.; Wang, H. L.; Casalongue, H. S.; Vinh, D.; Dai, H. J. Ultrasmall Reduced Graphene Oxide with High Near-Infrared Absorbance for Photothermal Therapy. J. Am. Chem. Soc. 2011, 133, 6825-6831. 78. Pan, D. Y.; Zhang, J. C.; Li, Z.; Wu, M. H. Hydrothermal Route for Cutting Graphene Sheets into Blue-Luminescent Graphene Quantum Dots. Adv. Mater. 2010, 22, 734-+. 79. Li, Y.; Hu, Y.; Zhao, Y.; Shi, G. Q.; Deng, L. E.; Hou, Y. B.; Qu, L. T. An Electrochemical Avenue to Green-Luminescent Graphene Quantum Dots as Potential Electron-Acceptors for Photovoltaics. Adv. Mater. 2011, 23, 776-+. 80. Zhang, M.; Bai, L. L.; Shang, W. H.; Xie, W. J.; Ma, H.; Fu, Y. Y.; Fang, D. C.; Sun, H.; Fan, L. Z.; Han, M.; Liu, C. M.; Yang, S. H. Facile synthesis of water-soluble, highly fluorescent graphene quantum dots as a robust biological label for stem cells. J.
Mater. Chem. 2012, 22, 7461-7467. 81. Akhavan, O. Graphene nanomesh by ZnO nanorod photocatalysts. ACS nano 2010, 4, 4174-4180.
45
82. Mao, S.; Wen, Z.; Kim, H.; Lu, G.; Hurley, P.; Chen, J. A general approach to one-pot fabrication of crumpled graphene-based nanohybrids for energy applications. ACS
nano 2012, 6, 7505-7513. 83. Wu, Z.-S.; Winter, A.; Chen, L.; Sun, Y.; Turchanin, A.; Feng, X.; Müllen, K. Three-Dimensional Nitrogen and Boron Co-doped Graphene for High-Performance All-Solid-State Supercapacitors. Adv. Mater. 2012, 24, 5130-5135. 84. Jiang, L.; Fan, Z. Design of advanced porous graphene materials: from graphene nanomesh to 3D architectures. Nanoscale 2014, 6, 1922-1945. 85. Liang, C.; Li, Z.; Dai, S. Mesoporous carbon materials: synthesis and modification. Angew. Chem. Int. Ed. 2008, 47, 3696-3717. 86. Zhu, Y.; Murali, S.; Stoller, M. D.; Ganesh, K.; Cai, W.; Ferreira, P. J.; Pirkle, A.; Wallace, R. M.; Cychosz, K. A.; Thommes, M. Carbon-based supercapacitors produced by activation of graphene. Science 2011, 332, 1537-1541. 87. Wang, Z.-L.; Xu, D.; Wang, H.-G.; Wu, Z.; Zhang, X.-B. In situ fabrication of porous graphene electrodes for high-performance energy storage. Acs Nano 2013, 7, 2422-2430. 88. Ning, G.; Xu, C.; Mu, L.; Chen, G.; Wang, G.; Gao, J.; Fan, Z.; Qian, W.; Wei, F. High capacity gas storage in corrugated porous graphene with a specific surface area-lossless tightly stacking manner. Chem. Commun. 2012, 48, 6815-6817. 89. Li, Y.; Zhou, Z.; Shen, P.; Chen, Z. Two-dimensional polyphenylene: experimentally available porous graphene as a hydrogen purification membrane. Chem.
Commun. 2010, 46, 3672-3674. 90. Schrier, J. Helium separation using porous graphene membranes. The Journal of
Physical Chemistry Letters 2010, 1, 2284-2287. 91. Du, H.; Li, J.; Zhang, J.; Su, G.; Li, X.; Zhao, Y. Separation of hydrogen and nitrogen gases with porous graphene membrane. The Journal of Physical Chemistry C
2011, 115, 23261-23266. 92. Si, C.; Zhou, G. Size-dependent chemical reactivity of porous graphene for purification of exhaust gases. The Journal of chemical physics 2012, 137, 184309. 93. Shan, M.; Xue, Q.; Jing, N.; Ling, C.; Zhang, T.; Yan, Z.; Zheng, J. Influence of chemical functionalization on the CO 2/N 2 separation performance of porous graphene membranes. Nanoscale 2012, 4, 5477-5482. 94. Hauser, A. W.; Schwerdtfeger, P. Methane-selective nanoporous graphene membranes for gas purification. PCCP 2012, 14, 13292-13298. 95. Dong, X.; Wang, X.; Wang, L.; Song, H.; Zhang, H.; Huang, W.; Chen, P. 3D graphene foam as a monolithic and macroporous carbon electrode for electrochemical sensing. ACS applied materials & interfaces 2012, 4, 3129-3133. 96. Li, H.; Liu, L.; Yang, F. Covalent assembly of 3D graphene/polypyrrole foams for oil spill cleanup. Journal of Materials Chemistry A 2013, 1, 3446-3453. 97. Kou, R.; Shao, Y.; Mei, D.; Nie, Z.; Wang, D.; Wang, C.; Viswanathan, V. V.; Park, S.ν Aksay, I. A.ν Lin, Y. Stabilization of electrocatalytic metal nanoparticles at metal− metal oxide− graphene triple junction points. J. Am. Chem. Soc. 2011, 133, 2541-2547. 98. Luo, J.; Jang, H. D.; Sun, T.; Xiao, L.; He, Z.; Katsoulidis, A. P.; Kanatzidis, M. G.; Gibson, J. M.; Huang, J. Compression and aggregation-resistant particles of crumpled soft sheets. Acs Nano 2011, 5, 8943-8949.
46
99. Bieri, M.; Treier, M.; Cai, J.; Aït-Mansour, K.; Ruffieux, P.; Gröning, O.; Gröning, P.; Kastler, M.; Rieger, R.; Feng, X. Porous graphenes: two-dimensional polymer synthesis with atomic precision. Chem. Commun. 2009, 6919-6921. 100. Ning, G.; Fan, Z.; Wang, G.; Gao, J.; Qian, W.; Wei, F. Gram-scale synthesis of nanomesh graphene with high surface area and its application in supercapacitor electrodes. Chem. Commun. 2011, 47, 5976-5978. 101. Kuhn, P.; Forget, A.; Su, D.; Thomas, A.; Antonietti, M. From microporous regular frameworks to mesoporous materials with ultrahigh surface area: dynamic reorganization of porous polymer networks. J. Am. Chem. Soc. 2008, 130, 13333-13337. 102. Lin, Y.; Watson, K. A.; Kim, J.-W.; Baggett, D. W.; Working, D. C.; Connell, J. W. Bulk preparation of holey graphene via controlled catalytic oxidation. Nanoscale 2013, 5, 7814-7824. 103. Zhang, L.; Zhang, F.; Yang, X.; Long, G.; Wu, Y.; Zhang, T.; Leng, K.; Huang, Y.; Ma, Y.; Yu, A. Porous 3D graphene-based bulk materials with exceptional high surface area and excellent conductivity for supercapacitors. Scientific reports 2013, 3. 104. Zhao, X.; Hayner, C. M.; Kung, M. C.; Kung, H. H. Flexible holey graphene paper electrodes with enhanced rate capability for energy storage applications. ACS nano 2011, 5, 8739-8749. 105. Wang, X.; Jiao, L.; Sheng, K.; Li, C.; Dai, L.; Shi, G. Solution-processable graphene nanomeshes with controlled pore structures. Scientific reports 2013, 3. 106. Kotchey, G. P.; Allen, B. L.; Vedala, H.; Yanamala, N.; Kapralov, A. A.; Tyurina, Y. Y.; Klein-Seetharaman, J.; Kagan, V. E.; Star, A. The enzymatic oxidation of graphene oxide. ACS nano 2011, 5, 2098-2108. 107. Fischbein, M. D.ν Drndić, M. Electron beam nanosculpting of suspended graphene sheets. Appl. Phys. Lett. 2008, 93, 113107. 108. Zeng, Z.; Huang, X.; Yin, Z.; Li, H.; Chen, Y.; Li, H.; Zhang, Q.; Ma, J.; Boey, F.; Zhang, H. Fabrication of graphene nanomesh by using an anodic aluminum oxide membrane as a template. Adv. Mater. 2012, 24, 4138-4142. 109. Jung, I.; Jang, H. Y.; Park, S. Direct growth of graphene nanomesh using a Au nano-network as a metal catalyst via chemical vapor deposition. Appl. Phys. Lett. 2013, 103, 023105. 110. Yi, J.; Lee, D. H.; Lee, W. W.; Park, W. I. Direct synthesis of graphene meshes and semipermanent electrical doping. The Journal of Physical Chemistry Letters 2013, 4, 2099-2104. 111. Fan, Z.; Liu, Y.; Yan, J.; Ning, G.; Wang, Q.; Wei, T.; Zhi, L.; Wei, F. Template‐Directed Synthesis of Pillared‐ Porous Carbon Nanosheet Architectures: High‐Performance Electrode Materials for Supercapacitors. Advanced Energy Materials 2012, 2, 419-424. 112. Patel, M.; Feng, W.; Savaram, K.; Khoshi, M. R.; Huang, R.; Sun, J.; Rabie, E.; Flach, C.; Mendelsohn, R.; Garfunkel, E. Microwave Enabled One‐ Pot, One‐ Step Fabrication and Nitrogen Doping of Holey Graphene Oxide for Catalytic Applications. small 2015, 11, 3358-3368. 113. Bai, J.; Zhong, X.; Jiang, S.; Huang, Y.; Duan, X. Graphene nanomesh. Nature
nanotechnology 2010, 5, 190-194. 114. Fan, Z.; Zhao, Q.; Li, T.; Yan, J.; Ren, Y.; Feng, J.; Wei, T. Easy synthesis of porous graphene nanosheets and their use in supercapacitors. Carbon 2012, 50, 1699-1703.
47
115. Xi, Q.; Chen, X.; Evans, D. G.; Yang, W. Gold nanoparticle-embedded porous graphene thin films fabricated via layer-by-layer self-assembly and subsequent thermal annealing for electrochemical sensing. Langmuir 2012, 28, 9885-9892. 116. Han, T. H.; Huang, Y.-K.; Tan, A. T.; Dravid, V. P.; Huang, J. Steam etched porous graphene oxide network for chemical sensing. J. Am. Chem. Soc. 2011, 133, 15264-15267. 117. Peng, W.; Liu, S.; Sun, H.; Yao, Y.; Zhi, L.; Wang, S. Synthesis of porous reduced graphene oxide as metal-free carbon for adsorption and catalytic oxidation of organics in water. Journal of Materials Chemistry A 2013, 1, 5854-5859. 118. Wang, X.; Sun, G.; Routh, P.; Kim, D.-H.; Huang, W.; Chen, P. Heteroatom-doped graphene materials: syntheses, properties and applications. Chem. Soc. Rev. 2014, 43, 7067-7098. 119. Kuila, T.; Bose, S.; Mishra, A. K.; Khanra, P.; Kim, N. H.; Lee, J. H. Chemical functionalization of graphene and its applications. Prog. Mater Sci. 2012, 57, 1061-1105. 120. Jiao, Y.; Zheng, Y.; Jaroniec, M.; Qiao, S. Z. Origin of the electrocatalytic oxygen reduction activity of graphene-based catalysts: A roadmap to achieve the best performance. J. Am. Chem. Soc. 2014, 136, 4394-4403. 121. Rani, P.; Jindal, V. Designing band gap of graphene by B and N dopant atoms. RSC
Advances 2013, 3, 802-812. 122. Miwa, R. H.; Martins, T. B.; Fazzio, A. Hydrogen adsorption on boron doped graphene: an ab initio study. Nanotechnology 2008, 19, 155708. 123. Faccio, R.; Fernández-Werner, L.; Pardo, H.; Goyenola, C.; Ventura, O. N.; Mombrú, Á. W. Electronic and structural distortions in graphene induced by carbon vacancies and boron doping. The Journal of Physical Chemistry C 2010, 114, 18961-18971. 124. Yu, L.; Pan, X.; Cao, X.; Hu, P.; Bao, X. Oxygen reduction reaction mechanism on nitrogen-doped graphene: A density functional theory study. J. Catal. 2011, 282, 183-190. 125. Lherbier, A.; Botello-Mendez, A. R.; Charlier, J.-C. Electronic and transport properties of unbalanced sublattice N-doping in graphene. Nano Lett. 2013, 13, 1446-1450. 126. Jalili, S.; Vaziri, R. Study of the electronic properties of li-intercalated nitrogen doped graphite. Mol. Phys. 2011, 109, 687-694. 127. Schiros, T.ν Nordlund, D.ν Palova, L.ν Prezzi, D.ν Zhao, L.ν Kim, K. S.ν Wurstbauer, U.ν Gutierrez, C.ν Delongchamp, D.ν Jaye, C. Connecting dopant bond type with electronic structure in N-doped graphene. Nano Lett. 2012, 12, 4025-4031. 128. Hwang, J. O.; Park, J. S.; Choi, D. S.; Kim, J. Y.; Lee, S. H.; Lee, K. E.; Kim, Y.-H.; Song, M. H.; Yoo, S.; Kim, S. O. Workfunction-tunable, N-doped reduced graphene transparent electrodes for high-performance polymer light-emitting diodes. Acs Nano
2011, 6, 159-167. 129. Liu, Y.; Feng, Q.; Tang, N.; Wan, X.; Liu, F.; Lv, L.; Du, Y. Increased magnetization of reduced graphene oxide by nitrogen-doping. Carbon 2013, 60, 549-551. 130. Chiou, J.; Ray, S. C.; Peng, S.; Chuang, C.; Wang, B.; Tsai, H.; Pao, C.; Lin, H.-J.; Shao, Y.; Wang, Y. Nitrogen-functionalized graphene nanoflakes (GNFs: N): tunable photoluminescence and electronic structures. The Journal of Physical Chemistry C 2012, 116, 16251-16258. 131. Yang, Z.; Yao, Z.; Li, G.; Fang, G.; Nie, H.; Liu, Z.; Zhou, X.; Chen, X. a.; Huang, S. Sulfur-doped graphene as an efficient metal-free cathode catalyst for oxygen reduction. ACS nano 2011, 6, 205-211.
48
132. Denis, P. A. Concentration dependence of the band gaps of phosphorus and sulfur doped graphene. Computational Materials Science 2013, 67, 203-206. 133. Wang, H.-m.; Wang, H.-x.; Chen, Y.; Liu, Y.-j.; Zhao, J.-x.; Cai, Q.-h.; Wang, X.-z. Phosphorus-doped graphene and (8, 0) carbon nanotube: Structural, electronic, magnetic properties, and chemical reactivity. Appl. Surf. Sci. 2013, 273, 302-309. 134. Some, S.; Kim, J.; Lee, K.; Kulkarni, A.; Yoon, Y.; Lee, S.; Kim, T.; Lee, H. Highly air‐ stable phosphorus‐ doped n‐ type graphene field‐ effect transistors. Adv. Mater.
2012, 24, 5481-5486. 135. Liang, J.; Jiao, Y.; Jaroniec, M.; Qiao, S. Z. Sulfur and nitrogen dual‐ doped mesoporous graphene electrocatalyst for oxygen reduction with synergistically enhanced performance. Angew. Chem. Int. Ed. 2012, 51, 11496-11500. 136. Choi, C. H.; Chung, M. W.; Jun, Y. J.; Woo, S. I. Doping of chalcogens (sulfur and/or selenium) in nitrogen-doped graphene–CNT self-assembly for enhanced oxygen reduction activity in acid media. RSC Advances 2013, 3, 12417-12422. 137. Chen, Y.; Liu, Y.-j.; Wang, H.-x.; Zhao, J.-x.; Cai, Q.-h.; Wang, X.-z.; Ding, Y.-h. Silicon-Doped Graphene: An Effective and Metal-Free Catalyst for NO Reduction to N2O? ACS Applied Materials & Interfaces 2013, 5, 5994-6000. 138. Jeon, I.-Y.; Choi, M.; Choi, H.-J.; Jung, S.-M.; Kim, M.-J.; Seo, J.-M.; Bae, S.-Y.; Yoo, S.; Kim, G.; Jeong, H. Y. Antimony-doped graphene nanoplatelets. Nature
communications 2015, 6. 139. Wang, X.; Sun, G.; Routh, P.; Kim, D. H.; Huang, W.; Chen, P. Heteroatom-doped graphene materials: syntheses, properties and applications. Chem. Soc. Rev. 2014, 43, 7067-98. 140. Sheng, Z.-H.; Shao, L.; Chen, J.-J.; Bao, W.-J.; Wang, F.-B.; Xia, X.-H. Catalyst-free synthesis of nitrogen-doped graphene via thermal annealing graphite oxide with melamine and its excellent electrocatalysis. ACS nano 2011, 5, 4350-4358. 141. Li, X.; Wang, H.; Robinson, J. T.; Sanchez, H.; Diankov, G.; Dai, H. Simultaneous nitrogen doping and reduction of graphene oxide. J. Am. Chem. Soc. 2009, 131, 15939-15944. 142. Shao, Y.; Zhang, S.; Engelhard, M. H.; Li, G.; Shao, G.; Wang, Y.; Liu, J.; Aksay, I. A.; Lin, Y. Nitrogen-doped graphene and its electrochemical applications. J. Mater.
Chem. 2010, 20, 7491-7496. 143. Wang, Y.; Shao, Y.; Matson, D. W.; Li, J.; Lin, Y. Nitrogen-doped graphene and its application in electrochemical biosensing. ACS nano 2010, 4, 1790-1798. 144. Long, D.; Li, W.; Ling, L.; Miyawaki, J.; Mochida, I.; Yoon, S.-H. Preparation of nitrogen-doped graphene sheets by a combined chemical and hydrothermal reduction of graphene oxide. Langmuir 2010, 26, 16096-16102. 145. Huang, C.; Li, C.; Shi, G. Graphene based catalysts. Energy & Environmental
Science 2012, 5, 8848-8868. 146. Wei, D.; Liu, Y.; Wang, Y.; Zhang, H.; Huang, L.; Yu, G. Synthesis of N-doped graphene by chemical vapor deposition and its electrical properties. Nano Lett. 2009, 9, 1752-1758. 147. Qu, L.; Liu, Y.; Baek, J.-B.; Dai, L. Nitrogen-doped graphene as efficient metal-free electrocatalyst for oxygen reduction in fuel cells. ACS nano 2010, 4, 1321-1326.
49
148. Luo, Z.; Lim, S.; Tian, Z.; Shang, J.; Lai, L.; MacDonald, B.; Fu, C.; Shen, Z.; Yu, T.; Lin, J. Pyridinic N doped graphene: synthesis, electronic structure, and electrocatalytic property. J. Mater. Chem. 2011, 21, 8038-8044. 149. Deng, D.; Pan, X.; Yu, L.; Cui, Y.; Jiang, Y.; Qi, J.; Li, W.-X.; Fu, Q.; Ma, X.; Xue, Q. Toward N-doped graphene via solvothermal synthesis. Chem. Mater. 2011, 23, 1188-1193. 150. Latorre‐ Sánchez, M.; Primo, A.; García, H. P‐ Doped Graphene Obtained by Pyrolysis of Modified Alginate as a Photocatalyst for Hydrogen Generation from Water–Methanol Mixtures. Angew. Chem. Int. Ed. 2013, 52, 11813-11816. 151. Hulicova-Jurcakova, D.; Puziy, A. M.; Poddubnaya, O. I.; Suárez-García, F.; Tascón, J. M.; Lu, G. Q. Highly stable performance of supercapacitors from phosphorus-enriched carbons. J. Am. Chem. Soc. 2009, 131, 5026-5027. 152. Zhao, X.; Wang, A.; Yan, J.; Sun, G.; Sun, L.; Zhang, T. Synthesis and electrochemical performance of heteroatom-incorporated ordered mesoporous carbons. Chem. Mater. 2010, 22, 5463-5473. 153. Nasini, U. B.; Gopal Bairi, V.; Kumar Ramasahayam, S.; Bourdo, S. E.; Viswanathan, T.; Shaikh, A. U. Oxygen Reduction Reaction Studies of Phosphorus and Nitrogen Co‐ Doped Mesoporous Carbon Synthesized via Microwave Technique. ChemElectroChem 2014, 1, 573-579. 154. Ramasahayam, S. K.; Nasini, U. B.; Bairi, V.; Shaikh, A. U.; Viswanathan, T. Microwave assisted synthesis and characterization of silicon and phosphorous co-doped carbon as an electrocatalyst for oxygen reduction reaction. RSC Advances 2014, 4, 6306-6313. 155. Guiotoku, M.; Rambo, C. R.; Hotza, D. Charcoal produced from cellulosic raw materials by microwave-assisted hydrothermal carbonization. J. Therm. Anal. Calorim.
2014, 117, 269-275. 156. Jun, G. H.; Jin, S. H.; Lee, B.; Kim, B. H.; Chae, W.-S.; Hong, S. H.; Jeon, S. Enhanced conduction and charge-selectivity by N-doped graphene flakes in the active layer of bulk-heterojunction organic solar cells. Energy & Environmental Science 2013, 6, 3000-3006. 157. Lai, L.; Potts, J. R.; Zhan, D.; Wang, L.; Poh, C. K.; Tang, C.; Gong, H.; Shen, Z.; Lin, J.; Ruoff, R. S. Exploration of the active center structure of nitrogen-doped graphene-based catalysts for oxygen reduction reaction. Energy & Environmental Science 2012, 5, 7936-7942. 158. Li, R.; Wei, Z.; Gou, X.; Xu, W. Phosphorus-doped graphene nanosheets as efficient metal-free oxygen reduction electrocatalysts. Rsc Advances 2013, 3, 9978-9984. 159. Yang, S.; Zhi, L.; Tang, K.; Feng, X.; Maier, J.; Müllen, K. Efficient synthesis of heteroatom (N or S)‐ doped graphene based on ultrathin graphene oxide‐ porous silica sheets for oxygen reduction reactions. Adv. Funct. Mater. 2012, 22, 3634-3640. 160. Wu, Z.-S.; Ren, W.; Xu, L.; Li, F.; Cheng, H.-M. Doped graphene sheets as anode materials with superhigh rate and large capacity for lithium ion batteries. ACS nano 2011, 5, 5463-5471. 161. Jeong, H. M.; Lee, J. W.; Shin, W. H.; Choi, Y. J.; Shin, H. J.; Kang, J. K.; Choi, J. W. Nitrogen-doped graphene for high-performance ultracapacitors and the importance of nitrogen-doped sites at basal planes. Nano Lett. 2011, 11, 2472-2477.
50
162. Liu, J.-Y.; Chang, H.-Y.; Truong, Q. D.; Ling, Y.-C. Synthesis of nitrogen-doped graphene by pyrolysis of ionic-liquid-functionalized graphene. Journal of Materials
Chemistry C 2013, 1, 1713-1716. 163. Yang, G.-H.; Zhou, Y.-H.; Wu, J.-J.; Cao, J.-T.; Li, L.-L.; Liu, H.-Y.; Zhu, J.-J. Microwave-assisted synthesis of nitrogen and boron co-doped graphene and its application for enhanced electrochemical detection of hydrogen peroxide. RSC Advances 2013, 3, 22597-22604. 164. Liu, C. L.; Hu, C.-C.; Wu, S.-H.; Wu, T.-H. Electron transfer number control of the oxygen reduction reaction on nitrogen-doped reduced-graphene oxides using experimental design strategies. J. Electrochem. Soc. 2013, 160, H547-H552. 165. Kim, I. T.; Shin, M. W. Synthesis of nitrogen-doped graphene via simple microwave-hydrothermal process. Mater. Lett. 2013, 108, 33-36. 166. Lü, X.; Wu, J.; Lin, T.; Wan, D.; Huang, F.; Xie, X.; Jiang, M. Low-temperature rapid synthesis of high-quality pristine or boron-doped graphene via Wurtz-type reductive coupling reaction. J. Mater. Chem. 2011, 21, 10685-10689. 167. Wu, P.; Cai, Z.; Gao, Y.; Zhang, H.; Cai, C. Enhancing the electrochemical reduction of hydrogen peroxide based on nitrogen-doped graphene for measurement of its releasing process from living cells. Chem. Commun. 2011, 47, 11327-11329. 168. Sun, L.; Wang, L.; Tian, C.; Tan, T.; Xie, Y.; Shi, K.; Li, M.; Fu, H. Nitrogen-doped graphene with high nitrogen level via a one-step hydrothermal reaction of graphene oxide with urea for superior capacitive energy storage. Rsc Advances 2012, 2, 4498-4506. 169. Su, Y.; Zhang, Y.; Zhuang, X.; Li, S.; Wu, D.; Zhang, F.; Feng, X. Low-temperature synthesis of nitrogen/sulfur co-doped three-dimensional graphene frameworks as efficient metal-free electrocatalyst for oxygen reduction reaction. Carbon 2013, 62, 296-301. 170. Jeon, I.-Y.; Choi, H.-J.; Ju, M. J.; Choi, I. T.; Lim, K.; Ko, J.; Kim, H. K.; Kim, J. C.; Lee, J.-J.; Shin, D. Direct nitrogen fixation at the edges of graphene nanoplatelets as efficient electrocatalysts for energy conversion. Scientific reports 2013, 3. 171. Jeon, I. Y.; Zhang, S.; Zhang, L.; Choi, H. J.; Seo, J. M.; Xia, Z.; Dai, L.; Baek, J. B. Edge‐ selectively sulfurized graphene nanoplatelets as efficient metal‐ free electrocatalysts for oxygen reduction reaction: the electron spin effect. Adv. Mater. 2013, 25, 6138-6145. 172. Panchakarla, L.; Subrahmanyam, K.; Saha, S.; Govindaraj, A.; Krishnamurthy, H.; Waghmare, U.; Rao, C. Synthesis, structure, and properties of boron-and nitrogen-doped graphene. Adv. Mater. 2009, 21, 4726. 173. Ci, L.; Song, L.; Jin, C.; Jariwala, D.; Wu, D.; Li, Y.; Srivastava, A.; Wang, Z.; Storr, K.; Balicas, L. Atomic layers of hybridized boron nitride and graphene domains. Nature materials 2010, 9, 430-435. 174. Wu, T.; Shen, H.; Sun, L.; Cheng, B.; Liu, B.; Shen, J. Nitrogen and boron doped monolayer graphene by chemical vapor deposition using polystyrene, urea and boric acid. New J. Chem. 2012, 36, 1385-1391. 175. Wang, H.; Zhou, Y.; Wu, D.; Liao, L.; Zhao, S.; Peng, H.; Liu, Z. Synthesis of Boron‐ Doped Graphene Monolayers Using the Sole Solid Feedstock by Chemical Vapor Deposition. Small 2013, 9, 1316-1320.
51
176. Gao, H.; Liu, Z.; Song, L.; Guo, W.; Gao, W.; Ci, L.; Rao, A.; Quan, W.; Vajtai, R.; Ajayan, P. M. Synthesis of S-doped graphene by liquid precursor. Nanotechnology
2012, 23, 275605. 177. Xu, J.; Dong, G.; Jin, C.; Huang, M.; Guan, L. Sulfur and Nitrogen Co‐ Doped, Few‐ Layered Graphene Oxide as a Highly Efficient Electrocatalyst for the Oxygen‐Reduction Reaction. ChemSusChem 2013, 6, 493-499. 178. Choi, C. H.; Park, S. H.; Woo, S. I. Binary and ternary doping of nitrogen, boron, and phosphorus into carbon for enhancing electrochemical oxygen reduction activity. ACS
nano 2012, 6, 7084-7091. 179. Choi, C. H.; Park, S. H.; Woo, S. I. Phosphorus–nitrogen dual doped carbon as an effective catalyst for oxygen reduction reaction in acidic media: effects of the amount of P-doping on the physical and electrochemical properties of carbon. J. Mater. Chem. 2012, 22, 12107-12115. 180. Patel, M.; Savaram, K.; Keating, K.; He, H. Rapid Transformation of Biomass Compounds to Metal Free Catalysts via Short Microwave Irradiation. Journal of Natural
Products Research Updates 2015, 1, 18-28. 181. Patel, M. A.; Luo, F.; Khoshi, M. R.; Rabie, E.; Zhang, Q.; Flach, C. R.; Mendelsohn, R.; Garfunkel, E.; Szostak, M.; He, H. P-Doped Porous Carbon as Metal Free Catalysts for Selective Aerobic Oxidation with an Unexpected Mechanism. ACS nano
2015. 182. Herrmann, W. A. N‐ Heterocyclic Carbenes: A New Concept in Organometallic Catalysis. Angew. Chem. Int. Ed. 2002, 41, 1290-1309. 183. Zhao, X.; Yin, M.; Ma, L.; Liang, L.; Liu, C.; Liao, J.; Lu, T.; Xing, W. Recent advances in catalysts for direct methanol fuel cells. Energy & Environmental Science 2011, 4, 2736-2753. 184. Bond, G. C.; Thompson, D. T. Catalysis by gold. Catalysis Reviews 1999, 41, 319-388. 185. Du, P.; Eisenberg, R. Catalysts made of earth-abundant elements (Co, Ni, Fe) for water splitting: recent progress and future challenges. Energy & Environmental Science
2012, 5, 6012-6021. 186. Dhakshinamoorthy, A.; Primo, A.; Concepcion, P.; Alvaro, M.; Garcia, H. Doped Graphene as a Metal-Free Carbocatalyst for the Selective Aerobic Oxidation of Benzylic Hydrocarbons, Cyclooctane and Styrene. Chemistry-a European Journal 2013, 19, 7547-7554. 187. Zhang, L.; Niu, J.; Dai, L.; Xia, Z. Effect of microstructure of nitrogen-doped graphene on oxygen reduction activity in fuel cells. Langmuir 2012, 28, 7542-7550. 188. Zhang, L.; Niu, J.; Li, M.; Xia, Z. Catalytic mechanisms of sulfur-doped graphene as efficient oxygen reduction reaction catalysts for fuel cells. The Journal of Physical
Chemistry C 2014, 118, 3545-3553. 189. Zhang, L.; Xia, Z. Mechanisms of oxygen reduction reaction on nitrogen-doped graphene for fuel cells. The Journal of Physical Chemistry C 2011, 115, 11170-11176. 190. Xue, Y.; Liu, J.; Chen, H.; Wang, R.; Li, D.; Qu, J.; Dai, L. Nitrogen‐ doped graphene foams as metal‐ free counter electrodes in high‐ performance dye‐ sensitized solar cells. Angew. Chem. Int. Ed. 2012, 51, 12124-12127.
52
191. Hsu, H.-C.; Shown, I.; Wei, H.-Y.; Chang, Y.-C.; Du, H.-Y.; Lin, Y.-G.; Tseng, C.-A.; Wang, C.-H.; Chen, L.-C.; Lin, Y.-C. Graphene oxide as a promising photocatalyst for CO 2 to methanol conversion. Nanoscale 2013, 5, 262-268. 192. Zeng, F.; Sun, Z.; Sang, X.; Diamond, D.; Lau, K. T.; Liu, X.; Su, D. S. In situ one‐ step electrochemical preparation of graphene oxide nanosheet‐ modified electrodes for biosensors. ChemSusChem 2011, 4, 1587-1591. 193. Wu, P.; Qian, Y.; Du, P.; Zhang, H.; Cai, C. Facile synthesis of nitrogen-doped graphene for measuring the releasing process of hydrogen peroxide from living cells. J.
Mater. Chem. 2012, 22, 6402-6412. 194. Wu, P.; Du, P.; Zhang, H.; Cai, C. Microscopic effects of the bonding configuration of nitrogen-doped graphene on its reactivity toward hydrogen peroxide reduction reaction. PCCP 2013, 15, 6920-6928. 195. Steele, B. C.; Heinzel, A. Materials for fuel-cell technologies. Nature 2001, 414, 345-352. 196. Yu, Y.; Hu, Y.; Liu, X.; Deng, W.; Wang, X. The study of Pt@ Au electrocatalyst based on Cu underpotential deposition and Pt redox replacement. Electrochim. Acta 2009, 54, 3092-3097. 197. Geng, D.; Chen, Y.; Chen, Y.; Li, Y.; Li, R.; Sun, X.; Ye, S.; Knights, S. High oxygen-reduction activity and durability of nitrogen-doped graphene. Energy &
Environmental Science 2011, 4, 760-764. 198. Wu, Z.; Iqbal, Z.; Wang, X. Metal-free, carbon-based catalysts for oxygen reduction reactions. Frontiers of Chemical Science and Engineering 2015, 9, 280-294. 199. Lee, K. R.; Lee, K. U.; Lee, J. W.; Ahn, B. T.; Woo, S. I. Electrochemical oxygen reduction on nitrogen doped graphene sheets in acid media. Electrochem. Commun. 2010, 12, 1052-1055. 200. Niwa, H.; Horiba, K.; Harada, Y.; Oshima, M.; Ikeda, T.; Terakura, K.; Ozaki, J.-i.; Miyata, S. X-ray absorption analysis of nitrogen contribution to oxygen reduction reaction in carbon alloy cathode catalysts for polymer electrolyte fuel cells. J. Power
Sources 2009, 187, 93-97. 201. Wang, P.; Wang, Z.; Jia, L.; Xiao, Z. Origin of the catalytic activity of graphite nitride for the electrochemical reduction of oxygen: geometric factors vs. electronic factors. PCCP 2009, 11, 2730-2740. 202. Lin, Z.; Waller, G. H.; Liu, Y.; Liu, M.; Wong, C.-p. 3D Nitrogen-doped graphene prepared by pyrolysis of graphene oxide with polypyrrole for electrocatalysis of oxygen reduction reaction. Nano Energy 2013, 2, 241-248. 203. Kong, X.; Chen, Q.; Sun, Z. Enhanced Oxygen Reduction Reactions in Fuel Cells on H‐ Decorated and B‐ Substituted Graphene. ChemPhysChem 2013, 14, 514-519. 204. Okamoto, Y. First-principles molecular dynamics simulation of O 2 reduction on nitrogen-doped carbon. Appl. Surf. Sci. 2009, 256, 335-341. 205. Zheng, Y.; Jiao, Y.; Ge, L.; Jaroniec, M.; Qiao, S. Z. Two‐ Step Boron and Nitrogen Doping in Graphene for Enhanced Synergistic Catalysis. Angew. Chem. 2013, 125, 3192-3198. 206. Choi, C. H.; Chung, M. W.; Kwon, H. C.; Park, S. H.; Woo, S. I. B, N-and P, N-doped graphene as highly active catalysts for oxygen reduction reactions in acidic media. Journal of Materials Chemistry A 2013, 1, 3694-3699.
53
207. Navalon, S.; Dhakshinamoorthy, A.; Alvaro, M.; Garcia, H. Carbocatalysis by Graphene-Based Materials. Chemical Reviews 2014, 114, 6179-6212. 208. Jia, H. P.; Dreyer, D. R.; Bielawski, C. W. Graphite Oxide as an Auto-Tandem Oxidation-Hydration-Aldol Coupling Catalyst. Adv. Synth. Catal. 2011, 353, 528-532. 209. Jia, H. P.; Dreyer, D. R.; Bielawski, C. W. C-H oxidation using graphite oxide. Tetrahedron 2011, 67, 4431-4434. 210. Dreyer, D. R.; Jia, H. P.; Bielawski, C. W. Graphene oxide: a convenient carbocatalyst for facilitating oxidation and hydration reactions. Angew. Chem. Int. Ed.
Engl. 2010, 49, 6813-6. 211. Dreyer, D. R.; Park, S.; Bielawski, C. W.; Ruoff, R. S. The chemistry of graphene oxide. Chem. Soc. Rev. 2010, 39, 228-240. 212. Dreyer, D. R.; Jia, H. P.; Bielawski, C. W. Graphene oxide: a convenient carbocatalyst for facilitating oxidation and hydration reactions. Angewandte Chemie 2010, 122, 6965-6968. 213. Dreyer, D. R.; Jia, H.-P.; Todd, A. D.; Geng, J.; Bielawski, C. W. Graphite oxide: a selective and highly efficient oxidant of thiols and sulfides. Organic & biomolecular
chemistry 2011, 9, 7292-7295. 214. Jia, H.-P.; Dreyer, D. R.; Bielawski, C. W. C–H oxidation using graphite oxide. Tetrahedron 2011, 67, 4431-4434. 215. Jia, H. P.; Dreyer, D. R.; Bielawski, C. W. Graphite Oxide as an Auto‐ Tandem Oxidation–Hydration–Aldol Coupling Catalyst. Adv. Synth. Catal. 2011, 353, 528-532. 216. Pan, Y.; Wang, S.; Kee, C. W.; Dubuisson, E.; Yang, Y.; Loh, K. P.; Tan, C.-H. Graphene oxide and Rose Bengal: oxidative C–H functionalisation of tertiary amines using visible light. Green chemistry 2011, 13, 3341-3344. 217. Su, C.; Acik, M.; Takai, K.; Lu, J.; Hao, S.-j.; Zheng, Y.; Wu, P.; Bao, Q.; Enoki, T.; Chabal, Y. J. Probing the catalytic activity of porous graphene oxide and the origin of this behaviour. Nature communications 2012, 3, 1298. 218. Long, Y.; Zhang, C.; Wang, X.; Gao, J.; Wang, W.; Liu, Y. Oxidation of SO 2 to SO 3 catalyzed by graphene oxide foams. J. Mater. Chem. 2011, 21, 13934-13941. 219. Dhakshinamoorthy, A.; Alvaro, M.; Concepción, P.; Fornés, V.; Garcia, H. Graphene oxide as an acid catalyst for the room temperature ring opening of epoxides. Chem. Commun. 2012, 48, 5443-5445. 220. Dhakshinamoorthy, A.; Alvaro, M.; Puche, M.; Fornes, V.; Garcia, H. Graphene oxide as catalyst for the acetalization of aldehydes at room temperature. ChemCatChem
2012, 4, 2026-2030. 221. Verma, S.; Mungse, H. P.; Kumar, N.; Choudhary, S.; Jain, S. L.; Sain, B.; Khatri, O. P. Graphene oxide: an efficient and reusable carbocatalyst for aza-Michael addition of amines to activated alkenes. Chem. Commun. 2011, 47, 12673-12675. 222. Kumar, A. V.; Rao, K. R. Recyclable graphite oxide catalyzed Friedel–Crafts addition of indoles to α, β-unsaturated ketones. Tetrahedron Lett. 2011, 52, 5188-5191. 223. Hu, F.; Patel, M.; Luo, F.; Flach, C.; Mendelsohn, R.; Garfunkel, E.; He, H.; Szostak, M. Graphene-Catalyzed Direct Friedel–Crafts Alkylation Reactions: Mechanism, Selectivity, and Synthetic Utility. J. Am. Chem. Soc. 2015, 137, 14473-14480. 224. Tang, S.; Cao, Z. Site-dependent catalytic activity of graphene oxides towards oxidative dehydrogenation of propane. PCCP 2012, 14, 16558-16565.
54
225. Schwartz, V.; Fu, W.; Tsai, Y. T.; Meyer, H. M.; Rondinone, A. J.; Chen, J.; Wu, Z.; Overbury, S. H.; Liang, C. Oxygen‐ Functionalized Few‐ Layer Graphene Sheets as Active Catalysts for Oxidative Dehydrogenation Reactions. ChemSusChem 2013, 6, 840-846. 226. Patel, M. A.; Luo, F.; Khoshi, M. R.; Rabie, E.; Zhang, Q.; Flach, C. R.; Mendelsohn, R.; Garfunkel, E.; Szostak, M.; He, H. P-Doped Porous Carbon as Metal Free Catalysts for Selective Aerobic Oxidation with an Unexpected Mechanism. ACS Nano
2016, 10, 2305-2315. 227. Boukhvalov, D. W.; Dreyer, D. R.; Bielawski, C. W.; Son, Y. W. A computational investigation of the catalytic properties of graphene oxide: Exploring mechanisms by using DFT methods. ChemCatChem 2012, 4, 1844-1849. 228. Gao, Y.; Hu, G.; Zhong, J.; Shi, Z.; Zhu, Y.; Su, D. S.; Wang, J.; Bao, X.; Ma, D. Nitrogen‐ Doped sp2‐ Hybridized Carbon as a Superior Catalyst for Selective Oxidation. Angew. Chem. Int. Ed. 2013, 52, 2109-2113. 229. Long, J. L.; Xie, X. Q.; Xu, J.; Gu, Q.; Chen, L. M.; Wang, X. X. Nitrogen-Doped Graphene Nanosheets as Metal-Free Catalysts for Aerobic Selective Oxidation of Benzylic Alcohols. Acs Catalysis 2012, 2, 622-631. 230. Watanabe, H.; Asano, S.; Fujita, S.-i.; Yoshida, H.; Arai, M. Nitrogen-Doped, Metal-Free Activated Carbon Catalysts for Aerobic Oxidation of Alcohols. ACS Catalysis
2015, 5, 2886-2894. 231. Meng, Y.; Voiry, D.; Goswami, A.; Zou, X.; Huang, X.; Chhowalla, M.; Liu, Z.; Asefa, T. N-, O-, and S-Tridoped Nanoporous Carbons as Selective Catalysts for Oxygen Reduction and Alcohol Oxidation Reactions. J. Am. Chem. Soc. 2014, 136, 13554-13557. 232. Li, W. J.; Gao, Y. J.; Chen, W. L.; Tang, P.; Li, W. Z.; Shi, Z. J.; Su, D. S.; Wang, J. G.; Ma, D. Catalytic Epoxidation Reaction over N-Containing sp(2) Carbon Catalysts. Acs Catalysis 2014, 4, 1261-1266. 233. Kong, X.-k.; Sun, Z.-y.; Chen, M.; Chen, Q.-w. Metal-free catalytic reduction of 4-nitrophenol to 4-aminophenol by N-doped graphene. Energy & Environmental Science
2013, 6, 3260-3266. 234. Chen, T.-W.; Xu, J.-Y.; Sheng, Z.-H.; Wang, K.; Wang, F.-B.; Liang, T.-M.; Xia, X.-H. Enhanced electrocatalytic activity of nitrogen-doped graphene for the reduction of nitro explosives. Electrochem. Commun. 2012, 16, 30-33. 235. Hayes, B. L. Microwave synthesis: chemistry at the speed of light. 2002. 236. Kappe, C. O. Controlled microwave heating in modern organic synthesis. Angew.
Chem. Int. Ed. 2004, 43, 6250-6284. 237. Wiesbrock, F.; Hoogenboom, R.; Schubert, U. S. Microwave‐ assisted polymer synthesis: state‐ of‐ the‐ art and future perspectives. Macromol. Rapid Commun. 2004, 25, 1739-1764. 238. Roberts, B. A.ν Strauss, C. R. Toward rapid,“green”, predictable microwave-assisted synthesis. Acc. Chem. Res. 2005, 38, 653-661. 239. Gerbec, J. A.; Magana, D.; Washington, A.; Strouse, G. F. Microwave-enhanced reaction rates for nanoparticle synthesis. J. Am. Chem. Soc. 2005, 127, 15791-15800. 240. Motasemi, F.; Afzal, M. T. A review on the microwave-assisted pyrolysis technique. Renewable and Sustainable Energy Reviews 2013, 28, 317-330.
55
241. Mutyala, S.; Fairbridge, C.; Paré, J. J.; Bélanger, J. M.; Ng, S.; Hawkins, R. Microwave applications to oil sands and petroleum: A review. Fuel Process. Technol.
2010, 91, 127-135. 242. Abubakar, Z.; Salema, A. A.; Ani, F. N. A new technique to pyrolyse biomass in a microwave system: effect of stirrer speed. Bioresour. Technol. 2013, 128, 578-585. 243. Mudgett, R. Microwave food processing. Food technology (USA) 1989. 244. Zlotorzynski, A. The application of microwave radiation to analytical and environmental chemistry. Crit. Rev. Anal. Chem. 1995, 25, 43-76. 245. Datta, A. K.; Davidson, P. M. Microwave and radio frequency processing. J. Food
Sci. 2000, 65, 32-41. 246. Galema, S. A. Microwave chemistry. Chem. Soc. Rev. 1997, 26, 233-238. 247. Thostenson, E.; Chou, T.-W. Microwave processing: fundamentals and applications. Composites Part A: Applied Science and Manufacturing 1999, 30, 1055-1071. 248. Kingston, H. M.; Jassie, L. B. Introduction to microwave sample preparation:
theory and practice. American Chemical Society: 1988. 249. Vázquez, E.; Giacalone, F.; Prato, M. Non-conventional methods and media for the activation and manipulation of carbon nanoforms. Chem. Soc. Rev. 2014, 43, 58-69. 250. Faraji, S.; Ani, F. N. Microwave-assisted synthesis of metal oxide/hydroxide composite electrodes for high power supercapacitors–a review. J. Power Sources 2014, 263, 338-360.
56
Chapter 2. Direct Production of Graphene Nanosheets for Near
Infrared Photoacoustic Imaging
2.1. Introduction
Recently, there has been a surge of interest in nanosized graphene sheets due to
their unique size effects,1-4 edge effects,5-7 and even quantum confinement effects,8 in
addition to the intrinsic exotic properties of graphene. Several strategies have been
developed to fabricate nanosized graphene sheets.8-10 Most of them rely on chemical
oxidation via Hummers’ method or other modified Hummers’ methods, which always
involve the oxidization of graphite powder to produce heavily oxidized graphene sheets
termed graphene oxide (GO).11 The oxidation reaction is a lengthy process (from hours to
several days) and the aggressive chemistry also leads to uncontrollable cutting/unzipping
of graphene sheets into small pieces of different sizes and shapes with extensive defects.12,
13
To reach predefined nanometer-sized GO sheets, extended oxidation and
sonication14 or other oxidative cutting reactions are required.10, 15 Alternatively, nanosized
GO sheets can be synthesized using starting materials which are already small such as
graphite nanofibers or carbon fibers.16, 17 In GO, most of the exotic properties of graphene
have vanished due to the high density of oxygen containing groups that heavily distort and
break up the -conjugated structure. Various approaches to reduce GO including chemical,
electrochemical, and hydrothermal methods have been explored with only a fraction of the
graphene properties recovered.4, 8, 9, 18-20 No strategy has been reported to directly fabricate
graphene nanosheets (instead of GO nanosheets) in a one-pot reaction. Theoretical studies
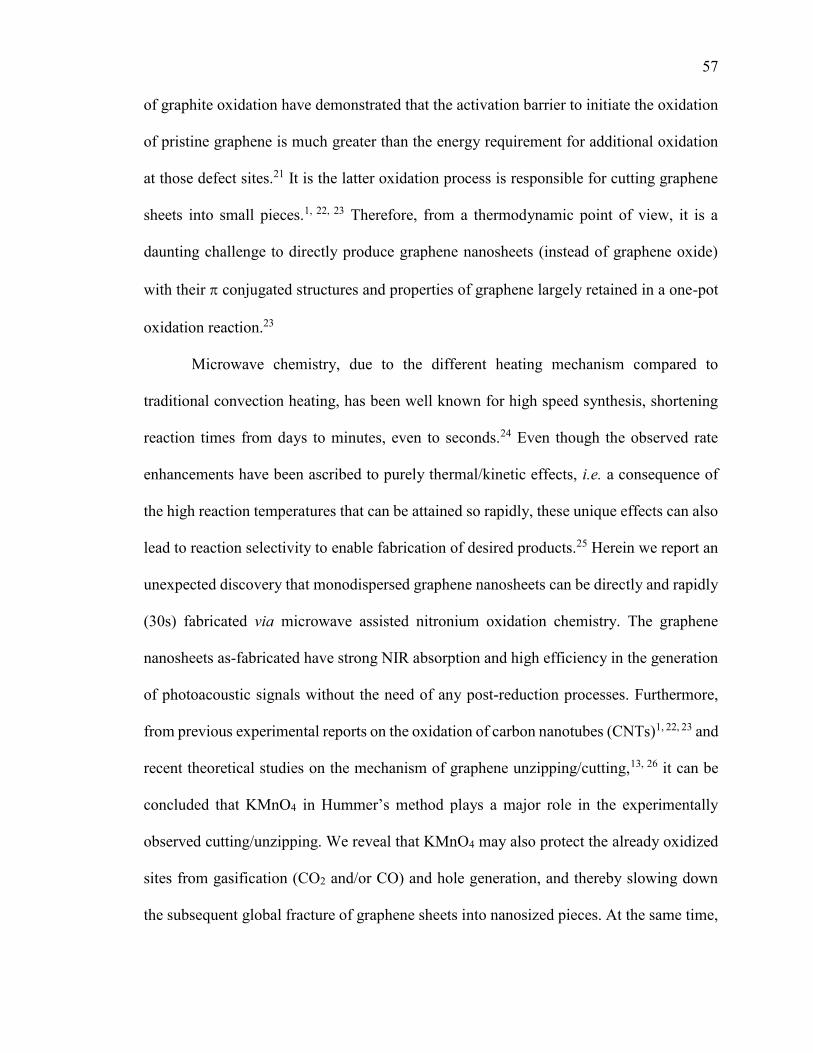
57
of graphite oxidation have demonstrated that the activation barrier to initiate the oxidation
of pristine graphene is much greater than the energy requirement for additional oxidation
at those defect sites.21 It is the latter oxidation process is responsible for cutting graphene
sheets into small pieces.1, 22, 23 Therefore, from a thermodynamic point of view, it is a
daunting challenge to directly produce graphene nanosheets (instead of graphene oxide)
with their conjugated structures and properties of graphene largely retained in a one-pot
oxidation reaction.23
Microwave chemistry, due to the different heating mechanism compared to
traditional convection heating, has been well known for high speed synthesis, shortening
reaction times from days to minutes, even to seconds.24 Even though the observed rate
enhancements have been ascribed to purely thermal/kinetic effects, i.e. a consequence of
the high reaction temperatures that can be attained so rapidly, these unique effects can also
lead to reaction selectivity to enable fabrication of desired products.25 Herein we report an
unexpected discovery that monodispersed graphene nanosheets can be directly and rapidly
(30s) fabricated via microwave assisted nitronium oxidation chemistry. The graphene
nanosheets as-fabricated have strong NIR absorption and high efficiency in the generation
of photoacoustic signals without the need of any post-reduction processes. Furthermore,
from previous experimental reports on the oxidation of carbon nanotubes (CNTs)1, 22, 23 and
recent theoretical studies on the mechanism of graphene unzipping/cutting,13, 26 it can be
concluded that KMnO4 in Hummer’s method plays a major role in the experimentally
observed cutting/unzipping. We reveal that KMnO4 may also protect the already oxidized
sites from gasification (CO2 and/or CO) and hole generation, and thereby slowing down
the subsequent global fracture of graphene sheets into nanosized pieces. At the same time,
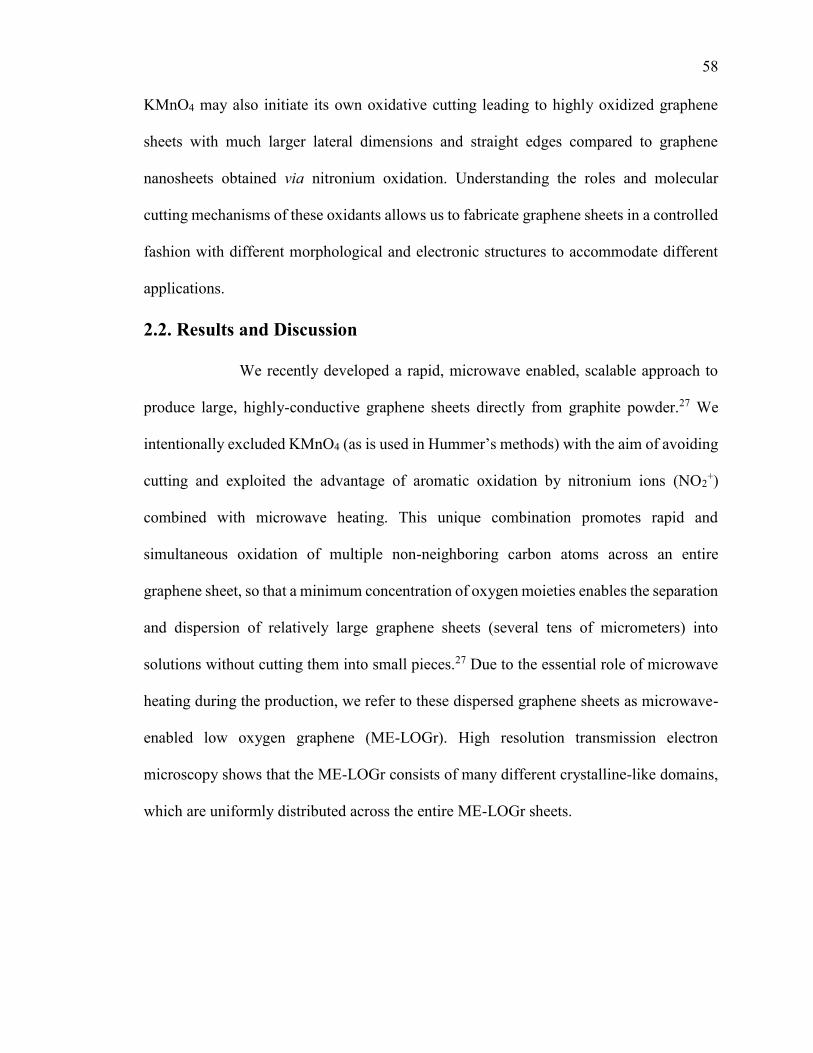
58
KMnO4 may also initiate its own oxidative cutting leading to highly oxidized graphene
sheets with much larger lateral dimensions and straight edges compared to graphene
nanosheets obtained via nitronium oxidation. Understanding the roles and molecular
cutting mechanisms of these oxidants allows us to fabricate graphene sheets in a controlled
fashion with different morphological and electronic structures to accommodate different
applications.
2.2. Results and Discussion
We recently developed a rapid, microwave enabled, scalable approach to
produce large, highly-conductive graphene sheets directly from graphite powder.27 We
intentionally excluded KMnO4 (as is used in Hummer’s methods) with the aim of avoiding
cutting and exploited the advantage of aromatic oxidation by nitronium ions (NO2+)
combined with microwave heating. This unique combination promotes rapid and
simultaneous oxidation of multiple non-neighboring carbon atoms across an entire
graphene sheet, so that a minimum concentration of oxygen moieties enables the separation
and dispersion of relatively large graphene sheets (several tens of micrometers) into
solutions without cutting them into small pieces.27 Due to the essential role of microwave
heating during the production, we refer to these dispersed graphene sheets as microwave-
enabled low oxygen graphene (ME-LOGr). High resolution transmission electron
microscopy shows that the ME-LOGr consists of many different crystalline-like domains,
which are uniformly distributed across the entire ME-LOGr sheets.
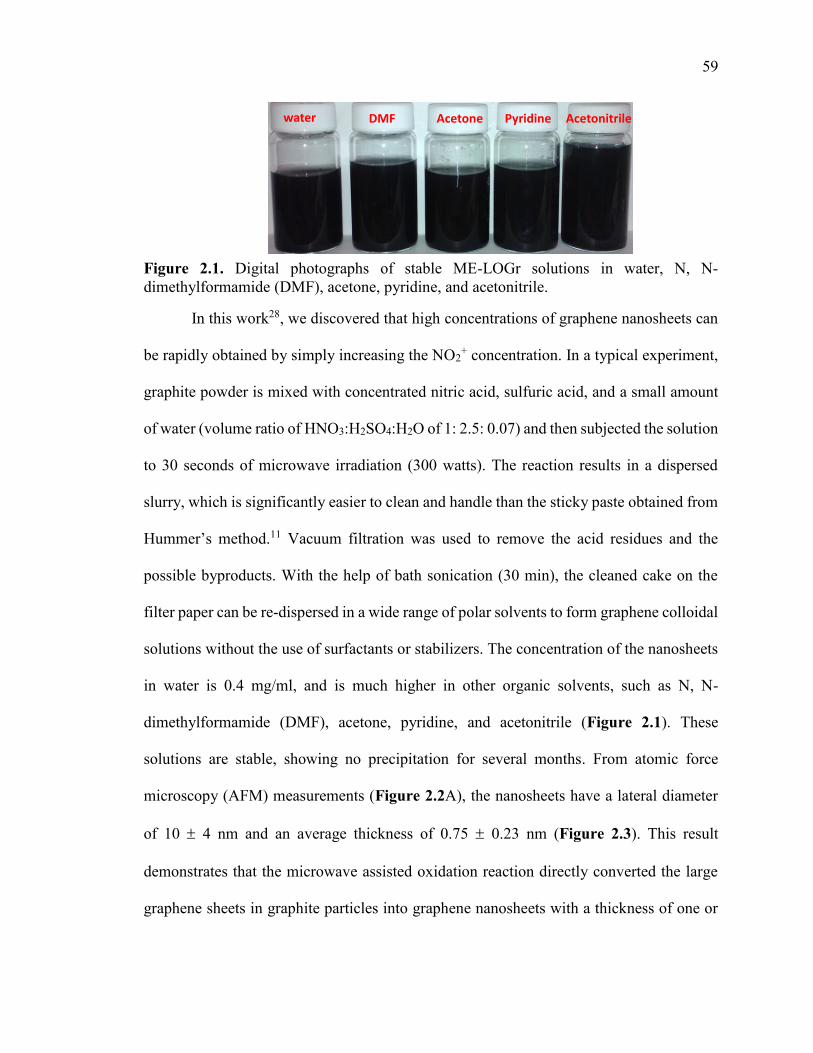
59
Figure 2.1. Digital photographs of stable ME-LOGr solutions in water, N, N-dimethylformamide (DMF), acetone, pyridine, and acetonitrile.
In this work28, we discovered that high concentrations of graphene nanosheets can
be rapidly obtained by simply increasing the NO2+ concentration. In a typical experiment,
graphite powder is mixed with concentrated nitric acid, sulfuric acid, and a small amount
of water (volume ratio of HNO3:H2SO4:H2O of 1: 2.5: 0.07) and then subjected the solution
to 30 seconds of microwave irradiation (300 watts). The reaction results in a dispersed
slurry, which is significantly easier to clean and handle than the sticky paste obtained from
Hummer’s method.11 Vacuum filtration was used to remove the acid residues and the
possible byproducts. With the help of bath sonication (30 min), the cleaned cake on the
filter paper can be re-dispersed in a wide range of polar solvents to form graphene colloidal
solutions without the use of surfactants or stabilizers. The concentration of the nanosheets
in water is 0.4 mg/ml, and is much higher in other organic solvents, such as N, N-
dimethylformamide (DMF), acetone, pyridine, and acetonitrile (Figure 2.1). These
solutions are stable, showing no precipitation for several months. From atomic force
microscopy (AFM) measurements (Figure 2.2A), the nanosheets have a lateral diameter
of 10 4 nm and an average thickness of 0.75 0.23 nm (Figure 2.3). This result
demonstrates that the microwave assisted oxidation reaction directly converted the large
graphene sheets in graphite particles into graphene nanosheets with a thickness of one or
water DMF Acetone Pyridine Acetonitrile
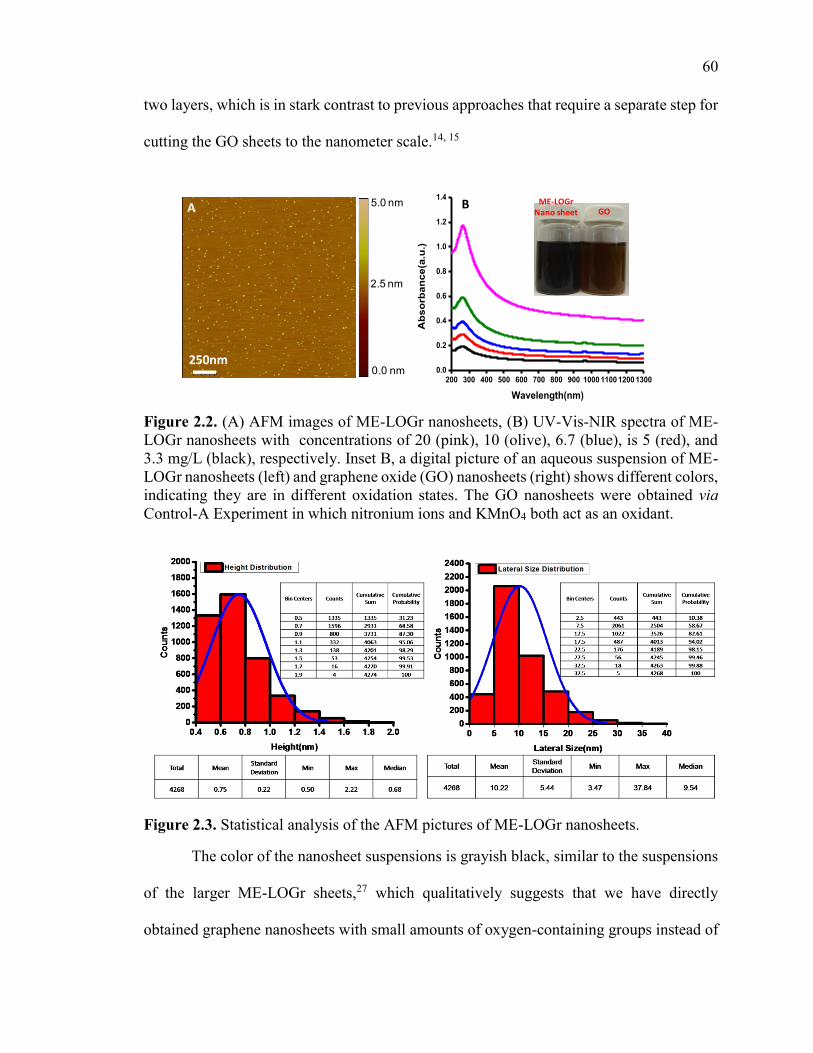
60
two layers, which is in stark contrast to previous approaches that require a separate step for
cutting the GO sheets to the nanometer scale.14, 15
Figure 2.2. (A) AFM images of ME-LOGr nanosheets, (B) UV-Vis-NIR spectra of ME-LOGr nanosheets with concentrations of 20 (pink), 10 (olive), 6.7 (blue), is 5 (red), and 3.3 mg/L (black), respectively. Inset B, a digital picture of an aqueous suspension of ME-LOGr nanosheets (left) and graphene oxide (GO) nanosheets (right) shows different colors, indicating they are in different oxidation states. The GO nanosheets were obtained via Control-A Experiment in which nitronium ions and KMnO4 both act as an oxidant.
Figure 2.3. Statistical analysis of the AFM pictures of ME-LOGr nanosheets.
The color of the nanosheet suspensions is grayish black, similar to the suspensions
of the larger ME-LOGr sheets,27 which qualitatively suggests that we have directly
obtained graphene nanosheets with small amounts of oxygen-containing groups instead of
ME-LOGr
Nano sheet GO
200 300 400 500 600 700 800 900 1000 1100 1200 1300
0.0
0.2
0.4
0.6
0.8
1.0
1.2
1.4
Ab
so
rban
ce(a
.u.)
Wavelength(nm)
B
250nm
5.0 nm
2.5 nm
0.0 nm
A
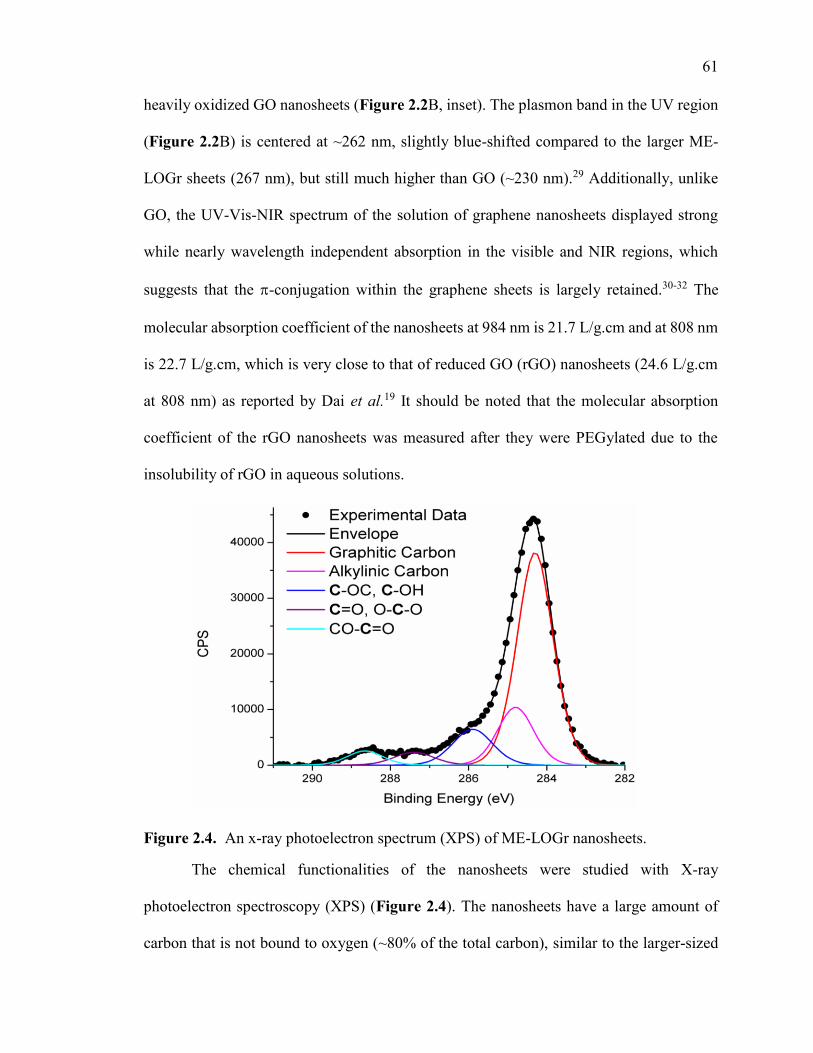
61
heavily oxidized GO nanosheets (Figure 2.2B, inset). The plasmon band in the UV region
(Figure 2.2B) is centered at ~262 nm, slightly blue-shifted compared to the larger ME-
LOGr sheets (267 nm), but still much higher than GO (~230 nm).29 Additionally, unlike
GO, the UV-Vis-NIR spectrum of the solution of graphene nanosheets displayed strong
while nearly wavelength independent absorption in the visible and NIR regions, which
suggests that the -conjugation within the graphene sheets is largely retained.30-32 The
molecular absorption coefficient of the nanosheets at 984 nm is 21.7 L/g.cm and at 808 nm
is 22.7 L/g.cm, which is very close to that of reduced GO (rGO) nanosheets (24.6 L/g.cm
at 808 nm) as reported by Dai et al.19 It should be noted that the molecular absorption
coefficient of the rGO nanosheets was measured after they were PEGylated due to the
insolubility of rGO in aqueous solutions.
Figure 2.4. An x-ray photoelectron spectrum (XPS) of ME-LOGr nanosheets.
The chemical functionalities of the nanosheets were studied with X-ray
photoelectron spectroscopy (XPS) (Figure 2.4). The nanosheets have a large amount of
carbon that is not bound to oxygen (~80% of the total carbon), similar to the larger-sized
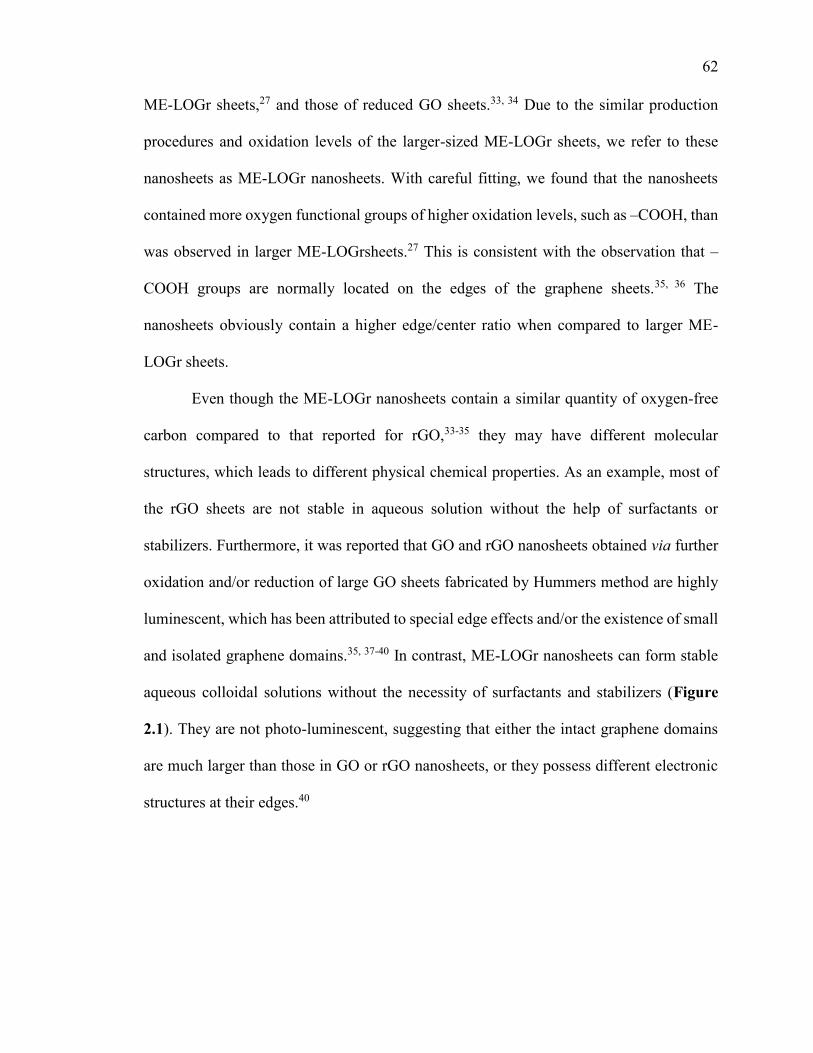
62
ME-LOGr sheets,27 and those of reduced GO sheets.33, 34 Due to the similar production
procedures and oxidation levels of the larger-sized ME-LOGr sheets, we refer to these
nanosheets as ME-LOGr nanosheets. With careful fitting, we found that the nanosheets
contained more oxygen functional groups of higher oxidation levels, such as –COOH, than
was observed in larger ME-LOGrsheets.27 This is consistent with the observation that –
COOH groups are normally located on the edges of the graphene sheets.35, 36 The
nanosheets obviously contain a higher edge/center ratio when compared to larger ME-
LOGr sheets.
Even though the ME-LOGr nanosheets contain a similar quantity of oxygen-free
carbon compared to that reported for rGO,33-35 they may have different molecular
structures, which leads to different physical chemical properties. As an example, most of
the rGO sheets are not stable in aqueous solution without the help of surfactants or
stabilizers. Furthermore, it was reported that GO and rGO nanosheets obtained via further
oxidation and/or reduction of large GO sheets fabricated by Hummers method are highly
luminescent, which has been attributed to special edge effects and/or the existence of small
and isolated graphene domains.35, 37-40 In contrast, ME-LOGr nanosheets can form stable
aqueous colloidal solutions without the necessity of surfactants and stabilizers (Figure
2.1). They are not photo-luminescent, suggesting that either the intact graphene domains
are much larger than those in GO or rGO nanosheets, or they possess different electronic
structures at their edges.40
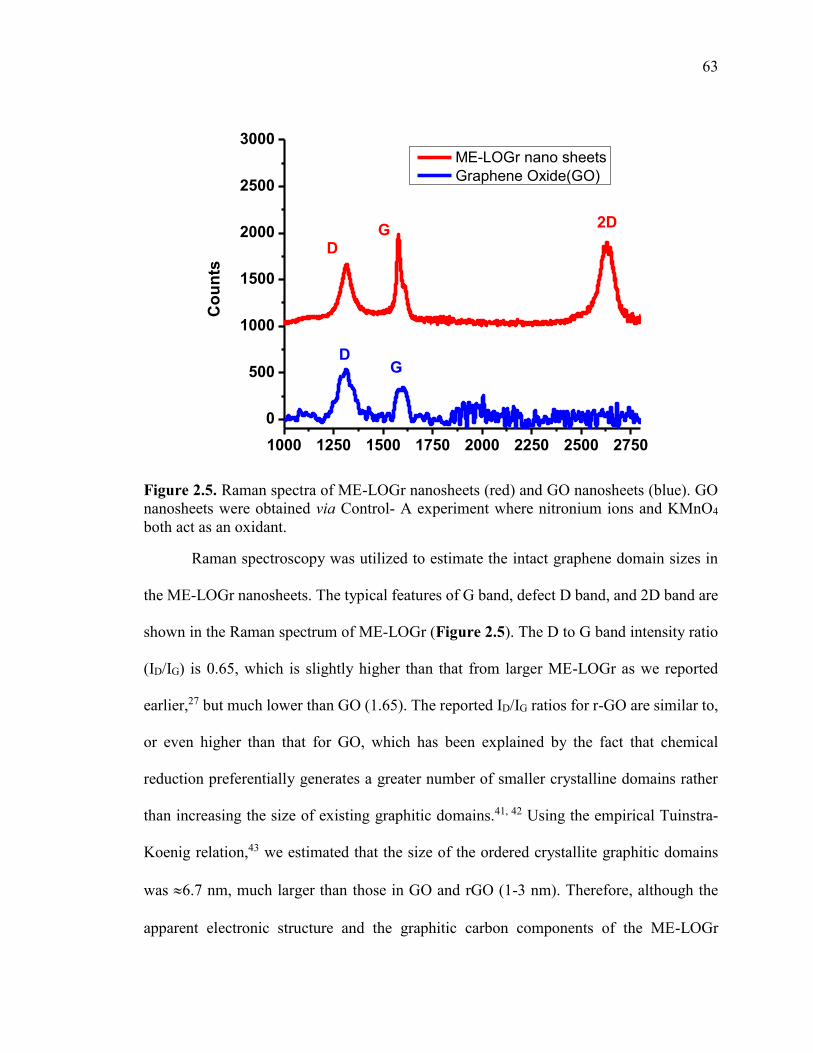
63
Figure 2.5. Raman spectra of ME-LOGr nanosheets (red) and GO nanosheets (blue). GO nanosheets were obtained via Control- A experiment where nitronium ions and KMnO4 both act as an oxidant.
Raman spectroscopy was utilized to estimate the intact graphene domain sizes in
the ME-LOGr nanosheets. The typical features of G band, defect D band, and 2D band are
shown in the Raman spectrum of ME-LOGr (Figure 2.5). The D to G band intensity ratio
(ID/IG) is 0.65, which is slightly higher than that from larger ME-LOGr as we reported
earlier,27 but much lower than GO (1.65). The reported ID/IG ratios for r-GO are similar to,
or even higher than that for GO, which has been explained by the fact that chemical
reduction preferentially generates a greater number of smaller crystalline domains rather
than increasing the size of existing graphitic domains.41, 42 Using the empirical Tuinstra-
Koenig relation,43 we estimated that the size of the ordered crystallite graphitic domains
was 6.7 nm, much larger than those in GO and rGO (1-3 nm). Therefore, although the
apparent electronic structure and the graphitic carbon components of the ME-LOGr
1000 1250 1500 1750 2000 2250 2500 2750
0
500
1000
1500
2000
2500
3000
Co
un
ts
x0 = -58.2
ME-LOGr nano sheets
Graphene Oxide(GO)
DG
2D
DG
64
nanosheets are similar to rGO, as demonstrated by their color, UV-Vis-NIR and XPS
spectra, the ME-LOGr sheets have unique molecular structures that differ from both GO
and r-GO.42, 44
It has been reported that the 2D band in GO is absent.34, 42 Additionally, the
reduction of GO results in only a small increase in the 2D band intensity, presumably due
to the defects in the graphitic structures.41 A decrease of the 2D band intensity has also
been associated with the modification of pristine graphene through chemisorption45 and
physisorption.46, 47 However, for ME-LOGr nanosheets, the intensity of the 2D band is
similar to that of the G band. The small intensity ratio of D/G bands and the high intensity
of 2D band are in contrast to the larger D/G band ratio and the absence of the 2D band in
GO and rGO, indicating that the intrinsic structure and properties of graphene were largely
retained in ME-LOGr nanosheets, and these nanosheets are clean without adsorbent-
induced surface modification.41
All of these results collectively demonstrate that with microwave heating and
nitronium oxidation of graphite particles directly leads to relatively “clean” graphene
nanosheets instead of GO nanosheets as produced via Hummer’s method.11 The molecular
mechanism for the experimentally observed graphite oxidation and the accompanied
graphene sheet cutting via Hummer’s method remains elusive. From density functional
calculations, it has been reported that graphene cutting is likely initiated by the formation
of an epoxy group. The strain associated with epoxy group formation on graphene
facilitates the generation of another epoxy group at its nearest neighbor, and finally leads
to linearly aligned epoxy groups on the surface as the oxidation progresses.13, 26, 48 These
aligned epoxy groups co-operatively strain the graphene sheets, which accounts for the GO
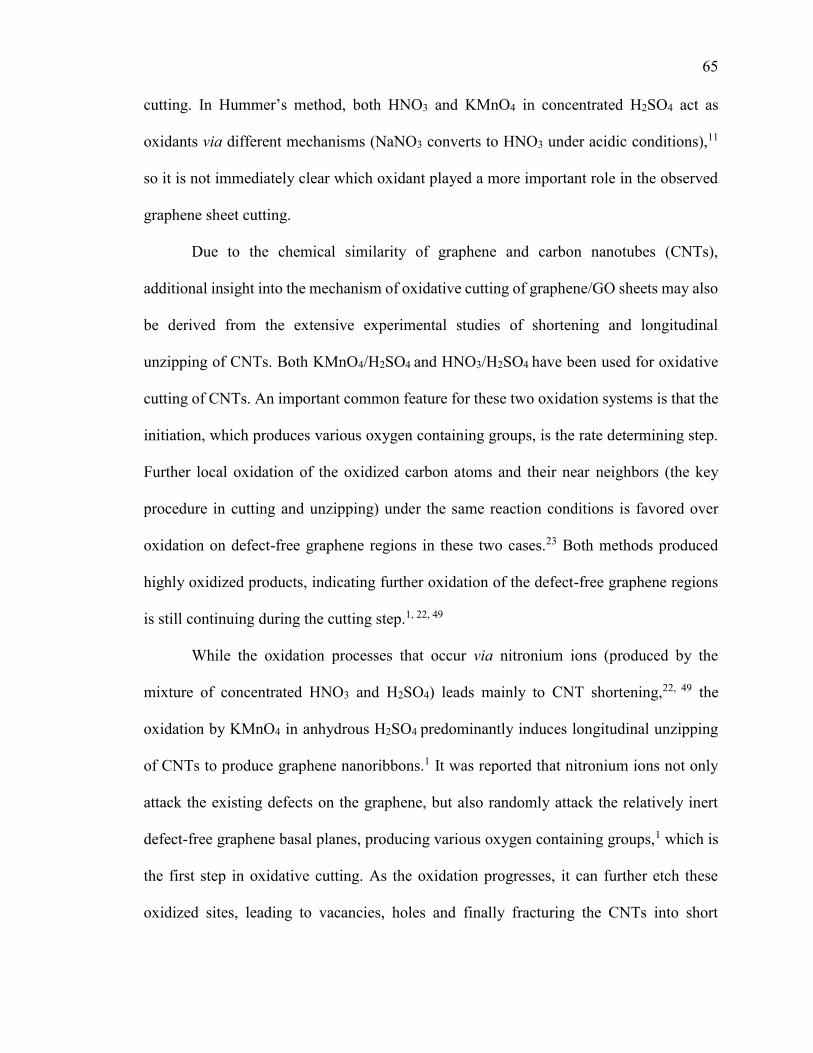
65
cutting. In Hummer’s method, both HNO3 and KMnO4 in concentrated H2SO4 act as
oxidants via different mechanisms (NaNO3 converts to HNO3 under acidic conditions),11
so it is not immediately clear which oxidant played a more important role in the observed
graphene sheet cutting.
Due to the chemical similarity of graphene and carbon nanotubes (CNTs),
additional insight into the mechanism of oxidative cutting of graphene/GO sheets may also
be derived from the extensive experimental studies of shortening and longitudinal
unzipping of CNTs. Both KMnO4/H2SO4 and HNO3/H2SO4 have been used for oxidative
cutting of CNTs. An important common feature for these two oxidation systems is that the
initiation, which produces various oxygen containing groups, is the rate determining step.
Further local oxidation of the oxidized carbon atoms and their near neighbors (the key
procedure in cutting and unzipping) under the same reaction conditions is favored over
oxidation on defect-free graphene regions in these two cases.23 Both methods produced
highly oxidized products, indicating further oxidation of the defect-free graphene regions
is still continuing during the cutting step.1, 22, 49
While the oxidation processes that occur via nitronium ions (produced by the
mixture of concentrated HNO3 and H2SO4) leads mainly to CNT shortening,22, 49 the
oxidation by KMnO4 in anhydrous H2SO4 predominantly induces longitudinal unzipping
of CNTs to produce graphene nanoribbons.1 It was reported that nitronium ions not only
attack the existing defects on the graphene, but also randomly attack the relatively inert
defect-free graphene basal planes, producing various oxygen containing groups,1 which is
the first step in oxidative cutting. As the oxidation progresses, it can further etch these
oxidized sites, leading to vacancies, holes and finally fracturing the CNTs into short
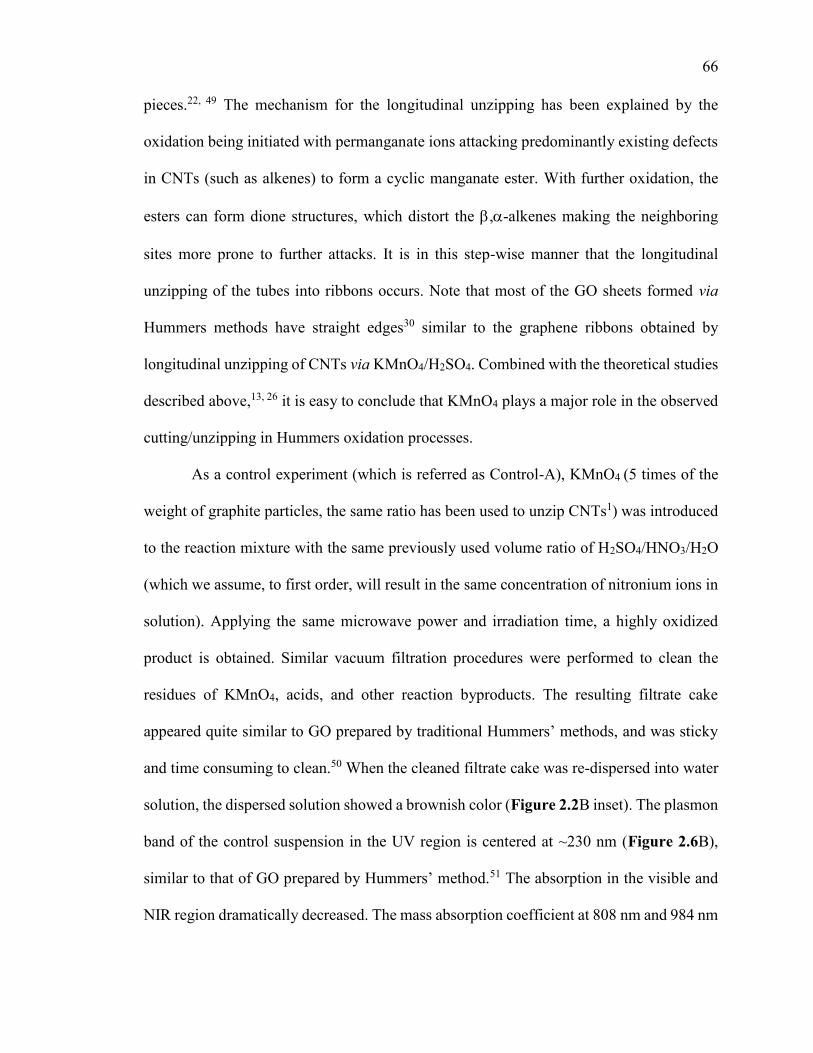
66
pieces.22, 49 The mechanism for the longitudinal unzipping has been explained by the
oxidation being initiated with permanganate ions attacking predominantly existing defects
in CNTs (such as alkenes) to form a cyclic manganate ester. With further oxidation, the
esters can form dione structures, which distort the ,-alkenes making the neighboring
sites more prone to further attacks. It is in this step-wise manner that the longitudinal
unzipping of the tubes into ribbons occurs. Note that most of the GO sheets formed via
Hummers methods have straight edges30 similar to the graphene ribbons obtained by
longitudinal unzipping of CNTs via KMnO4/H2SO4. Combined with the theoretical studies
described above,13, 26 it is easy to conclude that KMnO4 plays a major role in the observed
cutting/unzipping in Hummers oxidation processes.
As a control experiment (which is referred as Control-A), KMnO4 (5 times of the
weight of graphite particles, the same ratio has been used to unzip CNTs1) was introduced
to the reaction mixture with the same previously used volume ratio of H2SO4/HNO3/H2O
(which we assume, to first order, will result in the same concentration of nitronium ions in
solution). Applying the same microwave power and irradiation time, a highly oxidized
product is obtained. Similar vacuum filtration procedures were performed to clean the
residues of KMnO4, acids, and other reaction byproducts. The resulting filtrate cake
appeared quite similar to GO prepared by traditional Hummers’ methods, and was sticky
and time consuming to clean.50 When the cleaned filtrate cake was re-dispersed into water
solution, the dispersed solution showed a brownish color (Figure 2.2B inset). The plasmon
band of the control suspension in the UV region is centered at ~230 nm (Figure 2.6B),
similar to that of GO prepared by Hummers’ method.51 The absorption in the visible and
NIR region dramatically decreased. The mass absorption coefficient at 808 nm and 984 nm
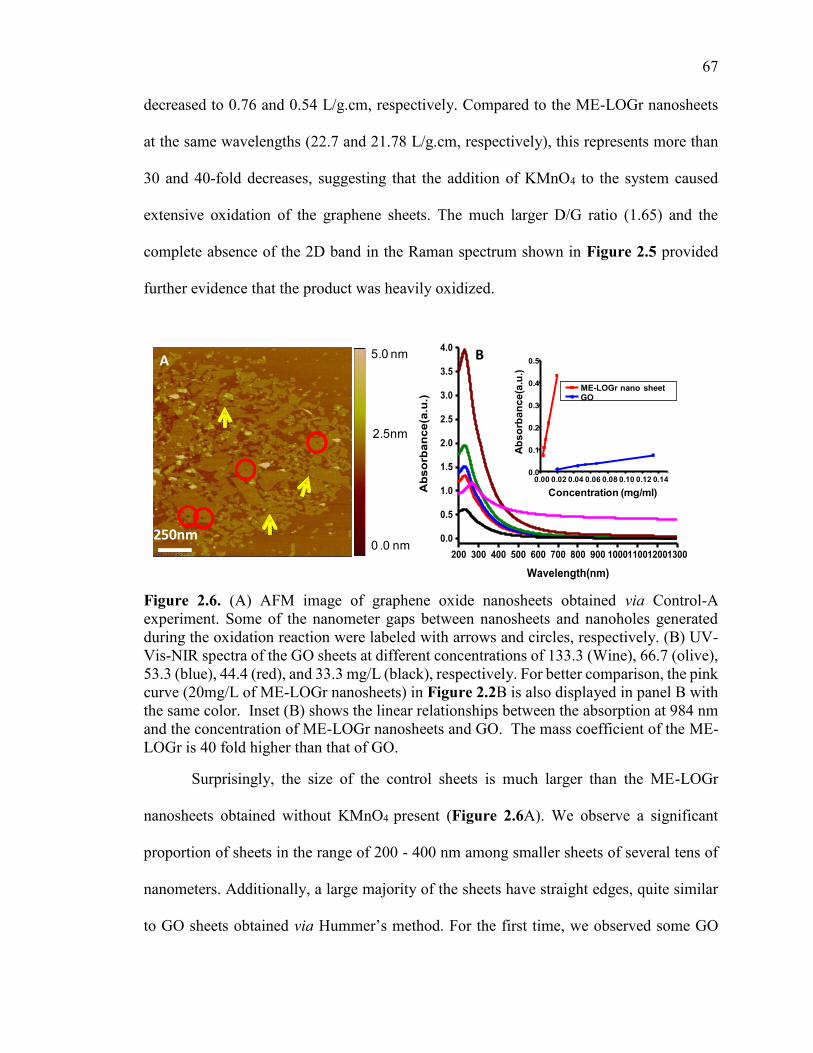
67
decreased to 0.76 and 0.54 L/g.cm, respectively. Compared to the ME-LOGr nanosheets
at the same wavelengths (22.7 and 21.78 L/g.cm, respectively), this represents more than
30 and 40-fold decreases, suggesting that the addition of KMnO4 to the system caused
extensive oxidation of the graphene sheets. The much larger D/G ratio (1.65) and the
complete absence of the 2D band in the Raman spectrum shown in Figure 2.5 provided
further evidence that the product was heavily oxidized.
Figure 2.6. (A) AFM image of graphene oxide nanosheets obtained via Control-A experiment. Some of the nanometer gaps between nanosheets and nanoholes generated during the oxidation reaction were labeled with arrows and circles, respectively. (B) UV-Vis-NIR spectra of the GO sheets at different concentrations of 133.3 (Wine), 66.7 (olive), 53.3 (blue), 44.4 (red), and 33.3 mg/L (black), respectively. For better comparison, the pink curve (20mg/L of ME-LOGr nanosheets) in Figure 2.2B is also displayed in panel B with the same color. Inset (B) shows the linear relationships between the absorption at 984 nm and the concentration of ME-LOGr nanosheets and GO. The mass coefficient of the ME-LOGr is 40 fold higher than that of GO.
Surprisingly, the size of the control sheets is much larger than the ME-LOGr
nanosheets obtained without KMnO4 present (Figure 2.6A). We observe a significant
proportion of sheets in the range of 200 - 400 nm among smaller sheets of several tens of
nanometers. Additionally, a large majority of the sheets have straight edges, quite similar
to GO sheets obtained via Hummer’s method. For the first time, we observed some GO
200 300 400 500 600 700 800 900 1000110012001300
0.0
0.5
1.0
1.5
2.0
2.5
3.0
3.5
4.0
Ab
so
rban
ce(a
.u.)
Wavelength(nm)
B
0.00 0.02 0.04 0.06 0.08 0.10 0.12 0.140.0
0.1
0.2
0.3
0.4
0.5
Ab
so
rba
nc
e(a
.u.)
Concentration (mg/ml)
ME-LOGr nano sheetGO
250nm
A5.0 nm
2.5nm
0 .0 nm
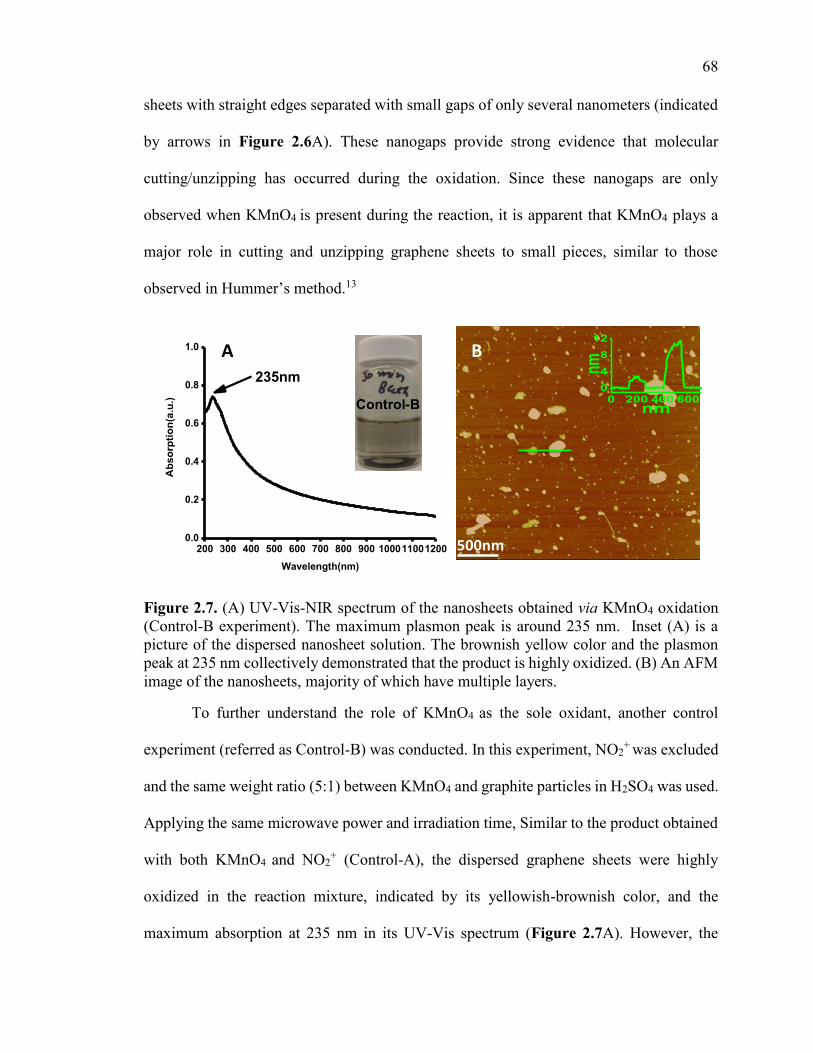
68
sheets with straight edges separated with small gaps of only several nanometers (indicated
by arrows in Figure 2.6A). These nanogaps provide strong evidence that molecular
cutting/unzipping has occurred during the oxidation. Since these nanogaps are only
observed when KMnO4 is present during the reaction, it is apparent that KMnO4 plays a
major role in cutting and unzipping graphene sheets to small pieces, similar to those
observed in Hummer’s method.13
Figure 2.7. (A) UV-Vis-NIR spectrum of the nanosheets obtained via KMnO4 oxidation (Control-B experiment). The maximum plasmon peak is around 235 nm. Inset (A) is a picture of the dispersed nanosheet solution. The brownish yellow color and the plasmon peak at 235 nm collectively demonstrated that the product is highly oxidized. (B) An AFM image of the nanosheets, majority of which have multiple layers.
To further understand the role of KMnO4 as the sole oxidant, another control
experiment (referred as Control-B) was conducted. In this experiment, NO2+ was excluded
and the same weight ratio (5:1) between KMnO4 and graphite particles in H2SO4 was used.
Applying the same microwave power and irradiation time, Similar to the product obtained
with both KMnO4 and NO2+ (Control-A), the dispersed graphene sheets were highly
oxidized in the reaction mixture, indicated by its yellowish-brownish color, and the
maximum absorption at 235 nm in its UV-Vis spectrum (Figure 2.7A). However, the
200 300 400 500 600 700 800 900 1000110012000.0
0.2
0.4
0.6
0.8
1.0
Ab
so
rpti
on
(a.u
.)
Wavelength(nm)
235nm
500nm
0 200 400 6000
4
8
12
nm
nm
BA
Control-B
69
concentration of the dispersed sheets is about 10 times lower than that achieved in Control
A. Furthermore, a large majority of the dispersed sheets are multiple layered as observed
by AFM measurements (Figure 2.7B). Most of the graphite particles were not exfoliated
and they settled on the bottom of the vial, suggesting that the capability of KMnO4 in
anhydrous H2SO4 to intercalate into and oxidize the inner parts of graphite is not as efficient
as NO2+ ions.
The molecular mechanisms leading to these significantly different results need
further study. We hypothesize that it is due to the different initiation oxidation capabilities
and the following oxidization pathways of KMnO4 and NO2+. Nitronium ions not only
attack the existing defects on the graphene, but also randomly attack the relatively inert
defect-free graphene basal planes.1 In the following oxidation step, NO2+ continues to
attack the already oxidized carbon atoms and carbon atoms far away from those already
oxidized. An important consequence of these differences is that oxidation by NO2+ can
naturally produce intact graphene domains separated by regions of oxygen containing
groups.27 With the increased speed of the second etching step, nanosheets with retained
structures can be obtained. Alternatively, KMnO4 starts oxidation at existing defect sites
and the following oxidation preferentially attack the neighboring carbons which are already
oxidized. While the high temperature reached by microwave heating selectively speeds up
the cutting/unzipping process, the unzipped sheets are still more oxidized.
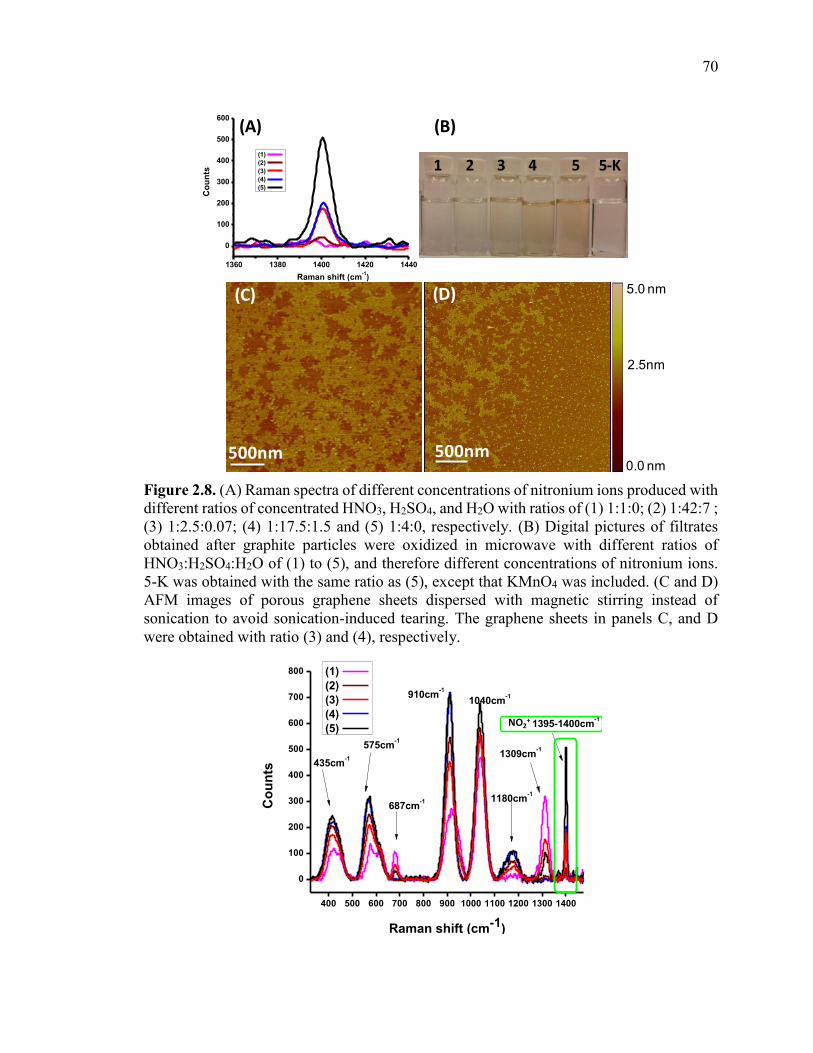
70
Figure 2.8. (A) Raman spectra of different concentrations of nitronium ions produced with different ratios of concentrated HNO3, H2SO4, and H2O with ratios of (1) 1:1:0; (2) 1:42:7 ; (3) 1:2.5:0.07; (4) 1:17.5:1.5 and (5) 1:4:0, respectively. (B) Digital pictures of filtrates obtained after graphite particles were oxidized in microwave with different ratios of HNO3:H2SO4:H2O of (1) to (5), and therefore different concentrations of nitronium ions. 5-K was obtained with the same ratio as (5), except that KMnO4 was included. (C and D) AFM images of porous graphene sheets dispersed with magnetic stirring instead of sonication to avoid sonication-induced tearing. The graphene sheets in panels C, and D were obtained with ratio (3) and (4), respectively.
500nm
(C)
500nm
(D)
1 2 3 4 5 5-K
(B)
1360 1380 1400 1420 1440
0
100
200
300
400
500
600
Co
un
ts
Raman shift (cm-1)
(1)
(2)
(3)
(4)
(5)
(A)
5.0 nm
2.5nm
0.0 nm
400 500 600 700 800 900 1000 1100 1200 1300 1400
0
100
200
300
400
500
600
700
800
Co
un
ts
Raman shift (cm-1)
435cm-1
575cm-1
687cm-1
910cm-1
1040cm-1
1180cm-1
1309cm-1
1395-1400cm-1
(1)
(2)
(3)
(4)
(5) NO2
+
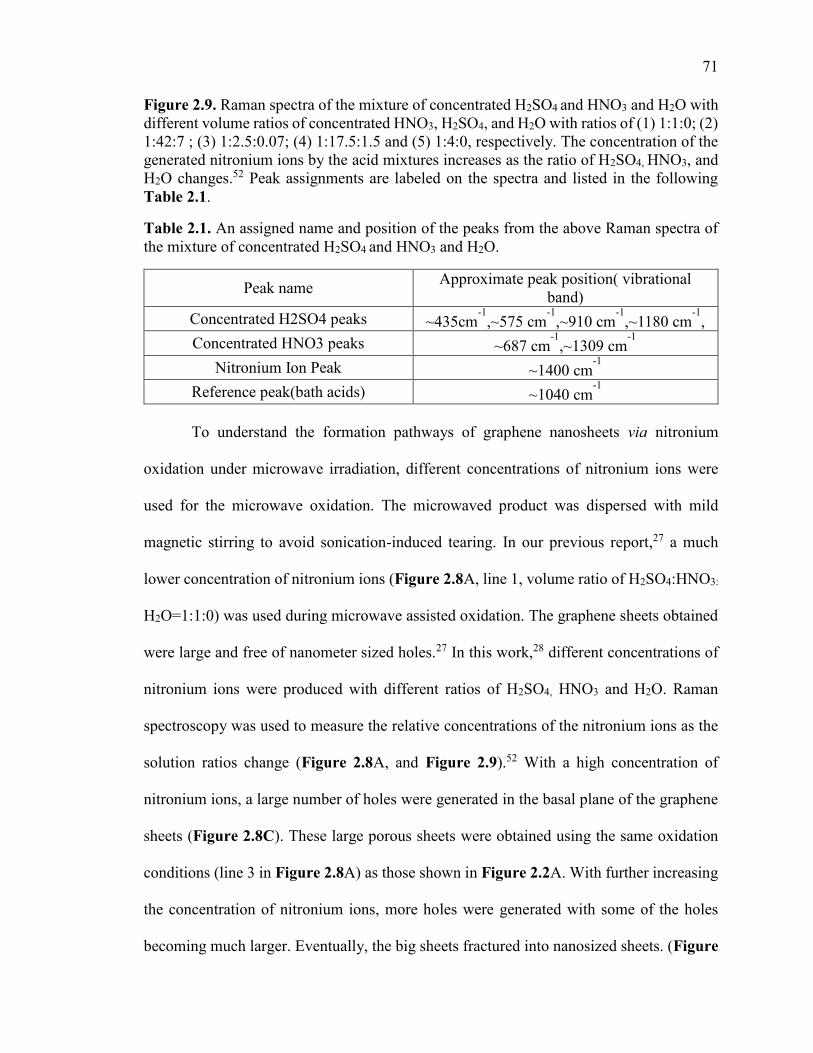
71
Figure 2.9. Raman spectra of the mixture of concentrated H2SO4 and HNO3 and H2O with different volume ratios of concentrated HNO3, H2SO4, and H2O with ratios of (1) 1:1:0; (2) 1:42:7 ; (3) 1:2.5:0.07; (4) 1:17.5:1.5 and (5) 1:4:0, respectively. The concentration of the generated nitronium ions by the acid mixtures increases as the ratio of H2SO4, HNO3, and H2O changes.52 Peak assignments are labeled on the spectra and listed in the following Table 2.1.
Table 2.1. An assigned name and position of the peaks from the above Raman spectra of the mixture of concentrated H2SO4 and HNO3 and H2O.
Peak name Approximate peak position( vibrational
band) Concentrated H2SO4 peaks ~435cm
-1,~575 cm
-1,~λ10 cm
-1,~1180 cm
-1,
Concentrated HNO3 peaks ~687 cm-1
,~130λ cm-1
Nitronium Ion Peak ~1400 cm
-1
Reference peak(bath acids) ~1040 cm-1
To understand the formation pathways of graphene nanosheets via nitronium
oxidation under microwave irradiation, different concentrations of nitronium ions were
used for the microwave oxidation. The microwaved product was dispersed with mild
magnetic stirring to avoid sonication-induced tearing. In our previous report,27 a much
lower concentration of nitronium ions (Figure 2.8A, line 1, volume ratio of H2SO4:HNO3:
H2O=1:1:0) was used during microwave assisted oxidation. The graphene sheets obtained
were large and free of nanometer sized holes.27 In this work,28 different concentrations of
nitronium ions were produced with different ratios of H2SO4, HNO3 and H2O. Raman
spectroscopy was used to measure the relative concentrations of the nitronium ions as the
solution ratios change (Figure 2.8A, and Figure 2.9).52 With a high concentration of
nitronium ions, a large number of holes were generated in the basal plane of the graphene
sheets (Figure 2.8C). These large porous sheets were obtained using the same oxidation
conditions (line 3 in Figure 2.8A) as those shown in Figure 2.2A. With further increasing
the concentration of nitronium ions, more holes were generated with some of the holes
becoming much larger. Eventually, the big sheets fractured into nanosized sheets. (Figure
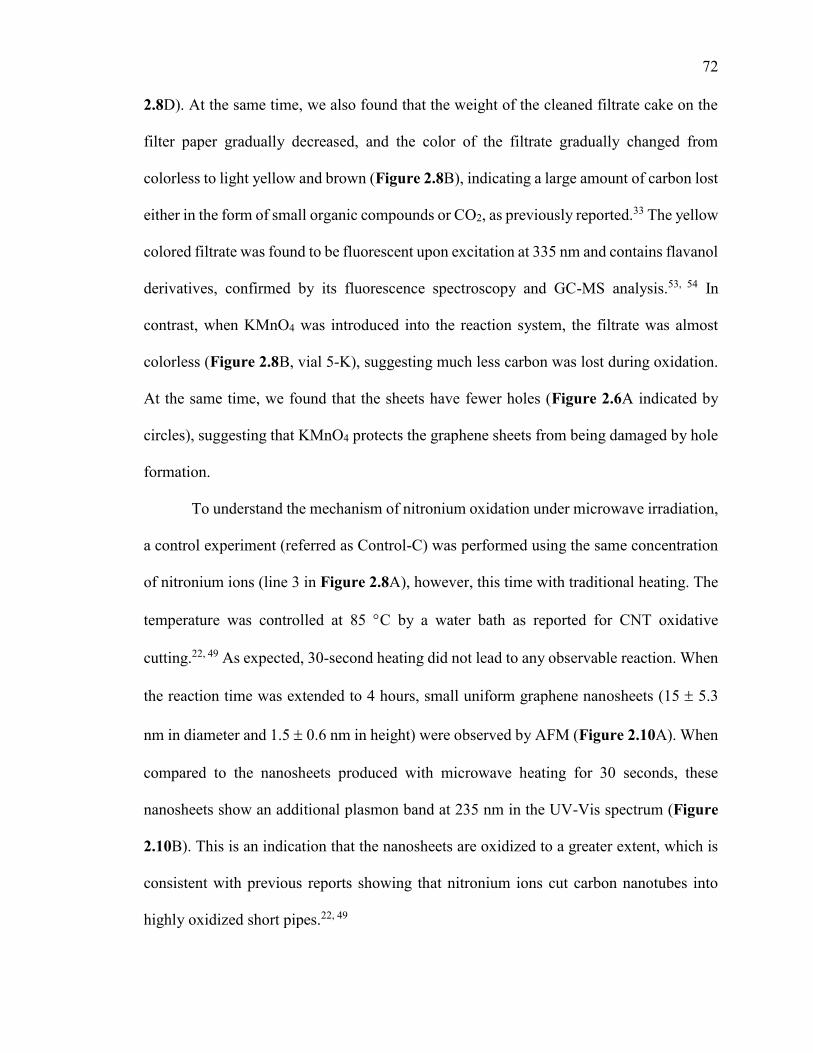
72
2.8D). At the same time, we also found that the weight of the cleaned filtrate cake on the
filter paper gradually decreased, and the color of the filtrate gradually changed from
colorless to light yellow and brown (Figure 2.8B), indicating a large amount of carbon lost
either in the form of small organic compounds or CO2, as previously reported.33 The yellow
colored filtrate was found to be fluorescent upon excitation at 335 nm and contains flavanol
derivatives, confirmed by its fluorescence spectroscopy and GC-MS analysis.53, 54 In
contrast, when KMnO4 was introduced into the reaction system, the filtrate was almost
colorless (Figure 2.8B, vial 5-K), suggesting much less carbon was lost during oxidation.
At the same time, we found that the sheets have fewer holes (Figure 2.6A indicated by
circles), suggesting that KMnO4 protects the graphene sheets from being damaged by hole
formation.
To understand the mechanism of nitronium oxidation under microwave irradiation,
a control experiment (referred as Control-C) was performed using the same concentration
of nitronium ions (line 3 in Figure 2.8A), however, this time with traditional heating. The
temperature was controlled at 85 C by a water bath as reported for CNT oxidative
cutting.22, 49 As expected, 30-second heating did not lead to any observable reaction. When
the reaction time was extended to 4 hours, small uniform graphene nanosheets (15 5.3
nm in diameter and 1.5 0.6 nm in height) were observed by AFM (Figure 2.10A). When
compared to the nanosheets produced with microwave heating for 30 seconds, these
nanosheets show an additional plasmon band at 235 nm in the UV-Vis spectrum (Figure
2.10B). This is an indication that the nanosheets are oxidized to a greater extent, which is
consistent with previous reports showing that nitronium ions cut carbon nanotubes into
highly oxidized short pipes.22, 49
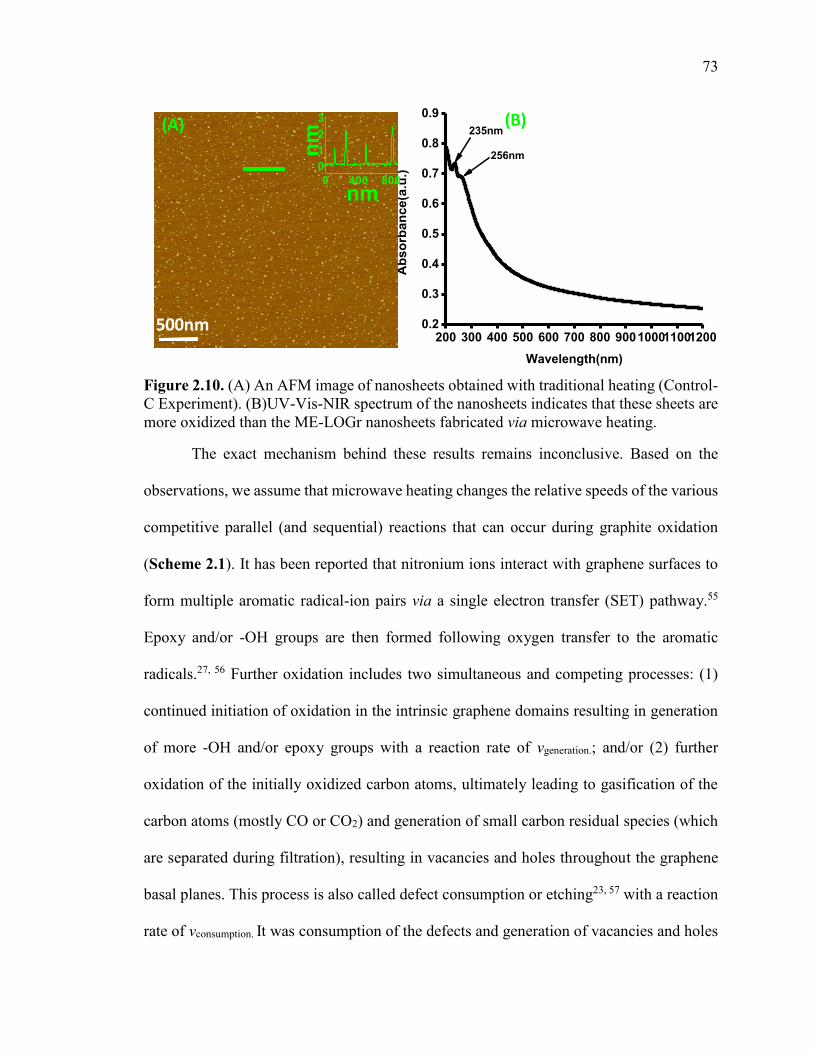
73
Figure 2.10. (A) An AFM image of nanosheets obtained with traditional heating (Control-C Experiment). (B)UV-Vis-NIR spectrum of the nanosheets indicates that these sheets are more oxidized than the ME-LOGr nanosheets fabricated via microwave heating.
The exact mechanism behind these results remains inconclusive. Based on the
observations, we assume that microwave heating changes the relative speeds of the various
competitive parallel (and sequential) reactions that can occur during graphite oxidation
(Scheme 2.1). It has been reported that nitronium ions interact with graphene surfaces to
form multiple aromatic radical-ion pairs via a single electron transfer (SET) pathway.55
Epoxy and/or -OH groups are then formed following oxygen transfer to the aromatic
radicals.27, 56 Further oxidation includes two simultaneous and competing processes: (1)
continued initiation of oxidation in the intrinsic graphene domains resulting in generation
of more -OH and/or epoxy groups with a reaction rate of vgeneration.; and/or (2) further
oxidation of the initially oxidized carbon atoms, ultimately leading to gasification of the
carbon atoms (mostly CO or CO2) and generation of small carbon residual species (which
are separated during filtration), resulting in vacancies and holes throughout the graphene
basal planes. This process is also called defect consumption or etching23, 57 with a reaction
rate of vconsumption. It was consumption of the defects and generation of vacancies and holes
200 300 400 500 600 700 800 9001000110012000.2
0.3
0.4
0.5
0.6
0.7
0.8
0.9
Ab
so
rban
ce(a
.u.)
Wavelength(nm)
235nm
256nm
500nm
0 400 800
0
1
2
3
nm
nm
(A) (B)
74
in the sidewalls of carbon nanotubes that led to rapid cutting of the CNTs into short pipes
and cutting graphene sheets to small pieces. 22, 23 The relative reaction rates of these two
processes determine the overall speed of nanosheet fabrication and also the oxidation level
of the nanosheets. The reaction speeds of these two processes can be described using
Arrhenius equations as follows,
In which, CIntrinsic-Gr and CDefects are the density of intrinsic graphene domains and the
density of defects (such as oxygen containing groups) on a graphene sheets; EaGeneration is
the activation energy of the initial oxidation of the intrinsic graphene domains and
EaConsumption is the activation energy of further oxidations of the already oxidized carbon
atoms (defect consumption step).
When microwave heating is used to control the nitronium oxidation processes, the
strong microwave absorption characteristic of graphite particles leads to the rapid
achievement of high temperatures localized on/or near the graphite particles, which in turn
dramatically increases the intercalation rate of nitronium ions into the graphite particles.
This process is accompanied by the generation of a large amount of –OH and/or epoxy
groups distributed over the entirety of the graphene sheets (high CDefects). After this initial
oxidation, in the subsequent competing reactions, it is possible that the defect consumption
or etching speed (vconsumption) becomes faster than that of the continuing generation of
RTEa
DefectsnConsumptio
RTEa
GrIntrinsicGeneration
nConsumptio
Generation
AeCv
AeCv
/
/
75
additional new defects (vgeneration) on the intact graphene domains due to the high density
of the -OH and/or epoxy groups generated in the first step (high CDefects).58 With the high
temperatures obtained by microwave heating, the vconsumption may be further increased
compared to vgeneration due to the lower activation barrier of the defect consumption process
compared to that generation of new defects.21 As a result, the graphene sheets are fractured
into small pieces with the intrinsic structures of graphene within the pieces left largely
intact. In contrast with traditional heating, much lower temperatures (bulk temperature of
85 C was applied in most reports) can be utilized for the reaction without decomposing
the nitronium ions. Consequently, a much lower density of -OH and/or epoxy groups can
be generated in the first step. The subsequent competing reactions, in particular defect
consumption vs. generation of new defects (low CDefects), are also much slower compared
to the case of microwave heating. Therefore a much longer reaction period was required to
produce nanosized sheets. Furthermore, the low density of -OH and/or epoxy groups
generated in the first oxidation step combined with the relative low reaction temperature
may result in smaller differences in the two competing reaction rates. Therefore, even
though graphene was fractured to small pieces with conventional heating, albeit with a
much longer reaction time, the produced nanosheets are highly oxidized.
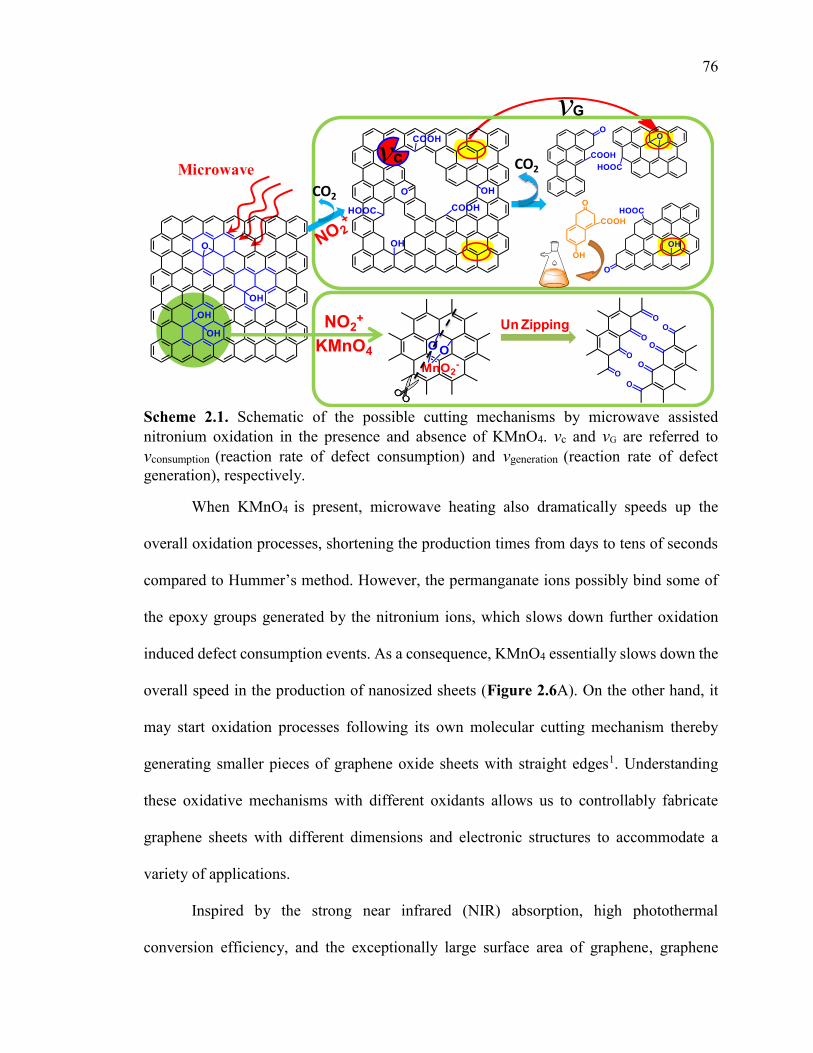
76
Scheme 2.1. Schematic of the possible cutting mechanisms by microwave assisted nitronium oxidation in the presence and absence of KMnO4. vc and vG are referred to vconsumption (reaction rate of defect consumption) and vgeneration (reaction rate of defect generation), respectively.
When KMnO4 is present, microwave heating also dramatically speeds up the
overall oxidation processes, shortening the production times from days to tens of seconds
compared to Hummer’s method. However, the permanganate ions possibly bind some of
the epoxy groups generated by the nitronium ions, which slows down further oxidation
induced defect consumption events. As a consequence, KMnO4 essentially slows down the
overall speed in the production of nanosized sheets (Figure 2.6A). On the other hand, it
may start oxidation processes following its own molecular cutting mechanism thereby
generating smaller pieces of graphene oxide sheets with straight edges1. Understanding
these oxidative mechanisms with different oxidants allows us to controllably fabricate
graphene sheets with different dimensions and electronic structures to accommodate a
variety of applications.
Inspired by the strong near infrared (NIR) absorption, high photothermal
conversion efficiency, and the exceptionally large surface area of graphene, graphene
Microwave
Un Zipping
CO2
CO2cv
Gv
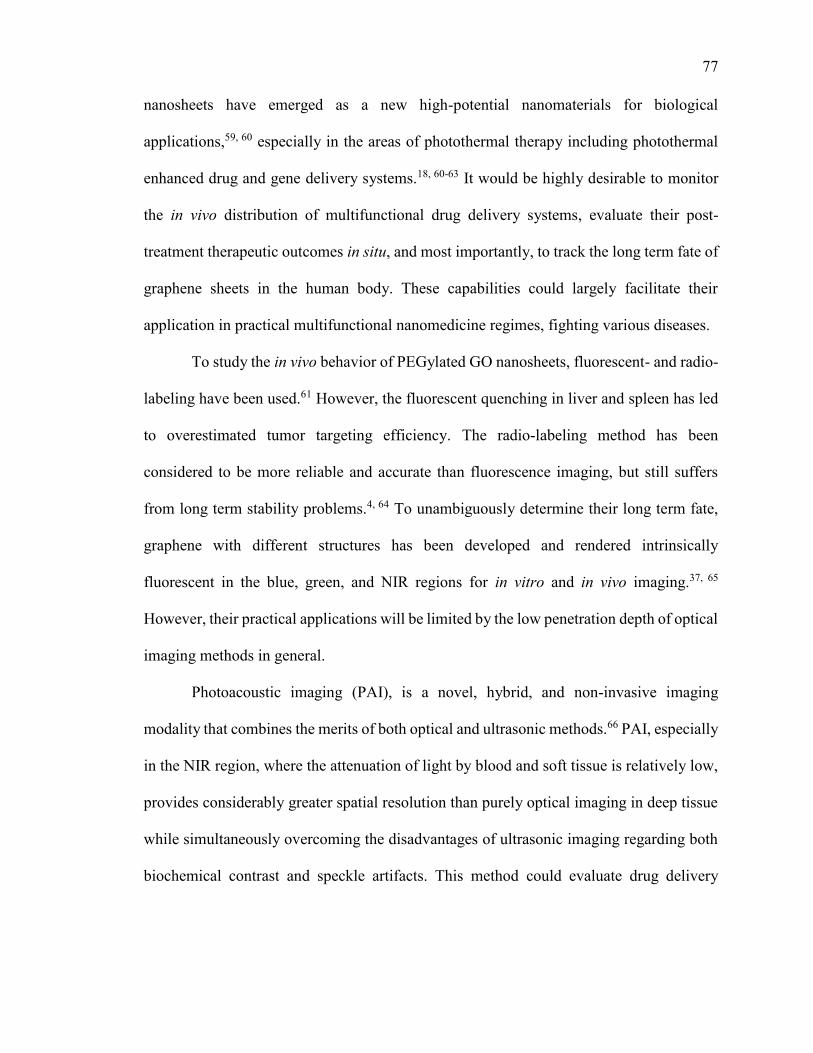
77
nanosheets have emerged as a new high-potential nanomaterials for biological
applications,59, 60 especially in the areas of photothermal therapy including photothermal
enhanced drug and gene delivery systems.18, 60-63 It would be highly desirable to monitor
the in vivo distribution of multifunctional drug delivery systems, evaluate their post-
treatment therapeutic outcomes in situ, and most importantly, to track the long term fate of
graphene sheets in the human body. These capabilities could largely facilitate their
application in practical multifunctional nanomedicine regimes, fighting various diseases.
To study the in vivo behavior of PEGylated GO nanosheets, fluorescent- and radio-
labeling have been used.61 However, the fluorescent quenching in liver and spleen has led
to overestimated tumor targeting efficiency. The radio-labeling method has been
considered to be more reliable and accurate than fluorescence imaging, but still suffers
from long term stability problems.4, 64 To unambiguously determine their long term fate,
graphene with different structures has been developed and rendered intrinsically
fluorescent in the blue, green, and NIR regions for in vitro and in vivo imaging.37, 65
However, their practical applications will be limited by the low penetration depth of optical
imaging methods in general.
Photoacoustic imaging (PAI), is a novel, hybrid, and non-invasive imaging
modality that combines the merits of both optical and ultrasonic methods.66 PAI, especially
in the NIR region, where the attenuation of light by blood and soft tissue is relatively low,
provides considerably greater spatial resolution than purely optical imaging in deep tissue
while simultaneously overcoming the disadvantages of ultrasonic imaging regarding both
biochemical contrast and speckle artifacts. This method could evaluate drug delivery
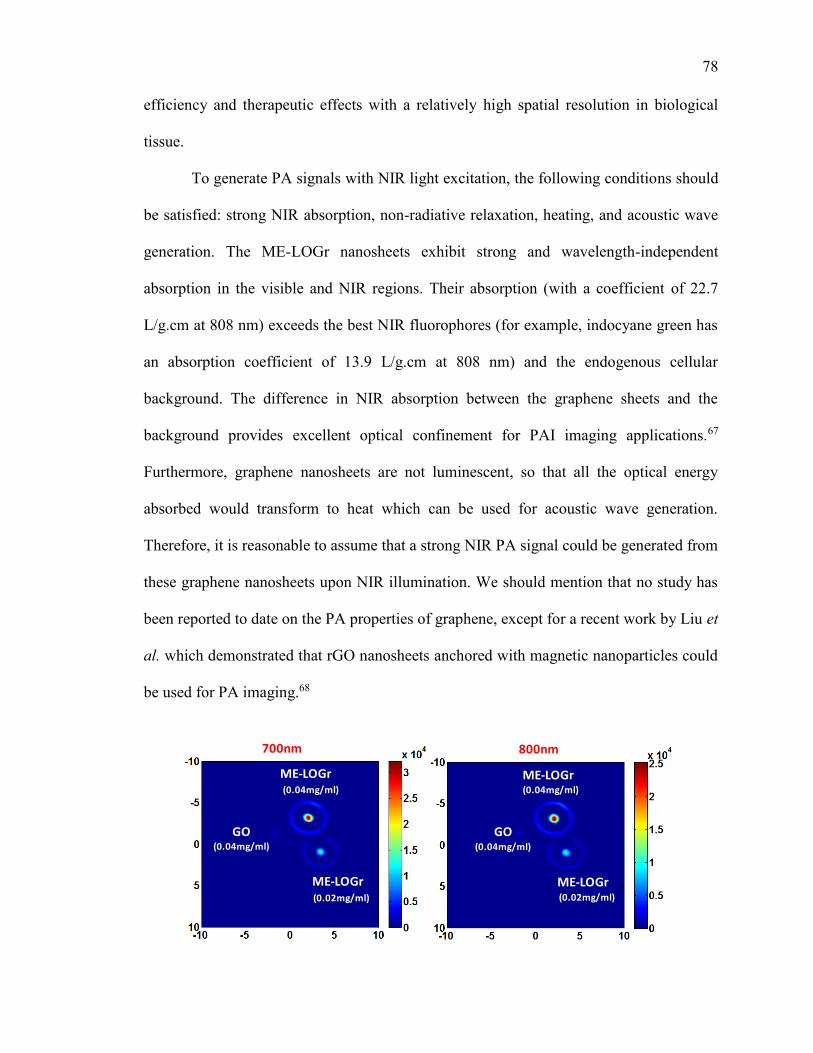
78
efficiency and therapeutic effects with a relatively high spatial resolution in biological
tissue.
To generate PA signals with NIR light excitation, the following conditions should
be satisfied: strong NIR absorption, non-radiative relaxation, heating, and acoustic wave
generation. The ME-LOGr nanosheets exhibit strong and wavelength-independent
absorption in the visible and NIR regions. Their absorption (with a coefficient of 22.7
L/g.cm at 808 nm) exceeds the best NIR fluorophores (for example, indocyane green has
an absorption coefficient of 13.9 L/g.cm at 808 nm) and the endogenous cellular
background. The difference in NIR absorption between the graphene sheets and the
background provides excellent optical confinement for PAI imaging applications.67
Furthermore, graphene nanosheets are not luminescent, so that all the optical energy
absorbed would transform to heat which can be used for acoustic wave generation.
Therefore, it is reasonable to assume that a strong NIR PA signal could be generated from
these graphene nanosheets upon NIR illumination. We should mention that no study has
been reported to date on the PA properties of graphene, except for a recent work by Liu et
al. which demonstrated that rGO nanosheets anchored with magnetic nanoparticles could
be used for PA imaging.68
700nm 800nm
GO (0.04mg/ml)
ME-LOGr(0.04mg/ml)
(0.02mg/ml)
GO (0.04mg/ml)
(0.04mg/ml)
(0.02mg/ml)
ME-LOGr
ME-LOGrME-LOGr
79
Figure 2.11. Photoacoustic (PA) signal of GO and graphene nanosheets of different concentrations, illuminated with 700nm and 800nm laser. The color coded vertical bar represents the strength of the photoacoustic signal generated. GO nanosheets were obtained via Control-A experiment.
Figure 2.11 shows that the ME-LOGr nanosheets exhibit remarkably strong PA
signals under NIR laser illumination of 700 nm. In contrast, the GO nanosheets did not
show any detectable PA signal at the same concentration and NIR illumination, possibly
due to their low NIR absorption capability. Furthermore, the intensity of the PA signals
depends on the concentration of the ME-LOGr nanosheets, suggesting the ME-LOGr
nanosheets can be used as NIR contrast agent for in-situ NIR photoacoustic imaging. Since
the strong NIR absorption of ME-LOGr nanosheets is almost independent of the
wavelength in the NIR region, their NIR PA signal shows a similar trend of wavelength
independence. Figure 2.11 shows that PA signals generated under 800 nm illumination are
similar to those illuminated at 700 nm. This “wavelength independent” characteristic is
very different from other PA contrast agents, such as Au nanorods and Ag nanoplates
which are highly wavelength dependent.67
In addition to photoacousting imaging, we have also explored the ME-LOGr
nanosheets for multi-functional drug delivery applications for ovarian cancer treatment in
collaboration with Dr. Taratula, at Oregon State University.69 In this work, firstly, the
graphene nanosheets were chemically modified with polypropylenimine dendrimers
loaded with phthalocyanine (Pc), which is a photosensitizer molecule. After that, the
graphene nanosheets were conjugated with poly (ethylene glycol), to improve
biocompatibility, and with luteinizing hormone-releasing hormone (LHRH) peptide, for
tumor-targeted delivery. Due to the strong NIR absorption and photothermal efficiency of
ME-LOGr nanosheets, it performs a dual role, 1) heat generation for photothermal therapy

80
(PTT) and 2) production of reactive oxygen species (ROS)-production by activating Pc
molecules for photodynamic therapy (PDT). This combinatorial phototherapy (PTT +
PDT) resulted in an enhanced destruction of ovarian cancer cells, with a killing efficacy of
90%–95% at low Pc and low-oxygen graphene dosages as shown in figure xx, presumably
conferring cytotoxicity to the synergistic effects of generated ROS and mild hyperthermia.
This Pc loaded into the nanoplatform can be also employed as a NIR fluorescence agent
for imaging-guided drug delivery. Hence, the newly developed Pc-graphene nanoplatform
has the significant potential as an effective NIR theranostic probe for imaging and
combinatorial phototherapy.69
Figure 2.12. Schematic illustration of the multifunctional nanoplatform based on ME-LOGr nanosheets. A) In Vivo NIR fluorescence imaging of nude mice 12 hours after injection of saline ME-LOGr-Pc-LHRH. B) Combinatorial (PDT-PTT) therapeutic effects of ME-LOGr-Pc-LHRH (cyan color) on A2780/AD cell pellets (2,000,000) irradiated for 10 minutes using a 690 nm laser diode (0.95 W/cm2), compared with controls- ME-LOGr-LHRH (black) and Pc-LHRH (sky blue).69
2.3. Conclusions
In summary, for the first time, we demonstrated that graphene nanosheets can be directly
fabricated from abundant and inexpensive graphite particles in a short one-pot nitronium
oxidative reaction. The key is the utilization of microwave heating instead of traditional
81
convective heating, which selectively and rapidly increases the local temperature of
graphite particles thus leading to a unique thermodynamic effect. As a result, several
positive outcomes are produced which steer the graphite oxidation processes toward direct
fabrication of graphene nanosheets instead of GO nanosheets: 1) The intercalation of
nitronium ions into the inner parts of graphite particles is dramatically sped up. 2) A large
amount of oxygen containing groups (defects) are generated simultaneously and they are
randomly distributed across the entire graphene sheets. 3) Further oxidation of these defects
or defect consumption reactions is more rapid than the pathways generating additional
defects on the intact graphene domains. 4) Finally, graphene nanosheets are directly and
rapidly fabricated with the intrinsic properties of graphene largely retained.
This fabrication process involved no toxic metal compounds or reducting agents during the
fabrication, and the product can be easily cleaned and purified. It is noteworthy that this
method of fabricating nanosheets is different from all the approaches relying on GO via
Hummer’s method or modified Hummer’s methods, in which highly oxidative metallic
compounds, such as KMnO4,were required for the oxidation and other chemicals for the
reduction of the produced GO. Trace amounts of metal ions and other chemicals involved
in the oxidation and subsequent reduction processes may participate in unwanted toxic
reactions which could be detrimental to biological and other applications.70, 71 However,
purification of GO is difficult due to its tendency to gel.50 Therefore, extensive purification
steps, which require large amount of solvents and long washing times, make the production
of clean GO and rGO very time consuming.50Another merit of the produced ME-LOGr
nanosheets is that they can be directly dispersed into aqueous and other polar organic
solvents without surfactants or stabilizing agents, allowing for the production of solutions
82
of graphene nanosheets with “clean” surfaces. Most importantly, without the requirement
for post-reduction processes, the fabricated graphene nanosheets exhibit strong NIR
absorption, high photothermal, and photoacoustic conversion efficiencies. Therefore, they
possess great potential as nanocarriers to develop multifunctional drug delivery systems
with “on demand’ release and in vivo photoacoustic imaging capabilities for in-situ
evaluation of therapeutic effects and for tracking their long term fate.
2.4. Experimental Section
2.4.1. Materials
Synthetic graphite powder (20 m) was purchased from Sigma Aldrich and used as
received in all experiments. Concentrated sulfuric acid (98% H2SO4, ACS grade) and
concentrated nitric acid (70% HNO3, ACS grade) were purchased from Pharmco-AAPER
and used as received. Deionized water (18.2 MΩ) (Nanopure water, Barnstead) was used
to prepare all solutions and to rinse and clean the samples.
2.4.2. Fabrication of ME-LOGr nanosheets
20mg of graphite are mixed with concentrated sulfuric acid and water in a round bottom
flask. The mixture is then swirled and cooled in an ice bath for approximately 5 minutes.
Concentrated nitric acid is then added (Different volume ratio of HNO3:H2SO4:H2O is
given in the Table 2.2). The entire mixture is swirled and mixed for another 30 seconds
and placed into a microwave reactor chamber (CEM Discover). The flask is connected to
a reflux condenser that passes through the roof of the microwave oven via a port. The
reaction mixture is subject to microwave irradiation (300 watts) for 30 seconds.
Subsequently, the reaction is quenched with 200ml of deionized followed by filtering
through an alumina anodisc filter (0.02 µm pore size) and washing with 800ml deionized
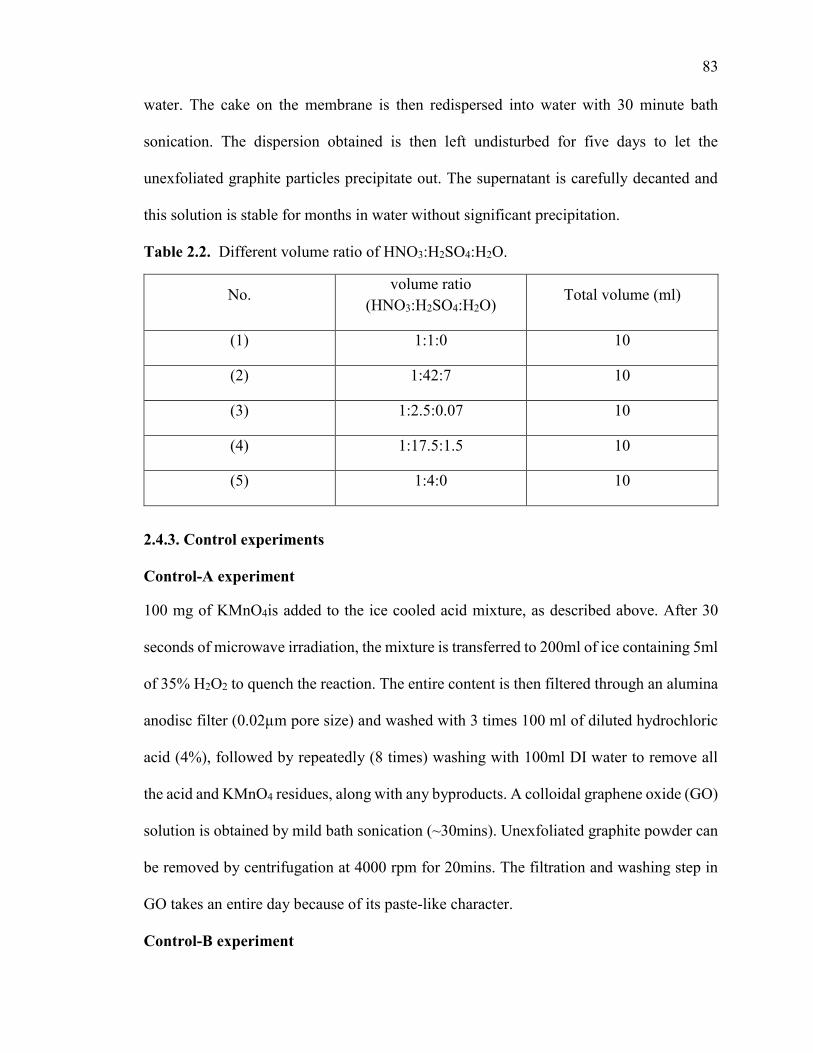
83
water. The cake on the membrane is then redispersed into water with 30 minute bath
sonication. The dispersion obtained is then left undisturbed for five days to let the
unexfoliated graphite particles precipitate out. The supernatant is carefully decanted and
this solution is stable for months in water without significant precipitation.
Table 2.2. Different volume ratio of HNO3:H2SO4:H2O.
No. volume ratio
(HNO3:H2SO4:H2O) Total volume (ml)
(1) 1:1:0 10
(2) 1:42:7 10
(3) 1:2.5:0.07 10
(4) 1:17.5:1.5 10
(5) 1:4:0 10
2.4.3. Control experiments
Control-A experiment
100 mg of KMnO4is added to the ice cooled acid mixture, as described above. After 30
seconds of microwave irradiation, the mixture is transferred to 200ml of ice containing 5ml
of 35% H2O2 to quench the reaction. The entire content is then filtered through an alumina
anodisc filter (0.02µm pore size) and washed with 3 times 100 ml of diluted hydrochloric
acid (4%), followed by repeatedly (8 times) washing with 100ml DI water to remove all
the acid and KMnO4 residues, along with any byproducts. A colloidal graphene oxide (GO)
solution is obtained by mild bath sonication (~30mins). Unexfoliated graphite powder can
be removed by centrifugation at 4000 rpm for 20mins. The filtration and washing step in
GO takes an entire day because of its paste-like character.
Control-B experiment
84
100 mg of KMnO4 is added to the ice cooled 10ml concentrated sulfuric acid instead of
acid mixture and other experimental procedure is similar as control-A experiment.
Control-C experiment
20mg graphite and acid mixture (No.3 in the Table 2.2) was heated at 85oC for 4 hours in
water bath in a fume hood with the flask connected to a reflux condenser. After that
washing procedure is followed similar as ME-LOGr nanosheets:-
2.4.4. Material Characterization
The morphology of the graphene and GO samples were studied using a Nanoscope IIIa
Multimode scanning probe microscope system (Digital Instruments, Bruker) with a J
scanner operated in the “Tapping Mode”. Micro Raman Spectroscopy (Kaiser Optical
Systems Raman Microprobe) equipped with a 785 nm solid-state diode laser) was
performed to measure the relative concentrations of nitronium ions formed via mixing
concentrated HNO3 and H2SO4 at different volume ratios. Spectra were obtained of these
solutions held in a thin quartz cuvette. This instrument was also used to study the graphene
and GO films deposited on an alumina filter membrane. XPS characterization was
performed after depositing a layer of ME-LOGr nanosheets or GO onto a gold film (a 100
nm gold layer was sputter-coated on silicon with a 10 nm Ti adhesion layer).The thickness
of the graphene or GO film on the gold substrates was roughly 30-50 nm. XPS spectra were
acquired using a Thermo Scientific K-Alpha system with a monochromatic Al Kα x-ray
source (h = 1486.7 eV) and data were analyzed using Casa XPS 2.3.15 software.
Absorption spectra were recorded on a Cary 5000 UV-vis-NIR spectrophotometer in the
double beam mode using a 1cm quartz cuvette.
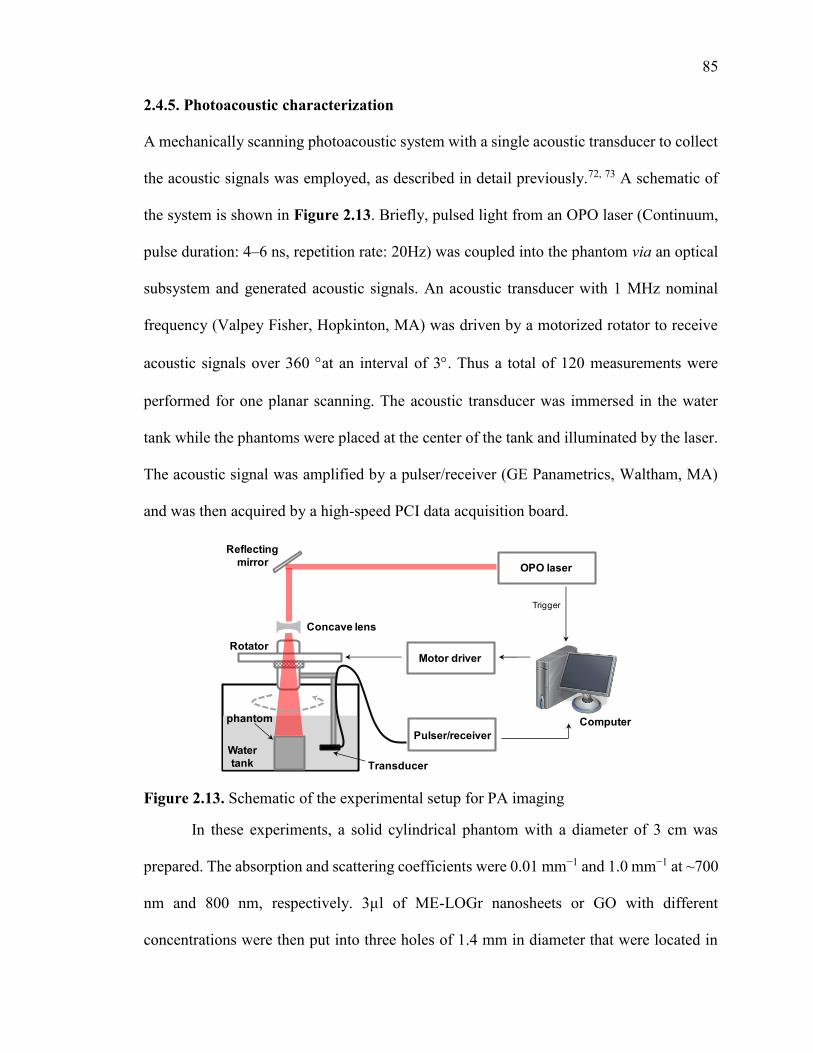
85
2.4.5. Photoacoustic characterization
A mechanically scanning photoacoustic system with a single acoustic transducer to collect
the acoustic signals was employed, as described in detail previously.72, 73 A schematic of
the system is shown in Figure 2.13. Briefly, pulsed light from an OPO laser (Continuum,
pulse duration: 4–6 ns, repetition rate: 20Hz) was coupled into the phantom via an optical
subsystem and generated acoustic signals. An acoustic transducer with 1 MHz nominal
frequency (Valpey Fisher, Hopkinton, MA) was driven by a motorized rotator to receive
acoustic signals over 360 at an interval of 3. Thus a total of 120 measurements were
performed for one planar scanning. The acoustic transducer was immersed in the water
tank while the phantoms were placed at the center of the tank and illuminated by the laser.
The acoustic signal was amplified by a pulser/receiver (GE Panametrics, Waltham, MA)
and was then acquired by a high-speed PCI data acquisition board.
Figure 2.13. Schematic of the experimental setup for PA imaging
In these experiments, a solid cylindrical phantom with a diameter of 3 cm was
prepared. The absorption and scattering coefficients were 0.01 mm−1 and 1.0 mm−1 at ~700
nm and 800 nm, respectively. 3µl of ME-LOGr nanosheets or GO with different
concentrations were then put into three holes of 1.4 mm in diameter that were located in
Rotator
Reflecting
mirror
Water
tank
OPO laser
Concave lens
Motor driver
Trigger
Pulser/receiver
Computerphantom
Transducer

86
the center of the phantom. The phantom materials consisted of TiO2 for scattering and India
ink as an absorber with agar powder (1 – 2%) for solidifying the TiO2 and India ink
solution.
2.5. References
1. Kosynkin, D. V.; Higginbotham, A. L.; Sinitskii, A.; Lomeda, J. R.; Dimiev, A.; Price, B. K.; Tour, J. M. Longitudinal unzipping of carbon nanotubes to form graphene nanoribbons. Nature 2009, 458, 872-6. 2. Chen, X.; Zhou, X.; Han, T.; Wu, J.; Zhang, J.; Guo, S. Stabilization and induction of oligonucleotide i-motif structure via graphene quantum dots. ACS Nano 2013, 7, 531-7. 3. Ren, H.; Wang, C.; Zhang, J.; Zhou, X.; Xu, D.; Zheng, J.; Guo, S.; Zhang, J. DNA cleavage system of nanosized graphene oxide sheets and copper ions. ACS Nano 2010, 4, 7169-74. 4. Yang, K.; Wan, J.; Zhang, S.; Tian, B.; Zhang, Y.; Liu, Z. The influence of surface chemistry and size of nanoscale graphene oxide on photothermal therapy of cancer using ultra-low laser power. Biomaterials 2012, 33, 2206-14. 5. Radovic, L. R.; Bockrath, B. On the chemical nature of graphene edges: origin of stability and potential for magnetism in carbon materials. J. Am. Chem. Soc. 2005, 127, 5917-27. 6. Ohba, T.; Kanoh, H. Intensive Edge Effects of Nanographenes in Molecular Adsorptions. J Phys Chem Lett 2012, 3, 511-6. 7. Chou, S. S.; De, M.; Luo, J.; Rotello, V. M.; Huang, J.; Dravid, V. P. Nanoscale graphene oxide (nGO) as artificial receptors: implications for biomolecular interactions and sensing. J. Am. Chem. Soc. 2012, 134, 16725-33. 8. Pan, D.; Zhang, J.; Li, Z.; Wu, M. Hydrothermal route for cutting graphene sheets into blue-luminescent graphene quantum dots. Adv. Mater. 2010, 22, 734-8. 9. Li, Y.; Hu, Y.; Zhao, Y.; Shi, G.; Deng, L.; Hou, Y.; Qu, L. An electrochemical avenue to green-luminescent graphene quantum dots as potential electron-acceptors for photovoltaics. Adv. Mater. 2011, 23, 776-80. 10. Zhou, X.; Zhang, Y.; Wang, C.; Wu, X.; Yang, Y.; Zheng, B.; Wu, H.; Guo, S.; Zhang, J. Photo-Fenton reaction of graphene oxide: a new strategy to prepare graphene quantum dots for DNA cleavage. ACS Nano 2012, 6, 6592-9. 11. Hummers, W. S.; Offeman, R. E. Preparation of Graphitic Oxide. J. Am. Chem.
Soc. 1958, 80, 1339. 12. Erickson, K.; Erni, R.; Lee, Z.; Alem, N.; Gannett, W.; Zettl, A. Determination of the local chemical structure of graphene oxide and reduced graphene oxide. Adv. Mater.
2010, 22, 4467-72. 13. Li, J. L.; Kudin, K. N.; McAllister, M. J.; Prud'homme, R. K.; Aksay, I. A.; Car, R. Oxygen-driven unzipping of graphitic materials. Phys. Rev. Lett. 2006, 96, 176101. 14. Zhang, L.; Liang, J. J.; Huang, Y.; Ma, Y. F.; Wang, Y.; Chen, Y. S. Size-controlled synthesis of graphene oxide sheets on a large scale using chemical exfoliation. Carbon
2009, 47, 3365-3368.
87
15. Wang, D.; Wang, L.; Dong, X. Y.; Shi, Z.; Jin, J. Chemically tailoring graphene oxides into fluorescent nanosheets for Fe3+ ion detection. Carbon 2012, 50, 2147-2154. 16. Luo, J.; Cote, L. J.; Tung, V. C.; Tan, A. T.; Goins, P. E.; Wu, J.; Huang, J. Graphene oxide nanocolloids. J. Am. Chem. Soc. 2010, 132, 17667-9. 17. Peng, J.; Gao, W.; Gupta, B. K.; Liu, Z.; Romero-Aburto, R.; Ge, L.; Song, L.; Alemany, L. B.; Zhan, X.; Gao, G.; Vithayathil, S. A.; Kaipparettu, B. A.; Marti, A. A.; Hayashi, T.; Zhu, J. J.; Ajayan, P. M. Graphene quantum dots derived from carbon fibers. Nano Lett. 2012, 12, 844-9. 18. Tian, B.; Wang, C.; Zhang, S.; Feng, L.; Liu, Z. Photothermally enhanced photodynamic therapy delivered by nano-graphene oxide. ACS Nano 2011, 5, 7000-9. 19. Robinson, J. T.; Tabakman, S. M.; Liang, Y.; Wang, H.; Casalongue, H. S.; Vinh, D.; Dai, H. Ultrasmall reduced graphene oxide with high near-infrared absorbance for photothermal therapy. J. Am. Chem. Soc. 2011, 133, 6825-31. 20. Zhang, M.; Bai, L. L.; Shang, W. H.; Xie, W. J.; Ma, H.; Fu, Y. Y.; Fang, D. C.; Sun, H.; Fan, L. Z.; Han, M.; Liu, C. M.; Yang, S. H. Facile synthesis of water-soluble, highly fluorescent graphene quantum dots as a robust biological label for stem cells. J.
Mater. Chem. 2012, 22, 7461-7467. 21. Xu, S. C.; Irle, S.; Musaev, D. G.; Lin, M. C. Quantum chemical study of the dissociative adsorption of OH and H2O on pristine and defective graphite (0001) surfaces: Reaction mechanisms and kinetics. Journal of Physical Chemistry C 2007, 111, 1355-1365. 22. Liu, J.; Rinzler, A. G.; Dai, H.; Hafner, J. H.; Bradley, R. K.; Boul, P. J.; Lu, A.; Iverson, T.; Shelimov, K.; Huffman, C. B.; Rodriguez-Macias, F.; Shon, Y. S.; Lee, T. R.; Colbert, D. T.; Smalley, R. E. Fullerene pipes. Science 1998, 280, 1253-6. 23. Ziegler, K. J.; Gu, Z.; Peng, H.; Flor, E. L.; Hauge, R. H.; Smalley, R. E. Controlled oxidative cutting of single-walled carbon nanotubes. J. Am. Chem. Soc. 2005, 127, 1541-7. 24. Kingston, H. M.; Haswell, S. J. Microwave-Enhanced Chemistry: Fundamentals,
Sample Preparation, and Applications. American chemical society: Washington DC, 1997. 25. Kappe, C. O. Controlled microwave heating in modern organic synthesis. Angew.
Chem. Int. Ed. Engl. 2004, 43, 6250-84. 26. Sun, T.; Fabris, S. Mechanisms for oxidative unzipping and cutting of graphene. Nano Lett. 2012, 12, 17-21. 27. Chiu, P. L.; Mastrogiovanni, D. D.; Wei, D.; Louis, C.; Jeong, M.; Yu, G.; Saad, P.; Flach, C. R.; Mendelsohn, R.; Garfunkel, E.; He, H. Microwave- and nitronium ion-enabled rapid and direct production of highly conductive low-oxygen graphene. J. Am.
Chem. Soc. 2012, 134, 5850-6. 28. Patel, M. A.; Yang, H.; Chiu, P. L.; Mastrogiovanni, D. D. T.; Flach, C. R.; Savaram, K.; Gomez, L.; Hemnarine, A.; Mendelsohn, R.; Garfunkel, E.; Jiang, H.; He, H. Direct Production of Graphene Nanosheets for Near Infrared Photoacoustic Imaging. ACS
Nano 2013, 7, 8147-8157. 29. Sun, X.; Luo, D.; Liu, J.; Evans, D. G. Monodisperse chemically modified graphene obtained by density gradient ultracentrifugal rate separation. ACS Nano 2010, 4, 3381-9. 30. Li, D.; Muller, M. B.; Gilje, S.; Kaner, R. B.; Wallace, G. G. Processable aqueous dispersions of graphene nanosheets. Nat Nanotechnol 2008, 3, 101-5.
88
31. Hernandez, Y.; Nicolosi, V.; Lotya, M.; Blighe, F. M.; Sun, Z.; De, S.; McGovern, I. T.; Holland, B.; Byrne, M.; Gun'Ko, Y. K.; Boland, J. J.; Niraj, P.; Duesberg, G.; Krishnamurthy, S.; Goodhue, R.; Hutchison, J.; Scardaci, V.; Ferrari, A. C.; Coleman, J. N. High-yield production of graphene by liquid-phase exfoliation of graphite. Nat
Nanotechnol 2008, 3, 563-8. 32. Becerril, H. A.; Mao, J.; Liu, Z.; Stoltenberg, R. M.; Bao, Z.; Chen, Y. Evaluation of solution-processed reduced graphene oxide films as transparent conductors. Acs Nano
2008, 2, 463-470. 33. Bagri, A.; Mattevi, C.; Acik, M.; Chabal, Y. J.; Chhowalla, M.; Shenoy, V. B. Structural evolution during the reduction of chemically derived graphene oxide. Nat Chem
2010, 2, 581-7. 34. Eda, G.; Fanchini, G.; Chhowalla, M. Large-Area Ultrathin Films of Reduced Graphene Oxide as a Transparent and Flexible Electronic Materials. Nature Nanotech.
2008, 3, 270-274. 35. Loh, K. P.; Bao, Q.; Eda, G.; Chhowalla, M. Graphene oxide as a chemically tunable platform for optical applications. Nat Chem 2010, 2, 1015-24. 36. Park, S.; Ruoff, R. S. Chemical Methods for the Production of Graphene. Nature
Nanotech. 2009, 4, 217-224. 37. Chien, C. T.; Li, S. S.; Lai, W. J.; Yeh, Y. C.; Chen, H. A.; Chen, I. S.; Chen, L. C.; Chen, K. H.; Nemoto, T.; Isoda, S.; Chen, M.; Fujita, T.; Eda, G.; Yamaguchi, H.; Chhowalla, M.; Chen, C. W. Tunable photoluminescence from graphene oxide. Angew.
Chem. Int. Ed. Engl. 2012, 51, 6662-6. 38. Eda, G.; Chhowalla, M. Chemically derived graphene oxide: towards large-area thin-film electronics and optoelectronics. Adv. Mater. 2010, 22, 2392-415. 39. Eda, G.; Lin, Y. Y.; Mattevi, C.; Yamaguchi, H.; Chen, H. A.; Chen, I. S.; Chen, C. W.; Chhowalla, M. Blue photoluminescence from chemically derived graphene oxide. Adv. Mater. 2010, 22, 505-9. 40. Zhu, S.; Tang, S.; Zhang, J.; Yang, B. Control the size and surface chemistry of graphene for the rising fluorescent materials. Chem Commun (Camb) 2012, 48, 4527-39. 41. Moon, I. K.; Lee, J.; Ruoff, R. S.; Lee, H. Reduced graphene oxide by chemical graphitization. Nat Commun 2010, 1, 73. 42. Tung, V. C.; Allen, M. J.; Yang, Y.; Kaner, R. B. High-throughput solution processing of large-scale graphene. Nat Nanotechnol 2009, 4, 25-9. 43. Tuinstra, F.; Koenig, J. L. Raman spectrum of graphite. J. Chem. Phys. 1970, 53, 1126–1130. 44. Wang, H.; Robinson, J. T.; Li, X.; Dai, H. Solvothermal reduction of chemically exfoliated graphene sheets. J. Am. Chem. Soc. 2009, 131, 9910-1. 45. Niyogi, S.; Bekyarova, E.; Itkis, M. E.; Zhang, H.; Shepperd, K.; Hicks, J.; Sprinkle, M.; Berger, C.; Lau, C. N.; deHeer, W. A.; Conrad, E. H.; Haddon, R. C. Spectroscopy of covalently functionalized graphene. Nano Lett. 2010, 10, 4061-6. 46. Farmer, D. B.; Golizadeh-Mojarad, R.; Perebeinos, V.; Lin, Y. M.; Tulevski, G. S.; Tsang, J. C.; Avouris, P. Chemical doping and electron-hole conduction asymmetry in graphene devices. Nano Lett. 2009, 9, 388-92. 47. Lotya, M.; Hernandez, Y.; King, P. J.; Smith, R. J.; Nicolosi, V.; Karlsson, L. S.; Blighe, F. M.; De, S.; Wang, Z.; McGovern, I. T.; Duesberg, G. S.; Coleman, J. N. Liquid
89
phase production of graphene by exfoliation of graphite in surfactant/water solutions. J.
Am. Chem. Soc. 2009, 131, 3611-20. 48. Li, Z.; Zhang, W.; Luo, Y.; Yang, J.; Hou, J. G. How graphene is cut upon oxidation? J. Am. Chem. Soc. 2009, 131, 6320-1. 49. Chen, Z.; Kobashi, K.; Rauwald, U.; Booker, R.; Fan, H.; Hwang, W. F.; Tour, J. M. Soluble ultra-short single-walled carbon nanotubes. J. Am. Chem. Soc. 2006, 128, 10568-71. 50. Kim, F.; Luo, J. Y.; Cruz-Silva, R.; Cote, L. J.; Sohn, K.; Huang, J. X. Self-Propagating Domino-like Reactions in Oxidized Graphite. Adv. Funct. Mater. 2010, 20, 2867-2873. 51. Marcano, D. C.; Kosynkin, D. V.; Berlin, J. M.; Sinitskii, A.; Sun, Z.; Slesarev, A.; Alemany, L. B.; Lu, W.; Tour, J. M. Improved synthesis of graphene oxide. ACS Nano
2010, 4, 4806-14. 52. Edwards, H. G. M.; Fawcett, V. Quantitative Raman Spectroscopic Studies of Nitronium Ion Concentrations in Mixtures of Sulphuric and Nitric Acids. J. Molecular
Structure 1994, 326, 131. 53. Savaram, K.; Kalyanikar, M.; Patel, M.; Brukh, R.; Flach, C. R.; Huang, R.; Khoshi, M. R.; Mendelsohn, R.; Wang, A.; Garfunkel, E.; He, H. Synergy of oxygen and a piranha solution for eco-friendly production of highly conductive graphene dispersions. Green
Chemistry 2015, 17, 869-881. 54. Patel, M.; Feng, W.; Savaram, K.; Khoshi, M. R.; Huang, R.; Sun, J.; Rabie, E.; Flach, C.; Mendelsohn, R.; Garfunkel, E.; He, H. Microwave Enabled One-Pot, One-Step Fabrication and Nitrogen Doping of Holey Graphene Oxide for Catalytic Applications. Small 2015, 11, 3358-3368. 55. Loughin, S.; Grayeski, R.; Fischer, J. E. Charge Transfer in Graphite Nitrate and the Ionic Salt Model. J. Chem. Phys. 1978, 69, 3740-3745. 56. Esteves, P. M.; De, M. C. J. W.; Cardoso, S. P.; Barbosa, A. G.; Laali, K. K.; Rasul, G.; Prakash, G. K.; Olah, G. A. Unified mechanistic concept of electrophilic aromatic nitration: convergence of computational results and experimental data. J. Am. Chem. Soc.
2003, 125, 4836-49. 57. Han, T. H.; Huang, Y. K.; Tan, A. T.; Dravid, V. P.; Huang, J. Steam etched porous graphene oxide network for chemical sensing. J. Am. Chem. Soc. 2011, 133, 15264-7. 58. Bagri, A.; Mattevi, C.; Acik, M.; Chabal, Y. J.; Chhowalla, M.; Shenoy, V. B. Structural evolution during the reduction of chemically derived graphene oxide. Nature
Chemistry 2010, 2, 581-587. 59. Shen, H.; Liu, M.; He, H.; Zhang, L.; Huang, J.; Chong, Y.; Dai, J.; Zhang, Z. PEGylated graphene oxide-mediated protein delivery for cell function regulation. ACS
Appl Mater Interfaces 2012, 4, 6317-23. 60. Yang, K.; Feng, L.; Shi, X.; Liu, Z. Nano-graphene in biomedicine: theranostic applications. Chem. Soc. Rev. 2013, 42, 530-47. 61. Yang, K.; Zhang, S.; Zhang, G.; Sun, X.; Lee, S. T.; Liu, Z. Graphene in mice: ultrahigh in vivo tumor uptake and efficient photothermal therapy. Nano Lett. 2010, 10, 3318-23. 62. Yang, X. Y.; Zhang, X. Y.; Liu, Z. F.; Ma, Y. F.; Huang, Y.; Chen, Y. High-Efficiency Loading and Controlled Release of Doxorubicin Hydrochloride on Graphene Oxide. Journal of Physical Chemistry C 2008, 112, 17554-17558.
90
63. Zhang, L. M.; Wang, Z. L.; Lu, Z. X.; Shen, H.; Huang, J.; Zhao, Q. H.; Liu, M.; He, N. Y.; Zhang, Z. J. PEGylated reduced graphene oxide as a superior ssRNA delivery system. Journal of Materials Chemistry B 2013, 1, 749-755. 64. Zhang, Y.; Yang, K.; Hong, H.; Engle, J.; Feng, L.; Theuer, C.; Barnhart, T.; Liu, Z.; Cai, W. In Vivo Targeting and Imaging of Tumor Vasculature with Radiolabeled, Antibody-Conjugated Nano-Graphene. Medical Physics 2012, 39, 3950-3950. 65. Sun, X.; Liu, Z.; Welsher, K.; Robinson, J. T.; Goodwin, A.; Zaric, S.; Dai, H. Nano-Graphene Oxide for Cellular Imaging and Drug Delivery. Nano Res 2008, 1, 203-212. 66. Yang, X.; Skrabalak, S. E.; Li, Z. Y.; Xia, Y.; Wang, L. V. Photoacoustic tomography of a rat cerebral cortex in vivo with au nanocages as an optical contrast agent. Nano Lett. 2007, 7, 3798-802. 67. de la Zerda, A.; Kim, J. W.; Galanzha, E. I.; Gambhir, S. S.; Zharov, V. P. Advanced contrast nanoagents for photoacoustic molecular imaging, cytometry, blood test and photothermal theranostics. Contrast Media Mol Imaging 2011, 6, 346-69. 68. Yang, K.; Hu, L.; Ma, X.; Ye, S.; Cheng, L.; Shi, X.; Li, C.; Li, Y.; Liu, Z. Multimodal imaging guided photothermal therapy using functionalized graphene nanosheets anchored with magnetic nanoparticles. Adv. Mater. 2012, 24, 1868-72. 69. Taratula, O.; Patel, M.; Schumann, C.; Naleway, M. A.; Pang, A. J.; He, H.; Taratula, O. Phthalocyanine-loaded graphene nanoplatform for imaging-guided combinatorial phototherapy. International journal of nanomedicine 2015, 10, 2347. 70. Jachak, A. C.; Creighton, M.; Qiu, Y.; Kane, A. B.; Hurt, R. H. Biological interactions and safety of graphene materials. MRS Bull. 2012, 37, 1307-1313. 71. Sanchez, V. C.; Jachak, A.; Hurt, R. H.; Kane, A. B. Biological interactions of graphene-family nanomaterials: an interdisciplinary review. Chem. Res. Toxicol. 2012, 25, 15-34. 72. Yin, L.; Wang, Q.; Zhang, Q. Z.; Jiang, H. B. Tomographic imaging of absolute optical absorption coefficient in turbid media using combined photoacoustic and diffusing light measurements. Opt. Lett. 2007, 32, 2556-2558. 73. Zhang, Q.; Liu, Z.; Carney, P. R.; Yuan, Z.; Chen, H.; Roper, S. N.; Jiang, H. Non-invasive imaging of epileptic seizures in vivo using photoacoustic tomography. Phys Med
Biol 2008, 53, 1921-31.
91
Chapter 3. Microwave Enabled One-Pot, One-Step Fabrication
and Nitrogen Doping of Holey Graphene Oxide for Catalytic
Applications
3.1 Introduction
The ever-increasing global depletion of fossil resources and their environmental impacts
stimulate intense research activities in the development of alternative green and sustainable
energy resources. Fuel cells and metal-air batteries are the most attractive clean and high-
efficiency devices for power generation and energy storage.1-3 However, their large-scale
practical application will be difficult to realize if the expensive platinum-based
electrocatalysts for oxygen reduction reaction (ORR) cannot be replaced by efficient,
stable, low-cost, and sustainable catalysts in their electrodes. Recent efforts in
reducing/replacing expensive platinum-based electrodes have led to the development of
new ORR electrocatalysts.4-9 Among them, graphene, especially the heteroatom doped
graphene, shows outstanding potential as a metal free catalyst. However, practical
application of the graphene based metal free catalyst is hampered due to its remarkable
impermeability.10 Hence, the reactants and products cannot access/leave the inner catalytic
sites easily, which results in unsatisfactory performance and non-efficient mass transport.
In contrast, holey graphene, referred to graphene sheets with nanoholes in its basal plane,
not only provides “short cuts” for efficient mass transport, but also possess significantly
more catalytic centers due to the increased edges associated with the existence of holes.
Several approaches have been reported for the production of holey graphene sheets.
Bottom-up approaches based on chemical vapor deposition methods,11-13 and top-down
92
approaches via photo,14 electron,15 or plasma11 etching utilize various templates, which
provide good control over the sizes and shapes of the holes/pores. However, all these
strategies suffer from difficulties in scaling up for large quantity production and high cost.
On the other hand, chemical etching based processes, such as KOH etching,16 H3PO4
activation,17 HNO3 oxidation,18, 19 hot steam etching,20 and oxidative etching with catalytic
nanoparticles like Fe2O3,21 Ag22 or other metal oxide nanoparticles23 have advantages for
large scale and cost effective synthesis. However, these chemical etching based approaches
require graphene oxide (GO) or reduced graphene oxide (rGO) as a starting material, which
takes hours to days for their fabrication, depending on the oxidation method applied. There
is no approach that has been reported yet to rapidly fabricate holey graphene directly from
graphite particles. Herein, we report our unexpected discovery that by replacing traditional
heating with microwave heating, holey graphene oxide (HGO) sheets are directly and
rapidly (40 seconds) fabricated from graphite particles via a one-step-one-pot reaction.
Furthermore, by slightly shortening the microwave heating time, graphene oxide (GO)
sheets without holes can be rapidly fabricated. This approach has the similar chemical
recipe as the widely used Hummers method, but dramatically shortened the reaction time
from days to tens of seconds with high production yield (120 wt% of graphite).
Heteroatom (N, P, B, and S) doping in graphene can effectively tailor its electronic
properties and thus have a great impact on its wide range of applications in electronics,
energy storage and metal free catalyst applications.24-35 There are quite a few methods
available for nitrogen(N) doping.32, 36-43 However, all of these approaches require long time
and/or high annealing temperature with various N containing molecules. Again, by taking
advantage of the unique heating mechanism of microwave, we developed a fast and low
93
temperature approach to simultaneously reduce and dope graphene oxide sheets with
nitrogen. The N doping type can be controlled simply by changing the microwave time.
With 10 minutes of microwave irradiation, pyridinic and pyrrolic N reaches the highest
percentage in holey graphene sheets, which shows the best catalytic activity toward
electrochemical oxygen reduction reaction (ORR). These N-doped holey rGO (N-HrGO-
10) sheets not only offer the lower over-potential and peak potential but also provides more
than 4 times higher kinetic current density than non-porous N-doped rGO (N-rGO-10). It
is likely due to the existence of nanoholes, which provides “short cuts” for efficient mass
transport and also creates more catalytic centers due to the increased surface area and edges
associated with the nanoholes in the N-HrGO-10. For the first time, we experimentally
determined the effective diffusion coefficient constant of O2 for the N-HrGO-10, which is
indeed significantly higher than that of the N-rGO-10. Even though the onset potential is
slightly higher than the Pt/C (0.09 V), the N-HrGO-10 shows much higher catalytic current,
better stability and durability against methanol poisoning. The capability of rapid
fabrication and N doping of HGO can lead us to develop efficient catalysts which can
replace previous coin metals for energy generation and storage, such as fuel cells and metal
–air batteries.
3.2 Results and Discussion
In the previous chapter, we have developed a fast, scalable, and low-energy approach to
directly produce graphene nanosheets (GNs) from graphite powder.44 These graphene
nanosheets are highly uniform in size and largely retain their intrinsic graphitic structures
without any post-reduction treatment. The key is to exclude KMnO4 (as used in Hummers
or Modified Hummers methods) and exploit pure nitronium ion oxidation and the unique
94
thermal and kinetic effects induced by microwave heating. Due to the unique effects of
microwave heating, it is very likely that consumption/etching of defective carbons (already
oxidized carbon or sp3 carbon) was selectively enhanced more than that of the continuing
oxidation of intact graphene domains (generation of more oxygen containing groups). As
a result, the graphene sheets rapidly breakdown to small pieces with the intrinsic structures
of graphene largely intact. In this work, we found that by including KMnO4 in the reaction
system, and by adjusting microwave irradiation time and amount of KMnO4, the
etching/consumption of the generated defective carbons can be controlled, so that graphene
oxide sheets with controlled hole structures can be directly fabricated from graphite powder
in one step.
In a typical experiment, the mixture of graphite powder, acids (concentrated H2SO4:
HNO3, 4:1) and KMnO4 (500 wt% of graphite) was subjected to microwave irradiation at
300 watts for different times (30seconds for GO or 40seconds for HGO). The resulting
products, after cleaning, are easy to disperse in water by simple bath sonication. Their
dispersions in water have brown color (inset of Figure 3.1E and F), independent of
microwave irradiation time. They all exhibit the typical ~230nm peak in UV-visible
spectrum (Figure 3.1E and F, respectively) due to π → π* transition of C=C with a
shoulder around 300nm due to the n → π* transition of carbonyl functional group. X-ray
photoelectron spectroscopy (XPS) measurements were performed to carefully study their
oxidation level and chemical functionalities. Interestingly, high resolution C1s (Figure
3.2C and D) and O1s peak (Figure 3.2B) analysis of GO and HGO shows that the C: O
atomic ratio is ~2.38, similar in both GO (Table 3.1), which indicates that both GOs have
similar extent of oxidation in spite of different microwave time.
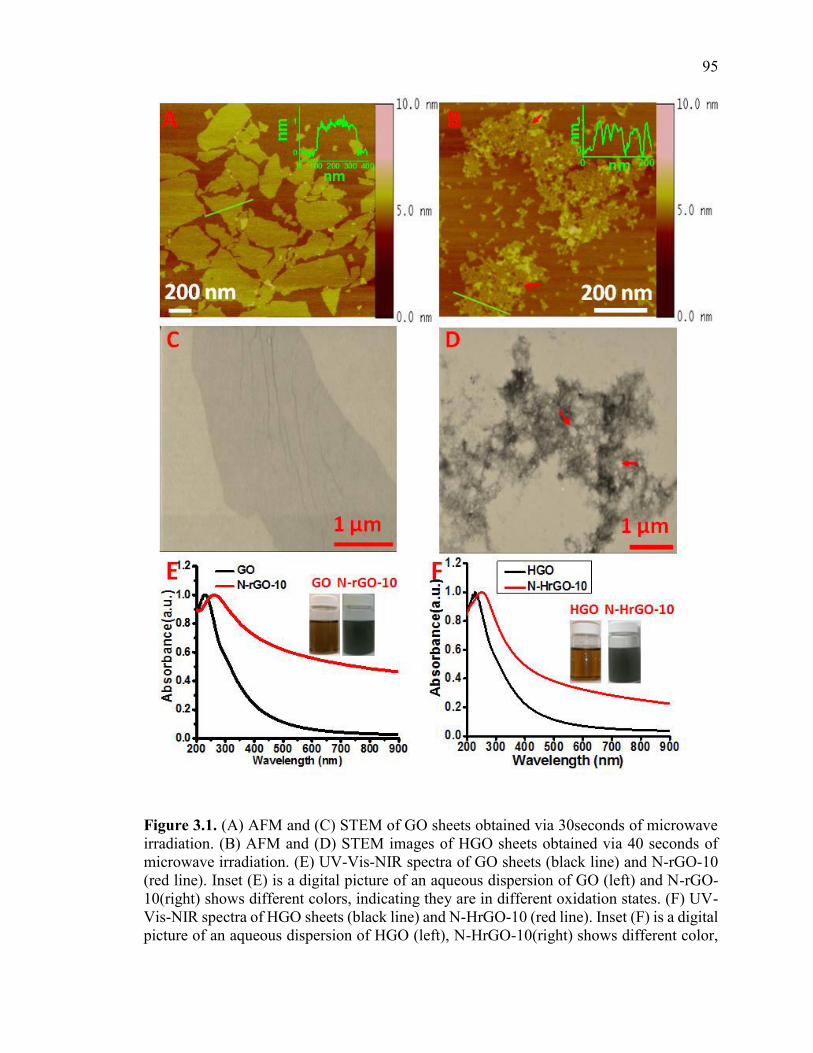
95
Figure 3.1. (A) AFM and (C) STEM of GO sheets obtained via 30seconds of microwave irradiation. (B) AFM and (D) STEM images of HGO sheets obtained via 40 seconds of microwave irradiation. (E) UV-Vis-NIR spectra of GO sheets (black line) and N-rGO-10 (red line). Inset (E) is a digital picture of an aqueous dispersion of GO (left) and N-rGO-10(right) shows different colors, indicating they are in different oxidation states. (F) UV-Vis-NIR spectra of HGO sheets (black line) and N-HrGO-10 (red line). Inset (F) is a digital picture of an aqueous dispersion of HGO (left), N-HrGO-10(right) shows different color,
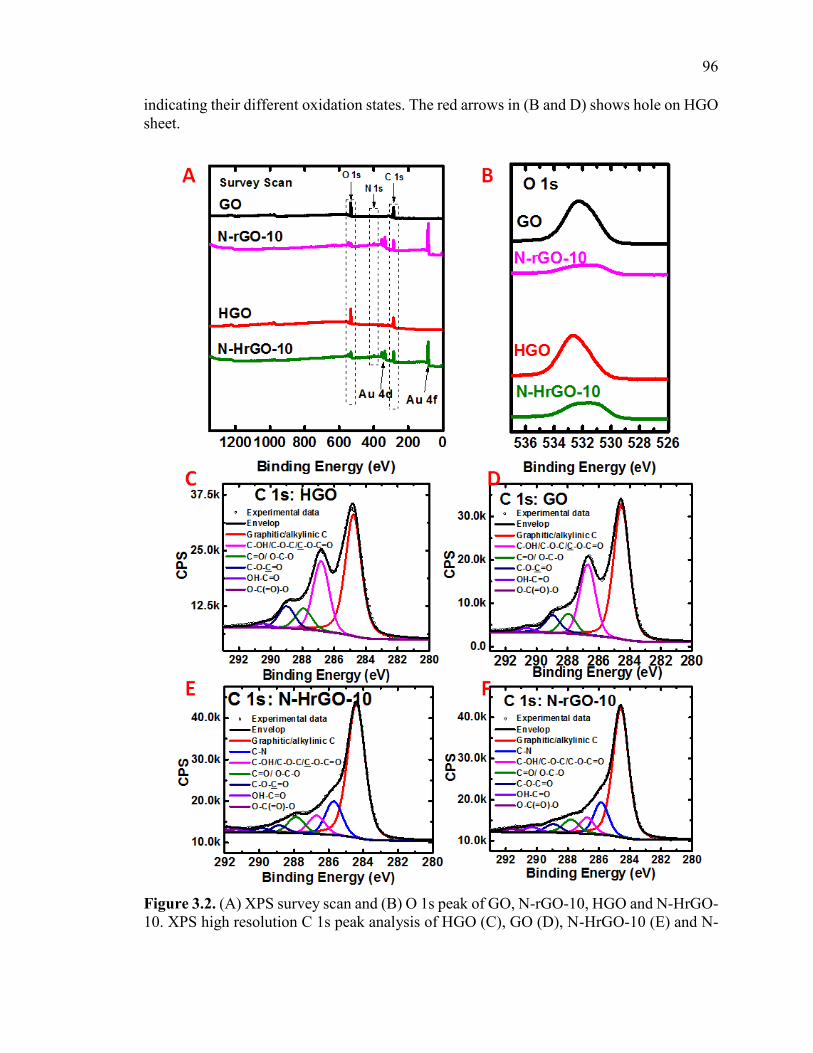
96
indicating their different oxidation states. The red arrows in (B and D) shows hole on HGO sheet.
Figure 3.2. (A) XPS survey scan and (B) O 1s peak of GO, N-rGO-10, HGO and N-HrGO-10. XPS high resolution C 1s peak analysis of HGO (C), GO (D), N-HrGO-10 (E) and N-
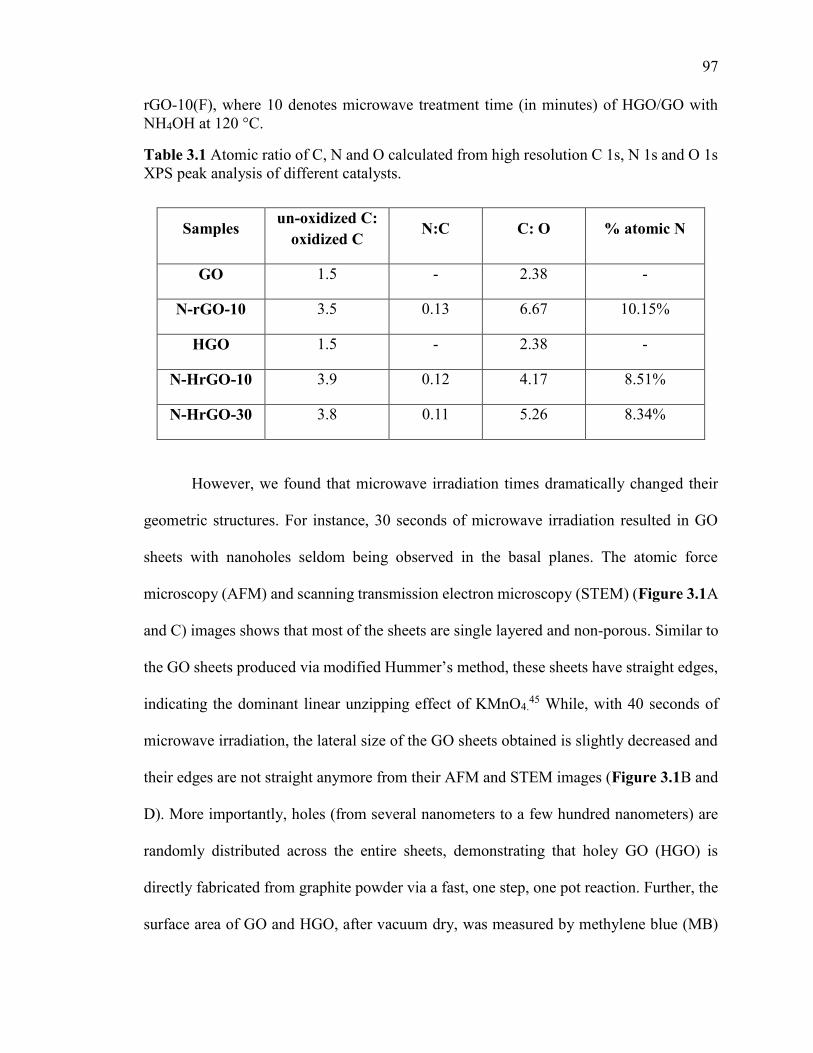
97
rGO-10(F), where 10 denotes microwave treatment time (in minutes) of HGO/GO with NH4OH at 120 °C.
Table 3.1 Atomic ratio of C, N and O calculated from high resolution C 1s, N 1s and O 1s XPS peak analysis of different catalysts.
However, we found that microwave irradiation times dramatically changed their
geometric structures. For instance, 30 seconds of microwave irradiation resulted in GO
sheets with nanoholes seldom being observed in the basal planes. The atomic force
microscopy (AFM) and scanning transmission electron microscopy (STEM) (Figure 3.1A
and C) images shows that most of the sheets are single layered and non-porous. Similar to
the GO sheets produced via modified Hummer’s method, these sheets have straight edges,
indicating the dominant linear unzipping effect of KMnO4.45 While, with 40 seconds of
microwave irradiation, the lateral size of the GO sheets obtained is slightly decreased and
their edges are not straight anymore from their AFM and STEM images (Figure 3.1B and
D). More importantly, holes (from several nanometers to a few hundred nanometers) are
randomly distributed across the entire sheets, demonstrating that holey GO (HGO) is
directly fabricated from graphite powder via a fast, one step, one pot reaction. Further, the
surface area of GO and HGO, after vacuum dry, was measured by methylene blue (MB)
Samples un-oxidized C:
oxidized C N:C C: O % atomic N
GO 1.5 - 2.38 -
N-rGO-10 3.5 0.13 6.67 10.15%
HGO 1.5 - 2.38 -
N-HrGO-10 3.λ 0.12 4.17 8.51%
N-HrGO-30 3.8 0.11 5.26 8.34%
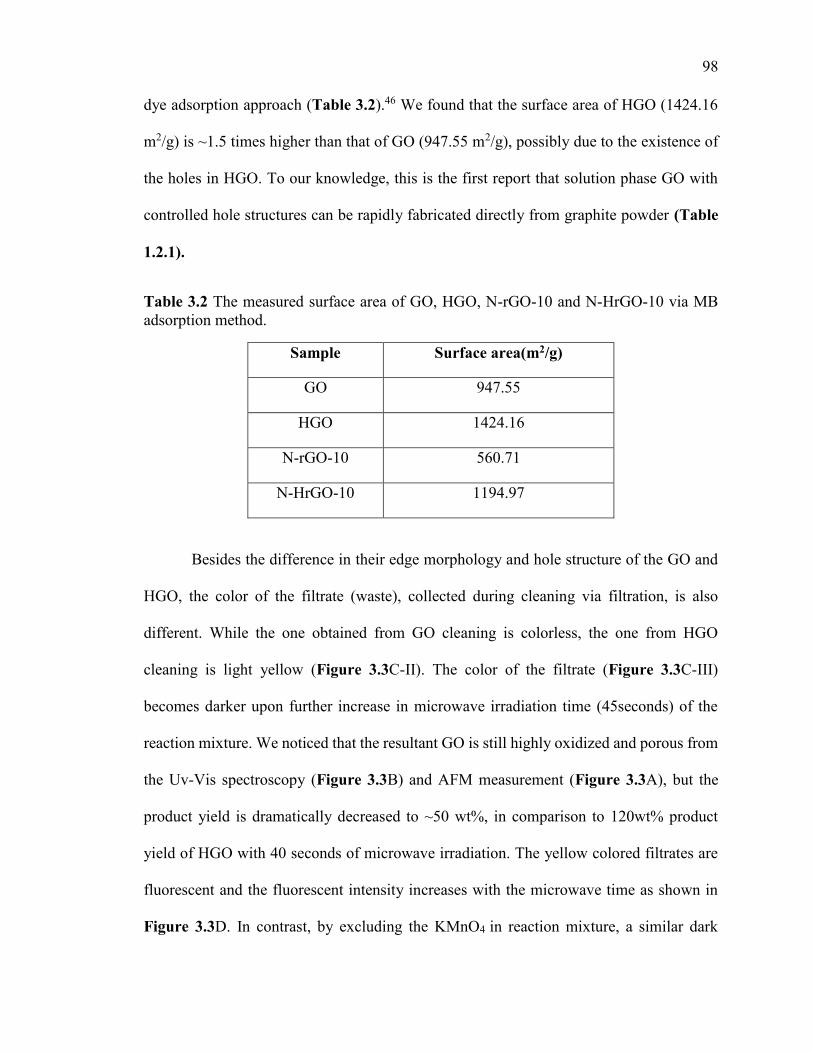
98
dye adsorption approach (Table 3.2).46 We found that the surface area of HGO (1424.16
m2/g) is ~1.5 times higher than that of GO (947.55 m2/g), possibly due to the existence of
the holes in HGO. To our knowledge, this is the first report that solution phase GO with
controlled hole structures can be rapidly fabricated directly from graphite powder (Table
1.2.1).
Table 3.2 The measured surface area of GO, HGO, N-rGO-10 and N-HrGO-10 via MB adsorption method.
Sample Surface area(m2/g)
GO 947.55
HGO 1424.16
N-rGO-10 560.71
N-HrGO-10 1194.97
Besides the difference in their edge morphology and hole structure of the GO and
HGO, the color of the filtrate (waste), collected during cleaning via filtration, is also
different. While the one obtained from GO cleaning is colorless, the one from HGO
cleaning is light yellow (Figure 3.3C-II). The color of the filtrate (Figure 3.3C-III)
becomes darker upon further increase in microwave irradiation time (45seconds) of the
reaction mixture. We noticed that the resultant GO is still highly oxidized and porous from
the Uv-Vis spectroscopy (Figure 3.3B) and AFM measurement (Figure 3.3A), but the
product yield is dramatically decreased to ~50 wt%, in comparison to 120wt% product
yield of HGO with 40 seconds of microwave irradiation. The yellow colored filtrates are
fluorescent and the fluorescent intensity increases with the microwave time as shown in
Figure 3.3D. In contrast, by excluding the KMnO4 in reaction mixture, a similar dark
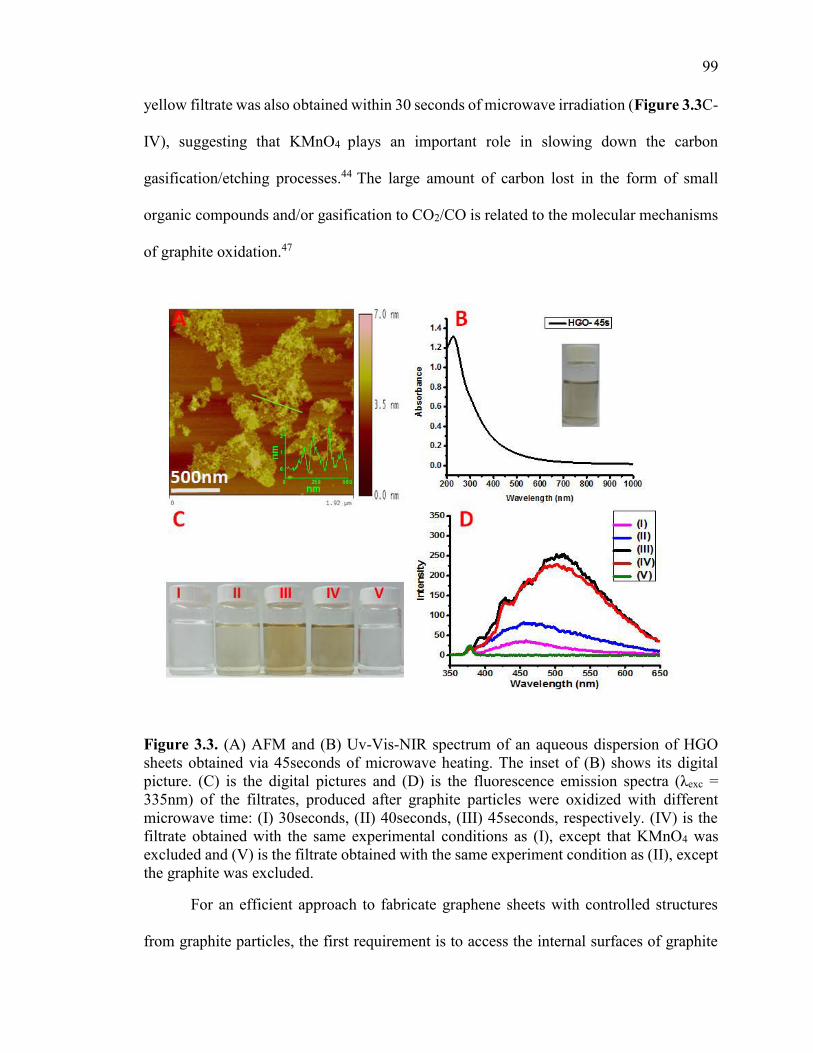
99
yellow filtrate was also obtained within 30 seconds of microwave irradiation (Figure 3.3C-
IV), suggesting that KMnO4 plays an important role in slowing down the carbon
gasification/etching processes.44 The large amount of carbon lost in the form of small
organic compounds and/or gasification to CO2/CO is related to the molecular mechanisms
of graphite oxidation.47
Figure 3.3. (A) AFM and (B) Uv-Vis-NIR spectrum of an aqueous dispersion of HGO sheets obtained via 45seconds of microwave heating. The inset of (B) shows its digital picture. (C) is the digital pictures and (D) is the fluorescence emission spectra ( exc = 335nm) of the filtrates, produced after graphite particles were oxidized with different microwave time: (I) 30seconds, (II) 40seconds, (III) 45seconds, respectively. (IV) is the filtrate obtained with the same experimental conditions as (I), except that KMnO4 was excluded and (V) is the filtrate obtained with the same experiment condition as (II), except the graphite was excluded.
For an efficient approach to fabricate graphene sheets with controlled structures
from graphite particles, the first requirement is to access the internal surfaces of graphite
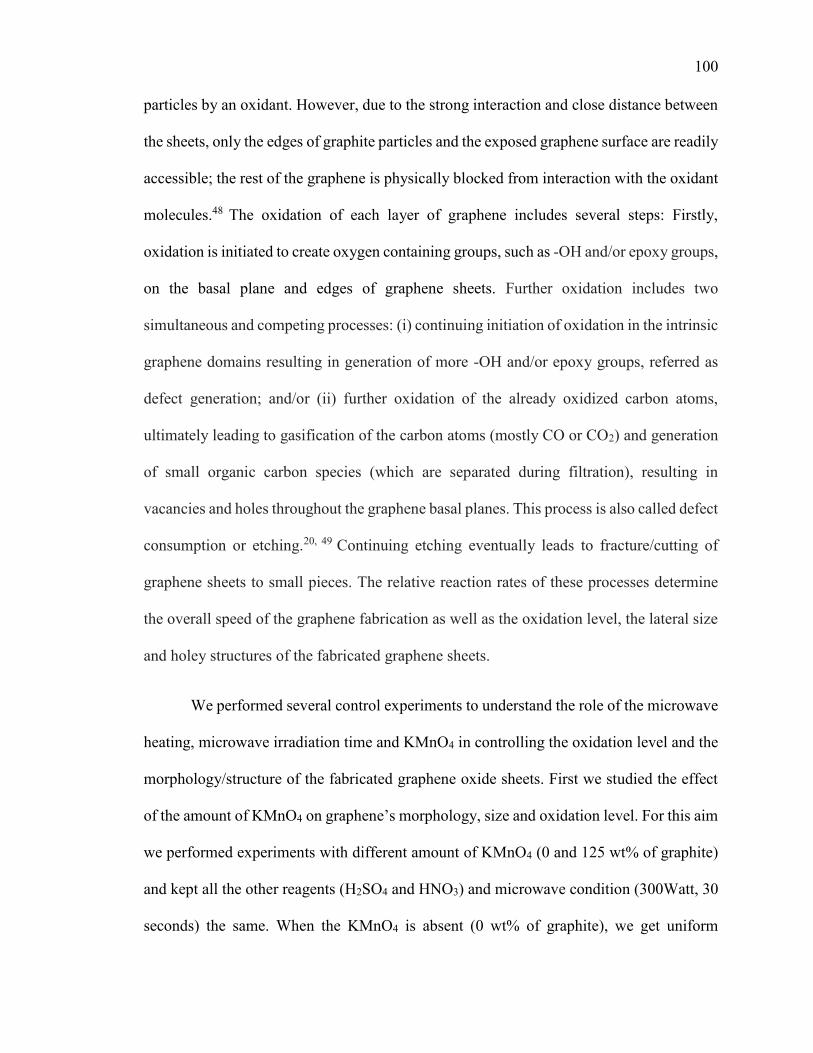
100
particles by an oxidant. However, due to the strong interaction and close distance between
the sheets, only the edges of graphite particles and the exposed graphene surface are readily
accessible; the rest of the graphene is physically blocked from interaction with the oxidant
molecules.48 The oxidation of each layer of graphene includes several steps: Firstly,
oxidation is initiated to create oxygen containing groups, such as -OH and/or epoxy groups,
on the basal plane and edges of graphene sheets. Further oxidation includes two
simultaneous and competing processes: (i) continuing initiation of oxidation in the intrinsic
graphene domains resulting in generation of more -OH and/or epoxy groups, referred as
defect generation; and/or (ii) further oxidation of the already oxidized carbon atoms,
ultimately leading to gasification of the carbon atoms (mostly CO or CO2) and generation
of small organic carbon species (which are separated during filtration), resulting in
vacancies and holes throughout the graphene basal planes. This process is also called defect
consumption or etching.20, 49 Continuing etching eventually leads to fracture/cutting of
graphene sheets to small pieces. The relative reaction rates of these processes determine
the overall speed of the graphene fabrication as well as the oxidation level, the lateral size
and holey structures of the fabricated graphene sheets.
We performed several control experiments to understand the role of the microwave
heating, microwave irradiation time and KMnO4 in controlling the oxidation level and the
morphology/structure of the fabricated graphene oxide sheets. First we studied the effect
of the amount of KMnO4 on graphene’s morphology, size and oxidation level. For this aim
we performed experiments with different amount of KMnO4 (0 and 125 wt% of graphite)
and kept all the other reagents (H2SO4 and HNO3) and microwave condition (300Watt, 30
seconds) the same. When the KMnO4 is absent (0 wt% of graphite), we get uniform
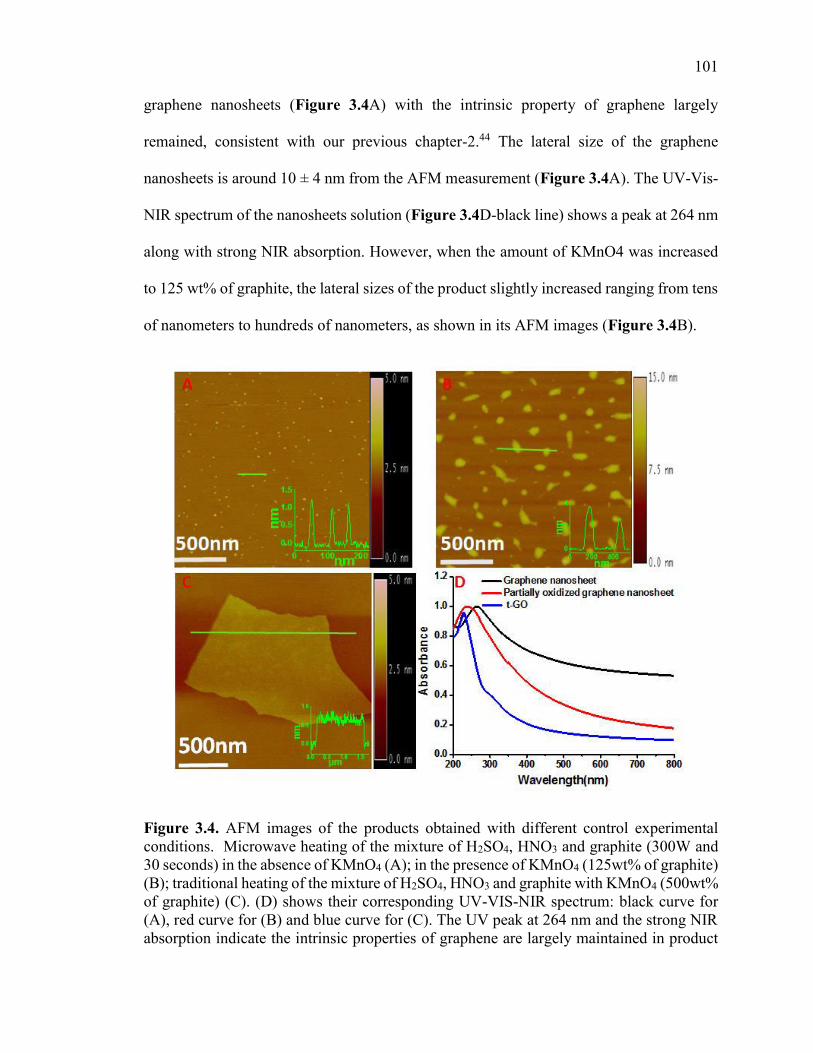
101
graphene nanosheets (Figure 3.4A) with the intrinsic property of graphene largely
remained, consistent with our previous chapter-2.44 The lateral size of the graphene
nanosheets is around 10 ± 4 nm from the AFM measurement (Figure 3.4A). The UV-Vis-
NIR spectrum of the nanosheets solution (Figure 3.4D-black line) shows a peak at 264 nm
along with strong NIR absorption. However, when the amount of KMnO4 was increased
to 125 wt% of graphite, the lateral sizes of the product slightly increased ranging from tens
of nanometers to hundreds of nanometers, as shown in its AFM images (Figure 3.4B).
Figure 3.4. AFM images of the products obtained with different control experimental conditions. Microwave heating of the mixture of H2SO4, HNO3 and graphite (300W and 30 seconds) in the absence of KMnO4 (A); in the presence of KMnO4 (125wt% of graphite) (B); traditional heating of the mixture of H2SO4, HNO3 and graphite with KMnO4 (500wt% of graphite) (C). (D) shows their corresponding UV-VIS-NIR spectrum: black curve for (A), red curve for (B) and blue curve for (C). The UV peak at 264 nm and the strong NIR absorption indicate the intrinsic properties of graphene are largely maintained in product
102
(A); the blue shift of the UV peak to 240 nm and the decrease in NIR absorption suggest that the product (B) is partially oxidized. The product (C) shows a typical UV-VIS-NIR spectrum of a highly oxidized graphene oxide.
Moreover, the UV-visible spectrum (Figure 3.4D-red line) of the product shows a peak
position at 240 nm, which indicates the product are partially oxidized compared to those
obtained without KMnO4. These results suggest that in absence of KMnO4, the defect
consumption rate is much faster than the rate of new defect generation, resulting in uniform
nanosized graphene with largely retained intrinsic properties. But in the presence of
KMnO4, defect consumption speed is decreased possibly because the MnO4– ions anchor
and /or bind to the defects (the oxygen containing functional groups generated in the first
step of oxidation), which slows down the speed of defect consumption. Hence the lateral
size and oxidation level of graphene is slightly increased.
We also performed another control experiment to study the importance of
microwave heating over traditional heating in HGO synthesis. In this control experiment,
instead of microwave heating, we heated the mixture of graphite, sulfuric acid, nitric acid
and KMnO4 (500 wt% of graphite) at 80 °C on oil bath for 12 hours. Similar to traditional
Hummer’s method, highly oxidized GO sheets (we referred as t-GO) were produced. The
UV-Visible spectrum of the t-GO (Figure 3.4D-blue line) shows a typical absorption peak
of GO at 230nm due to π→ π* transition of C=C and a shoulder around 300 nm due to n→
π* transition of carbonyl functional groups (Figure 3.4C). The t-GO sheets are mainly
single layered with their lateral sizes ranging from hundreds nanometers to a few
micrometers. However, nanoholes in these sheets are seldom observed, suggesting that
microwave heating is important to synthesis holey GO. This is possibly due to its ability to
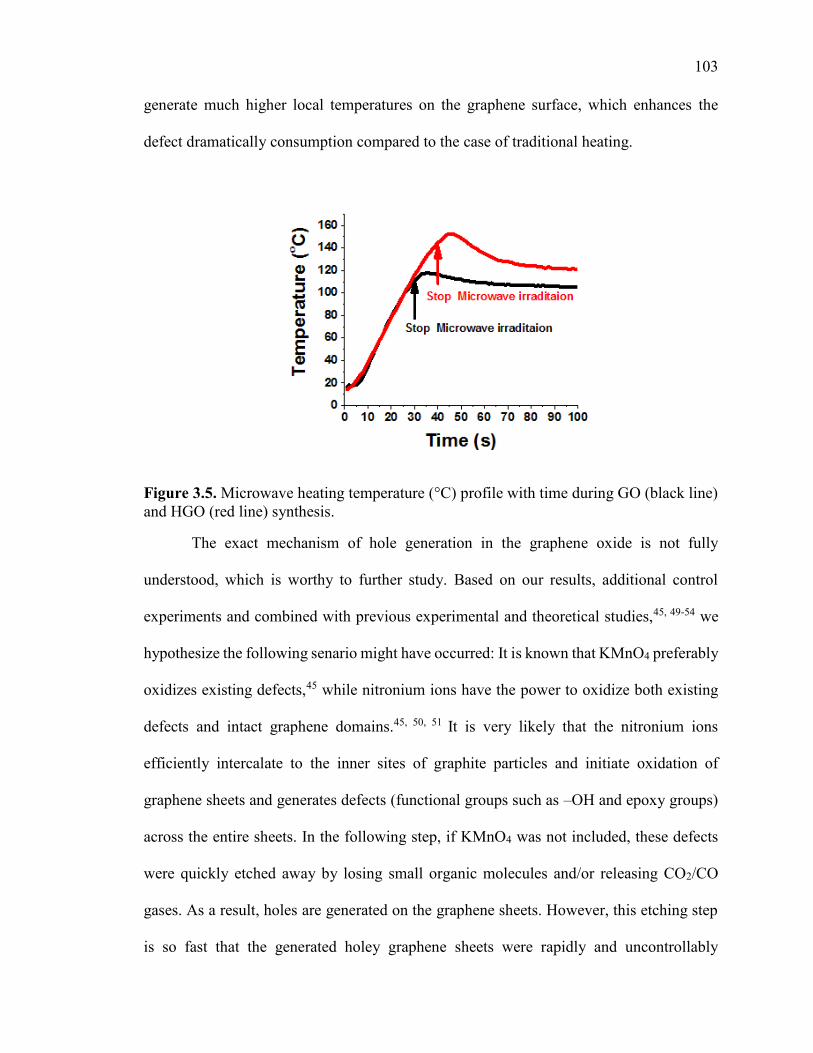
103
generate much higher local temperatures on the graphene surface, which enhances the
defect dramatically consumption compared to the case of traditional heating.
Figure 3.5. Microwave heating temperature (°C) profile with time during GO (black line) and HGO (red line) synthesis.
The exact mechanism of hole generation in the graphene oxide is not fully
understood, which is worthy to further study. Based on our results, additional control
experiments and combined with previous experimental and theoretical studies,45, 49-54 we
hypothesize the following senario might have occurred: It is known that KMnO4 preferably
oxidizes existing defects,45 while nitronium ions have the power to oxidize both existing
defects and intact graphene domains.45, 50, 51 It is very likely that the nitronium ions
efficiently intercalate to the inner sites of graphite particles and initiate oxidation of
graphene sheets and generates defects (functional groups such as –OH and epoxy groups)
across the entire sheets. In the following step, if KMnO4 was not included, these defects
were quickly etched away by losing small organic molecules and/or releasing CO2/CO
gases. As a result, holes are generated on the graphene sheets. However, this etching step
is so fast that the generated holey graphene sheets were rapidly and uncontrollably
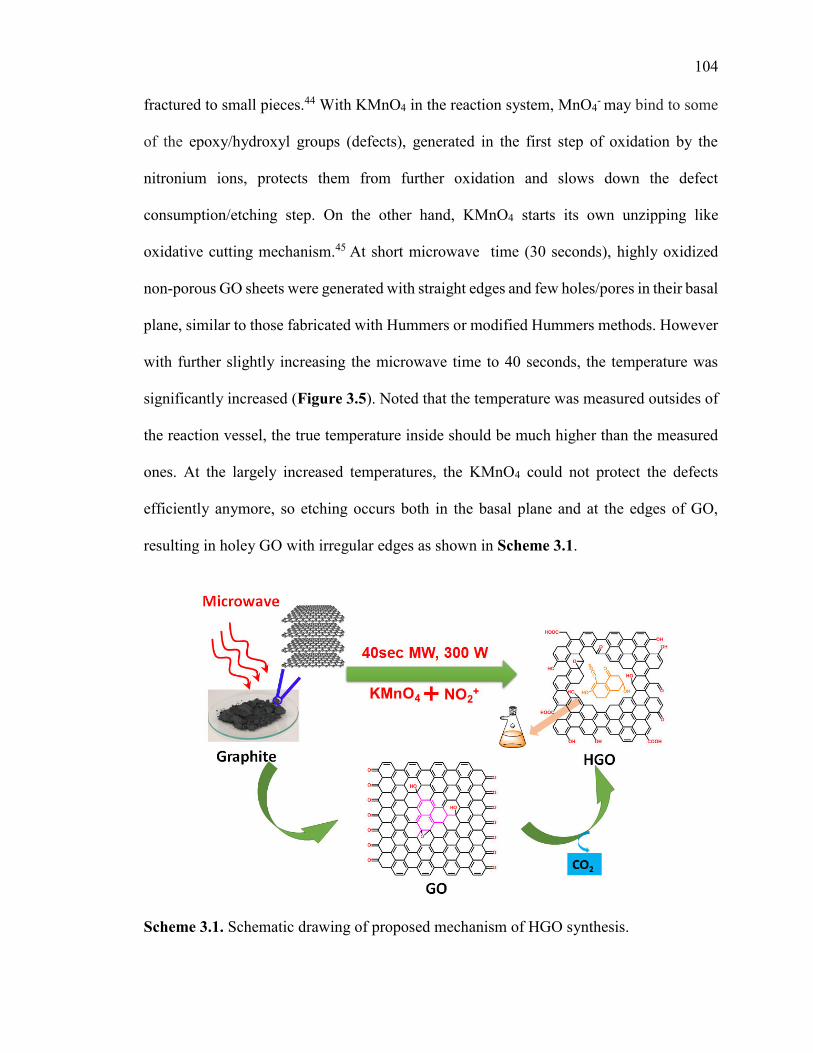
104
fractured to small pieces.44 With KMnO4 in the reaction system, MnO4- may bind to some
of the epoxy/hydroxyl groups (defects), generated in the first step of oxidation by the
nitronium ions, protects them from further oxidation and slows down the defect
consumption/etching step. On the other hand, KMnO4 starts its own unzipping like
oxidative cutting mechanism.45 At short microwave time (30 seconds), highly oxidized
non-porous GO sheets were generated with straight edges and few holes/pores in their basal
plane, similar to those fabricated with Hummers or modified Hummers methods. However
with further slightly increasing the microwave time to 40 seconds, the temperature was
significantly increased (Figure 3.5). Noted that the temperature was measured outsides of
the reaction vessel, the true temperature inside should be much higher than the measured
ones. At the largely increased temperatures, the KMnO4 could not protect the defects
efficiently anymore, so etching occurs both in the basal plane and at the edges of GO,
resulting in holey GO with irregular edges as shown in Scheme 3.1.
Scheme 3.1. Schematic drawing of proposed mechanism of HGO synthesis.
105
Heteroatom doping of graphene, especially N-doping, can effectively tailor and fine
tune its electronic structures, thus has great impacts on is applications in electronics, energy
storage and metal free catalysts.24, 28-31 There are quite a few strategies have been reported
for N-doping of graphene, however all of them require high temperature (500 ~ 1000 ˚C)
and/or long reaction time for N doping (Table 1.3.1). Recently, Tang et al. exploited
microwave heating to reach high temperature and to shorten the doping time.55 However,
due to the low microwave absorption capability of GO, the microwave assisted N doping
could be achieved only for pre-pyrolytic graphene oxide dry powder, which obtained by
preheating of GO at ~250 °C before microwave treatment. Furthermore, the product is not
easy for solution processible applications. Here in, again by taking an advantage of
microwave heating, we report that solution processbile N doped and concurrently reduced
GO is achieved at low temperatures and with short reaction time. Specifically, a mixture
of GO sheets and concentrated NH4OH is heated in a closed glass vessel via microwave
irradiation. In ~40 seconds, the apparent temperature reaches to 120 °C possibly due to
dielectric and/or ionic heating mechanism. With a closed looped configuration of the
microwave heating system, we held this temperature for 10 minutes. From Uv-vis
spectroscopy, FT-IR, and XPS characterization, we found that this process results in
simultaneous N-doping and reduction of GO/HGO. We refer the N-doped holey reduced
GO as N-HrGO-10 and N-doped nonporous reduced GO as N-rGO-10, 10 denotes 10
minutes of microwave reaction time for N doping.
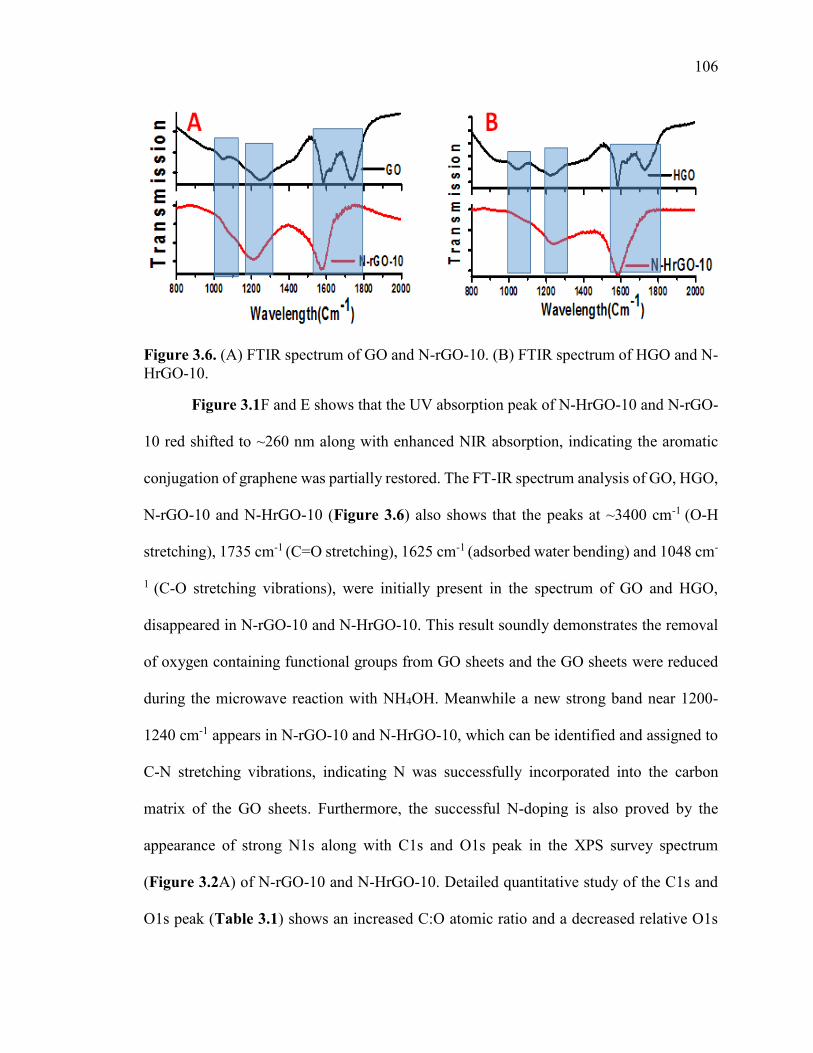
106
Figure 3.6. (A) FTIR spectrum of GO and N-rGO-10. (B) FTIR spectrum of HGO and N-HrGO-10.
Figure 3.1F and E shows that the UV absorption peak of N-HrGO-10 and N-rGO-
10 red shifted to ~260 nm along with enhanced NIR absorption, indicating the aromatic
conjugation of graphene was partially restored. The FT-IR spectrum analysis of GO, HGO,
N-rGO-10 and N-HrGO-10 (Figure 3.6) also shows that the peaks at ~3400 cm-1 (O-H
stretching), 1735 cm-1 (C=O stretching), 1625 cm-1 (adsorbed water bending) and 1048 cm-
1 (C-O stretching vibrations), were initially present in the spectrum of GO and HGO,
disappeared in N-rGO-10 and N-HrGO-10. This result soundly demonstrates the removal
of oxygen containing functional groups from GO sheets and the GO sheets were reduced
during the microwave reaction with NH4OH. Meanwhile a new strong band near 1200-
1240 cm-1 appears in N-rGO-10 and N-HrGO-10, which can be identified and assigned to
C-N stretching vibrations, indicating N was successfully incorporated into the carbon
matrix of the GO sheets. Furthermore, the successful N-doping is also proved by the
appearance of strong N1s along with C1s and O1s peak in the XPS survey spectrum
(Figure 3.2A) of N-rGO-10 and N-HrGO-10. Detailed quantitative study of the C1s and
O1s peak (Table 3.1) shows an increased C:O atomic ratio and a decreased relative O1s
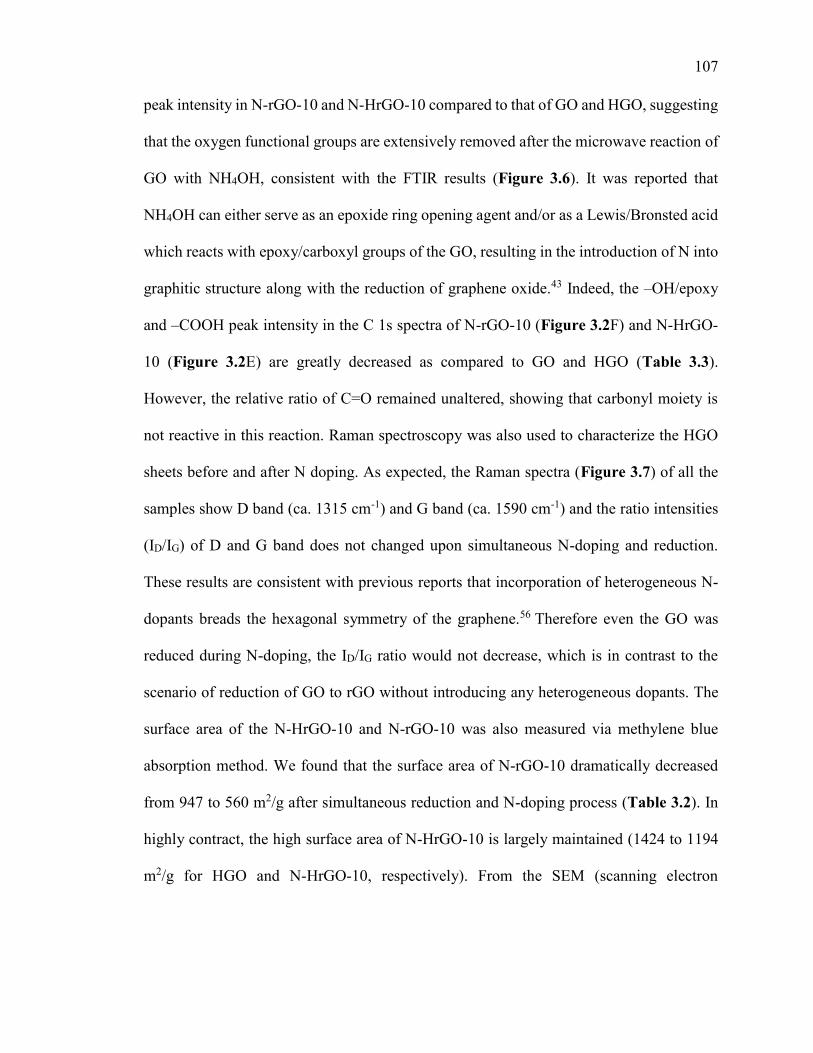
107
peak intensity in N-rGO-10 and N-HrGO-10 compared to that of GO and HGO, suggesting
that the oxygen functional groups are extensively removed after the microwave reaction of
GO with NH4OH, consistent with the FTIR results (Figure 3.6). It was reported that
NH4OH can either serve as an epoxide ring opening agent and/or as a Lewis/Bronsted acid
which reacts with epoxy/carboxyl groups of the GO, resulting in the introduction of N into
graphitic structure along with the reduction of graphene oxide.43 Indeed, the –OH/epoxy
and –COOH peak intensity in the C 1s spectra of N-rGO-10 (Figure 3.2F) and N-HrGO-
10 (Figure 3.2E) are greatly decreased as compared to GO and HGO (Table 3.3).
However, the relative ratio of C=O remained unaltered, showing that carbonyl moiety is
not reactive in this reaction. Raman spectroscopy was also used to characterize the HGO
sheets before and after N doping. As expected, the Raman spectra (Figure 3.7) of all the
samples show D band (ca. 1315 cm-1) and G band (ca. 1590 cm-1) and the ratio intensities
(ID/IG) of D and G band does not changed upon simultaneous N-doping and reduction.
These results are consistent with previous reports that incorporation of heterogeneous N-
dopants breads the hexagonal symmetry of the graphene.56 Therefore even the GO was
reduced during N-doping, the ID/IG ratio would not decrease, which is in contrast to the
scenario of reduction of GO to rGO without introducing any heterogeneous dopants. The
surface area of the N-HrGO-10 and N-rGO-10 was also measured via methylene blue
absorption method. We found that the surface area of N-rGO-10 dramatically decreased
from 947 to 560 m2/g after simultaneous reduction and N-doping process (Table 3.2). In
highly contract, the high surface area of N-HrGO-10 is largely maintained (1424 to 1194
m2/g for HGO and N-HrGO-10, respectively). From the SEM (scanning electron
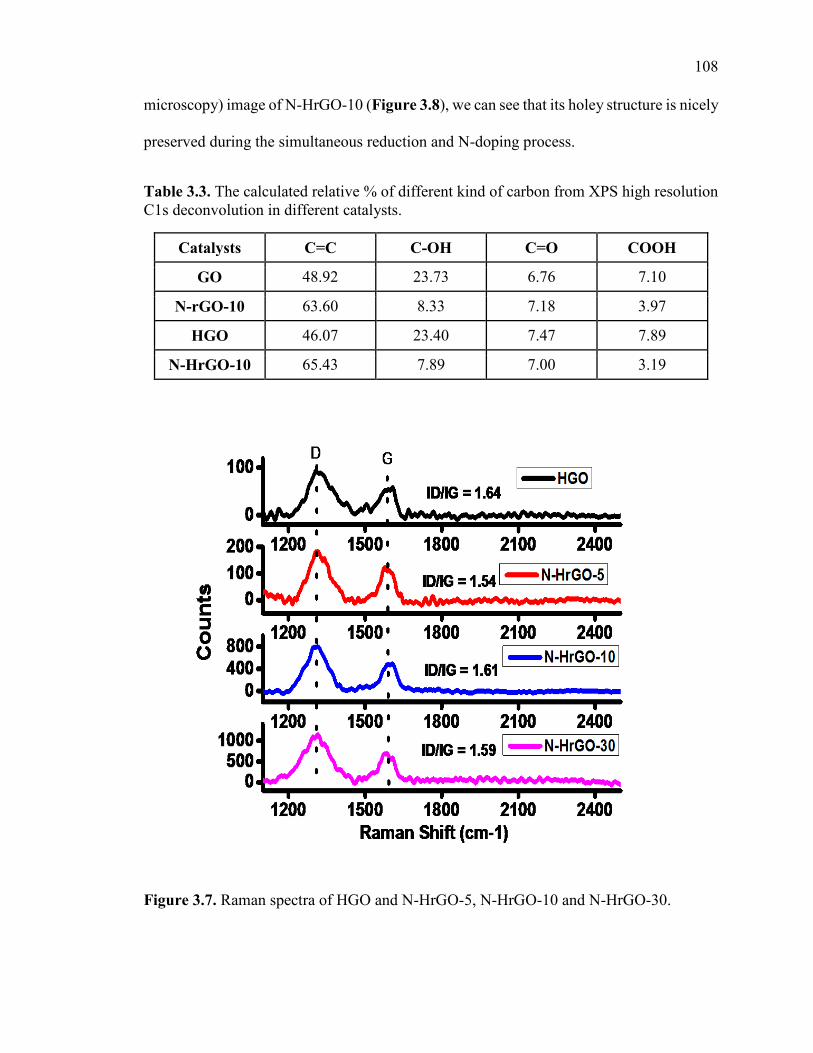
108
microscopy) image of N-HrGO-10 (Figure 3.8), we can see that its holey structure is nicely
preserved during the simultaneous reduction and N-doping process.
Table 3.3. The calculated relative % of different kind of carbon from XPS high resolution C1s deconvolution in different catalysts.
Catalysts C=C C-OH C=O COOH
GO 48.92 23.73 6.76 7.10
N-rGO-10 63.60 8.33 7.18 3.97
HGO 46.07 23.40 7.47 7.89
N-HrGO-10 65.43 7.89 7.00 3.19
Figure 3.7. Raman spectra of HGO and N-HrGO-5, N-HrGO-10 and N-HrGO-30.
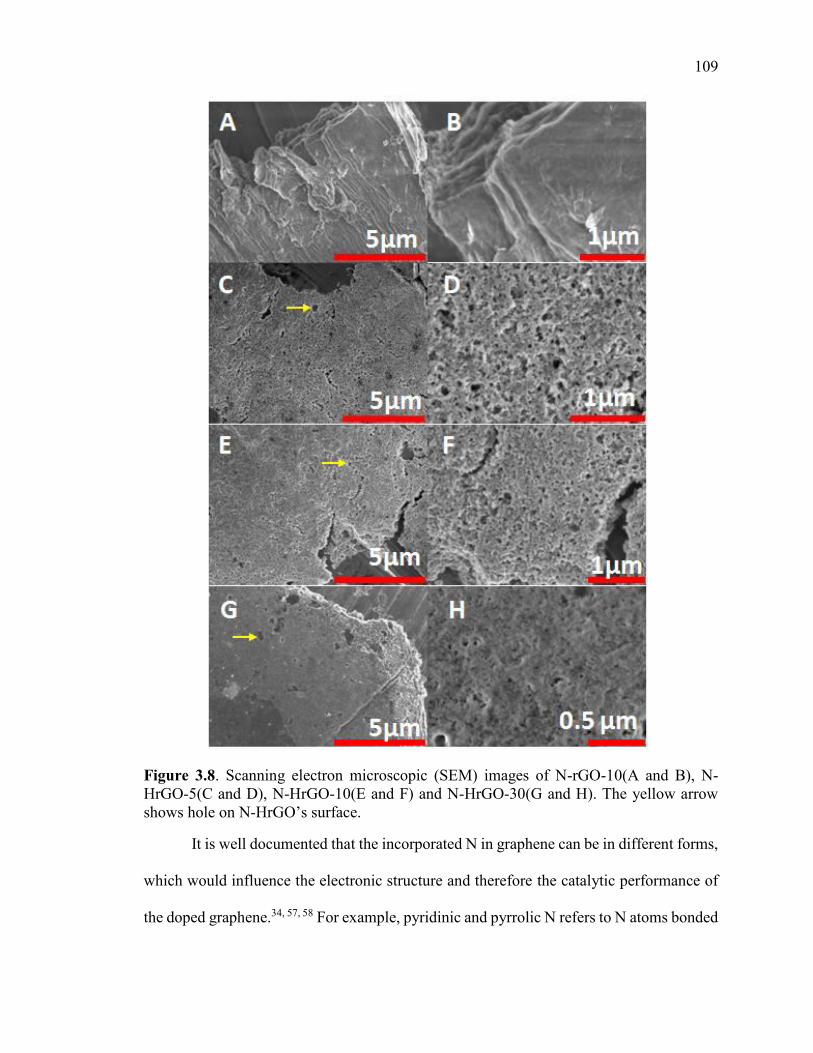
109
Figure 3.8. Scanning electron microscopic (SEM) images of N-rGO-10(A and B), N-HrGO-5(C and D), N-HrGO-10(E and F) and N-HrGO-30(G and H). The yellow arrow shows hole on N-HrGO’s surface.
It is well documented that the incorporated N in graphene can be in different forms,
which would influence the electronic structure and therefore the catalytic performance of
the doped graphene.34, 57, 58 For example, pyridinic and pyrrolic N refers to N atoms bonded
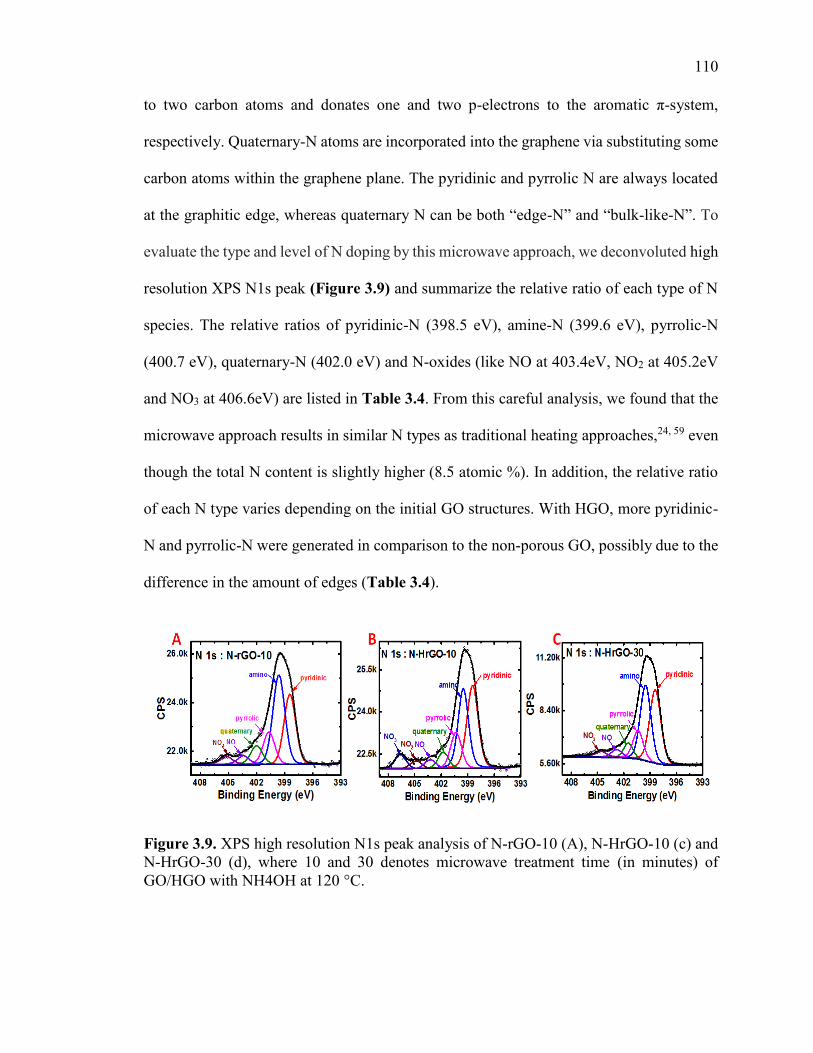
110
to two carbon atoms and donates one and two p-electrons to the aromatic π-system,
respectively. Quaternary-N atoms are incorporated into the graphene via substituting some
carbon atoms within the graphene plane. The pyridinic and pyrrolic N are always located
at the graphitic edge, whereas quaternary N can be both “edge-N” and “bulk-like-N”. To
evaluate the type and level of N doping by this microwave approach, we deconvoluted high
resolution XPS N1s peak (Figure 3.9) and summarize the relative ratio of each type of N
species. The relative ratios of pyridinic-N (398.5 eV), amine-N (399.6 eV), pyrrolic-N
(400.7 eV), quaternary-N (402.0 eV) and N-oxides (like NO at 403.4eV, NO2 at 405.2eV
and NO3 at 406.6eV) are listed in Table 3.4. From this careful analysis, we found that the
microwave approach results in similar N types as traditional heating approaches,24, 59 even
though the total N content is slightly higher (8.5 atomic %). In addition, the relative ratio
of each N type varies depending on the initial GO structures. With HGO, more pyridinic-
N and pyrrolic-N were generated in comparison to the non-porous GO, possibly due to the
difference in the amount of edges (Table 3.4).
Figure 3.9. XPS high resolution N1s peak analysis of N-rGO-10 (A), N-HrGO-10 (c) and N-HrGO-30 (d), where 10 and 30 denotes microwave treatment time (in minutes) of GO/HGO with NH4OH at 120 °C.
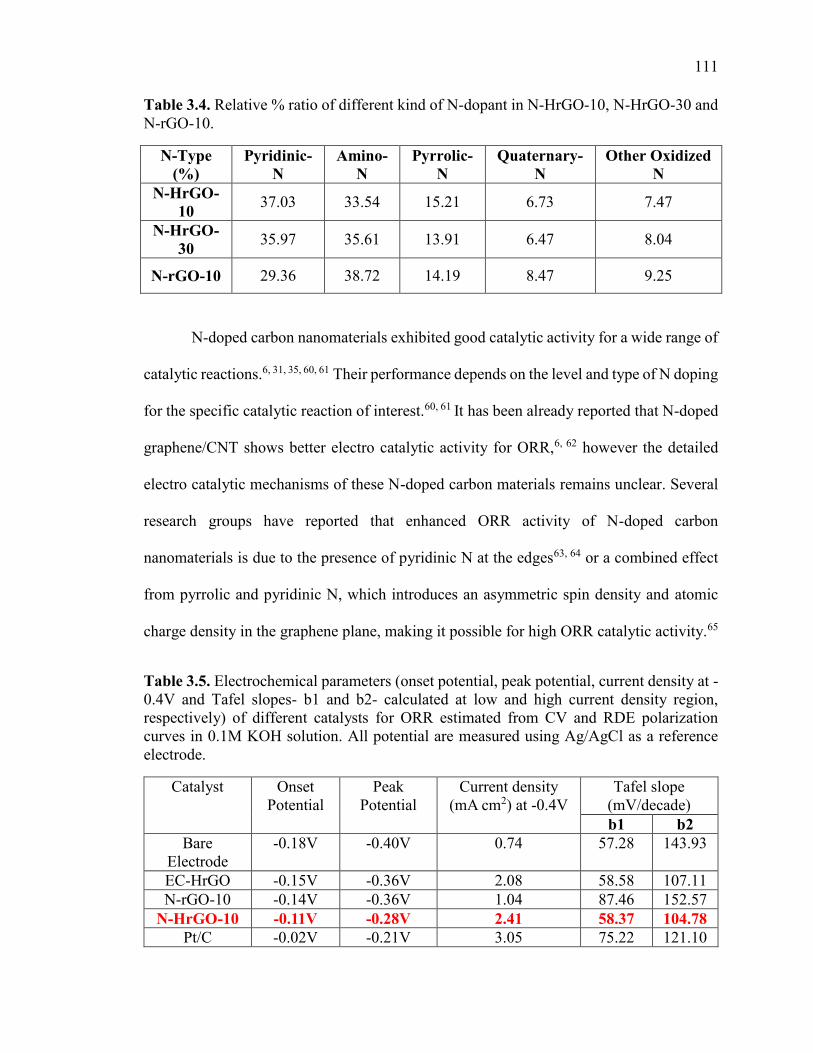
111
Table 3.4. Relative % ratio of different kind of N-dopant in N-HrGO-10, N-HrGO-30 and N-rGO-10.
N-Type
(%)
Pyridinic-
N
Amino-
N
Pyrrolic-
N
Quaternary-
N
Other Oxidized
N
N-HrGO-
10 37.03 33.54 15.21 6.73 7.47
N-HrGO-
30 35.97 35.61 13.91 6.47 8.04
N-rGO-10 29.36 38.72 14.19 8.47 9.25
N-doped carbon nanomaterials exhibited good catalytic activity for a wide range of
catalytic reactions.6, 31, 35, 60, 61 Their performance depends on the level and type of N doping
for the specific catalytic reaction of interest.60, 61 It has been already reported that N-doped
graphene/CNT shows better electro catalytic activity for ORR,6, 62 however the detailed
electro catalytic mechanisms of these N-doped carbon materials remains unclear. Several
research groups have reported that enhanced ORR activity of N-doped carbon
nanomaterials is due to the presence of pyridinic N at the edges63, 64 or a combined effect
from pyrrolic and pyridinic N, which introduces an asymmetric spin density and atomic
charge density in the graphene plane, making it possible for high ORR catalytic activity.65
Table 3.5. Electrochemical parameters (onset potential, peak potential, current density at -0.4V and Tafel slopes- b1 and b2- calculated at low and high current density region, respectively) of different catalysts for ORR estimated from CV and RDE polarization curves in 0.1M KOH solution. All potential are measured using Ag/AgCl as a reference electrode.
Catalyst Onset Potential
Peak Potential
Current density (mA cm2) at -0.4V
Tafel slope (mV/decade) b1 b2
Bare Electrode
-0.18V -0.40V 0.74 57.28 143.93
EC-HrGO -0.15V -0.36V 2.08 58.58 107.11 N-rGO-10 -0.14V -0.36V 1.04 87.46 152.57
N-HrGO-10 -0.11V -0.28V 2.41 58.37 104.78
Pt/C -0.02V -0.21V 3.05 75.22 121.10
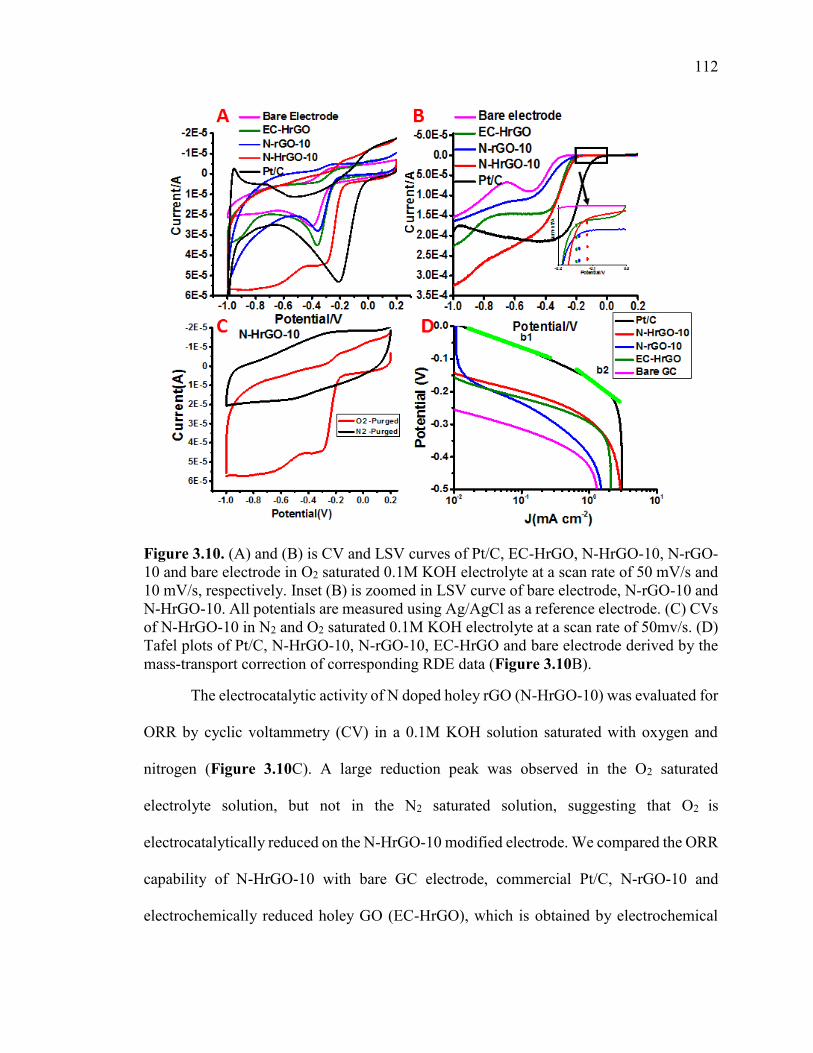
112
Figure 3.10. (A) and (B) is CV and LSV curves of Pt/C, EC-HrGO, N-HrGO-10, N-rGO-10 and bare electrode in O2 saturated 0.1M KOH electrolyte at a scan rate of 50 mV/s and 10 mV/s, respectively. Inset (B) is zoomed in LSV curve of bare electrode, N-rGO-10 and N-HrGO-10. All potentials are measured using Ag/AgCl as a reference electrode. (C) CVs of N-HrGO-10 in N2 and O2 saturated 0.1M KOH electrolyte at a scan rate of 50mv/s. (D) Tafel plots of Pt/C, N-HrGO-10, N-rGO-10, EC-HrGO and bare electrode derived by the mass-transport correction of corresponding RDE data (Figure 3.10B).
The electrocatalytic activity of N doped holey rGO (N-HrGO-10) was evaluated for
ORR by cyclic voltammetry (CV) in a 0.1M KOH solution saturated with oxygen and
nitrogen (Figure 3.10C). A large reduction peak was observed in the O2 saturated
electrolyte solution, but not in the N2 saturated solution, suggesting that O2 is
electrocatalytically reduced on the N-HrGO-10 modified electrode. We compared the ORR
capability of N-HrGO-10 with bare GC electrode, commercial Pt/C, N-rGO-10 and
electrochemically reduced holey GO (EC-HrGO), which is obtained by electrochemical
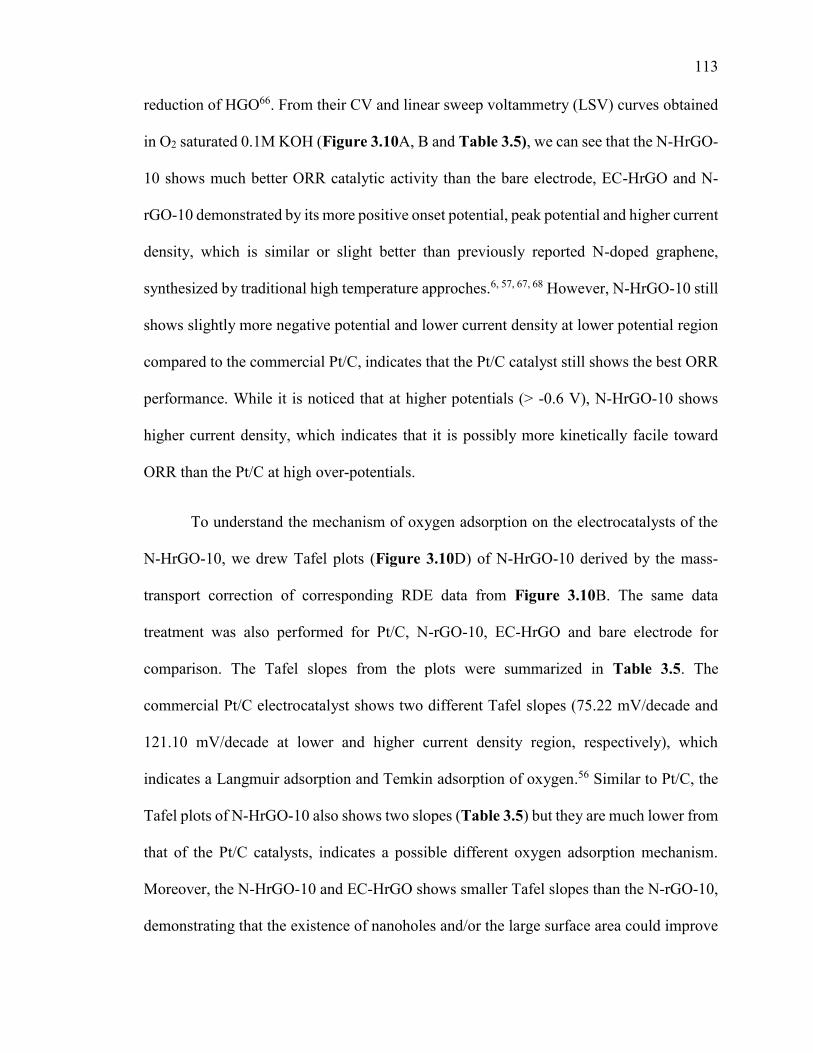
113
reduction of HGO66. From their CV and linear sweep voltammetry (LSV) curves obtained
in O2 saturated 0.1M KOH (Figure 3.10A, B and Table 3.5), we can see that the N-HrGO-
10 shows much better ORR catalytic activity than the bare electrode, EC-HrGO and N-
rGO-10 demonstrated by its more positive onset potential, peak potential and higher current
density, which is similar or slight better than previously reported N-doped graphene,
synthesized by traditional high temperature approches.6, 57, 67, 68 However, N-HrGO-10 still
shows slightly more negative potential and lower current density at lower potential region
compared to the commercial Pt/C, indicates that the Pt/C catalyst still shows the best ORR
performance. While it is noticed that at higher potentials (> -0.6 V), N-HrGO-10 shows
higher current density, which indicates that it is possibly more kinetically facile toward
ORR than the Pt/C at high over-potentials.
To understand the mechanism of oxygen adsorption on the electrocatalysts of the
N-HrGO-10, we drew Tafel plots (Figure 3.10D) of N-HrGO-10 derived by the mass-
transport correction of corresponding RDE data from Figure 3.10B. The same data
treatment was also performed for Pt/C, N-rGO-10, EC-HrGO and bare electrode for
comparison. The Tafel slopes from the plots were summarized in Table 3.5. The
commercial Pt/C electrocatalyst shows two different Tafel slopes (75.22 mV/decade and
121.10 mV/decade at lower and higher current density region, respectively), which
indicates a Langmuir adsorption and Temkin adsorption of oxygen.56 Similar to Pt/C, the
Tafel plots of N-HrGO-10 also shows two slopes (Table 3.5) but they are much lower from
that of the Pt/C catalysts, indicates a possible different oxygen adsorption mechanism.
Moreover, the N-HrGO-10 and EC-HrGO shows smaller Tafel slopes than the N-rGO-10,
demonstrating that the existence of nanoholes and/or the large surface area could improve
114
the catalytic activities of carbon based catalysts. Furthermore, we also found that ORR
activity of N-HrGO depends on the microwave reaction time of HGO with NH4OH. At
longer reaction time, the relative ratios of N types (Table 3.4) were changed, which largely
influenced their ORR catalytic activity. From the CV curves (Figure 3.11), the onset
potential and peak potential were negatively shifted and the kinetic current decreased on
N-HrGO-30, which is obtained via 30 mins of microwave reaction time. Among all the
graphene modified electrodes, N-HrGO-10 modified electrodes exhibit the lowest onset
potential and peak potential, and highest ORR current.
Figure 3.11. CV curves (A) and onset potential (B) of N-HrGO-x electrode in O2 saturated 0.1M KOH electrolyte at a scan rate of 50mv/s, where “x” is different microwave time (0, 5, 10, 15, 30 minutes) used for synthesis of different N-HrGO. All potentials are measured using Ag/AgCl as a reference electrode.
ORR can occur either via a direct four electron reduction pathway or a two electron
pathway. In the four electron pathway, oxygen is directly reduced to water, while in the
two electron pathway, oxygen is reduced to peroxide. In fuel cells, the direct four electron
pathway is preferred to achieve better energy conversion efficiency and prevent corrosion
of cell components due to the hazardous peroxides. LSV of EC-HrGO (Figure 3.10B)
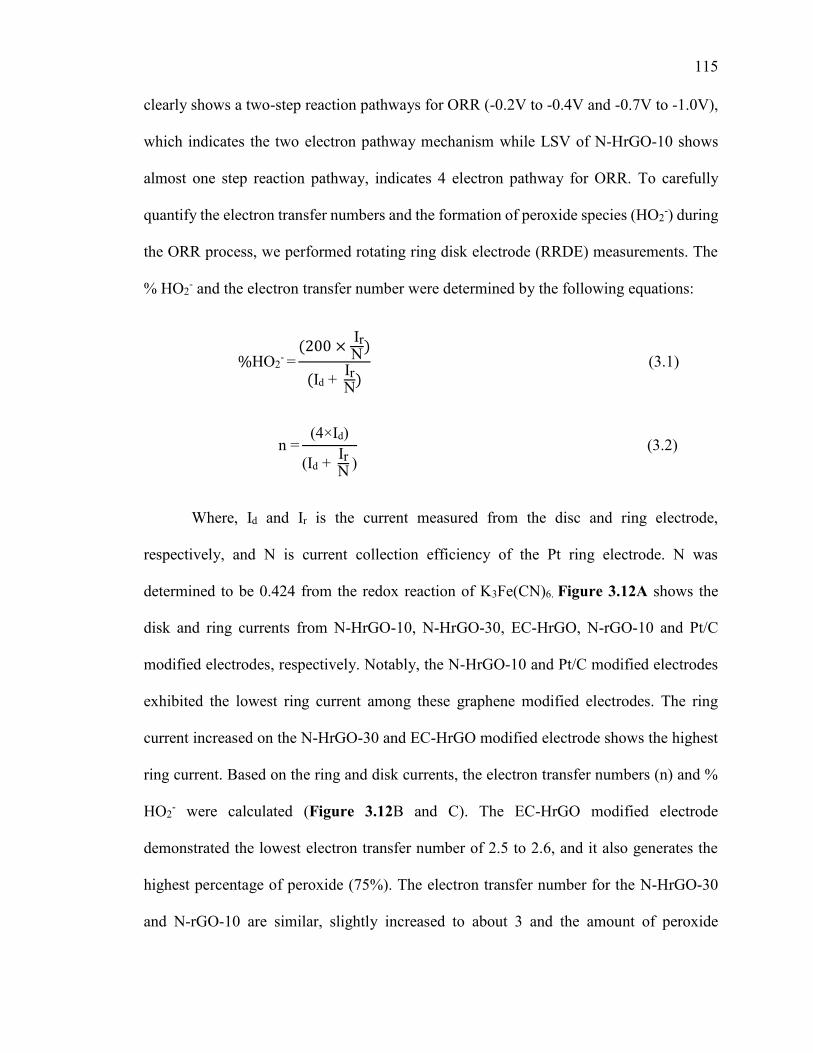
115
clearly shows a two-step reaction pathways for ORR (-0.2V to -0.4V and -0.7V to -1.0V),
which indicates the two electron pathway mechanism while LSV of N-HrGO-10 shows
almost one step reaction pathway, indicates 4 electron pathway for ORR. To carefully
quantify the electron transfer numbers and the formation of peroxide species (HO2-) during
the ORR process, we performed rotating ring disk electrode (RRDE) measurements. The
% HO2- and the electron transfer number were determined by the following equations:
%HO2- =
× IrN
Id + IrN
(3.1)
n =(4×Id)
(Id + IrN )
(3.2)
Where, Id and Ir is the current measured from the disc and ring electrode,
respectively, and N is current collection efficiency of the Pt ring electrode. N was
determined to be 0.424 from the redox reaction of K3Fe(CN)6. Figure 3.12A shows the
disk and ring currents from N-HrGO-10, N-HrGO-30, EC-HrGO, N-rGO-10 and Pt/C
modified electrodes, respectively. Notably, the N-HrGO-10 and Pt/C modified electrodes
exhibited the lowest ring current among these graphene modified electrodes. The ring
current increased on the N-HrGO-30 and EC-HrGO modified electrode shows the highest
ring current. Based on the ring and disk currents, the electron transfer numbers (n) and %
HO2- were calculated (Figure 3.12B and C). The EC-HrGO modified electrode
demonstrated the lowest electron transfer number of 2.5 to 2.6, and it also generates the
highest percentage of peroxide (75%). The electron transfer number for the N-HrGO-30
and N-rGO-10 are similar, slightly increased to about 3 and the amount of peroxide
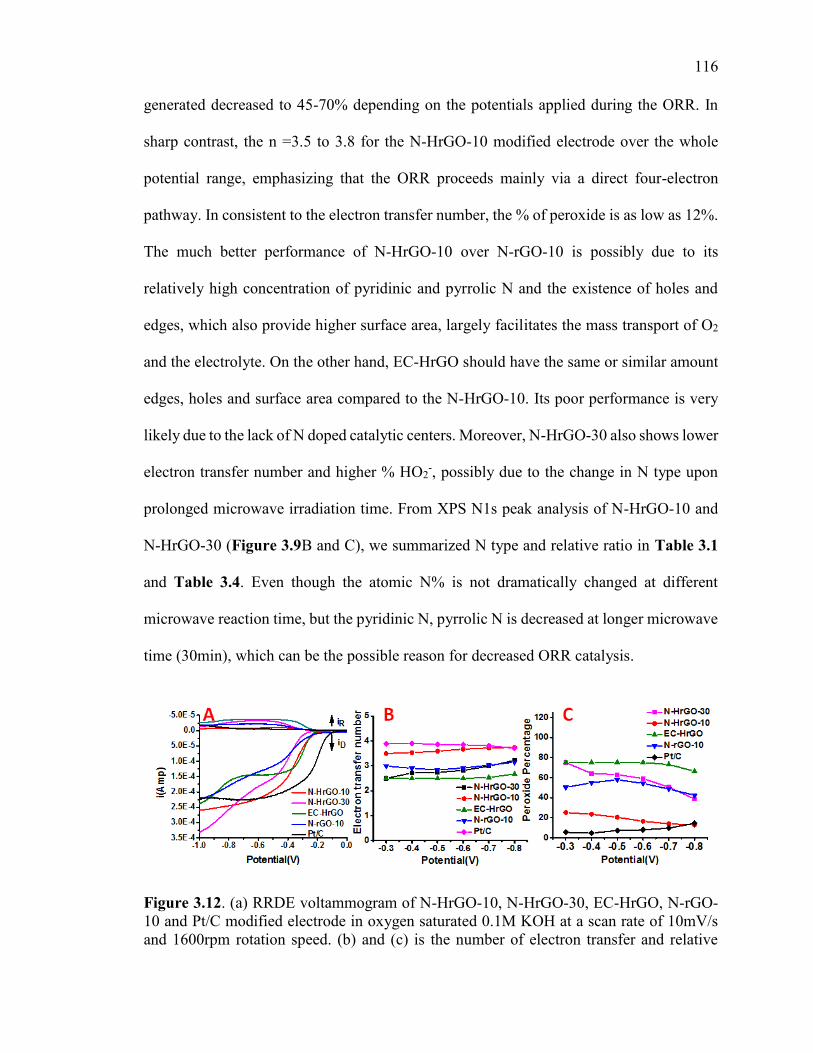
116
generated decreased to 45-70% depending on the potentials applied during the ORR. In
sharp contrast, the n =3.5 to 3.8 for the N-HrGO-10 modified electrode over the whole
potential range, emphasizing that the ORR proceeds mainly via a direct four-electron
pathway. In consistent to the electron transfer number, the % of peroxide is as low as 12%.
The much better performance of N-HrGO-10 over N-rGO-10 is possibly due to its
relatively high concentration of pyridinic and pyrrolic N and the existence of holes and
edges, which also provide higher surface area, largely facilitates the mass transport of O2
and the electrolyte. On the other hand, EC-HrGO should have the same or similar amount
edges, holes and surface area compared to the N-HrGO-10. Its poor performance is very
likely due to the lack of N doped catalytic centers. Moreover, N-HrGO-30 also shows lower
electron transfer number and higher % HO2-, possibly due to the change in N type upon
prolonged microwave irradiation time. From XPS N1s peak analysis of N-HrGO-10 and
N-HrGO-30 (Figure 3.9B and C), we summarized N type and relative ratio in Table 3.1
and Table 3.4. Even though the atomic N% is not dramatically changed at different
microwave reaction time, but the pyridinic N, pyrrolic N is decreased at longer microwave
time (30min), which can be the possible reason for decreased ORR catalysis.
Figure 3.12. (a) RRDE voltammogram of N-HrGO-10, N-HrGO-30, EC-HrGO, N-rGO-10 and Pt/C modified electrode in oxygen saturated 0.1M KOH at a scan rate of 10mV/s and 1600rpm rotation speed. (b) and (c) is the number of electron transfer and relative
117
peroxide %, respectively, for all catalyst calculated from RRDE voltammogram. All potentials are measured using Ag/AgCl as a reference electrode.
To further study how the hole structures on the N-HrGO-10 influence their electron
transfer kinetics involved in ORR, rotating disc electrode (RDE) measurements (Figure
3.13) were performed in O2 saturated 0.1M KOH solutions under various electrode rotating
rates. The same study also performed on the N-rGO-10 and Pt/C for comparison. As shown
in Figure 3.13, the current density is increased with rotation speed from 250 to 2500 rpm
due to the enhanced diffusion of the electrolytes and O2. The kinetic parameters, such as
kinetic current density (JK), and the effective diffusion coefficient of O2 (D0) in ORR is
then analyzed using the Koutecky-Levich (K-L) equation.69
1/J=1/JL+1/JK=1/Bω0.5+1/JK (3.3)
Where B = 0.62nFC0(D0)2/3 -1/6 and JK=nFkC0
Here, J is the measured current density, JL and JK are the diffusion limiting and kinetic
limiting current densities, ω is the angular rotation rate of the disc electrode (rad/s), B is
Levich constant, n is the number of electrons transferred in the oxygen reduction
reaction (mol-1), F is the Faraday constant (F = 96485 C/mol), D0 is the effective diffusion
coefficient of O2 (cm2/s), is the kinematic viscosity of the electrolyte (cm2/s), C0 is the
oxygen concentration (mol/cm3) and k is the electron transfer rate constant.
118
Figure 3.13. LSV curves of N-HrGO-10(a), N-rGO-10(b) and Pt/C(c) at different rotation speed in O2 saturated 0.1M KOH solution at 10mV/s. (d) is K-L plot of Pt/C, obtained based on the LSV data(c).All potentials are measured using Ag/AgCl as a reference electrode.
We plotted the K-L plot (J-1 vs ω-1/2) for N-HrGO-10, N-rGO-10 and Pt/C at various
electrode potentials (Figure 3.14A, 3.14B and 3.13D). From the linearity and parallelism
of the plot at various electrode potentials, we consider that the ORR is a typical first order
reaction kinetics with respect to the dissolved oxygen concentration. The slope and
intercept of the K-L plot gives the Levich constant (B) and JK., which then are used to
calculate the effective diffusion coefficient constant of O2 (D0) and electrochemical rate
constant k, respectively, by using electron transfer number n calculated from RRDE
measurement. From Figure 3.14D, the N-HrGO-10 has more than 4 times higher k than
the N-rGO-10. Here, for the first time, we found that the effective diffusion coefficient of
O2 is also much higher (Figure 3.14C) in N-HrGO-10, which quantitatively demonstrates
that the holey structures on the basal plane of graphene indeed contributed to the enhanced
diffusion of oxygen. The calculated kinetic current density (Jk) and rate constant (k) from
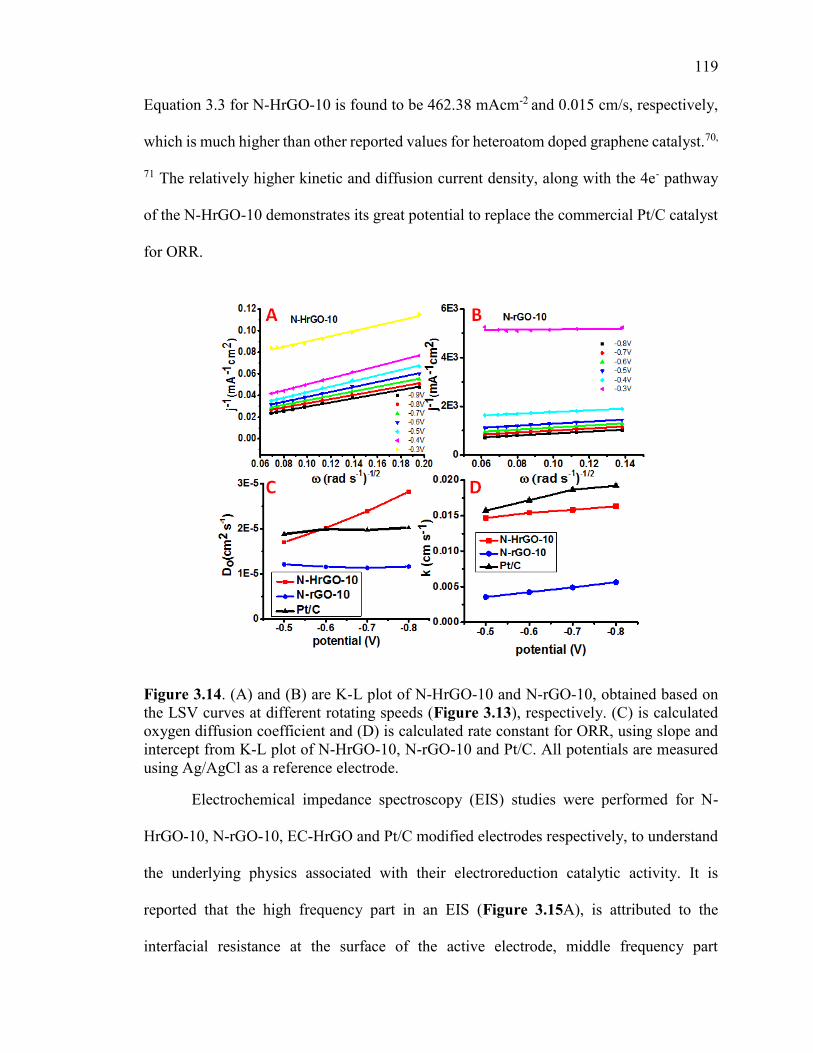
119
Equation 3.3 for N-HrGO-10 is found to be 462.38 mAcm-2 and 0.015 cm/s, respectively,
which is much higher than other reported values for heteroatom doped graphene catalyst.70,
71 The relatively higher kinetic and diffusion current density, along with the 4e- pathway
of the N-HrGO-10 demonstrates its great potential to replace the commercial Pt/C catalyst
for ORR.
Figure 3.14. (A) and (B) are K-L plot of N-HrGO-10 and N-rGO-10, obtained based on the LSV curves at different rotating speeds (Figure 3.13), respectively. (C) is calculated oxygen diffusion coefficient and (D) is calculated rate constant for ORR, using slope and intercept from K-L plot of N-HrGO-10, N-rGO-10 and Pt/C. All potentials are measured using Ag/AgCl as a reference electrode.
Electrochemical impedance spectroscopy (EIS) studies were performed for N-
HrGO-10, N-rGO-10, EC-HrGO and Pt/C modified electrodes respectively, to understand
the underlying physics associated with their electroreduction catalytic activity. It is
reported that the high frequency part in an EIS (Figure 3.15A), is attributed to the
interfacial resistance at the surface of the active electrode, middle frequency part
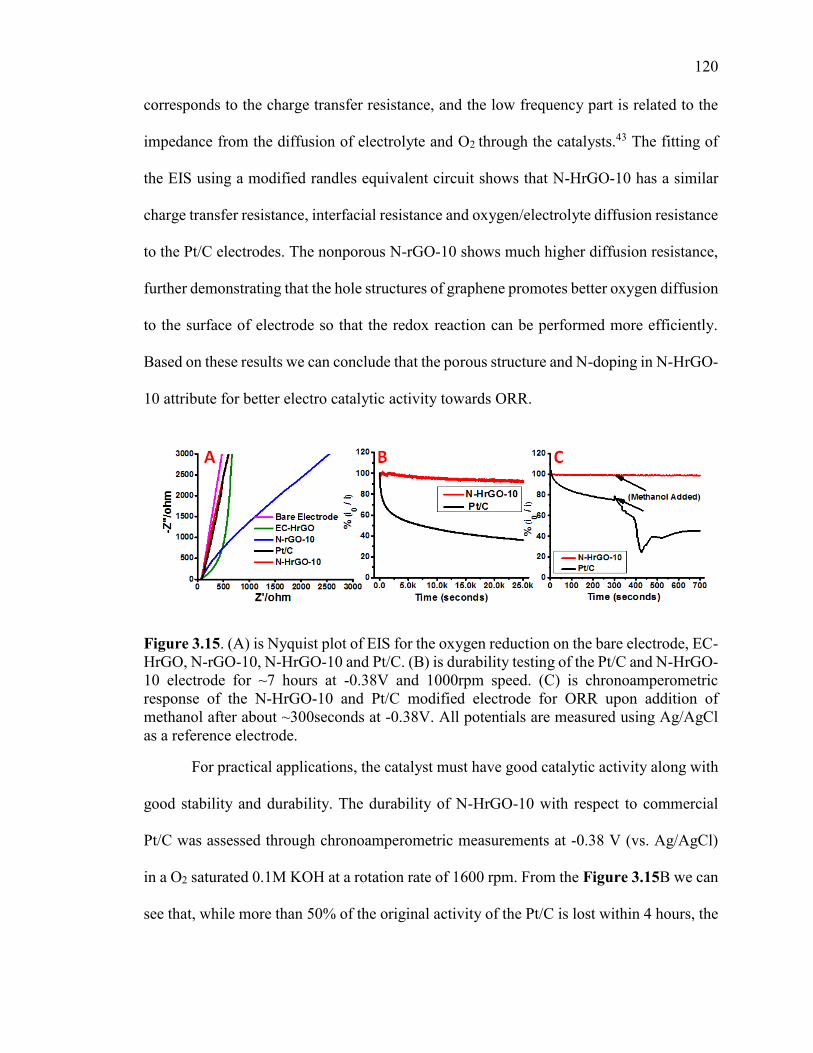
120
corresponds to the charge transfer resistance, and the low frequency part is related to the
impedance from the diffusion of electrolyte and O2 through the catalysts.43 The fitting of
the EIS using a modified randles equivalent circuit shows that N-HrGO-10 has a similar
charge transfer resistance, interfacial resistance and oxygen/electrolyte diffusion resistance
to the Pt/C electrodes. The nonporous N-rGO-10 shows much higher diffusion resistance,
further demonstrating that the hole structures of graphene promotes better oxygen diffusion
to the surface of electrode so that the redox reaction can be performed more efficiently.
Based on these results we can conclude that the porous structure and N-doping in N-HrGO-
10 attribute for better electro catalytic activity towards ORR.
Figure 3.15. (A) is Nyquist plot of EIS for the oxygen reduction on the bare electrode, EC-HrGO, N-rGO-10, N-HrGO-10 and Pt/C. (B) is durability testing of the Pt/C and N-HrGO-10 electrode for ~7 hours at -0.38V and 1000rpm speed. (C) is chronoamperometric response of the N-HrGO-10 and Pt/C modified electrode for ORR upon addition of methanol after about ~300seconds at -0.38V. All potentials are measured using Ag/AgCl as a reference electrode.
For practical applications, the catalyst must have good catalytic activity along with
good stability and durability. The durability of N-HrGO-10 with respect to commercial
Pt/C was assessed through chronoamperometric measurements at -0.38 V (vs. Ag/AgCl)
in a O2 saturated 0.1M KOH at a rotation rate of 1600 rpm. From the Figure 3.15B we can
see that, while more than 50% of the original activity of the Pt/C is lost within 4 hours, the
121
N-HrGO-10 loses only ~7% of its original activity after 7 hours, demonstrating that the N-
HrGO-10 have far better durability. We also performed methanol cross over test to check
stability of N-HrGO-10 and Pt/C against methanol. From Figure 3.15C, we can see that
Pt/C loses its ~35% of its original activity in presence of methanol due to blockage of the
active sites on Pt nanoparticle by methanol adsorption,72 while the introduction of methanol
does not affect the ORR activity of N-HrGO-10, shows better stability against methanol
cross over effect and great potential to replace Pt/C as a metal free catalysts.
3.3. Conclusions
In summary, by replacing traditional heating with microwave irradiation, holey
graphene oxide sheets or graphene oxide sheets without holes can be controllably, directly
and rapidly (tens of seconds) fabricated from graphite powder via a one-step-one-pot
reaction with a production yield of 120 wt% of graphite. Again by taking advantage of the
unique heating mechanism of microwave irradiation, a fast and low temperature approach
to fabricate solution processable N doped graphene is developed. The N-doped holey
graphene sheets (N-HrGO-10) demonstrated remarkable electro-catalytic capabilities for
the electrochemical reduction of oxygen (ORR). The existence of the nanoholes not only
provides a “short cut” for efficient mass transport, but also creates more catalytic centers
due to the increased surface area and edges associated with the nanoholes. For the first
time, we experimentally measure the effective diffusion constant of O2 for N-HrGO-10 and
N-rGO-10, which quantitatively demonstrates that the hole structures on the basal plane of
graphene indeed contributed to the enhanced diffusion of oxygen in N-HrGO-10. Although
the onset potential of N-HrGO-10 for ORR is slightly negative in comparison to that of
commercial Pt/C catalysts, the N-HrGO-10 shows much better stability and durability
122
against methanol poisoning. The capability for rapid fabrication and N doping of holey GO
can lead us to develop efficient catalysts which can replace precious coin metals for energy
generation and storage, such as fuel cells and metal –air batteries.
3.4. Experimental Section
3.4.1. Synthesis of GO and HGO
Graphite powder (20mg, Sigma Aldrich, ≤ 20 m lateral size) was mixed with concentrated
sulfuric acid (8mL, 98%, ACS grade) in a round bottom flask. The mixture is then swirled
and cooled in an ice bath for approximately 5 minutes. Then concentrated nitric acid (2mL,
70%, ACS grade) was added and again cooled in ice bath for approximately 5 minutes.
After that KMnO4 (100mg, ACS grade) was added to the ice cooled acid mixture. The
entire mixture was swirled and mixed for another 30 seconds and placed into a microwave
reactor chamber (CEM Discover-SP). The reaction mixture was subjected to microwave
irradiation (300 watts) for different time to produce GO and HGO. 30seconds of
microwave results in GO, while 40seconds of microwave results in HGO. Subsequently,
after microwave irradiation, the mixture is transferred to 200mL of ice containing 5mL of
35% H2O2 to quench the reaction and then filtered through polycarbonate filter paper
(0.2µm pore size) follow by washing with diluted hydrochloric acid (~ 4%) and deionized
(DI) water. A colloidal graphene oxide (HGO and GO) solution is obtained by mild bath
sonication (~30 minutes). The dispersion obtained is then left undisturbed for seven days
to let the unexfoliated graphite particles precipitate out. The supernatant was carefully
decanted and this solution is stable for months in water without significant precipitation.
123
3.4.2. N doping of GO and HGO
HGO or GO (3mL, 0.55 mg/mL) was mixed with concentrated ammonium hydroxide
(3mL, 29.2%, ACS plus grade) in Pyrex tube and sealed with Teflon cap. This mixture is
heated in microwave at 120oC for different time (5, 10, 15, 30 minutes) with the pressure
limit set to 15 bars, which resulted into nitrogen doping and simultaneously reduction of
GO and HGO to form N-rGO-x and N-HrGO-x, respectively, where x denotes microwave
reaction time. After the reaction, the mixture is cooled down to 50oC and neutralized with
sulfuric acid in order to precipitate out the product and then dialyzed with 12 kD membrane
dialysis tube with DI water to remove any salt residues. Finally, the product was
centrifuged and bath-sonicated to redisperse in water to achieve desired concentration.
3.4.3. Material Characterization
The morphology of the graphene samples were studied by using Tapping mode AFM
Nanoscope-IIIa Multimode scanning probe microscope system (Digital Instruments,
Bruker) with a J scanner and STEM/SEM (Hitachi S-4800). The sample for AFM and SEM
was prepared by simple drop casting of sample on freshly cleaved mica surface and Cu
tape, respectively and allowed it for air dry. The sample for STEM was also prepared by
drop casting a sample (2µL) on carbon supported Cu grid (400 meshes, type or company)
and allowed it to dry in air. X-ray Photoelectron Spectroscopy (XPS) characterization was
performed after depositing a layer of all kinds of catalysts onto a gold film (a 100 nm gold
layer was sputter-coated on silicon with a 10 nm Ti adhesion layer). The thickness of the
film on the gold substrates was roughly 30-50 nm. XPS spectra were acquired using a
Thermo Scientific K-Alpha system with a monochromatic Al Kα x-ray source (h = 1486.7
eV). For data analysis, Shirley background subtraction was performed, and the spectra were
124
fit with Gaussian/Lorentzian peaks using a minimum deviation curve fitting method (part
of the Avantage software package). The surface composition of each species was
determined by the integrated peak areas and the Scofield sensitivity factor provided by the
Avantage software. Absorption spectra were recorded on a Cary 5000 UV-vis-NIR
spectrophotometer in the double beam mode using a 1cm quartz cuvette. Raman spectra of
the samples (deposited on anodisc membrane) were collected using Raman Microscope
(Confocal) – Wi-Tec, Alpha 3000R with an excitation laser at 785 nm. FT-IR spectra of
the samples (deposited on CaF2 windows) were acquired with a Perkin Elmer Spotlight
300 system using the transmission mode. The surface area of GO, HGO, N-rGO-10 and N-
HrGO-10 is measured by methylene blue (MB) adsorption method and descried as below.
3.4.4. Surface area measurement of GO, HGO, N-rGO-10 and N-HrGO-10:
Methylene blue(MB) adsorption method is a common dye adsorption based approach used
to determine the surface area of graphitic materials, with each mg of adsorbed methylene
blue representing 2.54m2 of surface area.73 The surface area of graphene samples were
calculated by adding a known mass of graphene sample into a standardized methylene blue
solution (2mg/ml) in DI water. The solution was stirred for 24 hours to reach maximum
adsorption of MB on the graphene samples. For each mg of graphene sample, 750µL of
MB (2mg/ml) is added so that the total mass of MB will remain 1.5 times higher than each
of the graphene samples to reach a full coverage of MB on the graphene samples. The
mixture was then centrifuged at 5000 rpm for 5 minutes to separate the non-absorbed MB
molecules, which are still the supernatant. Then the MB concentration in the supernatant
was determined by UV-vis spectroscopy at wavelength of 664 nm and compared to the
initial standard concentration of MB prior to interacting with the graphene sample.
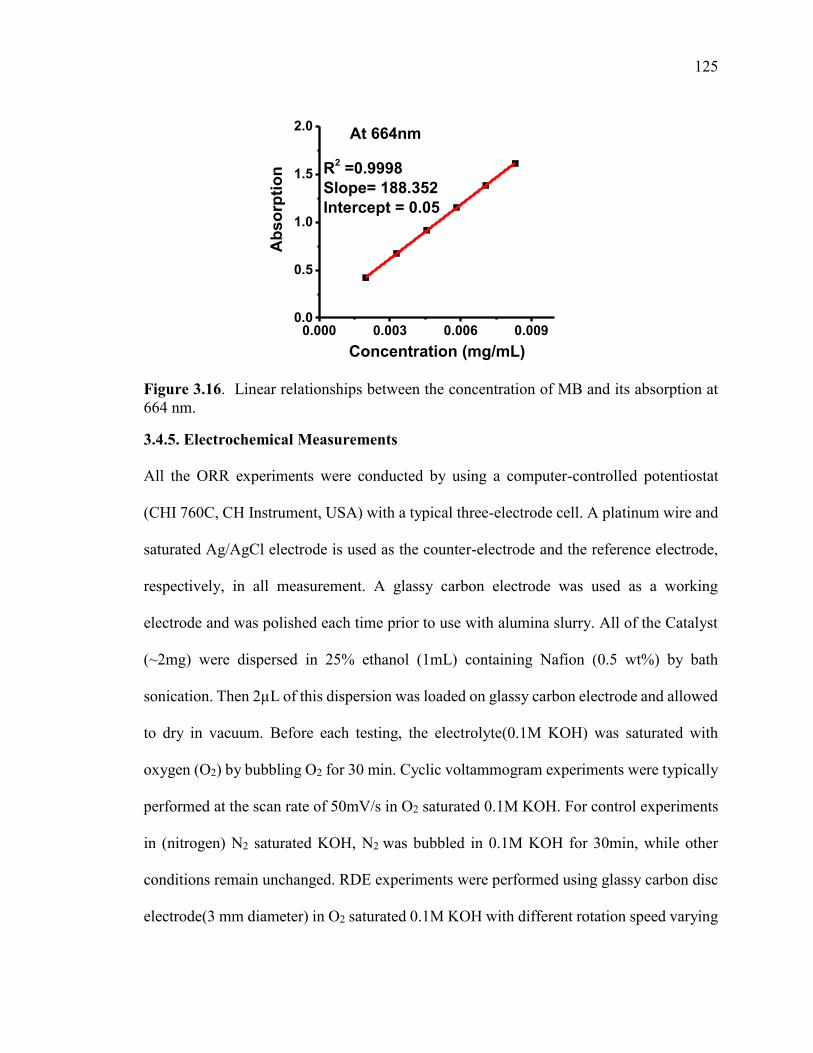
125
Figure 3.16. Linear relationships between the concentration of MB and its absorption at 664 nm.
3.4.5. Electrochemical Measurements
All the ORR experiments were conducted by using a computer-controlled potentiostat
(CHI 760C, CH Instrument, USA) with a typical three-electrode cell. A platinum wire and
saturated Ag/AgCl electrode is used as the counter-electrode and the reference electrode,
respectively, in all measurement. A glassy carbon electrode was used as a working
electrode and was polished each time prior to use with alumina slurry. All of the Catalyst
(~2mg) were dispersed in 25% ethanol (1mL) containing Nafion (0.5 wt%) by bath
sonication. Then 2µL of this dispersion was loaded on glassy carbon electrode and allowed
to dry in vacuum. Before each testing, the electrolyte(0.1M KOH) was saturated with
oxygen (O2) by bubbling O2 for 30 min. Cyclic voltammogram experiments were typically
performed at the scan rate of 50mV/s in O2 saturated 0.1M KOH. For control experiments
in (nitrogen) N2 saturated KOH, N2 was bubbled in 0.1M KOH for 30min, while other
conditions remain unchanged. RDE experiments were performed using glassy carbon disc
electrode(3 mm diameter) in O2 saturated 0.1M KOH with different rotation speed varying
0.000 0.003 0.006 0.0090.0
0.5
1.0
1.5
2.0
Ab
so
rpti
on
Concentration (mg/mL)
At 664nm
R2 =0.9998
Slope= 188.352
Intercept = 0.05
126
from 250 to 2500rpm and 10mV/s scan rate. For a comparison, the commercially available
Johnson Matthey (JM) Pt/C 40 wt% (Johnson Matthey Corp., Pt loading: 40 wt% Pt on
carbon) electrode was also prepared similarly to other catalyst as above mentioned. For the
RRDE measurement, catalyst and electrodes are prepared by the same method as RDE
measurement, except using RRDE electrode (GC disc and Pt ring electrode). The
chronoamperometry experiment was conducted by measuring current for 25,000 seconds
at -0.38V potential and at 1000rpm rotation speed with continues maintaining oxygen flow
to avoid any oxygen concentration effect. For methanol cross over effect, we conducted
another amperometric experiment for 700seconds with same experiment condition as
above, except 2mL of methanol was added at 300seconds during the experiment. The
electrochemical impedance spectra (EIS) for ORR on the catalyst electrodes are measured
in O2-saturated 0.1M KOH solution at -0.31 V vs. Ag/AgCl.
3.5. References
1. Chen, H. S.; Cong, T. N.; Yang, W.; Tan, C. Q.; Li, Y. L.; Ding, Y. L. Progress in electrical energy storage system: A critical review. Progress in Natural Science 2009, 19, 291-312. 2. Chu, S.; Majumdar, A. Opportunities and challenges for a sustainable energy future. Nature 2012, 488, 294-303. 3. Linden, D. Handbook of batteries and fuel cells. New York 1984. 4. Yu, D. S.; Nagelli, E.; Du, F.; Dai, L. M. Metal-Free Carbon Nanomaterials Become More Active than Metal Catalysts and Last Longer. Journal of Physical Chemistry
Letters 2010, 1, 2165-2173. 5. Liu, R. L.; Wu, D. Q.; Feng, X. L.; Mullen, K. Nitrogen-Doped Ordered Mesoporous Graphitic Arrays with High Electrocatalytic Activity for Oxygen Reduction. Angew. Chem. Int. Ed. 2010, 49, 2565-2569. 6. Qu, L. T.; Liu, Y.; Baek, J. B.; Dai, L. M. Nitrogen-Doped Graphene as Efficient Metal-Free Electrocatalyst for Oxygen Reduction in Fuel Cells. Acs Nano 2010, 4, 1321-1326. 7. Gong, K. P.; Du, F.; Xia, Z. H.; Durstock, M.; Dai, L. M. Nitrogen-Doped Carbon Nanotube Arrays with High Electrocatalytic Activity for Oxygen Reduction. Science 2009, 323, 760-764.
127
8. Jafri, R. I.; Rajalakshmi, N.; Ramaprabhu, S. Nitrogen-doped multi-walled carbon nanocoils as catalyst support for oxygen reduction reaction in proton exchange membrane fuel cell. J. Power Sources 2010, 195, 8080-8083. 9. Nagaiah, T. C.; Kundu, S.; Bron, M.; Muhler, M.; Schuhmann, W. Nitrogen-doped carbon nanotubes as a cathode catalyst for the oxygen reduction reaction in alkaline medium. Electrochem. Commun. 2010, 12, 338-341. 10. Joshi, R. K.; Carbone, P.; Wang, F. C.; Kravets, V. G.; Su, Y.; Grigorieva, I. V.; Wu, H. A.; Geim, A. K.; Nair, R. R. Precise and Ultrafast Molecular Sieving Through Graphene Oxide Membranes. Science 2014, 343, 752-754. 11. Bai, J.; Zhong, X.; Jiang, S.; Huang, Y.; Duan, X. Graphene nanomesh. Nat
Nanotechnol 2010, 5, 190-4. 12. Kuhn, P.; Forget, A.; Su, D.; Thomas, A.; Antonietti, M. From microporous regular frameworks to mesoporous materials with ultrahigh surface area: dynamic reorganization of porous polymer networks. J. Am. Chem. Soc. 2008, 130, 13333-7. 13. Bieri, M.; Treier, M.; Cai, J.; Ait-Mansour, K.; Ruffieux, P.; Groning, O.; Groning, P.; Kastler, M.; Rieger, R.; Feng, X.; Mullen, K.; Fasel, R. Porous graphenes: two-dimensional polymer synthesis with atomic precision. Chem Commun (Camb) 2009, 6919-21. 14. Akhavan, O. Graphene nanomesh by ZnO nanorod photocatalysts. ACS Nano 2010, 4, 4174-80. 15. Fischbein, M. D.; Drndic, M. Electron beam nanosculpting of suspended graphene sheets. Appl. Phys. Lett. 2008, 93, 113107. 16. Zhu, Y.; Murali, S.; Stoller, M. D.; Ganesh, K. J.; Cai, W.; Ferreira, P. J.; Pirkle, A.; Wallace, R. M.; Cychosz, K. A.; Thommes, M.; Su, D.; Stach, E. A.; Ruoff, R. S. Carbon-based supercapacitors produced by activation of graphene. Science 2011, 332, 1537-41. 17. Wang, S.; Tristan, F.; Minami, D.; Fujimori, T.; Cruz-Silva, R.; Terrones, M.; Takeuchi, K.; Teshima, K.; Rodríguez-Reinoso, F.; Endo, M. Activation routes for high surface area graphene monoliths from graphene oxide colloids. Carbon 2014, 76, 220-231. 18. Zhao, X.; Hayner, C. M.; Kung, M. C.; Kung, H. H. Flexible holey graphene paper electrodes with enhanced rate capability for energy storage applications. ACS Nano 2011, 5, 8739-49. 19. Wang, X.; Jiao, L.; Sheng, K.; Li, C.; Dai, L.; Shi, G. Solution-processable graphene nanomeshes with controlled pore structures. Scientific reports 2013, 3. 20. Han, T. H.; Huang, Y. K.; Tan, A. T.; Dravid, V. P.; Huang, J. Steam etched porous graphene oxide network for chemical sensing. J. Am. Chem. Soc. 2011, 133, 15264-7. 21. Zhao, Y.; Hu, C.; Song, L.; Wang, L.; Shi, G.; Dai, L.; Qu, L. Functional graphene nanomesh foam. Energy & Environmental Science 2014, 7, 1913-1918. 22. Lin, Y.; Watson, K. A.; Kim, J.-W.; Baggett, D. W.; Working, D. C.; Connell, J. W. Bulk preparation of holey graphene via controlled catalytic oxidation. Nanoscale 2013, 5, 7814-7824. 23. Zhou, D.; Cui, Y.; Xiao, P.-W.; Jiang, M.-Y.; Han, B.-H. A general and scalable synthesis approach to porous graphene. Nature communications 2014, 5. 24. Li, X.; Wang, H.; Robinson, J. T.; Sanchez, H.; Diankov, G.; Dai, H. Simultaneous nitrogen doping and reduction of graphene oxide. J. Am. Chem. Soc. 2009, 131, 15939-44.
128
25. Xue, Y.; Yu, D.; Dai, L.; Wang, R.; Li, D.; Roy, A.; Lu, F.; Chen, H.; Liu, Y.; Qu, J. Three-dimensional B,N-doped graphene foam as a metal-free catalyst for oxygen reduction reaction. Phys. Chem. Chem. Phys. 2013, 15, 12220-6. 26. Zhang, C.; Mahmood, N.; Yin, H.; Liu, F.; Hou, Y. Synthesis of phosphorus-doped graphene and its multifunctional applications for oxygen reduction reaction and lithium ion batteries. Adv. Mater. 2013, 25, 4932-7. 27. Wang, H.; Zhou, Y.; Wu, D.; Liao, L.; Zhao, S.; Peng, H.; Liu, Z. Synthesis of boron-doped graphene monolayers using the sole solid feedstock by chemical vapor deposition. Small 2013, 9, 1316-20. 28. Wang, H. B.; Xie, M. S.; Thia, L.; Fisher, A.; Wang, X. Strategies on the Design of Nitrogen-Doped Graphene. Journal of Physical Chemistry Letters 2014, 5, 119-125. 29. Wang, H. B.; Maiyalagan, T.; Wang, X. Review on Recent Progress in Nitrogen-Doped Graphene: Synthesis, Characterization, and Its Potential Applications. Acs Catalysis
2012, 2, 781-794. 30. Hu, T.; Sun, X.; Sun, H.; Xin, G.; Shao, D.; Liu, C.; Lian, J. Rapid synthesis of nitrogen-doped graphene for a lithium ion battery anode with excellent rate performance and super-long cyclic stability. Phys. Chem. Chem. Phys. 2014, 16, 1060-6. 31. Chang, D. W.; Lee, E. K.; Park, E. Y.; Yu, H.; Choi, H. J.; Jeon, I. Y.; Sohn, G. J.; Shin, D.; Park, N.; Oh, J. H.; Dai, L.; Baek, J. B. Nitrogen-doped graphene nanoplatelets from simple solution edge-functionalization for n-type field-effect transistors. J. Am.
Chem. Soc. 2013, 135, 8981-8. 32. Shao, Y. Y.; Zhang, S.; Engelhard, M. H.; Li, G. S.; Shao, G. C.; Wang, Y.; Liu, J.; Aksay, I. A.; Lin, Y. H. Nitrogen-doped graphene and its electrochemical applications. J. Mater. Chem. 2010, 20, 7491-7496. 33. Liu, Z.; Robinson, J. T.; Tabakman, S. M.; Yang, K.; Dai, H. Carbon materials for drug delivery & cancer therapy. Mater. Today 2011, 14, 316-323. 34. Zhang, B.; Wen, Z.; Ci, S.; Mao, S.; Chen, J.; He, Z. Synthesizing Nitrogen-doped Activated Carbon and Probing its Active Sites for Oxygen Reduction Reaction in Microbial Fuel Cells. ACS applied materials & interfaces 2014. 35. Chen, L.; Du, R.; Zhu, J.; Mao, Y.; Xue, C.; Zhang, N.; Hou, Y.; Zhang, J.; Yi, T. Three‐Dimensional Nitrogen‐Doped Graphene Nanoribbons Aerogel as a Highly Efficient Catalyst for the Oxygen Reduction Reaction. Small 2014. 36. Wu, Z. S.; Ren, W. C.; Xu, L.; Li, F.; Cheng, H. M. Doped Graphene Sheets As Anode Materials with Superhigh Rate and Large Capacity for Lithium Ion Batteries. Acs
Nano 2011, 5, 5463-5471. 37. Panchakarla, L.; Subrahmanyam, K.; Saha, S.; Govindaraj, A.; Krishnamurthy, H.; Waghmare, U.; Rao, C. Synthesis, structure, and properties of boron-and nitrogen-doped graphene. Adv. Mater. 2009, 21, 4726. 38. Reddy, A. L.; Srivastava, A.; Gowda, S. R.; Gullapalli, H.; Dubey, M.; Ajayan, P. M. Synthesis of nitrogen-doped graphene films for lithium battery application. ACS Nano
2010, 4, 6337-42. 39. Deng, D. H.; Pan, X. L.; Yu, L. A.; Cui, Y.; Jiang, Y. P.; Qi, J.; Li, W. X.; Fu, Q. A.; Ma, X. C.; Xue, Q. K.; Sun, G. Q.; Bao, X. H. Toward N-Doped Graphene via Solvothermal Synthesis. Chem. Mater. 2011, 23, 1188-1193.
129
40. Wang, X. R.; Li, X. L.; Zhang, L.; Yoon, Y.; Weber, P. K.; Wang, H. L.; Guo, J.; Dai, H. J. N-Doping of Graphene Through Electrothermal Reactions with Ammonia. Science 2009, 324, 768-771. 41. Guo, H. L.; Su, P.; Kang, X. F.; Ning, S. K. Synthesis and characterization of nitrogen-doped graphene hydrogels by hydrothermal route with urea as reducing-doping agents. Journal of Materials Chemistry A 2013, 1, 2248-2255. 42. Sheng, Z. H.; Shao, L.; Chen, J. J.; Bao, W. J.; Wang, F. B.; Xia, X. H. Catalyst-free synthesis of nitrogen-doped graphene via thermal annealing graphite oxide with melamine and its excellent electrocatalysis. ACS Nano 2011, 5, 4350-8. 43. Jiang, Z. Q.; Jiang, Z. J.; Tian, X. N.; Chen, W. H. Amine-functionalized holey graphene as a highly active metal-free catalyst for the oxygen reduction reaction. Journal
of Materials Chemistry A 2014, 2, 441-450. 44. Patel, M. A.; Yang, H.; Chiu, P. L.; Mastrogiovanni, D. D.; Flach, C. R.; Savaram, K.; Gomez, L.; Hemnarine, A.; Mendelsohn, R.; Garfunkel, E.; Jiang, H.; He, H. Direct production of graphene nanosheets for near infrared photoacoustic imaging. ACS Nano
2013, 7, 8147-57. 45. Kosynkin, D. V.; Higginbotham, A. L.; Sinitskii, A.; Lomeda, J. R.; Dimiev, A.; Price, B. K.; Tour, J. M. Longitudinal unzipping of carbon nanotubes to form graphene nanoribbons. Nature 2009, 458, 872-U5. 46. Aboutalebi, S. H.; Jalili, R.; Esrafilzadeh, D.; Salari, M.; Gholamvand, Z.; Aminorroaya Yamini, S.; Konstantinov, K.; Shepherd, R. L.; Chen, J.; Moulton, S. E. High-Performance Multifunctional Graphene Yarns: Toward Wearable All-Carbon Energy Storage Textiles. ACS nano 2014, 8, 2456-2466. 47. Bagri, A.; Mattevi, C.; Acik, M.; Chabal, Y. J.; Chhowalla, M.; Shenoy, V. B. Structural evolution during the reduction of chemically derived graphene oxide. Nat Chem
2010, 2, 581-7. 48. Dimiev, A. M.; Tour, J. M. Mechanism of Graphene Oxide Formation. Acs Nano
2014, 8, 3060-3068. 49. Ziegler, K. J.; Gu, Z.; Peng, H.; Flor, E. L.; Hauge, R. H.; Smalley, R. E. Controlled oxidative cutting of single-walled carbon nanotubes. J. Am. Chem. Soc. 2005, 127, 1541-7. 50. Liu, J.; Rinzler, A. G.; Dai, H. J.; Hafner, J. H.; Bradley, R. K.; Boul, P. J.; Lu, A.; Iverson, T.; Shelimov, K.; Huffman, C. B.; Rodriguez-Macias, F.; Shon, Y. S.; Lee, T. R.; Colbert, D. T.; Smalley, R. E. Fullerene pipes. Science 1998, 280, 1253-1256. 51. Chen, Z. Y.; Kobashi, K.; Rauwald, U.; Booker, R.; Fan, H.; Hwang, W. F.; Tour, J. M. Soluble ultra-short single-walled carbon nanotubes. J. Am. Chem. Soc. 2006, 128, 10568-10571. 52. Li, J.-L.; Kudin, K. N.; McAllister, M. J.; Prud'homme, R. K.; Aksay, I. A.; Car, R. Oxygen-Driven Unzipping of Graphitic Materials Phys. Rev. Lett. 2006, 96, 176101. 53. Sun, T.; Fabris, S. Mechanisms for Oxidative Unzipping and Cutting of Graphene. Nano Lett. 2012, 12, 17-21. 54. Li, Z. Y.; Zhang, W. H.; Luo, Y.; Yang, J. L.; Hou, J. G. How Graphene Is Cut upon Oxidation? J. Am. Chem. Soc. 2009, 131, 6320-+. 55. Tang, P.; Hu, G.; Gao, Y.; Li, W.; Yao, S.; Liu, Z.; Ma, D. The microwave adsorption behavior and microwave-assisted heteroatoms doping of graphene-based nano-carbon materials. Scientific reports 2014, 4.
130
56. Zhang, Y.; Fugane, K.; Mori, T.; Niu, L.; Ye, J. Wet chemical synthesis of nitrogen-doped graphene towards oxygen reduction electrocatalysts without high-temperature pyrolysis. J. Mater. Chem. 2012, 22, 6575-6580. 57. Lai, L. F.; Potts, J. R.; Zhan, D.; Wang, L.; Poh, C. K.; Tang, C. H.; Gong, H.; Shen, Z. X.; Jianyi, L. Y.; Ruoff, R. S. Exploration of the active center structure of nitrogen-doped graphene-based catalysts for oxygen reduction reaction. Energy & Environmental
Science 2012, 5, 7936-7942. 58. Jiao, Y.; Zheng, Y.; Jaroniec, M.; Qiao, S. Z. Origin of the electrocatalytic oxygen reduction activity of graphene-based catalysts: a roadmap to achieve the best performance. J. Am. Chem. Soc. 2014, 136, 4394-403. 59. Sun, Y.; Li, C.; Shi, G. Nanoporous nitrogen doped carbon modified graphene as electrocatalyst for oxygen reduction reaction. J. Mater. Chem. 2012, 22, 12810-12816. 60. Kong, X.-K.; Chen, C.-L.; Chen, Q.-W. Doped graphene for metal-free catalysis. Chem. Soc. Rev. 2014, 43, 2841-2857. 61. Navalon, S.; Dhakshinamoorthy, A.; Alvaro, M.; Garcia, H. Carbocatalysis by Graphene-Based Materials. Chem. Rev. 2014. 62. Gong, K.; Du, F.; Xia, Z.; Durstock, M.; Dai, L. Nitrogen-doped carbon nanotube arrays with high electrocatalytic activity for oxygen reduction. Science 2009, 323, 760-4. 63. Kurak, K. A.; Anderson, A. B. Nitrogen-Treated Graphite and Oxygen Electroreduction on Pyridinic Edge Sites. Journal of Physical Chemistry C 2009, 113, 6730-6734. 64. Rao, C. V.; Cabrera, C. R.; Ishikawa, Y. In Search of the Active Site in Nitrogen-Doped Carbon Nanotube Electrodes for the Oxygen Reduction Reaction. Journal of
Physical Chemistry Letters 2010, 1, 2622-2627. 65. Zhang, L. P.; Xia, Z. H. Mechanisms of Oxygen Reduction Reaction on Nitrogen-Doped Graphene for Fuel Cells. Journal of Physical Chemistry C 2011, 115, 11170-11176. 66. Peng, X. Y.; Liu, X. X.; Diamond, D.; Lau, K. T. Synthesis of electrochemically-reduced graphene oxide film with controllable size and thickness and its use in supercapacitor. Carbon 2011, 49, 3488-3496. 67. Wang, S. Y.; Yu, D. S.; Dai, L. M.; Chang, D. W.; Baek, J. B. Polyelectrolyte-Functionalized Graphene as Metal-Free Electrocatalysts for Oxygen Reduction. Acs Nano
2011, 5, 6202-6209. 68. Lin, Z.; Waller, G.; Liu, Y.; Liu, M.; Wong, C. P. Facile Synthesis of Nitrogen‐Doped Graphene via Pyrolysis of Graphene Oxide and Urea, and its Electrocatalytic Activity toward the Oxygen‐Reduction Reaction. Advanced Energy Materials 2012, 2, 884-888. 69. Liu, R.; Wu, D.; Feng, X.; Mullen, K. Nitrogen-doped ordered mesoporous graphitic arrays with high electrocatalytic activity for oxygen reduction. Angew. Chem. Int.
Ed. Engl. 2010, 49, 2565-9. 70. Moses, K.; Kiran, V.; Sampath, S.; Rao, C. N. Few-layer borocarbonitride nanosheets: platinum-free catalyst for the oxygen reduction reaction. Chem Asian J 2014, 9, 838-43. 71. Zheng, Y.; Jiao, Y.; Ge, L.; Jaroniec, M.; Qiao, S. Z. Two-step boron and nitrogen doping in graphene for enhanced synergistic catalysis. Angew. Chem. Int. Ed. Engl. 2013, 52, 3110-6.

131
72. Zhang, Y.; Huang, Q. H.; Zou, Z. Q.; Yang, J. F.; Vogel, W.; Yang, H. Enhanced Durability of Au Cluster Decorated Pt Nanoparticles for the Oxygen Reduction Reaction. Journal of Physical Chemistry C 2010, 114, 6860-6868. 73. McAllister, M. J.; Li, J.-L.; Adamson, D. H.; Schniepp, H. C.; Abdala, A. A.; Liu, J.; Herrera-Alonso, M.; Milius, D. L.; Car, R.; Prud'homme, R. K. Single sheet functionalized graphene by oxidation and thermal expansion of graphite. Chem. Mater.
2007, 19, 4396-4404.
132
Chapter 4. P-Doped Porous Carbon as Metal Free Catalysts
for Selective Aerobic Oxidation with an Unexpected
Mechanism
4.1. Introduction
Catalytic oxidation of inexpensive and widely available chemicals to produce high value-
added chemicals remains a significant task in many important current industrial and fine-
chemical processes. Ideal catalytic oxidation processes would use non-toxic sustainable
catalysts and the most environmentally benign and abundant oxidants, such as molecular
oxygen (O2), with good conversion and selectivity. A wide range of homogeneous and
heterogeneous transition metal-based catalysts have been developed for these reactions.
Unfortunately, many metals are not widely available and/or are toxic, which presents
sustainability and environmental challenges. For these reasons, there is ever increasing
interest in developing sustainable and eco-friendly metal-free, “carbon based catalysts”,
including graphene and other nanocarbon based catalysts.1-5
Compared to traditional metal based catalysts, carbon based materials provide
additional advantages because the existence of giant π structures promotes strong
interactions with various reactants. More importantly, its physicochemical and electronic
properties, which in principle determine the catalytic properties of a material, can be
tailored and fine-tuned by molecular engineering and/or heteroatomic doping.6 A plethora
of reports have demonstrated that doping of heteroatoms into graphene and other carbon
based materials gives rise to enhanced performance in electrocatalytic oxygen reduction
reaction (ORR), when compared to their undoped analogues.7-10 Compared to ORR, studies
133
that use doped and/or co-doped carbon materials as catalysts for selective organic synthesis
are in their early stages of development, although a great potential has already been
demonstrated.11 Importantly, these carbocatalysts merge the benefits of green synthesis
with heterogeneous reaction conditions, which greatly simplifies work-up conditions and
is particularly attractive from an industrial standpoint. However, there are few reports
demonstrating that carbon based materials match the efficiency and recyclability of
transition metal catalysts.11 On the other hand, limited “types” of graphene and carbon
materials have been explored so far.2, 12-15 The majority of the research has been focused on
graphene oxide (GO) possibly due to its large availability.16-18 Carbon materials doped with
nitrogen (N) and N-codoped with other heteroatoms have been explored for C-H activation
and aerobic alcohol oxidation.12, 15, 19, 20 Among three types of nitrogen species doped into
the graphene lattice, pyridinic N, pyrrolic N, and graphitic N, the graphitic sp2 N species
were established to be catalytically active centers. However, the requirement of high
temperature to fabricate the graphitic sp2 N violates the original idea for energy saving and
sustainability.21 Furthermore, the planar structure of graphitic sp2 N brings difficulties in
overcoming substrate steric hindrance effects, which causes limited catalytic reaction scope
of N-doped carbon materials.20, 22
Recently, growing interest has emerged in phosphorus (P) doped carbon materials.
23-26 P has the same number of valence electrons as N, making P-doped carbon materials
also electron rich.24 While, the polarity of the C–P bond is opposite to that of the C–N
bond due to lower electronegativity of P atoms (2.19) than C (2.55), making P partially
positively charged and possibly the catalytic sites,27, 28 instead of the neighboring C atoms
as in the N-doped carbon materials.12, 15, 19 Furthermore, as the diameter of P is much larger
134
than C, P-doping results in more local structural distortion of the hexagonal carbon
framework and in such a configuration, P protrudes out of the graphene plane.27, 28 Finally,
when compared with N-doping, distinct effects by P-doping may also arise from the
additional vacant 3d orbitals and the valence electrons in the third shell. All these
characteristics empower P-doped carbon materials to overcome the steric hindrance effects
encountered in N-doped carbon materials.12, 20 However, experimentally, most of the
approaches for P-doping necessitate accompanying O doping, forming various P and O
containing functional groups.25, 26, 29 How these functional groups, and the bonding
configuration of P in a carbon matrix, influence the electronic property and therefore its
catalytic performance remains unknown. Furthermore, most of the P-doped materials were
fabricated via high temperature annealing for long periods of time in an inert environment,
which also violates the original idea for energy saving and sustainability.
Herein we report an extremely simple and rapid (seconds) approach to directly
synthesize gram quantities of P-doped porous carbon materials from abundant biomass
molecules. The work function of P-doped carbon materials and its connectivity to the P
bond configuration in the carbon matrix have been studied via PeakForce Kelvin probe
force microscopy (PF KPFM). Most significantly, the capability of the P-doped carbon
materials as metal free catalysts for aerobic oxidation reactions have been demonstrated
for the first time. As expected, unlike N-doped carbon material, the steric problem does not
exist for P-doped carbon materials. The P-doped materials can efficiently catalyze aerobic
oxidation of both primary and secondary benzyl alcohols to the corresponding aldehydes
or ketones. A kinetic study shows that the P-doped carbon material have an activation
energy of ~ 49.6 kJ.mol-1 for benzyl alcohol oxidation, which is lower than N-doped carbon
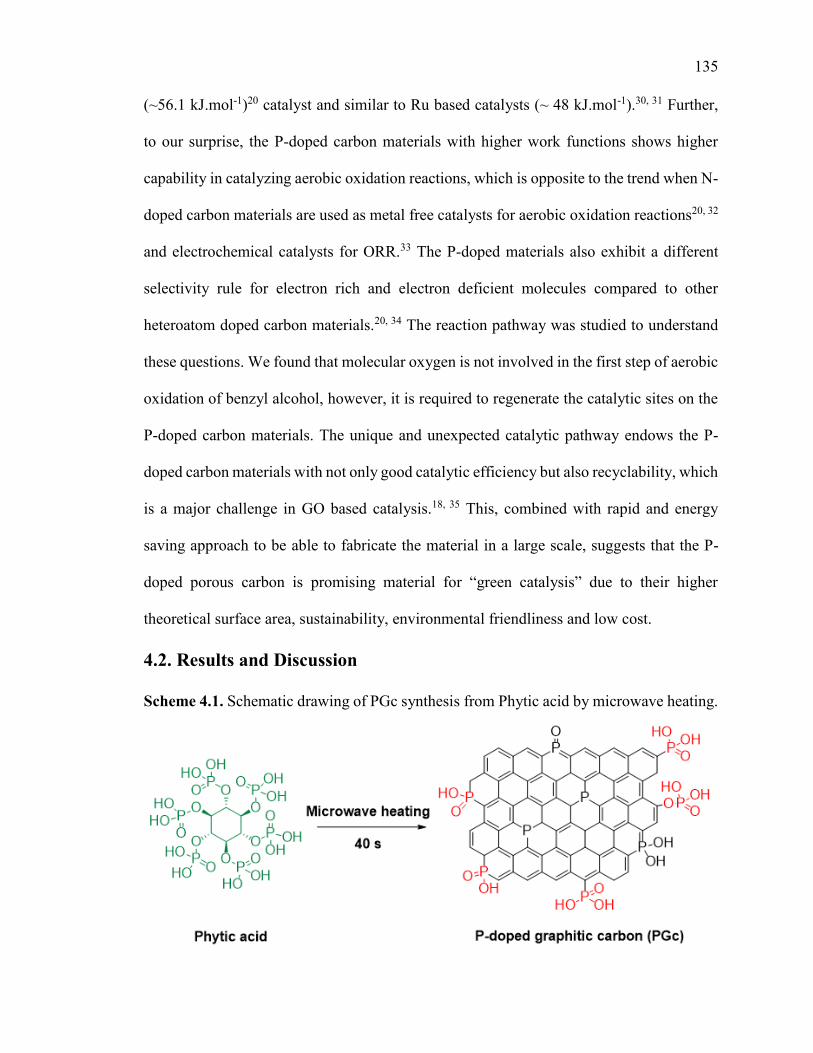
135
(~56.1 kJ.mol-1)20 catalyst and similar to Ru based catalysts (~ 48 kJ.mol-1).30, 31 Further,
to our surprise, the P-doped carbon materials with higher work functions shows higher
capability in catalyzing aerobic oxidation reactions, which is opposite to the trend when N-
doped carbon materials are used as metal free catalysts for aerobic oxidation reactions20, 32
and electrochemical catalysts for ORR.33 The P-doped materials also exhibit a different
selectivity rule for electron rich and electron deficient molecules compared to other
heteroatom doped carbon materials.20, 34 The reaction pathway was studied to understand
these questions. We found that molecular oxygen is not involved in the first step of aerobic
oxidation of benzyl alcohol, however, it is required to regenerate the catalytic sites on the
P-doped carbon materials. The unique and unexpected catalytic pathway endows the P-
doped carbon materials with not only good catalytic efficiency but also recyclability, which
is a major challenge in GO based catalysis.18, 35 This, combined with rapid and energy
saving approach to be able to fabricate the material in a large scale, suggests that the P-
doped porous carbon is promising material for “green catalysis” due to their higher
theoretical surface area, sustainability, environmental friendliness and low cost.
4.2. Results and Discussion
Scheme 4.1. Schematic drawing of PGc synthesis from Phytic acid by microwave heating.
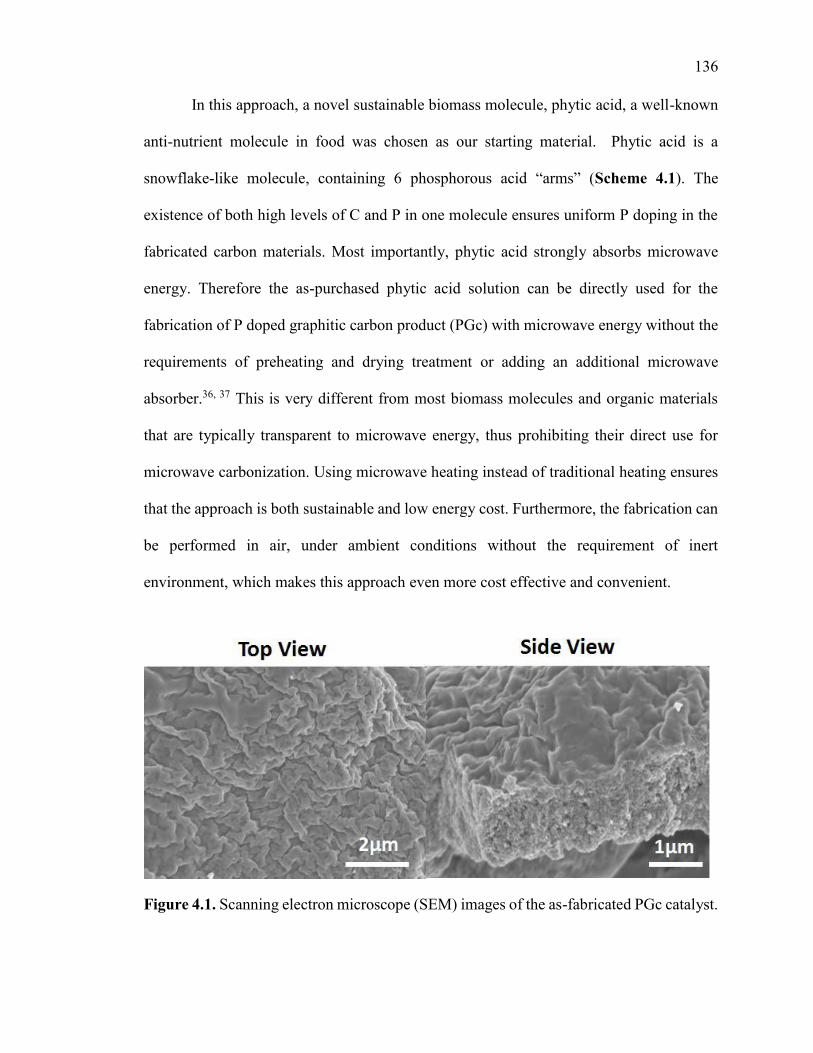
136
In this approach, a novel sustainable biomass molecule, phytic acid, a well-known
anti-nutrient molecule in food was chosen as our starting material. Phytic acid is a
snowflake-like molecule, containing 6 phosphorous acid “arms” (Scheme 4.1). The
existence of both high levels of C and P in one molecule ensures uniform P doping in the
fabricated carbon materials. Most importantly, phytic acid strongly absorbs microwave
energy. Therefore the as-purchased phytic acid solution can be directly used for the
fabrication of P doped graphitic carbon product (PGc) with microwave energy without the
requirements of preheating and drying treatment or adding an additional microwave
absorber.36, 37 This is very different from most biomass molecules and organic materials
that are typically transparent to microwave energy, thus prohibiting their direct use for
microwave carbonization. Using microwave heating instead of traditional heating ensures
that the approach is both sustainable and low energy cost. Furthermore, the fabrication can
be performed in air, under ambient conditions without the requirement of inert
environment, which makes this approach even more cost effective and convenient.
Figure 4.1. Scanning electron microscope (SEM) images of the as-fabricated PGc catalyst.
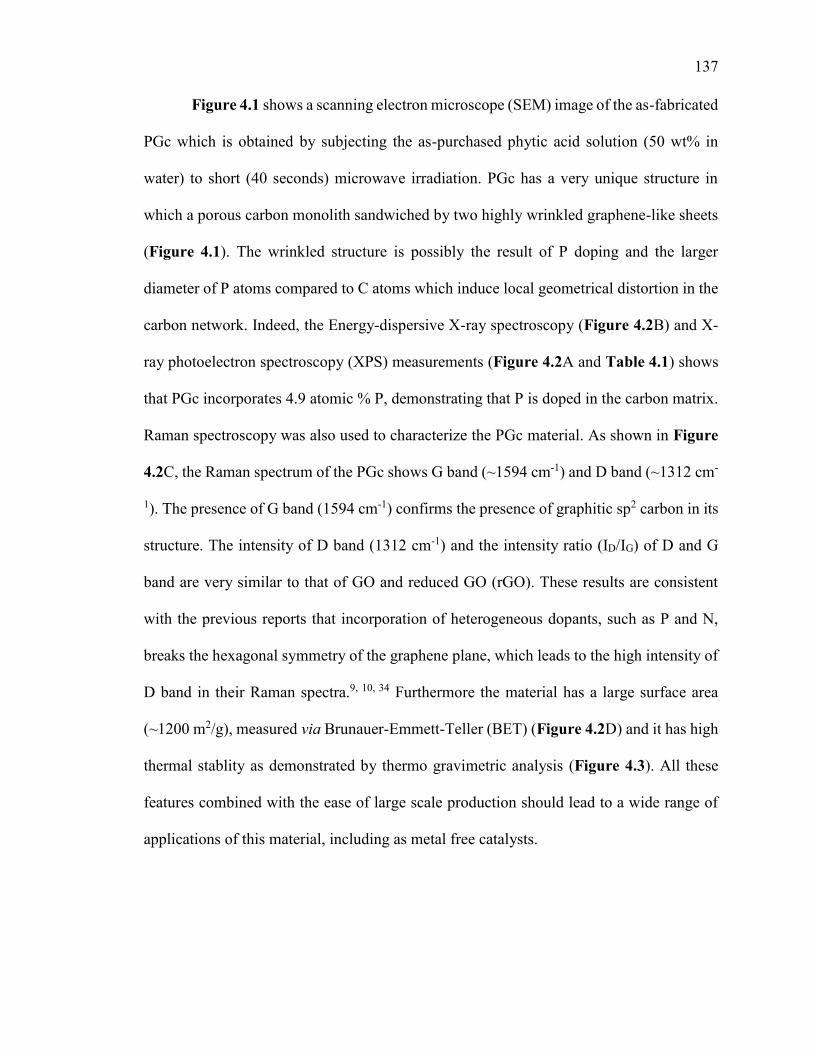
137
Figure 4.1 shows a scanning electron microscope (SEM) image of the as-fabricated
PGc which is obtained by subjecting the as-purchased phytic acid solution (50 wt% in
water) to short (40 seconds) microwave irradiation. PGc has a very unique structure in
which a porous carbon monolith sandwiched by two highly wrinkled graphene-like sheets
(Figure 4.1). The wrinkled structure is possibly the result of P doping and the larger
diameter of P atoms compared to C atoms which induce local geometrical distortion in the
carbon network. Indeed, the Energy-dispersive X-ray spectroscopy (Figure 4.2B) and X-
ray photoelectron spectroscopy (XPS) measurements (Figure 4.2A and Table 4.1) shows
that PGc incorporates 4.9 atomic % P, demonstrating that P is doped in the carbon matrix.
Raman spectroscopy was also used to characterize the PGc material. As shown in Figure
4.2C, the Raman spectrum of the PGc shows G band (~1594 cm-1) and D band (~1312 cm-
1). The presence of G band (1594 cm-1) confirms the presence of graphitic sp2 carbon in its
structure. The intensity of D band (1312 cm-1) and the intensity ratio (ID/IG) of D and G
band are very similar to that of GO and reduced GO (rGO). These results are consistent
with the previous reports that incorporation of heterogeneous dopants, such as P and N,
breaks the hexagonal symmetry of the graphene plane, which leads to the high intensity of
D band in their Raman spectra.9, 10, 34 Furthermore the material has a large surface area
(~1200 m2/g), measured via Brunauer-Emmett-Teller (BET) (Figure 4.2D) and it has high
thermal stablity as demonstrated by thermo gravimetric analysis (Figure 4.3). All these
features combined with the ease of large scale production should lead to a wide range of
applications of this material, including as metal free catalysts.
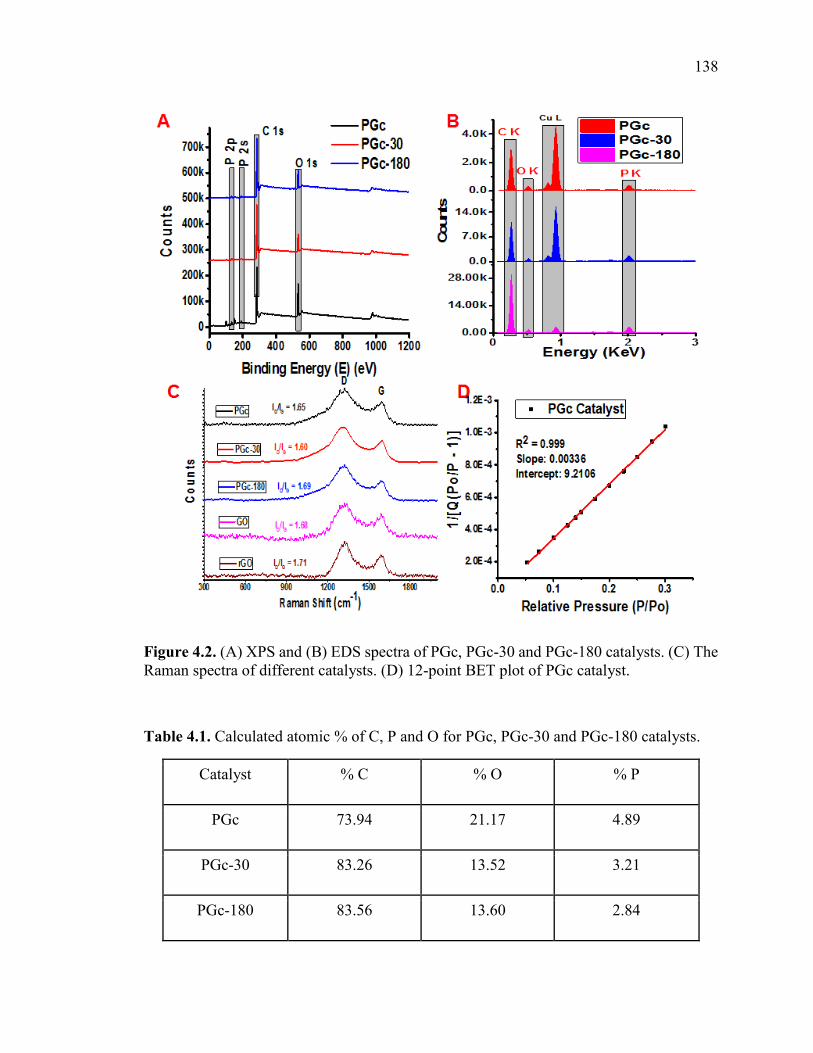
138
Figure 4.2. (A) XPS and (B) EDS spectra of PGc, PGc-30 and PGc-180 catalysts. (C) The Raman spectra of different catalysts. (D) 12-point BET plot of PGc catalyst.
Table 4.1. Calculated atomic % of C, P and O for PGc, PGc-30 and PGc-180 catalysts.
Catalyst % C % O % P
PGc 73.94 21.17 4.89
PGc-30 83.26 13.52 3.21
PGc-180 83.56 13.60 2.84
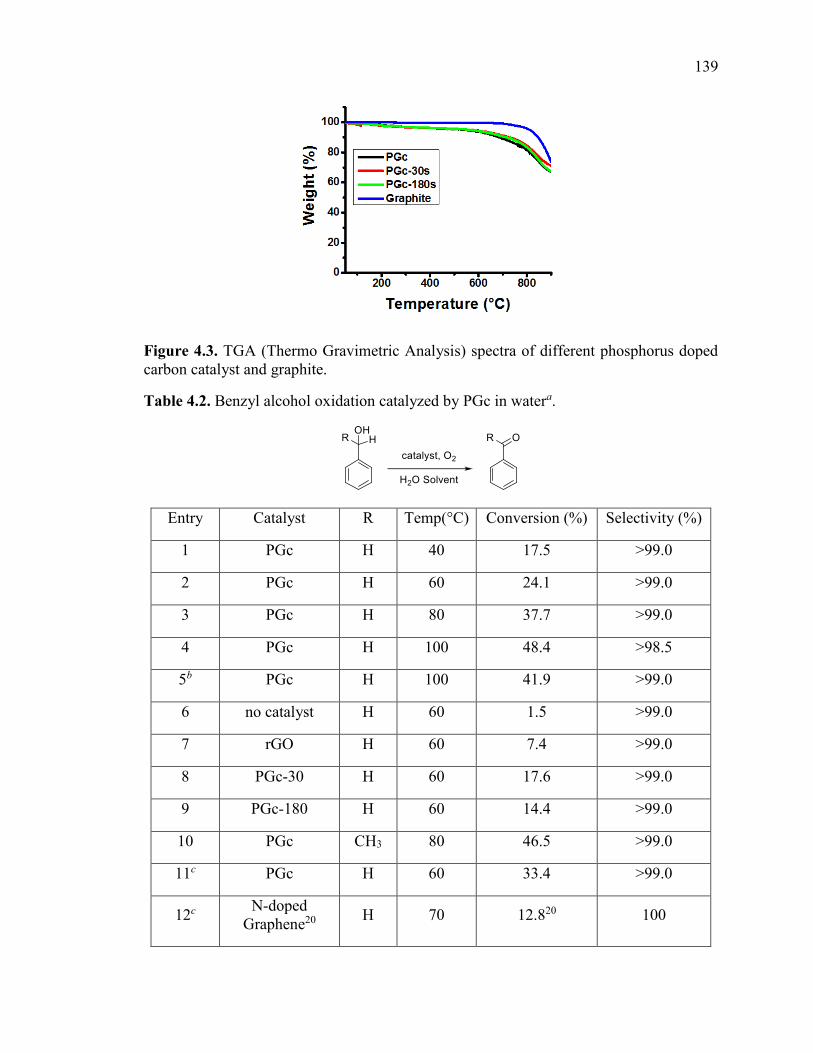
139
Figure 4.3. TGA (Thermo Gravimetric Analysis) spectra of different phosphorus doped carbon catalyst and graphite.
Table 4.2. Benzyl alcohol oxidation catalyzed by PGc in watera.
Entry Catalyst R Temp(°C) Conversion (%) Selectivity (%)
1 PGc H 40 17.5 >99.0
2 PGc H 60 24.1 >99.0
3 PGc H 80 37.7 >99.0
4 PGc H 100 48.4 >98.5
5b PGc H 100 41.9 >99.0
6 no catalyst H 60 1.5 >99.0
7 rGO H 60 7.4 >99.0
8 PGc-30 H 60 17.6 >99.0
9 PGc-180 H 60 14.4 >99.0
10 PGc CH3 80 46.5 >99.0
11c PGc H 60 33.4 >99.0
12c N-doped
Graphene20 H 70 12.820 100
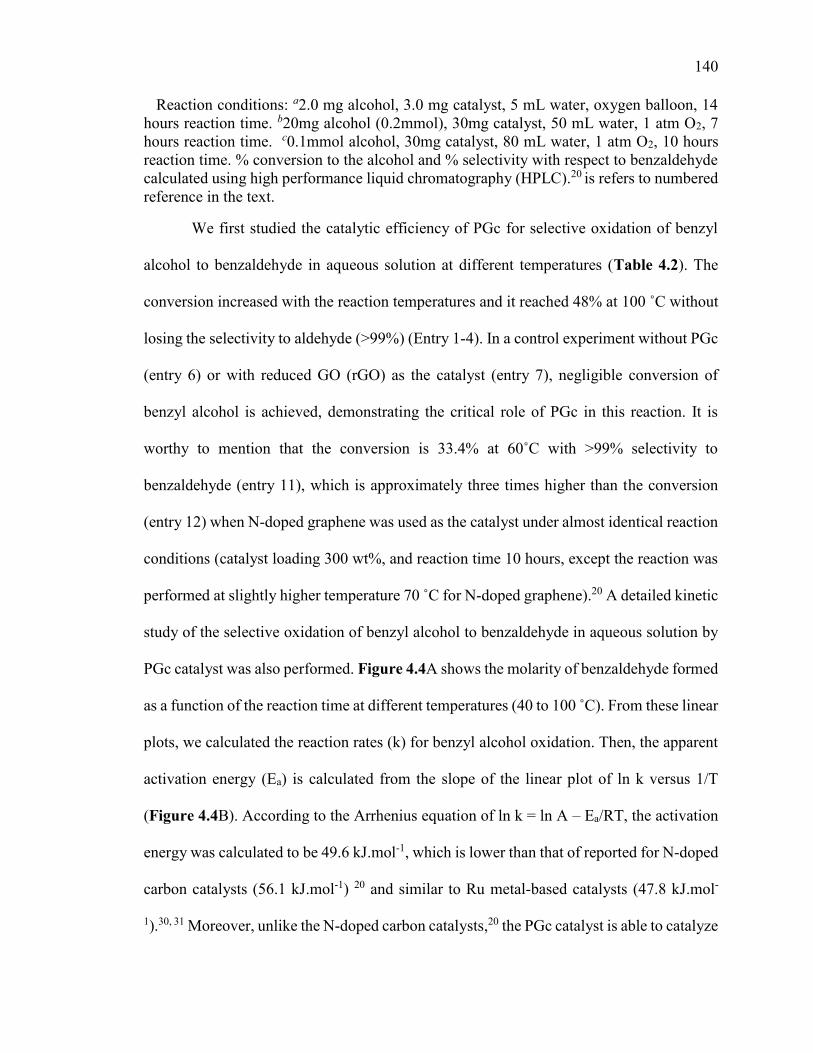
140
Reaction conditions: a2.0 mg alcohol, 3.0 mg catalyst, 5 mL water, oxygen balloon, 14 hours reaction time. b20mg alcohol (0.2mmol), 30mg catalyst, 50 mL water, 1 atm O2, 7 hours reaction time. c0.1mmol alcohol, 30mg catalyst, 80 mL water, 1 atm O2, 10 hours reaction time. % conversion to the alcohol and % selectivity with respect to benzaldehyde calculated using high performance liquid chromatography (HPLC).20 is refers to numbered reference in the text.
We first studied the catalytic efficiency of PGc for selective oxidation of benzyl
alcohol to benzaldehyde in aqueous solution at different temperatures (Table 4.2). The
conversion increased with the reaction temperatures and it reached 48% at 100 ˚C without
losing the selectivity to aldehyde (>99%) (Entry 1-4). In a control experiment without PGc
(entry 6) or with reduced GO (rGO) as the catalyst (entry 7), negligible conversion of
benzyl alcohol is achieved, demonstrating the critical role of PGc in this reaction. It is
worthy to mention that the conversion is 33.4% at 60˚C with >λλ% selectivity to
benzaldehyde (entry 11), which is approximately three times higher than the conversion
(entry 12) when N-doped graphene was used as the catalyst under almost identical reaction
conditions (catalyst loading 300 wt%, and reaction time 10 hours, except the reaction was
performed at slightly higher temperature 70 ˚C for N-doped graphene).20 A detailed kinetic
study of the selective oxidation of benzyl alcohol to benzaldehyde in aqueous solution by
PGc catalyst was also performed. Figure 4.4A shows the molarity of benzaldehyde formed
as a function of the reaction time at different temperatures (40 to 100 C). From these linear
plots, we calculated the reaction rates (k) for benzyl alcohol oxidation. Then, the apparent
activation energy (Ea) is calculated from the slope of the linear plot of ln k versus 1/T
(Figure 4.4B). According to the Arrhenius equation of ln k = ln A – Ea/RT, the activation
energy was calculated to be 49.6 kJ.mol-1, which is lower than that of reported for N-doped
carbon catalysts (56.1 kJ.mol-1) 20 and similar to Ru metal-based catalysts (47.8 kJ.mol-
1).30, 31 Moreover, unlike the N-doped carbon catalysts,20 the PGc catalyst is able to catalyze
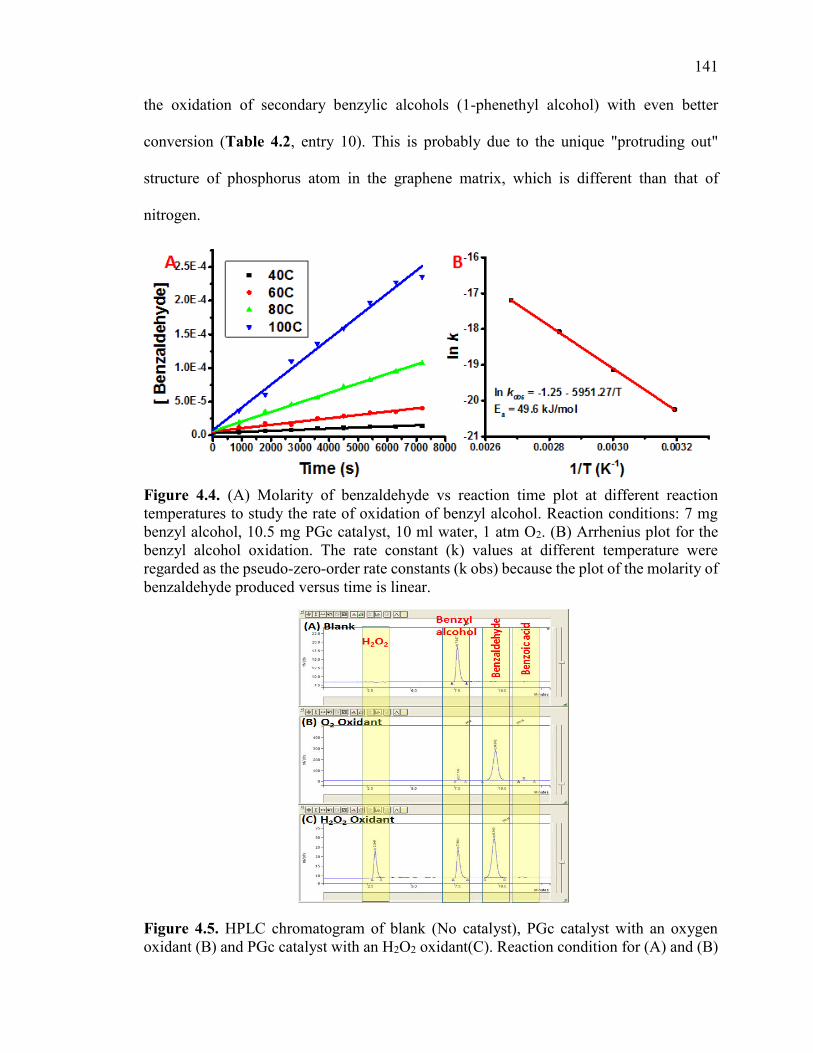
141
the oxidation of secondary benzylic alcohols (1-phenethyl alcohol) with even better
conversion (Table 4.2, entry 10). This is probably due to the unique "protruding out"
structure of phosphorus atom in the graphene matrix, which is different than that of
nitrogen.
Figure 4.4. (A) Molarity of benzaldehyde vs reaction time plot at different reaction temperatures to study the rate of oxidation of benzyl alcohol. Reaction conditions: 7 mg benzyl alcohol, 10.5 mg PGc catalyst, 10 ml water, 1 atm O2. (B) Arrhenius plot for the benzyl alcohol oxidation. The rate constant (k) values at different temperature were regarded as the pseudo-zero-order rate constants (k obs) because the plot of the molarity of benzaldehyde produced versus time is linear.
Figure 4.5. HPLC chromatogram of blank (No catalyst), PGc catalyst with an oxygen oxidant (B) and PGc catalyst with an H2O2 oxidant(C). Reaction condition for (A) and (B)
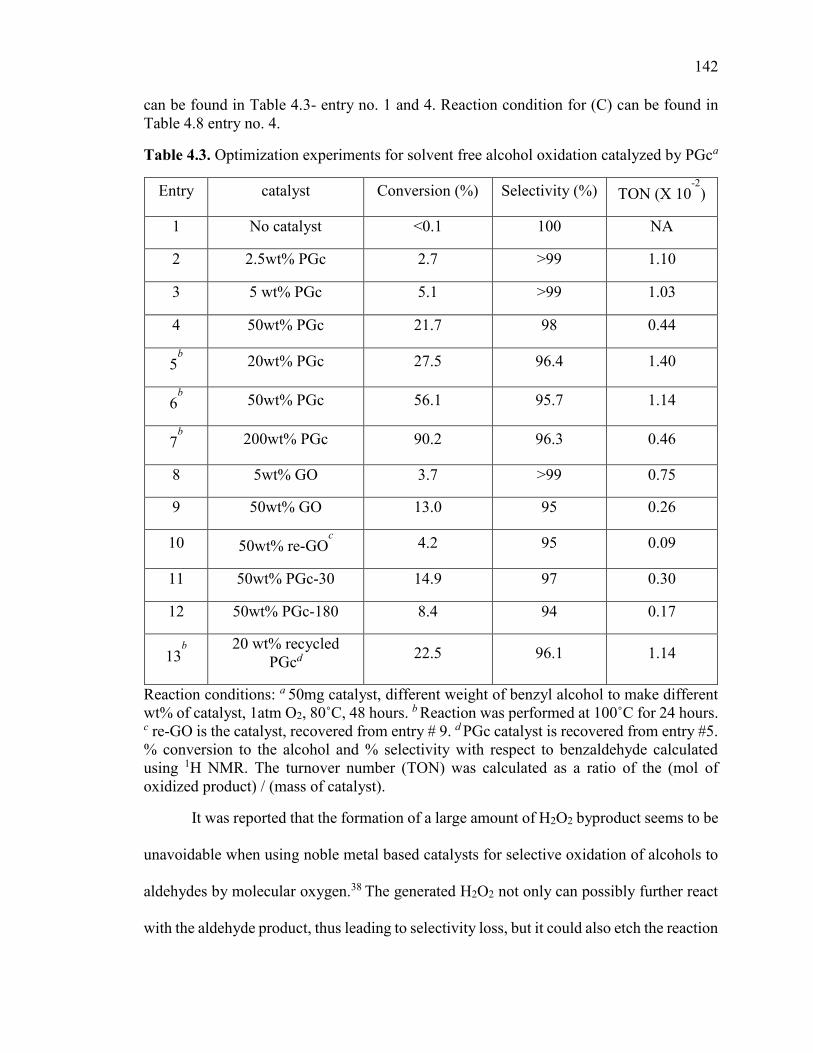
142
can be found in Table 4.3- entry no. 1 and 4. Reaction condition for (C) can be found in Table 4.8 entry no. 4.
Table 4.3. Optimization experiments for solvent free alcohol oxidation catalyzed by PGca
Entry catalyst Conversion (%) Selectivity (%) TON (X 10-2
)
1 No catalyst <0.1 100 NA
2 2.5wt% PGc 2.7 >99 1.10
3 5 wt% PGc 5.1 >99 1.03
4 50wt% PGc 21.7 98 0.44
5b
20wt% PGc 27.5 96.4 1.40
6b
50wt% PGc 56.1 95.7 1.14
7b
200wt% PGc 90.2 96.3 0.46
8 5wt% GO 3.7 >99 0.75
9 50wt% GO 13.0 95 0.26
10 50wt% re-GOc
4.2 95 0.09
11 50wt% PGc-30 14.9 97 0.30
12 50wt% PGc-180 8.4 94 0.17
13b
20 wt% recycled
PGcd 22.5 96.1 1.14
Reaction conditions: a 50mg catalyst, different weight of benzyl alcohol to make different wt% of catalyst, 1atm O2, 80˚C, 48 hours. b Reaction was performed at 100˚C for 24 hours. c re-GO is the catalyst, recovered from entry # 9. d PGc catalyst is recovered from entry #5. % conversion to the alcohol and % selectivity with respect to benzaldehyde calculated using 1H NMR. The turnover number (TON) was calculated as a ratio of the (mol of oxidized product) / (mass of catalyst).
It was reported that the formation of a large amount of H2O2 byproduct seems to be
unavoidable when using noble metal based catalysts for selective oxidation of alcohols to
aldehydes by molecular oxygen.38 The generated H2O2 not only can possibly further react
with the aldehyde product, thus leading to selectivity loss, but it could also etch the reaction
143
equipment. Therefore, it is worth mentioning that there is no detectable H2O2 byproduct
generated in the present reaction (Figure 4.5), which is another advantage compared to
transition metal catalysis.38-40
For industrial applications, solvent free catalytic reactions are preferred to avoid
extra cost related to the use of and handling of solvents. Previously, Bielawski reported
that GO is capable of catalyzing oxidation and hydration reactions in solvent free
conditions.18 To test whether PGc can also catalyze benzyl alcohol oxidation without any
solvent, neat benzyl alcohol was heated to 80 ˚C for 48 hours in the presence of different
wt% of PGc, under 1 atm of oxygen (Table 4.3). The %conversion with PGc catalyst
increases from 2.7% to 22% with the increase of the amount of catalyst loading (entries 2-
4). If the reaction is performed under the same conditions, the catalytic efficiency of PGc
is similar or slightly better compared to GO reported by Bielawski et al.18 (entries 5-7). For
example, the alcohol conversion increases to 56% and 90% with 50 and 200 wt% catalyst
loading, respectively, at 100˚C for 24 hours (entries 5-7). The high aldehyde selectivity is
largely maintained (≥ 96%). It was reported that at 20 wt% GO catalyst loading, a dramatic
decrease in conversion efficiency from 24% to 5% was reported, indicating that majority
of the catalytic sites have been lost during the catalytic cycle.18 It has also been reported
that the graphitic N in N-doped graphene suffered from serious stability issues.32 To test
the recyclability of the PGc, we recovered the PGc catalyst by filtration at the end of the
reaction and recycled the catalyst for eight runs. Significantly, with 50 wt% PGc catalyst
loading, the decrease in alcohol conversion and selectivity was not obvious (Figure 4.6A),
which is in sharp contrast to GO catalysts (Table 4.3, entry 9 and 10). With 20 wt%
loading, the decrease in % conversion is much less compared to that of GO (Table 4.3,
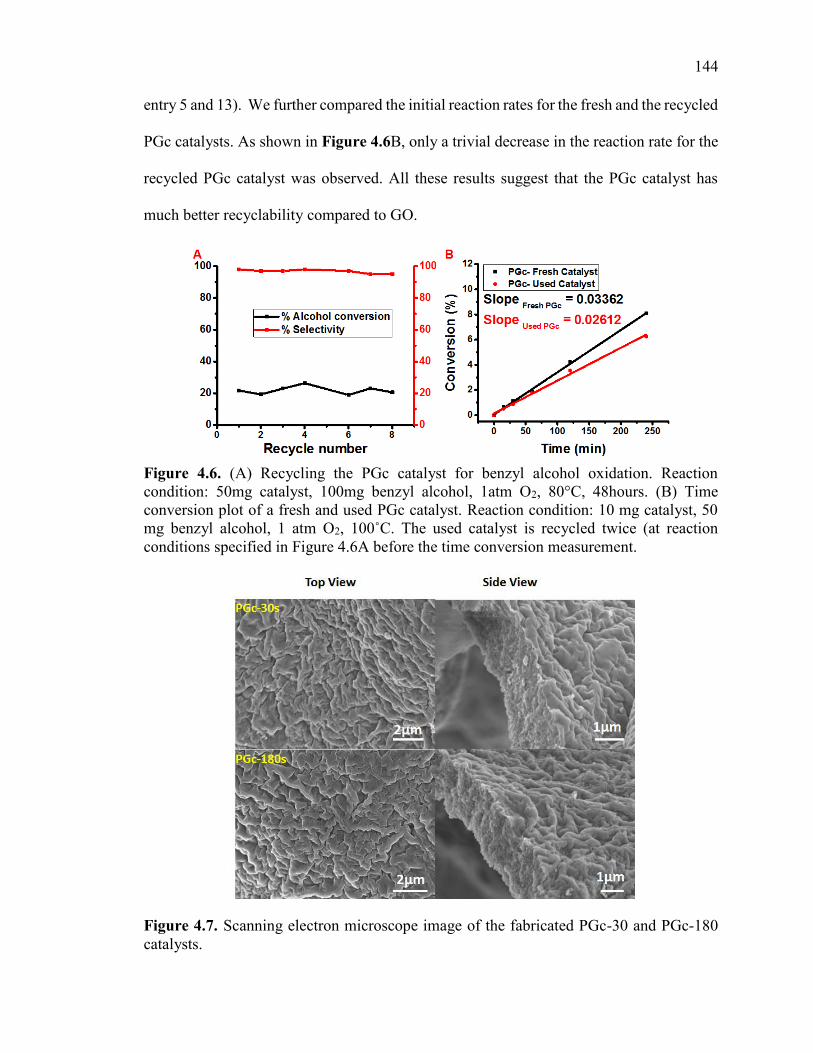
144
entry 5 and 13). We further compared the initial reaction rates for the fresh and the recycled
PGc catalysts. As shown in Figure 4.6B, only a trivial decrease in the reaction rate for the
recycled PGc catalyst was observed. All these results suggest that the PGc catalyst has
much better recyclability compared to GO.
Figure 4.6. (A) Recycling the PGc catalyst for benzyl alcohol oxidation. Reaction condition: 50mg catalyst, 100mg benzyl alcohol, 1atm O2, 80°C, 48hours. (B) Time conversion plot of a fresh and used PGc catalyst. Reaction condition: 10 mg catalyst, 50 mg benzyl alcohol, 1 atm O2, 100˚C. The used catalyst is recycled twice (at reaction conditions specified in Figure 4.6A before the time conversion measurement.
Figure 4.7. Scanning electron microscope image of the fabricated PGc-30 and PGc-180 catalysts.
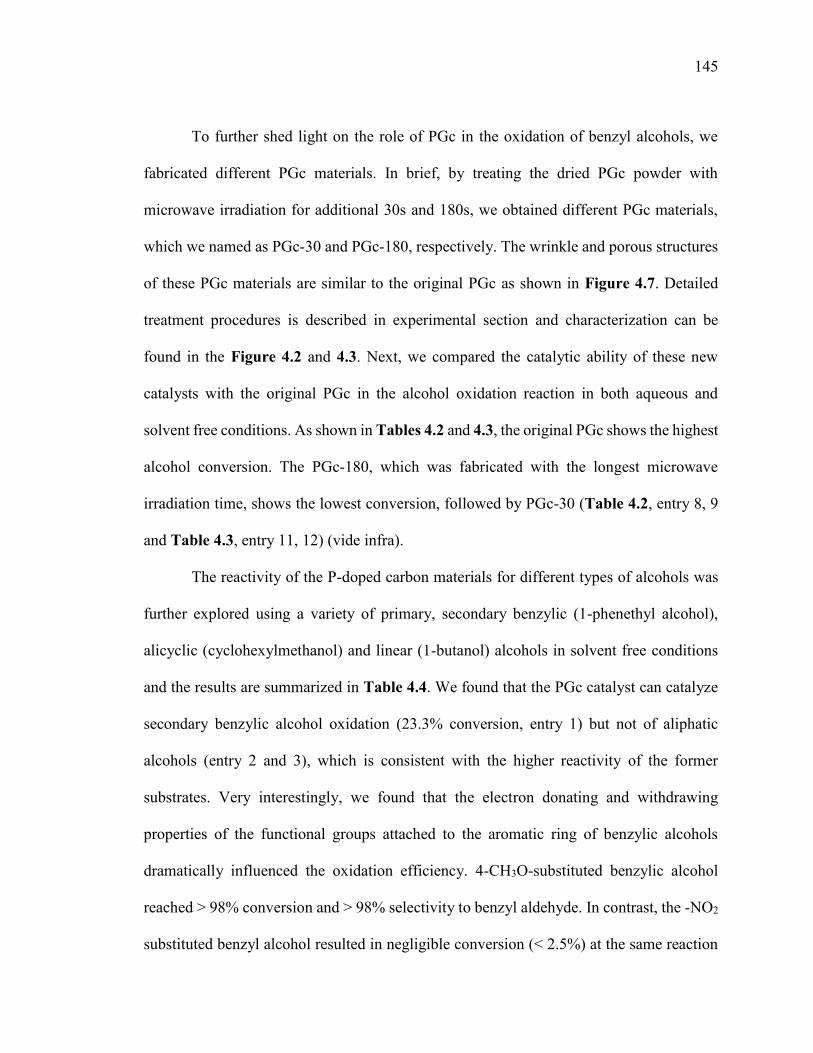
145
To further shed light on the role of PGc in the oxidation of benzyl alcohols, we
fabricated different PGc materials. In brief, by treating the dried PGc powder with
microwave irradiation for additional 30s and 180s, we obtained different PGc materials,
which we named as PGc-30 and PGc-180, respectively. The wrinkle and porous structures
of these PGc materials are similar to the original PGc as shown in Figure 4.7. Detailed
treatment procedures is described in experimental section and characterization can be
found in the Figure 4.2 and 4.3. Next, we compared the catalytic ability of these new
catalysts with the original PGc in the alcohol oxidation reaction in both aqueous and
solvent free conditions. As shown in Tables 4.2 and 4.3, the original PGc shows the highest
alcohol conversion. The PGc-180, which was fabricated with the longest microwave
irradiation time, shows the lowest conversion, followed by PGc-30 (Table 4.2, entry 8, 9
and Table 4.3, entry 11, 12) (vide infra).
The reactivity of the P-doped carbon materials for different types of alcohols was
further explored using a variety of primary, secondary benzylic (1-phenethyl alcohol),
alicyclic (cyclohexylmethanol) and linear (1-butanol) alcohols in solvent free conditions
and the results are summarized in Table 4.4. We found that the PGc catalyst can catalyze
secondary benzylic alcohol oxidation (23.3% conversion, entry 1) but not of aliphatic
alcohols (entry 2 and 3), which is consistent with the higher reactivity of the former
substrates. Very interestingly, we found that the electron donating and withdrawing
properties of the functional groups attached to the aromatic ring of benzylic alcohols
dramatically influenced the oxidation efficiency. 4-CH3O-substituted benzylic alcohol
reached > 98% conversion and > 98% selectivity to benzyl aldehyde. In contrast, the -NO2
substituted benzyl alcohol resulted in negligible conversion (< 2.5%) at the same reaction
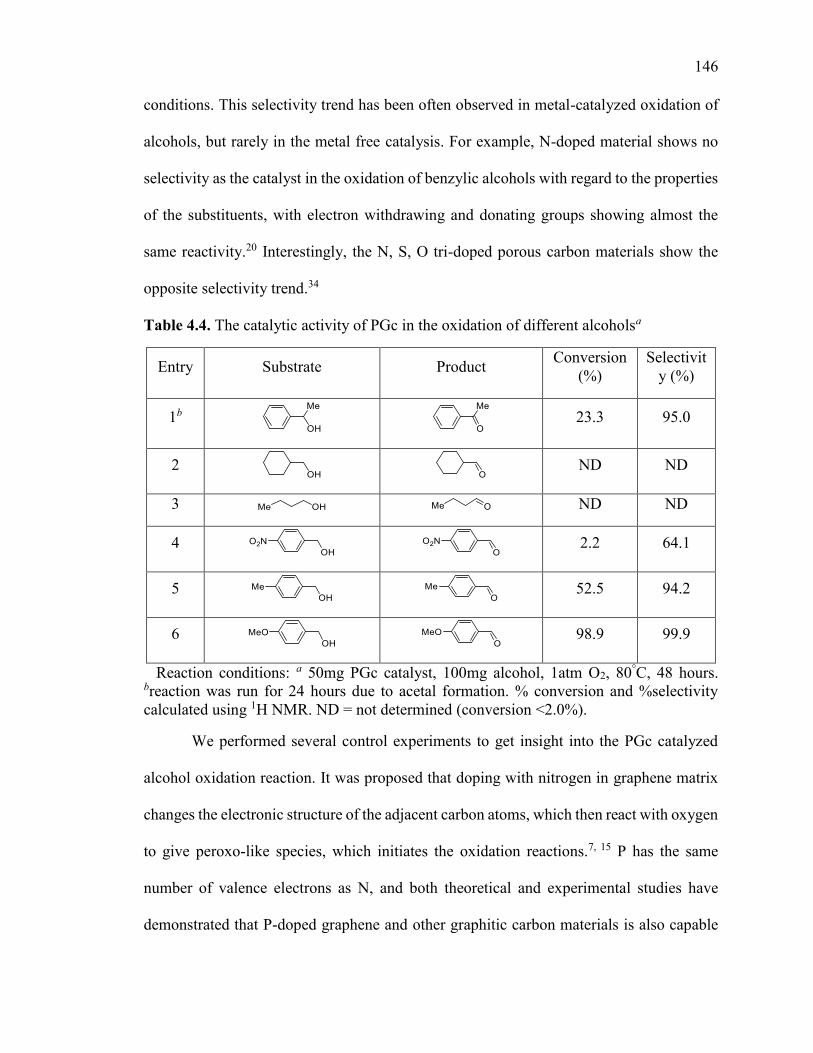
146
conditions. This selectivity trend has been often observed in metal-catalyzed oxidation of
alcohols, but rarely in the metal free catalysis. For example, N-doped material shows no
selectivity as the catalyst in the oxidation of benzylic alcohols with regard to the properties
of the substituents, with electron withdrawing and donating groups showing almost the
same reactivity.20 Interestingly, the N, S, O tri-doped porous carbon materials show the
opposite selectivity trend.34
Table 4.4. The catalytic activity of PGc in the oxidation of different alcoholsa
Entry Substrate Product Conversion
(%) Selectivit
y (%)
1b
23.3 95.0
2
ND ND
3 ND ND
4
2.2 64.1
5
52.5 94.2
6
98.9 99.9
Reaction conditions: a 50mg PGc catalyst, 100mg alcohol, 1atm O2, 80°C, 48 hours. breaction was run for 24 hours due to acetal formation. % conversion and %selectivity calculated using 1H NMR. ND = not determined (conversion <2.0%).
We performed several control experiments to get insight into the PGc catalyzed
alcohol oxidation reaction. It was proposed that doping with nitrogen in graphene matrix
changes the electronic structure of the adjacent carbon atoms, which then react with oxygen
to give peroxo-like species, which initiates the oxidation reactions.7, 15 P has the same
number of valence electrons as N, and both theoretical and experimental studies have
demonstrated that P-doped graphene and other graphitic carbon materials is also capable
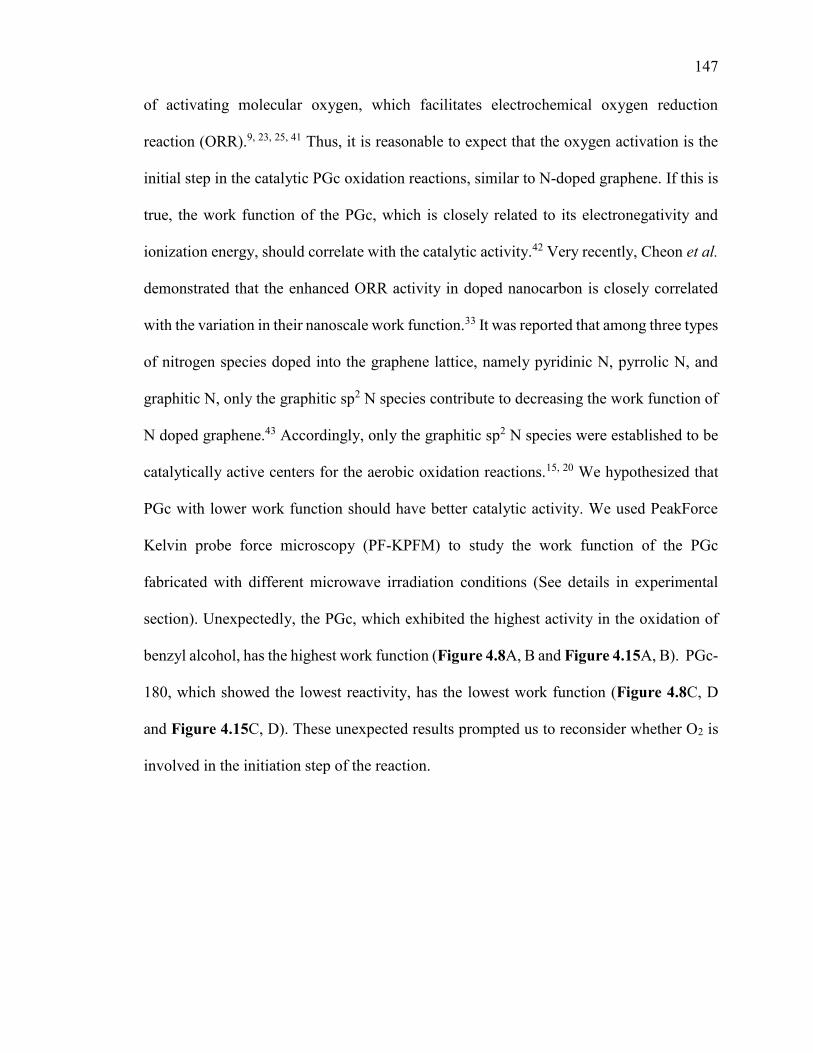
147
of activating molecular oxygen, which facilitates electrochemical oxygen reduction
reaction (ORR).9, 23, 25, 41 Thus, it is reasonable to expect that the oxygen activation is the
initial step in the catalytic PGc oxidation reactions, similar to N-doped graphene. If this is
true, the work function of the PGc, which is closely related to its electronegativity and
ionization energy, should correlate with the catalytic activity.42 Very recently, Cheon et al.
demonstrated that the enhanced ORR activity in doped nanocarbon is closely correlated
with the variation in their nanoscale work function.33 It was reported that among three types
of nitrogen species doped into the graphene lattice, namely pyridinic N, pyrrolic N, and
graphitic N, only the graphitic sp2 N species contribute to decreasing the work function of
N doped graphene.43 Accordingly, only the graphitic sp2 N species were established to be
catalytically active centers for the aerobic oxidation reactions.15, 20 We hypothesized that
PGc with lower work function should have better catalytic activity. We used PeakForce
Kelvin probe force microscopy (PF-KPFM) to study the work function of the PGc
fabricated with different microwave irradiation conditions (See details in experimental
section). Unexpectedly, the PGc, which exhibited the highest activity in the oxidation of
benzyl alcohol, has the highest work function (Figure 4.8A, B and Figure 4.15A, B). PGc-
180, which showed the lowest reactivity, has the lowest work function (Figure 4.8C, D
and Figure 4.15C, D). These unexpected results prompted us to reconsider whether O2 is
involved in the initiation step of the reaction.
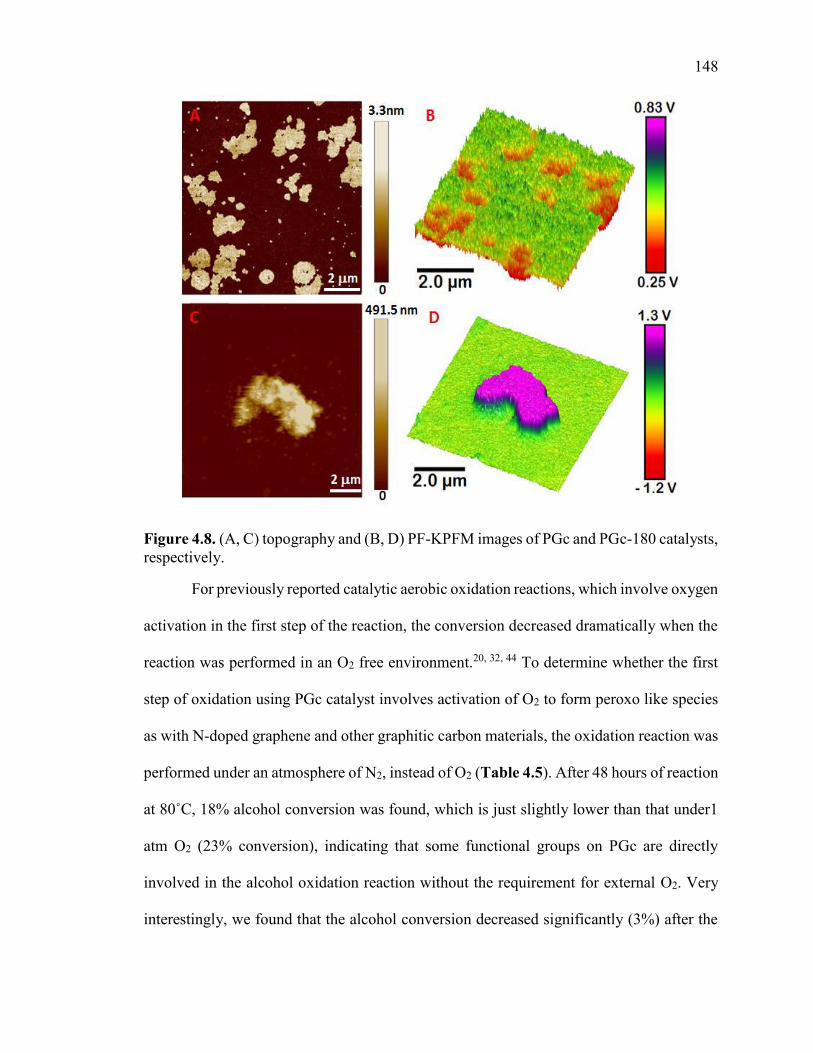
148
Figure 4.8. (A, C) topography and (B, D) PF-KPFM images of PGc and PGc-180 catalysts, respectively.
For previously reported catalytic aerobic oxidation reactions, which involve oxygen
activation in the first step of the reaction, the conversion decreased dramatically when the
reaction was performed in an O2 free environment.20, 32, 44 To determine whether the first
step of oxidation using PGc catalyst involves activation of O2 to form peroxo like species
as with N-doped graphene and other graphitic carbon materials, the oxidation reaction was
performed under an atmosphere of N2, instead of O2 (Table 4.5). After 48 hours of reaction
at 80˚C, 18% alcohol conversion was found, which is just slightly lower than that under1
atm O2 (23% conversion), indicating that some functional groups on PGc are directly
involved in the alcohol oxidation reaction without the requirement for external O2. Very
interestingly, we found that the alcohol conversion decreased significantly (3%) after the
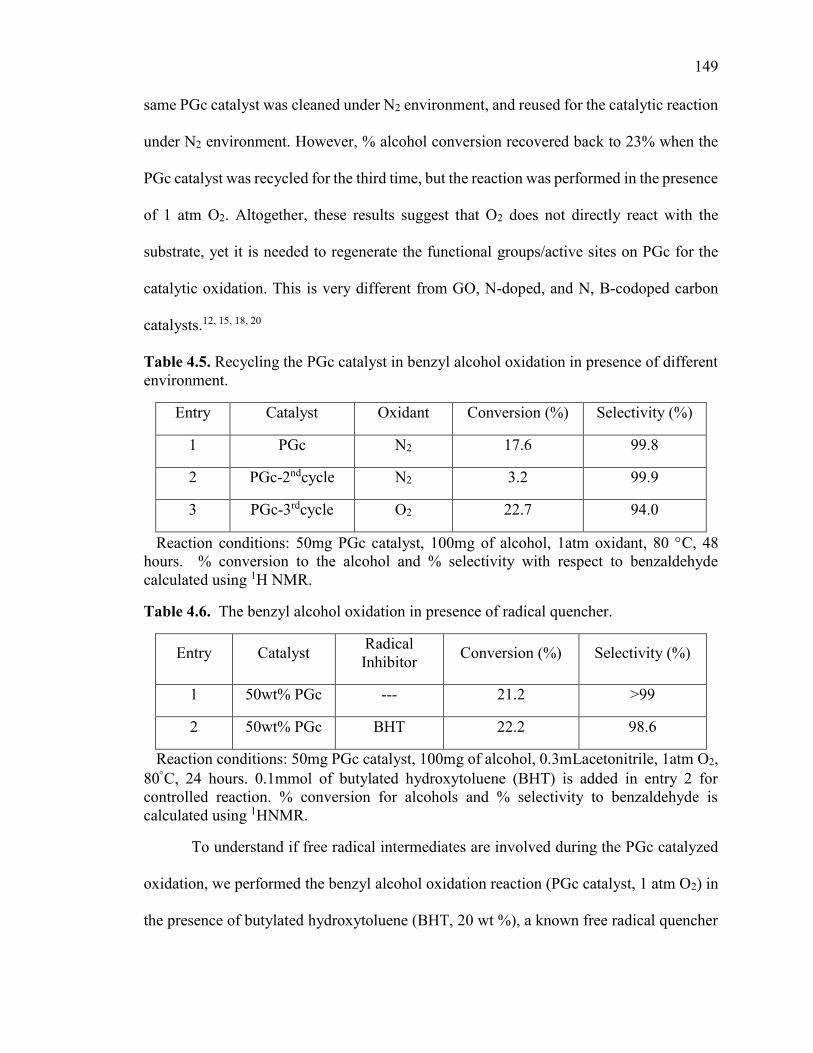
149
same PGc catalyst was cleaned under N2 environment, and reused for the catalytic reaction
under N2 environment. However, % alcohol conversion recovered back to 23% when the
PGc catalyst was recycled for the third time, but the reaction was performed in the presence
of 1 atm O2. Altogether, these results suggest that O2 does not directly react with the
substrate, yet it is needed to regenerate the functional groups/active sites on PGc for the
catalytic oxidation. This is very different from GO, N-doped, and N, B-codoped carbon
catalysts.12, 15, 18, 20
Table 4.5. Recycling the PGc catalyst in benzyl alcohol oxidation in presence of different environment.
Entry Catalyst Oxidant Conversion (%) Selectivity (%)
1 PGc N2 17.6 99.8
2 PGc-2ndcycle N2 3.2 99.9
3 PGc-3rdcycle O2 22.7 94.0
Reaction conditions: 50mg PGc catalyst, 100mg of alcohol, 1atm oxidant, 80 C, 48 hours. % conversion to the alcohol and % selectivity with respect to benzaldehyde calculated using 1H NMR.
Table 4.6. The benzyl alcohol oxidation in presence of radical quencher.
Entry Catalyst Radical Inhibitor
Conversion (%) Selectivity (%)
1 50wt% PGc --- 21.2 >99
2 50wt% PGc BHT 22.2 98.6
Reaction conditions: 50mg PGc catalyst, 100mg of alcohol, 0.3mLacetonitrile, 1atm O2, 80C, 24 hours. 0.1mmol of butylated hydroxytoluene (BHT) is added in entry 2 for controlled reaction. % conversion for alcohols and % selectivity to benzaldehyde is calculated using 1HNMR.
To understand if free radical intermediates are involved during the PGc catalyzed
oxidation, we performed the benzyl alcohol oxidation reaction (PGc catalyst, 1 atm O2) in
the presence of butylated hydroxytoluene (BHT, 20 wt %), a known free radical quencher
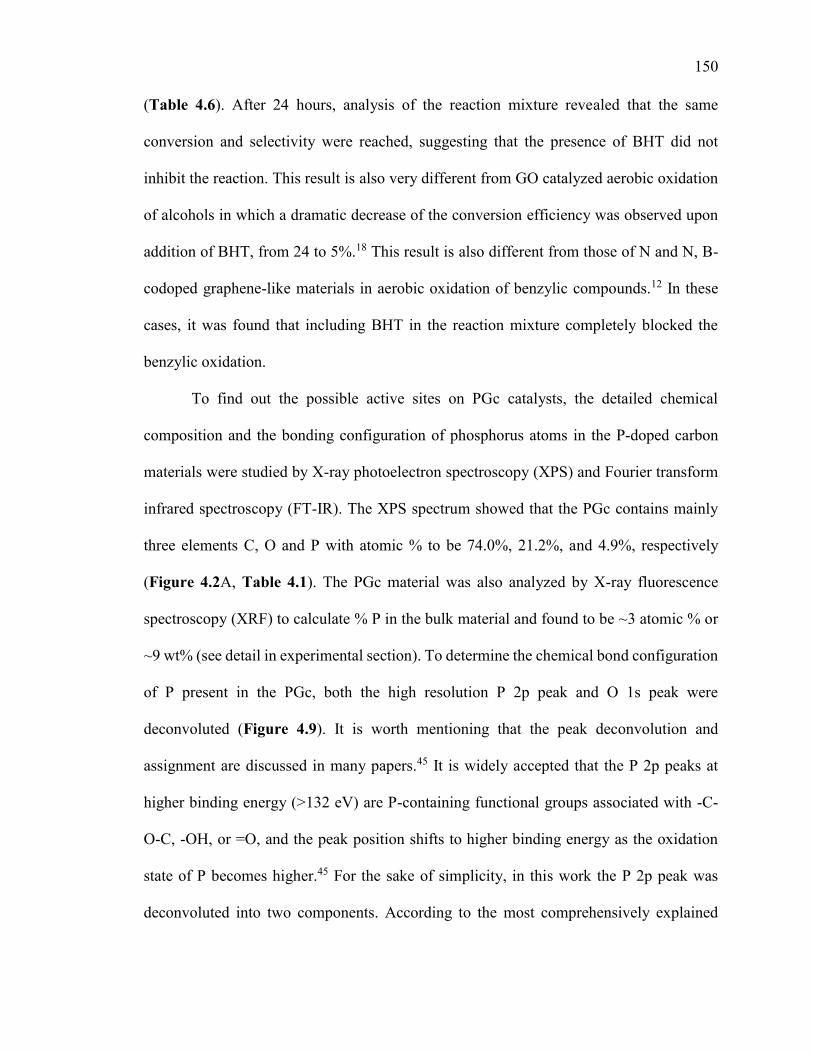
150
(Table 4.6). After 24 hours, analysis of the reaction mixture revealed that the same
conversion and selectivity were reached, suggesting that the presence of BHT did not
inhibit the reaction. This result is also very different from GO catalyzed aerobic oxidation
of alcohols in which a dramatic decrease of the conversion efficiency was observed upon
addition of BHT, from 24 to 5%.18 This result is also different from those of N and N, B-
codoped graphene-like materials in aerobic oxidation of benzylic compounds.12 In these
cases, it was found that including BHT in the reaction mixture completely blocked the
benzylic oxidation.
To find out the possible active sites on PGc catalysts, the detailed chemical
composition and the bonding configuration of phosphorus atoms in the P-doped carbon
materials were studied by X-ray photoelectron spectroscopy (XPS) and Fourier transform
infrared spectroscopy (FT-IR). The XPS spectrum showed that the PGc contains mainly
three elements C, O and P with atomic % to be 74.0%, 21.2%, and 4.9%, respectively
(Figure 4.2A, Table 4.1). The PGc material was also analyzed by X-ray fluorescence
spectroscopy (XRF) to calculate % P in the bulk material and found to be ~3 atomic % or
~9 wt% (see detail in experimental section). To determine the chemical bond configuration
of P present in the PGc, both the high resolution P 2p peak and O 1s peak were
deconvoluted (Figure 4.9). It is worth mentioning that the peak deconvolution and
assignment are discussed in many papers.45 It is widely accepted that the P 2p peaks at
higher binding energy (>132 eV) are P-containing functional groups associated with -C-
O-C, -OH, or =O, and the peak position shifts to higher binding energy as the oxidation
state of P becomes higher.45 For the sake of simplicity, in this work the P 2p peak was
deconvoluted into two components. According to the most comprehensively explained
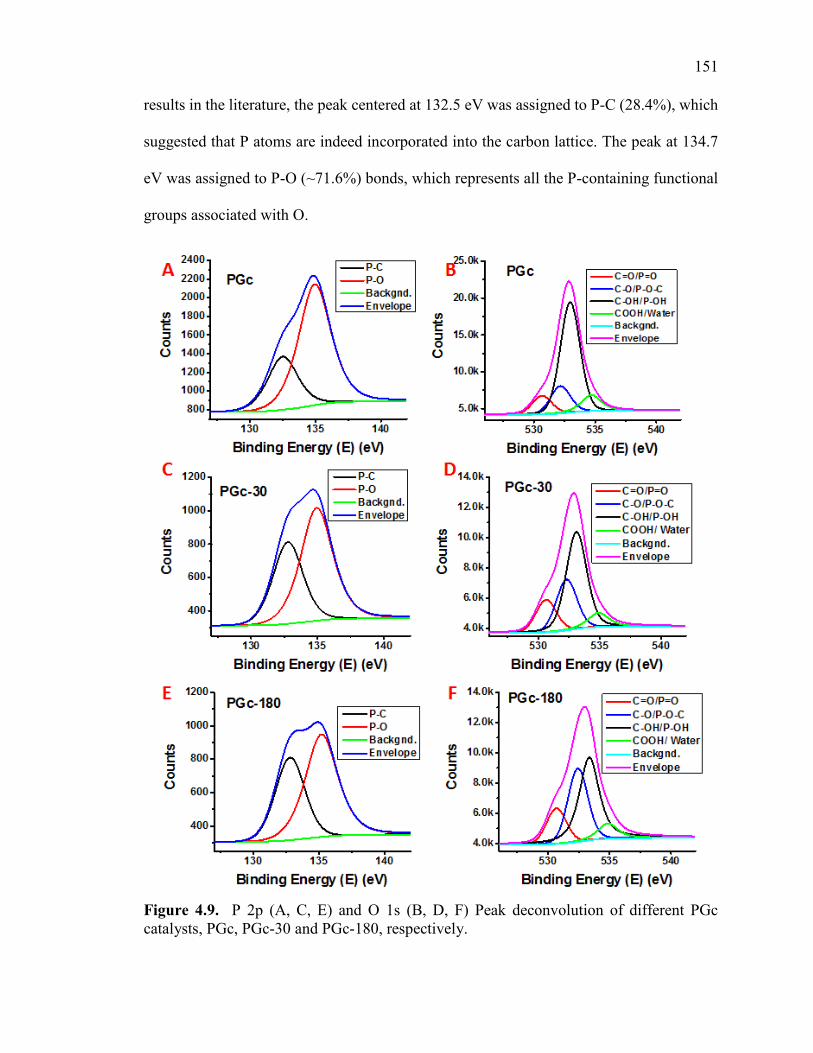
151
results in the literature, the peak centered at 132.5 eV was assigned to P-C (28.4%), which
suggested that P atoms are indeed incorporated into the carbon lattice. The peak at 134.7
eV was assigned to P-O (~71.6%) bonds, which represents all the P-containing functional
groups associated with O.
Figure 4.9. P 2p (A, C, E) and O 1s (B, D, F) Peak deconvolution of different PGc catalysts, PGc, PGc-30 and PGc-180, respectively.
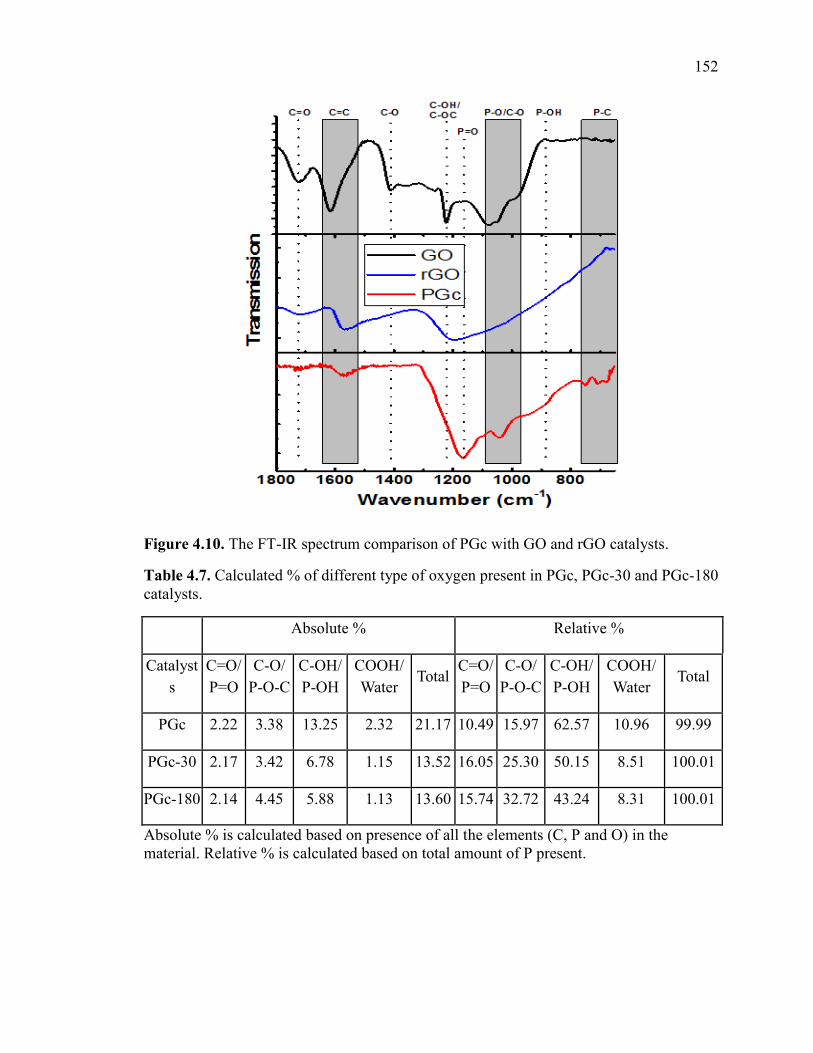
152
Figure 4.10. The FT-IR spectrum comparison of PGc with GO and rGO catalysts.
Table 4.7. Calculated % of different type of oxygen present in PGc, PGc-30 and PGc-180 catalysts.
Absolute % Relative %
Catalysts
C=O/P=O
C-O/ P-O-C
C-OH/ P-OH
COOH/Water
Total C=O/P=O
C-O/ P-O-C
C-OH/ P-OH
COOH/Water
Total
PGc 2.22 3.38 13.25 2.32 21.17 10.4λ 15.λ7 62.57 10.λ6 λλ.λλ
PGc-30 2.17 3.42 6.78 1.15 13.52 16.05 25.30 50.15 8.51 100.01
PGc-180 2.14 4.45 5.88 1.13 13.60 15.74 32.72 43.24 8.31 100.01
Absolute % is calculated based on presence of all the elements (C, P and O) in the material. Relative % is calculated based on total amount of P present.
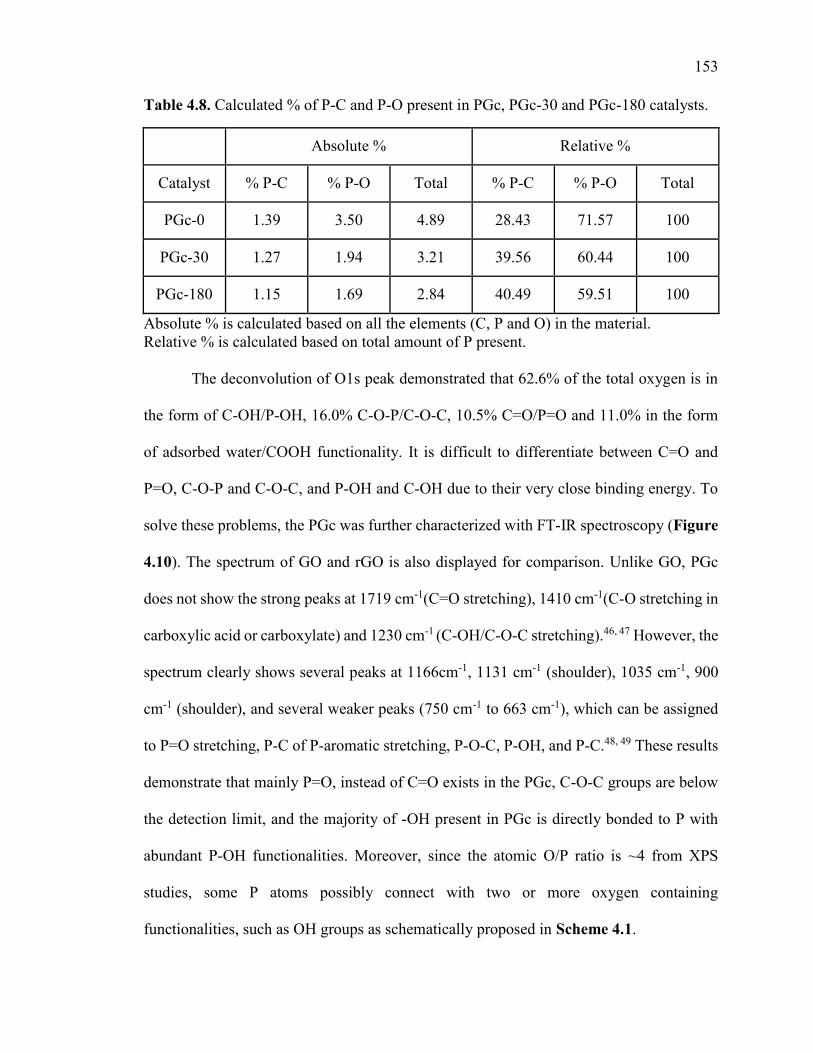
153
Table 4.8. Calculated % of P-C and P-O present in PGc, PGc-30 and PGc-180 catalysts.
Absolute % is calculated based on all the elements (C, P and O) in the material. Relative % is calculated based on total amount of P present.
The deconvolution of O1s peak demonstrated that 62.6% of the total oxygen is in
the form of C-OH/P-OH, 16.0% C-O-P/C-O-C, 10.5% C=O/P=O and 11.0% in the form
of adsorbed water/COOH functionality. It is difficult to differentiate between C=O and
P=O, C-O-P and C-O-C, and P-OH and C-OH due to their very close binding energy. To
solve these problems, the PGc was further characterized with FT-IR spectroscopy (Figure
4.10). The spectrum of GO and rGO is also displayed for comparison. Unlike GO, PGc
does not show the strong peaks at 1719 cm-1(C=O stretching), 1410 cm-1(C-O stretching in
carboxylic acid or carboxylate) and 1230 cm-1 (C-OH/C-O-C stretching).46, 47 However, the
spectrum clearly shows several peaks at 1166cm-1, 1131 cm-1 (shoulder), 1035 cm-1, 900
cm-1 (shoulder), and several weaker peaks (750 cm-1 to 663 cm-1), which can be assigned
to P=O stretching, P-C of P-aromatic stretching, P-O-C, P-OH, and P-C.48, 49 These results
demonstrate that mainly P=O, instead of C=O exists in the PGc, C-O-C groups are below
the detection limit, and the majority of -OH present in PGc is directly bonded to P with
abundant P-OH functionalities. Moreover, since the atomic O/P ratio is ~4 from XPS
studies, some P atoms possibly connect with two or more oxygen containing
functionalities, such as OH groups as schematically proposed in Scheme 4.1.
Absolute % Relative %
Catalyst % P-C % P-O Total % P-C % P-O Total
PGc-0 1.39 3.50 4.89 28.43 71.57 100
PGc-30 1.27 1.94 3.21 39.56 60.44 100
PGc-180 1.15 1.69 2.84 40.49 59.51 100
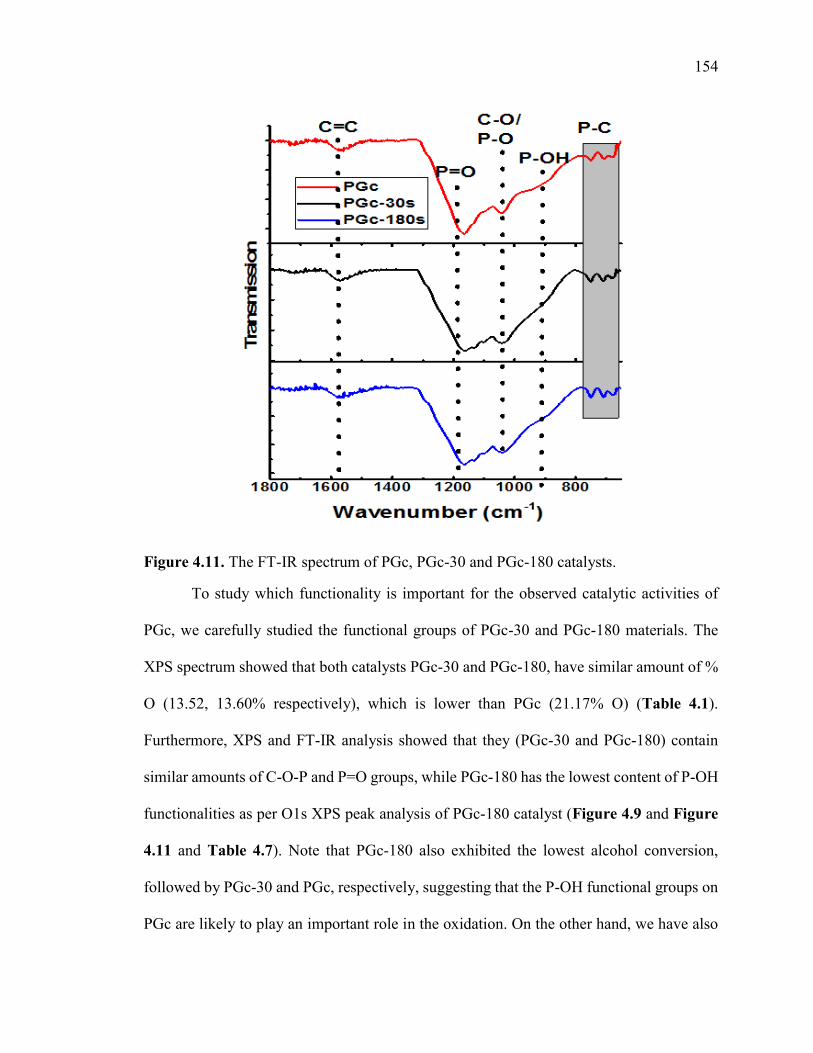
154
Figure 4.11. The FT-IR spectrum of PGc, PGc-30 and PGc-180 catalysts.
To study which functionality is important for the observed catalytic activities of
PGc, we carefully studied the functional groups of PGc-30 and PGc-180 materials. The
XPS spectrum showed that both catalysts PGc-30 and PGc-180, have similar amount of %
O (13.52, 13.60% respectively), which is lower than PGc (21.17% O) (Table 4.1).
Furthermore, XPS and FT-IR analysis showed that they (PGc-30 and PGc-180) contain
similar amounts of C-O-P and P=O groups, while PGc-180 has the lowest content of P-OH
functionalities as per O1s XPS peak analysis of PGc-180 catalyst (Figure 4.9 and Figure
4.11 and Table 4.7). Note that PGc-180 also exhibited the lowest alcohol conversion,
followed by PGc-30 and PGc, respectively, suggesting that the P-OH functional groups on
PGc are likely to play an important role in the oxidation. On the other hand, we have also
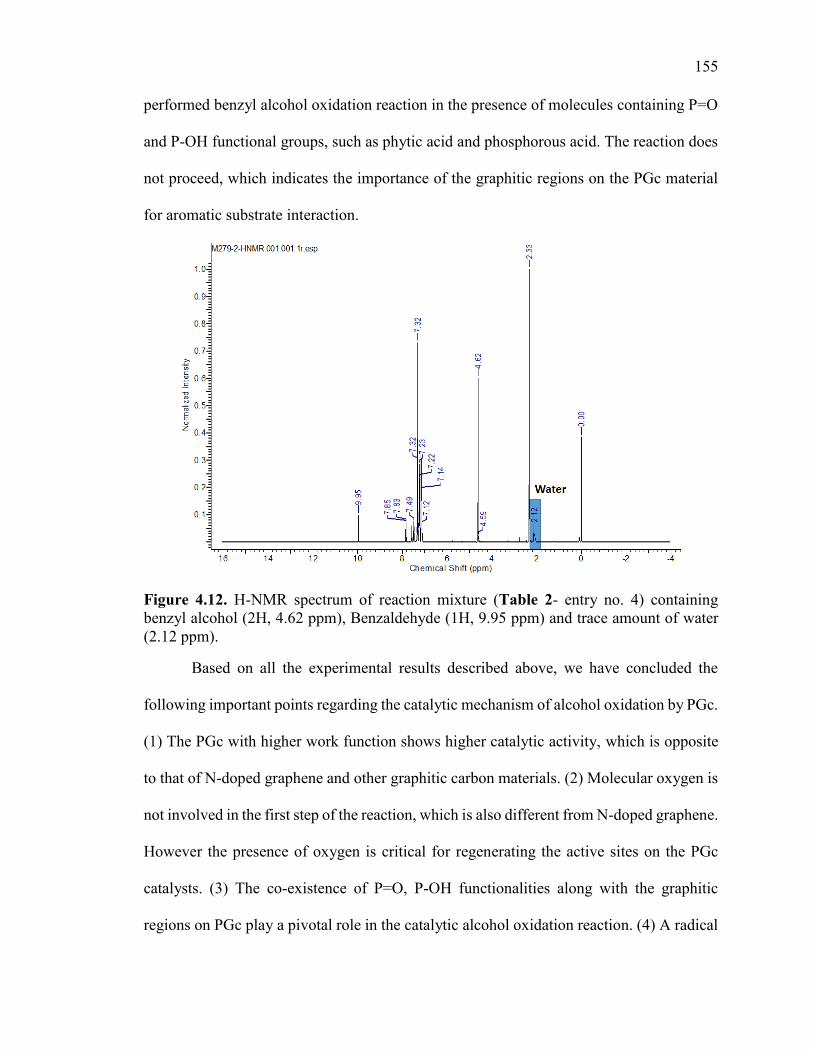
155
performed benzyl alcohol oxidation reaction in the presence of molecules containing P=O
and P-OH functional groups, such as phytic acid and phosphorous acid. The reaction does
not proceed, which indicates the importance of the graphitic regions on the PGc material
for aromatic substrate interaction.
Figure 4.12. H-NMR spectrum of reaction mixture (Table 2- entry no. 4) containing benzyl alcohol (2H, 4.62 ppm), Benzaldehyde (1H, 9.95 ppm) and trace amount of water (2.12 ppm).
Based on all the experimental results described above, we have concluded the
following important points regarding the catalytic mechanism of alcohol oxidation by PGc.
(1) The PGc with higher work function shows higher catalytic activity, which is opposite
to that of N-doped graphene and other graphitic carbon materials. (2) Molecular oxygen is
not involved in the first step of the reaction, which is also different from N-doped graphene.
However the presence of oxygen is critical for regenerating the active sites on the PGc
catalysts. (3) The co-existence of P=O, P-OH functionalities along with the graphitic
regions on PGc play a pivotal role in the catalytic alcohol oxidation reaction. (4) A radical
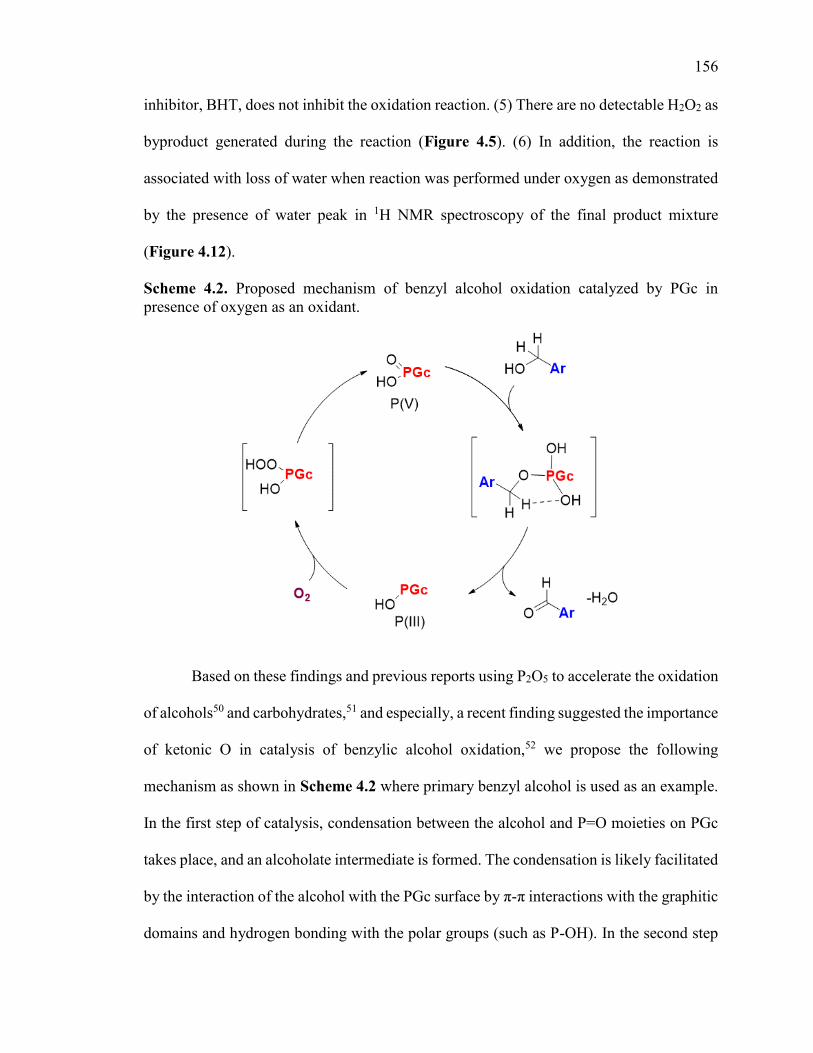
156
inhibitor, BHT, does not inhibit the oxidation reaction. (5) There are no detectable H2O2 as
byproduct generated during the reaction (Figure 4.5). (6) In addition, the reaction is
associated with loss of water when reaction was performed under oxygen as demonstrated
by the presence of water peak in 1H NMR spectroscopy of the final product mixture
(Figure 4.12).
Scheme 4.2. Proposed mechanism of benzyl alcohol oxidation catalyzed by PGc in presence of oxygen as an oxidant.
Based on these findings and previous reports using P2O5 to accelerate the oxidation
of alcohols50 and carbohydrates,51 and especially, a recent finding suggested the importance
of ketonic O in catalysis of benzylic alcohol oxidation,52 we propose the following
mechanism as shown in Scheme 4.2 where primary benzyl alcohol is used as an example.
In the first step of catalysis, condensation between the alcohol and P=O moieties on PGc
takes place, and an alcoholate intermediate is formed. The condensation is likely facilitated
by the interaction of the alcohol with the PGc surface by π-π interactions with the graphitic
domains and hydrogen bonding with the polar groups (such as P-OH). In the second step
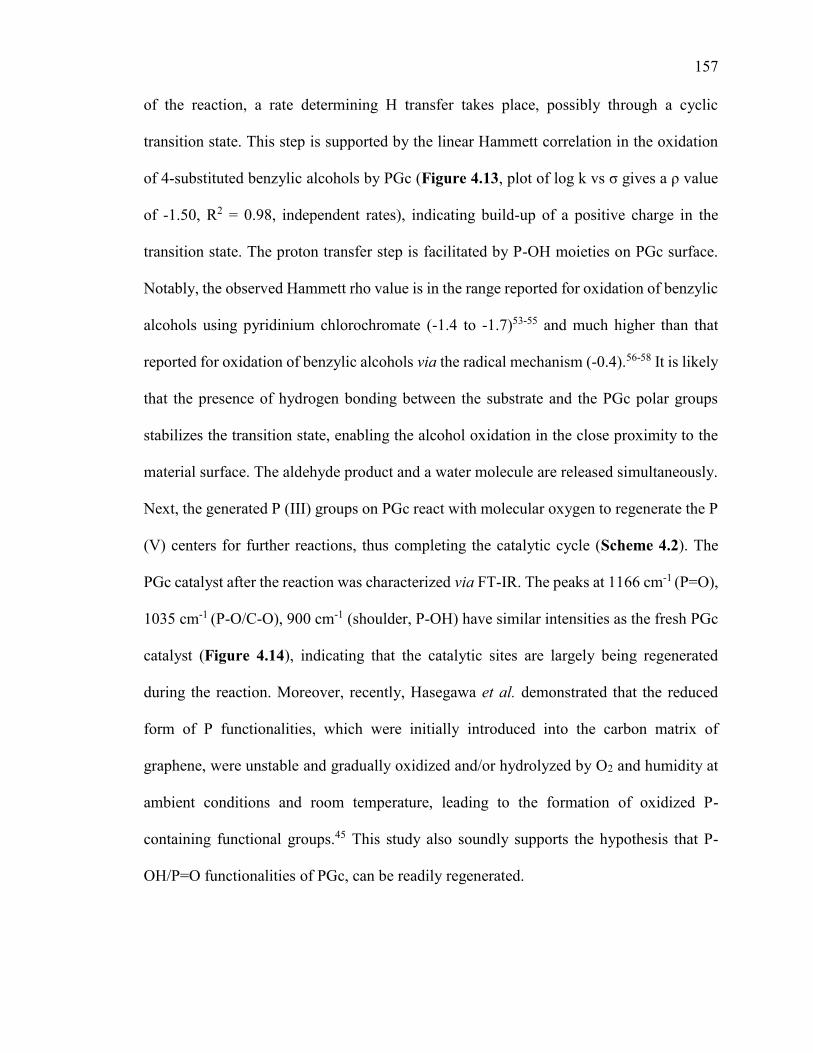
157
of the reaction, a rate determining H transfer takes place, possibly through a cyclic
transition state. This step is supported by the linear Hammett correlation in the oxidation
of 4-substituted benzylic alcohols by PGc (Figure 4.13, plot of log k vs σ gives a ρ value
of -1.50, R2 = 0.98, independent rates), indicating build-up of a positive charge in the
transition state. The proton transfer step is facilitated by P-OH moieties on PGc surface.
Notably, the observed Hammett rho value is in the range reported for oxidation of benzylic
alcohols using pyridinium chlorochromate (-1.4 to -1.7)53-55 and much higher than that
reported for oxidation of benzylic alcohols via the radical mechanism (-0.4).56-58 It is likely
that the presence of hydrogen bonding between the substrate and the PGc polar groups
stabilizes the transition state, enabling the alcohol oxidation in the close proximity to the
material surface. The aldehyde product and a water molecule are released simultaneously.
Next, the generated P (III) groups on PGc react with molecular oxygen to regenerate the P
(V) centers for further reactions, thus completing the catalytic cycle (Scheme 4.2). The
PGc catalyst after the reaction was characterized via FT-IR. The peaks at 1166 cm-1 (P=O),
1035 cm-1 (P-O/C-O), 900 cm-1 (shoulder, P-OH) have similar intensities as the fresh PGc
catalyst (Figure 4.14), indicating that the catalytic sites are largely being regenerated
during the reaction. Moreover, recently, Hasegawa et al. demonstrated that the reduced
form of P functionalities, which were initially introduced into the carbon matrix of
graphene, were unstable and gradually oxidized and/or hydrolyzed by O2 and humidity at
ambient conditions and room temperature, leading to the formation of oxidized P-
containing functional groups.45 This study also soundly supports the hypothesis that P-
OH/P=O functionalities of PGc, can be readily regenerated.
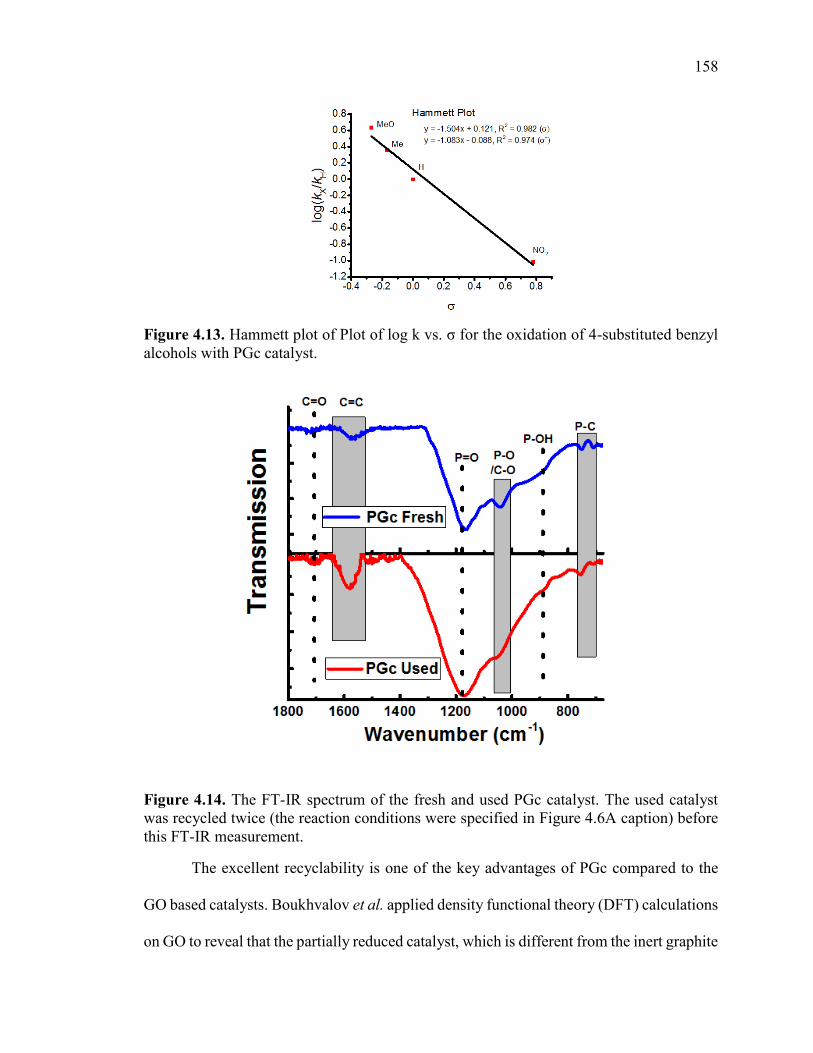
158
Figure 4.13. Hammett plot of Plot of log k vs. σ for the oxidation of 4-substituted benzyl alcohols with PGc catalyst.
Figure 4.14. The FT-IR spectrum of the fresh and used PGc catalyst. The used catalyst was recycled twice (the reaction conditions were specified in Figure 4.6A caption) before this FT-IR measurement.
The excellent recyclability is one of the key advantages of PGc compared to the
GO based catalysts. Boukhvalov et al. applied density functional theory (DFT) calculations
on GO to reveal that the partially reduced catalyst, which is different from the inert graphite
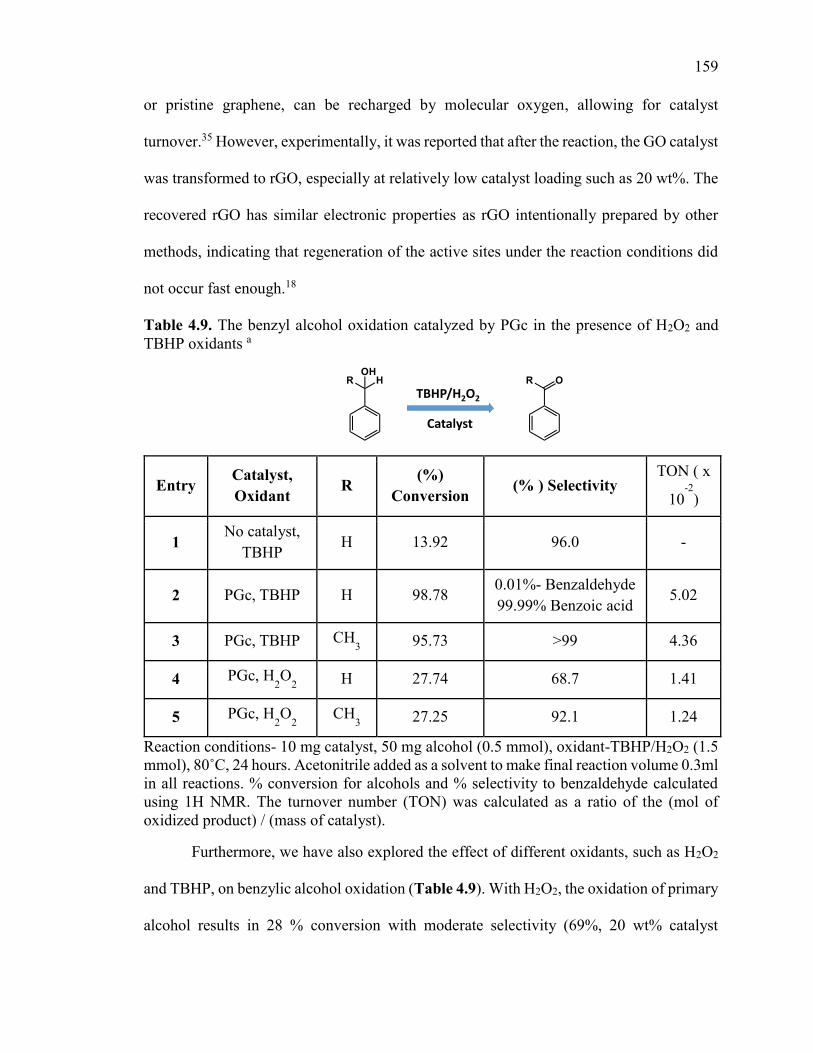
159
or pristine graphene, can be recharged by molecular oxygen, allowing for catalyst
turnover.35 However, experimentally, it was reported that after the reaction, the GO catalyst
was transformed to rGO, especially at relatively low catalyst loading such as 20 wt%. The
recovered rGO has similar electronic properties as rGO intentionally prepared by other
methods, indicating that regeneration of the active sites under the reaction conditions did
not occur fast enough.18
Table 4.9. The benzyl alcohol oxidation catalyzed by PGc in the presence of H2O2 and TBHP oxidants a
Entry Catalyst, Oxidant R
(%) Conversion
(% ) Selectivity TON ( x
10-2
)
1 No catalyst,
TBHP H 13.λ2 λ6.0 -
2 PGc, TBHP H λ8.78 0.01%- Benzaldehyde λλ.λλ% Benzoic acid
5.02
3 PGc, TBHP CH3 λ5.73 >λλ 4.36
4 PGc, H2O
2 H 27.74 68.7 1.41
5 PGc, H2O
2 CH
3 27.25 λ2.1 1.24
Reaction conditions- 10 mg catalyst, 50 mg alcohol (0.5 mmol), oxidant-TBHP/H2O2 (1.5 mmol), 80˚C, 24 hours. Acetonitrile added as a solvent to make final reaction volume 0.3ml in all reactions. % conversion for alcohols and % selectivity to benzaldehyde calculated using 1H NMR. The turnover number (TON) was calculated as a ratio of the (mol of oxidized product) / (mass of catalyst).
Furthermore, we have also explored the effect of different oxidants, such as H2O2
and TBHP, on benzylic alcohol oxidation (Table 4.9). With H2O2, the oxidation of primary
alcohol results in 28 % conversion with moderate selectivity (69%, 20 wt% catalyst
TBHP/H2O2
Catalyst
160
loading). Which also suggests that presence of H2O2 is affecting the selectivity of aldehyde
products. Interestingly, when the oxidant is switched to TBHP, even at relatively low
catalyst loading (20 wt %), the conversion of both primary and secondary benzylic alcohol
reaches ≥λ5%. However, the product for the oxidation of the primary benzylic alcohol is
benzoic acid instead of benzaldehyde (100% selectivity) possibly due to the faster
oxidation of aldehyde to acid in the presence of a strong oxidant (TBHP).
4.3. Conclusions
In summary, we have reported an extremely simple, energy effective, and scalable
approach to rapidly fabricate P-doped carbon materials with controlled P bond
configuration. For the first time, we demonstrated that the P-doped carbon materials can
be used as a selective metal free catalyst for aerobic oxidation of benzylic alcohols with
>98% selectivity to benzaldehydes. The P bond configuration influences the work function
of P-doped carbon materials. However, in sharp contrast to N-doped graphene and other
graphitic carbon materials, the PGc material with higher work function shows high activity
in catalytic aerobic oxidation. Based on our extensive experimental studies, a unique
catalytic mechanism seem to be operating when PGc catalysts are used, which is different
from both GO and N-doped graphene obtained by high temperature nitrification. While the
apparent conversion is similar to GO, the key advantage compared to GO is that this
catalyst, even with low catalyst loading, can be reused multiple times with simple filtration
without losing its catalytic activity. Compared to the N-doped graphene, not only the
conversion increased 3 times without losing selectivity, this catalyst also shows no steric
effect as both primary and secondary alcohol can be converted with similar conversion
efficiency. Finally, while our study focused on alcohol oxidation, it is also worthy to
161
mentioning that phosphate functionalized carbon materials have been used for acidic
catalytic reactions,59 to increase the selectivity of the oxidative dehydration reactions,60 and
widen the electrochemical potential window in high capacitance applications.61 All these
are due to the different P bond configuration in these carbon materials, which in turn
demonstrated the rich P chemistry can be tailored to fit different applications. Importantly,
we have already demonstrated that P carbon materials co-doped with other heteroatoms,
such as N, B, S, and Si can also be fabricated by this microwave assisted approach by
simply adding a suitable dopant precursor into the reactor.62 Altogether, these facts
combined with the capability of co-doping with other heteroatoms via this simple
microwave assisted approach, it is reasonable to predict that tailored carbon materials can
be designed and quickly fabricated to develop more efficient and metal free carbon based
catalysts for wide range of reactions and other sustainable applications.
4.4. Experimental Section
4.4.1. PGc (Phosphorus doped graphitic carbon) fabrication
The phytic acid (Sigma Aldrich, 50 w/w% in water, 1 mL) was placed in 35 mL Pyrex
glass vessel (CEM, #909036) and then closed with Teflon lined cap (CEM, #909235). This
closed glass vessel was kept in 500 mL beaker and then the whole assembly was covered
with watch glass before transferring to a domestic microwave oven (1100 W, Sanyo-EM-
S9515W, 2.45 GHz). A microwave irradiation was applied for 40 seconds which results
into black carbonized material. After microwave treatment, the glass tube was left in a
fume hood for a few minutes to remove any gas generated during microwave reaction and
then dispersed in ethanol by bath sonication (5 minutes). The resulting dispersion is filtered
by 0.8 m polycarbonate filter paper (Millipore, ATTP 04700) and washed with water
162
(~800 mL) and ethanol (~400 mL). After filtration, the product was dried in vacuum oven
at ~110C overnight before further use. The yield of product (PGc) was calculated to be
~12% by the weight of pure phytic acid or ~90% by weight of carbon present in phytic
acid. Note: The above fabrication reaction can be also carried out in single mode cavity
using commercial CEM microwave (CEM Discover SP, 300 Watts). This microwave unit
provides much higher energy density than domestic microwave and so PGc can be
synthesized in shorter time (30 seconds at 300 watts) than domestic microwave. It is also
worthy to mention that the bulk price of phytic acid is $0.03 per gram, which is much
cheaper compared to GO (~$200 per gram) and it is also sustainable for synthesis of P
doped carbon materials.
4.4.2. Fabrication of PGc-30 and PGc-180
The PGc powder was further heated in the same microwave oven with additional
microwave irradiation of total 30s and 180s, respectively. In detail, ~100 mg of PGc
powder weighed into small porcelain dish and covered with a piece of watch glass before
transferring into the domestic microwave chamber. The microwave radiation was applied
in pulse of 10 seconds for different times with a 10-15 minute interval between two
microwave pulses to avoid over heating or burning of the carbon material. For example, to
synthesize PGc-180, 10 seconds of microwave radiation was repeated for 18 times with
10-15 minutes interval in between each microwave pulse.
4.4.3. Synthesis of GO and rGO for catalysis
GO is synthesized according to Hummer’s method with slight modification.63 In brief, the
graphite powder (2 g, Sigma Aldrich, <20 m) is mixed with 55 mL sulfuric acid
(PHARMCO-AAPER, ACS grade 95-98%) and stirred in ice bath for 15min. After that we
163
added 12 mL nitric acid (BDH, ACS grade 69-70%) and again stirred in ice bath for
additional 15 minute to cool down the mixture. Then we added 10 g of KMnO4 (10 g,
Sigma Aldrich, ACS grade) in a small portions while stirring the mixture in ice bath. After
2 hours of stirring in ice bath, the mixture was stirred in water bath at 45 oC for 6 hours to
complete the oxidation of graphite. After Reaction was completed, it was quenched in 500
mL ice containing 10 mL of H2O2 (BDH, 35 w/w %) and filtered using what man filter
paper (grade 5, 47 mm). Then the brown solid powder was resuspended in ~4% HCl and
washed with it for 5 times by centrifugation at 8000 rpm * 30 minutes. After that it was
washed with acetone for 10 times at 10000 rpm* 45 minutes of centrifugation and then
dried in vacuum oven for 3 days before further use.
To synthesize rGO, 500 mg of GO was taken in the round bottom flask and then
heated with microwave of 300 Watt (CEM discover SP) for 40secs. The brown colored GO
powder was converted to black colored reduced graphene oxide (rGO) which was used as
a control in catalytic reaction of benzyl alcohol oxidation to benzaldehyde in water solvent.
4.4.4. Catalytic oxidation of primary and secondary alcohol Reaction.
All the chemicals were used as received for catalytic reaction. Benzyl Alcohol (Millipore,
≥λλ%) and DL-sec-phenyl ethyl alcohol (Acros Organics, ≥λ7%), Cyclohexane methanol
(Alfa Aesar, 99%), n butanol (anhydrous, Sigma Aldrich, 99.8%), 4-methoxybenzyl
alcohol (TCI, >98%), 4-methylbenzyl alcohol (Sigma Aldrich, 98%), 4-nitrobenzyl alcohol
(Alfa Aesar, 99%), Toluene (anhydrous, Sigma Aldrich, 99.8%) Ethyl benzene (Alfa
Aesar, 99%), tert-butyl hydroperoxide (TBHP) (Alfa Aesar, 70%), H2O2 (BDH, 35% w/w).
Alcohol oxidation in water: The aerobic oxidation reactions were carried out in a round
bottom flask or 35ml reaction tube (depending on the size of the reaction) by stirring water,
164
alcohol and catalyst under 1atm oxygen environment (using oxygen balloon). The detailed
experimental condition and the amount of reagent and catalyst are specified in Table 4.2
footnote. After the reaction is completed, reaction mixture is filtered via 0.02 m syringe
filter and analyzed by HPLC (Varian Pro-Star and Phenomenex C18 column, mobile phase
50:50 ratio of Methanol: 0.44% Acetic acid). For kinetic studies, the experiment was
carried out at different temperatures. During each of the experiments, ~0.3 mL of aliquot
was withdrawn at a regular interval of 15 minutes, filtered via 0.02 m syringe filter and
analyzed by HPLC.
Solvent free alcohol oxidation: In a typical reaction, benzyl alcohol was purged with
oxygen for 10 minutes prior to mixing with a specified amount of catalyst (as mentioned
in Table 4.3) in a microwave reaction vial (VWR, 10-20 mL, #89079-402) and sealed with
PTFE faced aluminum cap. The reaction vial was heated in oil bath at specified temperature
and time. For controlled experiment, nitrogen gas was used instead of oxygen. For control
experiment with a radical inhibitor, BHT (Butylated hydroxytoluene), specified amount of
BHT and acetonitrile (for maintaining uniform dispersion of BHT) was added to the above
described mixture in the beginning of the reaction. For alcohol oxidation using TBHP or
H2O2 as oxidant, TBHP or H2O2 was mixed with the specific alcohol and catalysts and then
sealed in ambient environment. The experimental condition and the amount of the reactant
and catalysts are specified in the table footnote. For control experiment using P-OH
functional containing molecules (such as phytic acid or phosphoric acid) as a catalyst, we
have mixed 1 mmol of benzyl alcohol and catalyst such that mmols of P-OH functional
group comes to 1.2 mmols and heated under 80 ˚C for 48 hours under 1atm O2. After
completion of the reaction, ~0.7 mL of CDCl3 was mixed with the reaction mixture and
165
filtered via 0.02 m syringe filter and analyzed by 1H NMR spectroscopy (Bruker
Avalanche 500 MHz).
4.4.5. Material Characterization
PF-KPFM measurements of the PGc and PGc-180 catalysts were conducted using a
Dimension ICON AFM setup inside a nitrogen-filled glove box where both H2O and O2
level were below 0.1 ppm. The tips used were PFQNE-AL (Bruker AFM Probes),
composed of a silicon nitride cantilever with a sharp silicon tip. The morphology of
graphene samples were studied using the scanning electron microscopy (SEM, Hitachi S-
4800). The sample for SEM was prepared by directly adding the powder sample on a
conductive carbon tape. X-ray photoelectron spectroscopy (XPS) characterization was
performed after depositing a layer of the catalyst to be studied onto a Si substrate. The
thickness of the film on the substrates was roughly 30–50 nm. XPS spectra were acquired
using a Thermo Scientific K-Alpha system with a monochromatic Al Kα x-ray source (h
= 1486.7 eV). For data analysis, Smart background subtraction was performed, and the
spectra were fit with Gaussian/Lorentzian peaks using a minimum deviation curve fitting
method (part of the Avantage software package). The surface composition of each species
was determined by the integrated peak areas and the Scofield sensitivity factor provided
by the Avantage software. The FT-IR spectra of the samples (thin films deposited on ZnSe
windows) were acquired with a Thermo-Nicolet 6700 spectrometer (Thermo-Electron
Corp., Madison, WI), using a sample shuttle and a mercury-cadmium-telluride (MCT)
detector. Four blocks of 128 scans each were co-added with 4 cm-1 spectral resolution and
two levels of zero-filling so that data was encoded every 1 cm-1. Thermogravimetric
analyses (TGA) of the PGc samples were performed on a TGA instrument (TA
166
instruments, Discovery TGA) under N2 atmosphere. ~5 mg sample was loaded on to TGA
platinum HT pan and kept at 40 °C for 5 minutes before each analysis. After 5 minutes, the
temperature is increased from 40˚C to λ00˚C at 5˚C/min under N2 flow (20 ml/min). The
Raman spectra of the PGc and other samples (deposited on Anodisc membrane) were
collected using Raman Microscope (Confocal) – Wi-Tec, Alpha 3000R with an excitation
laser at 785 nm. The X-ray fluorescence spectroscopic (XRF) measurement was carried
out using Horiba XGT-1000WR with high purity Si detector.
The Surface area measurement by Brunauer-Emmett-Teller (BET) method:
The surface areas of the PGc catalyst was determined using a 12-point BET method
(Micromeritics, ASAP 2020) and nitrogen as the adsorbate using.64 After the BET
measurements, the isotherms of these measurement are converted into BET plots as shown
in Figure 4.2D and then the specific surface area of the catalyst was calculated using the
value of the slope and intercept of the linear best fit line and below BET equation.64
[ 0/ − ] = � −mc (
0) + �m�
Here, is adsorbed gas quantity, mis monolayer quantity of adsorbed gas, c is the BET
constant, P and P0 are the equilibrium and the saturation pressure of adsorbates at the
temperature of adsorption, respectively. The Calculated surface area of the PGc catalyst is
1260 m2/g.
PF-KPFM measurement of PGc catalysts:
To understand the mechanism of the alcohol oxidation reaction catalyzed by PGc materials,
we have conducted a PeakForce Kelvin probe force microscopy (PF-KPFM™). PF-
KPFM™, the combination of PeakForce Tapping mode and frequency modulated KPFM
167
(FM-KPFM), integrates the benefits and capabilities of PeakForce Tapping and the
superior spatial resolution and accuracy of FM-KPFM. PF-KPFM has the best performance
of KPFM working in a dual-pass fashion.65 By using KPFM, one can measure the local
surface potential of nanoscale materials, concurrently imaging their topography. Since
KPFM measures the voltage required to nullify the work function (φ) difference between
the conductive tip and the sample (φtip – φsample) or vice versa (depending on whether the
potential was applied to the sample or the probe), the contrast in the contact potential
difference (CPD) is equivalent to the local work function variation of the sample on a
supporting substrate. So the local surface potential can be used to calculate the work
function of the materials, if the work function of the tip is known. KPFM has been widely
used to investigate the influence of dopants or atomic scale defects on the variation of work
function. It has also been used to study the work function of graphene as a function of
number of layers and heteroatomic doping.66-68
PF-KPFM measurements on the PGc materials were conducted with a Dimension
ICON AFM setup inside an Argon-filled glove box where both H2O and O2 levels were
below 0.1 ppm. The probes used were PFQNE-AL (Bruker AFM Probes), composed of a
silicon nitride cantilever with a sharp silicon tip. The inert environment helped us to obtain
more accurate measurements, since the dipole moment of any absorbed species can directly
induce a difference in contact potential and, subsequently, a phase shift of our samples.69
To ascertain the accuracy of our surface potential measurements, the CPD measurement
was first conducted for a piece of freshly cleaved highly ordered pyrolytic graphite (HOPG)
in the glove box. The average CPD value of 0.60 V (with the standard deviation of 0.02 V)
was obtained from the measurements at four different spots on the same HOPG. Knowing
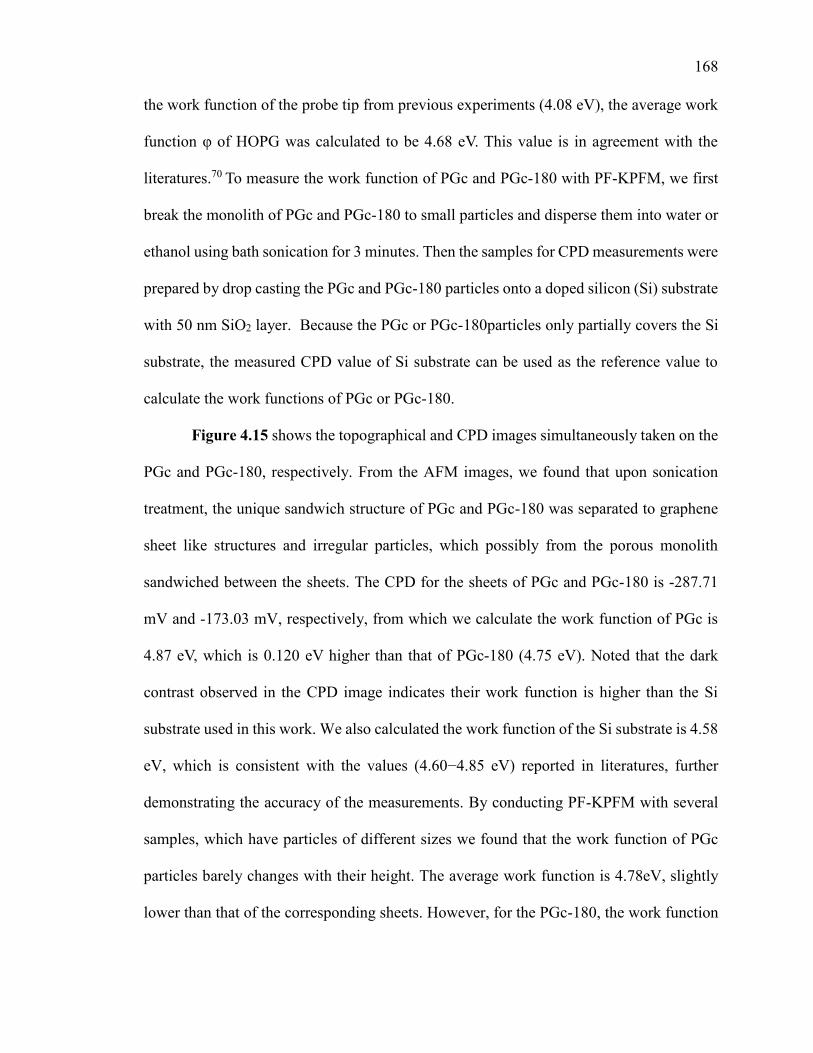
168
the work function of the probe tip from previous experiments (4.08 eV), the average work
function φ of HOPG was calculated to be 4.68 eV. This value is in agreement with the
literatures.70 To measure the work function of PGc and PGc-180 with PF-KPFM, we first
break the monolith of PGc and PGc-180 to small particles and disperse them into water or
ethanol using bath sonication for 3 minutes. Then the samples for CPD measurements were
prepared by drop casting the PGc and PGc-180 particles onto a doped silicon (Si) substrate
with 50 nm SiO2 layer. Because the PGc or PGc-180particles only partially covers the Si
substrate, the measured CPD value of Si substrate can be used as the reference value to
calculate the work functions of PGc or PGc-180.
Figure 4.15 shows the topographical and CPD images simultaneously taken on the
PGc and PGc-180, respectively. From the AFM images, we found that upon sonication
treatment, the unique sandwich structure of PGc and PGc-180 was separated to graphene
sheet like structures and irregular particles, which possibly from the porous monolith
sandwiched between the sheets. The CPD for the sheets of PGc and PGc-180 is -287.71
mV and -173.03 mV, respectively, from which we calculate the work function of PGc is
4.87 eV, which is 0.120 eV higher than that of PGc-180 (4.75 eV). Noted that the dark
contrast observed in the CPD image indicates their work function is higher than the Si
substrate used in this work. We also calculated the work function of the Si substrate is 4.58
eV, which is consistent with the values (4.60−4.85 eV) reported in literatures, further
demonstrating the accuracy of the measurements. By conducting PF-KPFM with several
samples, which have particles of different sizes we found that the work function of PGc
particles barely changes with their height. The average work function is 4.78eV, slightly
lower than that of the corresponding sheets. However, for the PGc-180, the work function
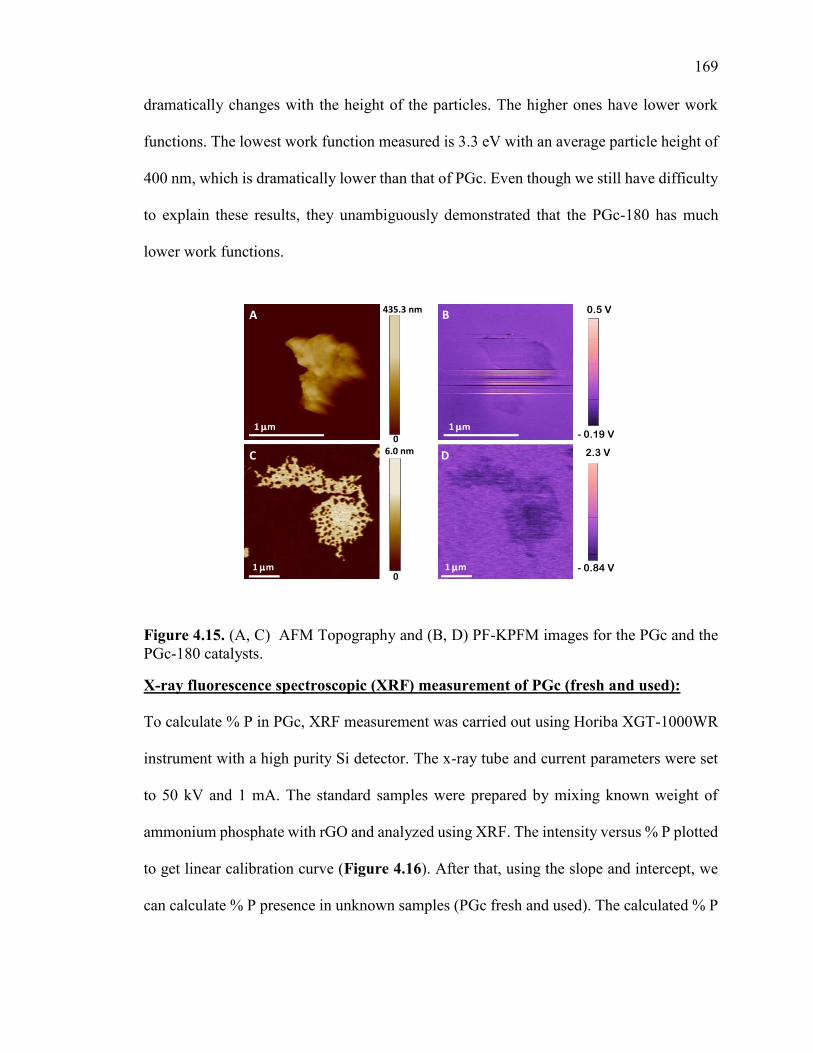
169
dramatically changes with the height of the particles. The higher ones have lower work
functions. The lowest work function measured is 3.3 eV with an average particle height of
400 nm, which is dramatically lower than that of PGc. Even though we still have difficulty
to explain these results, they unambiguously demonstrated that the PGc-180 has much
lower work functions.
Figure 4.15. (A, C) AFM Topography and (B, D) PF-KPFM images for the PGc and the PGc-180 catalysts.
X-ray fluorescence spectroscopic (XRF) measurement of PGc (fresh and used):
To calculate % P in PGc, XRF measurement was carried out using Horiba XGT-1000WR
instrument with a high purity Si detector. The x-ray tube and current parameters were set
to 50 kV and 1 mA. The standard samples were prepared by mixing known weight of
ammonium phosphate with rGO and analyzed using XRF. The intensity versus % P plotted
to get linear calibration curve (Figure 4.16). After that, using the slope and intercept, we
can calculate % P presence in unknown samples (PGc fresh and used). The calculated % P
6.0 nm
0
0
435.3 nm 0.5 V
- 0.19 V
- 0.84 V
2.3 V
1 mm
1 mm
1 mm
1 mm
A B
C D
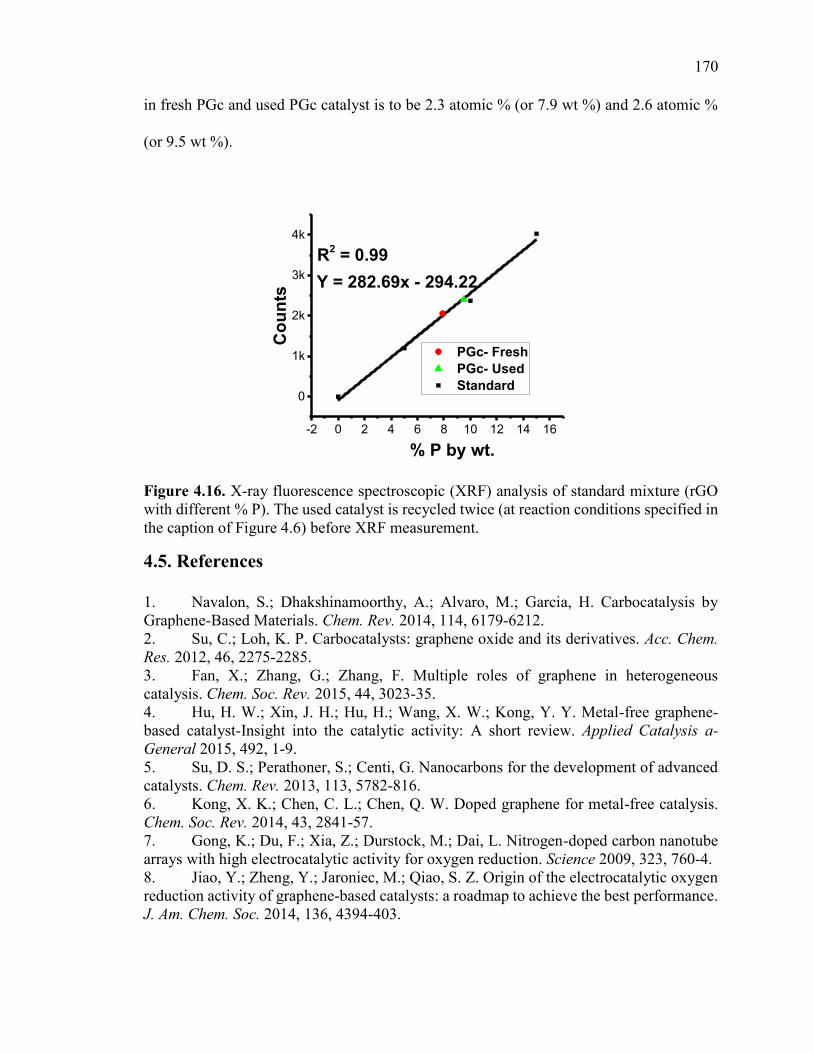
170
in fresh PGc and used PGc catalyst is to be 2.3 atomic % (or 7.9 wt %) and 2.6 atomic %
(or 9.5 wt %).
Figure 4.16. X-ray fluorescence spectroscopic (XRF) analysis of standard mixture (rGO with different % P). The used catalyst is recycled twice (at reaction conditions specified in the caption of Figure 4.6) before XRF measurement.
4.5. References
1. Navalon, S.; Dhakshinamoorthy, A.; Alvaro, M.; Garcia, H. Carbocatalysis by Graphene-Based Materials. Chem. Rev. 2014, 114, 6179-6212. 2. Su, C.; Loh, K. P. Carbocatalysts: graphene oxide and its derivatives. Acc. Chem.
Res. 2012, 46, 2275-2285. 3. Fan, X.; Zhang, G.; Zhang, F. Multiple roles of graphene in heterogeneous catalysis. Chem. Soc. Rev. 2015, 44, 3023-35. 4. Hu, H. W.; Xin, J. H.; Hu, H.; Wang, X. W.; Kong, Y. Y. Metal-free graphene-based catalyst-Insight into the catalytic activity: A short review. Applied Catalysis a-
General 2015, 492, 1-9. 5. Su, D. S.; Perathoner, S.; Centi, G. Nanocarbons for the development of advanced catalysts. Chem. Rev. 2013, 113, 5782-816. 6. Kong, X. K.; Chen, C. L.; Chen, Q. W. Doped graphene for metal-free catalysis. Chem. Soc. Rev. 2014, 43, 2841-57. 7. Gong, K.; Du, F.; Xia, Z.; Durstock, M.; Dai, L. Nitrogen-doped carbon nanotube arrays with high electrocatalytic activity for oxygen reduction. Science 2009, 323, 760-4. 8. Jiao, Y.; Zheng, Y.; Jaroniec, M.; Qiao, S. Z. Origin of the electrocatalytic oxygen reduction activity of graphene-based catalysts: a roadmap to achieve the best performance. J. Am. Chem. Soc. 2014, 136, 4394-403.
-2 0 2 4 6 8 10 12 14 16
0
1k
2k
3k
4k
% P by wt.
PGc- Fresh
PGc- Used
Standard
Co
un
ts
R2 = 0.99
Y = 282.69x - 294.22
171
9. Zhang, C.; Mahmood, N.; Yin, H.; Liu, F.; Hou, Y. Synthesis of phosphorus-doped graphene and its multifunctional applications for oxygen reduction reaction and lithium ion batteries. Adv. Mater. 2013, 25, 4932-7. 10. Patel, M.; Feng, W.; Savaram, K.; Khoshi, M. R.; Huang, R.; Sun, J.; Rabie, E.; Flach, C.; Mendelsohn, R.; Garfunkel, E.; He, H. Microwave Enabled One-Pot, One-Step Fabrication and Nitrogen Doping of Holey Graphene Oxide for Catalytic Applications. Small 2015, 11, 3358-68. 11. Su, C.; Acik, M.; Takai, K.; Lu, J.; Hao, S. J.; Zheng, Y.; Wu, P.; Bao, Q.; Enoki, T.; Chabal, Y. J.; Loh, K. P. Probing the catalytic activity of porous graphene oxide and the origin of this behaviour. Nat Commun 2012, 3, 1298. 12. Dhakshinamoorthy, A.; Primo, A.; Concepcion, P.; Alvaro, M.; Garcia, H. Doped Graphene as a Metal-Free Carbocatalyst for the Selective Aerobic Oxidation of Benzylic Hydrocarbons, Cyclooctane and Styrene. Chemistry-a European Journal 2013, 19, 7547-7554. 13. Li, X. H.; Chen, J. S.; Wang, X.; Sun, J.; Antonietti, M. Metal-free activation of dioxygen by graphene/g-C3N4 nanocomposites: functional dyads for selective oxidation of saturated hydrocarbons. J. Am. Chem. Soc. 2011, 133, 8074-7. 14. Li, X. H.; Antonietti, M. Polycondensation of boron- and nitrogen-codoped holey graphene monoliths from molecules: carbocatalysts for selective oxidation. Angew. Chem.
Int. Ed. Engl. 2013, 52, 4572-6. 15. Gao, Y.; Hu, G.; Zhong, J.; Shi, Z.; Zhu, Y.; Su, D. S.; Wang, J.; Bao, X.; Ma, D. Nitrogen‐Doped sp2‐Hybridized Carbon as a Superior Catalyst for Selective Oxidation. Angew. Chem. Int. Ed. 2013, 52, 2109-2113. 16. Jia, H. P.; Dreyer, D. R.; Bielawski, C. W. Graphite Oxide as an Auto-Tandem Oxidation-Hydration-Aldol Coupling Catalyst. Adv. Synth. Catal. 2011, 353, 528-532. 17. Jia, H. P.; Dreyer, D. R.; Bielawski, C. W. C-H oxidation using graphite oxide. Tetrahedron 2011, 67, 4431-4434. 18. Dreyer, D. R.; Jia, H. P.; Bielawski, C. W. Graphene oxide: a convenient carbocatalyst for facilitating oxidation and hydration reactions. Angew. Chem. Int. Ed.
Engl. 2010, 49, 6813-6. 19. Li, W. J.; Gao, Y. J.; Chen, W. L.; Tang, P.; Li, W. Z.; Shi, Z. J.; Su, D. S.; Wang, J. G.; Ma, D. Catalytic Epoxidation Reaction over N-Containing sp(2) Carbon Catalysts. Acs Catalysis 2014, 4, 1261-1266. 20. Long, J. L.; Xie, X. Q.; Xu, J.; Gu, Q.; Chen, L. M.; Wang, X. X. Nitrogen-Doped Graphene Nanosheets as Metal-Free Catalysts for Aerobic Selective Oxidation of Benzylic Alcohols. Acs Catalysis 2012, 2, 622-631. 21. Khai, T. V.; Na, H. G.; Kwak, D. S.; Kwon, Y. J.; Ham, H.; Shim, K. B.; Kim, H. W. Significant enhancement of blue emission and electrical conductivity of N-doped graphene. J. Mater. Chem. 2012, 22, 17992-18003. 22. Wang, X.; Sun, G.; Routh, P.; Kim, D.-H.; Huang, W.; Chen, P. Heteroatom-doped graphene materials: syntheses, properties and applications. Chem. Soc. Rev. 2014, 43, 7067-7098. 23. Yang, D. S.; Bhattacharjya, D.; Inamdar, S.; Park, J.; Yu, J. S. Phosphorus-Doped Ordered Mesoporous Carbons with Different Lengths as Efficient Metal-Free Electrocatalysts for Oxygen Reduction Reaction in Alkaline Media. J. Am. Chem. Soc.
2012, 134, 16127-16130.
172
24. Some, S.; Kim, J.; Lee, K.; Kulkarni, A.; Yoon, Y.; Lee, S.; Kim, T.; Lee, H. Highly air-stable phosphorus-doped n-type graphene field-effect transistors. Adv. Mater. 2012, 24, 5481-6. 25. Liu, Z. W.; Peng, F.; Wang, H. J.; Yu, H.; Zheng, W. X.; Yang, J. Phosphorus-doped graphite layers with high electrocatalytic activity for the O2 reduction in an alkaline medium. Angew. Chem. Int. Ed. Engl. 2011, 50, 3257-61. 26. Latorre-Sanchez, M.; Primo, A.; Garcia, H. P-doped graphene obtained by pyrolysis of modified alginate as a photocatalyst for hydrogen generation from water-methanol mixtures. Angew. Chem. Int. Ed. Engl. 2013, 52, 11813-6. 27. Zhang, X. L.; Lu, Z. S.; Fu, Z. M.; Tang, Y. A.; Ma, D. W.; Yang, Z. X. The mechanisms of oxygen reduction reaction on phosphorus doped graphene: A first-principles study. J. Power Sources 2015, 276, 222-229. 28. Wang, H. M.; Wang, H. X.; Chen, Y.; Liu, Y. J.; Zhao, J. X.; Cai, Q. H.; Wang, X. Z. Phosphorus-doped graphene and (8,0) carbon nanotube: Structural, electronic, magnetic properties, and chemical reactivity. Appl. Surf. Sci. 2013, 273, 302-309. 29. Liu, Z. W.; Peng, F.; Wang, H. J.; Yu, H.; Zheng, W. X.; Wei, X. Y. Preparation of phosphorus-doped carbon nanospheres and their electrocatalytic performance for O-2 reduction. Journal of Natural Gas Chemistry 2012, 21, 257-264. 30. Yamaguchi, K.; Mizuno, N. Scope, kinetics, and mechanistic aspects of aerobic oxidations catalyzed by ruthenium supported on alumina. Chemistry-A European Journal
2003, 9, 4353-4361. 31. Dijksman, A.; Marino-Gonzalez, A.; Payeras, A. M. I.; Arends, I. W. C. E.; Sheldon, R. A. Efficient and selective aerobic oxidation of alcohols into aldehydes and ketones using ruthenium/TEMPO as the catalytic system. J. Am. Chem. Soc. 2001, 123, 6826-6833. 32. Watanabe, H.; Asano, S.; Fujita, S.; Yoshida, H.; Arai, M. Nitrogen-Doped, Metal-Free Activated Carbon Catalysts for Aerobic Oxidation of Alcohols. Acs Catalysis 2015, 5, 2886-2894. 33. Cheon, J. Y.; Kim, J. H.; Kim, J. H.; Goddeti, K. C.; Park, J. Y.; Joo, S. H. Intrinsic relationship between enhanced oxygen reduction reaction activity and nanoscale work function of doped carbons. J. Am. Chem. Soc. 2014, 136, 8875-8. 34. Meng, Y. Y.; Voiry, D.; Goswami, A.; Zou, X. X.; Huang, X. X.; Chhowalla, M.; Liu, Z. W.; Asefa, T. N-, O-, and S-Tridoped Nanoporous Carbons as Selective Catalysts for Oxygen Reduction and Alcohol Oxidation Reactions. J. Am. Chem. Soc. 2014, 136, 13554-13557. 35. Boukhvalov, D. W.; Dreyer, D. R.; Bielawski, C. W.; Son, Y. W. A Computational Investigation of the Catalytic Properties of Graphene Oxide: Exploring Mechanisms by using DFT Methods. Chemcatchem 2012, 4, 1844-1849. 36. Ramasahayam, S. K.; Nasini, U. B.; Bairi, V.; Shaikh, A. U.; Viswanathan, T. Microwave assisted synthesis and characterization of silicon and phosphorous co-doped carbon as an electrocatalyst for oxygen reduction reaction. Rsc Advances 2014, 4, 6306-6313. 37. Ramasahayam, S. K.; Nasini, U. B.; Shaikh, A. U.; Viswanathan, T. Novel tannin-based Si, P co-doped carbon for supercapacitor applications. J. Power Sources 2015, 275, 835-844.
173
38. Enache, D. I.; Edwards, J. K.; Landon, P.; Solsona-Espriu, B.; Carley, A. F.; Herzing, A. A.; Watanabe, M.; Kiely, C. J.; Knight, D. W.; Hutchings, G. J. Solvent-free oxidation of primary alcohols to aldehydes using Au-Pd/TiO2 catalysts. Science 2006, 311, 362-5. 39. Liu, H. L.; Liu, Y. L.; Li, Y. W.; Tang, Z. Y.; Jiang, H. F. Metal-Organic Framework Supported Gold Nanoparticles as a Highly Active Heterogeneous Catalyst for Aerobic Oxidation of Alcohols. Journal of Physical Chemistry C 2010, 114, 13362-13369. 40. Zhu, J.; Wang, P. C.; Lu, M. Selective oxidation of benzyl alcohol under solvent-free condition with gold nanoparticles encapsulated in metal-organic framework. Applied
Catalysis a-General 2014, 477, 125-131. 41. Liu, Z. W.; Peng, F.; Wang, H. J.; Yu, H.; Tan, J.; Zhu, L. L. Novel phosphorus-doped multiwalled nanotubes with high electrocatalytic activity for O-2 reduction in alkaline medium. Catal. Commun. 2011, 16, 35-38. 42. Gholizadeh, R.; Yu, Y. X. Work Functions of Pristine and Heteroatom-Doped Graphenes under Different External Electric Fields: An ab Initio DFT Study. Journal of
Physical Chemistry C 2014, 118, 28274-28282. 43. Schiros, T.; Nordlund, D.; Palova, L.; Prezzi, D.; Zhao, L.; Kim, K. S.; Wurstbauer, U.; Gutierrez, C.; Delongchamp, D.; Jaye, C.; Fischer, D.; Ogasawara, H.; Pettersson, L. G.; Reichman, D. R.; Kim, P.; Hybertsen, M. S.; Pasupathy, A. N. Connecting dopant bond type with electronic structure in N-doped graphene. Nano Lett. 2012, 12, 4025-31. 44. Dreyer, D. R.; Jia, H. P.; Bielawski, C. W. Graphene oxide: a convenient carbocatalyst for facilitating oxidation and hydration reactions. Angewandte Chemie 2010, 122, 6965-6968. 45. Hasegawa, G.; Deguchi, T.; Kanamori, K.; Kobayashi, Y.; Kageyama, H.; Abe, T.; Nakanishi, K. High-Level Doping of Nitrogen, Phosphorus, and Sulfur into Activated Carbon Monoliths and Their Electrochemical Capacitances. Chem. Mater. 2015, 27, 4703-4712. 46. Patel, M.; Feng, W.; Savaram, K.; Khoshi, M. R.; Huang, R.; Sun, J.; Rabie, E.; Flach, C.; Mendelsohn, R.; Garfunkel, E. Microwave Enabled One‐Pot, One‐Step Fabrication and Nitrogen Doping of Holey Graphene Oxide for Catalytic Applications. Small 2015. 47. Marcano, D. C.; Kosynkin, D. V.; Berlin, J. M.; Sinitskii, A.; Sun, Z.; Slesarev, A.; Alemany, L. B.; Lu, W.; Tour, J. M. Improved synthesis of graphene oxide. ACS Nano
2010, 4, 4806-14. 48. Puziy, A. M.; Poddubnaya, O. I.; Martinez-Alonso, A.; Suarez-Garcia, F.; Tascon, J. M. D. Surface chemistry of phosphorus-containing carbons of lignocellulosic origin. Carbon 2005, 43, 2857-2868. 49. Puziy, A. M.; Poddubnaya, O. I.; Ziatdinov, A. M. On the chemical structure of phosphorus compounds in phosphoric acid-activated carbon. Appl. Surf. Sci. 2006, 252, 8036-8038. 50. Khazaei, A.; Rad, M. N. S.; Borazjani, M. K.; Saednia, S.; Borazjani, M. K.; Golbaghi, M.; Behrouz, S. Highly Efficient Etherification and Oxidation of Aromatic Alcohols Using Supported and Unsupported Phosphorus Pentoxide as a Heterogeneous Reagent. Synth. Commun. 2011, 41, 1544-1553. 51. Onodera, K.; Hirano, S.; Kashimura, N. Oxidation of carbohydrates with dimethyl sulfoxide containing phosphorus pentoxide. J. Am. Chem. Soc. 1965, 87, 4651-4652.
174
52. Jeyaraj, V. S.; Kamaraj, M.; Subramanian, V. Generalized Reaction Mechanism for the Selective Aerobic Oxidation of Aryl and Alkyl Alcohols over Nitrogen-Doped Graphene. Journal of Physical Chemistry C 2015, 119, 26438-26450. 53. Banerji, K. K. Oxidation of Substituted Benzyl Alcohols by Pyridinium Fluorochromate - a Kinetic-Study. J. Org. Chem. 1988, 53, 2154-2159. 54. Stewart, R.; Lee, D. G. THE CHROMIC ACID OXIDATION OF ARYL TRIFLUOROMETHYL ALCOHOLS: ISOTOPE AND SUBSTITUENT EFFECTS. Can.
J. Chem. 1964, 42, 439-446. 55. Banerji, K. K. Kinetics and mechanism of the oxidation of substituted benzyl alcohols by pyridinium chlorochromate. Journal of the Chemical Society, Perkin
Transactions 2 1978, 639-641. 56. De Nooy, A. E.; Besemer, A. C.; van Bekkum, H. On the use of stable organic nitroxyl radicals for the oxidation of primary and secondary alcohols. Synthesis 1996, 1153-1174. 57. Minisci, F.; Recupero, F.; Cecchetto, A.; Gambarotti, C.; Punta, C.; Faletti, R.; Paganelli, R.; Pedulli, G. F. Mechanisms of the Aerobic Oxidation of Alcohols to Aldehydes and Ketones, Catalysed under Mild Conditions by Persistent and Non‐Persistent Nitroxyl Radicals and Transition Metal Salts− Polar, Enthalpic, and Captodative Effects. Eur. J. Org. Chem. 2004, 2004, 109-119. 58. Koshino, N.; Saha, B.; Espenson, J. H. Kinetic study of the phthalimide N-oxyl radical in acetic acid. Hydrogen abstraction from substituted toluenes, benzaldehydes, and benzyl alcohols. J. Org. Chem. 2003, 68, 9364-70. 59. Villa, A.; Schiavoni, M.; Fulvio, P. F.; Mahurin, S. M.; Dai, S.; Mayes, R. T.; Veith, G. M.; Prati, L. Phosphorylated mesoporous carbon as effective catalyst for the selective fructose dehydration to HMF. Journal of Energy Chemistry 2013, 22, 305-311. 60. Zhang, J.; Liu, X.; Blume, R.; Zhang, A.; Schlogl, R.; Su, D. S. Surface-modified carbon nanotubes catalyze oxidative dehydrogenation of n-butane. Science 2008, 322, 73-7. 61. Hulicova-Jurcakova, D.; Puziy, A. M.; Poddubnaya, O. I.; Suarez-Garcia, F.; Tascon, J. M.; Lu, G. Q. Highly stable performance of supercapacitors from phosphorus-enriched carbons. J. Am. Chem. Soc. 2009, 131, 5026-7. 62. Patel, M.; Savaram, K.; Keating, K.; He, H. Rapid Transformation of Biomass Compounds to Metal Free Catalysts via Short Microwave Irradiation. Journal of Natural
Products Research Updates 2015, 1, 18-28. 63. Hu, F.; Patel, M.; Luo, F.; Flach, C.; Mendelsohn, R.; Garfunkel, E.; He, H.; Szostak, M. Graphene-Catalyzed Direct Friedel-Crafts Alkylation Reactions: Mechanism, Selectivity, and Synthetic Utility. J. Am. Chem. Soc. 2015, 137, 14473-80. 64. Brunauer, S.; Emmett, P. H.; Teller, E. Adsorption of gases in multimolecular layers. J. Am. Chem. Soc. 1938, 60, 309-319. 65. Chunzeng Li, S. M., Yan Hu, Ji Ma, Jianli He, Henry Mittel,Vinson Kelly, Natalia Erina, Senli Guo, Thomas Mueller. PeakForce Kelvin Probe Force Microscopy,
Application Note #140; Bruker Corporation: 2013. 66. Baumgart, C.; Helm, M.; Schmidt, H. Quantitative dopant profiling in semiconductors: A Kelvin probe force microscopy model. Physical Review B 2009, 80, 085305.
175
67. Koren, E.; Berkovitch, N.; Rosenwaks, Y. Measurement of active dopant distribution and diffusion in individual silicon nanowires. Nano Lett. 2010, 10, 1163-1167. 68. Ziegler, D.; Gava, P.; Güttinger, J.; Molitor, F.; Wirtz, L.; Lazzeri, M.; Saitta, A.; Stemmer, A.; Mauri, F.; Stampfer, C. Variations in the work function of doped single-and few-layer graphene assessed by Kelvin probe force microscopy and density functional theory. Physical Review B 2011, 83, 235434. 69. Lagel, B.; Baikie, I. D.; Petermann, U. A novel detection system for defects and chemical contamination in semiconductors based upon the Scanning Kelvin Probe. Surf.
Sci. 1999, 433, 622-626. 70. Beerbom, M. M.; Lagel, B.; Cascio, A. J.; Doran, B. V.; Schlaf, R. Direct comparison of photoemission spectroscopy and in situ Kelvin probe work function measurements on indium tin oxide films. J. Electron. Spectrosc. Relat. Phenom. 2006, 152, 12-17.
176
Chapter 5. Rapid Transformation of Biomass Compounds
to Metal Free Catalysts via Short Microwave Irradiation
5.1. Introduction
The pivotal role of catalytic materials in various industries is unambiguously demonstrated
by the fact that up to 90% of commercially available chemical products involve the use of
catalysts at some production stage.1 However, most catalytic materials were developed
based on toxic and/or precious metals, which are unsustainable and possess environmental
risks. In the drive towards green and sustainable chemistry, there is an increasing interest
in developing new carbon-based materials that are benign, abundant, readily available, and
metal free to act as catalysts for chemical synthesis. A plethora of reports have
demonstrated that doping graphene matrices with heteroatoms modifies its
physicochemical and electronic properties towards enhanced electrocatalytic oxygen
reduction reaction (ORR) performance, when compared to undoped analogs.2-8 In addition,
co-doping with several different heteroatoms shows further improvements in ORR
performances.3, 4, 9-16 Compared to ORR studies, the use of doped and/or co-doped carbon
materials as catalysts for selective organic synthesis are in their early stages of
development, although a great potential has been demonstrated. Importantly, these
carbocatalysts merge the benefits of green synthesis with heterogeneous reaction
conditions, which greatly simplifies work-up conditions and is particularly attractive from
an industrial standpoint. To convert this great potential to practical industrial reality,
methods for the large-scale fabrication, that is both cost and energy efficient, of these novel
heteroatom-doped graphene-based materials, is required.
177
Various approaches have been developed for the fabrication of heteroatom-doped
graphene. Most of the reported doping procedures are long and require high temperature
annealing of graphene oxide (GO) with doping precursors in an inert environment.17-20
Furthermore, although single layer graphene has the largest surface area (2600 m2/g), the
effective surface area, especially in some solvents or reactants, is much lower due to
aggregation. The aggregated structures dramatically influence mass transport of reactants
to the active sites and inhibit the products from leaving the active centers. On the other
hand, porous carbon materials can be beneficial for mass transport due to their large surface
area and the existence of large amount of pores so that the active sites are easily accessible.
Furthermore, these materials can be made from cheap abundant biomass compounds,
ensuring sustainability of resources.21-24 However, all the porous carbon materials,
including the heteroatom doped ones, have been also fabricated via long period (hours) of
high temperature reaction or annealing procedures in inert environments to afford stable
materials with the desired performance, which deviates the concept of energy saving and
sustainability.
The use of microwave heating instead of traditional high temperature annealing is
attractive due to its energy savings and rapid fabrication advantages. However, the
challenge with using microwave energy is that most of the biomass and organic compounds
are transparent to microwave energy, prohibiting their direct use for microwave irradiation
to undergo carbonization. This problem has been partially solved by pre-heating with
traditional heating or by adding some microwave absorbing materials, such as mineral
oxides, and some type of carbon.25-27 However, these microwave-absorbing materials may
introduce unintentional contaminations to the obtained carbon materials, which is not
178
desirable for catalytic applications in organic synthesis. Therefore, choosing the right
microwave-adsorbing materials is important to avoid this problem.
In chapter-4, it was discovered that phytic acid, a sustainable biomass compound,
can be used directly for P doped carbon material fabrication with microwave irradiation.28
Phytic acid is the principal storage form of phosphorus in many plant tissues, especially in
the bran of grains and other seeds, and it is well known as an anti-nutrient substance in
food. Phytic acid is a snowflake-like compound, containing six phosphorous acid “arms”
(Scheme 5.1). The existence of both high levels of C and P in one molecule ensures
uniform P doping in the fabricated carbon materials. Most importantly, phytic acid strongly
absorbs microwave energy, so that the as-purchased phytic acid solution can be directly
subjected to short (40 seconds) microwave irradiation for the fabrication of P doped
graphene like carbon product (PGc). By simply changing the microwave irradiation time,
PGc with different P bond configurations were fabricated, as determined by combined
FTIR and X-ray photoelectron spectroscopy (XPS).28 Using microwave heating instead of
traditional heating ensures that this approach is both sustainable and energy efficient.
Furthermore, the fabrication can be performed under ambient conditions without the
requirements of an inert environment, which makes this approach even more cost effective
and convenient.
Furthermore, the capability of the P doped carbon materials as metal free catalysts
for aerobic oxidation reactions has been demonstrated for the first time.28 It was found that
P doped carbon materials efficiently catalyzed aerobic oxidation of both primary and
secondary benzyl alcohols to the corresponding aldehydes or ketones. To our surprise, the
PGc with higher work functions showed higher capacity in catalyzing aerobic oxidation
179
reactions, which is opposite to the trend when N doped carbon materials were used as metal
free catalysts for aerobic oxidation reactions and electrochemical catalysts for ORR. Since
both ORR and aerobic oxidation reactions involve activation of molecular oxygen at
certain stages of the reactions, it was hypothesized that a strong correlation should exist
between these two processes. However, it is not certain if the best catalysts for aerobic
reaction are also good electrocatalysts for ORR. The main focus of this work is to study
the ORR performance as a function of P bond configuration and reveal any correlations
between the catalytic behavior for ORR and aerobic oxidation.
It was well accepted that different heteroatomic doping confers graphene with
distinct properties due to their different electronic structures and atomic diameters.10, 29, 30
Furthermore, it is reported that co-doping with different heteroatoms generates new
properties and/or creates synergistic effects, which results in largely improved
electrocatalytic ORR performances. These synergistic effects could also be beneficial for
other catalytic applications.30-32 Interestingly, a recent study by Garcia et al. demonstrated
that graphene like carbon materials without any heteroatom doping gave excellent catalytic
performance for selective acetylene hydrogenation and alkene hydrogenation in the
absence of metal catalysts.33 The fabrication of this material was achieved by carbonization
of alginate at high temperatures (900 C for 6 hours). Therefore it provides a scope for this
simple and energy effective approach to be extended to fabricate carbon materials with or
without heteroatom doping, and P co-doping with other heteroatoms to accommodate a
large range of catalytic applications. In this work, it was demonstrated that, the microwave-
assisted carbonization approach can be extended to fabricate co-doped carbon catalysts
such as P-N, P-S, P-Si, and P-B co-doped carbon materials, labeled as PN-Gc, PS-Gc, PSi-
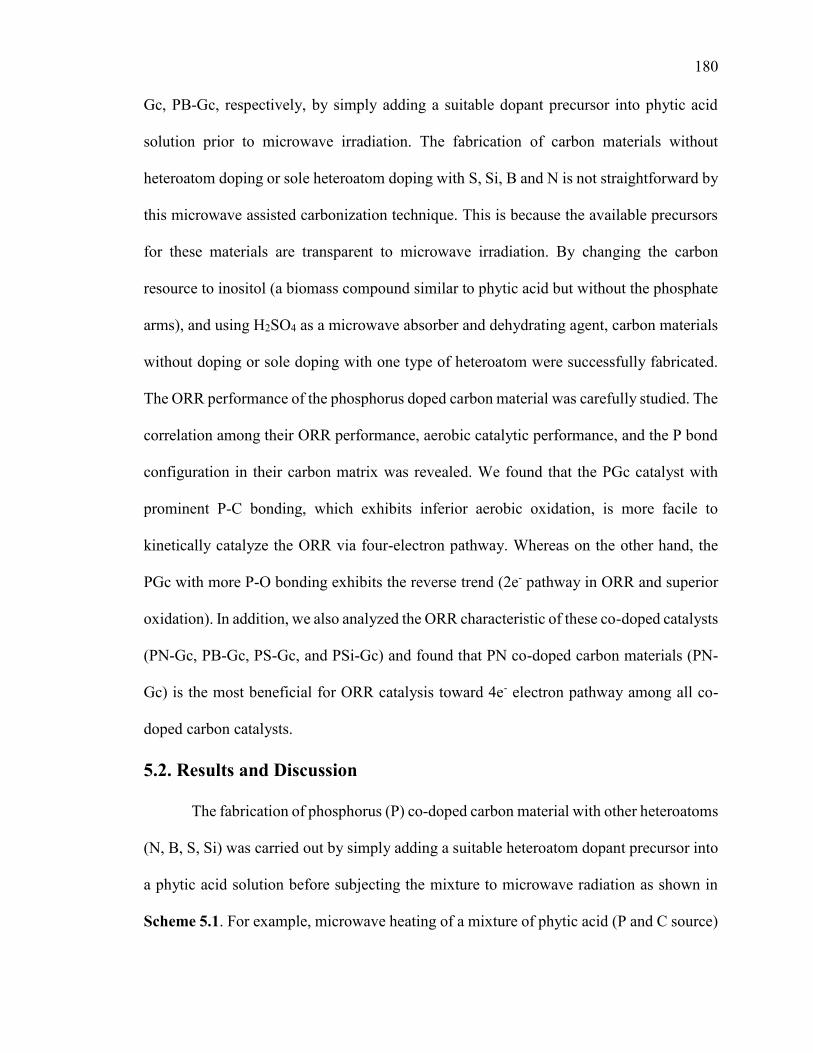
180
Gc, PB-Gc, respectively, by simply adding a suitable dopant precursor into phytic acid
solution prior to microwave irradiation. The fabrication of carbon materials without
heteroatom doping or sole heteroatom doping with S, Si, B and N is not straightforward by
this microwave assisted carbonization technique. This is because the available precursors
for these materials are transparent to microwave irradiation. By changing the carbon
resource to inositol (a biomass compound similar to phytic acid but without the phosphate
arms), and using H2SO4 as a microwave absorber and dehydrating agent, carbon materials
without doping or sole doping with one type of heteroatom were successfully fabricated.
The ORR performance of the phosphorus doped carbon material was carefully studied. The
correlation among their ORR performance, aerobic catalytic performance, and the P bond
configuration in their carbon matrix was revealed. We found that the PGc catalyst with
prominent P-C bonding, which exhibits inferior aerobic oxidation, is more facile to
kinetically catalyze the ORR via four-electron pathway. Whereas on the other hand, the
PGc with more P-O bonding exhibits the reverse trend (2e- pathway in ORR and superior
oxidation). In addition, we also analyzed the ORR characteristic of these co-doped catalysts
(PN-Gc, PB-Gc, PS-Gc, and PSi-Gc) and found that PN co-doped carbon materials (PN-
Gc) is the most beneficial for ORR catalysis toward 4e- electron pathway among all co-
doped carbon catalysts.
5.2. Results and Discussion
The fabrication of phosphorus (P) co-doped carbon material with other heteroatoms
(N, B, S, Si) was carried out by simply adding a suitable heteroatom dopant precursor into
a phytic acid solution before subjecting the mixture to microwave radiation as shown in
Scheme 5.1. For example, microwave heating of a mixture of phytic acid (P and C source)
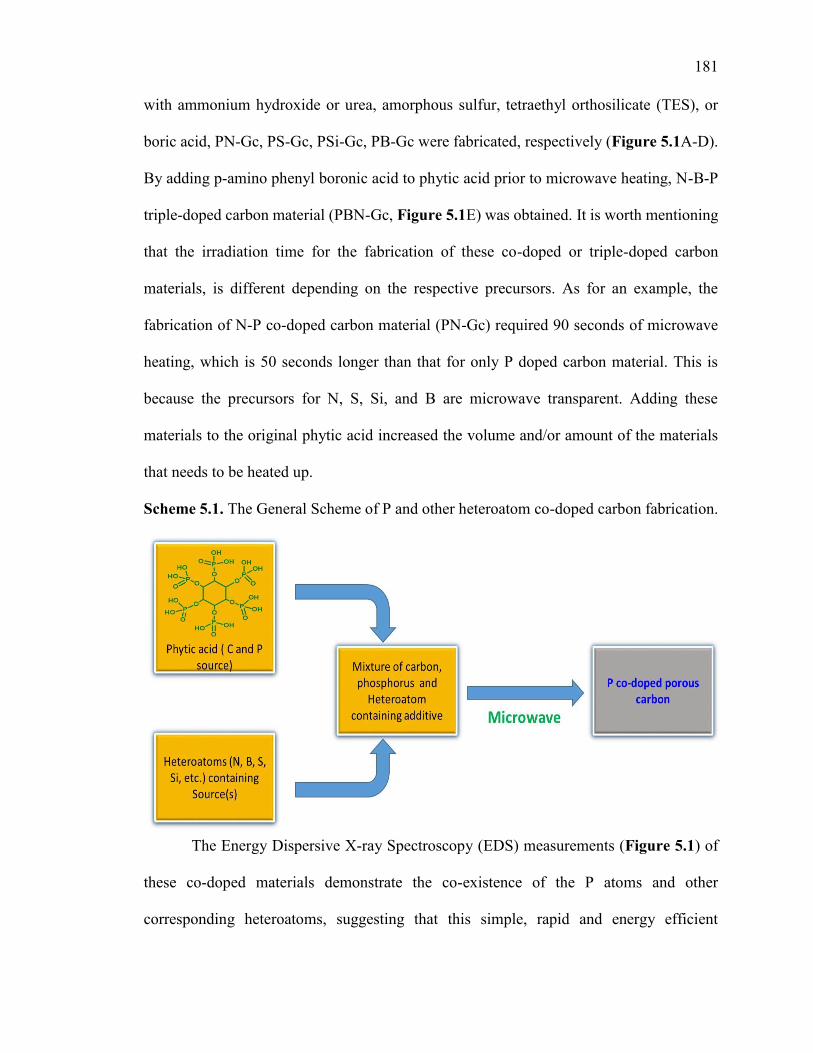
181
with ammonium hydroxide or urea, amorphous sulfur, tetraethyl orthosilicate (TES), or
boric acid, PN-Gc, PS-Gc, PSi-Gc, PB-Gc were fabricated, respectively (Figure 5.1A-D).
By adding p-amino phenyl boronic acid to phytic acid prior to microwave heating, N-B-P
triple-doped carbon material (PBN-Gc, Figure 5.1E) was obtained. It is worth mentioning
that the irradiation time for the fabrication of these co-doped or triple-doped carbon
materials, is different depending on the respective precursors. As for an example, the
fabrication of N-P co-doped carbon material (PN-Gc) required 90 seconds of microwave
heating, which is 50 seconds longer than that for only P doped carbon material. This is
because the precursors for N, S, Si, and B are microwave transparent. Adding these
materials to the original phytic acid increased the volume and/or amount of the materials
that needs to be heated up.
Scheme 5.1. The General Scheme of P and other heteroatom co-doped carbon fabrication.
The Energy Dispersive X-ray Spectroscopy (EDS) measurements (Figure 5.1) of
these co-doped materials demonstrate the co-existence of the P atoms and other
corresponding heteroatoms, suggesting that this simple, rapid and energy efficient
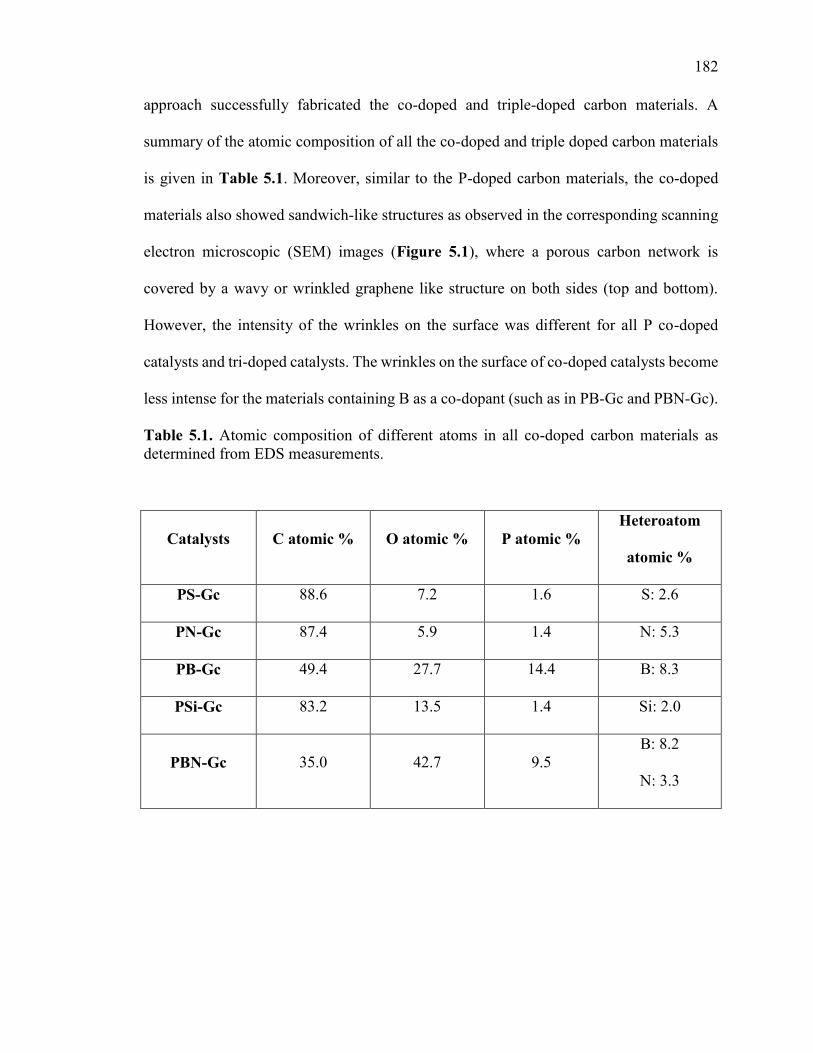
182
approach successfully fabricated the co-doped and triple-doped carbon materials. A
summary of the atomic composition of all the co-doped and triple doped carbon materials
is given in Table 5.1. Moreover, similar to the P-doped carbon materials, the co-doped
materials also showed sandwich-like structures as observed in the corresponding scanning
electron microscopic (SEM) images (Figure 5.1), where a porous carbon network is
covered by a wavy or wrinkled graphene like structure on both sides (top and bottom).
However, the intensity of the wrinkles on the surface was different for all P co-doped
catalysts and tri-doped catalysts. The wrinkles on the surface of co-doped catalysts become
less intense for the materials containing B as a co-dopant (such as in PB-Gc and PBN-Gc).
Table 5.1. Atomic composition of different atoms in all co-doped carbon materials as determined from EDS measurements.
Catalysts C atomic % O atomic % P atomic % Heteroatom
atomic %
PS-Gc 88.6 7.2 1.6 S: 2.6
PN-Gc 87.4 5.9 1.4 N: 5.3
PB-Gc 49.4 27.7 14.4 B: 8.3
PSi-Gc 83.2 13.5 1.4 Si: 2.0
PBN-Gc 35.0 42.7 9.5 B: 8.2
N: 3.3
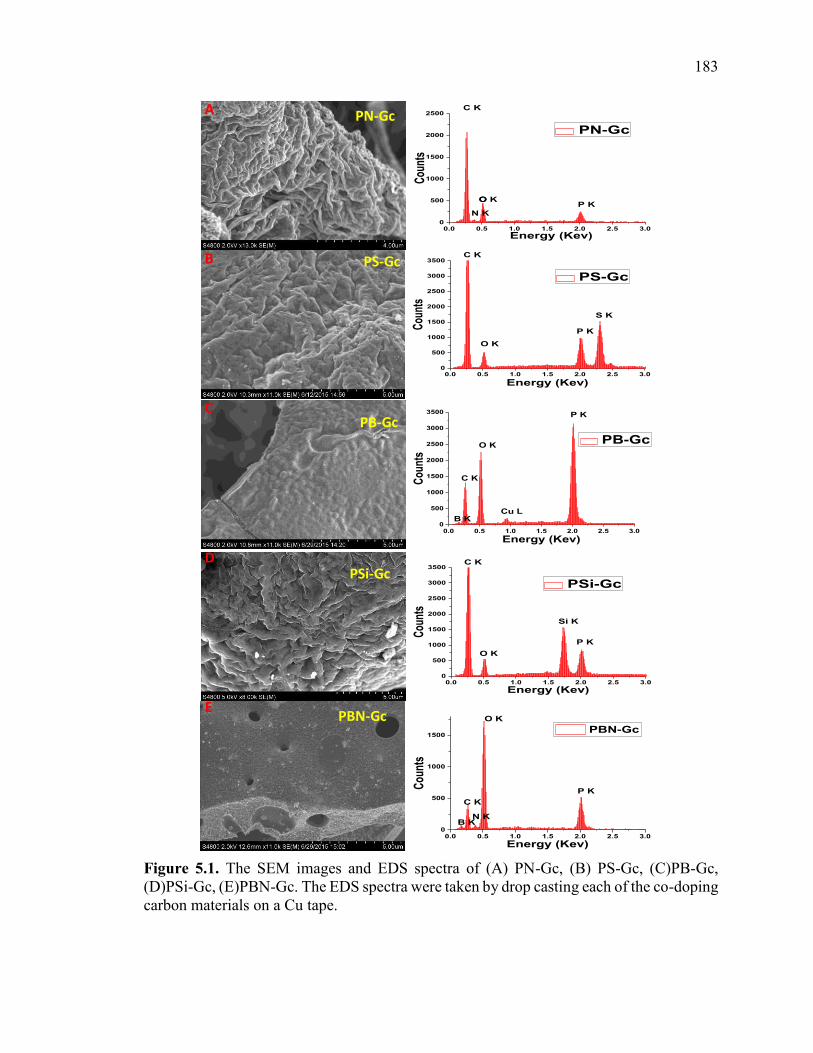
183
Figure 5.1. The SEM images and EDS spectra of (A) PN-Gc, (B) PS-Gc, (C)PB-Gc, (D)PSi-Gc, (E)PBN-Gc. The EDS spectra were taken by drop casting each of the co-doping carbon materials on a Cu tape.
0.0 0.5 1.0 1.5 2.0 2.5 3.00
500
1000
1500
2000
2500
Cou
nts
Energy (Kev)
N K
O
PN-Gc
O KP K
C K
PN-Gc
PS-Gc
0.0 0.5 1.0 1.5 2.0 2.5 3.00
500
1000
1500
2000
2500
3000
3500
Cou
nts
Energy (Kev)
PS-Gc
S K
O K
P K
C K
PB-Gc
0.0 0.5 1.0 1.5 2.0 2.5 3.00
500
1000
1500
2000
2500
3000
3500
O K
Cou
nts
Energy (Kev)
PB-Gc
Cu L
P K
B K
C K
PSi-Gc
0.0 0.5 1.0 1.5 2.0 2.5 3.00
500
1000
1500
2000
2500
3000
3500
Si K
Cou
nts
Energy (Kev)
PSi-Gc
O K
P K
C K
PBN-Gc
0.0 0.5 1.0 1.5 2.0 2.5 3.00
500
1000
1500
O K
P K
N KB K
Cou
nts
Energy (Kev)
PBN-Gc
C K
A
B
C
D
E
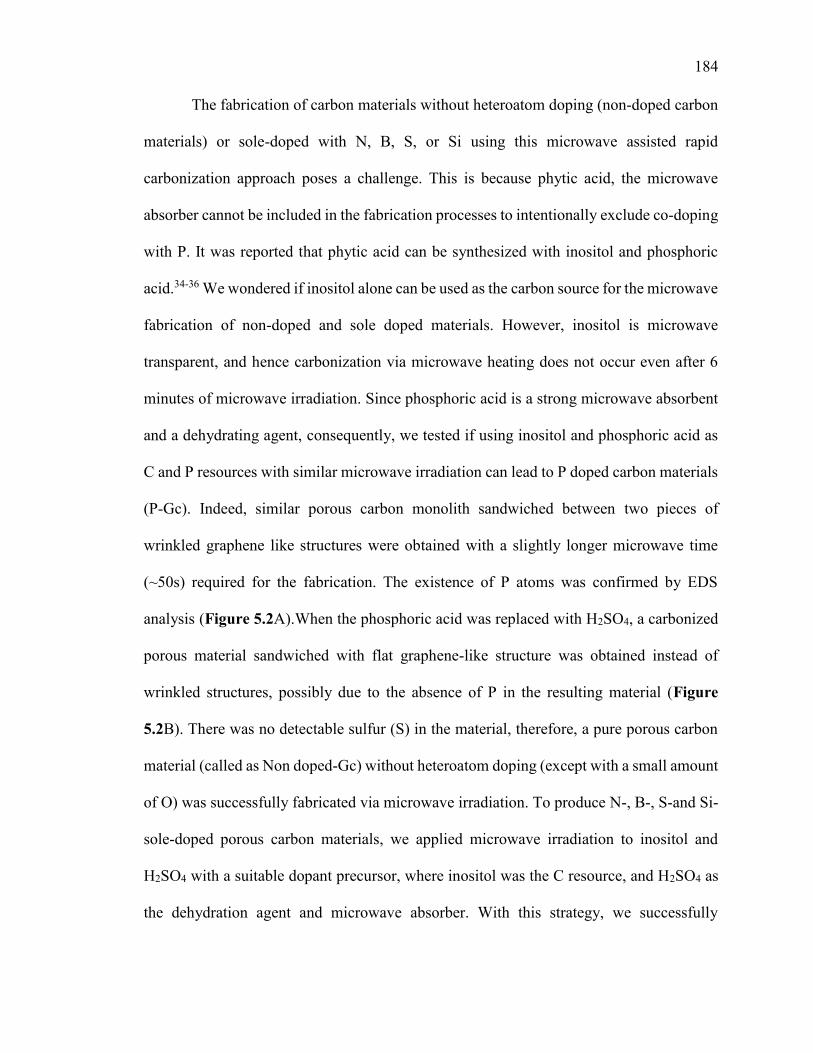
184
The fabrication of carbon materials without heteroatom doping (non-doped carbon
materials) or sole-doped with N, B, S, or Si using this microwave assisted rapid
carbonization approach poses a challenge. This is because phytic acid, the microwave
absorber cannot be included in the fabrication processes to intentionally exclude co-doping
with P. It was reported that phytic acid can be synthesized with inositol and phosphoric
acid.34-36 We wondered if inositol alone can be used as the carbon source for the microwave
fabrication of non-doped and sole doped materials. However, inositol is microwave
transparent, and hence carbonization via microwave heating does not occur even after 6
minutes of microwave irradiation. Since phosphoric acid is a strong microwave absorbent
and a dehydrating agent, consequently, we tested if using inositol and phosphoric acid as
C and P resources with similar microwave irradiation can lead to P doped carbon materials
(P-Gc). Indeed, similar porous carbon monolith sandwiched between two pieces of
wrinkled graphene like structures were obtained with a slightly longer microwave time
(~50s) required for the fabrication. The existence of P atoms was confirmed by EDS
analysis (Figure 5.2A).When the phosphoric acid was replaced with H2SO4, a carbonized
porous material sandwiched with flat graphene-like structure was obtained instead of
wrinkled structures, possibly due to the absence of P in the resulting material (Figure
5.2B). There was no detectable sulfur (S) in the material, therefore, a pure porous carbon
material (called as Non doped-Gc) without heteroatom doping (except with a small amount
of O) was successfully fabricated via microwave irradiation. To produce N-, B-, S-and Si-
sole-doped porous carbon materials, we applied microwave irradiation to inositol and
H2SO4 with a suitable dopant precursor, where inositol was the C resource, and H2SO4 as
the dehydration agent and microwave absorber. With this strategy, we successfully
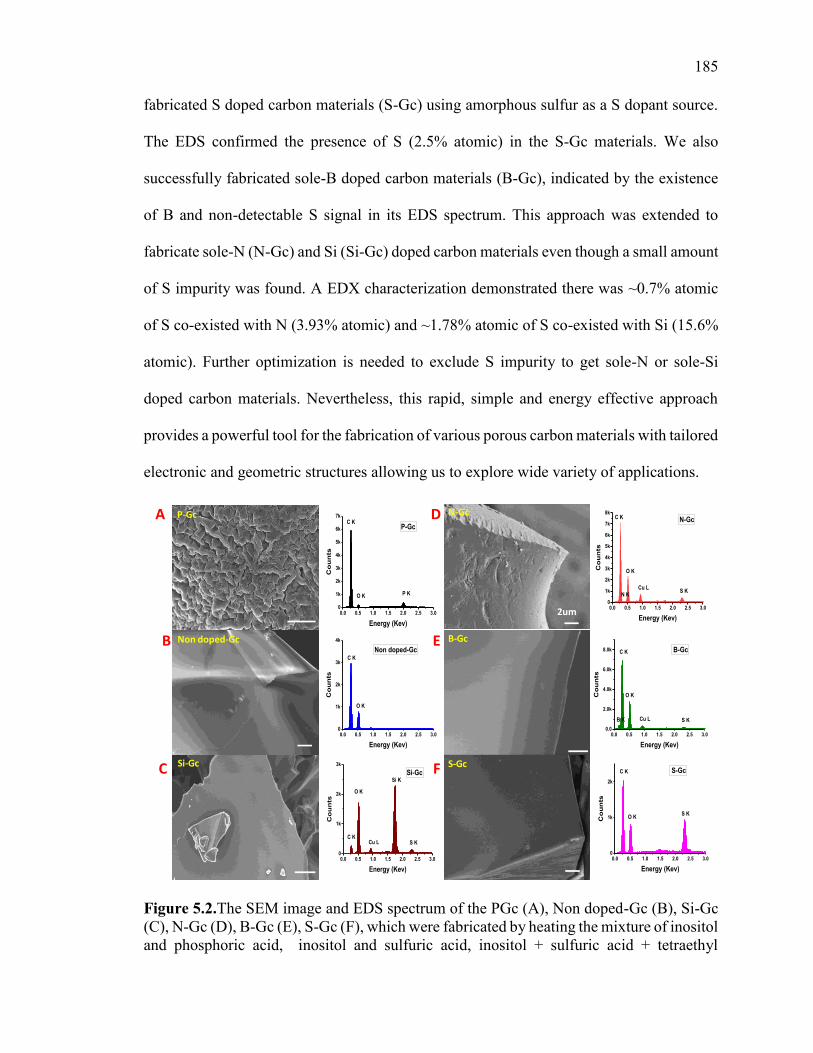
185
fabricated S doped carbon materials (S-Gc) using amorphous sulfur as a S dopant source.
The EDS confirmed the presence of S (2.5% atomic) in the S-Gc materials. We also
successfully fabricated sole-B doped carbon materials (B-Gc), indicated by the existence
of B and non-detectable S signal in its EDS spectrum. This approach was extended to
fabricate sole-N (N-Gc) and Si (Si-Gc) doped carbon materials even though a small amount
of S impurity was found. A EDX characterization demonstrated there was ~0.7% atomic
of S co-existed with N (3.93% atomic) and ~1.78% atomic of S co-existed with Si (15.6%
atomic). Further optimization is needed to exclude S impurity to get sole-N or sole-Si
doped carbon materials. Nevertheless, this rapid, simple and energy effective approach
provides a powerful tool for the fabrication of various porous carbon materials with tailored
electronic and geometric structures allowing us to explore wide variety of applications.
Figure 5.2.The SEM image and EDS spectrum of the PGc (A), Non doped-Gc (B), Si-Gc (C), N-Gc (D), B-Gc (E), S-Gc (F), which were fabricated by heating the mixture of inositol and phosphoric acid, inositol and sulfuric acid, inositol + sulfuric acid + tetraethyl
0.0 0.5 1.0 1.5 2.0 2.5 3.00
1k
2k
3k
4k
5k
6k
7k
8k
N KCu L
S K
O KCo
un
ts
Energy (Kev)
N-GcC KN-Gc
2um
0.0 0.5 1.0 1.5 2.0 2.5 3.00.0
2.0k
4.0k
6.0k
8.0k
Cu LB K S K
O K
C K
Co
un
ts
Energy (Kev)
B-Gc
B-Gc
0.0 0.5 1.0 1.5 2.0 2.5 3.00
1k
2k
S KO K
C K
Co
un
ts
Energy (Kev)
S-GcS-Gc
0.0 0.5 1.0 1.5 2.0 2.5 3.00
1k
2k
3k
4k
5k
6k
7k
P-Gc
P KO K
Co
un
ts
Energy (Kev)
C K
0.0 0.5 1.0 1.5 2.0 2.5 3.00
1k
2k
3k
4k
O K
C K
Co
un
ts
Energy (Kev)
Non doped-Gc
Non doped-Gc
P-Gc
0.0 0.5 1.0 1.5 2.0 2.5 3.00
1k
2k
3k
Cu L
Si K
S K
O K
C K
Co
un
ts
Energy (Kev)
Si-GcSi-GcC F
A D
B E
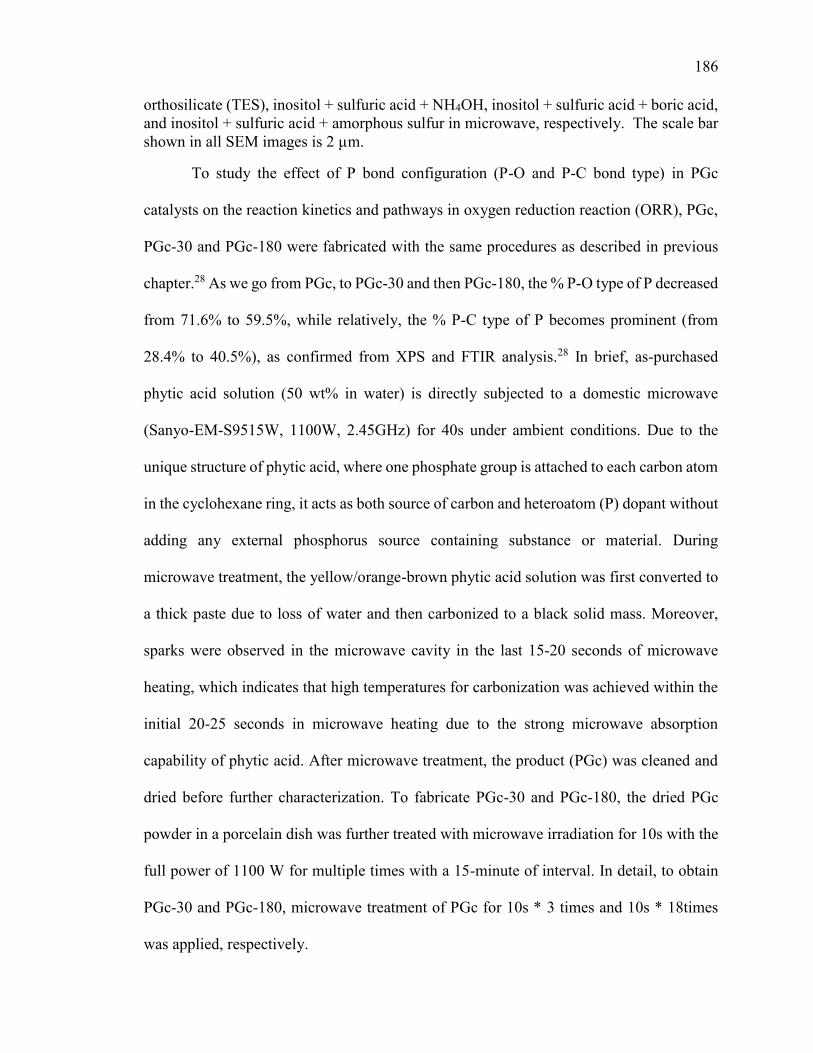
186
orthosilicate (TES), inositol + sulfuric acid + NH4OH, inositol + sulfuric acid + boric acid, and inositol + sulfuric acid + amorphous sulfur in microwave, respectively. The scale bar shown in all SEM images is 2 µm.
To study the effect of P bond configuration (P-O and P-C bond type) in PGc
catalysts on the reaction kinetics and pathways in oxygen reduction reaction (ORR), PGc,
PGc-30 and PGc-180 were fabricated with the same procedures as described in previous
chapter.28 As we go from PGc, to PGc-30 and then PGc-180, the % P-O type of P decreased
from 71.6% to 59.5%, while relatively, the % P-C type of P becomes prominent (from
28.4% to 40.5%), as confirmed from XPS and FTIR analysis.28 In brief, as-purchased
phytic acid solution (50 wt% in water) is directly subjected to a domestic microwave
(Sanyo-EM-S9515W, 1100W, 2.45GHz) for 40s under ambient conditions. Due to the
unique structure of phytic acid, where one phosphate group is attached to each carbon atom
in the cyclohexane ring, it acts as both source of carbon and heteroatom (P) dopant without
adding any external phosphorus source containing substance or material. During
microwave treatment, the yellow/orange-brown phytic acid solution was first converted to
a thick paste due to loss of water and then carbonized to a black solid mass. Moreover,
sparks were observed in the microwave cavity in the last 15-20 seconds of microwave
heating, which indicates that high temperatures for carbonization was achieved within the
initial 20-25 seconds in microwave heating due to the strong microwave absorption
capability of phytic acid. After microwave treatment, the product (PGc) was cleaned and
dried before further characterization. To fabricate PGc-30 and PGc-180, the dried PGc
powder in a porcelain dish was further treated with microwave irradiation for 10s with the
full power of 1100 W for multiple times with a 15-minute of interval. In detail, to obtain
PGc-30 and PGc-180, microwave treatment of PGc for 10s * 3 times and 10s * 18times
was applied, respectively.
187
Figure 5.3. (A) is Cyclic voltammetry (CV) and (B) is Linear sweep voltammetry (LSV) curves of different phosphorus doped carbon catalyst in O2 saturated 0.1M KOH. LSV measurements were performed using rotating ring disc (RRDE) electrode at 2000 rpm.
The ORR performance of PGc, PGc-30 and PGc-180 catalysts were evaluated by
cyclic voltammetry (CV) and linear sweep voltammetry (LSV) in a 0.1M KOH solution
saturated with oxygen and nitrogen gas. The same amount of materials for each catalysts
was deposited onto a glassy carbon electrode for easy comparison. A bare glassy carbon
electrode without any catalyst was used as a control. As shown in Figure 5.3A, a large
reduction peak was observed in all the CV curves, while only in the O2 saturated electrolyte
but not the N2, which suggests that O2 is electro-catalytically reduced on the modified and
bare electrodes. However, the PGc, PGc-30 and PGc-180 modified electrodes show much
lower onset and peak potentials compared to the bare electrode (Figure 5.3 and Table 5.2).
Among all the PGc catalysts, the PGc-180 modified electrode shows the lowest peak
potential (-0.292 V) and the highest current density (3.33 mA. cm-2 at -0.60 V) in LSV.
These result demonstrates that the PGc-180 catalyst shows the best catalytic ORR
performance and is more kinetically facile toward ORR than the PGc-30 and PGc catalysts.
Table 5.2. Electrochemical parameters (onset potential, peak potential, current density, no of electrons, % HO2
-, rate constant k and Tafel slopes-b1 and -b2 of different catalysts for ORR estimated from CV and RRDE polarization curves in 0.1 m KOH solution. b1 and b2
-1.0 -0.8 -0.6 -0.4 -0.2 0.0
4E-04
3E-04
2E-04
1E-04
0E+00
-1E-04
-2E-04
Cu
rre
nt
(A)
Potential (V)
N2 Purged
Bare electrode
PGc
PGc-30
PGc-180
-0.8 -0.6 -0.4 -0.2 0.04.0
3.5
3.0
2.5
2.0
1.5
1.0
0.5
0.0
Cu
rre
nt
De
ns
ity
(m
A/c
m2)
Potential (V)
Bare Electrode
PGc
PGc-30
PGc-180
A B
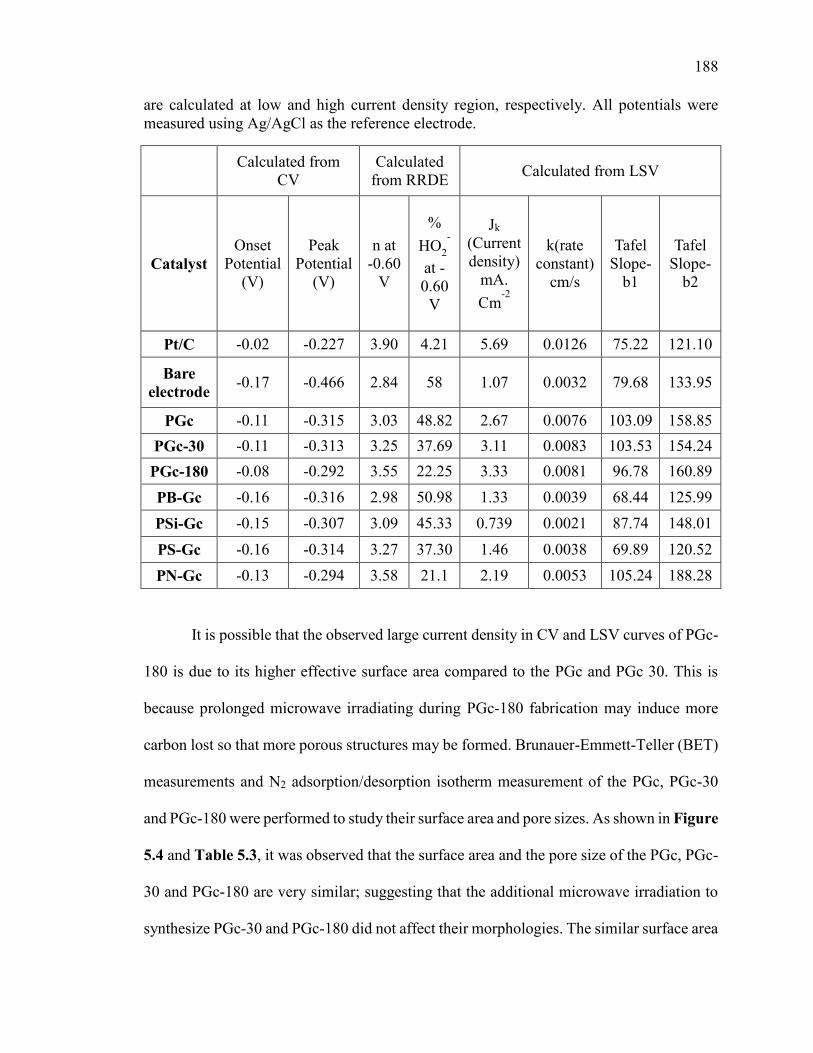
188
are calculated at low and high current density region, respectively. All potentials were measured using Ag/AgCl as the reference electrode.
Calculated from
CV Calculated
from RRDE Calculated from LSV
Catalyst Onset
Potential (V)
Peak Potential
(V)
n at -0.60
V
% HO2
-
at -0.60
V
Jk (Current density)
mA. Cm-2
k(rate constant)
cm/s
Tafel Slope-
b1
Tafel Slope-
b2
Pt/C -0.02 -0.227 3.λ0 4.21 5.6λ 0.0126 75.22 121.10
Bare electrode
-0.17 -0.466 2.84 58 1.07 0.0032 7λ.68 133.λ5
PGc -0.11 -0.315 3.03 48.82 2.67 0.0076 103.0λ 158.85
PGc-30 -0.11 -0.313 3.25 37.6λ 3.11 0.0083 103.53 154.24
PGc-180 -0.08 -0.2λ2 3.55 22.25 3.33 0.0081 λ6.78 160.8λ
PB-Gc -0.16 -0.316 2.λ8 50.λ8 1.33 0.003λ 68.44 125.λλ
PSi-Gc -0.15 -0.307 3.0λ 45.33 0.73λ 0.0021 87.74 148.01
PS-Gc -0.16 -0.314 3.27 37.30 1.46 0.0038 6λ.8λ 120.52
PN-Gc -0.13 -0.2λ4 3.58 21.1 2.1λ 0.0053 105.24 188.28
It is possible that the observed large current density in CV and LSV curves of PGc-
180 is due to its higher effective surface area compared to the PGc and PGc 30. This is
because prolonged microwave irradiating during PGc-180 fabrication may induce more
carbon lost so that more porous structures may be formed. Brunauer-Emmett-Teller (BET)
measurements and N2 adsorption/desorption isotherm measurement of the PGc, PGc-30
and PGc-180 were performed to study their surface area and pore sizes. As shown in Figure
5.4 and Table 5.3, it was observed that the surface area and the pore size of the PGc, PGc-
30 and PGc-180 are very similar; suggesting that the additional microwave irradiation to
synthesize PGc-30 and PGc-180 did not affect their morphologies. The similar surface area
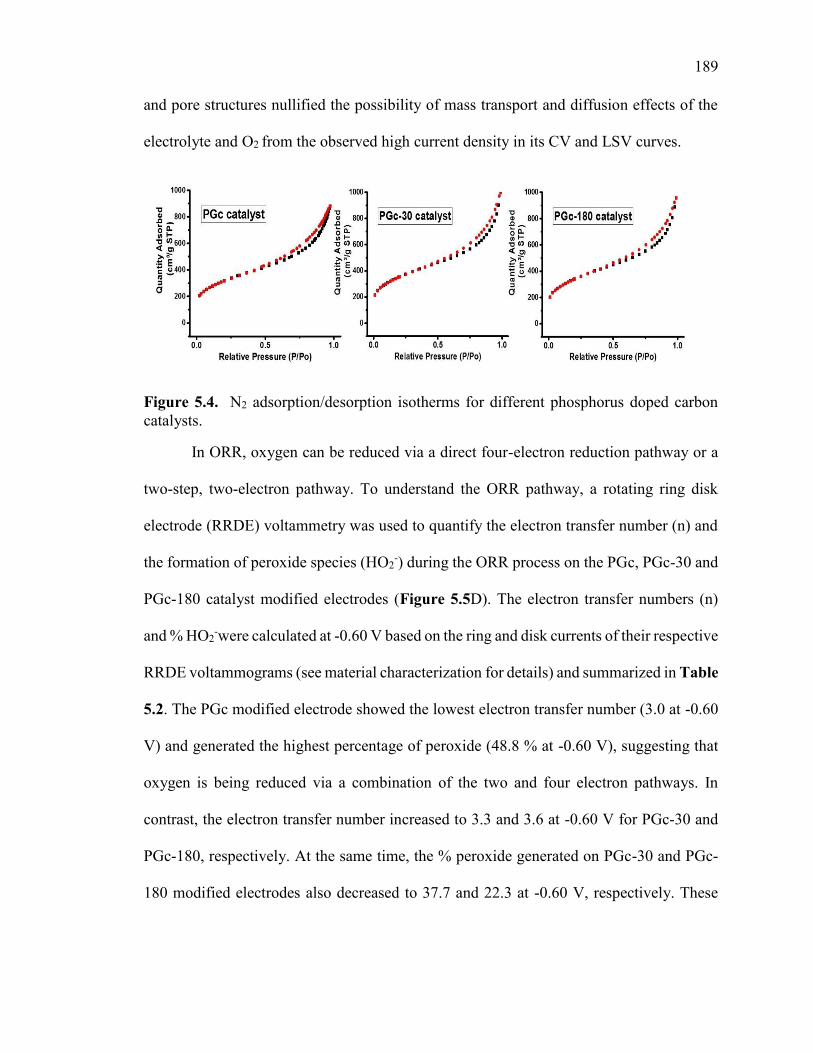
189
and pore structures nullified the possibility of mass transport and diffusion effects of the
electrolyte and O2 from the observed high current density in its CV and LSV curves.
Figure 5.4. N2 adsorption/desorption isotherms for different phosphorus doped carbon catalysts.
In ORR, oxygen can be reduced via a direct four-electron reduction pathway or a
two-step, two-electron pathway. To understand the ORR pathway, a rotating ring disk
electrode (RRDE) voltammetry was used to quantify the electron transfer number (n) and
the formation of peroxide species (HO2-) during the ORR process on the PGc, PGc-30 and
PGc-180 catalyst modified electrodes (Figure 5.5D). The electron transfer numbers (n)
and % HO2-were calculated at -0.60 V based on the ring and disk currents of their respective
RRDE voltammograms (see material characterization for details) and summarized in Table
5.2. The PGc modified electrode showed the lowest electron transfer number (3.0 at -0.60
V) and generated the highest percentage of peroxide (48.8 % at -0.60 V), suggesting that
oxygen is being reduced via a combination of the two and four electron pathways. In
contrast, the electron transfer number increased to 3.3 and 3.6 at -0.60 V for PGc-30 and
PGc-180, respectively. At the same time, the % peroxide generated on PGc-30 and PGc-
180 modified electrodes also decreased to 37.7 and 22.3 at -0.60 V, respectively. These
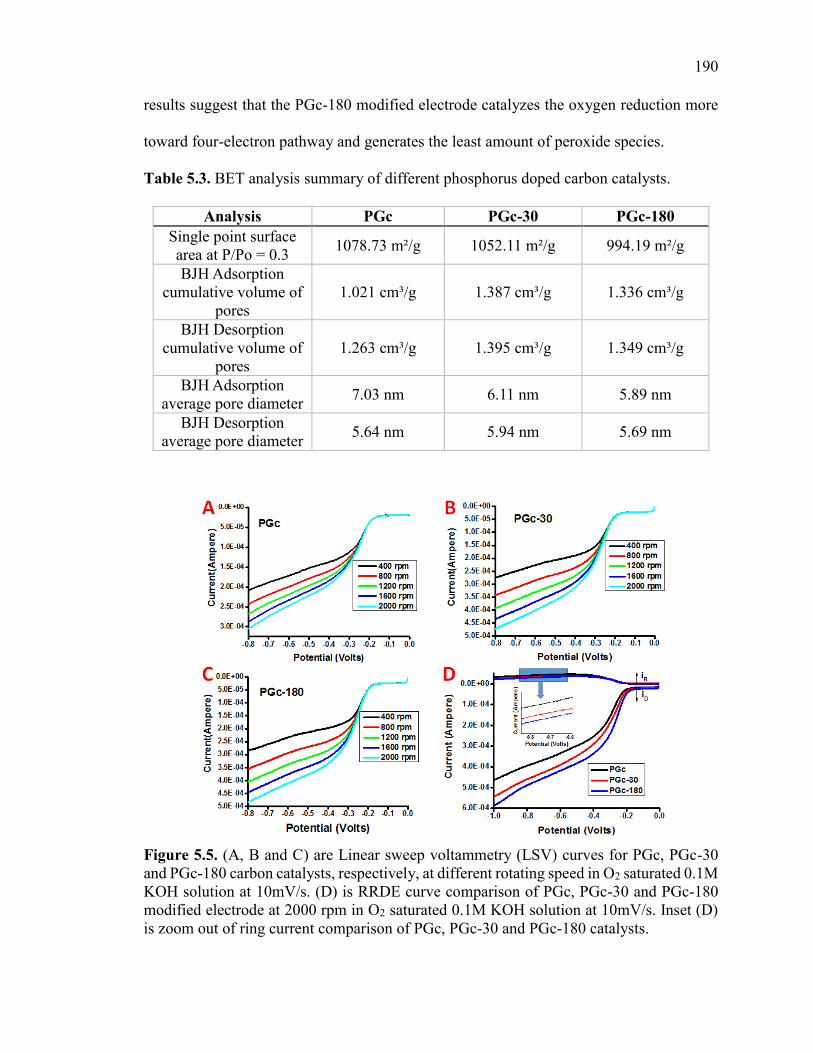
190
results suggest that the PGc-180 modified electrode catalyzes the oxygen reduction more
toward four-electron pathway and generates the least amount of peroxide species.
Table 5.3. BET analysis summary of different phosphorus doped carbon catalysts.
Figure 5.5. (A, B and C) are Linear sweep voltammetry (LSV) curves for PGc, PGc-30 and PGc-180 carbon catalysts, respectively, at different rotating speed in O2 saturated 0.1M KOH solution at 10mV/s. (D) is RRDE curve comparison of PGc, PGc-30 and PGc-180 modified electrode at 2000 rpm in O2 saturated 0.1M KOH solution at 10mV/s. Inset (D) is zoom out of ring current comparison of PGc, PGc-30 and PGc-180 catalysts.
Analysis PGc PGc-30 PGc-180
Single point surface area at P/Po = 0.3
1078.73 m²/g 1052.11 m²/g λλ4.1λ m²/g
BJH Adsorption cumulative volume of
pores 1.021 cm³/g 1.387 cm³/g 1.336 cm³/g
BJH Desorption cumulative volume of
pores 1.263 cm³/g 1.3λ5 cm³/g 1.34λ cm³/g
BJH Adsorption average pore diameter 7.03 nm 6.11 nm 5.8λ nm
BJH Desorption average pore diameter 5.64 nm 5.λ4 nm 5.6λ nm
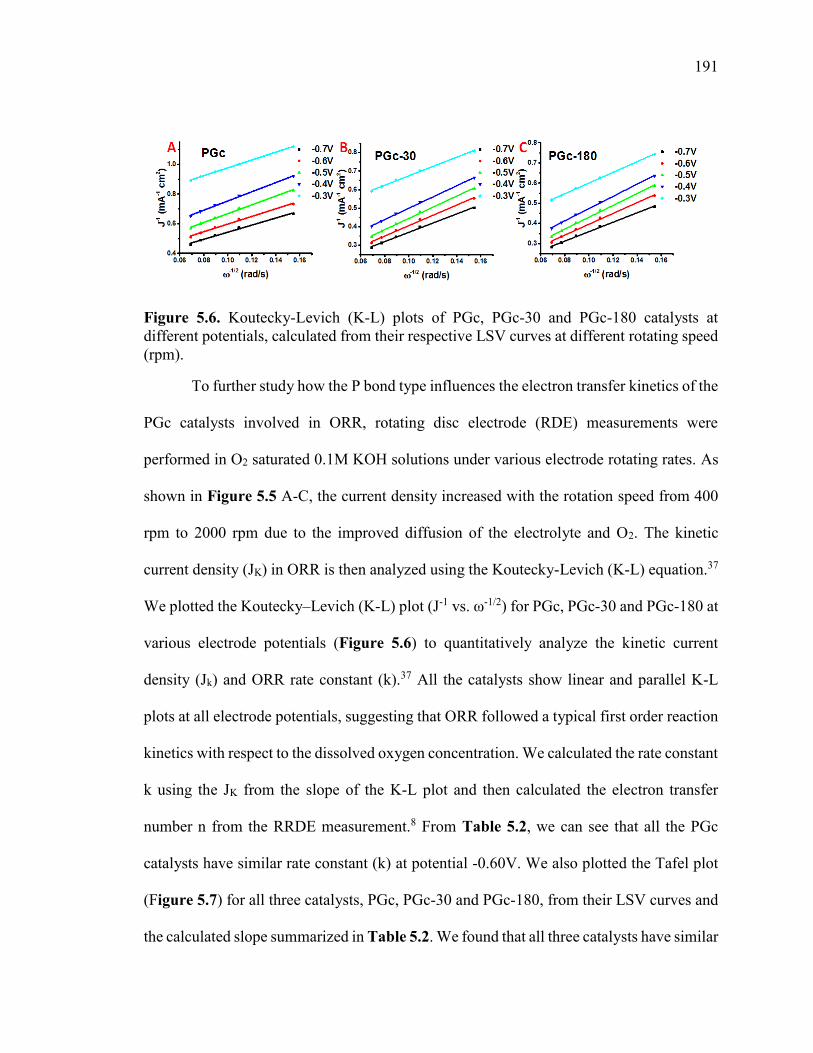
191
Figure 5.6. Koutecky-Levich (K-L) plots of PGc, PGc-30 and PGc-180 catalysts at different potentials, calculated from their respective LSV curves at different rotating speed (rpm).
To further study how the P bond type influences the electron transfer kinetics of the
PGc catalysts involved in ORR, rotating disc electrode (RDE) measurements were
performed in O2 saturated 0.1M KOH solutions under various electrode rotating rates. As
shown in Figure 5.5 A-C, the current density increased with the rotation speed from 400
rpm to 2000 rpm due to the improved diffusion of the electrolyte and O2. The kinetic
current density (JK) in ORR is then analyzed using the Koutecky-Levich (K-L) equation.37
We plotted the Koutecky–Levich (K-L) plot (J-1 vs. ω-1/2) for PGc, PGc-30 and PGc-180 at
various electrode potentials (Figure 5.6) to quantitatively analyze the kinetic current
density (Jk) and ORR rate constant (k).37 All the catalysts show linear and parallel K-L
plots at all electrode potentials, suggesting that ORR followed a typical first order reaction
kinetics with respect to the dissolved oxygen concentration. We calculated the rate constant
k using the JK from the slope of the K-L plot and then calculated the electron transfer
number n from the RRDE measurement.8 From Table 5.2, we can see that all the PGc
catalysts have similar rate constant (k) at potential -0.60V. We also plotted the Tafel plot
(Figure 5.7) for all three catalysts, PGc, PGc-30 and PGc-180, from their LSV curves and
the calculated slope summarized in Table 5.2. We found that all three catalysts have similar
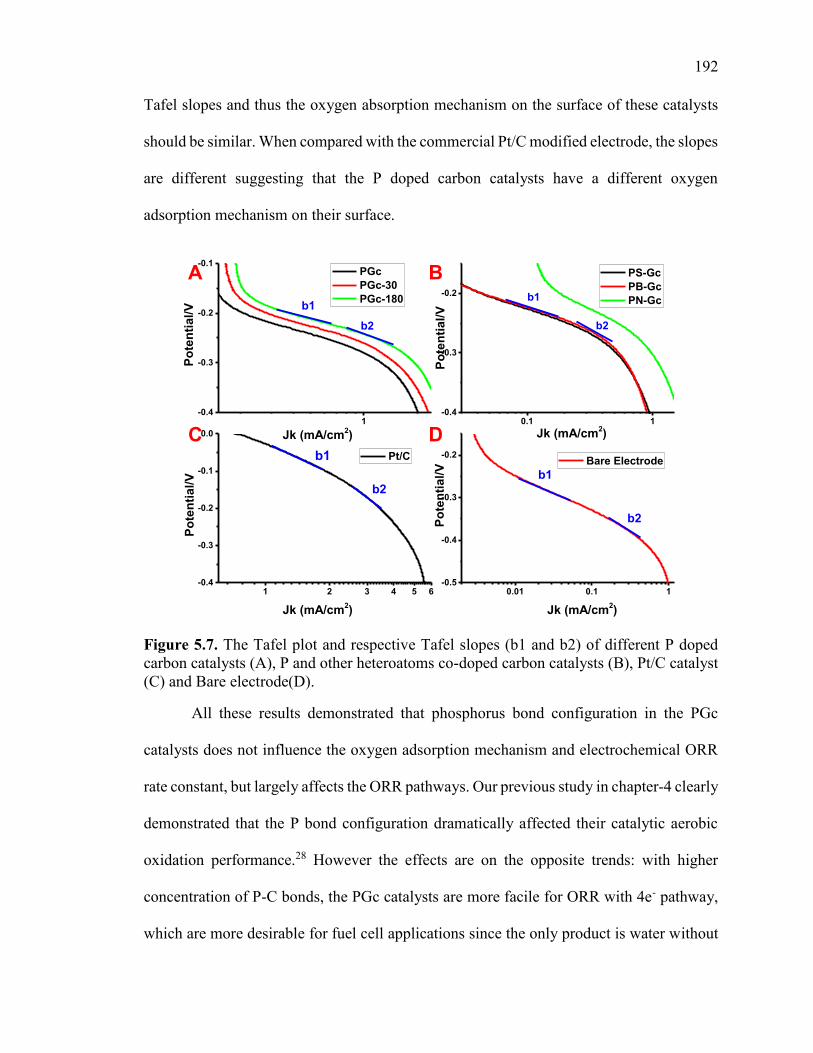
192
Tafel slopes and thus the oxygen absorption mechanism on the surface of these catalysts
should be similar. When compared with the commercial Pt/C modified electrode, the slopes
are different suggesting that the P doped carbon catalysts have a different oxygen
adsorption mechanism on their surface.
Figure 5.7. The Tafel plot and respective Tafel slopes (b1 and b2) of different P doped carbon catalysts (A), P and other heteroatoms co-doped carbon catalysts (B), Pt/C catalyst (C) and Bare electrode(D).
All these results demonstrated that phosphorus bond configuration in the PGc
catalysts does not influence the oxygen adsorption mechanism and electrochemical ORR
rate constant, but largely affects the ORR pathways. Our previous study in chapter-4 clearly
demonstrated that the P bond configuration dramatically affected their catalytic aerobic
oxidation performance.28 However the effects are on the opposite trends: with higher
concentration of P-C bonds, the PGc catalysts are more facile for ORR with 4e- pathway,
which are more desirable for fuel cell applications since the only product is water without
1-0.4
-0.3
-0.2
-0.1
0.1 1-0.4
-0.3
-0.2
1 2 3 4 5 6-0.4
-0.3
-0.2
-0.1
0.0
0.01 0.1 1-0.5
-0.4
-0.3
-0.2
Po
ten
tial/V
Jk (mA/cm2)
PGc
PGc-30
PGc-180b1
b2
A B
C DP
ote
nti
al/V
Jk (mA/cm2)
PS-Gc
PB-Gc
PN-Gcb1
b2
Po
ten
tial/V
Jk (mA/cm2)
Pt/C
b2
b1
Po
ten
tial/V
Jk (mA/cm2)
Bare Electrode
b2
b1
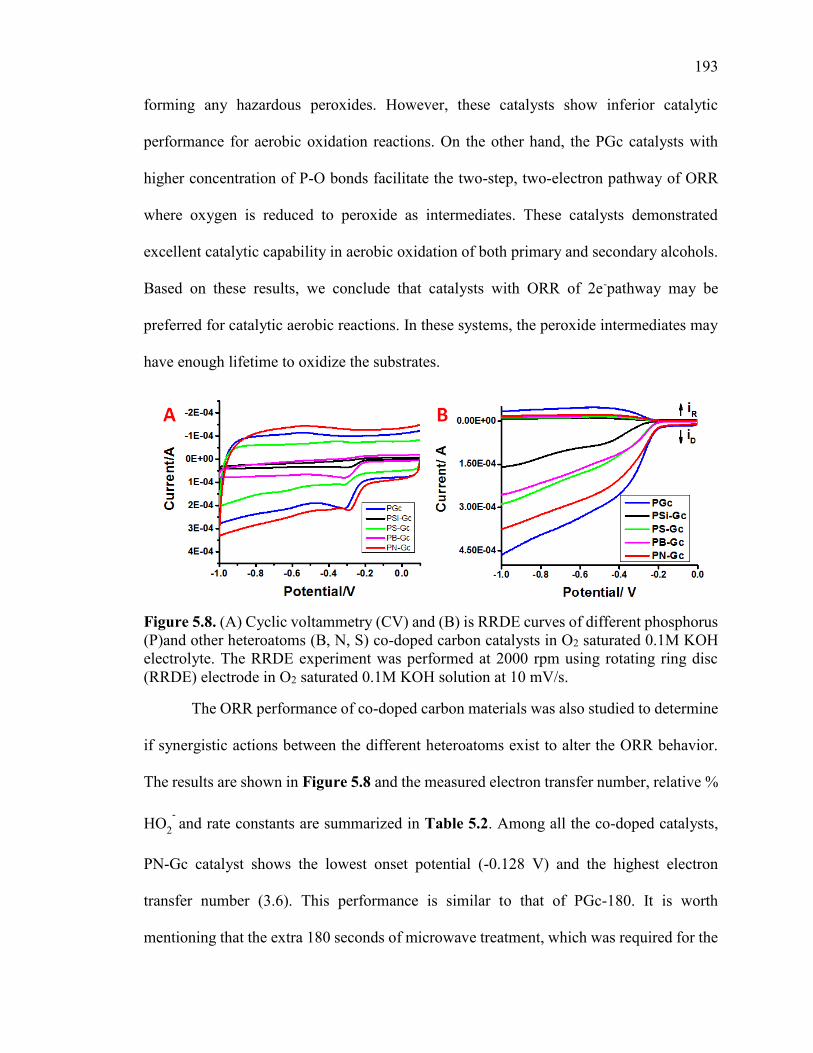
193
forming any hazardous peroxides. However, these catalysts show inferior catalytic
performance for aerobic oxidation reactions. On the other hand, the PGc catalysts with
higher concentration of P-O bonds facilitate the two-step, two-electron pathway of ORR
where oxygen is reduced to peroxide as intermediates. These catalysts demonstrated
excellent catalytic capability in aerobic oxidation of both primary and secondary alcohols.
Based on these results, we conclude that catalysts with ORR of 2e-pathway may be
preferred for catalytic aerobic reactions. In these systems, the peroxide intermediates may
have enough lifetime to oxidize the substrates.
Figure 5.8. (A) Cyclic voltammetry (CV) and (B) is RRDE curves of different phosphorus (P)and other heteroatoms (B, N, S) co-doped carbon catalysts in O2 saturated 0.1M KOH electrolyte. The RRDE experiment was performed at 2000 rpm using rotating ring disc (RRDE) electrode in O2 saturated 0.1M KOH solution at 10 mV/s.
The ORR performance of co-doped carbon materials was also studied to determine
if synergistic actions between the different heteroatoms exist to alter the ORR behavior.
The results are shown in Figure 5.8 and the measured electron transfer number, relative %
HO2- and rate constants are summarized in Table 5.2. Among all the co-doped catalysts,
PN-Gc catalyst shows the lowest onset potential (-0.128 V) and the highest electron
transfer number (3.6). This performance is similar to that of PGc-180. It is worth
mentioning that the extra 180 seconds of microwave treatment, which was required for the
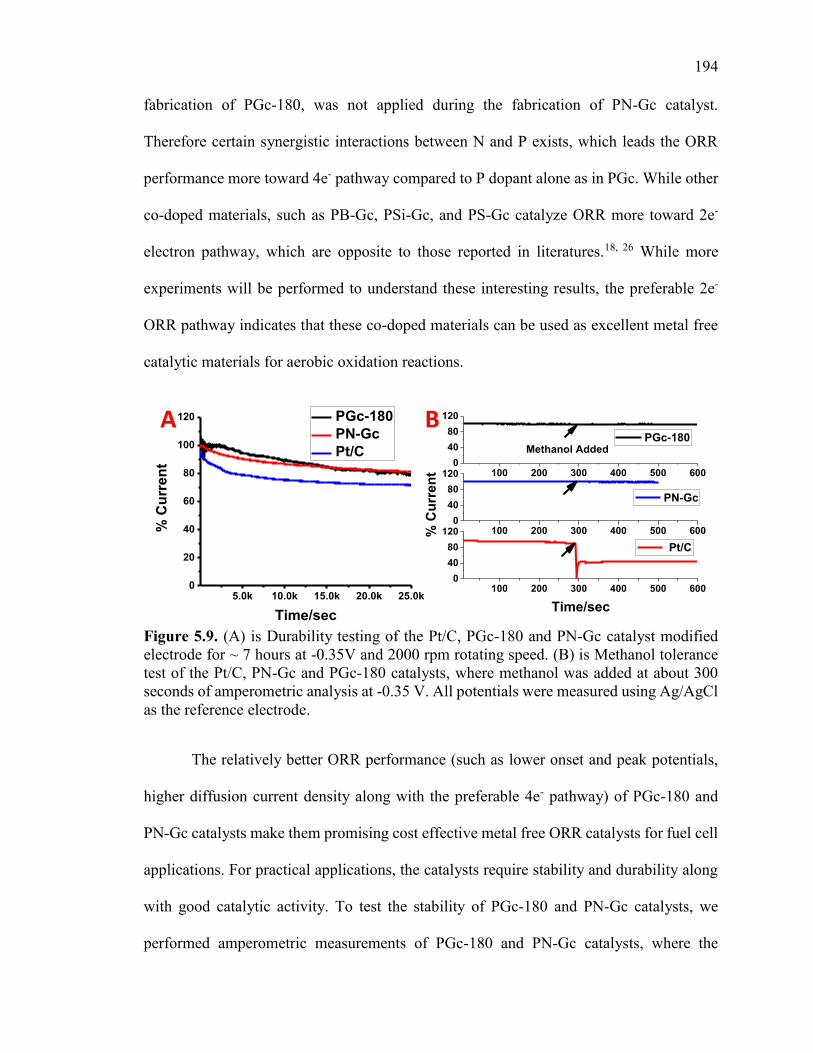
194
fabrication of PGc-180, was not applied during the fabrication of PN-Gc catalyst.
Therefore certain synergistic interactions between N and P exists, which leads the ORR
performance more toward 4e- pathway compared to P dopant alone as in PGc. While other
co-doped materials, such as PB-Gc, PSi-Gc, and PS-Gc catalyze ORR more toward 2e-
electron pathway, which are opposite to those reported in literatures.18, 26 While more
experiments will be performed to understand these interesting results, the preferable 2e-
ORR pathway indicates that these co-doped materials can be used as excellent metal free
catalytic materials for aerobic oxidation reactions.
Figure 5.9. (A) is Durability testing of the Pt/C, PGc-180 and PN-Gc catalyst modified electrode for ~ 7 hours at -0.35V and 2000 rpm rotating speed. (B) is Methanol tolerance test of the Pt/C, PN-Gc and PGc-180 catalysts, where methanol was added at about 300 seconds of amperometric analysis at -0.35 V. All potentials were measured using Ag/AgCl as the reference electrode.
The relatively better ORR performance (such as lower onset and peak potentials,
higher diffusion current density along with the preferable 4e- pathway) of PGc-180 and
PN-Gc catalysts make them promising cost effective metal free ORR catalysts for fuel cell
applications. For practical applications, the catalysts require stability and durability along
with good catalytic activity. To test the stability of PGc-180 and PN-Gc catalysts, we
performed amperometric measurements of PGc-180 and PN-Gc catalysts, where the
5.0k 10.0k 15.0k 20.0k 25.0k0
20
40
60
80
100
120
% C
urr
en
t
Time/sec
PGc-180
PN-Gc
Pt/C
100 200 300 400 500 6000
40
80
120
100 200 300 400 500 6000
40
80
120
100 200 300 400 500 6000
40
80
120% C
urr
en
t PGc-180
Methanol Added
PN-Gc
Time/sec
Pt/C
A B
195
amperometric current was being continuously measured for hours at constant potential of
-0.35 V in 0.1M KOH. From Figure 5.9, we can see that after 7 hours, the amperometric
current decreased by only 20% demonstrating the stability of PGc-180 and PN-Gc
catalysts. Moreover, we have also performed the methanol cross over test for PGc-180 and
PN-Gc catalysts to check its stability against methanol poisoning. In the presence of
methanol, they were much more stable than that of the commercial Pt/C catalyst, where the
catalytic activity was dramatically decreased in presence of methanol possibly due to the
blockage of active sites on Pt nanoparticles by methanol adsorption.38
5.3. Conclusions
In summary, it has been shown that a simple and scalable microwave assisted
approach to synthesize P doped carbon materials can be easily extended for the synthesis
of non-doped porous carbon materials, P and other heteroatoms (B, N, S and Si), dual-
doped porous carbon material, and even triple-doped carbon material (such as B, N, and P
doped). Extensive study on the ORR performance of these carbon materials as a function
of P bond configuration and co-doping type reveals that P doped carbon material with
higher P-C bond type shows better ORR performance. Out of all the co-doped carbon
materials, PN co-doped carbon materials (PN-Gc) shows the best ORR performance among
the others, prone more towards 4e- pathway and less % HO2- generation. P doped carbon
materials with higher P-O bond type and P co-doped with B, Si and S exhibit 2e- ORR
pathway. In the previous chapter-4, we clearly demonstrated the P doped carbon materials
with higher P-O bond type has excellent catalytic performance in aerobic oxidation of
benzyl alcohol to benzyl aldehyde.28 We hypothesize that these B-, Si-, and S- co-doped P
196
carbon materials are possibly good catalytic materials as metal free catalytic materials for
aerobic oxidation reactions, which are still under study.
5.4. Experimental Section
5.4.1. Synthesis of the PGc (Phosphorus doped graphitic carbon), PGc-30 and PGc-
180:
The PGc, PGc-30 and PGc-180 was synthesized as per our previous work.28 In brief, to
synthesize PGc, 1.0 ml of Phytic acid (Sigma Aldrich, 50 w/w% in water) is placed in 35ml
Pyrex glass vessel (CEM, #909036) and closed with Teflon lined cap (CEM, #909235).
Then this assembly is placed in 500 mL beaker, covered with watch glass and heated in
Domestic microwave (1100W, Sanyo-EM-S9515W, 2.45GHz) chamber by apply
microwave irradiation for 40seconds. This procedure results into black carbonized
material, which is left in fume hoods for few minutes to remove any gas that generated
during microwave reaction. After that product is sonicated in ethanol solvent for 5 minute
and filtered via 0.8uM polycarbonate filter paper (Millipore, ATTP 04700). The Product is
washed and clean with water and ethanol (first wash with 250ml ethanol, then subsequent
wash with 500ml water and final wash with 250ml ethanol). Dry this product in vacuum
oven at ~110- 120C overnight before further use.
To synthesize PGc-30 and PGc-180, ~60mg of PGc powder was placed in small
porcelain dish and cover with a piece of watch glass. Then this assembly is heated into
domestic microwave chamber by applying microwave radiation for 10seconds for multiple
times. For example in order to synthesize PGc-30 and PGc-180, 10sec microwave radiation
was applied for 3 and 18 times, respectively. During each interval of applying microwave
radiation, wait for 15 minutes to cool down the material.
197
5.4.2. Synthesis of P and other heteroatoms (N, B, S and Si) co-doped catalysts:
A 1.0 ml of phytic acid (w/w% in water)is mixed with other heteroatom source such that
moles/atomic ratio of all heteroatom dopants stays 1:1 or in other words the mole ratio
between phytic acid and heteroatom dopant molecules is 1:6, because each mole of phytic
acid contains 6 moles of phosphate group. Here, we have shown the examples of P co-
doped with B, N, S and Si. We can also synthesize P, B and N triple-doped carbon material.
P, N co-doped graphitic carbon (PN-Gc) material synthesis:
0.45 ml of ammonia solution was mixed with 1.0 ml of phytic acid in 35ml Pyrex glass
vessel. This vessel is closed with Teflon lined cap and the resultant mixture is heated in the
domestic microwave for 90 sec. After that, the resultant product mixture is left in fume
hood to cool down. Finally the product is filtered, washed and dried as described for PGc
product.
P, S co-doped graphitic carbon (PS-Gc) material synthesis:
A 67.0 mg of amorphous sulfur powder was mixed with 1.0 ml of phytic acid in 35 ml
Pyrex glass vessel by 5 to 10 minute of bath sonication. This vessel is closed with Teflon
lined cap and the resultant mixture is heated in the domestic microwave for 42sec. After
that, the resultant product mixture is left in fume hood to cool down. Finally the product is
filtered, washed and dried as described for PGc product.
P, B co-doped graphitic carbon (PB-Gc) material synthesis:
Aqueous solution of boric acid is prepared via dissolving 230.0 mg of boric acid into 5.0
ml deionized water in 35 ml Pyrex glass vessel. The boric acid solubility in water at room
198
temperature is very low, hence the sample is heated until the boric acid dissolves
completely (around 10mins to reduce the total water volume approx. 2ml). After that, add
1.0 ml of phytic acid and closed with Teflon lined cap. The resultant mixture is heated in
the domestic microwave for 150 sec. The resultant product mixture is left in fume hood to
cool down. Finally the product is filtered, washed and dried as described for the PGc
product.
P, B, N doped carbon (PBN-Gc) material synthesis:
Aqueous dispersion of 4-amino phenyl boric acid is prepared via dispersing it (~ 430 mg)
into 1.0 ml deionized water in 35ml Pyrex glass vessel. This vessel is closed with Teflon
lined cap, followed by short period of sonication to get a uniform suspension. After that,
add 1.0 ml of phytic acid and the resultant mixture is heated in the domestic microwave for
150 sec. The resultant product mixture is left in fume hood to cool down. Finally the
product is filtered, washed and dried as described for the PGc product.
P, Si doped carbon (PSi-Gc) material synthesis:
A 1.0 ml of Phytic acid and 0.125 ml of n-propyl triethoxysilane or tetraethyl orthosilicate
is mixed in 35 ml Pyrex glass vessel. This vessel is closed with Teflon lined cap and then
sonicated to get a uniform suspension. The resulting suspension is heated in the domestic
microwave for 120 sec. The resulting product mixture is left in fume hood to cool down.
Finally the product is filtered, washed and dried as described for the PGc product.
199
5.4.3. Synthesis of P-doped and Non-carbon catalysts using Inositol and phosphoric
acid/sulfuric acid for control experiment.
In this experiment, 200.0 mg of inositol is mixed with concentrated phosphoric acid such
that Inositol to phosphoric acid mole ration become 1:6 on in other ward , carbon to
phosphorus mole ratio become 1:1. This reaction mixture is heated in microwave chamber
for 50 sec. After that, the resultant product mixture is left in fume hood to cool down.
Finally the product is filtered, washed and dried as described for PGc product. A similar
reaction was performed by replacing the concentrated phosphoric acid with sulfuric acid.
5.4.4. Synthesis of sole heteroatoms (B, N, S, or Si) doped carbon materials using
Inositol as carbon (C) source.
To Synthesize different sole heteroatoms (-B, -N, -S, and -Si) doped carbon material,
mixture of ~250 mg of myo-Inositol (act as C source), ~0.6 mL of concentrated sulfuric
acid (act as strong dehydrating agent and microwave absorbing agent) and heteroatom
dopant source is heated in the domestic microwave chamber for specific time. To
synthesize B doped carbon, 500 mg of boric acid is used as B source and heated for 100s
in microwave chamber. To synthesize N-doped carbon, 0.5 ml of concentrated NH4OH
added to above mixture and heated for 60 seconds. To synthesize S-doped carbon, ~67mg
amorphous sulfur was added to above mixture and heated for 60 seconds. To synthesize
Si-doped carbon, 0.25ml of tetraethyl orthosilicate was added to above mixture and heated
for 150 seconds. The resultant product is left in fume hood to cool down and then filtered,
washed and dried as described for PGc product.
200
5.4.5. Electrochemical Characterization:
The electrochemical characterization for all catalysts were conducted through a computer-
controlled CHI 760C potentiostat with a three electrode cell, where a platinum wire and
saturated Ag/AgCl electrode were used as the counter-electrode and the reference
electrode, respectively. A glassy carbon (GC) electrode was used as a working electrode
and was polished each time prior to use with alumina slurry. A catalyst slurry (2mg/ml)
was prepared by sonicating (Bath sonicator, 60minutes) preweighed catalysts in DI water
containing Nafion (0.5 wt %). A 20 µL of this dispersion was drop casted on glassy carbon
electrode and allowed to dry under vacuum. The electrolyte (0.1 M KOH) was saturated
with oxygen (O2) by bubbling O2 for 30 min prior to all experiments. Cyclic voltammetry
experiments were typically performed at the scan rate of 50 mV s−1 in O2 saturated 0.1 M
KOH. For control experiment in oxygen reduction reaction, N2 saturated 0.1 M KOH was
used as an electrolyte while other conditions remain unchanged. A RDE experiments were
performed using RRDE electrode (GC disc- 4mm diameter and Pt ring electrode) in O2
saturated 0.1 M KOH with different rotation speed varying from 250 to 2500 rpm and 10
mV s−1 scan rate. The RRDE measurements were carried by RRDE electrode (GC disc and
Pt ring electrode) in O2 saturated 0.1 M KOH at 2000 rpm and 10 mV s−1 scan rate. The
durability of catalysts were tested using the Chrono-amperometry experiment, where the
current continuously measured for 25 000 s at −0.35 V potential. The rotation speed was
set at 2000 rpm with continues maintaining oxygen flow to avoid any oxygen concentration
effect. The methanol cross over effect for catalysts was also tested via amperometric
experiment. Here in, the current was continuously measured for 700 s with same
experiment condition as for durability testing, but 1 mL of methanol was added at around
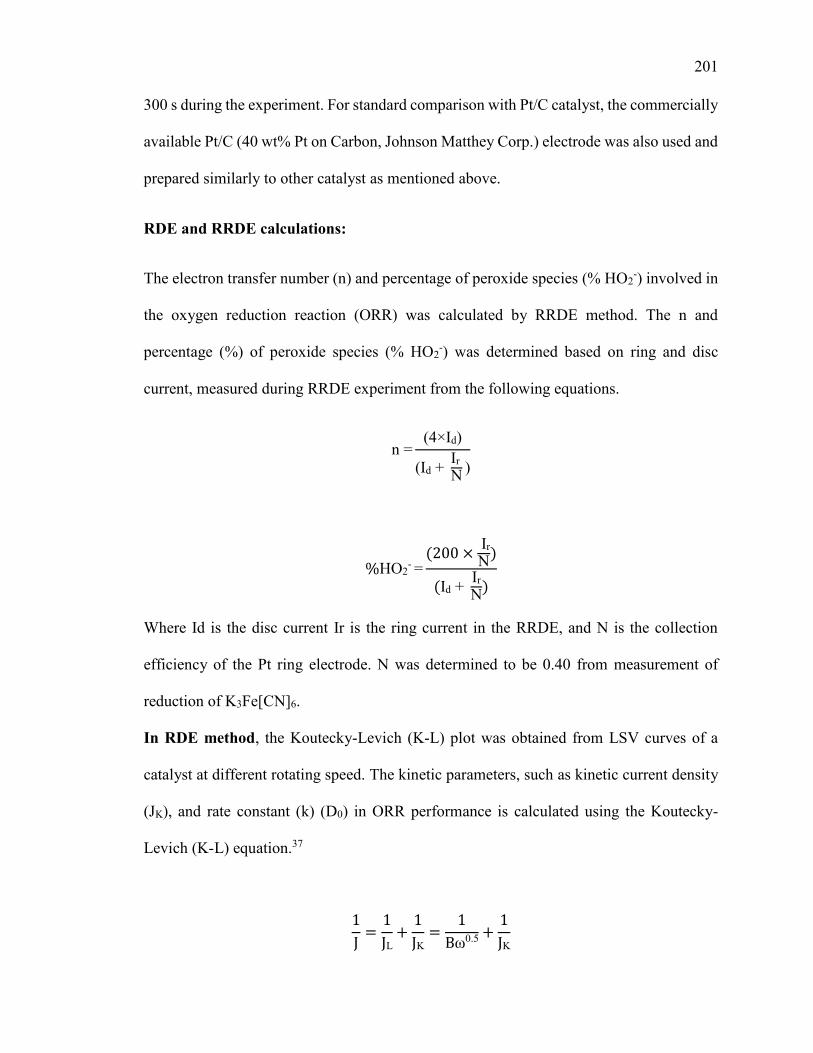
201
300 s during the experiment. For standard comparison with Pt/C catalyst, the commercially
available Pt/C (40 wt% Pt on Carbon, Johnson Matthey Corp.) electrode was also used and
prepared similarly to other catalyst as mentioned above.
RDE and RRDE calculations:
The electron transfer number (n) and percentage of peroxide species (% HO2-) involved in
the oxygen reduction reaction (ORR) was calculated by RRDE method. The n and
percentage (%) of peroxide species (% HO2-) was determined based on ring and disc
current, measured during RRDE experiment from the following equations.
n =(4×Id)
(Id + Ir N )
%HO2- =
× IrN
Id + IrN
Where Id is the disc current Ir is the ring current in the RRDE, and N is the collection
efficiency of the Pt ring electrode. N was determined to be 0.40 from measurement of
reduction of K3Fe[CN]6.
In RDE method, the Koutecky-Levich (K-L) plot was obtained from LSV curves of a
catalyst at different rotating speed. The kinetic parameters, such as kinetic current density
(JK), and rate constant (k) (D0) in ORR performance is calculated using the Koutecky-
Levich (K-L) equation.37
J = JL+ JK
= Bω0.5 + JK
202
Where B = 0.62nFC0(D0)2/3 -1/6 and JK=nFkC0
Here, J is the measured current density, JL and JK are the diffusion limiting and kinetic
limiting current densities, ω is the angular rotation rate of the disc electrode (rad/s), B is
Levich constant, n is the number of electrons transferred in the oxygen reduction reaction,
F is the Faraday constant (F = 96485 C/mol), D0 is the diffusion coefficient (cm2/s), is
the viscosity of the electrolyte (cm2/s), C0 is the oxygen concentration (mol/cm3) and k is
the electron transfer rate constant. The values of k and JK were obtained from the slope and
y-intercept, respectively, of the K-L plots (or J-1 vs. ω -1/2) and using C0 = 1.2 × 10⁻⁶
mol/cm3, D0 = 1.9 × 10⁻⁵ cm 2/s and = 0.01 cm2 /s in the equation.
5.4.6. Material Characterization:
The morphology of porous carbon materials were studied using the scanning electron
microscopy (SEM, Hitachi S-4800). The sample for SEM imaging was prepared by simple
drop casting of the sample on to carbon tape and allowed it for air dry. The heteroatom
doping and atomic % of all elements in the porous carbon was analyzed by Energy
Dispersive X-ray Spectroscopy (EDS) characterization. The sample for EDS imaging was
prepared by simple drop casting of the slurry of a sample on to copper tape and allowed it
for air dry. The surface area of catalysts was measured by Brunauer–Emmett–Teller (BET)
and the pore size was measured using Nitrogen adsorption-desorption isotherm.
Surface Area and pore size measurements by BET and N2 adsorption- desorption
method:
203
The surface area and porosity of phosphorus doped carbon catalysts (PGc, PGc-30 and
PGc-180) were analyzed nitrogen Brunauer–Emmett–Teller (BET) and nitrogen
adsorption-desorption isotherms, respectively. The measurements are carried out at 77K
using Micromeritics ASAP 2020. Each sample was dried by first at room temperature and
then at 100C for overnight under vacuum, prior to measurement. The specific surface area
was calculated using BET method and pore size was calculated using BJH adsorption-
desorption analysis.
5.5. References
1. Hu, H. W.; Xin, J. H.; Hu, H.; Wang, X. W.; Kong, Y. Y. Metal-free graphene-based catalyst-Insight into the catalytic activity: A short review. Applied Catalysis a-
General 2015, 492, 1-9. 2. Cheon, J. Y.; Kim, J. H.; Kim, J. H.; Goddeti, K. C.; Park, J. Y.; Joo, S. H. Intrinsic relationship between enhanced oxygen reduction reaction activity and nanoscale work function of doped carbons. J. Am. Chem. Soc. 2014, 136, 8875-8. 3. Wang, H.; Zhou, Y.; Wu, D.; Liao, L.; Zhao, S.; Peng, H.; Liu, Z. Synthesis of boron-doped graphene monolayers using the sole solid feedstock by chemical vapor deposition. Small 2013, 9, 1316-20. 4. Meng, Y. Y.; Voiry, D.; Goswami, A.; Zou, X. X.; Huang, X. X.; Chhowalla, M.; Liu, Z. W.; Asefa, T. N-, O-, and S-Tridoped Nanoporous Carbons as Selective Catalysts for Oxygen Reduction and Alcohol Oxidation Reactions. J. Am. Chem. Soc. 2014, 136, 13554-13557. 5. Yang, D. S.; Bhattacharjya, D.; Inamdar, S.; Park, J.; Yu, J. S. Phosphorus-Doped Ordered Mesoporous Carbons with Different Lengths as Efficient Metal-Free Electrocatalysts for Oxygen Reduction Reaction in Alkaline Media. J. Am. Chem. Soc.
2012, 134, 16127-16130. 6. Zhang, C.; Mahmood, N.; Yin, H.; Liu, F.; Hou, Y. Synthesis of phosphorus-doped graphene and its multifunctional applications for oxygen reduction reaction and lithium ion batteries. Adv. Mater. 2013, 25, 4932-7. 7. Zhang, X. L.; Lu, Z. S.; Fu, Z. M.; Tang, Y. A.; Ma, D. W.; Yang, Z. X. The mechanisms of oxygen reduction reaction on phosphorus doped graphene: A first-principles study. J. Power Sources 2015, 276, 222-229. 8. Patel, M.; Feng, W.; Savaram, K.; Khoshi, M. R.; Huang, R.; Sun, J.; Rabie, E.; Flach, C.; Mendelsohn, R.; Garfunkel, E.; He, H. Microwave Enabled One-Pot, One-Step Fabrication and Nitrogen Doping of Holey Graphene Oxide for Catalytic Applications. Small 2015, 11, 3358-68.
204
9. Li, R.; Wei, Z. D.; Gou, X. L. Nitrogen and Phosphorus Dual-Doped Graphene/Carbon Nanosheets as Bifunctional Electrocatalysts for Oxygen Reduction and Evolution. Acs Catalysis 2015, 5, 4133-4142. 10. Liu, J.; Song, P.; Ning, Z. G.; Xu, W. L. Recent Advances in Heteroatom-Doped Metal-Free Electrocatalysts for Highly Efficient Oxygen Reduction Reaction. Electrocatalysis 2015, 6, 132-147. 11. Liu, Z. W.; Fu, X.; Li, M.; Wang, F.; Wang, Q. D.; Kang, G. J.; Peng, F. Novel silicon-doped, silicon and nitrogen-codoped carbon nanomaterials with high activity for the oxygen reduction reaction in alkaline medium. Journal of Materials Chemistry A 2015, 3, 3289-3293. 12. Qiao, X. C.; Liao, S. J.; You, C. H.; Chen, R. Phosphorus and Nitrogen Dual Doped and Simultaneously Reduced Graphene Oxide with High Surface Area as Efficient Metal-Free Electrocatalyst for Oxygen Reduction. Catalysts 2015, 5, 981-991. 13. Shi, Q. Q.; Peng, F.; Liao, S. X.; Wang, H. J.; Yu, H.; Liu, Z. W.; Zhang, B. S.; Su, D. S. Sulfur and nitrogen co-doped carbon nanotubes for enhancing electrochemical oxygen reduction activity in acidic and alkaline media. Journal of Materials Chemistry A
2013, 1, 14853-14857. 14. Sun, X.; Xu, J.; Ding, Y.; Zhang, B.; Feng, Z.; Su, D. S. The Effect of Different Phosphorus Chemical States on an Onion-like Carbon Surface for the Oxygen Reduction Reaction. ChemSusChem 2015, 8, 2872-6. 15. Tian, G. L.; Zhang, Q.; Zhang, B. S.; Jin, Y. G.; Huang, J. Q.; Su, D. S.; Wei, F. Toward Full Exposure of "Active Sites": Nanocarbon Electrocatalyst with Surface Enriched Nitrogen for Superior Oxygen Reduction and Evolution Reactivity. Adv. Funct.
Mater. 2014, 24, 5956-5961. 16. Wang, D. W.; Su, D. S. Heterogeneous nanocarbon materials for oxygen reduction reaction. Energy & Environmental Science 2014, 7, 576-591. 17. Shin, H. J.; Choi, W. M.; Choi, D.; Han, G. H.; Yoon, S. M.; Park, H. K.; Kim, S. W.; Jin, Y. W.; Lee, S. Y.; Kim, J. M.; Choi, J. Y.; Lee, Y. H. Control of electronic structure of graphene by various dopants and their effects on a nanogenerator. J. Am. Chem. Soc.
2010, 132, 15603-9. 18. Choi, C. H.; Park, S. H.; Woo, S. I. Binary and ternary doping of nitrogen, boron, and phosphorus into carbon for enhancing electrochemical oxygen reduction activity. ACS
Nano 2012, 6, 7084-91. 19. Choi, C. H.; Park, S. H.; Woo, S. I. Phosphorus-nitrogen dual doped carbon as an effective catalyst for oxygen reduction reaction in acidic media: effects of the amount of P-doping on the physical and electrochemical properties of carbon. J. Mater. Chem. 2012, 22, 12107-12115. 20. Kong, X. K.; Chen, C. L.; Chen, Q. W. Doped graphene for metal-free catalysis. Chem. Soc. Rev. 2014, 43, 2841-57. 21. Latorre-Sanchez, M.; Primo, A.; Garcia, H. P-doped graphene obtained by pyrolysis of modified alginate as a photocatalyst for hydrogen generation from water-methanol mixtures. Angew. Chem. Int. Ed. Engl. 2013, 52, 11813-6. 22. Hulicova-Jurcakova, D.; Puziy, A. M.; Poddubnaya, O. I.; Suarez-Garcia, F.; Tascon, J. M.; Lu, G. Q. Highly stable performance of supercapacitors from phosphorus-enriched carbons. J. Am. Chem. Soc. 2009, 131, 5026-7.
205
23. Puziy, A. M.; Poddubnaya, O. I.; Socha, R. P.; Gurgul, J.; Wisniewski, M. XPS and NMR studies of phosphoric acid activated carbons. Carbon 2008, 46, 2113-2123. 24. Zhao, X. C.; Wang, A. Q.; Yan, J. W.; Sun, G. Q.; Sun, L. X.; Zhang, T. Synthesis and Electrochemical Performance of Heteroatom-Incorporated Ordered Mesoporous Carbons. Chem. Mater. 2010, 22, 5463-5473. 25. Nasini, U. B.; Bairi, V. G.; Ramasahayam, S. K.; Bourdo, S. E.; Viswanathan, T.; Shaikh, A. U. Oxygen Reduction Reaction Studies of Phosphorus and Nitrogen Co-Doped Mesoporous Carbon Synthesized via Microwave Technique. Chemelectrochem 2014, 1, 573-579. 26. Ramasahayam, S. K.; Nasini, U. B.; Bairi, V.; Shaikh, A. U.; Viswanathan, T. Microwave assisted synthesis and characterization of silicon and phosphorous co-doped carbon as an electrocatalyst for oxygen reduction reaction. Rsc Advances 2014, 4, 6306-6313. 27. Guiotoku, M.; Rambo, C. R.; Hotza, D. Charcoal produced from cellulosic raw materials by microwave-assisted hydrothermal carbonization. J. Therm. Anal. Calorim.
2014, 117, 269-275. 28. Patel, M.; Luo, F.; Khoshi, M. R.; Rabie, E.; Zhang, Q.; Flach, C.; Mendelsohn, R.; Garfunkel, E.; Szostak, M.; He, H. P-Doped Porous Carbon as Metal Free Catalysts for Selective Aerobic Oxidation with an Unexpected Mechanism. ACS Nano 2015, 10, 2305-2315. 29. Duan, J. J.; Chen, S.; Jaroniec, M.; Qiao, S. Z. Heteroatom-Doped Graphene-Based Materials for Energy-Relevant Electrocatalytic Processes. Acs Catalysis 2015, 5, 5207-5234. 30. Joshi, R. K.; Carbone, P.; Wang, F. C.; Kravets, V. G.; Su, Y.; Grigorieva, I. V.; Wu, H. A.; Geim, A. K.; Nair, R. R. Precise and Ultrafast Molecular Sieving Through Graphene Oxide Membranes. Science 2014, 343, 752-754. 31. Nasini, U. B.; Bairi, V. G.; Ramasahayam, S. K.; Bourdo, S. E.; Viswanathan, T.; Shaikh, A. U. Phosphorous and nitrogen dual heteroatom doped mesoporous carbon synthesized via microwave method for supercapacitor application. J. Power Sources 2014, 250, 257-265. 32. Zhang, J.; Zhao, Z.; Xia, Z.; Dai, L. A metal-free bifunctional electrocatalyst for oxygen reduction and oxygen evolution reactions. Nat Nanotechnol 2015, 10, 444-52. 33. Primo, A.; Neatu, F.; Florea, M.; Parvulescu, V.; Garcia, H. Graphenes in the absence of metals as carbocatalysts for selective acetylene hydrogenation and alkene hydrogenation. Nat Commun 2014, 5, 5291. 34. Mitsuhashi, N.; Ohnishi, M.; Sekiguchi, Y.; Kwon, Y. U.; Chang, Y. T.; Chung, S. K.; Inoue, Y.; Reid, R. J.; Yagisawa, H.; Mimura, T. Phytic acid synthesis and vacuolar accumulation in suspension-cultured cells of Catharanthus roseus induced by high concentration of inorganic phosphate and cations. Plant Physiol 2005, 138, 1607-14. 35. Raboy, V. The ABCs of low-phytate crops. Nat. Biotechnol. 2007, 25, 874-5. 36. Anderson, R. Synthesis of phytic acid. J. Biol. Chem. 1920, 43, 117-128. 37. Liu, R.; Wu, D.; Feng, X.; Mullen, K. Nitrogen-doped ordered mesoporous graphitic arrays with high electrocatalytic activity for oxygen reduction. Angew. Chem. Int.
Ed. Engl. 2010, 49, 2565-9.

206
38. Zhang, Y.; Huang, Q. H.; Zou, Z. Q.; Yang, J. F.; Vogel, W.; Yang, H. Enhanced Durability of Au Cluster Decorated Pt Nanoparticles for the Oxygen Reduction Reaction. Journal of Physical Chemistry C 2010, 114, 6860-6868.
207
Chapter 6. Phosphorus and Sulfur Dual-Doped Graphitic
Porous Carbon Metal-Free Catalysts for Aerobic Oxidation
Reactions: Enhanced Catalytic Activity and Active Sites.
6.1. Introduction
In the drive towards green and sustainable chemistry, using molecule oxygen as the sole
oxidant and metal free carbon-based materials as eco-friendly, abundant, and readily
available heterogeneous catalysts are attractive for chemical synthesis.1-9 Among these,
carbon-based materials such as graphene and porous graphitic materials are actively being
pursued recently due to their large surface area, tunable electronic and surface properties,
and most importantly, the easy accessibility of a large amount of materials without metal
contamination. Since the pioneering work by Bielawski’s group using graphene oxide (GO,
oxygen doped graphene) as a catalyst for chemoselective oxidation of alcohols under mild
conditions,10 other heteroatoms, such as N-doped, B-doped and N,B-codoped graphitic
carbon materials have been exploited to oxidize petroleum molecules to value-added
compounds.6, 7, 9, 11 Recently, we have also exploited P-doped graphitic porous carbon
materials as metal-free catalysts for aerobic oxidation of benzyl alcohol.12 It can selectively
oxidize both primary and secondary benzyl alcohols to the corresponding aldehydes or
ketones. This is different from N-doped graphitic materials, which can only oxidize
primary benzyl alcohol to an aldehyde.11 We attributed this difference to the “protruding
out” structure of P, compared to the planar structure of N in the carbon matrix, which
minimized the steric hindrance for secondary alcohol to access the catalytic centers.
Further, to our surprise, the P-doped carbon materials with higher work functions shows
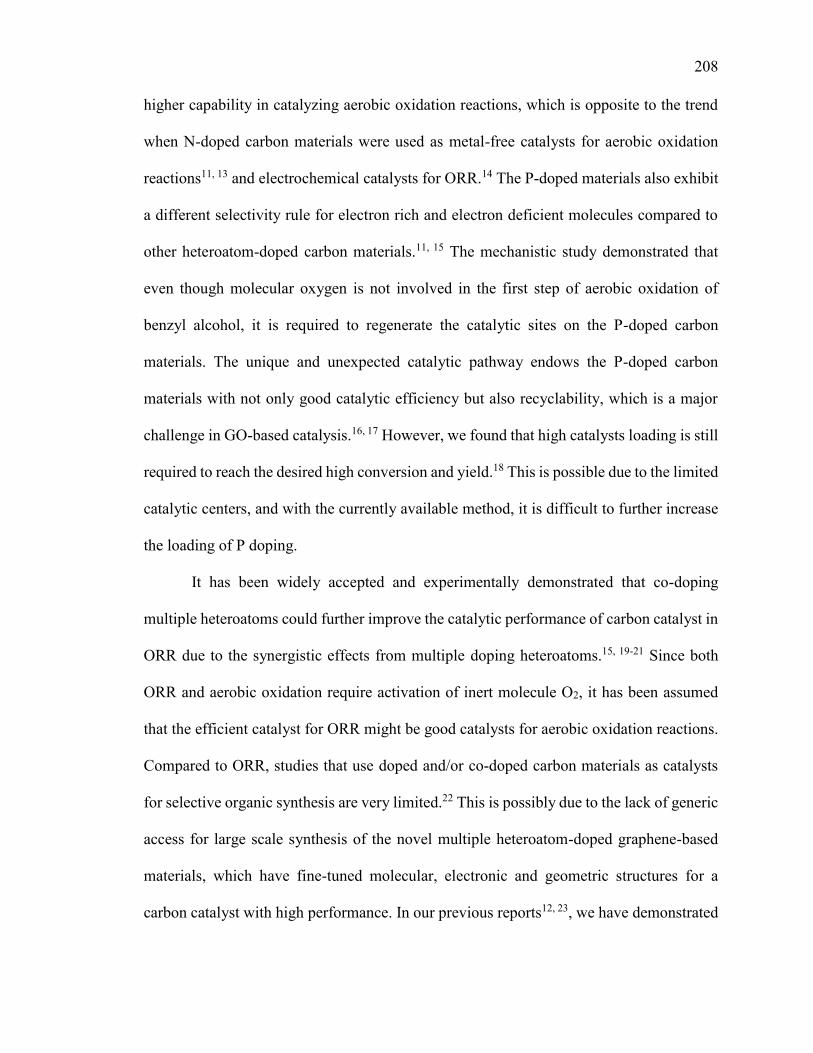
208
higher capability in catalyzing aerobic oxidation reactions, which is opposite to the trend
when N-doped carbon materials were used as metal-free catalysts for aerobic oxidation
reactions11, 13 and electrochemical catalysts for ORR.14 The P-doped materials also exhibit
a different selectivity rule for electron rich and electron deficient molecules compared to
other heteroatom-doped carbon materials.11, 15 The mechanistic study demonstrated that
even though molecular oxygen is not involved in the first step of aerobic oxidation of
benzyl alcohol, it is required to regenerate the catalytic sites on the P-doped carbon
materials. The unique and unexpected catalytic pathway endows the P-doped carbon
materials with not only good catalytic efficiency but also recyclability, which is a major
challenge in GO-based catalysis.16, 17 However, we found that high catalysts loading is still
required to reach the desired high conversion and yield.18 This is possible due to the limited
catalytic centers, and with the currently available method, it is difficult to further increase
the loading of P doping.
It has been widely accepted and experimentally demonstrated that co-doping
multiple heteroatoms could further improve the catalytic performance of carbon catalyst in
ORR due to the synergistic effects from multiple doping heteroatoms.15, 19-21 Since both
ORR and aerobic oxidation require activation of inert molecule O2, it has been assumed
that the efficient catalyst for ORR might be good catalysts for aerobic oxidation reactions.
Compared to ORR, studies that use doped and/or co-doped carbon materials as catalysts
for selective organic synthesis are very limited.22 This is possibly due to the lack of generic
access for large scale synthesis of the novel multiple heteroatom-doped graphene-based
materials, which have fine-tuned molecular, electronic and geometric structures for a
carbon catalyst with high performance. In our previous reports12, 23, we have demonstrated
209
that by combining the unique heating properties of microwave with the strong microwave
absorption power of phytic acid, a biomass molecule present in plant tissue such as brans
of grain and seed, P-doped porous carbon can be directly synthesized from the phytic acid
by very short microwave irradiation (40 seconds). In addition to that, it has been also
demonstrated that by simply mixing the other heteroatom (N, S, B) sources (such as
ammonium hydroxide -N source, amorphous sulfur -S source, boric acid -B source) with
phytic acid prior to microwave heating, we can also synthesize various P-coped porous
carbon materials. This as synthesized co-doped porous carbon materials such as P-N, P-S,
and P-B co-doped porous carbon materials, denoted as PN-Gc, PS-Gc, and PB-Gc,
respectively.
By taking the advantage of this simple technique to synthesize these co-doped
carbon materials, in this chapter, we have compared the catalytic performance of these co-
doped carbon catalysts (PN-Gc, PS-Gc and PB-Gc) for benzylic alcohol oxidation and
found that PS-Gc catalyst shows the most improved catalytic performance compared to
single doped (S-Gc and P-Gc) and co-doped carbon catalysts (PB-Gc and PN-Gc). The
detailed characterization and control experiments were performed to gain understanding
about the catalytic centers in the PS-Gc catalyst and their mechanism to catalyze the
benzylic alcohol oxidation reaction.
6.2. Results and Discussion
For large scale synthesis of valuable chemicals in industry, solvent free reactions
are highly preferred to eliminate additional cost related to the use and handling of reaction
solvents. Therefore, our catalytic studies of these P-codoped carbon materials were
performed in solvent-free reaction conditions. Firstly, we have compared the catalytic
210
efficiency of the various as synthesized P co-doped porous carbon catalysts for selective
oxidation of benzyl alcohol to benzaldehyde at 80°C for 48 hours. As we can see from the
Table 6.1, benzyl alcohol oxidation cannot proceed efficiently in the absence of a catalyst
(entry 1), in the presence of carbon-based catalysts without heteroatom doping (rGO or
non-doped carbon), and or with heteroatom S source (amorphous sulfur for PS-Gc
synthesis). The PS-Gc and PN-Gc show much improved catalytic efficiency (~54% and
~35% conversion, respectively) than P-Gc (~21% conversion). Surprisingly, codoping of
B with P (PB-Gc) deteriorates the catalytic activity of P-Gc to ~4% conversion for benzyl
alcohol oxidation. This may be due to the formation of P-B type functionalities during B
doping, which destroys the catalytic sites similar the scenario in N, B-codoped carbon
catalysts24. It is also possible that the electron deficient nature of B makes the catalyst less
electron rich and deactivates the catalytic activity of catalytic centers in P-Gc. Based on
the above results it was concluded that PS-Gc shows the most improved catalytic
performance toward benzyl alcohol oxidation among all the P co-doped carbon catalysts
(PS-Gc, PN-Gc, and PB-Gc). To know whether the improved catalytic performance of PS-
Gc is due to a synergistic effect or an additive effect of two different heteroatoms (P and
S), we have synthesized the P-doped carbon (P-Gc) and S-doped carbon (S-Gc) and tested
their catalytic performance toward benzyl alcohol oxidation. From the results listed in
Table 6.1, it is clear that PS-Gc codoped carbon catalysts shows higher conversion (~54%)
than the addition of the conversion from P and S only doped carbon catalysis (P-Gc (~21%)
and S-Gc (18%)), which suggests that the P and S heteroatom doping in PS-Gc imparts
addition as well as synergistic effects. Because of the unique and enhanced catalytic effect
of PS-Gc catalyst, in this chapter we will focus on the studies of the unique structure of
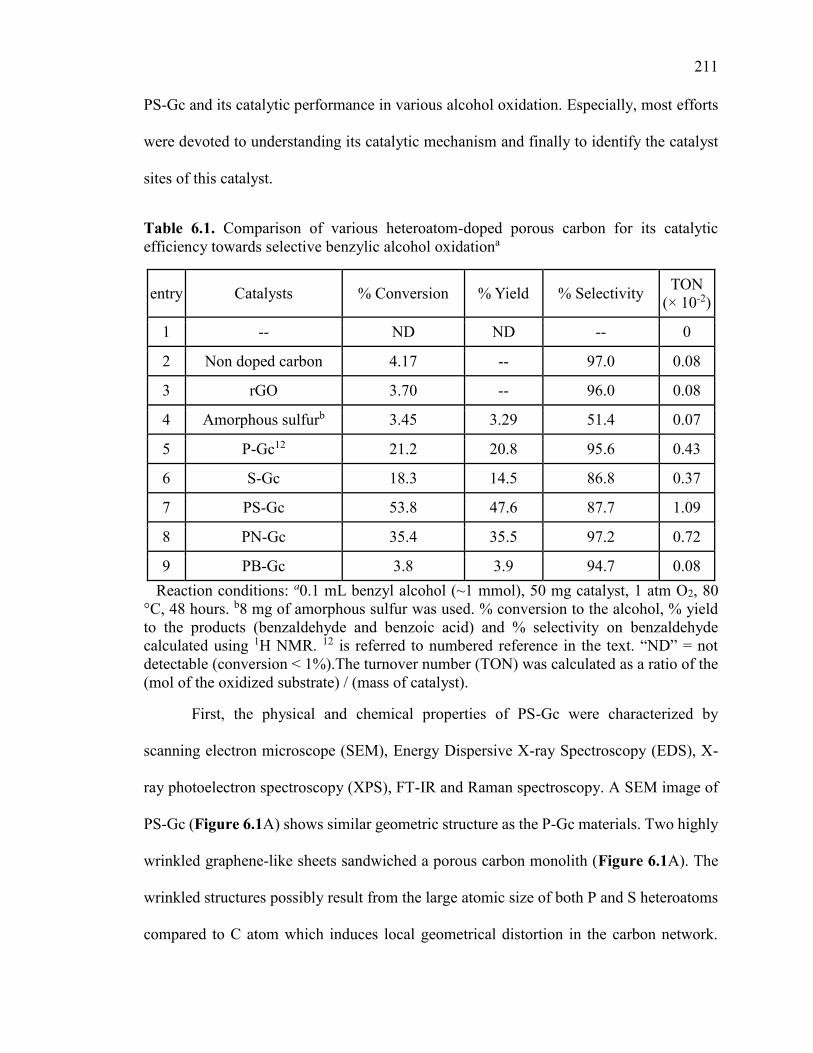
211
PS-Gc and its catalytic performance in various alcohol oxidation. Especially, most efforts
were devoted to understanding its catalytic mechanism and finally to identify the catalyst
sites of this catalyst.
Table 6.1. Comparison of various heteroatom-doped porous carbon for its catalytic efficiency towards selective benzylic alcohol oxidationa
entry Catalysts % Conversion % Yield % Selectivity TON
(× 10-2)
1 -- ND ND -- 0
2 Non doped carbon 4.17 -- λ7.0 0.08
3 rGO 3.70 -- λ6.0 0.08
4 Amorphous sulfurb 3.45 3.2λ 51.4 0.07
5 P-Gc12 21.2 20.8 λ5.6 0.43
6 S-Gc 18.3 14.5 86.8 0.37
7 PS-Gc 53.8 47.6 87.7 1.09
8 PN-Gc 35.4 35.5 λ7.2 0.72
λ PB-Gc 3.8 3.λ λ4.7 0.08
Reaction conditions: a0.1 mL benzyl alcohol (~1 mmol), 50 mg catalyst, 1 atm O2, 80 °C, 48 hours. b8 mg of amorphous sulfur was used. % conversion to the alcohol, % yield to the products (benzaldehyde and benzoic acid) and % selectivity on benzaldehyde calculated using 1H NMR. 12 is referred to numbered reference in the text. “ND” = not detectable (conversion < 1%).The turnover number (TON) was calculated as a ratio of the (mol of the oxidized substrate) / (mass of catalyst).
First, the physical and chemical properties of PS-Gc were characterized by
scanning electron microscope (SEM), Energy Dispersive X-ray Spectroscopy (EDS), X-
ray photoelectron spectroscopy (XPS), FT-IR and Raman spectroscopy. A SEM image of
PS-Gc (Figure 6.1A) shows similar geometric structure as the P-Gc materials. Two highly
wrinkled graphene-like sheets sandwiched a porous carbon monolith (Figure 6.1A). The
wrinkled structures possibly result from the large atomic size of both P and S heteroatoms
compared to C atom which induces local geometrical distortion in the carbon network.
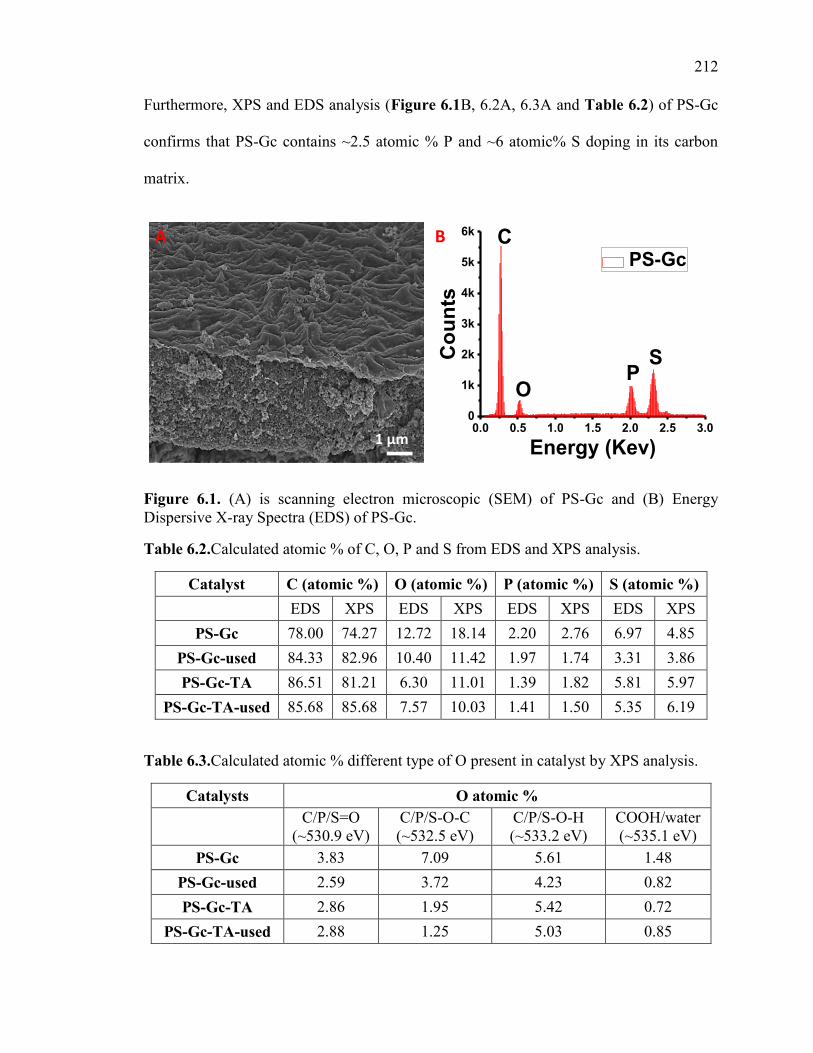
212
Furthermore, XPS and EDS analysis (Figure 6.1B, 6.2A, 6.3A and Table 6.2) of PS-Gc
confirms that PS-Gc contains ~2.5 atomic % P and ~6 atomic% S doping in its carbon
matrix.
Figure 6.1. (A) is scanning electron microscopic (SEM) of PS-Gc and (B) Energy Dispersive X-ray Spectra (EDS) of PS-Gc.
Table 6.2.Calculated atomic % of C, O, P and S from EDS and XPS analysis.
Catalyst C (atomic %) O (atomic %) P (atomic %) S (atomic %)
EDS XPS EDS XPS EDS XPS EDS XPS
PS-Gc 78.00 74.27 12.72 18.14 2.20 2.76 6.97 4.85
PS-Gc-used 84.33 82.96 10.40 11.42 1.97 1.74 3.31 3.86
PS-Gc-TA 86.51 81.21 6.30 11.01 1.39 1.82 5.81 5.97
PS-Gc-TA-used 85.68 85.68 7.57 10.03 1.41 1.50 5.35 6.19
Table 6.3.Calculated atomic % different type of O present in catalyst by XPS analysis.
Catalysts O atomic %
C/P/S=O
(~530.9 eV) C/P/S-O-C (~532.5 eV)
C/P/S-O-H (~533.2 eV)
COOH/water (~535.1 eV)
PS-Gc 3.83 7.09 5.61 1.48
PS-Gc-used 2.59 3.72 4.23 0.82
PS-Gc-TA 2.86 1.95 5.42 0.72
PS-Gc-TA-used 2.88 1.25 5.03 0.85
1 μm0.0 0.5 1.0 1.5 2.0 2.5 3.0
0
1k
2k
3k
4k
5k
6k
Co
un
tsEnergy (Kev)
PS-Gc
S
OP
CA B

213
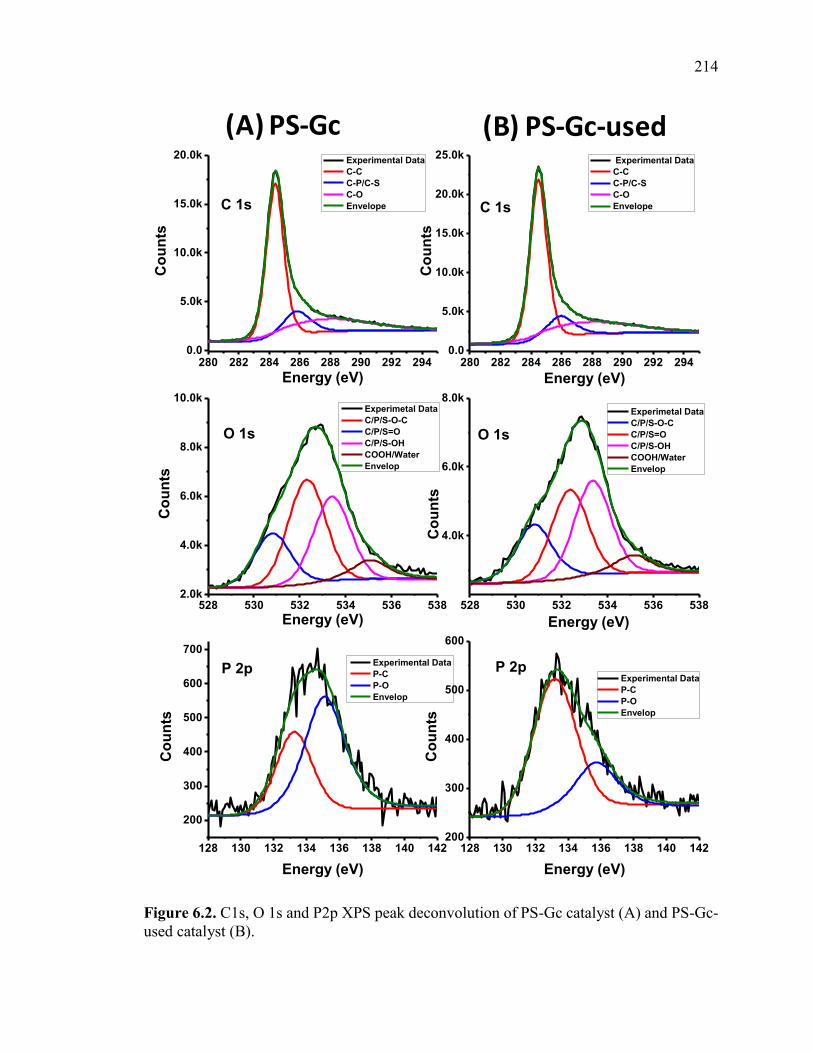
214
Figure 6.2. C1s, O 1s and P2p XPS peak deconvolution of PS-Gc catalyst (A) and PS-Gc-used catalyst (B).
280 282 284 286 288 290 292 2940.0
5.0k
10.0k
15.0k
20.0k
280 282 284 286 288 290 292 2940.0
5.0k
10.0k
15.0k
20.0k
25.0k
Experimetal Data
C/P/S-O-C
C/P/S=O
C/P/S-OH
COOH/Water
Envelop
528 530 532 534 536 5382.0k
4.0k
6.0k
8.0k
10.0k
528 530 532 534 536 538
4.0k
6.0k
8.0k
Experimental Data
P-C
P-O
Envelop
128 130 132 134 136 138 140 142
200
300
400
500
600
700
128 130 132 134 136 138 140 142200
300
400
500
600
Co
un
ts
Energy (eV)
Experimental Data
C-C
C-P/C-S
C-O
EnvelopeC 1s C 1s
Co
un
ts
Energy (eV)
Experimental Data
C-C
C-P/C-S
C-O
Envelope
Co
un
ts
Energy (eV)
O 1s O 1sC
ou
nts
Energy (eV)
Experimetal Data
C/P/S-O-C
C/P/S=O
C/P/S-OH
COOH/Water
Envelop
Co
un
ts
Energy (eV)
P 2pP 2p
Co
un
ts
Energy (eV)
Experimental Data
P-C
P-O
Envelop
(A) PS-Gc (B) PS-Gc-used
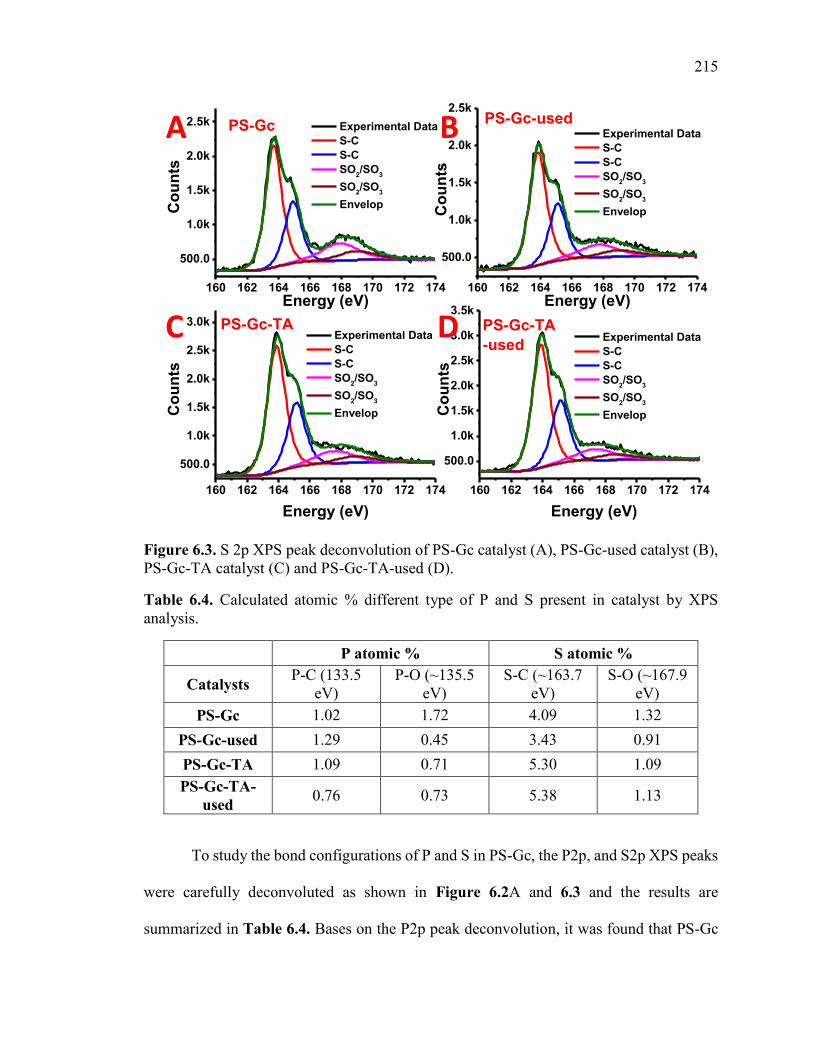
215
Figure 6.3. S 2p XPS peak deconvolution of PS-Gc catalyst (A), PS-Gc-used catalyst (B), PS-Gc-TA catalyst (C) and PS-Gc-TA-used (D).
Table 6.4. Calculated atomic % different type of P and S present in catalyst by XPS analysis.
P atomic % S atomic %
Catalysts P-C (133.5
eV) P-O (~135.5
eV) S-C (~163.7
eV) S-O (~167.9
eV)
PS-Gc 1.02 1.72 4.09 1.32
PS-Gc-used 1.29 0.45 3.43 0.91
PS-Gc-TA 1.09 0.71 5.30 1.09
PS-Gc-TA-
used 0.76 0.73 5.38 1.13
To study the bond configurations of P and S in PS-Gc, the P2p, and S2p XPS peaks
were carefully deconvoluted as shown in Figure 6.2A and 6.3 and the results are
summarized in Table 6.4. Bases on the P2p peak deconvolution, it was found that PS-Gc
160 162 164 166 168 170 172 174
500.0
1.0k
1.5k
2.0k
2.5k
160 162 164 166 168 170 172 174
500.0
1.0k
1.5k
2.0k
2.5k
160 162 164 166 168 170 172 174
500.0
1.0k
1.5k
2.0k
2.5k
3.0k
160 162 164 166 168 170 172 174
500.0
1.0k
1.5k
2.0k
2.5k
3.0k
3.5k
PS-Gc
Co
un
ts
Energy (eV)
Experimental Data
S-C
S-C
SO2/SO
3
SO2/SO
3
Envelop
PS-Gc-used
Co
un
ts
Energy (eV)
Experimental Data
S-C
S-C
SO2/SO
3
SO2/SO
3
Envelop
PS-Gc-TA
Co
un
ts
Energy (eV)
Experimental Data
S-C
S-C
SO2/SO
3
SO2/SO
3
Envelop
PS-Gc-TA
-used
Co
un
ts
Energy (eV)
Experimental Data
S-C
S-C
SO2/SO
3
SO2/SO
3
Envelop
A B
C D
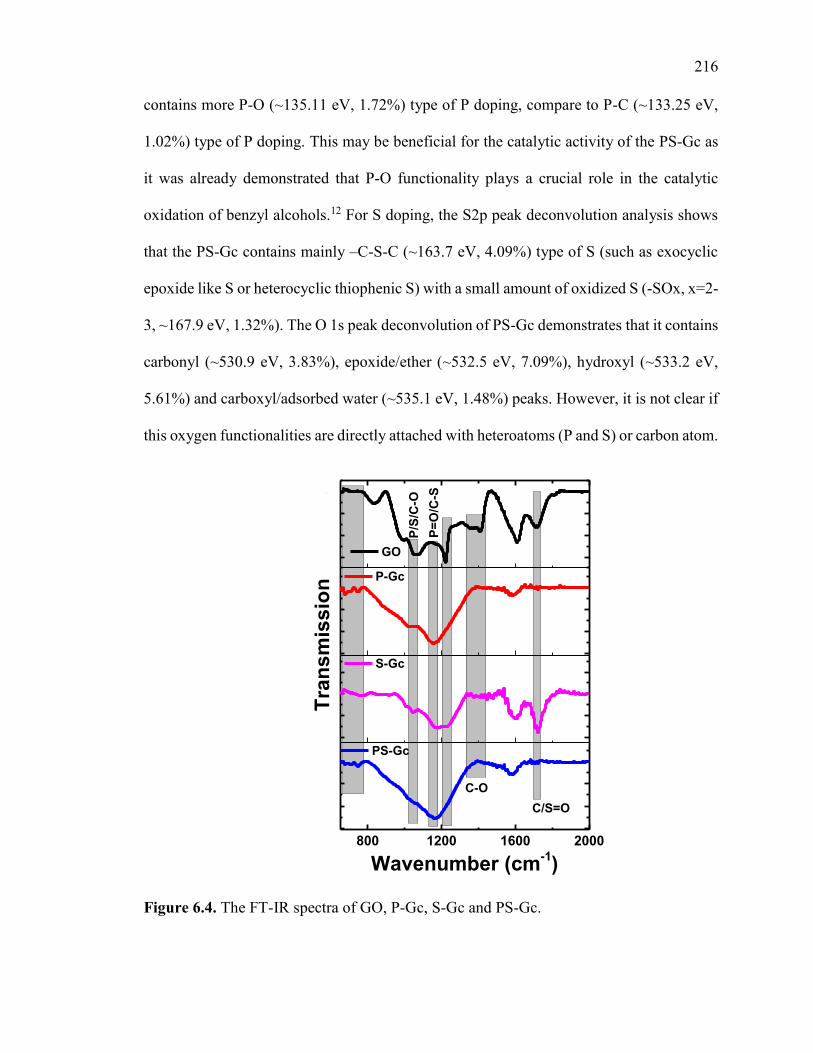
216
contains more P-O (~135.11 eV, 1.72%) type of P doping, compare to P-C (~133.25 eV,
1.02%) type of P doping. This may be beneficial for the catalytic activity of the PS-Gc as
it was already demonstrated that P-O functionality plays a crucial role in the catalytic
oxidation of benzyl alcohols.12 For S doping, the S2p peak deconvolution analysis shows
that the PS-Gc contains mainly –C-S-C (~163.7 eV, 4.09%) type of S (such as exocyclic
epoxide like S or heterocyclic thiophenic S) with a small amount of oxidized S (-SOx, x=2-
3, ~167.9 eV, 1.32%). The O 1s peak deconvolution of PS-Gc demonstrates that it contains
carbonyl (~530.9 eV, 3.83%), epoxide/ether (~532.5 eV, 7.09%), hydroxyl (~533.2 eV,
5.61%) and carboxyl/adsorbed water (~535.1 eV, 1.48%) peaks. However, it is not clear if
this oxygen functionalities are directly attached with heteroatoms (P and S) or carbon atom.
Figure 6.4. The FT-IR spectra of GO, P-Gc, S-Gc and PS-Gc.
800 1200 1600 2000
GO
Tra
ns
mis
sio
n
P-Gc
S-Gc
C-O
P/S
/C-O
P=
O/C
-S
Wavenumber (cm-1)
PS-Gc
C/S=O
1
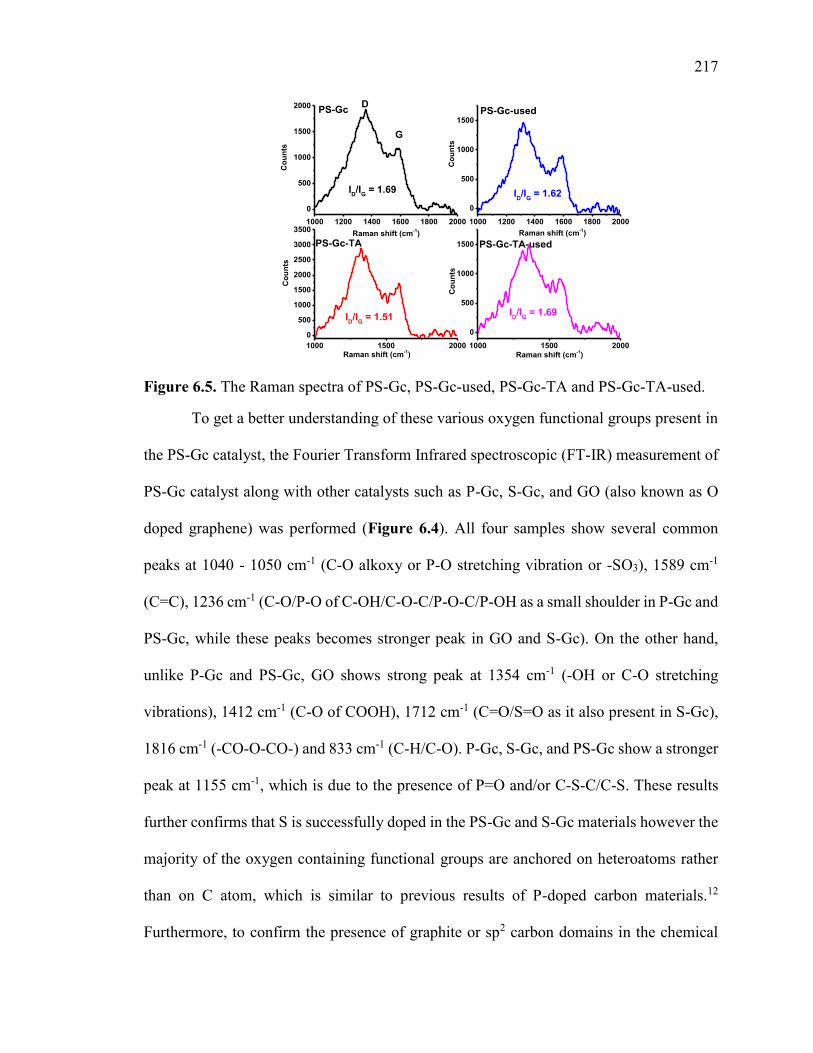
217
Figure 6.5. The Raman spectra of PS-Gc, PS-Gc-used, PS-Gc-TA and PS-Gc-TA-used.
To get a better understanding of these various oxygen functional groups present in
the PS-Gc catalyst, the Fourier Transform Infrared spectroscopic (FT-IR) measurement of
PS-Gc catalyst along with other catalysts such as P-Gc, S-Gc, and GO (also known as O
doped graphene) was performed (Figure 6.4). All four samples show several common
peaks at 1040 - 1050 cm-1 (C-O alkoxy or P-O stretching vibration or -SO3), 1589 cm-1
(C=C), 1236 cm-1 (C-O/P-O of C-OH/C-O-C/P-O-C/P-OH as a small shoulder in P-Gc and
PS-Gc, while these peaks becomes stronger peak in GO and S-Gc). On the other hand,
unlike P-Gc and PS-Gc, GO shows strong peak at 1354 cm-1 (-OH or C-O stretching
vibrations), 1412 cm-1 (C-O of COOH), 1712 cm-1 (C=O/S=O as it also present in S-Gc),
1816 cm-1 (-CO-O-CO-) and 833 cm-1 (C-H/C-O). P-Gc, S-Gc, and PS-Gc show a stronger
peak at 1155 cm-1, which is due to the presence of P=O and/or C-S-C/C-S. These results
further confirms that S is successfully doped in the PS-Gc and S-Gc materials however the
majority of the oxygen containing functional groups are anchored on heteroatoms rather
than on C atom, which is similar to previous results of P-doped carbon materials.12
Furthermore, to confirm the presence of graphite or sp2 carbon domains in the chemical
1000 1200 1400 1600 1800 2000
0
500
1000
1500
2000
1000 1200 1400 1600 1800 2000
0
500
1000
1500
PS-Gc-TA
1000 1500 2000
0
500
1000
1500
2000
2500
3000
3500
PS-Gc-TA-used
1000 1500 2000
0
500
1000
1500
G
D
ID/I
G = 1.69
ID/I
G = 1.51
ID/I
G = 1.62
Co
un
ts
Co
un
ts
Raman shift (cm-1)
Co
un
ts
Co
un
ts
Raman shift (cm-1)
PS-Gc
ID/I
G = 1.69
PS-Gc-used
Raman shift (cm-1)Raman shift (cm
-1)
218
structure of PS-Gc, Raman measurement of PS-Gc was performed using 785 nm laser. As
shown in Figure 6.5, the presence of G band (~1594 cm-1) and D band (~1312 cm-1) in the
Raman spectra of PS-Gc confirms the presence of graphitic sp2 carbon in its structure. The
presence of strong D band also indicates a large amount of defects exist in the PS-Gc,
which may be due to the presence of non-graphitic C in its structure and also due to the
chemical doping (P and S) along with its unique porous morphology. The surface area of
the porous PS-Gc material was measured by the methyl blue dye adsorption method, which
is calculated to be ~900 m2/g. A high surface area of the catalyst is important for effective
mass transfer as well as for facile access to the catalytic centers by reactants. Combining
all these unique features of PS-Gc material such as the very high surface area, unique
morphology, chemical doping and the ease of large-scale production of PS-Gc, it can be
an excellent metal-free catalyst for many reactions.
The selective oxidation of benzyl alcohol to benzaldehyde in solvent free condition
with the PS-Gc catalyst was further optimized. First, the reactions at the various reaction
temperatures (40 to 100 °C), times (4 to 48 hours) and catalyst loadings (10 to 100 wt %)
were performed to optimize the reaction condition (Table 6.5). As we can see from the
Table 6.5 (entries 1 to 4) that as the reaction time is increased from 4 to 48 hours (at 50
wt% catalyst and 80 °C), the conversion of benzyl alcohol increases from 6 to 50%. But
the selectivity to benzaldehyde drops below 90% if the reactions run for more than 24
hours, suggesting that the longer reaction time affects the reaction selectivity to an
aldehyde. The conversion of benzyl alcohol increases from 2 to 68 % (Table 6.5, entry 3,
5 to 7) as the reaction temperature is raised from 40 to 100 °C (50 wt% catalyst, 24 hours)
with good aldehyde selectivity (> 90%). Furthermore, the conversion of benzyl alcohol
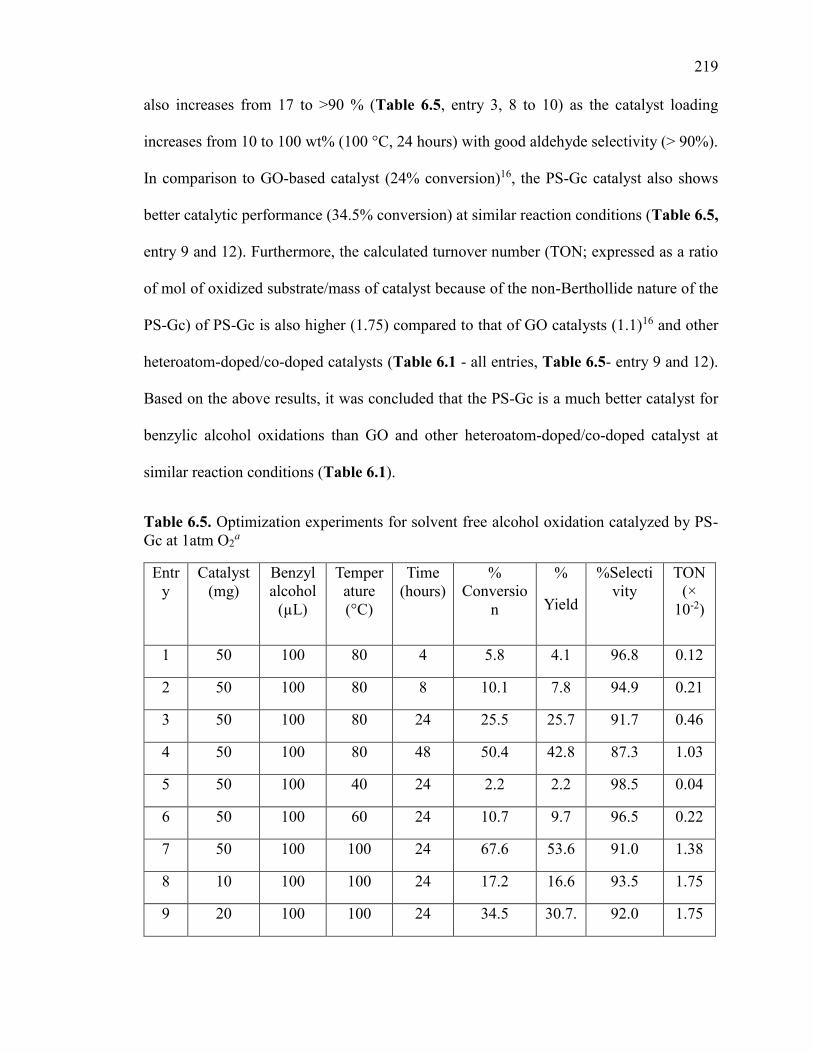
219
also increases from 17 to >90 % (Table 6.5, entry 3, 8 to 10) as the catalyst loading
increases from 10 to 100 wt% (100 °C, 24 hours) with good aldehyde selectivity (> 90%).
In comparison to GO-based catalyst (24% conversion)16, the PS-Gc catalyst also shows
better catalytic performance (34.5% conversion) at similar reaction conditions (Table 6.5,
entry 9 and 12). Furthermore, the calculated turnover number (TON; expressed as a ratio
of mol of oxidized substrate/mass of catalyst because of the non-Berthollide nature of the
PS-Gc) of PS-Gc is also higher (1.75) compared to that of GO catalysts (1.1)16 and other
heteroatom-doped/co-doped catalysts (Table 6.1 - all entries, Table 6.5- entry 9 and 12).
Based on the above results, it was concluded that the PS-Gc is a much better catalyst for
benzylic alcohol oxidations than GO and other heteroatom-doped/co-doped catalyst at
similar reaction conditions (Table 6.1).
Table 6.5. Optimization experiments for solvent free alcohol oxidation catalyzed by PS-Gc at 1atm O2
a
Entry
Catalyst (mg)
Benzyl alcohol
(µL)
Temperature (°C)
Time (hours)
% Conversio
n
%
Yield
%Selectivity
TON (×
10-2)
1 50 100 80 4 5.8 4.1 λ6.8 0.12
2 50 100 80 8 10.1 7.8 λ4.λ 0.21
3 50 100 80 24 25.5 25.7 λ1.7 0.46
4 50 100 80 48 50.4 42.8 87.3 1.03
5 50 100 40 24 2.2 2.2 λ8.5 0.04
6 50 100 60 24 10.7 λ.7 λ6.5 0.22
7 50 100 100 24 67.6 53.6 λ1.0 1.38
8 10 100 100 24 17.2 16.6 λ3.5 1.75
λ 20 100 100 24 34.5 30.7. λ2.0 1.75
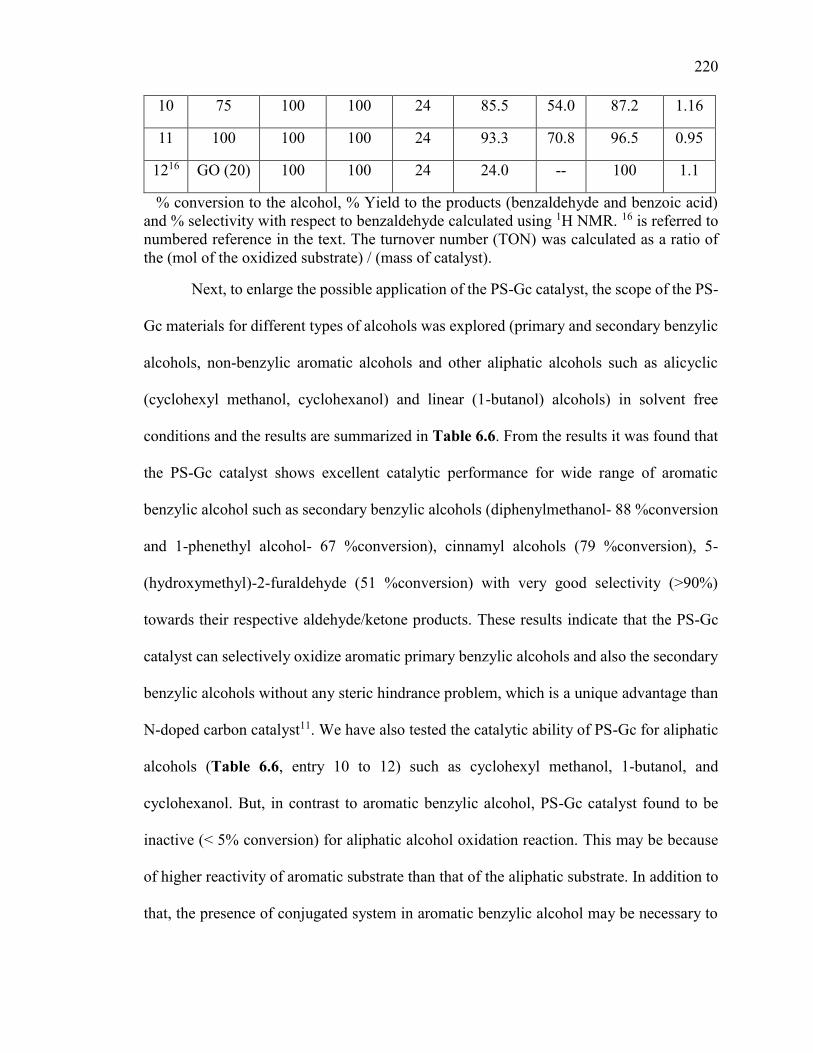
220
10 75 100 100 24 85.5 54.0 87.2 1.16
11 100 100 100 24 λ3.3 70.8 λ6.5 0.95
1216 GO (20) 100 100 24 24.0 -- 100 1.1
% conversion to the alcohol, % Yield to the products (benzaldehyde and benzoic acid) and % selectivity with respect to benzaldehyde calculated using 1H NMR. 16 is referred to numbered reference in the text. The turnover number (TON) was calculated as a ratio of the (mol of the oxidized substrate) / (mass of catalyst).
Next, to enlarge the possible application of the PS-Gc catalyst, the scope of the PS-
Gc materials for different types of alcohols was explored (primary and secondary benzylic
alcohols, non-benzylic aromatic alcohols and other aliphatic alcohols such as alicyclic
(cyclohexyl methanol, cyclohexanol) and linear (1-butanol) alcohols) in solvent free
conditions and the results are summarized in Table 6.6. From the results it was found that
the PS-Gc catalyst shows excellent catalytic performance for wide range of aromatic
benzylic alcohol such as secondary benzylic alcohols (diphenylmethanol- 88 %conversion
and 1-phenethyl alcohol- 67 %conversion), cinnamyl alcohols (79 %conversion), 5-
(hydroxymethyl)-2-furaldehyde (51 %conversion) with very good selectivity (>90%)
towards their respective aldehyde/ketone products. These results indicate that the PS-Gc
catalyst can selectively oxidize aromatic primary benzylic alcohols and also the secondary
benzylic alcohols without any steric hindrance problem, which is a unique advantage than
N-doped carbon catalyst11. We have also tested the catalytic ability of PS-Gc for aliphatic
alcohols (Table 6.6, entry 10 to 12) such as cyclohexyl methanol, 1-butanol, and
cyclohexanol. But, in contrast to aromatic benzylic alcohol, PS-Gc catalyst found to be
inactive (< 5% conversion) for aliphatic alcohol oxidation reaction. This may be because
of higher reactivity of aromatic substrate than that of the aliphatic substrate. In addition to
that, the presence of conjugated system in aromatic benzylic alcohol may be necessary to
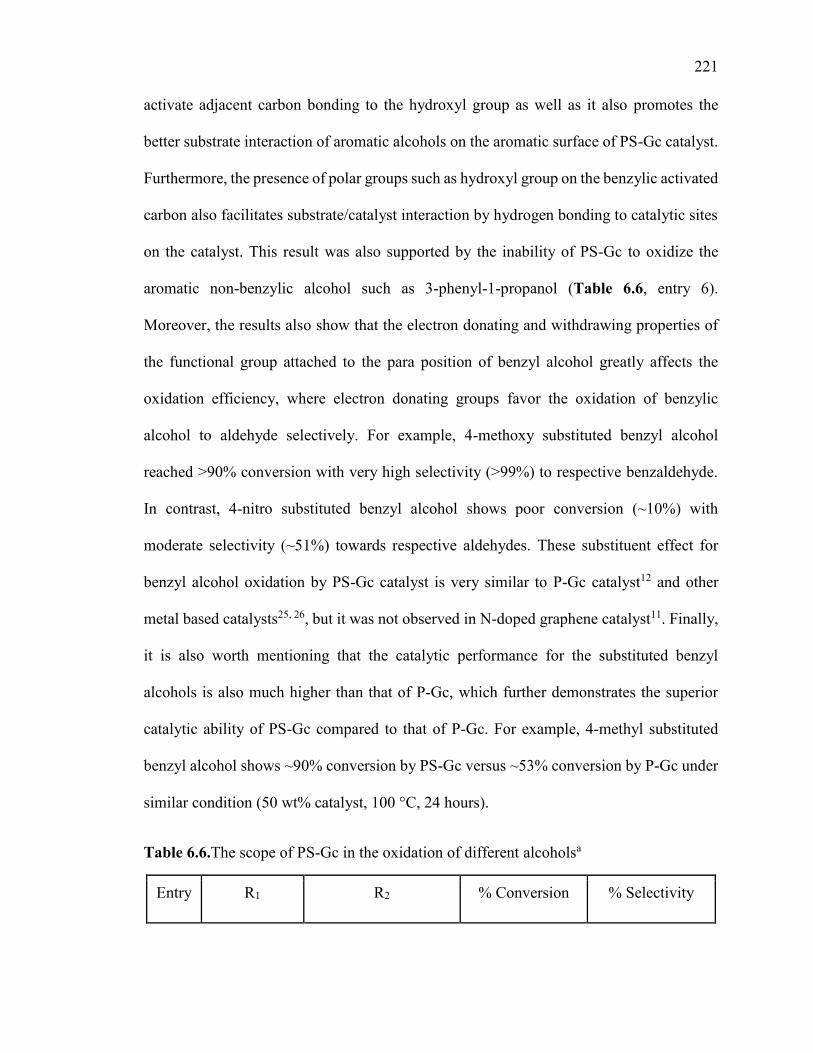
221
activate adjacent carbon bonding to the hydroxyl group as well as it also promotes the
better substrate interaction of aromatic alcohols on the aromatic surface of PS-Gc catalyst.
Furthermore, the presence of polar groups such as hydroxyl group on the benzylic activated
carbon also facilitates substrate/catalyst interaction by hydrogen bonding to catalytic sites
on the catalyst. This result was also supported by the inability of PS-Gc to oxidize the
aromatic non-benzylic alcohol such as 3-phenyl-1-propanol (Table 6.6, entry 6).
Moreover, the results also show that the electron donating and withdrawing properties of
the functional group attached to the para position of benzyl alcohol greatly affects the
oxidation efficiency, where electron donating groups favor the oxidation of benzylic
alcohol to aldehyde selectively. For example, 4-methoxy substituted benzyl alcohol
reached >90% conversion with very high selectivity (>99%) to respective benzaldehyde.
In contrast, 4-nitro substituted benzyl alcohol shows poor conversion (~10%) with
moderate selectivity (~51%) towards respective aldehydes. These substituent effect for
benzyl alcohol oxidation by PS-Gc catalyst is very similar to P-Gc catalyst12 and other
metal based catalysts25, 26, but it was not observed in N-doped graphene catalyst11. Finally,
it is also worth mentioning that the catalytic performance for the substituted benzyl
alcohols is also much higher than that of P-Gc, which further demonstrates the superior
catalytic ability of PS-Gc compared to that of P-Gc. For example, 4-methyl substituted
benzyl alcohol shows ~90% conversion by PS-Gc versus ~53% conversion by P-Gc under
similar condition (50 wt% catalyst, 100 °C, 24 hours).
Table 6.6.The scope of PS-Gc in the oxidation of different alcoholsa
Entry R1 R2 % Conversion % Selectivity
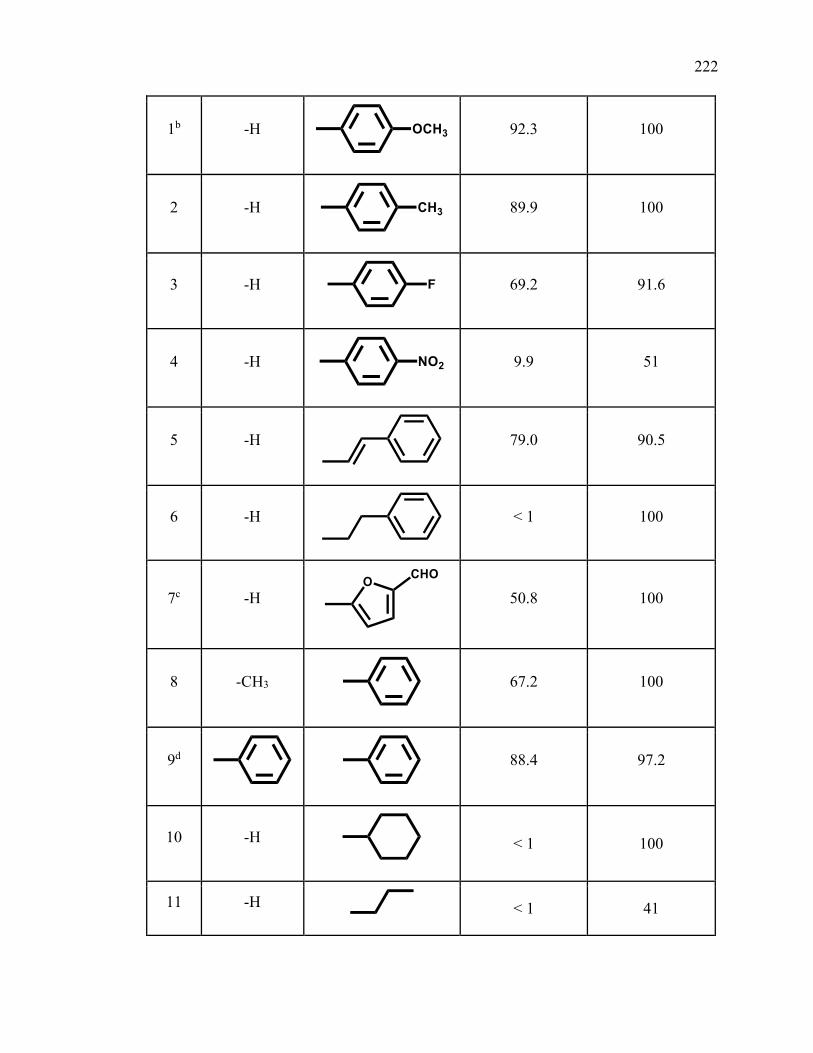
222
1b -H
92.3 100
2 -H
89.9 100
3 -H
69.2 91.6
4 -H
9.9 51
5 -H
79.0 90.5
6 -H
< 1 100
7c -H
50.8 100
8 -CH3
67.2 100
9d
88.4 97.2
10 -H
< 1 100
11 -H < 1 41
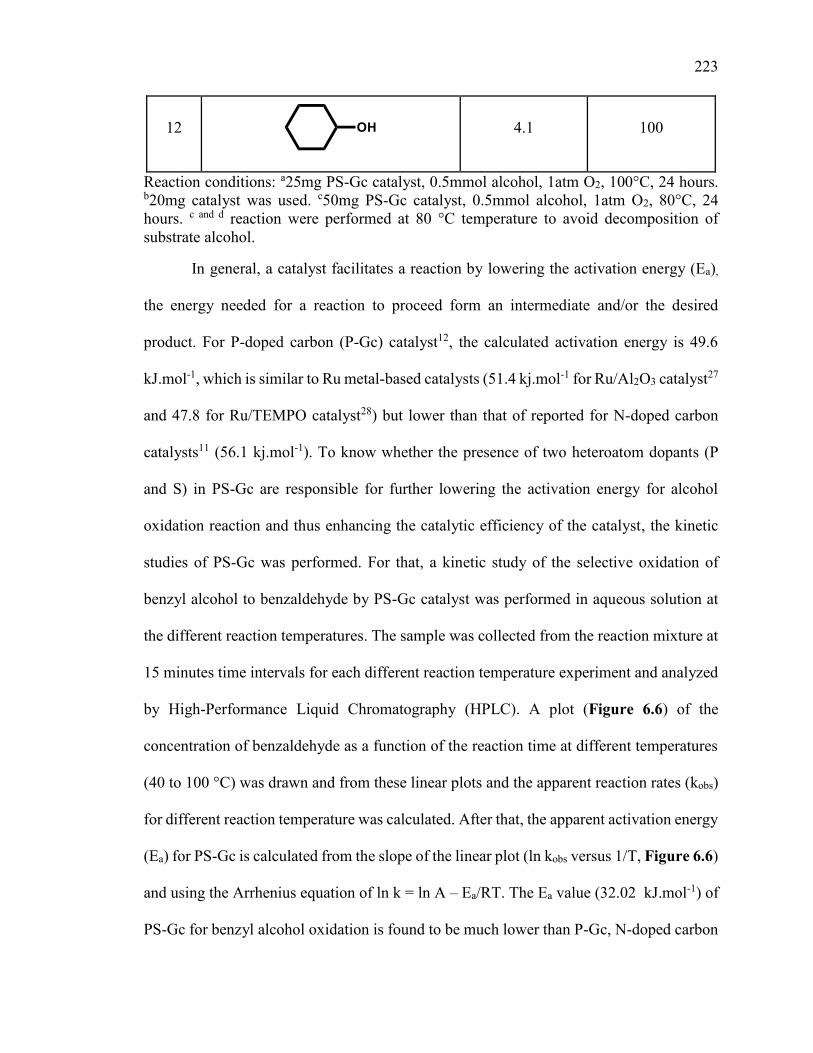
223
12
4.1 100
Reaction conditions: a25mg PS-Gc catalyst, 0.5mmol alcohol, 1atm O2, 100°C, 24 hours. b20mg catalyst was used. c50mg PS-Gc catalyst, 0.5mmol alcohol, 1atm O2, 80°C, 24 hours. c and d reaction were performed at 80 °C temperature to avoid decomposition of substrate alcohol.
In general, a catalyst facilitates a reaction by lowering the activation energy (Ea),
the energy needed for a reaction to proceed form an intermediate and/or the desired
product. For P-doped carbon (P-Gc) catalyst12, the calculated activation energy is 49.6
kJ.mol-1, which is similar to Ru metal-based catalysts (51.4 kj.mol-1 for Ru/Al2O3 catalyst27
and 47.8 for Ru/TEMPO catalyst28) but lower than that of reported for N-doped carbon
catalysts11 (56.1 kj.mol-1). To know whether the presence of two heteroatom dopants (P
and S) in PS-Gc are responsible for further lowering the activation energy for alcohol
oxidation reaction and thus enhancing the catalytic efficiency of the catalyst, the kinetic
studies of PS-Gc was performed. For that, a kinetic study of the selective oxidation of
benzyl alcohol to benzaldehyde by PS-Gc catalyst was performed in aqueous solution at
the different reaction temperatures. The sample was collected from the reaction mixture at
15 minutes time intervals for each different reaction temperature experiment and analyzed
by High-Performance Liquid Chromatography (HPLC). A plot (Figure 6.6) of the
concentration of benzaldehyde as a function of the reaction time at different temperatures
(40 to 100 °C) was drawn and from these linear plots and the apparent reaction rates (kobs)
for different reaction temperature was calculated. After that, the apparent activation energy
(Ea) for PS-Gc is calculated from the slope of the linear plot (ln kobs versus 1/T, Figure 6.6)
and using the Arrhenius equation of ln k = ln A – Ea/RT. The Ea value (32.02 kJ.mol-1) of
PS-Gc for benzyl alcohol oxidation is found to be much lower than P-Gc, N-doped carbon
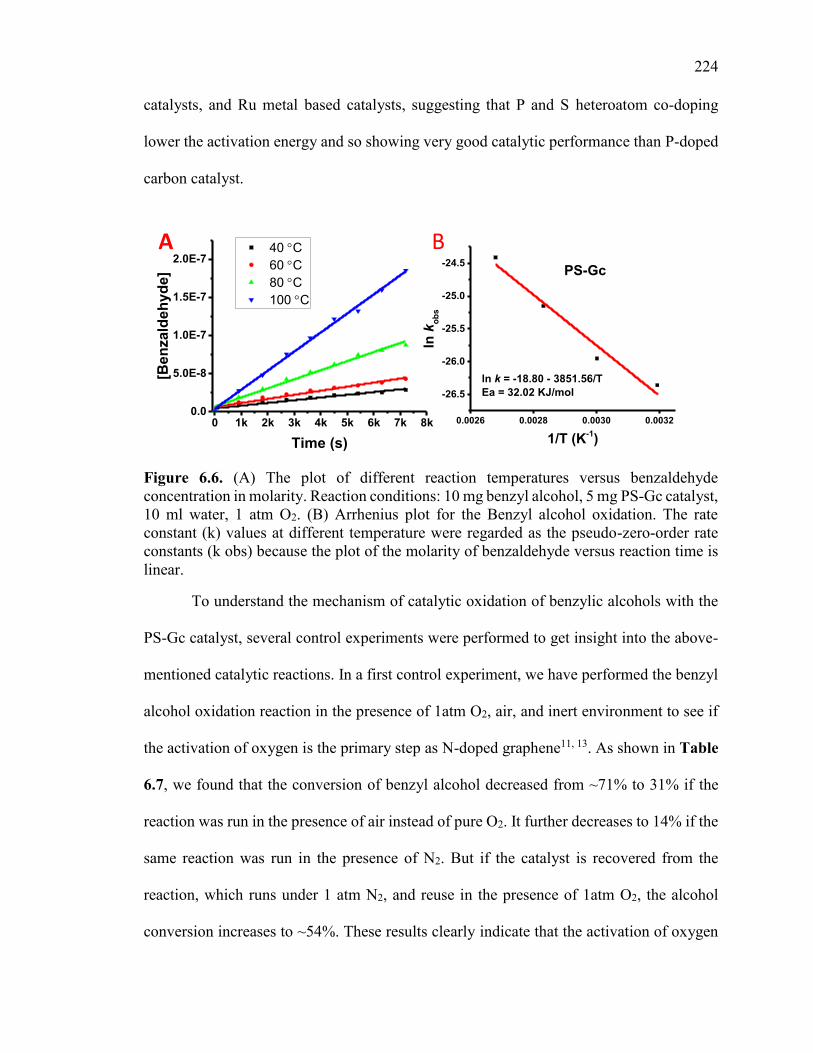
224
catalysts, and Ru metal based catalysts, suggesting that P and S heteroatom co-doping
lower the activation energy and so showing very good catalytic performance than P-doped
carbon catalyst.
Figure 6.6. (A) The plot of different reaction temperatures versus benzaldehyde concentration in molarity. Reaction conditions: 10 mg benzyl alcohol, 5 mg PS-Gc catalyst, 10 ml water, 1 atm O2. (B) Arrhenius plot for the Benzyl alcohol oxidation. The rate constant (k) values at different temperature were regarded as the pseudo-zero-order rate constants (k obs) because the plot of the molarity of benzaldehyde versus reaction time is linear.
To understand the mechanism of catalytic oxidation of benzylic alcohols with the
PS-Gc catalyst, several control experiments were performed to get insight into the above-
mentioned catalytic reactions. In a first control experiment, we have performed the benzyl
alcohol oxidation reaction in the presence of 1atm O2, air, and inert environment to see if
the activation of oxygen is the primary step as N-doped graphene11, 13. As shown in Table
6.7, we found that the conversion of benzyl alcohol decreased from ~71% to 31% if the
reaction was run in the presence of air instead of pure O2. It further decreases to 14% if the
same reaction was run in the presence of N2. But if the catalyst is recovered from the
reaction, which runs under 1 atm N2, and reuse in the presence of 1atm O2, the alcohol
conversion increases to ~54%. These results clearly indicate that the activation of oxygen
0.0026 0.0028 0.0030 0.0032
-26.5
-26.0
-25.5
-25.0
-24.5PS-Gc
ln k = -18.80 - 3851.56/T
Ea = 32.02 KJ/mol
ln k
ob
s1/T (K
-1)
0 1k 2k 3k 4k 5k 6k 7k 8k0.0
5.0E-8
1.0E-7
1.5E-7
2.0E-7 40 C 60 C 80 C 100 C
[Ben
zald
eh
yd
e]
Time (s)
A B
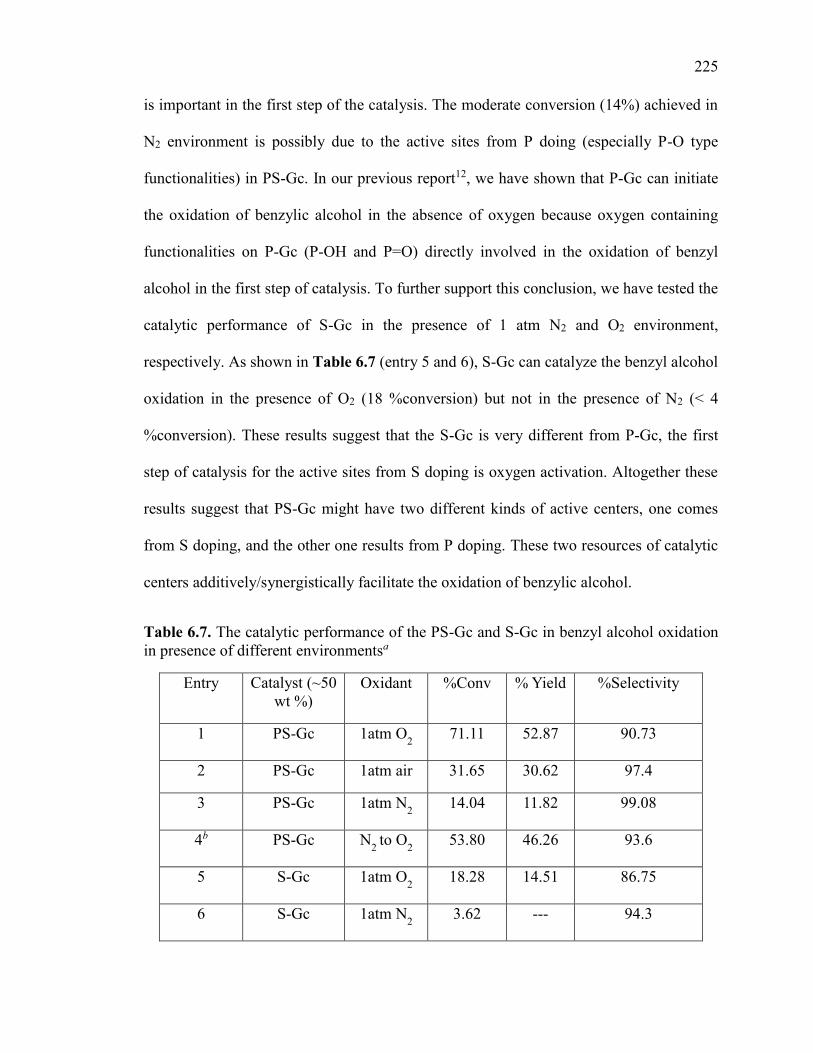
225
is important in the first step of the catalysis. The moderate conversion (14%) achieved in
N2 environment is possibly due to the active sites from P doing (especially P-O type
functionalities) in PS-Gc. In our previous report12, we have shown that P-Gc can initiate
the oxidation of benzylic alcohol in the absence of oxygen because oxygen containing
functionalities on P-Gc (P-OH and P=O) directly involved in the oxidation of benzyl
alcohol in the first step of catalysis. To further support this conclusion, we have tested the
catalytic performance of S-Gc in the presence of 1 atm N2 and O2 environment,
respectively. As shown in Table 6.7 (entry 5 and 6), S-Gc can catalyze the benzyl alcohol
oxidation in the presence of O2 (18 %conversion) but not in the presence of N2 (< 4
%conversion). These results suggest that the S-Gc is very different from P-Gc, the first
step of catalysis for the active sites from S doping is oxygen activation. Altogether these
results suggest that PS-Gc might have two different kinds of active centers, one comes
from S doping, and the other one results from P doping. These two resources of catalytic
centers additively/synergistically facilitate the oxidation of benzylic alcohol.
Table 6.7. The catalytic performance of the PS-Gc and S-Gc in benzyl alcohol oxidation in presence of different environmentsa
Entry Catalyst (~50 wt %)
Oxidant %Conv % Yield %Selectivity
1 PS-Gc 1atm O2 71.11 52.87 λ0.73
2 PS-Gc 1atm air 31.65 30.62 λ7.4
3 PS-Gc 1atm N2 14.04 11.82 λλ.08
4b PS-Gc N2 to O2 53.80 46.26 λ3.6
5 S-Gc 1atm O2 18.28 14.51 86.75
6 S-Gc 1atm N2 3.62 --- λ4.3
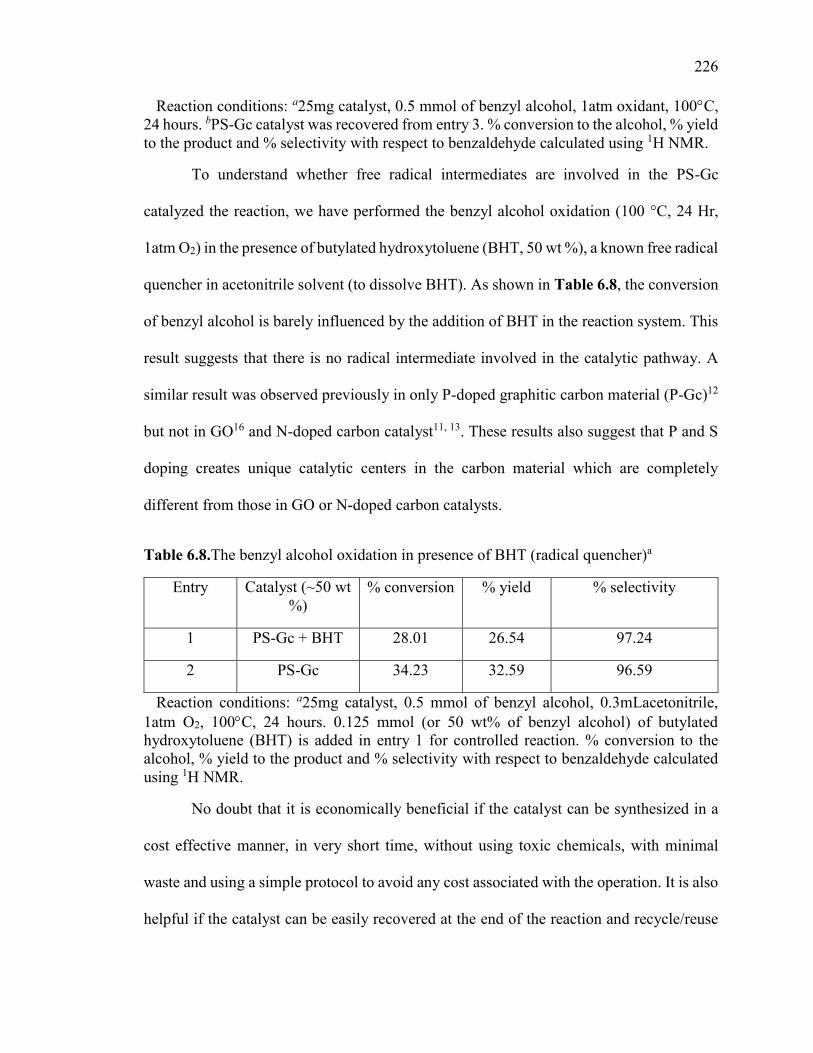
226
Reaction conditions: a25mg catalyst, 0.5 mmol of benzyl alcohol, 1atm oxidant, 100C, 24 hours. bPS-Gc catalyst was recovered from entry 3. % conversion to the alcohol, % yield to the product and % selectivity with respect to benzaldehyde calculated using 1H NMR.
To understand whether free radical intermediates are involved in the PS-Gc
catalyzed the reaction, we have performed the benzyl alcohol oxidation (100 °C, 24 Hr,
1atm O2) in the presence of butylated hydroxytoluene (BHT, 50 wt %), a known free radical
quencher in acetonitrile solvent (to dissolve BHT). As shown in Table 6.8, the conversion
of benzyl alcohol is barely influenced by the addition of BHT in the reaction system. This
result suggests that there is no radical intermediate involved in the catalytic pathway. A
similar result was observed previously in only P-doped graphitic carbon material (P-Gc)12
but not in GO16 and N-doped carbon catalyst11, 13. These results also suggest that P and S
doping creates unique catalytic centers in the carbon material which are completely
different from those in GO or N-doped carbon catalysts.
Table 6.8.The benzyl alcohol oxidation in presence of BHT (radical quencher)a
Entry Catalyst (~50 wt %)
% conversion % yield % selectivity
1 PS-Gc + BHT 28.01 26.54 λ7.24
2 PS-Gc 34.23 32.5λ λ6.5λ
Reaction conditions: a25mg catalyst, 0.5 mmol of benzyl alcohol, 0.3mLacetonitrile, 1atm O2, 100C, 24 hours. 0.125 mmol (or 50 wt% of benzyl alcohol) of butylated hydroxytoluene (BHT) is added in entry 1 for controlled reaction. % conversion to the alcohol, % yield to the product and % selectivity with respect to benzaldehyde calculated using 1H NMR.
No doubt that it is economically beneficial if the catalyst can be synthesized in a
cost effective manner, in very short time, without using toxic chemicals, with minimal
waste and using a simple protocol to avoid any cost associated with the operation. It is also
helpful if the catalyst can be easily recovered at the end of the reaction and recycle/reuse
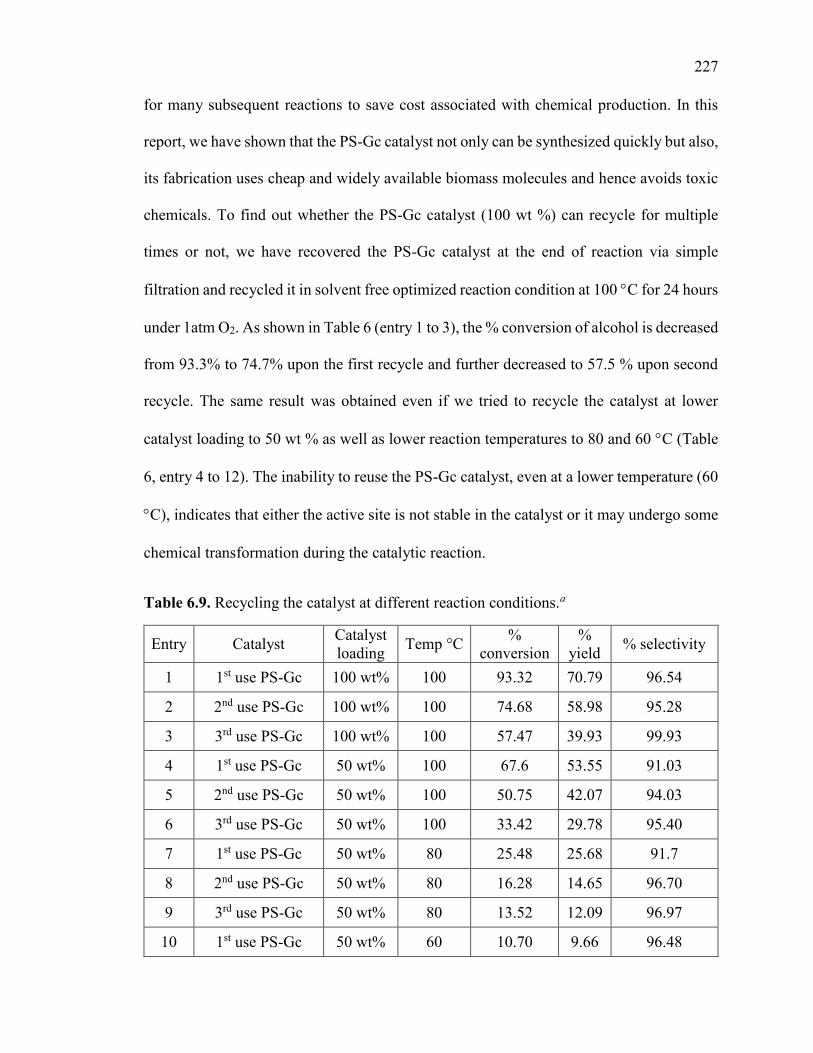
227
for many subsequent reactions to save cost associated with chemical production. In this
report, we have shown that the PS-Gc catalyst not only can be synthesized quickly but also,
its fabrication uses cheap and widely available biomass molecules and hence avoids toxic
chemicals. To find out whether the PS-Gc catalyst (100 wt %) can recycle for multiple
times or not, we have recovered the PS-Gc catalyst at the end of reaction via simple
filtration and recycled it in solvent free optimized reaction condition at 100 C for 24 hours
under 1atm O2. As shown in Table 6 (entry 1 to 3), the % conversion of alcohol is decreased
from 93.3% to 74.7% upon the first recycle and further decreased to 57.5 % upon second
recycle. The same result was obtained even if we tried to recycle the catalyst at lower
catalyst loading to 50 wt % as well as lower reaction temperatures to 80 and 60 C (Table
6, entry 4 to 12). The inability to reuse the PS-Gc catalyst, even at a lower temperature (60
C), indicates that either the active site is not stable in the catalyst or it may undergo some
chemical transformation during the catalytic reaction.
Table 6.9. Recycling the catalyst at different reaction conditions.a
Entry Catalyst Catalyst loading
Temp °C %
conversion %
yield % selectivity
1 1st use PS-Gc 100 wt% 100 93.32 70.79 96.54
2 2nd use PS-Gc 100 wt% 100 74.68 58.98 95.28
3 3rd use PS-Gc 100 wt% 100 57.47 39.93 99.93
4 1st use PS-Gc 50 wt% 100 67.6 53.55 91.03
5 2nd use PS-Gc 50 wt% 100 50.75 42.07 94.03
6 3rd use PS-Gc 50 wt% 100 33.42 29.78 95.40
7 1st use PS-Gc 50 wt% 80 25.48 25.68 91.7
8 2nd use PS-Gc 50 wt% 80 16.28 14.65 96.70
9 3rd use PS-Gc 50 wt% 80 13.52 12.09 96.97
10 1st use PS-Gc 50 wt% 60 10.70 9.66 96.48
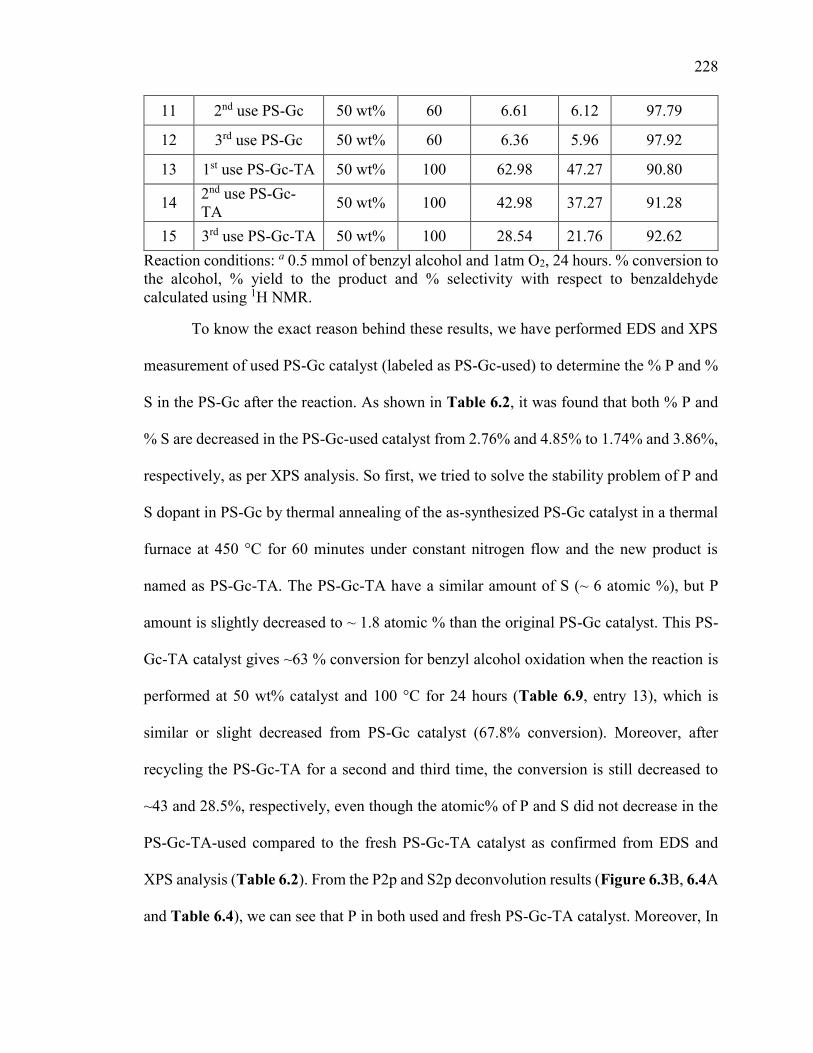
228
11 2nd use PS-Gc 50 wt% 60 6.61 6.12 97.79
12 3rd use PS-Gc 50 wt% 60 6.36 5.96 97.92
13 1st use PS-Gc-TA 50 wt% 100 62.λ8 47.27 90.80
14 2nd use PS-Gc-TA
50 wt% 100 42.λ8 37.27 91.28
15 3rd use PS-Gc-TA 50 wt% 100 28.54 21.76 92.62
Reaction conditions: a 0.5 mmol of benzyl alcohol and 1atm O2, 24 hours. % conversion to the alcohol, % yield to the product and % selectivity with respect to benzaldehyde calculated using 1H NMR.
To know the exact reason behind these results, we have performed EDS and XPS
measurement of used PS-Gc catalyst (labeled as PS-Gc-used) to determine the % P and %
S in the PS-Gc after the reaction. As shown in Table 6.2, it was found that both % P and
% S are decreased in the PS-Gc-used catalyst from 2.76% and 4.85% to 1.74% and 3.86%,
respectively, as per XPS analysis. So first, we tried to solve the stability problem of P and
S dopant in PS-Gc by thermal annealing of the as-synthesized PS-Gc catalyst in a thermal
furnace at 450 °C for 60 minutes under constant nitrogen flow and the new product is
named as PS-Gc-TA. The PS-Gc-TA have a similar amount of S (~ 6 atomic %), but P
amount is slightly decreased to ~ 1.8 atomic % than the original PS-Gc catalyst. This PS-
Gc-TA catalyst gives ~63 % conversion for benzyl alcohol oxidation when the reaction is
performed at 50 wt% catalyst and 100 °C for 24 hours (Table 6.9, entry 13), which is
similar or slight decreased from PS-Gc catalyst (67.8% conversion). Moreover, after
recycling the PS-Gc-TA for a second and third time, the conversion is still decreased to
~43 and 28.5%, respectively, even though the atomic% of P and S did not decrease in the
PS-Gc-TA-used compared to the fresh PS-Gc-TA catalyst as confirmed from EDS and
XPS analysis (Table 6.2). From the P2p and S2p deconvolution results (Figure 6.3B, 6.4A
and Table 6.4), we can see that P in both used and fresh PS-Gc-TA catalyst. Moreover, In
229
our previous report,12 it has been reported that P-doped carbon (P-Gc) can be recycled at
least 8 times without losing its catalytic performance in benzyl alcohol oxidation. However,
It has been reported that XPS was not able to clearly differentiate the doped S with different
oxidation (-2 to +8) due to the resolution problem29. We have also compared the FT-IR
spectra of fresh and used, PS-Gc and PS-Gc-TA catalysts, as shown in Figure 6.7. From
the results, we can see that the peak at ~1720 cm-1, which was not detectable in both fresh
PS-Gc and PS-Gc-TA catalyst, becomes slightly stronger in the used PS-Gc and PS-Gc-
TA catalyst suggesting that carbonyl oxygen (S=O / C=O) were possibly generated in the
used catalyst. As the majority of the oxygen functionalities are connected with S, we
suspect that the reduced S type is converted to S=O type of functionalities during the
catalytic reaction. Nevertheless, due to overlapping of different peaks at a similar
frequency in FT-IR measurements and poor resolution of XPS to separate S species with
different oxidation states, we were not able to get any detailed information about changes
in S functionalities in fresh and used PS-Gc catalyst.
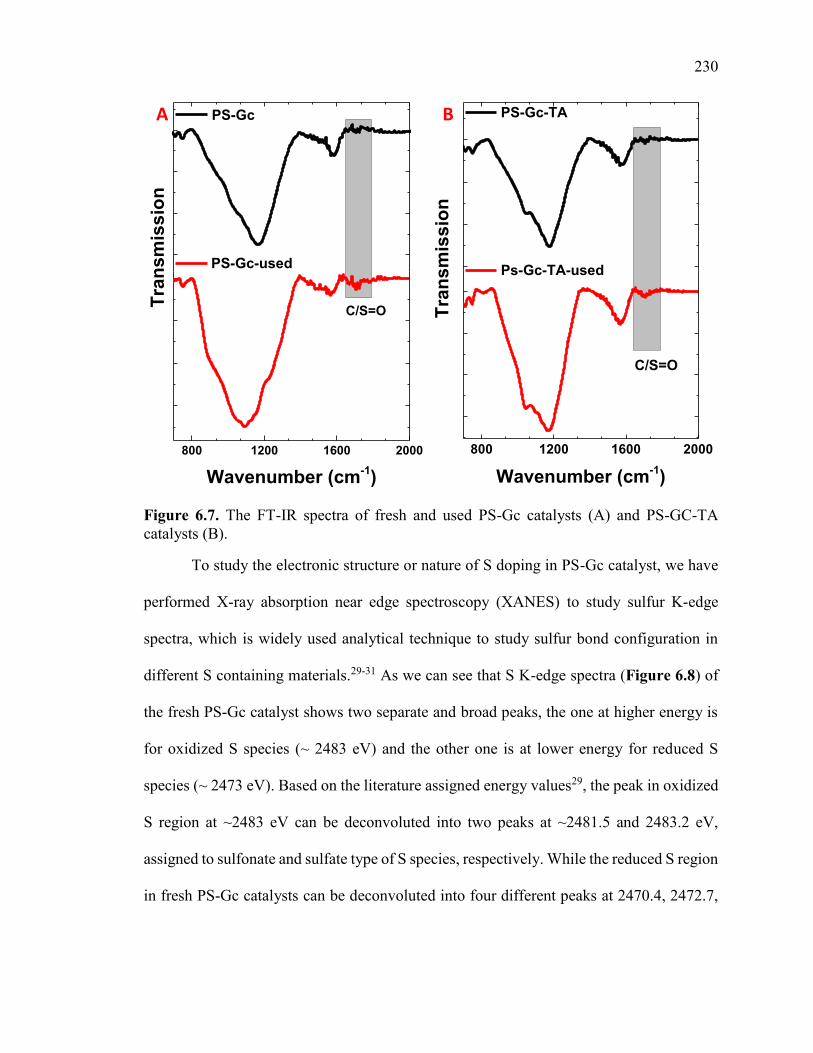
230
Figure 6.7. The FT-IR spectra of fresh and used PS-Gc catalysts (A) and PS-GC-TA catalysts (B).
To study the electronic structure or nature of S doping in PS-Gc catalyst, we have
performed X-ray absorption near edge spectroscopy (XANES) to study sulfur K-edge
spectra, which is widely used analytical technique to study sulfur bond configuration in
different S containing materials.29-31 As we can see that S K-edge spectra (Figure 6.8) of
the fresh PS-Gc catalyst shows two separate and broad peaks, the one at higher energy is
for oxidized S species (~ 2483 eV) and the other one is at lower energy for reduced S
species (~ 2473 eV). Based on the literature assigned energy values29, the peak in oxidized
S region at ~2483 eV can be deconvoluted into two peaks at ~2481.5 and 2483.2 eV,
assigned to sulfonate and sulfate type of S species, respectively. While the reduced S region
in fresh PS-Gc catalysts can be deconvoluted into four different peaks at 2470.4, 2472.7,
800 1200 1600 2000
PS-Gc
Tra
ns
mis
sio
n
Wavenumber (cm-1)
PS-Gc-used
C/S=O
800 1200 1600 2000
Tra
nsm
issio
n
PS-Gc-TA
Wavenumber (cm-1)
Ps-Gc-TA-used
C/S=O
A B
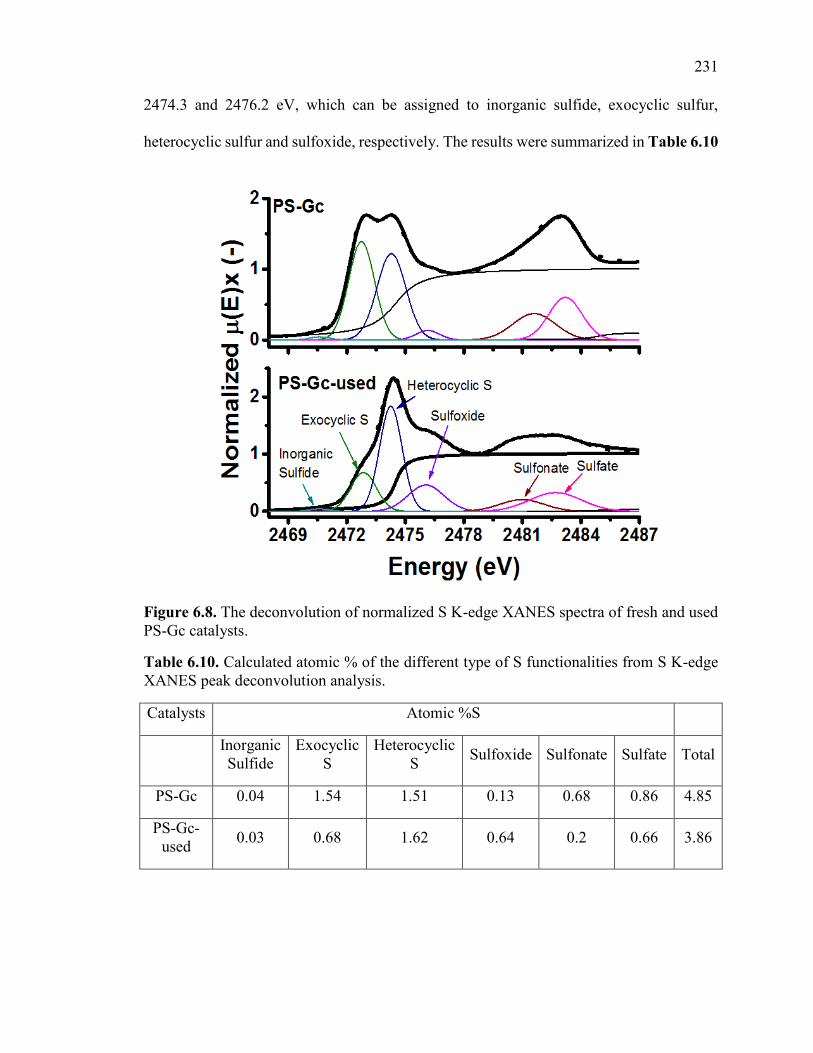
231
2474.3 and 2476.2 eV, which can be assigned to inorganic sulfide, exocyclic sulfur,
heterocyclic sulfur and sulfoxide, respectively. The results were summarized in Table 6.10
Figure 6.8. The deconvolution of normalized S K-edge XANES spectra of fresh and used PS-Gc catalysts.
Table 6.10. Calculated atomic % of the different type of S functionalities from S K-edge XANES peak deconvolution analysis.
Catalysts Atomic %S
Inorganic Sulfide
Exocyclic S
Heterocyclic S
Sulfoxide Sulfonate Sulfate Total
PS-Gc 0.04 1.54 1.51 0.13 0.68 0.86 4.85
PS-Gc-used
0.03 0.68 1.62 0.64 0.2 0.66 3.86
232
From a comparison of the fresh PS-Gc catalyst with the PS-Gc-used catalyst, we
found that the exocyclic sulfur (C-S-C) peak drastically decreased and at the same time
sulfoxide (C-S(O)-C) peak becomes stronger in used PS-Gc-used catalyst. These results in
facts are in line with the FT-IR characterization results where a new peak for S=O type
functional groups appeared at ~1720cm-1 in the PS-Gc-used catalyst. All these results
clearly demonstrate that the exocyclic S species (which is more like epoxides in GO, who
are playing a major role in catalysis17) plays the crucial role in activating the oxygen and
catalyzing the benzyl alcohol oxidation reaction. During the catalytic reactions, exocyclic
S is oxidized to sulfoxide type of S and thus catalytic centers were diminished.
The proposed mechanism of P-doped active sites was already reported in our
previous report12 where it has been demonstrated that the alcohol molecule interacts with
P-O (P-OH and P=O) functionalities to produce aldehyde/ketone without needing any
oxidant (such as oxygen). But in the following step, in the presence of oxygen, these
functional groups on the catalytic site (P) are regenerated and will continue the reaction
cycle. Here in this report, we found that S and P co-doping shows catalytic synergistic
effects. Based on the above control experiments and detailed characterization by FT-IR,
XANES, and XPS, we have proposed that exocyclic S species play a major role in the
observed synergistic catalytic effect, and the catalytic mechanism was proposed for alcohol
oxidation reaction in Scheme 6.1.
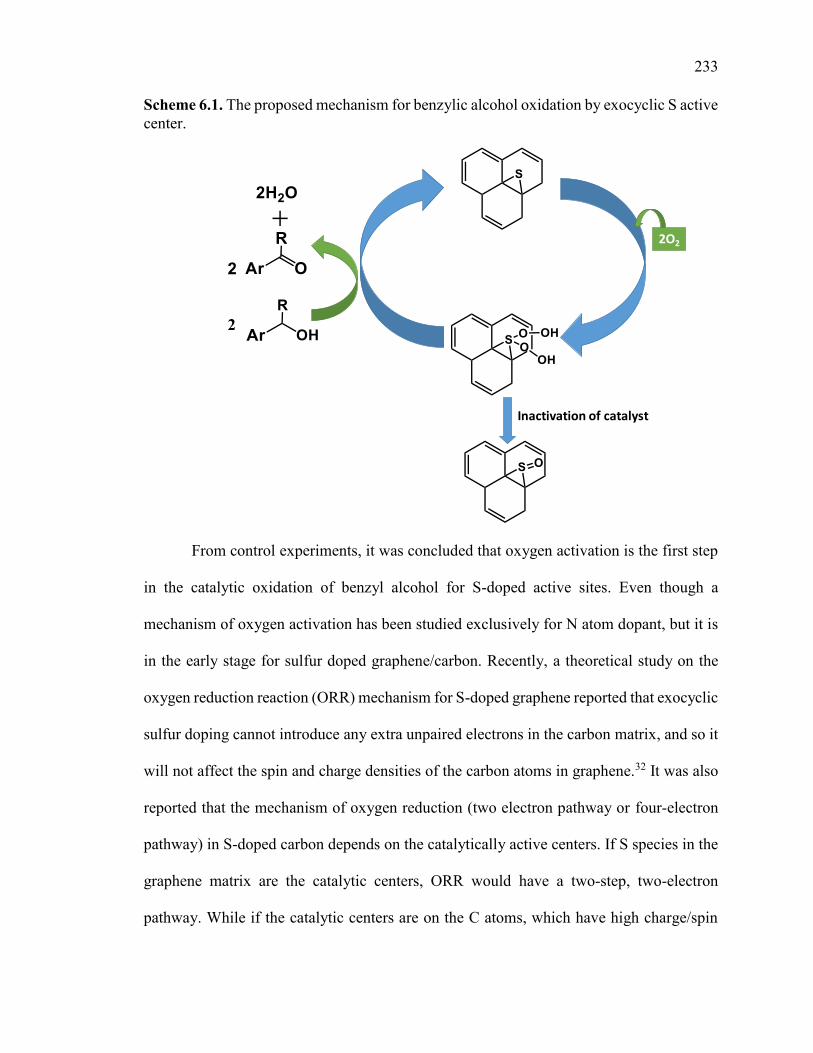
233
Scheme 6.1. The proposed mechanism for benzylic alcohol oxidation by exocyclic S active center.
From control experiments, it was concluded that oxygen activation is the first step
in the catalytic oxidation of benzyl alcohol for S-doped active sites. Even though a
mechanism of oxygen activation has been studied exclusively for N atom dopant, but it is
in the early stage for sulfur doped graphene/carbon. Recently, a theoretical study on the
oxygen reduction reaction (ORR) mechanism for S-doped graphene reported that exocyclic
sulfur doping cannot introduce any extra unpaired electrons in the carbon matrix, and so it
will not affect the spin and charge densities of the carbon atoms in graphene.32 It was also
reported that the mechanism of oxygen reduction (two electron pathway or four-electron
pathway) in S-doped carbon depends on the catalytically active centers. If S species in the
graphene matrix are the catalytic centers, ORR would have a two-step, two-electron
pathway. While if the catalytic centers are on the C atoms, which have high charge/spin
Inactivation of catalyst
2O2
234
density due to S doping, the ORR will have a four-electron pathway.32 In our PS-Gc
catalyst, due to the presence of an exclusive amount of exocyclic S, no additional
charge/spin density was introduced in the catalyst. So, we suspect that oxygen is being
reduced on the S atom (active site) to reactive oxygen species (ROS) via two electron
pathway. The oxygen reduction via two-electron pathway could result in different types of
ROS, such as hydroxyl radical (·OH), peroxide like species OOH, hydrogen
peroxide (H2O2), superoxide radical (·O2−). Based on our control experiments in the
presence of a radical quencher (BHT), it was clearly demonstrated that there are no radicals
generated during the catalytic oxidation of alcohols. These results suggest that activation
of oxygen resulted in non-radical ROS such as peroxides like species OOH and hydrogen
peroxide (H2O2). It has also been reported that producing the excess amount of H2O2 via
oxygen reduction is the key parameter to affect the selectivity of aldehyde/ketone products
in metal catalyzed reactions. But our experimental results suggested that the benzyl alcohol
is selectively oxidized to aldehyde/ketone without producing the carboxylic acid, and
moreover, we could not detect any peroxide species by HPLC, suggesting that either the
generated peroxide amount is too small that there are no detectable detrimental effects on
the product selectivity was not observed or a transient peroxo like species (OOH) were
generated, which directly oxidized the benzyl alcohol before it converted to peroxide. N-
doped graphene has already been reported for the generation of peroxo like species in
previous reports, where graphitic N is playing a catalytic role.33, 34 The same graphitic N is
also responsible for reducing the oxygen via two electron pathway35, 36, which indirectly
supports our conclusion that S-doped active site may be responsible for reducing oxygen
via two electron pathway to peroxo like species. Now in the next step of oxidation, the
235
produced OOH type of ROS oxidized the alcohol to the respective aldehydes or ketones.
During this oxidation, the exocyclic S active sites in PS-GC may be converted to C–S(O)
-C type of functionalities which cannot further act as catalytic centers to activate molecule
oxygen. As a consequence, the catalytic activity of the PS-Gc catalyst was decreased
largely upon recycling. Currently, we are working on methods to regenerate the active sites
in the used PS-Gc catalyst, so we can able to reuse them multiple times.
6.3. Conclusions
In this chapter, it has been shown that the S and P codoped porous carbon (PS-Gc) material
shows better catalytic performance than single doped (S-Gc and P-Gc) and other P co-
doped carbon catalysts (PB-Gc and PN-Gc) for benzylic alcohol oxidations. Moreover, the
PS-Gc catalyst can selectively oxidize a variety of primary and secondary benzylic alcohols
to the respective aldehydes/ketone without steric hindrance. The calculated activation
energy for benzyl alcohol oxidation is ~32kJ/mol for the PS-Gc, which is lower than P-
doped, N-doped carbon catalyst as well as Ru metal based catalysts. From the various
control experiments and the detailed characterization of the fresh and used PS-Gc catalysts
we have concluded the following points. 1) PS-Gc catalyst probably contains two distinct
types of catalyst centers from P and S-doping. 2) PS-Gc catalyst requires oxygen activation
as the first step of oxidation, which is different than P-doped Carbon. 3) S is doped with
multiple S species while only the exocyclic sulfur (C-S-C) species play the important role
in activating the oxygen molecule as well as selectively oxidizing the benzylic alcohols. 4)
The S containing active sites (exocyclic S) were not stable during the catalytic reaction and
converted to sulfoxide type of S species which cannot be reduced back into the reaction
conditions. Thus, the reusability of the PS-Gc catalyst is limited.
236
6.4. Experimental Section
6.4.1. Synthesis of catalysts
Synthesis of P and other heteroatoms (N, B, S and Si) co-doped catalysts: The P and
another heteroatom co-doped porous carbon catalyst were synthesized according to
previously published protocol.23 In brief, 1.0 ml of phytic acid (Sigma-Aldrich 50 w/w%
in water) is mixed with pre-weighed amount of other heteroatom source ( such as
amorphous sulfur or ammonium hydroxide or boric acid as S, N and B source, respectively)
in 35 mL Pyrex glass vessel (CEM, #909036) and closed with Teflon-lined cap (CEM,
#909235). The amount of heteroatom source is calculated such that the moles ratio of P
and other heteroatom dopants stays 1:1. The uniformed dispersion or suspension of the
phytic acid and heteroatom source is obtained by the aid of bath sonicating the mixture for
15 minutes. After that, the resultant mixture is heated in the domestic microwave (Sanyo-
EM-S9515W, 1100 W, 2.45 GHz) chamber for a different time to obtain co-doped carbon
material. The microwave heating time is depending on the microwave absorption capacity
of heteroatom precursor and the resultant mixture. For example, the microwave heating
time is 42s, 90s and 150s for the synthesis of PS-Gc, PN-Gc and PB-Gc, respectively. The
microwave heating time is also varied based on the type of domestic microwave, size or
physical dimensions of microwave cavity and microwave output power. After heating the
mixture in microwave, the resultant product is left in fume hood to cool down and then
filtered, washed and dried as described in the previous report.23
To prevent the loss of % atomic S and P heteroatom dopant in PS-Gc catalyst during
the catalytic oxidation of benzyl alcohol oxidation, the as-synthesized PS-Gc material was
further heated at 450 °C for 60 minutes under constant N2 flow in a thermal furnace. After
237
treatment, the new material is again filtered with water and ethanol solvent to remove any
impurities and labeled as a PS-Gc-TA.
Synthesis of S-doped carbon material (S-Gc): The S-doped porous carbon catalyst was
also synthesized according to previously published protocol.23 In brief, ~250 mg of myo-
Inositol (act as C source), ~0.6 mL of concentrated sulfuric acid (act as strong dehydrating
agent and microwave absorbing agent) and heteroatom dopant source, which is ~67 mg
amorphous sulfur, was mixed by bath sonication for 15 minutes and then heated in
microwave for 60 seconds. The resultant product is left in fume hood to cool down and
then filtered, washed and dried as described in the previous report.23
6.4.2. Catalytic oxidation of primary and secondary alcohol Reaction.
Materials: Benzyl Alcohol (Millipore, ≥λλ%), DL-sec-phenyl ethyl alcohol (Acros
Organics, ≥λ7%), Cyclohexane methanol (Alfa Aesar, 99%), n-butanol (anhydrous,
Sigma-Aldrich, 99.8%), 4-methoxybenzyl alcohol (TCI, >98%), 4-methylbenzyl alcohol
(Sigma-Aldrich, 98%), 4-nitrobenzyl alcohol (Alfa Aesar, 99%), 4-fluorobenzyl alcohol
(Sigma-Aldrich, ≥λ7%), cinnamyl alcohol (Sigma-Aldrich, ≥λ8%), diphenylmethanol
(Sigma-Aldrich, 99%), 5-(hydroxymethyl)-2-furaldehyde (Sigma-Aldrich, 99%),
Cyclohexanol (Sigma-Aldrich, 99%), Toluene (anhydrous, Sigma-Aldrich, 99.8%).
Solvent free alcohol oxidation: A catalytic reaction for benzylic alcohol oxidation was
carried out by mixing the pre-determined amount of catalyst and benzylic alcohol in a 10
mL microwave reaction vial (VWR 89079-402) and then sealed with PTFE-faced
aluminum cap. After that, the air inside of the reaction vessel is removed using traditional
vacuum system and replaced with the desired atmosphere before heating the reaction vial
in an oil bath for specified time and at a specified temperature. For control experiment with
238
a radical inhibitor, BHT (Butylated hydroxytoluene), specified amount of BHT and
acetonitrile (for maintaining uniform dispersion of BHT) was added to the above-described
mixture at the beginning of the reaction. The detailed experimental condition, the amount
of the reactant and catalysts were specified in the footnote of each table. After completion
of each reaction, ~0.7 mL of CDCl3 and 100 µL of anhydrous toluene (internal standard)
was mixed with the reaction mixture and filtered via 0.02 m syringe filter and analyzed by
1H NMR spectroscopy (Bruker Avalanche 500 MHz).
Kinetic study of an alcohol oxidation in water: The kinetic studies for aerobic oxidation
reactions at different reaction temperatures were carried out in 20 ml microwave reaction
vial sealed with PTFE-faced aluminum cap. Here, 5mg of PS-Gc and 10 µL of benzyl
alcohol is added to 10 mL of oxygen saturated deionized water solvent in reaction vial and
the reaction is carried out at 1atm O2 environment. during the experiments, ~0.3 mL of the
aliquot was withdrawn at a regular interval of 15 minutes, filtered via 0.02 m syringe filter
and analyzed by HPLC (Varian Pro-Star and Phenomenex C18 column, mobile phase
50:50 ratio of Methanol: 0.44% Acetic acid) to monitor the amount of benzaldehyde
produced.
6.4.3. Material characterization
The morphology of PS-Gc materials was studied using the scanning electron microscopy
(SEM, Hitachi S-4800). The sample for SEM was prepared by sprinkling the dried PS-Gc
powder on the carbon tape. The heteroatom doping and atomic % of all elements in the
porous carbon were analyzed by Energy Dispersive X-ray Spectroscopy (EDS)
characterization. The sample for EDS imaging was prepared by simple drop casting of the
slurry of a sample on to copper tape and allowed it for air dry. The X-ray photoelectron
239
spectroscopy (XPS) characterization was performed after drop casting the catalyst onto a
Si substrate. The thickness of the catalyst film on the Si substrates was roughly 30–50 nm.
XPS spectra were acquired using a Thermo Scientific K-Alpha system with a
monochromatic Al Kα X-ray source (h = 1486.7 eV). For data analysis, Smart
Background subtraction was performed, and the spectra were fit with Gaussian/Lorentzian
peaks using a minimum deviation curve fitting method (part of the Avantage software
package). The surface composition of each species was determined by the integrated peak
areas and the Scofield sensitivity factor provided by the Avantage software. The Fourier
transform infrared spectroscopy (FT-IR) spectra of PS-Gc samples (thin films deposited
on ZnSe windows) were acquired with a Thermo-Nicolet 6700 spectrometer (Thermo-
Electron Corp., Madison, WI), using a sample shuttle and a mercury-cadmium-telluride
(MCT) detector. Four blocks of 128 scans each was co-added with 4 cm-1 spectral
resolution and two levels of zero-filling so that data was encoded every 1 cm-1. Raman
spectra of the PS-Gc material (deposited on Anodisc membrane) was collected using
Raman Microscope (Confocal) – Wi-Tec, Alpha 3000R with an excitation laser at 785 nm.
The Surface area of PS-Gc material was measured using Methylene blue(MB) adsorption
method as described in the previous report.37 The S K-edge (2472.02 eV) XANES spectra
were recorded at APS at 9-BM beamline in fluorescence mode at room temperature using
a Lytle detector. The Si (111) monochromator was calibrated relative to the 3% sodium
thiosulfate standard. Three scans were collected in order to confirm absence of X-ray
damage, processed and averaged in Athena program.38 All the spectra were deconvoluted
using Gaussians and 2 arctangent functions using Athena.38
240
6.5. References
1. Zhang, J.; Liu, X.; Blume, R.; Zhang, A. H.; Schlogl, R.; Su, D. S. Surface-modified carbon nanotubes catalyze oxidative dehydrogenation of n-butane. Science 2008, 322, 73-77. 2. Su, D. S.; Zhang, J.; Frank, B.; Thomas, A.; Wang, X. C.; Paraknowitsch, J.; Schlogl, R. Metal-Free Heterogeneous Catalysis for Sustainable Chemistry. Chemsuschem
2010, 3, 169-180. 3. Su, D. S.; Perathoner, S.; Centi, G. Nanocarbons for the Development of Advanced Catalysts. Chem. Rev. 2013, 113, 5782-5816. 4. Su, C.; Loh, K. P. Carbocatalysts: Graphene Oxide and Its Derivatives. Acc. Chem.
Res. 2013, 46, 2275-2285. 5. Navalon, S.; Dhakshinamoorthy, A.; Alvaro, M.; Garcia, H. Carbocatalysis by Graphene-Based Materials. Chem. Rev. 2014, 114, 6179-6212. 6. Dhakshinamoorthy, A.; Latorre-Sanchez, M.; Asiri, A. M.; Primo, A.; Garcia, H. Sulphur-doped graphene as metal-free carbocatalysts for the solventless aerobic oxidation of styrenes. Catal. Commun. 2015, 65, 10-13. 7. Dhakshinamoorthy, A.; Primo, A.; Concepcion, P.; Alvaro, M.; Garcia, H. Doped Graphene as a Metal-Free Carbocatalyst for the Selective Aerobic Oxidation of Benzylic Hydrocarbons, Cyclooctane and Styrene. Chemistry-a European Journal 2013, 19, 7547-7554. 8. hayashi, M. Oxidation using activated carbon and molecular oxygen system. Chemical Record 2008, 8, 252-267. 9. Lv, G.; Wang, H.; Yang, Y.; Deng, T.; Chen, C.; Zhu, Y.; Hou, X. Graphene Oxide: A Convenient Metal-Free Carbocatalyst for Facilitating Aerobic Oxidation of 5-Hydroxymethylfurfural into 2, 5-Diformylfuran. Acs Catalysis 2015, 5, 5636-5646. 10. Dreyer, D. R.; Jia, H. P.; Bielawski, C. W. Graphene Oxide: A Convenient Carbocatalyst for Facilitating Oxidation and Hydration Reactions. Angewandte Chemie-
International Edition 2010, 49, 6813-6816. 11. Long, J. L.; Xie, X. Q.; Xu, J.; Gu, Q.; Chen, L. M.; Wang, X. X. Nitrogen-Doped Graphene Nanosheets as Metal-Free Catalysts for Aerobic Selective Oxidation of Benzylic Alcohols. Acs Catalysis 2012, 2, 622-631. 12. Patel, M. A.; Luo, F.; Khoshi, M. R.; Rabie, E.; Zhang, Q.; Flach, C. R.; Mendelsohn, R.; Garfunkel, E.; Szostak, M.; He, H. P-Doped Porous Carbon as Metal Free Catalysts for Selective Aerobic Oxidation with an Unexpected Mechanism. ACS Nano
2016, 10, 2305-15. 13. Watanabe, H.; Asano, S.; Fujita, S.; Yoshida, H.; Arai, M. Nitrogen-Doped, Metal-Free Activated Carbon Catalysts for Aerobic Oxidation of Alcohols. Acs Catalysis 2015, 5, 2886-2894. 14. Cheon, J. Y.; Kim, J. H.; Goddeti, K. C.; Park, J. Y.; Joo, S. H. Intrinsic Relationship between Enhanced Oxygen Reduction Reaction Activity and Nanoscale Work Function of Doped Carbons. J. Am. Chem. Soc. 2014, 136, 8875-8878. 15. Meng, Y.; Voiry, D.; Goswami, A.; Zou, X.; Huang, X.; Chhowalla, M.; Liu, Z.; Asefa, T. N-, O-, and S-tridoped nanoporous carbons as selective catalysts for oxygen reduction and alcohol oxidation reactions. J. Am. Chem. Soc. 2014, 136, 13554-7.
241
16. Dreyer, D. R.; Jia, H. P.; Bielawski, C. W. Graphene oxide: a convenient carbocatalyst for facilitating oxidation and hydration reactions. Angew. Chem. Int. Ed.
Engl. 2010, 49, 6813-6. 17. Boukhvalov, D. W.; Dreyer, D. R.; Bielawski, C. W.; Son, Y. W. A Computational Investigation of the Catalytic Properties of Graphene Oxide: Exploring Mechanisms by using DFT Methods. Chemcatchem 2012, 4, 1844-1849. 18. Patel, M.; Luo, F.; Khoshi, M. R.; Rabie, E.; Zhang, Q.; Flach, C. R.; Mendelsohn, R.; Garfunkel, E.; Szostak, M.; He, H. P-Doped Porous Carbon as Metal Free Catalysts for Selective Aerobic Oxidation with an Unexpected Mechanism. ACS Nano 2016, 10, 2305-2315. 19. Choi, C. H.; Park, S. H.; Woo, S. I. Phosphorus-nitrogen dual doped carbon as an effective catalyst for oxygen reduction reaction in acidic media: effects of the amount of P-doping on the physical and electrochemical properties of carbon. J. Mater. Chem. 2012, 22, 12107-12115. 20. Li, R.; Wei, Z. D.; Gou, X. L. Nitrogen and Phosphorus Dual-Doped Graphene/Carbon Nanosheets as Bifunctional Electrocatalysts for Oxygen Reduction and Evolution. Acs Catal 2015, 5, 4133-4142. 21. Shi, Q. Q.; Peng, F.; Liao, S. X.; Wang, H. J.; Yu, H.; Liu, Z. W.; Zhang, B. S.; Su, D. S. Sulfur and nitrogen co-doped carbon nanotubes for enhancing electrochemical oxygen reduction activity in acidic and alkaline media. Journal of Materials Chemistry A
2013, 1, 14853-14857. 22. Wang, X.; Sun, G.; Routh, P.; Kim, D. H.; Huang, W.; Chen, P. Heteroatom-doped graphene materials: syntheses, properties and applications. Chem. Soc. Rev. 2014, 43, 7067-98. 23. Patel, M.; Savaram, K.; Keating, K.; He, H. Rapid Transformation of Biomass Compounds to Metal Free Catalysts via Short Microwave Irradiation. Journal of Natural
Products Research Updates 2015, 1, 18-28. 24. Dhakshinamoorthy, A.; Primo, A.; Concepcion, P.; Alvaro, M.; Garcia, H. Doped Graphene as a Metal-Free Carbocatalyst for the Selective Aerobic Oxidation of Benzylic Hydrocarbons, Cyclooctane and Styrene. Chemistry – A European Journal 2013, 19, 7547-7554. 25. Fung, W.-H.; Yu, W.-Y.; Che, C.-M. Chemoselective Oxidation of Alcohols to Aldehydes and Ketones by tert-Butyl Hydroperoxide Catalyzed by a Ruthenium Complex of N,N‘,N‘‘-Trimethyl-1,4,7-triazacyclononane. The Journal of Organic Chemistry 1998, 63, 2873-2877. 26. Poreddy, R.; Engelbrekt, C.; Riisager, A. Copper oxide as efficient catalyst for oxidative dehydrogenation of alcohols with air. Catalysis Science & Technology 2015, 5, 2467-2477. 27. Yamaguchi, K.; Mizuno, N. Scope, Kinetics, and Mechanistic Aspects of Aerobic Oxidations Catalyzed by Ruthenium Supported on Alumina. Chemistry – A European
Journal 2003, 9, 4353-4361. 28. Dijksman, A.; Marino-González, A.; Mairata i Payeras, A.; Arends, I. W. C. E.; Sheldon, R. A. Efficient and Selective Aerobic Oxidation of Alcohols into Aldehydes and Ketones Using Ruthenium/TEMPO as the Catalytic System. J. Am. Chem. Soc. 2001, 123, 6826-6833.
242
29. El-Sawy, A. M.; Mosa, I. M.; Su, D.; Guild, C. J.; Khalid, S.; Joesten, R.; Rusling, J. F.; Suib, S. L. Controlling the Active Sites of Sulfur-Doped Carbon Nanotube–Graphene Nanolobes for Highly Efficient Oxygen Evolution and Reduction Catalysis. Advanced
Energy Materials 2016, 6, n/a-n/a. 30. Hsi, H.-C.; Rood, M. J.; Rostam-Abadi, M.; Chen, S.; Chang, R. Effects of Sulfur Impregnation Temperature on the Properties and Mercury Adsorption Capacities of Activated Carbon Fibers (ACFs). Environmental Science & Technology 2001, 35, 2785-2791. 31. Huffman, G. P.; Mitra, S.; Huggins, F. E.; Shah, N.; Vaidya, S.; Lu, F. Quantitative analysis of all major forms of sulfur in coal by x-ray absorption fine structure spectroscopy. Energy & Fuels 1991, 5, 574-581. 32. Zhang, L.; Niu, J.; Li, M.; Xia, Z. Catalytic Mechanisms of Sulfur-Doped Graphene as Efficient Oxygen Reduction Reaction Catalysts for Fuel Cells. The Journal of Physical
Chemistry C 2014, 118, 3545-3553. 33. Li, W.; Gao, Y.; Chen, W.; Tang, P.; Li, W.; Shi, Z.; Su, D.; Wang, J.; Ma, D. Catalytic Epoxidation Reaction over N-Containing sp2 Carbon Catalysts. Acs Catal 2014, 4, 1261-1266. 34. Gao, Y.; Hu, G.; Zhong, J.; Shi, Z.; Zhu, Y.; Su, D. S.; Wang, J.; Bao, X.; Ma, D. Nitrogen-Doped sp2-Hybridized Carbon as a Superior Catalyst for Selective Oxidation. Angew. Chem. Int. Ed. 2013, 52, 2109-2113. 35. Lai, L.; Potts, J. R.; Zhan, D.; Wang, L.; Poh, C. K.; Tang, C.; Gong, H.; Shen, Z.; Lin, J.; Ruoff, R. S. Exploration of the active center structure of nitrogen-doped graphene-based catalysts for oxygen reduction reaction. Energy & Environmental Science 2012, 5, 7936-7942. 36. Yuan, H.; He, Z. Graphene-modified electrodes for enhancing the performance of microbial fuel cells. Nanoscale 2015, 7, 7022-7029. 37. Patel, M.; Feng, W.; Savaram, K.; Khoshi, M. R.; Huang, R.; Sun, J.; Rabie, E.; Flach, C.; Mendelsohn, R.; Garfunkel, E.; He, H. Microwave Enabled One-Pot, One-Step Fabrication and Nitrogen Doping of Holey Graphene Oxide for Catalytic Applications. Small 2015, 11, 3358-3368. 38. Ravel, B.; Newville, M. ATHENA, ARTEMIS, HEPHAESTUS: data analysis for X-ray absorption spectroscopy using IFEFFIT. Journal of synchrotron radiation 2005, 12, 537-541.
Related Documents