UNLV Retrospective Theses & Dissertations 1-1-1992 Microwave digestion methods for preparation of platinum ore Microwave digestion methods for preparation of platinum ore samples for Icp analysis samples for Icp analysis Piotr Nowinski University of Nevada, Las Vegas Follow this and additional works at: https://digitalscholarship.unlv.edu/rtds Repository Citation Repository Citation Nowinski, Piotr, "Microwave digestion methods for preparation of platinum ore samples for Icp analysis" (1992). UNLV Retrospective Theses & Dissertations. 261. http://dx.doi.org/10.25669/307g-vclw This Thesis is protected by copyright and/or related rights. It has been brought to you by Digital Scholarship@UNLV with permission from the rights-holder(s). You are free to use this Thesis in any way that is permitted by the copyright and related rights legislation that applies to your use. For other uses you need to obtain permission from the rights-holder(s) directly, unless additional rights are indicated by a Creative Commons license in the record and/ or on the work itself. This Thesis has been accepted for inclusion in UNLV Retrospective Theses & Dissertations by an authorized administrator of Digital Scholarship@UNLV. For more information, please contact [email protected].

Welcome message from author
This document is posted to help you gain knowledge. Please leave a comment to let me know what you think about it! Share it to your friends and learn new things together.
Transcript

UNLV Retrospective Theses & Dissertations
1-1-1992
Microwave digestion methods for preparation of platinum ore Microwave digestion methods for preparation of platinum ore
samples for Icp analysis samples for Icp analysis
Piotr Nowinski University of Nevada, Las Vegas
Follow this and additional works at: https://digitalscholarship.unlv.edu/rtds
Repository Citation Repository Citation Nowinski, Piotr, "Microwave digestion methods for preparation of platinum ore samples for Icp analysis" (1992). UNLV Retrospective Theses & Dissertations. 261. http://dx.doi.org/10.25669/307g-vclw
This Thesis is protected by copyright and/or related rights. It has been brought to you by Digital Scholarship@UNLV with permission from the rights-holder(s). You are free to use this Thesis in any way that is permitted by the copyright and related rights legislation that applies to your use. For other uses you need to obtain permission from the rights-holder(s) directly, unless additional rights are indicated by a Creative Commons license in the record and/or on the work itself. This Thesis has been accepted for inclusion in UNLV Retrospective Theses & Dissertations by an authorized administrator of Digital Scholarship@UNLV. For more information, please contact [email protected].

INFORMATION TO USERS
This manuscript has been reproduced from the microfilm master. UMI films the text directly from the original or copy submitted. Thus, some thesis and dissertation copies are in typewriter face, while others may be from any type of computer printer.
The quality of this reproduction is dependent upon the quality of the copy submitted. Broken or indistinct print, colored or poor quality illustrations and photographs, print bleedthrough, substandard margins, and improper alignment can adversely affect reproduction.
In the unlikely event that the author did not send UMI a complete manuscript and there are missing pages, these will be noted. Also, if unauthorized copyright material had to be removed, a note will indicate the deletion.
Oversize materials (e.g., maps, drawings, charts) are reproduced by sectioning the original, beginning at the upper left-hand corner and continuing from left to right in equal sections with small overlaps. Each original is also photographed in one exposure and is included in reduced form at the back of the book.
Photographs included in the original manuscript have been reproduced xerographically in this copy. Higher quality 6" x 9" black and white photographic prints are available for any photographs or illustrations appearing in this copy for an additional charge. Contact UMI directly to order.
University M icrofilms International A Bell & Howell Information C o m p a n y
3 0 0 North Z e e b R oad. Ann Arbor. Ml 4 8 1 0 6 -1 3 4 6 USA 3 1 3 /7 6 1 -4 7 0 0 8 0 0 /5 2 1 -0 6 0 0


Order Num ber 1352555
M icrowave digestion m ethods for preparation of platinum ore samples for ICP analysis
Nowinski, Piotr, M.S.
University of Nevada, Las Vegas, 1993
U M I300 N. Zeeb Rd.Ann Arbor, MI 48106


MICROWAVE DIGESTION METHODS FOR PREPARATION OF PLATINUM
ORE SAMPLES FOR ICP ANALYSIS
byPiotr Nowinski
A thesis submitted in partial fulfillment of the requirements for the degree of
Master of Science
in
Chemistry
Department of Chemistry University of Nevada, Las Vegas
April, 1993
The thesis of Piotr Nowin.ski for the degree of M aster of Science in Chemistryis approved.
Chairperson, Vernon F. Hodge, Ph.D
Exatm^ing Committee Member, Spencer l^L Steinberg, Ph.D
^ ^ (1 -y yy A \s rExamining Cdrnmiftee Member, Brian J . Johnson, Ph.D
r x —f— - • -— IT v i ’' • c tk , , ______________Graduate Faculty Representative, Eugene I. Smith, Ph.D
Graduate Dean, Ronald W. Smith
University of Nevada, Las Vegas April, 1993

ABSTRACT
The technique of microwave digestion was evaluated as a possible alternative to conventional sample preparation methods for the platinum ores prior to spectroscopic analysis. Microwave energy used with aqua regia in closed vessel provides elevated pressure and rapid heating which significantly reduce digestion time. The effect of varying sample preparation conditions, including power settings programming, heating time and pressure inside the digestion vessel was studied using reference materials. Reference materials included: SARM7, NBM-5b, NBM-6a, NBM-6b, and SU-la. All analyses were carried out by inductively coupled plasma atomic-emission spectroscopy (ICP-AES). The study provides analytical method performance data (detection limit, optimum concentration range, interferences, precision and accuracy). For optimization of microwave digestion conditions a central composite design was employed. Because of the complex chemistry of the ore samples, ICP-AES analysis suffered from severe spectral interferences. To reduce matrix interferences during analysis, a predigestion step with 50 mL of 1:1 nitric acid was introduced. This new method was used to determine the platinum group elements (PGE) values in the unknown materials supplied by the Mineral Deposits Division of the Geological Survey of Canada. Both ICP-AES and inductively plasma mass spectroscopy (ICP-MS) were used for analysis of sample extracts. ICP-AES analyses showed improved recoveries of Pd (60-80%) and Pt (30-60%) in only two reference materials SARM7 and NBM-6b. ICP-MS analyses of the reference materials indicate that most PGE recoveries were 85-102%. Os and Au were less efficiently recovered. Relative percent difference in the determination of the more efficiently recovered elements ranged between 1-12%. Additionally PGE extraction with 10% KCN solution was investigated. Sample extracts were analyzed by ICP-MS. Analyses of the cyanide extracts showed similar PGE recoveries to aqua regia digestion for Ir, Pd, Ru, and Rh. Platinum, osmium and gold recoveries were less efficient. Data from the ICP-MS analysis of standard materials demonstrate the ability of the microwave procedure to perform rapid and accurate determinations of PGE in the ore samples.
TABLE OF CONTENTTS
APPROVAL P A G E ..................................................................................................... ii
A BSTRA CT..................................................................................................................... iii
FIG U RES...................................................................................................................... vi
TABLES ...................................................................................................................... vii
ABBREVIATIONS ..................................................................................................... ix
ACKNOWLEDGEMENTS........................................................................................ xii
CHAPTER 1 INTRODUCTION ............................................................................... 1H istory ............................................................................................................... 2Inorganic Chemistry........................................................................................ 3Geology and Mineralogy ............................................................................... 4Microwave digestion ...................................................................................... 7Inductively Coupled Plasma Atomic Emission Spectroscopy.................... 9Inductively Coupled Plasma Mass Spectrometry ....................................... 13
CHAPTER 2 ICP-AES ANALYSIS.......................................................................... 16Experimental..................................................................................................... 16
CHAPTER 3 OPTIMIZATION OF THE MICROWAVE DIGESTIONMETHOD ....................................................................................................... 26Reference M aterials........................................................................................ 26Collection of Microwave Calibration Data ................................................. 31Results of Microwave Calibration ................................................................ 32Experimental Design for Microwave Method Optimization...................... 35Results of Microwave Digestion Optimization Experiments .................... 41ICP-AES Analysis Results and D iscussion................................................. 44Microwave digestion method for platinum ore samples ........................... 50
CHAPTER 4 ICP-MS ANALYSIS .......................................................................... 52Experimental..................................................................................................... 52Microwave digestion method for platinum ore samples ........................... 61Cyanide Leach Method ................................................................................. 63Microwave cyanide leach for platinum ore sam ples................................... 63
CHAPTER 5 CONCLUSIONS ................................................................................. 69

APPENDIX 1 MICROWAVE D IG ESTIO N ........................................................... 71
APPENDIX 2 ICP-AES DATA RESULTS.............................................................. 76
APPENDIX 3 ICP-MS DATA RESULTS .............................................................. 96
APPENDDC 4 QUALITY ASSURANCE P L A N ................................................. 116
REFERENCES .......................................................................................................... 120
v
FIGURES
Figure 1. Simultaneous ICP-AES system.................................................................. 12
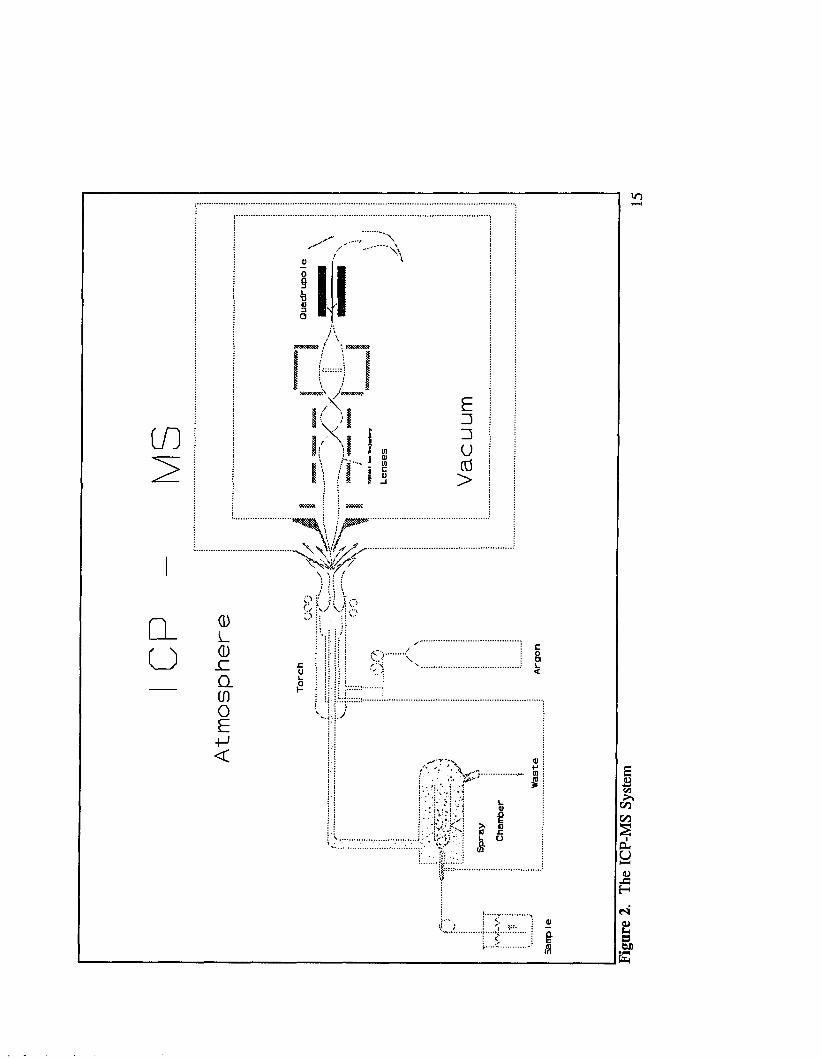
Figure 2. The ICP-MS S y stem ................................................................................. 15
Figure 3. Memory effects for osmium. Analysis of rinse blank solution 23
Figure 4. Calibration Line for Microwave Digestion Oven No. 2......................... 34
Figure 5. Central composite design in three fac to rs ............................................... 39
Figure 6. Time-Pressure curves for aqua regia......................................................... 43
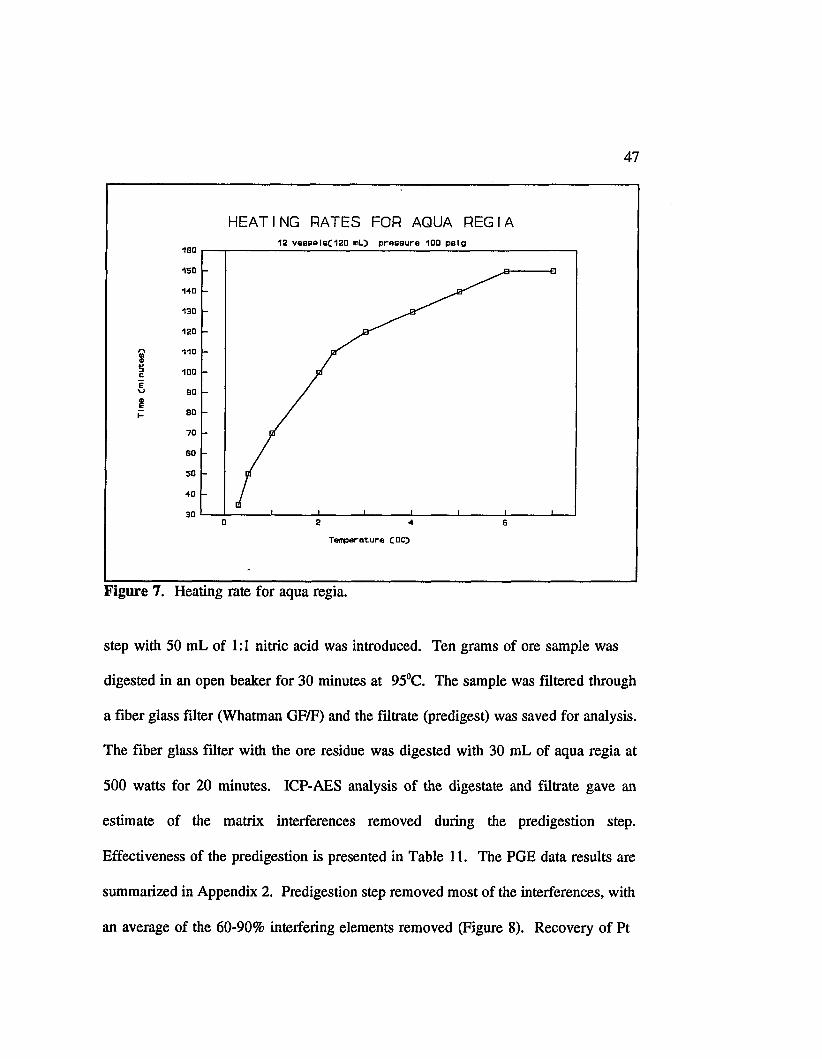
Figure 7. Heating rate for aqua regia......................................................................... 47
Figure 8. SARM7. Effectiveness of the predigestion step.................................... 49
Figure 9. NBM-6b. Distribution of PGE.................................................................. 57
Figure 10. SU-la. Distribution of PGE .................................................................. 57
Figure 11. SARM7. Distribution of P G E ................................................................ 58
Figure 12. SU-la. Comparison of ICP-AES and ICP-MS ............................... 66
Figure 13. SU-la. Comparison of aqua regia and cyanide ............................... 66
Figure 14. SARM7. Comparison of ICP-AES and ICP-MS ................................. 67
Figure 15. SARM7. Comparison of aqua regia and cyan ide ................................. 67
Figure 16. NBM-6b. Comparison of ICP-AES and IC P-M S................................ 68
vi
TABLES
Table 1. ICP-AES operating conditions.................................................................. 16
Table 2. Average background noise during ICP-AES analysis ............................. 19
Table 3. Summary of instrument detection limits ................................................. 20
Table 4. Spectral interference (ug/L) caused by 1000 mg/L of interfering
element at the wavelength of in terest............................................... 21
Table 5. Summary of optimum concentration ranges (linearity) for
ICP-AES ............................................................................................. 24
Table 6. Analytical lines used during ICP-AES analysis ..................................... 25
Table 7. Concentration of platinum group elements in the standard reference
materials ............................................................................................. 28
Table 8. Results of Microwave Calibration ........................................................... 33
Table 9. Microwave test conditions......................................................................... 40
Table 10. Summary of maximum pressures during microwave digestions . . . . 42
Table 11. Removal of interfering elements by predigestion ................................ 48
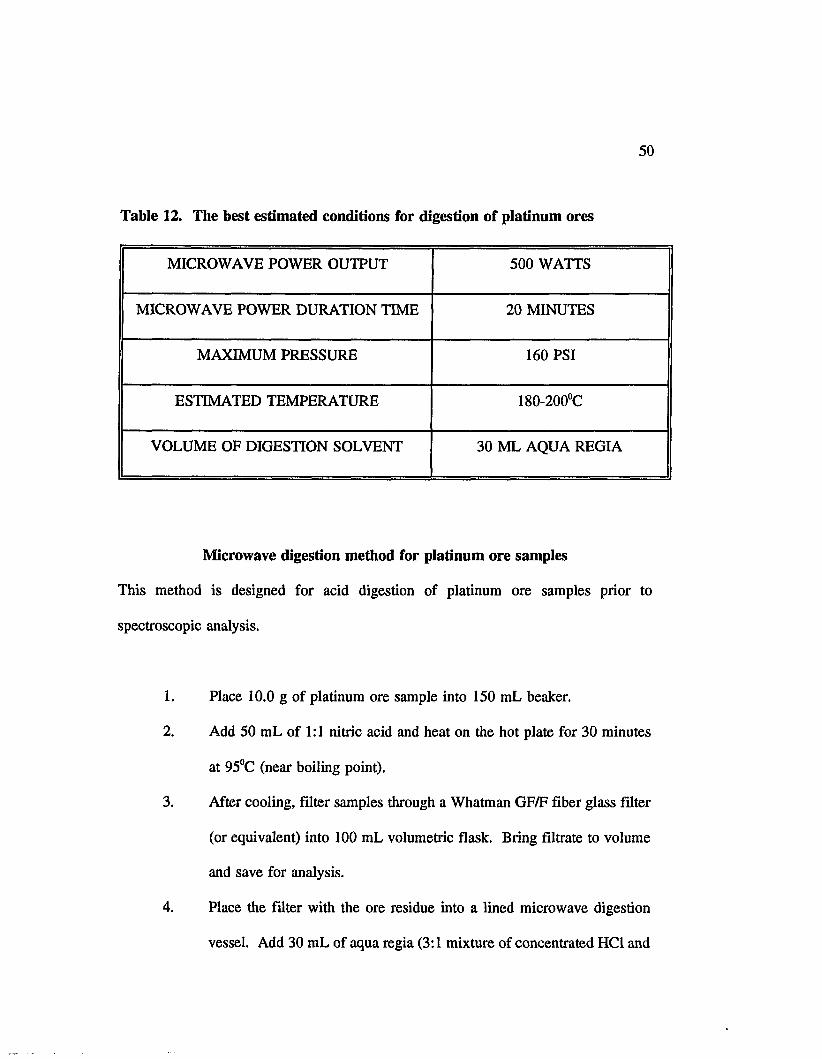
Table 12. The best estimated conditions for digestion of platinum o r e s 50
Table 13. ICP-MS operating conditions.................................................................. 52
Table 14. Analytical ions used during ICP-MS analysis
(potential interferences are also shown) .......................................... 54
Table 15. Summary of PGE recoveries.................................................................. 56

Table 16. Summary of % recovery for ICP-AES and ICP-MS analyses 59
Table 17. Summary of desirability coefficients for ICP-AES and
ICP-MS analyses................................................................................. 60
Table 18. Summary of % recovery for ICP-MS analyses ..................................... 65
viii

ABBREVIATIONS
amu - atomic mass unit
CCB - Continuous Calibration Blank
CCV - Continuous Calibration Blank
D - overall desirability coefficient
ICB - Initial Calibration Blank
ICP-AES - Inductively Coupled Plasma-Atomic Emission Spectroscopy
ICP-MS - Inductively Coupled Plasma-Mass Spectrometry
ICV - Initial Calibration Verification
IDL - Instrument Detection Limit
kV - kilovolt
L - liter
mg - milligram
mL - milliliter
MHz - megahertz
min - minute
ug - microgram
nm - nanometer

PB - Preparation Blank
PGE - Platinum Group Elements
PPb - parts per billion
ppm - parts per million
QA/QC - Quality Assurance/Quality Control
rf - radio frequency
RPD - Relative Percent Difference
SD - Standard Deviation
SRM - Standard Reference Material
W - watt
X

For my loving and supporting wife, Danuta

ACKNOWLEDGEMENTS
The author would like to show his appreciation to following people for their valuable
help, assistance, and advice:
Dr. Vem Hodge, Dr. Brian Johnson, Dr. Spencer Steinberg, Dr. Eugene Smith,
Ron Callison, Dan Fisher, Dan Hillman, , John Teberg, Xavier Suarez, Roger Smid,
Lynn Peters, and Greg Rabb. Special thanks to Magumi Amano and Charles Monaco.
Also the author would like to express his appreciation to the Harry Reid Research
Center and Lockheed Environmental Systems and Technologies.

CHAPTER 1
INTRODUCTION
The platinum group elements (PGE) are currently receiving worldwide attention
as an attractive exploration target because they are precious metals with many
important uses. The PGE have important applications as catalysts, enabling petroleum
and other chemicals to be produced from crude oil. Substituting other metals in this
strategically important function is difficult PGE also have environmental significance
as an active component of catalytic converters. The catalytic converter significantly
reduces the output of polluting emissions from internal combustion engines.
There is a wide range of methods available for the preparation of platinum ore
samples prior to atomic absorption or emission analysis (Heines and Robert)1. None
is ideal for all types of samples and a method for rapid, quantitative digestion of
geological samples has long been sought. The purpose of this study was to develop
a quick-versatile acid digestion method for platinum ore samples. The developed
method should be ideally applicable to all types of geological matrices and assure
satisfactory recoveries of the PGE.
Use of microwave energy as a method of heating acid digests can be an
attractive alternative to conventional heating methods (Kingston and Jassie)2. The
1
2
advantages of microwave dissolution include shorter heating times that result from the
high temperatures and pressures attained inside the sealed containers. The use of
closed vessels also makes it possible to potentially eliminate uncontrolled trace element
losses due to the formation of volatile molecular species and decreases contamination
from the laboratory equipment which can occur with open vessels.
All the sample digests prepared in this study were analyzed by inductively
coupled plasma atomic emission spectroscopy (ICP-AES) and inductively coupled
plasma mass spectrometry (ICP-MS). These two analytical techniques were used
because of their multielement capabilities and speed. However, microwave digested
samples are amenable for analysis by atomic absorption techniques as well which
would increase the utility of the procedures developed in this study.
History
Platinum was known to the Indians of Ecuador and Colombia long before the
discovery of the Americas. The first description of platinum was made in 1735 by
Antonio de Ulloa, a Spanish surveyor. Palladium and rhodium were discovered in
1803 by Wollaston in crude platinum ore obtained from South America. In the same
year Tennant discovered osmium and iridium in the residue left when crude platinum
is dissolved in aqua regia (Lide)3, In 1844 Klaus obtained 6 grams of ruthenium from
insoluble crude platinum residue (Lide)3. Mining of Colombian placer deposits by the
Spaniards started in 1778. This area remained the world’s only source of platinum
until 1822 when the deposits in the Ural Mountains were discovered. Platinum was
also discovered in the nickel-copper ores of Sudbury, Ontario, in 1885. However, this
district did not became a significant producer of PGE until 1919. The South African
deposits were not commercially developed until 1925, although their occurrence has
been known since 1890. Presently, South Africa is the world’s largest producer of
PGE (Buchanan)4.
Inorganic Chemistry
There are six platinum group elements divided into two triads on the basis of
their atomic weight. The light triad contains ruthenium (Ru), rhodium (Rh) and
palladium (Pd). The heavy triad contains osmium (Os), iridium (Ir), and platinum (Pt).
All the PGE have high densities and melting points and are generally unreactive.
Osmium can be dissolved by strong, alkaline oxidizing agents but is quite inert to aqua
regia. Both platinum and palladium dissolve in aqua regia. Iridium is the most
corrosion-resistant metal known; it is not attacked by hot aqua regia. However, the
PGE will dissolve in molten bases such as sodium, phosphorus, silicon, arsenic,
antimony and lead. Platinum and palladium are relatively soft and ductile. Rhodium
has excellent catalytic characteristics and provides superior properties at high
temperatures when alloyed with platinum. Ruthenium is hard and brittle and as a
consequence is difficult to work. When alloyed with platinum and palladium, it does
impart hardness. Iridium retains its strength and corrosion resistance at very high
temperatures. Osmium is the heaviest known element and has the highest melting
point (2700°C) of the PGE (Lide)3. It remains brittle and unworkable at high

temperatures and is of limited industrial use.
4
Geology and Mineralogy
PGE occur as minerals combined with the chalcophile elements antimony,
arsenic, sulfur, and tellurium. Platinum, together with iridium and osmium, is also a
siderophile and will combine with transition metals, particularly iron, to form metal
alloys. Platinum group minerals or alloys are found mostly in basic and ultrabasic
intrusive igneous rocks. PGE are sometimes associated with nickel and copper
minerals and chromite (CuFeS2). The mineral sperrylite (PtAs2) is associated with
nickel and copper sulfides at Sudbury, Ontario. The large South African deposits
contain sperrylite (PtAsj), native platinum, cooperite (PtS), laurite (RuS2), and braggite
a complex sulfide mineral containing Pt, Pd, Ni, and S (Sjoberg and Gomes)7.
Weathering by oxidation of natural PGE alloys in rocks is slow compared to the
weathering of sulfides, arsenides and other compounds. PGE metal alloys are likely
to be liberated during weathering of host rocks. The high density of osmium, iridium
and platinum would account for the concentration of PGE alloys in alluvial placer.
Lode Deposits
About 63% of the world’s supply of newly mined PGE originate from the
Bushveld Complex, South Africa. This group of rocks is also the source of 85% of
the world’s production of platinum (Buchanan)4. The Bushveld Complex is a body of
igneous rock where PGE in the presence of a sulphide phase became sufficiently
5
enriched to form mineralized horizons. The Bushveld rocks consist of four lobes, the
northern Potgietesrus lode, the western and eastern lobes and a hidden sequence in the
southeast and west A characteristic of the Bushveld complex is the continuity shown
by many of the layers over tens of kilometers (Schiffries and Skimmer)s. The PGE
in the Bushveld Complex combine predominately with sulphur to form sulfides such
as braggite [(Pt,Pd)S], cooperite (PtS), and laurite (RuS2). The Sudbury Nickel
Irruptive in Canada is a prime example of sulphide mineralization associated with a
small mafic intrusion. Discovered in 1888 by a group of gold miners, copper-nickel
ore was shown to contain a mineral composed of an arsenide of platinum. Platinum-
group metals continue to be recovered as a by-product of nickel mining. Peak output
was achieved in 1976 when 0.189 million oz of Pt and 0.198 million oz of Pd were
recovered (Buchanan)4. In 1919 while prospecting for coal in northwestern Siberia,
a Russian geologist discovered a large nickel-copper sulfide ore body in mafic rocks.
In 1924 it was recognized that the mineralization also hosted PGE. Exploitation of the
ore body started in 1935 when Norilsk Mining and Metallurgical Combine was
established (Buchanan)4. The major U.S. lode deposit is located in the Stillwater
complex, Sweetwater County, Montana. An estimated 150 million ounces of Pd and
Pt are contained in certain mineralized layers (Czamanske and Bohlen)5. The Pd-to-Pt
ratio is about 3:1, and most of the platinum and palladium are associated with copper,
iron, and nickel sulfides. Minerals identified in the Stillwater complex include
stibiopalladinite (Pd3Sb), sperrylite (PtAs2), cooperite (PtS), laurite (RuS2), moncheite
(PtTe^, braggite[(Pt, Pd)S], vysoskite (PdS), kotulskite (PdTe), and ferroplatinum
6
alloys (Butterman)8.
Alluvial and Eluvial Deposits
The most common platinum-group minerals or alloys in major alluvial deposits
are Pt-Fe alloys, Ir-Os alloys and minor amounts of cooperite (PtS), sperrylite (PtAs2),
laurite (RuSj), erlichitanite (OsS2), and irasite (IrAsS). The alluvial deposits of PGE
along rivers in the Choco Province of Colombia are found in association with gold
(Sjoberg and Gomes)7. Placer platinum deposits were discovered in the central Ural
Mountains in 1819, north of Sverdlovsk. Up to the discovery of South African
deposits in 1920’s these deposits represented virtually the only source of platinum.
The PGE of the Freetown Layered Complex, Sierra Leone, West Africa are found in
streams (alluvial deposits) and in the laterite cover over a broad band of anorthositic
rocks (eluvial deposits).
The West African platinum placers were exploited between 1929 and 1949.
In 1933 alluvial platinum was discovered at Goodnews Bay on the south-west coast
of Alaska. The deposit could be worked only for six months of the year and operated
until 1982 when it closed down owing to declining grades. Gold and platinum-bearing
placers have been worked along the Talameen and Similkameen rivers near Princeton
in south-central British Columbia since 1891. The deposits have not been actively
worked since the early 1900’s.

7
Epithermal Deposits
Exceptionally high platinum and palladium grades are reported in the felsic
rocks of the Bushveld Complex in the Waterberg district The PGE appear to have
been deposited from mineralizing solutions (Schiffers and Skimmer)s. Epithermal PGE
mineralization in association with gold is also known at Coronation Hill in the
Northern Territory of Australia. In the Lubin copper deposits of Poland, gold and PGE
are concentrated in a layer a few centimeters thick. Hydrothermal processes may have
redistributed or concentrated magmatic PGE; there seems to be a little potential for
significant resources of PGE of purely hydrothermal origin (Buchanan)4.
Microwave digestion
Sample digestion is required prior to analyzing geological samples by
spectroscopic methods. The spectrometers operate most conveniently and give superior
results when the sample is in an aqueous solution. Conventional digestions are
performed using hot plates, block digestors or pressure bombs. Recently, digestion
methods utilizing microwave digestion ovens have been developed. The microwave
method offers several advantages over conventional digestions, such as faster reaction
rates, decrease in contamination, the elimination of losses of volatile analytes, and
reproducibility of digestion conditions.
The use of microwave heating for rapid acid digestions was first demonstrated
in 1975 (Abu-Samra at el.)9. Polar molecules, such as mineral acids and water, will

rotate in response to a microwave electric field. The microwave electric field reverses
polarity (oscillates) several billion times each second producing many collisions
between neighboring molecules. These collisions raise the kinetic energy and therefore
the temperature of the liquid. Some liquids contain dissolved ions which can conduct
current. Dissolved ions will migrate in the presence of an applied microwave field.
The migration of solvated ions also causes collisions with neighboring molecules and
raises the temperature of the liquid. Liquids are heated by both mechanisms
simultaneously. The percent contribution of each mechanism depends on concentration
of the ions and their equivalent conductivity. If a digestion vessel which is transparent
to microwaves is placed in the microwave field, the energy will pass through the walls
even if the container is completely closed. Microwave energy, because of its longer
wavelength, can penetrate a substantial distance into a liquid and is able to cause
heating throughout the liquid rather than only at the surface. The rate of heating water
(which absorbs microwaves by both mechanisms) illustrates how rapid and efficient
microwave heating can be. The power equation for microwave heating of water is
(Gillman)11:
Pabs - power absorbed
Cp - heat capacity of water
M - mass of water being heated
9
T - temperature rise during heating
t - time
L - convective, conductive and radiative heat losses (in most heat losses are cases
ignored)
One of the advantages of microwave digestion methods is the ability to
reproducibly control digestion conditions between different ovens. This is
accomplished by specifying the digestion conditions in terms of power(watts) and
time(minutes). An inherent assumption is the ability to control the oven power in
terms of watts. Since the power for an oven is set with a % power setting (0-100%
power), a calibration must be performed to relate the % power setting to watts. Most
microwave digestion protocols give a general procedure for generating a calibration
curves. However, the simplest calibration procedure may not result in a accurate
picture of the calibration curve (Nowinski and Hillman)12.
Inductively Coupled Plasma Atomic Emission Spectroscopy
The ICP operating at atmospheric pressure was first described and used by
Reed as a technique for growing crystals under high temperature conditions (Reed)13.
The analytical potential of the technique followed from work of Greenfield et al.14 and
Wendt and Fassel15. These early workers did much to establish the ICP as a
spectroscopic source. Inductively coupled plasma atomic emission spectroscopy (ICP-
AES) measures element-emitted light by optical spectroscopy. Element specific

10
atomic-line emission spectra are produced by radio-frequency sustained plasma. The
basis for all emission spectrometry is that atoms and ions in energized state
spontaneously revert to a lower energy state and emit a photon of energy. For
quantitative emission spectrometry it is assumed that the emitted energy is proportional
to the concentration of atoms or ions. However, it is possible that some of the emitted
photons will be absorbed by the same emitting atoms or ions, and in consequence the
proportionality between element concentration and light emitted is destroyed. The
extent to which the ICP succeeds in avoiding self-absorption and self-reversal is
reflected in the very wide range of concentration for which for which linear calibration
graphs are obtained (Thompson and Walsh)16.
The light emitted by the atoms of an element in the ICP must be measured
quantitatively. This is accomplished by resolving light into its component radiation
by means of a diffraction grating and then measuring the light intensity with a
photomultiplier tube at the specific wavelength. Figure 1 shows this process
diagrammatically. Each element has many lines in its spectrum and the selection of
the best line for the analytical application requires considerable experience. Although
the ICP spectrometry has some advantages over other atomic emission techniques, it
is not entirely free of spectral, physical and chemical interferences. Spectral
interferences are caused by: (1) direct overlap of a spectral line from another element;
(2) unresolved overlap of molecular band spectra; (3) background contribution from
continuous and recombination phenomena; and (4) stray light from the light emission
of high concentration elements. Physical interferences are effects associated with the

11
sample nebulization and transport process. Changes in viscosity and surface tension
can cause significant inaccuracies, especially in samples containing high dissolved
solids or high acid concentrations. Chemical interferences include molecular
compound formation, ionization effects, and solute vaporization effects. Normally
these effects are not significant problems with the ICP technique (CLP SOW, 1990)17.

12
diffraction grating
V
transfer fsjptm m a optica
-e -
?/photomultipliers behind axil slits
interface (analog-* digital)
computar with aaaociatad software
VOU teletype
s>observation zona
R.F.coilgenerator
xiliarygsa
outer (plasma cnotam)Ont
taerosolWinjector gas) J L—v - *“ argon
/'fS feutaer^ 'f''' injector gas
H r a if l ^
#*| peristaltic pump
tsolution auto sampler
Figure 1. Simultaneous ICP-AES system.

13
Inductively Coupled Plasma Mass Spectrometry
Techniques for interfacing the ICP to a mass spectrometer were first developed
in 1979 (Gray and Dates)18. Inductively Coupled Plasma Mass Spectrometry (ICP-MS)
is a method which measures the masses of ions produced in a radio-frequency plasma.
Analyte species in a liquid are nebulized and the resulting aerosol is transported into
the plasma torch. Sample species in the plasma are dissociated, atomized and ionized.
The plasma core containing the sample ions is extracted, by means of a water-cooled
interface into a mass spectrometer, capable of providing a resolution of at least 1 amu
peak width at 10% of peak height. A system of electrostatic lenses extracts the
positively charged ions and transport them to a quadrupole mass filter, which sorts
them according to their mass-to-charge ratio. An ion detector registers the transmitted
ions. The schematics of the ICP-MS system is presented in Figure 2. Each naturally
occurring element has a unique mass-to-charge ratio spectrum corresponding to its
isotopes. This pattern allows easy identification of the element in the sample. The
number of registered ions from a given isotope depends directly on the concentration
of the relevant element in the sample, so quantitation is straightforward
(PlasmaQuad)19. The ICP-MS still suffers from interferences, but to a lower extent
than ICP-AES. The major source of interferences are isobaric ions, which are isotopes
of different elements having the same nominal mass-to-charge ratio e.g.,114Cd and
1I4Sn. Molecular ions which have the same nominal charge-to-mass ratio as analyte
of interest are called isobaric molecular ions e .g .,75As and 40Ai35C1+. Isobaric doubly
14
charged ions are caused when a matrix constituent has a secondary ionization potential
that is low enough for doubly formed ions to be formed. The signal occurs at one-half
of the interfering mass, e.g., 69Ga+ and 138Ba+\ A memory interference occurs when
an analyte is present at a high concentrations in a sample and the analyte carries over
into the next sequentially analyzed sample. Most of these interferences can be
corrected if the isotope ratios of the molecular species are known (Laing at el.)20.
U 1
a
CJ6 KJ \
>.
Figu
re
2. Th
e IC
P-M
S Sy
stem

16
CHAPTER 2
ANALYSIS BY ICP-AES
Experimental
ICP-AES Instrumentation: A Perkin-EImer Model Plasma 40 sequential ICP
spectrometer with transversely mounted pneumatic cross-flow nebulizer, and computer
was used to obtain concentration data for PGE in digests of the ore samples.
Instrument operating conditions are given in Table 1. A Baird model 2000
simultaneous ICP spectrometer equipped with a Hildebrand grid nebulizer was used
for analysis of the matrix components.
Table 1. ICP-AES operating conditions
Operating Frequency 40 MHz
Nominal Output Power 1 kW
Plasma Gas Flow Rate 12.0 L/min
Auxiliary Gas Flow Rate 2.0 L/min
Sample Flow Rate 1.0 mL/min
Calibration standard solutions of the PGE and gold were prepared by diluting 1000
mg/L stock solutions: Ir, Os, Rh (Spex Industries, Inc., Edison, NJ), Pd, Pt, Ru and Au
(VWR Scientific, Cerritos, CA) in 60% aqua regia (45 mL HC1 + 15 mL HN03 + 40

17
mL H20). All acids used during this project had spectroscopic purity (Seastar
Chemicals, Sidney, B.C.). All standard solutions used during determination of spectral
interferences had concentration 1000 mg/L (Spex Industries, Inc., Edison, NJ).
The primary objective of this study was to determine optimum conditions for
microwave digestion of platinum ore samples. ICP-AES was chosen as a quick
versatile method with multi-element capability for analysis of the sample digests.
However, before analysis of ore extracts method performance parameters were
evaluated. Parameters investigated included:
1. Precision
2. Accuracy
3. Detection limits
4. Interferences
5. Optimum concentration range
6. Ruggedness
Optimization of Instrument Variables
Instrument variables were optimized prior to collection of data for the method
parameters. Several adjustments were made in order to maximize the platinum signal.
These instrument variables are the following: torch height, sample flow rate, plasma
gas flow rate, and supporting gas flow rate. All optimization procedures were
performed using platinum analytical wavelength 214.423 nm. The sequential

18
spectrometer stepper motor was commanded to the peak position of platinum emission.
This was achieved by nebulizing 10 mg/L platinum standard and directing the stepper
motor to the position of maximum intensity. General optimization of plasma
conditions consisted of adjustment of plasma torch height, such that a maximum signal
intensity was achieved with 1200 watts of applied power using a two-second
integration time. The peristaltic pump was adjusted to a flow rate of 1 mL/min.
Plasma support gas was delivered at 0.8 L/min. The sample carrier flow rate was 2.5
L/min.
Precision
Precision was reported as a function of PGE concentration for each sample.
Precision was determined from calculation of the relative percent difference (RPD) of
the duplicate results.(Formula for calculation of relative percent difference (RPD) is
presented in data reduction section).
Accuracy
Standard materials with certified PGE concentrations sufficient for measurement
by ICP-AES were provided. Accuracy was expressed as a % recovery of the analyte
with the respect to certified value in SRM. At least 70% recovery was considered
good.

19
Instrument Detection Limit (IDL)
The IDL was determined by analysis of seven replicates of sample the matrix
blank. The detection limit is defined as three times the standard deviation of seven
consecutive measurements of the reagent blank at the wavelength of interest (SW-
846)“ . In this study 60% aqua regia (final acids concentration resulting from
microwave digestion), free of interferences, was used as the reagent blank. The results
of DDL measurement are summarized in Table 3.
Background noise level was estimated by analysis of eleven preparation blank solutions
and averaging the results. Average background contributions are summarized in Table
2.
Table 2. Average background noise during ICP-AES analysis
Element Analytical wavelength Average background noise (ug/L)
Iridium 212.681 nm 239
Platinum 214.432 nm 110.25
Osmium 225.585 nm 383
Rhodium 233.477 nm 346
Gold 242.795 nm 131
Ruthenium 245.657 nm 169
Palladium 340.458 nm 96
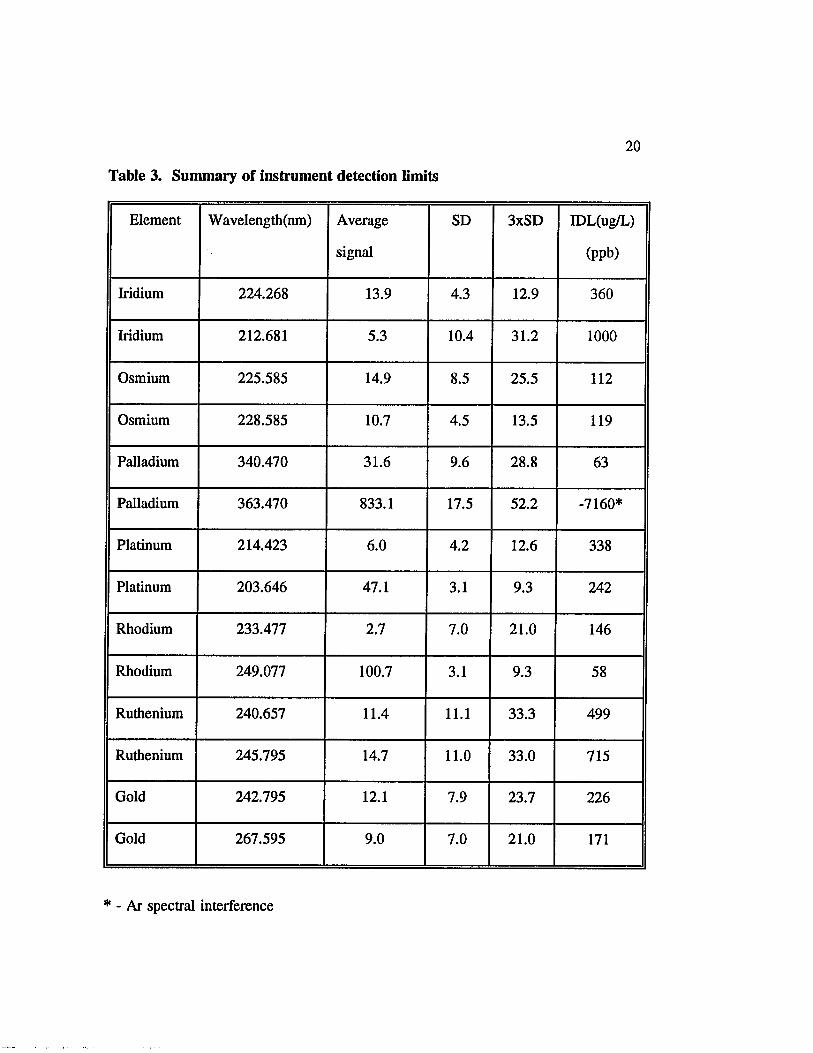
Table 3. Summary of instrument detection limits
2 0
Element Wavelength(nm) Average
signal
SD 3xSD IDL(ug/L)
(ppb)
Iridium 224.268 13.9 4.3 12.9 360
Iridium 212.681 5.3 10.4 31.2 1000
Osmium 225.585 14.9 8.5 25.5 112
Osmium 228.585 10.7 4.5 13.5 119
Palladium 340.470 31.6 9.6 28.8 63
Palladium 363.470 833.1 17.5 52.2 -7160*
Platinum 214.423 6.0 4.2 12.6 338
Platinum 203.646 47.1 3.1 9.3 242
Rhodium 233.477 2.7 7.0 21.0 146
Rhodium 249.077 100.7 3.1 9.3 58
Ruthenium 240.657 11.4 11.1 33.3 499
Ruthenium 245.795 14.7 11.0 33.0 715
Gold 242.795 12.1 7.9 23.7 226
Gold 267.595 9.0 7.0 21.0 171
* - Ar spectral interference
2 1
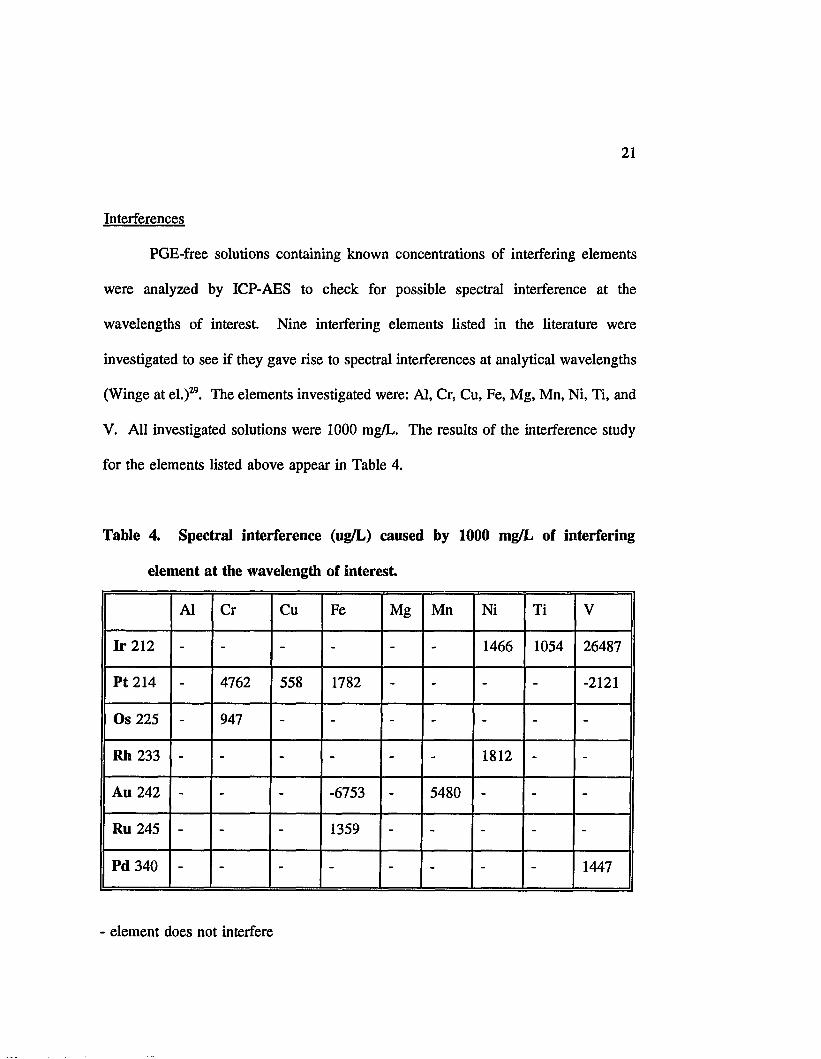
Interferences
PGE-free solutions containing known concentrations of interfering elements
were analyzed by ICP-AES to check for possible spectral interference at the
wavelengths of interest. Nine interfering elements listed in the literature were
investigated to see if they gave rise to spectral interferences at analytical wavelengths
(Winge at el.)29. The elements investigated were: Al, Cr, Cu, Fe, Mg, Mn, Ni, Ti, and
V. All investigated solutions were 1000 mg/L. The results of the interference study
for the elements listed above appear in Table 4.
Table 4. Spectral interference (ug/L) caused by 1000 mg/L of interfering
element at the wavelength of interest
Al Cr Cu Fe Mg Mn Ni Ti V
I r 212 - - - - - - 1466 1054 26487
P t 214 - 4762 558 1782 - - - - -2121
Os 225 - 947 - - - - - - -
RIi 233 - - - - - - 1812 - -
Au 242 - - - -6753 - 5480 - - -
Ru 245 - - - 1359 - - - - -
Pd 340 - - - - - - - - 1447
- element does not interfere

2 2
Optimum Concentration Range
The range over which the measured analyte emission varies linearly with
concentration was determined by aspirating a series of standards and noting any
deviation from theoretical concentrations. The standards used ranged from a blank
solution to a 20 mg/L analyte standard. Acids concentrations in the standard solutions
was identical as in the sample extracts resulting from the digestion (60% aqua regia).
Data points represent the average of triplicate measurements of solutions. For all the
analytes investigated, the increase in the analyte signal was linear to 20 mg/L. In the
range from 0 to 20 mg/L deviation from the theoretical signal is minimal. Analysis
of regression results for palladium emission line 363.470 nm showed poor linearity
(r2=0.8724). This was attributed to argon interference (Winge at el.)29. The results
of linear regression for all investigated analytes are summarized in Table 5. During
the investigation of linear ranges a peculiar behavior of osmium was observed. After
analysis of the 20 mg/L standard, a strong osmium signal was observed when a blank
solution was analyzed. Subsequent analyses of the blank yielded a declining signal
intensities, leading to a hypothesis that osmium (and to a lower extend ruthenium)
temporally binds to the TygonR tubing of sample delivery system. Intensity of the
signal was also proportional to the concentration of osmium in a sample analyzed prior
to blank. A time period required to remove the residual osmium from the sample
delivery tubing was determined by analysis of 20 mg/L osmium solution followed by
rinse with a blank solution. The osmium signal was then monitored every 2 min for
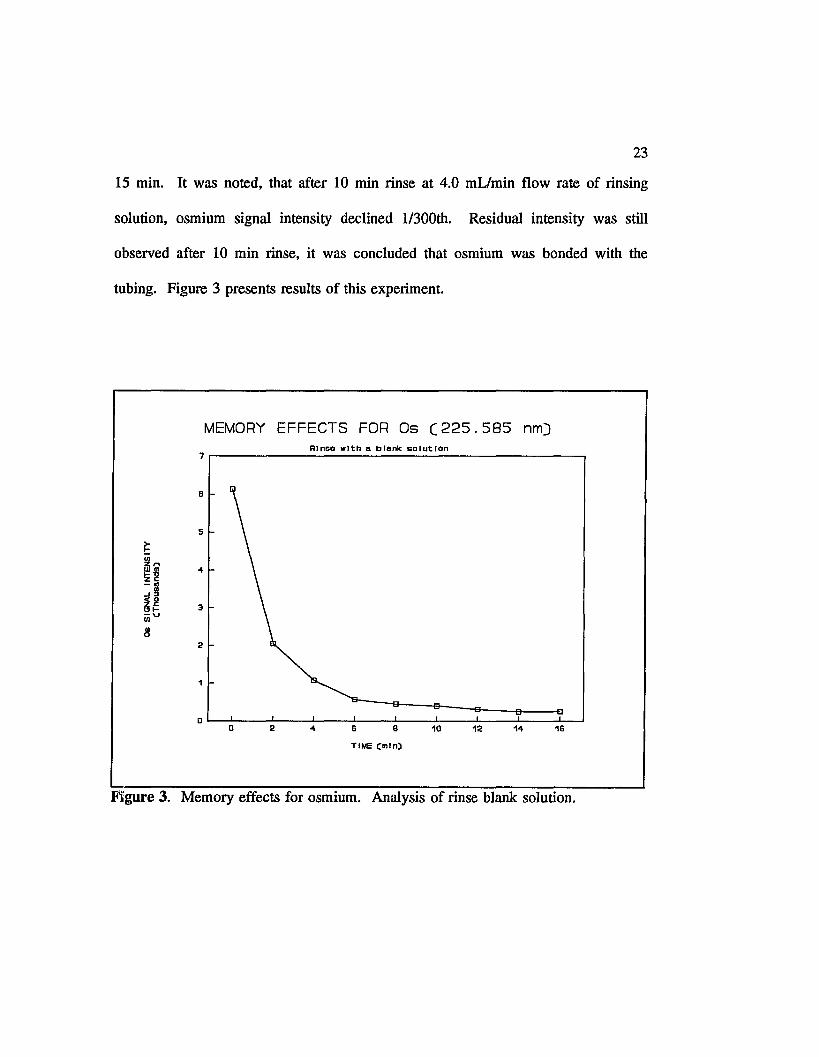
23
15 min. It was noted, that after 10 min rinse at 4.0 mL/min flow rate of rinsing
solution, osmium signal intensity declined l/300th. Residual intensity was still
observed after 10 min rinse, it was concluded that osmium was bonded with the
tubing. Figure 3 presents results of this experiment.
MEMORY EFFECTS FOR Os C225.585 nm}R in se w ith a b la n k s o l u t i o n
7
6
5
4
3
2
1
0 0 2 4 6 B 10 12 14 16
T I M E C m l n }
Figure 3. Memory effects for osmium. Analysis of rinse blank solution.

24
Table 5. Summary of optimum concentration ranges (linearity) for ICP-AES
Element Wavelength(nm) Correlation
coefficient r2
Slope Intercept
Iridium 224.268 0.9999 41.73 -2.10
Iridium 212.681 1.0000 28.60 2.58
Osmium 225.585 0.9999 1248.59 -114.76
Osmium 228.585 0.9999 884.47 -91.49
Palladium 340.470 0.9999 258.92 12.42
Palladium 363.470 0.8724 103.33 792.36
Platinum 214.423 0.9990 29.65 2.58
Platinum 203.646 1.0000 16.43 5.32
Rhodium 233.477 0.9999 436.48 -42.83
Rhodium 249.077 1.0000 266.47 -6.28
Ruthenium 240.657 0.9993 47.50 9.61
Ruthenium 245.795 0.9991 32.70 9.61
Gold 242.795 0.9999 150.79 -10.41
Gold 267.595 0.9999 124.69 -0.38

25
Ruggedness
The limits over which instrument method parameters can be varied without
affecting the method performance were determined. Ruggedness testing included
variations in the sample nebulization rate. Variations in the sample intake rate did not
influenced the signal intensity of the platinum 214.423 nm emission line.
Performance evaluation data was used for selection of the analytical
wavelengths used during analysis of digested samples. Selection results are provided
in Table 6 .
Table 6. Analytical lines used during ICP-AES analysis.
Analyte Analytical wavelength Criteria of selection
Iridium 212.681 nm Other line has strong Cu interference
Platinum 214.432 nm most intensive line; other line at window edge
Osmium 225.585 nm most intensive line
Rhodium 233.477 nm most intensive line; other line at window edge
Gold 242.795 nm most intensive line; less background noise
Ruthenium 245.657 nm lowest number of interferences
Palladium 340.458 nm Other line strong Ar interference
26
CHAPTER 3
OPTIMIZATION OF THE MICROWAVE DIGESTION METHOD
Reference Materials
During optimization of the microwave digestion method the following standard
reference materials (SRM) with certified values of PGEs were utilized:
SARM7 - the material is a composite of samples from the Merensky Reef taken from
5 localities in the Bushveld Complex in the Transvaal, South Africa. The material
consists mainly of a feldspatic pyroxenite. Minor constituents are chromite(FeCr20 4),
pentlandite [(Fe,Ni)9Sg], chalcopyrite (CuFeS2), and pyrrhotite [(Fe,Ni)S], Major
constituents are pyroxene (ABSi20 6) \ olivine [(Mg,Fe)2Si04], serpentine
[(Mg,Fe)3Si20 5(0H)4], and plagioclase [(Na,Ca)Al(Si,Al)Si20 3]. The platinum minerals
are mainly ferroplatinum, cooperite (PtS), sperrylite (PtAs^, braggite (RuS2), and
moncheite (PtTeJ. Silica (Si02) and Magnesia (MgO) account for 70% of the sample
and oxides of iron, aluminum, and calcium for a further 24% (Steele et al.)21.
1 Pyroxene - group of silicate minerals having the general formula ABSi20 6 where A = Ca, Na, Mg, or Fe+2; B = Mg, Fe+3, or Al (Gary at el.)10.

27
SU-la - the bulk material is a sample of feed to the Clarabelle mill of the International
Nickel Company (Sudbury) consisting of 27% chlorite [(Mg,Fe+2,Fe+3)6AlSi3O10(OH)8],
15-19% of each quartz (Si02), feldspar (KAlSi30 8), mica [(K,Na,Ca)(Mg,Fe,Li,Al)2.
3(Al,Si)4O10(OH,F)2] and amphibole [A2.3B5(Si,Al)80 22(OH)2]2 and less than 2% of each
of calcite (CaC03), siderite (FeC03), sphalerite (ZnS), pyrrholite [(Fe,Ni)S],
pentalandite [(Fe,Ni)9S8] and chalcopyrite (CuFeS^ (CANMET)22.
NBM-5b - is a carbonate hosted, hydrothermal Au, Ag, Pt and Pd from the Boss Mine
in Southern Nevada (Goodsprings area). The ore occurs in dolomitic limestone
[CaMg(C03)], most of the ore body is an irregular mass of quartz and iron oxides
containing copper minerals, gold, silver, and a small amount of platinum and palladium
(Desilets)23.
NBM-6b - Stillwater intrusive, Sweetwater County, Montana. Mineralization consist
largely of plagioclase [(Na,Ca)Al(Si,Al)Si20 3], pyroxene (ABSi20 6), and olivine
[(Mg,Fe)2Si04]. Most Pt and Pd values are associated with Cu, Fe, and Ni sulfides.
The Pd-to-Pt ratio is about 3:1 (Czamanske and Bohlen)6.
NBM-6a - background from Stillwater intrusive (Czamanske and Bohlen)6.
Concentrations of the PGEs in the SRMs are summarized in the Table 7.
2 Amphibole - ferromagnesian silicate minerals having the general formulaA2r3Bs(Si,Al)80 22(0H )2 where A = Mg, Fe+2, Ca, or Na;B = Mg, Fe+\ Fe+3, or Al (Gaiy at el.)10.
5

28
Table 7. Concentration of platinum group elements in the standard reference
materials
mg/kg SARM7 SU-la NBM-5b NBM-6b NBM-6a
Pt 3.74 0.41 0.302 5.19 0.122
Pd 1.53 0.37 0.874 15.55 0.45
Au 0.31 0.15 1.074 0.37 0.012
Rli 0.24 0.08 0.21
Ru 0.43
I r 0.074
Os 0.063
After the microwave digestion method was optimized, it was used for digestion
of the following materials obtained from Mineral Deposits Division of the Geological
Survey of Canada. All the materials were from the Wellgreen Complex, Yukon,
except TDB-1 which is from Tremblay Lake, Saskatchewan and UMT-1 which is from
Giant Mascot, Hope British Columbia. Description of digested materials is given
below (Leaver)24:
WGB-1 - the mineralogy of this gabbro rock consists of plagioclase feldspar
[(Na,Ca)Al(Si,Al)Si20 8], pyroxene (ABSi20 8), chlorite [(Mg,Fe+2,Fe+3)6AlSi3O10(OH)8],

29
prehnite [Ca2Al2Si3O10(OH)2] and calcite (CaC03). Sulphide mineralization in the
sample is sparse and includes chalcopyrite (CuFeS2), pyrrhotite [(Fe,Ni)S], pentlandite
[(Fe,Ni)9Sg] and galena (PbS). Others minerals identified include titanite (CaTiSiOs),
ilmenite (FeTi03) and rutile (Ti02).
WMG-1 - this mineralized gabbro consists largely of pyroxene (ABSi20 6) with
prehnite [Ca2Al2Si3O10(OH)2], amphibole [A^BjCSi.Al^O^COHJJ, chlorite
[(Mg,Fe+2,Fe+3)6AlSi3O10(OH)8] and accessory magnetite (Fe30 4), ilmenite (FeTi03) and
titanite (CaTiSiOs). Mineralization consists chiefly of chalcopyrite (CuFeS2), pyrrhotite
[(Fe,Ni)S], pendlandite [(Fe,Ni)9S8), violarite (Ni2FeS4) and altaite (PbTe).
WMS-1 - this material is composed largely of sulfides rather than silicates. The
sulfides in this material are massive in form, intimately associated with one another
and composed of pyrrhotite [(Fe,Ni)S] with smaller quantities of pentlandite [(Fe,Ni)S],
chalcopyrite (CuFeSj), minor sphalerite (ZnS), and galena (PbS). The massive sulfides
contain inclusions of magnetite (Fe30 4) many of which are severely fractured and
veined with silicates. Other minerals identified include electrum (Au,Ag alloy) as an
inclusion in chalcopyrite (CuFeS2), and one inclusion of altaite (PbTe), as well as an
inclusion of antimonial temagamite (Hg,SbPd3Te3) in pyrrhotite [(Fe,Ni)S]. Silicates
form a much smaller portion of the material and include an iron aluminum silicate
[Al4(Si04)3], chlorite [(Mg,Fe+2,Fe+3)6AlSi3O10(OH)8], mica [(K,Na,Ca)(Mg,Fe,Li,Al)2.
3(Al,Si)4O10(OH,F)J and quartz (SiOj).
WPR-1 - this altered peridotite contains essentially antigorite [Mg3Si2Os(OH)4] with
small amounts of chlorite [(Mg,Fe+2,Fe+3)6AlSi3O10(OH,F)2] and accessory magnetite
30
(FejO,,) and chromite (FeCr20 4). The peridotite contains pyrrohotite [(Fe,Ni)S],
pentlandite [(Fe,Ni)9Sg] and chalcopyrite (CuFeS2) all either enclosed, penetrated or
intergrown with magnetite (Fe30 4). Violarite (Ni2FeS4) occurs as inclusions in the
pyrrhotite [(Fe,Ni)S], Tellurides were observed which have been tentatively identified
as PGE complexes.
TDB-1 - this diabase rock is composed of a siliceous matrix containing numerous
small masses, aggregates and discrete grains of titaniferous magnetite [Fe+2,Fe+3,Ti)20 4]
and ilmenite (FeTiOs) intimately associated with ferroan titanite (FeTiSiOs). Several
small grains of chalcopyrite (CuFeSj) and bomite (Cu5FeS4) are associated with the
oxide aggregates. Some of the bomite (Cu5FeS4) grains are partly replaced by a thin
layer of covelline (CuS). The siliceous matrix consists largely of plagioclase feldspar
[(Na,Ca)Al(Si,Al)Si2Og] and pyroxene (ABSi20 6) with minor amounts of mica
[(K,Na,Ca)(Mg,Fe,Li,Al)2,3(Al,Si)4O10(OH,F)2] and quartz (Si02).
UMT-1 - this sample of tailings is composed almost entirely of silicates, including
pyroxene (ABSi2Oe) and amphibole [ A ^B 5(Si, A l^O^OEOJ. Ore minerals comprise
a minor portion and include pentlandite [(Fe,Ni)9S8] and chalcopyrite (CuFeSj).
Minute amounts of magnetite (Fe30 4), ilmenite (FeTi03), geothite [FeO(OH)] and some
iron, magnesium, aluminum and manganese spinels.

31
Collection of Microwave Calibration Data
The microwave used in the study was a MDS-81A microwave oven equipped
with a pressure controller. Teflon lined microwave digestion vessels(CEM
Corporation, Matthews, NC) with 200 psi pressure capability were used for all
digestions. The pressure was controlled during digestion by a pressure transducer via
a pressure transmission line connected to a digestion vessel. Drawing of the digestion
vessel is given in the Appendix 1. Calibration of a laboratory unit depends on the type
of electronic system used by the manufacturer. Because digestion temperature is one
of the most important factors in microwave digestion, the functional relationship
between microwave power setting (% power) and actual watts delivered must be
known for digestion purposes. The microwave power setting (% power) is a control
on the microwave oven that can be set manually or by computer control. The oven
is calibrated by measuring the temperature rise in a known mass of water when
microwaved at a given % power setting for a known time. The actual watts delivered
can be calculated from this data. By repeating the measurement at different power
settings, a calibration curve can be constructed (Kingston and Jassie)2.
The microwave device was calibrated twice with a few days interval between
each calibration to account for a day-to-day variability in the calibration function.
Suitable microwave power settings are : 30 ,40 ,50 ,60 ,70 , 80, 89, 90,95, 96,97, 98,
99 and 100. An additional power setting of 0 was added to give a better estimate of
the intercept. Randomized triplicates are necessary to estimate repeatability, as well
as provide a basis for the statistical testing (Deming)25. Thus, each calibration

32
procedure requires a minimum of 45 experiments. A procedure for microwave
calibration is given in Appendix 1.
Results of Microwave Calibration
Three calibration data sets were collected for the microwave oven. The raw
data is listed in Appendix 1. Each data set was fit to a straight-line model (Y = B0 +
BjX) using matrix least squares analysis (Deming)25. The coefficients are listed in
Table 8a. The predicted powers for each calibration set at several specific % power
settings are listed in Table 8b. Each data set has a definite offset in the response curve
in the power setting range 90-99%. The response is linear over the range 0-89% and
also over the range 90-99%, but the two are not coincident. Data at 100% fall on the
calibration range 0-89%. For simplicity, only the calibration range 0-89% was used
in practice. The offset over the range 90-99% is inherent in the microwave electronics.
Statistically, the calibration lines (Table 8) for the data sets 1, 2, and 3 are equivalent
(Deming)25. Pooling the data from all three data sets provides a calibration line
(Figure 4) that includes day-to-day variability (Nowinski and Hillman)12.

Table 8. Results of Microwave Calibration
Table 8a.Calibration Line Equations(includes only the settings in the
range 0-89%)
Data Set B0 B1 95% C.I.
1 0.54 6.82 9
2 2.00 6.87 11
3 8.08 6.64 25
1-3 1.90 6.80 17
Calibration Model: Y = BO + BIX
The 95% C.I. is the maximum for the predicted power at given % power
setting
Table 8b. Predicted Power for Specific % Power Settings
PREDICTED POWER (WATTS)
% Power Setting CAL 1 CAL 2 CAL 3
40 273 277 274
60 410 414 406
80 546 552 539
90 614 620 614
95 648 655 639
100 683 689 672

o
o
— CDE
LLi l_CM
ozzL U>ocr:oLL h- CEL Uz
zoI—<dm
UJ i—z b-J o _ LUZ QTOCLt ^< O Si Li-03
10 C7)
_J
>- a q
aa a oo a o a aa aam i
Cs u v m D t)3M 0d a s a n s v s w
cn
CNo£c<D>Oco\CJc/iCDW)
<o&Io
IIJ3
U
iIS
35
Experimental Design for Microwave Method Optimization
Summary of method
30 mL of aqua regia was added to each of two digestion vessels containing
specified amount of the standard material to be digested. Five additional sets of two
digestion vessels containing other standard materials were prepared. Twelve loaded
and sealed digestion vessels were placed in the microwave oven and a randomly
chosen vessel was connected to the pressure monitor. The required power settings
were entered into the microwave oven memory and the vessels were microwaved. The
pressure within the microwave vessels and the microwave power were continuously
monitored in all tests. In some tests, the pressure monitor was used to control the
microwave power applied to the digestion vessel. After microwaving, the vessels were
opened and the contents diluted to 50 mL. The diluted digests were filtered through
a Whatmam No. 42 filter and stored in polyethylene containers. The sample extracts
were analyzed for PGE by ICP-AES and ICP-MS. To estimate digestion losses (vessel
venting, vapor loss, sample degassing, etc.), all vessels with acids and samples were
weighed before and after digestion. A difference in weight indicates venting during
digestion and possible loss of the analyte.
Method Optimization
The central composite design in three factors is ideally suited for the method
optimization of microwave methods (Deming and Morgan)19. Microwave digestion

36
methods have certain practical limitations. These practical limitations (boundary
limits) control the highest pressure and temperature that can be achieved during
microwave digestion given operating conditions and microwave digestion vessel
design. These practical limitations reduce the number of variables that need to be
manipulated for method optimization. Mapping of the microwave-assisted extraction
behavior was conducted for selected SRMs as a function of microwave power,
microwave power duration, and sample size. Since aqua regia (3:1 mixture of
concentrated HC1 and HN03) assures adequate leachibility of some analytes, a 30 mL
aliquot was used.
• Boundary limits
- highest pressure a microwave digestion vessel can withstand without venting
- longest practical digestion time
- highest dissolved solids which can be tolerated by instruments used for analysis
• Factors
- digestion times
- microwave power
NOTE: The amount o f microwave power and time applied will control temperature and
pressure in the microwave digestion vessel.
- mass of sample
37
• Responses
- Accuracy (% analyte recovery)
- Precision (relative percent difference)
- Sensitivity
- Pressure
- Temperature
The experimental design included 15 experiments varying the digestion times,
microwave power settings, and sample size. Tested microwave conditions are listed
in Table 9. Figure 5 is a graphic representation of the experimental design. All 15
experiments were completed. The pressure limit was lowered to 160 psi (originally
180 psi) because of the safety considerations. The results of these experiments were
used to optimize the conditions of the microwave digestion of PGE ore samples. As
a mean to process a large number of analytical results (1700) statistical computations
were used. A combination of results from ICP-AES analysis of the standard reference
materials (SRM) were expressed as a dimensionless quantity D, the overall desirability
coefficient (Deming and Morgan)20:
D=(Dj + Dj + D3 + ... +Dn)/n
The desirability coefficients of individual analytes D„ were determined by the
following criteria:
38
D,=l, when the analyte % recovery from individual SRM was greater than or equal 0
60%
D~0, when the analyte % recovery from individual SRM was less than or equal to
30%.
Dj, is equal to weighted fraction of 1 (assuming linearity), when the analyte %
recovery from an individual SRM is between 30% and 60%.
(Example: for 45% analyte recovery, D—0.5)
n= number of measurable analytes in the sample that are greater than two times
instrument detection limit (DDL).

ITJ

40
Table 9. Microwave test conditions
Power (W) + Time (min) Sample size (g)
Center 550W + 15’ 2.0
1 550W + 25’ 2.0
2 550W + 5’ 2.0
3 550W + 15’ 0.5
4 550W + 15’ 4.0
5 650W + 15’ 2.0
6 450W + 15’ 2.0
A 600W + 20’ 1.0
B 500W + 20’ 1.0
C 500W + 20’ 3.0
D 600W + 20’ 3.0
E 600W + 10’ 1.0
F 500W + 10’ 1.0
G 500W + 10’ 3.0
H 600W + 10’ 3.0

41
Results of Microwave Digestion Optimization Experiments
Initial investigation of 15 digestion experiments indicated the limitations of the
microwave method. Hot aqua regia used as a digestion solvent attacked the digestion
vessel cap. UltemR polyetherimide material from which caps were manufactured was
corroded by aqua regia vapors. Corroded caps could not withstand elevated digestion
pressures. The mechanical endurance of some caps was lowered below the threshold
pressure of the safety membrane. As a result, the vessels did not vent vapors to lower
the excess of pressure but exploded inside the microwave oven. During most of the
digestion optimization experiments, pressure was monitored for selected SRMs. Plots
of pressure vs. time for selected digestion conditions are presented in Figure 6. All
measured maximum pressures during digestion experiments are summarized in Table
10. Pressure was monitored only for two types of samples: SU-la (high sulfide
content) and NBM-5b (carbonaceous sample). For both these samples chemical
reaction was observed after addition of digestion solvent. As a safety precaution
maximum pressure during digestion was lowered to 160 psi (max 200 psi) and all caps
were carefully inspected for signs of corrosion before each digestion experiment. As
power output and duration times increase, venting may be a problem on some types
of samples that emit gases (carbonaceous or high organic samples). In fact, this
problem occurred during some digestions. As a practical limitation, a power output of
500-550 watts and duration time of 20 minutes is recommended. These digestion

42
Table 10. Summary of maximum pressures during microwave digestions
Sample (grams) Power+Time (W+min) Max. Pressure(psi) Time to reach
max pressure
NBM-5B (2.0)* 550W + 25’ 148 psi 25 min
SU-la (0.5) 550W + 15’ 114 psi 14 min
NBM-5B (4.0) 550W + 15’ 138 psi 15 min
NBM-5B (2.0)* 650W + 15’ 180 psi 12 min
SU-la (2.0) 450W + 15’ 94 psi 12 min
SU-la (1.0)* 600W + 20’ 180 psi 14 min
SU-la (3.0) 500W + 20’ 160 psi 12 min
SU-la (1.0) 600W + 10’ 107 psi 10 min
NBM-6A (3.0)* 500W + 10’ 130 psi 10 min
SU-la (2.0) 550W + 15’ 92 psi 12 min
* - vessel exploded or vented during digestion

C l S c O 3dnSS3dd
is

44
conditions should assure safe leachibility of PGE. Digestion losses (vapor loss, vessel
venting, etc.) in this power and time region rarely exceed 5% with the majority of the
digestion losses in the 1-2% range. To address matrix problems of some types of
samples i.e. carbonates, a predigestion step with 50 mL 1:1 nitric acid was introduced.
The predigestion step has several advantages:(l) it prevents generation of gases inside
the digestion vessel allowing an increase in pressure and times without compromising
safety; (2) it lowers or removes matrix interferences leaving PGE intact; (3) it
preserves acid mixture strength for digestion of samples.
ICP-AES Analysis Results and Discussion
The purpose of the first phase of this study was to determine the best operating
conditions for a microwave digestion of the platinum ore samples. A central
composite experimental design composed of 15 experiments using microwave vessel
pressure control was prepared to determine the optimum microwave method. All 15
experiments were performed. The digested solutions from the experiments were
analyzed for PGE and gold by ICP-AES. The results for each experiment were
evaluated for precision by comparing the %RSD for each element and SRM. The data
results for gold were not evaluated because of strong spectral interferences. Most of
the microwave digestions exhibited acceptable precision with the majority of the
analytes within 20% RPD. Exceptions were the experiments: 1 (550W+15’), F
(500W+10’), G (500W+10’), and H(600W+10’). Accuracy was evaluated by
determining the percent recovery of each analyte with respect to the certified analyte
45
concentration in the SRMs. The evaluated experiments were: Center(550W+15’);
4(550W+15’); and C(500W+20’). Complete data is presented in Appendix 2. For
these experiments the desirability coefficient was calculated. Data from the remaining
experiments were unpractical to use for a of variety of reasons: (1) excessive power
was delivered to the digestion vessel during experiments 5(650W+15’) and
D(600W+20’) causing explosions or venting the vessel contents; (2) during
experiments 2(550W+5’) and 6(450W+15’), the temperature inside the digestion vessel
did not rise high enough to assure accurate leaching of analytes (short time or low
power); (3) the sample size in experiments 3(0.5 g); B(1.0 g) and E (1.0 g) was too
small and it was difficult to estimate PGE values due to matrix interferences and
background noise during ICP-AES analysis; (4) analytical data for experiments
l(550W+25’), F(500W+10’), G(500W+10’), and H(600W+10’) showed poor precision.
Accuracy was unacceptable for all analytes. Despite applied interelement corrections,
the majority of analytes were either undetected or showed extremely high recoveries
(1000% or more). After examination of the emission spectra, complexity of the
interferences was evident (Winge at el.)29. It was impossible to mathematically correct
for spectral interferences and background contributions. All PGE have a number of
emission lines with analytical significance. Unfortunately none of them is distinctively
intensive and interference free; in reality, the opposite is true.
Matrix components of the selected digested samples were analyzed by a
simultaneous ICP-AES. Digested samples have a complex and difficult matrix causing
substantial spectral interferences at the wavelengths of interest. Spectral interferences

46
were calibrated during method performance evaluation and were applied for the
correction of the results from the optimization experiments: Center; 4; and C. Results
of digestion experiments and ICP-AES analysis determined the optimum digestion
conditions. From the first phase of the experimental study, it was apparent that the
microwave power output and microwave power duration time are governed by the
experimental design boundary limits and practicality of the preparative method. These
two digestion parameters were determined to give the best digestion conditions: 500-
550W output power and 20 minutes power duration time. Under these conditions
pressure inside a digestion vessel gradually reaches 160-180 psi (Figure 6) within 10-
12 minutes and is controlled at this level by the pressure controller. Temperature is
the most important factor during microwave digestions, although a temperature probe
was not available during this study, temperature inside the digestion vessel was
estimated from temperature-time curves (Gillman)11. A temperature-time curve is
presented in Figure 7. Estimated temperature for these microwave conditions was
about 180-200°C.
Accuracy data enabled use of desirability coefficients for evaluation of the
analytical results. Only palladium recovery for NBM-6b was in the 48-140% range.
To improve the performance of the analytical, method sample size was increased to
10 g; e.g., over 2.5 times more than in the original experimental design. Larger
sample size increased the sensitivity of the analytical method and reduced
heterogeneity effects in the ore samples. However, with the sample size increase
matrix interferences will rise proportionally. To address this problem, a predigestion
47
HEATING RATES FOR AQUA REGIA12 vessdl8C120 mLD pressure 100 psia160
150
140
130
120
110
100
90
80
70
60
50
40
30 0 2 4 6T errp e ra tu re C0C3
Figure 7. Heating rate for aqua regia.
step with 50 mL of 1:1 nitric acid was introduced. Ten grams of ore sample was
digested in an open beaker for 30 minutes at 95°C. The sample was filtered through
a fiber glass filter (Whatman GF/F) and the filtrate (predigest) was saved for analysis.
The fiber glass filter with the ore residue was digested with 30 mL of aqua regia at
500 watts for 20 minutes. ICP-AES analysis of the digestate and filtrate gave an
estimate of the matrix interferences removed during the predigestion step.
Effectiveness of the predigestion is presented in Table 11. The PGE data results are
summarized in Appendix 2. Predigestion step removed most of the interferences, with
an average of the 60-90% interfering elements removed (Figure 8). Recovery of Pt

48
and Pd from SARM-7 improved with the predigestion (Pt 79.5% and Pd 57.23%).
However, the rest of the data was unacceptable, despite increased sample size and
removal of interferences. To evaluate performance of the optimized microwave
digestion, ICP-MS analysis was necessary.
Table 11. Removal of interfering elements by predigestion
% SARM-7 NBM-5B NBM-6B SU -la
PRE. DIG. PRE. DIG. PRE. DIG. PRE. DIG.
Cr 74% 24% 0% 100% 82% 18% 89% 11%
Ni 97% 3% 85% 15% 94% 6% 81% 19%
Fe 80% 20% 68% 32% 90% 10% 91% 9%
Mn 91% 9% 100% 0% 91% 9% 89% 11%
V 90% 10% 63% 27% 84% 16% 85% 15%
Cu 95% 5% 98% 2% 93% 7% 98% 2%
Ti 68% 32% 0% 100% 45% 55% 85% 15%
ND - element not detected
Experimental results of the method optimization study determined microwave digestion
conditions. Table 12 summarizes the optimal conditions for digestion of platinum ore
samples. Microwave digestion method in the SOP format is presented below.

MASS
BALA
NCE
OF IN
TERF
EREN
CES
Pre
dIg
sst-
D1g
est
as-3-
% l N 3 D 3 d d
50
Table 12. The best estimated conditions for digestion of platinum ores
MICROWAVE POWER OUTPUT 500 WATTS
MICROWAVE POWER DURATION TIME 20 MINUTES
MAXIMUM PRESSURE 160 PSI
ESTIMATED TEMPERATURE 180-200°C
VOLUME OF DIGESTION SOLVENT 30 ML AQUA REGIA
Microwave digestion method for platinum ore samples
This method is designed for acid digestion of platinum ore samples prior to
spectroscopic analysis.
1. Place 10.0 g of platinum ore sample into 150 mL beaker.
2. Add 50 mL of 1:1 nitric acid and heat on the hot plate for 30 minutes
at 95°C (near boiling point).
3. After cooling, filter samples through a Whatman GF/F fiber glass filter
(or equivalent) into 100 mL volumetric flask. Bring filtrate to volume
and save for analysis.
4. Place the filter with the ore residue into a lined microwave digestion
vessel. Add 30 mL of aqua regia (3:1 mixture of concentrated HC1 and

HN03) into the vessel. Cap the vessel and check safety membrane.
Weigh vessel with its content and note the weight.
Repeat step 4 until microwave carousel contains 12 vessels. When
fewer than 12 samples are digested additional vessels should be filled
with 30 mL of aqua regia to achieve fill the carousel. (Note! It is
very important that microwave carousel contained 12 vessels because
delivered power is calculated for full compliment of vessels.)
Place carousel with 12 vessels in the calibrated microwave oven.
Program power at 500 watts for 20 minutes. After digestion leave the
vessels in the oven for 15 minutes to cool.
After cooling weight the vessels. Weight difference allows to estimate
digestion losses.
Carefully vent the vessel contents by releasing a vent stem (preferably
in the fume hood).
Filter sample extracts through a Whatman GF/F fiber glass filter (or
equivalent) into clean polyethylene bottles.
The sample extracts are ready for analysis by AA, ICP-AES or ICP-

52
CHAPTER 4
ANALYSIS BY ICP-MS
Experimental
ICP-MS instrumentation: An ELAN model 5000 (SCIEX, Thornhill, Ontario,
Canada, now being sold by Perkin-Elmer) instrument equipped with an ultrasonic
nebulizer was employed for all ICP-MS analyses. Instrument operating conditions are
presented in Table 13. ICP-MS is a relatively new method technique and ideal for the
analysis of the geological materials. The main advantages of the ICP-MS are: multi
element capability, excellent sensitivity and speed. The ICP-MS spectra are simple
compared to ICP-AES and interpretation of the results is much easier. Selected SRMs
were digested by the optimized digestion procedure and analyzed by ICP-MS and ICP-
AES.
Table 13. ICP-MS operating conditions
Plasma Argon Flow Rate 15.0 L/min
Nebulizer Argon Flow Rate 0.9 L/min
Auxiliary Argon Flow Rate 0.8 L/min
Channel Electron Multiplier Voltage -3.5 kV
Running Vacuum Pressure 1 x 10'5 Thor
Base Vacuum Pressure 5 x 10'7 Thor
Detector Voltage 1.0 kV

53
Sample extracts resulting from digestion of the materials obtained from
CANMET, as well as the SRMs used in the optimization study, were analyzed by ICP-
MS. Sample extracts were diluted 1:2000 prior to ICP-MS analysis. External
calibration in the 0-3 ug/L range was used. The standard had the same acid
concentration as samples. Calibration graphs are shown in Appendix 3. Preliminary
"screening" of diluted digests allowed an estimates of concentrations of the analytes
in the sample extracts. Severe memory effects are reported for Os and Au (Jackson
at el)30. As Os rarely occurs in high concentrations in geological samples, the main
source of memory is from calibration solutions (Longerich at el.)31. To prevent this
problem 70 seconds flushing times between samples was employed. Prior to ICP-MS
analysis sample extracts were diluted, the dilution factor was adjusted individually for
each SRM so measured concentration fall in the mid range of the calibration. Mass
selection and potential interferences are listed in Table 14 (Longerich at el.)31. Matrix
interferences were not corrected.

54
Table 14. Analytical ions used during ICP-MS analysis (potential interferences
are also shown)
Determined ion Isotopic abundance (%) Potential interferences
"Ru+ 12.63 83BiO+
103Rh+ 100.0 63Cu40Ar+ 87SrO+
10SPd+ 22.2 65Cu40Ar+ 89YO+
O00
16.1 173YbO+
193Ir+ 62.6 177HfO+
i9Spt+ 33.8 179HfO+
197Au+ 100.0 181TaO+
ICP-MS Analysis Results and Discussion
The data results from digestion of SRM were evaluated for precision and
accuracy. These data are summarized in Appendix 3. Precision was evaluated by
comparing the %RSD for each analyte and SRM. All PGE had excellent precision
with all analytes falling within a 20% window (majority RPD<5%). Precision for gold
in SU-la was slightly higher (32.86% RPD), may be caused by "memory effects".
Accuracy was evaluated as % recovery of each analyte with respect to certified
concentration of the analyte in the SRM. The improvement of data in comparison to
ICP-AES was dramatic. All analytes recoveries, except Au, were in the 20-150%

55
range. High recoveries of gold appear to have been due to memory interference
(Jackson at el.)30. Ruthenium was undetected in all ICP-MS analyses. The low
recovery may reflect limitations in the digestion method; e.g., the chemical resistance
of Ru may prevent its dissolution (Lide)3. Platinum and palladium recoveries for
SARM-7 (Pt 30%, Pd 60%); SU-la (Pt 20%, Pd 70%); and NBM-5b (Pt 36%)
suggested the possibility of analyte losses during the predigestion step. Although the
native PGE do not dissolve in nitric acid, some PGE compounds are known to be
soluble in HN03 (Lide)3. Fortunately the predigestion solutions were saved and could
be analyzed by ICP-MS to get a material balance on these metals. Analysis results
showed high concentrations of PGE in the predigest solutions. Distribution of PGE
between the predigest and digestate is presented in Table 15. Total % recoveries of
PGE were calculated by summation of concentrations of PGE in solutions resulting
from predigestion and microwave digestion (Figures 9-11). Total % recovery and
desirability coefficients for the optimized digestion method were compared to ICP-AES
results. A summary of these data is presented in Tables 16 and 17.

Table 15. Summary of PGE recoveries
SARM7
mg/kg (ppm) Certified Analysis Predigest Digest
Ir 0.074 0.0625 0.0295 0.033
Pt 3.74 2.11 4 1.259
Os 0.063 0 0
Rh 0.24 0.233 0.028
Ru 0.43 0.2775 0.001
Pd 1.53 0.987 739.88 0.936
SU-la
mg/kg (ppm) Certified Analysis Predigest Digest
Au 0.15 0.289 0 0.289
Pt 0.41 0.121 0.034 0.087
Rh 0.08 0.0645 0.0295 0.035
Pd 0.37 0.335 0.067 0.268
NBM-6b
mg/kg (ppm) Certified Analysis Predigestion Digestion
Pt 5.91 4.445 0.271 4.174
Pd 15.55 15.93 5.25 10.68
Rh 0.21 0.215 0.056 0.159
Au 0.37 2.96 1.284 1.676

57
MASS BALANCE OF PGEO le tlb u tlo n o f a n a ly te s
110
100
90
eo
70
60
SO
30
SO10
ANALYTES CPGE + AlO PREDIGEST ESS3 DIGEST
Figure 9. NBM-6b. Distribution of PGE.
SU-1a PGE DISTRIBUTIONPREOIGESTION- DIGESTION
21 0200190160170160150110130120
110100
90GO706Q5040302010
Pd
ANALYTES PGE ♦ AUPREDIGEST DIGEST
Figure 10. SU-la. Distribution of PGE

58
MASS BALANCE OF PGE150
110
130
120
110
100
90
80
* 60
50 1030
2 0
10
01 2 3 1 5 6 7
A N ALYTES C P G E + A tO
g g g a P R E D IG E S T IO N E 5 5 5 3 D IG E S T IO N
D is tr ib u tio n o f a n a ly te s
Figure 11. SARM7. Distribution of PGE

59
Table 16. Summary of % recovery for ICP-AES and ICP-MS analyses
ICP-AES RESULTS
SARM-7 SARM-7D NBM-5B NBM-5BD NBM-6B NBM-6BD SU-la SU-laD
It 0 0 0
Pt 0 0 4493.59 4454.96 0 0 0 0
Os 12564.14 11214.93 0
Rh 2329.08 1919.36 0 0 0 0
Ru 0 0 0
Pd 528.27 342.0 739.88 829.51 48.78 97.44 11310.7 795.9
ICP-AES RESULTS WITH PREDIGESTION
SARM-7 SARM-7D NBM-5B NBM-5BD NBM-6B NBM-6BD SU-la SU-laD
Ir 0 0
Pt 166.47 79.59 4151.04 35.19 0 3332.32 0
Os 678.17 801.98
Rh 0 0 0 0 0 0
Ru 341.79 0
Pd 32.9 57.23 670.38 38.46 38.46 291.1 0
ICP-MS RESULTS WITH PREDIGESTION
SARM-7 SARM-7D NBM-5B NBM-5BD NBM-6B NBM-6BD SU-la SU-laD
Ir 84.48 82.32
Pt 56.43 54.96 34.56 85.83 89.31 29.59 24.73
Os 0 14.71
Rh 97.51 95.25 102.67 102.1 80.64 78.65
Ru 29.15 29.26
Pd 64.53 63.91 83.21 102.46 97.75 90.56 86.36
Au 129.95 129.27 144.59 798.29 669.86 192.66 138.28
0 - analyte was not recovered

60
Table 17. Summary of desirability coefficients for ICP-AES and ICP-MS analyses
ICP-AES RESULTS D=0.0832
SARM-7 SARM-7D NBM-5B NBM-5BD NBM-6B NBM-6BD SU-la SU-laD
Ir 0 0 0
Pt 0 0 0 0 0 0 0 0
Os 0 0 0
Rh 0 0 0 0 0 0
Ru 0 0 0
Pd 0 0 0 0 1 1 0 0
TOTAL 0 0 0 0 0.333 0.333 0 0
ICP-AES RESULTS WITH PREDIGESTION D=0.0905
SARM-7 SARM-7D NBM-5B NBM-5BD NBM-6B NBM-6BD SU-la SU-laD
Ir 0 0
Pt 0 1 0 0.173 0 0 0
Os 0 0
Rh 0 0 0 0 0 0
Ru 0 0
Pd 0.097 0.908 0 0.447 0.282 0 0
TOTAL 0.016 0.318 0 0.206 0.094 0 0
ICP-MS RESULTS WITH PREDIGESTION D=0.743
SARM-7 SARM-7D NBM-5B NBM-5BD NBM-6B NBM-6BD SU-la SU-laD
Ir 1 1
Pt 0.88 0.832 0.152 1 1 0 0
Os 0 0
Rh 1 1 1 1 1 1
Ru 0 0
Pd 1 1 1 1 1 1
TOTAL 0.646 0.647 0.576 1 1 0.666 0.666

61
Comparison of % recoveries for a combination of microwave digestion and
ICP-AES and ICP-MS analyses showed clearly the superiority of the ICP-MS. Since
the same digestion method was used, this indicates an impressive improvement in the
sensitivity by changing analytical techniques. The predigestion step did not improved
significantly a performance of the ICP-AES. Performance of the ICP-MS suggests that
the predigestion step could be eliminated and sample size decreased. This procedural
change would simplify even further the microwave method. The proposed simplified
microwave digestion method is presented below.
Microwave digestion method for platinum ore samples
This method is designed for acid digestion of platinum ore samples prior to ICP-MS
analysis. Because of decreased sample size, sample inhomogenity may effect the
analysis results.
1. Weigh 1.00 g of platinum ore sample into microwave digestion vessel.
Add 30 mL of aqua regia (3:1 mixture of concentrated HC1 and HN03)
into the vessel.
2. Repeat step 1 until microwave carousel contains 12 vessels. When
fewer than 12 samples is digested additional vessel should be filled with
30 mL of aqua regia to achieve full compliment of vessels. Note!
It is very important that microwave carousel contained 12 vessels
because delivered power is calculated for full compliment of vessels.

62
3. Place carousel with 12 open vessels in the calibrated microwave oven.
Program power at 100 watts for 10 minutes. Turn on microwave oven
fan at maximum speed. Wait for the reaction of gaseous samples to
subside.
4. Open the microwave oven and carefully remove microwave carousel.
Cap the vessels and check safety membrane. Weigh the vessels and
record the weight.
5. Place microwave carousel inside microwave oven. Set power at 500 W
for 20 minutes. After digestion leave vessels inside microwave for 15
minutes to cool.
6. After cooling weight the vessels. Weight difference allows to estimate
digestion losses.
7. Carefully vent the vessel contents by releasing a vent stem (preferably in
the fume hood).
9. Filter sample extracts through a Whatman GF/F fiber glass filter (or
equivalent) into clean polyethylene bottles.
10. The sample extracts are ready for analysis by ICP-MS.

63
Cyanide Leach Method
In addition to the aqua regia digestion procedure, a cyanide leach method was
investigated. Three SRM with 10% KCN solution in an attempt to extract the PGE.
The potassium cyanide was prepared in 1% NaOH. Microwave oven conditions were
identical to those used for aqua regia digestion (500 watts and 20 minutes). The
experimental procedure is described below:
Microwave cyanide leach for platinum ore samples
1. Weigh 10.0 g of platinum ore directly in a digestion vessel liner.
2. Place the liner with the sample in the digestion vessel body and slowly
add 50 mL 10% KCN solution in 1% NaOH. Note! Exercise extreme
caution when working with the cyanide.
3. Assembly the vessel following manufacturer’s instructions. Weigh the
assembled vessel and record the weight.
4. Repeat steps 1 and 2 until turntable contains 12 vessel.
5. Place turntable inside microwave oven. Set power at 500 W for 20
minutes. After digestion leave vessels inside microwave for 15
minutes to cool.
6. After cooling weight the vessels. Weight difference allows to estimate
digestion losses.
7. Carefully vent the vessel contents by releasing a vent stem (preferably in

64
the fume hood).
9. Filter sample extracts through a Whatman GF/F fiber glass filter (or
equivalent) into clean polyethylene bottles.
10. The sample extracts are ready for analysis by ICP-MS.
ICP-MS analyses showed recoveries of Ir, Pd, Rh, and Ru similar to aqua regia
digestion for all of the SRMs. In contrast, recoveries of Pt were significantly lower
(<30%). Au recoveries were greater than 100% (150-700%), probably, due to
"memory effects". Due to the time constrains, the cause of this anomaly was not
investigated. Data comparing the two microwave digestion-analysis procedures (aqua
regia ICP-MS and cyanide ICP-MS) are summarized in Table 18. The results in the
form of bar graphs are presented in Figures 12-16.
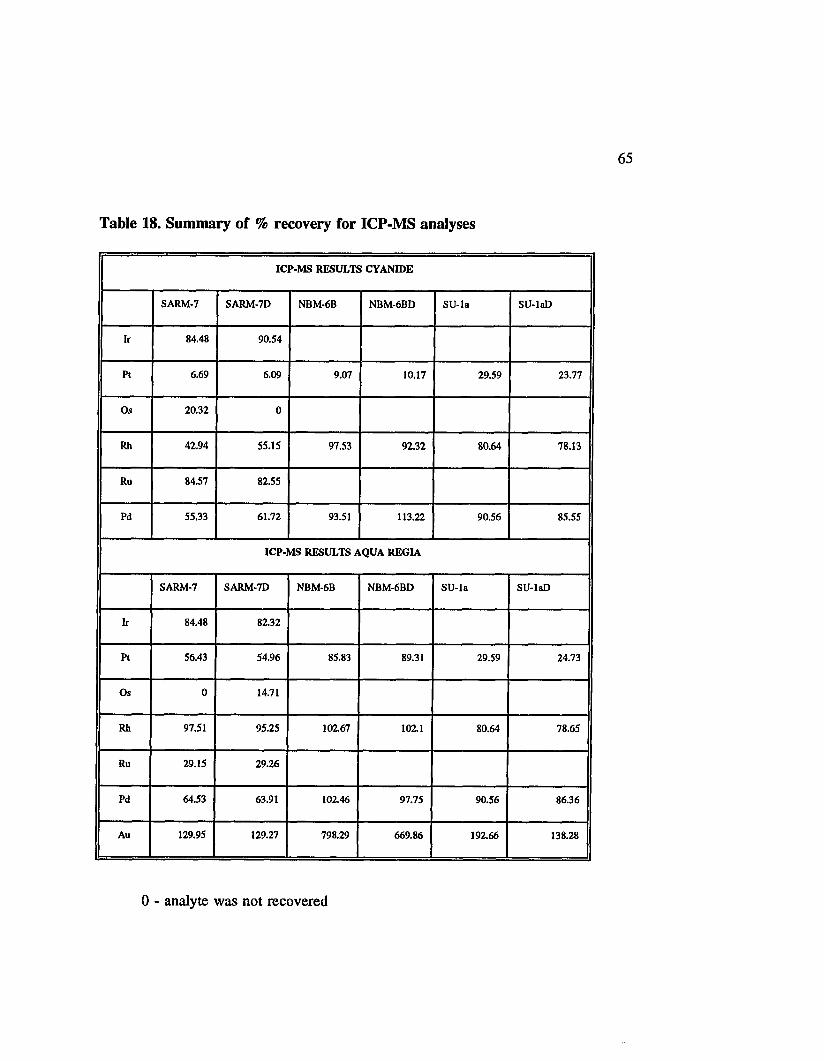
Table 18. Summary of % recovery for ICP-MS analyses
ICP-MS RESULTS CYANIDE
SARM-7 SARM-7D NBM-6B NBM-6BD SU-la SU-laD
Ir 84.48 90.54
Pt 6.69 6.09 9.07 10.17 29.59 23.77
Os 20.32 0
Rh 42.94 55.15 97.53 92.32 80.64 78.13
Ru 84.57 82.55
Pd 55.33 61.72 93.51 113.22 90.56 85.55
ICP-MS RESULTS AQUA REGIA
SARM-7 SARM-7D NBM-6B NBM-6BD SU-la SU-laD
Ir 84.48 82.32
Pt 56.43 54.96 85.83 89.31 29.59 24.73
Os 0 14.71
Rh 97.51 95.25 102.67 102.1 80.64 78.65
Ru 29.15 29.26
Pd 64.53 63.91 102.46 97.75 90.56 86.36
Au 129.95 129.27 798.29 669.86 192.66 138.28
0 - analyte was not recovered

6 6
SU- 1a
§! * u
Cooperlefon o f d fo a s tto n a3 .5 Pt
3
2 .5
2
1.5
1
0 .5Pd
Rh0ANALYTES CPGE + Au)
ICP-AES * PREDIG E3551 ICP-MS AQUA REGIA VZZft ICP-MS CYAN IOE
i'igure 12. SU-la. Comparison of ICP-AES and ICP-MS
SU-1a ICP-MSAqua r e a la - CyanIda
260
220
.Ali.2 0 0
160
140
120
100 ■Pd-
60
60
40
20
01 2 3 4
ANALYTES CPGE + Au}M AQUA REGIA ES5S CYANIDE
Figure 13. SU-la. Comparison of aqua regia and cyanide
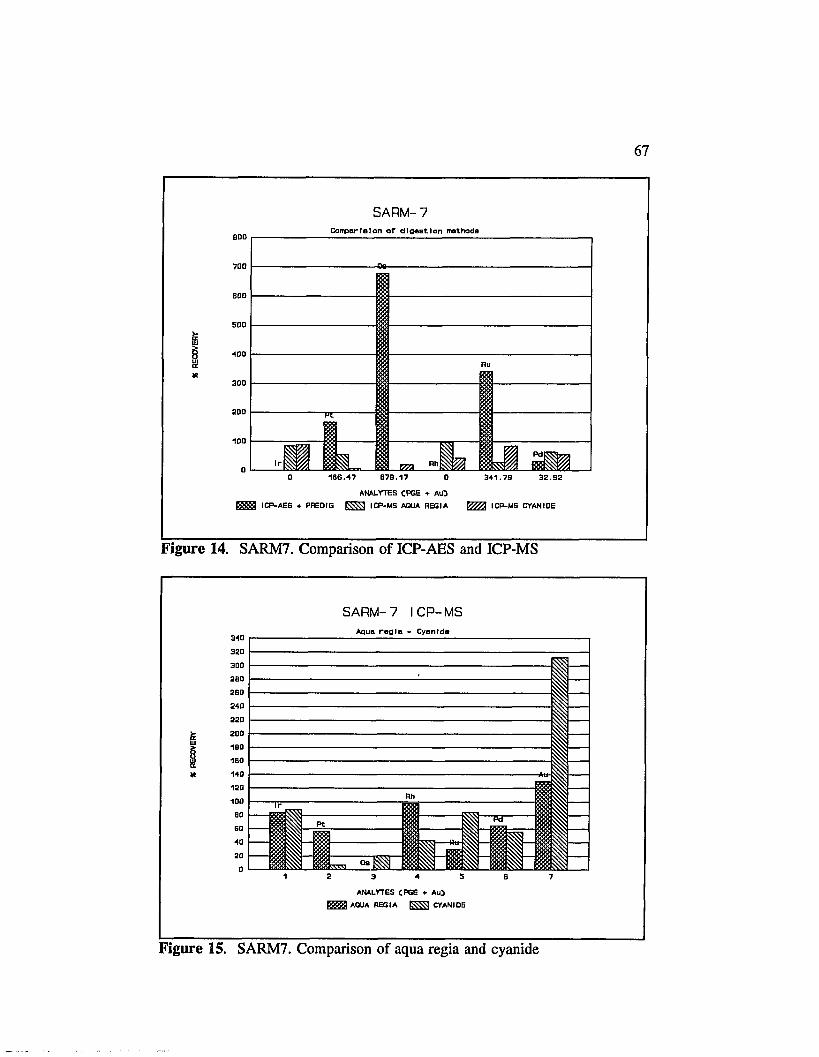
67
SARM-7Corrparlelon o f d ig e s t io n mothode
BOO
-Oo-700
60 0
500
Ru
300
20 0
100
Pd;Rh
0 166.47 678.17 0 341.79 32.92
ANALYTES CPGE + AtO Bgggl ICP-AES . PREOIG E SS ICP-MS AQUA REGIA V7Z7X ICP-MS CYANIDE
Figure 14. SARM7. Comparison of ICP-AES and ICP-MS
SARM-7 ICP-MSAqua r e g ia - Cyanide
320300260260240220200
160160140 -At*120
Rh100
60Pt60
20 08
ANALYTES CPGE ♦ AlO AQUA REGIA ISS33 CYANIDE
Figure 15. SARM7. Comparison of aqua regia and cyanide
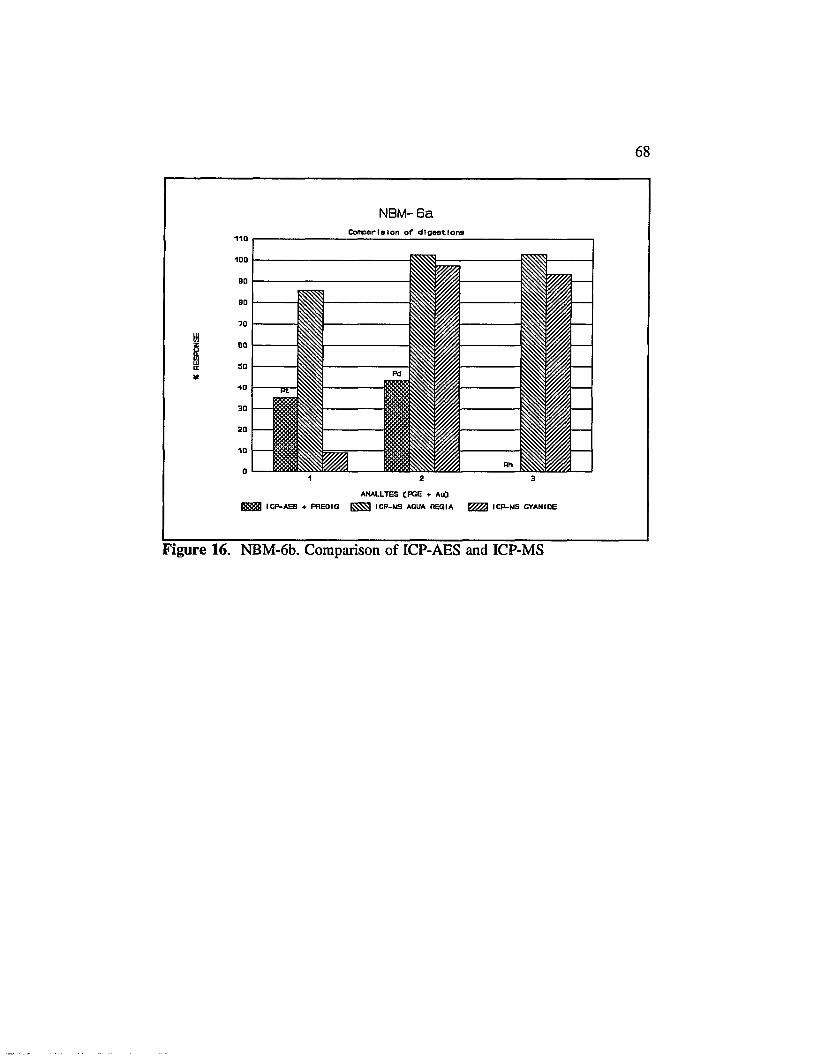
6 8
NBM-BaComporlslon o f d ig e s t io n s110 p--------------------------------------------------------------------------------
ANALLTES CPGE ♦ AlO S S S ICP-AES * PREOIG ES5S] ICP-MS AQUA REGIA VZZA ICP-MS CVANIDE
i'igure 16. NBM-6b. Comparison of ICP-AES and ICP-MS
69
CHAPTER 5
CONCLUSIONS
At the present time, none of the spectroscopic methods (AA, ICP-AES, and
ICP-MS) is universal for the analysis of all kinds of matrices and analytes. The data
presented demonstrate that the combination of microwave digestion and ICP-MS
analysis has great potential for the simultaneous determination of the PGE in
geological samples. Microwave digestion offers several advantages over conventional
methods, such as faster reaction rates, decrease in contamination, and reproducibility
of digestion conditions. The main advantages of microwave digestion are its speed
and simplicity. The central composite design strategy used for microwave method
optimization proved to be a very useful statistical tool. Despite problems with the
ICP-AES analysis, parameters of microwave digestion were established. The accurate
calibration of the microwave digestion oven before optimization experiments is very
important for the determination of the best practical digestion conditions. Temperature
is the most important parameter to control during microwave digestions. Temperature
measuring device (probe) would expedite the method optimization process. A number
of manipulated factors would be reduced. Programming the microwave devices in
terms of temperature and pressure instead of power output and time gives better
control of digestion conditions. Moreover, the microwave digestion procedure

70
developed in this study can be successfully applied to the digestion of platinum ores.
Application of ICP-AES analysis for the determination of PGE in sample extracts
proved to be unsuccessful. Spectral interferences from sample matrix are virtually
impossible to eliminate when the PGE concentrations are at the ppb or sub ppb levels.
On the other hand, results of the ICP-MS analysis after aqua regia microwave
digestion were very encouraging. Most of the PGE can be successfully determinated
with this technique in range of the complex matrices used in this research. However,
there are differences in PGE recoveries from different matrices. Application of
different digestion solvents may lower matrix effects. A cyanide leach tested in this
study improved the recoveries of Ir, Rh, and Ru.
Speed and high sample throughput of microwaves techniques combined with
the speed and multielement capabilities of ICP-MS allows for rapid analysis of large
number of samples. This capability can be enhanced with an automation of the
microwave digestion (Hillman and Nowinski)32.
However, the results of this research suggest that a further evaluation of the
ICP-MS method be performed. The use of extraction procedures other than aqua regia
and cyanide should be investigated and the abnormally high gold recoveries must be
explained and corrected.

APPENDIX 1
MICROWAVE DIGESTION

MICROWAVE CALIBRATION PROCEDURE
72
Procedure
Weigh 1000.00 g of deionized water in the volumetric flask calibrated to deliver.
Mark the level of water on the flask (it can be different than that marked by the
manufacturer). This should assure delivery of lOOOg ± 2g of water.
Important!!! Prior to calibration run the microwave device at 100% power for 5
minutes to warm-up the electronics. Use 2 or 3 liters of water as a heat sink.
Measure the power of % power settings of 0, 30, 40, 50, 60, 70, 80, 89, 90, 95, 96,
97, 98 and 100. Perform each measurement in triplicate. Randomize order of
measurements. A complete set of measurements will take about 4 hours. Repeat the
measurement on two days.
Use the following procedure to collect each calibration data point:
1. Pour 1000 ± 2g of water measured in the volumetric flask into microwave
transparent vessel.
2. Record the initial temperature of the water (must be 24 ± 2°C measured
accurately to 0.1 °C).
3. Place vessel into the microwave, and start carousel rotation.
4. Set the time to 120 seconds and the power to the desired power setting (%
power).
5. Irradiate vessel at the prescribed settings.
6. Promptly remove the vessel, add a stir bar and temperature measurement

73
device, place on magnetic stirrer and thermally equilibrate the water. Record
maximum temperature within 30s, accurately to 0.1 °C.
Safety Note! Do not irradiate with stir bar in vessel. This can cause electrical arcing.
Calculations
The absorbed power is determined by the following relationship:
p _ (k • Cp • M • AT) t
P=the apparent power absorbed by the sample in watts (W)
K=the conversion factor for thermochemical calories/sec to watts = 4.184
Cp=the heat capacity of water (cal • g 1 • C'1)
M=mass of the water sample in grams (g)
AT =the final temperature minus the initial temperature (°C)
t=the time in seconds (s)
Using 2 minutes and lOOOg of distilled water, the calibration equation simplifies to:
P = LT • 34.87

Lined Digestion Vessel Components
Vent Stem
-Cover
Cover/Vent Stem Assembly
Vessel Body

Lined Digestion Vessel Assembly
Exhaust Port Rupture M em brane
Cover
V essel Body

APPENDIX 2
ICP-AES DATA RESULTS

77
ICP-AES analysis data results. Precision and Accuracy data.
BATCH #4 (550W 15’ 4.0g)
NBM-6A ug/L CORRECTED mg/kg %R RPD
Ir ND ND ND - -
Pt ND ND ND - -
Os 536 530 6.63 - 4.02
Rh 292 153 1.92 - 7.89
Ru 2013 539 6.73 - 10.68
Pd ND ND ND - -
NBM-6AD ug/L CORRECTED mg/kg %R
Ir ND ND ND -
Pt ND ND ND -
Os 558 552 6.90 -
Rh 316 177 2.22 -
Ru 1809 335 4.18 -
Pd ND ND ND -
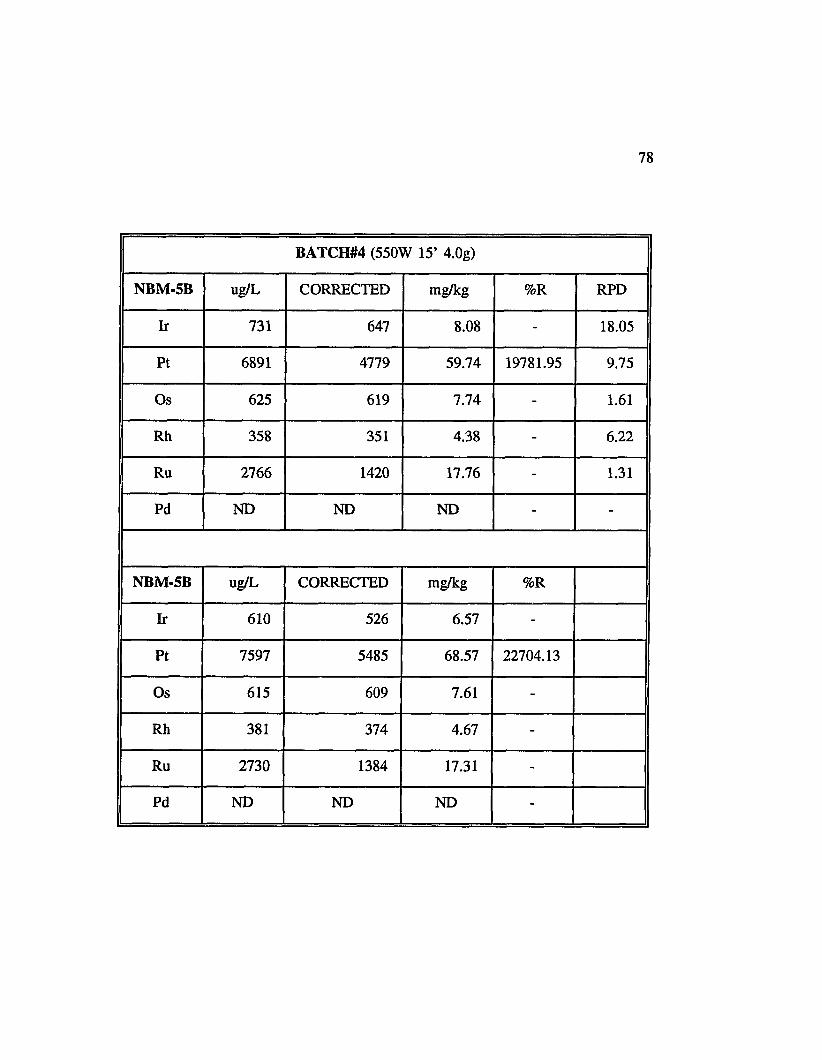
78
BATCH#4 (550W 15’ 4.0g)
NBM-5B ug/L CORRECTED mg/kg %R RPD
Ir 731 647 8.08 - 18.05
Pt 6891 4779 59.74 19781.95 9.75
Os 625 619 7.74 - 1.61
Rh 358 351 4.38 - 6.22
Ru 2766 1420 17.76 - 1.31
Pd ND ND ND - -
NBM-5B ug/L CORRECTED rag/kg %R
Ir 610 526 6.57 -
Pt 7597 5485 68.57 22704.13
Os 615 609 7.61 -
Rh 381 374 4.67 -
Ru 2730 1384 17.31 -
Pd ND ND ND -

79
BATCH #4 (550W 15’ 4.0g)
NBM-6B ug/L CORRECTED mg/kg %R RPD
Ir 444 ND ND - 5.48
Pt ND ND ND - -
Os 725 712 8.90 - 0.41
Rh ND ND ND - -
Ru 3859 910 11.38 - 5.21
Pd 883 876 10.96 70.46 4.32
NBM-6BD ug/L CORRECTED mg/kg %R
Ir 469 ND ND -
Pt ND ND ND -
Os 728 715 8.94 -
Rh ND ND ND -
Ru 3663 714 8.93 -
Pd 922 915 11.44 73.59

80
BATCH #4 (550W 15’ 4.0g)
SARM-7 ug/L CORRECTED rag/kg %R RPD
Ir 556 368 4.60 6211.04 27.20
Pt 491 ND ND - 40.98
Os 551 536 6.70 10639.54 -
Rh 471 289 3.61 1504.43 200.00
Ru 1933 646 8.07 1877.35 6.22
Pd ND ND ND - -
SARM-7D ug/L CORRECTED mg/kg %R
Ir 731 543 6.78 9167.13
Pt 324 ND ND -
Os 556 541 6.77 10738.74
Rh ND ND ND -
Ru 2057 770 9.62 2237.82
Pd ND ND ND -

81
BATCH #4 (550W 15’ 4.0g)
SU -la ug/L CORRECTED mg/kg %R RPD
Ir 1171 132 1.65 - 30.11
Pt 15076 12775 159.68 38946.91 1.59
Os 2244 2237 27.96 - 7.39
Rh 431 ND ND - 14.82
Ru 19361 17887 223.58 60427.68 9.15
Pd ND ND ND - -
SU -la ug/L CORRECTED mg/kg %R
Ir 1586 547 6.84 -
Pt 15317 13016 162.69 39681.66
Os 2084 2077 25.96 -
Rh 500 ND ND -
Ru 17667 16193 202.41 54704.71
Pd ND ND ND -
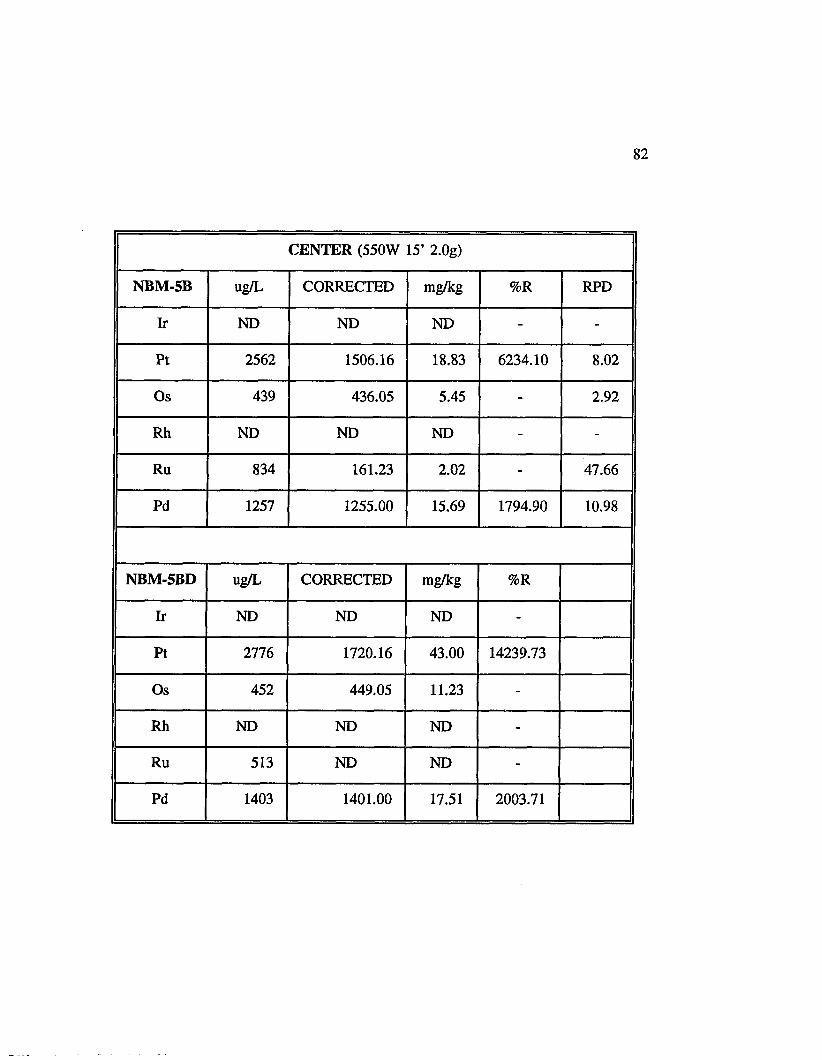
8 2
CENTER (550W 15’ 2.0g)
NBM-5B ug/L CORRECTED mg/kg %R RPD
Ir ND ND ND - -
Pt 2562 1506.16 18.83 6234.10 8.02
Os 439 436.05 5.45 - 2.92
Rh ND ND ND - -
Ru 834 161.23 2.02 - 47.66
Pd 1257 1255.00 15.69 1794.90 10.98
NBM-5BD ug/L CORRECTED mg/kg %R
Ir ND ND ND -
Pt 2776 1720.16 43.00 14239.73
Os 452 449.05 11.23 -
Rh ND ND ND -
Ru 513 ND ND -
Pd 1403 1401.00 17.51 2003.71

83
CENTER (550W 15’ 2.0g)
SU -la ug/L CORRECTED rag/kg %R RPD
Ir 971 451.44 5.64 - 21.82
Pt 8093 6942.29 86.78 21165.53 0.84
Os 1281 1277.44 15.97 - 0.31
Rh 992 444.49 5.56 - 0.20
Ru 3551 2813.80 35.17 9506.07 7.06
Pd 7502 7499.44 93.74 - 5.13
SU-laD ug/L CORRECTED mg/kg %R
Ir 780 260.44 6.51 -
Pt 8161 7010.29 175.26 42745.69
Os 1285 1281.44 32.04 -
Rh 994 446.49 11.16 -
Ru 3811 3073.80 76.84 20768.90
Pd 7127 7124.44 178.11 -

84
CENTER (550W 15’ 2.0g)
NBM-6A ug/L CORRECTED mg/kg %R RPD
Ir ND ND ND - -
Pt 352 ND ND - 1326.40
Os 397 394.10 ND - 1.00
Rh ND ND ND - -
Ru 827 89.82 1.12 - 49.85
Pd 965 964.26 12.05 2678.51 10.58
NBM-6AD ug/L CORRECTED mg/kg %R
Ir ND ND ND -
Pt -477 ND ND 0.00
Os 401 398.10 9.95 -
Rh ND ND ND -
Ru 497 ND ND -
Pd . 868 867.26 10.84 2409.06

85
CENTER (550W 15’ 2.0g)
NBM-6B ug/L CORRECTED mg/kg %R RPD
Ir 780 187.66 2.35 0.00 77.33
Pt 335 ND ND 0.00 99.25
Os 494 487.66 6.10 0.00 1.01
Rh ND ND ND 0.00 0.00
Ru 711 ND ND 0.00 65.28
Pd 794 1790.74 22.38 143.95 0.11
NBM-6B ug/L CORRECTED mg/kg %R
Ir 345 ND ND -
Pt 995 ND ND -
Os 499 ND ND -
Rh ND ND ND -
Ru 1400 ND ND -
Pd 1796 1792.74 44.82 288.22
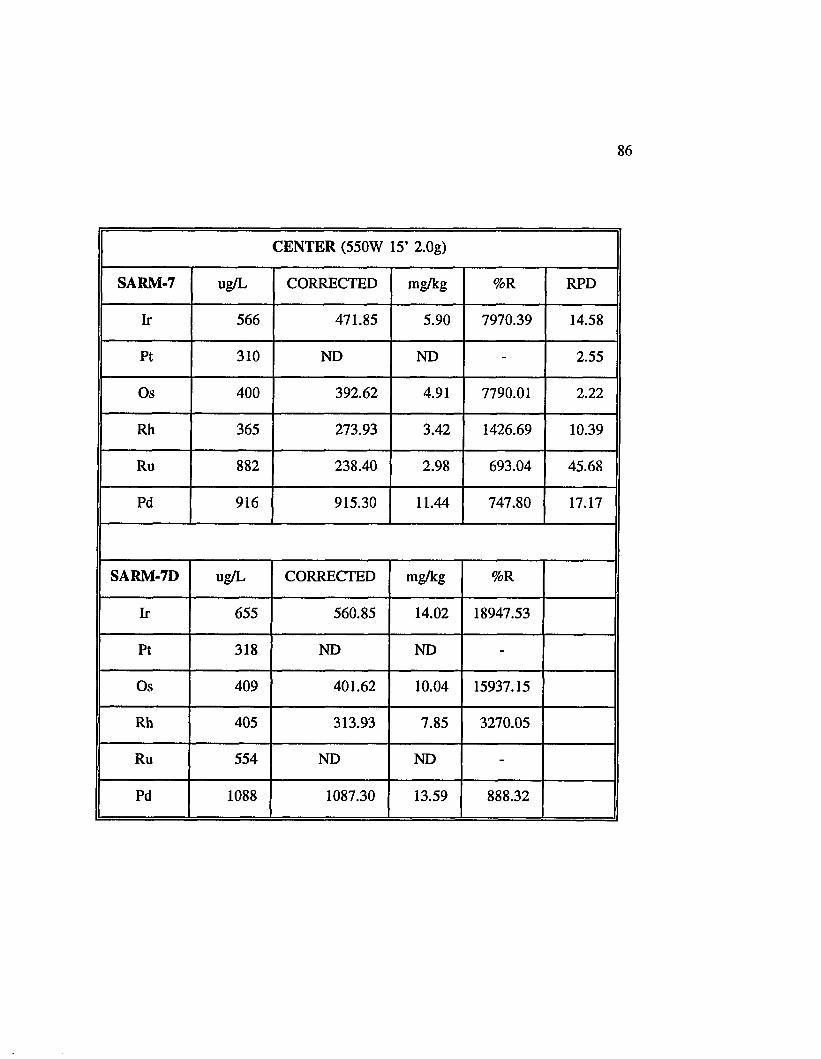
8 6
CENTER (550W 15’ 2.0g)
S ARM-7 ug/L CORRECTED mg/kg %R RPD
Ir 566 471.85 5.90 7970.39 14.58
Pt 310 ND ND - 2.55
Os 400 392.62 4.91 7790.01 2.22
Rh 365 273.93 3.42 1426.69 10.39
Ru 882 238.40 2.98 693.04 45.68
Pd 916 915.30 11.44 747.80 17.17
SARM-7D ug/L CORRECTED mg/kg %R
Ir 655 560.85 14.02 18947.53
Pt 318 ND ND -
Os 409 401.62 10.04 15937.15
Rh 405 313.93 7.85 3270.05
Ru 554 ND ND -
Pd 1088 1087.30 13.59 888.32

87
Batch #C (500W 3.0g 20min)
NBM-5B ug/L CORRECTED mg/kg %R RPD
Ir 341 278 4.628 - -
Pt 2398 814 13.571 4493.59 0.29
Os 509 505 8.410 - 0.98
Rh ND ND ND - -
Ru 433 ND ND - 57.33
Pd 391 388 6.467 739.88 11.34
NBM-5BD ug/L CORRECTED mg/kg %R
Ir ND ND ND -
Pt 2391 807 13.454 4454.96
Os 514 510 8.493 -
Rh ND ND ND -
Ru 781 ND ND -
Pd 438 435 7.250 829.51

8 8
Batch #C (500W 3.0g 20min)
NBM-6A ug/L CORRECTED mg/kg %R RPD
Ir 492 380 6.327 - -
Pt ND ND ND - -
Os 462 458 7.628 - 6.94
Rh ND ND ND - -
Ru 764 ND ND - 41.58
Pd 355 354 5.898 1310.72 48.69
NBM-6AD ug/L CORRECTED rag/kg %R
Ir ND ND ND -
Pt 323 ND ND -
Os 431 427 7.111 -
Rh ND ND ND -
Ru 501 ND ND -
Pd 216 215 3.582 795.90

89
Batch #C (500W 3.0g 20min)
NBM-6B ug/L CORRECTED mg/kg %R RPD
Ir 574 ND ND - 25.98
Pt 247 ND ND - 20.69
Os 432 422 7.042 - 14.19
Rh 344 ND ND - 0.29
Ru 467 ND ND - 30.18
Pd 460 455 7.585 48.78 66.08
NBM-6BD ug/L CORRECTED mg/kg %R
Ir 442 ND ND -
Pt 304 ND ND -
Os 498 ND ND -
Rh 343 ND ND -
Ru 633 ND ND -
Pd 914 909 15.152 97.44
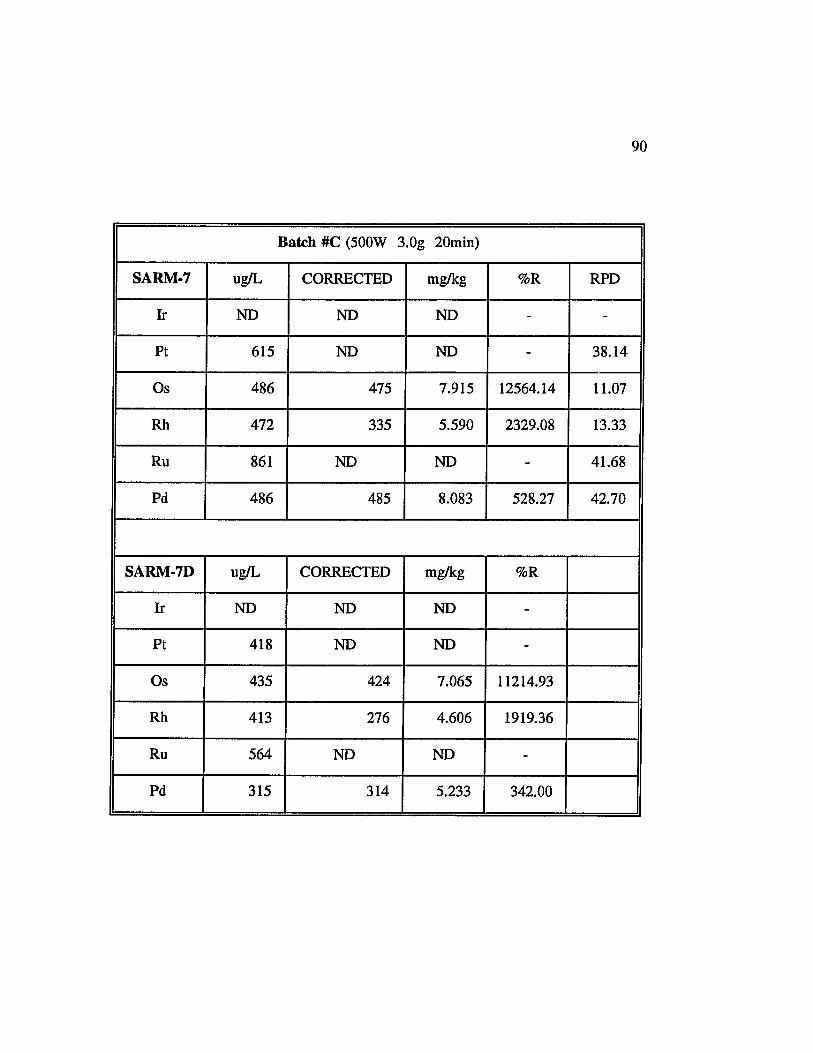
90
Batch #C (500W 3.0g 20rain)
SARM-7 ug/L CORRECTED mg/kg %R RPD
Ir ND ND ND - -
Pt 615 ND ND - 38.14
Os 486 475 7.915 12564.14 11.07
Rh 472 335 5.590 2329.08 13.33
Ru 861 ND ND - 41.68
Pd 486 485 8.083 528.27 42.70
SARM-7D ug/L CORRECTED rag/kg %R
Ir ND ND ND -
Pt 418 ND ND -
Os 435 424 7.065 11214.93
Rh 413 276 4.606 1919.36
Ru 564 ND ND -
Pd 315 314 5.233 342.00

91
Batch #C (500W 3.0g 20min)
SU-la ug/L CORRECTED mg/kg %R RPD
Ir 429 ND ND - 100.87
Pt 3889 2163 36.049 8792.43 58.59
Os 1059 1054 17.561 - 27.31
Rh 781 ND ND - 9.63
Ru 4393 3287 54.787 - 25.54
Pd 865 861 14.353 3879.12 2.58
SU-laD ug/L CORRECTED mg/kg %R
Ir 1302 523 8.711 -
Pt 7112 5386 89.766 21894.06
Os 1394 1389 23.144 -
Rh 860 39 0.645 -
Ru 5679 4573 76.220 -
Pd 843 839 13.986 3780.03

92
ICP-AES data results. Precision and Accuracy data for predigestion step.
PREDIGESTION (500W 20min lOg)
NBM-5B ug/L CORRECTED mg/kg %R
Ir 1367 589 1.767 -
Pt 7250 4179 12.536 4151.04
Os 1865 1861 5.583 -
Rh ND ND ND -
Ru ND ND ND -
Pd 1995 1953 5.859 670.38

93
PREDIGESTION (500W 20min lOg)
NBM-6B ug/L CORRECTED mg/kg %R RPD
Ir 796 ND ND - 36.38
Pt 1333 609 1.826 35.19 96.22
Os 582 579 1.737 - 7.12
Rh ND ND ND - -
Ru ND ND ND - -
Pd 2571 2250 6.749 43.40 10.48
NBM-6BD ug/L CORRECTED mg/kg %R
Ir 551 ND ND -
Pt 467 ND ND -
Os 542 539 1.617 -
Rh ND ND ND -
Ru ND ND ND -
Pd 2315 1994 5.981 38.46

94
PREDIGESTION (500W 20min lOg)
SARM-7 ug/L CORRECTED rag/kg %R RPD
Ir 1449 ND ND - 65.38
Pt 2433 2075 6.226 166.47 57.26
Os 158 142 0.427 678.17 15.20
Rh ND ND ND - -
Ru 513 490 1.470 341.79 200.00
Pd 301 168 0.504 32.92 34.16
SARM-7D ug/L CORRECTED rag/kg %R
Ir 735 ND ND -
Pt 1350 992 2.977 79.59
Os 184 168 0.505 801.98
Rh ND ND ND -
Ru ND ND ND -
Pd 425 292 0.876 57.23

95
PREDIGESTION (500W 20min lOg)
SU -la ug/L CORRECTED mg/kg %R RPD
Ir 1694 ND ND - 61.42
Pt 6750 4554 13.663 3332.32 161.59
Os 2309 2307 6.921 - -
Rh ND ND ND - -
Ru ND ND ND - -
Pd 469 359 1.077 291.10 127.97
SU-laD ug/L CORRECTED rag/kg %R
Ir 898 ND ND -
Pt 717 ND ND -
Os ND ND ND -
Rh ND ND ND -
Ru ND ND ND -
Pd 103 ND ND -

APPENDIX 3
ICP-MS DATA RESULTS

97
QUANTITATIVE ANALYSIS I CALIBRATION REPORTData Set: 3.16.93Data Set Description:Calibration File: TPT31693LBCalibration: External Standard
Root Kean CorrelationAnalyteRu 99
Slope46551.855469
Intercept0.000000
Square840.227661
Coefficient0.999628
Unitsppb ZRh 103 3.341010E+05 0.000000 6494.395020 0.999559 ppb ZPd 105 70652.484375 0.000000 1505.808838 0.999480 ppb ZIr 193 2.331235E+05 0.000000 5547.896484 0.999337 ppb ZP t 194 88711.906250 0.000000 1647.307251 0.999602 ppb ZP t 195 92080.539063 0.000000 1143.213867 0.999825 ppb ZAu 197 1.392016E+05 0.000000 2821.582520 0.999547 ppb ZOb 188 22974.000000 0.000000 1145.873047 0.997106 ppb ZOb 189 28371.560547 0.000000 1260.488159 0.997706 ppb ZOb 192 73019.898438 0.000000 2853.225098 0.998233 ppb z
8S006' 80000-
60000'
i£ 4000020000
— — ---------------------------------- , 1 --e 09 e.50 i-00CONCENTRATION FOB Bu then 1 urK 89 »
CURRENT INTENSITV: 10879.00 <F> First StandardCURRENT CONCENTRATION: 0 2500 (L > Last StandardLAST SAMPLE CONC. : n/a <N> Next ElenentCORRELATION COEFF . • 1.0e0
t2 .00
IN1 .50ppb<T> Toggle Point <R> Repeat Regression ( X > Exit Graphics < H ) Hardcopy Screen

98
-e.ea 1 .eeCURRENT INTENSITY: CURRENT CONCENTRATION: LAST SAMPLE CONC . : CORRELATION COEFF.:
CONCENTRATION FOR Rhodlun<103> 61648.50 <F> First Standard0.2500 < L ) Last Standardn/a <N> Next Elenent
1 .000
IN ppb<T> Toggle Point <R> Repeat Regression <X> Exit Graphios < H ) Hardcopy Soreen
40000-
1.00 ».50CONCENTRATION FOR Pa 1 led lurK 10S > IN ppb-0.09 CONCENTRAT
CURRENT INTENSITY: 1S433.00CURRENT CONCENTRATION: 0.2500LAST SAMPLE CONC.: n/aCORRELATION COEFF.: 0.993
<F> First Standard <L> Last Standard <N> Next Elenent<T> Toggle Point <R> Repeat Regression <X> Exit Graphics (H > Hardcopy Soreen

99
58000"
1.00 1.50ION FOB Iridiurrt 193> IN ppb0.50CONCENTRAT-0 .09
CURRENT INTENSITV: 56481.00CURRENT CONCENTRRTION: 0.2S00LAST SAMPLE CONC.: n/a__CORRELATION COEFF.C 0.999
<F) First Standard <L> Last Standard <N> Next Element(T> Toggle Point <R> Repeat Regression <X> Exit Craphios < H ) Hardcopy Soreen
00 .50 1 .00 2 .00
CURRENT INTENSITV: CURRENT CONCENTRATION: LAST SAMPLE CONC.: CORRELATION COEFF.:
CONCENTRATION FOR Cold<197> IN ppb 30877.00 <F> First Standard <T> Toggle Point0.2500 <L> Last Standard <R> Repeat Regressionn/a CN) Next Elenent <X> Exit Graphlos1 .000 < H > Hardcopy Soreen

100
iseeac-
1 0 0 0 0 0-
50000-
- « .ea 2.00
CURRENT INTENSITV: CURRENT CONCENTRRTION: LAST SAMPLE CONC.: CORRELATION COEFF.:
I----------------------------------1---------------------------------- r0 .50 1 .00 1 .50CONCENTRATION FOR P 1atlnun<195> IN ppb 21760.50 < F ) First Standard <T> Toggle Point0.2500 <L> Last Standard <R> Repeat Regressionn/a CN> Next Elenent <X> Exit Graphics
1 .000 < H > Hardcopu Soreen
50000-
0 - 1 .501 .00 2 .000 .09 CONCENTRATION FOR PlatlnurK 194> IN ppb CURRENT INTENSITY: 21199.00 <F> First Standard <T> Toggle PointCURRENT CONCENTRATION: 0.2S00 <L> Last Standard <H) Repeat RegressionLOST SAMPLE CONC.: n/a <N> Next Elenent <X> Exit GraphicsCORRELATION COEFF.: 1.000 <H> Hardcopy Screen
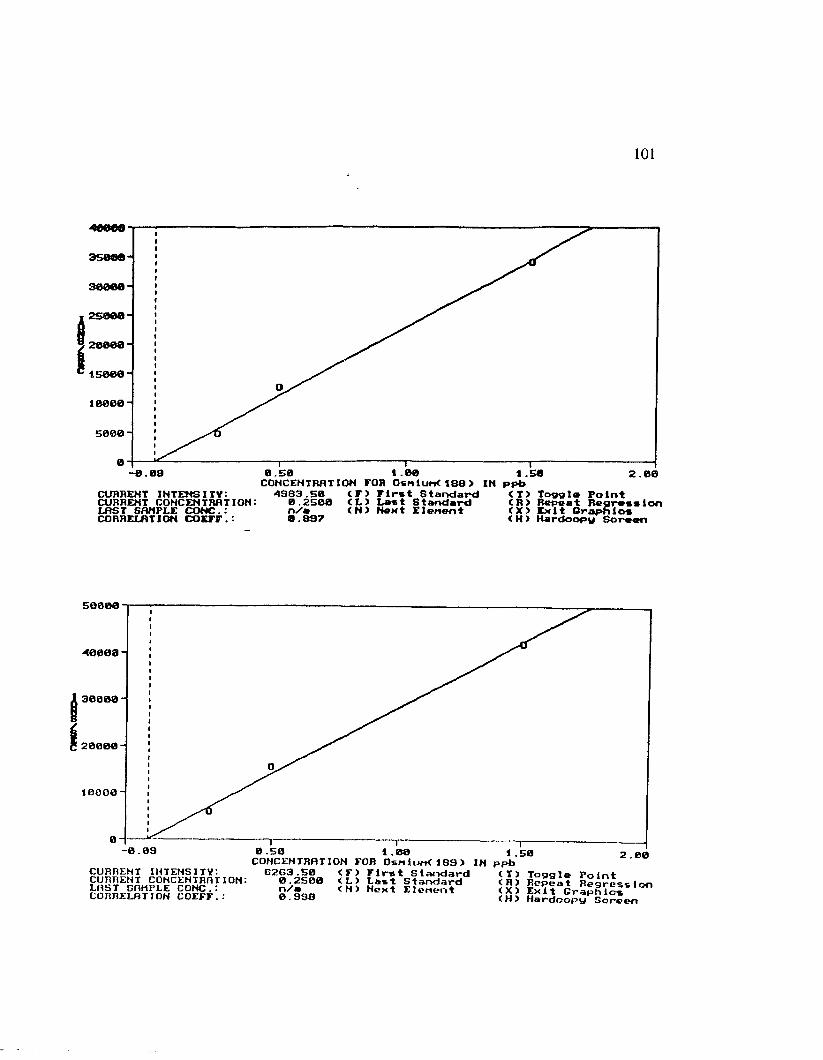
101
i .80-0.09 2 .00
CURRENT INTENSITV: 4983.50CURRENT CONCENTRATION: 0.2500LAST SAMPLE CONC.: n/eCORRELATION COEFF.: 0.8S7
CONCENTRRTION FOR Osnlun<18S> IN ppb<F> First Standard <L> Last Standard < N ) Next Elenent
<T> Toggle Point <R> Repeat Regression <X> Exit Orapnlot < H > Hardcopy Soreen
50000
40000 H
30000 -
20000
10000 -i
-0.09CURRENT INTENSITV. CURRENT CONCENTRATION: LRST SAMPLE CONC.: CORRELATION COEFF.:
2 .00
____ ——I----
r " Vi?lun<»B9> PPj Toggi . Po‘ntsslonC%5CLHTBnT ION r o R ^ l a r d ^ r a P ^e2G3.||0 aH) t ^ ! l e « e n * <H>Hard
0 ^ 9 9 0

102
1 .588 .58CONCENTRATION FOR Osn iurrC 192 > IN ppbCURRENT INTENSITV: 16282.33CURRENT CONCENTRATION: 8.2S00LAST SAMPLE CONC.: n / m__CORRELATION COEFF.: 0.898
<F> First Standard <L> Last 8tandard <N) Next Elenent<T) Toggle Point <R> Repeat Regression <X> Exit Oraphios < H ) Hardoopg Soreen

ICP-MS data results. SRM with predigestion.
NBM-5B (ug/L) rag/kg %R
"R u 0.0004 0.000 -
l03Rh 0.1038 0.031 -
105Pd 2.4242 0.727 83.21
193Ir 0.1084 0.033 -
194Pt 0.3479 0.104 34.56
195Pt 0.3687 0.111 36.63
197Au 5.1764 1.553 144.59
I890 s 0.027 0.008 -
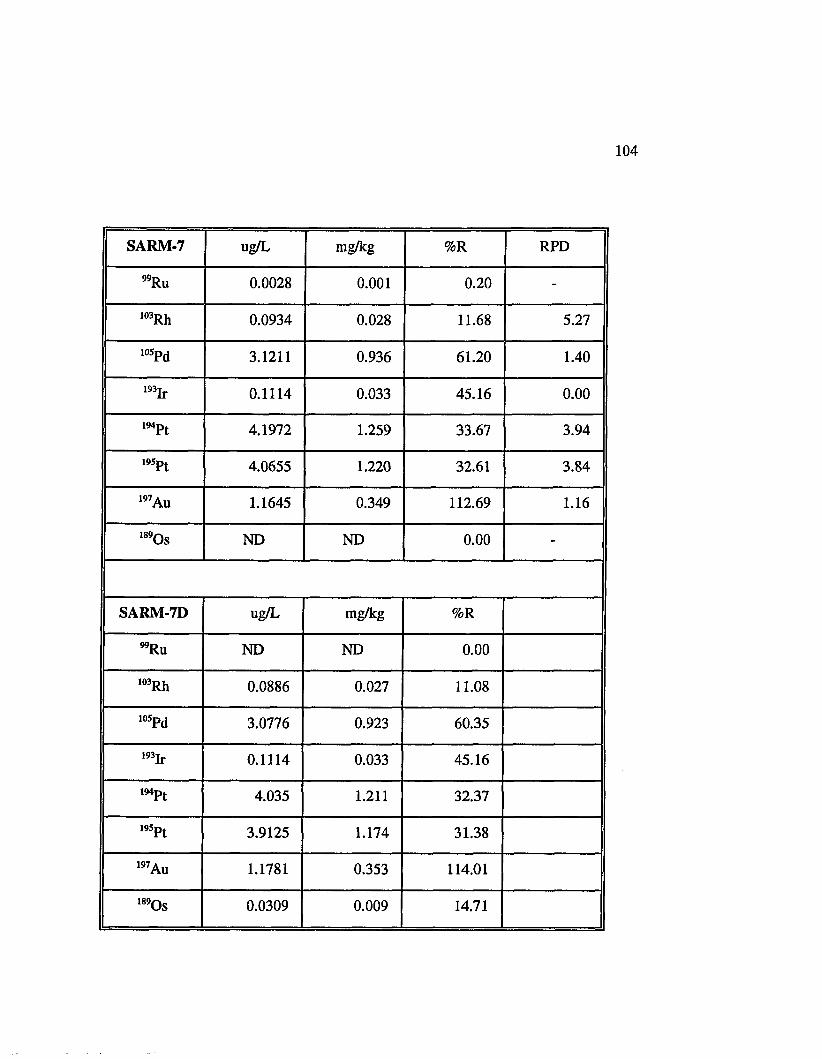
104
SARM-7 ug/L rag/kg %R RPD
"Ru 0.0028 0.001 0.20 -
103Rh 0.0934 0.028 11.68 5.27
105Pd 3.1211 0.936 61.20 1.40
193Ir 0.1114 0.033 45.16 0.00
194Pt 4.1972 1.259 33.67 3.94
195Pt 4.0655 1.220 32.61 3.84
197Au 1.1645 0.349 112.69 1.16
1890 s ND ND 0.00 -
SARM-7D ug/L mg/kg %R
"Ru ND ND 0.00
103Rh 0.0886 0.027 11.08
i°5pd 3.0776 0.923 60.35
193Ir 0.1114 0.033 45.16
mpt 4.035 1.211 32.37
195Pt 3.9125 1.174 31.38
197Au 1.1781 0.353 114.01
1890 s 0.0309 0.009 14.71

105
SU -la (ug/L) mg/kg %R RPD
"R u ND ND - -
103Rh 0.1167 0.035 43.76 0.26
10SPd 0.8936 0.268 72.45 5.21
193Ir 0.1024 0.031 - 0.29
194Pt 0.2914 0.087 21.32 19.22
I95Pt 0.318 0.095 23.27 16.70
197Au 0.9633 0.289 192.66 32.86
1890 s 0.006 0.002 - 200.00
SU-laD ug/L mg/kg %R
"R u ND ND
103Rh 0.1164 0.035 43.65
lOSpd 0.8482 0.254 68.77
193Ir 0.1027 0.031 -
194Pt 0.2403 0.072 17.58
195Pt 0.269 0.081 19.68
197Au 0.6914 0.207 138.28
1890 s ND ND -

106
NBM-6B ug/L rag/kg %R RPD
"Ru ND ND - -
103Rh 0.0938 0.281 76.05 4.02
105Pd 3.5599 10.680 68.68 25.90
193Ir 0.1014 0.304 - 0.20
194Pt 1.3912 4.174 80.42 4.22
195Pt 1.3614 4.084 78.69 4.85
197Au 0.5588 1.676 798.29 17.50
CGoOs00 ND ND - -
NBM-5BD ug/L rag/kg %R
"Ru ND ND -
103Rh 0.0901 0.270 73.05
i°5Pd 2.7435 8.231 52.93
193Ir 0.1012 0.304 -
m pt 1.4512 4.354 83.88
,95pt 1.4291 4.287 82.61
197Au 0.4689 1.407 669.86
O©*00 ND ND -

ICP-MS analysis. CANMET data results.
TDB-1 ug/L mg/kg RPD
Ru 99 ND ND -
Rh 103 0.0725 0.044 0.14
Pd 105 0.6634 0.398 6.17
Ir 193 0.1004 0.060 0.60
Pt 194 0.0803 0.048 4.33
Pt 195 0.109 0.065 4.79
Au 197 0.2868 0.172 1.72
Os 189 ND ND -
TDB-ID ug/L mg/kg
Ru 99 - -
Rh 103 0.0724 0.043
Pd 105 0.6237 0.374
Ir 193 0.0998 0.060
Pt 194 0.0769 0.046
Pt 195 0.1039 0.062
Au 197 0.2819 0.169
Os 189 0.0133 0.008

UMT-1 ug/L rag/kg RPD
Ru 99 ND ND -
Rh 103 0.0898 0.013 1.68
Pd 105 1.2261 0.184 6.91
Ir 193 0.1019 0.015 0.59
Pt 194 0.3548 0.053 1.51
Pt 195 0.3736 0.056 0.40
Au 197 0.682 0.102 17.37
Os 189 0.005 0.001 200.00
UMT-1D ug/L mg/kg
Ru 99 0.0102 0.002
Rh 103 0.0883 0.013
Pd 105 1.1442 0.172
Ir 193 0.1013 0.015
Pt 194 0.3495 0.052
Pt 195 0.3721 0.056
Au 197 0.573 0.086
Os 189 ND ND

WGB-1 ug/L rag/kg RPD
Ru 99 ND ND -
Rh 103 0.0727 0.044 3.07
Pd 105 0.6415 0.385 10.09
Ir 193 0.0997 0.060 0.30
Pt 194 0.0795 0.048 6.49
Pt 195 0.1067 0.064 2.85
Au 197 0.2921 0.175 3.66
Os 189 0.0432 0.026 200.00
WGB-1D ug/L rag/kg
Ru 99 ND ND
Rh 103 0.0705 0.042
Pd 105 0.5799 0.348
Ir 193 0.1 0.060
Pt 194 0.0745 0.045
Pt 195 0.1037 0.062
Au 197 0.303 0.182
Os 189 ND ND
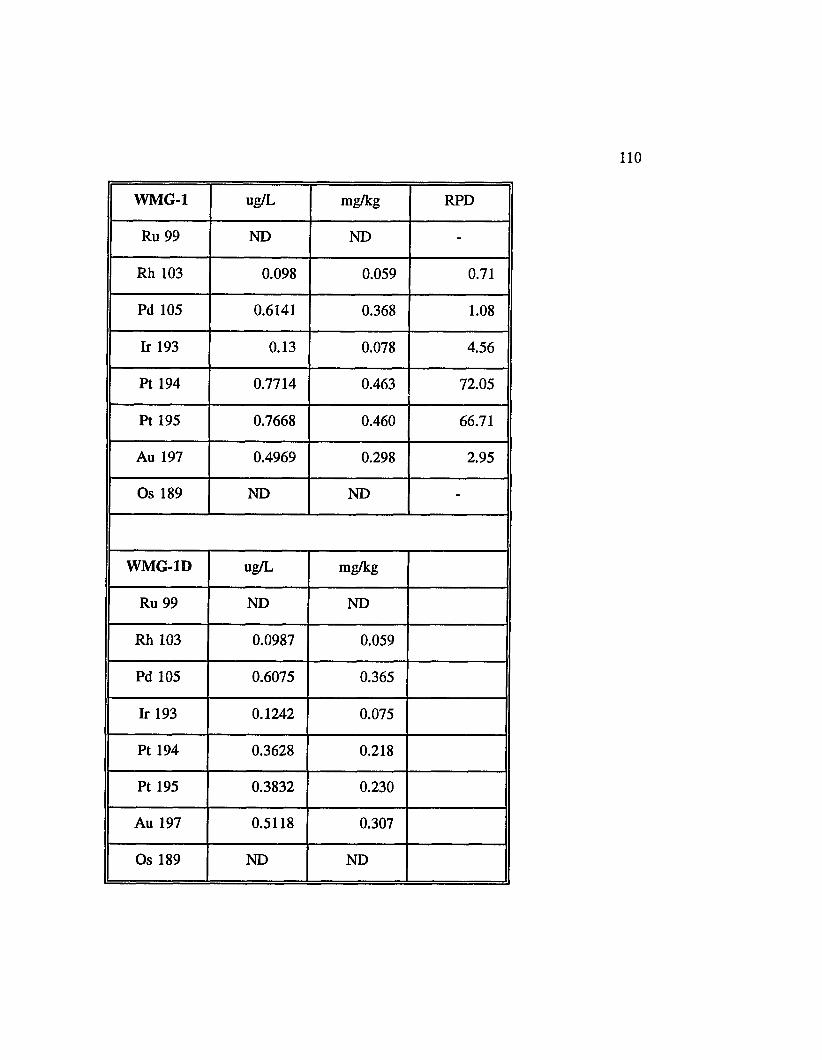
WMG-1 ug/L rag/kg RPD
Ru 99 ND ND -
Rh 103 0.098 0.059 0.71
Pd 105 0.6141 0.368 1.08
It 193 0.13 0.078 4.56
Pt 194 0.7714 0.463 72.05
Pt 195 0.7668 0.460 66.71
Au 197 0.4969 0.298 2.95
Os 189 ND ND -
WMG-1D ug/L mg/kg
Ru 99 ND ND
Rh 103 0.0987 0.059
Pd 105 0.6075 0.365
Ir 193 0.1242 0.075
Pt 194 0.3628 0.218
Pt 195 0.3832 0.230
Au 197 0.5118 0.307
Os 189 ND ND

WMS-1 ug/L mg/kg RPD
Ru 99 0.1371 0.082 51.48
Rh 103 0.2768 0.166 5.77
Pd 105 2.2446 1.347 10.72
Ir 193 0.223 0.134 27.81
Pt 194 0.9891 0.593 6.59
Pt 195 0.992 0.595 5.49
Au 197 0.9318 0.559 15.94
Os 189 0.1859 0.112 47.67
WMS-1D ug/L mg/kg
Ru 99 0.23215 0.139
Rh 103 0.29325 0.176
Pd 105 2.4988 1.499
Ir 193 0.16855 0.101
Pt 194 1.0565 0.634
Pt 195 1.04805 0.629
Au 197 0.7942 0.477
Os 189 0.30225 0.181
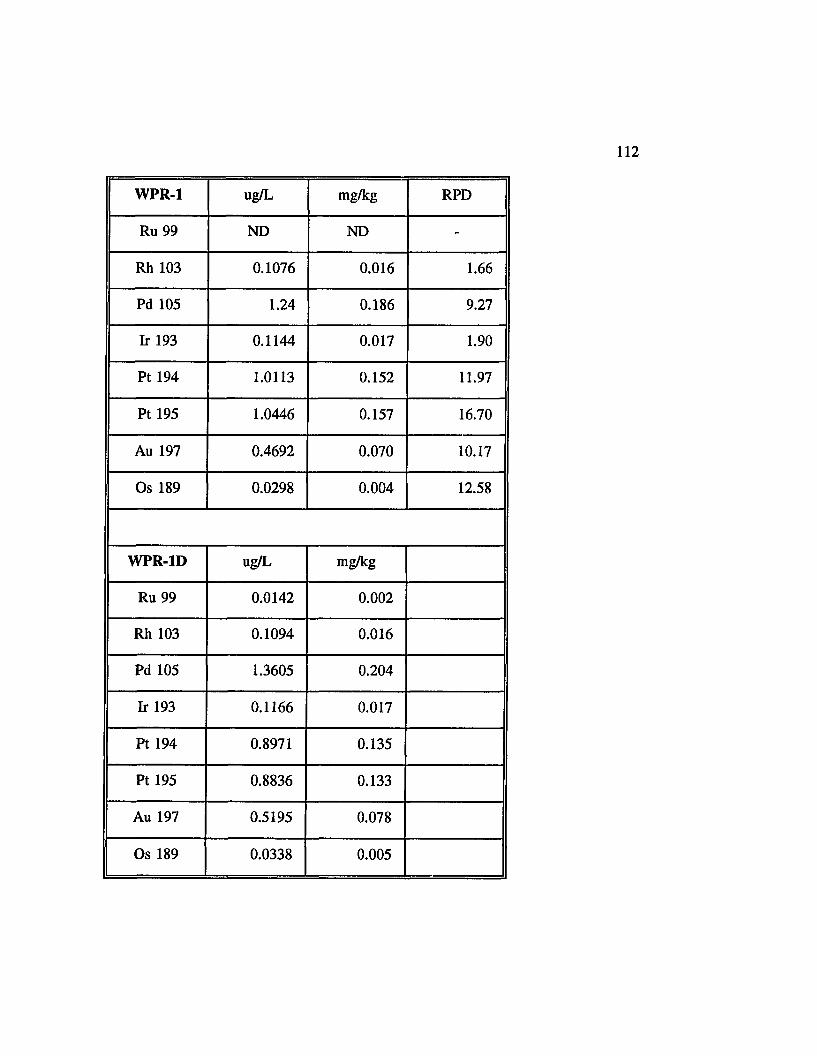
WPR-1 ug/L mg/kg RPD
Ru 99 ND ND -
Rh 103 0.1076 0.016 1.66
Pd 105 1.24 0.186 9.27
Ir 193 0.1144 0.017 1.90
Pt 194 1.0113 0.152 11.97
Pt 195 1.0446 0.157 16.70
Au 197 0.4692 0.070 10.17
Os 189 0.0298 0.004 12.58
WPR-1D ug/L mg/kg
Ru 99 0.0142 0.002
Rh 103 0.1094 0.016
Pd 105 1.3605 0.204
Ir 193 0.1166 0.017
Pt 194 0.8971 0.135
Pt 195 0.8836 0.133
Au 197 0.5195 0.078
Os 189 0.0338 0.005

ICP-MS analysis results. Cyanide leach data.
SARM-7-CN ug/L mg/kg %R
Ru 99 0.7273 0.364 84.57
Rh 103 0.2061 0.103 42.94
Pd 105 1.6931 0.847 55.33
Ir 193 0.1308 0.065 88.38
Pt 194 0.5004 0.250 6.69
Pt 195 0.5187 0.259 6.93
Au 197 1.9363 0.968 312.31
Os 189 0.0256 0.013 20.32
SARM-7-CND ug/L mg/kg %R
Ru 99 0.7099 0.355 82.55
Rh 103 0.2647 0.132 55.15
Pd 105 1.8885 0.944 61.72
Ir 193 0.1340 0.067 90.54
Pt 194 0.6049 0.302 8.09
Pt 195 0.6240 0.312 8.34
Au 197 1.3558 0.678 218.68
Os 189 0.0000 0.000 0.00
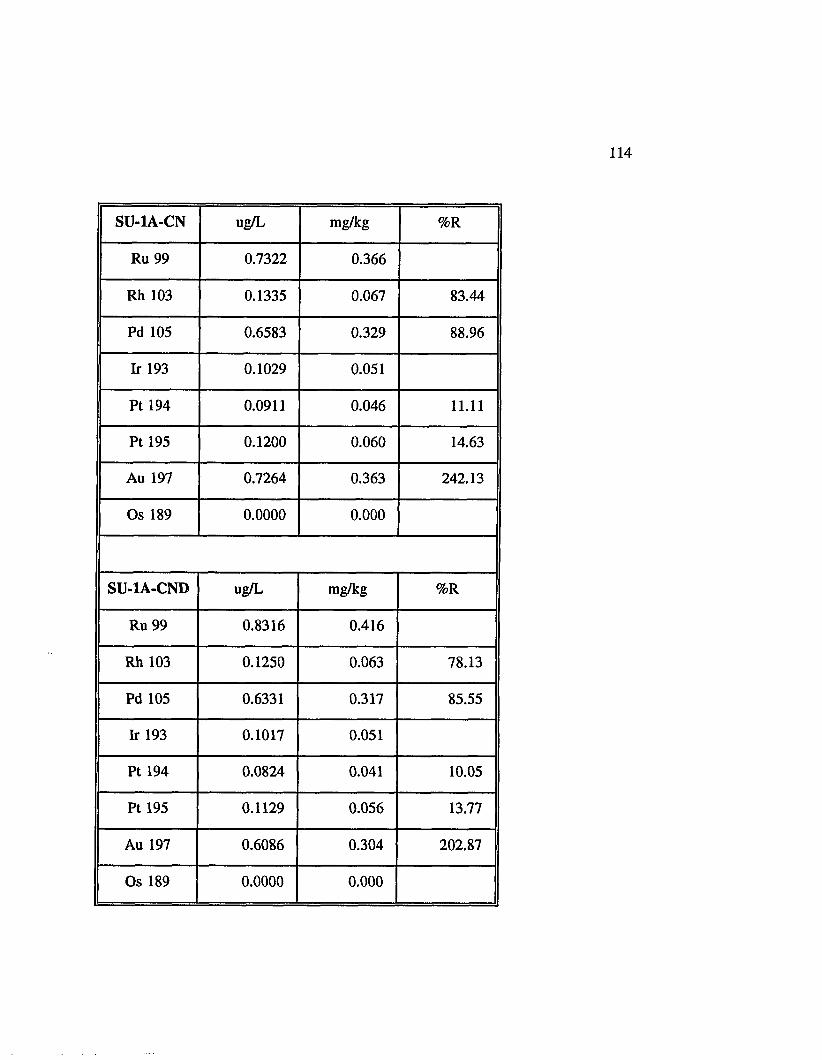
SU-1A-CN ug/L mg/kg %R
Ru 99 0.7322 0.366
Rh 103 0.1335 0.067 83.44
Pd 105 0.6583 0.329 88.96
Ir 193 0.1029 0.051
Pt 194 0.0911 0.046 11.11
Pt 195 0.1200 0.060 14.63
Au 197 0.7264 0.363 242.13
Os 189 0.0000 0.000
SU-1A-CND ug/L rag/kg %R
Ru 99 0.8316 0.416
Rh 103 0.1250 0.063 78.13
Pd 105 0.6331 0.317 85.55
Ir 193 0.1017 0.051
Pt 194 0.0824 0.041 10.05
Pt 195 0.1129 0.056 13.77
Au 197 0.6086 0.304 202.87
Os 189 0.0000 0.000

NBM-6B-CN ug/L mg/kg %R
Ru 99 0.0000 0.000
Rh 103 0.1384 0.346 93.51
Pd 105 6.0662 15.166 97.53
Ir 193 0.1722 0.431
Pt 194 0.1883 0.471 9.07
Pt 195 0.2163 0.541 10.42
Au 197 0.5298 1.325 630.71
Os 189 0.0000 0.000
NBM-6B-CND ug/L mg/kg %R
Ru 99 0.0140 0.035
Rh 103 0.1365 0.341 92.23
Pd 105 7.0421 17.605 113.22
Ir 193 0.1050 0.263
Pt 194 0.2112 0.528 10.17
Pt 195 0.2385 0.596 11.49
Au 197 0.4821 1.205 573.93
Os 189 0.0000 0.000

APPENDIX 4
QUALITY ASSURANCE PLAN

117
QUALITY ASSURANCE PLAN
The following Quality Assurance/Quality Control (QA/QC) practices were
employed during all sample preparations and analytical work. The quality assurance
plan in this project was based on the QA/QC plan for US EPA contractors (CLP SOW,
1990)17.
Instrument Calibration
One blank and at least three calibration standards in graduated amount in the
appropriate range were used for determination of the calibration curve (4 points
required). The calibration standards were prepared on the day of analyses with the
same combination of acids at the same concentrations as resulted in a fully digested
sample.
Initial Calibration Verification (ICV)
Immediately after instrument was calibrated the accuracy of the initial
calibration was verified and documented. For calibration verification, an independent
PGE standard was used.
118
Continuing Calibration Verification (CCV)
To ensure calibration accuracy during each analysis run, every 10th sample
calibration standard was analyzed for every wavelength or mass used for analysis. The
standard was also analyzed and reported after the last analytical sample. The
concentration of PGE in the continuing calibration standard was at the mid-range level
of the calibration.
Initial Calibration Blank (ICB) and Continuing Calibration Blank (CCB)
A calibration blank was analyzed immediately after every initial and continuing
calibration verification. The blank was also analyzed at the beginning of the run and
after every analytical sample.
Preparation Blank (PB)
At least one preparation blank, consisting of deionized distilled water processed
through each sample preparation and analysis procedure was prepared and analyzed
with each sample batch.
Duplicate Sample Analysis (D)
All samples were prepared and analyzed in duplicate. The relative percent
difference (RPD) of results of the duplicate analysis should be less than 20% or three
times IDL, whichever is greater.

119
Data Reduction Methods
Concentration of analvte
The concentration determined in the digest was reported on the basis of weight
of the sample:
Conc(mg/kg) = C x V/W
C = concentration (mg/L)
V = final volume in liters after sample preparation
W = weight in kg of wet sample
Precision
The relative percent difference (RPD) for duplicate samples was calculated:
RPD= 100 x (S-D)/(S+D) x 0.5
RPD = Relative Percent Difference
S = First Sample Value (original)
D = Second Sample Value (duplicate)
Accuracy
% Recovery of the analyte from Standard Reference Material (SRM):
%R=100% x (CJCSJ
%R= percent recovery
Cm= measured concentration of SRM
Csnn= actual concentration of SRM
1 2 0
REFERENCES
1. Haines, J., and Robert, R.V.D., Cone. Miner. Technol. (MINTEK, S.Afir.) Rep.,No. M34, 1982.
2. Kingston, H.M., and Jassie, L.B., Introduction to Microwave Sample Preparation:Theory and Practice, American Chemical Society, Washington,D.C., 1988.
3. Lide, D.R., Handbook of Chemistry and Physics, CRC Press, Inc., 1990.
4. Buchanan, D.L., Platinum-group element exploration, Elsvier SciencePublications, Amsterdam 1988.
5. Schiffries, C.M. and Skinner, B.J., Am J of Sci, 1987, 287, 566-595.
6. Czamanske, G.K. and Bohlen, S.R., Am Mineralogist, 1990, 75, 37-45.
7. Sjoberg, J., and Gomes, J.M., California Geology, 1981, 5,91-98.
8. Butterman, W.C., Platinum-group metals in mineral facts and problems: U.S.Bureau of Mines Bulletin 667, 1976, 835-854.
9. Abu-Samra, A., Moris, J.S., and Koirtyohann, S.R., Anal. Chem., 1975, 47,1475-1477.
10. Gary, M., McAfee, R. Jr, and Wolf, C.L., Glossary of Geology, AmericanGeological Institute, Washington, D.C.
11. Gillman, B.L., General Guidelines for Microwave Sample Preparation, CEMCorporation, July 1988.
12. Nowinski, P. and Hillman, D.C., Practical Calibration of Microwave DigestionOvens, Pittsburgh Conference and Exposition on Analytical Chemistry and Applied Spectroscopy, 202P, New Orleans 1992.
13. Reed, T.B., J. Appl. Phys., 1961, 32, 821-824.
14. Greenfield, S., Jones, I.L.C., and Berry, C.T., Analyst, 1964, 89, 713-720.
15. Wendt, R.H. and Fassel, V.A., Anal. Chem., 1965, 37, 920-922.
16. Thompson, M. and Walsh, N.J., A Handbook of Inductively Coupled PlasmaSpectrometry, Blackie, London 1983.
1 2 1
17. Contract Laboratory Program. Method 6010. Washington, D.C. 1990.
18. Gray, A.L. and Date, A . R Analyst, 1983, 108, 1033.
19. PlasmaQuad System Manual, Version 2a. VG Elemental, March 1988.
20. Laing, G.A., Dobb, D.E., Baggett, C.A., and Cardenas, D., Inductively CoupledPlasma-Mass Spectrometry Auditors Training Course, EMSL-LV, 1992.
21. Steele, T.W., et al., Preparation and certification of a reference sample of aprecious metal ore, Report No. 1696-1975 of the National Institute of Metallurgy, Republic of South Africa.
22. Canada Center for Mineral and Energy Technology (CANMET), Nickel-Cooper-Cobalt Ore SU-la, Certificate of Analysis.
23. Desilats, M., Nevada Bureau of Mines, Reno, 1991, personal communication.
24. Leaver, M., CANMET, 1991, personal communication.
25. Deming, S., Microwave Power Calibration Study, EPA Technical Report#910212-01. February 19,1992.
26. Deming, S. and Morgan, S.L., Experimental Design for Quality and Productivityin Research, Development, and Manufacturing, Statistical Designs, Houston,1989.
27. Deming, S. and Morgan, S.L., Sequential Simplex Optimization, StatisticalDesigns, Houston, 1991.
28. Test Methods for Evaluating Solid Waste, Volume 1A, US EPA, Office of SolidWaste, SW-846, November 1986.
29. Winge, R.K., Fassel, V.J., Peterson, V.J., and Floyd, M.A., Inductively CoupledPlasma Atomic Emission Spectroscopy. An Atlas of Spectral Information, Elsvier, 1985, 473-476.
30. Jackson, S.E., Fryer, B.J., Gosse, W„ Healy, D.C., Longerich, H.P., and Strong,D.F.M ai. Geology, 1990, 83, 119-132.
31. Longerich, H.P., Jenner, G.A., Fryer, B,J., and Jackson, S.E., Anal. Geology,1990, 83, 105-118.

1 2 2
32. Hillman, D.C. and Nowinski, P., Robotic Microwave Digestion System for Contract Laboratory Program, OSWER Conference, Atlanta, 1991.
Related Documents