Microtubule Assembly of Isotypically Purified Tubulin and Its Mixtures Vahid Rezania,* y Olga Azarenko, z Mary Ann Jordan, z Hannes Bolterauer, § Richard F. Luduen ˜a, { J. Torin Huzil,* and Jack A. Tuszynski* *Department of Oncology, University of Alberta, Edmonton, Alberta, Canada; y Institute for Advanced Studies in Basic Sciences, Zanjan, Iran; z Department of Molecular, Cellular and Developmental Biology, University of California, Santa Barbara, California; § Institute of Theoretical Physics, J. Liebig Universitaet Giessen, Giessen, Germany; and { Department of Biochemistry, University of Texas Health Science Center, San Antonio, Texas ABSTRACT Numerous isotypes of the structural protein tubulin have now been characterized in various organisms and their expression offers a plausible explanation for observed differences affecting microtubule function in vivo. While this is an attractive hypothesis, there are only a handful of studies demonstrating a direct influence of tubulin isotype composition on the dynamic properties of microtubules. Here, we present the results of experimental assays on the assembly of microtubules from bovine brain tubulin using purified isotypes at various controlled relative concentrations. A novel data analysis is developed using recursive maps which are shown to be related to the master equation formalism. We have found striking similarities between the three isotypes of bovine tubulin studied in regard to their dynamic instability properties, except for subtle differences in their catastrophe frequencies. When mixtures of tubulin isotypes are analyzed, their nonlinear concentration dependence is modeled and interpreted in terms of lower affinities of tubulin dimers belonging to the same isotype than those that represent different isotypes indicating hitherto unsuspected influences of tubulin dimers on each other within a microtubule. Finally, we investigate the fluctuations in microtubule assembly and disassembly rates and conclude that the inherent rate variability may signify differences in the guanosine-59-triphosphate composition of the growing and shortening microtubule tips. It is the main objective of this article to develop a quantitative model of tubulin polymerization for individual isotypes and their mixtures. The possible biological significance of the observed differences is addressed. INTRODUCTION Microtubules (MTs) are long and relatively rigid hollow protein cylinders that constitute a major component of the cytoskeleton within eukaryotic cells (1). MTs are responsible for several fundamental cellular processes, such as intracel- lular trafficking, cellular morphogenesis, and cell division. It has also been hypothesized that MTs may be responsible for transferring energy across the cell, with little energy dissi- pation (2). MTs are assembled by aggregation of a- and b-tubulin heterodimers in the presence of guanosine-59-triphosphate (GTP) and magnesium. The irregularity of growing and shortening patterns observed experimentally in MTs may, at first, suggest a very complicated set of processes. In most of the biophysical literature on this topic, two main modes of behavior have been identified and termed: growing and shortening. The implication also made in this context is that these are two distinct dynamical events that somehow com- pete for the system’s involvement. Individual MTs fluctuate stochastically between assembly and disassembly (growing and shortening) phases, in a nonequilibrium process referred to as dynamic instability (3,4). In vitro, only tubulin dimers that are bound to two GTP molecules are assembly-competent; one GTP molecule is bound nonexchangeably to a-tubulin and the other GTP is bound exchangeably to b-tubulin (5). However, upon binding, the exchangeably-bound GTP is rapidly hydrolyzed to guanosine diphosphate (GDP), with the exception of the so-called GTP (or lateral) cap that consists perhaps of only the top layer or two of tubulin dimers (5). It has been speculated that the hydrolysis of GTP weakens lateral and longitudinal tubulin interactions, thereby producing con- ditions suitable for disassembly. In general, one can summa- rize MT assembly and disassembly as comprised of the key governing reactions, 1. Generating tubulin-GTP (assembly-competent) (T GTP ) from tubulin GDP (assembly incompetent) (T GDP ): D 1 1 T GDP / T GTP , 2. Growing of a microtubule: D 2 1 T GTP 1 MT(n) / MT(n 1 1), 3. Shortening of a microtubule: MT(n) / MT(n 1 1) 1 D 3 1 T GTP , where MT(n) is a microtubule with n tubulin dimers, and D 1 0.0069 kcal/mol, D 2 0.0017 kcal/mol, and D 3 0.0017 kcal/mol are the corresponding free energy values given by Caplow et al. (6). The standard designation used in the literature is to refer to the change from a growing phase to a shortening phase as a catastrophe and to its mirror image, i.e., from a shortening phase to a growing phase as a rescue. We note that due to the conversion of tubulin GTP to tubulin GDP after binding to the MT, we did not consider the loss of tubulin GTP as a fundamental process although it most certainly is an intermediate step leading to disassembly. It is also noteworthy that the conformation of growing MTs doi: 10.1529/biophysj.108.132233 Submitted February 25, 2008, and accepted for publication April 22, 2008. Address reprint requests to Jack A. Tuszynski, E-mail: [email protected]. ca. Editor: Susan P. Gilbert. Ó 2008 by the Biophysical Society 0006-3495/08/08/1993/16 $2.00 Biophysical Journal Volume 95 August 2008 1993–2008 1993

Welcome message from author
This document is posted to help you gain knowledge. Please leave a comment to let me know what you think about it! Share it to your friends and learn new things together.
Transcript
Microtubule Assembly of Isotypically Purified Tubulin and Its Mixtures
Vahid Rezania,*y Olga Azarenko,z Mary Ann Jordan,z Hannes Bolterauer,§ Richard F. Luduena,{
J. Torin Huzil,* and Jack A. Tuszynski**Department of Oncology, University of Alberta, Edmonton, Alberta, Canada; yInstitute for Advanced Studies in Basic Sciences,Zanjan, Iran; zDepartment of Molecular, Cellular and Developmental Biology, University of California, Santa Barbara, California;§Institute of Theoretical Physics, J. Liebig Universitaet Giessen, Giessen, Germany; and {Department of Biochemistry,University of Texas Health Science Center, San Antonio, Texas
ABSTRACT Numerous isotypes of the structural protein tubulin have now been characterized in various organisms and theirexpression offers a plausible explanation for observed differences affecting microtubule function in vivo. While this is an attractivehypothesis, there are only a handful of studies demonstrating a direct influence of tubulin isotype composition on the dynamicproperties of microtubules. Here, we present the results of experimental assays on the assembly of microtubules from bovinebrain tubulin using purified isotypes at various controlled relative concentrations. A novel data analysis is developed usingrecursive maps which are shown to be related to the master equation formalism. We have found striking similarities between thethree isotypes of bovine tubulin studied in regard to their dynamic instability properties, except for subtle differences in theircatastrophe frequencies. When mixtures of tubulin isotypes are analyzed, their nonlinear concentration dependence is modeledand interpreted in terms of lower affinities of tubulin dimers belonging to the same isotype than those that represent differentisotypes indicating hitherto unsuspected influences of tubulin dimers on each other within a microtubule. Finally, we investigatethe fluctuations in microtubule assembly and disassembly rates and conclude that the inherent rate variability may signifydifferences in the guanosine-59-triphosphate composition of the growing and shortening microtubule tips. It is the main objectiveof this article to develop a quantitative model of tubulin polymerization for individual isotypes and their mixtures. The possiblebiological significance of the observed differences is addressed.
INTRODUCTION
Microtubules (MTs) are long and relatively rigid hollow
protein cylinders that constitute a major component of the
cytoskeleton within eukaryotic cells (1). MTs are responsible
for several fundamental cellular processes, such as intracel-
lular trafficking, cellular morphogenesis, and cell division. It
has also been hypothesized that MTs may be responsible for
transferring energy across the cell, with little energy dissi-
pation (2).
MTs are assembled by aggregation of a- and b-tubulin
heterodimers in the presence of guanosine-59-triphosphate
(GTP) and magnesium. The irregularity of growing and
shortening patterns observed experimentally in MTs may, at
first, suggest a very complicated set of processes. In most of
the biophysical literature on this topic, two main modes of
behavior have been identified and termed: growing and
shortening. The implication also made in this context is that
these are two distinct dynamical events that somehow com-
pete for the system’s involvement. Individual MTs fluctuate
stochastically between assembly and disassembly (growing
and shortening) phases, in a nonequilibrium process referred
to as dynamic instability (3,4). In vitro, only tubulin dimers that
are bound to two GTP molecules are assembly-competent; one
GTP molecule is bound nonexchangeably to a-tubulin and
the other GTP is bound exchangeably to b-tubulin (5).
However, upon binding, the exchangeably-bound GTP is
rapidly hydrolyzed to guanosine diphosphate (GDP), with the
exception of the so-called GTP (or lateral) cap that consists
perhaps of only the top layer or two of tubulin dimers (5). It has
been speculated that the hydrolysis of GTP weakens lateral
and longitudinal tubulin interactions, thereby producing con-
ditions suitable for disassembly. In general, one can summa-
rize MT assembly and disassembly as comprised of the key
governing reactions,
1. Generating tubulin-GTP (assembly-competent) (TGTP)
from tubulin GDP (assembly incompetent) (TGDP): D1 1
TGDP/ TGTP,
2. Growing of a microtubule: D2 1 TGTP 1 MT(n) /MT(n 1 1),
3. Shortening of a microtubule: MT(n) / MT(n 1 1) 1 D3 1
TGTP,
where MT(n) is a microtubule with n tubulin dimers, and
D1 � 0.0069 kcal/mol, D2 � 0.0017 kcal/mol, and D3 �0.0017 kcal/mol are the corresponding free energy values
given by Caplow et al. (6). The standard designation used in
the literature is to refer to the change from a growing phase to
a shortening phase as a catastrophe and to its mirror image,
i.e., from a shortening phase to a growing phase as a rescue.
We note that due to the conversion of tubulin GTP to tubulin
GDP after binding to the MT, we did not consider the loss of
tubulin GTP as a fundamental process although it most
certainly is an intermediate step leading to disassembly. It is
also noteworthy that the conformation of growing MTs
doi: 10.1529/biophysj.108.132233
Submitted February 25, 2008, and accepted for publication April 22, 2008.
Address reprint requests to Jack A. Tuszynski, E-mail: [email protected].
ca.
Editor: Susan P. Gilbert.
� 2008 by the Biophysical Society
0006-3495/08/08/1993/16 $2.00
Biophysical Journal Volume 95 August 2008 1993–2008 1993
(mainly straight protofilaments) differs from that of shorten-
ing ones (with their characteristic curved protofilaments
sometimes called the ram’s horns) (7,8). This could indicate
that polymerization involves the formation of axial interac-
tions while depolymerization consists of breaking lateral
bonds already weakened by GTP hydrolysis.
Electron microscopy demonstrated the existence of several
stages in the development of a microtubule. An initial nu-
cleation stage from seed oligomers (typically consisting of
g-tubulin in cells) tends to occur slowly reaching an asymp-
totic density of MT ends after ;1 h (9). This is followed by
an almost continuous growth process that is stochastically
interrupted by sudden and catastrophic disassembly that can
be followed by a growth stage (5,10,11). The average number
of nucleated MTs is a nonlinear function of tubulin concen-
tration that increases rapidly above a threshold concentration
value. The pattern of growing and shortening is repeated
over and over again but seemingly exhibits little regularity.
Although it is clear that the dynamic properties of MTs play a
significant role in the cell (12,13), little is still known about
how their growth is regulated.
Most eukaryotic organisms have multiple genes that en-
code distinct isoforms or isotypes of a- and b-tubulin. In
humans, several isotypes have been identified and charac-
terized (14–16). At the molecular level, the roles and inter-
actions of tubulin are complex and differ between isotypes.
For instance, MT dynamics appear to change significantly
with b-tubulin isotype composition and MTs constructed
from isotypically unfractionated tubulin (IUT) or from pu-
rified abII and abIV isotypes are significantly less dynamic
than MTs assembled from the abIII isotype (14). The avail-
ability of high quality structural data for tubulin enabled us,
previously, to create comparative models of all currently
known a- and b-tubulin isotypes (17). From these results, we
have selected, for comparison, the three human b-tubulin
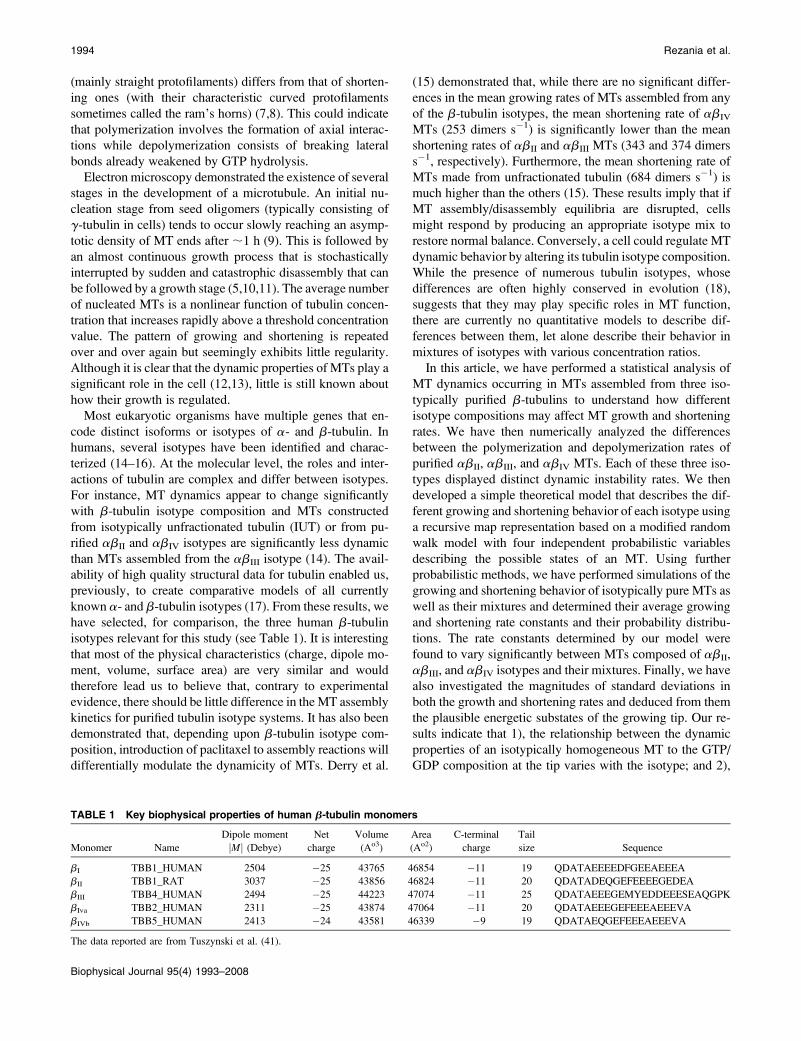
isotypes relevant for this study (see Table 1). It is interesting
that most of the physical characteristics (charge, dipole mo-
ment, volume, surface area) are very similar and would
therefore lead us to believe that, contrary to experimental
evidence, there should be little difference in the MT assembly
kinetics for purified tubulin isotype systems. It has also been
demonstrated that, depending upon b-tubulin isotype com-
position, introduction of paclitaxel to assembly reactions will
differentially modulate the dynamicity of MTs. Derry et al.
(15) demonstrated that, while there are no significant differ-
ences in the mean growing rates of MTs assembled from any
of the b-tubulin isotypes, the mean shortening rate of abIV
MTs (253 dimers s�1) is significantly lower than the mean
shortening rates of abII and abIII MTs (343 and 374 dimers
s�1, respectively). Furthermore, the mean shortening rate of
MTs made from unfractionated tubulin (684 dimers s�1) is
much higher than the others (15). These results imply that if
MT assembly/disassembly equilibria are disrupted, cells
might respond by producing an appropriate isotype mix to
restore normal balance. Conversely, a cell could regulate MT
dynamic behavior by altering its tubulin isotype composition.
While the presence of numerous tubulin isotypes, whose
differences are often highly conserved in evolution (18),
suggests that they may play specific roles in MT function,
there are currently no quantitative models to describe dif-
ferences between them, let alone describe their behavior in
mixtures of isotypes with various concentration ratios.
In this article, we have performed a statistical analysis of
MT dynamics occurring in MTs assembled from three iso-
typically purified b-tubulins to understand how different
isotype compositions may affect MT growth and shortening
rates. We have then numerically analyzed the differences
between the polymerization and depolymerization rates of
purified abII, abIII, and abIV MTs. Each of these three iso-
types displayed distinct dynamic instability rates. We then
developed a simple theoretical model that describes the dif-
ferent growing and shortening behavior of each isotype using
a recursive map representation based on a modified random
walk model with four independent probabilistic variables
describing the possible states of an MT. Using further
probabilistic methods, we have performed simulations of the
growing and shortening behavior of isotypically pure MTs as
well as their mixtures and determined their average growing
and shortening rate constants and their probability distribu-
tions. The rate constants determined by our model were
found to vary significantly between MTs composed of abII,
abIII, and abIV isotypes and their mixtures. Finally, we have
also investigated the magnitudes of standard deviations in
both the growth and shortening rates and deduced from them
the plausible energetic substates of the growing tip. Our re-
sults indicate that 1), the relationship between the dynamic
properties of an isotypically homogeneous MT to the GTP/
GDP composition at the tip varies with the isotype; and 2),
TABLE 1 Key biophysical properties of human b-tubulin monomers
Monomer Name
Dipole moment
jMj (Debye)
Net
charge
Volume
(Ao3)
Area
(Ao2)
C-terminal
charge
Tail
size Sequence
bI TBB1_HUMAN 2504 �25 43765 46854 �11 19 QDATAEEEEDFGEEAEEEA
bII TBB1_RAT 3037 �25 43856 46824 �11 20 QDATADEQGEFEEEEGEDEA
bIII TBB4_HUMAN 2494 �25 44223 47074 �11 25 QDATAEEEGEMYEDDEEESEAQGPK
bIva TBB2_HUMAN 2311 �25 43874 47064 �11 20 QDATAEEEGEFEEEAEEEVA
bIVb TBB5_HUMAN 2413 �24 43581 46339 �9 19 QDATAEQGEFEEEAEEEVA
The data reported are from Tuszynski et al. (41).
1994 Rezania et al.
Biophysical Journal 95(4) 1993–2008
the dynamic behavior of MTs made of mixtures of isotypes
is dependent on specific and hitherto unsuspected isotype-
isotype interactions leading to clustering effects.
MATERIALS AND METHODS
Data collection
Data in this article have come from three sources. Two independent sets of
data were gathered by digitizing the results published earlier by Panda et al.
(14) and Derry et al. (15). The data obtained by Panda et al. presented the
time variation in the length of four individual MTs made from purified abII,
abIII, or abIV isotypes. Derry et al. (15) reported the time variation in the
length of five individual MTs composed from abII, abIII, and abIV isotypes
or isotypically unfractioned tubulin. Since the original data presented by
Panda et al. (14) and Derry et al. (15) were collected at 2–6 s intervals, the
digitized data were collected every 4.2 s. The data were digitized using
VistaMetrix (http://www.skillcrest.com/), and sampled into ;200 data points
for each trace.
The third source was unpublished results of experiments on MTs (com-
posed of purified abII and abIII isotypes from bovine brain tubulin) per-
formed by O. Azarenko, L. Wilson, and M. A. Jordan at the University of
California, Santa Barbara. The data acquisition methodology is as follows
(see (19) for more detail):
Purification of microtubule protein and tubulin
Microtubule protein preparations consisting of 70% tubulin and 30% MAPs
were isolated from bovine brain by three cycles of polymerization and de-
polymerization. Tubulin was purified from the microtubule protein by
phosphocellulose chromatography, drop-frozen in liquid nitrogen, and stored
at 70�C (20). On the day of use, the tubulin was thawed on ice and then
centrifuged (17,000 3 g; 20 min; 4�C) to remove aggregated or denatured
tubulin. Protein concentration was determined by the Bradford assay using
bovine serum albumin as the standard. The isotypically pure tubulin dimers
abII, abIII, and abIV, were prepared from bovine brain tubulin by immu-
noaffinity chromatography using monoclonal antibodies to bII, bIII, and bIV as
previously described (21).
Video microscopy
Purified bovine brain tubulin (15–16 mM) was mixed with sea urchin fla-
gellar axoneme seeds (;1 3 104 seeds/mL) and polymerized in PMME
buffer (86 mM PIPES, 36 mM MES, 1 mM EGTA, and 1.4 mM MgSO4, pH
6.8) containing 1 mM GTP for 25–30 min at 37�C. After assembly to poly-
mer mass steady state (;25 min), a 2–3 ml sample was placed between two
coverslips and mounted on a prewarmed glass microscope slide. The
growing and shortening dynamics of individual MTs at their plus-ends were
recorded at 37�C by differential interference contrast video microscopy. Data
points representing MT lengths were collected at 2–6 s intervals. MT lengths
were analyzed using the Real Time Measurement program, Ver. 5.0 (a kind
gift of Neal Gliksman and E. D. Salmon, University of North Carolina,
Chapel Hill, NC). Growing and shortening rates were calculated by least-
squares regression analysis of the data points for each phase of growth or
shortening. A microtubule was considered to be in a growth phase if its
length increased by .0.2 mm at a rate of .0.15 mm/min and in a shortening
phase if its length decreased by .0.2 mm at a rate of .0.3 mm/min. Length
changes #0.2 mm over the duration of six data points were considered at-
tenuation phases (phases in which length changes were below the resolution
of the microscope). It should be noted that the experimental detection limit
for length changes corresponds to ;400–800 tubulin dimers, which is sig-
nificant for model development and data interpretation.
The supplied data (O. Azarenko, L. Wilson, and M. A. Jordan, unpub-
lished), however, was in the form of a hard copy and we needed to digitize
them for our analysis. First the graphs were scanned and then digitized using
the software DigitizeIt (http://www.digitizeit.de/). For each graph, we man-
ually set the scale for x and y axes, clicked on each point, and then exported
the data into a comma-separated ASCII text file. We digitized over 30 plots of
abII and over 35 graphs of abIII. The mean and standard deviation analyses
are reported in Table 2.
Recursive map model
To provide a simple yet accurate and powerful analysis of the MT assembly
data, we use an approach based mainly on recursive maps for the data points,
as opposed to the customary representation in the form of a time series, which
are typically quite noisy. Appendix A demonstrates how this basic model is
directly linked to a more sophisticated but also more complicated master
equation representation of the same process. (See Eq. 14 as an example.) The
obvious advantage of the recursive maps is the introduction of regularity into
the data sets that allows for a better choice of adjustable parameters due to
noise reduction inherent in the separation of data into subsets corresponding
to independent processes. The second advantage is the simplicity of the
mathematical formulas used in simulations. The model presented here pos-
sesses sufficient flexibility and can be easily extended to capture a number of
subtle features such as: 1), rescue and catastrophe events; 2), nonlinearity
effects in the growth process; 3), saturation of growth; and 4), the presence of
the attenuation states in both growing and shortening phases that is discussed
mathematically in Appendix B. Despite being very simple, recursive map
simulations of assembly and disassembly processes of individual MTs pre-
sented in this article can successfully reproduce many of the key character-
istic features of the experimental data available. Consider first the following
stochastic map as the simplest case that illustrates the approach taken,
‘ðtn11Þ ¼ rð‘ðtnÞ1 aÞ; (1)
where ‘(tn) is the length of a microtubule after n time steps. The difference
between the above equation and a deterministic map is that r is chosen to be a
random number with the following two possibilities:
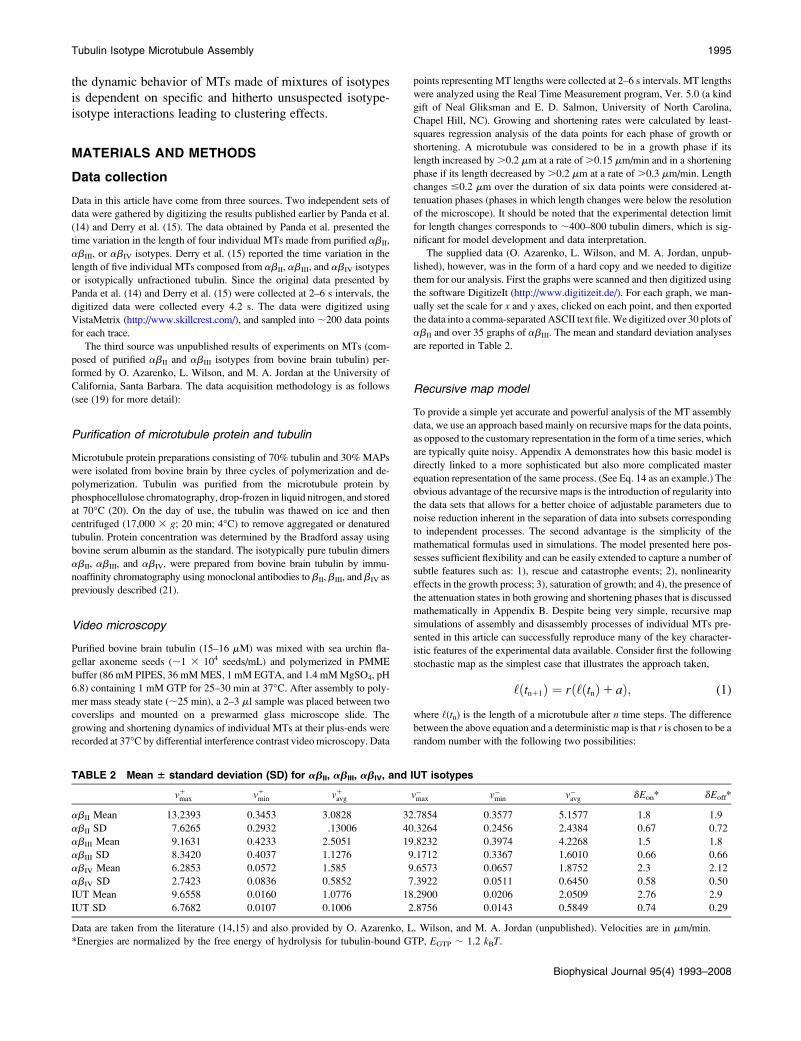
TABLE 2 Mean 6 standard deviation (SD) for abII, abIII, abIV, and IUT isotypes
v1max v1
min v1avg v�max v�min v�avg dEon* dEoff*
abII Mean 13.2393 0.3453 3.0828 32.7854 0.3577 5.1577 1.8 1.9
abII SD 7.6265 0.2932 .13006 40.3264 0.2456 2.4384 0.67 0.72
abIII Mean 9.1631 0.4233 2.5051 19.8232 0.3974 4.2268 1.5 1.8
abIII SD 8.3420 0.4037 1.1276 9.1712 0.3367 1.6010 0.66 0.66
abIV Mean 6.2853 0.0572 1.585 9.6573 0.0657 1.8752 2.3 2.12
abIV SD 2.7423 0.0836 0.5852 7.3922 0.0511 0.6450 0.58 0.50
IUT Mean 9.6558 0.0160 1.0776 18.2900 0.0206 2.0509 2.76 2.9
IUT SD 6.7682 0.0107 0.1006 2.8756 0.0143 0.5849 0.74 0.29
Data are taken from the literature (14,15) and also provided by O. Azarenko, L. Wilson, and M. A. Jordan (unpublished). Velocities are in mm/min.
*Energies are normalized by the free energy of hydrolysis for tubulin-bound GTP, EGTP ; 1.2 kBT.
Tubulin Isotype Microtubule Assembly 1995
Biophysical Journal 95(4) 1993–2008
r ¼ 1 with probability p
r ¼ 0 with probability 1� p:(2)
In terms of the MT polymerization process, p is the probability that a given
event will result in assembly, and 1�p is the probability of a complete
catastrophe of the MT structure. The above simplified model, therefore, is
governed by only two adjustable parameters: the probability of complete
catastrophe 1�p which is constant and independent of the length or time
elapsed; and the rate of polymerization which is proportional to the length
increment a over the unit of time chosen in the simulation. Thus, the
coefficient a divided by the time step Dt (¼ tn11 � tn) gives the average
growth velocity of an individual MT.
In the general case, however, this overly simplistic model requires the
probabilities for at least three elementary events that take place stochasti-
cally:
1. Catastrophe (with rate fcat) MTðnÞ$catastrophe
rescueMTðn� mÞ1 mT;
2. Rescue (with rate fres),
3. Attenuation MT(n) / MT(n),
where T represents a tubulin dimer. It is noteworthy that the identification of
the attenuation state depends on both temporal and spatial resolutions in
measuring the MT length. Here, the spatial resolution is ;400–800 tubulin
dimers (;200–400 nm) for the data measured by O. Azarenko, L. Wilson,
and M. A. Jordan (unpublished). However, recently Schek et al. (21)
performed a series of experiments with a much higher spatial resolution of
;5–10 nm (;10–20 tubulin dimers). In this study, Schek et al. (21) found
that the length of an MT continuously undergoes growing and shortening
phases with no attenuation (or no apparent pause) observed.
As expected, the mean growth rates increase linearly with the concen-
tration of tubulin (slope ¼ kg ¼ 0.17 6 0.02 mm/min/mM (4.6 6 0.5 sub-
units/(s/mM)) and the intercept k�g ¼ 0.86 6 0.53 mm/min (23 6 14
subunits/s)). Thus, the growth rate can be defined as
Ærgæ ¼ kg½Tb� � k�g; (3)
where [Tb] is the molar concentration of the tubulin dimer, kg is the second
order (more precisely: pseudo-first-order) rate constant for the addition of
subunits to the (1) ends, and k�g is the first-order (pseudo-zero-order) rate
constant for loss of subunits from the (1) ends during the growth phase of
MT dynamics.
RESULTS
As stated above, instead of the usual time series representa-
tion, we have used a recursive map analysis to conform to the
model proposed above. Plotting ‘(tn11) versus ‘(tn) leads to
the emergence of several straight lines on the return map
diagram for the abII, abIII, and abIV isotypes, and IUT (see
Fig. 4). These straight lines neatly separate various distinct
processes taking place over the course of an experiment (e.g.,
polymerization, catastrophes, rescues, and the attenuation
states). All different data sets exhibit subsets of points char-
acterized by slopes whose values are very close to 1.0 indi-
cating that the growth rates are essentially identical for all the
isotypes. However, the isotypes differ in their catastrophe
frequency and hence, in their overall dynamicity. In short, the
general solution of Eq. 1 can be found as
‘ðtnÞ ¼ r0 rn1 ra=ð1� rÞ;
where r0 is a constant that is determined by the initial con-
ditions. The data were also analyzed to find the maximum,
minimum, and mean growth/shortening rates for the purified
abII, abIII, and abIV isotypes by finding the average time
interval of the corresponding time series. For completeness,
the probability distributions for growing and shortening of
MTs made from different tubulin isotypes are also presented
(see Fig. 3). A note of caution should be made that the
different experimental preparations used by us in the analysis
lead to significant parameter variations and hence cloud the
issue of the absolute values of the model parameters for the
individual isotypes. This requires more work to be done in
the future on standardization of these data sets. However, it
appears that the overall direction of the reported trends is
largely reproducible, i.e., abIII is generally more dynamic
than abII in almost all preparations. Nonetheless, this issue,
while not central to the article’s key claims, certainly de-
serves special attention. We discuss the results of our data
analysis in more detail in the subsection that follows.
Microtubule assembly data for tubulin isotypes
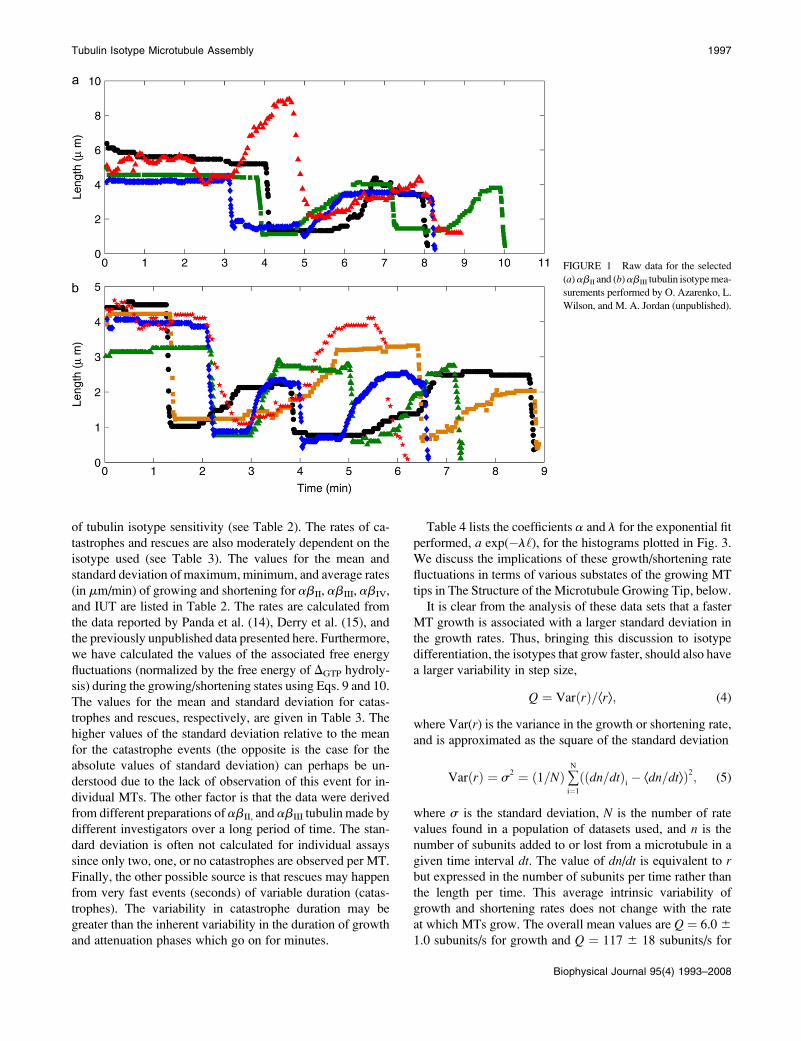
Fig. 1 represents the variation of the length of a microtubule
as a function of time for the abII (Fig. 1 a) and abIII (Fig. 1 b)
isotypes. These data were collected from O. Azarenko, L.
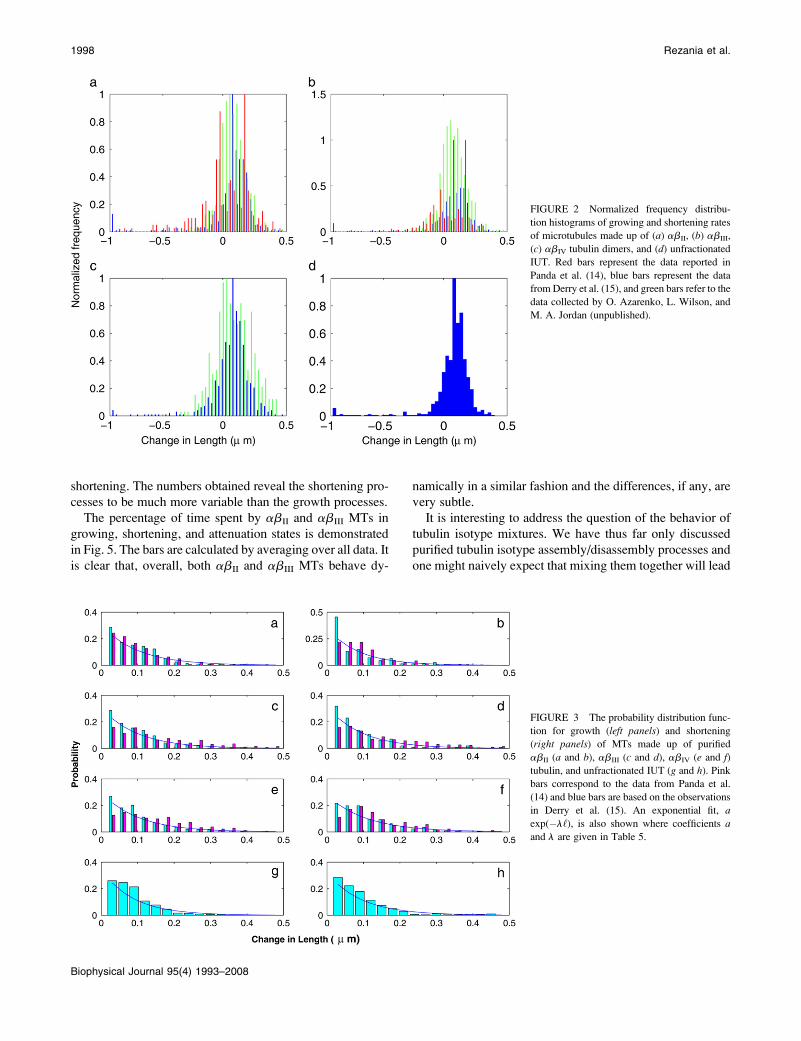
Wilson, and M. A. Jordan (unpublished). In Fig. 2, we plot
the normalized frequency distribution of growing and short-
ening rates of MTs made from abII (Fig. 2 a), abIII (Fig. 2 b),
abIV (Fig. 2 c), and unfractionated IUT (Fig. 2 d) based on
data reported by Panda et al. (14) (red bars), Derry et al. (15)
(blue bars), and collected here (green bars). As can be readily
seen, the occurrence of the growing/shortening processes as a
function of the growing/shortening step size for all tubulin
isotypes approximates a normal distribution. The shorter the
step size, the higher the probability of the growing/shortening
events. This feature can also be seen in Fig. 3 that demon-
strates the probability distribution for growing (left panels)
and shortening (right panels) of MTs made from purified
abII (Fig. 3, a and b), abIII (Fig. 3, c and d), abIV (Fig. 3, eand f) tubulin, and unfractionated IUT (Fig. 3, g and h), based
on the experimental data published in Panda et al. (14) (pinkbars) and Derry et al. (15) (blue bars), respectively. Again
the occurrence of a growing/shortening process exhibits a
higher probability at a smaller step size and decays more or
less exponentially by increasing the step size.
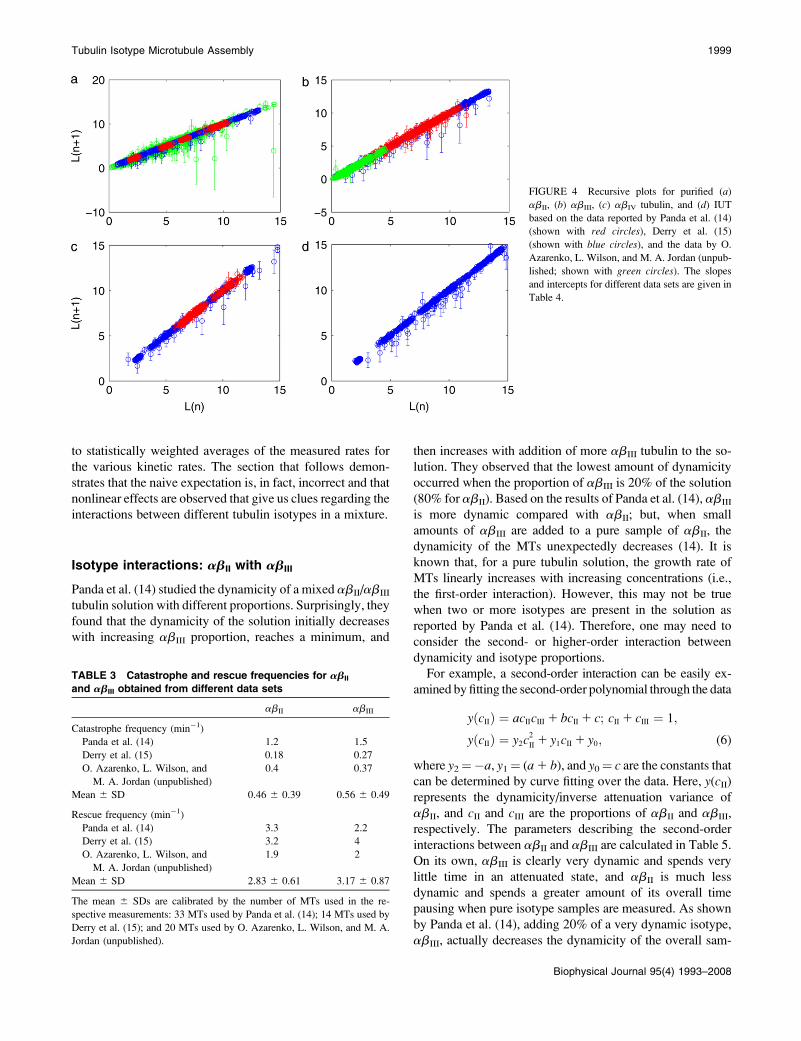
The cumulative recursive maps for the abII, abIII, and
abIV isotypes and IUT based on all the data points (growth,
attenuation, and shortening) reported in the literature (14,15)
and the data of O. Azarenko, L. Wilson, and M. A. Jordan
(unpublished) are presented in Fig. 4. The regression analysis
of these maps in Fig. 4 for abII, abIII, abIV, and IUT dem-
onstrates that all slopes are close to 1 with ;0 intercepts as
might be expected from the model. Interestingly, all the
different data sets for the three tubulin isotypes have similar
slopes and intercepts indicating that the assembly process is
largely insensitive to the isotype of tubulin used. However, as
noted earlier, the shortening events exhibit a moderate level
1996 Rezania et al.
Biophysical Journal 95(4) 1993–2008
of tubulin isotype sensitivity (see Table 2). The rates of ca-
tastrophes and rescues are also moderately dependent on the
isotype used (see Table 3). The values for the mean and
standard deviation of maximum, minimum, and average rates
(in mm/min) of growing and shortening for abII, abIII, abIV,
and IUT are listed in Table 2. The rates are calculated from
the data reported by Panda et al. (14), Derry et al. (15), and
the previously unpublished data presented here. Furthermore,
we have calculated the values of the associated free energy
fluctuations (normalized by the free energy of DGTP hydroly-
sis) during the growing/shortening states using Eqs. 9 and 10.
The values for the mean and standard deviation for catas-
trophes and rescues, respectively, are given in Table 3. The
higher values of the standard deviation relative to the mean
for the catastrophe events (the opposite is the case for the
absolute values of standard deviation) can perhaps be un-
derstood due to the lack of observation of this event for in-
dividual MTs. The other factor is that the data were derived
from different preparations of abII, and abIII tubulin made by
different investigators over a long period of time. The stan-
dard deviation is often not calculated for individual assays
since only two, one, or no catastrophes are observed per MT.
Finally, the other possible source is that rescues may happen
from very fast events (seconds) of variable duration (catas-
trophes). The variability in catastrophe duration may be
greater than the inherent variability in the duration of growth
and attenuation phases which go on for minutes.
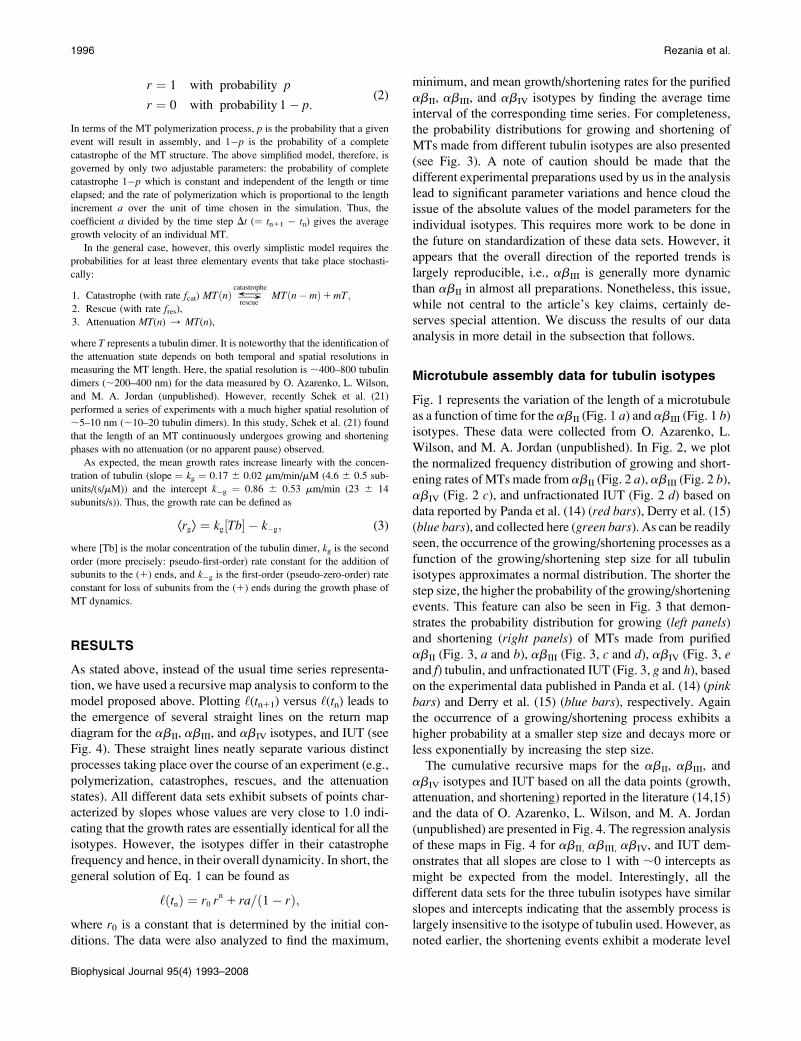
Table 4 lists the coefficients a and l for the exponential fit
performed, a exp(�l‘), for the histograms plotted in Fig. 3.
We discuss the implications of these growth/shortening rate
fluctuations in terms of various substates of the growing MT
tips in The Structure of the Microtubule Growing Tip, below.
It is clear from the analysis of these data sets that a faster
MT growth is associated with a larger standard deviation in
the growth rates. Thus, bringing this discussion to isotype
differentiation, the isotypes that grow faster, should also have
a larger variability in step size,
Q ¼ VarðrÞ=Æræ; (4)
where Var(r) is the variance in the growth or shortening rate,
and is approximated as the square of the standard deviation
VarðrÞ ¼ s2 ¼ ð1=NÞ+
N
i¼1
ððdn=dtÞi � Ædn=dtæÞ2; (5)
where s is the standard deviation, N is the number of rate
values found in a population of datasets used, and n is the
number of subunits added to or lost from a microtubule in a
given time interval dt. The value of dn/dt is equivalent to rbut expressed in the number of subunits per time rather than
the length per time. This average intrinsic variability of
growth and shortening rates does not change with the rate
at which MTs grow. The overall mean values are Q ¼ 6.0 6
1.0 subunits/s for growth and Q ¼ 117 6 18 subunits/s for
FIGURE 1 Raw data for the selected
(a) abII and (b) abIII tubulin isotype mea-
surements performed by O. Azarenko, L.
Wilson, and M. A. Jordan (unpublished).
Tubulin Isotype Microtubule Assembly 1997
Biophysical Journal 95(4) 1993–2008
shortening. The numbers obtained reveal the shortening pro-
cesses to be much more variable than the growth processes.
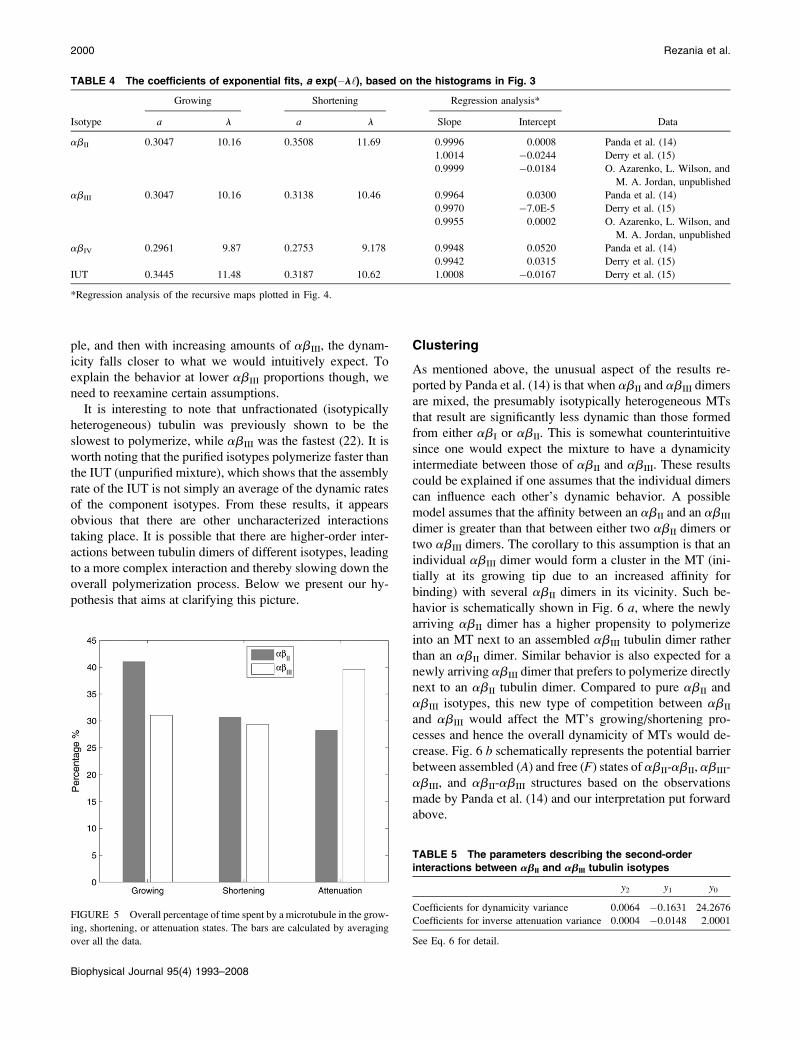
The percentage of time spent by abII and abIII MTs in
growing, shortening, and attenuation states is demonstrated
in Fig. 5. The bars are calculated by averaging over all data. It
is clear that, overall, both abII and abIII MTs behave dy-
namically in a similar fashion and the differences, if any, are
very subtle.
It is interesting to address the question of the behavior of
tubulin isotype mixtures. We have thus far only discussed
purified tubulin isotype assembly/disassembly processes and
one might naively expect that mixing them together will lead
FIGURE 2 Normalized frequency distribu-
tion histograms of growing and shortening rates
of microtubules made up of (a) abII, (b) abIII,
(c) abIV tubulin dimers, and (d) unfractionated
IUT. Red bars represent the data reported in
Panda et al. (14), blue bars represent the data
from Derry et al. (15), and green bars refer to the
data collected by O. Azarenko, L. Wilson, and
M. A. Jordan (unpublished).
FIGURE 3 The probability distribution func-
tion for growth (left panels) and shortening
(right panels) of MTs made up of purified
abII (a and b), abIII (c and d), abIV (e and f)
tubulin, and unfractionated IUT (g and h). Pink
bars correspond to the data from Panda et al.
(14) and blue bars are based on the observations
in Derry et al. (15). An exponential fit, a
exp(�l‘), is also shown where coefficients aand l are given in Table 5.
1998 Rezania et al.
Biophysical Journal 95(4) 1993–2008
to statistically weighted averages of the measured rates for
the various kinetic rates. The section that follows demon-
strates that the naive expectation is, in fact, incorrect and that
nonlinear effects are observed that give us clues regarding the
interactions between different tubulin isotypes in a mixture.
Isotype interactions: abII with abIII
Panda et al. (14) studied the dynamicity of a mixed abII/abIII
tubulin solution with different proportions. Surprisingly, they
found that the dynamicity of the solution initially decreases
with increasing abIII proportion, reaches a minimum, and
then increases with addition of more abIII tubulin to the so-
lution. They observed that the lowest amount of dynamicity
occurred when the proportion of abIII is 20% of the solution
(80% for abII). Based on the results of Panda et al. (14), abIII
is more dynamic compared with abII; but, when small
amounts of abIII are added to a pure sample of abII, the
dynamicity of the MTs unexpectedly decreases (14). It is
known that, for a pure tubulin solution, the growth rate of
MTs linearly increases with increasing concentrations (i.e.,
the first-order interaction). However, this may not be true
when two or more isotypes are present in the solution as
reported by Panda et al. (14). Therefore, one may need to
consider the second- or higher-order interaction between
dynamicity and isotype proportions.
For example, a second-order interaction can be easily ex-
amined by fitting the second-order polynomial through the data
yðcIIÞ ¼ acIIcIII 1 bcII 1 c; cII 1 cIII ¼ 1;
yðcIIÞ ¼ y2c2
II 1 y1cII 1 y0; (6)
where y2¼�a, y1¼ (a 1 b), and y0¼ c are the constants that
can be determined by curve fitting over the data. Here, y(cII)
represents the dynamicity/inverse attenuation variance of
abII, and cII and cIII are the proportions of abII and abIII,
respectively. The parameters describing the second-order
interactions between abII and abIII are calculated in Table 5.
On its own, abIII is clearly very dynamic and spends very
little time in an attenuated state, and abII is much less
dynamic and spends a greater amount of its overall time
pausing when pure isotype samples are measured. As shown
by Panda et al. (14), adding 20% of a very dynamic isotype,
abIII, actually decreases the dynamicity of the overall sam-
FIGURE 4 Recursive plots for purified (a)
abII, (b) abIII, (c) abIV tubulin, and (d) IUT
based on the data reported by Panda et al. (14)
(shown with red circles), Derry et al. (15)
(shown with blue circles), and the data by O.
Azarenko, L. Wilson, and M. A. Jordan (unpub-
lished; shown with green circles). The slopes
and intercepts for different data sets are given in
Table 4.
TABLE 3 Catastrophe and rescue frequencies for abII
and abIII obtained from different data sets
abII abIII
Catastrophe frequency (min�1)
Panda et al. (14) 1.2 1.5
Derry et al. (15) 0.18 0.27
O. Azarenko, L. Wilson, and
M. A. Jordan (unpublished)
0.4 0.37
Mean 6 SD 0.46 6 0.39 0.56 6 0.49
Rescue frequency (min�1)
Panda et al. (14) 3.3 2.2
Derry et al. (15) 3.2 4
O. Azarenko, L. Wilson, and
M. A. Jordan (unpublished)
1.9 2
Mean 6 SD 2.83 6 0.61 3.17 6 0.87
The mean 6 SDs are calibrated by the number of MTs used in the re-
spective measurements: 33 MTs used by Panda et al. (14); 14 MTs used by
Derry et al. (15); and 20 MTs used by O. Azarenko, L. Wilson, and M. A.
Jordan (unpublished).
Tubulin Isotype Microtubule Assembly 1999
Biophysical Journal 95(4) 1993–2008
ple, and then with increasing amounts of abIII, the dynam-
icity falls closer to what we would intuitively expect. To
explain the behavior at lower abIII proportions though, we
need to reexamine certain assumptions.
It is interesting to note that unfractionated (isotypically
heterogeneous) tubulin was previously shown to be the
slowest to polymerize, while abIII was the fastest (22). It is
worth noting that the purified isotypes polymerize faster than
the IUT (unpurified mixture), which shows that the assembly
rate of the IUT is not simply an average of the dynamic rates
of the component isotypes. From these results, it appears
obvious that there are other uncharacterized interactions
taking place. It is possible that there are higher-order inter-
actions between tubulin dimers of different isotypes, leading
to a more complex interaction and thereby slowing down the
overall polymerization process. Below we present our hy-
pothesis that aims at clarifying this picture.
Clustering
As mentioned above, the unusual aspect of the results re-
ported by Panda et al. (14) is that when abII and abIII dimers
are mixed, the presumably isotypically heterogeneous MTs
that result are significantly less dynamic than those formed
from either abI or abII. This is somewhat counterintuitive
since one would expect the mixture to have a dynamicity
intermediate between those of abII and abIII. These results
could be explained if one assumes that the individual dimers
can influence each other’s dynamic behavior. A possible
model assumes that the affinity between an abII and an abIII
dimer is greater than that between either two abII dimers or
two abIII dimers. The corollary to this assumption is that an
individual abIII dimer would form a cluster in the MT (ini-
tially at its growing tip due to an increased affinity for
binding) with several abII dimers in its vicinity. Such be-
havior is schematically shown in Fig. 6 a, where the newly
arriving abII dimer has a higher propensity to polymerize
into an MT next to an assembled abIII tubulin dimer rather
than an abII dimer. Similar behavior is also expected for a
newly arriving abIII dimer that prefers to polymerize directly
next to an abII tubulin dimer. Compared to pure abII and
abIII isotypes, this new type of competition between abII
and abIII would affect the MT’s growing/shortening pro-
cesses and hence the overall dynamicity of MTs would de-
crease. Fig. 6 b schematically represents the potential barrier
between assembled (A) and free (F) states of abII-abII, abIII-
abIII, and abII-abIII structures based on the observations
made by Panda et al. (14) and our interpretation put forward
above.
TABLE 4 The coefficients of exponential fits, a exp(�l‘), based on the histograms in Fig. 3
Growing Shortening Regression analysis*
Isotype a l a l Slope Intercept Data
abII 0.3047 10.16 0.3508 11.69 0.9996 0.0008 Panda et al. (14)
1.0014 �0.0244 Derry et al. (15)
0.9999 �0.0184 O. Azarenko, L. Wilson, and
M. A. Jordan, unpublished
abIII 0.3047 10.16 0.3138 10.46 0.9964 0.0300 Panda et al. (14)
0.9970 �7.0E-5 Derry et al. (15)
0.9955 0.0002 O. Azarenko, L. Wilson, and
M. A. Jordan, unpublished
abIV 0.2961 9.87 0.2753 9.178 0.9948 0.0520 Panda et al. (14)
0.9942 0.0315 Derry et al. (15)
IUT 0.3445 11.48 0.3187 10.62 1.0008 �0.0167 Derry et al. (15)
*Regression analysis of the recursive maps plotted in Fig. 4.
FIGURE 5 Overall percentage of time spent by a microtubule in the grow-
ing, shortening, or attenuation states. The bars are calculated by averaging
over all the data.
TABLE 5 The parameters describing the second-order
interactions between abII and abIII tubulin isotypes
y2 y1 y0
Coefficients for dynamicity variance 0.0064 �0.1631 24.2676
Coefficients for inverse attenuation variance 0.0004 �0.0148 2.0001
See Eq. 6 for detail.
2000 Rezania et al.
Biophysical Journal 95(4) 1993–2008
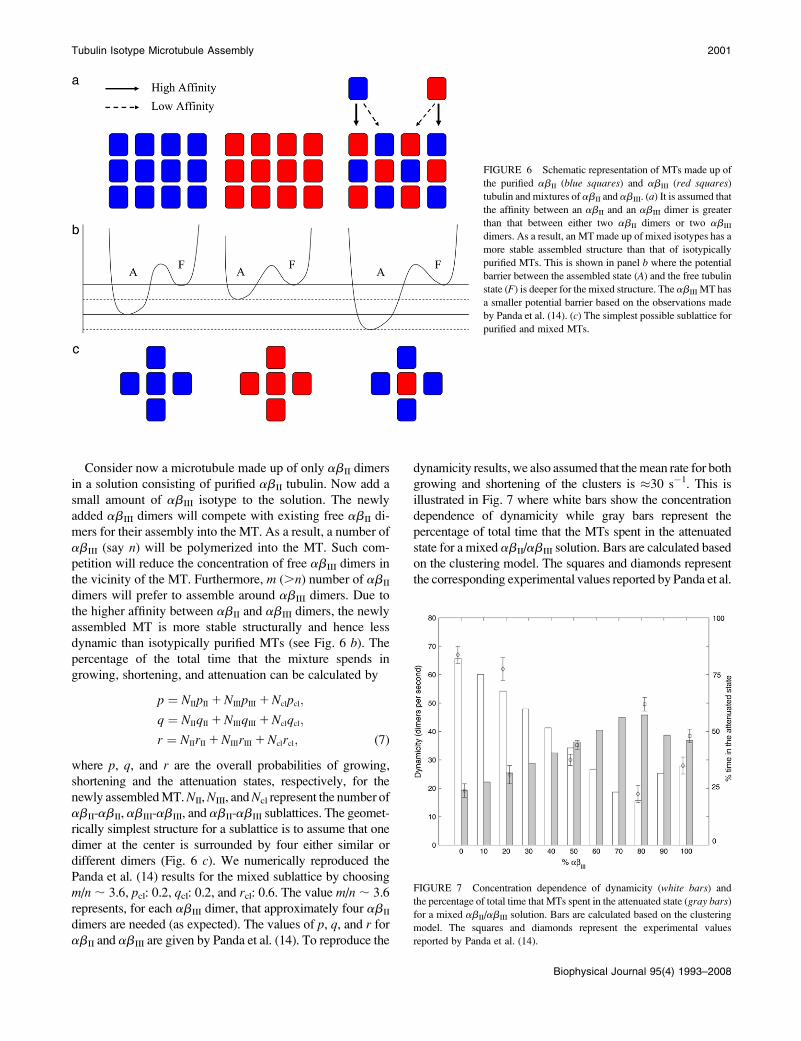
Consider now a microtubule made up of only abII dimers
in a solution consisting of purified abII tubulin. Now add a
small amount of abIII isotype to the solution. The newly
added abIII dimers will compete with existing free abII di-
mers for their assembly into the MT. As a result, a number of
abIII (say n) will be polymerized into the MT. Such com-
petition will reduce the concentration of free abIII dimers in
the vicinity of the MT. Furthermore, m (.n) number of abII
dimers will prefer to assemble around abIII dimers. Due to
the higher affinity between abII and abIII dimers, the newly
assembled MT is more stable structurally and hence less
dynamic than isotypically purified MTs (see Fig. 6 b). The
percentage of the total time that the mixture spends in
growing, shortening, and attenuation can be calculated by
p ¼ NIIpII 1 NIIIpIII 1 Nclpcl;
q ¼ NIIqII 1 NIIIqIII 1 Nclqcl;
r ¼ NIIrII 1 NIIIrIII 1 Nclrcl; (7)
where p, q, and r are the overall probabilities of growing,
shortening and the attenuation states, respectively, for the
newly assembled MT. NII, NIII, and Ncl represent the number of
abII-abII, abIII-abIII, and abII-abIII sublattices. The geomet-
rically simplest structure for a sublattice is to assume that one
dimer at the center is surrounded by four either similar or
different dimers (Fig. 6 c). We numerically reproduced the
Panda et al. (14) results for the mixed sublattice by choosing
m/n ; 3.6, pcl: 0.2, qcl: 0.2, and rcl: 0.6. The value m/n ; 3.6
represents, for each abIII dimer, that approximately four abII
dimers are needed (as expected). The values of p, q, and r for
abII and abIII are given by Panda et al. (14). To reproduce the
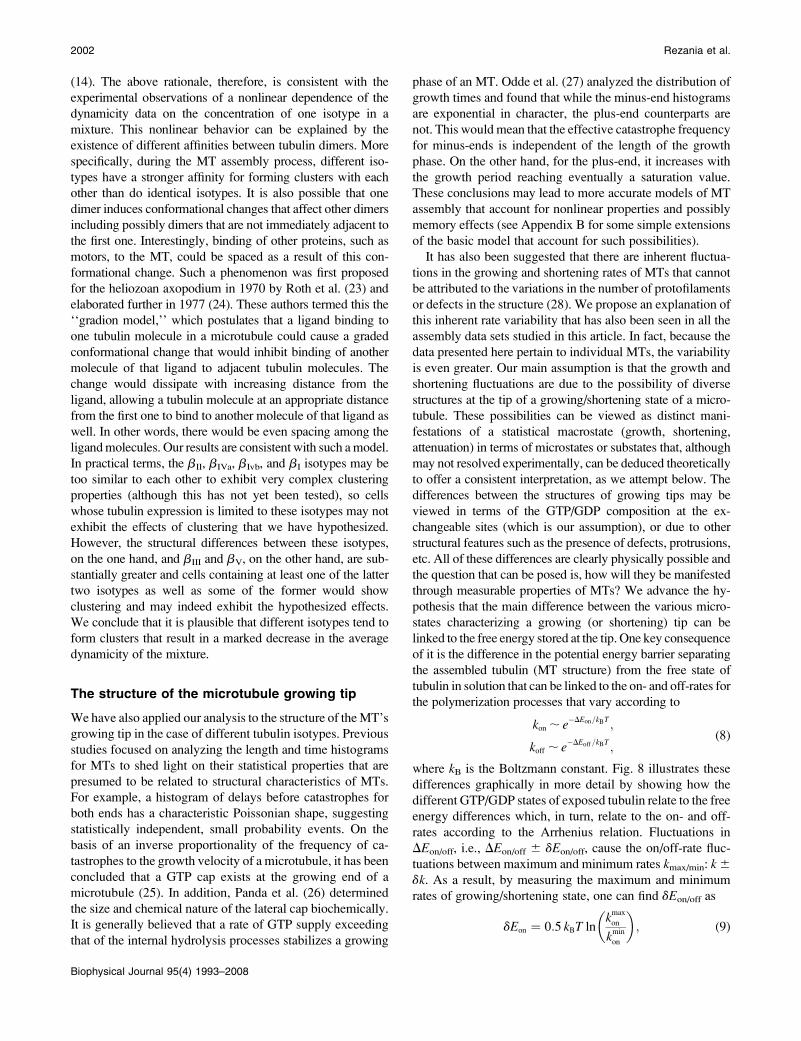
dynamicity results, we also assumed that the mean rate for both
growing and shortening of the clusters is �30 s�1. This is
illustrated in Fig. 7 where white bars show the concentration
dependence of dynamicity while gray bars represent the
percentage of total time that the MTs spent in the attenuated
state for a mixed abII/abIII solution. Bars are calculated based
on the clustering model. The squares and diamonds represent
the corresponding experimental values reported by Panda et al.
FIGURE 6 Schematic representation of MTs made up of
the purified abII (blue squares) and abIII (red squares)
tubulin and mixtures of abII and abIII. (a) It is assumed that
the affinity between an abII and an abIII dimer is greater
than that between either two abII dimers or two abIII
dimers. As a result, an MT made up of mixed isotypes has a
more stable assembled structure than that of isotypically
purified MTs. This is shown in panel b where the potential
barrier between the assembled state (A) and the free tubulin
state (F) is deeper for the mixed structure. The abIII MT has
a smaller potential barrier based on the observations made
by Panda et al. (14). (c) The simplest possible sublattice for
purified and mixed MTs.
FIGURE 7 Concentration dependence of dynamicity (white bars) and
the percentage of total time that MTs spent in the attenuated state (gray bars)
for a mixed abII/abIII solution. Bars are calculated based on the clustering
model. The squares and diamonds represent the experimental values
reported by Panda et al. (14).
Tubulin Isotype Microtubule Assembly 2001
Biophysical Journal 95(4) 1993–2008
(14). The above rationale, therefore, is consistent with the
experimental observations of a nonlinear dependence of the
dynamicity data on the concentration of one isotype in a
mixture. This nonlinear behavior can be explained by the
existence of different affinities between tubulin dimers. More
specifically, during the MT assembly process, different iso-
types have a stronger affinity for forming clusters with each
other than do identical isotypes. It is also possible that one
dimer induces conformational changes that affect other dimers
including possibly dimers that are not immediately adjacent to
the first one. Interestingly, binding of other proteins, such as
motors, to the MT, could be spaced as a result of this con-
formational change. Such a phenomenon was first proposed
for the heliozoan axopodium in 1970 by Roth et al. (23) and
elaborated further in 1977 (24). These authors termed this the
‘‘gradion model,’’ which postulates that a ligand binding to
one tubulin molecule in a microtubule could cause a graded
conformational change that would inhibit binding of another
molecule of that ligand to adjacent tubulin molecules. The
change would dissipate with increasing distance from the
ligand, allowing a tubulin molecule at an appropriate distance
from the first one to bind to another molecule of that ligand as
well. In other words, there would be even spacing among the
ligand molecules. Our results are consistent with such a model.
In practical terms, the bII, bIVa, bIvb, and bI isotypes may be
too similar to each other to exhibit very complex clustering
properties (although this has not yet been tested), so cells
whose tubulin expression is limited to these isotypes may not
exhibit the effects of clustering that we have hypothesized.
However, the structural differences between these isotypes,
on the one hand, and bIII and bV, on the other hand, are sub-
stantially greater and cells containing at least one of the latter
two isotypes as well as some of the former would show
clustering and may indeed exhibit the hypothesized effects.
We conclude that it is plausible that different isotypes tend to
form clusters that result in a marked decrease in the average
dynamicity of the mixture.
The structure of the microtubule growing tip
We have also applied our analysis to the structure of the MT’s
growing tip in the case of different tubulin isotypes. Previous
studies focused on analyzing the length and time histograms
for MTs to shed light on their statistical properties that are
presumed to be related to structural characteristics of MTs.
For example, a histogram of delays before catastrophes for
both ends has a characteristic Poissonian shape, suggesting
statistically independent, small probability events. On the
basis of an inverse proportionality of the frequency of ca-
tastrophes to the growth velocity of a microtubule, it has been
concluded that a GTP cap exists at the growing end of a
microtubule (25). In addition, Panda et al. (26) determined
the size and chemical nature of the lateral cap biochemically.
It is generally believed that a rate of GTP supply exceeding
that of the internal hydrolysis processes stabilizes a growing
phase of an MT. Odde et al. (27) analyzed the distribution of
growth times and found that while the minus-end histograms
are exponential in character, the plus-end counterparts are
not. This would mean that the effective catastrophe frequency
for minus-ends is independent of the length of the growth
phase. On the other hand, for the plus-end, it increases with
the growth period reaching eventually a saturation value.
These conclusions may lead to more accurate models of MT
assembly that account for nonlinear properties and possibly
memory effects (see Appendix B for some simple extensions
of the basic model that account for such possibilities).
It has also been suggested that there are inherent fluctua-
tions in the growing and shortening rates of MTs that cannot
be attributed to the variations in the number of protofilaments
or defects in the structure (28). We propose an explanation of
this inherent rate variability that has also been seen in all the
assembly data sets studied in this article. In fact, because the
data presented here pertain to individual MTs, the variability
is even greater. Our main assumption is that the growth and
shortening fluctuations are due to the possibility of diverse
structures at the tip of a growing/shortening state of a micro-
tubule. These possibilities can be viewed as distinct mani-
festations of a statistical macrostate (growth, shortening,
attenuation) in terms of microstates or substates that, although
may not resolved experimentally, can be deduced theoretically
to offer a consistent interpretation, as we attempt below. The
differences between the structures of growing tips may be
viewed in terms of the GTP/GDP composition at the ex-
changeable sites (which is our assumption), or due to other
structural features such as the presence of defects, protrusions,
etc. All of these differences are clearly physically possible and
the question that can be posed is, how will they be manifested
through measurable properties of MTs? We advance the hy-
pothesis that the main difference between the various micro-
states characterizing a growing (or shortening) tip can be
linked to the free energy stored at the tip. One key consequence
of it is the difference in the potential energy barrier separating
the assembled tubulin (MT structure) from the free state of
tubulin in solution that can be linked to the on- and off-rates for
the polymerization processes that vary according to
kon ; e�DEon=kBT
;
koff ; e�DEoff=kBT
;(8)
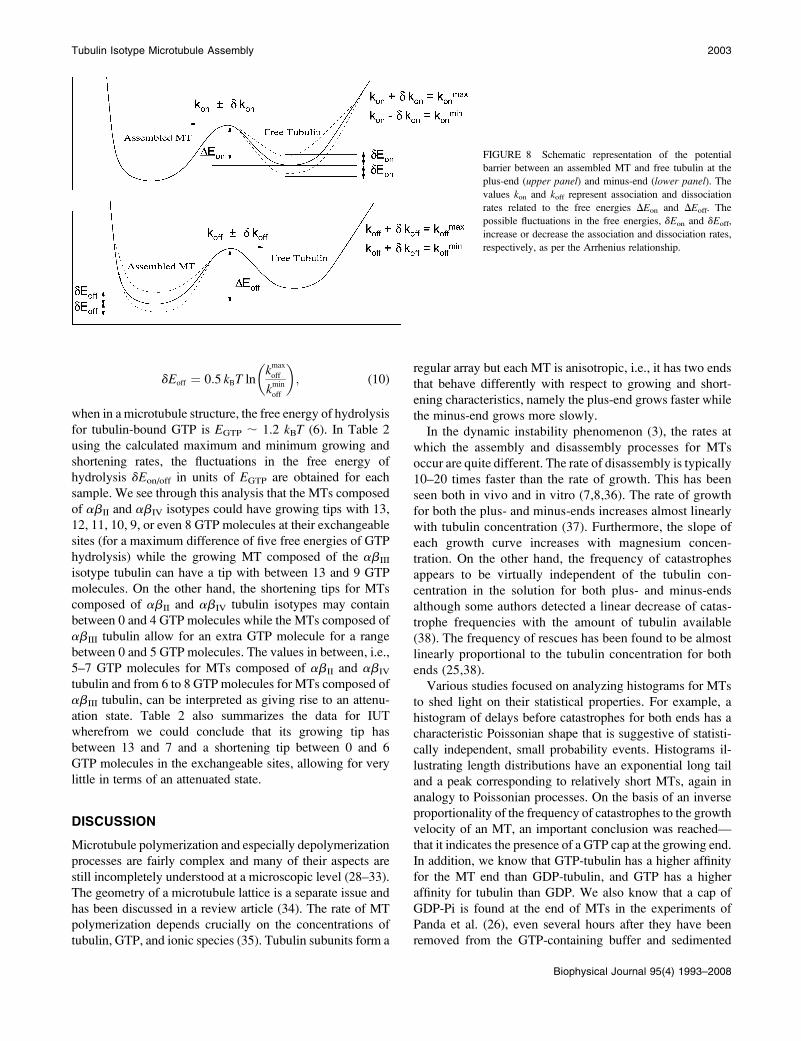
where kB is the Boltzmann constant. Fig. 8 illustrates these
differences graphically in more detail by showing how the
different GTP/GDP states of exposed tubulin relate to the free
energy differences which, in turn, relate to the on- and off-
rates according to the Arrhenius relation. Fluctuations in
DEon/off, i.e., DEon/off 6 dEon/off, cause the on/off-rate fluc-
tuations between maximum and minimum rates kmax/min: k 6
dk. As a result, by measuring the maximum and minimum
rates of growing/shortening state, one can find dEon/off as
dEon ¼ 0:5 kBT lnk
max
on
kmin
on
� �; (9)
2002 Rezania et al.
Biophysical Journal 95(4) 1993–2008
dEoff ¼ 0:5 kBT lnk
max
off
kmin
off
� �; (10)
when in a microtubule structure, the free energy of hydrolysis
for tubulin-bound GTP is EGTP ; 1.2 kBT (6). In Table 2
using the calculated maximum and minimum growing and
shortening rates, the fluctuations in the free energy of
hydrolysis dEon/off in units of EGTP are obtained for each
sample. We see through this analysis that the MTs composed
of abII and abIV isotypes could have growing tips with 13,
12, 11, 10, 9, or even 8 GTP molecules at their exchangeable
sites (for a maximum difference of five free energies of GTP
hydrolysis) while the growing MT composed of the abIII
isotype tubulin can have a tip with between 13 and 9 GTP
molecules. On the other hand, the shortening tips for MTs
composed of abII and abIV tubulin isotypes may contain
between 0 and 4 GTP molecules while the MTs composed of
abIII tubulin allow for an extra GTP molecule for a range
between 0 and 5 GTP molecules. The values in between, i.e.,
5–7 GTP molecules for MTs composed of abII and abIV
tubulin and from 6 to 8 GTP molecules for MTs composed of
abIII tubulin, can be interpreted as giving rise to an attenu-
ation state. Table 2 also summarizes the data for IUT
wherefrom we could conclude that its growing tip has
between 13 and 7 and a shortening tip between 0 and 6
GTP molecules in the exchangeable sites, allowing for very
little in terms of an attenuated state.
DISCUSSION
Microtubule polymerization and especially depolymerization
processes are fairly complex and many of their aspects are
still incompletely understood at a microscopic level (28–33).
The geometry of a microtubule lattice is a separate issue and
has been discussed in a review article (34). The rate of MT
polymerization depends crucially on the concentrations of
tubulin, GTP, and ionic species (35). Tubulin subunits form a
regular array but each MT is anisotropic, i.e., it has two ends
that behave differently with respect to growing and short-
ening characteristics, namely the plus-end grows faster while
the minus-end grows more slowly.
In the dynamic instability phenomenon (3), the rates at
which the assembly and disassembly processes for MTs
occur are quite different. The rate of disassembly is typically
10–20 times faster than the rate of growth. This has been
seen both in vivo and in vitro (7,8,36). The rate of growth
for both the plus- and minus-ends increases almost linearly
with tubulin concentration (37). Furthermore, the slope of
each growth curve increases with magnesium concen-
tration. On the other hand, the frequency of catastrophes
appears to be virtually independent of the tubulin con-
centration in the solution for both plus- and minus-ends
although some authors detected a linear decrease of catas-
trophe frequencies with the amount of tubulin available
(38). The frequency of rescues has been found to be almost
linearly proportional to the tubulin concentration for both
ends (25,38).
Various studies focused on analyzing histograms for MTs
to shed light on their statistical properties. For example, a
histogram of delays before catastrophes for both ends has a
characteristic Poissonian shape that is suggestive of statisti-
cally independent, small probability events. Histograms il-
lustrating length distributions have an exponential long tail
and a peak corresponding to relatively short MTs, again in
analogy to Poissonian processes. On the basis of an inverse
proportionality of the frequency of catastrophes to the growth
velocity of an MT, an important conclusion was reached—
that it indicates the presence of a GTP cap at the growing end.
In addition, we know that GTP-tubulin has a higher affinity
for the MT end than GDP-tubulin, and GTP has a higher
affinity for tubulin than GDP. We also know that a cap of
GDP-Pi is found at the end of MTs in the experiments of
Panda et al. (26), even several hours after they have been
removed from the GTP-containing buffer and sedimented
FIGURE 8 Schematic representation of the potential
barrier between an assembled MT and free tubulin at the
plus-end (upper panel) and minus-end (lower panel). The
values kon and koff represent association and dissociation
rates related to the free energies DEon and DEoff. The
possible fluctuations in the free energies, dEon and dEoff,
increase or decrease the association and dissociation rates,
respectively, as per the Arrhenius relationship.
Tubulin Isotype Microtubule Assembly 2003
Biophysical Journal 95(4) 1993–2008
through a sucrose cushion. Thus, it is not sufficient to con-
clude that the GTP supply exceeding the internal hydrolysis
process stabilizes a growing MT. We must conclude that
there is a persistent biochemical cap.
Odde et al. (27) investigated the validity of the standard
assumption that the growing and shortening of MTs is gov-
erned by first-order chemical kinetics. They analyzed the
distribution of growth times and found that while the minus-
end histograms are exponential in character, the plus-end
counterparts are not. This would mean that the effective ca-
tastrophe frequency for minus-ends is independent of the
length of the growth phase. On the other hand, for the plus-
end, it increases with the growth period reaching eventually a
saturation value. Time series for growing and shortening
MTs may appear to indicate the presence of. an attenuation
state in the midst of both elongation and shortening periods.
However, we feel that it is important to note that attenuation
is not really a distinct state, but rather a period of time during
which we cannot experimentally discern whether a MT is
growing or shortening due to the inadequate resolution of the
method used.
As discussed above, Panda et al. (14) showed experi-
mentally that the dynamics of abIII MTs will change after
adding the abII isotype along with the abIII isotype in the
solution during polymerization. They examined a mixture of
abII and abIII tubulin isotypes at three different ratios: 20:80,
50:50, and 80:20%, respectively. As shown in Fig. 7, the
dynamicity as well as the percent of time spent in the atten-
uation state of the abII and abIII mixture shows a nonlinear
behavior. Here, we fit the observed data with a second-order
function of abII tubulin proportion, cII. The parameters are
listed in Table 5. We explained this nonlinear interaction of
abII and abIII isotypes due to the clustering of the isotypes
together. We showed that a cluster of 3–4 abII tubulin dimers
surrounding one abIII tubulin dimer can describe the ob-
served nonlinear behavior in the MT dynamicity (see Fig. 6
for illustration).
We have seen through the analysis of the data presented in
this article that different tubulin isotypes differ in regard to
their polymerization properties when forming MTs. This is
especially true of catastrophe frequencies. With very little in
terms of biophysical differences between them, as discussed
earlier in the article we wish to compare their structural
properties in more detail, especially in regard to the dimer/
dimer contacts that are presumed to determine the binding
energies within the MT structure and hence its overall sta-
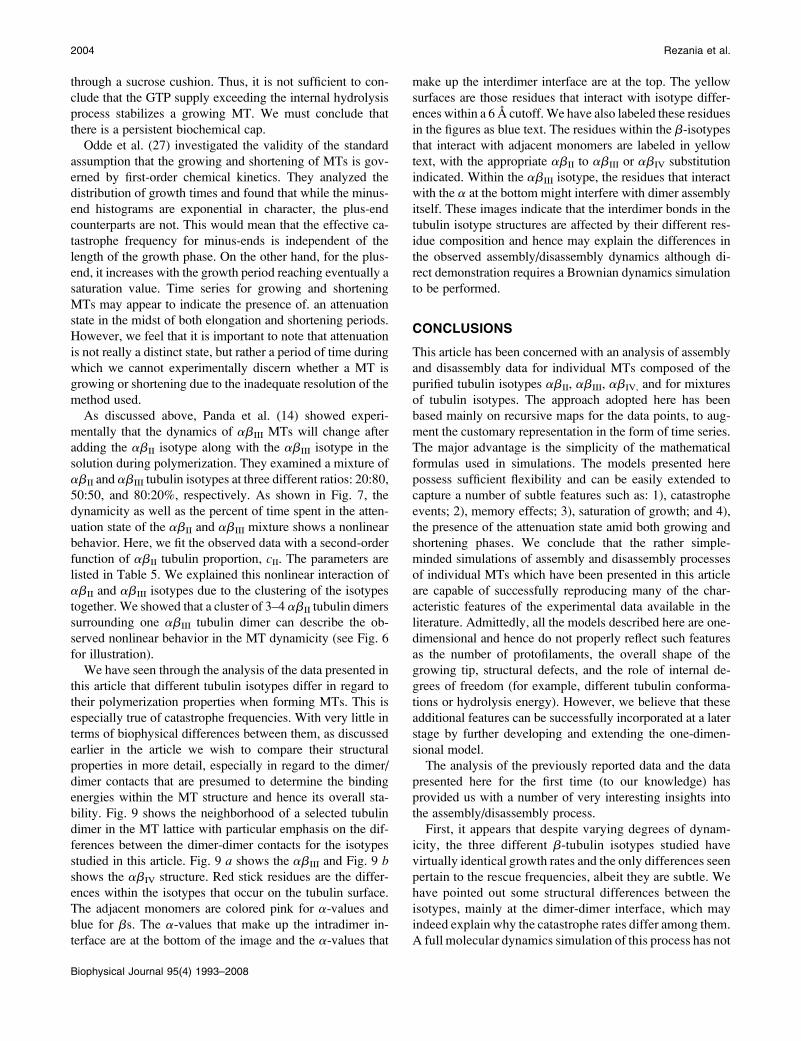
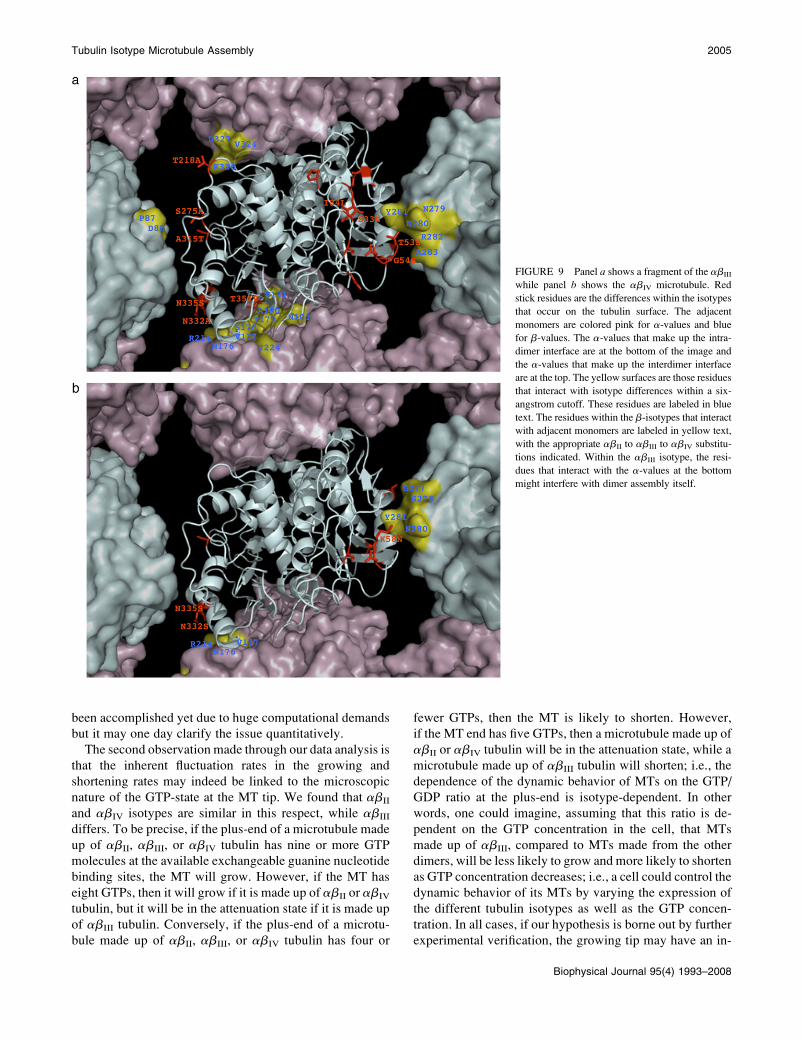
bility. Fig. 9 shows the neighborhood of a selected tubulin
dimer in the MT lattice with particular emphasis on the dif-
ferences between the dimer-dimer contacts for the isotypes
studied in this article. Fig. 9 a shows the abIII and Fig. 9 bshows the abIV structure. Red stick residues are the differ-
ences within the isotypes that occur on the tubulin surface.
The adjacent monomers are colored pink for a-values and
blue for bs. The a-values that make up the intradimer in-
terface are at the bottom of the image and the a-values that
make up the interdimer interface are at the top. The yellow
surfaces are those residues that interact with isotype differ-
ences within a 6 A cutoff. We have also labeled these residues
in the figures as blue text. The residues within the b-isotypes
that interact with adjacent monomers are labeled in yellow
text, with the appropriate abII to abIII or abIV substitution
indicated. Within the abIII isotype, the residues that interact
with the a at the bottom might interfere with dimer assembly
itself. These images indicate that the interdimer bonds in the
tubulin isotype structures are affected by their different res-
idue composition and hence may explain the differences in
the observed assembly/disassembly dynamics although di-
rect demonstration requires a Brownian dynamics simulation
to be performed.
CONCLUSIONS
This article has been concerned with an analysis of assembly
and disassembly data for individual MTs composed of the
purified tubulin isotypes abII, abIII, abIV, and for mixtures
of tubulin isotypes. The approach adopted here has been
based mainly on recursive maps for the data points, to aug-
ment the customary representation in the form of time series.
The major advantage is the simplicity of the mathematical
formulas used in simulations. The models presented here
possess sufficient flexibility and can be easily extended to
capture a number of subtle features such as: 1), catastrophe
events; 2), memory effects; 3), saturation of growth; and 4),
the presence of the attenuation state amid both growing and
shortening phases. We conclude that the rather simple-
minded simulations of assembly and disassembly processes
of individual MTs which have been presented in this article
are capable of successfully reproducing many of the char-
acteristic features of the experimental data available in the
literature. Admittedly, all the models described here are one-
dimensional and hence do not properly reflect such features
as the number of protofilaments, the overall shape of the
growing tip, structural defects, and the role of internal de-
grees of freedom (for example, different tubulin conforma-
tions or hydrolysis energy). However, we believe that these
additional features can be successfully incorporated at a later
stage by further developing and extending the one-dimen-
sional model.
The analysis of the previously reported data and the data
presented here for the first time (to our knowledge) has
provided us with a number of very interesting insights into
the assembly/disassembly process.
First, it appears that despite varying degrees of dynam-
icity, the three different b-tubulin isotypes studied have
virtually identical growth rates and the only differences seen
pertain to the rescue frequencies, albeit they are subtle. We
have pointed out some structural differences between the
isotypes, mainly at the dimer-dimer interface, which may
indeed explain why the catastrophe rates differ among them.
A full molecular dynamics simulation of this process has not
2004 Rezania et al.
Biophysical Journal 95(4) 1993–2008
been accomplished yet due to huge computational demands
but it may one day clarify the issue quantitatively.
The second observation made through our data analysis is
that the inherent fluctuation rates in the growing and
shortening rates may indeed be linked to the microscopic
nature of the GTP-state at the MT tip. We found that abII
and abIV isotypes are similar in this respect, while abIII
differs. To be precise, if the plus-end of a microtubule made
up of abII, abIII, or abIV tubulin has nine or more GTP
molecules at the available exchangeable guanine nucleotide
binding sites, the MT will grow. However, if the MT has
eight GTPs, then it will grow if it is made up of abII or abIV
tubulin, but it will be in the attenuation state if it is made up
of abIII tubulin. Conversely, if the plus-end of a microtu-
bule made up of abII, abIII, or abIV tubulin has four or
fewer GTPs, then the MT is likely to shorten. However,
if the MT end has five GTPs, then a microtubule made up of
abII or abIV tubulin will be in the attenuation state, while a
microtubule made up of abIII tubulin will shorten; i.e., the
dependence of the dynamic behavior of MTs on the GTP/
GDP ratio at the plus-end is isotype-dependent. In other
words, one could imagine, assuming that this ratio is de-
pendent on the GTP concentration in the cell, that MTs
made up of abIII, compared to MTs made from the other
dimers, will be less likely to grow and more likely to shorten
as GTP concentration decreases; i.e., a cell could control the
dynamic behavior of its MTs by varying the expression of
the different tubulin isotypes as well as the GTP concen-
tration. In all cases, if our hypothesis is borne out by further
experimental verification, the growing tip may have an in-
FIGURE 9 Panel a shows a fragment of the abIII
while panel b shows the abIV microtubule. Red
stick residues are the differences within the isotypes
that occur on the tubulin surface. The adjacent
monomers are colored pink for a-values and blue
for b-values. The a-values that make up the intra-
dimer interface are at the bottom of the image and
the a-values that make up the interdimer interface
are at the top. The yellow surfaces are those residues
that interact with isotype differences within a six-
angstrom cutoff. These residues are labeled in blue
text. The residues within the b-isotypes that interact
with adjacent monomers are labeled in yellow text,
with the appropriate abII to abIII to abIV substitu-
tions indicated. Within the abIII isotype, the resi-
dues that interact with the a-values at the bottom
might interfere with dimer assembly itself.
Tubulin Isotype Microtubule Assembly 2005
Biophysical Journal 95(4) 1993–2008

complete number of GTP molecules in the exchangeable
sites of exposed tubulin dimers resulting in the associated
differences in the potential energy barrier and hence dif-
ferent assembly rates. The same can be said about a short-
ening state and the number of GDP molecules occupying the
exchangeable sites.
Third, our results indicate a nonlinear dependence on the
concentration values for the contributing isotypes in MTs
formed from mixtures of tubulin isotypes. We have fitted the
data appropriately and concluded that the most logical ex-
planation of this nonlinear dependence is a differential af-
finity between tubulin dimers coming from different isotype
pools. More specifically, when assembling into a microtu-
bule, identical isotypes have a lesser affinity for forming
clusters with each other than do different isotypes. The
concept of isotype clustering raises the possibility of some
highly subtle and complex regulatory phenomena. For ex-
ample, the fact that a mixture of abII and abIII generates a
microtubule whose dynamic properties are outside of the
range defined by those of the two isotypes individually,
means that the range of dynamic properties available to a cell
is greater than that which would be available if the dynamic
properties of a mixed MT were linearly dependent on the
relative amounts of the two isotypes. One could imagine that
having a wider range of possible MT dynamic behaviors
would be advantageous to the cell.
Also, the observation that one dimer can influence the
dynamic properties of another one (in particular binding to an
MT) is highly intriguing. This raises the possibility that one
dimer can induce conformational changes that affect other
dimers including possibly dimers that are not immediately
adjacent to the first one. Such a phenomenon could have
more implications than just dynamics. For instance, binding
of other proteins, such as motors, to the MT, could be spaced
as a result of this conformational change. Such a phenome-
non was first proposed for the heliozoan axopodium by Roth
et al. (23,24). They postulate that a ligand binding to one
tubulin molecule in a microtubule could cause a graded
conformational change that would inhibit binding of another
molecule of that ligand to adjacent tubulin molecules. The
change would dissipate with increasing distance from the
ligand, allowing a tubulin molecule at an appropriate distance
from the first one to bind to another molecule of that ligand as
well. That is, there would be even spacing among the ligand
molecules. Our results are consistent with such a model. In
practical terms, the bII, bIVa, bIvb, and bI isotypes may be too
similar to each other to exhibit very complex clustering
properties (although this has not yet been tested), so cells
whose tubulin expression is limited to these isotypes may not
exhibit the effects of clustering that we have hypothesized.
However, the differences between these isotypes, and bIII
and bV, are substantially greater and cells containing at least
one of the latter two isotypes, as well as some of the former,
would show clustering and may indeed exhibit the hypoth-
esized effects.
To further test our model, it would be interesting to con-
duct experimental assays with more than two tubulin isotypes
present. To verify the utility of the recursive map approach,
on the other hand, data sets for a single isotype for vastly
different tubulin concentrations should be analyzed as they
may clarify the origin of the various types of nonlinear terms
in the recursive map due to saturation, competition, and nu-
cleation effects.
APPENDIX A: THE BASIC STOCHASTIC MODELFOR MICROTUBULES
It is clear that the behavior of an individual MT is stochastic. Here, following
Bolterauer et al. (39), we briefly review a stochastic model for MTs. In
general, the key reactions of a microtubule during growing/shortening phases
can be summarized as
MðnÞ1 T/Mðn 1 1Þ with probability t1;
MðnÞ/Mðn� 1Þ1 T with probability t2;
MðnÞ/Mðn� mÞ1 mT with probability t3;
MðnÞ/MðnÞ with probability 1� t1 � t2 � t3;
(11)
where M(n) represents a microtubule composed of n tubulin (T) dimers with
length a. As a result, the length of the MT(n) is ‘(t) ¼ na. The third reaction
describes an incomplete catastrophe, i.e., allows for a rescue event to follow.
Here m is a random integer number in the range 0 , m # ‘(t)/a. Note that
m ¼ n means there is no rescue during a catastrophe.
The probabilities ti are just the transition rates tri for a given process
multiplied by the probability of finding the reactant molecules in a given
reaction region, and thus, for a single MT, are given by
t1 ¼ cTtr1;
t2 ¼ tr2;
t3 ¼ tr3; (12)
where ct denotes the concentration of tubulin. The connection between the
transition rates tri and the reaction constants ki is
tri ¼ kiDt; (13)
where Dt is the time step in the simulation. The value r is a random number in
the interval 0 # r # 1. As a result, a stochastic equation that describes the
length evolution ‘(t) as a function of time t for an individual MT can be
written as
‘ðt 1 DtÞ ¼
‘ðtÞ1 a for 0 , r # t1
‘ðtÞ � a for t1 , r # t1 1 t2
‘ðtÞ � ma for t1 1 t2 , r # t1 1 t2 1 t3
‘ðtÞ for t1 1 t2 1 t3 , r # 1
:
8>><>>:
(14)
Equation 14 represents the recursive maps that relate length of MTs at time
t 1 Dt to time t. Estimating various associated averaged quantities for an
ensemble of MTs with different lengths requires a knowledge about the
probability distribution P(n,t) that characterizes the system in a given state nat a time t. To calculate P(n,t), one needs to know the transition probabilities
for the processes leading into the given state n (i.e., rate in), and the processes
leading out of state n and into any other possible state (i.e., rate out).
Furthermore, these probabilities tri are simply proportional to the reaction
rates ki (see Eq. 13). In general, a master equation is written as
2006 Rezania et al.
Biophysical Journal 95(4) 1993–2008
d
dtPðn; tÞ ¼ ðrate inÞ � ðrate outÞ: (15)
For our reaction scheme in Eq. 11, the master equation becomes
d
dtPðn; tÞ ¼ cTtr1Pðn� 1; tÞ1 tr2Pðn 1 1; tÞ
1 tr3 +N
m¼1
wðn;mÞPðn 1 m; tÞ
� ðcTtr1 1 tr2 1 tr3ÞPðn; tÞ (16)
for n . 0. The value w(n,m) is the probability that a collapsing MT of length
n 1 m is rescued at length n. For evenly distributed rescue probability we have
wðn;mÞ ¼ 1
n: (17)
The master equation for n ¼ 0 follows again from Eq. 15, but it also ensures
the time independence of the norm +Nn¼0
Pðn; tÞ ¼ 1 and has the form
d
dtPð0; tÞ ¼ tr2Pð1; tÞ1 tr3 +
N
n¼1
Pðn; tÞ � cTtr1Pð0; tÞ: (18)
Note that collapsing to n¼ 0 state from an n state means that no rescue occurs
in the process. The steady-state equation, that is, (d/dt)P(n,t) ¼ 0, can be
solved with respect to the normalization condition +Nn¼0
Pðn; tÞ ¼ 1: It is
straightforward to take the continuum limit of the master equation. This is
done by expanding the probability P(n 6 1,t) as follows:
Pðn61; tÞ/Pðx; tÞ6 @
@xPðx; tÞ1 1
2
@2
@x2 Pðx; tÞ6 . . . : (19)
Expanding Eq. 16 up to the first-order terms, one finds
@
@tPðx; tÞ ¼ �ðcTtr1 � tr2Þ
@
@xPðx; tÞ � tr3Pðx; tÞ
1 tr3
Z N
x
wðx9ÞPðx9; tÞdx9; (20)
where x is the continuum limit equivalent of n. For evenly distributed rescue
events, i.e., w(x) ¼ 1/x, Eq. 20 has the stationary solution as
PðxÞ: x e� tr3
cT tr1�tr2x; (21)
which is, in fact, a bell-shaped solution. The uniform probability distribution
assumption for rescues is highly limiting and, hence, may result in solutions
that are not appropriate for all experimentally observed situations.
APPENDIX B: EXTENSIONS OF THESTOCHASTIC MODEL
A more detailed description of the models presented below can be found in
Tuszynski et al. (40), where additional numerical examples are shown to help
the reader better understand the concepts proposed. The first natural exten-
sion of the basic model presented in Appendix A introduces incomplete
catastrophes, which means that a given MT may exhibit a rapid shortening to
a fraction of its previous length. One of the simplest iterative maps to reflect
this property is
‘ðn 1 1Þ ¼ rcð‘ðnÞ1 bÞ1 ð1� rÞeð‘ðnÞ1 dÞ: (22)
The first term in the equation above describes growth (for r ¼1) at a rate bc
over the time unit while the second describes shortening (for r ¼ 0) to the
length e ‘(n) with a growth increment d. We assume that b . d and c . e. The
length histogram is not affected by this assumption.
To generate saturation characteristics of the growth phase, a simple
addition is needed in the recursive equation above that will effectively stop
the growth of MTs whose length exceeds a particular upper bound. The first
such possibility makes use of a nonlinear term,
‘ðn 1 1Þ ¼ rcð‘ðnÞ1 bÞ1 ð1� rÞeð‘ðnÞ1 dÞ � f ‘2ðnÞ;
(23)
where f . 0 will ensure saturation (as opposed to an unbounded growth for
f , 0). The second model simply reduces the growth step per time-unit
according to a linear dependence of the used tubulin that is proportional to the
length of the MT itself,
‘ðn 1 1Þ ¼ rð‘ðnÞ1 a� f ‘ðnÞÞ: (24)
Again f . 0 will ensure the emergence of saturation that will lead to a
termination of the MT growth. In the third variant of this model, the reduction
of the growth step per time unit is generated through the introduction of the
attenuation states whose probability is length-dependent. Averaging over a
couple of time steps the growth rate becomes also length-dependent. The
model includes now two random numbers r1 that determine the occurrence of
catastrophes and r2 growth and the attenuation states, respectively. The
number r1 ¼ 1 with probability p1, else 0, and r2 ¼ 1 with probability is
p2½‘ðnÞ� ¼ p2ð0Þðmax� ‘ðnÞÞ=max;
else 0: (25)
In all models of this type the length histogram is only marginally affected.
There is a saturation cutoff for long MTs, but in the short range the
exponential distribution is still correct to a very good approximation.
Another simple extension of the model is capable of capturing the presence
of the attenuation states in the system. We add to the model another random
number such that, in addition to a growth stage (with a probability p1p) and
catastrophe (with a probability q), the attenuation state could take place (with a
probability p2p). With no other processes allowed this implies that
ðp1 1 p2Þp 1 q ¼ p 1 q ¼ 1; (26)
and a simple return map equation can be written in the form
‘ðn 1 1Þ ¼ r1ð‘ðnÞ1 ar2Þ; (27)
where r1 is the first random number (valued 1 for growth for the attenuation
state with a probability p while 0 for a catastrophe with a probability q) and r2
is the second random number (valued 1 for growth with a probability p1 and 0
for the attenuation state with a probability p2). The resultant statistical
description is somewhat more involved compared to the basic model. The
probability of a particular sequence of n1 growth steps and n2 the attenuation
states such that we have n¼ n1 1 n2 time steps before a catastrophe is given by
Pðn1; n2Þ ¼ Aq2pðn11n2Þðn1 1 n2Þ!n1!n2!p
n1
1 pn2
2 : (28)
This yields, by summation over all the possible attenuation states, to the
length distribution of
Pðn1Þ ¼ Aq2ðpp1Þn1 n1! +
N
n2
ðn1 1 n2Þ!n2!ðpp2Þn2 : (29)
The authors thank Dr. Michael Hendzel for his insightful comments and
Ms. Kristy Beinert and Mr. Joe Senez for their assistance in the preliminary
data analysis. The use of the resources of the Laboratory of Dr. Leslie
Wilson at the University of California at Santa Barbara is gratefully
acknowledged.
This research was supported by the Natural Sciences and Engineering
Research Council of Canada, the Allard Foundation, the United States
Tubulin Isotype Microtubule Assembly 2007
Biophysical Journal 95(4) 1993–2008
Army, Canadian Space Agency, and the Alberta Cancer Board, as well as
the following grants to R.F.L.: grant No. W81XWH-05-1-0238 from the
Department of Defense Breast Cancer Research Program, grant No. P30
CA54174 from the San Antonio Cancer Institute, a grant from the Texas
Higher Education Coordinating Board; and to M.A.J., National Institutes of
Health grant No. CA57291.
REFERENCES
1. Dustin, P. 1984. Microtubules, 2nd Ed. Springer, Berlin.
2. Alberts, B., J. Lewis, M. Raff, K. Roberts, and J. D. Watson. 1994.Molecular Biology of the Cell. Garland, New York.
3. Mitchison, T., and M. Krischner. 1984. Microtubule assembly nucle-ated by isolated centrosomes. Nature. 312:232–236.
4. Rezania, V., and J. A. Tuszynski. 2007. From a quantum mechanicaldescription of the assembly processes in microtubules to their semi-classical nonlinear dynamics. Quantum Biosys. 1:1–20.
5. Erickson, H. P., and T. E. O’Brien. 1992. Microtubule dynamic in-stability and GTP hydrolysis. Annu. Rev. Biophys. Biomol. Struct. 21:145–166.
6. Caplow, M., R. L. Ruhlen, and J. Shanks. 1994. The free energy forhydrolysis of a microtubule-bound nucleotide triphosphate is near zero:all of the free energy for hydrolysis is stored in the microtubule lattice.J. Cell Biol. 127:779–788.
7. Mandelkow, E.-M., and E. Mandelkow. 1992. Microtubule oscilla-tions. Cell Motil. Cytoskeleton. 22:235–244.
8. Trinczek, B., A. Marx, E.-M. Mandelkow, B. D. Murphy, and E.Mandelkow. 1993. Dynamics of microtubules from erythrocyte mar-ginal bands. Mol. Biol. Cell. 4:323–335.
9. Fygenson, D. K., H. Flyvbjerg, K. Sneppen, A. Libachaber, and S.Leibler. 1995. Spontaneous nucleation of microtubules. Phys. Rev. E.51:5058–5063.
10. Cassimeris, L., N. K. Pryer, and E. D. Salmon. 1988. Real-timeobservations of microtubule dynamic instability in living cells. J. CellBiol. 107:2223–2231.
11. Drechsel, D. N., A. A. Hyman, M. H. Cobb, and M. W. Kirschner.1992. Modulation of dynamic instability of microtubule assembly bythe microtubule associated protein tau. Mol. Biol. Cell. 3:1141–1154.
12. Wordeman, L., and T. J. Mitchison. 1994. Dynamics of microtubuleassembly in vivo. In Microtubules. C. Lloyd and J. Hyams, editors.Wiley, New York.
13. McIntosh, R. 1994. The role of microtubules in chromosome move-ment. In Microtubules. C. Lloyd and J. Hyams, editors. Wiley, NewYork.
14. Panda, D., H. P. Miller, A. Banerjee, R. F. Luduena, and L. Wilson.1994. Microtubule dynamics in vitro are regulated by the tubulinisotype composition. Cell Biol. 91:11358–11362.
15. Derry, W. B., L. Wilson, I. A. Khan, R. F. Luduena, and M. A. Jordan.1997. Taxol differentially modulates the dynamics of microtubulesassembled from unfractionated and purified b-tubulin isotypes.Biochemistry. 36:3554–3562.
16. Lu, Q., and R. Luduena. 1994. In vitro analysis of microtubule assem-bly of isotypically pure tubulin dimers. Intrinsic differences in theassembly properties of abII, abIII, and abIV tubulin dimers in theabsence of microtubule-associated proteins. J. Biol. Chem. 269:2041–2047.
17. Carpenter, E. J., J. Torin Huzil, R. F. Luduena, and J. A. Tuszynski.2006. Homology modeling of tubulin: influence predictions for micro-tubules biophysical properties. Eur. J. Biophys. 36:35–43.
18. Luduena, R. 1998. Multiple forms of tubulin: different gene productsand covalent modifications. Int. Rev. Cytol. 178:207–275.
19. Ngan, V. K., K. Bellman, D. Panda, B. T. Hill, M. A. Jordan, and L.Wilson. 2000. Novel actions of the antitumor drugs Vinflunine andVinorelbine on microtubules. Cancer Res. 60:5045–5051.
20. Panda, D., H. Miller, and L. Wilson. 1999. Rapid treadmilling of brainmicrotubules free of microtubule-associated proteins in vitro and itssuppression by tau. Proc. Natl. Acad. Sci. USA. 96:12459–12464.
21. Schek, H. T., M. K. Gardner, J. Cheng, D. J. Odde, and A. J. Hunt.2007. Microtubule assembly dynamics at the nanoscale. Curr. Biol. 17:1445–1455.
22. Banerjee, A., M. C. Roach, P. Trcka, and R. F. Luduena. 1992.Preparation of a monoclonal antibody specific for the class IV isotypeof b-tubulin. Purification and assembly of abII, abIII, and abIV tubulindimers from bovine brain. J. Cell Biol. 267:5625–5630.
23. Roth, L. E., D. J. Pihlaja, and Y. Shigenaka. 1970. Microtubules in theheliozoan axopodium. I. The gradion hypothesis of allosterism instructural proteins. J. Ultrastruct. Res. 30:7–37.
24. Roth, L. E., and D. J. Pihlaja. 1977. Gradionation: hypothesis forpositioning and patterning. J. Protozool. 24:2–9.
25. Flyvbjerg, H., T. E. Holy, and S. Leibler. 1996. Microtubule dynamics:caps, catastrophes, and coupled hydrolysis. Phys. Rev. E. 54:5538–5560.
26. Panda, D., H. P. Miller, and L. Wilson. 2002. Determination of the sizeand chemical nature of the stabilizing ‘‘cap’’ at microtubule ends usingmodulators of polymerization dynamics. Biochemistry. 41:1609–1617.
27. Odde, D. J., L. Cassimeris, and H. M. Buettner. 1995. Kinetics ofmicrotubule catastrophe assessed by probabilistic analysis. Biophys. J.69:796–802.
28. Williams, R. 2002. Concentration dependence of variability in growthrate of microtubules. Biophys. J. 83:1809–1819.
29. Janson, M. E., and M. Dogterom. 2004. A bending mode analysis forgrowing microtubules: evidence for a velocity-dependent rigidity.Biophys. J. 87:2723–2736.
30. Hill, T. L., and M. W. Kirschner. 1982. Bioenergetics and kinetics ofmicrotubule and actin filament assembly-disassembly. Int. Rev. Cytol.78:1–125.
31. Bayley, P. M., M. J. Schilstra, and S. R. Martin. 1989. A simpleformulation of microtubule dynamics: quantitative implications of thedynamic instability of microtubule populations in vivo and in vitro.J. Cell Sci. 93:241–254.
32. Bayley, P. M., M. J. Schilstra, and S. R. Martin. 1990. Microtubuledynamic instability: numerical simulation of microtubule transitionproperties using a lateral cap model. J. Cell Sci. 95:33–48.
33. Martin, S. R., M. J. Schilstra, and P. M. Bayley. 1993. Dynamicinstability of microtubules: Monte Carlo simulation and application todifferent types of microtubule lattice. Biophys. J. 65:578–596.
34. Amos, L. A. 1995. The microtubule lattice—20 years on. Trends CellBiol. 5:48–51.
35. Horio, T., and H. Hotani. 1986. Visualization of the dynamic instabilityof individual microtubules by dark-field microscopy. Nature. 321:605–607.
36. Mandelkow, E., and E.-M. Mandelkow. 1994. Microtubule structure.Curr. Opin. Struct. Biol. 4:171–179.
37. Walker, R. A., N. K. Pryer, and E. D. Salmon. 1991. Dilution ofindividual microtubules observed in real time in vitro: evidence thatcap size is small and independent of elongation rate. J. Cell Biol. 114:73–81.
38. Flyvbjerg, H., T. E. Holy, and S. Leibler. 1994. Stochastic dynamics ofmicrotubules: a model for caps and catastrophes. Phys. Rev. Lett. 73:2372.
39. Bolterauer, H., H.-J. Limbach, and J. A. Tuszynski. 1999. Models ofassembly and disassembly of individual microtubules: stochastic andaveraged equations. J. Biol. Phys. 25:1–22.
40. Tuszynski, J. A., D. Sept, H. Bolterauer, and H.-J. Limbach. 1998.Stochastic data analysis for the assembly and disassembly of microtu-bules in vitro. Adv. Structural Biol. 5:169–201.
41. Tuszynski, J. A., E. Carpenter, J. Torin, J. Huzil, W. Malinski, T.Luchko, and R. F. Luduena. 2006. The evolution of the structure oftubulin and its potential consequences for the role and function ofmicrotubules in cells and embryos. Int. J. Dev. Biol. 50:341–358.
2008 Rezania et al.
Biophysical Journal 95(4) 1993–2008
Related Documents


![BIOACTIVE SECONDARY METABOLITES: AN … SECONDARY METABOLITES: AN OVERVIEW ... biochemical activities include the tubulin microtubule] ... microorganisms present in our environment](https://static.cupdf.com/doc/110x72/5aafa36b7f8b9aa8438d8df2/bioactive-secondary-metabolites-an-secondary-metabolites-an-overview-biochemical.jpg)


