Microstructure and texture development in Ti-5Al-5Mo- 5V-3Cr alloy during cold rolling and annealing Alireza Ghaderi 1,2, a , Peter D Hodgson 1,2, b and Matthew R Barnett 1,2, c 1 ARC Centre of Excellence for Design in Light Metals 2 Institute for Frontier Materials, Deakin University, Geelong, VIC 3216, Australia a [email protected], b [email protected], c [email protected] Keywords: Ti-5Al-5Mo-5V-3Cr, cold rolling, texture, recrystallization This study focuses on the microstructure and texture evolution of a Ti-5Al-5Mo-5V-3Cr alloy during cold rolling and annealing treatments. Three samples with different initial microstructures were cold rolled to a 40% reduction in thickness. The starting microstructure of one sample was single β phase while two other specimens were α+β phases with different α particle sizes, distributed in β grains. For all three samples, the average size of primary β grains was 150 µm. The cold rolled specimens were then annealed at 860 °C (10 °C above the β transus temperature) for 5 minutes followed by water quenching. Microstructure development during cold rolling and recrystallization was studied by scanning electron microscopy (SEM) and electron backscatter diffraction (EBSD) technique. Microstructure investigations showed that massive amount of shear bands occurred during the cold rolling of the single β phase sample while only a few shear bands were observed in the α+β cold rolled microstructures. The cold rolled texture of the sample comprised of a single β phase contains a gamma fibre (<111>//ND) and a partial alpha fibre (<110>//RD). Annealing treatment decreased the intensity of the cold rolled texture in the single β phase sample. Also, it was found that the presence of α precipitates changes the common annealing texture observed in the single β phase specimen. Introduction The alloy Ti-5Al-5Mo-5V-3Cr (Ti5553) has been recently used in heavy section aerospace components due to its high specific strength and excellent fracture toughness [1, 2]. This alloy is in the category of metastable β alloys that contain single β phase at room temperature upon quenching from the β phase field. They can be then aged, below the transus temperature, to precipitate a high volume fraction of α particles throughout the β grains. The α particles inside the β grains act as obstacles for dislocation glide resulting in strengthening of the material [3]. The average size of the β grains and their overall textures are important in terms of the strength and ductility. In general in these alloys, grain size and bulk textures are optimized during hot deformation processing such as forging or rolling. However, the processing window for stimulating recrystallization is narrow and the stored energy is often released by dynamic recovery rather than recrystallization, which causes non-uniform microstructures [4, 5]. The aim of this study is to investigate the evolution of microstructure in Ti5553 during cold rolling and subsequent annealing. In particular, the main focus is to understand the effect of alpha phase on the recrystallization behaviour and texture evolution of β phase. Experimental The material employed in this study was a 3.5 mm thickness sheet with the chemical composition given in Table 1. The material was first annealed in a tube furnace at 900 °C for 30 minutes followed by quenching in water. Fig. 1 shows the typical microstructure of the annealed sample, which contains equiaxed β grains with an average size of 150 µm measured by intercept line method. Two pieces were cut from of the annealed sample and aged at two different Key Engineering Materials Vol. 551 (2013) pp 210-216 © (2013) Trans Tech Publications, Switzerland doi:10.4028/www.scientific.net/KEM.551.210 All rights reserved. No part of contents of this paper may be reproduced or transmitted in any form or by any means without the written permission of TTP, www.ttp.net. (ID: 128.184.184.37-14/05/13,05:30:30)

Welcome message from author
This document is posted to help you gain knowledge. Please leave a comment to let me know what you think about it! Share it to your friends and learn new things together.
Transcript
Microstructure and texture development in Ti-5Al-5Mo-
5V-3Cr alloy during cold rolling and annealing
Alireza Ghaderi1,2, a, Peter D Hodgson1,2, b and Matthew R Barnett1,2, c
1ARC Centre of Excellence for Design in Light Metals
2 Institute for Frontier Materials, Deakin University, Geelong, VIC 3216, Australia
[email protected], [email protected], [email protected]
Keywords: Ti-5Al-5Mo-5V-3Cr, cold rolling, texture, recrystallization
This study focuses on the microstructure and texture evolution of a Ti-5Al-5Mo-5V-3Cr alloy
during cold rolling and annealing treatments. Three samples with different initial microstructures
were cold rolled to a 40% reduction in thickness. The starting microstructure of one sample was
single β phase while two other specimens were α+β phases with different α particle sizes,
distributed in β grains. For all three samples, the average size of primary β grains was 150 µm. The
cold rolled specimens were then annealed at 860 °C (10 °C above the β transus temperature) for 5
minutes followed by water quenching. Microstructure development during cold rolling and
recrystallization was studied by scanning electron microscopy (SEM) and electron backscatter
diffraction (EBSD) technique. Microstructure investigations showed that massive amount of shear
bands occurred during the cold rolling of the single β phase sample while only a few shear bands
were observed in the α+β cold rolled microstructures. The cold rolled texture of the sample
comprised of a single β phase contains a gamma fibre (<111>//ND) and a partial alpha fibre
(<110>//RD). Annealing treatment decreased the intensity of the cold rolled texture in the single β
phase sample. Also, it was found that the presence of α precipitates changes the common annealing
texture observed in the single β phase specimen.
Introduction
The alloy Ti-5Al-5Mo-5V-3Cr (Ti5553) has been recently used in heavy section aerospace
components due to its high specific strength and excellent fracture toughness [1, 2]. This alloy is in
the category of metastable β alloys that contain single β phase at room temperature upon quenching
from the β phase field. They can be then aged, below the transus temperature, to precipitate a high
volume fraction of α particles throughout the β grains. The α particles inside the β grains act as
obstacles for dislocation glide resulting in strengthening of the material [3].
The average size of the β grains and their overall textures are important in terms of the strength
and ductility. In general in these alloys, grain size and bulk textures are optimized during hot
deformation processing such as forging or rolling. However, the processing window for stimulating
recrystallization is narrow and the stored energy is often released by dynamic recovery rather than
recrystallization, which causes non-uniform microstructures [4, 5].
The aim of this study is to investigate the evolution of microstructure in Ti5553 during cold
rolling and subsequent annealing. In particular, the main focus is to understand the effect of alpha
phase on the recrystallization behaviour and texture evolution of β phase.
Experimental
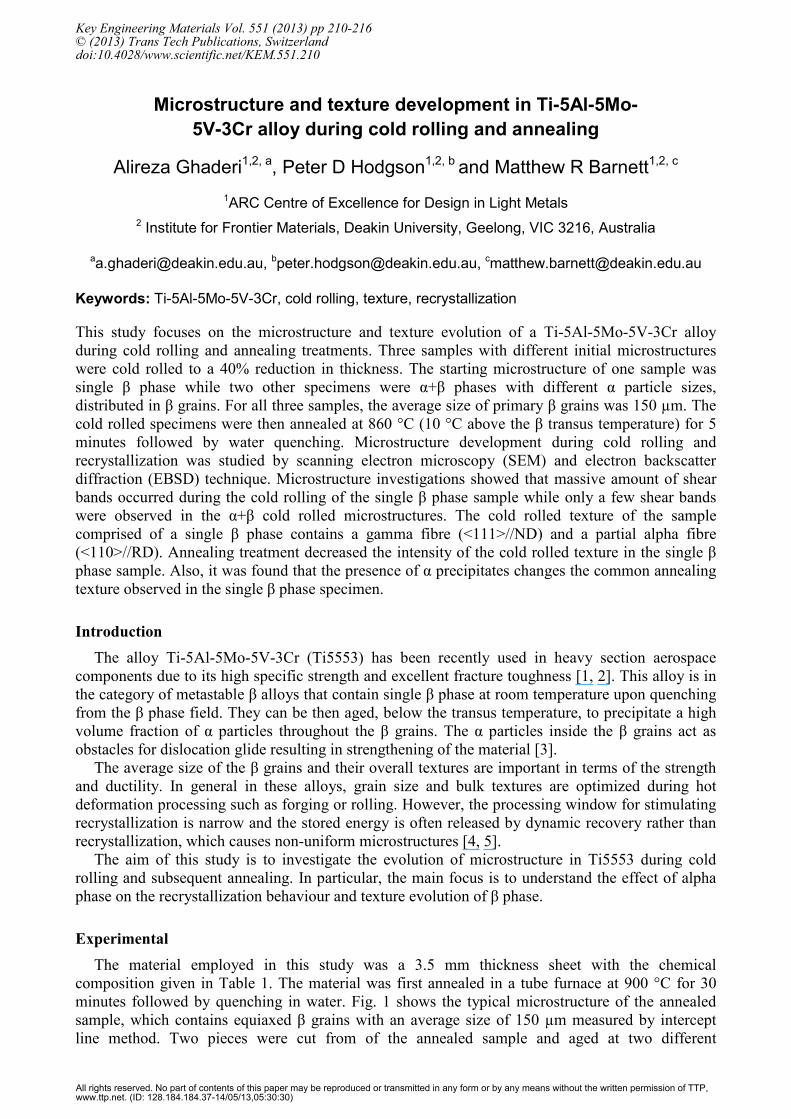
The material employed in this study was a 3.5 mm thickness sheet with the chemical
composition given in Table 1. The material was first annealed in a tube furnace at 900 °C for 30
minutes followed by quenching in water. Fig. 1 shows the typical microstructure of the annealed
sample, which contains equiaxed β grains with an average size of 150 µm measured by intercept
line method. Two pieces were cut from of the annealed sample and aged at two different
Key Engineering Materials Vol. 551 (2013) pp 210-216© (2013) Trans Tech Publications, Switzerlanddoi:10.4028/www.scientific.net/KEM.551.210
All rights reserved. No part of contents of this paper may be reproduced or transmitted in any form or by any means without the written permission of TTP,www.ttp.net. (ID: 128.184.184.37-14/05/13,05:30:30)
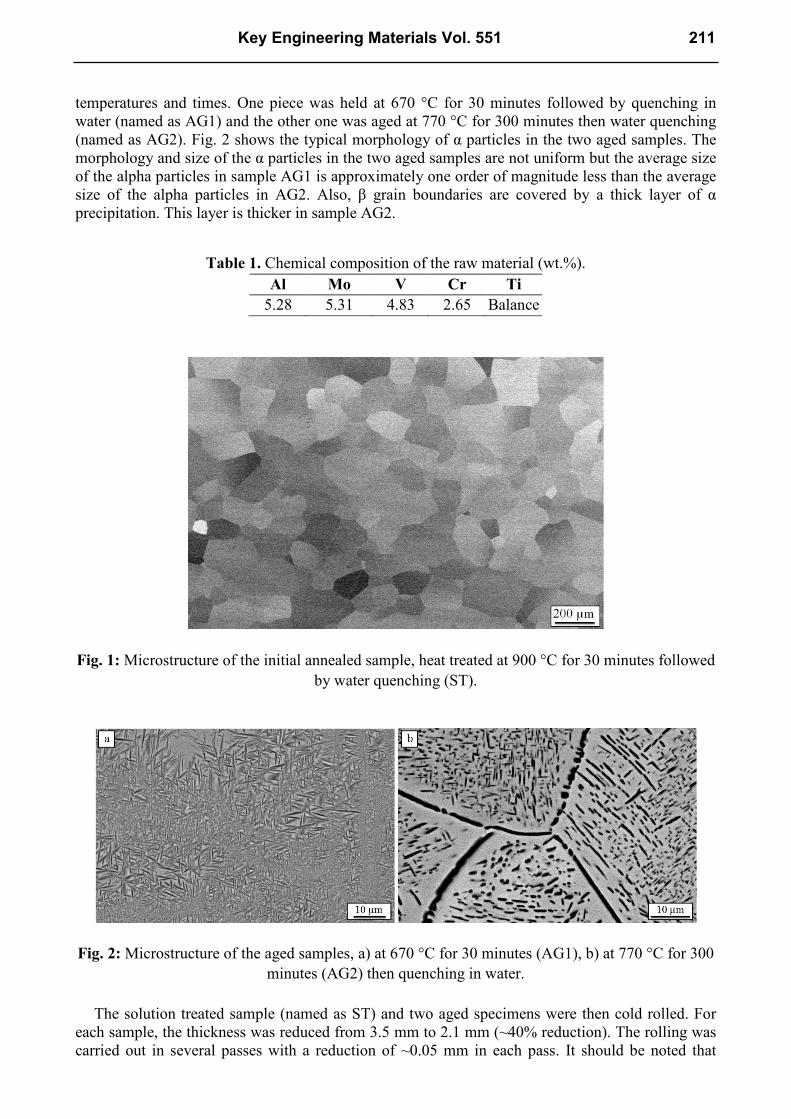
temperatures and times. One piece was held at 670 °C for 30 minutes followed by quenching in
water (named as AG1) and the other one was aged at 770 °C for 300 minutes then water quenching
(named as AG2). Fig. 2 shows the typical morphology of α particles in the two aged samples. The
morphology and size of the α particles in the two aged samples are not uniform but the average size
of the alpha particles in sample AG1 is approximately one order of magnitude less than the average
size of the alpha particles in AG2. Also, β grain boundaries are covered by a thick layer of α
precipitation. This layer is thicker in sample AG2.
Table 1. Chemical composition of the raw material (wt.%).
Al Mo V Cr Ti
5.28 5.31 4.83 2.65 Balance
Fig. 1: Microstructure of the initial annealed sample, heat treated at 900 °C for 30 minutes followed
by water quenching (ST).
Fig. 2: Microstructure of the aged samples, a) at 670 °C for 30 minutes (AG1), b) at 770 °C for 300
minutes (AG2) then quenching in water.
The solution treated sample (named as ST) and two aged specimens were then cold rolled. For
each sample, the thickness was reduced from 3.5 mm to 2.1 mm (~40% reduction). The rolling was
carried out in several passes with a reduction of ~0.05 mm in each pass. It should be noted that
Key Engineering Materials Vol. 551 211
during cold rolling, several transverse cracks appeared at the edges of the AG1 sample. Annealing
treatment was conducted on the cold rolled plates in a fluid bed furnace at 860 °C (10 °C above the
β transus temperature) for 5 minutes followed by water quenching. The heating rate was
approximately 14 °C.s-1
. In order to minimize oxidation during the high temperature treatments, all
samples were coated with a glass based coating (Acheson’s Deltaglaze FB-412) as well as purging
Argon gas into the furnaces.
Microstructure investigation was carried out on the midsection of samples parallel to the rolling
direction, using the scanning electron microscope (SEM) equipped with different detectors. An
angular selective backscatter (ASB) detector was employed to examine the microstructure and an
electron backscatter diffraction (EBSD) detector equipped with the HKL Technology CHANNEL 5
EBSD software was used for data acquisition, orientation mapping and texture measurements.
Samples examined with the SEM were prepared by mechanical polishing finished with a mixture of
colloidal alumina slurry and hydrogen peroxide.
Results and Discussion
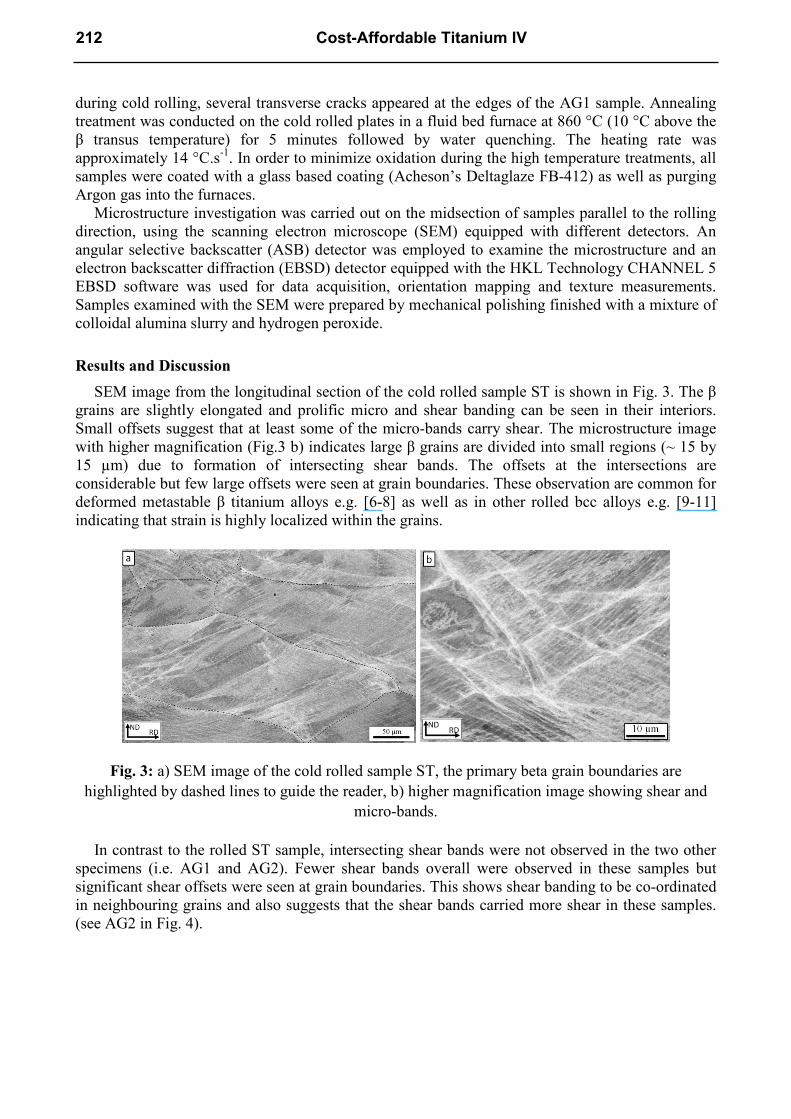
SEM image from the longitudinal section of the cold rolled sample ST is shown in Fig. 3. The β
grains are slightly elongated and prolific micro and shear banding can be seen in their interiors.
Small offsets suggest that at least some of the micro-bands carry shear. The microstructure image
with higher magnification (Fig.3 b) indicates large β grains are divided into small regions (~ 15 by
15 µm) due to formation of intersecting shear bands. The offsets at the intersections are
considerable but few large offsets were seen at grain boundaries. These observation are common for
deformed metastable β titanium alloys e.g. [6-8] as well as in other rolled bcc alloys e.g. [9-11]
indicating that strain is highly localized within the grains.
Fig. 3: a) SEM image of the cold rolled sample ST, the primary beta grain boundaries are
highlighted by dashed lines to guide the reader, b) higher magnification image showing shear and
micro-bands.
In contrast to the rolled ST sample, intersecting shear bands were not observed in the two other
specimens (i.e. AG1 and AG2). Fewer shear bands overall were observed in these samples but
significant shear offsets were seen at grain boundaries. This shows shear banding to be co-ordinated
in neighbouring grains and also suggests that the shear bands carried more shear in these samples.
(see AG2 in Fig. 4).
212 Cost-Affordable Titanium IV
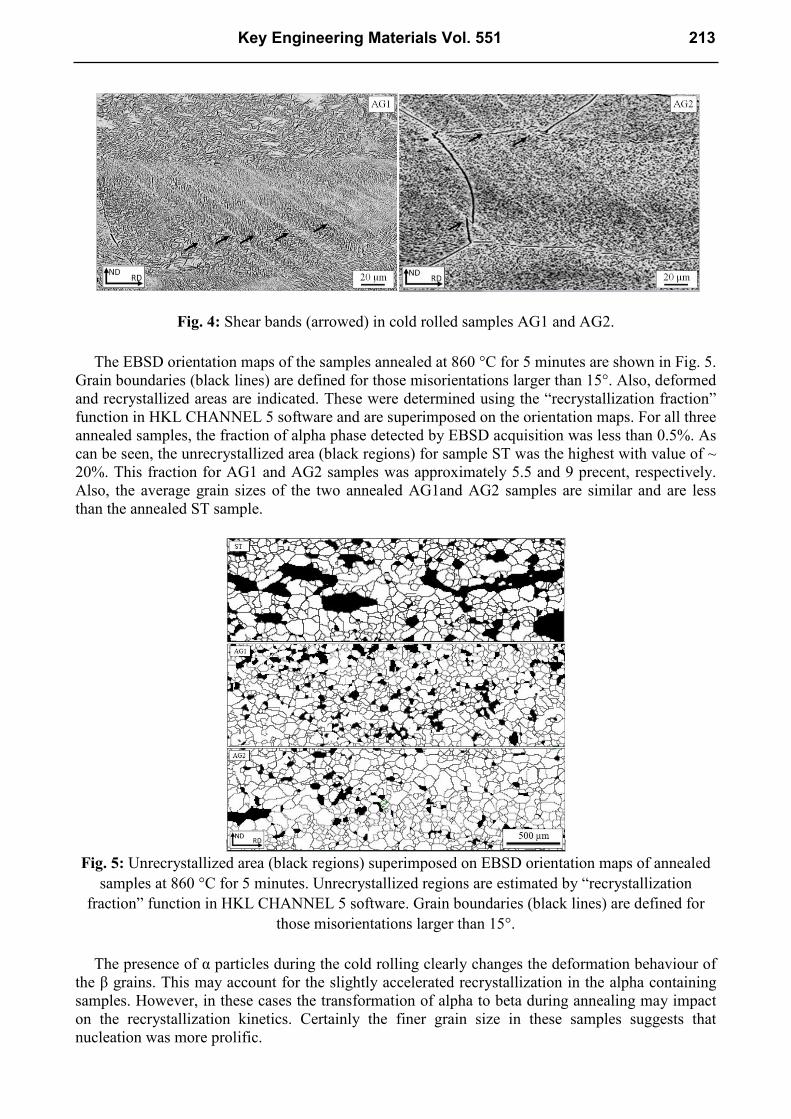
Fig. 4: Shear bands (arrowed) in cold rolled samples AG1 and AG2.
The EBSD orientation maps of the samples annealed at 860 °C for 5 minutes are shown in Fig. 5.
Grain boundaries (black lines) are defined for those misorientations larger than 15°. Also, deformed
and recrystallized areas are indicated. These were determined using the “recrystallization fraction”
function in HKL CHANNEL 5 software and are superimposed on the orientation maps. For all three
annealed samples, the fraction of alpha phase detected by EBSD acquisition was less than 0.5%. As
can be seen, the unrecrystallized area (black regions) for sample ST was the highest with value of ~
20%. This fraction for AG1 and AG2 samples was approximately 5.5 and 9 precent, respectively.
Also, the average grain sizes of the two annealed AG1and AG2 samples are similar and are less
than the annealed ST sample.
Fig. 5: Unrecrystallized area (black regions) superimposed on EBSD orientation maps of annealed
samples at 860 °C for 5 minutes. Unrecrystallized regions are estimated by “recrystallization
fraction” function in HKL CHANNEL 5 software. Grain boundaries (black lines) are defined for
those misorientations larger than 15°.
The presence of α particles during the cold rolling clearly changes the deformation behaviour of
the β grains. This may account for the slightly accelerated recrystallization in the alpha containing
samples. However, in these cases the transformation of alpha to beta during annealing may impact
on the recrystallization kinetics. Certainly the finer grain size in these samples suggests that
nucleation was more prolific.
Key Engineering Materials Vol. 551 213
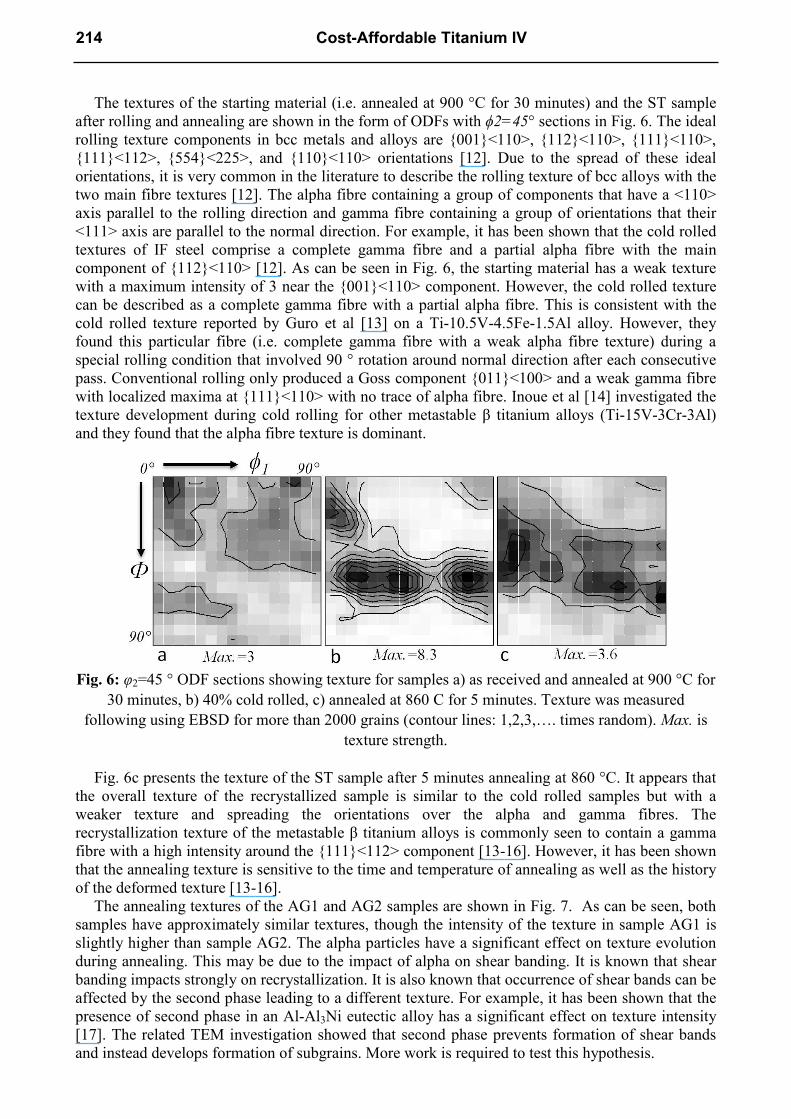
The textures of the starting material (i.e. annealed at 900 °C for 30 minutes) and the ST sample
after rolling and annealing are shown in the form of ODFs with ϕ2=45° sections in Fig. 6. The ideal
rolling texture components in bcc metals and alloys are {001}<110>, {112}<110>, {111}<110>,
{111}<112>, {554}<225>, and {110}<110> orientations [12]. Due to the spread of these ideal
orientations, it is very common in the literature to describe the rolling texture of bcc alloys with the
two main fibre textures [12]. The alpha fibre containing a group of components that have a <110>
axis parallel to the rolling direction and gamma fibre containing a group of orientations that their
<111> axis are parallel to the normal direction. For example, it has been shown that the cold rolled
textures of IF steel comprise a complete gamma fibre and a partial alpha fibre with the main
component of {112}<110> [12]. As can be seen in Fig. 6, the starting material has a weak texture
with a maximum intensity of 3 near the {001}<110> component. However, the cold rolled texture
can be described as a complete gamma fibre with a partial alpha fibre. This is consistent with the
cold rolled texture reported by Guro et al [13] on a Ti-10.5V-4.5Fe-1.5Al alloy. However, they
found this particular fibre (i.e. complete gamma fibre with a weak alpha fibre texture) during a
special rolling condition that involved 90 ° rotation around normal direction after each consecutive
pass. Conventional rolling only produced a Goss component {011}<100> and a weak gamma fibre
with localized maxima at {111}<110> with no trace of alpha fibre. Inoue et al [14] investigated the
texture development during cold rolling for other metastable β titanium alloys (Ti-15V-3Cr-3Al)
and they found that the alpha fibre texture is dominant.
Fig. 6: φ2=45 ° ODF sections showing texture for samples a) as received and annealed at 900 °C for
30 minutes, b) 40% cold rolled, c) annealed at 860 C for 5 minutes. Texture was measured
following using EBSD for more than 2000 grains (contour lines: 1,2,3,…. times random). Max. is
texture strength.
Fig. 6c presents the texture of the ST sample after 5 minutes annealing at 860 °C. It appears that
the overall texture of the recrystallized sample is similar to the cold rolled samples but with a
weaker texture and spreading the orientations over the alpha and gamma fibres. The
recrystallization texture of the metastable β titanium alloys is commonly seen to contain a gamma
fibre with a high intensity around the {111}<112> component [13-16]. However, it has been shown
that the annealing texture is sensitive to the time and temperature of annealing as well as the history
of the deformed texture [13-16].
The annealing textures of the AG1 and AG2 samples are shown in Fig. 7. As can be seen, both
samples have approximately similar textures, though the intensity of the texture in sample AG1 is
slightly higher than sample AG2. The alpha particles have a significant effect on texture evolution
during annealing. This may be due to the impact of alpha on shear banding. It is known that shear
banding impacts strongly on recrystallization. It is also known that occurrence of shear bands can be
affected by the second phase leading to a different texture. For example, it has been shown that the
presence of second phase in an Al-Al3Ni eutectic alloy has a significant effect on texture intensity
[17]. The related TEM investigation showed that second phase prevents formation of shear bands
and instead develops formation of subgrains. More work is required to test this hypothesis.
214 Cost-Affordable Titanium IV
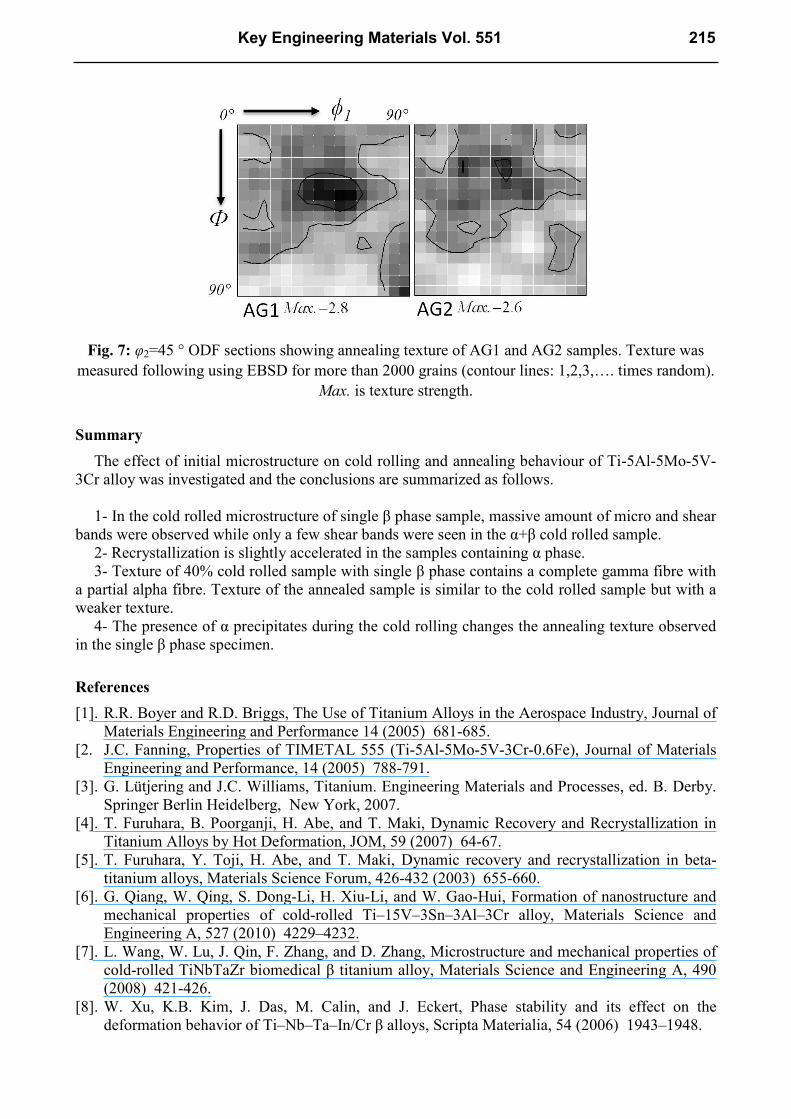
Fig. 7: φ2=45 ° ODF sections showing annealing texture of AG1 and AG2 samples. Texture was
measured following using EBSD for more than 2000 grains (contour lines: 1,2,3,…. times random).
Max. is texture strength.
Summary
The effect of initial microstructure on cold rolling and annealing behaviour of Ti-5Al-5Mo-5V-
3Cr alloy was investigated and the conclusions are summarized as follows.
1- In the cold rolled microstructure of single β phase sample, massive amount of micro and shear
bands were observed while only a few shear bands were seen in the α+β cold rolled sample.
2- Recrystallization is slightly accelerated in the samples containing α phase.
3- Texture of 40% cold rolled sample with single β phase contains a complete gamma fibre with
a partial alpha fibre. Texture of the annealed sample is similar to the cold rolled sample but with a
weaker texture.
4- The presence of α precipitates during the cold rolling changes the annealing texture observed
in the single β phase specimen.
References
[1]. R.R. Boyer and R.D. Briggs, The Use of Titanium Alloys in the Aerospace Industry, Journal of
Materials Engineering and Performance 14 (2005) 681-685.
[2. J.C. Fanning, Properties of TIMETAL 555 (Ti-5Al-5Mo-5V-3Cr-0.6Fe), Journal of Materials
Engineering and Performance, 14 (2005) 788-791.
[3]. G. Lütjering and J.C. Williams, Titanium. Engineering Materials and Processes, ed. B. Derby.
Springer Berlin Heidelberg, New York, 2007.
[4]. T. Furuhara, B. Poorganji, H. Abe, and T. Maki, Dynamic Recovery and Recrystallization in
Titanium Alloys by Hot Deformation, JOM, 59 (2007) 64-67.
[5]. T. Furuhara, Y. Toji, H. Abe, and T. Maki, Dynamic recovery and recrystallization in beta-
titanium alloys, Materials Science Forum, 426-432 (2003) 655-660.
[6]. G. Qiang, W. Qing, S. Dong-Li, H. Xiu-Li, and W. Gao-Hui, Formation of nanostructure and
mechanical properties of cold-rolled Ti–15V–3Sn–3Al–3Cr alloy, Materials Science and
Engineering A, 527 (2010) 4229–4232.
[7]. L. Wang, W. Lu, J. Qin, F. Zhang, and D. Zhang, Microstructure and mechanical properties of
cold-rolled TiNbTaZr biomedical β titanium alloy, Materials Science and Engineering A, 490
(2008) 421-426.
[8]. W. Xu, K.B. Kim, J. Das, M. Calin, and J. Eckert, Phase stability and its effect on the
deformation behavior of Ti–Nb–Ta–In/Cr β alloys, Scripta Materialia, 54 (2006) 1943–1948.
Key Engineering Materials Vol. 551 215
[9]. M.R. Barnett, Role of In-grain shear bands in the nucleation of <111> || ND recrystaIIization
textures in warm rolled steel, ISIJ International, 38 (1998) 78-85.
[10]. L.E. Murr and E.V. Esquivel, Observations of common microstructural issues associated
with dynamic deformation phenomena: Twins, microbands, grain size effects, shear bands, and
dynamic recrystallization, Journal of Materials Science, 39 (2004) 1153 – 1168.
[11]. T. Nguyen-Minh, J.J. Sidor, R.H. Petrov, and L.A.I. Kestens, Occurrence of shear bands in
rotated Goss ({110}<110>) orientations of metals with bcc crystal structure, Scripta Materialia,
67 (2012) 935-938.
[12]. F.J. Humphreys and M. Hatherly, Recrystallization and related annealing phenomena, 2nd
ed., Elsevier Science, New York, 2004.
[13]. N.P. Gurao, A. Ali A, and S. Suwas, Study of texture evolution in metastable β-Ti alloy as a
function of strain path and its effect on α transformation texture, Materials Science and
Engineering A, 504 (2009) 24-35.
[14]. H. Inoue, S. Fukushima, and N. Inakazu, Transformation textures in Ti-15V-3Cr-3Sn-3Al
alloy sheets, Materials Transactions, JIM, 33 (1992) 129-137.
[15]. B. Sander and D. Raabe, Texture inhomogeneity in a Ti–Nb-based β-titanium alloy after
warm rolling and recrystallization, Materials Science and Engineering A, 479 (2008) 236-247.
[16]. A.K. Singh, A. Bhattacharjee, and A.K. Gogia, Microstructure and texture of rolled and
annealed β titanium alloy Ti–10V–4.5Fe–1.5Al, Materials Science and Engineering A, 270
(1999) 225-230.
[17]. K. Kitagawa and S. Hirata, Rolling texture of Al-Al3Ni eutectic alloy, Journal of Japan
Institute of Light Metals, 41 (1991) 766-771.
216 Cost-Affordable Titanium IV
Related Documents