* 2 ◦ ◦ −1 ◦ ◦ ∗ 2 3 2 2 3 ≈ 25 3 2 3 2 3 2 5 ◦ ◦ −1

Welcome message from author
This document is posted to help you gain knowledge. Please leave a comment to let me know what you think about it! Share it to your friends and learn new things together.
Transcript

Vol. 121 (2012) ACTA PHYSICA POLONICA A No. 3
Microstructure and Surface Morphologyof Nanocrystalline Silver Silicates
S. Duhan∗
Materials Science Lab, Department of Materials Science and Nanotechnology, Deenbandhu Chhotu RamUniversity of Science and Technology, Murthal, Sonepat-131039, India
(Received May 19, 2011; in �nal form January 6, 2012)
Microstructure and surface morphology of AgO nanocrystallites (25 nm) supported on SiO2 and subjectedto heat treatment in air up to 500 ◦C have been studied by transmission electron microscopy, scanning electronmicroscopy, and the Fourier transform infrared spectroscopy measurements. It has been found that heating at500 ◦C resulted in spreading of AgO over silica and formation of quasi two-dimensional amorphous phase (silicateprecursor) exhibiting very weak band at 566 cm−1 have appeared in the Fourier transform infrared spectroscopy.Nanocrystalline silver silicate of unde�ned structure formed at 300�500 ◦C.
PACS: 61.46.Df, 61.46.Hk, 78.67.Bf
1. Introduction
Synthesis and characterization of nanosized metal-lic powders have attracted attention of the materialscommunity due to their promising properties. Metal-lic nanoparticles have many potential applications suchas heterogeneous catalysts, surfaces of heat exchangers,thermometers at ultra low-temperatures, memory de-vices, gas sensors, optical switches etc. [1, 2]. Their usein several natural and inorganic materials has been usedas antimicrobial agents [3]. However, among them, silveror silver ions have been long known to have widespreadantibacterial activities [4�6]. Therefore, there have beena broad range of commercial usages of silver or silver ionsas antibacterial agents.Materials containing metal nanoclusters have tradi-
tionally been prepared by a variety of chemical or phys-ical methods. Among various methods, sol�gel has beenlargely used for the preparation of inorganic oxide, due toits versatility and low cost. In this method, the synthesisof materials starts from precursors and oxide network isobtained via hydrolysis and condensation reactions thatoccur in solution. This method allows the incorporationof di�erent species such as atoms, molecules or ultra�neparticles into dried glass. These species are added inthe precursor solutions producing characteristic proper-ties in solid-glasses. The optical properties of silica basednanocomposites, synthesized using chemical process, de-pend on the type and amount of the incorporated species[7�14]. In recent past, the physical properties of silicaglass containing the di�erent amounts of silver were dis-cussed [15�17]. Recently, it has been shown that silicaglasses containing certain amounts of silver, prepared bysol�gel method, can be crystallized in cristobalite phaseat annealing temperatures much lower than 500 ◦C pre-dicted by the phase diagrams.In the present report, we have studied e�ect of calci-
nations temperature with prolonged annealing time that
∗ e-mail: [email protected]
mainly supports the development of the silver silicatesnanocrystallites in case of silver-containing silica. Thestem of this study is in the results of our earlier re-port [18], in which we demonstrated the e�ect of temper-ature and time on Nd2O3�SiO2 nanocomposites. The an-nealing temperature and time dependence of the forma-tion of Nd2O3 nanocrystallites as well as their distribu-tion in fused silica matrix were observed. We found thatthe average size of the silver nanocrystallites in a silicamatrix was ≈ 25 nm. The scanning electron microscopy(SEM), transmission electron microscopy (TEM), andthe Fourier transform infrared (FTIR) spectroscopy datafor silver silicates are presented.
2. Experimental
2.1. Preparation of bulk samples
The principle and basic technique of the sol�gel processwere described in detail in Ref. [18]. Silver silicates wereprepared by mixing high purity reagents (CH3CH2O)Sitetraethoxy silane (TEOS) (Aldrich 99.999), ethanol(Aldrich 99.9995), and deionized water. To prepare thesamples, the molar ratio of starting solution was taken asTEOS:AgNO3:H2O:HNO3:C2H5OH was 1:0.2:11:0.5:8.The pH of resultant solutions was three. The resultanthomogeneous solutions were �lled in a mold and placedin drying oven at 25 ◦C. The gelation occurred after 9days. After gelation the samples were still left inside theoven for 20 days, for ageing, until no shrinkage appeared.Thermal treatments were then done in air, at di�erenttemperatures (200, 300, 400, and 500 ◦C) and time (1 h).
2.2. Characterization
The particle size and aggregation state of particles werefurther measured with transmission electron micrograph(TEM, JEOL, JEM-1010, Japan) at 80 kV acceleratingvoltage. Infra red spectra in the wave number range2000�400 cm−1 were recorded with a FTIR spectrometer(Perkin Elmer 1600). SEM of the samples was done withJEOL-JSM-T330-A 35 CF microscope at an acceleratingvoltage of 20 kV.
(636)
Microstructure and Surface Morphology of Nanocrystalline Silver Silicates 637
3. Results
3.1. FTIR
Figure 1 shows the infrared absorption spectra, in therange 500�4000 cm−1, and treated at the indicated tem-peratures 300, 400, and 500 ◦C. For annealing tempera-tures 300 ◦C, samples showed three absorption bands cen-tered at about 450, 800, and 1050 cm−1, which are themost important peaks related to Si�O�Si bonds [19, 20].These peaks are related to the bending vibration, sym-metric and stretching vibration modes of this bond, re-spectively. For the spectra of samples heated at 400 ◦C,there is also a shoulder peak at about 1636 cm−1 whichis related to the Si�O�Si bond [1].
Fig. 1. FTIR spectra of silver doped in silica matrixat di�erent temperatures: (a) 300 ◦C, (b) 400 ◦C and(c) 500 ◦C.
In addition, an additional sharp absorption band ap-peared at about 625 cm−1, assigned to TO-A2 symmetrymodes. The spectra of samples heat treated at 500 ◦Cshow an example of the deconvoluted absorption band(Si-OH). The bands at 1070 and 1200 cm−1 have beenpreviously associated with TO and LO optical modes inthe SiO2 structure, respectively [19]. The bands at about950 cm−1 in samples heated at 500 ◦C are associated withstretching vibrations of Si-OH groups [20]. This band isdramatically reduced in samples heated at higher tem-peratures. The absence of nitrate peak at about 1300�1400 cm−1 and organic bond related peaks show that allof the nitrate and organic groups are burned and removedfrom the system during thermal treatment. There is apeak at 3409 cm−1 which is related to the H2O groups.It can be seen from Fig. 1 that peak at 566 cm−1 has
appeared in the FTIR of silica due to the Ag doping.In the FTIR spectra this peak can be seen with higherintensity which is a result of thermal treatment of thesample at higher temperatures.
3.2. SEM
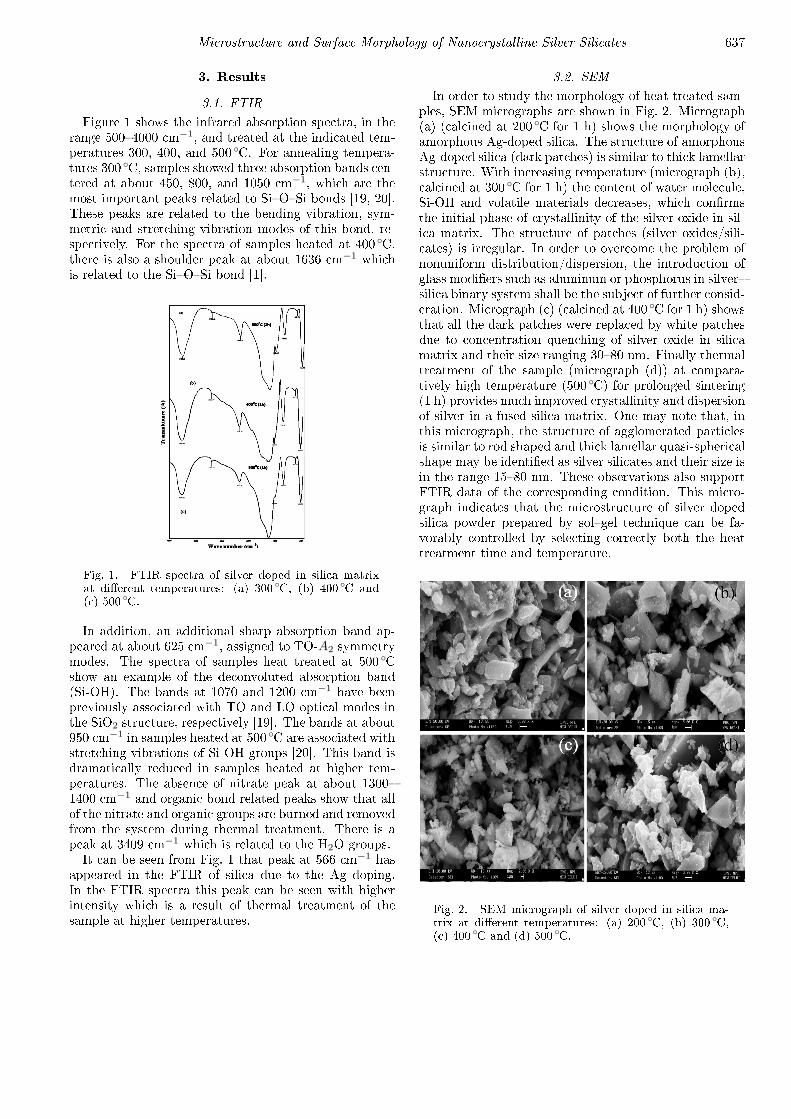
In order to study the morphology of heat treated sam-ples, SEM micrographs are shown in Fig. 2. Micrograph(a) (calcined at 200 ◦C for 1 h) shows the morphology ofamorphous Ag-doped silica. The structure of amorphousAg-doped silica (dark patches) is similar to thick lamellarstructure. With increasing temperature (micrograph (b),calcined at 300 ◦C for 1 h) the content of water molecule,Si-OH and volatile materials decreases, which con�rmsthe initial phase of crystallinity of the silver oxide in sil-ica matrix. The structure of patches (silver oxides/sili-cates) is irregular. In order to overcome the problem ofnonuniform distribution/dispersion, the introduction ofglass modi�ers such as aluminum or phosphorus in silver�silica binary system shall be the subject of further consid-eration. Micrograph (c) (calcined at 400 ◦C for 1 h) showsthat all the dark patches were replaced by white patchesdue to concentration quenching of silver oxide in silicamatrix and their size ranging 30�80 nm. Finally thermaltreatment of the sample (micrograph (d)) at compara-tively high temperature (500 ◦C) for prolonged sintering(1 h) provides much improved crystallinity and dispersionof silver in a fused silica matrix. One may note that, inthis micrograph, the structure of agglomerated particlesis similar to rod shaped and thick lamellar quasi-sphericalshape may be identi�ed as silver silicates and their size isin the range 15�80 nm. These observations also supportFTIR data of the corresponding condition. This micro-graph indicates that the microstructure of silver dopedsilica powder prepared by sol�gel technique can be fa-vorably controlled by selecting correctly both the heattreatment time and temperature.
Fig. 2. SEM micrograph of silver doped in silica ma-trix at di�erent temperatures: (a) 200 ◦C, (b) 300 ◦C,(c) 400 ◦C and (d) 500 ◦C.

638 S. Duhan
3.3. TEM
The TEM spectra of the samples annealed at 300 ◦C,400 ◦C, and 500 ◦C are shown in Fig. 3a�c, respectively.Figure 3a shows agglomerates of small grains and somedispersed nanoparticles which are more or less spheri-cal. Figure 3b shows particles spherical and close to thesquare for the large ones. Figure 3c shows agglomeratesof small grains and some dispersed nanoparticles. Theparticle size of silver particles (right-hand illustration inFig. 3) shows that the particles range in size from 8 to50 nm with mean diameter 24 nm.
Fig. 3. TEM pictures of silver doped in silica matrixat di�erent temperatures: (a) 300 ◦C, (b) 400 ◦C and (c)500 ◦C.
4. Discussion
Silver silicates were successfully prepared by the sol�gel technique and characterized by FTIR spectroscopy,SEM and TEM. The heat treatment forms silver dopedin silica nanocrystallites in the range 25�45 nm in thesample. The presence of IR band at around 950 cm−1 forthe 400 ◦C dried gels (Fig. 1) con�rmed the presence ofnon-bridging oxygen other than those belonging to Si-OHgroups. With the increase of temperature, the densi�ca-tion of silicate network was followed by elimination ofresidual organics; mainly carbon and water were formedby condensation reaction. It is also noticed that silverclusters formed at 500 ◦C are stable and do not show anydegradation of their optical properties with aging.In relation to the surface morphology of the samples
and the annealing temperature, in this system, high tem-perature treatment leads to a semi circle-like morphologyof Ag/SiO2 clusters (Fig. 2). TEM results showed thatthe aggregates around these circles are Ag-rich areas. Itseems that these semi-circle-like pores are created due tothe exhaust of the gases resulting from nitrate decompo-sition to the formation of Ag-rich clusters around thesepores.
Work is in progress on the characterization of the non--linear optical properties of the obtained samples.
5. Conclusions
The sol�gel process successfully prepared silver-dopedsilica samples. The samples were characterized by FTIRspectroscopies, SEM and TEM, and the formation ofAg/SiO2 nanocomposites was con�rmed. It is found thatthe morphology and evolution of the system as a functionof the annealing temperature is necessary for obtaininga nanoclusters distribution in silica matrix.
References
[1] F. Gonella, P. Mazzoldi, Handbook of Nanostruc-tured Materials and Nanotechnology, Vol. 4, AcademicPress, CA 2000.
[2] P. Chakraborty, J. Mater. Sci. 33, 2235 (1998).
[3] H.J. Jeon, S.C. Yi, S.G. Oh, J. Biomater. 24, 4921(2003).
[4] S.M. Lee, B.S. Lee, T.G. Byunc, K.C. Song, J. Col-loids Surf. A: Physicochem. Eng. Aspects 355, 167(2010).
[5] http://microbewiki.kenyon.edu/index.php/ Silveras an Antimicrobial Agent, access on Oct. 2010.
[6] U. Klueh, V. Wagner, S. Kelly, A. Johnson, J.D. Bry-ers, J. Biomed. Mater. Res. Part B: Appl. Biomater.53, 621 (2000).
[7] B. Akkopru, C. Durucan, J. Sol-Gel. Sci. Technol.43, 227 (2007).
[8] M.R. Poulsen, P.I. Borel, J. Fage-Pedersen, J. Hub-ner, M. Kristensen, J.H. Povlsen, K. Rottwitt,M. Svalgard, W. Svendsen, Opt. Eng. 42, 2821(2003).
[9] A. Dhawan, J.F. Muth, Nanotechnology 17, 2504(2006).
[10] E. Cattauruzza, G. Battaglin, F. Gonella, G. Mattei,P. Mazzoldi, R. Polloni, B.F. Scremin, Appl. Surf. Sci.247, 390 (2005).
[11] T.P. Ma, M. Miyauch, Appl. Phys. Lett. 75, 88(1999).
[12] R.A. Weimer, P.M. Lenahan, T.A. Marchione, Appl.Phys. Lett. 51, 1179 (1987).
[13] F. Orgaz, H. Rawson, J. Non-Cryst. Solids 82, 378(1986).
[14] A. Duran, J.M. Hernaz-Navarro, P. Mazon, A. Jogar,J. Non-Cryst. Solids 82, 391 (1986).
[15] A. Hinsh, A. Zastrow, J. Non-Cryst. Solids 147, 579(1992).
[16] M. Menning, J. Spanhel, H. Schmidt, S. Betzholz,J. Non-Cryst. Solids 147, 326 (1992).
[17] D. Brusilowsky, M. Eyal, R. Reisfeld, Chem. Phys.Lett. 153, 203 (1998).
[18] S. Duhan, P. Aghamkar, Acta Phys. Pol. A 113, 1671(2008).
[19] F.L. Galeener, A.E. Geissberger, Phys. Rev. B 27,6199 (1983).
[20] M. Ristic, M. Ivanda, S. Popovic, S. Music, J. Non--Cryst. Solids 303, 270 (2002).
Related Documents


