UNSW Sydney Microstructural engineering of modern high strength low alloy steels via advanced thermo-mechanical processing Carina Ledermueller School of Materials Science and Engineering Faculty of Science September 2019 A thesis in fulfilment of the requirements for the degree of Doctor of Philosophy

Welcome message from author
This document is posted to help you gain knowledge. Please leave a comment to let me know what you think about it! Share it to your friends and learn new things together.
Transcript
UNSW Sydney
Microstructural engineering of modern high strength low alloy steels via
advanced thermo-mechanical processing
Carina Ledermueller
School of Materials Science and Engineering
Faculty of Science
September 2019
A thesis in fulfilment of the requirements for the degree of
Doctor of Philosophy
Thesis/Dissertation Sheet
Surname/Family Name : Ledermueller
Given Name/s : Carina
Abbreviation for degree as give in the University calendar : PhD
Faculty : Science
School : Materials Science & Engineering
Thesis Title : Microstructural engineering of modern high strength low alloy steels via advanced thermo-mechanical processing
Engineering microstructures in high strength low alloy (HSLA) steels via advanced thermo-mechanical processing (aTMP) is a
promising approach to overcome challenges around low work hardenability and toughness in ultrafine-grained mild steels. Thus,
the applicability of advanced thermo-mechanical processing for achieving multi-scale hierarchical microstructures in a HSLA steel
was studied. The microstructural evolution during warm deformation of a martensitic/bainitic starting microstructure using a
Gleeble 3500 thermo-mechanical simulator at 600°C followed by a direct aging step was investigated. A strain rate of 10 s-1
during a single pass plane strain compression led to strain localisation and, therefore, the formation of a macroscopic shear band.
Hence, an optimised advanced multi-hit thermo-mechanical process for achieving homogenous hierarchical microstructures
without strain localisation was developed. Ultrafine crystallites confined by a mixture of high angle gain and subgrain boundaries
are formed, decorated by two types of precipitates. Large FeMnC-rich cementite particles are found on grain boundaries and
smaller TiNbC-rich precipitates on dislocations and subgrain boundaries. The further aim of this study was the investigation of
the mechanical properties by upscaling the process developed in the Gleeble using a Hille 100 rolling mill. It was found that rolling
to reduction of thickness of 55% at a temperature around 650°C can lead to an ultimate tensile strength (UTS) of 650 MPa, a
yield ratio of 0.95 and a total elongation of 14% in the as-rolled condition. Delaminations did occur in the lower temperature region
of the Charpy impact testing in longitudinal and transversal directions. Finally, a similar processing was implemented to invoke
grain refinement coupled with strengthening arising from microalloying. It was found that Mo leads to an increase in hardness of
~20% compared to the base alloy, whereas Cr provides only a minor hardening increment. It was found that Mo is more effective
than Cr in delaying dislocation recovery. It was also observed that Mo partitions into nanoscale Nb-C solute clusters and
precipitates of NbC and Fe3C during ageing, retarding the coarsening of these phases. However, Cr was found to partition into
Fe3C only, and does not contribute to the nature of the dispersion of clusters and NbC.
Declaration relating to disposition of project thesis/dissertation I hereby grant to the University of New South Wales or its agents the right to archive and to make available my thesis or dissertation in whole or in part in the University libraries in all forms of media, now or here after known, subject to the provisions of the Copyright Act 1968. I retain all property rights, such as patent rights. I also retain the right to use in future works (such as articles or books) all or part of this thesis or dissertation. I also authorise University Microfilms to use the 350 word abstract of my thesis in Dissertation Abstracts International (this is applicable to doctoral theses only). …………………………………………………………… Signature
……………………………………..……………… Witness Signature
……….……………………...…….… Date
The University recognises that there may be exceptional circumstances requiring restrictions on copying or conditions on use. Requests for restriction for a period of up to 2 years must be made in writing. Requests for a longer period of restriction may be considered in exceptional circumstances and require the approval of the Dean of Graduate Research.
FOR OFFICE USE ONLY Date of completion of requirements for Award:

i
INCLUSION OF PUBLICATIONS STATEMENT
UNSW is supportive of candidates publishing their research results during their candidature
as detailed in the UNSW Thesis Examination Procedure.
Publications can be used in their thesis in lieu of a Chapter if:
The student contributed greater than 50% of the content in the publication and is the
“primary author”, ie. the student was responsible primarily for the planning, execution and
preparation of the work for publication
The student has approval to include the publication in their thesis in lieu of a Chapter from
their supervisor and Postgraduate Coordinator.
The publication is not subject to any obligations or contractual agreements with a third
party that would constrain its inclusion in the thesis
Please indicate whether this thesis contains published material or not.
☐ This thesis contains no publications, either published or submitted for publication (if this box is checked, you may delete all the material on page 2)
☐
Some of the work described in this thesis has been published and it has been documented in the relevant Chapters with acknowledgement (if this box is checked, you may delete all the material on page 2)
☒
This thesis has publications (either published or submitted for publication) incorporated into it in lieu of a chapter and the details are presented below
CANDIDATE’S DECLARATION
I declare that:
I have complied with the Thesis Examination Procedure
where I have used a publication in lieu of a Chapter, the listed publication(s) below meet(s) the requirements to be included in the thesis.
Name
Carina Ledermueller
Signature Date (dd/mm/yy)
20/08/20
Postgraduate Coordinator’s Declaration (to be filled in where publications are used in lieu of Chapters)
I declare that:
the information below is accurate
where listed publication(s) have been used in lieu of Chapter(s), their use complies with the Thesis Examination Procedure
the minimum requirements for the format of the thesis have been met.
PGC’s Name
Nagarajan Valanoor
PGC’s Signature Date (dd/mm/yy)
20/08/20
ii
For each publication incorporated into the thesis in lieu of a Chapter, provide all of
the requested details and signatures required
Details of publication #1: Full title: Engineering Hierarchical Microstructures via Advanced Thermo-mechanical Processing of a Modern HSLA steel Authors: Carina Ledermueller, Huijun Li, Sophie Primig Journal or book name: Metallurgical and Materials Transactions A Volume/page numbers: Volume 49, Issue 12, pp.6337-6350 Date accepted/ published: published online 11/09/2018
Status Published X Accepted and In press
In progress (submitted)
The Candidate’s Contribution to the Work C. Ledermueller did the majority of the planning and execution of the experimental work as well as the data analysis. The manuscript was drafted by her.
Location of the work in the thesis and/or how the work is incorporated in the thesis: Experimental work is described in Chapter 3, results and discussion in Chapter 4, parts of the abstract/introduction used in the thesis abstract and Chapter 2 & 8.
Primary Supervisor’s Declaration I declare that: • the information above is accurate • this has been discussed with the PGC and it is agreed that this publication can be
included in this thesis in lieu of a Chapter • All of the co-authors of the publication have reviewed the above information and have
agreed to its veracity by signing a ‘Co-Author Authorisation’ form.
Supervisor’s name Sophie Primig
Supervisor’s signature Date (dd/mm/yy) 20/08/20
Details of publication #2: Full title: Advanced thermo-mechanical process for homogenous hierarchical microstructures in HSLA steels Authors: C. Ledermueller, E. Kozeschnik, R. Webster & S. Primig Journal or book name: Metallurgical and Materials Transactions A Volume/page numbers: Volume 50, Issue 12, pp 5800-5815 Date accepted/ published: published online 11/10/2019
Status Published X Accepted and In press
In progress (submitted)
The Candidate’s Contribution to the Work C. Ledermueller did the majority of the planning and execution of the experimental work as well as the data analysis. The manuscript was drafted by her.
Location of the work in the thesis and/or how the work is incorporated in the thesis: Parts of the experimental work is described in Chapter 3, results and discussion in Chapter 5, parts of the abstract/introduction used in the thesis abstract and Chapter 1, 2 & 8.
Primary Supervisor’s Declaration I declare that: • the information above is accurate • this has been discussed with the PGC and it is agreed that this publication can be
included in this thesis in lieu of a Chapter • All of the co-authors of the publication have reviewed the above information and have
agreed to its veracity by signing a ‘Co-Author Authorisation’ form.
Supervisor’s name Sophie Primig
Supervisor’s signature Date (dd/mm/yy) 20/08/20
iii
Details of publication #3: Full title: An Initial Report on the Structure–Property Relationships of a High-Strength Low-Alloy Steel Subjected to Advanced Thermomechanical Processing in Ferrite Authors: C. Ledermueller, H. Zhu, H. Li, S. Primig Journal or book name: Steel Research International Volume/page numbers: Volume 91, Issue 7, Article Number: 1900596 Date accepted/ published: published online 05/02/2020
Status Published x Accepted and In press
In progress (submitted)
The Candidate’s Contribution to the Work C. Ledermueller did the majority of the planning and execution of the experimental work as well as the data analysis. The manuscript was drafted by her.
Location of the work in the thesis and/or how the work is incorporated in the thesis: Parts of the experimental work described in Chapter 3, results and discussion in Chapter 6, parts of the abstract/introduction used in the thesis abstract and Chapter 2 & 8.
Primary Supervisor’s Declaration I declare that: • the information above is accurate • this has been discussed with the PGC and it is agreed that this publication can be
included in this thesis in lieu of a Chapter • All of the co-authors of the publication have reviewed the above information and have
agreed to its veracity by signing a ‘Co-Author Authorisation’ form.
Supervisor’s name Sophie Primig
Supervisor’s signature Date (dd/mm/yy) 20/08/20
Details of publication #4: Full title: Microalloying effects of Mo versus Cr in HSLA steels with ultrafine grained ferrite microstructures Authors: C. Ledermueller, H. I. Pratiwi, R. F. Webster, M. Eizadjou, S. P. Ringer & S. Primig Journal or book name: Materials & Design Volume/page numbers: Volume 185, Article Number 108278 Date accepted/ published: published online 18/10/2019
Status Published x Accepted and In press
In progress (submitted)
The Candidate’s Contribution to the Work C. Ledermueller did a major part of the experimental work as well as the data analysis. The manuscript was drafted by her. She supervised the work done by H.I. Pratiwi.
Location of the work in the thesis and/or how the work is incorporated in the thesis: Parts of the experimental work described in Chapter 3, results and discussion in Chapter 7, parts of the abstract/introduction used in the thesis abstract and Chapter 2 & 8.
Primary Supervisor’s Declaration I declare that: • the information above is accurate • this has been discussed with the PGC and it is agreed that this publication can be
included in this thesis in lieu of a Chapter • All of the co-authors of the publication have reviewed the above information and have
agreed to its veracity by signing a ‘Co-Author Authorisation’ form.
Supervisor’s name Sophie Primig
Supervisor’s signature Date (dd/mm/yy) 20/08/20

i
ORIGINALITY STATEMENT
‘I hereby declare that this submission is my own work and to the best of my knowledge
contains no materials previously published or written by another person, or substantial
proportions of material which have been accepted for the award of any other degree or
diploma at UNSW or any other educational institution, except where due
acknowledgement is made in the thesis. Any contribution made to the research by others,
with whom I have worked at UNSW or elsewhere, is explicitly acknowledged in the thesis.
I also declare that the intellectual content of this thesis is the product of my own work,
except to the extent that assistance from others in the project’s design and conception or
in style, presentation and linguistic expression is acknowledged.’
Signed …………………………………………………….
Date ………………………………………………….

ii
COPYRIGHT STATEMENT ‘I hereby grant the University of New South Wales or its agents the right to archive
and to make available my thesis or dissertation in whole or part in the University
libraries in all forms of media, now or here after known, subject to the provisions
of Copyright Act 1968. I retain all property rights, such as patent rights. I also retain
the right to use in future works (such as articles or books) all or part of this thesis
or dissertation.
I also authorise University Microfilms to use the 350 word abstract of my thesis in
Dissertation Abstract International (this is applicable to doctoral theses only).
I have either used no substantial proportions of copyright material in my thesis or
I have obtained permission to use copyright material; where permission has not
been granted I have applied/will apply for a partial restriction of the digital copy of
my thesis or dissertation.’
Signed ………………………………………..
Date …………………………………………..
AUTHENTICITY STATEMENT
‘I certify that the Library deposit digital copy is a direct equivalent of the final
officially approved version of my thesis. No emendation of content has occurred
and if there are any minor variations in formatting, they are result of the conversion
to digital format.’
Signed ………………………………………..
Date …………………………………………..

iii
Acknowledgements
Undertaking a PhD was never part of my career planning. However, when the
opportunity arose to study overseas under the supervision of my former supervisor
Dr Sophie Primig I decided to dare to take on the adventure moving to the other
side of the world. Although PhD life was not always easy I am grateful for making
this decision. It was truly life-changing as it has opened up my mind to all that
beautiful variety of cultures and people out there. That said I would like to thank
everybody who was part of my journey during the last 3.5 years and has helped
me to complete my thesis.
Firstly, I would like to express my sincere gratitude to my supervisor, A/Prof Sophie
Primig, for her support, patience, motivation and immense knowledge. I am
grateful to be able to call her my supervisor and mentor all these years since
starting my undergraduate degree.
My sincere appreciation also goes to all the technical and professional staff at
UNSW Sydney and the Electron Microscopy Unit at UNSW but especially to
Prof Paul Munroe, Prof Michael Ferry, Dr Simon Hager, Dr Charlie Kong,
Dr Qiang Zhu, Dr George Yang and Dr Rahmat Kartono. I would like to
acknowledge Bill Joe’s help with the mechanical testing, Dr David Miskovic’s help
with the Gleeble experiments and Dr Richard Webster for the TEM imaging.
I further want to thank my collaborators at the University of Wollongong who have
enabled me to use their facilities. Prof Huijun Li and Dr Liang Chen for their support
and help with some of the Gleeble experiments and Hongtao Zhu and Nathan
Hodges for their support and help with the Hille 100 rolling mill.
Thanks to Prof Ernst Kozeschnik from the TU Vienna for his guidance, patience
and help with the thermo-kinetic modelling.

iv
Furthermore, I want to express my gratitude to my collaborators Prof Simon Ringer
and Dr Mehdi Eizadjou and the technical support by Dr Takanori Sato at the
University of Sydney who enabled me to use their atom probe facilities.
I thank my fellow group mates for the stimulating discussions, help with
experimental work and fun we had at our social activities. I especially want to
acknowledge Christian Legerer and Cerys Edwards who cast the steels used in
Chapter 7. A big thanks to my master by coursework student Hafsah Pratiwi for
her hard work and the fun we had working in the lab together.
I want to acknowledge the voestalpine Stahl Linz GmbH (Austria) for supplying the
industrial steel used for the majority of this thesis.
From the bottom of my heart I want to thank my friends who have been my family
away from home. Special thanks to Caitlin who has been my go-to person for all
questions regarding the English language and living in Australia. I want to thank
Arslan for his assistance with the TEM and Christina for her help with the IVAS
software. A special thanks to Koshy and the MSE Badminton Club for sparking my
passion for badminton and to the “ANZAC day”- lunch group for all those delicious
Asian foods we shared. This has helped me to maintain my work-life balance. I
also want to thank my coffee break buddies Irene and Bernd for their moral support
when PhD life was hard.
Last but not least, I would like to thank my family: my parents and my brother for
always supporting me and my partner Fan who is my source of happiness and
calm.
Table of Contents ________________________________________________________________________________________________________________________________
I
Table of Contents
Acknowledgements ........................................................................................... iii
Index of Abbreviations ..................................................................................... IV
Abstract ............................................................................................................. VI
1 Introduction .............................................................................................. 1
2 Literature Review ..................................................................................... 4
2.1 Steel industry, applications and needs ................................................... 4
2.2 HSLA steels ........................................................................................... 4
2.3 Role of Nb, Mo and Cr as microalloying elements ................................. 6
2.4 Processing of HSLA steels ..................................................................... 9
2.5 advanced TMP ..................................................................................... 13
2.5.1 Warm rolling in the ferrite region ................................................ 13
2.5.2 Tempforming ............................................................................. 15
2.5.3 Cold rolling and annealing ......................................................... 17
2.5.4 Influence of C content, heating rate and starting grain size on the
final microstructure ................................................................................... 20
2.6 Mechanism of grain refinement ............................................................ 22
2.7 HSLA steels and aTMP ........................................................................ 24
2.8 Challenges and drawbacks during aTMP ............................................. 25
2.9 Proposed solution to overcome these problems .................................. 29
3 Methods .................................................................................................. 31
3.1 Steel used in Chapter 4-6 ..................................................................... 31
3.2 Steels used in Chapter 7 ...................................................................... 32
3.3 Thermo-mechanical processing ........................................................... 33
3.3.1 aTMP for Chapter 4 ................................................................... 33
3.3.2 aTMP for Chapter 5 ................................................................... 34
3.3.3 aTMP for Chapter 6 ................................................................... 35
3.3.4 aTMP for Chapter 7 ................................................................... 36
3.4 Simulation approach and set-up for Chapter 5 ..................................... 37
3.5 Microstructural characterisation ........................................................... 39
3.5.1 Light optical and stereo microscopy .......................................... 39
3.5.2 SEM/ECCI/EBSD ...................................................................... 40
3.5.3 TEM ........................................................................................... 40
3.5.4 Atom probe ................................................................................ 41
Table of Contents ________________________________________________________________________________________________________________________________
II
3.6 Mechanical characterisation ................................................................. 42
3.6.1 Hardness testing ........................................................................ 42
3.6.2 Tensile testing ........................................................................... 42
3.6.3 Charpy impact testing ................................................................ 42
4 Feasibility study ..................................................................................... 43
4.1 Introduction .......................................................................................... 43
4.2 Results ................................................................................................. 44
4.2.1 Grain refinement ........................................................................ 44
4.2.2 Microstructure of the shear band ............................................... 48
4.2.3 Detailed characterisation of nanoscale precipitates and
dislocation structures ............................................................................... 51
4.3 Discussion ............................................................................................ 55
4.3.1 Grain refinement during aTMP .................................................. 56
4.3.2 Macroscopic shear band formation and CDRX .......................... 57
4.3.3 Direct ageing ............................................................................. 59
4.3.4 Microstructural model and mechanical properties ..................... 60
4.4 Summary and Outlook .......................................................................... 62
5 Optimisation of advanced thermo-mechanical process design ........ 63
5.1 Introduction .......................................................................................... 63
5.2 Results ................................................................................................. 64
5.2.1 Experimental results .................................................................. 64
5.2.2 Simulation results ...................................................................... 75
5.3 Discussion ............................................................................................ 79
5.3.1 Grain size and texture ............................................................... 79
5.3.2 Precipitates ................................................................................ 82
5.4 Summary and Outlook .......................................................................... 84
6 Initial report on structure-property relationships of HSLA steels
subjected to aTMP ............................................................................................ 86
6.1 Introduction .......................................................................................... 86
6.2 Results ................................................................................................. 87
6.2.1 Microstructure ............................................................................ 87
6.2.2 Mechanical Properties ............................................................... 91
6.3 Discussion ............................................................................................ 97
6.4 Summary and Outlook ........................................................................ 100
7 Influence of Cr/Mo as microalloying elements in HSLA steels
subjected to warm deformation .................................................................... 102
Table of Contents ________________________________________________________________________________________________________________________________
III
7.1 Introduction ........................................................................................ 102
7.2 Results ............................................................................................... 103
7.2.1 Hardness ................................................................................. 103
7.2.2 Dislocations and interfaces ...................................................... 105
7.2.3 Solute clusters and second phase precipitates ........................ 109
7.3 Discussion .......................................................................................... 116
7.3.1 Dislocations and interfaces ...................................................... 116
7.3.2 Precipitates and clusters ......................................................... 117
7.3.3 Microstructural Model .............................................................. 118
7.4 Summary ............................................................................................ 120
8 Conclusion and Outlook ...................................................................... 121
8.1 HSLA steels and aTMP ...................................................................... 121
8.2 Mechanical properties ........................................................................ 122
8.3 Alloy design ........................................................................................ 122
8.4 Recommendations for future research ............................................... 122
9 References ............................................................................................ 124
10 Appendix A: MatCalc script ................................................................ 133
Index of Abbreviations ________________________________________________________________________________________________________________________________
IV
Index of Abbreviations
ADF annular dark field
AP(T) atom probe (tomography)
at% atom percent
(a)TMP (advanced) thermo-mechanical processing
bcc body centred cubic
BF bright field
CDRX continuous dynamic recrystallisation
DBTT ductile-to-brittle transition temperature
DDRX discontinuous dynamic recrystallisation
DRX dynamic recrystallisation
EBSD electron backscatter diffraction
ECCI electron channelling contrast imagining
EDS energy-dispersive x-ray spectroscopy
fcc face centred cubic
GB grain boundary
HAGB high angle grain boundary
HRTEM high-resolution transmission electron microscopy
HSLA high strength low alloy
IPF inverse pole figure
LAGB low angle grain boundary
LOM light optical microscopy
m% mass percent
MS martensite start temperature
ND normal direction
RD rolling direction
Rxx recrystallisation
SEM scanning electron microscope
(S)TEM (scanning) transmission electron microscope
Index of Abbreviations ________________________________________________________________________________________________________________________________
V
TnR ‘non-recrystallisation temperature’ (below this temperature complete
static recrystallisation does not longer occur between deformation
passes or during cooling)
UFG ultrafine grained
UTS ultimate tensile strength
wt% weight percent
α ferrite
ε logarithmic strain
𝜀̇ strain rate
γ austenite
Abstract ________________________________________________________________________________________________________________________________
VI
Abstract
Engineering microstructures in high strength low alloy (HSLA) steels via advanced
thermo-mechanical processing (aTMP) is a promising approach to overcome
challenges around low work hardenability and toughness in ultrafine-grained mild
steels.
Thus, the applicability of advanced thermo-mechanical processing for achieving
multi-scale hierarchical microstructures in a HSLA steel was studied. The
microstructural evolution during warm deformation of a martensitic/bainitic starting
microstructure using a Gleeble 3500 thermo-mechanical simulator at 600°C
followed by a direct ageing step was investigated. A strain rate of 10 s-1 during a
single pass plane strain compression led to strain localisation and, therefore, the
formation of a macroscopic shear band. Hence, an optimised advanced multi-hit
thermo-mechanical process for achieving homogenous hierarchical
microstructures without strain localisation was developed. The success of the
process design was verified via high-resolution microscopy, such as electron
channelling contrast imaging, electron backscatter diffraction and transmission
electron microscopy, and thermo-kinetic modelling, using the software MatCalc. A
typical body-centred-cubic rolling texture is achieved in contrast to the previous
process design. Ultrafine crystallites confined by a mixture of high angle gain and
subgrain boundaries are formed, decorated by two types of precipitates. Large
FeMnC-rich cementite particles are found on grain boundaries and smaller
TiNbC-rich precipitates on dislocations and subgrain boundaries. The further aim
of this study was the investigation of the mechanical properties by upscaling the
process developed in the Gleeble using a Hille 100 rolling mill. As a majority of
studies on advanced thermo-mechanical processing of low-alloyed steels was
performed under large strain conditions (<80% reduction in thickness) or on
subsize specimens there is a need to provide mechanical data from standardised
tensile and Charpy impact tests. It was found that rolling to reduction of thickness
of 55% at a temperature around 650°C can lead to an ultimate tensile strength
(UTS) of 650 MPa, a yield ratio of 0.95 and a total elongation of 14% in the
as-rolled condition. The low yield ratio can be explained by the rather large
Abstract ________________________________________________________________________________________________________________________________
VII
precipitates (average precipitate size for the as-rolled condition: 51±38 nm) which
do not effectively contribute to work hardening. Delaminations did occur in the
lower temperature region of the Charpy impact testing in longitudinal and
transversal directions. However, for the 60 min direct aged sample a very high
impact energy of 197±6 J at room temperature was found due to the onset of grain
growth during recrystallisation. Finally, a similar processing was implemented to
invoke grain refinement coupled with strengthening arising from microalloying. For
example, microalloying with Mo and Cr has been reported to provide significant
additional strengthening during such processing but the detailed mechanisms yet
remain unknown. Therefore, three model Fe-1.6Mn-0.04C-0.1Nb+0.5Mo/Cr steels
were warm-rolled at ~600°C with an overall reduction of 50% followed by ageing.
It was found that Mo leads to an increase in hardness of ~20% compared to the
base alloy, whereas Cr provides only a minor hardening increment. It was found
that Mo is more effective than Cr in delaying dislocation recovery. It was also
observed that Mo partitions into nanoscale Nb-C solute clusters and precipitates
of NbC and Fe3C during ageing, retarding the coarsening of these phases.
However, Cr was found to partition into Fe3C only, and does not contribute to the
nature of the dispersion of clusters and NbC.
Introduction ________________________________________________________________________________________________________________________________
1
1 Introduction
Worldwide, steel markets are expanding due to growing population resulting in
expanding urban communities [1–3]. Therefore, novel higher performance steels
are needed for enabling mechanical design with thinner structural elements,
leading to weight reduction and, thus, reduced fuel consumption and CO2
emissions in transport applications. Due to their exceptional cost-performance
ratio, modern HSLA steels are excellent candidates to cover the corresponding
growing demands for advanced steels for construction and transportation [2,3].
HSLA steels are conventionally manufactured by a sophisticated temperature and
deformation schedule known as thermo-mechanical processing (TMP), which
allows to precisely control the microstructural evolution. Here, engineering of a
designed target microstructures can lead to the desired mechanical properties, i.e.
high strength and elongation. Newer, advanced thermo-mechanical processing
routes which include lowering of rolling temperatures to the ferrite region or
annealing of cold-rolled martensite have been shown to have a significant effect
on grain refinement in mild steels. This leads to grain sizes in the submicron
regime, resulting in exceptional yield strength [4–6]. It has been proposed that the
mechanism behind the grain fragmentation is continuous dynamic
recrystallisation [4,7,8]. However, challenges such as low work-hardening
capability and delamination due to rather large cementite particles still need to be
overcome in such steels [4,9]. It is further known that steels with hierarchical
microstructures, which are defined as microstructures exhibiting features across
several length-scales, are able to overcome the well-known strength-elongation
trade-off [10,11]. Thus, the approach of this thesis is to overcome the issues during
aTMP of mild steels with designing aTMPs for modern HSLA steels. This is
because nano-scale precipitates present in such steels are assumed to more
uniformly decorate dislocation networks, by creating the desired hierarchical
microstructures, avoiding delamination and increasing the work hardening
rate [12]. An additional goal is to explore how far the limits for achieving ultrafine
grains that consist of mostly high angle grain boundaries (HAGBs) (i.e. ratio of
HAGBs to low angle grain boundaries (LAGBs)) can be pushed with processing
Introduction ________________________________________________________________________________________________________________________________
2
methods that can potentially be up-scaled. In this thesis Nb and Mo, as well as
their combined effect as microalloying elements, are studied in detail because Nb
is one of the most common and well-studied microalloying elements in HSLA
steels. The main benefits of Nb are precipitation strengthening and its major role
in solute drag and grain boundary pinning [13–16]. Mo is known to increase
hardenability and can delay phase transformations and recrystallisation [17,18].
Alloying with both, Nb and Mo, can lead to a change in the precipitation sequence
[18] which, so far, is not well understood. Further focus is laid on Cr as
microalloying element because it is known to inhibit cementite coarsening [19,20].
The long-term strategic goal of this research program is to achieve an ultimate
tensile strength of ~1100 MPa and a ductile to brittle transition temperature that
might be lower than ~120°C. This thesis investigates only a part of this research
program aimed on the design and implementation of a novel thermo-mechanical
procedure, initially using a simpler steel composition. It is not expected to achieve
a reduction in forces. However, this new processing route, which is limited to rolling
and sheet material, is expected to be more time and energy efficient in terms of
energy used for heat treatments. The design of hierarchical microstructures is a
common aim in modern process and alloy design. However, the detailed aim of
this thesis is to obtain these in HSLA steels, because superior properties
compared to mild steels subjected to advanced thermo-mechanical processing are
expected.The main project objectives discussed in the following chapters are:
1. Study the feasibility of HSLA steels for aTMP to obtain hierarchical
microstructures.
2. Design of an aTMP route that is optimised for achieving homogenous
microstructures in HSLA steels.
3. Up-scale the process to thoroughly study the mechanical properties and
therefore the success of this approach.
4. Study the effect of Cr and Mo as microalloying elements in a Nb
microalloyed steel that has been warm deformed in the ferrite.
To summarise, the main goal of this thesis is to study the microstructure-property
relationship of HSLA steels that have been subjected to deformation in the ferrite

Introduction ________________________________________________________________________________________________________________________________
3
region with correlative high-resolution microscopy and mechanical testing. This
experimental work is accompanied by thermo-kinetic modelling using the software
package MatCalc.
Literature Review ________________________________________________________________________________________________________________________________
4
2 Literature Review
2.1 Steel industry, applications and needs
Since 1950 there has been a steady growth in crude steel production peaking in
2018 at 1,808 million tonnes [1]. Steel products are very versatile as they combine
strength and formability in a way that is tailored to the specific application.
Moreover, they are 100% recyclable. The largest steel market is building and
infrastructure at about 50% followed by mechanical equipment and the automotive
industry [2]. These expanding steel markets can be explained by the world’s
population growth which is expected to reach a maximum of 2.7 billion people by
2050 leading to fast urbanisation [3]. A reduction in usage of natural resources
and accompanying emissions is vital in enabling a sustainable future. Steelmakers
are providing structural solutions for building smart houses that are energy
efficient. Automotive industries are innovating in light-weight design utilising
thinner structural elements and, thus, leading to reduced fuel consumption and
greenhouse gas emissions. These developments clearly highlight the need for
higher performance steels that meet higher environmental standards [3]. HSLA
steels are excellent candidates to fulfil these needs because of their remarkable
strength to weight ratio.
2.2 HSLA steels
A low C steel with small amounts of (micro-) alloying elements is called high
strength low alloy steel. For the first time in the 1960s small amounts
(0.005-0.03 wt%) of Nb were added to simple mild steels which led to an increased
strength up to 415 MPa with relatively good toughness [21]. In contrast to simpler
steels, such as plain or mild steels, the key mechanical properties of HSLA steels,
hardness and yield strength, are increased significantly by low additions of
microalloying elements. Common microalloying elements are Nb, Mo, V and Ti,
and they are known to form precipitates that provide precipitation hardening and,
more importantly, grain size control via Zener pinning and solute drag during
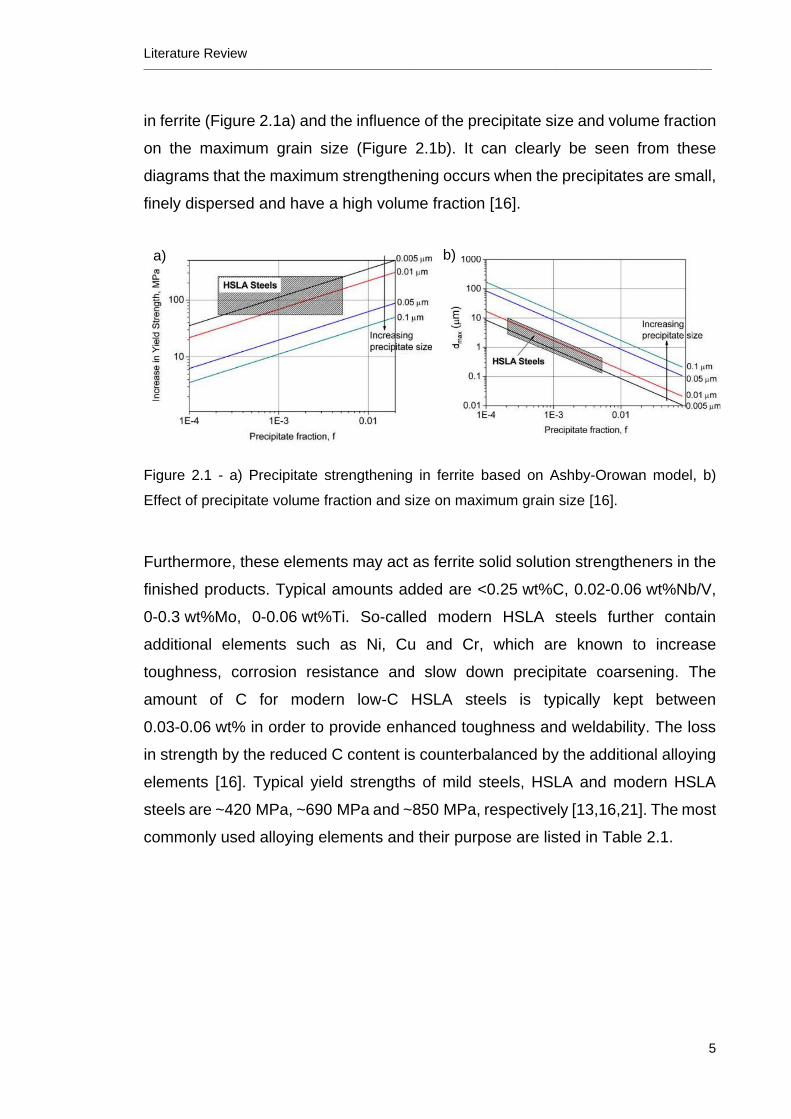
processing [13,16,21]. Figure 2.1 pictures the strengthening effects of precipitates
Literature Review ________________________________________________________________________________________________________________________________
5
in ferrite (Figure 2.1a) and the influence of the precipitate size and volume fraction
on the maximum grain size (Figure 2.1b). It can clearly be seen from these
diagrams that the maximum strengthening occurs when the precipitates are small,
finely dispersed and have a high volume fraction [16].
Figure 2.1 - a) Precipitate strengthening in ferrite based on Ashby-Orowan model, b)
Effect of precipitate volume fraction and size on maximum grain size [16].
Furthermore, these elements may act as ferrite solid solution strengtheners in the
finished products. Typical amounts added are <0.25 wt%C, 0.02-0.06 wt%Nb/V,
0-0.3 wt%Mo, 0-0.06 wt%Ti. So-called modern HSLA steels further contain
additional elements such as Ni, Cu and Cr, which are known to increase
toughness, corrosion resistance and slow down precipitate coarsening. The
amount of C for modern low-C HSLA steels is typically kept between
0.03-0.06 wt% in order to provide enhanced toughness and weldability. The loss
in strength by the reduced C content is counterbalanced by the additional alloying
elements [16]. Typical yield strengths of mild steels, HSLA and modern HSLA
steels are ~420 MPa, ~690 MPa and ~850 MPa, respectively [13,16,21]. The most
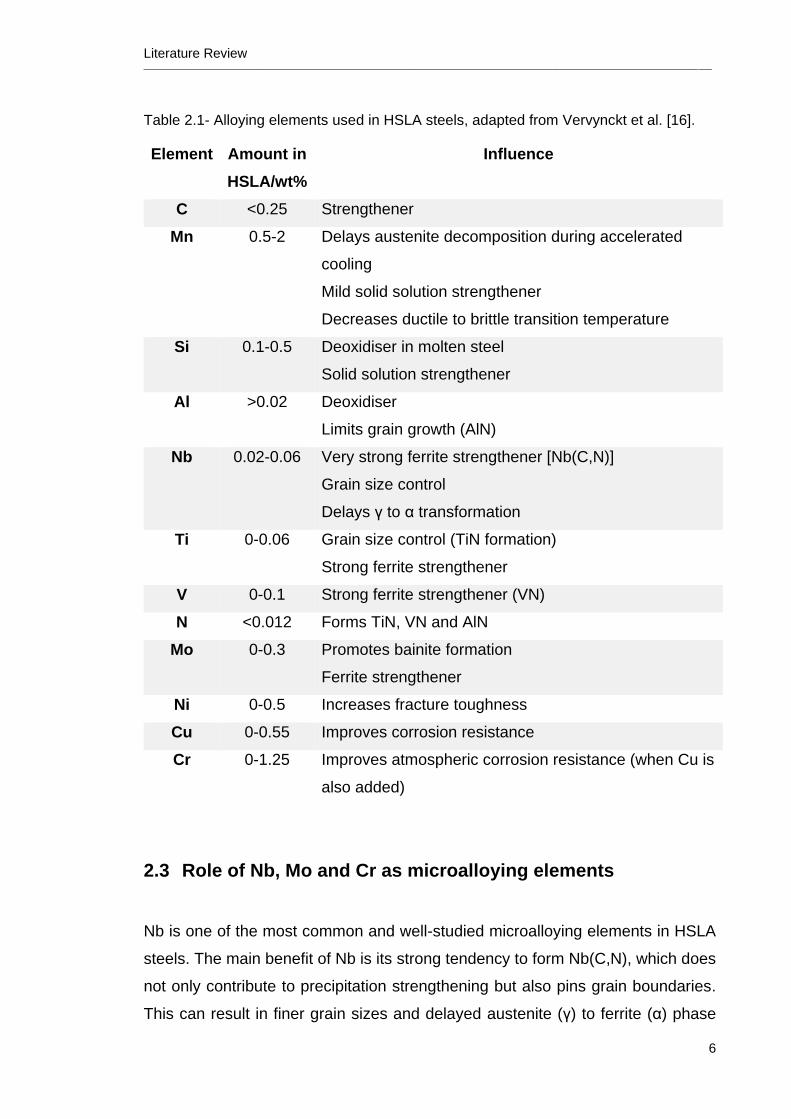
commonly used alloying elements and their purpose are listed in Table 2.1.
a) b)
Literature Review ________________________________________________________________________________________________________________________________
6
Table 2.1- Alloying elements used in HSLA steels, adapted from Vervynckt et al. [16].
Element Amount in
HSLA/wt%
Influence
C <0.25 Strengthener
Mn 0.5-2 Delays austenite decomposition during accelerated
cooling
Mild solid solution strengthener
Decreases ductile to brittle transition temperature
Si 0.1-0.5 Deoxidiser in molten steel
Solid solution strengthener
Al >0.02 Deoxidiser
Limits grain growth (AlN)
Nb 0.02-0.06 Very strong ferrite strengthener [Nb(C,N)]
Grain size control
Delays γ to α transformation
Ti 0-0.06 Grain size control (TiN formation)
Strong ferrite strengthener
V 0-0.1 Strong ferrite strengthener (VN)
N <0.012 Forms TiN, VN and AlN
Mo 0-0.3 Promotes bainite formation
Ferrite strengthener
Ni 0-0.5 Increases fracture toughness
Cu 0-0.55 Improves corrosion resistance
Cr 0-1.25 Improves atmospheric corrosion resistance (when Cu is
also added)
2.3 Role of Nb, Mo and Cr as microalloying elements
Nb is one of the most common and well-studied microalloying elements in HSLA
steels. The main benefit of Nb is its strong tendency to form Nb(C,N), which does
not only contribute to precipitation strengthening but also pins grain boundaries.
This can result in finer grain sizes and delayed austenite (γ) to ferrite (α) phase
Literature Review ________________________________________________________________________________________________________________________________
7
transformation. Furthermore, the solute drag effect of Nb, where solute Nb
segregates to dislocations and grain boundaries, is a major contributor to
increasing strength and retarding recrystallisation in steels [13,14,16,22].
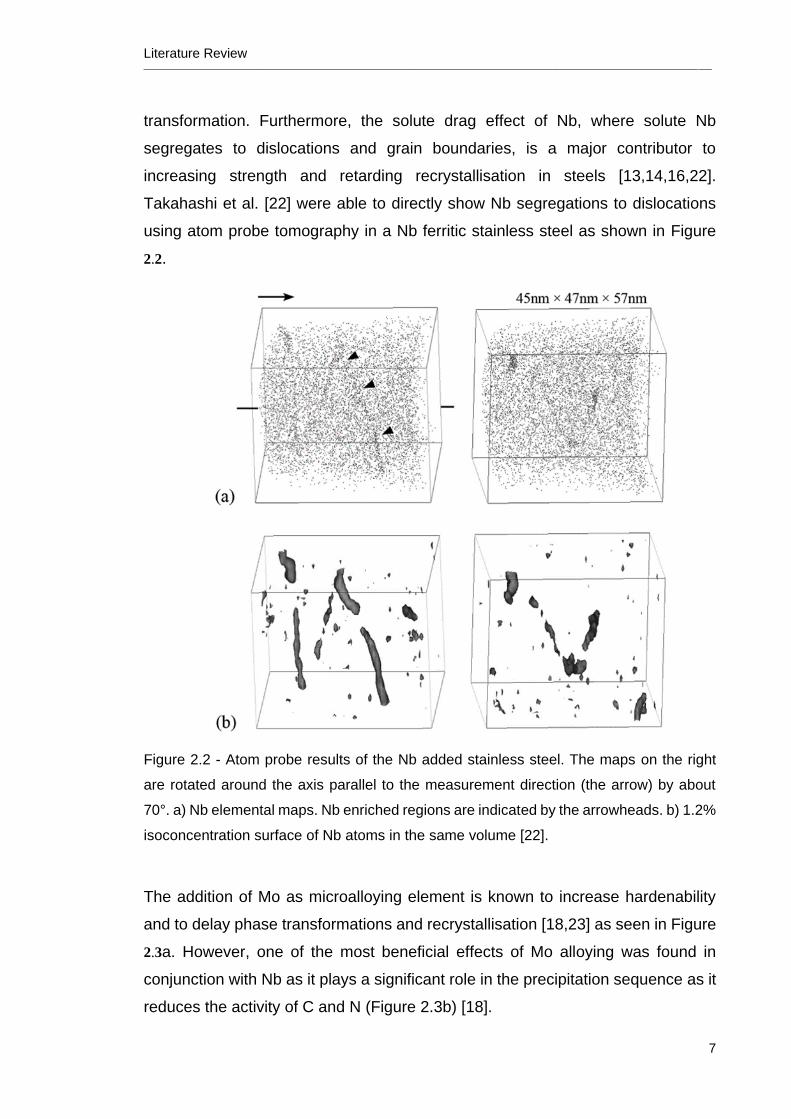
Takahashi et al. [22] were able to directly show Nb segregations to dislocations
using atom probe tomography in a Nb ferritic stainless steel as shown in Figure
2.2.
Figure 2.2 - Atom probe results of the Nb added stainless steel. The maps on the right
are rotated around the axis parallel to the measurement direction (the arrow) by about
70°. a) Nb elemental maps. Nb enriched regions are indicated by the arrowheads. b) 1.2%
isoconcentration surface of Nb atoms in the same volume [22].
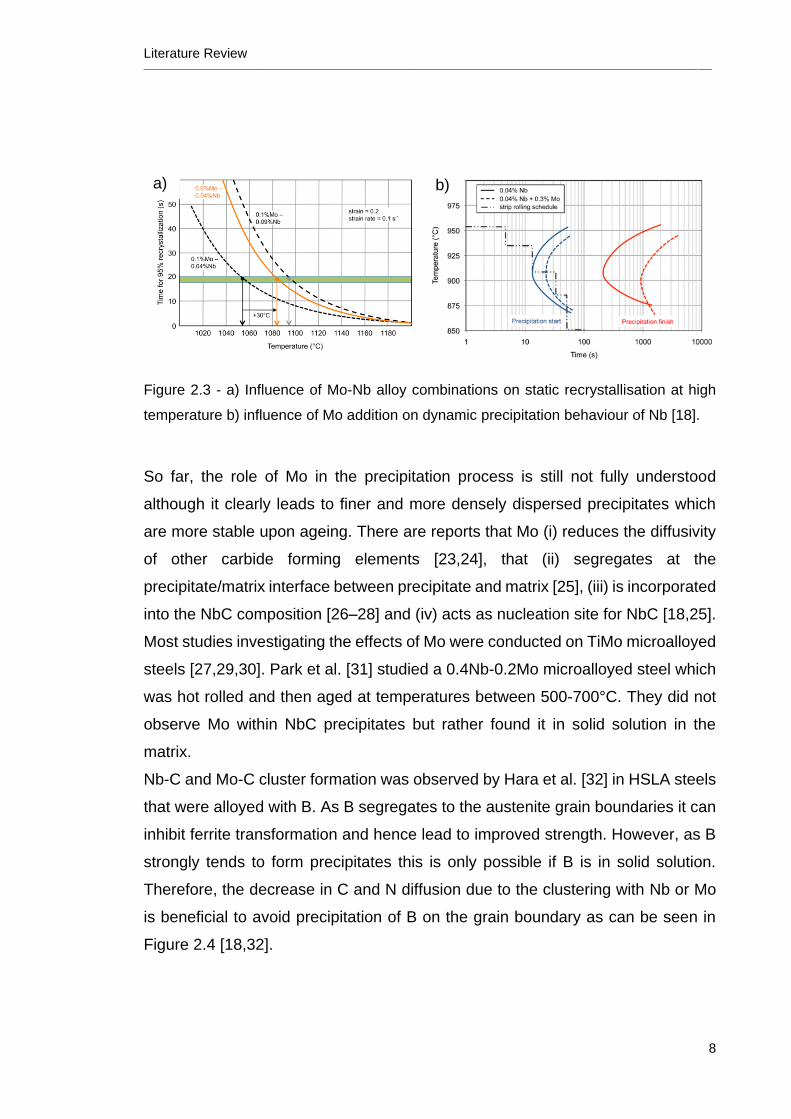
The addition of Mo as microalloying element is known to increase hardenability
and to delay phase transformations and recrystallisation [18,23] as seen in Figure
2.3a. However, one of the most beneficial effects of Mo alloying was found in
conjunction with Nb as it plays a significant role in the precipitation sequence as it
reduces the activity of C and N (Figure 2.3b) [18].
Literature Review ________________________________________________________________________________________________________________________________
8
Figure 2.3 - a) Influence of Mo-Nb alloy combinations on static recrystallisation at high
temperature b) influence of Mo addition on dynamic precipitation behaviour of Nb [18].
So far, the role of Mo in the precipitation process is still not fully understood
although it clearly leads to finer and more densely dispersed precipitates which
are more stable upon ageing. There are reports that Mo (i) reduces the diffusivity
of other carbide forming elements [23,24], that (ii) segregates at the
precipitate/matrix interface between precipitate and matrix [25], (iii) is incorporated
into the NbC composition [26–28] and (iv) acts as nucleation site for NbC [18,25].
Most studies investigating the effects of Mo were conducted on TiMo microalloyed
steels [27,29,30]. Park et al. [31] studied a 0.4Nb-0.2Mo microalloyed steel which
was hot rolled and then aged at temperatures between 500-700°C. They did not
observe Mo within NbC precipitates but rather found it in solid solution in the
matrix.
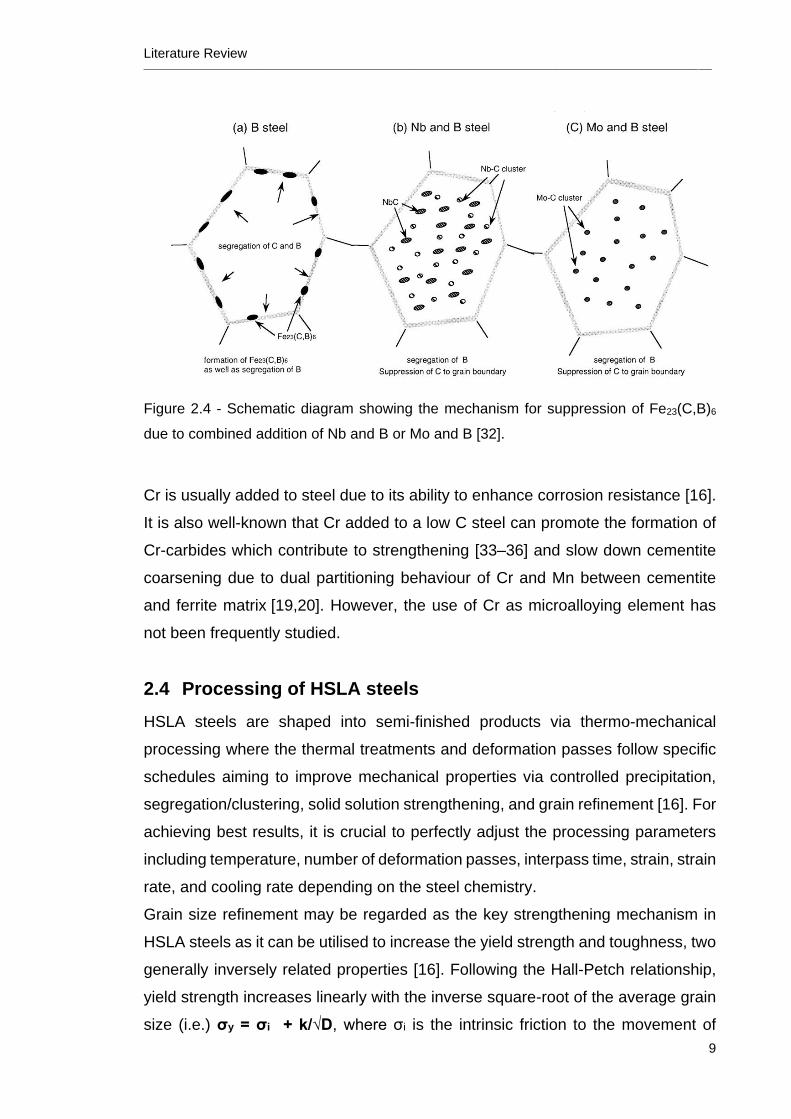
Nb-C and Mo-C cluster formation was observed by Hara et al. [32] in HSLA steels
that were alloyed with B. As B segregates to the austenite grain boundaries it can
inhibit ferrite transformation and hence lead to improved strength. However, as B
strongly tends to form precipitates this is only possible if B is in solid solution.
Therefore, the decrease in C and N diffusion due to the clustering with Nb or Mo
is beneficial to avoid precipitation of B on the grain boundary as can be seen in
Figure 2.4 [18,32].
a) b)
Literature Review ________________________________________________________________________________________________________________________________
9
Figure 2.4 - Schematic diagram showing the mechanism for suppression of Fe23(C,B)6
due to combined addition of Nb and B or Mo and B [32].
Cr is usually added to steel due to its ability to enhance corrosion resistance [16].
It is also well-known that Cr added to a low C steel can promote the formation of
Cr-carbides which contribute to strengthening [33–36] and slow down cementite
coarsening due to dual partitioning behaviour of Cr and Mn between cementite
and ferrite matrix [19,20]. However, the use of Cr as microalloying element has
not been frequently studied.
2.4 Processing of HSLA steels
HSLA steels are shaped into semi-finished products via thermo-mechanical
processing where the thermal treatments and deformation passes follow specific
schedules aiming to improve mechanical properties via controlled precipitation,
segregation/clustering, solid solution strengthening, and grain refinement [16]. For
achieving best results, it is crucial to perfectly adjust the processing parameters
including temperature, number of deformation passes, interpass time, strain, strain
rate, and cooling rate depending on the steel chemistry.
Grain size refinement may be regarded as the key strengthening mechanism in
HSLA steels as it can be utilised to increase the yield strength and toughness, two
generally inversely related properties [16]. Following the Hall-Petch relationship,
yield strength increases linearly with the inverse square-root of the average grain
size (i.e.) σy = σi + k/√D, where σi is the intrinsic friction to the movement of
Literature Review ________________________________________________________________________________________________________________________________
10
dislocations in the lattice, k is a material constant and D is the average grain
size [37]. Traditional thermo-mechanical processing (TMP) where deformation
occurs in the lower austenite temperature region is well established and grain
sizes of around 2-5 μm are generally achieved [38–42]. Here, the grains are
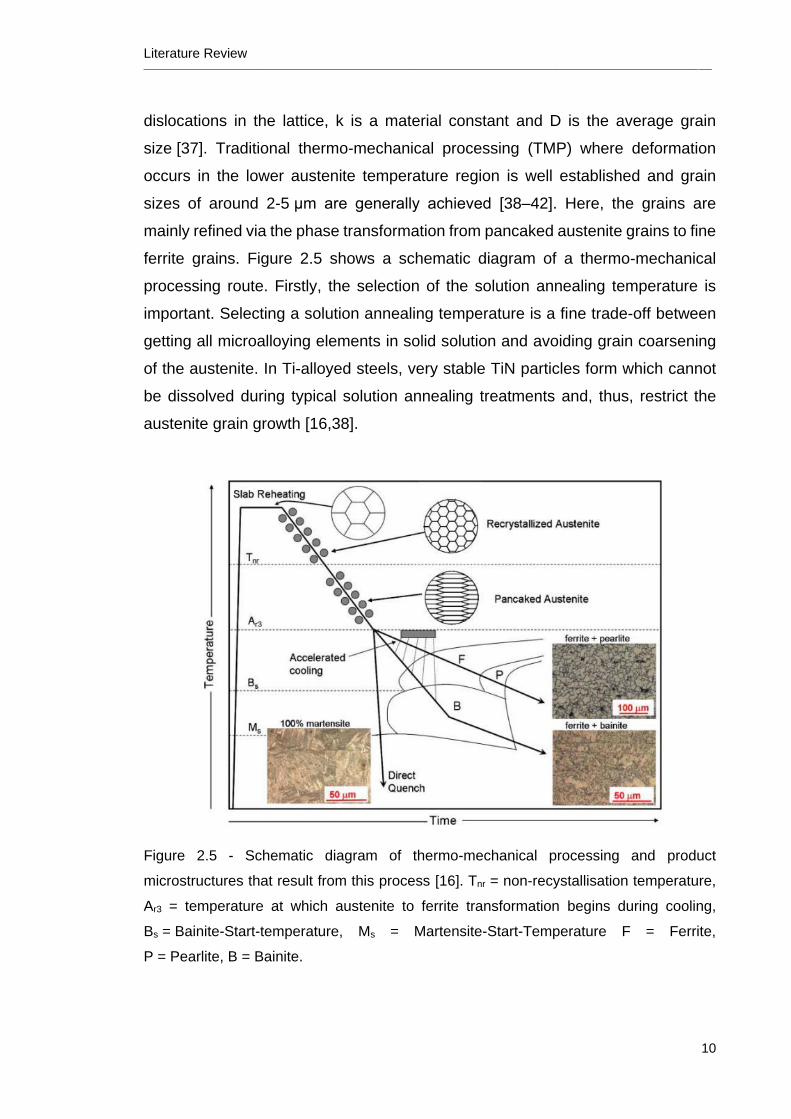
mainly refined via the phase transformation from pancaked austenite grains to fine
ferrite grains. Figure 2.5 shows a schematic diagram of a thermo-mechanical
processing route. Firstly, the selection of the solution annealing temperature is
important. Selecting a solution annealing temperature is a fine trade-off between
getting all microalloying elements in solid solution and avoiding grain coarsening
of the austenite. In Ti-alloyed steels, very stable TiN particles form which cannot
be dissolved during typical solution annealing treatments and, thus, restrict the
austenite grain growth [16,38].
Figure 2.5 - Schematic diagram of thermo-mechanical processing and product
microstructures that result from this process [16]. Tnr = non-recystallisation temperature,
Ar3 = temperature at which austenite to ferrite transformation begins during cooling,
Bs = Bainite-Start-temperature, Ms = Martensite-Start-Temperature F = Ferrite,
P = Pearlite, B = Bainite.
Literature Review ________________________________________________________________________________________________________________________________
11
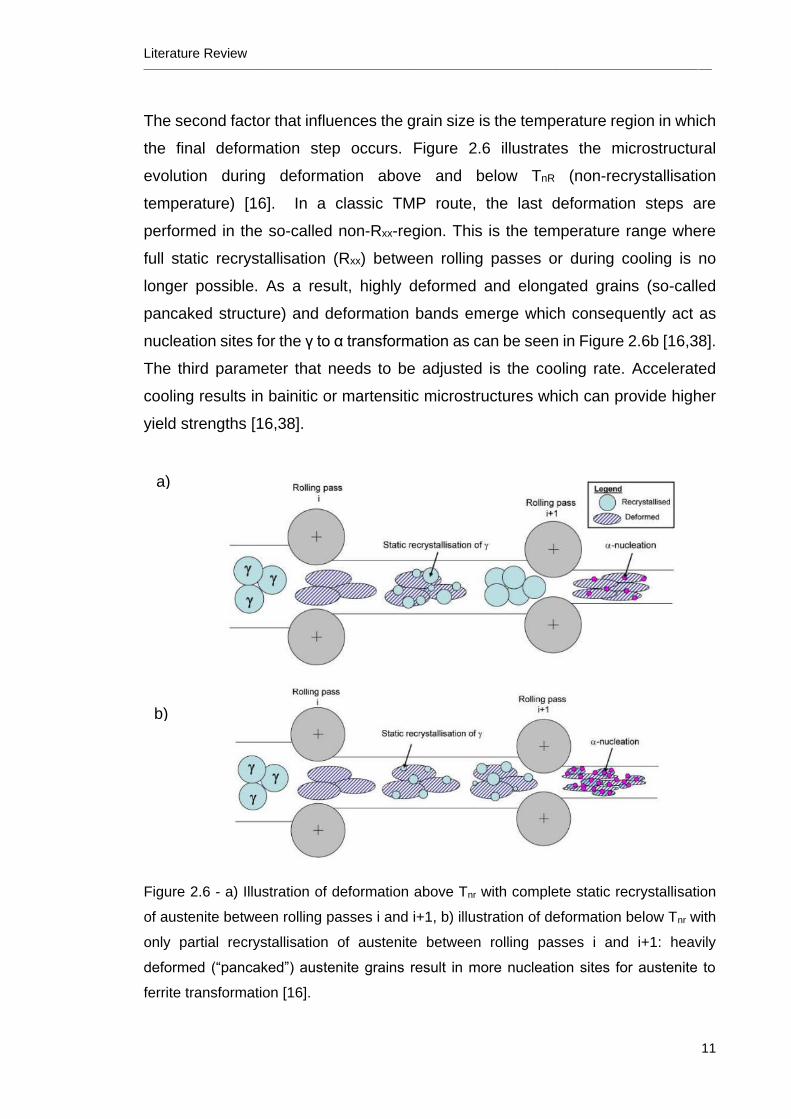
The second factor that influences the grain size is the temperature region in which
the final deformation step occurs. Figure 2.6 illustrates the microstructural
evolution during deformation above and below TnR (non-recrystallisation
temperature) [16]. In a classic TMP route, the last deformation steps are
performed in the so-called non-Rxx-region. This is the temperature range where
full static recrystallisation (Rxx) between rolling passes or during cooling is no
longer possible. As a result, highly deformed and elongated grains (so-called
pancaked structure) and deformation bands emerge which consequently act as
nucleation sites for the γ to α transformation as can be seen in Figure 2.6b [16,38].
The third parameter that needs to be adjusted is the cooling rate. Accelerated
cooling results in bainitic or martensitic microstructures which can provide higher
yield strengths [16,38].
Figure 2.6 - a) Illustration of deformation above Tnr with complete static recrystallisation
of austenite between rolling passes i and i+1, b) illustration of deformation below Tnr with
only partial recrystallisation of austenite between rolling passes i and i+1: heavily
deformed (“pancaked”) austenite grains result in more nucleation sites for austenite to
ferrite transformation [16].
a)
b)
Literature Review ________________________________________________________________________________________________________________________________
12
Isasti et al. [39] used this “classic” TMP successfully to achieve grain refinement
of Nb-Mo microalloyed steels deformed in the non-Rxx region. For a
0.05C-1.57Mn-0.05Si-0.028Nb-0.31Mo-0.028Al-0.005N steel at a coiling
temperature of 450°C, a mean unit size (which considers low angle (2-15°) and
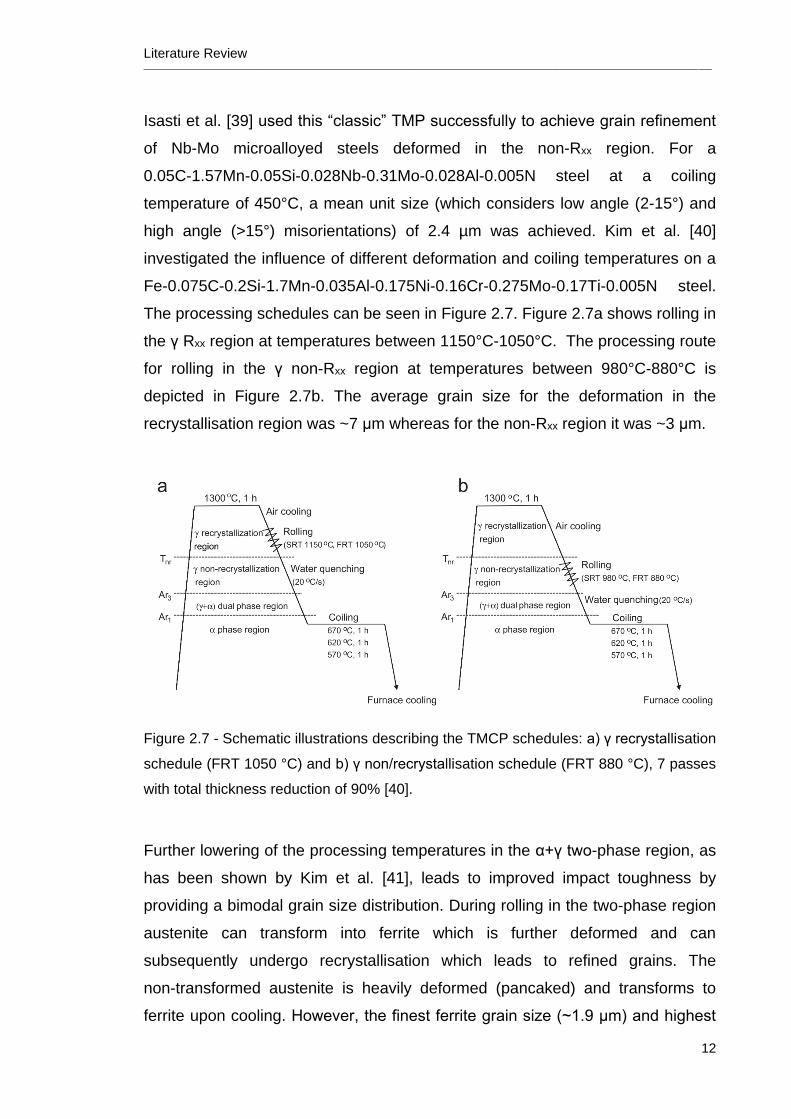
high angle (>15°) misorientations) of 2.4 µm was achieved. Kim et al. [40]
investigated the influence of different deformation and coiling temperatures on a
Fe-0.075C-0.2Si-1.7Mn-0.035Al-0.175Ni-0.16Cr-0.275Mo-0.17Ti-0.005N steel.
The processing schedules can be seen in Figure 2.7. Figure 2.7a shows rolling in
the γ Rxx region at temperatures between 1150°C-1050°C. The processing route
for rolling in the γ non-Rxx region at temperatures between 980°C-880°C is
depicted in Figure 2.7b. The average grain size for the deformation in the
recrystallisation region was ~7 μm whereas for the non-Rxx region it was ~3 μm.
Figure 2.7 - Schematic illustrations describing the TMCP schedules: a) γ recrystallisation
schedule (FRT 1050 °C) and b) γ non/recrystallisation schedule (FRT 880 °C), 7 passes
with total thickness reduction of 90% [40].
Further lowering of the processing temperatures in the α+γ two-phase region, as
has been shown by Kim et al. [41], leads to improved impact toughness by
providing a bimodal grain size distribution. During rolling in the two-phase region
austenite can transform into ferrite which is further deformed and can
subsequently undergo recrystallisation which leads to refined grains. The
non-transformed austenite is heavily deformed (pancaked) and transforms to
ferrite upon cooling. However, the finest ferrite grain size (~1.9 μm) and highest
Literature Review ________________________________________________________________________________________________________________________________
13
strength was be achieved by rolling in the non-Rxx region [41]. Similar results were
reported by Ghosh and Mula [42] who studied a Nb-Ti microalloyed steel at
different deformation temperatures (in the Rxx region, non-Rxx region and the α+γ
region) and for different coiling temperatures. The best balance between the
mechanical properties was be achieved with deformation in the two-phase region
because of the bimodal grain size distribution. Fine grains (~2 µm) are favourable
for strength and larger grains (~35 µm) for ductility.
2.5 advanced TMP
More recent attempts in thermo-mechanical processing aim to achieve ultrafine
grained (UFG) microstructures with grain sizes below 1 μm. This is because
exceptional mechanical properties with yield strengths of 1,000 MPa and beyond
are unlocked in this regime. It is widely known that severe plastic deformation is a
suitable method to achieve these UFG microstructures although the high
logarithmic true strains (up to 5.6) required and the small material volumes limit
the feasibility of such approaches in industrial-scale processing [4,43,44]. More
industrially viable approaches that only use comparably small logarithmic true
strains, typically in the range from 1-3.6, are so-called advanced
thermo-mechanical processing routes [4]. Examples are warm deformation in the
ferrite region of various starting microstructures such as ferrite/pearlite or
martensite, tempforming (deformation of tempered martensite) [4,5,9,45–50] or
intercritical annealing of cold-rolled martensite [6,51–59].
2.5.1 Warm rolling in the ferrite region
Warm deformation describes processing that occurs in the ferrite region which has
been shown to be successful in producing ultrafine grains by several research
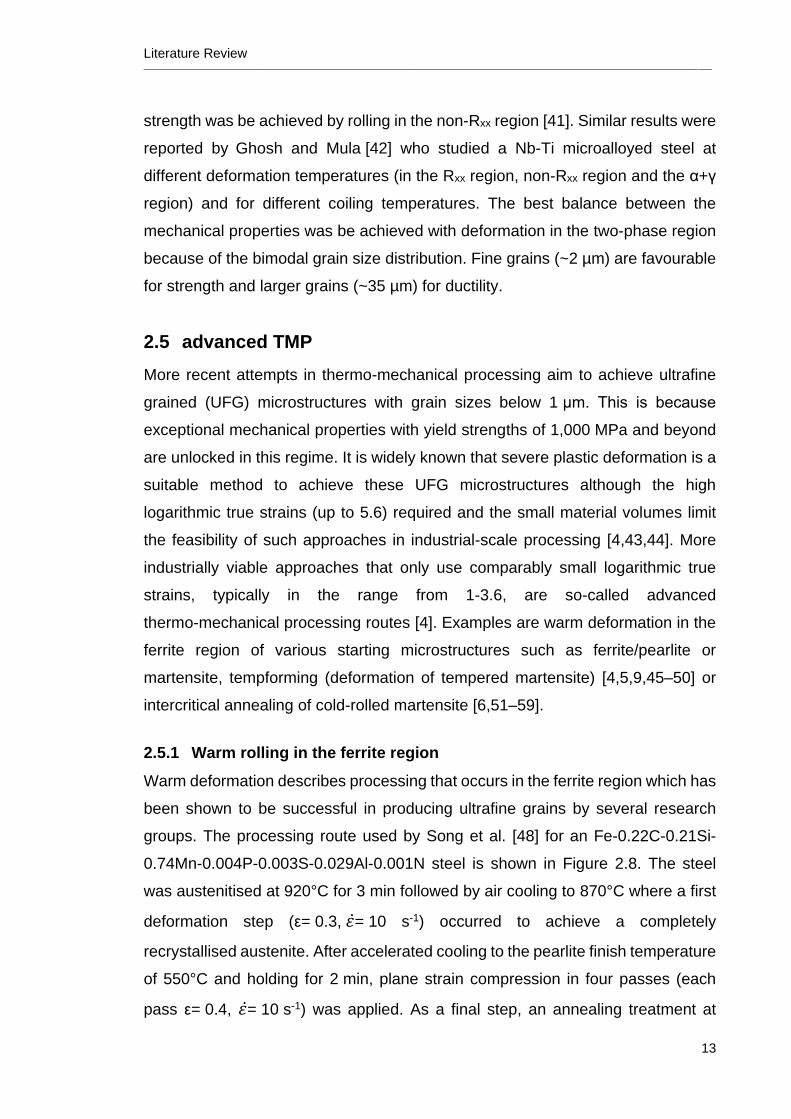
groups. The processing route used by Song et al. [48] for an Fe-0.22C-0.21Si-
0.74Mn-0.004P-0.003S-0.029Al-0.001N steel is shown in Figure 2.8. The steel
was austenitised at 920°C for 3 min followed by air cooling to 870°C where a first
deformation step (ε= 0.3, 𝜀̇= 10 s-1) occurred to achieve a completely
recrystallised austenite. After accelerated cooling to the pearlite finish temperature
of 550°C and holding for 2 min, plane strain compression in four passes (each
pass ε= 0.4, 𝜀̇= 10 s-1) was applied. As a final step, an annealing treatment at
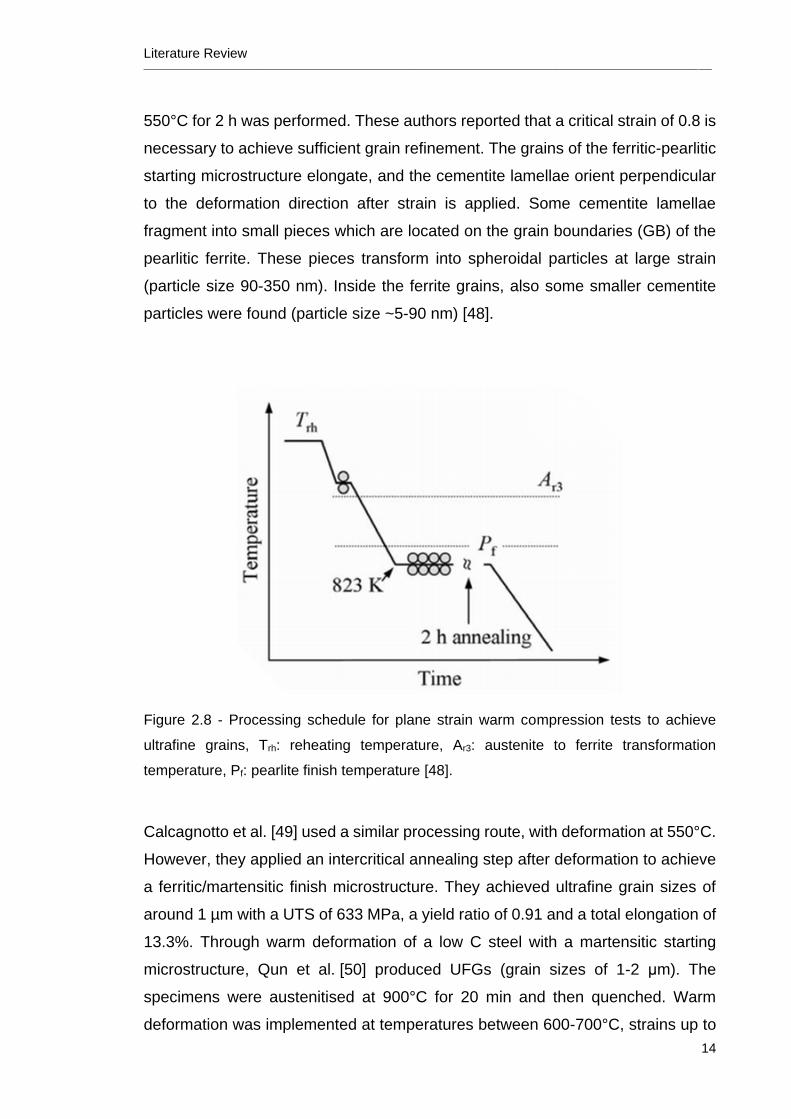
Literature Review ________________________________________________________________________________________________________________________________
14
550°C for 2 h was performed. These authors reported that a critical strain of 0.8 is
necessary to achieve sufficient grain refinement. The grains of the ferritic-pearlitic
starting microstructure elongate, and the cementite lamellae orient perpendicular
to the deformation direction after strain is applied. Some cementite lamellae
fragment into small pieces which are located on the grain boundaries (GB) of the
pearlitic ferrite. These pieces transform into spheroidal particles at large strain
(particle size 90-350 nm). Inside the ferrite grains, also some smaller cementite
particles were found (particle size ~5-90 nm) [48].
Figure 2.8 - Processing schedule for plane strain warm compression tests to achieve
ultrafine grains, Trh: reheating temperature, Ar3: austenite to ferrite transformation
temperature, Pf: pearlite finish temperature [48].
Calcagnotto et al. [49] used a similar processing route, with deformation at 550°C.
However, they applied an intercritical annealing step after deformation to achieve
a ferritic/martensitic finish microstructure. They achieved ultrafine grain sizes of
around 1 µm with a UTS of 633 MPa, a yield ratio of 0.91 and a total elongation of
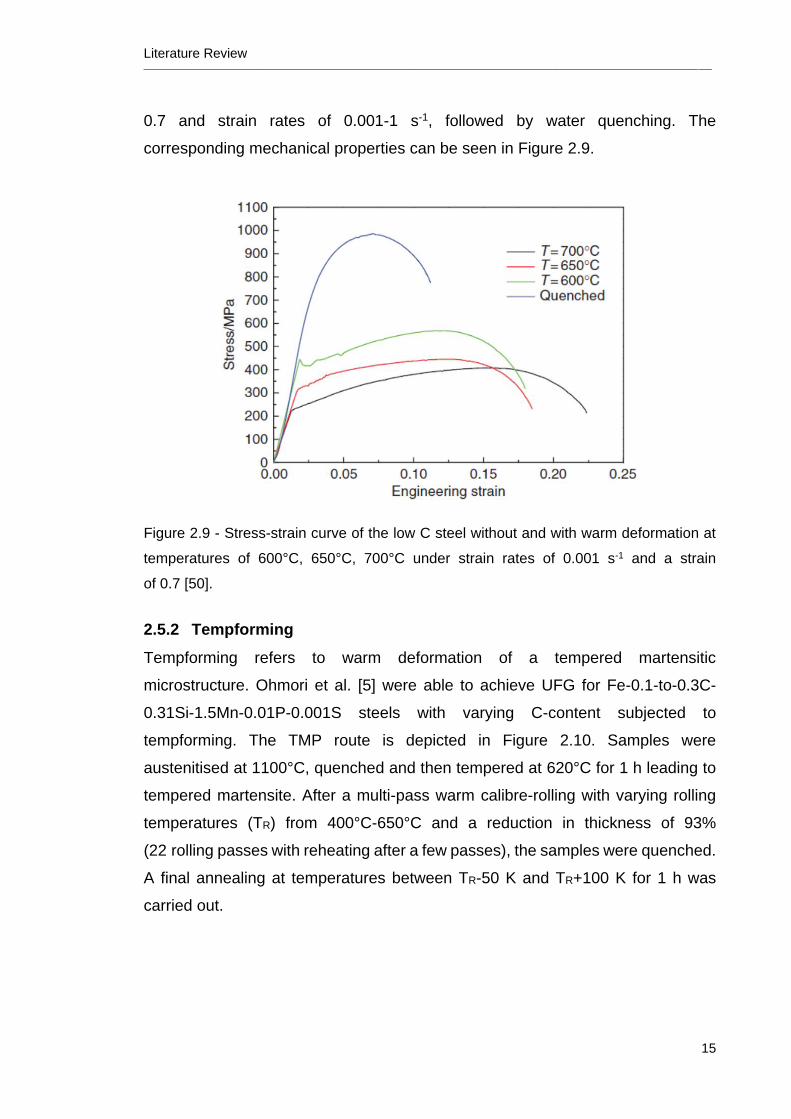
13.3%. Through warm deformation of a low C steel with a martensitic starting
microstructure, Qun et al. [50] produced UFGs (grain sizes of 1-2 μm). The
specimens were austenitised at 900°C for 20 min and then quenched. Warm
deformation was implemented at temperatures between 600-700°C, strains up to
Literature Review ________________________________________________________________________________________________________________________________
15
0.7 and strain rates of 0.001-1 s-1, followed by water quenching. The
corresponding mechanical properties can be seen in Figure 2.9.
Figure 2.9 - Stress-strain curve of the low C steel without and with warm deformation at
temperatures of 600°C, 650°C, 700°C under strain rates of 0.001 s-1 and a strain
of 0.7 [50].
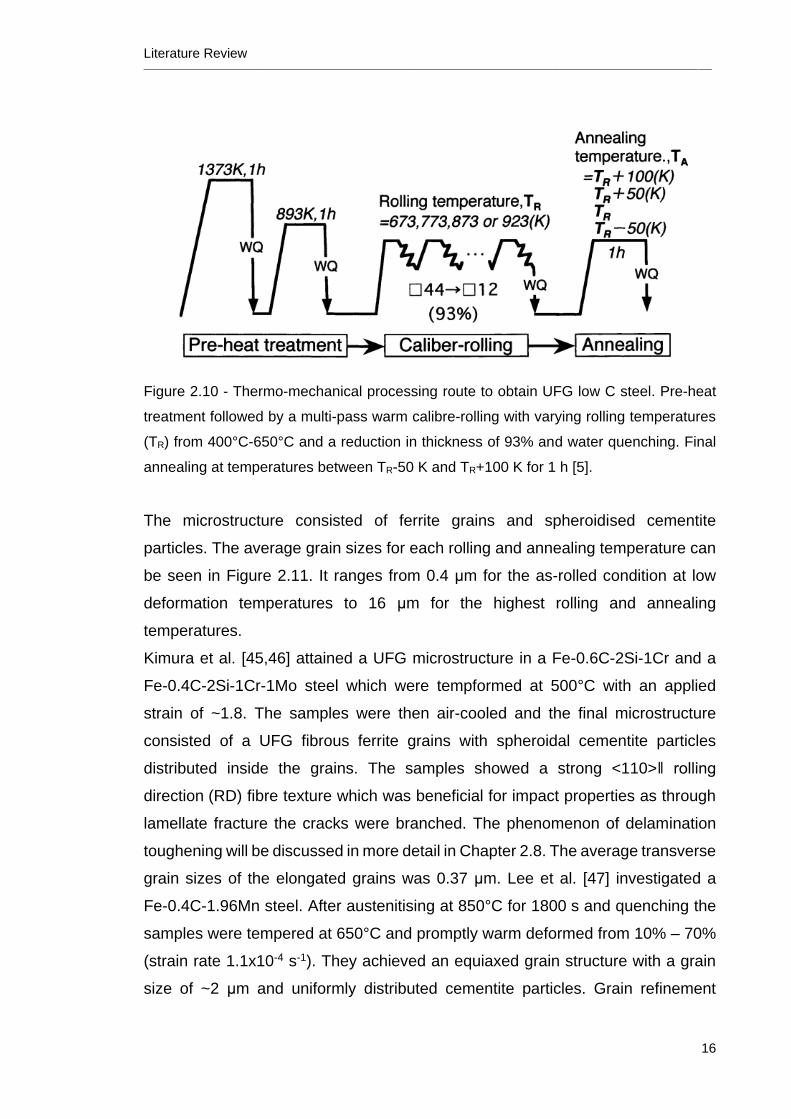
2.5.2 Tempforming
Tempforming refers to warm deformation of a tempered martensitic
microstructure. Ohmori et al. [5] were able to achieve UFG for Fe-0.1-to-0.3C-
0.31Si-1.5Mn-0.01P-0.001S steels with varying C-content subjected to
tempforming. The TMP route is depicted in Figure 2.10. Samples were
austenitised at 1100°C, quenched and then tempered at 620°C for 1 h leading to
tempered martensite. After a multi-pass warm calibre-rolling with varying rolling
temperatures (TR) from 400°C-650°C and a reduction in thickness of 93%
(22 rolling passes with reheating after a few passes), the samples were quenched.
A final annealing at temperatures between TR-50 K and TR+100 K for 1 h was
carried out.
Literature Review ________________________________________________________________________________________________________________________________
16
Figure 2.10 - Thermo-mechanical processing route to obtain UFG low C steel. Pre-heat
treatment followed by a multi-pass warm calibre-rolling with varying rolling temperatures
(TR) from 400°C-650°C and a reduction in thickness of 93% and water quenching. Final
annealing at temperatures between TR-50 K and TR+100 K for 1 h [5].
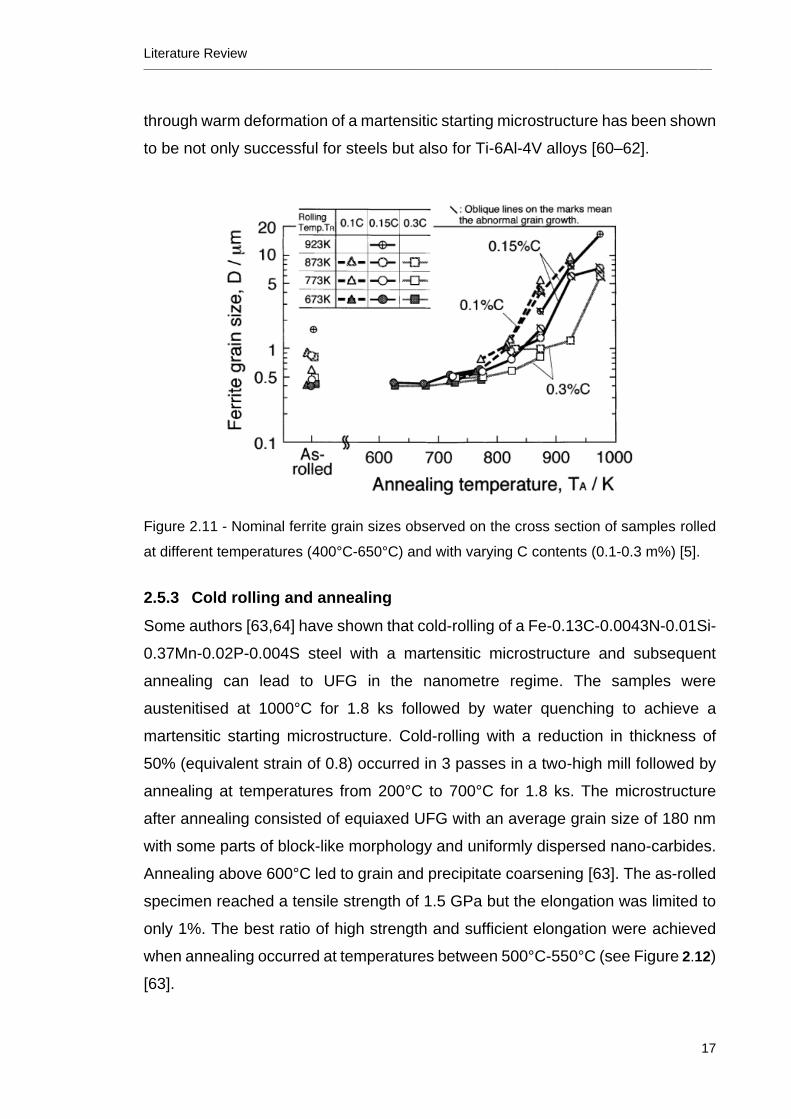
The microstructure consisted of ferrite grains and spheroidised cementite
particles. The average grain sizes for each rolling and annealing temperature can
be seen in Figure 2.11. It ranges from 0.4 μm for the as-rolled condition at low
deformation temperatures to 16 μm for the highest rolling and annealing
temperatures.
Kimura et al. [45,46] attained a UFG microstructure in a Fe-0.6C-2Si-1Cr and a
Fe-0.4C-2Si-1Cr-1Mo steel which were tempformed at 500°C with an applied
strain of ~1.8. The samples were then air-cooled and the final microstructure
consisted of a UFG fibrous ferrite grains with spheroidal cementite particles
distributed inside the grains. The samples showed a strong <110>‖ rolling
direction (RD) fibre texture which was beneficial for impact properties as through
lamellate fracture the cracks were branched. The phenomenon of delamination
toughening will be discussed in more detail in Chapter 2.8. The average transverse
grain sizes of the elongated grains was 0.37 μm. Lee et al. [47] investigated a
Fe-0.4C-1.96Mn steel. After austenitising at 850°C for 1800 s and quenching the
samples were tempered at 650°C and promptly warm deformed from 10% – 70%
(strain rate 1.1x10⁻⁴ s-1). They achieved an equiaxed grain structure with a grain
size of ~2 μm and uniformly distributed cementite particles. Grain refinement
Literature Review ________________________________________________________________________________________________________________________________
17
through warm deformation of a martensitic starting microstructure has been shown
to be not only successful for steels but also for Ti-6Al-4V alloys [60–62].
Figure 2.11 - Nominal ferrite grain sizes observed on the cross section of samples rolled
at different temperatures (400°C-650°C) and with varying C contents (0.1-0.3 m%) [5].
2.5.3 Cold rolling and annealing
Some authors [63,64] have shown that cold-rolling of a Fe-0.13C-0.0043N-0.01Si-
0.37Mn-0.02P-0.004S steel with a martensitic microstructure and subsequent
annealing can lead to UFG in the nanometre regime. The samples were
austenitised at 1000°C for 1.8 ks followed by water quenching to achieve a
martensitic starting microstructure. Cold-rolling with a reduction in thickness of
50% (equivalent strain of 0.8) occurred in 3 passes in a two-high mill followed by
annealing at temperatures from 200°C to 700°C for 1.8 ks. The microstructure
after annealing consisted of equiaxed UFG with an average grain size of 180 nm
with some parts of block-like morphology and uniformly dispersed nano-carbides.
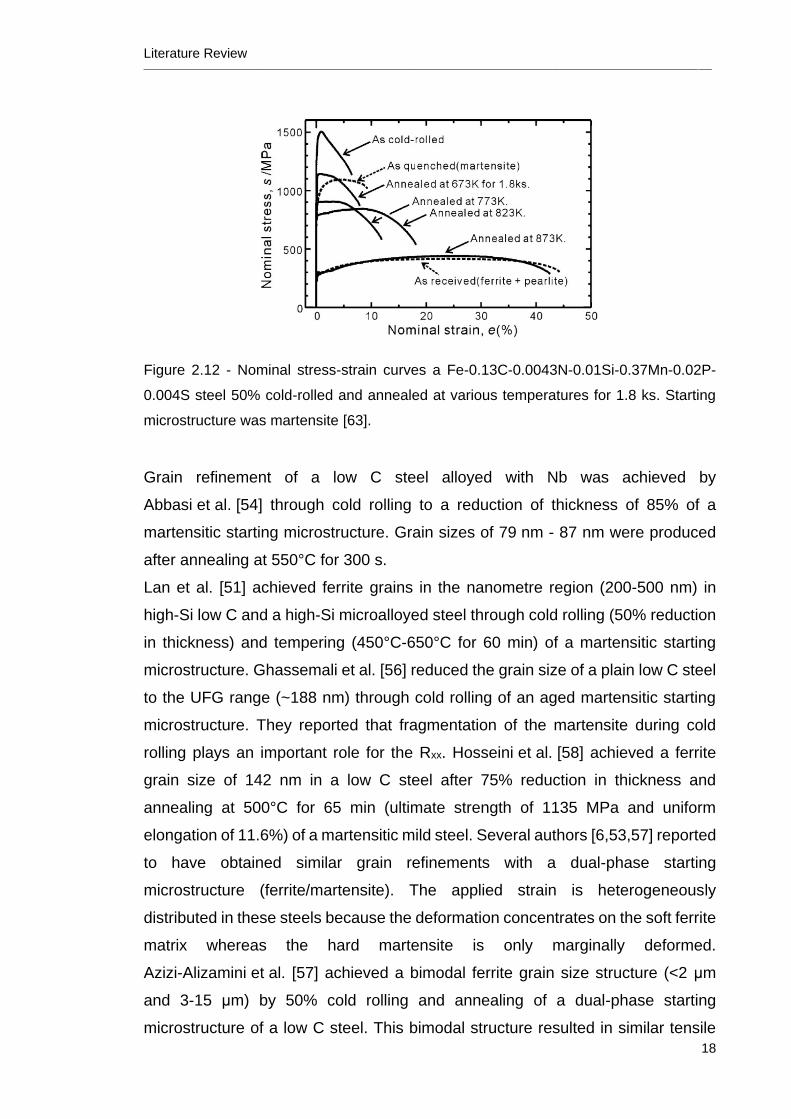
Annealing above 600°C led to grain and precipitate coarsening [63]. The as-rolled
specimen reached a tensile strength of 1.5 GPa but the elongation was limited to
only 1%. The best ratio of high strength and sufficient elongation were achieved
when annealing occurred at temperatures between 500°C-550°C (see Figure 2.12)
[63].
Literature Review ________________________________________________________________________________________________________________________________
18
Figure 2.12 - Nominal stress-strain curves a Fe-0.13C-0.0043N-0.01Si-0.37Mn-0.02P-
0.004S steel 50% cold-rolled and annealed at various temperatures for 1.8 ks. Starting
microstructure was martensite [63].
Grain refinement of a low C steel alloyed with Nb was achieved by
Abbasi et al. [54] through cold rolling to a reduction of thickness of 85% of a
martensitic starting microstructure. Grain sizes of 79 nm - 87 nm were produced
after annealing at 550°C for 300 s.
Lan et al. [51] achieved ferrite grains in the nanometre region (200-500 nm) in
high-Si low C and a high-Si microalloyed steel through cold rolling (50% reduction
in thickness) and tempering (450°C-650°C for 60 min) of a martensitic starting
microstructure. Ghassemali et al. [56] reduced the grain size of a plain low C steel
to the UFG range (~188 nm) through cold rolling of an aged martensitic starting
microstructure. They reported that fragmentation of the martensite during cold
rolling plays an important role for the Rxx. Hosseini et al. [58] achieved a ferrite
grain size of 142 nm in a low C steel after 75% reduction in thickness and
annealing at 500°C for 65 min (ultimate strength of 1135 MPa and uniform
elongation of 11.6%) of a martensitic mild steel. Several authors [6,53,57] reported
to have obtained similar grain refinements with a dual-phase starting
microstructure (ferrite/martensite). The applied strain is heterogeneously
distributed in these steels because the deformation concentrates on the soft ferrite
matrix whereas the hard martensite is only marginally deformed.
Azizi-Alizamini et al. [57] achieved a bimodal ferrite grain size structure (<2 μm
and 3-15 μm) by 50% cold rolling and annealing of a dual-phase starting
microstructure of a low C steel. This bimodal structure resulted in similar tensile
Literature Review ________________________________________________________________________________________________________________________________
19
strength (~550 MPa) and elongation (~12%) compared to a cold-rolled fully
martensite but no Lüders strain was detected.
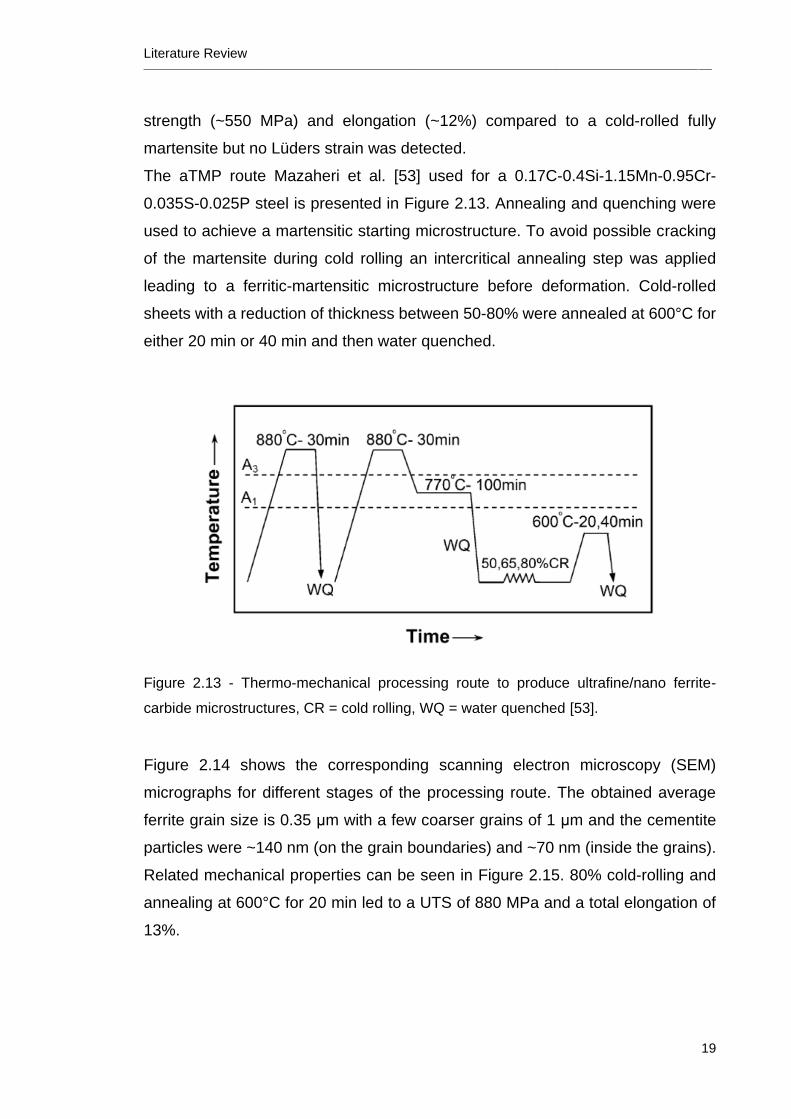
The aTMP route Mazaheri et al. [53] used for a 0.17C-0.4Si-1.15Mn-0.95Cr-
0.035S-0.025P steel is presented in Figure 2.13. Annealing and quenching were
used to achieve a martensitic starting microstructure. To avoid possible cracking
of the martensite during cold rolling an intercritical annealing step was applied
leading to a ferritic-martensitic microstructure before deformation. Cold-rolled
sheets with a reduction of thickness between 50-80% were annealed at 600°C for
either 20 min or 40 min and then water quenched.
Figure 2.13 - Thermo-mechanical processing route to produce ultrafine/nano ferrite-
carbide microstructures, CR = cold rolling, WQ = water quenched [53].
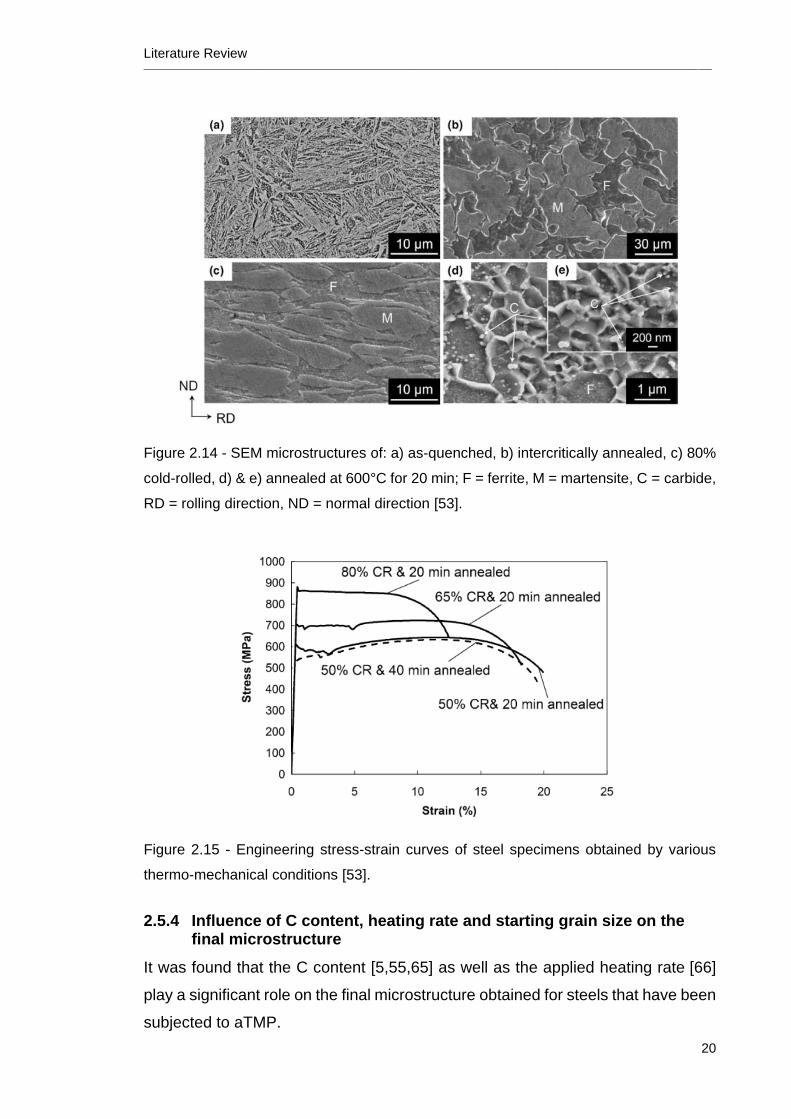
Figure 2.14 shows the corresponding scanning electron microscopy (SEM)
micrographs for different stages of the processing route. The obtained average
ferrite grain size is 0.35 μm with a few coarser grains of 1 μm and the cementite
particles were ~140 nm (on the grain boundaries) and ~70 nm (inside the grains).
Related mechanical properties can be seen in Figure 2.15. 80% cold-rolling and
annealing at 600°C for 20 min led to a UTS of 880 MPa and a total elongation of
13%.
Literature Review ________________________________________________________________________________________________________________________________
20
Figure 2.14 - SEM microstructures of: a) as-quenched, b) intercritically annealed, c) 80%
cold-rolled, d) & e) annealed at 600°C for 20 min; F = ferrite, M = martensite, C = carbide,
RD = rolling direction, ND = normal direction [53].
Figure 2.15 - Engineering stress-strain curves of steel specimens obtained by various
thermo-mechanical conditions [53].
2.5.4 Influence of C content, heating rate and starting grain size on the final microstructure
It was found that the C content [5,55,65] as well as the applied heating rate [66]
play a significant role on the final microstructure obtained for steels that have been
subjected to aTMP.
Literature Review ________________________________________________________________________________________________________________________________
21
Ohmori et al. [5] reported that generally the ferrite grain size during tempforming
decreases with increasing C-content for a Fe-0.1-to-0.3C-0.31Si-1.5Mn-0.01P-
0.001S steel. The same phenomenon was observed by Poorganji et al. [65] for a
tempformed Fe-2 m%Mn-C alloy with varying C-contents between 0.1 and
0.8 m%. They suggest that with increasing C-content the block width of the starting
microstructure decreases whereas an increase in cementite particles was
observed which suppressed dynamic recrystallization (DRX). Foroozmehr et al.
[55] also investigated the influence of the C content on microstructure of a cold-
rolled and annealed low C steel. They found that the martensite becomes finer
with higher C content and the necessary amount of cold reduction for gaining UFG
decreases as well.
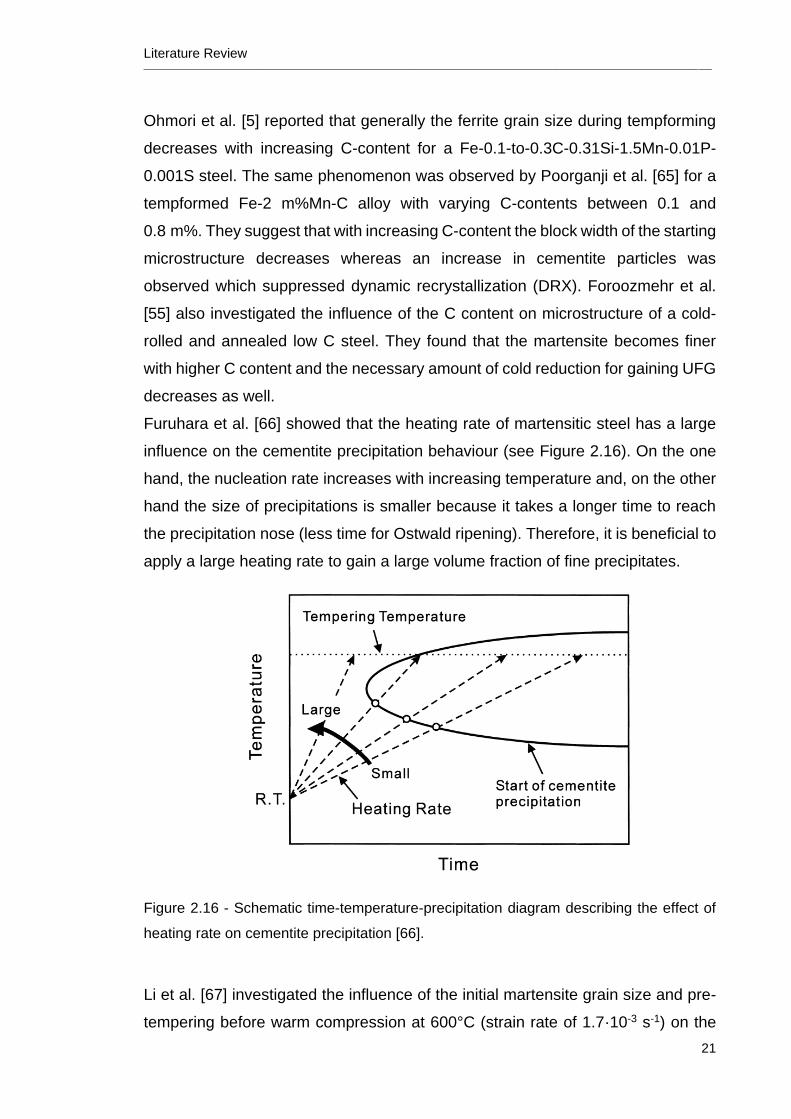
Furuhara et al. [66] showed that the heating rate of martensitic steel has a large
influence on the cementite precipitation behaviour (see Figure 2.16). On the one
hand, the nucleation rate increases with increasing temperature and, on the other
hand the size of precipitations is smaller because it takes a longer time to reach
the precipitation nose (less time for Ostwald ripening). Therefore, it is beneficial to
apply a large heating rate to gain a large volume fraction of fine precipitates.
Figure 2.16 - Schematic time-temperature-precipitation diagram describing the effect of
heating rate on cementite precipitation [66].
Li et al. [67] investigated the influence of the initial martensite grain size and pre-
tempering before warm compression at 600°C (strain rate of 1.7·10-3 s-1) on the
Literature Review ________________________________________________________________________________________________________________________________
22
Rxx behaviour of a SM490 martensite steel. To gain martensite with different grain
sizes, austenitisation was conducted at different temperatures. These authors
found that the Rxx grain size (2.3 μm) only depends marginally on the starting grain
size. Interestingly, there is a similar dynamic recrystallisation (DRX) behaviour for
the as-quenched and pre-tempered samples although cementite particles already
existed after pre-tempering. This suggests that the cementite precipitates
achieved in this material are not effective in pinning grain boundaries.
2.6 Mechanism of grain refinement
Most reports on the mechanism behind the grain refinement during advanced
thermo-mechanical processing suggest that it is in-situ Rxx also called continuous
dynamic recrystallisation (CDRX) [4,7,8,47,52,55].
According to Gourdet et al. [68] the rate of recovery is so high that instead of a
classic recrystallization behaviour continuous dynamic recrystallisation occurs in
high stacking fault materials such as ferrite. Dislocations introduced during
deformation form subgrains, which are confined by low angle grain boundaries,
and then progressively increase their misorientation angle until they convert into
high angle grain boundaries. Low angle grain boundaries usually develop at low
strains and upon reaching strains around 1, a conversion into high angle grain
boundaries can be observed. These microstructures typically consist of a mixture
between crystallites confined either by low angle grain boundaries (LAGBs) or high
angle grain boundaries (HAGBs) [68]. In the following chapters, the concept of
grain size is based on this definition. A schematic drawing of a CDRX
microstructure is shown in Figure 2.17.
Literature Review ________________________________________________________________________________________________________________________________
23
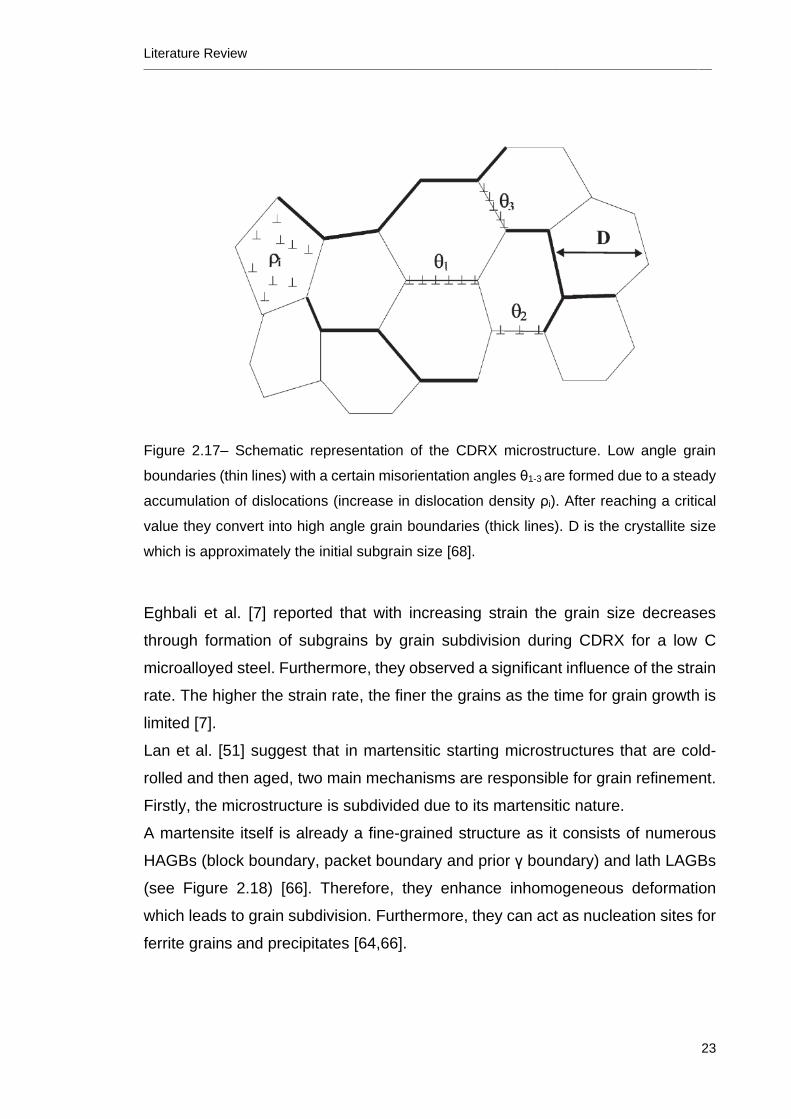
Figure 2.17– Schematic representation of the CDRX microstructure. Low angle grain
boundaries (thin lines) with a certain misorientation angles θ1-3 are formed due to a steady
accumulation of dislocations (increase in dislocation density ρi). After reaching a critical
value they convert into high angle grain boundaries (thick lines). D is the crystallite size
which is approximately the initial subgrain size [68].
Eghbali et al. [7] reported that with increasing strain the grain size decreases
through formation of subgrains by grain subdivision during CDRX for a low C
microalloyed steel. Furthermore, they observed a significant influence of the strain
rate. The higher the strain rate, the finer the grains as the time for grain growth is
limited [7].
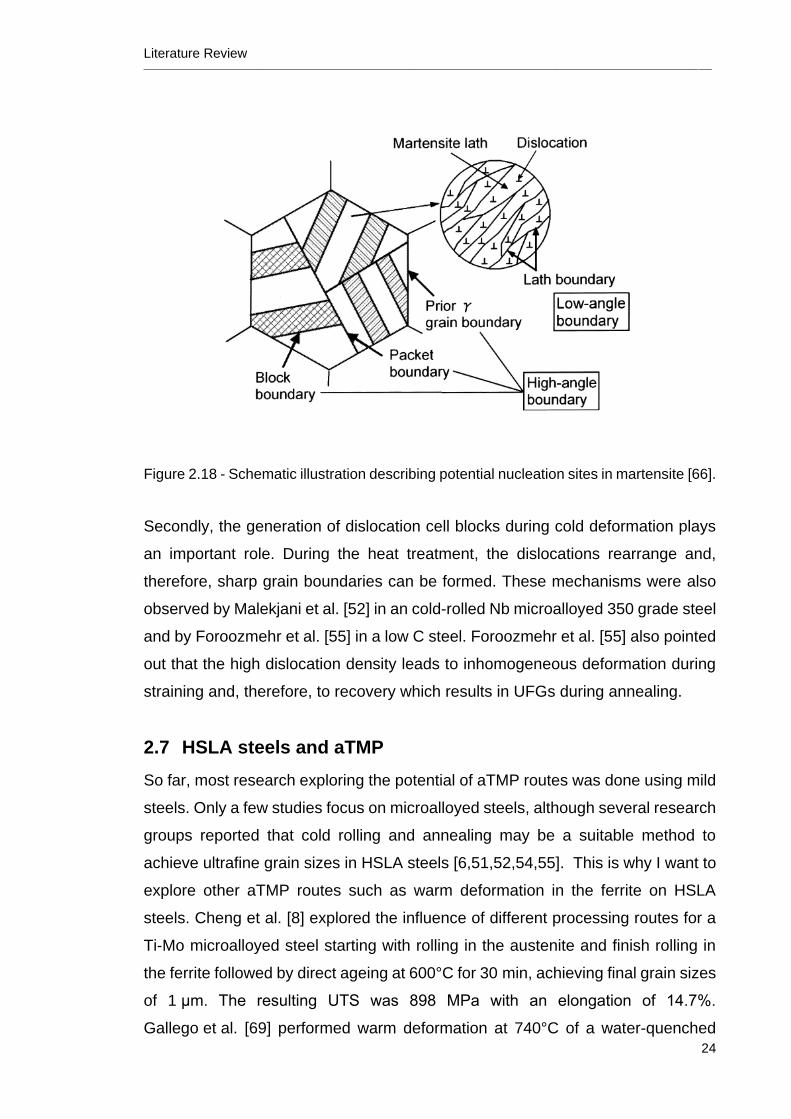
Lan et al. [51] suggest that in martensitic starting microstructures that are cold-
rolled and then aged, two main mechanisms are responsible for grain refinement.
Firstly, the microstructure is subdivided due to its martensitic nature.
A martensite itself is already a fine-grained structure as it consists of numerous
HAGBs (block boundary, packet boundary and prior γ boundary) and lath LAGBs
(see Figure 2.18) [66]. Therefore, they enhance inhomogeneous deformation
which leads to grain subdivision. Furthermore, they can act as nucleation sites for
ferrite grains and precipitates [64,66].
Literature Review ________________________________________________________________________________________________________________________________
24
Figure 2.18 - Schematic illustration describing potential nucleation sites in martensite [66].
Secondly, the generation of dislocation cell blocks during cold deformation plays
an important role. During the heat treatment, the dislocations rearrange and,
therefore, sharp grain boundaries can be formed. These mechanisms were also
observed by Malekjani et al. [52] in an cold-rolled Nb microalloyed 350 grade steel
and by Foroozmehr et al. [55] in a low C steel. Foroozmehr et al. [55] also pointed
out that the high dislocation density leads to inhomogeneous deformation during
straining and, therefore, to recovery which results in UFGs during annealing.
2.7 HSLA steels and aTMP
So far, most research exploring the potential of aTMP routes was done using mild
steels. Only a few studies focus on microalloyed steels, although several research
groups reported that cold rolling and annealing may be a suitable method to
achieve ultrafine grain sizes in HSLA steels [6,51,52,54,55]. This is why I want to
explore other aTMP routes such as warm deformation in the ferrite on HSLA
steels. Cheng et al. [8] explored the influence of different processing routes for a
Ti-Mo microalloyed steel starting with rolling in the austenite and finish rolling in
the ferrite followed by direct ageing at 600°C for 30 min, achieving final grain sizes
of 1 μm. The resulting UTS was 898 MPa with an elongation of 14.7%.
Gallego et al. [69] performed warm deformation at 740°C of a water-quenched
Literature Review ________________________________________________________________________________________________________________________________
25
HSLA steel which led to a final grain size of 0.9 μm and a combination of cementite
particles with a size of 114.7±45.5 nm as well as fine (Nb,Ti)(C,N).
2.8 Challenges and drawbacks during aTMP
Low work hardening rates due to relatively large cementite particles and
delamination are common problems in mild steels that have been subjected to
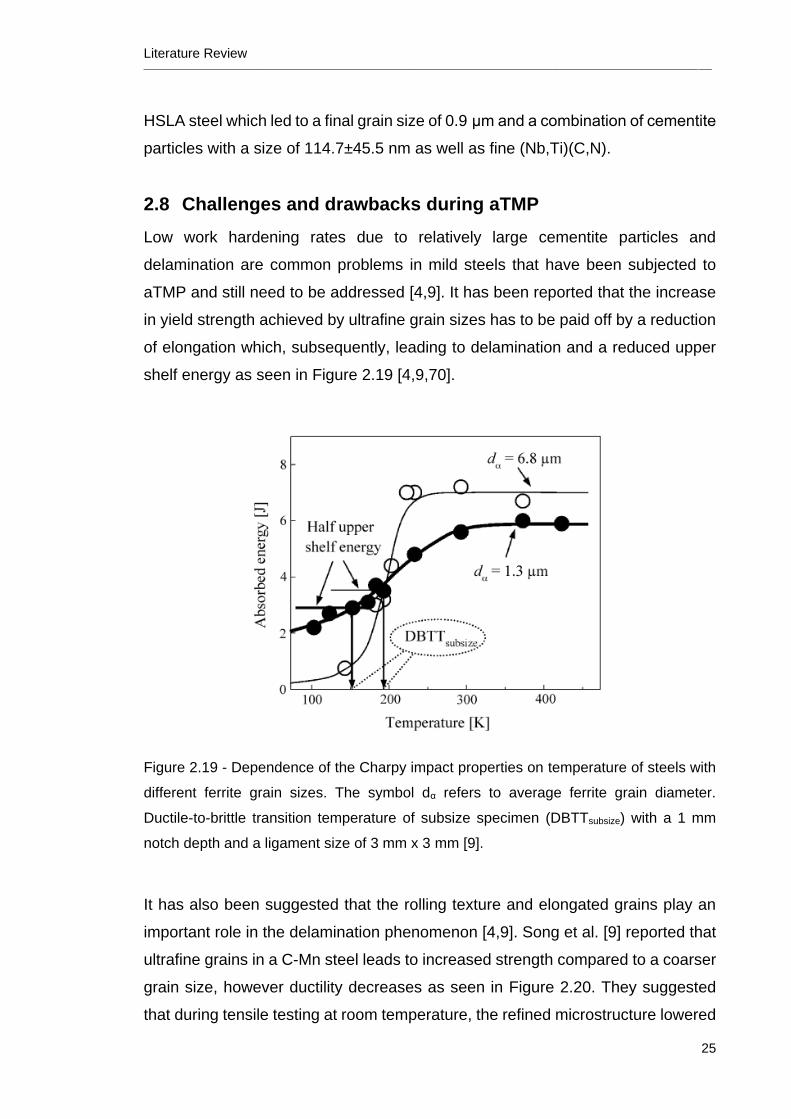
aTMP and still need to be addressed [4,9]. It has been reported that the increase
in yield strength achieved by ultrafine grain sizes has to be paid off by a reduction
of elongation which, subsequently, leading to delamination and a reduced upper
shelf energy as seen in Figure 2.19 [4,9,70].
Figure 2.19 - Dependence of the Charpy impact properties on temperature of steels with
different ferrite grain sizes. The symbol dα refers to average ferrite grain diameter.
Ductile-to-brittle transition temperature of subsize specimen (DBTTsubsize) with a 1 mm
notch depth and a ligament size of 3 mm x 3 mm [9].
It has also been suggested that the rolling texture and elongated grains play an
important role in the delamination phenomenon [4,9]. Song et al. [9] reported that
ultrafine grains in a C-Mn steel leads to increased strength compared to a coarser
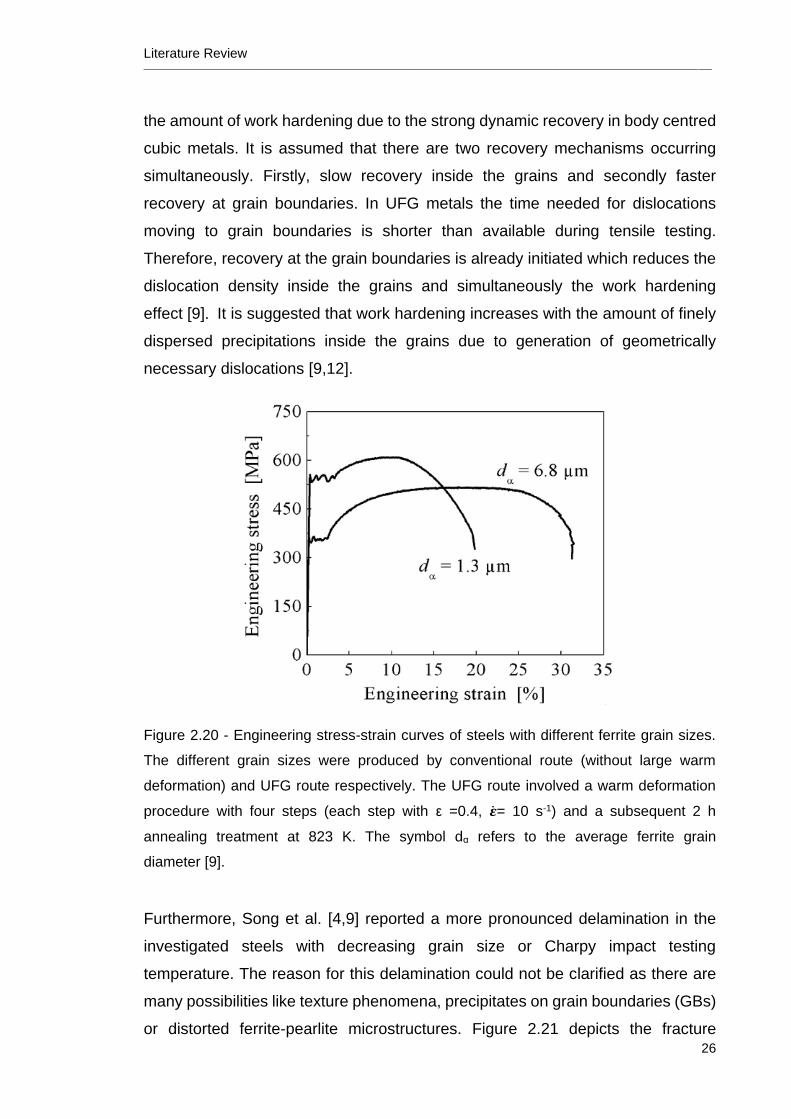
grain size, however ductility decreases as seen in Figure 2.20. They suggested
that during tensile testing at room temperature, the refined microstructure lowered
Literature Review ________________________________________________________________________________________________________________________________
26
the amount of work hardening due to the strong dynamic recovery in body centred
cubic metals. It is assumed that there are two recovery mechanisms occurring
simultaneously. Firstly, slow recovery inside the grains and secondly faster
recovery at grain boundaries. In UFG metals the time needed for dislocations
moving to grain boundaries is shorter than available during tensile testing.
Therefore, recovery at the grain boundaries is already initiated which reduces the
dislocation density inside the grains and simultaneously the work hardening
effect [9]. It is suggested that work hardening increases with the amount of finely
dispersed precipitations inside the grains due to generation of geometrically
necessary dislocations [9,12].
Figure 2.20 - Engineering stress-strain curves of steels with different ferrite grain sizes.
The different grain sizes were produced by conventional route (without large warm
deformation) and UFG route respectively. The UFG route involved a warm deformation
procedure with four steps (each step with ε =0.4, �̇�= 10 s-1) and a subsequent 2 h
annealing treatment at 823 K. The symbol dα refers to the average ferrite grain
diameter [9].
Furthermore, Song et al. [4,9] reported a more pronounced delamination in the
investigated steels with decreasing grain size or Charpy impact testing
temperature. The reason for this delamination could not be clarified as there are
many possibilities like texture phenomena, precipitates on grain boundaries (GBs)
or distorted ferrite-pearlite microstructures. Figure 2.21 depicts the fracture
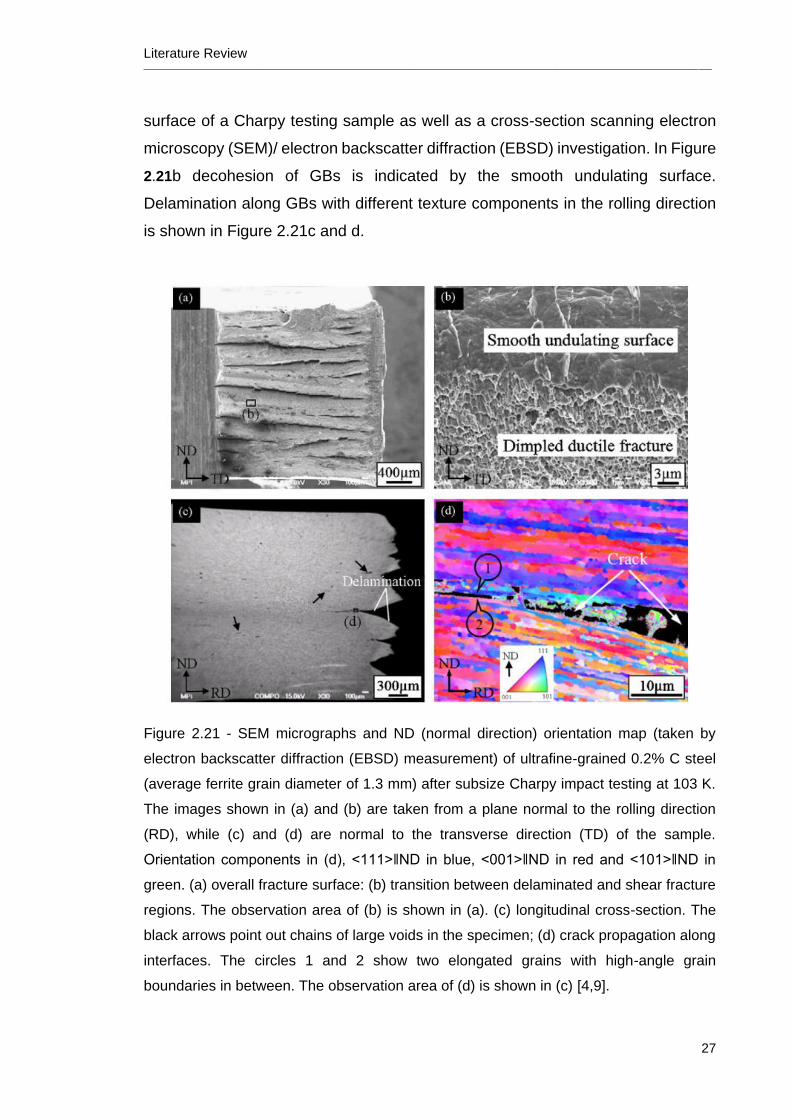
Literature Review ________________________________________________________________________________________________________________________________
27
surface of a Charpy testing sample as well as a cross-section scanning electron
microscopy (SEM)/ electron backscatter diffraction (EBSD) investigation. In Figure
2.21b decohesion of GBs is indicated by the smooth undulating surface.
Delamination along GBs with different texture components in the rolling direction
is shown in Figure 2.21c and d.
Figure 2.21 - SEM micrographs and ND (normal direction) orientation map (taken by
electron backscatter diffraction (EBSD) measurement) of ultrafine-grained 0.2% C steel
(average ferrite grain diameter of 1.3 mm) after subsize Charpy impact testing at 103 K.
The images shown in (a) and (b) are taken from a plane normal to the rolling direction
(RD), while (c) and (d) are normal to the transverse direction (TD) of the sample.
Orientation components in (d), <111>‖ND in blue, <001>‖ND in red and <101>‖ND in
green. (a) overall fracture surface: (b) transition between delaminated and shear fracture
regions. The observation area of (b) is shown in (a). (c) longitudinal cross-section. The
black arrows point out chains of large voids in the specimen; (d) crack propagation along
interfaces. The circles 1 and 2 show two elongated grains with high-angle grain
boundaries in between. The observation area of (d) is shown in (c) [4,9].
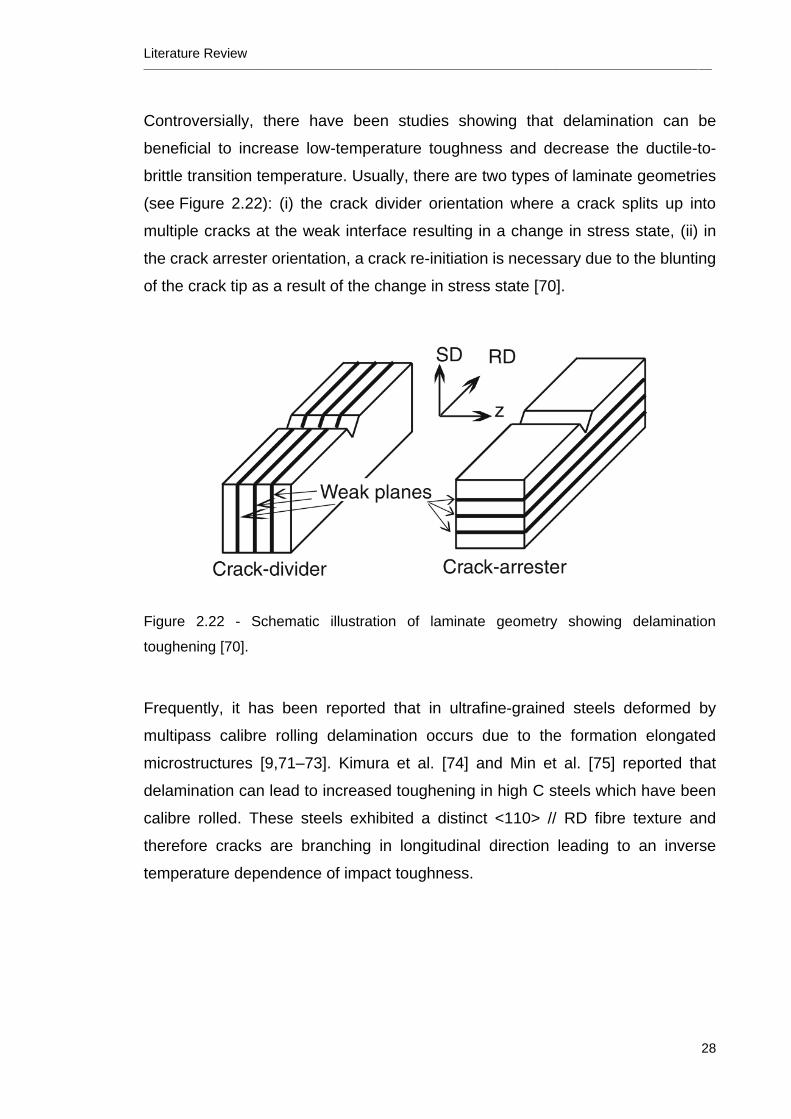
Literature Review ________________________________________________________________________________________________________________________________
28
Controversially, there have been studies showing that delamination can be
beneficial to increase low-temperature toughness and decrease the ductile-to-
brittle transition temperature. Usually, there are two types of laminate geometries
(see Figure 2.22): (i) the crack divider orientation where a crack splits up into
multiple cracks at the weak interface resulting in a change in stress state, (ii) in
the crack arrester orientation, a crack re-initiation is necessary due to the blunting
of the crack tip as a result of the change in stress state [70].
Figure 2.22 - Schematic illustration of laminate geometry showing delamination
toughening [70].
Frequently, it has been reported that in ultrafine-grained steels deformed by
multipass calibre rolling delamination occurs due to the formation elongated
microstructures [9,71–73]. Kimura et al. [74] and Min et al. [75] reported that
delamination can lead to increased toughening in high C steels which have been
calibre rolled. These steels exhibited a distinct <110> // RD fibre texture and
therefore cracks are branching in longitudinal direction leading to an inverse
temperature dependence of impact toughness.
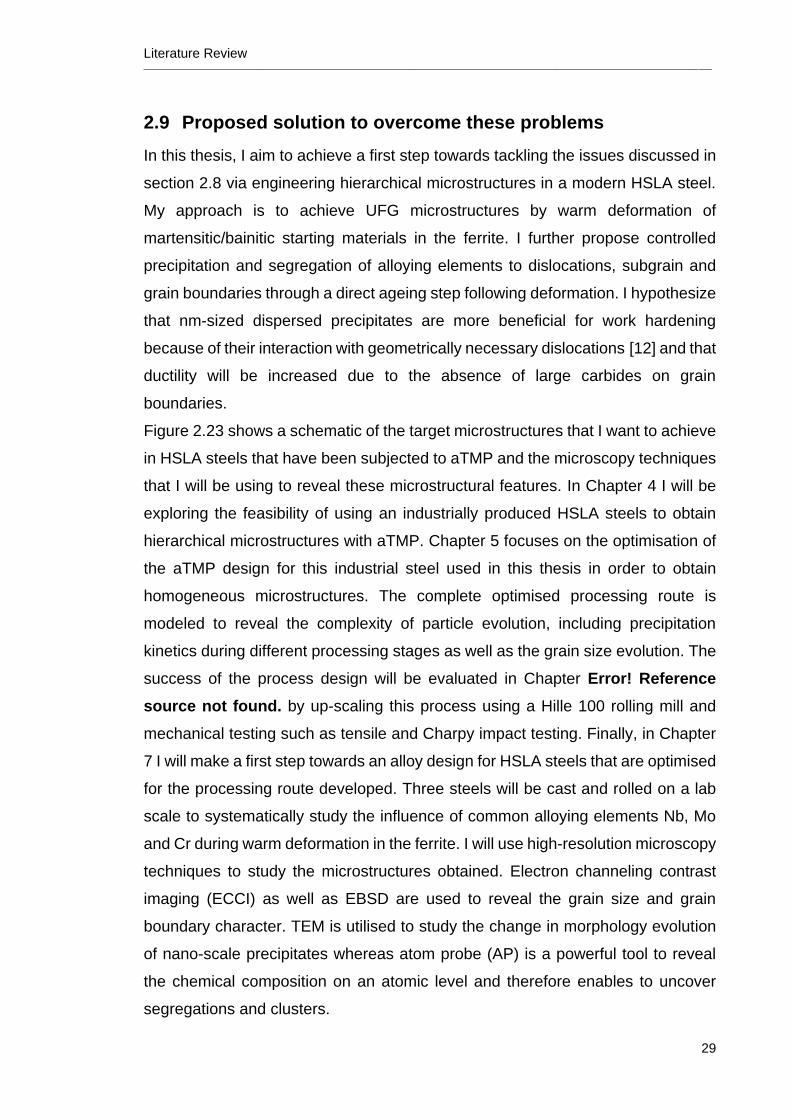
Literature Review ________________________________________________________________________________________________________________________________
29
2.9 Proposed solution to overcome these problems
In this thesis, I aim to achieve a first step towards tackling the issues discussed in
section 2.8 via engineering hierarchical microstructures in a modern HSLA steel.
My approach is to achieve UFG microstructures by warm deformation of
martensitic/bainitic starting materials in the ferrite. I further propose controlled
precipitation and segregation of alloying elements to dislocations, subgrain and
grain boundaries through a direct ageing step following deformation. I hypothesize
that nm-sized dispersed precipitates are more beneficial for work hardening
because of their interaction with geometrically necessary dislocations [12] and that
ductility will be increased due to the absence of large carbides on grain
boundaries.
Figure 2.23 shows a schematic of the target microstructures that I want to achieve
in HSLA steels that have been subjected to aTMP and the microscopy techniques
that I will be using to reveal these microstructural features. In Chapter 4 I will be
exploring the feasibility of using an industrially produced HSLA steels to obtain
hierarchical microstructures with aTMP. Chapter 5 focuses on the optimisation of
the aTMP design for this industrial steel used in this thesis in order to obtain
homogeneous microstructures. The complete optimised processing route is
modeled to reveal the complexity of particle evolution, including precipitation
kinetics during different processing stages as well as the grain size evolution. The
success of the process design will be evaluated in Chapter Error! Reference
source not found. by up-scaling this process using a Hille 100 rolling mill and
mechanical testing such as tensile and Charpy impact testing. Finally, in Chapter
7 I will make a first step towards an alloy design for HSLA steels that are optimised
for the processing route developed. Three steels will be cast and rolled on a lab
scale to systematically study the influence of common alloying elements Nb, Mo
and Cr during warm deformation in the ferrite. I will use high-resolution microscopy
techniques to study the microstructures obtained. Electron channeling contrast
imaging (ECCI) as well as EBSD are used to reveal the grain size and grain
boundary character. TEM is utilised to study the change in morphology evolution
of nano-scale precipitates whereas atom probe (AP) is a powerful tool to reveal
the chemical composition on an atomic level and therefore enables to uncover
segregations and clusters.
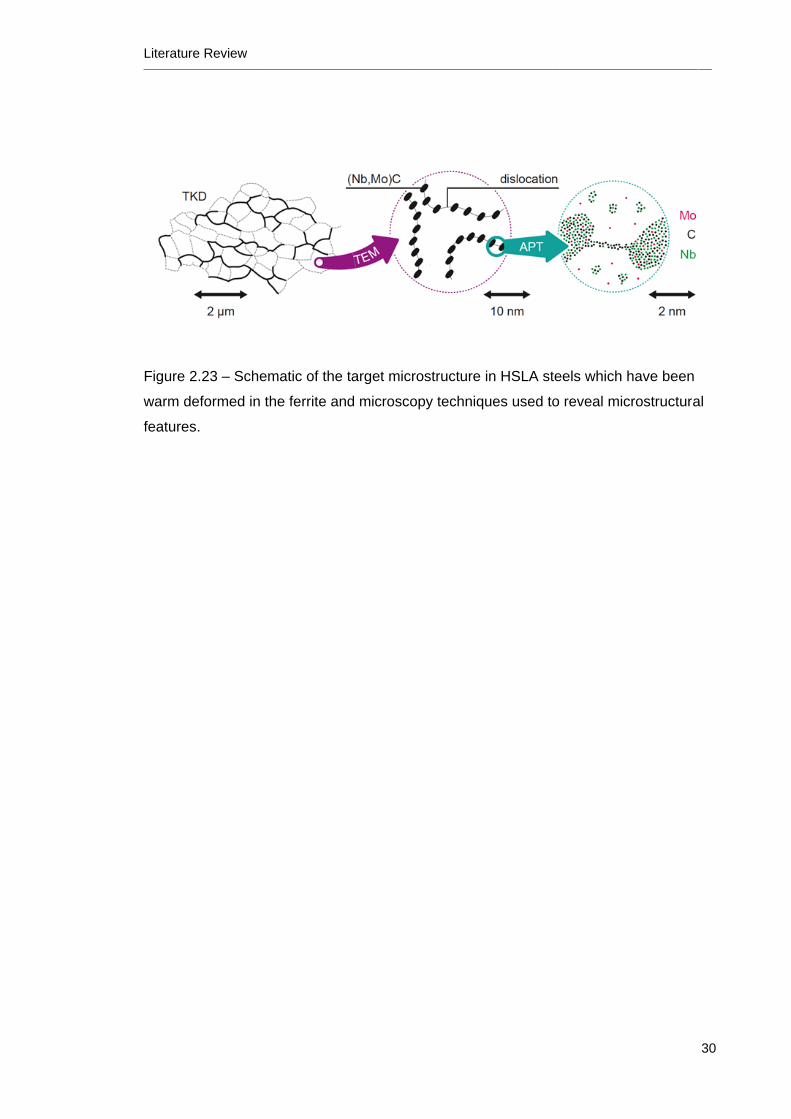
Literature Review ________________________________________________________________________________________________________________________________
30
Figure 2.23 – Schematic of the target microstructure in HSLA steels which have been
warm deformed in the ferrite and microscopy techniques used to reveal microstructural
features.
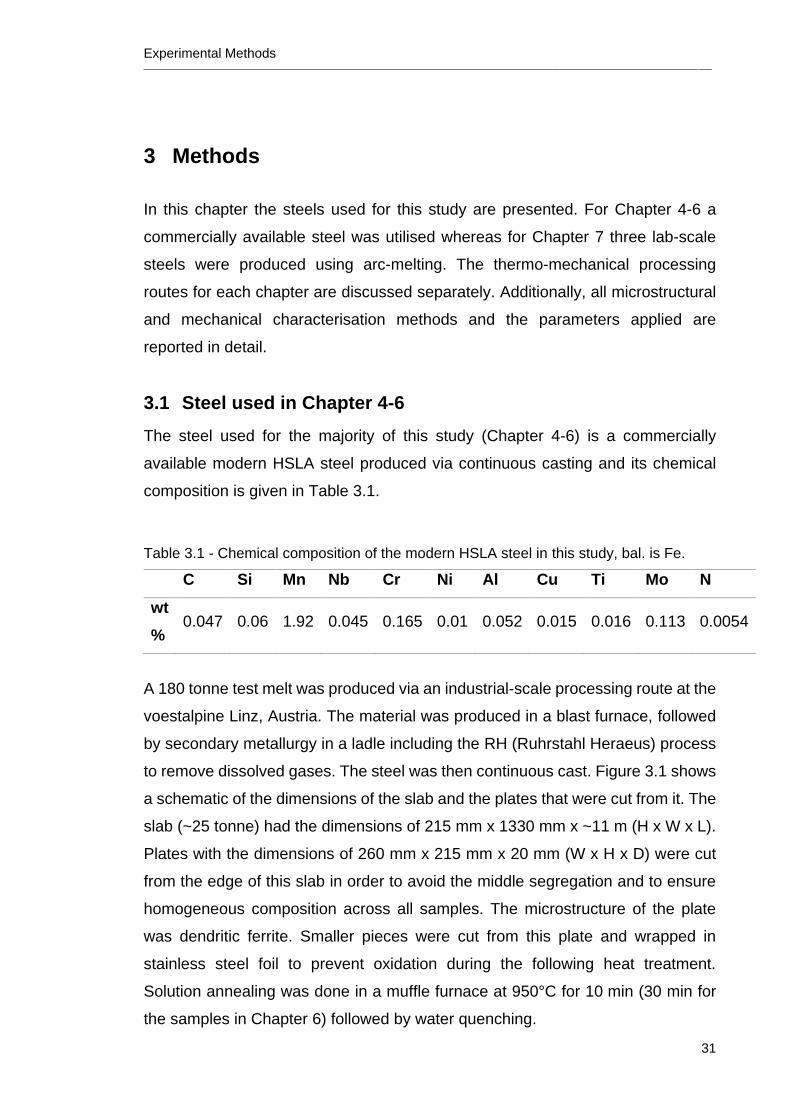
Experimental Methods ________________________________________________________________________________________________________________________________
31
3 Methods
In this chapter the steels used for this study are presented. For Chapter 4-6 a
commercially available steel was utilised whereas for Chapter 7 three lab-scale
steels were produced using arc-melting. The thermo-mechanical processing
routes for each chapter are discussed separately. Additionally, all microstructural
and mechanical characterisation methods and the parameters applied are
reported in detail.
3.1 Steel used in Chapter 4-6
The steel used for the majority of this study (Chapter 4-6) is a commercially
available modern HSLA steel produced via continuous casting and its chemical
composition is given in Table 3.1.
Table 3.1 - Chemical composition of the modern HSLA steel in this study, bal. is Fe.
C Si Mn Nb Cr Ni Al Cu Ti Mo N
wt
% 0.047 0.06 1.92 0.045 0.165 0.01 0.052 0.015 0.016 0.113 0.0054
A 180 tonne test melt was produced via an industrial-scale processing route at the
voestalpine Linz, Austria. The material was produced in a blast furnace, followed
by secondary metallurgy in a ladle including the RH (Ruhrstahl Heraeus) process
to remove dissolved gases. The steel was then continuous cast. Figure 3.1 shows
a schematic of the dimensions of the slab and the plates that were cut from it. The
slab (~25 tonne) had the dimensions of 215 mm x 1330 mm x ~11 m (H x W x L).
Plates with the dimensions of 260 mm x 215 mm x 20 mm (W x H x D) were cut
from the edge of this slab in order to avoid the middle segregation and to ensure
homogeneous composition across all samples. The microstructure of the plate
was dendritic ferrite. Smaller pieces were cut from this plate and wrapped in
stainless steel foil to prevent oxidation during the following heat treatment.
Solution annealing was done in a muffle furnace at 950°C for 10 min (30 min for
the samples in Chapter 6) followed by water quenching.
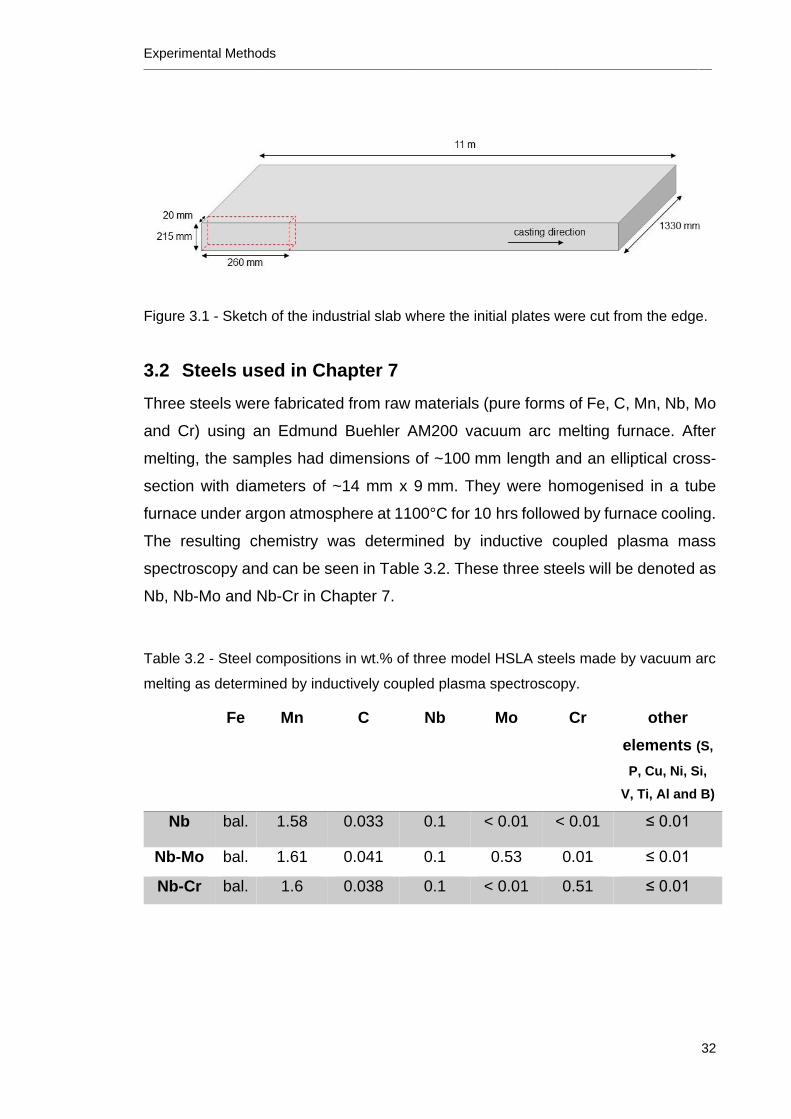
Experimental Methods ________________________________________________________________________________________________________________________________
32
Figure 3.1 - Sketch of the industrial slab where the initial plates were cut from the edge.
3.2 Steels used in Chapter 7
Three steels were fabricated from raw materials (pure forms of Fe, C, Mn, Nb, Mo
and Cr) using an Edmund Buehler AM200 vacuum arc melting furnace. After
melting, the samples had dimensions of ~100 mm length and an elliptical cross-
section with diameters of ~14 mm x 9 mm. They were homogenised in a tube
furnace under argon atmosphere at 1100°C for 10 hrs followed by furnace cooling.
The resulting chemistry was determined by inductive coupled plasma mass
spectroscopy and can be seen in Table 3.2. These three steels will be denoted as
Nb, Nb-Mo and Nb-Cr in Chapter 7.
Table 3.2 - Steel compositions in wt.% of three model HSLA steels made by vacuum arc
melting as determined by inductively coupled plasma spectroscopy.
Fe Mn C Nb Mo Cr other
elements (S,
P, Cu, Ni, Si,
V, Ti, Al and B)
Nb bal. 1.58 0.033 0.1 < 0.01 < 0.01 ≤ 0.01
Nb-Mo bal. 1.61 0.041 0.1 0.53 0.01 ≤ 0.01
Nb-Cr bal. 1.6 0.038 0.1 < 0.01 0.51 ≤ 0.01
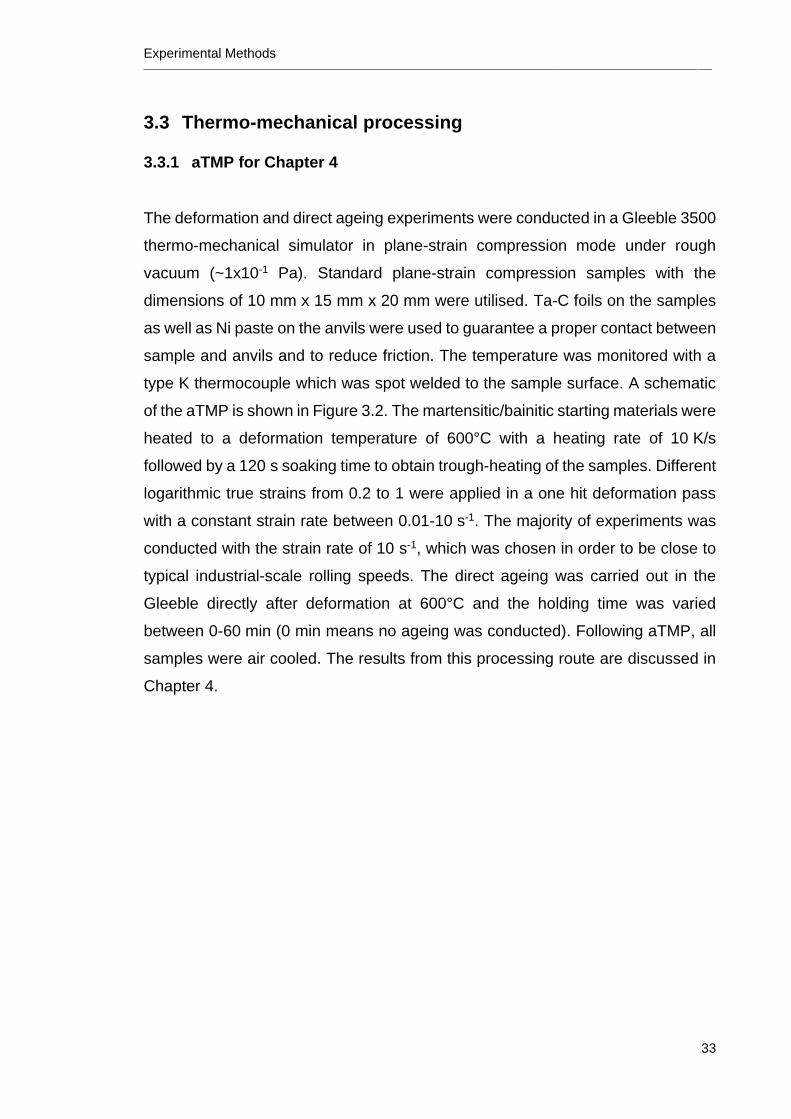
Experimental Methods ________________________________________________________________________________________________________________________________
33
3.3 Thermo-mechanical processing
3.3.1 aTMP for Chapter 4
The deformation and direct ageing experiments were conducted in a Gleeble 3500
thermo-mechanical simulator in plane-strain compression mode under rough
vacuum (~1x10⁻¹ Pa). Standard plane-strain compression samples with the
dimensions of 10 mm x 15 mm x 20 mm were utilised. Ta-C foils on the samples
as well as Ni paste on the anvils were used to guarantee a proper contact between
sample and anvils and to reduce friction. The temperature was monitored with a
type K thermocouple which was spot welded to the sample surface. A schematic
of the aTMP is shown in Figure 3.2. The martensitic/bainitic starting materials were
heated to a deformation temperature of 600°C with a heating rate of 10 K/s
followed by a 120 s soaking time to obtain trough-heating of the samples. Different
logarithmic true strains from 0.2 to 1 were applied in a one hit deformation pass
with a constant strain rate between 0.01-10 s-1. The majority of experiments was
conducted with the strain rate of 10 s-1, which was chosen in order to be close to
typical industrial-scale rolling speeds. The direct ageing was carried out in the
Gleeble directly after deformation at 600°C and the holding time was varied
between 0-60 min (0 min means no ageing was conducted). Following aTMP, all
samples were air cooled. The results from this processing route are discussed in
Chapter 4.
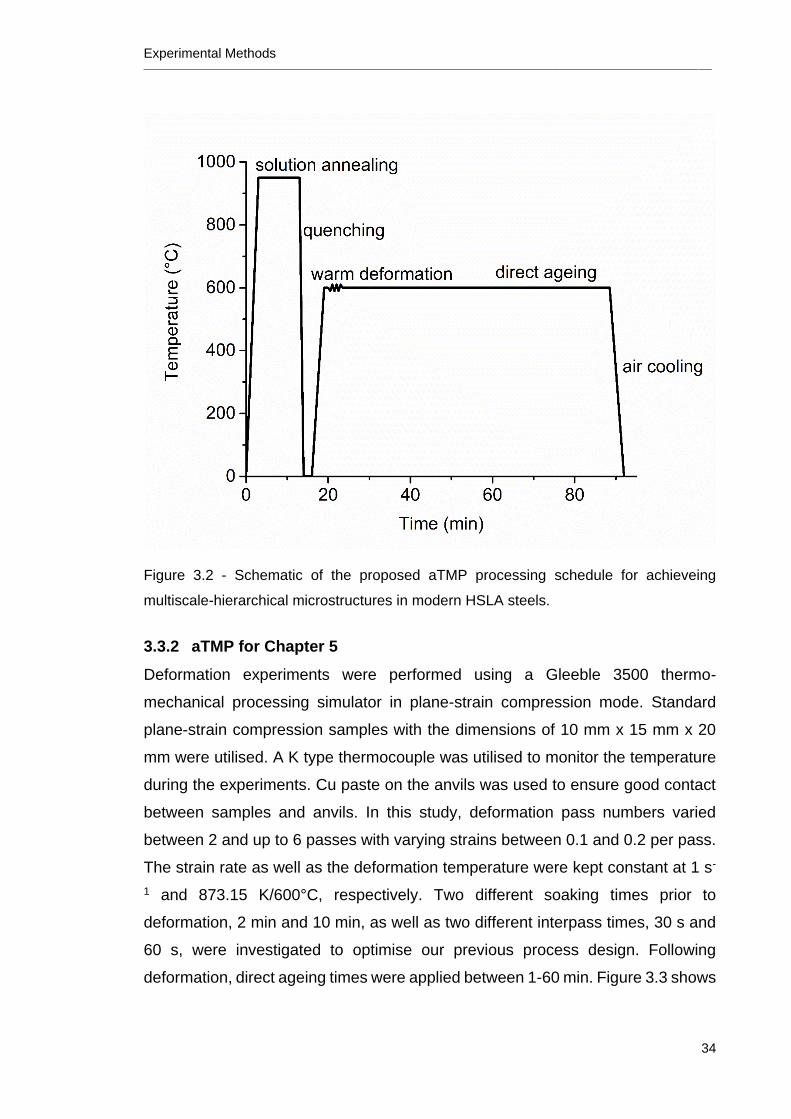
Experimental Methods ________________________________________________________________________________________________________________________________
34
Figure 3.2 - Schematic of the proposed aTMP processing schedule for achieveing
multiscale-hierarchical microstructures in modern HSLA steels.
3.3.2 aTMP for Chapter 5
Deformation experiments were performed using a Gleeble 3500 thermo-
mechanical processing simulator in plane-strain compression mode. Standard
plane-strain compression samples with the dimensions of 10 mm x 15 mm x 20
mm were utilised. A K type thermocouple was utilised to monitor the temperature
during the experiments. Cu paste on the anvils was used to ensure good contact
between samples and anvils. In this study, deformation pass numbers varied
between 2 and up to 6 passes with varying strains between 0.1 and 0.2 per pass.
The strain rate as well as the deformation temperature were kept constant at 1 s-
1 and 873.15 K/600°C, respectively. Two different soaking times prior to
deformation, 2 min and 10 min, as well as two different interpass times, 30 s and
60 s, were investigated to optimise our previous process design. Following
deformation, direct ageing times were applied between 1-60 min. Figure 3.3 shows
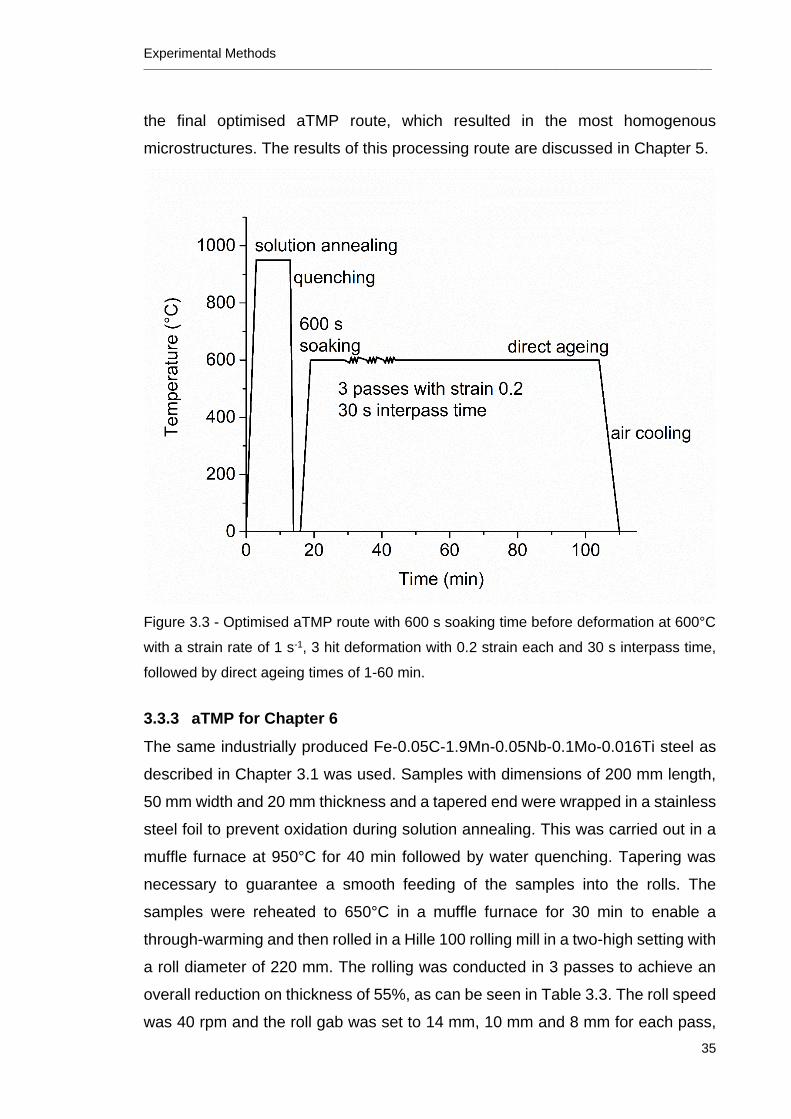
Experimental Methods ________________________________________________________________________________________________________________________________
35
the final optimised aTMP route, which resulted in the most homogenous
microstructures. The results of this processing route are discussed in Chapter 5.
Figure 3.3 - Optimised aTMP route with 600 s soaking time before deformation at 600°C
with a strain rate of 1 s-1, 3 hit deformation with 0.2 strain each and 30 s interpass time,
followed by direct ageing times of 1-60 min.
3.3.3 aTMP for Chapter 6
The same industrially produced Fe-0.05C-1.9Mn-0.05Nb-0.1Mo-0.016Ti steel as
described in Chapter 3.1 was used. Samples with dimensions of 200 mm length,
50 mm width and 20 mm thickness and a tapered end were wrapped in a stainless
steel foil to prevent oxidation during solution annealing. This was carried out in a
muffle furnace at 950°C for 40 min followed by water quenching. Tapering was
necessary to guarantee a smooth feeding of the samples into the rolls. The
samples were reheated to 650°C in a muffle furnace for 30 min to enable a
through-warming and then rolled in a Hille 100 rolling mill in a two-high setting with
a roll diameter of 220 mm. The rolling was conducted in 3 passes to achieve an
overall reduction on thickness of 55%, as can be seen in Table 3.3. The roll speed
was 40 rpm and the roll gab was set to 14 mm, 10 mm and 8 mm for each pass,
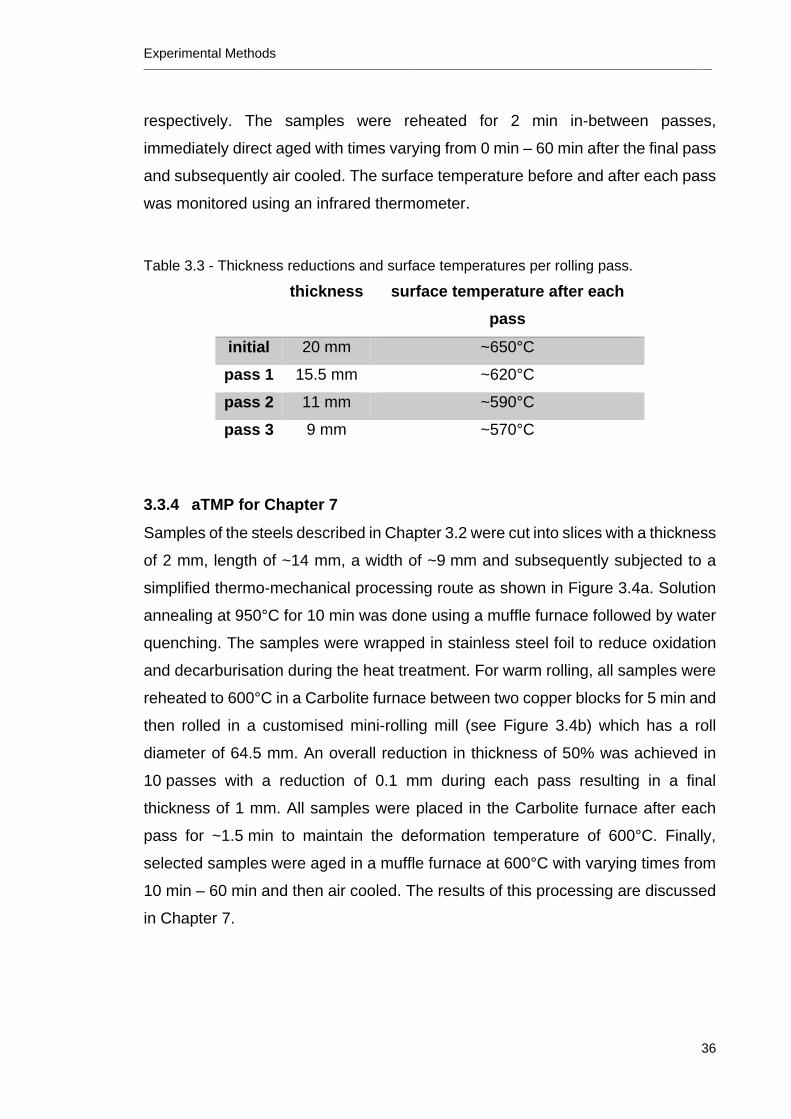
Experimental Methods ________________________________________________________________________________________________________________________________
36
respectively. The samples were reheated for 2 min in-between passes,
immediately direct aged with times varying from 0 min – 60 min after the final pass
and subsequently air cooled. The surface temperature before and after each pass
was monitored using an infrared thermometer.
Table 3.3 - Thickness reductions and surface temperatures per rolling pass.
thickness surface temperature after each
pass
initial 20 mm ~650°C
pass 1 15.5 mm ~620°C
pass 2 11 mm ~590°C
pass 3 9 mm ~570°C
3.3.4 aTMP for Chapter 7
Samples of the steels described in Chapter 3.2 were cut into slices with a thickness
of 2 mm, length of ~14 mm, a width of ~9 mm and subsequently subjected to a
simplified thermo-mechanical processing route as shown in Figure 3.4a. Solution
annealing at 950°C for 10 min was done using a muffle furnace followed by water
quenching. The samples were wrapped in stainless steel foil to reduce oxidation
and decarburisation during the heat treatment. For warm rolling, all samples were
reheated to 600°C in a Carbolite furnace between two copper blocks for 5 min and
then rolled in a customised mini-rolling mill (see Figure 3.4b) which has a roll
diameter of 64.5 mm. An overall reduction in thickness of 50% was achieved in
10 passes with a reduction of 0.1 mm during each pass resulting in a final
thickness of 1 mm. All samples were placed in the Carbolite furnace after each
pass for ~1.5 min to maintain the deformation temperature of 600°C. Finally,
selected samples were aged in a muffle furnace at 600°C with varying times from
10 min – 60 min and then air cooled. The results of this processing are discussed
in Chapter 7.
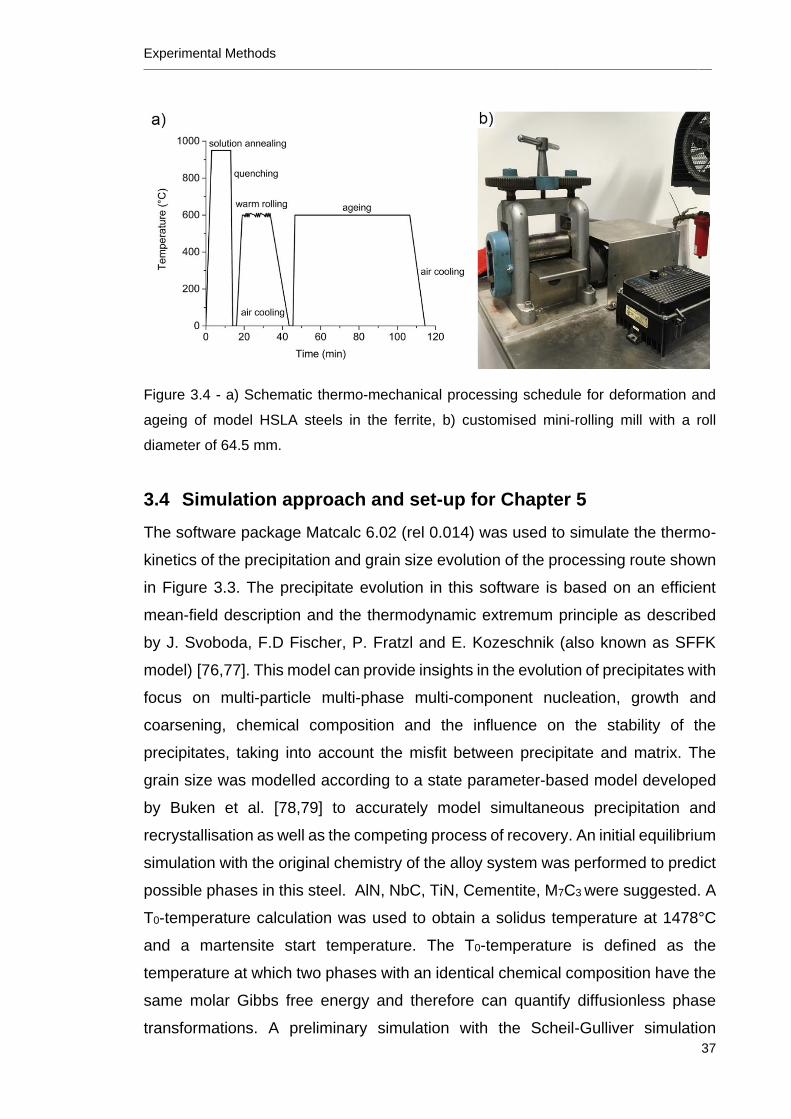
Experimental Methods ________________________________________________________________________________________________________________________________
37
Figure 3.4 - a) Schematic thermo-mechanical processing schedule for deformation and
ageing of model HSLA steels in the ferrite, b) customised mini-rolling mill with a roll
diameter of 64.5 mm.
3.4 Simulation approach and set-up for Chapter 5
The software package Matcalc 6.02 (rel 0.014) was used to simulate the thermo-
kinetics of the precipitation and grain size evolution of the processing route shown
in Figure 3.3. The precipitate evolution in this software is based on an efficient
mean-field description and the thermodynamic extremum principle as described
by J. Svoboda, F.D Fischer, P. Fratzl and E. Kozeschnik (also known as SFFK
model) [76,77]. This model can provide insights in the evolution of precipitates with
focus on multi-particle multi-phase multi-component nucleation, growth and
coarsening, chemical composition and the influence on the stability of the
precipitates, taking into account the misfit between precipitate and matrix. The
grain size was modelled according to a state parameter-based model developed
by Buken et al. [78,79] to accurately model simultaneous precipitation and
recrystallisation as well as the competing process of recovery. An initial equilibrium
simulation with the original chemistry of the alloy system was performed to predict
possible phases in this steel. AlN, NbC, TiN, Cementite, M7C3 were suggested. A
T0-temperature calculation was used to obtain a solidus temperature at 1478°C
and a martensite start temperature. The T0-temperature is defined as the
temperature at which two phases with an identical chemical composition have the
same molar Gibbs free energy and therefore can quantify diffusionless phase
transformations. A preliminary simulation with the Scheil-Gulliver simulation
Experimental Methods ________________________________________________________________________________________________________________________________
38
module of MatCalc (taking back diffusion of C and N into account) [80,81] has
shown that only approximately 40% of Ti and N will be bound in primary TiN
precipitates and 60% of the nominal Ti and N are remaining in solid solution after
solidification, when performing the Scheil-Gulliver simulation under the
assumption that final solidification occurs at 3% residual liquid fraction. This means
that most of the Ti and N are available for precipitation in the matrix during the
later heat treatment. Furthermore, the martensite start temperature was calculated
as 492°C, in order to switch the precipitation domains, austenite and ferrite,
according to temperature changes. Thus, proper diffusion coefficients of alloying
elements in austenite and ferrite are taken into account.
Following preliminary calculations, it was decided to simplify the system only
allowing alloying elements and precipitates that were found in the actual
experiments. The system was simulated following the complete processing route
including casting, solution annealing at 950°C for 10 min and quenching, followed
by the aTMP route according to Figure 3.3 with deformation occurring in the ferrite.
The initial computing parameters used in the simplified simulation are listed in
Table 3.4. A large initial subgrain diameter was chosen as the simulation starts
from casting. In the standard setup, MatCalc automatically creates a complex
carbo-nitride if Ti, Nb, N and C are selected to form a precipitate with face-centred-
cubic (fcc) crystal structure. However, this complex carbo-nitride shows a
miscibility gap. Therefore, the carbo-nitride phase is split into two phases, one with
Nb and C as the major constituents and a second one where Ti and N are major
constituents. Furthermore, grain boundaries were selected as nucleation sites for
cementite, whereas nucleation sites for TiN and NbC were set as dislocations and
subgrain boundaries, as found in experimental observations. Results of these
simulations are shown and discussed in Chapter 5.
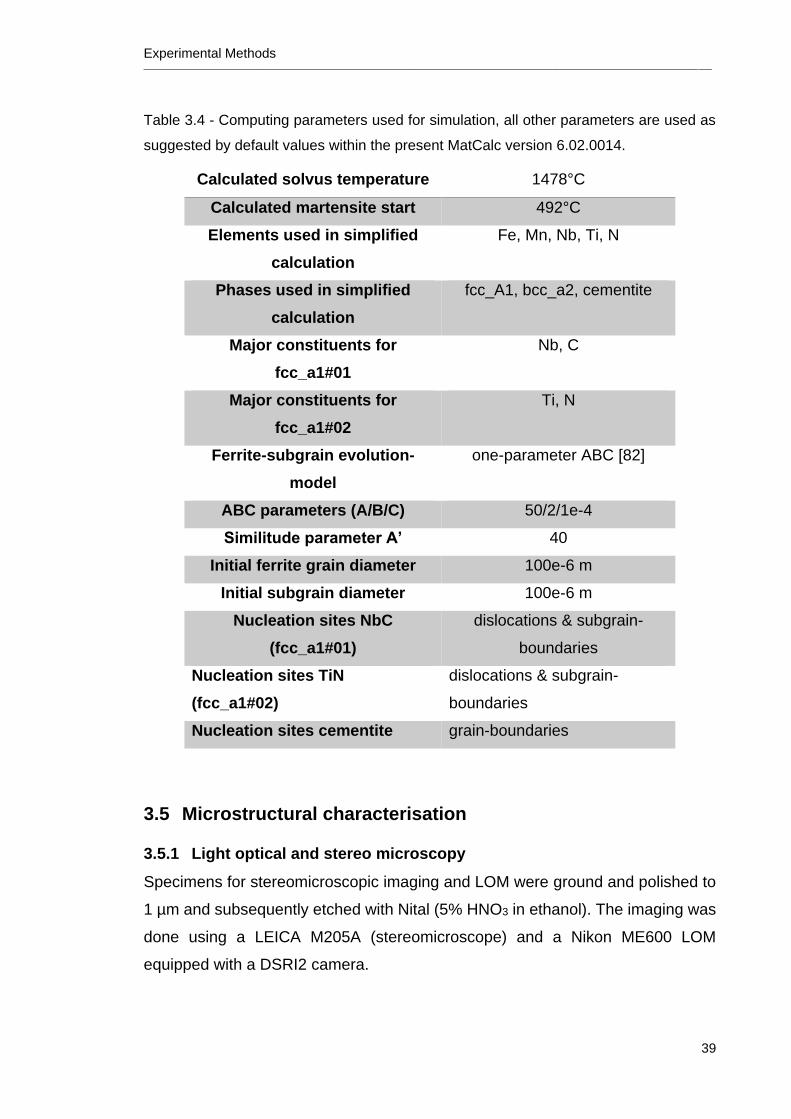
Experimental Methods ________________________________________________________________________________________________________________________________
39
Table 3.4 - Computing parameters used for simulation, all other parameters are used as
suggested by default values within the present MatCalc version 6.02.0014.
Calculated solvus temperature 1478°C
Calculated martensite start 492°C
Elements used in simplified
calculation
Fe, Mn, Nb, Ti, N
Phases used in simplified
calculation
fcc_A1, bcc_a2, cementite
Major constituents for
fcc_a1#01
Nb, C
Major constituents for
fcc_a1#02
Ti, N
Ferrite-subgrain evolution-
model
one-parameter ABC [82]
ABC parameters (A/B/C) 50/2/1e-4
Similitude parameter A’ 40
Initial ferrite grain diameter 100e-6 m
Initial subgrain diameter 100e-6 m
Nucleation sites NbC
(fcc_a1#01)
dislocations & subgrain-
boundaries
Nucleation sites TiN
(fcc_a1#02)
dislocations & subgrain-
boundaries
Nucleation sites cementite grain-boundaries
3.5 Microstructural characterisation
3.5.1 Light optical and stereo microscopy
Specimens for stereomicroscopic imaging and LOM were ground and polished to
1 µm and subsequently etched with Nital (5% HNO3 in ethanol). The imaging was
done using a LEICA M205A (stereomicroscope) and a Nikon ME600 LOM
equipped with a DSRI2 camera.
Experimental Methods ________________________________________________________________________________________________________________________________
40
3.5.2 SEM/ECCI/EBSD
After standard grinding and polishing to 1 µm finish samples for electron
channelling contrast imaging (ECCI) and EBSD were electropolished using a
STRUERS Lectropol-5 apparatus and a STRUERS electrolyte A2 (perchloric acid
in ethanol) at 25 V for 20 s with a flow rate of 10 at room temperature. ECCI was
carried out using a ZEISS Auriga field emission SEM at 20 kV, 9 mm working
distance, and 30 μm aperture size with no rotation or tilt of the stage.
EBSD was done in a JEOL 7001 field emission SEM equipped with an EDAX
Hikari Super EBSD system at 25 kV, 15 mm working distance, 6x6 binning and a
50 nm step size (a step size of 0.5 μm was used for imaging of the starting
material). The TSL OIM Analysis 7 software was used for EBSD data evaluation.
An EBSD data-clean up with a neighbour confidence index correlation of 0.1 was
applied prior to grain/subgrain size evaluations with a grain tolerance angle of 2°,
and a minimum size 3 data points as threshold values. For grain size
measurements, an average of 3-5 EBSD scans was used, high angle grain
boundaries (HAGB) were defined with an angle >15°, whereas subgrain
boundaries, i.e. low angle grain boundaries (LAGB) were set between 2-15°. The
grain size was always defined as crystallites that are either confined by HAGBs or
LAGBs.
The texture in Chapter 5 was analysed using the TSL OIM Analysis 8 software
with merged data-sets of 3-4 individual scans within the deformation zone. This
was done to obtain more statistically significant information about the overall
texture. However, it must be noted that the homogenous area is small due to the
nature of the plane strain compression test applied in this research.
The fracture surfaces in Chapter 6 were characterised by photography and using
a ZEISS Auriga field emission SEM with secondary electron contrast at 15 kV and
an aperture of 30 µm.
3.5.3 TEM
Slices with a thickness of around 150 µm were cut from the samples and then
punched to discs with 3 mm diameter. These discs were mechanically thinned to
around 60 μm, followed by electropolishing using a STRUERS Tenupol-5 twin-jet
polishing machine and a STRUERS electrolyte A2 (perchloric acid in ethanol).
Experimental Methods ________________________________________________________________________________________________________________________________
41
Parameters used were 26 V with a pump flow rate of 15 and a light stop value of
17 at ~7°C.
Transmission electron microscopy (TEM) imaging in Chapter 4 was done using a
Philips CM200 field emission TEM equipped with a Bruker QUANTAX energy-
dispersive x-ray spectroscopy (EDS) system at 200 kV.
The TEM used in Chapter 5-7 was a JEOL JEM-F200 cold field emission gun
(CFEG) scanning TEM (STEM) operated at 200 kV acceleration voltage. Images
were acquired in scanning mode at a camera length of 120 mm with a
corresponding inner angle of 62 mrad collection for the annular dark field (ADF)
detector and 10 mrad for the bright field (BF) detector. This configuration provides
strong diffraction contrast in the BF-STEM and Z contrast in ADF-STEM images.
The microscope is equipped with a JEOL 100mm2 silicon-drift X-ray detector with
a collection solid angle of approximately 1 sr which was used to acquire the EDS
maps.
3.5.4 Atom probe
Atom probe (AP) samples were prepared electrolytically using perchloric-acid at
15-20 V DC. The AP measurements were conducted in voltage mode with a LEAP
3000 Si with a detector efficiency of 0.57 from Cameca at a temperature of 40 K,
a pulse fraction of 20% and a pulse repetition of 200 kHz. The software package
IVAS 3.6.6 from Cameca was used for data reconstruction. Calibration of the
reconstruction parameters such as field factor and image compression factor was
done using crystallographic features present in the atom probe dataset [83].
A cluster analysis was performed after removing the poles from the data with an
iso-surface for Fe at 75%, based on the of the detector efficiency multiplied by the
density of body-centred-cubic Fe = 84.6 atoms/nm3. The total number of atoms
after removing the poles in the data sets shown in Figure 7.9 was 11.3 million and
27.7 million for the Nb-Mo 30 min and Nb-Cr 10 min respectively. This analysis is
based on the maximum separation method [83] and was performed with the first
nearest neighbour distances considering C, C2, C3, and Nb.
Experimental Methods ________________________________________________________________________________________________________________________________
42
3.6 Mechanical characterisation
3.6.1 Hardness testing
Vickers hardness testing according to ASTM E92-17 using a STRUERS Duramin
300 (HV5) was done in order to be able to achieve a first estimate of the
mechanical properties. Each value present is an average from at least 5 indents
(10 indents for Chapter 7).
For Chapter 5, a 1 kg load was chosen to allow for sufficient distance for 3 indents
in the homogenous region of the deformed samples.
3.6.2 Tensile testing
Flat dog-bone tensile testing samples with a thickness of 3 mm, a width of 12.5 mm
and a gauge length of 50 mm were machined according to ASTM E8/E8M-11
standard parallel to RD. The tests were conducted with a constant crosshead
speed of 1 mm/min at room temperature using an Instron 5982 tensile testing
machine and an MTS laser extensometer Lx500. Unfortunately, due to issues with
the laser extensometer, the lower yield strength for the 60 min samples is not
available. The 10 min samples started necking outside the gauge length, hence,
these values are greyed out in Table 6.2, but their total elongation after fracture
fitted to the overall trend. Generally, a minimum of 2 samples was used to obtain
lower yield strength, UTS and total elongation for each condition.
3.6.3 Charpy impact testing
Subsize V-notch Charpy samples were machined according to ASTM E23-07a
with 55 mm length and 10 x 7.5 mm2 cross-section along and transverse the rolling
directions. Impact test were performed in a temperature range between -90°C and
120°C using Mohr & Federhaff A.G. pendulum impact testing machine. The
temperature was monitored with a K-type thermocouple that was spot welded onto
the samples. An average of 2-3 samples was used to obtain the impact energy for
each condition.
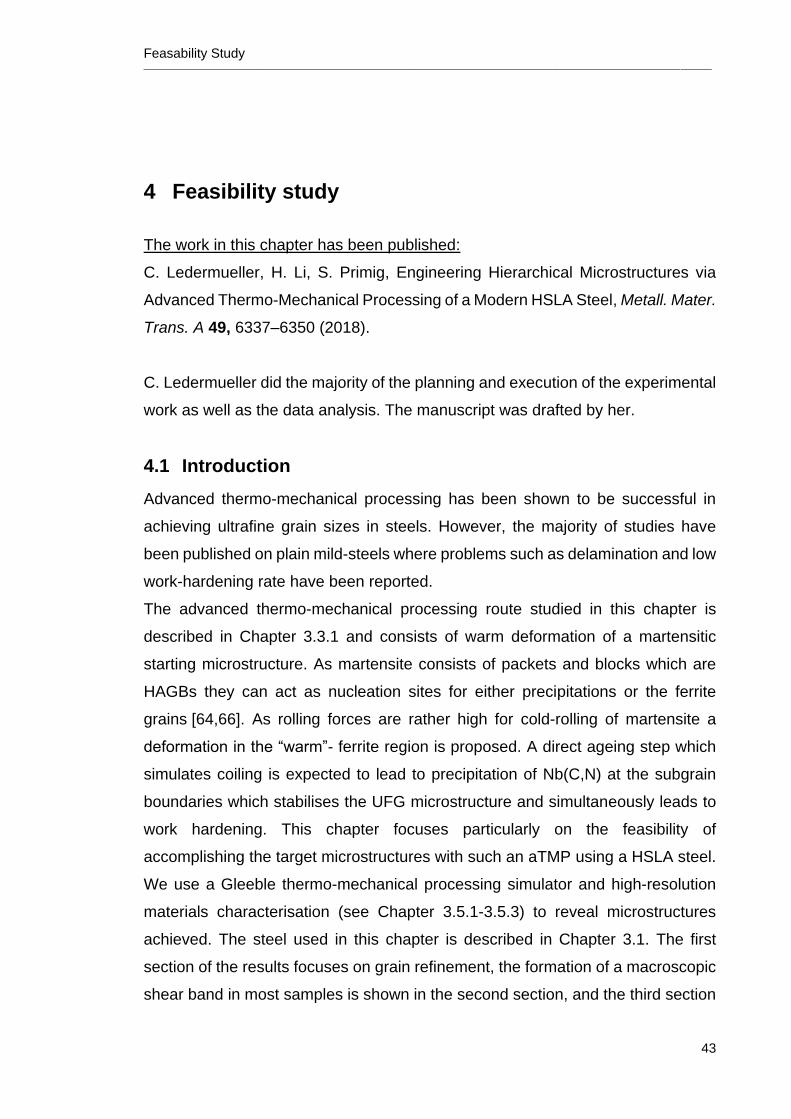
Feasability Study ________________________________________________________________________________________________________________________________
43
4 Feasibility study
The work in this chapter has been published:
C. Ledermueller, H. Li, S. Primig, Engineering Hierarchical Microstructures via
Advanced Thermo-Mechanical Processing of a Modern HSLA Steel, Metall. Mater.
Trans. A 49, 6337–6350 (2018).
C. Ledermueller did the majority of the planning and execution of the experimental
work as well as the data analysis. The manuscript was drafted by her.
4.1 Introduction
Advanced thermo-mechanical processing has been shown to be successful in
achieving ultrafine grain sizes in steels. However, the majority of studies have
been published on plain mild-steels where problems such as delamination and low
work-hardening rate have been reported.
The advanced thermo-mechanical processing route studied in this chapter is
described in Chapter 3.3.1 and consists of warm deformation of a martensitic
starting microstructure. As martensite consists of packets and blocks which are
HAGBs they can act as nucleation sites for either precipitations or the ferrite
grains [64,66]. As rolling forces are rather high for cold-rolling of martensite a
deformation in the “warm”- ferrite region is proposed. A direct ageing step which
simulates coiling is expected to lead to precipitation of Nb(C,N) at the subgrain
boundaries which stabilises the UFG microstructure and simultaneously leads to
work hardening. This chapter focuses particularly on the feasibility of
accomplishing the target microstructures with such an aTMP using a HSLA steel.
We use a Gleeble thermo-mechanical processing simulator and high-resolution
materials characterisation (see Chapter 3.5.1-3.5.3) to reveal microstructures
achieved. The steel used in this chapter is described in Chapter 3.1. The first
section of the results focuses on grain refinement, the formation of a macroscopic
shear band in most samples is shown in the second section, and the third section
Feasability Study ________________________________________________________________________________________________________________________________
44
reveals the decorations of grain and subgrain boundaries as well as dislocations
with nanoscale precipitates.
Following chapters in this thesis will focus on optimising the aTMP route and up-
scaling for thorough mechanical testing.
4.2 Results
4.2.1 Grain refinement
Figure 4.1a shows the lath shaped microstructure of the starting material after
solution annealing and quenching, which may be described as a mixture of
martensite and bainite. The lath width is approximately 10±5 μm. Figure 4.1b is an
EBSD inverse pole figure map with high angle grain boundaries (HAGB) shown
as black lines and low angle grain boundaries (LAGB) as red lines. Individual
sheaves of bainite and/or martensite can be seen. Figure 4.1c is a TEM bright field
image showing microtwins in the martensite, marked by arrow. The hardness of
solution annealed and water quenched material with 202±4 HV5 is not
considerably higher compared to the received as-cast material with 195±3 HV5.
Feasability Study ________________________________________________________________________________________________________________________________
45
Figure 4.1 - Microstructural characterisation of the as-quenched starting microstructure
for deformation experiments: (a) LOM shows the quite coarse lath-shaped microstructure,
(b) EBSD inverse pole figure map shows individual sheaves, high angle grain boundaries
are shown with black lines and low angle boundaries with red lines, IPF map is from top
view sample has as no real coordinate system yet, (c) The TEM image shows microtwins
in the martensite which are marked with a red arrow.
Figure 4.2 shows the as-deformed microstructure of a sample that was deformed
to a true strain of 0.8 at 600°C without ageing. Overall, grain refinement has been
achieved in the deformed section of the sample, however, strain unfortunately did
not occur in an entirely homogenous manner. Figure 4.2a-c are LOM images at
different magnifications of the cross-section. The blue square in Figure 4.2a
indicates where all further imaging was done in the following sections of this paper,
and the red arrows mark the deformation direction. A macro-shear band originates
from the edges of the Gleeble anvils and crosses the samples diagonally from top
left corner to bottom right corner in this case. The shear band exhibits a very
fine-grained microstructure, although it was not possible to reveal the grains in the
LOM, whereas the microstructure next to the shear band remains somewhat
coarser. Figure 4.2c shows local hardness measurements. The hardness in the
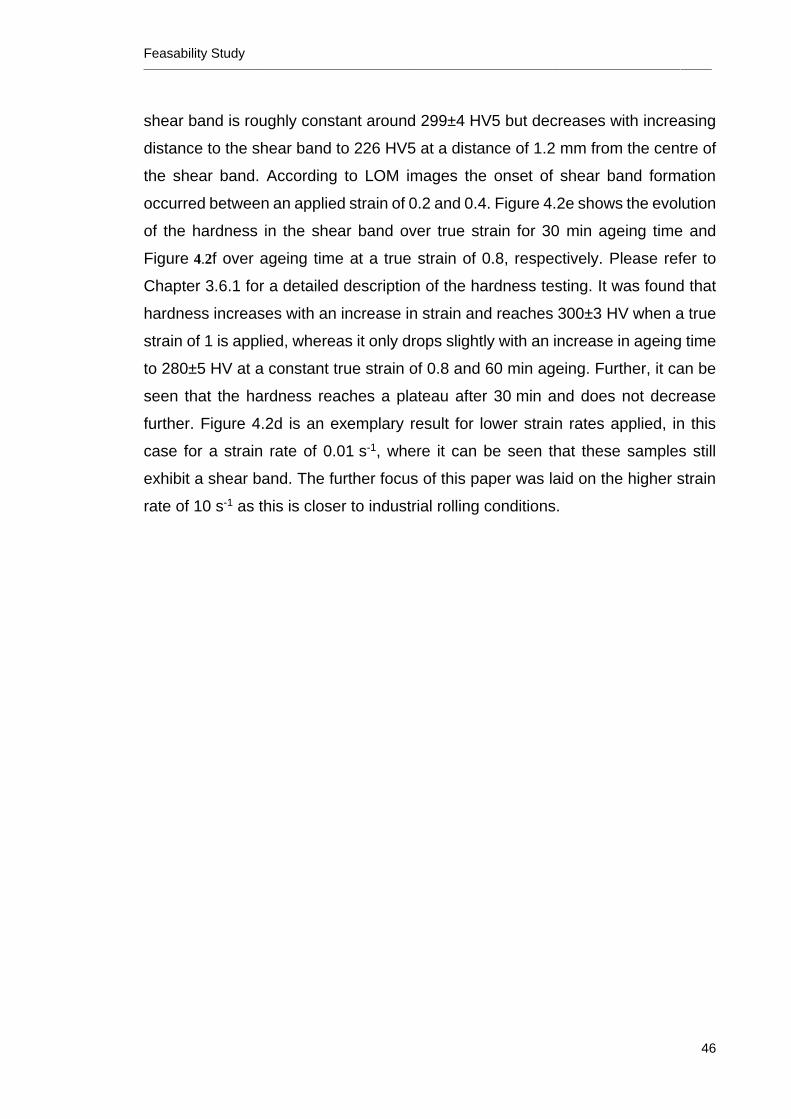
Feasability Study ________________________________________________________________________________________________________________________________
46
shear band is roughly constant around 299±4 HV5 but decreases with increasing
distance to the shear band to 226 HV5 at a distance of 1.2 mm from the centre of
the shear band. According to LOM images the onset of shear band formation
occurred between an applied strain of 0.2 and 0.4. Figure 4.2e shows the evolution
of the hardness in the shear band over true strain for 30 min ageing time and
Figure 4.2f over ageing time at a true strain of 0.8, respectively. Please refer to
Chapter 3.6.1 for a detailed description of the hardness testing. It was found that
hardness increases with an increase in strain and reaches 300±3 HV when a true
strain of 1 is applied, whereas it only drops slightly with an increase in ageing time
to 280±5 HV at a constant true strain of 0.8 and 60 min ageing. Further, it can be
seen that the hardness reaches a plateau after 30 min and does not decrease
further. Figure 4.2d is an exemplary result for lower strain rates applied, in this
case for a strain rate of 0.01 s-1, where it can be seen that these samples still
exhibit a shear band. The further focus of this paper was laid on the higher strain
rate of 10 s-1 as this is closer to industrial rolling conditions.
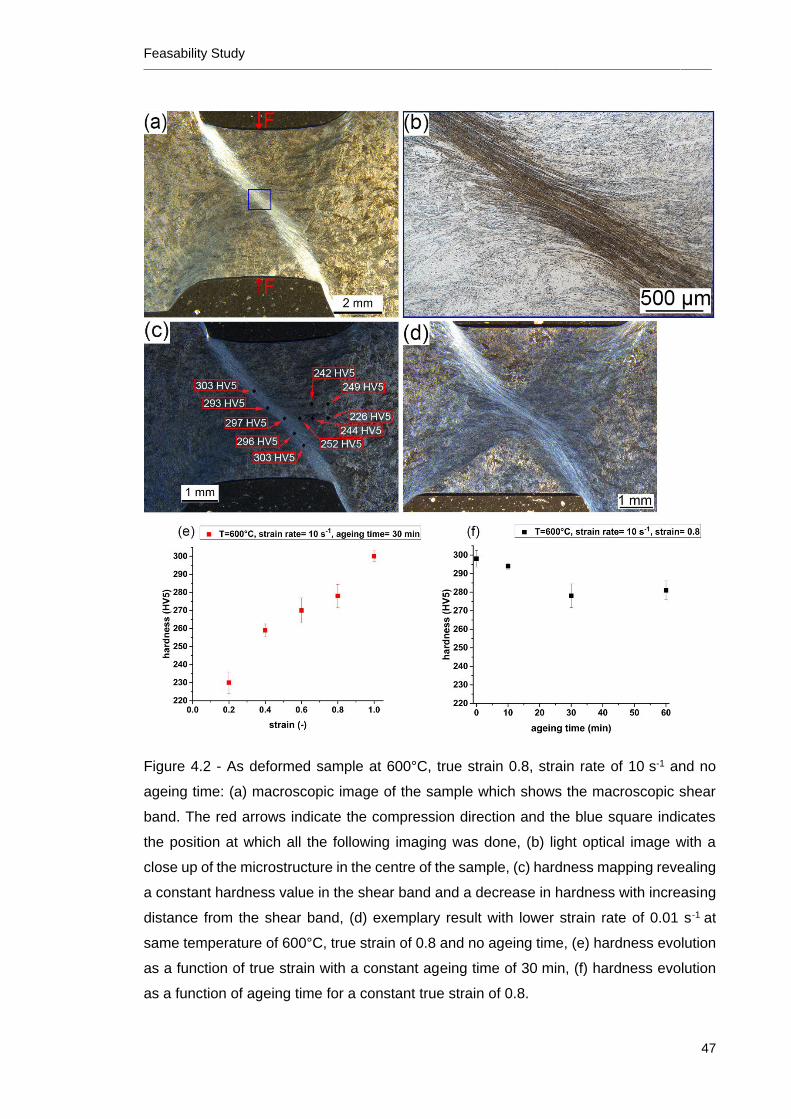
Feasability Study ________________________________________________________________________________________________________________________________
47
Figure 4.2 - As deformed sample at 600°C, true strain 0.8, strain rate of 10 s-1 and no
ageing time: (a) macroscopic image of the sample which shows the macroscopic shear
band. The red arrows indicate the compression direction and the blue square indicates
the position at which all the following imaging was done, (b) light optical image with a
close up of the microstructure in the centre of the sample, (c) hardness mapping revealing
a constant hardness value in the shear band and a decrease in hardness with increasing
distance from the shear band, (d) exemplary result with lower strain rate of 0.01 s-1 at
same temperature of 600°C, true strain of 0.8 and no ageing time, (e) hardness evolution
as a function of true strain with a constant ageing time of 30 min, (f) hardness evolution
as a function of ageing time for a constant true strain of 0.8.
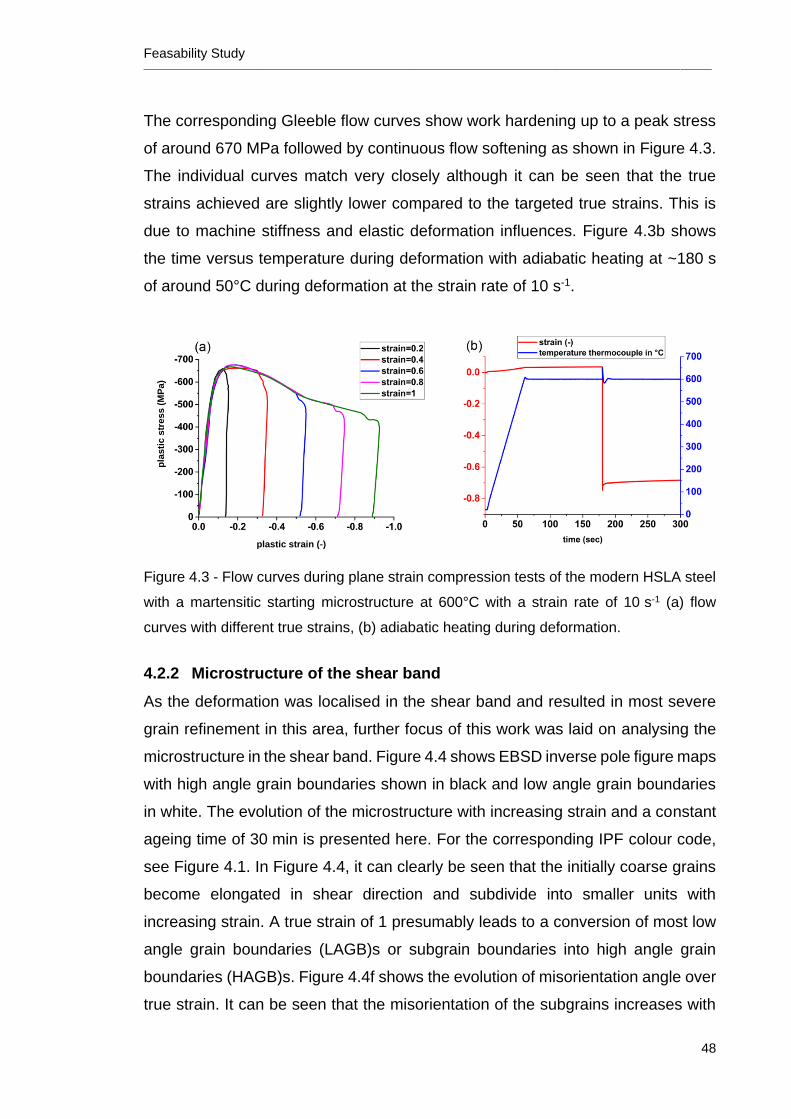
Feasability Study ________________________________________________________________________________________________________________________________
48
The corresponding Gleeble flow curves show work hardening up to a peak stress
of around 670 MPa followed by continuous flow softening as shown in Figure 4.3.
The individual curves match very closely although it can be seen that the true
strains achieved are slightly lower compared to the targeted true strains. This is
due to machine stiffness and elastic deformation influences. Figure 4.3b shows
the time versus temperature during deformation with adiabatic heating at ~180 s
of around 50°C during deformation at the strain rate of 10 s-1.
Figure 4.3 - Flow curves during plane strain compression tests of the modern HSLA steel
with a martensitic starting microstructure at 600°C with a strain rate of 10 s-1 (a) flow
curves with different true strains, (b) adiabatic heating during deformation.
4.2.2 Microstructure of the shear band
As the deformation was localised in the shear band and resulted in most severe
grain refinement in this area, further focus of this work was laid on analysing the
microstructure in the shear band. Figure 4.4 shows EBSD inverse pole figure maps
with high angle grain boundaries shown in black and low angle grain boundaries
in white. The evolution of the microstructure with increasing strain and a constant
ageing time of 30 min is presented here. For the corresponding IPF colour code,
see Figure 4.1. In Figure 4.4, it can clearly be seen that the initially coarse grains
become elongated in shear direction and subdivide into smaller units with
increasing strain. A true strain of 1 presumably leads to a conversion of most low
angle grain boundaries (LAGB)s or subgrain boundaries into high angle grain
boundaries (HAGB)s. Figure 4.4f shows the evolution of misorientation angle over
true strain. It can be seen that the misorientation of the subgrains increases with
plastic strain (-)
pla
sti
c s
tre
ss (
MP
a)
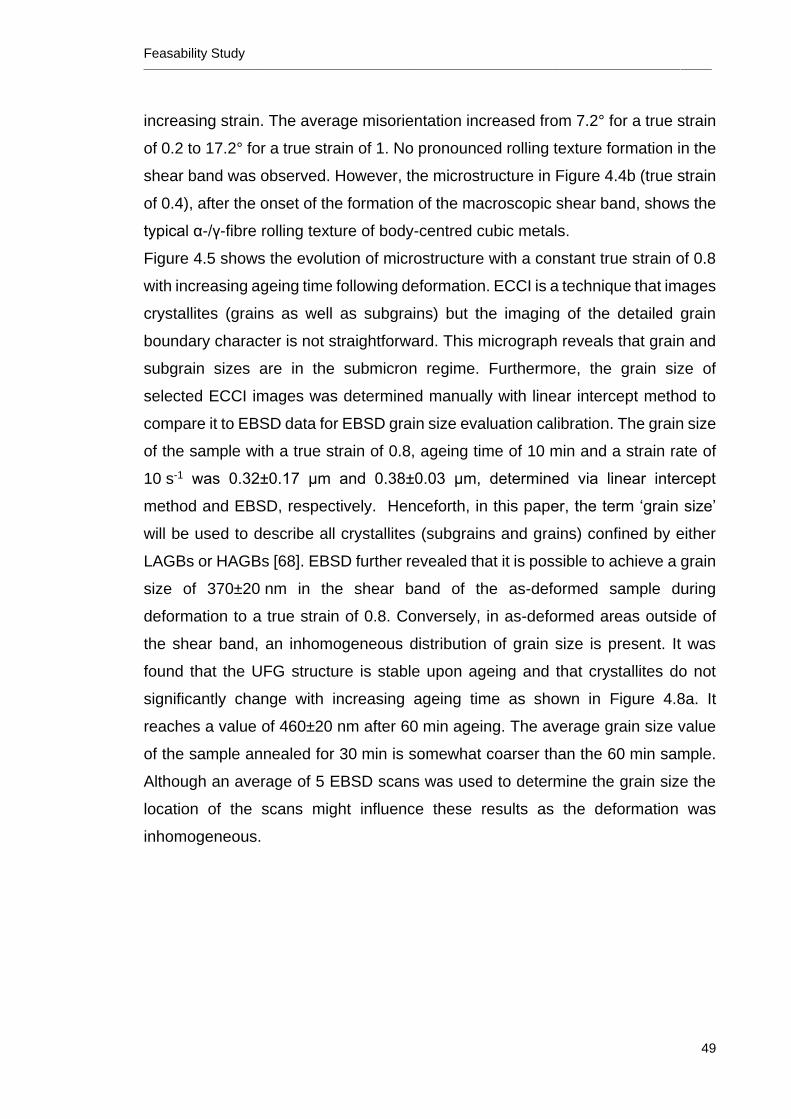
Feasability Study ________________________________________________________________________________________________________________________________
49
increasing strain. The average misorientation increased from 7.2° for a true strain
of 0.2 to 17.2° for a true strain of 1. No pronounced rolling texture formation in the
shear band was observed. However, the microstructure in Figure 4.4b (true strain
of 0.4), after the onset of the formation of the macroscopic shear band, shows the
typical α-/γ-fibre rolling texture of body-centred cubic metals.
Figure 4.5 shows the evolution of microstructure with a constant true strain of 0.8
with increasing ageing time following deformation. ECCI is a technique that images
crystallites (grains as well as subgrains) but the imaging of the detailed grain
boundary character is not straightforward. This micrograph reveals that grain and
subgrain sizes are in the submicron regime. Furthermore, the grain size of
selected ECCI images was determined manually with linear intercept method to
compare it to EBSD data for EBSD grain size evaluation calibration. The grain size
of the sample with a true strain of 0.8, ageing time of 10 min and a strain rate of
10 s-1 was 0.32±0.17 μm and 0.38±0.03 μm, determined via linear intercept
method and EBSD, respectively. Henceforth, in this paper, the term ‘grain size’
will be used to describe all crystallites (subgrains and grains) confined by either
LAGBs or HAGBs [68]. EBSD further revealed that it is possible to achieve a grain
size of 370±20 nm in the shear band of the as-deformed sample during
deformation to a true strain of 0.8. Conversely, in as-deformed areas outside of
the shear band, an inhomogeneous distribution of grain size is present. It was
found that the UFG structure is stable upon ageing and that crystallites do not
significantly change with increasing ageing time as shown in Figure 4.8a. It
reaches a value of 460±20 nm after 60 min ageing. The average grain size value
of the sample annealed for 30 min is somewhat coarser than the 60 min sample.
Although an average of 5 EBSD scans was used to determine the grain size the
location of the scans might influence these results as the deformation was
inhomogeneous.
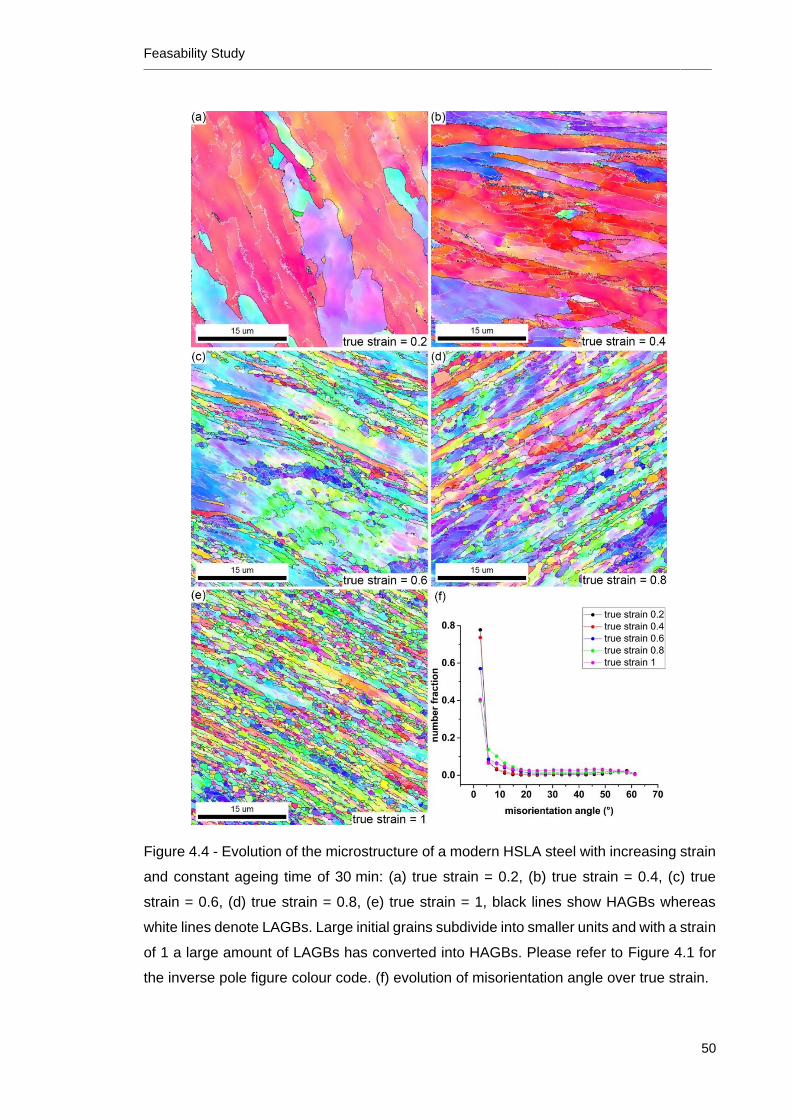
Feasability Study ________________________________________________________________________________________________________________________________
50
Figure 4.4 - Evolution of the microstructure of a modern HSLA steel with increasing strain
and constant ageing time of 30 min: (a) true strain = 0.2, (b) true strain = 0.4, (c) true
strain = 0.6, (d) true strain = 0.8, (e) true strain = 1, black lines show HAGBs whereas
white lines denote LAGBs. Large initial grains subdivide into smaller units and with a strain
of 1 a large amount of LAGBs has converted into HAGBs. Please refer to Figure 4.1 for
the inverse pole figure colour code. (f) evolution of misorientation angle over true strain.
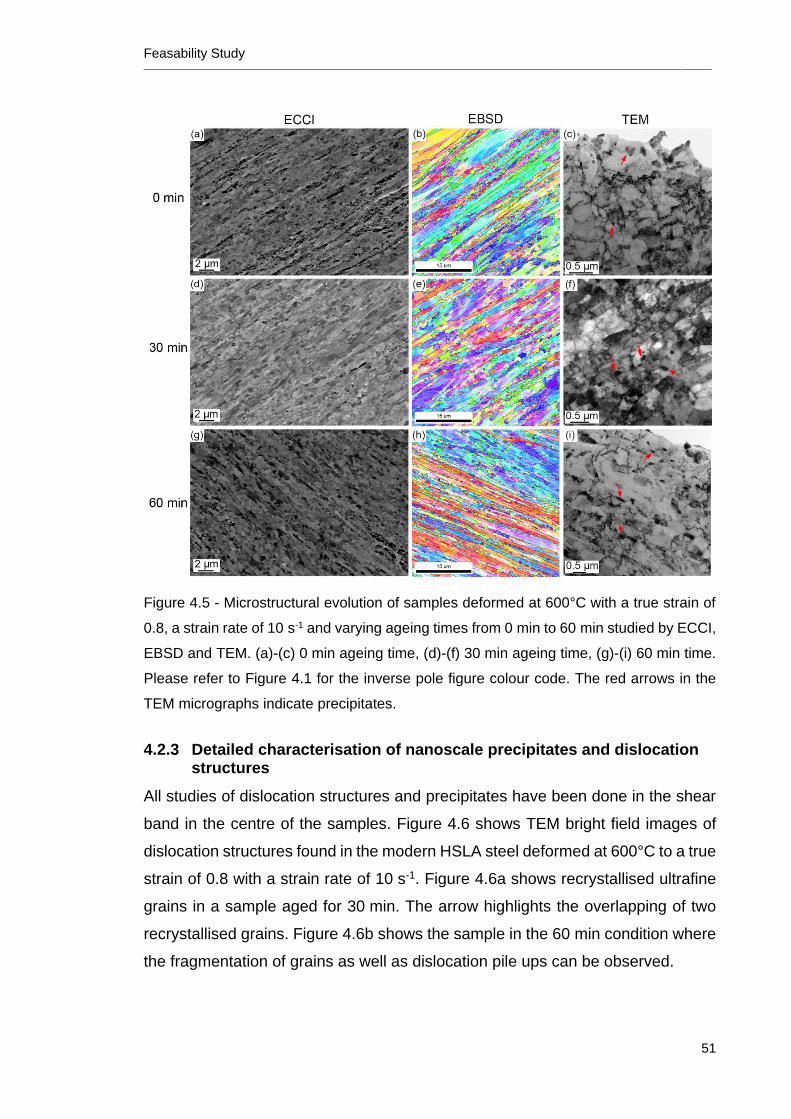
Feasability Study ________________________________________________________________________________________________________________________________
51
Figure 4.5 - Microstructural evolution of samples deformed at 600°C with a true strain of
0.8, a strain rate of 10 s-1 and varying ageing times from 0 min to 60 min studied by ECCI,
EBSD and TEM. (a)-(c) 0 min ageing time, (d)-(f) 30 min ageing time, (g)-(i) 60 min time.
Please refer to Figure 4.1 for the inverse pole figure colour code. The red arrows in the
TEM micrographs indicate precipitates.
4.2.3 Detailed characterisation of nanoscale precipitates and dislocation structures
All studies of dislocation structures and precipitates have been done in the shear
band in the centre of the samples. Figure 4.6 shows TEM bright field images of
dislocation structures found in the modern HSLA steel deformed at 600°C to a true
strain of 0.8 with a strain rate of 10 s-1. Figure 4.6a shows recrystallised ultrafine
grains in a sample aged for 30 min. The arrow highlights the overlapping of two
recrystallised grains. Figure 4.6b shows the sample in the 60 min condition where
the fragmentation of grains as well as dislocation pile ups can be observed.
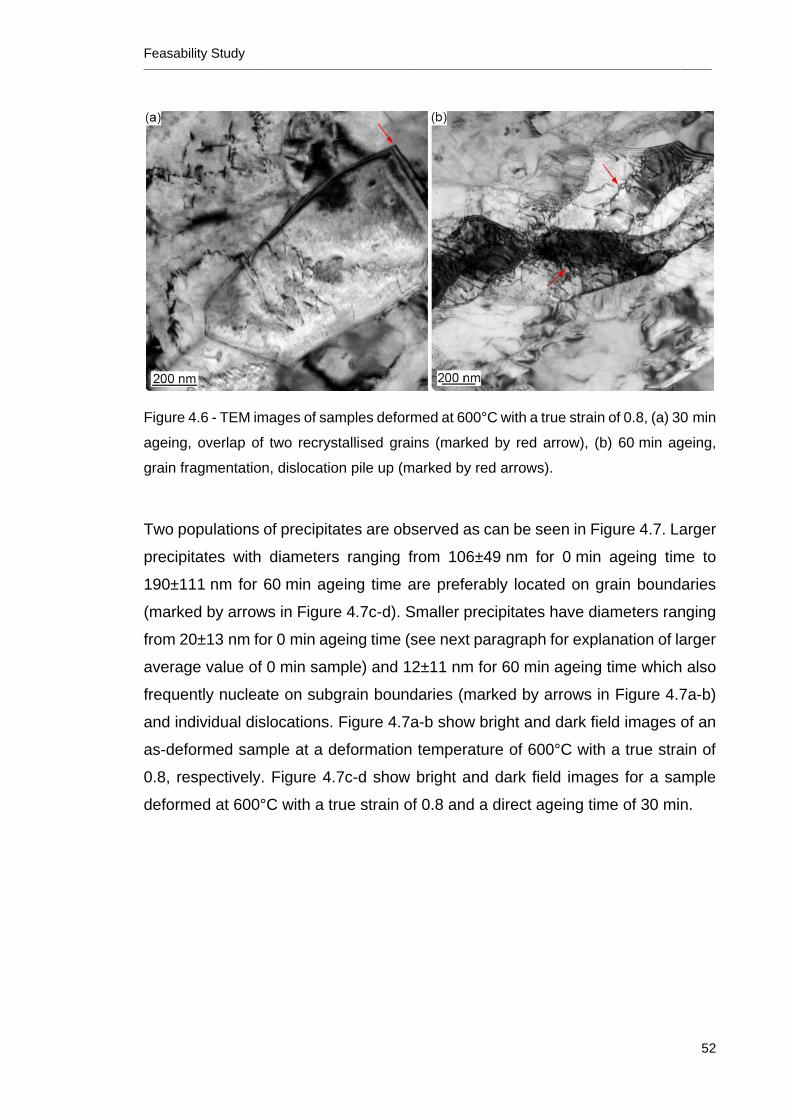
Feasability Study ________________________________________________________________________________________________________________________________
52
Figure 4.6 - TEM images of samples deformed at 600°C with a true strain of 0.8, (a) 30 min
ageing, overlap of two recrystallised grains (marked by red arrow), (b) 60 min ageing,
grain fragmentation, dislocation pile up (marked by red arrows).
Two populations of precipitates are observed as can be seen in Figure 4.7. Larger
precipitates with diameters ranging from 106±49 nm for 0 min ageing time to
190±111 nm for 60 min ageing time are preferably located on grain boundaries
(marked by arrows in Figure 4.7c-d). Smaller precipitates have diameters ranging
from 20±13 nm for 0 min ageing time (see next paragraph for explanation of larger
average value of 0 min sample) and 12±11 nm for 60 min ageing time which also
frequently nucleate on subgrain boundaries (marked by arrows in Figure 4.7a-b)
and individual dislocations. Figure 4.7a-b show bright and dark field images of an
as-deformed sample at a deformation temperature of 600°C with a true strain of
0.8, respectively. Figure 4.7c-d show bright and dark field images for a sample
deformed at 600°C with a true strain of 0.8 and a direct ageing time of 30 min.
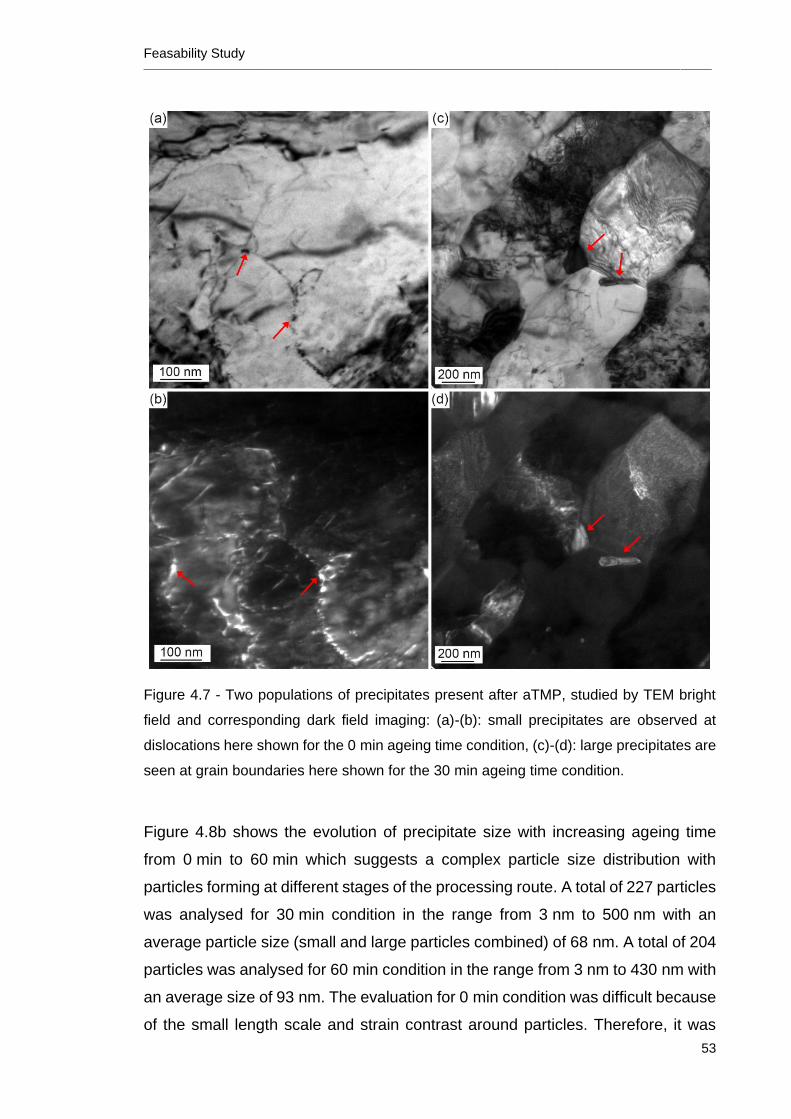
Feasability Study ________________________________________________________________________________________________________________________________
53
Figure 4.7 - Two populations of precipitates present after aTMP, studied by TEM bright
field and corresponding dark field imaging: (a)-(b): small precipitates are observed at
dislocations here shown for the 0 min ageing time condition, (c)-(d): large precipitates are
seen at grain boundaries here shown for the 30 min ageing time condition.
Figure 4.8b shows the evolution of precipitate size with increasing ageing time
from 0 min to 60 min which suggests a complex particle size distribution with
particles forming at different stages of the processing route. A total of 227 particles
was analysed for 30 min condition in the range from 3 nm to 500 nm with an
average particle size (small and large particles combined) of 68 nm. A total of 204
particles was analysed for 60 min condition in the range from 3 nm to 430 nm with
an average size of 93 nm. The evaluation for 0 min condition was difficult because
of the small length scale and strain contrast around particles. Therefore, it was
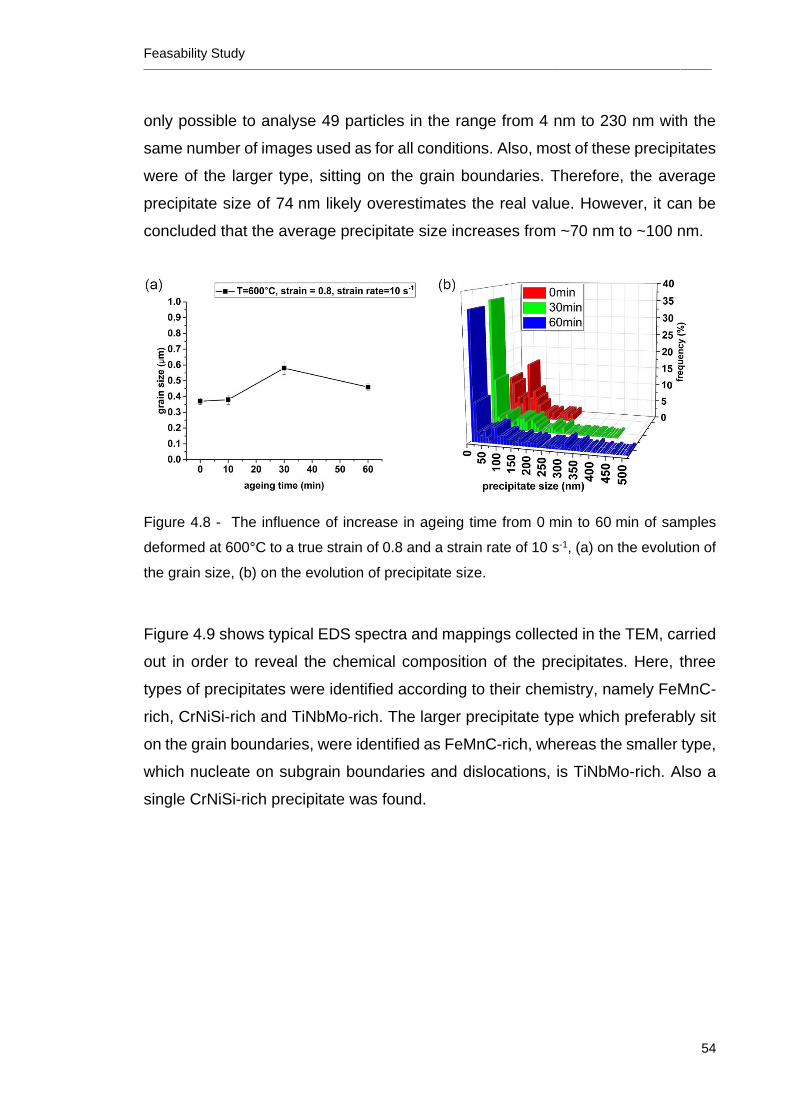
Feasability Study ________________________________________________________________________________________________________________________________
54
only possible to analyse 49 particles in the range from 4 nm to 230 nm with the
same number of images used as for all conditions. Also, most of these precipitates
were of the larger type, sitting on the grain boundaries. Therefore, the average
precipitate size of 74 nm likely overestimates the real value. However, it can be
concluded that the average precipitate size increases from ~70 nm to ~100 nm.
Figure 4.8 - The influence of increase in ageing time from 0 min to 60 min of samples
deformed at 600°C to a true strain of 0.8 and a strain rate of 10 s-1, (a) on the evolution of
the grain size, (b) on the evolution of precipitate size.
Figure 4.9 shows typical EDS spectra and mappings collected in the TEM, carried
out in order to reveal the chemical composition of the precipitates. Here, three
types of precipitates were identified according to their chemistry, namely FeMnC-
rich, CrNiSi-rich and TiNbMo-rich. The larger precipitate type which preferably sit
on the grain boundaries, were identified as FeMnC-rich, whereas the smaller type,
which nucleate on subgrain boundaries and dislocations, is TiNbMo-rich. Also a
single CrNiSi-rich precipitate was found.
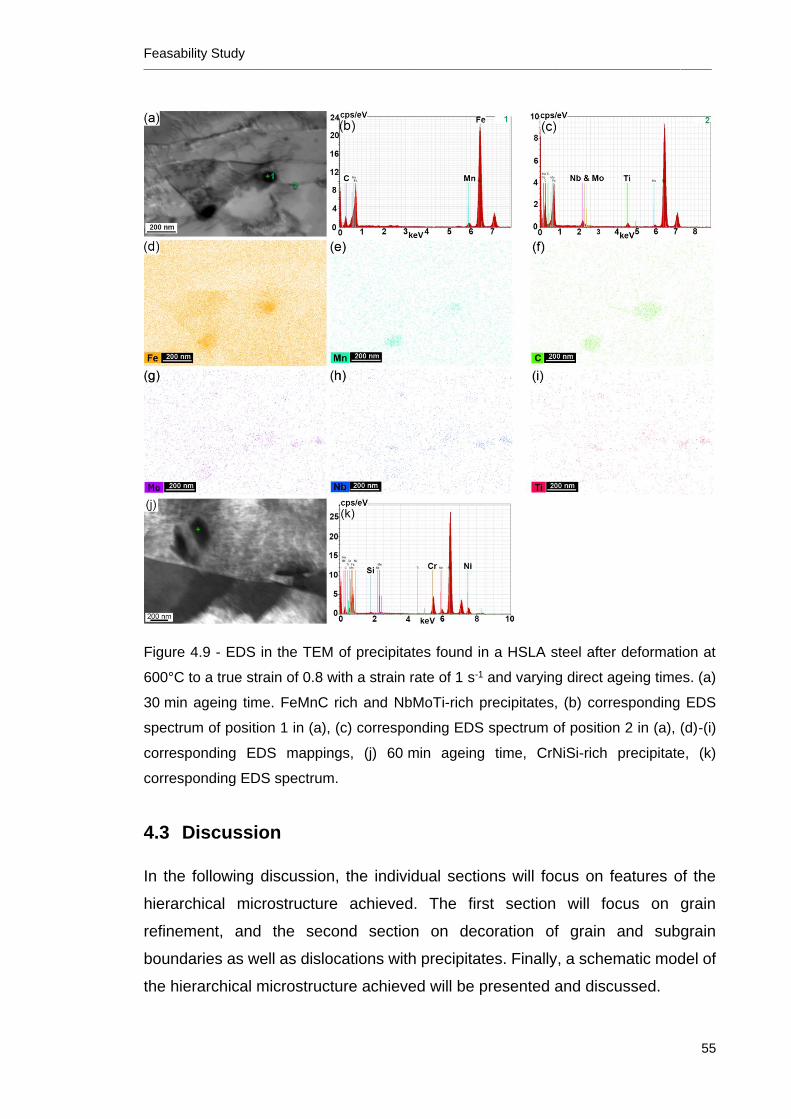
Feasability Study ________________________________________________________________________________________________________________________________
55
Figure 4.9 - EDS in the TEM of precipitates found in a HSLA steel after deformation at
600°C to a true strain of 0.8 with a strain rate of 1 s-1 and varying direct ageing times. (a)
30 min ageing time. FeMnC rich and NbMoTi-rich precipitates, (b) corresponding EDS
spectrum of position 1 in (a), (c) corresponding EDS spectrum of position 2 in (a), (d)-(i)
corresponding EDS mappings, (j) 60 min ageing time, CrNiSi-rich precipitate, (k)
corresponding EDS spectrum.
4.3 Discussion
In the following discussion, the individual sections will focus on features of the
hierarchical microstructure achieved. The first section will focus on grain
refinement, and the second section on decoration of grain and subgrain
boundaries as well as dislocations with precipitates. Finally, a schematic model of
the hierarchical microstructure achieved will be presented and discussed.
Feasability Study ________________________________________________________________________________________________________________________________
56
4.3.1 Grain refinement during aTMP
Through warm deformation of a martensitic/bainitic starting microstructure of a
modern HSLA steel, UFG microstructures with grain sizes in the range of
0.37 μm – 0.58 μm were achieved in the shear band (Figure 4.5). The grain sizes
in literature are more homogenous if rolling was used instead of plane strain
compression. Malekjani et al. [52] reported a similar subgrain size of 300 nm for a
Nb microalloyed steel grade 350 (0.145C-0.023Nb) after 50% cold rolling and
subsequent annealing at 500°C between 300-7200 s of a martensitic
microstructure. The applied rolling reduction of 50% which equals a true strain of
0.7 matches the strains studied in our research. The (sub)grain size is similar to
our results with grain sizes in the range of 0.37 μm – 0.58 μm (Figure 4.8a). These
authors found Fe3C on grain and subgrain boundaries as well as on triple
junctions. The average precipitate size was reported to be 67 nm after 300 s and
100 nm after 7200 s annealing. This is slightly smaller compared to the cementite
size measured here which was 106±49 nm for the 0 min ageing condition (Figure
4.8b). Note that the C content of 0.145% was double the amount compared to the
current material (see Table 3.1). We identified the same preferable nucleation sites
for cementite (Figure 4.7c-d). Malekjani et al. [52] further reported large
recrystallised grains of 1.6±0.3 μm after 7200 s annealing, in contrast to our study.
Okitsu et al. [6] achieved grain sizes of 0.49 μm for cold rolling to 91% of a
ferritic/martensitic duplex microstructure (0.1C-0.018Nb) followed by annealing at
625°C for 120 s. They reported that their grains were uniaxial and did not consist
of substructures which they explained by the large reduction in thickness applied.
The grain size is again comparable to our results although these authors used a
larger reduction in thickness of 90% which equals a true strain of 1.6. Furthermore,
they used a martensitic/ferritic duplex starting microstructure where most of the
deformation was located in the softer ferrite. Abbasi et al. [54] achieved UFG sizes
through cold rolling to 85% reduction in thickness of a martensitic microstructure
(0.14C-0.045Nb) and subsequent annealing. Annealing for 300 s at 550°C and
600°C led to grain sizes of 79 nm and 167 nm, respectively. This is somewhat
smaller than in our research which might be due to the larger rolling reduction of
85%, equalling a true strain of 1.9. They furthermore discussed the positive effect
of NbC to prevent grain growth during annealing. However, there is no detailed
Feasability Study ________________________________________________________________________________________________________________________________
57
characterisation of the nano-scale precipitates in their paper.
Foroozmehr et al. [55] studied the influence of C content and rolling reduction on
the formation of UFG of a Nb microalloyed steel. They concluded that the lower
the C content is the higher the required reduction. Up to 80% cold rolling and
annealing at 500°C for 30 min was not sufficient to achieve complete grain
refinement in a 0.038C-0.02Nb steel. They concluded that steels with a C content
lower than 0.08 wt% are not suitable for achieving UFG with this process.
Other methods to achieve UFG in microalloyed steels have been reported
although the resulting grain sizes are slightly larger compared to cold rolling and
annealing. Cheng et al. [8] achieved a grain size of 1 μm in a Ti-Mo microalloyed
steel (0.11C-0.3Mo-0.11Ti) after rolling at 850°C with a reduction of thickness of
55.6%, finish rolling at 650°C with a reduction of 65% followed by ageing at 600°C
for 30 min. They report that strain induced nano-scale (Ti, Mo)C precipitate in the
substructures of the pancaked austenite which is not only beneficial for grain
refinement but for precipitation hardening as well. Gallego et al. [69] reported a
grain size of 0.9 μm in a microalloyed steel (0.16C-0.048Nb-0.016Ti) after warm
deformation at 740°C with a total deformation of 60% of a martensitic
microstructure. They furthermore reported a cementite size of 115±46 nm. It
appears that the grain sizes achieved with these methods are on average larger
compared to our processing approach, although the rolling reductions used are
comparable to the current study.
To conclude, warm rolling in the ferrite of a martensitic starting microstructure of
HSLA steels is a suitable method of aTMP for grain refinement in the submicron
regime. The clear industrial advantage of this method compared to cold rolling and
annealing is the reduced rolling force needed [50]. The advantage compared to
conventional TMP is the finer grain sizes achieved.
4.3.2 Macroscopic shear band formation and CDRX
Although target microstructures have been achieved, inhomogeneous
deformation due to formation of a macroscopic shear band as seen in Figure 4.2
occurs if a true strain of 0.4 or higher was applied. The shear band starts to form
at a strain of around 0.3. A possible reason is adiabatic heating during deformation
with high strain rate of 10 s-1 or the occurrence of gradient temperature prior to
Feasability Study ________________________________________________________________________________________________________________________________
58
deformation. Furthermore, it is belived that the geometry of the samples and anvils
in the Gleeble during plane strain compression lead to strain localisation as
described with finite element modelling by Aksenov et al. [84]. These authors
showed that large strain and strain rate inhomogeneities occur over the volume of
a HC420LA steel for deformation temperatures between 980°C – 1050°C. They
reported that the local effective strain in the sample compared to the nominal strain
applied might be up to 60% higher [84]. The formation of adiabatic shear bands in
steels is well known for high strain rates achieved through ballistic impacts. Xu et
al. [85] reported that shear localisation in a low C steel is dependent on the
strength at a certain strain rate. A higher strength leads to an increased likelihood
of shear banding. They also stated that the critical strain needed for shear band
formation in a quenched steel is 0.3, similar to our results. A similar behaviour of
shear banding was observed by Chao et al. [61] in a Ti-6Al-4V alloy when a
martensitic starting microstructure was uniaxially compressed at 700°C with a true
strain of 0.8 and a strain rate of 1 s-1. These authors suggested that the reason for
the shear band formation could be adiabatic heating which may lead to a phase
transformation and flow softening. They showed that lowering the strain rate to
0.001- 0.01 s-1 led to more homogenous deformation. We too observed adiabatic
heating of 50°C, as can be seen in Figure 4.3b. The approach to overcome shear
banding in this study was using lower strain rates. However, the lowest strain rate
of 0.01s-1 still resulted in shear banding in the material investigated in the current
study as can be seen in Figure 4.2d. Gourdet and Montheillet [68] developed a
model to describe flow curves of high stacking fault energy metals. They
suggested that stress-strain curves show a distinct maximum followed by only
limited softening. Experimental results although revealed a considerably amount
of flow softening. By incorporating adiabatic heating into their model they could
match the experimental observations. These authors concluded that adiabatic
heating and/or other topological effects are responsible for the flow softening.
Therefore, it can be concluded that the flow curve in Figure 4.3a follows typical
flow behaviour commonly observed during CDRX where strain localisation leads
to adiabatic heating (Figure 4.3b). Further, the EBSD scans in Figure 4.4 show the
subdivision of the original coarse grains by LAGBs and the gradual formation of
equiaxed refined grains which are surrounded by HAGBs. Due to their high
stacking fault energy, ferritic steels undergo CDRX, where classical nucleation
Feasability Study ________________________________________________________________________________________________________________________________
59
does not play are role in the formation of new grains. As dynamic recovery is the
predominant mechanism, recrystallised grains form by transformation from
subgrains into new grains within the original grains which have undergone
deformation. Dislocations accumulate in LAGBs leading to an increase in
misorientation angle and finally to the formation of HAGBS when a critical value is
reached [68]. The increase in misorientation angle for our samples is shown in
Figure 4.4f. Gourdet and Montheillet [68] suggest that the formation of HAGBS
happens at moderate true strains of 1. In our research first grains defined by
HAGBS started to form at a true strain of 0.6 (Figure 4.4c), but it can be assumed
that the local equivalent true strains are higher. When a strain of 1 was applied a
majority of subgrains have transformed (Figure 4.4e). This grain fragmentation
was also observed in the TEM, as seen in Figure 4.6, which shows that
dislocations subdivide individual grains. This confirms that the mechanism behind
the grain refinement during warm deformation and direct ageing of martensite is
CDRX, which was also found by other authors [4,7,8,55,61].
4.3.3 Direct ageing
As shown in Figure 4.7, Figure 4.8b and Figure 4.9 two populations of precipitates
were found. Large FeMnC-rich precipitates which were preferably found on grain
boundaries, and smaller precipitates which were NbMoTi-rich and nucleated on
dislocations and subgrain boundaries.
Charleux et al. [86] studied the precipitation behaviour of a Nb and Ti HSLA steel
(0.07C-0.08Nb-0.047Ti) which was processed via traditional TMP and ageing at
650°C for 60 min. They reported spherical Fe3C precipitates with sizes of
0.1-0.5 μm in diameter that formed due to spheroidisation of pearlite colonies
during annealing. As they were relatively large in size, these authors suggested
that they do not contribute significantly to strengthening. They furthermore
observed Nb/TiC of different sizes depending on their location. The precipitate size
on grain or subgrain boundaries ranged from 7-12 nm. Precipitates on dislocations
within grains with high dislocation density were needle-shaped with a length of
3-6 nm and a diameter of 0.7-0.9 nm. Spherical Nb/TiC with a size of 3-5 nm were
observed in grains with a low dislocation density. Lan et al. [51] reported cementite
particles with a size of several nm and NbTiV-rich precipitates with a size of a few
Feasability Study ________________________________________________________________________________________________________________________________
60
nm formed during annealing at 550°C of a cold-rolled martensite (0.16C-0.05Nb-
0.065Ti). These reports match well with the results in our study.
We assume that the larger FeMnC-rich precipitates are cementite which forms
during auto-tempering of the martensite during heating and soaking at deformation
temperature. A similar phenomenon was observed by Li et al. [87] during warm
deformation of a low C martensite with 0.16 wt%C. The steel in the present study
has only 0.05 wt%C which explained the smaller amount of cementite in our
material compared to Li et al.’s study. Other authors reported precipitation of large
cementite particles at higher temperatures or spheroidised pearlite [48,86].
As NbCN, TiN and TiC exhibit a NaCl crystal structure, they have a high lattice
mismatch with the ferrite and precipitate on crystalline defects such as dislocations
or subgrain boundaries. This leads to a strengthening effect following the
Orowan-Ashby mechanism [13]. Therefore, it can be assumed that strain-induced
precipitation occurs during deformation. Misra et al. [88] reported that only smaller
precipitates (<25 nm) are contributing significantly to precipitation hardening.
However, these precipitates do not only contribute to strengthening but also inhibit
grain growth during ageing as can be seen in Figure 4.5 and Figure 4.6a. The
grain size of our steel is stable upon ageing due to Zener pinning of the precipitates
located on grain and subgrain boundaries, as can be seen in Figure 4.7.
Lan et al. [51] discussed these positive effects of microalloying elements upon
ageing for a cold-rolled martensite. They also reported slight coarsening of
precipitates after 60 min tempering. Furthermore, Ostwald ripening during ageing
was observed for all precipitates, as can be seen in Figure 4.8b attributed to the
high diffusion coefficient of Nb and C in ferrite. Due to the chemical composition
of this steel, which also contains other carbide formers such as Cr, it is likely that
the coarsening of the Nb(C, N) is slowed down. It is believed that the isolated
CrNiSi-rich particle has formed because the solution annealing was not sufficient
enough for local homogenous redistribution of alloying elements.
4.3.4 Microstructural model and mechanical properties
In this study we aimed to produce a hierarchical microstructure in a HSLA steel in
order to enhance its mechanical properties by decorating ultrafine grains with
precipitates. A schematic of the hierarchical microstructure achieved is shown in
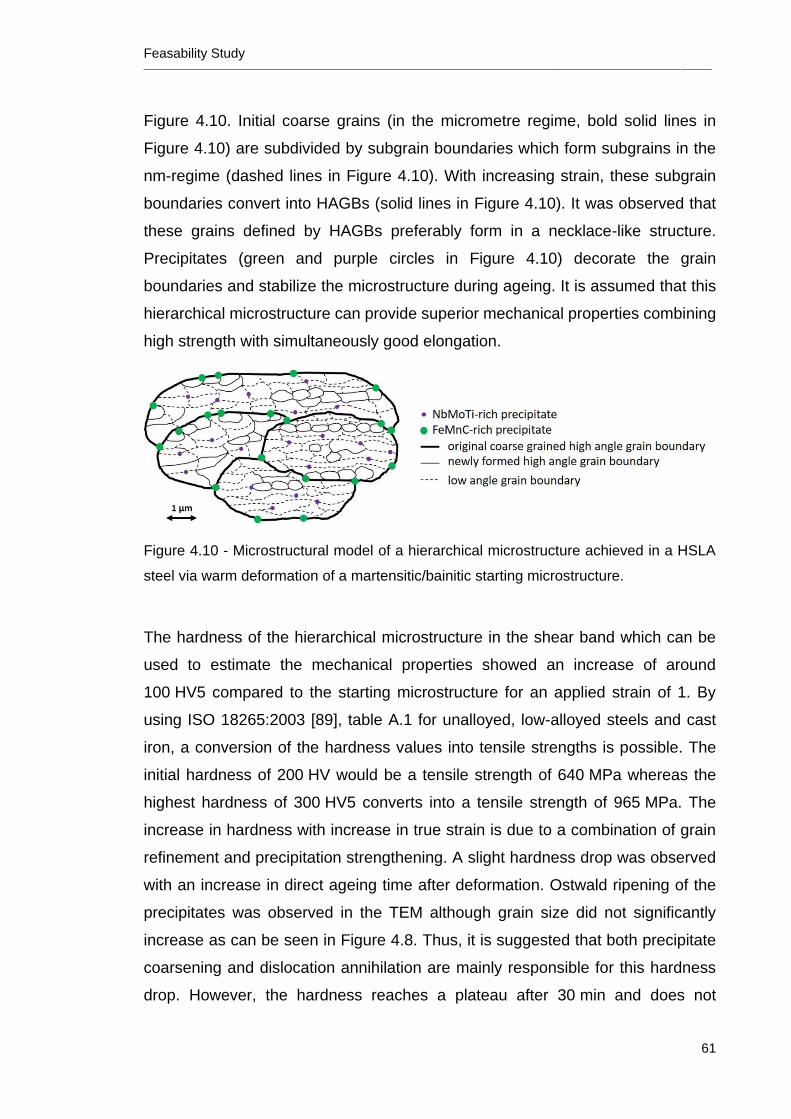
Feasability Study ________________________________________________________________________________________________________________________________
61
Figure 4.10. Initial coarse grains (in the micrometre regime, bold solid lines in
Figure 4.10) are subdivided by subgrain boundaries which form subgrains in the
nm-regime (dashed lines in Figure 4.10). With increasing strain, these subgrain
boundaries convert into HAGBs (solid lines in Figure 4.10). It was observed that
these grains defined by HAGBs preferably form in a necklace-like structure.
Precipitates (green and purple circles in Figure 4.10) decorate the grain
boundaries and stabilize the microstructure during ageing. It is assumed that this
hierarchical microstructure can provide superior mechanical properties combining
high strength with simultaneously good elongation.
Figure 4.10 - Microstructural model of a hierarchical microstructure achieved in a HSLA
steel via warm deformation of a martensitic/bainitic starting microstructure.
The hardness of the hierarchical microstructure in the shear band which can be
used to estimate the mechanical properties showed an increase of around
100 HV5 compared to the starting microstructure for an applied strain of 1. By
using ISO 18265:2003 [89], table A.1 for unalloyed, low-alloyed steels and cast
iron, a conversion of the hardness values into tensile strengths is possible. The
initial hardness of 200 HV would be a tensile strength of 640 MPa whereas the
highest hardness of 300 HV5 converts into a tensile strength of 965 MPa. The
increase in hardness with increase in true strain is due to a combination of grain
refinement and precipitation strengthening. A slight hardness drop was observed
with an increase in direct ageing time after deformation. Ostwald ripening of the
precipitates was observed in the TEM although grain size did not significantly
increase as can be seen in Figure 4.8. Thus, it is suggested that both precipitate
coarsening and dislocation annihilation are mainly responsible for this hardness
drop. However, the hardness reaches a plateau after 30 min and does not
Feasability Study ________________________________________________________________________________________________________________________________
62
decrease further. This confirms that the microstructures achieved are thermally
stable.
4.4 Summary and Outlook
In this chapter, a stable hierarchical target microstructure was achieved via
advanced thermo-mechanical processing of a modern HSLA steel. Deformation at
600°C with a strain rate of 10 s-1 of martensitic/bainitic starting microstructure
leads to strain localisation and therefore to the formation of a macroscopic shear
band if a true strain of 0.4 and higher is applied. Continuous dynamic
recrystallisation leads to ultrafine grain sizes of around 0.5 μm in the shear band
region which are stable upon ageing at 600°C up to 60 min. Two populations of
precipitates were found, a larger type of FeMnC-rich precipitates which preferably
nucleates at high angle grain boundaries, whereas smaller NbMoTi-rich
precipitates also nucleate at dislocations and subgrain boundaries. These
precipitates undergo limited Ostwald ripening during ageing at 600°C. Such
microstructures are desirable for design of modern HSLA steels with superior
mechanical properties in terms of strength, ductility and work hardening.
Thus, the following chapters will include achieving more homogenous deformation
by modifying the deformation parameters such as number of deformation passes
and strain applied per pass as well as strain-rate and soaking time before
deformation. After successful design approach for homogeneity the process will
be up-scaled in order to be able to enable thorough mechanical testing.
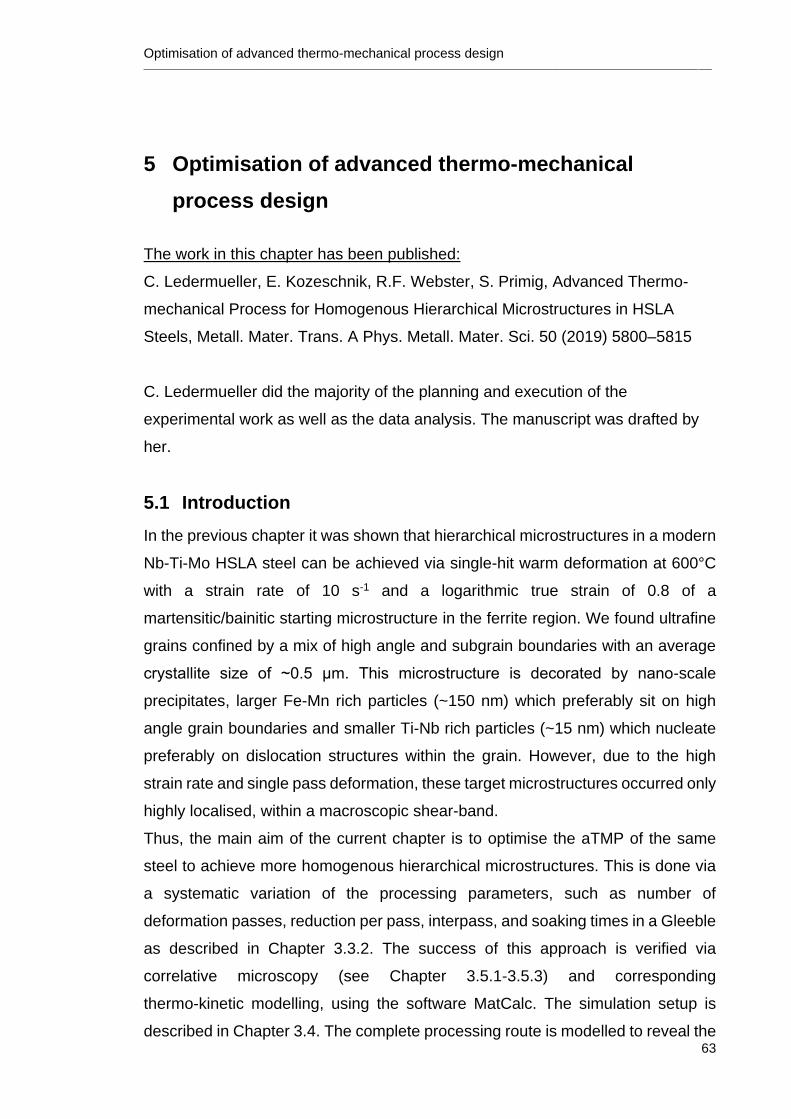
Optimisation of advanced thermo-mechanical process design ________________________________________________________________________________________________________________________________
63
5 Optimisation of advanced thermo-mechanical
process design
The work in this chapter has been published:
C. Ledermueller, E. Kozeschnik, R.F. Webster, S. Primig, Advanced Thermo-
mechanical Process for Homogenous Hierarchical Microstructures in HSLA
Steels, Metall. Mater. Trans. A Phys. Metall. Mater. Sci. 50 (2019) 5800–5815
C. Ledermueller did the majority of the planning and execution of the
experimental work as well as the data analysis. The manuscript was drafted by
her.
5.1 Introduction
In the previous chapter it was shown that hierarchical microstructures in a modern
Nb-Ti-Mo HSLA steel can be achieved via single-hit warm deformation at 600°C
with a strain rate of 10 s-1 and a logarithmic true strain of 0.8 of a
martensitic/bainitic starting microstructure in the ferrite region. We found ultrafine
grains confined by a mix of high angle and subgrain boundaries with an average
crystallite size of ~0.5 μm. This microstructure is decorated by nano-scale
precipitates, larger Fe-Mn rich particles (~150 nm) which preferably sit on high
angle grain boundaries and smaller Ti-Nb rich particles (~15 nm) which nucleate
preferably on dislocation structures within the grain. However, due to the high
strain rate and single pass deformation, these target microstructures occurred only
highly localised, within a macroscopic shear-band.
Thus, the main aim of the current chapter is to optimise the aTMP of the same
steel to achieve more homogenous hierarchical microstructures. This is done via
a systematic variation of the processing parameters, such as number of
deformation passes, reduction per pass, interpass, and soaking times in a Gleeble
as described in Chapter 3.3.2. The success of this approach is verified via
correlative microscopy (see Chapter 3.5.1-3.5.3) and corresponding
thermo-kinetic modelling, using the software MatCalc. The simulation setup is
described in Chapter 3.4. The complete processing route is modelled to reveal the
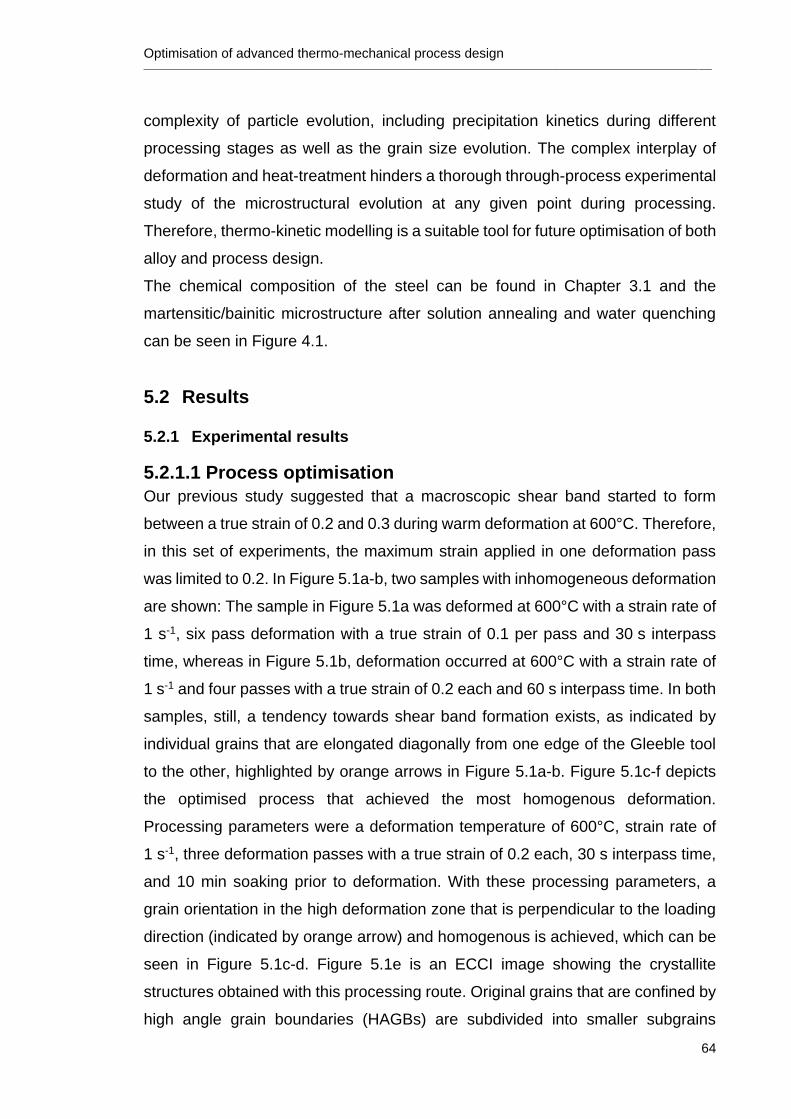
Optimisation of advanced thermo-mechanical process design ________________________________________________________________________________________________________________________________
64
complexity of particle evolution, including precipitation kinetics during different
processing stages as well as the grain size evolution. The complex interplay of
deformation and heat-treatment hinders a thorough through-process experimental
study of the microstructural evolution at any given point during processing.
Therefore, thermo-kinetic modelling is a suitable tool for future optimisation of both
alloy and process design.
The chemical composition of the steel can be found in Chapter 3.1 and the
martensitic/bainitic microstructure after solution annealing and water quenching
can be seen in Figure 4.1.
5.2 Results
5.2.1 Experimental results
5.2.1.1 Process optimisation
Our previous study suggested that a macroscopic shear band started to form
between a true strain of 0.2 and 0.3 during warm deformation at 600°C. Therefore,
in this set of experiments, the maximum strain applied in one deformation pass
was limited to 0.2. In Figure 5.1a-b, two samples with inhomogeneous deformation
are shown: The sample in Figure 5.1a was deformed at 600°C with a strain rate of
1 s-1, six pass deformation with a true strain of 0.1 per pass and 30 s interpass
time, whereas in Figure 5.1b, deformation occurred at 600°C with a strain rate of
1 s-1 and four passes with a true strain of 0.2 each and 60 s interpass time. In both
samples, still, a tendency towards shear band formation exists, as indicated by
individual grains that are elongated diagonally from one edge of the Gleeble tool
to the other, highlighted by orange arrows in Figure 5.1a-b. Figure 5.1c-f depicts
the optimised process that achieved the most homogenous deformation.
Processing parameters were a deformation temperature of 600°C, strain rate of
1 s-1, three deformation passes with a true strain of 0.2 each, 30 s interpass time,
and 10 min soaking prior to deformation. With these processing parameters, a
grain orientation in the high deformation zone that is perpendicular to the loading
direction (indicated by orange arrow) and homogenous is achieved, which can be
seen in Figure 5.1c-d. Figure 5.1e is an ECCI image showing the crystallite
structures obtained with this processing route. Original grains that are confined by
high angle grain boundaries (HAGBs) are subdivided into smaller subgrains
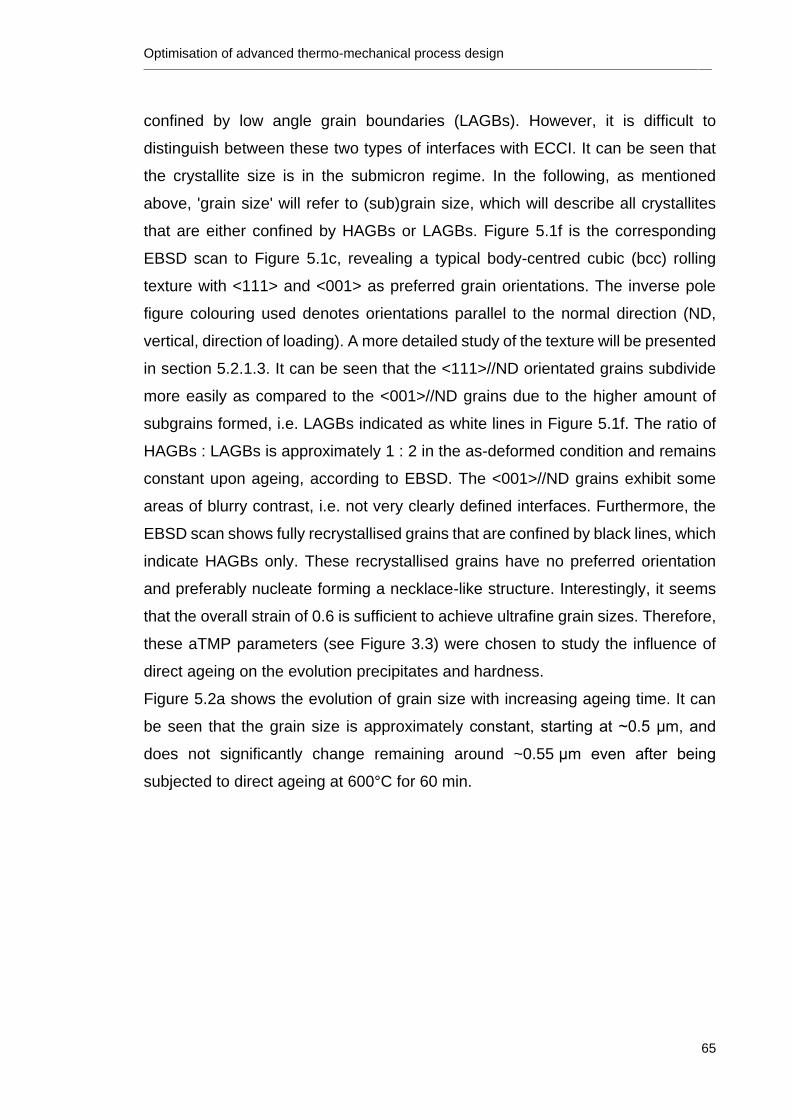
Optimisation of advanced thermo-mechanical process design ________________________________________________________________________________________________________________________________
65
confined by low angle grain boundaries (LAGBs). However, it is difficult to
distinguish between these two types of interfaces with ECCI. It can be seen that
the crystallite size is in the submicron regime. In the following, as mentioned
above, 'grain size' will refer to (sub)grain size, which will describe all crystallites
that are either confined by HAGBs or LAGBs. Figure 5.1f is the corresponding
EBSD scan to Figure 5.1c, revealing a typical body-centred cubic (bcc) rolling
texture with <111> and <001> as preferred grain orientations. The inverse pole
figure colouring used denotes orientations parallel to the normal direction (ND,
vertical, direction of loading). A more detailed study of the texture will be presented
in section 5.2.1.3. It can be seen that the <111>//ND orientated grains subdivide
more easily as compared to the <001>//ND grains due to the higher amount of
subgrains formed, i.e. LAGBs indicated as white lines in Figure 5.1f. The ratio of
HAGBs : LAGBs is approximately 1 : 2 in the as-deformed condition and remains
constant upon ageing, according to EBSD. The <001>//ND grains exhibit some
areas of blurry contrast, i.e. not very clearly defined interfaces. Furthermore, the
EBSD scan shows fully recrystallised grains that are confined by black lines, which
indicate HAGBs only. These recrystallised grains have no preferred orientation
and preferably nucleate forming a necklace-like structure. Interestingly, it seems
that the overall strain of 0.6 is sufficient to achieve ultrafine grain sizes. Therefore,
these aTMP parameters (see Figure 3.3) were chosen to study the influence of
direct ageing on the evolution precipitates and hardness.
Figure 5.2a shows the evolution of grain size with increasing ageing time. It can
be seen that the grain size is approximately constant, starting at ~0.5 μm, and
does not significantly change remaining around ~0.55 μm even after being
subjected to direct ageing at 600°C for 60 min.
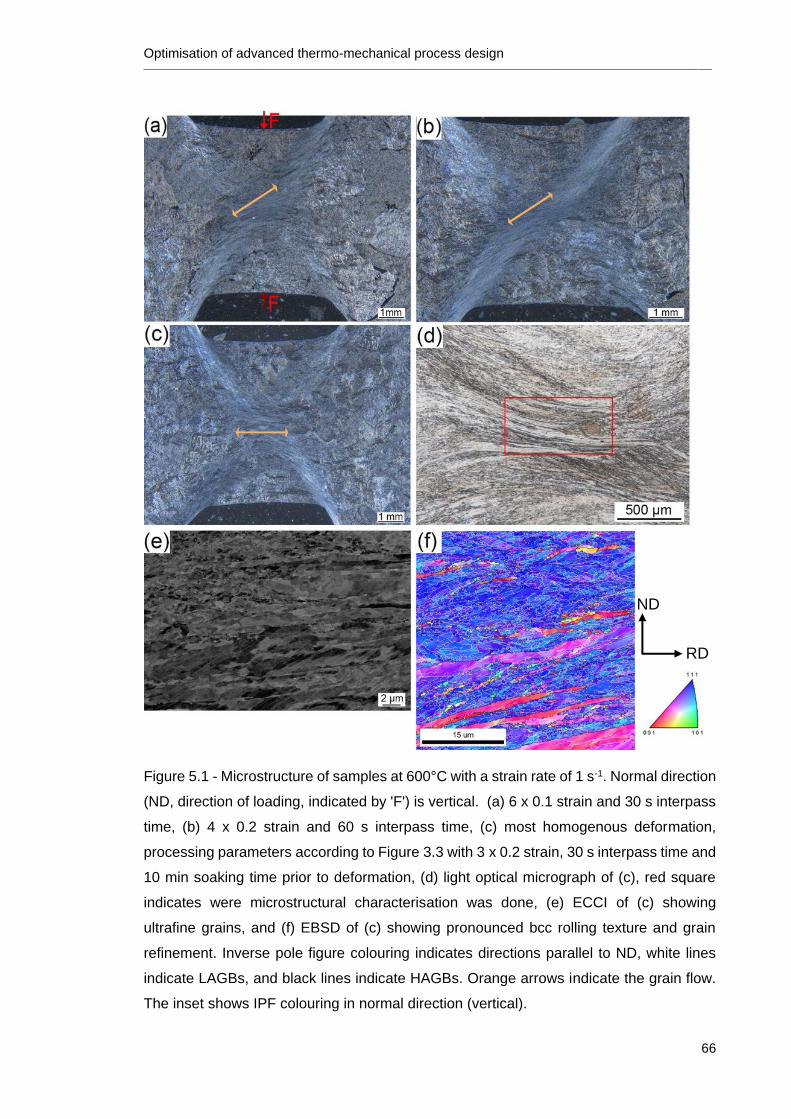
Optimisation of advanced thermo-mechanical process design ________________________________________________________________________________________________________________________________
66
Figure 5.1 - Microstructure of samples at 600°C with a strain rate of 1 s-1. Normal direction
(ND, direction of loading, indicated by 'F') is vertical. (a) 6 x 0.1 strain and 30 s interpass
time, (b) 4 x 0.2 strain and 60 s interpass time, (c) most homogenous deformation,
processing parameters according to Figure 3.3 with 3 x 0.2 strain, 30 s interpass time and
10 min soaking time prior to deformation, (d) light optical micrograph of (c), red square
indicates were microstructural characterisation was done, (e) ECCI of (c) showing
ultrafine grains, and (f) EBSD of (c) showing pronounced bcc rolling texture and grain
refinement. Inverse pole figure colouring indicates directions parallel to ND, white lines
indicate LAGBs, and black lines indicate HAGBs. Orange arrows indicate the grain flow.
The inset shows IPF colouring in normal direction (vertical).
ND
RD
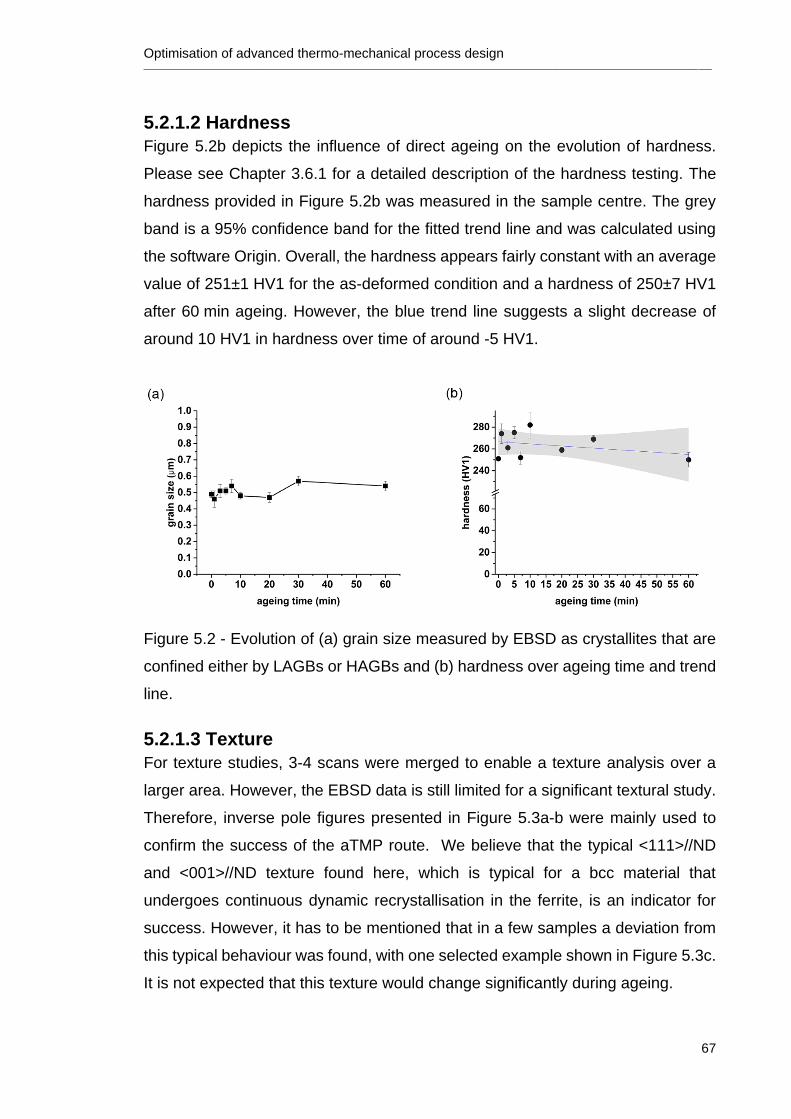
Optimisation of advanced thermo-mechanical process design ________________________________________________________________________________________________________________________________
67
5.2.1.2 Hardness
Figure 5.2b depicts the influence of direct ageing on the evolution of hardness.
Please see Chapter 3.6.1 for a detailed description of the hardness testing. The
hardness provided in Figure 5.2b was measured in the sample centre. The grey
band is a 95% confidence band for the fitted trend line and was calculated using
the software Origin. Overall, the hardness appears fairly constant with an average
value of 251±1 HV1 for the as-deformed condition and a hardness of 250±7 HV1
after 60 min ageing. However, the blue trend line suggests a slight decrease of
around 10 HV1 in hardness over time of around -5 HV1.
Figure 5.2 - Evolution of (a) grain size measured by EBSD as crystallites that are
confined either by LAGBs or HAGBs and (b) hardness over ageing time and trend
line.
5.2.1.3 Texture
For texture studies, 3-4 scans were merged to enable a texture analysis over a
larger area. However, the EBSD data is still limited for a significant textural study.
Therefore, inverse pole figures presented in Figure 5.3a-b were mainly used to
confirm the success of the aTMP route. We believe that the typical <111>//ND
and <001>//ND texture found here, which is typical for a bcc material that
undergoes continuous dynamic recrystallisation in the ferrite, is an indicator for
success. However, it has to be mentioned that in a few samples a deviation from
this typical behaviour was found, with one selected example shown in Figure 5.3c.
It is not expected that this texture would change significantly during ageing.
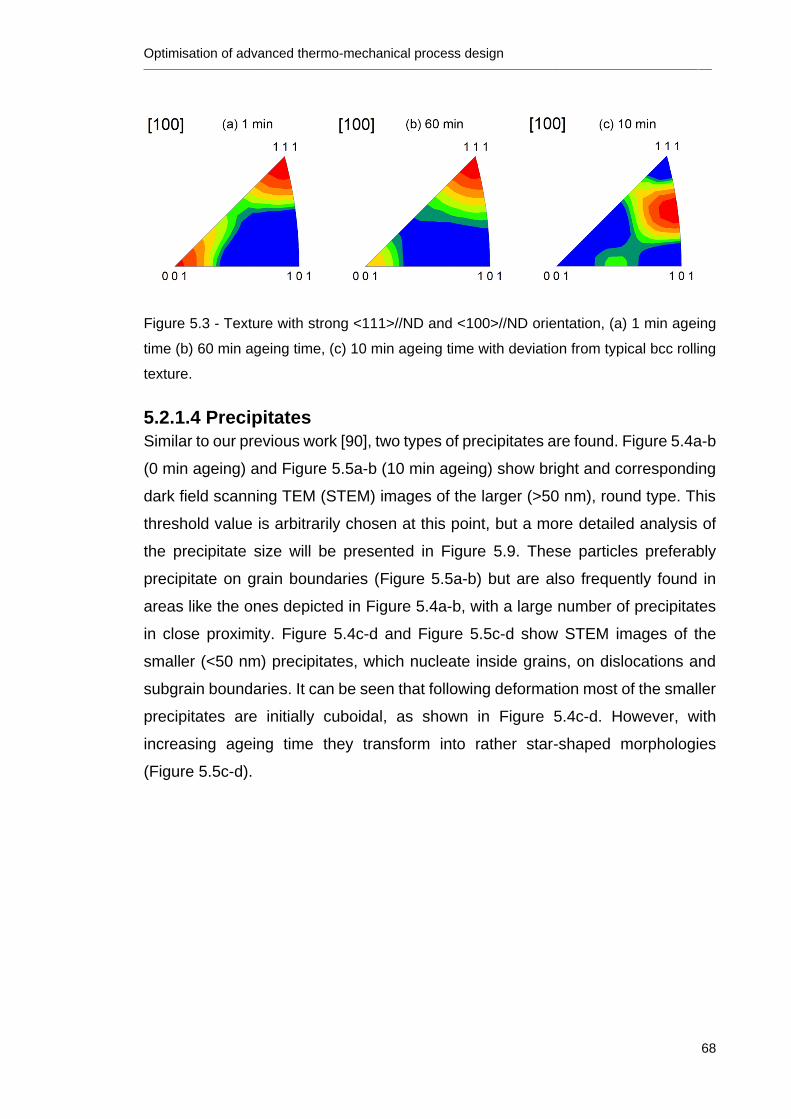
Optimisation of advanced thermo-mechanical process design ________________________________________________________________________________________________________________________________
68
Figure 5.3 - Texture with strong <111>//ND and <100>//ND orientation, (a) 1 min ageing
time (b) 60 min ageing time, (c) 10 min ageing time with deviation from typical bcc rolling
texture.
5.2.1.4 Precipitates
Similar to our previous work [90], two types of precipitates are found. Figure 5.4a-b
(0 min ageing) and Figure 5.5a-b (10 min ageing) show bright and corresponding
dark field scanning TEM (STEM) images of the larger (>50 nm), round type. This
threshold value is arbitrarily chosen at this point, but a more detailed analysis of
the precipitate size will be presented in Figure 5.9. These particles preferably
precipitate on grain boundaries (Figure 5.5a-b) but are also frequently found in
areas like the ones depicted in Figure 5.4a-b, with a large number of precipitates
in close proximity. Figure 5.4c-d and Figure 5.5c-d show STEM images of the
smaller (<50 nm) precipitates, which nucleate inside grains, on dislocations and
subgrain boundaries. It can be seen that following deformation most of the smaller
precipitates are initially cuboidal, as shown in Figure 5.4c-d. However, with
increasing ageing time they transform into rather star-shaped morphologies
(Figure 5.5c-d).
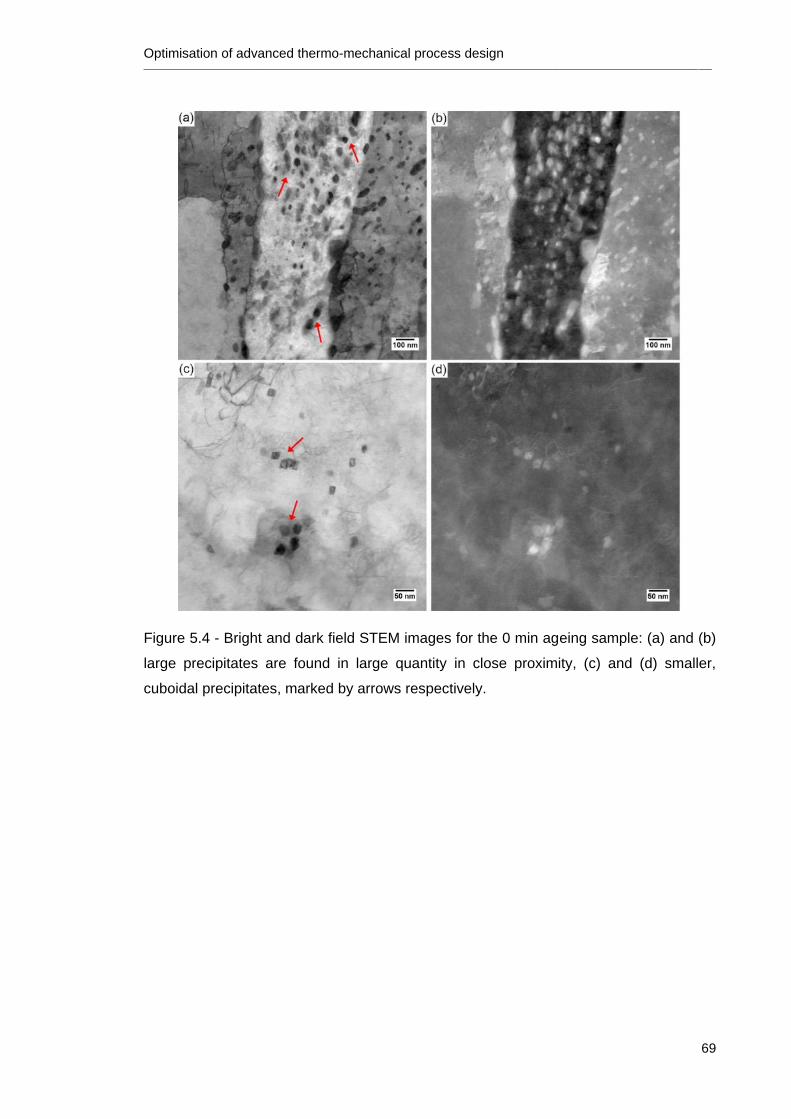
Optimisation of advanced thermo-mechanical process design ________________________________________________________________________________________________________________________________
69
Figure 5.4 - Bright and dark field STEM images for the 0 min ageing sample: (a) and (b)
large precipitates are found in large quantity in close proximity, (c) and (d) smaller,
cuboidal precipitates, marked by arrows respectively.
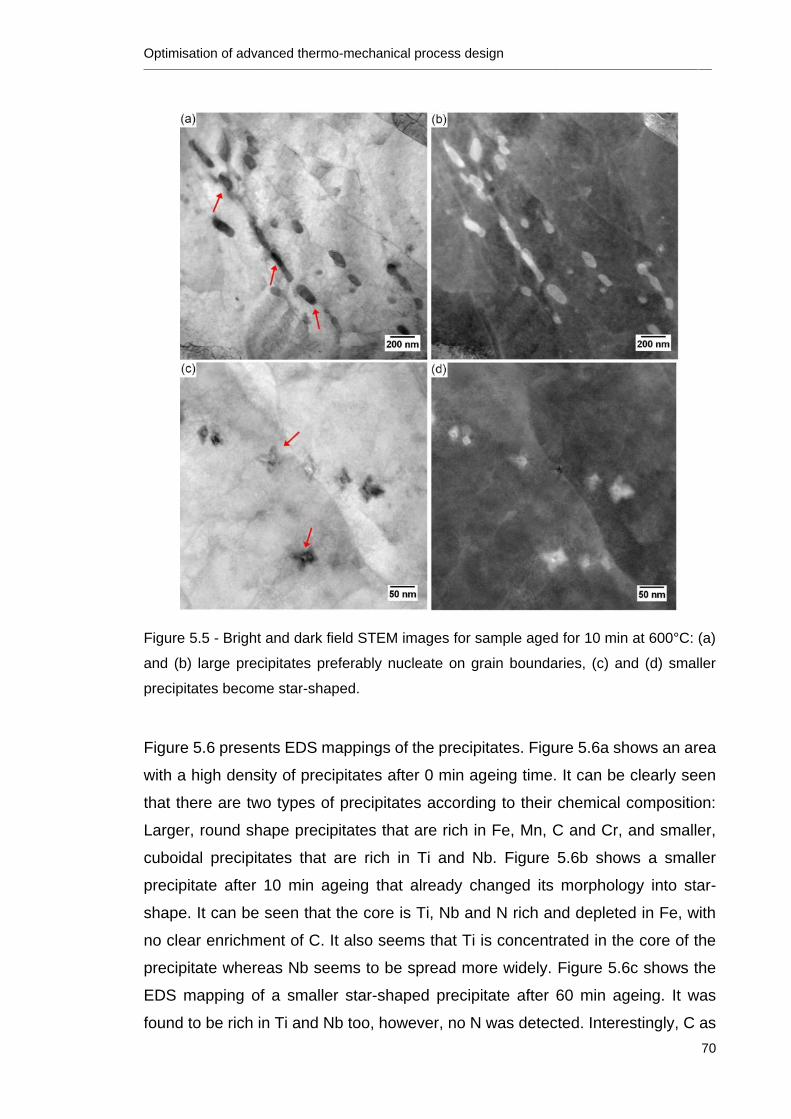
Optimisation of advanced thermo-mechanical process design ________________________________________________________________________________________________________________________________
70
Figure 5.5 - Bright and dark field STEM images for sample aged for 10 min at 600°C: (a)
and (b) large precipitates preferably nucleate on grain boundaries, (c) and (d) smaller
precipitates become star-shaped.
Figure 5.6 presents EDS mappings of the precipitates. Figure 5.6a shows an area
with a high density of precipitates after 0 min ageing time. It can be clearly seen
that there are two types of precipitates according to their chemical composition:
Larger, round shape precipitates that are rich in Fe, Mn, C and Cr, and smaller,
cuboidal precipitates that are rich in Ti and Nb. Figure 5.6b shows a smaller
precipitate after 10 min ageing that already changed its morphology into star-
shape. It can be seen that the core is Ti, Nb and N rich and depleted in Fe, with
no clear enrichment of C. It also seems that Ti is concentrated in the core of the
precipitate whereas Nb seems to be spread more widely. Figure 5.6c shows the
EDS mapping of a smaller star-shaped precipitate after 60 min ageing. It was
found to be rich in Ti and Nb too, however, no N was detected. Interestingly, C as
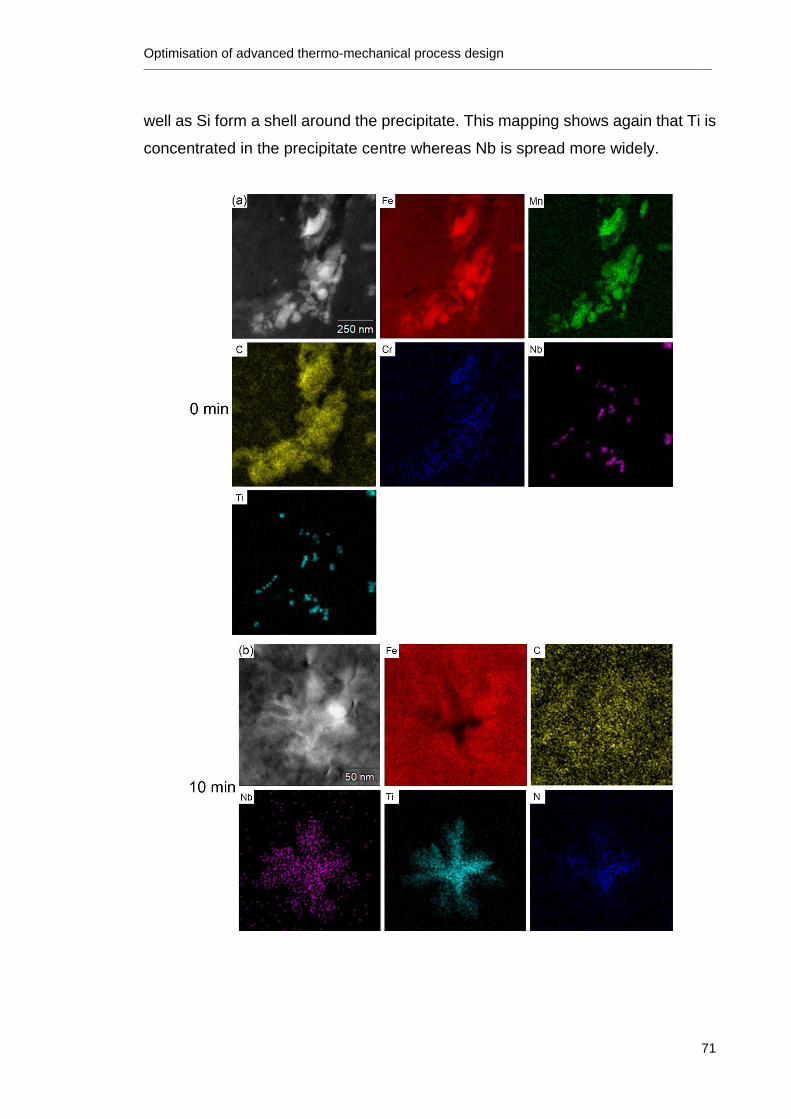
Optimisation of advanced thermo-mechanical process design ________________________________________________________________________________________________________________________________
71
well as Si form a shell around the precipitate. This mapping shows again that Ti is
concentrated in the precipitate centre whereas Nb is spread more widely.
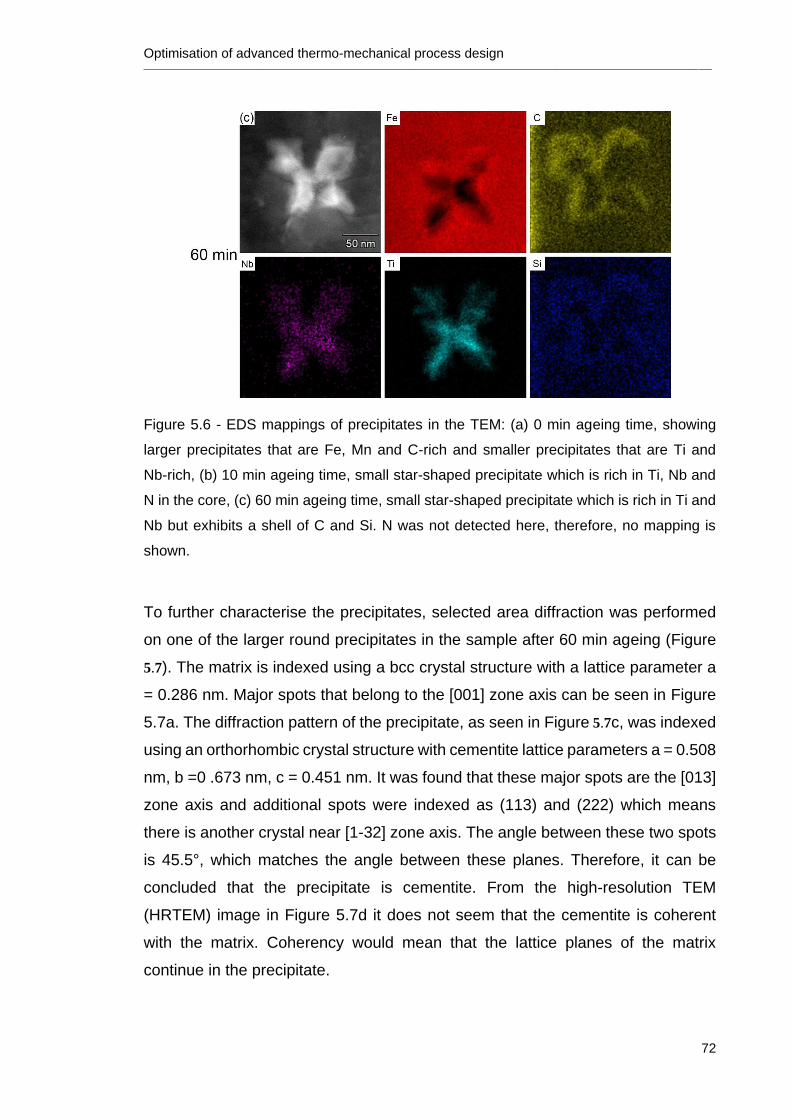
Optimisation of advanced thermo-mechanical process design ________________________________________________________________________________________________________________________________
72
Figure 5.6 - EDS mappings of precipitates in the TEM: (a) 0 min ageing time, showing
larger precipitates that are Fe, Mn and C-rich and smaller precipitates that are Ti and
Nb-rich, (b) 10 min ageing time, small star-shaped precipitate which is rich in Ti, Nb and
N in the core, (c) 60 min ageing time, small star-shaped precipitate which is rich in Ti and
Nb but exhibits a shell of C and Si. N was not detected here, therefore, no mapping is
shown.
To further characterise the precipitates, selected area diffraction was performed
on one of the larger round precipitates in the sample after 60 min ageing (Figure
5.7). The matrix is indexed using a bcc crystal structure with a lattice parameter a
= 0.286 nm. Major spots that belong to the [001] zone axis can be seen in Figure
5.7a. The diffraction pattern of the precipitate, as seen in Figure 5.7c, was indexed
using an orthorhombic crystal structure with cementite lattice parameters a = 0.508
nm, b =0 .673 nm, c = 0.451 nm. It was found that these major spots are the [013]
zone axis and additional spots were indexed as (113) and (222) which means
there is another crystal near [1-32] zone axis. The angle between these two spots
is 45.5°, which matches the angle between these planes. Therefore, it can be
concluded that the precipitate is cementite. From the high-resolution TEM
(HRTEM) image in Figure 5.7d it does not seem that the cementite is coherent
with the matrix. Coherency would mean that the lattice planes of the matrix
continue in the precipitate.
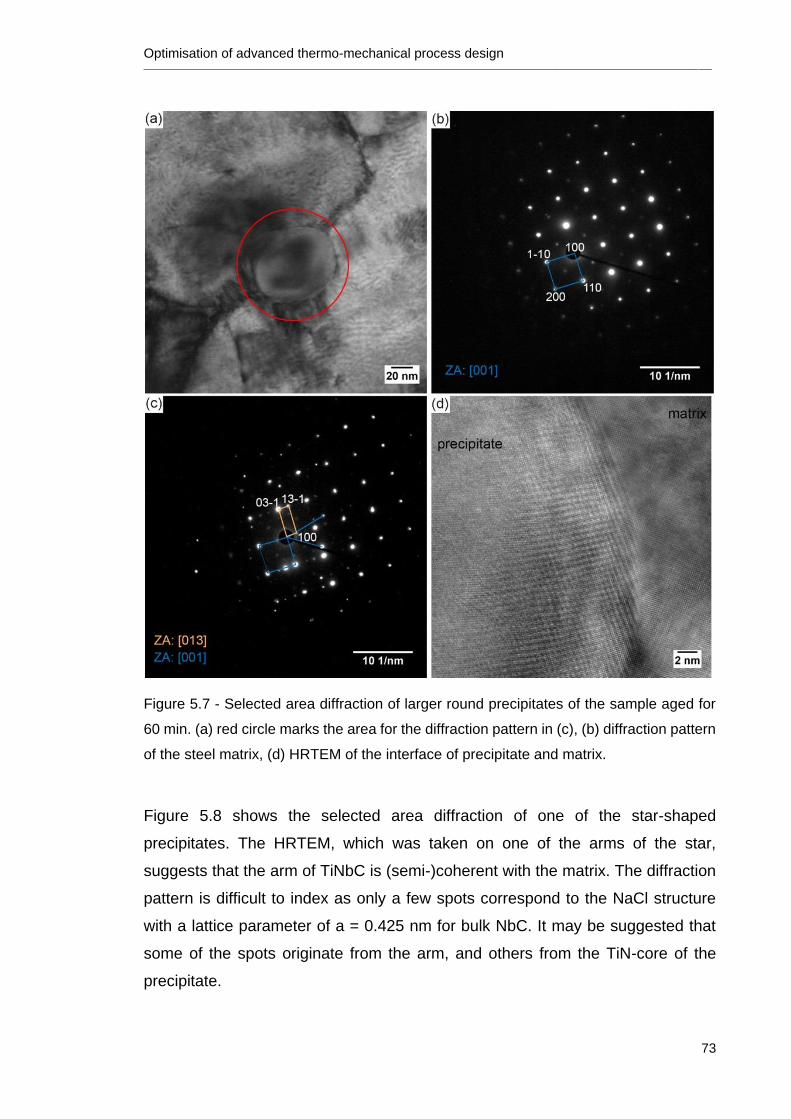
Optimisation of advanced thermo-mechanical process design ________________________________________________________________________________________________________________________________
73
Figure 5.7 - Selected area diffraction of larger round precipitates of the sample aged for
60 min. (a) red circle marks the area for the diffraction pattern in (c), (b) diffraction pattern
of the steel matrix, (d) HRTEM of the interface of precipitate and matrix.
Figure 5.8 shows the selected area diffraction of one of the star-shaped
precipitates. The HRTEM, which was taken on one of the arms of the star,
suggests that the arm of TiNbC is (semi-)coherent with the matrix. The diffraction
pattern is difficult to index as only a few spots correspond to the NaCl structure
with a lattice parameter of a = 0.425 nm for bulk NbC. It may be suggested that
some of the spots originate from the arm, and others from the TiN-core of the
precipitate.
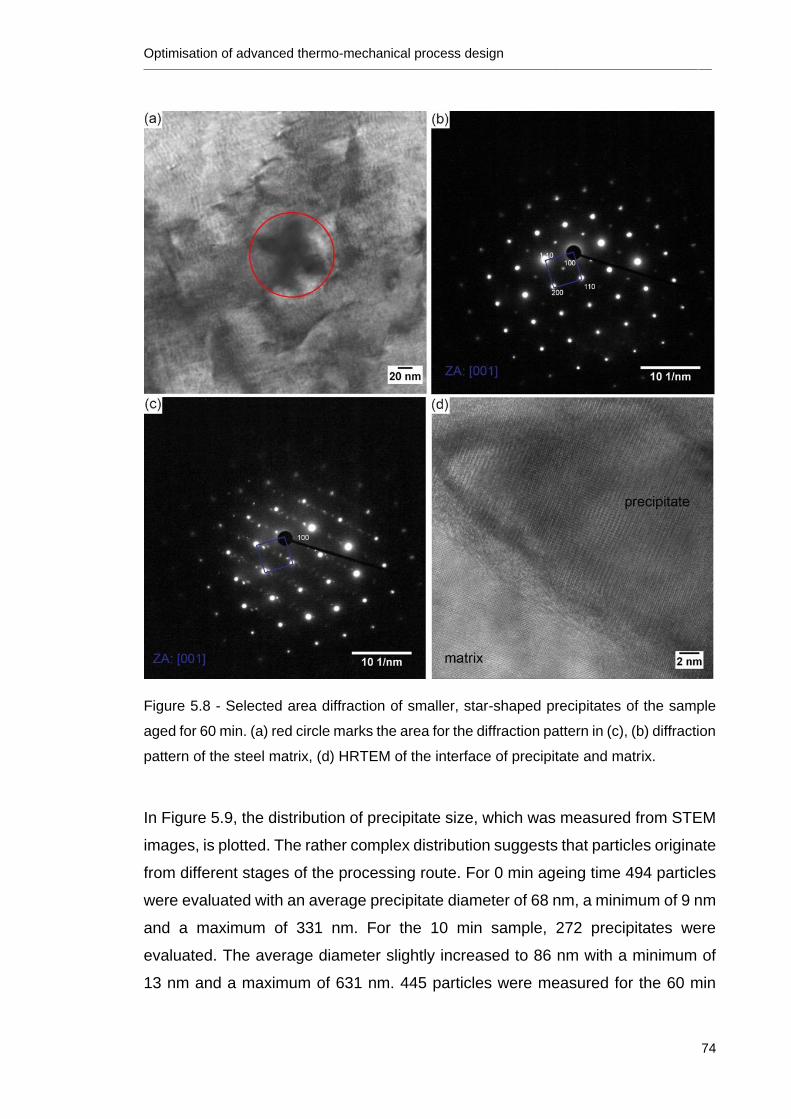
Optimisation of advanced thermo-mechanical process design ________________________________________________________________________________________________________________________________
74
Figure 5.8 - Selected area diffraction of smaller, star-shaped precipitates of the sample
aged for 60 min. (a) red circle marks the area for the diffraction pattern in (c), (b) diffraction
pattern of the steel matrix, (d) HRTEM of the interface of precipitate and matrix.
In Figure 5.9, the distribution of precipitate size, which was measured from STEM
images, is plotted. The rather complex distribution suggests that particles originate
from different stages of the processing route. For 0 min ageing time 494 particles
were evaluated with an average precipitate diameter of 68 nm, a minimum of 9 nm
and a maximum of 331 nm. For the 10 min sample, 272 precipitates were
evaluated. The average diameter slightly increased to 86 nm with a minimum of
13 nm and a maximum of 631 nm. 445 particles were measured for the 60 min
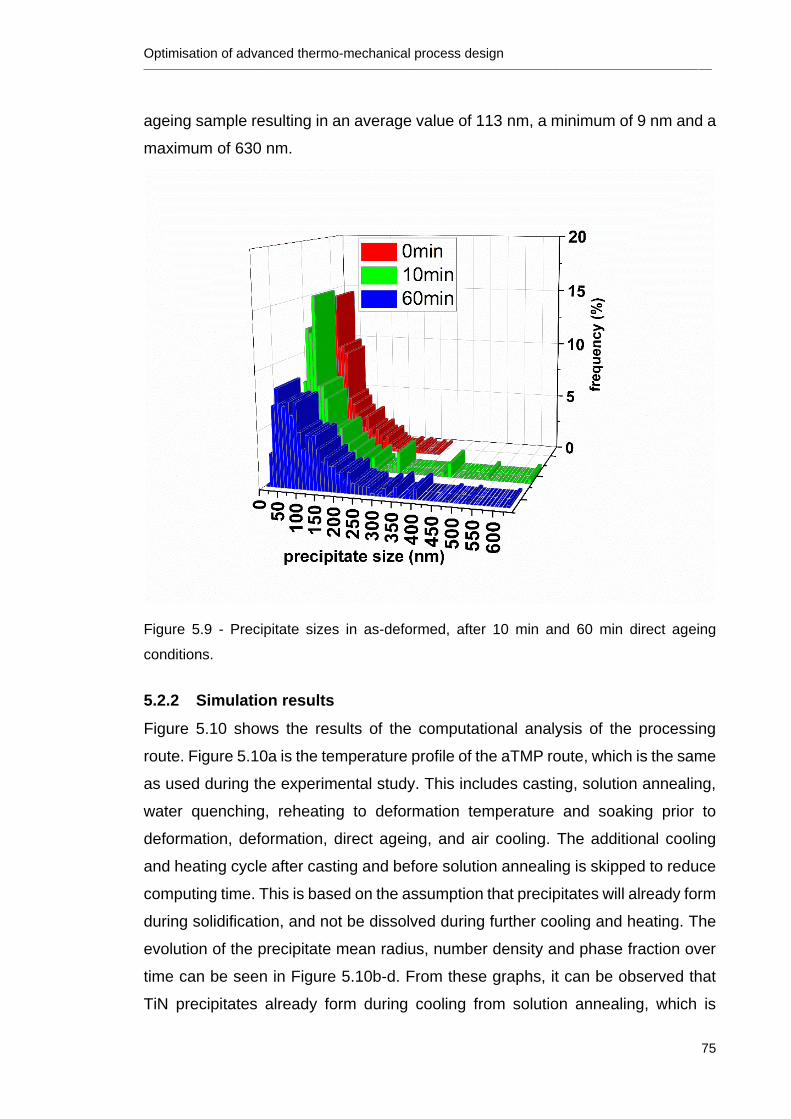
Optimisation of advanced thermo-mechanical process design ________________________________________________________________________________________________________________________________
75
ageing sample resulting in an average value of 113 nm, a minimum of 9 nm and a
maximum of 630 nm.
Figure 5.9 - Precipitate sizes in as-deformed, after 10 min and 60 min direct ageing
conditions.
5.2.2 Simulation results
Figure 5.10 shows the results of the computational analysis of the processing
route. Figure 5.10a is the temperature profile of the aTMP route, which is the same
as used during the experimental study. This includes casting, solution annealing,
water quenching, reheating to deformation temperature and soaking prior to
deformation, deformation, direct ageing, and air cooling. The additional cooling
and heating cycle after casting and before solution annealing is skipped to reduce
computing time. This is based on the assumption that precipitates will already form
during solidification, and not be dissolved during further cooling and heating. The
evolution of the precipitate mean radius, number density and phase fraction over
time can be seen in Figure 5.10b-d. From these graphs, it can be observed that
TiN precipitates already form during cooling from solution annealing, which is
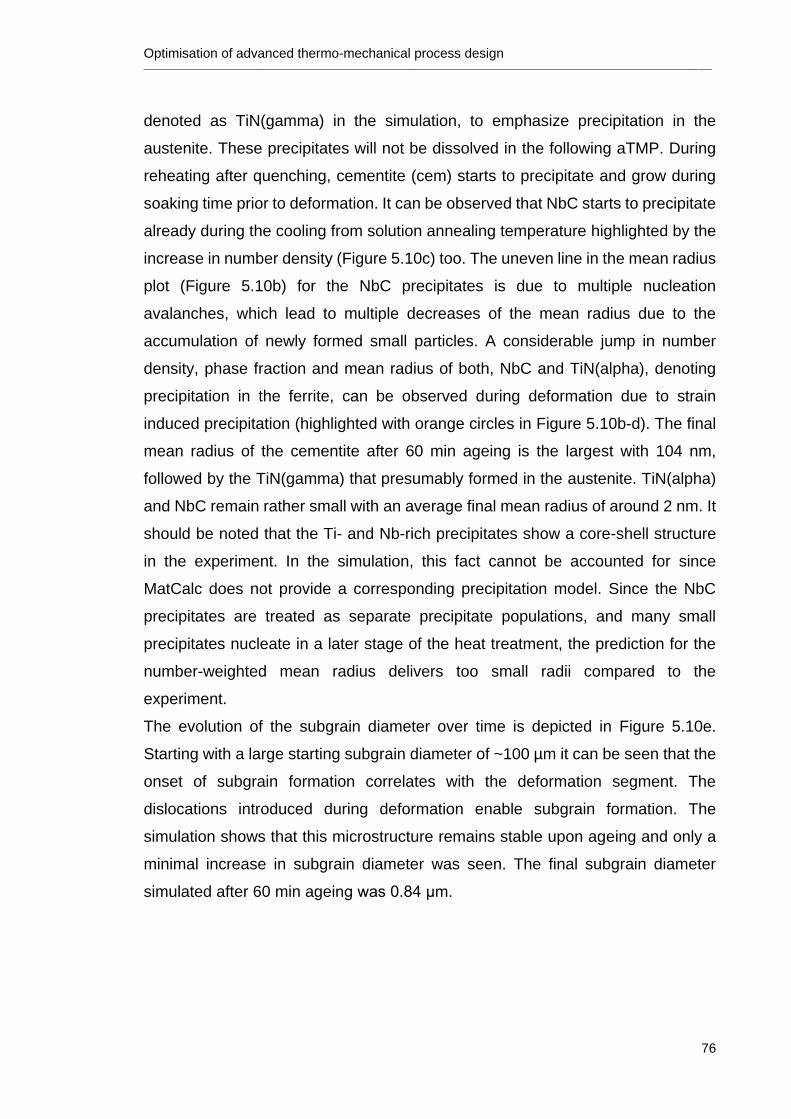
Optimisation of advanced thermo-mechanical process design ________________________________________________________________________________________________________________________________
76
denoted as TiN(gamma) in the simulation, to emphasize precipitation in the
austenite. These precipitates will not be dissolved in the following aTMP. During
reheating after quenching, cementite (cem) starts to precipitate and grow during
soaking time prior to deformation. It can be observed that NbC starts to precipitate
already during the cooling from solution annealing temperature highlighted by the
increase in number density (Figure 5.10c) too. The uneven line in the mean radius
plot (Figure 5.10b) for the NbC precipitates is due to multiple nucleation
avalanches, which lead to multiple decreases of the mean radius due to the
accumulation of newly formed small particles. A considerable jump in number
density, phase fraction and mean radius of both, NbC and TiN(alpha), denoting
precipitation in the ferrite, can be observed during deformation due to strain
induced precipitation (highlighted with orange circles in Figure 5.10b-d). The final
mean radius of the cementite after 60 min ageing is the largest with 104 nm,
followed by the TiN(gamma) that presumably formed in the austenite. TiN(alpha)
and NbC remain rather small with an average final mean radius of around 2 nm. It
should be noted that the Ti- and Nb-rich precipitates show a core-shell structure
in the experiment. In the simulation, this fact cannot be accounted for since
MatCalc does not provide a corresponding precipitation model. Since the NbC
precipitates are treated as separate precipitate populations, and many small
precipitates nucleate in a later stage of the heat treatment, the prediction for the
number-weighted mean radius delivers too small radii compared to the
experiment.
The evolution of the subgrain diameter over time is depicted in Figure 5.10e.
Starting with a large starting subgrain diameter of ~100 µm it can be seen that the
onset of subgrain formation correlates with the deformation segment. The
dislocations introduced during deformation enable subgrain formation. The
simulation shows that this microstructure remains stable upon ageing and only a
minimal increase in subgrain diameter was seen. The final subgrain diameter
simulated after 60 min ageing was 0.84 μm.
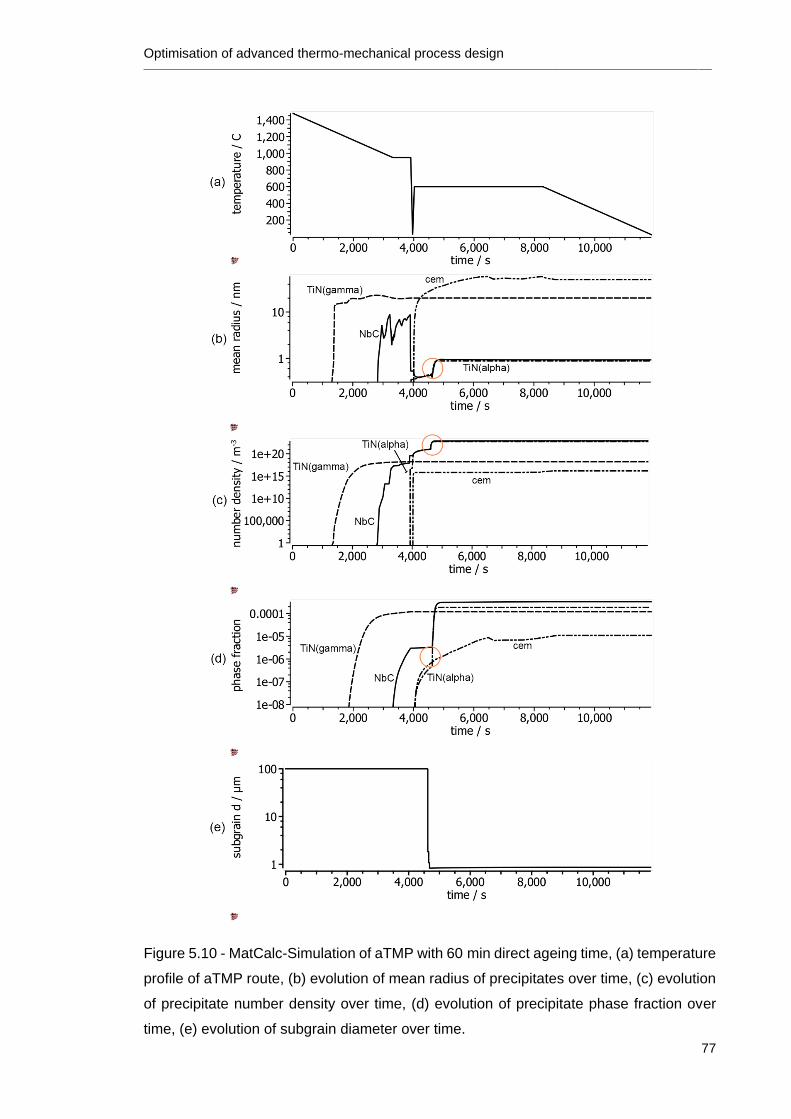
Optimisation of advanced thermo-mechanical process design ________________________________________________________________________________________________________________________________
77
Figure 5.10 - MatCalc-Simulation of aTMP with 60 min direct ageing time, (a) temperature
profile of aTMP route, (b) evolution of mean radius of precipitates over time, (c) evolution
of precipitate number density over time, (d) evolution of precipitate phase fraction over
time, (e) evolution of subgrain diameter over time.
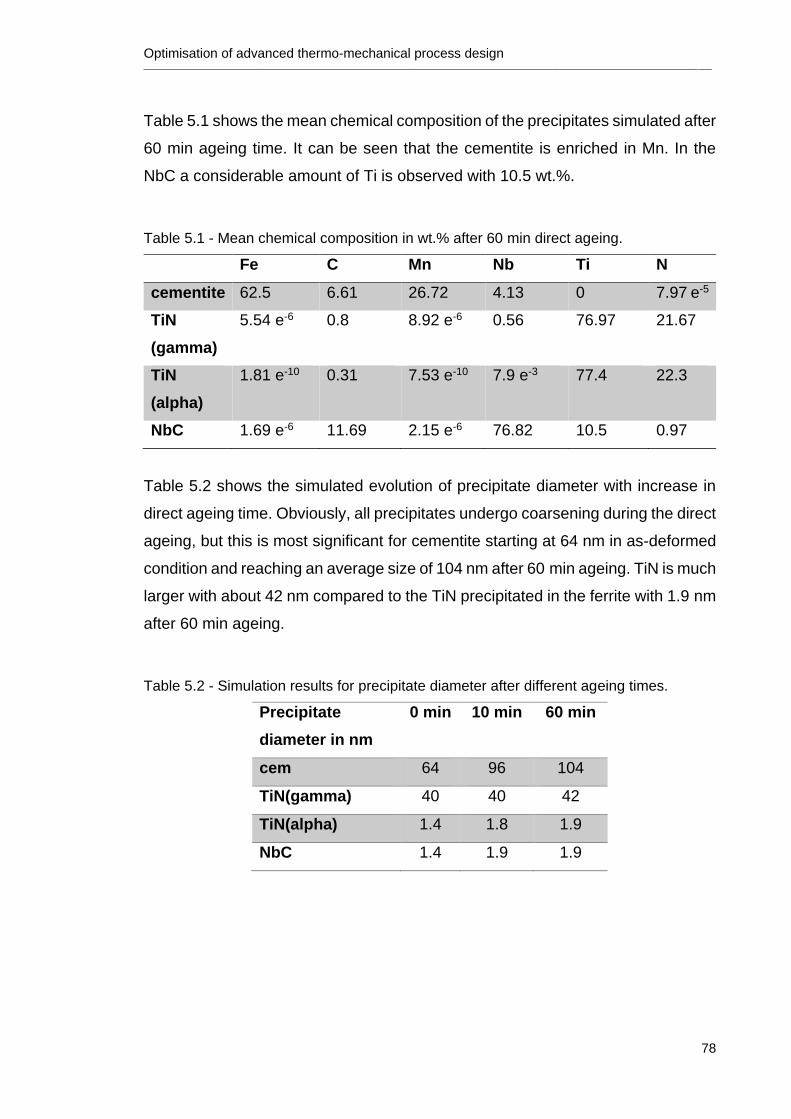
Optimisation of advanced thermo-mechanical process design ________________________________________________________________________________________________________________________________
78
Table 5.1 shows the mean chemical composition of the precipitates simulated after
60 min ageing time. It can be seen that the cementite is enriched in Mn. In the
NbC a considerable amount of Ti is observed with 10.5 wt.%.
Table 5.1 - Mean chemical composition in wt.% after 60 min direct ageing.
Fe C Mn Nb Ti N
cementite 62.5 6.61 26.72 4.13 0 7.97 e-5
TiN
(gamma)
5.54 e-6 0.8 8.92 e-6 0.56 76.97 21.67
TiN
(alpha)
1.81 e-10 0.31 7.53 e-10 7.9 e-3 77.4 22.3
NbC 1.69 e-6 11.69 2.15 e-6 76.82 10.5 0.97
Table 5.2 shows the simulated evolution of precipitate diameter with increase in
direct ageing time. Obviously, all precipitates undergo coarsening during the direct
ageing, but this is most significant for cementite starting at 64 nm in as-deformed
condition and reaching an average size of 104 nm after 60 min ageing. TiN is much
larger with about 42 nm compared to the TiN precipitated in the ferrite with 1.9 nm
after 60 min ageing.
Table 5.2 - Simulation results for precipitate diameter after different ageing times.
Precipitate
diameter in nm
0 min 10 min 60 min
cem 64 96 104
TiN(gamma) 40 40 42
TiN(alpha) 1.4 1.8 1.9
NbC 1.4 1.9 1.9
Optimisation of advanced thermo-mechanical process design ________________________________________________________________________________________________________________________________
79
5.3 Discussion
The overall goal which has been achieved in this chapter was to obtain a
homogeneous hierarchical microstructure in an HSLA steel via warm deformation
in the ferrite. The individual structural components will be discussed in the
following section and compared to MatCalc modelling results.
5.3.1 Grain size and texture
An advanced thermo-mechanical processing route was designed to obtain a
homogenous microstructure in the deformation zone of a Ti-Nb-Mo HSLA steel
during plane strain compression tests in a Gleeble thermo-mechanical simulator
(see Figure 5.1c-f). The successful processing route, see Figure 3.3, consists of
10 min soaking time prior to warm deformation at 600°C followed by three
deformation passes with a strain of 0.2 each, 30 s interpass time and a strain rate
of 1 s- 1. Compared to our previous study [90], several changes to the processing
route were made in order to achieve more homogenous deformation. To avoid the
formation of a macro shear band, as observed previously during single pass
deformation, the maximum strain applied per pass was kept at 0.2 and the strain
rate was reduced from 10 s-1 to 1 s-1. The rationale behind these changes is that
in our previous study shear band formation initiated at a true strain between 0.2
and 0.3. Furthermore, Xu et al.[85] reported shear band formation in a low carbon
steel starting at high strain rates and strains exceeding 0.3. In our study, the
interpass time was increased to 30 s, in order to enable limited recovery and/or
recrystallisation [91,92]. Furthermore, a longer soaking time of 10 min before
deformation was found to additionally decrease the tendency for shear band
formation, due to softening during tempering the martensitic/bainitic starting
microstructure. Tempering of martensite leads to increased toughness due to
precipitation of cementite particles and recovery/recrystallisation of the
martensite [66,93]. Although only an overall true strain of 0.6 was applied,
microstructures with grain sizes of around 0.55 μm were achieved and appear to
be stable upon ageing (see Figure 5.2a), which is similar to our previous study
with typical true strains of 0.8. Other authors achieved similar or larger grain sizes
between 0.3-1 µm in microalloyed steels for various other approaches of aTMP,
such as cold rolling and annealing as well as warm deformation in the austenite-
ferrite two phase region [6,8,52,54,55,69]. However, from the EBSD scan shown
Optimisation of advanced thermo-mechanical process design ________________________________________________________________________________________________________________________________
80
in Figure 5.1f, it can be seen that microstructure mainly consists of subgrains that
are confined mostly by LAGBs. Only a few fully recrystallised grains confined by
HAGBs arranged in necklace-like structures can be found near the original high
angle grain boundaries and regions with local C enrichment. A local change in
recrystallisation mechanism to discontinuous dynamic recrystallisation is assumed
to be present here, however, this is beyond the scope of the present study and will
be discussed in more detail in a future study. However, a possible reason for the
high fraction of LAGBS in the surrounding microstructure may be that the applied
total true strain of 0.6 is not sufficient for continuous dynamic recrystallisation to
reach its steady state with a 1 : 1 ratio of HAGBs : LAGBs [68]. The experimental
grain size is slightly smaller compared to the simulation results which predict a
subgrain diameter of ~0.8 μm (see Figure 5.10). This may be likely because the
simulation does not take into account the conversion from LAGBs to HAGBs
during continuous dynamic recrystallisation. Further, the resulting grain size
determined by EBSD is largely dependent on the detailed data evaluation
procedure.
Due to the limited sample volume probed by EBSD in our study, we suggest using
the resulting texture mainly to confirm the success of aTMP design rather than for
extended discussions of the detailed textural evolution in this particular steel. The
rationale behind this is that localised deformation is likely to result in a more
random texture than homogeneous deformation, which will result in a typical bcc
rolling texture. To explain typical bcc rolling textures, Rosenberg et al. [94]
calculated the Taylor factor and lattice rotations for bcc metals deformed by pencil
glide. They showed that <110>//ND is not stable during deformation and,
therefore, these grains will rotate towards <111>//ND or <100>//ND. <111>//ND
grains are known to have a high Taylor factor and require activation of many glide
systems to undergo further deformation. Therefore, they are considered as hard
and high stored energy regions. In contrast, <001>//ND grains have a low Taylor
factor and are considered as soft, low stored energy regions. This behaviour was
also observed in our experiments as can be seen in Figure 5.1f and Figure 5.3.
However, two of our samples do not show such a typical texture formation as
exemplarily shown in Figure 5.3c. Possible explanations are the nature of the
plane strain compression test in the Gleeble, with its limited deformation zone and
special tool geometry, resulting in a dog-bone shaped cross-section of the
Optimisation of advanced thermo-mechanical process design ________________________________________________________________________________________________________________________________
81
as-deformed materials, as modelled by Aksenov et al. [84]. Here, the material
volume close to the edges of the tool is prone to undergo localised deformation.
Further, this could be an effect of the limited scan area picked up by EBSD. Larger
area EBSD scans should be carried out on up-scaled samples processed by rolling
but this is beyond the scope of this study.
Overall, there are several studies on the competition of <001>//ND versus
<111>//ND grains at deformation temperatures in the ferrite region, and most of
these authors suggest a tendency towards formation of a strong <111>//ND
texture.
Anijdan et al. [95] studied the influence of a small true strain of 0.2 applied at 400°C
on three different microalloyed steels and reported that the texture that developed
was preferably <111>//ND texture. Han et al. [96] investigated the changes of
texture during annealing at 650°C of a Ti-containing interstitial-free steel after
warm rolling at a finish rolling temperature of 580°C with 90% reduction in
thickness. They found that a typical bcc rolling texture was achieved. <111>//ND
orientated grains preferably underwent recrystallisation. With increasing ageing
time, the amount of <001>//ND oriented grains were consumed by <111>//ND
recrystallised grains and, therefore, a more pronounced γ-fibre was formed.
Toroghinejad et al. [97] studied the influence of warm rolling between
temperatures of 440-850°C with a reduction of 65% in thickness for different
interstitial-free and low carbon steels. They reported a favourable <111>//ND
texture. Furthermore, NbC precipitates retarded recrystallisation, leading to
increased strain accumulation and, thus, to more shear bands as nucleation sites
for <111>//ND grains. This has been also reported by Barnett et al. [98] and
Humphreys et al. [99] who suggest that in-grain shear bands provide more
nucleation sites for developing γ-fibre texture and, therefore, increased deep-
drawability.
Overall, in our samples, we did not observe a strong trend to a more pronounced
<111>//ND texture. One reason could be that we did not observe in-grain shear
band formation although fine precipitates are present in the microstructure, but
they may not yet be fully precipitated when the materials undergo dynamic
restoration processes, as evidenced by the MatCalc simulation (Figure 5.10).
Optimisation of advanced thermo-mechanical process design ________________________________________________________________________________________________________________________________
82
5.3.2 Precipitates
Two types of precipitates were found: Larger (>50 nm) round particles which
preferably nucleate at grain boundaries and smaller (<50 nm) cuboidal
precipitates, which nucleate within the grains on dislocations and subgrain
boundaries.
5.3.2.1 Large (>50 nm) precipitates:
In the TEM bright and dark field images in Figure 5.4a-b and Figure 5.5a-b, the
precipitates at the grain boundaries are large and of round/elliptical shape. The
TEM EDS mapping in Figure 5.6a as well as the selected area diffraction in Figure
5.7 reveal that the larger, round precipitates are cementite. The EDS mapping
shows that these types of precipitates are rich in Fe, Mn and C whereas no other
elements were detected. This matches well with the simulation results concerning
the chemical composition of the precipitates (see Table 5.1) showing that
cementite incorporates a significant amount of Mn. Furthermore, the simulated
results show that the mean radius of cementite is significantly larger with 104 nm
compared to TiN and NbC with 2 nm after 60 min ageing (Figure 5.10b and Table
5.2) which was also observed in the experimental study. The computed result of
104 nm after 60 min ageing for cementite matches quite well with the second peak
in the experimentally measured precipitates size distribution in Figure 5.9 at
around ~120 nm. However, one needs to be aware that this peak is quite broad
with the largest measured precipitate being 630 nm. Furthermore, due to the rather
complex precipitation sequence, it is not possible to perfectly distinguish between
the two types of precipitates experimentally, as EDS analyses of each individual
particle would be required.
Interestingly, a large quantity of cementite in close proximity, as seen in Figure
5.4a-b, is observed in TEM. This might be because of C segregation making it
more easily available to form cementite in this region. Another explanation could
be that the martensitic/bainitic starting microstructure underwent tempering before
deformation [66,93] leading to these areas with high cementite density.
5.3.2.2 Small (<50 nm) precipitates:
The TEM EDS mapping in Figure 5.6 shows that the smaller cuboidal precipitates
are rich in Ti and Nb. The simulation also suggests that TiN and NbC precipitates
Optimisation of advanced thermo-mechanical process design ________________________________________________________________________________________________________________________________
83
form during this processing route. The computed mean radii of TiN and NbC are
significantly smaller than cementite (see Table 5.2 and Figure 5.10b), which
matches well with the experimental observations. It is well known that Ti forms TiN
at rather high temperatures (<1500°C), which is favourable for pinning of austenite
grain boundaries if deformation occurs in the austenite [16]. This is also evidenced
by thermo-kinetic modelling (see Figure 5.10). However, if the material undergoes
deformation in the ferrite region, the previously formed TiN particles will mainly act
as nucleation sites for NbC resulting in large, complex precipitates [100,101]. This
can be seen in Figure 5.5 and Figure 5.6, where NbC segregated around a square-
shaped TiN to form a star-shape. Similarly, Jia et al. [100] studied the precipitation
behaviour of two Ti-Nb microalloyed steels. They reported that NbC precipitates
epitaxially grew on the surface of a TiC due to the small lattice mismatch.
Kapoor et al. [101] investigated the chemical composition of two Nb-Ti
microalloyed steels using atom probe tomography. They reported that carbo-
nitride particles that are rich in Ti and N but lean in C precipitate at high
temperatures. With decreasing temperatures, shells of (Ti)(C,N) will form on the
already existing precipitates. These layers will become richer in C and leaner in N
with decreasing temperature, and eventually Nb starts to segregate on the outer
layers. They also suggest that this mechanism will deplete Nb from the
surrounding matrix, making it less favourable for low-temperature
precipitation [101]. The computed size of the TiN(gamma) is 40 nm in the
as-deformed condition and increases slightly to 42 nm after 60 min ageing. This
matches well with the first peak of the experimentally measured precipitate size
distribution seen in Figure 5.9. TiN and NbC are computed as separate
precipitates, therefore, the core-shell formation as seen in Figure 5.5c-d and
Figure 5.6 cannot be predicted. This explains why the precipitate size of NbC and
TiN(alpha) (see Table 5.2) is underestimated by the simulation. Another reason
might be the presence of small clusters which are beyond the detection limit of the
TEM used here. Such features could be detected by three-dimensional atom
probe microscopy, but this is beyond the scope of the current study.
Thus, for future alloy development of HSLA steels with martensitic/bainitic starting
microstructure for aTMP in the ferrite region, it is suggested to replace Ti by other
micro-alloying elements. As deformation does not occur in the austenite, the main
purpose of TiN, which is stabilizing the austenite to prevent grain growth, is not
Optimisation of advanced thermo-mechanical process design ________________________________________________________________________________________________________________________________
84
required in this case. In the ferrite, TiN will mainly undergo coarsening and remove
Nb from the matrix, hence, making Nb unavailable for further precipitation of
smaller particles.
To conclude, we demonstrated a novel processing route that leads to a
homogenous hierarchical microstructure without the formation of macroscopic
shear bands. Furthermore, successful through-process thermo-kinetic modelling
was performed using the software MatCalc which will be able to guide future alloy
design work. Furthermore, a deeper understanding of the detailed precipitation
sequence has been established. A demerit was the composition of the alloy used
here as TiN present in the current steel favoured the formation of Nb-rich shells
around these pre-existing particles. Therefore, future research in this area where
deformation occurs mostly in the ferrite will focus on alloy design of modern HSLA
steels without Ti. In a next step, this aTMP will be up-scaled to a rolling mill to
enable a thorough study of the mechanical properties.
5.4 Summary and Outlook
In the present chapter, an optimised aTMP route was developed that results in a
homogenous hierarchical microstructure in a modern Ti-Mo-Nb HSLA steel. The
investigation is based on a thorough experimental and modelling approach
delivering:
A soaking time of 10 min at 600°C prior to warm deformation, as well as a
three-pass deformation pass with a strain of 0.2 per pass with a strain rate
of 1 s-1 allows to achieve a homogenous deformation during plane strain
compression testing.
Continuous dynamic recrystallisation is the main dynamic restoration
mechanism active which lead to grain refinement with (sub)grain sizes
around 0.55 µm according to electron microscopy and 0.8 µm according to
modelling with MatCalc.
Two types of precipitates are observed: Larger (>50 nm) round FeMnC-rich
precipitates, which preferably nucleate at high angle grain boundaries, and
smaller (<50 nm) cuboidal TiNb-rich precipitates also nucleating at
dislocations and subgrain boundaries. It is shown that the TiNb particles
undergo a shape and composition change forming a core-shell structure
Optimisation of advanced thermo-mechanical process design ________________________________________________________________________________________________________________________________
85
when subjected to direct ageing after deformation. This is attributed to
diffusion of C, Si, N, and Nb and relatively higher stability of NbC at lower
temperatures.
Thermo-kinetic modelling using MatCalc is shown to enable a detailed
through-process study of the microstructural evolution during aTMP route.
Results match well with the experimental data.
In the following chapter, the aTMP processing route developed in this chapter
using the Gleeble thermo-mechanical processing simulator is translated to a
larger-scale rolling mill. This enables the study of the industrial feasibility and
thorough testing of mechanical properties (tensile and Charpy impact testing) on
large samples.
Initial report on structure-property relationships of HSLA steels subjected to aTMP ________________________________________________________________________________________________________________________________
86
6 Initial report on structure-property relationships of
HSLA steels subjected to aTMP
The work in this chapter has been published:
C. Ledermueller, H. Zhu, H. Li, S. Primig, An Initial Report on the Structure–
Property Relationships of a High-Strength Low-Alloy Steel Subjected to Advanced
Thermomechanical Processing in Ferrite, Steel Res. Int. 1900596 (2020)
C. Ledermueller did the majority of the planning and execution of the
experimental work as well as the data analysis. The manuscript was drafted by
her.
6.1 Introduction
In the previous chapter, it was shown that through an optimised aTMP design a
homogenous deformation microstructure of a HSLA steel can be achieved during
plane strain compression testing. Continuous dynamic recrystallisation is the
primary mechanism responsible for the grain refinement to (sub)grain sizes of
around 0.55 µm. Two types of precipitates were found: larger (>50 nm) round
FeMnC-rich and smaller (<50 nm) cuboidal TiNb-rich precipitates, which also
correlates with the results in Chapter 4. Additionally, it was found that the TiNb
particles undergo a change in shape and morphology exhibiting a core-shell
structure when subjected to direct ageing at 600°C. Furthermore, it was shown
that the microstructural evolution can be modelled in detail using the thermo-
kinetic modelling software MatCalc, in good agreement with the experimental data.
The aim of the current chapter is to up-scale this processing route to carry out
thorough mechanical testing in order to verify the success of the process design
regarding strength, ductility and target microstructures. Using the Gleeble in plane
strain compression mode has its limitations in simulating the strain distribution
obtained under real rolling conditions. Therefore, it is necessary to compare the
microstructures and textures achieved during plane strain compression
(Chapter 5) and rolling.
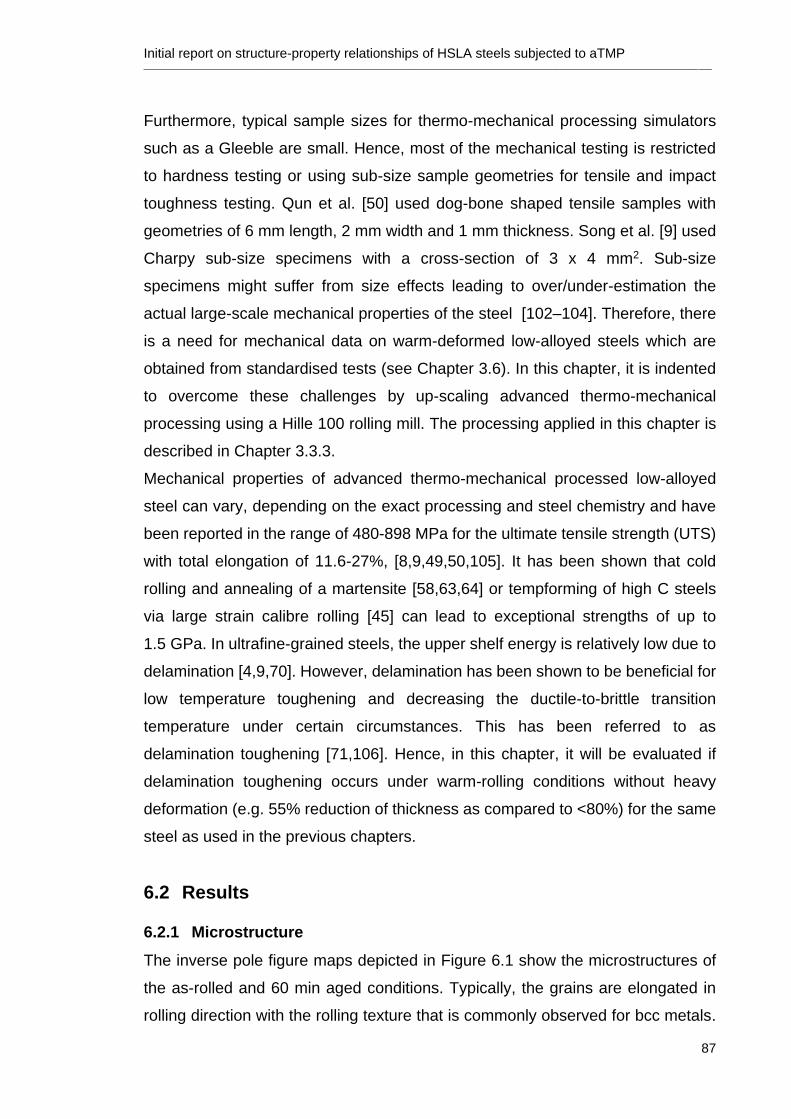
Initial report on structure-property relationships of HSLA steels subjected to aTMP ________________________________________________________________________________________________________________________________
87
Furthermore, typical sample sizes for thermo-mechanical processing simulators
such as a Gleeble are small. Hence, most of the mechanical testing is restricted
to hardness testing or using sub-size sample geometries for tensile and impact
toughness testing. Qun et al. [50] used dog-bone shaped tensile samples with
geometries of 6 mm length, 2 mm width and 1 mm thickness. Song et al. [9] used
Charpy sub-size specimens with a cross-section of 3 x 4 mm2. Sub-size
specimens might suffer from size effects leading to over/under-estimation the
actual large-scale mechanical properties of the steel [102–104]. Therefore, there
is a need for mechanical data on warm-deformed low-alloyed steels which are
obtained from standardised tests (see Chapter 3.6). In this chapter, it is indented
to overcome these challenges by up-scaling advanced thermo-mechanical
processing using a Hille 100 rolling mill. The processing applied in this chapter is
described in Chapter 3.3.3.
Mechanical properties of advanced thermo-mechanical processed low-alloyed
steel can vary, depending on the exact processing and steel chemistry and have
been reported in the range of 480-898 MPa for the ultimate tensile strength (UTS)
with total elongation of 11.6-27%, [8,9,49,50,105]. It has been shown that cold
rolling and annealing of a martensite [58,63,64] or tempforming of high C steels
via large strain calibre rolling [45] can lead to exceptional strengths of up to
1.5 GPa. In ultrafine-grained steels, the upper shelf energy is relatively low due to
delamination [4,9,70]. However, delamination has been shown to be beneficial for
low temperature toughening and decreasing the ductile-to-brittle transition
temperature under certain circumstances. This has been referred to as
delamination toughening [71,106]. Hence, in this chapter, it will be evaluated if
delamination toughening occurs under warm-rolling conditions without heavy
deformation (e.g. 55% reduction of thickness as compared to <80%) for the same
steel as used in the previous chapters.
6.2 Results
6.2.1 Microstructure
The inverse pole figure maps depicted in Figure 6.1 show the microstructures of
the as-rolled and 60 min aged conditions. Typically, the grains are elongated in
rolling direction with the rolling texture that is commonly observed for bcc metals.
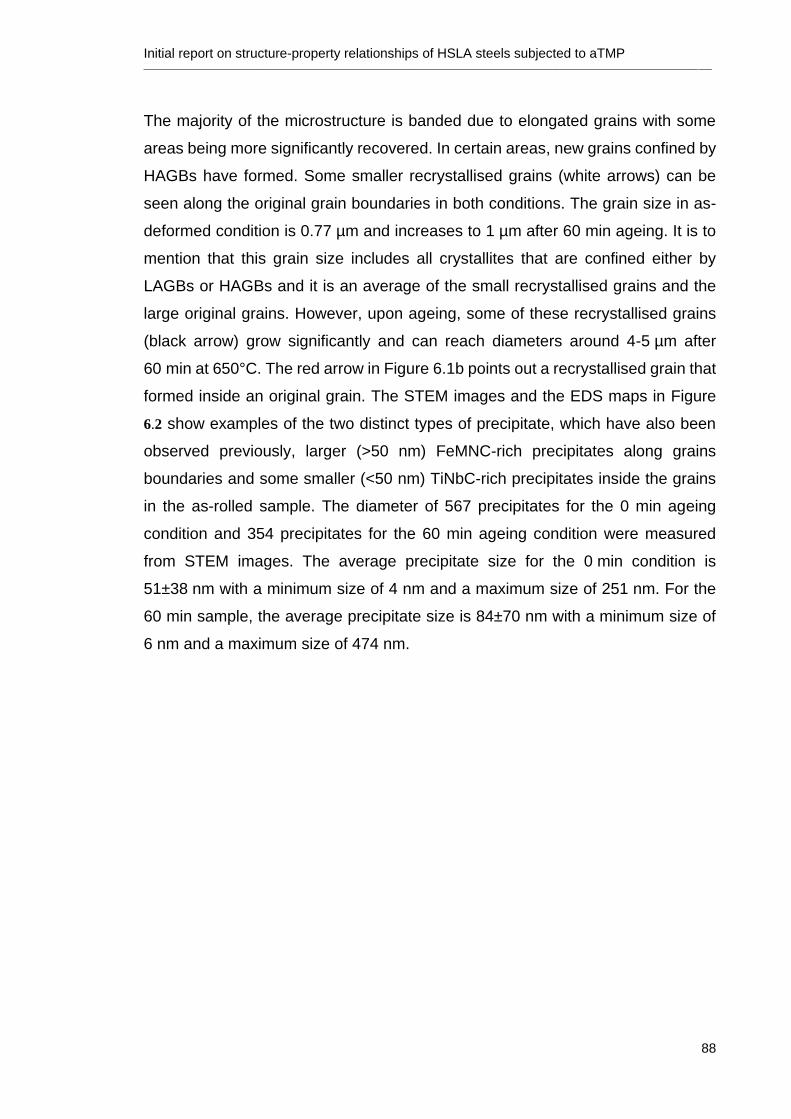
Initial report on structure-property relationships of HSLA steels subjected to aTMP ________________________________________________________________________________________________________________________________
88
The majority of the microstructure is banded due to elongated grains with some
areas being more significantly recovered. In certain areas, new grains confined by
HAGBs have formed. Some smaller recrystallised grains (white arrows) can be
seen along the original grain boundaries in both conditions. The grain size in as-
deformed condition is 0.77 µm and increases to 1 µm after 60 min ageing. It is to
mention that this grain size includes all crystallites that are confined either by
LAGBs or HAGBs and it is an average of the small recrystallised grains and the
large original grains. However, upon ageing, some of these recrystallised grains
(black arrow) grow significantly and can reach diameters around 4-5 µm after
60 min at 650°C. The red arrow in Figure 6.1b points out a recrystallised grain that
formed inside an original grain. The STEM images and the EDS maps in Figure
6.2 show examples of the two distinct types of precipitate, which have also been
observed previously, larger (>50 nm) FeMNC-rich precipitates along grains
boundaries and some smaller (<50 nm) TiNbC-rich precipitates inside the grains
in the as-rolled sample. The diameter of 567 precipitates for the 0 min ageing
condition and 354 precipitates for the 60 min ageing condition were measured
from STEM images. The average precipitate size for the 0 min condition is
51±38 nm with a minimum size of 4 nm and a maximum size of 251 nm. For the
60 min sample, the average precipitate size is 84±70 nm with a minimum size of
6 nm and a maximum size of 474 nm.
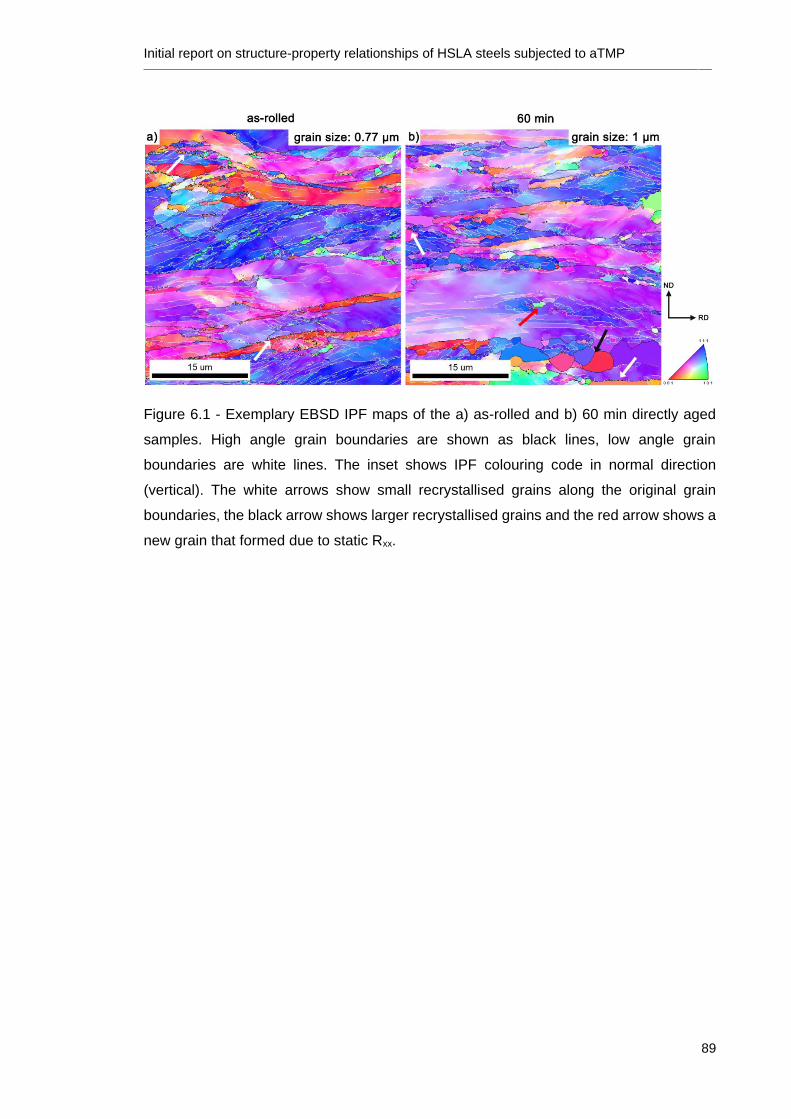
Initial report on structure-property relationships of HSLA steels subjected to aTMP ________________________________________________________________________________________________________________________________
89
Figure 6.1 - Exemplary EBSD IPF maps of the a) as-rolled and b) 60 min directly aged
samples. High angle grain boundaries are shown as black lines, low angle grain
boundaries are white lines. The inset shows IPF colouring code in normal direction
(vertical). The white arrows show small recrystallised grains along the original grain
boundaries, the black arrow shows larger recrystallised grains and the red arrow shows a
new grain that formed due to static Rxx.
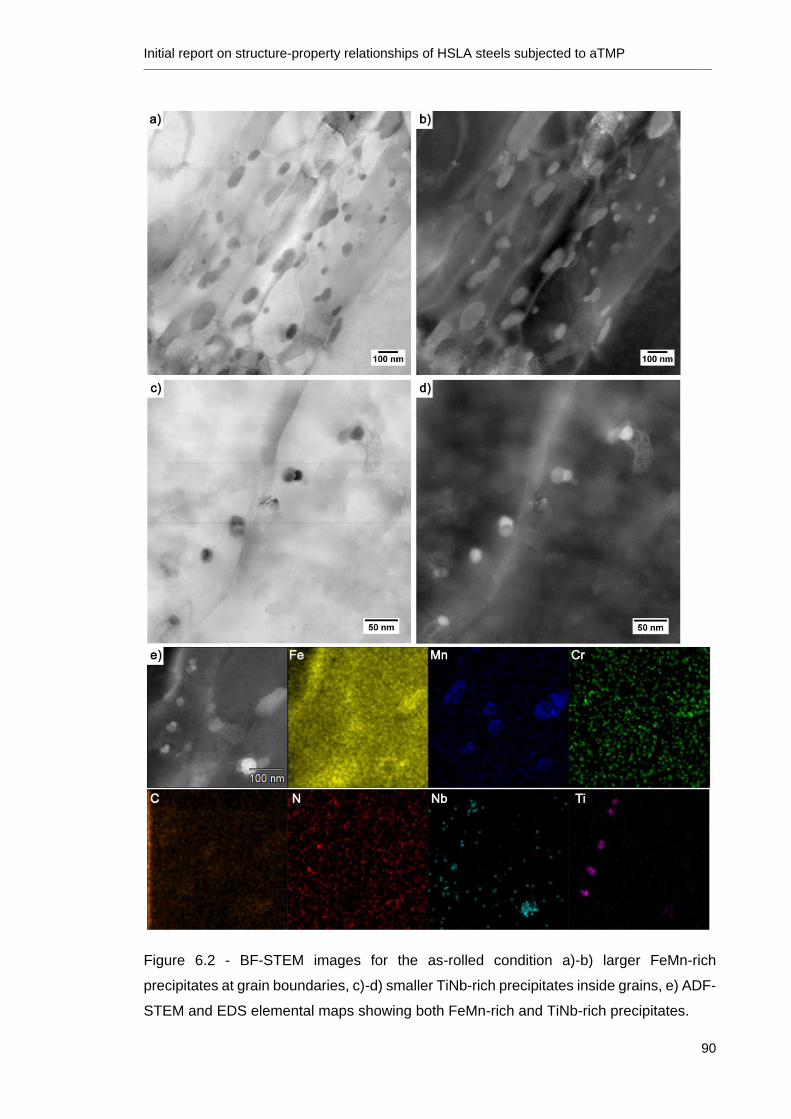
Initial report on structure-property relationships of HSLA steels subjected to aTMP ________________________________________________________________________________________________________________________________
90
Figure 6.2 - BF-STEM images for the as-rolled condition a)-b) larger FeMn-rich
precipitates at grain boundaries, c)-d) smaller TiNb-rich precipitates inside grains, e) ADF-
STEM and EDS elemental maps showing both FeMn-rich and TiNb-rich precipitates.
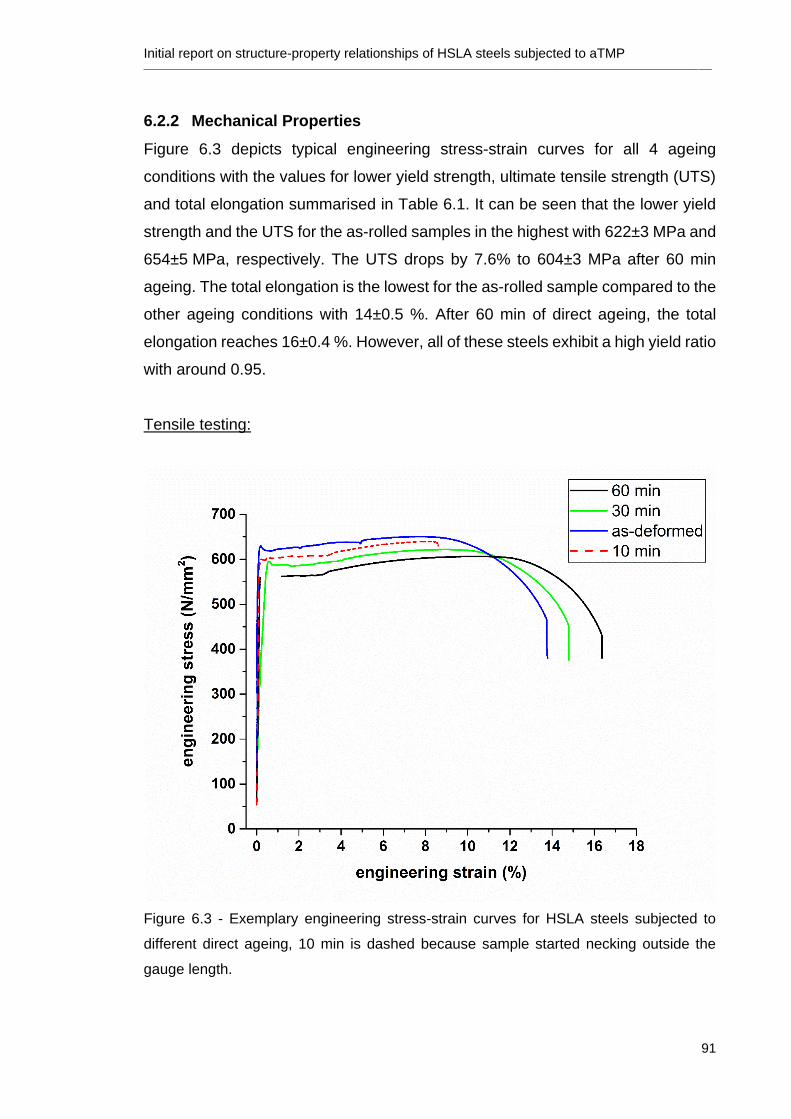
Initial report on structure-property relationships of HSLA steels subjected to aTMP ________________________________________________________________________________________________________________________________
91
6.2.2 Mechanical Properties
Figure 6.3 depicts typical engineering stress-strain curves for all 4 ageing
conditions with the values for lower yield strength, ultimate tensile strength (UTS)
and total elongation summarised in Table 6.1. It can be seen that the lower yield
strength and the UTS for the as-rolled samples in the highest with 622±3 MPa and
654±5 MPa, respectively. The UTS drops by 7.6% to 604±3 MPa after 60 min
ageing. The total elongation is the lowest for the as-rolled sample compared to the
other ageing conditions with 14±0.5 %. After 60 min of direct ageing, the total
elongation reaches 16±0.4 %. However, all of these steels exhibit a high yield ratio
with around 0.95.
Tensile testing:
Figure 6.3 - Exemplary engineering stress-strain curves for HSLA steels subjected to
different direct ageing, 10 min is dashed because sample started necking outside the
gauge length.
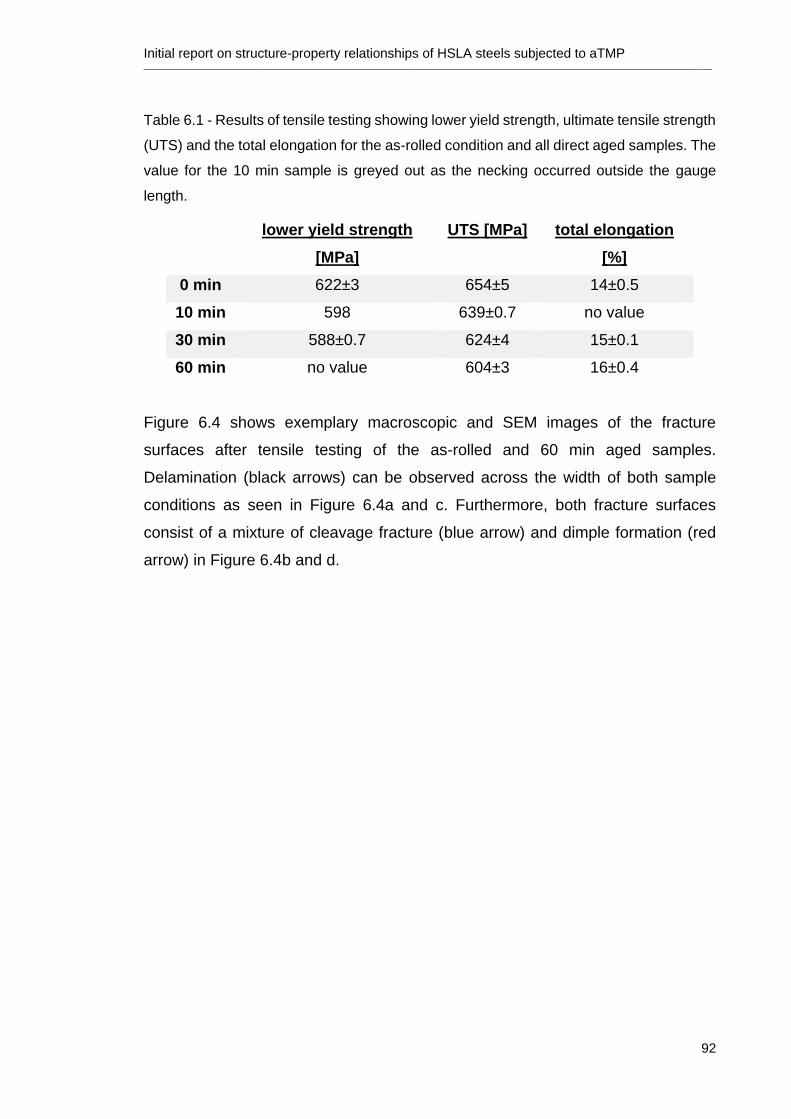
Initial report on structure-property relationships of HSLA steels subjected to aTMP ________________________________________________________________________________________________________________________________
92
Table 6.1 - Results of tensile testing showing lower yield strength, ultimate tensile strength
(UTS) and the total elongation for the as-rolled condition and all direct aged samples. The
value for the 10 min sample is greyed out as the necking occurred outside the gauge
length.
lower yield strength
[MPa]
UTS [MPa] total elongation
[%]
0 min 622±3 654±5 14±0.5
10 min 598 639±0.7 no value
30 min 588±0.7 624±4 15±0.1
60 min no value 604±3 16±0.4
Figure 6.4 shows exemplary macroscopic and SEM images of the fracture
surfaces after tensile testing of the as-rolled and 60 min aged samples.
Delamination (black arrows) can be observed across the width of both sample
conditions as seen in Figure 6.4a and c. Furthermore, both fracture surfaces
consist of a mixture of cleavage fracture (blue arrow) and dimple formation (red
arrow) in Figure 6.4b and d.
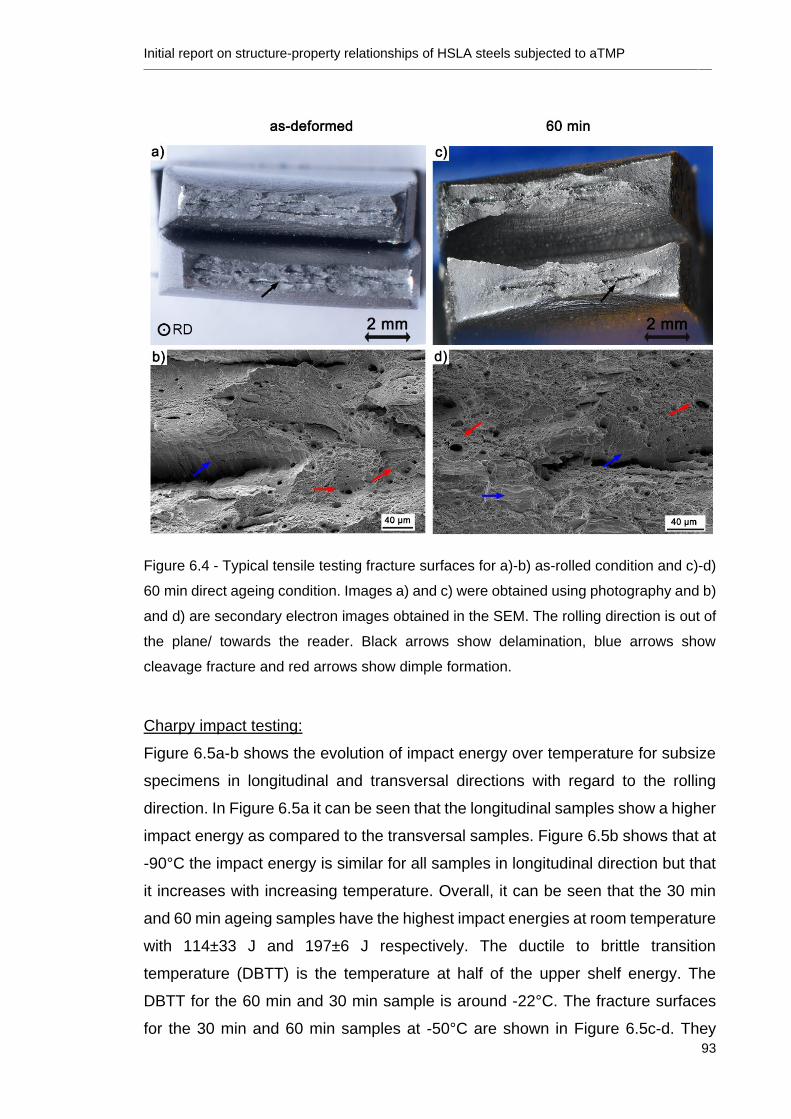
Initial report on structure-property relationships of HSLA steels subjected to aTMP ________________________________________________________________________________________________________________________________
93
Figure 6.4 - Typical tensile testing fracture surfaces for a)-b) as-rolled condition and c)-d)
60 min direct ageing condition. Images a) and c) were obtained using photography and b)
and d) are secondary electron images obtained in the SEM. The rolling direction is out of
the plane/ towards the reader. Black arrows show delamination, blue arrows show
cleavage fracture and red arrows show dimple formation.
Charpy impact testing:
Figure 6.5a-b shows the evolution of impact energy over temperature for subsize
specimens in longitudinal and transversal directions with regard to the rolling
direction. In Figure 6.5a it can be seen that the longitudinal samples show a higher
impact energy as compared to the transversal samples. Figure 6.5b shows that at
-90°C the impact energy is similar for all samples in longitudinal direction but that
it increases with increasing temperature. Overall, it can be seen that the 30 min
and 60 min ageing samples have the highest impact energies at room temperature
with 114±33 J and 197±6 J respectively. The ductile to brittle transition
temperature (DBTT) is the temperature at half of the upper shelf energy. The
DBTT for the 60 min and 30 min sample is around -22°C. The fracture surfaces
for the 30 min and 60 min samples at -50°C are shown in Figure 6.5c-d. They
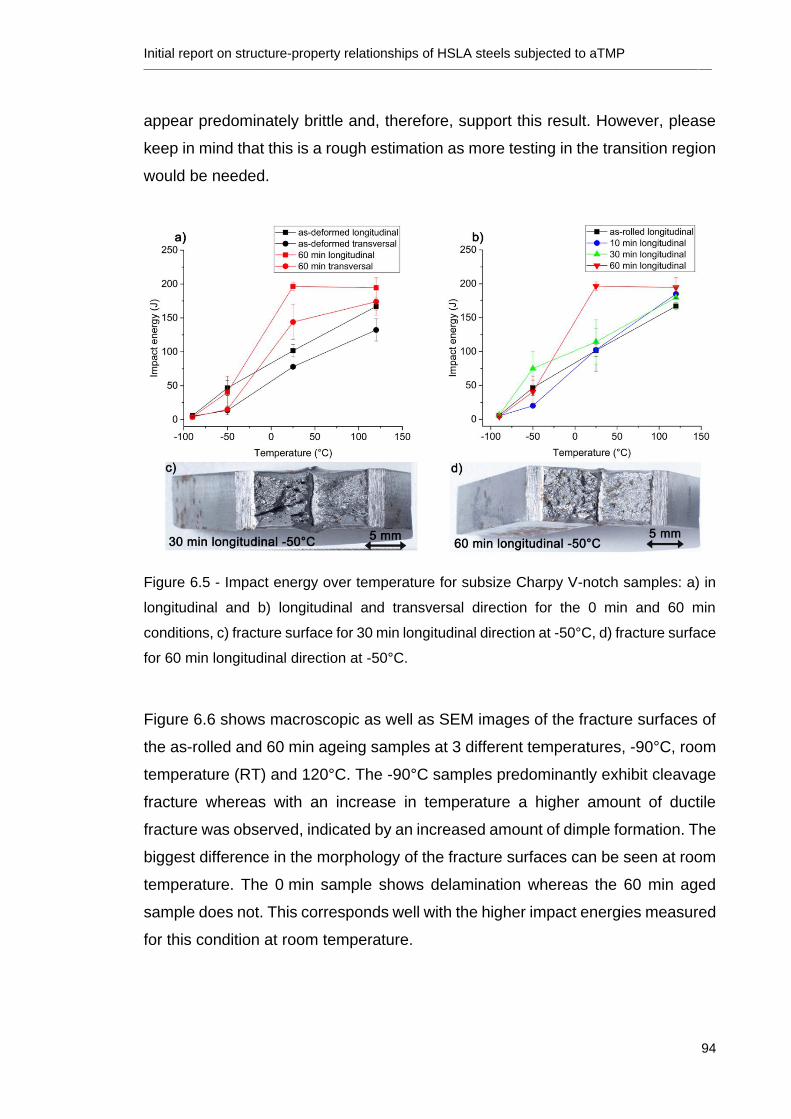
Initial report on structure-property relationships of HSLA steels subjected to aTMP ________________________________________________________________________________________________________________________________
94
appear predominately brittle and, therefore, support this result. However, please
keep in mind that this is a rough estimation as more testing in the transition region
would be needed.
Figure 6.5 - Impact energy over temperature for subsize Charpy V-notch samples: a) in
longitudinal and b) longitudinal and transversal direction for the 0 min and 60 min
conditions, c) fracture surface for 30 min longitudinal direction at -50°C, d) fracture surface
for 60 min longitudinal direction at -50°C.
Figure 6.6 shows macroscopic as well as SEM images of the fracture surfaces of
the as-rolled and 60 min ageing samples at 3 different temperatures, -90°C, room
temperature (RT) and 120°C. The -90°C samples predominantly exhibit cleavage
fracture whereas with an increase in temperature a higher amount of ductile
fracture was observed, indicated by an increased amount of dimple formation. The
biggest difference in the morphology of the fracture surfaces can be seen at room
temperature. The 0 min sample shows delamination whereas the 60 min aged
sample does not. This corresponds well with the higher impact energies measured
for this condition at room temperature.
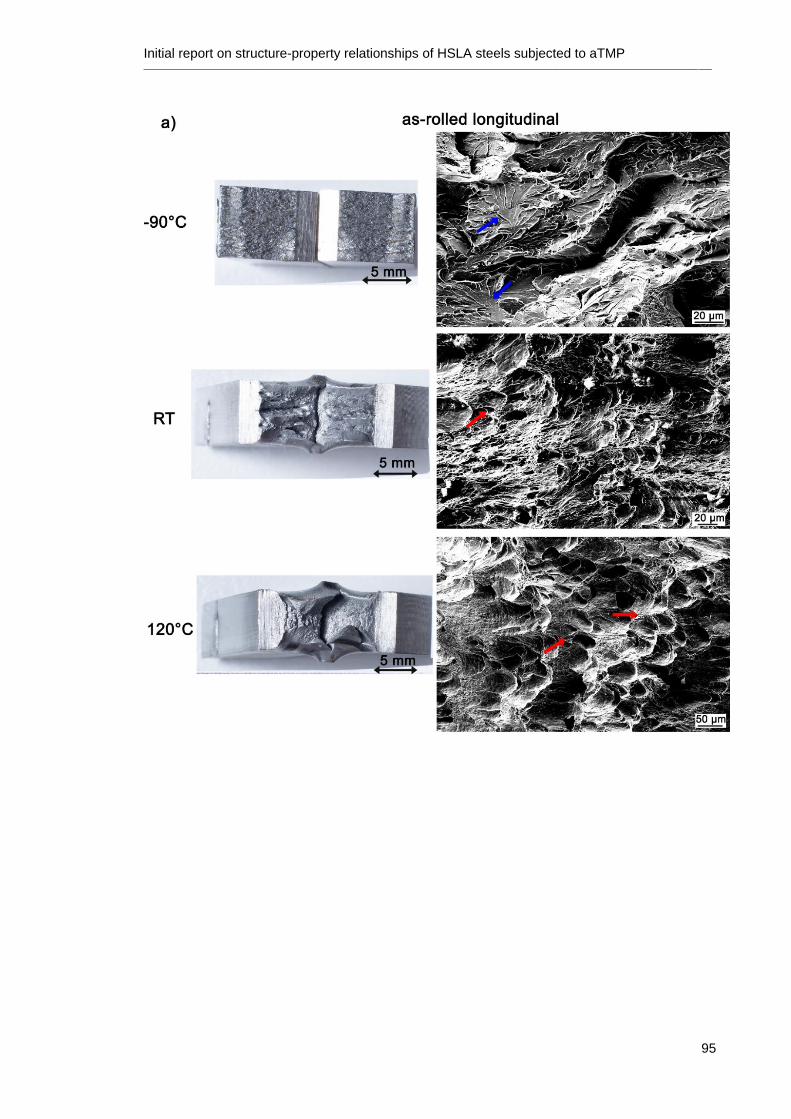
Initial report on structure-property relationships of HSLA steels subjected to aTMP ________________________________________________________________________________________________________________________________
95
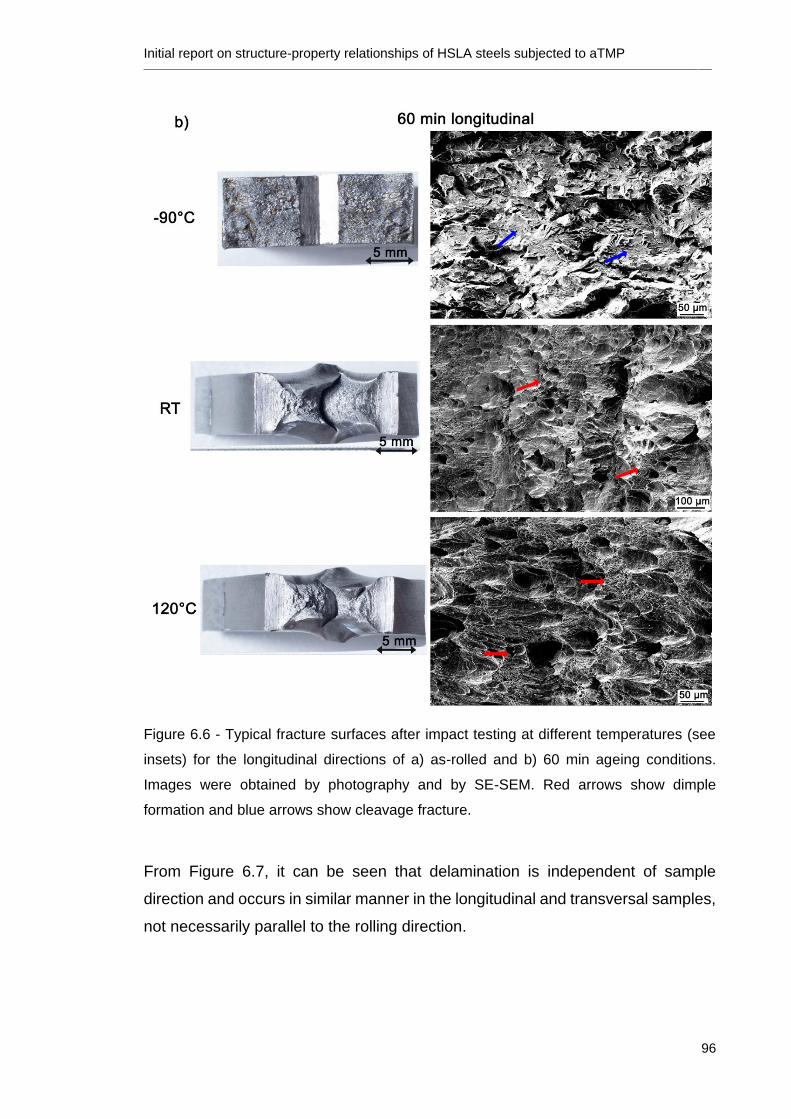
Initial report on structure-property relationships of HSLA steels subjected to aTMP ________________________________________________________________________________________________________________________________
96
Figure 6.6 - Typical fracture surfaces after impact testing at different temperatures (see
insets) for the longitudinal directions of a) as-rolled and b) 60 min ageing conditions.
Images were obtained by photography and by SE-SEM. Red arrows show dimple
formation and blue arrows show cleavage fracture.
From Figure 6.7, it can be seen that delamination is independent of sample
direction and occurs in similar manner in the longitudinal and transversal samples,
not necessarily parallel to the rolling direction.
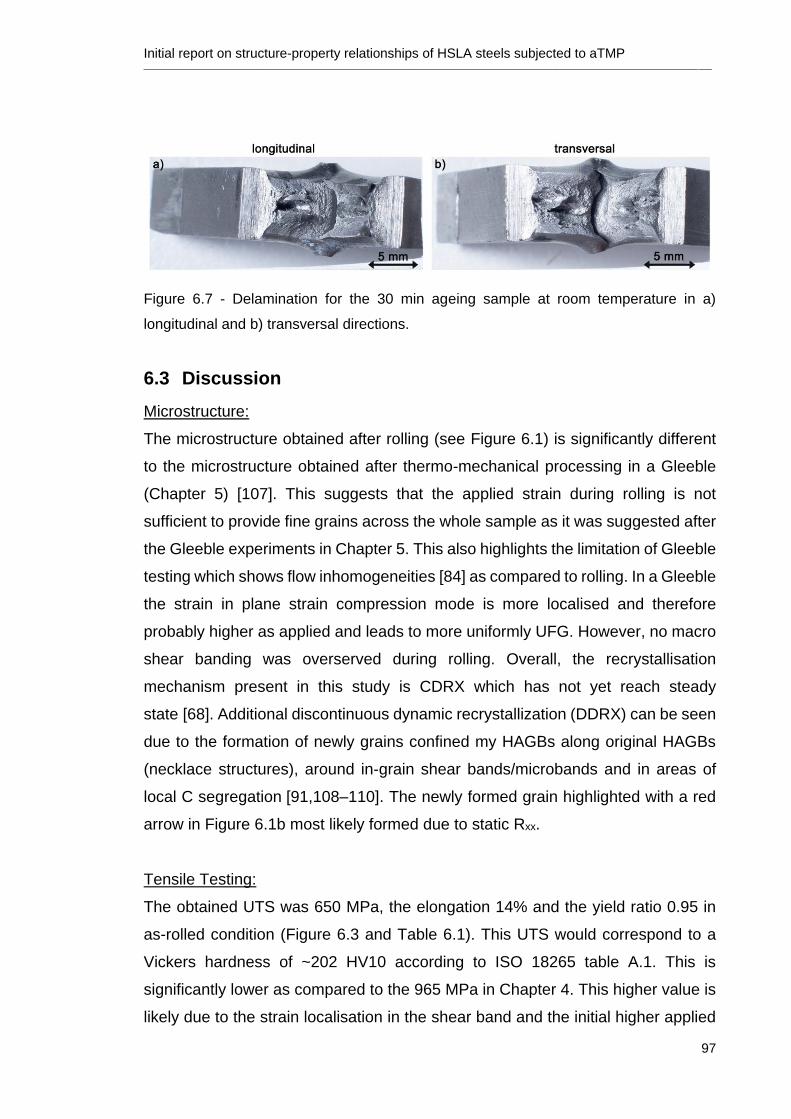
Initial report on structure-property relationships of HSLA steels subjected to aTMP ________________________________________________________________________________________________________________________________
97
Figure 6.7 - Delamination for the 30 min ageing sample at room temperature in a)
longitudinal and b) transversal directions.
6.3 Discussion
Microstructure:
The microstructure obtained after rolling (see Figure 6.1) is significantly different
to the microstructure obtained after thermo-mechanical processing in a Gleeble
(Chapter 5) [107]. This suggests that the applied strain during rolling is not
sufficient to provide fine grains across the whole sample as it was suggested after
the Gleeble experiments in Chapter 5. This also highlights the limitation of Gleeble
testing which shows flow inhomogeneities [84] as compared to rolling. In a Gleeble
the strain in plane strain compression mode is more localised and therefore
probably higher as applied and leads to more uniformly UFG. However, no macro
shear banding was overserved during rolling. Overall, the recrystallisation
mechanism present in this study is CDRX which has not yet reach steady
state [68]. Additional discontinuous dynamic recrystallization (DDRX) can be seen
due to the formation of newly grains confined my HAGBs along original HAGBs
(necklace structures), around in-grain shear bands/microbands and in areas of
local C segregation [91,108–110]. The newly formed grain highlighted with a red
arrow in Figure 6.1b most likely formed due to static Rxx.
Tensile Testing:
The obtained UTS was 650 MPa, the elongation 14% and the yield ratio 0.95 in
as-rolled condition (Figure 6.3 and Table 6.1). This UTS would correspond to a
Vickers hardness of ~202 HV10 according to ISO 18265 table A.1. This is
significantly lower as compared to the 965 MPa in Chapter 4. This higher value is
likely due to the strain localisation in the shear band and the initial higher applied
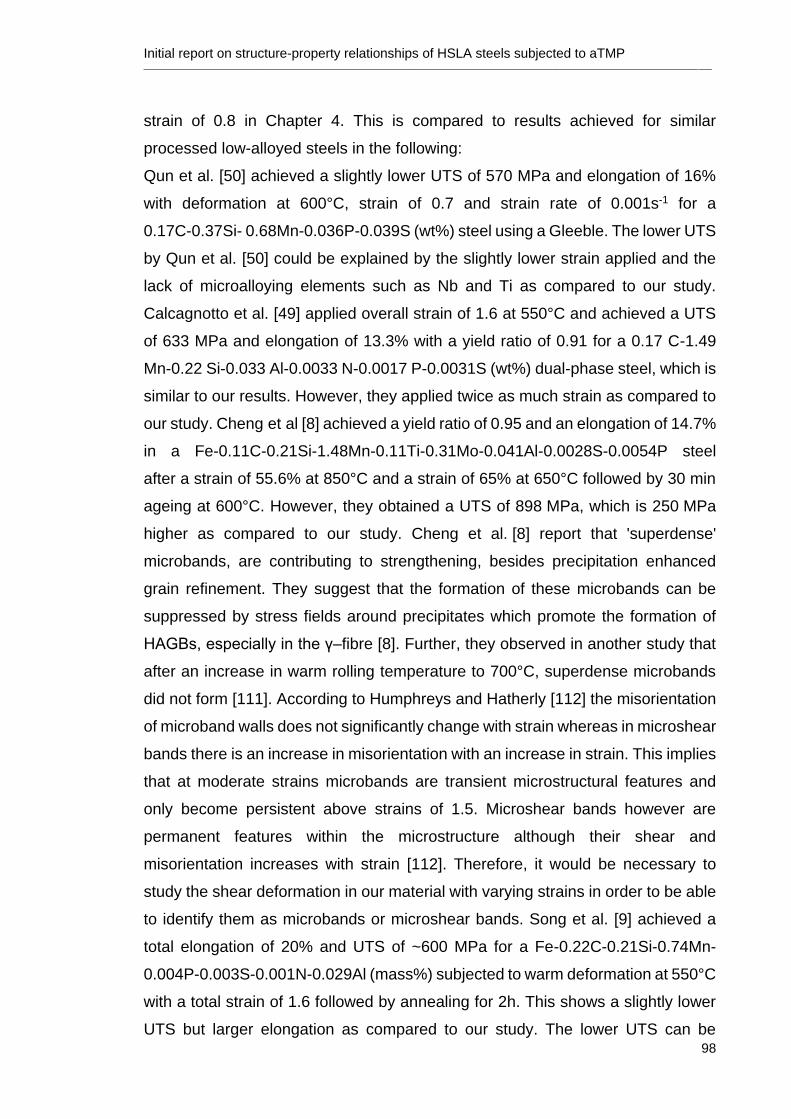
Initial report on structure-property relationships of HSLA steels subjected to aTMP ________________________________________________________________________________________________________________________________
98
strain of 0.8 in Chapter 4. This is compared to results achieved for similar
processed low-alloyed steels in the following:
Qun et al. [50] achieved a slightly lower UTS of 570 MPa and elongation of 16%
with deformation at 600°C, strain of 0.7 and strain rate of 0.001s-1 for a
0.17C-0.37Si- 0.68Mn-0.036P-0.039S (wt%) steel using a Gleeble. The lower UTS
by Qun et al. [50] could be explained by the slightly lower strain applied and the
lack of microalloying elements such as Nb and Ti as compared to our study.
Calcagnotto et al. [49] applied overall strain of 1.6 at 550°C and achieved a UTS
of 633 MPa and elongation of 13.3% with a yield ratio of 0.91 for a 0.17 C-1.49
Mn-0.22 Si-0.033 Al-0.0033 N-0.0017 P-0.0031S (wt%) dual-phase steel, which is
similar to our results. However, they applied twice as much strain as compared to
our study. Cheng et al [8] achieved a yield ratio of 0.95 and an elongation of 14.7%
in a Fe-0.11C-0.21Si-1.48Mn-0.11Ti-0.31Mo-0.041Al-0.0028S-0.0054P steel
after a strain of 55.6% at 850°C and a strain of 65% at 650°C followed by 30 min
ageing at 600°C. However, they obtained a UTS of 898 MPa, which is 250 MPa
higher as compared to our study. Cheng et al. [8] report that 'superdense'
microbands, are contributing to strengthening, besides precipitation enhanced
grain refinement. They suggest that the formation of these microbands can be
suppressed by stress fields around precipitates which promote the formation of
HAGBs, especially in the γ–fibre [8]. Further, they observed in another study that
after an increase in warm rolling temperature to 700°C, superdense microbands
did not form [111]. According to Humphreys and Hatherly [112] the misorientation
of microband walls does not significantly change with strain whereas in microshear
bands there is an increase in misorientation with an increase in strain. This implies
that at moderate strains microbands are transient microstructural features and
only become persistent above strains of 1.5. Microshear bands however are
permanent features within the microstructure although their shear and
misorientation increases with strain [112]. Therefore, it would be necessary to
study the shear deformation in our material with varying strains in order to be able
to identify them as microbands or microshear bands. Song et al. [9] achieved a
total elongation of 20% and UTS of ~600 MPa for a Fe-0.22C-0.21Si-0.74Mn-
0.004P-0.003S-0.001N-0.029Al (mass%) subjected to warm deformation at 550°C
with a total strain of 1.6 followed by annealing for 2h. This shows a slightly lower
UTS but larger elongation as compared to our study. The lower UTS can be
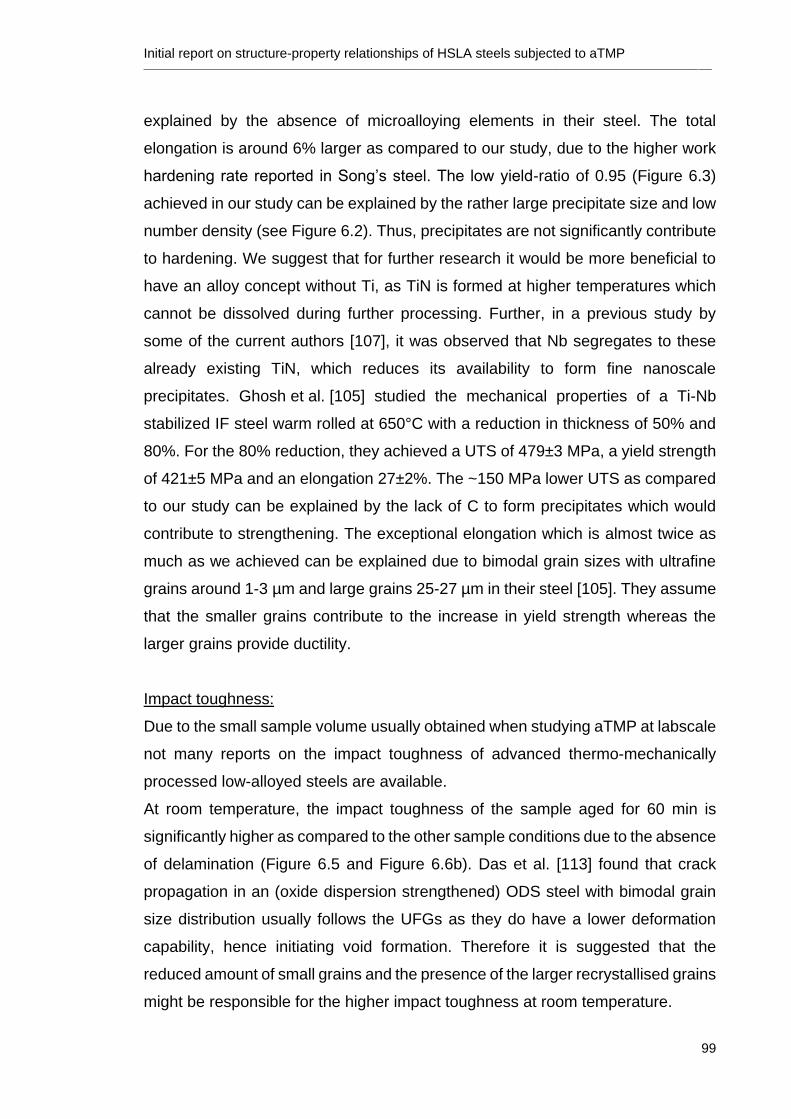
Initial report on structure-property relationships of HSLA steels subjected to aTMP ________________________________________________________________________________________________________________________________
99
explained by the absence of microalloying elements in their steel. The total
elongation is around 6% larger as compared to our study, due to the higher work
hardening rate reported in Song’s steel. The low yield-ratio of 0.95 (Figure 6.3)
achieved in our study can be explained by the rather large precipitate size and low
number density (see Figure 6.2). Thus, precipitates are not significantly contribute
to hardening. We suggest that for further research it would be more beneficial to
have an alloy concept without Ti, as TiN is formed at higher temperatures which
cannot be dissolved during further processing. Further, in a previous study by
some of the current authors [107], it was observed that Nb segregates to these
already existing TiN, which reduces its availability to form fine nanoscale
precipitates. Ghosh et al. [105] studied the mechanical properties of a Ti-Nb
stabilized IF steel warm rolled at 650°C with a reduction in thickness of 50% and
80%. For the 80% reduction, they achieved a UTS of 479±3 MPa, a yield strength
of 421±5 MPa and an elongation 27±2%. The ~150 MPa lower UTS as compared
to our study can be explained by the lack of C to form precipitates which would
contribute to strengthening. The exceptional elongation which is almost twice as
much as we achieved can be explained due to bimodal grain sizes with ultrafine
grains around 1-3 µm and large grains 25-27 µm in their steel [105]. They assume
that the smaller grains contribute to the increase in yield strength whereas the
larger grains provide ductility.
Impact toughness:
Due to the small sample volume usually obtained when studying aTMP at labscale
not many reports on the impact toughness of advanced thermo-mechanically
processed low-alloyed steels are available.
At room temperature, the impact toughness of the sample aged for 60 min is
significantly higher as compared to the other sample conditions due to the absence
of delamination (Figure 6.5 and Figure 6.6b). Das et al. [113] found that crack
propagation in an (oxide dispersion strengthened) ODS steel with bimodal grain
size distribution usually follows the UFGs as they do have a lower deformation
capability, hence initiating void formation. Therefore it is suggested that the
reduced amount of small grains and the presence of the larger recrystallised grains
might be responsible for the higher impact toughness at room temperature.
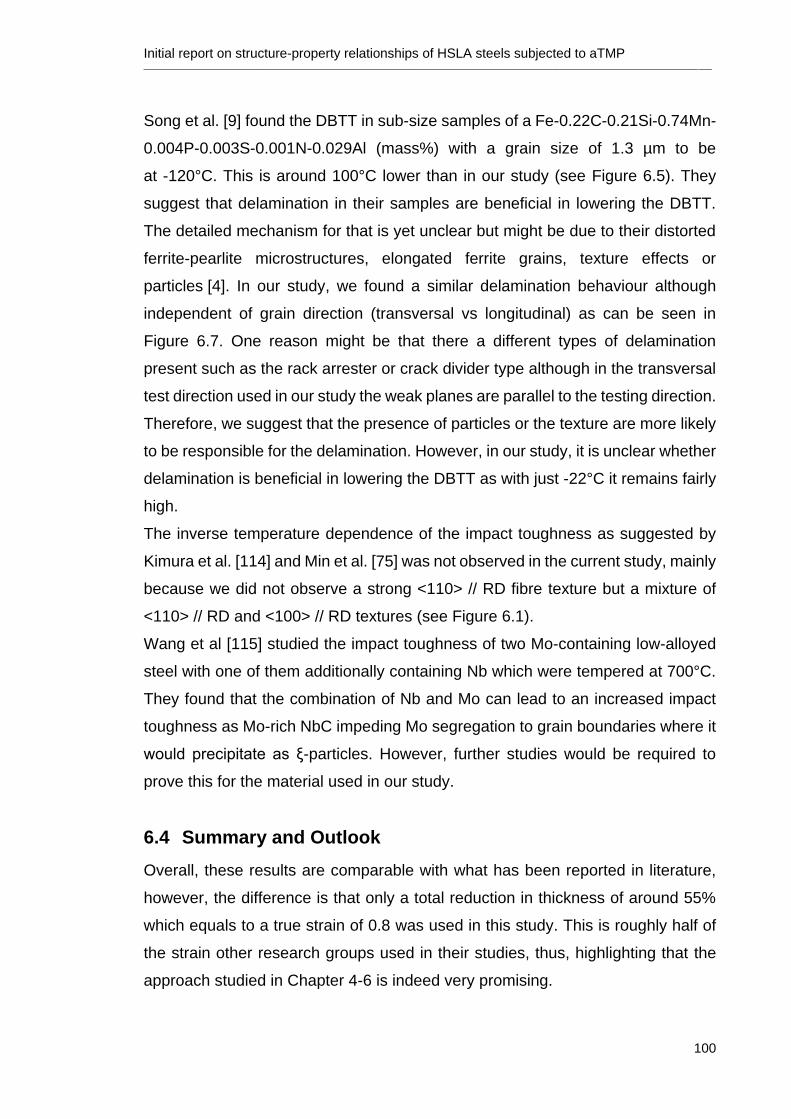
Initial report on structure-property relationships of HSLA steels subjected to aTMP ________________________________________________________________________________________________________________________________
100
Song et al. [9] found the DBTT in sub-size samples of a Fe-0.22C-0.21Si-0.74Mn-
0.004P-0.003S-0.001N-0.029Al (mass%) with a grain size of 1.3 µm to be
at -120°C. This is around 100°C lower than in our study (see Figure 6.5). They
suggest that delamination in their samples are beneficial in lowering the DBTT.
The detailed mechanism for that is yet unclear but might be due to their distorted
ferrite-pearlite microstructures, elongated ferrite grains, texture effects or
particles [4]. In our study, we found a similar delamination behaviour although
independent of grain direction (transversal vs longitudinal) as can be seen in
Figure 6.7. One reason might be that there a different types of delamination
present such as the rack arrester or crack divider type although in the transversal
test direction used in our study the weak planes are parallel to the testing direction.
Therefore, we suggest that the presence of particles or the texture are more likely
to be responsible for the delamination. However, in our study, it is unclear whether
delamination is beneficial in lowering the DBTT as with just -22°C it remains fairly
high.
The inverse temperature dependence of the impact toughness as suggested by
Kimura et al. [114] and Min et al. [75] was not observed in the current study, mainly
because we did not observe a strong <110> // RD fibre texture but a mixture of
<110> // RD and <100> // RD textures (see Figure 6.1).
Wang et al [115] studied the impact toughness of two Mo-containing low-alloyed
steel with one of them additionally containing Nb which were tempered at 700°C.
They found that the combination of Nb and Mo can lead to an increased impact
toughness as Mo-rich NbC impeding Mo segregation to grain boundaries where it
would precipitate as ξ-particles. However, further studies would be required to
prove this for the material used in our study.
6.4 Summary and Outlook
Overall, these results are comparable with what has been reported in literature,
however, the difference is that only a total reduction in thickness of around 55%
which equals to a true strain of 0.8 was used in this study. This is roughly half of
the strain other research groups used in their studies, thus, highlighting that the
approach studied in Chapter 4-6 is indeed very promising.
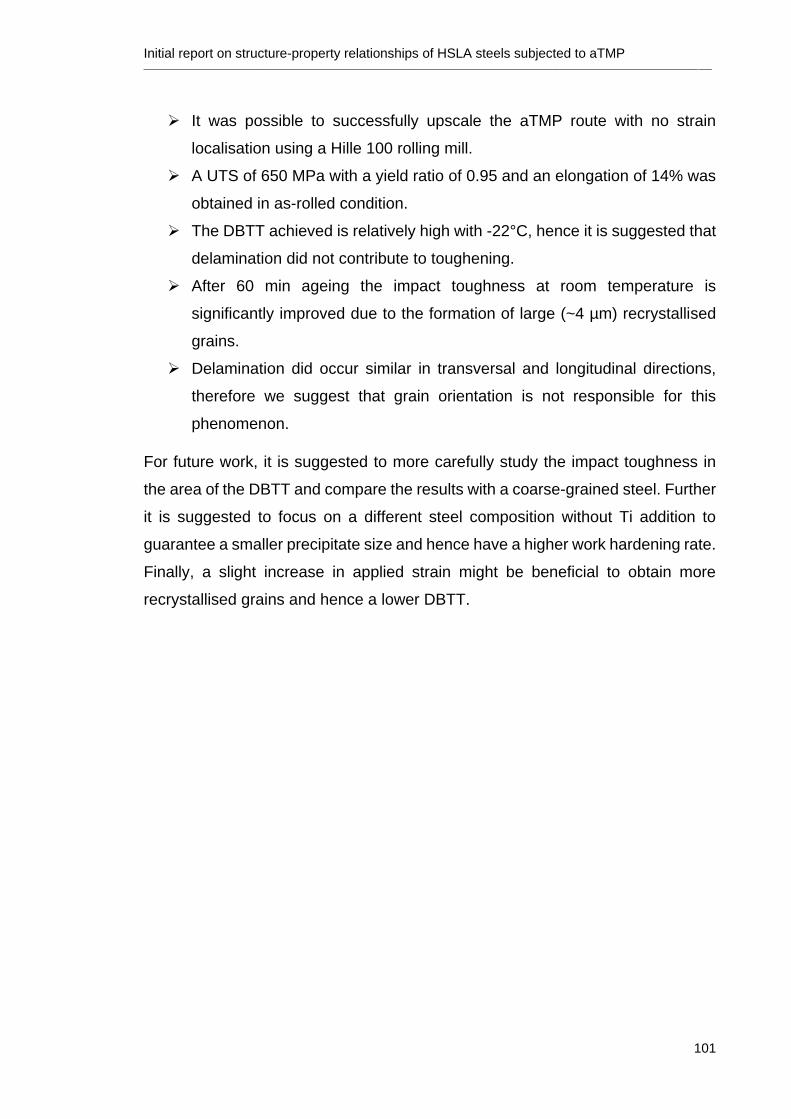
Initial report on structure-property relationships of HSLA steels subjected to aTMP ________________________________________________________________________________________________________________________________
101
It was possible to successfully upscale the aTMP route with no strain
localisation using a Hille 100 rolling mill.
A UTS of 650 MPa with a yield ratio of 0.95 and an elongation of 14% was
obtained in as-rolled condition.
The DBTT achieved is relatively high with -22°C, hence it is suggested that
delamination did not contribute to toughening.
After 60 min ageing the impact toughness at room temperature is
significantly improved due to the formation of large (~4 µm) recrystallised
grains.
Delamination did occur similar in transversal and longitudinal directions,
therefore we suggest that grain orientation is not responsible for this
phenomenon.
For future work, it is suggested to more carefully study the impact toughness in
the area of the DBTT and compare the results with a coarse-grained steel. Further
it is suggested to focus on a different steel composition without Ti addition to
guarantee a smaller precipitate size and hence have a higher work hardening rate.
Finally, a slight increase in applied strain might be beneficial to obtain more
recrystallised grains and hence a lower DBTT.
Influence of Cr/Mo as microalloying elements in HSLA steels subjected to warm deformation ________________________________________________________________________________________________________________________________
102
7 Influence of Cr/Mo as microalloying elements in
HSLA steels subjected to warm deformation
The work in this chapter has been published:
C. Ledermueller, H.I. Pratiwi, R.F. Webster, M. Eizadjou, S.P. Ringer, S. Primig,
Microalloying effects of Mo versus Cr in HSLA steels with ultrafine-grained ferrite
microstructures, Mater. Des. 185 (2020).
C. Ledermueller did a major part of the experimental work as well as the data
analysis. The manuscript was drafted by her. She supervised the work done by
H.J. Pratiwi.
7.1 Introduction
In the previous chapters, it was shown the industrial Ti-Nb-Mo HSLA steel with the
composition shown in Table 3.1 is suitable for aTMP schedules (see Chapter 5)
[90,107]. Hierarchical microstructures, comprising grain and subgrain boundaries
decorated by cementite and complex core-shell (Ti/Nb)(C,N) particles formed
during ageing were observed. Interestingly, fine-scale precipitates that might have
formed in the ferrite were not observed. This suggests that Nb may be a more
promising candidate than Ti for HSLA steel design via aTMP as Nb will remain in
solid solution and therefore available for strain-induced precipitation during
ageing.
The key concept of the current chapter was to extend the above approach to
explore the potential for additions of so-called ‘modern’ microalloying elements
such as Mo and Cr to provide further strengthening [18]. The background to our
compositional design was as follows: Firstly, Nb is one of the most common and
well-studied microalloying elements in HSLA steels. The main benefit of Nb is its
strong tendency to form Nb(C,N), which does not only contribute to precipitation
strengthening, but also pins grain boundaries enabling finer grain sizes and
delaying the γ-α phase transformation. Furthermore, the solute drag effect of Nb,
where solute Nb segregates to dislocations and grain boundaries, is a major
contributor to increased strength and delayed recrystallisation [13–16]. The
Influence of Cr/Mo as microalloying elements in HSLA steels subjected to warm deformation ________________________________________________________________________________________________________________________________
103
addition of Mo as a microalloying element is known to provide solid solution
hardening, increase hardenability, and to delay both phase transformations and
recrystallisation [17,18]. However, one of the most beneficial effects of Mo
microalloying was found in conjunction with Nb, modifying the precipitation
sequence [18] and leading to an increase in yield strength. The detailed role of Mo
in the precipitation process is not understood, but its effect is to clearly refine the
precipitate dispersion upon ageing. There are reports that Mo (i) reduces the
diffusivity of other carbide forming elements [17,24], (ii) segregates to the
precipitate/matrix interface between precipitate and matrix [25], (iii) is incorporated
into the NbC composition [26–28], and (iv) acts as a nucleation site for
NbC [18,25]. Most studies investigating the effects of Mo were conducted on TiMo
microalloyed steels [27,29,30]. Park et al. [31] studied a 0.4Nb-0.2Mo
microalloyed steel which was hot rolled and then aged at temperatures between
500-700°C. They did not observe Mo within NbC precipitates but rather found it in
solid solution in the matrix. The addition of Cr was of interest to our program due
to its ability to enhance corrosion resistance [16]. It is also well-known that
microalloying of Cr in low C steels can promote the formation of Cr-carbides which
contribute to strengthening [33–36]. Moreover, Cr can inhibit cementite coarsening
due to the dual partitioning behaviour of Cr and Mn between cementite and the
ferrite matrix [19,20].
This chapter studies the relative effects of microalloying with Mo versus Cr on the
microstructural evolution and properties of three model Fe-1.6Mn-0.04Nb-
0.1C+0.5Mo/Cr steels during deformation and ageing in the ferrite. The chemical
composition of the three steel is listed in Chapter 3.2 and the aTMP applied is
described in Chapter 3.3.4. The microstructural characterisation methods can be
found in Chapter 3.5 and the hardness testing is described in Chapter 3.6.1.
7.2 Results
7.2.1 Hardness
The Vickers hardness of all three steels as a function of ageing time at 600°C is
shown in Figure 7.1. As expected, in all cases, the initial value of the hardness is
high due to the work imparted during the warm rolling. The hardness then
decreases, and this is expected to be a competition between the recovery
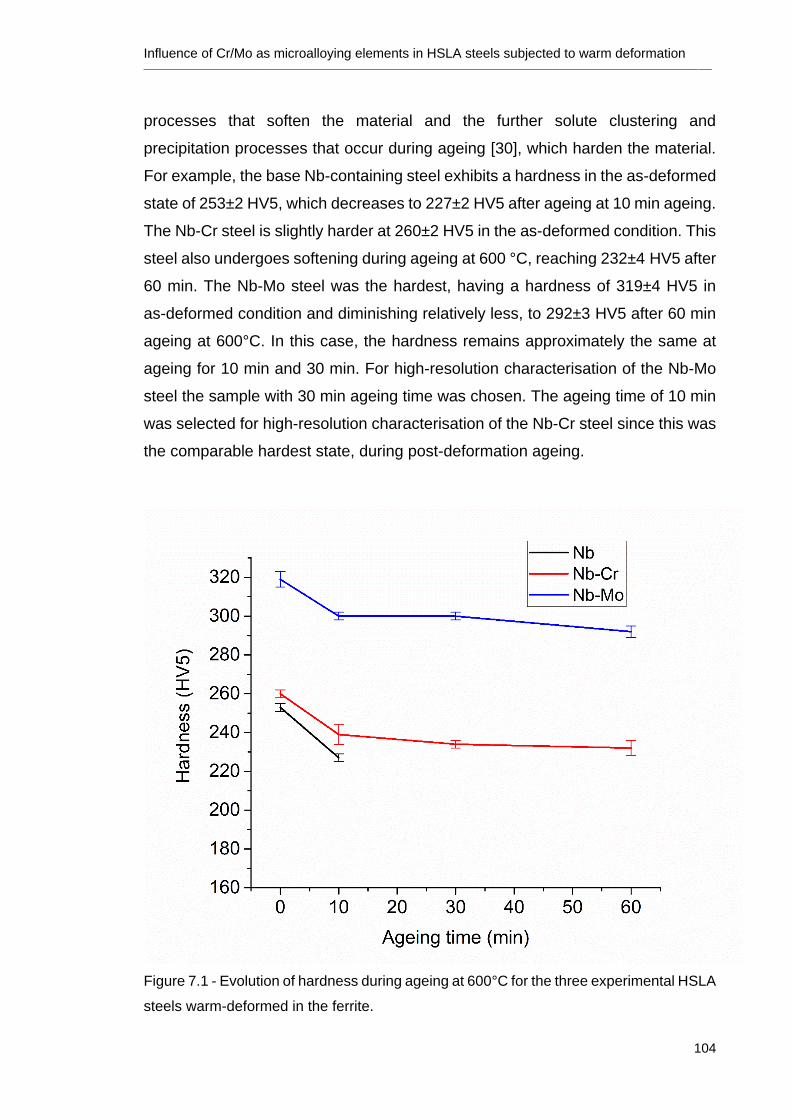
Influence of Cr/Mo as microalloying elements in HSLA steels subjected to warm deformation ________________________________________________________________________________________________________________________________
104
processes that soften the material and the further solute clustering and
precipitation processes that occur during ageing [30], which harden the material.
For example, the base Nb-containing steel exhibits a hardness in the as-deformed
state of 253±2 HV5, which decreases to 227±2 HV5 after ageing at 10 min ageing.
The Nb-Cr steel is slightly harder at 260±2 HV5 in the as-deformed condition. This
steel also undergoes softening during ageing at 600 °C, reaching 232±4 HV5 after
60 min. The Nb-Mo steel was the hardest, having a hardness of 319±4 HV5 in
as-deformed condition and diminishing relatively less, to 292±3 HV5 after 60 min
ageing at 600°C. In this case, the hardness remains approximately the same at
ageing for 10 min and 30 min. For high-resolution characterisation of the Nb-Mo
steel the sample with 30 min ageing time was chosen. The ageing time of 10 min
was selected for high-resolution characterisation of the Nb-Cr steel since this was
the comparable hardest state, during post-deformation ageing.
Figure 7.1 - Evolution of hardness during ageing at 600°C for the three experimental HSLA
steels warm-deformed in the ferrite.
Influence of Cr/Mo as microalloying elements in HSLA steels subjected to warm deformation ________________________________________________________________________________________________________________________________
105
7.2.2 Dislocations and interfaces
The SEM imaging presented here was done in the centre region of the deformed
samples as no significant difference between surface and centre was observed.
Generally, it was found that in all conditions the grains are elongated in rolling
direction (RD), as expected. Figure 7.2 shows a qualitative schematic of the
microstructural evolution of all three alloys as well as some representative
examples of the microstructures in ECCI contrast (ND indicates the normal
direction). The fraction of recovery/recrystallisation was qualitatively obtained from
the ECCI images. Recrystallised grains are individual cells with uniform contrast
within the cell whereas deformed areas show a smeared contrast in the ECCI
images. In the as-deformed conditions (0 min ageing time), the main fraction of
the microstructure in all three steels is dominated by highly deformed areas, as
can be seen in the ECCI images as blurry contrast and as highlighted red areas
in Figure 7.2a-c. Here, only a small amount of recovery and subgrain formation
was generally observed. Upon ageing, distinct changes in grain shape and
morphology can be seen. After 10 min ageing, the Nb-Cr and Nb-Mo steels still
exhibit a large fraction of as-deformed areas whereas in the Nb steel grains appear
to be more equiaxed. Here, subgrains and some new grains have formed (marked
as blue areas in Figure 7.2a-c). In the Nb-Cr steels, the formation of distinct
subgrains can be seen after 10 min ageing time, however, the majority of the
microstructure remains in the as-deformed state. With increasing ageing time up
to 60 min, the ratio of recovered areas with distinct subgrains to as-deformed areas
increases, and the formation of more globular new grains can be observed. This
is in contrast to the Nb-Mo steel where grains remain elongated and as-deformed
even after ageing for 60 min. Only a small amount of subgrains, especially near
the original grain boundaries is observed in this steel. The occasional bright spots
are cementite particles which will be studied further in the following.
Figure 7.3 shows examples of typical EBSD inverse pole figure (IPF) maps for all
three steel in as-deformed and 10 min ageing condition, with high angle grain
boundaries (>15°) shown as black lines and low angle grain boundaries (2-15°)
as white lines. Generally, all three steel show a typical body-centred cubic rolling
texture with grains oriented in <001> and <111> parallel to ND. However, a
specific difference in the recovery mechanism can be seen. The Nb and Nb-Cr
steels only exhibit a small amount of small new grains that form adjacent to the
Influence of Cr/Mo as microalloying elements in HSLA steels subjected to warm deformation ________________________________________________________________________________________________________________________________
106
original grain boundaries (marked with white arrows in Figure 7.3). This is in
contrast to the Nb-Mo steel where a large amount of these new grains is seen (see
zoomed-in region in Figure 7.3f). After 10 min ageing these small grains undergo
coarsening in the Nb and Nb-Cr steel but remain stable in the Nb-Mo steel. The
average grain size measured from EBSD for the Nb steel is 1.37±0.05 µm in as-
deformed condition and 1.44±0.08 µm after 10 min ageing. The grain sizes for the
Nb-Cr and Nb-Mo steel in as-deformed condition are 0.95±0.12 µm and
0.56±0.02 µm, after 10 min 0.97±0.05 µm and 0.49±0.06 µm and after 60 min
ageing (not shown here) 1.16±0.06 µm and 0.47±0.04 µm, respectively.
Crystallites confined either by high angle or low angle grain boundaries were
considered for the grain size measurement. Overall, the ratio of high angle grain
boundaries to low angle grain boundaries was roughly 50:50 for all three steels in
their as-deformed condition, and changed slightly towards ~40:60 with an increase
in ageing time due to additional static recovery processes. No significant
difference was found between the individual steels.
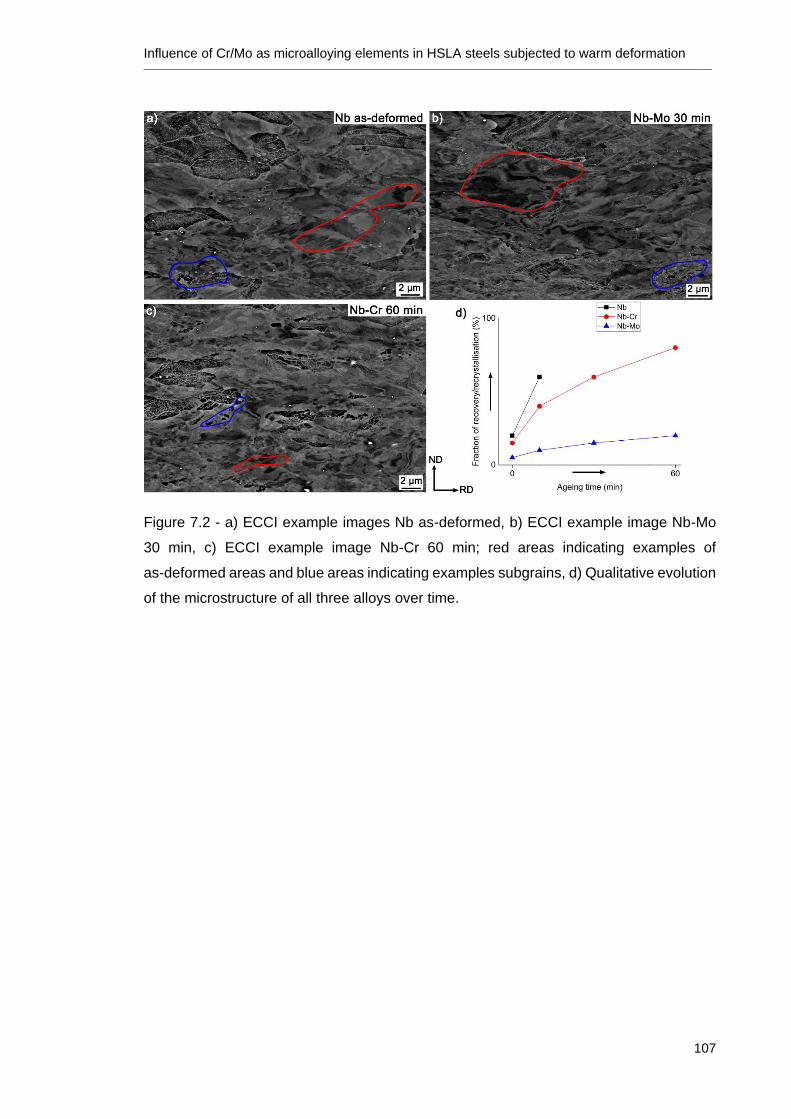
Influence of Cr/Mo as microalloying elements in HSLA steels subjected to warm deformation ________________________________________________________________________________________________________________________________
107
Figure 7.2 - a) ECCI example images Nb as-deformed, b) ECCI example image Nb-Mo
30 min, c) ECCI example image Nb-Cr 60 min; red areas indicating examples of
as-deformed areas and blue areas indicating examples subgrains, d) Qualitative evolution
of the microstructure of all three alloys over time.
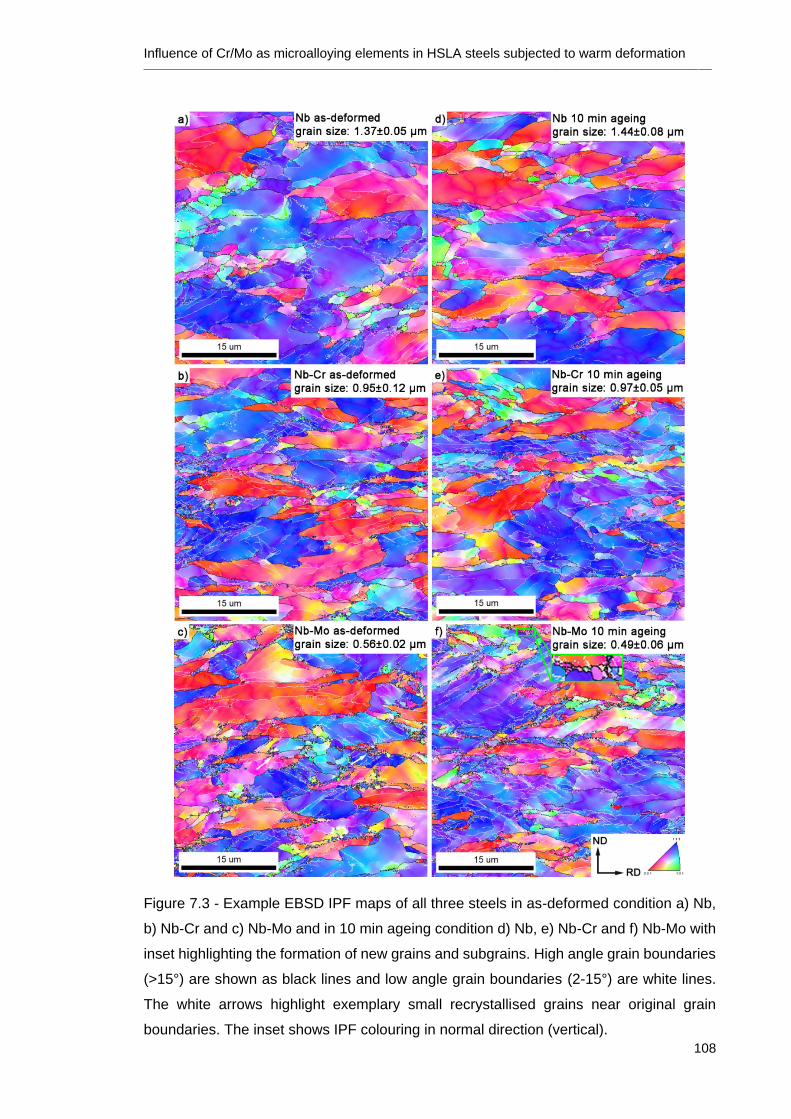
Influence of Cr/Mo as microalloying elements in HSLA steels subjected to warm deformation ________________________________________________________________________________________________________________________________
108
Figure 7.3 - Example EBSD IPF maps of all three steels in as-deformed condition a) Nb,
b) Nb-Cr and c) Nb-Mo and in 10 min ageing condition d) Nb, e) Nb-Cr and f) Nb-Mo with
inset highlighting the formation of new grains and subgrains. High angle grain boundaries
(>15°) are shown as black lines and low angle grain boundaries (2-15°) are white lines.
The white arrows highlight exemplary small recrystallised grains near original grain
boundaries. The inset shows IPF colouring in normal direction (vertical).
Influence of Cr/Mo as microalloying elements in HSLA steels subjected to warm deformation ________________________________________________________________________________________________________________________________
109
7.2.3 Solute clusters and second phase precipitates
High-resolution characterisation of the solute atom clusters and precipitates was
performed using TEM and AP to study their location within the matrix, their
chemical composition as well as their morphology. The samples studied were
those that exhibited the highest hardness during the post-deformation ageing step.
This was the 10 min ageing condition for the Nb-Cr sample, and the 30 min ageing
condition for the Nb-Mo sample, Figure 7.1. In Figure 7.4, BF-STEM images and
energy-dispersive X-ray spectroscopy (EDS) mapping of the Nb-Cr sample are
shown. It can be seen that there are two types of precipitates: elongated 'larger'
precipitates (100 to 300 nm) that nucleate preferably at the grain boundaries, and
'smaller' (10 to 30 nm), spheroidal intragranular precipitates. EDS mapping
indicated that the larger precipitates were rich in Fe-Mn-Cr-C, whereas the smaller
precipitates contained only Nb and C.
Figure 7.5 shows the STEM and EDS mapping from the Nb-Mo sample after
30 min ageing. Similar to the observations from the Nb-Cr steel, two types of
precipitates were found, 'larger' ones at grain boundaries and 'smaller'
intragranular precipitates. In accordance with the ECCI, there was a higher amount
of dislocation debris present compared to the Nb-Cr sample, as seen in Figure
7.5c. The EDS mapping reveals that the 'larger' precipitates are Fe-Mn-C-Mo rich
whereas the 'smaller' precipitates are rich in Nb and Mo.
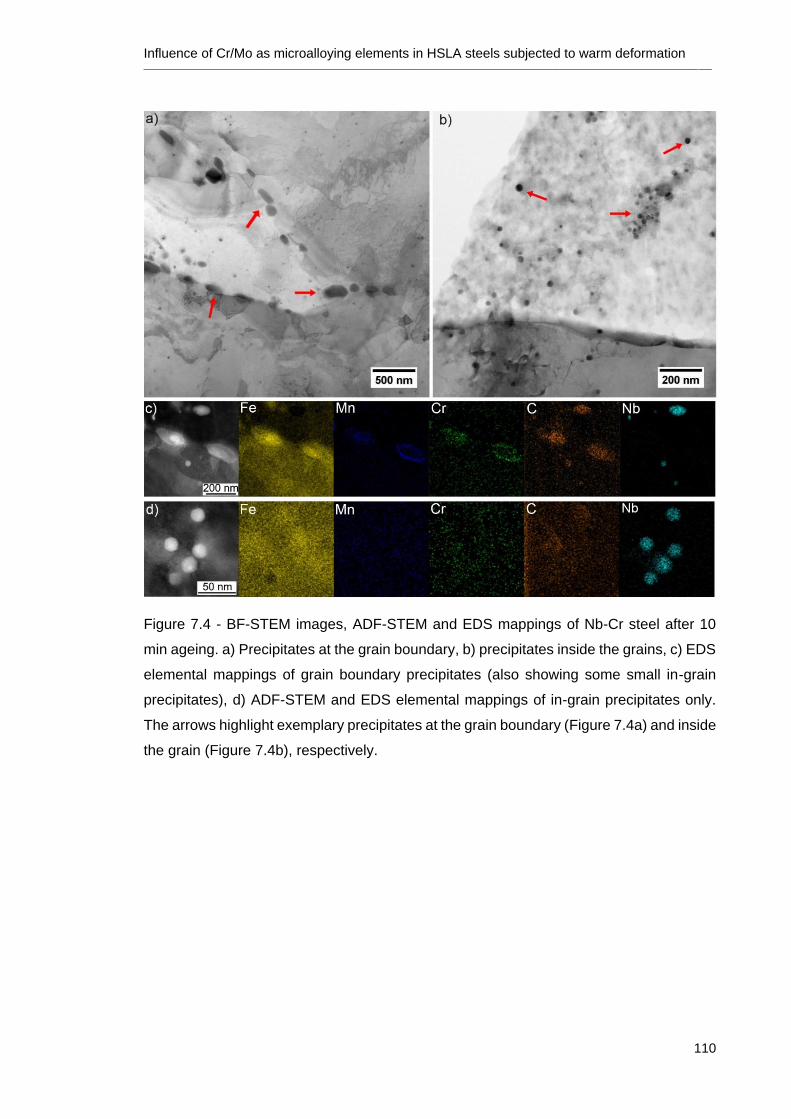
Influence of Cr/Mo as microalloying elements in HSLA steels subjected to warm deformation ________________________________________________________________________________________________________________________________
110
Figure 7.4 - BF-STEM images, ADF-STEM and EDS mappings of Nb-Cr steel after 10
min ageing. a) Precipitates at the grain boundary, b) precipitates inside the grains, c) EDS
elemental mappings of grain boundary precipitates (also showing some small in-grain
precipitates), d) ADF-STEM and EDS elemental mappings of in-grain precipitates only.
The arrows highlight exemplary precipitates at the grain boundary (Figure 7.4a) and inside
the grain (Figure 7.4b), respectively.
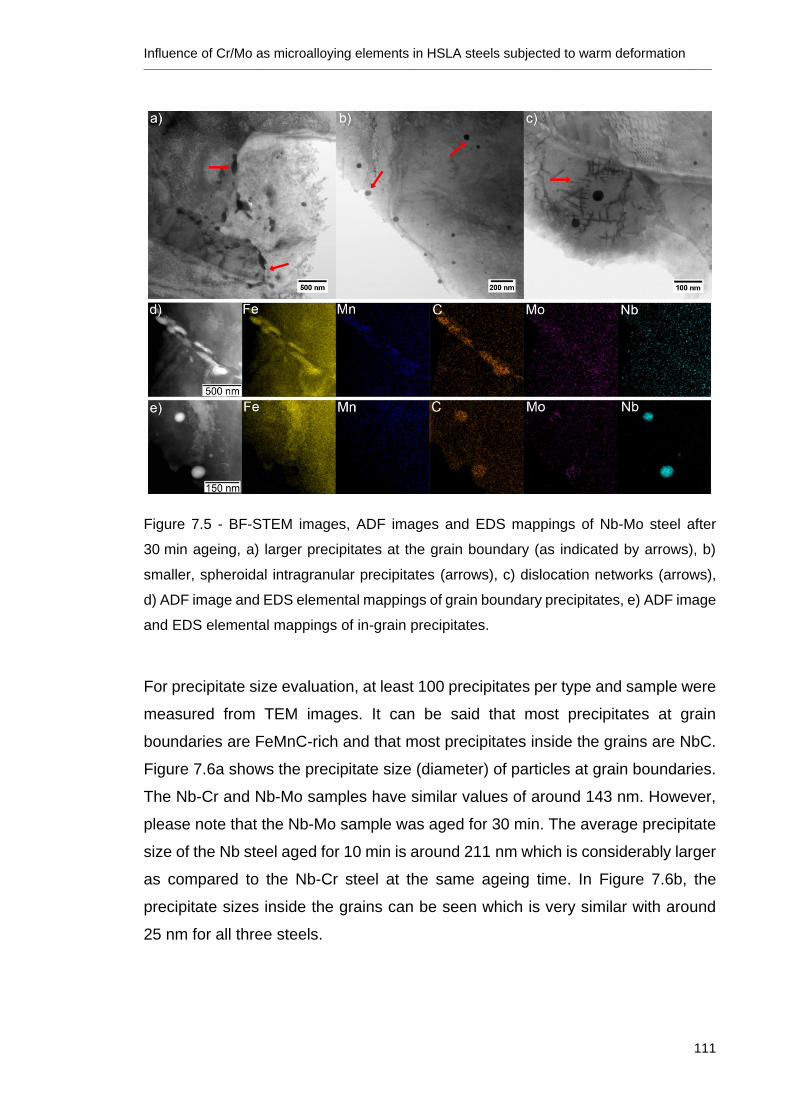
Influence of Cr/Mo as microalloying elements in HSLA steels subjected to warm deformation ________________________________________________________________________________________________________________________________
111
Figure 7.5 - BF-STEM images, ADF images and EDS mappings of Nb-Mo steel after
30 min ageing, a) larger precipitates at the grain boundary (as indicated by arrows), b)
smaller, spheroidal intragranular precipitates (arrows), c) dislocation networks (arrows),
d) ADF image and EDS elemental mappings of grain boundary precipitates, e) ADF image
and EDS elemental mappings of in-grain precipitates.
For precipitate size evaluation, at least 100 precipitates per type and sample were
measured from TEM images. It can be said that most precipitates at grain
boundaries are FeMnC-rich and that most precipitates inside the grains are NbC.
Figure 7.6a shows the precipitate size (diameter) of particles at grain boundaries.
The Nb-Cr and Nb-Mo samples have similar values of around 143 nm. However,
please note that the Nb-Mo sample was aged for 30 min. The average precipitate
size of the Nb steel aged for 10 min is around 211 nm which is considerably larger
as compared to the Nb-Cr steel at the same ageing time. In Figure 7.6b, the
precipitate sizes inside the grains can be seen which is very similar with around
25 nm for all three steels.
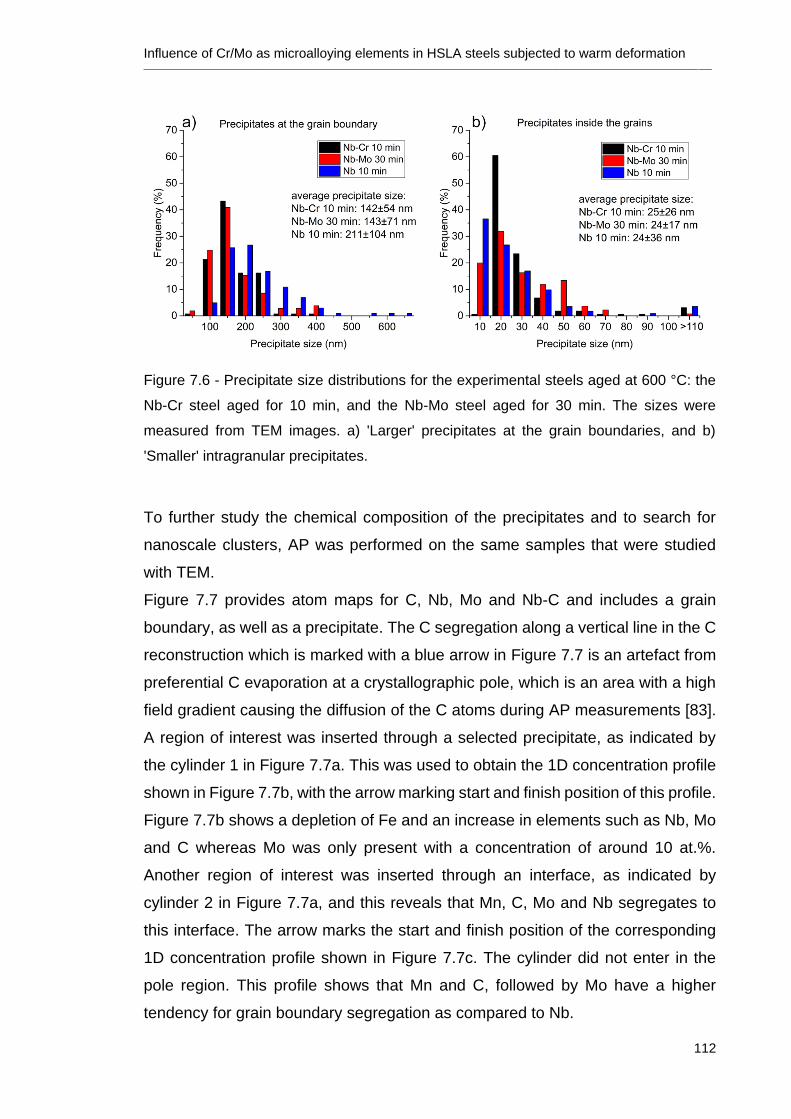
Influence of Cr/Mo as microalloying elements in HSLA steels subjected to warm deformation ________________________________________________________________________________________________________________________________
112
Figure 7.6 - Precipitate size distributions for the experimental steels aged at 600 °C: the
Nb-Cr steel aged for 10 min, and the Nb-Mo steel aged for 30 min. The sizes were
measured from TEM images. a) 'Larger' precipitates at the grain boundaries, and b)
'Smaller' intragranular precipitates.
To further study the chemical composition of the precipitates and to search for
nanoscale clusters, AP was performed on the same samples that were studied
with TEM.
Figure 7.7 provides atom maps for C, Nb, Mo and Nb-C and includes a grain
boundary, as well as a precipitate. The C segregation along a vertical line in the C
reconstruction which is marked with a blue arrow in Figure 7.7 is an artefact from
preferential C evaporation at a crystallographic pole, which is an area with a high
field gradient causing the diffusion of the C atoms during AP measurements [83].
A region of interest was inserted through a selected precipitate, as indicated by
the cylinder 1 in Figure 7.7a. This was used to obtain the 1D concentration profile
shown in Figure 7.7b, with the arrow marking start and finish position of this profile.
Figure 7.7b shows a depletion of Fe and an increase in elements such as Nb, Mo
and C whereas Mo was only present with a concentration of around 10 at.%.
Another region of interest was inserted through an interface, as indicated by
cylinder 2 in Figure 7.7a, and this reveals that Mn, C, Mo and Nb segregates to
this interface. The arrow marks the start and finish position of the corresponding
1D concentration profile shown in Figure 7.7c. The cylinder did not enter in the
pole region. This profile shows that Mn and C, followed by Mo have a higher
tendency for grain boundary segregation as compared to Nb.
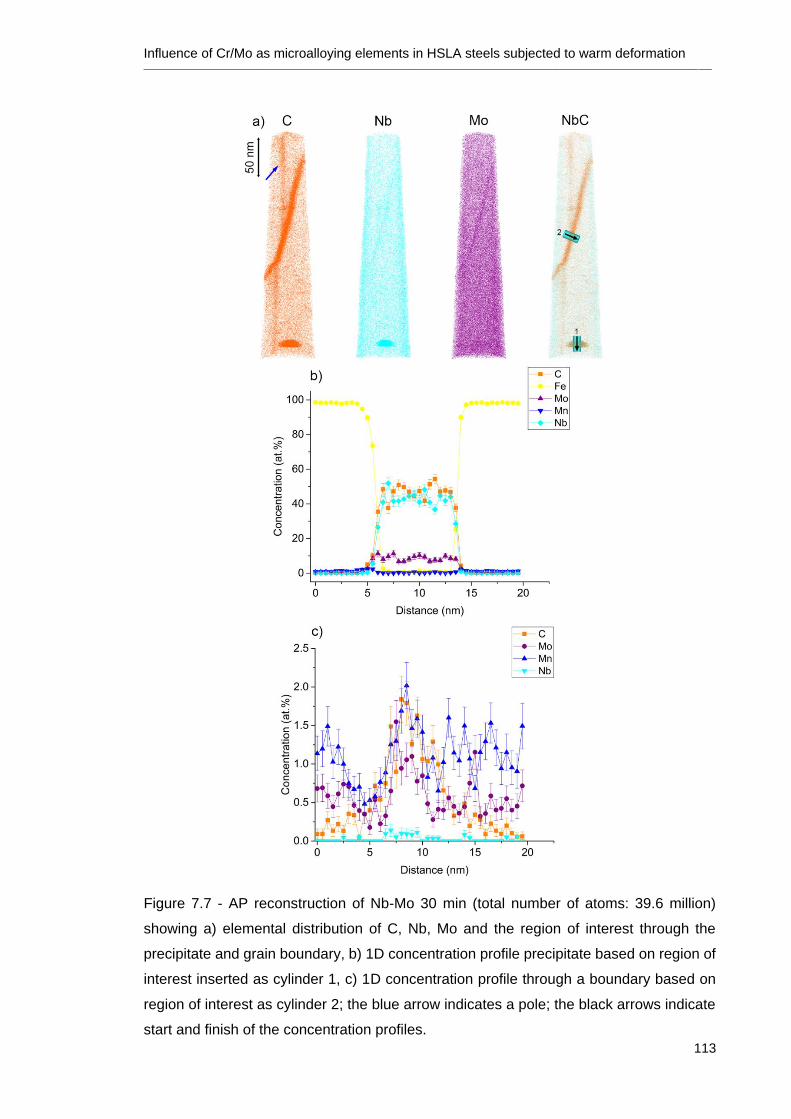
Influence of Cr/Mo as microalloying elements in HSLA steels subjected to warm deformation ________________________________________________________________________________________________________________________________
113
Figure 7.7 - AP reconstruction of Nb-Mo 30 min (total number of atoms: 39.6 million)
showing a) elemental distribution of C, Nb, Mo and the region of interest through the
precipitate and grain boundary, b) 1D concentration profile precipitate based on region of
interest inserted as cylinder 1, c) 1D concentration profile through a boundary based on
region of interest as cylinder 2; the blue arrow indicates a pole; the black arrows indicate
start and finish of the concentration profiles.
Influence of Cr/Mo as microalloying elements in HSLA steels subjected to warm deformation ________________________________________________________________________________________________________________________________
114
The AP tomograms in Figure 7.8 reveal the atomic co-clustering of Nb and C in
the Nb-Mo steel aged 30 min and the Nb-Cr steel aged for 10 min. These atomic
cluster maps were generated using a maximum separation distance of dmax= 1.33
nm, and a minimum number of atoms in a cluster of Nmin= 6 for the datasets in
Figure 7.8a. Similarly, values of dmax= 1.01 and Nmin= 10 for the dataset shown in
Figure 7.8b were used. Figure 7.8c and d summarise the number densities for the
Nb-Mo steel and the Nb-Cr steel, respectively. In the following, clusters will be
defined as features containing <60 atoms and the term nano-precipitates used to
describe features containing >60 atoms.
For the Nb-Mo steel, the majority of the Nb-C co-clusters observed contained
<20 atoms. However, a second peak of nano-precipitates was observed with
>60 atoms per cluster. Furthermore, it was found that these nano-precipitates
incorporate a significant amount of Mo after reaching a diameter of ~5 nm,
equivalent to them containing ≥ 4 atoms.
Figure 7.8d shows Nb-C co-clusters from the Nb-Cr containing steel. Relatively, a
much lower number of nano-precipitates were observed. Moreover, Cr was not
incorporated into the clusters, nor into the nano-precipitates.
The local matrix composition of the reconstruction shown in Figure 7.8a is
Fe-0.01C-1.01Mn-0.02Nb-0.55Mo wt.% and for the reconstruction in Figure 7.8b
is Fe-0.02C-1.1Mn-0.03Nb-0.64Cr wt.%. This suggests that the matrix is depleted
in Mn, C and Nb as compared to the overall steel compositions shown in Table
3.2.
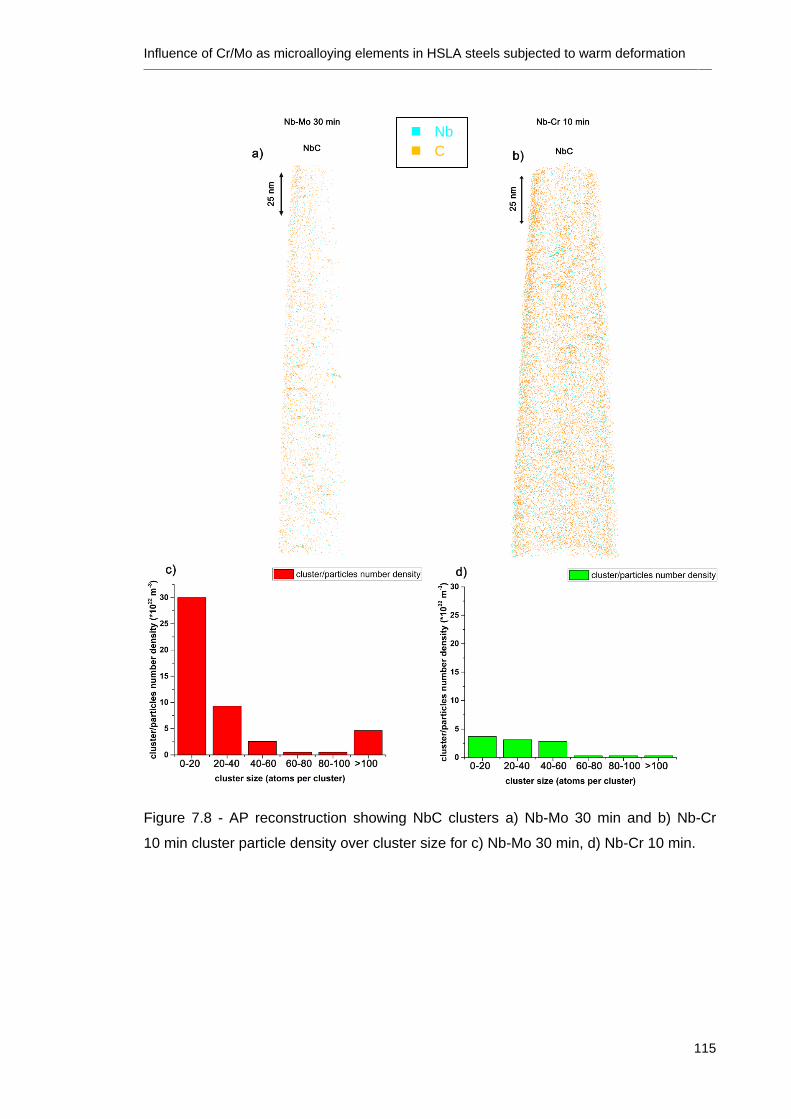
Influence of Cr/Mo as microalloying elements in HSLA steels subjected to warm deformation ________________________________________________________________________________________________________________________________
115
Figure 7.8 - AP reconstruction showing NbC clusters a) Nb-Mo 30 min and b) Nb-Cr
10 min cluster particle density over cluster size for c) Nb-Mo 30 min, d) Nb-Cr 10 min.
Nb
C
Influence of Cr/Mo as microalloying elements in HSLA steels subjected to warm deformation ________________________________________________________________________________________________________________________________
116
7.3 Discussion
In this chapter, the influence of Mo and Cr as microalloying elements in a
Nb-based HSLA steel which was deformed and aged in the ferrite was
investigated. In the following section, the effect of Cr/Mo on dislocations, solid
solution, clusters and precipitates as well as interfaces will be discussed
separately. A comprehensive model of the microstructural mechanisms will be
introduced at the end.
7.3.1 Dislocations and interfaces
The as-deformed microstructures of all three alloys consist of as-deformed areas
and recovered areas with subgrain structures as well as new recrystallised grains
(Figure 7.2 and Figure 7.3). Due to the high stacking fault energy of ferrite, the
main mechanism behind this is continuous dynamic recrystallisation, where there
is an extended tendency for dislocation rearrangements/annihilation and subgrain
formation. Subgrain boundaries can convert into high angle grain boundaries if
sufficient strain is applied [68]. The addition of Cr, as well as Mo, obviously leads
to a retardation in continuous dynamic recrystallisation as compared to the base
alloy which only contains Nb (Figure 7.2 and Figure 7.3). However, Mo is more
effective in retarding dislocation annihilation and subgrain formation as compared
to Cr and Nb as can be seen in Figure 7.2, Figure 7.3 and Figure 7.5c. This
microstructural observation corresponds well with the hardness data shown in
Figure 7.1 where the hardness of the Nb-Mo steel is ~20% higher as compared to
the Nb-Cr and Nb steels. It is suggested that the solute drag effect of Mo [18] is a
major contributor in delaying the dislocation rearrangements/annihilation and
subgrain formation. The high amount of dislocation networks present in the Nb-
Mo alloy will, thus, act as nucleation sites for NbC and also contribute to
strengthening. This is also suggested by Uemori et al. [25] who studied the
addition of Mo in a Ti-Nb steel via AP field ion microscopy as well as in the review
on Mo alloying in HSLA steels by Mohrbacher [18]. Furthermore, the segregation
of Mo as well as Nb and Mn to the grain boundary, as seen in Figure 7.7, may be
able to pin the grain boundary and, thus, may provide hardening. Mo segregation
in conjunction with P segregation to the prior austenite boundaries has been
reported by Song et al. [116] for a Cr-Mo low-alloyed steel that has been aged at
540°C after quenching from 980°C.
Influence of Cr/Mo as microalloying elements in HSLA steels subjected to warm deformation ________________________________________________________________________________________________________________________________
117
7.3.2 Precipitates and clusters
Mo is incorporated into both NbC and FeMnC as can be seen from Figure 7.5,
Figure 7.7 and Figure 7.8. The chemical composition of the matrix for the AP
reconstruction shown in Figure 7.8a clearly suggests that the majority of Mo
remains in solid solution, which contributes to solid solution strengthening. Only
small amounts of Mo participate in the NbC formation rather than segregating at
the precipitate/matrix interface as suggested in the literature by Cao et al. [26] and
Enloe et al. [27]. Cao et al. [26] studied a 0.08Nb-0.14Mo microalloyed steel after
warm deformation at 880°C, where complex (Nb,Mo)(C,N) with a ratio of Nb:Mo
of 2.43 were formed. Similar observations have been made for TiMo-
steels [27,29,30,117]. Enloe et al. [27] found Mo incorporated in NbC at 900°C
using AP. They also suggest that Mo is expected to be more significantly
incorporated into NbC in the ferrite compared to NbC in austenite based on an
ideal solution model after Speer et al. [118]. Nöhrer et al. [119] studied the
evolution of Nb precipitates in a low-alloyed steel which was deformed at 700°C.
They reported that Nb precipitates have a higher volume fraction in ferrite
compared to the same processing in austenite due to a lower solubility and higher
diffusivity in ferrite. On the contrary, Park et al. [31] did not find Mo addition in NbC
precipitates of a 0.45 wt.% Nb and 0.19 wt.% Mo microalloyed steel which was hot
rolled and then aged at temperatures between 500-700°C but found the Mo rather
in the matrix.
To understand why Mo is incorporated in carbides, Jang et al. [120] calculated the
lattice parameters of MoC with first principle showing that the replacement of Ti by
Mo will reduce the misfit with ferrite, which facilitates nucleation. At the same time,
the substitution of Ti by Mo will reduce the equilibrium Ti concentration in the ferrite
matrix during coarsening, which possibly decelerates the coarsening process of
(Ti,M)C precipitation. Mo retards growth of precipitates due to its partition into the
matrix as it is not favoured within the TiC. This behaviour is similar for Mo in
NbC/γ-Fe as calculated with density functional theory by Zhou et al. [121]. Nb
replacement by Mo is energetically unfavourable, however, it has been reported
to reduce the lattice parameter of MC and interfacial chemical energy which makes
it more resistant to coarsening compared to pure NbC [121]. To our best
knowledge, no first principle studies on Cr incorporation into NbC have been
reported in literature.
Influence of Cr/Mo as microalloying elements in HSLA steels subjected to warm deformation ________________________________________________________________________________________________________________________________
118
Overall, it seems that Mo is more effective in refining the precipitate size as
compared to Cr, (Figure 7.6) which also suggests that a combination of higher
number of nucleation sites and retarded diffusivity of Nb and C may be responsible
for finer size and increased hardness. Kostryzhev et al. [20] reported that Mo has
a stronger influence than Cr on the retardation of cementite coarsening in a NbV
microalloyed steel.
The cluster analysis (Figure 7.8) shows that in both alloys NbC clusters are
present. Mo is only present in clusters/nano-precipitates with a diameter larger
than ~5 nm. A similar behaviour was observed by others in TiMo steels [30,122]
suggesting that Mo is not only a key element in controlling the precipitate growth
but also in the early stages of precipitation.
Figure 7.4 shows that Cr is incorporated in the larger FeMn-rich precipitates in the
Nb-Cr steel in contrary to the nanoscale NbC where no Cr was found. A similar
behaviour of Cr was also observed by Kostryshev et al. [20] for a NbV-
microalloyed bainitic steel where it was found that Cr was effective in retarding the
growth of FeMnC-rich precipitates. This too can be observed in Figure 7.6a in the
present study. The average size of the FeMnC-rich precipitates in this study after
10 min ageing for the Nb-Cr steel is around a 30% finer compared to the Nb steel.
For the Nb-Cr sample no significant contribution of Cr in the cluster/nano-
precipitates was observed. However, Pereloma et al. [123] reported Cr clusters in
a low C steel, however, in this steel no Nb was present. Xie et al. [124] reported
NbC clusters in a 0.084 wt.% Nb microalloyed steel that did contain 0.37 wt.% Cr.
In their study, there was no evidence that NbC was enriched in Cr.
7.3.3 Microstructural Model
A schematic of the microstructural features upon Cr/Mo addition is shown in Figure
7.9 to summarise the detailed effects of Mo versus Cr. Both steels, the Nb-Cr as
well as the Nb-Mo, exhibit grains that are subdivided by low angle grain boundaries
and new recrystallised grains. FeMnC-rich precipitates are found at original grain
boundaries whereas NbC-rich precipitates and clusters are preferably located
inside of grains. The main difference between these two steels is that Cr only
partitions into the FeMnC-rich precipitates whereas Mo partitions into the FeMnC-
rich precipitates as well as into NbC. Furthermore, Mo retards dislocations
annihilation and subgrain formation, hence, small recrystallised grains remain
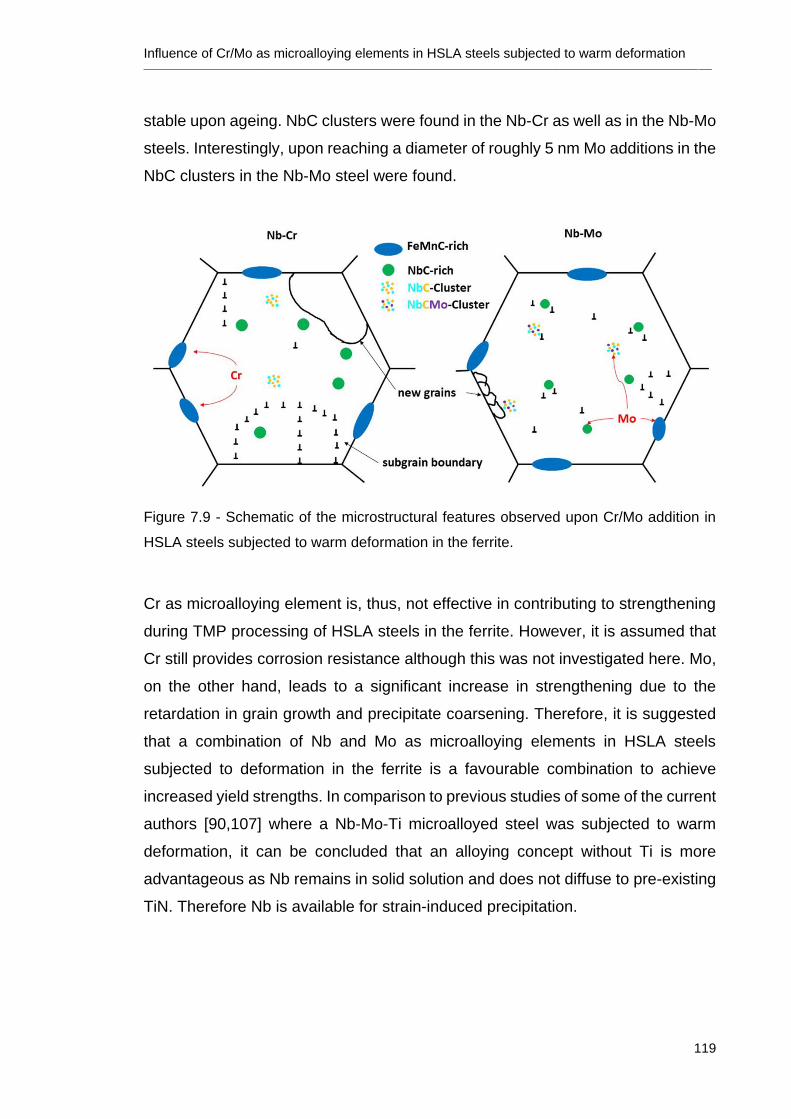
Influence of Cr/Mo as microalloying elements in HSLA steels subjected to warm deformation ________________________________________________________________________________________________________________________________
119
stable upon ageing. NbC clusters were found in the Nb-Cr as well as in the Nb-Mo
steels. Interestingly, upon reaching a diameter of roughly 5 nm Mo additions in the
NbC clusters in the Nb-Mo steel were found.
Figure 7.9 - Schematic of the microstructural features observed upon Cr/Mo addition in
HSLA steels subjected to warm deformation in the ferrite.
Cr as microalloying element is, thus, not effective in contributing to strengthening
during TMP processing of HSLA steels in the ferrite. However, it is assumed that
Cr still provides corrosion resistance although this was not investigated here. Mo,
on the other hand, leads to a significant increase in strengthening due to the
retardation in grain growth and precipitate coarsening. Therefore, it is suggested
that a combination of Nb and Mo as microalloying elements in HSLA steels
subjected to deformation in the ferrite is a favourable combination to achieve
increased yield strengths. In comparison to previous studies of some of the current
authors [90,107] where a Nb-Mo-Ti microalloyed steel was subjected to warm
deformation, it can be concluded that an alloying concept without Ti is more
advantageous as Nb remains in solid solution and does not diffuse to pre-existing
TiN. Therefore Nb is available for strain-induced precipitation.
Influence of Cr/Mo as microalloying elements in HSLA steels subjected to warm deformation ________________________________________________________________________________________________________________________________
120
7.4 Summary
In this chapter, the influence of Cr and Mo as microalloying elements on the
microstructural evolution of a Fe-1.6Mn-0.04C-0.1Nb model alloy subjected to
deformation in the ferrite region was investigated. The main findings are
summarised in the following:
Mo provides a significant increase in hardness of ~20% compared to the
base material (without Mo) whereas the Cr addition provides only a minor
hardening effect.
It is shown that Mo is more effective in contributing to strengthening due to
its partitioning into FeMnC-rich precipitates as well as into NbC precipitates
and clusters so as to inhibit precipitate growth during ageing.
Mo, Nb and Mn were found to segregate to interfaces/grain boundaries in
the Nb-Mo steel and contribute to strengthening by reducing the mobility of
these interfaces.
Mo retards recovery and the processes of dislocation annihilation and
subgrain formation due to a drag effect during ageing at 600°C.
Cr, on the other hand, partitions into the FeMnC-rich precipitates
exclusively and slows down their coarsening, but not does not provide the
additional beneficial effects of Mo summarised above. It was not found in
small NbC precipitates and clusters.
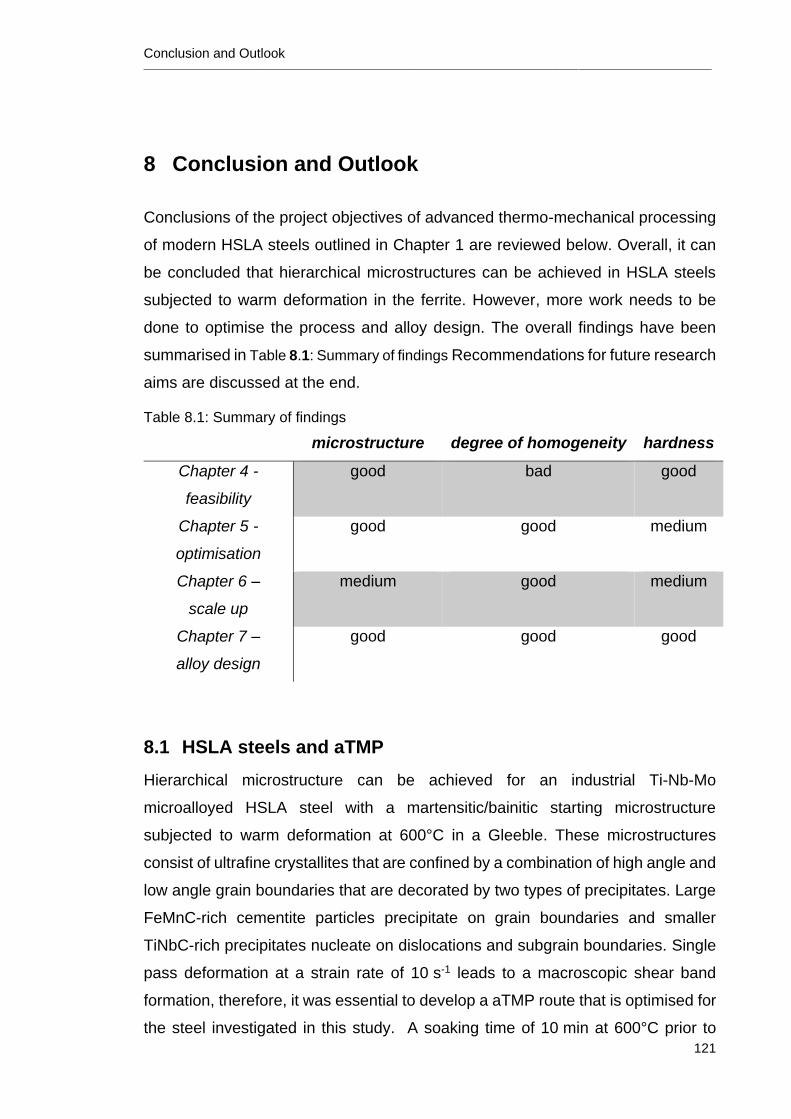
Conclusion and Outlook ________________________________________________________________________________________________________________________________
121
8 Conclusion and Outlook
Conclusions of the project objectives of advanced thermo-mechanical processing
of modern HSLA steels outlined in Chapter 1 are reviewed below. Overall, it can
be concluded that hierarchical microstructures can be achieved in HSLA steels
subjected to warm deformation in the ferrite. However, more work needs to be
done to optimise the process and alloy design. The overall findings have been
summarised in Table 8.1: Summary of findings Recommendations for future research
aims are discussed at the end.
Table 8.1: Summary of findings
microstructure degree of homogeneity hardness
Chapter 4 -
feasibility
good bad good
Chapter 5 -
optimisation
good good medium
Chapter 6 –
scale up
medium good medium
Chapter 7 –
alloy design
good good good
8.1 HSLA steels and aTMP
Hierarchical microstructure can be achieved for an industrial Ti-Nb-Mo
microalloyed HSLA steel with a martensitic/bainitic starting microstructure
subjected to warm deformation at 600°C in a Gleeble. These microstructures
consist of ultrafine crystallites that are confined by a combination of high angle and
low angle grain boundaries that are decorated by two types of precipitates. Large
FeMnC-rich cementite particles precipitate on grain boundaries and smaller
TiNbC-rich precipitates nucleate on dislocations and subgrain boundaries. Single
pass deformation at a strain rate of 10 s-1 leads to a macroscopic shear band
formation, therefore, it was essential to develop a aTMP route that is optimised for
the steel investigated in this study. A soaking time of 10 min at 600°C prior to
Conclusion and Outlook ________________________________________________________________________________________________________________________________
122
warm deformation, as well as a three-pass deformation with a strain of 0.2 per
pass with a strain rate of 1 s-1 allows to achieve a homogenous deformation during
plane strain compression testing.
8.2 Mechanical properties
Rolling at a temperature around 650°C with a reduction of thickness of 55% results
in a UTS of 650 MPa, a yield ratio of 0.95 and a total elongation of 14%. The low
yield ratio can be explained by the rather large precipitates (average precipitate
size for the as-rolled condition: 51±38 nm) in the Ti-Nb-Mo microalloyed steel,
which do not effectively contribute to work hardening. In the lower temperature
region of the Charpy impact testing delaminations occurred in longitudinal as well
as in transversal directions. However, direct ageing for 60 min shows a very high
impact energy at room temperature due to the onset of grain growth during
recrystallisation.
8.3 Alloy design
Additions of 0.5wt% Mo lead to an increase in hardness of ~20% compared to a
plain Nb microalloyed steel, whereas 0.5wt% Cr provides only a minor addition to
hardening. It was found that Mo is more effective than Cr in delaying dislocation
recovery and that it partitions into nanoscale Nb-C solute clusters and precipitates
of NbC and Fe3C during ageing, retarding the coarsening of these phases.
Conversely, Cr was found to solely partition into Fe3C, and does not contribute to
the nature of the dispersion of clusters and NbC.
8.4 Recommendations for future research
As TiN is already formed during casting and is not dissolved at typical
austenitisation temperatures Nb tends to co-precipitate at these TiN and
hence is not available for strain induced precipitation. Therefore, it is
suggested to focus on an alloy design without Ti addition to obtain a smaller
precipitate size and a higher work hardening rate.
An increase in applied strain might be beneficial to obtain more
recrystallised grains and hence a lower DBTT.
Conclusion and Outlook ________________________________________________________________________________________________________________________________
123
The influence of heating rate could be explored in more detail. In
Chapter 2.5.2 it was discussed that a larger reheating rate can lead to finer
precipitates. Therefore, it might be beneficial to carefully select the heating
rate applied depending on the chemical composition of the steel.
Further, it is suggested to more carefully study the impact toughness in the
area of the DBTT and compare the results with a coarse grained steel.
As a combination of Nb and Mo as microalloying elements has been shown
to be promising in achieving exceptional strengths steels subjected to warm
deformation, it is suggested to upscale and study the mechanical
properties.
It might be interesting to explore further additions of microalloying elements
such as B or Cu. B in conjunction with Mo has been reported to form Mo-B
cluster and hence leading to a decrease in C and N diffusion as discussed
in Chapter 2.3. Cu has been reported to increase corrosion resistance (see
Chapter 2.2) and also forms Cu clusters. These clusters have been
reported to contribute to hardening in precipitation hardening
steels [125,126].
References ________________________________________________________________________________________________________________________________
124
9 References
[1] Worldsteel Association, World Steel in Figures 2019, (2019). https://www.worldsteel.org/en/dam/jcr:96d7a585-e6b2-4d63-b943-4cd9ab621a91/World%2520Steel%2520in%2520Figures%25202019.pdf (accessed August 3, 2019).
[2] Worldsteel Association, Steel Markets, (2019). https://www.worldsteel.org/steel-by-topic/steel-markets.html (accessed August 3, 2019).
[3] Worldsteel Association, Steel in Buildings and Infrastructure, (2019). https://www.worldsteel.org/steel-by-topic/steel-markets/buildings-and-infrastructure.html (accessed August 14, 2019).
[4] R. Song, D. Ponge, D. Raabe, J.G. Speer, D.K. Matlock, Overview of processing, microstructure and mechanical properties of ultrafine grained bcc steels, Mater. Sci. Eng. A. 441 (2006) 1–17. doi:10.1016/j.msea.2006.08.095.
[5] A. Ohmori, S. Torizuka, K. Nagai, Strain-hardening due to Dispersed Cementite for Low Carbon Ultrafine-grained Steels, ISIJ Int. 44 (2004) 1063–1071. doi:10.2355/isijinternational.44.1063.
[6] Y. Okitsu, N. Takata, N. Tsuji, A new route to fabricate ultrafine-grained structures in carbon steels without severe plastic deformation, Scr. Mater. 60 (2009) 76–79. doi:10.1016/j.scriptamat.2008.09.002.
[7] B. Eghbali, Effect of strain rate on the microstructural development through continuous dynamic recrystallization in a microalloyed steel, Mater. Sci. Eng. A. 527 (2010) 3402–3406. doi:10.1016/j.msea.2010.01.077.
[8] L. Cheng, Y. Chen, Q. Cai, W. Yu, G. Han, E. Dong, X. Li, Precipitation enhanced ultragrain refinement of Ti-Mo microalloyed ferritic steel during warm rolling, Mater. Sci. Eng. A. 698 (2017) 117–125. doi:10.1016/j.msea.2017.04.112.
[9] R. Song, D. Ponge, D. Raabe, Mechanical properties of an ultrafine grained C-Mn steel processed by warm deformation and annealing, Acta Mater. 53 (2005) 4881–4892. doi:10.1016/j.actamat.2005.07.009.
[10] M. Koyama, Z. Zhang, M. Wang, D. Ponge, D. Raabe, K. Tsuzaki, H. Noguchi, C.C. Tasan, Bone-like crack resistance in hierarchical metastable nanolaminate steels, Science (80-. ). 355 (2017) 1055–1057. doi:10.1126/science.aal2766.
[11] Y.M. Wang, T. Voisin, J.T. McKeown, J. Ye, N.P. Calta, Z. Li, Z. Zeng, Y. Zhang, W. Chen, T.T. Roehling, R.T. Ott, M.K. Santala, P.J. Depond, M.J. Matthews, A. V. Hamza, T. Zhu, Additively manufactured hierarchical stainless steels with high strength and ductility, Nat. Mater. 17 (2018) 63–70. doi:10.1038/NMAT5021.
[12] R. Song, D. Ponge, D. Raabe, Improvement of the work hardening rate of ultrafine grained steels through second phase particles, Scr. Mater. 52 (2005) 1075–1080. doi:10.1016/j.scriptamat.2005.02.016.
[13] A.J. DeArdo, M. Hua, K. Cho, C.I. Garcia, On the strength of microalloyed steels - An interpretive review, Mater. Sci. Technol. 25 (2009) 1074–1082.
References ________________________________________________________________________________________________________________________________
125
doi:10.1179/174328409X455233. [14] T.N. Baker, Microalloyed Steels, Ironmak. Steelmak. 43 (2016) 264–307.
doi:10.1179/1743281215Y.0000000063. [15] J. Takahashi, K. Kawakami, J.I. Hamada, K. Kimura, Direct observation of
niobium segregation to dislocations in steel, Acta Mater. 107 (2016) 415–422. doi:10.1016/j.actamat.2016.01.070.
[16] S. Vervynckt, K. Verbeken, B. Lopez, J.J. Jonas, Modern HSLA steels and role of non-recrystallisation temperature, Int. Mater. Rev. 57 (2012) 187–207. doi:10.1179/1743280411Y.0000000013.
[17] M.G. Akben, B. Bacroix, J.J. Jonas, Effect of Vanadium and Molybdenum Addition on High Temperature Recovery, Recrystallization and Precipitation Behavior of Niobium-Based Microalloyed Steels, 31 (1983) 161–174.
[18] H. Mohrbacher, Principal effects of Mo in HSLA steels and cross effects with microalloying elements, in: Int. Semin. Appl. Mo Steels, Beijing, China, 2010.
[19] T. Jia, M. Li, X. Pei, Z. Wang, On the Spheroidizing Annealing Behavior in Cr/Nb Microalloyed Medium Carbon Steels, Steel Res. Int. 1800353 (2018) 1–11. doi:10.1002/srin.201800353.
[20] A. Kostryzhev, N. Singh, L. Chen, C. Killmore, E. Pereloma, Comparative Effect of Mo and Cr on Microstructure and Mechanical Properties in NbV-Microalloyed Bainitic Steels, Metals (Basel). 8 (2018) 134. doi:10.3390/met8020134.
[21] W.B. Morrison, Microalloy steels - the beginning, Mater. Sci. Technol. 25 (2009) 1066–1073. doi:10.1179/174328409x453299.
[22] J. Takahashi, K. Kawakami, J.I. Hamada, K. Kimura, Direct observation of niobium segregation to dislocations in steel, Acta Mater. 107 (2016) 415–422. doi:10.1016/j.actamat.2016.01.070.
[23] M.G. Akben, B. Bacroix, J.J. Jonas, Effect of Vanadium and Molybdenum Addition on High Temperature Recovery, Recrystallization and Precipitation Behavior of Niobium-Based Microalloyed Steels, Acta Metall. 31 (1983) 161–174. https://ac.els-cdn.com/0001616083900767/1-s2.0-0001616083900767-main.pdf?_tid=44db01b4-9d14-4b4c-ad2c-677592dbe09b&acdnat=1544116170_fd17d67963e0acf8c1a766cc01d051cd.
[24] W.B. Lee, S.G. Hong, C.G. Park, S.H. Park, Carbide precipitation and high-temperature strength of hot-rolled high-strength, low-alloy steels containing Nb and Mo, Metall. Mater. Trans. A Phys. Metall. Mater. Sci. 33 (2002) 1689–1698. doi:10.1007/s11661-002-0178-2.
[25] R. Uemori, R. Chijiiwa, H. Tamehiro, H. Morikawa, AP-FIM study on the effect of Mo addition on microstructure in Ti-Nb steel, Appl. Surf. Sci. 76–77 (1994) 255–260. doi:10.1016/0169-4332(94)90351-4.
[26] J. Cao, Q. Yong, Q. Liu, X. Sun, Precipitation of MC phase and precipitation strengthening in hot rolled Nb-Mo and Nb-Ti steels, J. Mater. Sci. 42 (2007) 10080–10084. doi:10.1007/s10853-007-2000-4.
[27] C.M. Enloe, K.O. Findley, C.M. Parish, M.K. Miller, B.C. De Cooman, J.G. Speer, Compositional evolution of microalloy carbonitrides in a Mo-bearing microalloyed steel, Scr. Mater. 68 (2013) 55–58. doi:10.1016/j.scriptamat.2012.09.027.
[28] J. Lu, O. Omotoso, J.B. Wiskel, D.G. Ivey, H. Henein, Strengthening
References ________________________________________________________________________________________________________________________________
126
mechanisms and their relative contributions to the yield strength of microalloyed steels, Metall. Mater. Trans. A Phys. Metall. Mater. Sci. 43 (2012) 3043–3061. doi:10.1007/s11661-012-1135-3.
[29] J.H. Jang, Y.-U. Heo, C.-H. Lee, H.K.D.H. Bhadeshia, D.-W. Suh, Interphase precipitation in Ti–Nb and Ti–Nb–Mo bearing steel, Mater. Sci. Technol. 29 (2013) 309–313. doi:10.1179/1743284712Y.0000000131.
[30] S. Mukherjee, I. Timokhina, C. Zhu, S.P. Ringer, P.D. Hodgson, Clustering and precipitation processes in a ferritic titanium-molybdenum microalloyed steel, J. Alloys Compd. 690 (2017) 621–632. doi:10.1016/j.jallcom.2016.08.146.
[31] D.B. Park, M.Y. Huh, J.H. Shim, J.Y. Suh, K.H. Lee, W.S. Jung, Strengthening mechanism of hot rolled Ti and Nb microalloyed HSLA steels containing Mo and W with various coiling temperature, Mater. Sci. Eng. A. 560 (2013) 528–534. doi:10.1016/j.msea.2012.09.098.
[32] T. Hara, H. Asahi, R. Uemori, H. Tamehiro, Role of Combined Addition of Niobium and Boron and of Molybdenum and Boron on Hardnenability in Low Carbon Steels, ISIJ Int. 44 (2008) 1431–1440. doi:10.2355/isijinternational.44.1431.
[33] M.A. Razzak, Heat treatment and effects of Cr and Ni in low alloy steel, Bull. Mater. Sci. 34 (2011) 1439–1445. doi:10.1007/s12034-011-0340-9.
[34] E. V Pereloma, V. Bata, R.I. Scott, R.M. Smith, Effect of Cr on Strain Ageing Behaviour of Low Carbon Steel, (2007) 4214–4219. doi:10.4028/www.scientific.net/MSF.539-543.4214.
[35] I.B. Timokhina, P.D. Hodgson, S.P. Ringer, R.K. Zheng, E. V. Pereloma, Precipitate characterisation of an advanced high-strength low-alloy (HSLA) steel using atom probe tomography, Scr. Mater. 56 (2007) 601–604. doi:10.1016/j.scriptamat.2006.12.018.
[36] S.P. Tsai, T.C. Su, J.R. Yang, C.Y. Chen, Y.T. Wang, C.Y. Huang, Effect of Cr and Al additions on the development of interphase-precipitated carbides strengthened dual-phase Ti-bearing steels, Mater. Des. 119 (2017) 319–325. doi:10.1016/j.matdes.2017.01.071.
[37] E.O. Hall, The Deformation and Ageing of Mild Steel: III Discussion of Results, Proc. Phys. Soc. Sect. B. 64 (1951) 747–753. doi:10.1088/0370-1301/64/9/303.
[38] L.. Teoh, Thermo-mechanical processing and microstructure of microalloyed steel bar and wire rod products, J. Mater. Process. Technol. 48 (1995) 475–481.
[39] N. Isasti, D. Jorge-Badiola, M.L. Taheri, P. Uranga, Microstructural and precipitation characterization in Nb-Mo microalloyed steels: Estimation of the contributions to the strength, Met. Mater. Int. 20 (2014) 807–817. doi:10.1007/s12540-014-5002-1.
[40] Y.W. Kim, S.W. Song, S.J. Seo, S.G. Hong, C.S. Lee, Development of Ti and Mo micro-alloyed hot-rolled high strength sheet steel by controlling thermomechanical controlled processing schedule, Mater. Sci. Eng. A. 565 (2013) 430–438. doi:10.1016/j.msea.2012.12.055.
[41] Y.W. Kim, J.H. Kim, S.G. Hong, C.S. Lee, Effects of rolling temperature on the microstructure and mechanical properties of Ti-Mo microalloyed hot-rolled high strength steel, Mater. Sci. Eng. A. 605 (2014) 244–252. doi:10.1016/j.msea.2014.03.054.
[42] S. Ghosh, S. Mula, Thermomechanical processing of low carbon Nb-Ti
References ________________________________________________________________________________________________________________________________
127
stabilized microalloyed steel: Microstructure and mechanical properties, Mater. Sci. Eng. A. 646 (2015) 218–233. doi:10.1016/j.msea.2015.08.072.
[43] B.Q. Han, S. Yue, Processing of ultrafine ferrite steels, J. Mater. Process. Technol. 136 (2003) 100–104. doi:10.1016/S0924-0136(02)01014-2.
[44] E. Astafurova, G. Maier, E. Melnikov, E. Naydenkin, A. Smirnov, V. Bataev, P. Odessky, S. Dobatkin, H.J. Maier, The Influence of the Thermomechanical Processing Regime on the Structural Evolution of Mo-Nb-Ti-V Microalloyed Steel Subjected to High-Pressure Torsion, Metall. Mater. Trans. A Phys. Metall. Mater. Sci. 48 (2017) 3400–3409. doi:10.1007/s11661-017-4085-y.
[45] Y. Kimura, T. Inoue, F. Yin, O. Sitdikov, K. Tsuzaki, Toughening of a 1500 MPa class steel through formation of an ultrafine fibrous grain structure, Scr. Mater. 57 (2007) 465–468. doi:10.1016/j.scriptamat.2007.05.039.
[46] Y. Kimura, T. Inoue, F. Yin, K. Tsuzaki, Inverse Temperature Dependence of Toughness in an Ultrafine Grain-Structure Steel, Science (80-. ). 320 (2008) 1057–1061. doi:10.1126.
[47] U.H. Lee, N. Kamikawa, G. Miyamoto, T. Furuhara, Continuous Dynamic Recrystallization during Warm Deformation of Tempered Lath Martensite in a Medium Carbon Steel, Key Eng. Mater. 508 (2012) 124–127. doi:10.4028/www.scientific.net/KEM.508.124.
[48] R. Song, D. Ponge, D. Raabe, R. Kaspar, Microstructure and crystallographic texture of an ultrafine grained C-Mn steel and their evolution during warm deformation and annealing, Acta Mater. 53 (2005) 845–858. doi:10.1016/j.actamat.2004.10.051.
[49] M. Calcagnotto, Y. Adachi, D. Ponge, D. Raabe, Deformation and fracture mechanisms in fine- and ultrafine-grained ferrite/martensite dual-phase steels and the effect of aging, Acta Mater. 59 (2011) 658–670. doi:10.1016/j.actamat.2010.10.002.
[50] L. Qun, J. Tianfu, G. Yuwei, L. Hongbiao, Investigation on the preparation of the ultrafine grained low-carbon steel by warm deformation, Phase Transitions. 85 (2012) 619–629. doi:10.1080/01411594.2011.651796.
[51] H.F. Lan, W.J. Liu, X.H. Liu, Ultrafine Ferrite Grains Produced by Tempering Cold-rolled Martensite in Low Carbon and Microalloyed Steels, ISIJ Int. 47 (2007) 1652–1657. doi:10.2355/isijinternational.47.1652.
[52] S. Malekjani, I.B. Timokhina, I. Sabirov, P.D. Hodgson, Deformation Behaviour of Ultrafine Grained Steel Produced by Cold Rolling of Martensite, Can. Metall. Q. 48 (2009) 229–235. doi:10.1179/000844309794239017.
[53] Y. Mazaheri, A. Kermanpur, A. Najafizadeh, N. Saeidi, Development of a New Ultrafine/Nano Ferrite-Carbide Microstructure by Thermomechanical Processing, Acta Metall. Sin. (English Lett. 28 (2015) 249–253. doi:10.1007/s40195-014-0191-7.
[54] M. Abbasi, A. Kermanpur, A. Najafizadeh, S. Saeedipour, Y. Mazaheri, The Effect of Niobium on the Formation of Nanostructured Low Carbon Steel Using Martensite Treatment, Int. J. ISSI. 9 (2012) 6–10.
[55] F. Foroozmehr, A. Najafizadeh, A. Shafyei, Effects of carbon content on the formation of nano/ultrafine grained low-carbon steel treated by martensite process, Mater. Sci. Eng. A. 528 (2011) 5754–5758. doi:10.1016/j.msea.2011.04.055.
[56] E. Ghassemali, A. Kermanpur, A. Najafizadeh, Microstructural evolution in
References ________________________________________________________________________________________________________________________________
128
a low carbon steel during cold rolling and subsequent annealing, J. Nanosci. Nanotechnol. 10 (2010) 6177–6181. doi:10.1166/jnn.2010.2578.
[57] H. Azizi-Alizamini, M. Militzer, W.J. Poole, A novel technique for developing bimodal grain size distributions in low carbon steels, Scr. Mater. 57 (2007) 1065–1068. doi:10.1016/j.scriptamat.2007.08.035.
[58] S.M. Hosseini, A. Najafizadeh, A. Kermanpur, Producing the nano/ultrafine grained low carbon steel by martensite process using plane strain compression, J. Mater. Process. Technol. 211 (2011) 230–236. doi:10.1016/j.jmatprotec.2010.09.014.
[59] J. Tian, G. Xu, W. Liang, Q. Yuan, Effect of Annealing on the Microstructure and Mechanical Properties of a Low-Carbon Steel with Ultrafine Grains, Metallogr. Microstruct. Anal. 6 (2017) 233–239. doi:10.1007/s13632-017-0350-0.
[60] Q. Chao, P.D. Hodgson, H. Beladi, Microstructure evolution of martensitic Ti-6Al-4V alloy during warm deformation, Mater. Sci. Forum. 783–786 (2014) 679–684. doi:10.4028/www.scientific.net/MSF.783-786.679.
[61] Q. Chao, P.D. Hodgson, H. Beladi, Ultrafine grain formation in a Ti-6Al-4V alloy by thermomechanical processing of a martensitic microstructure, Metall. Mater. Trans. A Phys. Metall. Mater. Sci. 45 (2014) 2659–2671. doi:10.1007/s11661-014-2205-5.
[62] Z.X. Zhang, S.J. Qu, A.H. Feng, J. Shen, D.L. Chen, Hot deformation behavior of Ti-6Al-4V alloy: Effect of initial microstructure, J. Alloys Compd. 718 (2017) 170–181. doi:10.1016/j.jallcom.2017.05.097.
[63] N. Tsuji, R. Ueji, Y. Minamino, Y. Saito, A new and simple process to obtain nano-structured bulk low-carbon steel with superior mechanical property, Scr. Mater. 46 (2002) 305–310. doi:10.1016/S1359-6462(01)01243-X.
[64] R. Ueji, N. Tsuji, Y. Minamino, Y. Koizumi, Ultragrain refinement of plain low carbon steel by cold-rolling and annealing of martensite, Acta Mater. 50 (2002) 4177–4189. doi:10.1016/S1359-6454(02)00260-4.
[65] B. Poorganji, G. Miyamoto, T. Furuhara, Formation of ultrafine grained ferrite by warm deformation of lath martensite in low-alloy steels with different carbon content, Scr. Mater. 59 (2008) 279–281. doi:10.1016/j.scriptamat.2008.03.041.
[66] T. Furuhara, K. Kobayashi, T. Maki, Control of Cementite Precipitation in Lath Martensite by Rapid Heating and Tempering, ISIJ Int. 44 (2004) 1937–1944. doi:10.2355/isijinternational.44.1937.
[67] J.H. Li, P.G. Xu, Y. Tomota, Y. Adachi, Formation of ferrite-cementite ultrafine grained microstructure by warm compression for SM490 martensite steel, Recryst. Grain Growth III, Pts 1 2. 558–559 (2007) 539–544. doi:10.4028/www.scientific.net/MSF.558-559.539.
[68] S. Gourdet, F. Montheillet, A model of continuous dynamic recrystallization, Acta Mater. 51 (2003) 2685–2699. doi:10.1016/S1359-6454(03)00078-8.
[69] J. Gallego, A.R. Rodrigues, L. Montanari, Second Phase Precipitation in Ultrafine-grained Ferrite Steel 2 . Material and Methods 3 . Results and Discussion, Mater. Res. 17 (2014) 527–534.
[70] Y. Kimura, T. Inoue, Influence of warm tempforming on microstructure and mechanical properties in an ultrahigh-strength medium-carbon low-alloy steel, Metall. Mater. Trans. A Phys. Metall. Mater. Sci. 44 (2013) 560–576.
References ________________________________________________________________________________________________________________________________
129
doi:10.1007/s11661-012-1391-2. [71] T. Inoue, F. Yin, Y. Kimura, K. Tsuzaki, S. Ochiai, Delamination effect on
impact properties of ultrafine-grained low-carbon steel processed by warm caliber rolling, Metall. Mater. Trans. A Phys. Metall. Mater. Sci. 41 (2010) 341–355. doi:10.1007/s11661-009-0093-x.
[72] A. Dolzhenko, Z. Yanushkevich, S.A. Nikulin, A. Belyakov, R. Kaibyshev, Impact toughness of an S700MC-type steel: Tempforming vs ausforming, Mater. Sci. Eng. A. 723 (2018) 259–268. doi:10.1016/j.msea.2018.03.044.
[73] T. Inoue, Y. Kimura, S. Ochiai, Shape effect of ultrafine-grained structure on static fracture toughness in low-alloy steel, Sci. Technol. Adv. Mater. 13 (2012). doi:10.1088/1468-6996/13/3/035005.
[74] Y. Kimura, T. Inoue, Y.I.N. Fuxing, K. Tsuzaki, Delamination toughening of ultrafine grain structure steels processed through tempforming at elevated temperatures, ISIJ Int. 50 (2010) 152–161. doi:10.2355/isijinternational.50.152.
[75] X. Min, Y. Kimura, T. Kimura, K. Tsuzaki, Delamination toughening assisted by phosphorus in medium-carbon low-alloy steels with ultrafine elongated grain structures, Mater. Sci. Eng. A. 649 (2016) 135–145. doi:10.1016/j.msea.2015.09.102.
[76] J. Svoboda, F.D. Fischer, P. Fratzl, E. Kozeschnik, Modelling of kinetics in multi-component multi-phase systems with spherical precipitates I: Theory, Mater. Sci. Eng. A. 385 (2004) 166–174. doi:10.1016/j.msea.2004.06.018.
[77] E. Kozeschnik, J. Svoboda, P. Fratzl, F.D. Fischer, Modelling of kinetics in multi-component multi-phase systems with spherical precipitates II: Numerical solution and application, Mater. Sci. Eng. A. 385 (2004) 157–165. doi:10.1016/j.msea.2004.06.018.
[78] H. Buken, P. Sherstnev, E. Kozeschnik, A state parameter-based model for static recrystallization interacting with precipitation, Model. Simul. Mater. Sci. Eng. 24 (2016) 35006. doi:10.1088/0965-0393/24/3/035006.
[79] H. Buken, E. Kozeschnik, A Model for Static Recrystallization with Simultaneous Precipitation and Solute Drag, Metall. Mater. Trans. A Phys. Metall. Mater. Sci. 48 (2017) 2812–2818. doi:10.1007/s11661-016-3524-5.
[80] E. Kozeschnik, A Scheil – Gulliver Model with Back- Diffusion Applied to the Microsegregation of Chromium in Fe-Cr-C Alloys, Metall. Mater. Trans. A. 31A (2000) 1682–1684.
[81] E. Kozeschnik, W. Rindler, B. Buchmayr, Scheil – Gulliver simulation with partial redistribution of fast diffusers and simultaneous solid-solid phase transformations, Int. J. Mater. Res. 98 (2007) 826–831. doi:10.3139/146.101535.
[82] J. Kreyca, E. Kozeschnik, State parameter-based constitutive modelling of stress strain curves in Al-Mg solid solutions, Int. J. Plast. 103 (2018) 67–80. doi:10.1016/j.ijplas.2018.01.001.
[83] B. Gault, M.P. Moody, J.M. Cairney, S.P. Ringer, Atom Probe Microscopy, Springer New York, New York, NY, 2012. doi:10.1007/978-1-4614-3436-8.
[84] S.A. Aksenov, Y.A. Puzino, I.P. Mazur, Inverse Analysis of Plane Strain and Uniaxial Compression Tests Performed on Gleeble, in: Metal, 2015: p. 6.
[85] Y. Xu, J. Zhang, Y. Bai, M.A. Meyers, Shear localization in dynamic deformation: Microstructural evolution, Metall. Mater. Trans. A Phys. Metall. Mater. Sci. 39 A (2008) 811–843. doi:10.1007/s11661-007-9431-z.
References ________________________________________________________________________________________________________________________________
130
[86] M. Charleux, W.J. Poole, M. Militzer, A. Deschamps, Precipitation HSLA-Nb / Ti Behavior Its Effect on Strengthening of an, Metall. Mater. Trans. A. 32 (2001) 1635–1647.
[87] J. Li, P. Xu, Y. Tomota, Y. Adachi, Dynamic Recrystallization Behavior in a Low-carbon Martensite Steel by Warm Compression, ISIJ Int. 48 (2008) 1008–1013. doi:10.2355/isijinternational.48.1008.
[88] R.D.K. Misra, H. Nathani, J.E. Hartmann, F. Siciliano, Microstructural evolution in a new 770 MPa hot rolled Nb-Ti microalloyed steel, Mater. Sci. Eng. A. 394 (2005) 339–352. doi:10.1016/j.msea.2004.11.041.
[89] ISO, ISO 18265 Metallic materials - Conversion of hardness values, 2003. [90] C. Ledermueller, H. Li, S. Primig, Engineering Hierarchical Microstructures
via Advanced Thermo-Mechanical Processing of a Modern HSLA Steel, Metall. Mater. Trans. A. 49 (2018) 6337–6350. doi:10.1007/s11661-018-4934-3.
[91] R.. Doherty, D.A. Hughes, F.J. Humphreys, J.J. Jonas, D. Juul Jensen, M.E. Kassner, W.E. King, T.R. McNelley, H.J. McQueen, A.D. Rollett, Current issues in recrystallization a review, Mater. Sci. Eng. A. 238 (1997) 219–274.
[92] R.A. Petković, M.J. Luton, J.J. Jonas, Recovery and recrystallization of carbon steel between intervals of hot working, Can. Metall. Q. 14 (1975) 137–145. doi:10.1179/000844375795050201.
[93] R.A. Grange, C.R. Hribal, L.F. Porter, Hardness of Tempered Martensite in Carbon and Low Alloy Steels, Metall. Trans. A. 8A (1977) 1775–1785. doi:10.1007/BF02646882.
[94] J.M. Rosenberg, H.R. Piehler, Calculation of the taylor factor and lattice rotations for bcc metals deforming by pencil glide, Metall. Trans. 2 (1971) 257–259. doi:10.1007/BF02662666.
[95] S.H.M. Anijdan, M. Hoseini, S. Yue, Texture development in cool deformed microalloyed steels, Mater. Sci. Eng. A. 528 (2011) 6788–6793. doi:10.1016/j.msea.2011.05.048.
[96] F.T. Han, Z.C. Wang, C.N. Jing, X.M. Liu, J. Su, S.Y. Zhang, Microstructure and Microtexture Evolution during Batch Annealing of Warm-Rolled Ti-IF Steel Sheets, Appl. Mech. Mater. 331 (2013) 443–447. doi:10.4028/www.scientific.net/AMM.331.443.
[97] M.R. Toroghinejad, A.O. Humphreys, D. Liu, F. Ashrafizadeh, A. Najafizadeh, J.J. Jonas, Effect of rolling temperature on the deformation and recrystallization textures of warm-rolled steels, Metall. Mater. Trans. A Phys. Metall. Mater. Sci. 34 A (2003) 1163–1174. doi:10.1007/s11661-003-0136-7.
[98] M.R. Barnett, J.J. Jonas, Influence of ferrite rolling temperature on grain size and texture in annealed low C and IF steel, IS. 37 (1997) 706–714.
[99] A.O. Humphreys, D. Liu, M.R. Toroghinejad, J.J. Jonas, Effect of Chromium and Boron Additions on the Warm Rolling Behavior of Low Carbon Steels, ISIJ Int. 42 (2002) S52–S56. doi:10.1179/cmq.2006.45.4.451.
[100] Z. Jia, R.D.K. Misra, R. O’Malley, S.J. Jansto, Fine-scale precipitation and mechanical properties of thin slab processed titanium-niobium bearing high strength steels, Mater. Sci. Eng. A. 528 (2011) 7077–7083. doi:10.1016/j.msea.2011.05.073.
[101] M. Kapoor, R. O’Malley, G.B. Thompson, Atom Probe Tomography Study
References ________________________________________________________________________________________________________________________________
131
of Multi-microalloyed Carbide and Carbo-Nitride Precipitates and the Precipitation Sequence in Nb-Ti HSLA Steels, Metall. Mater. Trans. A Phys. Metall. Mater. Sci. 47 (2016) 1984–1995. doi:10.1007/s11661-016-3398-6.
[102] D.P. Clausing, Effect of plastic strain state on ductility and toughness, Int. J. Fract. Mech. 6 (1970) 71–85. doi:10.1007/BF00183662.
[103] A. V. Sergueeva, J. Zhou, B.E. Meacham, D.J. Branagan, Gage length and sample size effect on measured properties during tensile testing, Mater. Sci. Eng. A. 526 (2009) 79–83. doi:10.1016/j.msea.2009.07.046.
[104] Y.H. Zhao, Y.Z. Guo, Q. Wei, T.D. Topping, A.M. Dangelewicz, Y.T. Zhu, T.G. Langdon, E.J. Lavernia, Influence of specimen dimensions and strain measurement methods on tensile stress-strain curves, Mater. Sci. Eng. A. 525 (2009) 68–77. doi:10.1016/j.msea.2009.06.031.
[105] S. Ghosh, A.K. Singh, S. Mula, P. Chanda, V. V. Mahashabde, T.K. Roy, Mechanical properties, formability and corrosion resistance of thermomechanically controlled processed Ti-Nb stabilized IF steel, Mater. Sci. Eng. A. 684 (2017) 22–36. doi:10.1016/j.msea.2016.12.034.
[106] N. Tsuji, S. Okuno, Y. Koizumi, Y. Minamino, Toughness of Ultrafine Grained Ferritic Steels Fabricated by ARB and Annealing Process, Mater. Trans. 45 (2005) 2272–2281. doi:10.2320/matertrans.45.2272.
[107] C. Ledermueller, E. Kozeschnik, R.F. Webster, S. Primig, Advanced Thermo-mechanical Process for Homogenous Hierarchical Microstructures in HSLA Steels, Metall. Mater. Trans. A Phys. Metall. Mater. Sci. 50 (2019) 5800–5815. doi:10.1007/s11661-019-05486-5.
[108] T. Sakai, A. Belyakov, R. Kaibyshev, H. Miura, J.J. Jonas, Dynamic and post-dynamic recrystallization under hot, cold and severe plastic deformation conditions, Prog. Mater. Sci. 60 (2014) 130–207. doi:10.1016/j.pmatsci.2013.09.002.
[109] I.L. Dillamore, H. Katoh, The Mechanisms of Recrystallization in Cubic Metals with Particular Reference to Their Orientation-Dependence, Met. Sci. 8 (1974) 73–83. doi:10.1179/msc.1974.8.1.73.
[110] L. Li, W. Yang, Z. Sun, Dynamic recrystallization of ferrite with particle-stimulated nucleation in a low-carbon steel, Metall. Mater. Trans. A Phys. Metall. Mater. Sci. 44 (2013) 2060–2069. doi:10.1007/s11661-012-1572-z.
[111] L. Cheng, Q. Cai, J. Lv, W. Yu, H. Miura, Superdense microbands strengthening of textured low alloy ferritic steel, J. Alloys Compd. 746 (2018) 482–489. doi:10.1016/j.jallcom.2018.02.297.
[112] F.J. Humphreys, M. Hatherly, Recrystallization and related annealing phenomena, Elsevier Ltd, 2004.
[113] A. Das, H.W. Viehrig, F. Bergner, C. Heintze, E. Altstadt, J. Hoffmann, Effect of microstructural anisotropy on fracture toughness of hot rolled 13Cr ODS steel – The role of primary and secondary cracking, J. Nucl. Mater. 491 (2017) 83–93. doi:10.1016/j.jnucmat.2017.04.059.
[114] Y. Kimura, T. Inoue, Influence of Carbon Content on Toughening in Ultrafine Elongated Grain Structure Steels, ISIJ Int. 55 (2015) 1135–1144. doi:10.2355/tetsutohagane.100.1104.
[115] H.C. Wang, C. Somsen, Y.J. Li, S.G. Fries, E. Detemple, G. Eggeler, Effect of Nb on improving the impact toughness of Mo-containing low-alloyed steels, J. Mater. Sci. 54 (2019) 7307–7321. doi:10.1007/s10853-019-03374-2.
References ________________________________________________________________________________________________________________________________
132
[116] S.-H. Song, Z.-X. Yuan, D.-D. Shen, J. Liu, L.-Q. Weng, Grain boundary segregation of phosphorus and molybdenum in a Cr – Mo low alloy steel, Mater. Sci. Technol. 20 (2004) 117–120. doi:10.1179/026708304225010307.
[117] C.Y. Chen, C.C. Chen, J.R. Yang, Microstructure characterization of nanometer carbides heterogeneous precipitation in Ti-Nb and Ti-Nb-Mo steel, Mater. Charact. 88 (2014) 69–79. doi:10.1016/j.matchar.2013.11.016.
[118] J.G. Speer, S. Mehta, S.S. Hansen, Composition of Vanadium Carbonitride Precipitates in Microallyed Austenite, Scr. Metall. 18 (1984) 14-211241–1244.
[119] M. Nöhrer, W. Mayer, S. Primig, S. Zamberger, E. Kozeschnik, H. Leitner, Influence of deformation on the precipitation behavior of Nb(CN) in austenite and ferrite, Metall. Mater. Trans. A Phys. Metall. Mater. Sci. 45 (2014) 4210–4219. doi:10.1007/s11661-014-2373-3.
[120] J.H. Jang, C.H. Lee, Y.U. Heo, D.W. Suh, Stability of (Ti, M)C (M = Nb, V, Mo and W) carbide in steels using first-principles calculations, Acta Mater. 60 (2012) 208–217. doi:10.1016/j.actamat.2011.09.051.
[121] Y. Zhou, Z. Wang, J. Zhao, Z. Leng, Z. Niu, C. Guo, Z. Zhang, Z. Yang, C. Yao, F. Jiang, Energy for the interface system of (Nb, Mo)C/γ-Fe, Appl. Phys. A Mater. Sci. Process. 123 (2017) 1–10. doi:10.1007/s00339-017-1120-1.
[122] S. Dhara, R.K.W. Marceau, K. Wood, T. Dorin, I.B. Timokhina, P.D. Hodgson, Precipitation and clustering in a Ti-Mo steel investigated using atom probe tomography and small-angle neutron scattering, Mater. Sci. Eng. A. 718 (2018) 74–86. doi:10.1016/j.msea.2018.01.070.
[123] E. V Pereloma, I.B. Timokhina, J.J. Jonas, M.K. Miller, Microstructural characterization of warm rolled Cr-containing low carbon steel, Scr. Mater. 56 (2007) 521–524. doi:10.1016/j.scriptamat.2006.11.027.
[124] K.Y. Xie, T. Zheng, J.M. Cairney, H. Kaul, J.G. Williams, F.J. Barbaro, C.R. Killmore, S.P. Ringer, Strengthening from Nb-rich clusters in a Nb-microalloyed steel, Scr. Mater. 66 (2012) 710–713. doi:10.1016/j.scriptamat.2012.01.029.
[125] S. Primig, G. Stechauner, E. Kozeschnik, Early Stages of Cu Precipitation in 15–5 PH Maraging Steel Revisited − Part I: Experimental Analysis, Steel Res. Int. 88 (2017) 1–10. doi:10.1002/srin.201600084.
[126] Z. Wang, X. Fang, H. Li, W. Liu, Atom Probe Tomographic Characterization of Nanoscale Cu-Rich Precipitates in 17-4 Precipitate Hardened Stainless Steel Tempered at Different Temperatures, Microsc. Microanal. 23 (2017) 340–349. doi:10.1017/S1431927616012629.

Appendix A ________________________________________________________________________________________________________________________________
133
10 Appendix A: MatCalc script
$$ date: 2018-07-16 Parameter study of simplified chemistry (Fe, Mn, C, N, Nb, Ti) only cementite and NbTiCN simulation of precipitates that occur during casting then stop at 950 for solution treatment and WQ Simulation of thermo-mechanical processing (heating to 600C with heating rate of 10/s, three hit deformation with strain rate of 10, and a strain of 0.2 each, aging for 60min) Script written by C Ledermueller under guidance of E. Kozeschnik $$ $ close any existing workspace without asking for save ... close-workspace f $ make sure we are in the correct working directory! set-working-directory . $ let's rock ... new-workspace open-thermodynamic-database mc_fe.tdb select-elements fe c Mn nb ti n select-phases fcc bcc_a2 cementite read-thermodynamic-database read-mobility-database mc_fe.ddb enter-composition weight-percent c=0.047 mn=1.92 nb=0.045 ti=0.016 n=0.0054 change-phase-status FCC_A1#01 major-constituents=:NB:C: create-new-phase FCC_A1 equilibrium change-phase-status FCC_A1#02 major-constituents=:TI:N: set-automatic-startvalues set-temperature-celsius 1400 calculate-equilibrium create-tm-treatment tmt $ create a new heat treatment append-tmt-segment tmt edit-tmt-segment tmt . precipitation-domain=austenite $ set precipitation domain to austenite
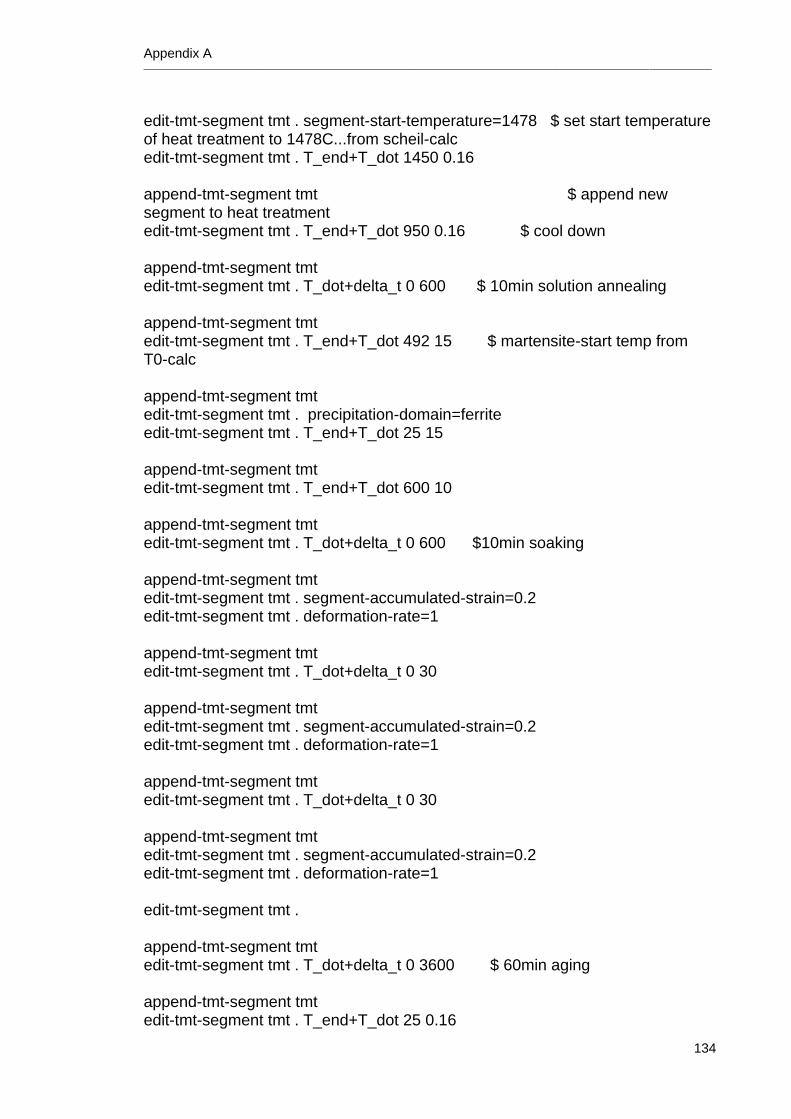
Appendix A ________________________________________________________________________________________________________________________________
134
edit-tmt-segment tmt . segment-start-temperature=1478 $ set start temperature of heat treatment to 1478C...from scheil-calc edit-tmt-segment tmt . T_end+T_dot 1450 0.16 append-tmt-segment tmt $ append new segment to heat treatment edit-tmt-segment tmt . T_end+T_dot 950 0.16 $ cool down append-tmt-segment tmt edit-tmt-segment tmt . T_dot+delta_t 0 600 $ 10min solution annealing append-tmt-segment tmt edit-tmt-segment tmt . T_end+T_dot 492 15 $ martensite-start temp from T0-calc append-tmt-segment tmt edit-tmt-segment tmt . precipitation-domain=ferrite edit-tmt-segment tmt . T_end+T_dot 25 15 append-tmt-segment tmt edit-tmt-segment tmt . T_end+T_dot 600 10 append-tmt-segment tmt edit-tmt-segment tmt . T_dot+delta_t 0 600 $10min soaking append-tmt-segment tmt edit-tmt-segment tmt . segment-accumulated-strain=0.2 edit-tmt-segment tmt . deformation-rate=1 append-tmt-segment tmt edit-tmt-segment tmt . T_dot+delta_t 0 30 append-tmt-segment tmt edit-tmt-segment tmt . segment-accumulated-strain=0.2 edit-tmt-segment tmt . deformation-rate=1 append-tmt-segment tmt edit-tmt-segment tmt . T_dot+delta_t 0 30 append-tmt-segment tmt edit-tmt-segment tmt . segment-accumulated-strain=0.2 edit-tmt-segment tmt . deformation-rate=1 edit-tmt-segment tmt . append-tmt-segment tmt edit-tmt-segment tmt . T_dot+delta_t 0 3600 $ 60min aging append-tmt-segment tmt edit-tmt-segment tmt . T_end+T_dot 25 0.16
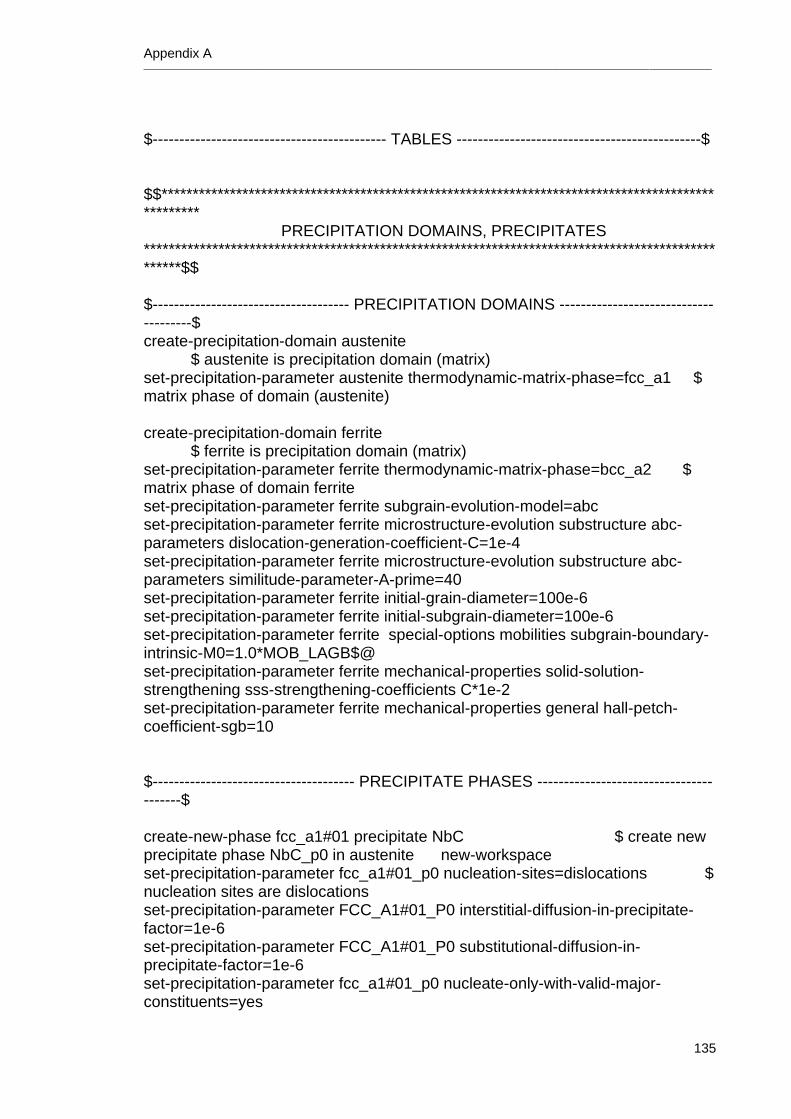
Appendix A ________________________________________________________________________________________________________________________________
135
$-------------------------------------------- TABLES ----------------------------------------------$ $$************************************************************************************************** PRECIPITATION DOMAINS, PRECIPITATES **************************************************************************************************$$ $------------------------------------- PRECIPITATION DOMAINS --------------------------------------$ create-precipitation-domain austenite $ austenite is precipitation domain (matrix) set-precipitation-parameter austenite thermodynamic-matrix-phase=fcc_a1 $ matrix phase of domain (austenite) create-precipitation-domain ferrite $ ferrite is precipitation domain (matrix) set-precipitation-parameter ferrite thermodynamic-matrix-phase=bcc_a2 $ matrix phase of domain ferrite set-precipitation-parameter ferrite subgrain-evolution-model=abc set-precipitation-parameter ferrite microstructure-evolution substructure abc-parameters dislocation-generation-coefficient-C=1e-4 set-precipitation-parameter ferrite microstructure-evolution substructure abc-parameters similitude-parameter-A-prime=40 set-precipitation-parameter ferrite initial-grain-diameter=100e-6 set-precipitation-parameter ferrite initial-subgrain-diameter=100e-6 set-precipitation-parameter ferrite special-options mobilities subgrain-boundary-intrinsic-M0=1.0*MOB_LAGB$@ set-precipitation-parameter ferrite mechanical-properties solid-solution-strengthening sss-strengthening-coefficients C*1e-2 set-precipitation-parameter ferrite mechanical-properties general hall-petch-coefficient-sgb=10 $-------------------------------------- PRECIPITATE PHASES ----------------------------------------$ create-new-phase fcc_a1#01 precipitate NbC $ create new precipitate phase NbC_p0 in austenite new-workspace set-precipitation-parameter fcc_a1#01_p0 nucleation-sites=dislocations $ nucleation sites are dislocations set-precipitation-parameter FCC_A1#01_P0 interstitial-diffusion-in-precipitate-factor=1e-6 set-precipitation-parameter FCC_A1#01_P0 substitutional-diffusion-in-precipitate-factor=1e-6 set-precipitation-parameter fcc_a1#01_p0 nucleate-only-with-valid-major-constituents=yes
Appendix A ________________________________________________________________________________________________________________________________
136
set-precipitation-parameter FCC_A1#01_P0 nucleation-sites=subgrain-boundaries create-new-phase fcc_a1#02 precipitate TiN(gamma) $ create new precipitate phase TiN_p0 in austenite set-precipitation-parameter fcc_a1#02_p0 nucleation-sites=dislocations $ nucleation sites are dislocations set-precipitation-parameter FCC_A1#02_P0 restrict-nucleation-to-precipitation-domain=austenite create-new-phase fcc_a1#02 precipitate TiN(alpha) $ create new precipitate phase TiN_p0 in austenite set-precipitation-parameter fcc_a1#02_p1 nucleation-sites=dislocations $ nucleation sites are dislocations and subgrain boundaries set-precipitation-parameter FCC_A1#02_P1 interstitial-diffusion-in-precipitate-factor=1e-6 set-precipitation-parameter FCC_A1#02_P1 substitutional-diffusion-in-precipitate-factor=1e-6 set-precipitation-parameter fcc_a1#02_p1 nucleate-only-with-valid-major-constituents=yes set-precipitation-parameter FCC_A1#02_P1 nucleation-sites=subgrain-boundaries set-precipitation-parameter FCC_A1#02_P1 restrict-nucleation-to-precipitation-domain=ferrite create-new-phase cementite precipitate cem $ create new precipitate phase Q_p0 in austenite $set-precipitation-parameter cementite_p0 nucleation-sites=dislocations $ nucleation sites are dislocations set-precipitation-parameter CEMENTITE_P0 nucleation-sites=grain-boundaries $$************************************************************************************************** ********************************* OUTPUT WINDOWS, PLOTS, ETC. ************************************** **************************************************************************************************$$ new-gui-window p1 $ generate new plot: temperature $---------------- Define values for default x-axis (will be used by all plots) -----------------$ set-gui-window-property . default-x-axis-data=stepvalue $ default x-axis variable (time) set-gui-window-property . default-x-axis-for-all-plots=yes $ use default x-axis for all plots: yes set-gui-window-property . default-x-axis-title=time / s $ default x-axis title set-gui-window-property . default-x-axis-factor=1 $ scaling factor is 1 $set-gui-window-property . number-of-plot-columns=2 $ 2 plot columns
Appendix A ________________________________________________________________________________________________________________________________
137
set-plot-option . series new buffer t$c $ add series: temperature set-plot-option . series rename -1 t$c T $ define series legend set-plot-option . y-axis-title=temperature / C $ y-axis title set-plot-option . legend-alignment=none $ no legend create-new-plot xy-plot . $ create new plot: mean radii set-plot-option . use-alias-names-in-legend=yes $ replace variable names by kinetic alias set-plot-option . series new buffer f_prec$* $ add all series: phase fractions of precipitates set-plot-option . y-axis-title=phase fraction $ change y-axis title set-plot-option . y-axis-type=log $ use log scale for y-axis set-plot-option . y-axis-scaling=1e-8.. $ scale the y-axis from 1e-8.. set-plot-option . legend-alignment=bottom $ show legend at the bottom of the figure create-new-plot xy-plot . $ create new plot: mean radii set-plot-option . use-alias-names-in-legend=yes $ replace variable names by kinetic alias set-plot-option . series new buffer r_mean$* $ add all series: mean radii of precipitates set-plot-option . y-axis-title=mean radius / nm $ change y-axis title set-plot-option . y-axis-type=log $ use logarithmic scale for y-axis set-plot-option . y-axis-factor=1e9 $ scaling factor is 1e9 set-plot-option . legend-alignment=bottom $ show legend at the bottom of the figure create-new-plot xy-plot . $ create new plot: number densities set-plot-option . use-alias-names-in-legend=yes $ replace variable names by kinetic alias set-plot-option . series new buffer num_part$* $ add all series: number densities of precipitates set-plot-option . y-axis-title=number density / m<sup>-3</sup> $ change y-axis title set-plot-option . y-axis-type=log $ use logarithmic scale for y-axis set-plot-option . y-axis-scaling=1.. $ scale the y-axis from 1..
Appendix A ________________________________________________________________________________________________________________________________
138
set-plot-option . legend-alignment=bottom $ show legend at the bottom of the figure $~~~~~~~plots for dislocation density, subgrain size and yield strength~~~~~~~~ new-gui-window p1 set-gui-window-property . default-x-axis-data=stepvalue $ default x-axis variable (time) set-gui-window-property . default-x-axis-for-all-plots=yes $ use default x-axis for all plots: yes set-gui-window-property . default-x-axis-title=time / s $ default x-axis title set-gui-window-property . default-x-axis-factor=1 $ scaling factor is 1 set-plot-option . series new buffer t$c $ add series: temperature set-plot-option . series rename -1 t$c T $ define series legend set-plot-option . y-axis-title=temperature / C $ y-axis title set-plot-option . legend-alignment=none $ no legend create-new-plot xy-plot . set-plot-option . use-alias-names-in-legend=yes $ replace variable names by kinetic alias set-plot-option . series new buffer DD_TOT$ferrite $ add all series: total dislocation density set-plot-option . y-axis-title=total dislocation density / m<sup>-2</sup> $ change y-axis title set-plot-option . y-axis-type=log $ use log scale for y-axis set-plot-option . y-axis-scaling=auto $ scale the y-axis automatic set-plot-option . legend-alignment=bottom $ show legend at the bottom of the figure create-new-plot xy-plot . set-plot-option . use-alias-names-in-legend=yes $ replace variable names by kinetic alias set-plot-option . series new buffer SGD$ferrite $ add all series: subgrain diameter set-plot-option . y-axis-title=subgrain diameter / µm $ change y-axis title set-plot-option . y-axis-type=log $ use log scale for y-axis set-plot-option . y-axis-scaling=auto $ scale the y-axis automatic set-plot-option . legend-alignment=bottom $ show legend at the bottom of the figure set-plot-option . y-axis-factor=1e006
Appendix A ________________________________________________________________________________________________________________________________
139
create-new-plot xy-plot . set-plot-option . use-alias-names-in-legend=yes $ replace variable names by kinetic alias set-plot-option . series new buffer TYS_0$ferrite $ add all series: yield strength set-plot-option . series new buffer TSSS$ferrite set-plot-option . series new buffer TDS$ferrite set-plot-option . series new buffer TSGS$ferrite set-plot-option . series new buffer TSIGMA_PREC$ferrite set-plot-option . y-axis-title=yield strength / MPa $ change y-axis title set-plot-option . y-axis-type=lin $ use log scale for y-axis set-plot-option . y-axis-scaling=auto $ scale the y-axis automatic set-plot-option . legend-alignment=bottom $ show legend at the bottom of the figure set-plot-option . y-axis-factor=1e-006 $$************************************************************************************************** ************************************ SIMULATION SETUP ********************************************** **************************************************************************************************$$ set-simulation-parameter end-time=1e24 $ set simulation end time set-simulation-parameter tm-treatment-name=tmt $ T-control from defined heat treatment set-simulation-parameter max-temperature-step=10 set-simulation-parameter starting-conditions=reset-precipitates $ simulation starting conditions: reset $ speed up simulations, modify numerical parameters $set-simulation-parameter max-radius-change-during-growth=1.0 $ maximum radius growth from 0.2 to 1.0 $$************************************************************************************************** ******************************** START PRECIPITATE SIMULATION ************************************** **************************************************************************************************$$ start-precipitate-simulation $$**************************************************************************************************

Appendix A ________________________________________________________________________________________________________________________________
140
******************************* PRECIPITATE SIMULATION FINISHED ************************************ **************************************************************************************************$$
Related Documents