Microstructural Characterization of Refractory Ceramics Author: Ing. J.C. van den Eynden Supervision: Ir. I. ¨ Ozdemir & Prof. Dr. Ir. M.G.D. Geers Internship: March 21, 2005 - May 27, 2005 Report number: MT05.34 Technische Universiteit Eindhoven Department of Mechanical Engineering Division Computational and Experimental Mechanics Section Mechanics of Materials

Welcome message from author
This document is posted to help you gain knowledge. Please leave a comment to let me know what you think about it! Share it to your friends and learn new things together.
Transcript

Microstructural Characterization ofRefractory Ceramics
Author: Ing. J.C. van den EyndenSupervision: Ir. I. Ozdemir & Prof. Dr. Ir. M.G.D. GeersInternship: March 21, 2005 - May 27, 2005Report number: MT05.34
Technische Universiteit EindhovenDepartment of Mechanical Engineering
Division Computational and Experimental MechanicsSection Mechanics of Materials
Contents
1 Introduction 21.1 Microstructural characterization . . . . . . . . . . . . . . . . . . . . . . . . 21.2 Mechanical characterization . . . . . . . . . . . . . . . . . . . . . . . . . . 2
2 Experimental setup 42.1 Microstructural characterization . . . . . . . . . . . . . . . . . . . . . . . . 42.2 Mechanical characterization . . . . . . . . . . . . . . . . . . . . . . . . . . 5
2.2.1 Tensile test . . . . . . . . . . . . . . . . . . . . . . . . . . . . . . . 52.2.2 Three-point bending test . . . . . . . . . . . . . . . . . . . . . . . . 62.2.3 Compression test . . . . . . . . . . . . . . . . . . . . . . . . . . . . 7
3 Results 83.1 Microstructural characterization . . . . . . . . . . . . . . . . . . . . . . . . 8
3.1.1 Grainsize distribution . . . . . . . . . . . . . . . . . . . . . . . . . . 83.1.2 Element analysis . . . . . . . . . . . . . . . . . . . . . . . . . . . . 113.1.3 Crystallographic orientations . . . . . . . . . . . . . . . . . . . . . . 13
3.2 Mechanical characterization . . . . . . . . . . . . . . . . . . . . . . . . . . 143.2.1 Tensile test . . . . . . . . . . . . . . . . . . . . . . . . . . . . . . . 143.2.2 Three-point bending . . . . . . . . . . . . . . . . . . . . . . . . . . 153.2.3 Compression test . . . . . . . . . . . . . . . . . . . . . . . . . . . . 18
4 Conclusion and discussion 194.1 Microstructural characterization . . . . . . . . . . . . . . . . . . . . . . . . 194.2 Mechanical characterization . . . . . . . . . . . . . . . . . . . . . . . . . . 19
Appendix A:Grainsize distribution of pure alumina specimens 21
Appendix B:Grainsize distribution of alumina with additional silica specimens 23
Appendix C:Wet conductive coating 26
1
Chapter 1
Introduction
Refractories are used to build structures subjected to high temperatures, ranging fromsimple to sophisticated, e.g. fireplace brick lining to heat shields for a space shuttle. Herethe interest is on ceramics used as a furnace lining for high temperature materials processingin metal, glass and ceramics manufacturing.
In this multi-partner project (Gouda VV (vuurvast), Corus, TNO, TU/e), the devel-opment of models with a high predictive capacity of the behavior under extreme thermalconditions is the ultimate goal. The knowledge to be gained is planned to be used for thedesign of superior refractory materials.
Computational multi-scale framework will be used and therefore an important stepof the modeling is the microstructural characterization. This is the point to which theinternship will be focused. The tasks planned to be done can be listed as follows:
1.1 Microstructural characterization
The samples of two different refractory ceramics - pure alumina (Al2O3) and alumina withadditional silica - will be investigated for microstructural characterization. This will becarried out at the multi-scale laboratory. The expected outcome is images of microstruc-ture at different scales which can directly be used in computational models along withcharacteristic maps of the grain anisotropy.
1.2 Mechanical characterization
The micro-structurally investigated ceramics will be mechanically characterized with threedifferent tests to determine the homogenized elastic properties.
1. relatively larger samples of the micro-structurally investigated ceramics will be testedwith the micro-loading stage in the multi-scale laboratory, in order to determine thetensile strength [ft].
2

2. a three-point bending test will conducted in the MOK (Materials Research and Char-acterization Laboratory) to determine the fracture energy [Gf ] and the stress intensityfactor [K1]. In order to determine the possible size effects, due to the brittleness ofthe material, the test will be done on three different specimens of varying dimensions.The length over height ratio will be L/H=4 and the thickness will be kept constantfor all three specimens types.
3. a compression test, also conducted in the MOK, will be done in order to determinethe Modulus of Elasticity [E].
3
Chapter 2
Experimental setup
2.1 Microstructural characterization
The microstructural characterization will be carried out in the multi-scale laboratory andconsists of three phases namely:
• determination of the grain size and grain size distribution [2] [3] [5]
• determination of the elements present in the material
• determination of the crystallographic orientations [1] [3] [4]
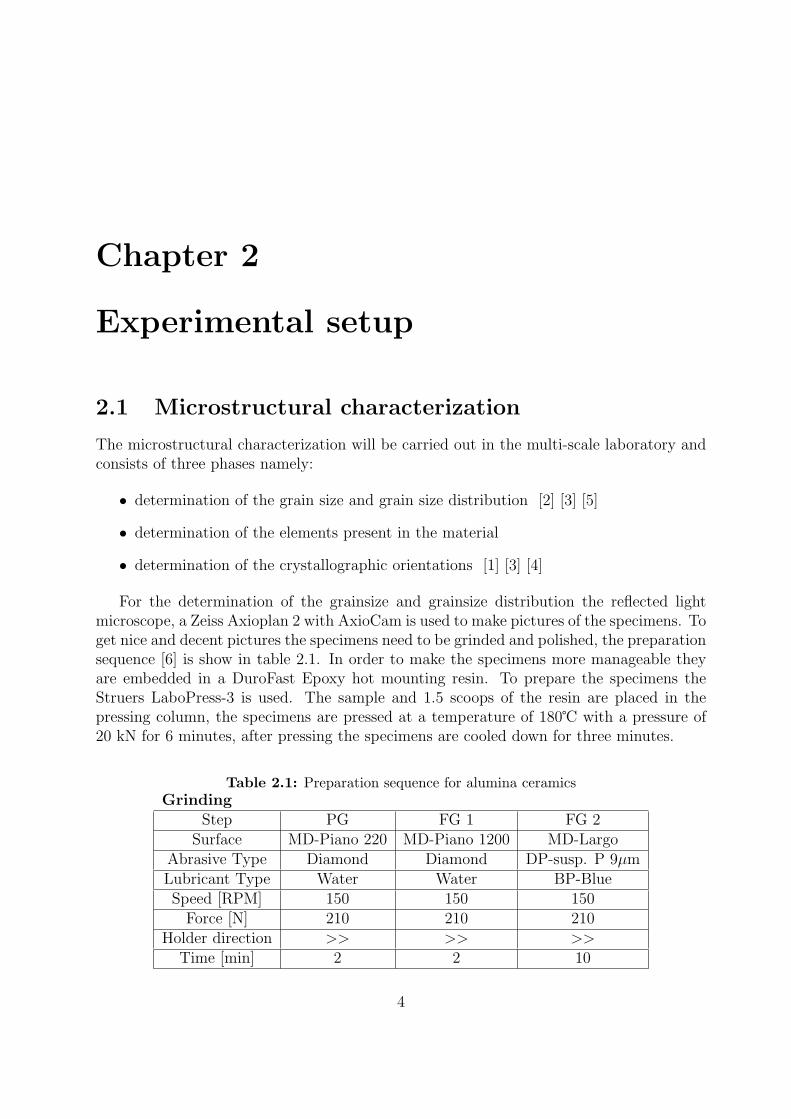
For the determination of the grainsize and grainsize distribution the reflected lightmicroscope, a Zeiss Axioplan 2 with AxioCam is used to make pictures of the specimens. Toget nice and decent pictures the specimens need to be grinded and polished, the preparationsequence [6] is show in table 2.1. In order to make the specimens more manageable theyare embedded in a DuroFast Epoxy hot mounting resin. To prepare the specimens theStruers LaboPress-3 is used. The sample and 1.5 scoops of the resin are placed in thepressing column, the specimens are pressed at a temperature of 180℃ with a pressure of20 kN for 6 minutes, after pressing the specimens are cooled down for three minutes.
Table 2.1: Preparation sequence for alumina ceramicsGrinding
Step PG FG 1 FG 2Surface MD-Piano 220 MD-Piano 1200 MD-Largo
Abrasive Type Diamond Diamond DP-susp. P 9µmLubricant Type Water Water BP-BlueSpeed [RPM] 150 150 150
Force [N] 210 210 210Holder direction >> >> >>
Time [min] 2 2 10
4
PolishingStep DP 1 DP 2 OP
Surface MD-Dac MD-Nap MD-ChemAbrasive Type DP-Susp. P 3µm DP-Susp. P 1µm OP-S, 0.04µmLubricant Type DP-Blue DP-BlueSpeed [RPM] 150 150 150
Force [N] 180 150 150Holder direction >> >> ><
Time [min] 8 2 1
For each material type three samples are prepared, several pictures of each sample aretaken with minimum (2.5x) magnification and will be evaluated in Matlab to determinethe maximum-, minimum- and average grainsize.
The Philips XL 30 ESEM-FEG will be used to determine the elements present in thetwo materials. The same preparation sequence is used to grind and polish the specimens.Ceramics are non-conducting materials, therefore the ESEM has to be in H2O or lowvacuum mode or the samples have to be coated with a conductive layer, preferably carbon,chromium or gold, if one needs to work in high vacuum mode. Both low and high vacuummodes are used, in high vacuum the specimens are coated with a gold layer.
To determine the crystallographic orientations the UHR-SEM (Ultra High Resolution -Scanning Electron Microscope) from FEI Sirion equipped with OIM (Orientation ImagingMicroscopy) Pegasus is used. To get a nice and decent picture the specimens need thesame preparation as the previous ones. This microscope can only operate under highvacuum, therefore the specimens need to coated with a conductive layer. In this case twoconductive coatings were used, a gold layer and a ”wet conductive coating” specificallyused for alumina’s.
2.2 Mechanical characterization
2.2.1 Tensile test
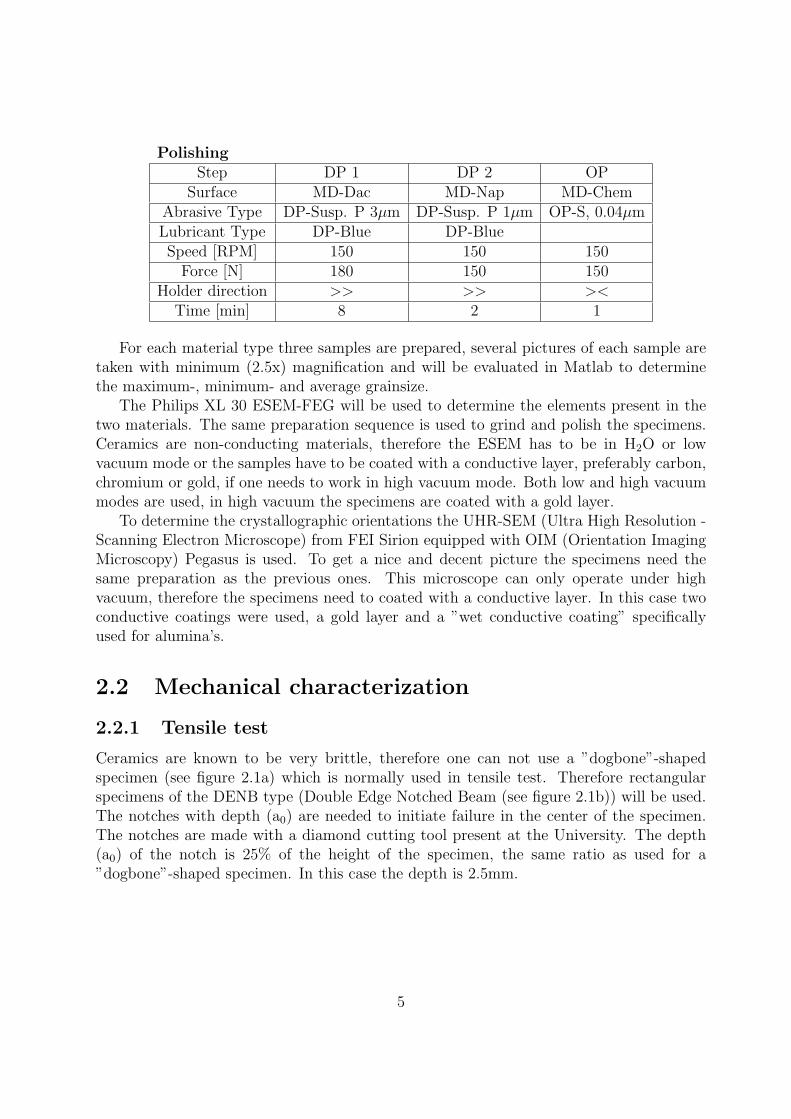
Ceramics are known to be very brittle, therefore one can not use a ”dogbone”-shapedspecimen (see figure 2.1a) which is normally used in tensile test. Therefore rectangularspecimens of the DENB type (Double Edge Notched Beam (see figure 2.1b)) will be used.The notches with depth (a0) are needed to initiate failure in the center of the specimen.The notches are made with a diamond cutting tool present at the University. The depth(a0) of the notch is 25% of the height of the specimen, the same ratio as used for a”dogbone”-shaped specimen. In this case the depth is 2.5mm.
5
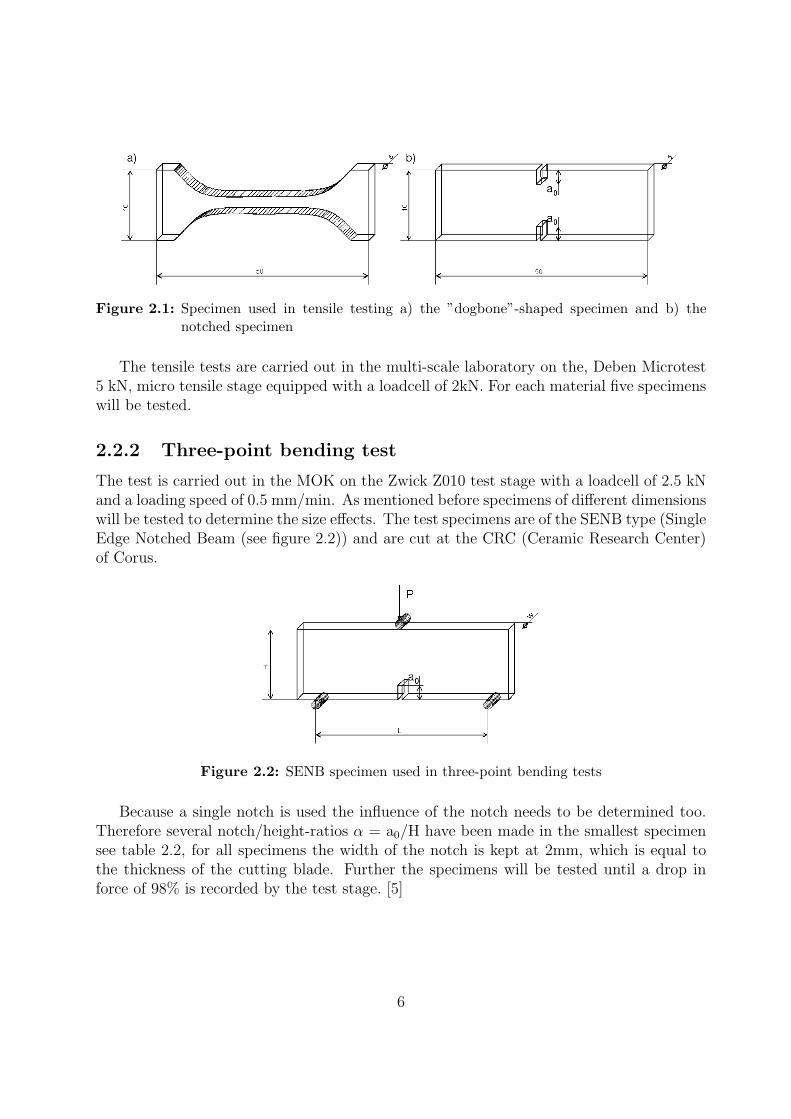
Figure 2.1: Specimen used in tensile testing a) the ”dogbone”-shaped specimen and b) thenotched specimen
The tensile tests are carried out in the multi-scale laboratory on the, Deben Microtest5 kN, micro tensile stage equipped with a loadcell of 2kN. For each material five specimenswill be tested.
2.2.2 Three-point bending test
The test is carried out in the MOK on the Zwick Z010 test stage with a loadcell of 2.5 kNand a loading speed of 0.5 mm/min. As mentioned before specimens of different dimensionswill be tested to determine the size effects. The test specimens are of the SENB type (SingleEdge Notched Beam (see figure 2.2)) and are cut at the CRC (Ceramic Research Center)of Corus.
Figure 2.2: SENB specimen used in three-point bending tests
Because a single notch is used the influence of the notch needs to be determined too.Therefore several notch/height-ratios α = a0/H have been made in the smallest specimensee table 2.2, for all specimens the width of the notch is kept at 2mm, which is equal tothe thickness of the cutting blade. Further the specimens will be tested until a drop inforce of 98% is recorded by the test stage. [5]
6

Table 2.2: SENB configurationH [mm] W [mm] L [mm] α
30 30 120 0.10; 0.20; 0.3340 30 160 0.2050 30 200 0.20
2.2.3 Compression test
The test is done on the Zwick Z010 test stage. The test specimens (see figure 2.3) arecylindrical with a diameter-height ratio D/H=1. The specimens will be tested until com-plete failure. Extremely high forces are to be expected, therefore additional support platesof high quality steel have to be mounted in order to cope with these forces.
Figure 2.3: Compression specimen
7

Chapter 3
Results
3.1 Microstructural characterization
3.1.1 Grainsize distribution
As said in chapter 2 the specimens need te be polished, here is where the problems began.The specimens of pure alumina were difficult to grind let alone polish. Due to the fact thatcourse matrix material was present, particles were worn out of the specimens, resulting ina poor quality of the polished specimens. This means the specimens were not flat which isone of the most important criteria to get a decent picture using a reflected light microscope.In figure 3.1 on of the pictures taken with the microscope using the dark field mode andthe result after postprocessing with Matlab is shown.
Figure 3.1: Grainsize distribution of one Al2O3 specimen polished and coated, picture (left)taken in darkfield mode and the result (right) after postprocessing with Matlab
There is a clear difference between the picture taken and the postprocessing with Mat-lab. In order to improve the quality of the picture and the postprocessing result, all fourmodes (brightfield, darkfield, polarization and DIC (differential interference contrast)) areused to make pictures of the specimens. There wasn’t a considerable improvement between
8

the four modes, therefore try to polish and enhance the contrast between the grains wasthe only remaining option. The contrast enhancement is done by dipping the specimenin the wet conductive coating which is mainly used for OIM, but due to the absorptionof the coating there might be an improvement in the contrast between the grains. Theseresults weren’t of considerable difference either (results are shown in appendix A). Thismeans no pronouncement can be given upon the grainsize distribution of the pure aluminaspecimens.
On the other hand the second type of material, alumina with additional silica, thematrix material was much more dense. This resulted in nice flat specimens and decentpictures (see figure 3.2) taken in the brightfield mode of the microscope.
Figure 3.2: Grainsize distribution of one Al2O3 with additional silica specimen, picture (left)taken in brightfield mode and the result (right) after postprocessing with Matlab
Three specimens were prepared and of each specimen three pictures were taken with2.5x magnification (see appendix B for all results). Matlab calculates several statisticalproperties of the objects in an image e.g. the area, the centroid and the bounding box. Thecharacteristic lengths for the size of a grain are calculated with respect to the boundingbox.
a
b
c g r a i na
b
ca
b
c g r a i n
Figure 3.3: Calculation of the characteristic grainsize with respect to the bounding box
The size of the bounding box is represented by the lengths a and b (see figure 3.3). Themaximum length to fit in a bounding box c can easily be calculated with pythagoras. This
9
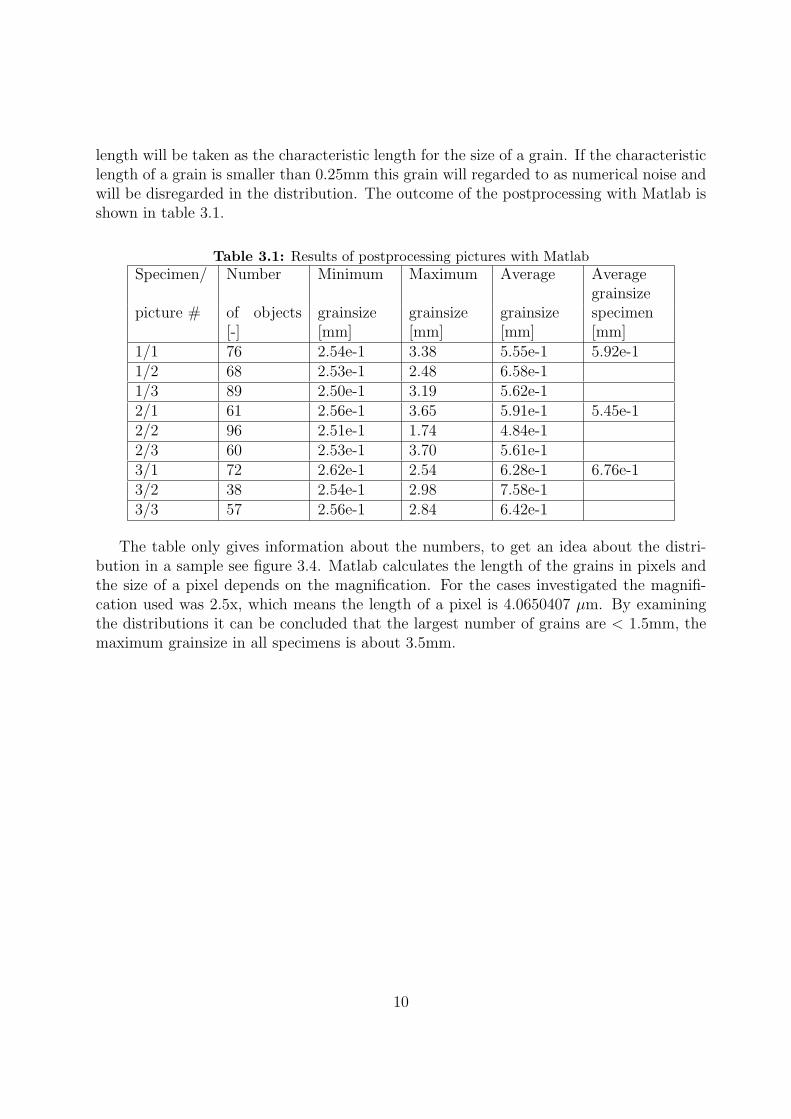
length will be taken as the characteristic length for the size of a grain. If the characteristiclength of a grain is smaller than 0.25mm this grain will regarded to as numerical noise andwill be disregarded in the distribution. The outcome of the postprocessing with Matlab isshown in table 3.1.
Table 3.1: Results of postprocessing pictures with MatlabSpecimen/ Number Minimum Maximum Average Average
grainsizepicture # of objects
[-]grainsize[mm]
grainsize[mm]
grainsize[mm]
specimen[mm]
1/1 76 2.54e-1 3.38 5.55e-1 5.92e-11/2 68 2.53e-1 2.48 6.58e-11/3 89 2.50e-1 3.19 5.62e-12/1 61 2.56e-1 3.65 5.91e-1 5.45e-12/2 96 2.51e-1 1.74 4.84e-12/3 60 2.53e-1 3.70 5.61e-13/1 72 2.62e-1 2.54 6.28e-1 6.76e-13/2 38 2.54e-1 2.98 7.58e-13/3 57 2.56e-1 2.84 6.42e-1
The table only gives information about the numbers, to get an idea about the distri-bution in a sample see figure 3.4. Matlab calculates the length of the grains in pixels andthe size of a pixel depends on the magnification. For the cases investigated the magnifi-cation used was 2.5x, which means the length of a pixel is 4.0650407 µm. By examiningthe distributions it can be concluded that the largest number of grains are < 1.5mm, themaximum grainsize in all specimens is about 3.5mm.
10

0 1 2 3 40
5
10
15
20
25
30Distribution in specimen 1
Num
ber
of g
rain
s [−
]
Grainsize [mm]0 1 2 3 4
0
5
10
15
20
25Distribution in specimen 2
Num
ber
of g
rain
s [−
]
Grainsize [mm]
0 1 2 30
2
4
6
8
10Distribution in specimen 2
Num
ber
of g
rain
s [−
]
Grainsize [mm]0 1 2 3 4
0
10
20
30
40
50
60Overall distribution
Num
ber
of g
rain
s [−
]
Grainsize [mm]
Figure 3.4: Grainsize distribution in the specimens, grains with characteristic length < 0.25mmwere filtered out and the distribution shown is that of three images
3.1.2 Element analysis
The alumina with additional silica was examined in high vacuum mode and thus coatedwith a gold layer. The pure alumina specimen was examined in low vacuum mode. Makinguse of the BSE (Back Scattered Electron) detector makes it possible to determine thelocation of the elements because each different gray scale indicates a different element orphase. In figure 3.5 the measurements on both specimens are shown. In figure 3.5 a) aclear peak for Silicium is present, in both graphs a peak for Carbon is visible, this mightbe due the grinding steps in the preparation sequence, since SiC paper has been used forgrinding.
11

a )
b )
Figure 3.5: a) Elements present in an Al2O3 with additional silica specimen and b) elementspresent in a pure Al2O3 specimen
To determine the location of the elements several overlays of picture and element posi-tions have been made for both specimens see figure 3.6.
a ) O r i g i n a l p i c t u r e A l
C O
S i A l - C - S i o v e r l a y
b ) O r i g n a l p i c t u r e A l
C O
A l - C o v e r l a y
Figure 3.6: Overlay pictures of an a) Al2O3 with additional silica specimen and b) a pure Al2O3
specimen
12

By examining the pictures above the coupling between the gray-scales and the elementscan be determined. The black areas can be coupled to carbon, the dark gray areas can becoupled to silicium and the light gray areas can be coupled to aluminium.
3.1.3 Crystallographic orientations
As mentioned before it was difficult to grind and polish the pure alumina specimens. Inorder to determine the crystallographic orientation the specimens need to be extremelyflat to reduce the noise, therefore it was only possible to determine the orientations in thealumina with additional silica specimen. One specimen was polished and coated with a goldlayer and another was polished and coated with a wet conductive coating (see appendixC for more information) [4]. This coating was especially created to use in orientationimaging of alumina specimens. The only difference between the two coatings was a higherCI (Confidence Index, indicating the degree of confidence that the orientation calculationis correct) with the wet conductive coating. The results of the two coating were similartherefore only the results of the gold coated specimen are depicted in figure 3.7. The higherthe CI the better the fit hkl-lines make with the Kikuchi-pattern. This pattern can be madeclear by tilting the specimen and using the BSE detector making use of the diffraction ofthe electrons. The diffraction effects cause individual grains of different orientation to givedifferent patterns. The hkl-lines indicate in what direction the diffraction plane (latticeplane) is orientated.
a ) b )
Figure 3.7: Orientation imaging results of an Al2O3 with additional silica specimen a) resultsof a scan in a single grain and b) results of a scan in a larger area. The imagesdepicted are inverse pole figures
13

Each color indicates a different orientation it can be seen that there is still a lot of noisepresent even in the scan of a single grain (figure 3.7 a)). Therefore it can be concludedthat the preparation sequence of the specimens needs improvement to get better results inorientation imaging.
3.2 Mechanical characterization
3.2.1 Tensile test
The tensile test was conducted on four notched specimens of 50x10x5mm3 with a notchdepth of 2.5mm. The results of the tensile test is depicted in figure 3.8.
0 50 100 150 200 2500
10
20
30
40
50
60
70
80
90
100
Deflection [µm]
For
ce [N
]
Sample 1Sample 2Sample 3Sample 4
Figure 3.8: Results of the tensile test conducted on the micro tensile stage
The difficulty in these kind of test with a brittle material is to avoid crack initiation byclamping the specimens. Therefore the specimens should be handled with care and alignedstraight in the clamps, a misalignment might cause a failure outside of the notched area orimmediate failure. In table 3.2 the problems occurred during the tensile test are shown.
14

Table 3.2: Problems occurring during tensile testSpecimen # Remarks Possible cause of failure
1 Slip occurred during the test the spec-imen was tightened
Clamping force not sufficient
2 Failure occurred at the clamps Clamping force to high3 Slip occurred during the test the spec-
imen was tightenedClamping force not sufficient
4 Immediate failure in the notched area Bad alignment of the specimen
These problems can also be related to the size of the specimens. The specimens were tosmall compared to grainsizes in the specimens e.g. the thickness of a specimen was equalto the size of one single grain. Therefore the results of the tensile test can not be regardedto as representative and the data acquired is not useful.
3.2.2 Three-point bending
The three-point bending test was scheduled to be done at the university on the Zwick Z010test stage with the bending apparatus available see figure 3.9. The test was supposed to bedone for both types of material, but due to a lack of time only the pure alumina specimenswere tested.
Figure 3.9: Three-point bending apparatus available at the university
As can be seen in figure 3.9 the span between the supports has almost reached itsmaximum with the smallest test specimen placed in the apparatus. The two larger spec-imens could therefore not be tested at the university. These specimens could be testedat the bending apparatus available at TNO. In table 3.3 information regarding the testedspecimens is depicted.
15

Table 3.3: Tested three-point bending specimens with remarks on the test resultsSpecimen size # of tests Remarks30x30x3 3 In the first test large cracks were visible at the
surface. The second specimen cracked outside ofthe notched area.
30x30x6 4 In the first test the crosshead hit the specimenresulting in an unexpected curve.
30x30x10 3 No remarks30x40x8 4 No remarks30x50x10 4 The first and third specimen cracked outside of the
notched area.
The specimens which cracked outside of the notched area are left out of consideration forthe reason that no information about the initial crack is known and therefore no calculationsregarding K1 can be made. In figure 3.10 force-deflection curves of the tests are shown.The specimens are indicated as follows: width x height x notch depth.
a) b)
0 0.2 0.4 0.6 0.8 1 1.2 1.4 1.6 1.8 20
200
400
600
800
1000
1200
1400
1600
Force−Deflection curve with regard to the influence of notch−depth
Deflection [mm]
For
ce [N
]
30x30x630x30x330x30x10
0 0.5 1 1.5 2 2.50
200
400
600
800
1000
1200
1400
1600
1800
2000
Deflection [mm]
For
ce [N
]
Force−Deflection curve with regard to the influence of the size effects with α = 0.2
30x30x630x40x830x50x10
Figure 3.10: The force-deflection curves a) influence of the notch and b) influence of the size
For each type of specimen tested the one with the highest peak force is depicted infigure 3.10. The depth of the notch has no influence on the slope of the modulus the onlyinfluence is the height of the peak force. Although the response is not as expected, a deepernotch is supposed to result in a lower peak force, therefore the peak force of the specimenwith a 3mm notch should be higher than the peak force of a specimen with 6mm notch, ascan be seen this is not the case. This might be caused by the quality of the specimens. Thefirst remark of the operator who cut the specimens was, ”these bricks are of poor quality”,and by examining the bricks there were already large cracks visible. The poor quality ofthe bricks might be caused due to poor filling of the mould or the pressure was to high fora period in time during the production, which results in spring back of the material.
16
It appears the influence of size can be neglected if one look at the peak forces, for alltested specimens the peak force is about 2000 N. The slope of the modulus is differentbetween the specimen test at the university and the specimens tested at TNO. This mightbe caused by a difference in stiffness of the test stages a stiffer stage results in a more steepslope of the modulus. Therefore no predictions can be made according to the influence ofsize on the slope of the modulus.
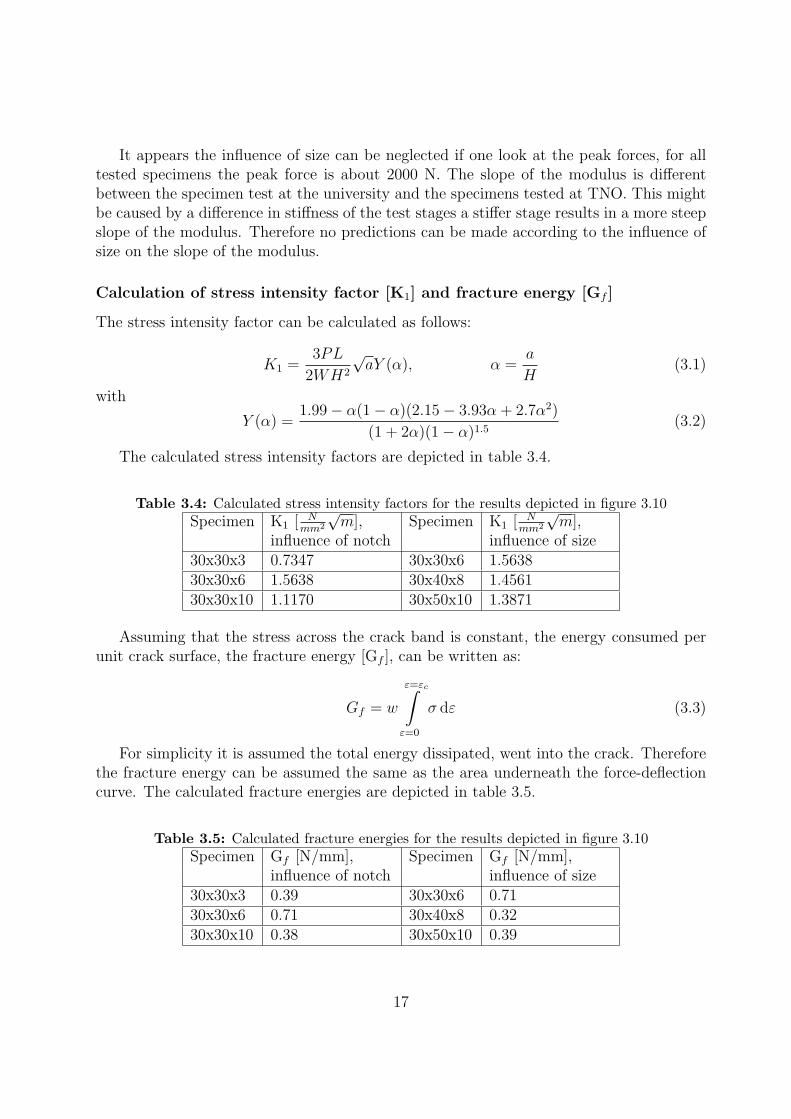
Calculation of stress intensity factor [K1] and fracture energy [Gf ]
The stress intensity factor can be calculated as follows:
K1 =3PL
2WH2
√aY (α), α =
a
H(3.1)
with
Y (α) =1.99− α(1− α)(2.15− 3.93α + 2.7α2)
(1 + 2α)(1− α)1.5(3.2)
The calculated stress intensity factors are depicted in table 3.4.
Table 3.4: Calculated stress intensity factors for the results depicted in figure 3.10Specimen K1 [ N
mm2
√m], Specimen K1 [ N
mm2
√m],
influence of notch influence of size30x30x3 0.7347 30x30x6 1.563830x30x6 1.5638 30x40x8 1.456130x30x10 1.1170 30x50x10 1.3871
Assuming that the stress across the crack band is constant, the energy consumed perunit crack surface, the fracture energy [Gf ], can be written as:
Gf = w
ε=εc∫
ε=0
σ dε (3.3)
For simplicity it is assumed the total energy dissipated, went into the crack. Thereforethe fracture energy can be assumed the same as the area underneath the force-deflectioncurve. The calculated fracture energies are depicted in table 3.5.
Table 3.5: Calculated fracture energies for the results depicted in figure 3.10Specimen Gf [N/mm], Specimen Gf [N/mm],
influence of notch influence of size30x30x3 0.39 30x30x6 0.7130x30x6 0.71 30x40x8 0.3230x30x10 0.38 30x50x10 0.39
17

In Linear Elastic Fracture Mechanics (LEFM) it is assumed K1 is a material parameterand therefore it is ought to be independent of size effects. In figure 3.11 the calculatedstress intensity factors and fracture energies based on the averages of the reliable tests aredepicted with an errorbar indicating the standard deviation. In most results the deviationis quit large, this might be caused by the poor quality of the used bricks. Due to the largedeviation in the results no reliable conclusions on the influence of notch depth and size onthe stress intensity factor and the fracture energy can be drawn. In order to be certainthat LEFM is invalid to describe these materials more tests need to be done.
a) b)
0 0.1 0.2 0.3 0.40.4
0.6
0.8
1
1.2
1.4
1.6
1.8
K1 notch influence
α [−]
K1 [M
Pa. m
1/2 ]
0 0.1 0.2 0.3 0.40.25
0.3
0.35
0.4
0.45
0.5
0.55
0.6
0.65
0.7
0.75
Gf notch influence
α [−]
Gf [N
/mm
]
20 30 40 50 601.1
1.15
1.2
1.25
1.3
1.35
1.4
1.45
1.5
1.55
1.6
K1 size influence
height [mm]
K1 [M
Pa. m
1/2 ]
20 30 40 50 600.25
0.3
0.35
0.4
0.45
0.5
0.55
0.6
0.65
0.7
0.75
Gf size influence
height [mm]
Gf [N
/mm
]
Figure 3.11: K1 and Gf values as calculated from the peak force with respect to a) the notchinfluence and b) the size influence
3.2.3 Compression test
The compression strength of the specimens is expected to be extremely high thereforeadditional support plates had to be mounted on the stage. These plates were not availableand had to be produced. Unfortunately the plates could not be produced within the timespan of this internship and therefore the compression test could not be done during thisinternship.
18
Chapter 4
Conclusion and discussion
4.1 Microstructural characterization
The major importance regarding the microstructural characterization is an improvementof the specimen preparation sequence. This improvement is needed for both the determi-nation of the grainsize, grainsize distribution in a pure alumina specimen and to reducethe noise present in the determination of the crystallographic orientations. Further consid-ering the crystallographic orientations more investigation needs to be done with respect tothe influence of the wet conductive coating and examine the influence of other conductivelayers e.g. carbon or chromium.
4.2 Mechanical characterization
For future work it is not advisable to conduct a tensile test for the very reason that itis time consuming and the results are poor with respect to the work needed to be donebefore one can start. Furthermore the results obtain from the test are not reliable for smallspecimens. Regarding the compression test nothing of importance can be said, but that itneeds to be done when the additional support plates are ready.
Considering the three-point bending results no reliable conclusions on the influence ofnotch depth and size on the stress intensity factor and the fracture energy can be drawndue to the large deviations in the results. In order to be certain that LEFM is invalid dodescribe these materials more tests need to be done.
19
Bibliography
[1] David J. Prior, et al., The application of electron backscatter diffraction and orienta-tion contrast imaging in the SEM to textural problems in rocks, American Mineroli-ogist, Volume 84 1999, p. 1741-1759
[2] Manfred Ruhle, Microscopy of Structural Ceramics, Advanced Materials, Volume 91997, p. 195-217
[3] William E. Lee, W. Mark Rainforth, Ceramic Microstructures - Property control byprocessing, Chapman & Hall 1994
[4] Danka Katrakova, Frank Mucklich, Specimen Preparation for Electron BackscatterDiffraction - PartII: Ceramics, Practical Metallography, Volume 39 2002, p. 644-662
[5] Marcel A.J. van Gils, Quasi-Brittle Fracture of Ceramics, Eindhoven University ofTechnology, 1997
[6] http://www.struers.com/modules/emetalog/generic view.asp?method=899,viewed 25-05-2005
20

Appendix A:Grainsize distribution of purealumina specimens
Al2O3 specimen unpolished, picture (left) taken in DIC mode and the result (right) afterpostprocessing with Matlab
Al2O3 specimen unpolished, picture (left) taken in darkfield mode and the result (right)after postprocessing with Matlab
Al2O3 specimen unpolished, picture (left) taken in brightfield mode and the result (right)after postprocessing with Matlab
21

Al2O3 specimen unpolished, picture (left) taken in polarization mode and the result(right) after postprocessing with Matlab
Al2O3 specimen polished and coated, picture (left) taken in DIC mode and the result(right) after postprocessing with Matlab
Al2O3 specimen polished and coated, picture (left) taken in darkfield mode and the result(right) after postprocessing with Matlab
Al2O3 specimen polished and coated, picture (left) taken in brightfield mode and theresult (right) after postprocessing with Matlab
Al2O3 specimen polished and coated, picture (left) taken in polarization mode and theresult (right) after postprocessing with Matlab
22
Appendix B:Grainsize distribution of aluminawith additional silica specimens
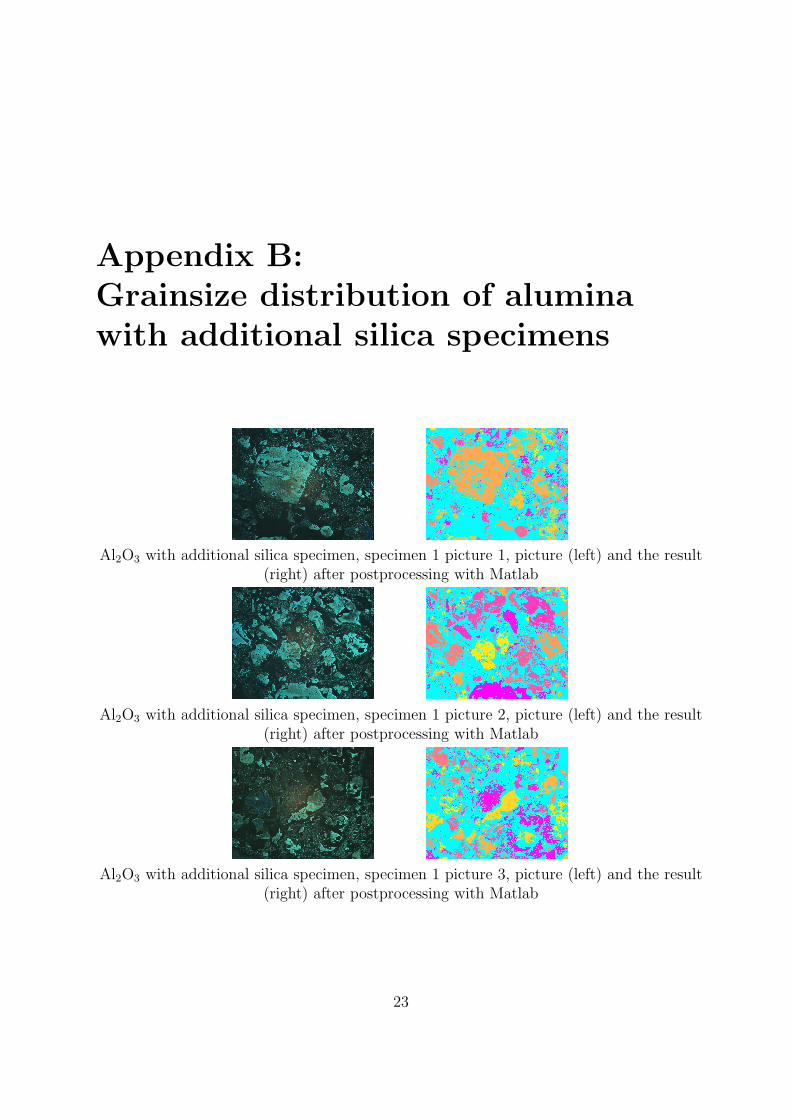
Al2O3 with additional silica specimen, specimen 1 picture 1, picture (left) and the result(right) after postprocessing with Matlab
Al2O3 with additional silica specimen, specimen 1 picture 2, picture (left) and the result(right) after postprocessing with Matlab
Al2O3 with additional silica specimen, specimen 1 picture 3, picture (left) and the result(right) after postprocessing with Matlab
23

Al2O3 with additional silica specimen, specimen 2 picture 1, picture (left) and the result(right) after postprocessing with Matlab
Al2O3 with additional silica specimen, specimen 2 picture 2, picture (left) and the result(right) after postprocessing with Matlab
Al2O3 with additional silica specimen, specimen 2 picture 3, picture (left) and the result(right) after postprocessing with Matlab
Al2O3 with additional silica specimen, specimen 3 picture 1, picture (left) and the result(right) after postprocessing with Matlab
Al2O3 with additional silica specimen, specimen 3 picture 2, picture (left) and the result(right) after postprocessing with Matlab
24
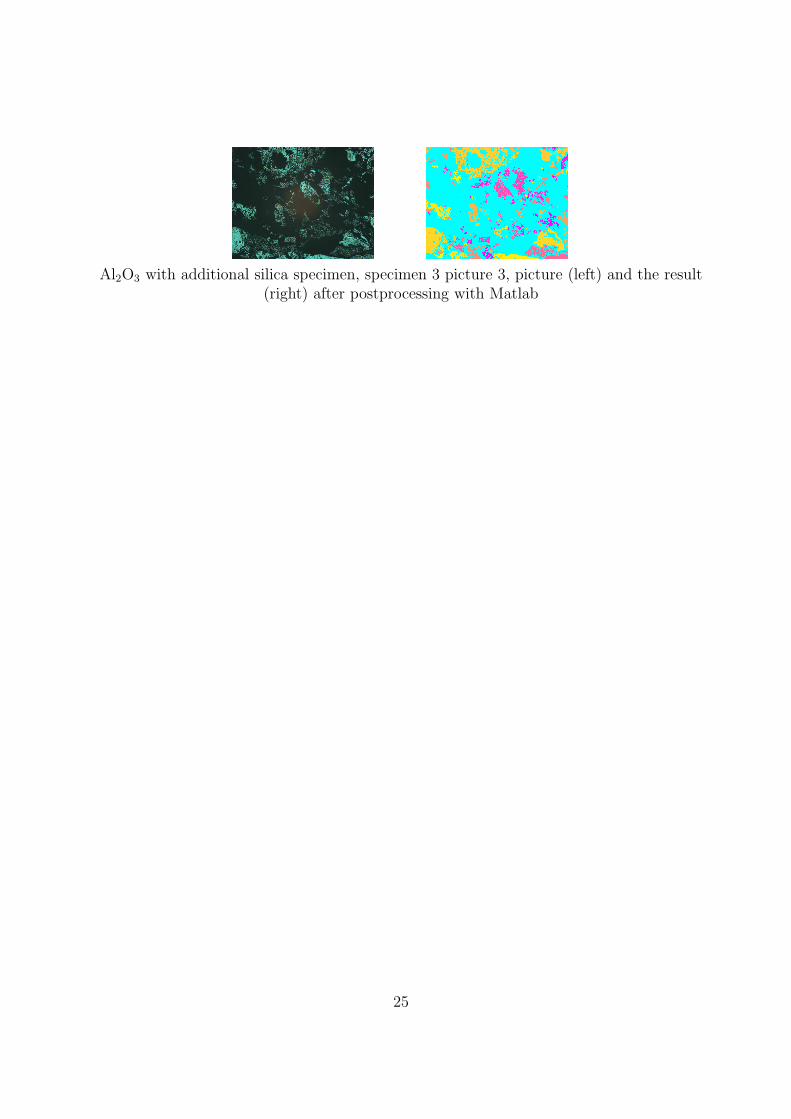
Al2O3 with additional silica specimen, specimen 3 picture 3, picture (left) and the result(right) after postprocessing with Matlab
25

Appendix C:Wet conductive coating
Original solutions
Pd Sn(1) Sn(2)0.1 g PdCl2 0.4 g SnCl2.H2O 4.6 g SnCl2.2H2O30 ml HCl (37%) 2 ml HCl (37%) 4 ml HCl (37%)60 ml H2O (dest.) 2 ml H2O (dest.) 4 ml H2O (dest.)
Preparation
1. 45 ml Pd + 2 ml Sn(1), mix carefully
2. wait for 15 hours
3. add 4 ml Sn(2), mix carefully
Coating
1. dip specimen into solution, agitate: 1.5 min
2. rinse carefully with distilled water
3. nitrogen drying
According to [4] this type of coating gives good results in OIM of alumina.
26
Related Documents