RESEARCH ARTICLE Microstructural Changes across Different Clinical Milestones of Disease in Amyotrophic Lateral Sclerosis Francesca Trojsi 1,2 , Giuseppina Caiazzo 1,2 , Daniele Corbo 3 , Giovanni Piccirillo 1 , Viviana Cristillo 1 , Cinzia Femiano 1 , Teresa Ferrantino 1 , Mario Cirillo 1,2 , Maria Rosaria Monsurrò 1,2 , Fabrizio Esposito 2,4 , Gioacchino Tedeschi 1,2 * 1 Department of Medical, Surgical, Neurological, Metabolic and Aging Sciences, Second University of Naples, Naples, Italy, 2 MRI Research Center SUN-FISM—Second University of Naples, 80138 Naples, Italy, 3 Department of Neuroscience, University of Parma, 43100 Parma, Italy, 4 Department of Medicine and Surgery, University of Salerno, 84081 Baronissi (Salerno), Italy * [email protected] Abstract Neurodegenerative process in amyotrophic lateral sclerosis (ALS) has been proven to in- volve several cortical and subcortical brain regions within and beyond motor areas. Howev- er, how ALS pathology spreads progressively during disease evolution is still unknown. In this cross-sectional study we investigated 54 ALS patients, divided into 3 subsets according to the clinical stage, and 18 age and sex-matched healthy controls, by using tract-based spatial statistics (TBSS) diffusion tensor imaging (DTI) and voxel-based morphometry (VBM) analyses. We aimed to identify white (WM) and gray matter (GM) patterns of disease distinctive of each clinical stage, corresponding to specific clinical milestones. ALS cases in stage 2A (i.e., at diagnosis) were characterized by GM and WM impairment of left motor and premotor cortices and brainstem at ponto-mesenchephalic junction. ALS patients in clinical stage 2B (with impairment of two functional regions) exhibited decreased fractional anisotropy (FA) (p<0.001, uncorrected) and increased mean (MD) and radial diffusivity (RD) (p<0.001, uncorrected) in the left cerebellar hemisphere and brainstem precerebellar nuclei, as well as in motor areas, while GM atrophy (p<0.001, uncorrected) was detected only in the left inferior frontal gyrus and right cuneus. Finally, ALS patients in stage 3 (with impairment of three functional regions) exhibited decreased FA and increased MD and RD (p<0.05, corrected) within WM underneath bilateral pre and postcentral gyri, corpus callo- sum midbody, long associative tracts and midbrain, while no significant clusters of GM atro- phy were observed. Our findings reinforce the hypothesis that the neurodegenerative process propagates along the axonal pathways and develops beyond motor areas from early stages, involving progressively several frontotemporal regions and their afferents and efferents, while the detection of GM atrophy in earlier stages and its disappearance in later stages may be the result of reactive gliosis. PLOS ONE | DOI:10.1371/journal.pone.0119045 March 20, 2015 1 / 17 OPEN ACCESS Citation: Trojsi F, Caiazzo G, Corbo D, Piccirillo G, Cristillo V, Femiano C, et al. (2015) Microstructural Changes across Different Clinical Milestones of Disease in Amyotrophic Lateral Sclerosis. PLoS ONE 10(3): e0119045. doi:10.1371/journal.pone.0119045 Academic Editor: Jan Kassubek, University of Ulm, GERMANY Received: September 15, 2014 Accepted: January 9, 2015 Published: March 20, 2015 Copyright: © 2015 Trojsi et al. This is an open access article distributed under the terms of the Creative Commons Attribution License, which permits unrestricted use, distribution, and reproduction in any medium, provided the original author and source are credited. Data Availability Statement: All relevant data are within the paper. Funding: The authors have no support or funding to report. Competing Interests: The authors have declared that no competing interests exist.

Welcome message from author
This document is posted to help you gain knowledge. Please leave a comment to let me know what you think about it! Share it to your friends and learn new things together.
Transcript
RESEARCH ARTICLE
Microstructural Changes across DifferentClinical Milestones of Disease in AmyotrophicLateral SclerosisFrancesca Trojsi1,2, Giuseppina Caiazzo1,2, Daniele Corbo3, Giovanni Piccirillo1,Viviana Cristillo1, Cinzia Femiano1, Teresa Ferrantino1, Mario Cirillo1,2, MariaRosaria Monsurrò1,2, Fabrizio Esposito2,4, Gioacchino Tedeschi1,2*
1 Department of Medical, Surgical, Neurological, Metabolic and Aging Sciences, Second University ofNaples, Naples, Italy, 2 MRI Research Center SUN-FISM—Second University of Naples, 80138 Naples,Italy, 3 Department of Neuroscience, University of Parma, 43100 Parma, Italy, 4 Department of Medicineand Surgery, University of Salerno, 84081 Baronissi (Salerno), Italy
AbstractNeurodegenerative process in amyotrophic lateral sclerosis (ALS) has been proven to in-
volve several cortical and subcortical brain regions within and beyond motor areas. Howev-
er, how ALS pathology spreads progressively during disease evolution is still unknown. In
this cross-sectional study we investigated 54 ALS patients, divided into 3 subsets according
to the clinical stage, and 18 age and sex-matched healthy controls, by using tract-based
spatial statistics (TBSS) diffusion tensor imaging (DTI) and voxel-based morphometry
(VBM) analyses. We aimed to identify white (WM) and gray matter (GM) patterns of disease
distinctive of each clinical stage, corresponding to specific clinical milestones. ALS cases in
stage 2A (i.e., at diagnosis) were characterized by GM andWM impairment of left motor
and premotor cortices and brainstem at ponto-mesenchephalic junction. ALS patients in
clinical stage 2B (with impairment of two functional regions) exhibited decreased fractional
anisotropy (FA) (p<0.001, uncorrected) and increased mean (MD) and radial diffusivity
(RD) (p<0.001, uncorrected) in the left cerebellar hemisphere and brainstem precerebellar
nuclei, as well as in motor areas, while GM atrophy (p<0.001, uncorrected) was detected
only in the left inferior frontal gyrus and right cuneus. Finally, ALS patients in stage 3 (with
impairment of three functional regions) exhibited decreased FA and increased MD and RD
(p<0.05, corrected) within WM underneath bilateral pre and postcentral gyri, corpus callo-
summidbody, long associative tracts and midbrain, while no significant clusters of GM atro-
phy were observed. Our findings reinforce the hypothesis that the neurodegenerative
process propagates along the axonal pathways and develops beyond motor areas from
early stages, involving progressively several frontotemporal regions and their afferents and
efferents, while the detection of GM atrophy in earlier stages and its disappearance in later
stages may be the result of reactive gliosis.
PLOS ONE | DOI:10.1371/journal.pone.0119045 March 20, 2015 1 / 17
OPEN ACCESS
Citation: Trojsi F, Caiazzo G, Corbo D, Piccirillo G,Cristillo V, Femiano C, et al. (2015) MicrostructuralChanges across Different Clinical Milestones ofDisease in Amyotrophic Lateral Sclerosis. PLoS ONE10(3): e0119045. doi:10.1371/journal.pone.0119045
Academic Editor: Jan Kassubek, University of Ulm,GERMANY
Received: September 15, 2014
Accepted: January 9, 2015
Published: March 20, 2015
Copyright: © 2015 Trojsi et al. This is an openaccess article distributed under the terms of theCreative Commons Attribution License, which permitsunrestricted use, distribution, and reproduction in anymedium, provided the original author and source arecredited.
Data Availability Statement: All relevant data arewithin the paper.
Funding: The authors have no support or funding toreport.
Competing Interests: The authors have declaredthat no competing interests exist.

IntroductionAmyotrophic lateral sclerosis (ALS) is the most frequent motor neuron disease characterizedby progressive atrophy and weakness of bulbar, limb, and respiratory muscles [1]. Recent stud-ies, including histochemical [2, 3], neuroradiological [4–9] and neuropsychological [10–12]analyses, have demonstrated that a widespread frontotemporal involvement is present in up to50% of patients, and have suggested that these findings are in line with the broadly describedgenetic [13, 14] and neuropathological [15, 16] continuum identified between ALS and fronto-temporal lobar degeneration (FTLD). Moreover, similarly to what observed in other neurode-generative diseases characterized by tau and alfa-sinuclein pathology [17–19], there isincreasing evidence that in ALS-FTLD spectrum the aggregation of transactive response DNAbinding protein 43 KDa (TDP-43) could sequentially disseminate during disease course from afocal site of onset in a prion-like, cell-to-cell manner [20]. This hypothesis recalls the clinico-pathological observation that motor neurons degeneration in ALS starts focally and spreadsfrom motor domains towards several extra-motor regions along anatomical pathways [2, 3, 21,22]. Furthermore, recent immunohistochemical evidence has depicted the probable sequentialpattern of propagation of TDP-43 pathology in ALS, identifying four neuropathological stagesof disease progression [23].
In vivo, advanced neuroimaging studies have corroborated the theory of a multisystem de-generation in ALS [4]. In particular, diffusion tensor imaging (DTI) findings of reduced whitematter (WM) integrity, in terms of decreased fractional anisotropy (FA) and increased mean(MD) and radial diffusivity (RD) in the frontal, temporal, and parietal lobes and in the corpuscallosum (CC) of ALS patients [5,7,8,24], have allowed to suggest a probable linkage betweenwidespread WM involvement and the multi-domain clinical impairment frequently reportedin ALS [10–12,25]. Moreover, on the basis of the neuropathological evidence of progressivestages of TDP-43 pathology affecting specific fiber tracts [23], significant differences betweenALS patients and controls for these WM fiber bundles have been recently shown in vivo byusing a new tract of interest-based fibre tracking approach [26], thereby identifying the DTIcorrelates of the previously described immunohistochemical stages of disease [23]. With regardto application of brain morphometry to ALS, especially voxel- (VBM) and surface-based(SBM) morphometry, which allowed a fully automated whole-brain measurement of regionalbrain atrophy [27] and cortical thickness [28], several studies have identified a widespread graymatter (GM) damage in frontal, temporal, parietal and occipital lobes in different clinical stagesof disease [6, 8, 9, 29–31]. In addition, some VBM and SBM studies have revealed significantcorrelations between cognitive impairment and frontotemporal cortical atrophy or thinning innon-demented ALS patients [9, 29–32]. However, the progressive extent and the regional dis-tribution of GM andWM involvement during disease course, a crucial point for assessing ALSpathophysiology, remain still to be elucidated.
The objective of the present cross-sectional study was to investigate DTI and VBM patternsof sequential dissemination of brain pathology across progressive clinical milestones of diseasein a large cohort of ALS patients, divided into three subsets according to the staging system forALS recently proposed by Roche et al. [33]. We applied whole-brain tract-based spatial statis-tics (TBSS) DTI [34] and VBM analyses to investigate FA, MD and RD changes in combinationwith GM atrophy assessment across different milestones of disease corresponding to clinicalstages, from diagnosis (stage 2A) to evidence of clinical signs of ALS in three functional regions(stage 3). We hypothesized to depict a structural pattern of extent of the neurodegenerativeprocess, consistent with the clinical progression of ALS.
Microstructural Brain Changes in ALS Course
PLOS ONE | DOI:10.1371/journal.pone.0119045 March 20, 2015 2 / 17
Methods
Case selectionFifty-four right-handed patients (29 M, 25 F; mean age 60.3 ± 11.2), 38 with definite ALS and16 with probable or probable laboratory-supported ALS, according to diagnostic El-Escorialcriteria [35], were consecutively recruited at the First Division of Neurology of the Second Uni-versity of Naples (Naples, Italy).
Definite, probable or probable laboratory-supported ALS was diagnosed when combinedlower and upper motor neuron dysfunction was identified in bulbar and spinal-innervated re-gions. With regard to clinical phenotypes, according to ALS subtype classification of Chiò et al.[36], forty patients exhibited classic phenotypes, ten bulbar phenotypes, two flail arm pheno-types and two flail leg phenotypes. Patients with major cognitive impairment (e.g., ALS-De-mentia, ALS-FTD), progressive bulbar palsy or primary lateral sclerosis were not included.
All patients were classified according to the clinical staging system for ALS proposed byRoche et al. [33], as following: Stage 1: symptom onset (involvement of first region); Stage 2A:diagnosis; Stage 2B: involvement of a second region; Stage 3: involvement of a third region;Stage 4A: need for gastrostomy; Stage 4B: need for respiratory support (non-invasive ventila-tion). Considering that no patient at onset or with gastrostomy or respiratory support has beenenrolled (since the former were less numerous than patients classified in other stages of diseaseand the latter were unsuitable to be examined by MRI), we defined three subsets of patients instages 2A, 2B and 3 (i.e., from diagnosis to involvement of three regions), each including eigh-teen patients (for more details, see Table 1).
As clinical parameters, we measured the ALS functional rating scale-revised (ALSFRS-R)score, index of disability status [37], and the upper motor neuron (UMN) score, measure of py-ramidal dysfunction through the evaluation of the number of pathologic reflexes elicited from15 body sites (i.e., glabellum, masseter, and orbicularis oris, biceps, triceps, finger jerks, knee,ankle, and Babinski responses bilaterally) [38]. Respiratory function, measured by forced vitalcapacity (FVC), was above 70% in all ALS patients and there was no evidence of nocturnalhypoventilation. None of the patients recruited had additional neurological disease or previousmental illness.
All patients included in the study underwent Addenbroke’s Cognitive Examination Revised(ACE-R), a sensitive and specific battery to detect early cognitive impairment and dementia[39]. It contains 5 subscales: attention and orientation, memory, fluency, language and visuo-spatial, with higher scores denoting preserved cognitive abilities (cut off 88/100). Fifteen pa-tients (four in stage 2A, five in stage 2B and five in stage 3) were not able to perform the testbecause of speech or manual difficulties. Moreover, behavioral dysfunctions were measured bythe Frontal Systems Behavior (FrSBe) Scale [40], a 46-item behavior rating scale for both pa-tients and caregivers, designed to provide a total frontal disturbance score (T score) and threesubscale scores (or subscores), which allow to assess apathy, disinhibition, and executive alter-ations. This scale quantifies behavioral changes over time by combining retrospective and cur-rent assessments of frontal dysfunction (T> 65 is defined as impaired behavior and executivefunctions). In our population we considered T scores and subscores derived from caregiversand referring to the present time and these data were available in thirty-nine patients (Table 1).
Genetic analysis was performed in all patients. Specifically, five patients, one with familialand four with sporadic ALS, were positive respectively for: i) an heterozygous mutationc.149T>C in the exon 5 of the superoxide (SOD1) gene (i.e., a case of familial ALS), ii) abnor-mal hexanucleotide repeat expansions of C9ORF72 gene (i.e., three sporadic cases affected byclassical ALS with behavioral abnormalities), and iii) an heterozygous mutation p.Asn352Ser
Microstructural Brain Changes in ALS Course
PLOS ONE | DOI:10.1371/journal.pone.0119045 March 20, 2015 3 / 17

in the exon 6 of TARDBP gene (i.e., a patient with sporadic ALS characterized by spasticquadriparesis).
Right-handed HCs were enrolled among the non consanguineous caregivers of patients andby word of mouth. They underwent a multidimensional assessment, including neurological ex-amination and a brief neuropsychological evaluation. Eighteen neurologically and cognitivelynormal subjects (9 M, 9 F; mean age 61 ± 8.1) were included in the study.
Ethics StatementThe research was conducted according to the principles expressed in the Declaration of Hel-sinki. Ethics approval was obtained from the Ethics Committee of Second University of Naples.Patient or family written consent was obtained from each participant.
Imaging acquisitionMagnetic-resonance images were acquired on a 3T scanner equipped with an 8-channel paral-lel head coil (General Electric Healthcare, Milwaukee, Wisconsin). Whole-brain DTI was per-formed using a GRE EPI sequence (repetition time = 10000 msec, echo time = 88 msec, field ofview = 320 mm, isotropic resolution = 2.5 mm, b value = 1,000 s/mm2, 32 isotropically distrib-uted gradients, frequency encoding RL).
Table 1. Detailed patients and controls characteristics.
Clinical features ALSpatients(n = 54)
ALS patients withinvolvement of a first region(stage 2A) (n = 18)
ALS patients withinvolvement of a secondregion (stage 2B) (n = 18)
ALS patients withinvolvement of a thirdregion (stage 3) (n = 18)
Healthycontrols(n = 18)
Mean age (years ± SD)(range)
60.3 ± 11.1(36–80)
59.2 ± 11.6 (36–80) 59.5 ± 10.6 (37–80) 62.4 ± 11.3 (36–74) 61 ± 8.1(43–76)
Gender (male: female) 29:25 9:9 10:8 11:7 9:9
Mean disease duration(years ± SD) (range)
2.7 ± 1.9(0.5–7)
2 ± 1.6 (0.5–7) 2.1 ± 1.2 (1–6) 3.9 ± 2.1 (1–7) -
El Escorial criteria forALS (definite:probable)
38:16 11:7 13:5 14:4 -
Clinical onset (bulbar:upper limbs: lowerlimbs)
13:13:28 2:4:12 7:4:7 4:5:9
ALS FRS-R (mean ±SD) (range)
33.4 ± 7.9(16–47)
36.3 ± 7.4 (19–47) 32.2 ± 8.6 (16–44) 31.6 ± 7.3 (21–44) -
UMN score (mean ±SD) (range)
7.2 ± 4.5(1–16)
7.6 ± 4.3 (2–15) 7.2 ± 4.4 (1–15) 6.7 ± 5 (1–16) -
ACE-r (cut off 88)(mean ± SD) (range)*
87.5 ± 10.7(64–99)
90 ± 12.3 (64–99) 87.6 ± 11.8 (65–97) 84.5 ± 6.9 (73–91) 89 ± 2.7(88–98)
FrSBe scale*
Total score (mean ±SD)
104.5 ±24.9
102.1 ± 27.5 105 ± 28.9 107 ± 18 -
Apathy subscore(mean± SD)
37.2 ± 8.4 32.4 ± 8.8 31.4 ± 8.6 32.7 ± 8.4 -
Disinhibition subscore(mean± SD)
31.6 ± 9.8 32.2 ± 9.5 32 ± 12.6 30.4 ± 7.1 -
Executive dysfunctionssubscore (mean± SD)
41.2 ± 12.3 38.8 ± 13.9 41.4 ± 13.9 43.8 ± 8.3 -
*available in 39 patients (i.e., 13 patients in stage 2A, 14 in stage 2B and 12 in stage 3)
doi:10.1371/journal.pone.0119045.t001
Microstructural Brain Changes in ALS Course
PLOS ONE | DOI:10.1371/journal.pone.0119045 March 20, 2015 4 / 17

Diffusion tensor imaging (DTI) analysisA voxel-based TBSS approach was used for group analysis of DTI data [34]. DTI data sets wereprocessed with the Functional MRI of the Brain (FMRIB) Software Library (FSL) softwarepackage (www.fmrib.ox.ac.uk/fsl). Preprocessing included eddy current and motion correctionand brain-tissue extraction. After preprocessing, DTI images were averaged and concatenatedinto 33 (1 B = 0 + 32 B = 1000) volumes and a diffusion tensor model was fitted at each voxel,generating FA, MD, and eigenvalue (λ1, λ2, λ3) maps. The average of the second and third ei-genvalues of the diffusion tensor was used for the definition of the RD. Images were warped tothe Montreal Neurological Institute (MNI) 152 template, available as standard T1 data set inthe FSL software package. TBSS was run with FA maps to create the “skeleton”, which repre-sents the center of all fiber bundles in common to all subjects, and which was used for all othermaps. To this purpose, FA images of all subjects (n = 72) were aligned to a common target(1x1x1 mmMNI152 FMRIB58_FA standard space) using nonlinear registration. A mean FAskeleton was then created with threshold of FA>0.2. Moreover, the TBSS results were linked tostandard anatomic data derived from the International Consortium of Brain Mapping DTI-81WM labels atlas (Johns Hopkins University, Baltimore, MD) [41,42].
Individual skeleton images were submitted to a GLM analysis with appropriate design ma-trices and linear contrasts defined for the group comparisons and the correlations between alldiffusivity parameters (FA, RD, MD) and clinical measures of disease duration and disability(ALSFRS-R scores, ACE-R, FrSBe scale T-score). The results of voxel-wise correlations wereshown on the skeleton map after correction for multiple comparison with the Threshold_FreeCluster Enhancement (TFCE) technique [34].
Regional atrophy measurements: voxel-based morphometry (VBM)We performed a VBM analysis using the VBM8 toolbox (http://dbm.neuro.uni-jena.de/vbm.html) of SPM8 software package (http://www.fil.ion.ucl.ac.uk/spm/) with default parametersincorporating the DARTEL toolbox in order to obtain a high-dimensional normalizationprotocol [27]. Images were bias-corrected, tissue-classified, and registered by using linear(12-parameter affine) and nonlinear transformations (warping) within a unified model [27].Subsequently, the warped GM segments were affine-transformed into MNI space and werescaled by the Jacobian determinants of the deformations to account for the local compressionand stretching that occurs as a consequence of the warping and affine transformation (modu-lated GM volumes) [27]. Finally, the modulated volumes were smoothed with a Gaussian ker-nel of 8-mm full width at half maximum. The GM volume maps were statistically analyzed byusing the general linear model based on Gaussian random field theory. Statistical analysis con-sisted of an analysis of covariance (ANCOVA) with age and sex as covariates of no interest.The MNI152 (a.k.a., International Consortium for Brain Mapping—ICBM—152) atlas [43,44],incorporated into SPM8, was used for localizing anatomically VBM results.
Results
DemographicsNo significant differences were identified for any of the demographic variables (age and gen-der) between patient groups and the control cohort (Table 1).
TBSS DTI analysisDifferences between ALS patients and controls. In comparison to HCs, ALS patients in clini-cal stage 2A (i.e., at diagnosis) exhibited decreased FA (p<0.05, corrected for multiple
Microstructural Brain Changes in ALS Course
PLOS ONE | DOI:10.1371/journal.pone.0119045 March 20, 2015 5 / 17

comparisons) in the body of CC and left corticospinal tract (CST), principally in its rostral partunderneath the primary motor cortex (Fig. 1, upper panels; Table 2), while increased MD andRD (p<0.001, uncorrected) was detected in brainstem (at the ponto-mesenchephalic junction),CC and WM underneath left primary motor and premotor cortices.
Compared to HCs, ALS patients in clinical stage 2B (i.e., with impairment of two functionalregions) exhibited decreased FA (p<0.001, uncorrected) in the left cerebellar hemisphere,brainstem precerebellar nuclei and premotor cortex, beyond CC body andWM underneaththe left precentral gyrus (Fig. 1, middle panels). Moreover, MD and RD measures were in-creased (p<0.001, uncorrected) in WM underneath the left precentral gyrus, left and rightamygdala, left cerebellar hemisphere and brainstem precerebellar nuclei.
Comparing HCs to ALS patients in clinical stage 3 (i.e., with involvement of three functionalregions), we found decreased FA and increased MD and RD (p<0.05, corrected for multiplecomparisons) in WM underneath pre and postcentral gyri including the rostral part of CSTs,the body of CC, thalamic radiations, bilateral superior and inferior longitudinal and fronto-oc-cipital fasciculi, right uncinate fasciculus and midbrain (Fig. 1, lower panels; Table 2).
Differences between patient groups. Comparing ALS patients in clinical stage 2B to pa-tients in stage 2A, we observed a decreased FA (p<0.001, uncorrected) in the right insula, anincreased MD (p<0.001, uncorrected) in the left precentral gyrus and premotor cortex, and anincreased MD and RD in the brainstem at the ponto-mesenchephalic junction (p<0.001, un-corrected). Moreover, comparing ALS patients in clinical stage 3 to patients in stage 2B, wefound a decreased FA (p<0.001 uncorrected) in the brainstem at the ponto-mesenchephalicjunction, superior longitudinal fasciculi, WM underneath precentral and cingulate gyri, and in-creased MD and RD (p<0.05, corrected for multiple comparisons) bilaterally in thalamic radi-ations, superior and inferior longitudinal fasciculi, WM underneath precentral gyri, CC bodyand right uncinate fasciculus.
Voxel-wise correlation analysis. In each clinical stage examined, we detected significantpositive correlations between FA and ALSFRS-R and ACE-R scores (p<0.05, corrected for mul-tiple comparisons) in the midpart of CC, superior and inferior longitudinal and fronto-occipitalfasciculi and within WM underneath primary motor and premotor cortices, inferior frontal andtemporal gyri, supramarginal gyri, visual cortices and brainstem at the ponto-mesenchephalicjunction (Fig. 2). Moreover, these widespread patterns of correlation were observed in all clinical
Fig 1. FA differences between ALS patients in the three stages of ALS and healthy controls. in thestage 2A, FA decrease (red-yellow scale, p<0.05, corrected) is evident in the body of CC and leftcorticospinal tract (CST), principally in its rostral part underneath primary motor cortex (upper panels); in thestage 2B, FA decrease (red-yellow scale, p<0.001, uncorrected) occurs in the left cerebellar hemisphere,beyond CC body andWM underneath the left precentral gyrus (middle panels); in the stage 3, FA decrease(red-yellow scale) (p<0.05, corrected) is highlighted in WM underneath pre and postcentral gyri including therostral part of CSTs, the body of CC, bilateral superior and inferior longitudinal and inferior fronto-occipitalfasciculi (lower panels).
doi:10.1371/journal.pone.0119045.g001
Microstructural Brain Changes in ALS Course
PLOS ONE | DOI:10.1371/journal.pone.0119045 March 20, 2015 6 / 17

Tab
le2.
Mea
nva
lues
ofFA,R
Dan
dMDin
thevo
lumes
ofinterest
(VOIs),derived
from
JohnsHopkinsUniversity
(JHU,B
altim
ore,M
arylan
d)whitemattertrac
tography
Atla
sofFSL[41,
42],whichsh
owed
significa
ntdifferen
cesco
mparingthethreegroupsofpatients
tohea
lthyco
ntrols
(HCs).
VOIs
(MNIx
,y,z
)FAmea
nva
lues
(Tva
lues
)RDmea
nva
lues
(Tva
lues
)MDmea
nva
lues
(Tva
lues
)
2A2B
*3
HCs
2A*
2B*
3HCs
2A*
2B*
3HCs
CCbo
dy0;
−9;
280.48
89(2.579
51)
0.50
770.48
882
(2.176
37)
0.51
987
0.00
074
0.00
072
0.00
105
(2.197
38)
0.00
101
0.00
110.00
10.00
117
(2.032
13)
0.00
114
LeftCST(in
ferio
rVOI)
**−7;
−23
;−29
0.54
567
0.54
627
0.53
821
(2.098
96)
0.56
732
0.00
054
(1.437
3)0.00
052
0.00
055
(2.210
23)
0.00
051
0.00
081
(1.324
77)
0.00
078
0.00
082
0.00
079
LeftCST(sup
erior
VOI)**
−22
;−33
;35
0.44
143
(2.324
83)
0.44
909
0.43
361
(2.153
39)
0.45
385
0.00
059
(2.791
2)0.00
056
0.00
060
(2.446
86)
0.00
056
0.00
079
(3.736
85)
0.00
077
0.00
080
(2,315
10)
0.00
077
Pon
to−mes
ench
epha
licjunc
tion2;
−28
;36
0.51
765
0.50
049
0.53
165
(1.702
43)
0.55
187
0.00
052
(1.863
9)0.00
054
0,00
053
(1.789
)0.00
048
0.00
075
(1.602
80)
0.00
076
0.00
078
0.00
074
Leftthalam
icradiations
−8;
−9;
30.44
482
0.45
072
0.43
890
(1.768
17)
0.46
144
0.00
062
0.00
062
0.00
065
(1.805
31)
0.00
061
0.00
086
0.00
085
0.00
087
(1.825
58)
0.00
084
Right
thalam
icradiations
7;−9;
40.44
887
0.46
616
0.44
470
(1.898
31)
0.46
963
0.00
062
0.00
060
0.00
065
(1.881
79)
0.00
061
0.00
085
0.00
084
0.00
088
(1.994
24)
0.00
085
LeftSLF
−39
;−14
;30
0.37
914
(2.486
82)
0.38
617
(1.680
64)
0.37
017
(2.047
54)
0.39
655
0.00
062
0.00
061
0.00
064
(2.183
2)0.00
060.00
078
(3.190
22)
0.00
077
0.00
077
(2.067
01)
0.00
077
Right
SLF
50;−
5;27
0.37
978
0.38
754
0.37
158
(1.992
08)
0.39
201
0.00
061
0.00
061
0.00
064
(1.982
37)
0.00
060
0.00
078
0.00
077
0.00
080
(1.929
72)
0.00
078
LeftILF−30
;−69
;−3
0.44
682
0.44
341
0.43
250
(1.917
77)
0.45
772
0.00
075
0.00
073
0.00
079
(1.815
35)
0.00
074
0.00
101
0.00
098
0.00
104
(1.948
66)
0.00
100
Right
ILF31
;−69
;−3
0.46
276
0.46
223
0.44
887
(1.890
97)
0.47
409
0.00
068
0.00
066
0.00
071
(1.833
10)
0.00
065
0.00
094
0.00
091
0.00
096
(1.933
83)
0.00
091
LeftIFOF−28
;−72
;−2
0.38
364
0.38
461
(1.924
36)
0.37
350
(1.913
86)
0.39
329
0.00
071
0.00
071
0.00
074
(1.813
98)
0.00
070
0.00
091
0000
90.00
094
(1.880
59)
0.00
091
Right
IFOF29
;38;
30.38
069
0.38
653
0.39
339
(1.792
48)
0.39
339
0.00
070
0.00
069
0.00
073
(1.792
7)0.00
069
0.00
090.00
088
0.00
092
(1.877
16)
0.00
089
Right
uncina
tefasciculus
27;1
3;−7
0.31
557
0.31
871
0.32
374
(1.679
58)
0.32
374
0.00
074
0.00
072
0.00
077
(1.631
83)
0.00
074
0.00
089
0.00
088
0.00
093
(1.746
93)
0.00
090
Amigda
la(le
ft)−23
;−8;
100.17
423
0.18
179
(2.541
73)
0.17
768
(1.808
87)
0.17
582
0.00
119
(2.817
)0.00
119
(2.803
5)0.00
123
(1.591
72)
0.00
113
0.00
130
(1.723
4)0.00
130
(2.880
3)0.00
135
0.00
123
Amigda
la(right)26
;−7;
−9
0.16
707
0.17
126
0.16
806
(2.253
70)
0.17
027
0.00
133
(3.214
)0.00
128
(2.788
2)0.00
137
0.00
129
0.00
144
(2.001
9)0.00
139
(2.754
)0.00
148
0.00
140
Tva
lues
,whe
nsign
ifica
nt,a
reindica
tedin
brac
kets.
CC=co
rpus
callosu
m;C
ST=co
rticos
pina
ltract;IFOF=inferio
rfron
to-occipita
lfas
cicu
lus;
ILF=inferio
rlong
itudina
lfas
cicu
lus;
SLF
=su
perio
rlong
itudina
lfas
cicu
lus;
VOI=
volumeof
interest
*Tva
lues
which
resu
ltedsign
ifica
ntat
anun
correc
tedleve
l(p<
0.00
1);
**Inferio
rVOIo
fCSTex
tend
from
thepre-
andpo
st-ce
ntralg
yritothece
rebral
pedu
ncles;
supe
riorVOIo
fCSTex
tend
from
thece
rebral
pedu
nclesto
theca
udal
portionof
thepo
ns.
doi:10.1371/journal.pone.0119045.t002
Microstructural Brain Changes in ALS Course
PLOS ONE | DOI:10.1371/journal.pone.0119045 March 20, 2015 7 / 17
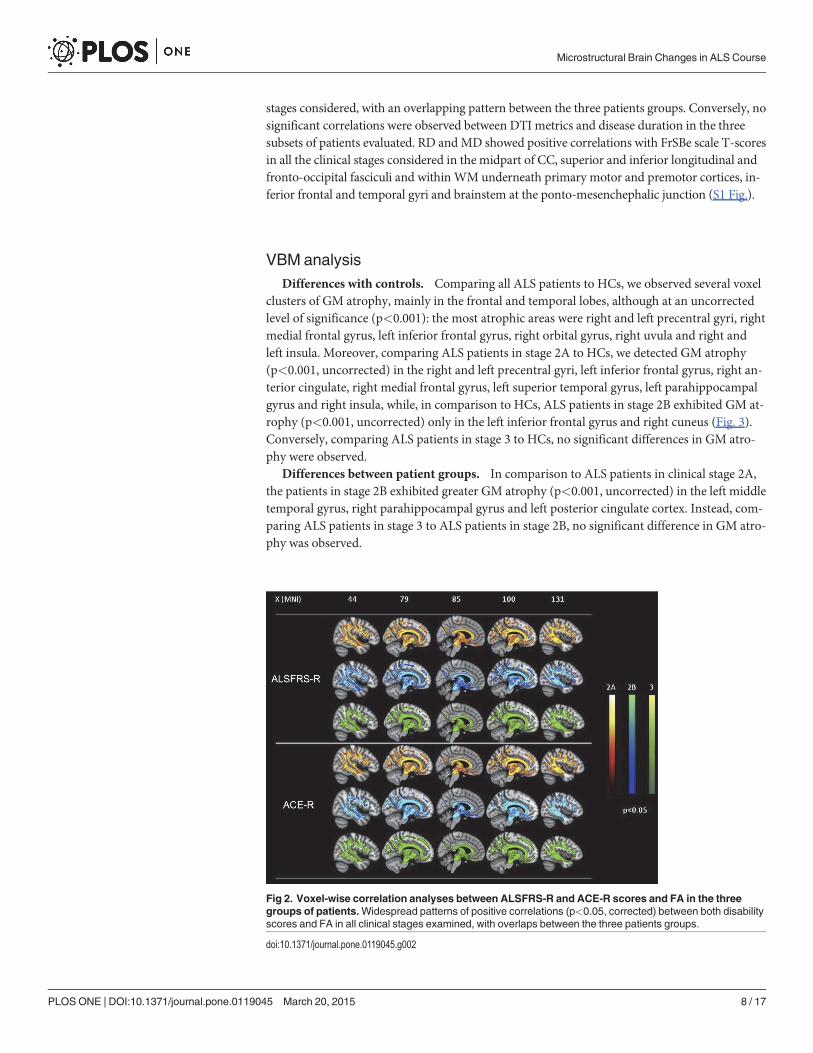
stages considered, with an overlapping pattern between the three patients groups. Conversely, nosignificant correlations were observed between DTI metrics and disease duration in the threesubsets of patients evaluated. RD andMD showed positive correlations with FrSBe scale T-scoresin all the clinical stages considered in the midpart of CC, superior and inferior longitudinal andfronto-occipital fasciculi and within WM underneath primary motor and premotor cortices, in-ferior frontal and temporal gyri and brainstem at the ponto-mesenchephalic junction (S1 Fig.).
VBM analysisDifferences with controls. Comparing all ALS patients to HCs, we observed several voxel
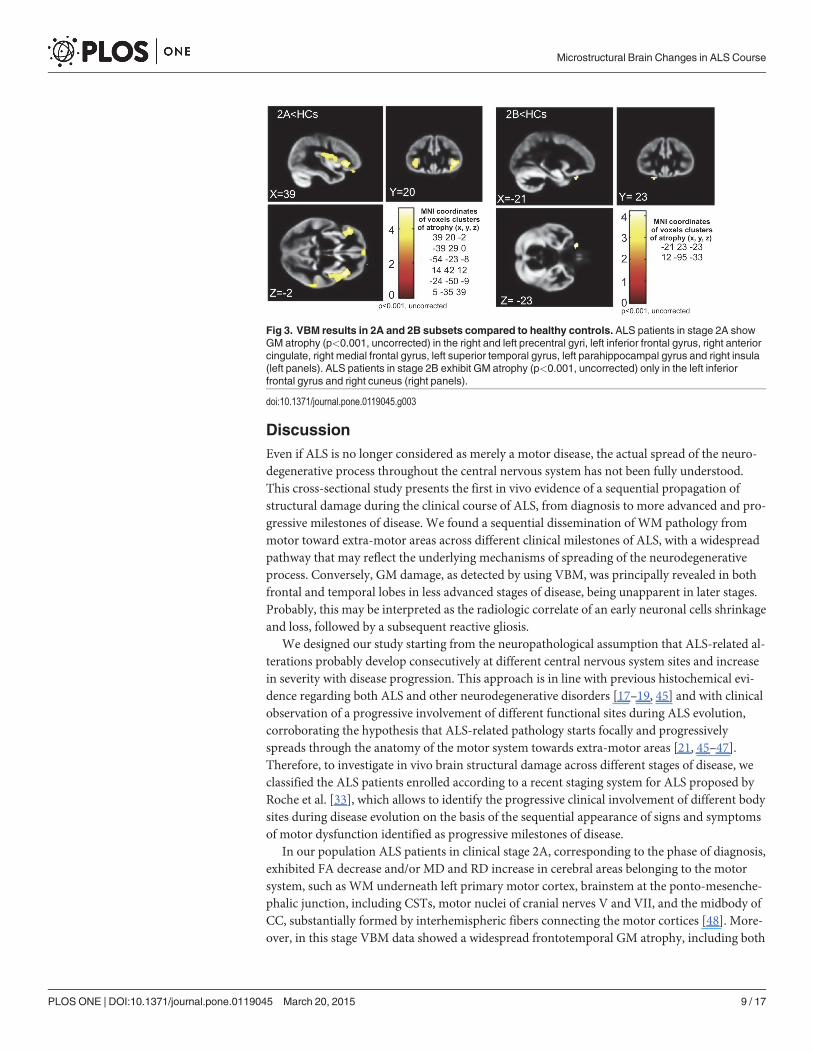
clusters of GM atrophy, mainly in the frontal and temporal lobes, although at an uncorrectedlevel of significance (p<0.001): the most atrophic areas were right and left precentral gyri, rightmedial frontal gyrus, left inferior frontal gyrus, right orbital gyrus, right uvula and right andleft insula. Moreover, comparing ALS patients in stage 2A to HCs, we detected GM atrophy(p<0.001, uncorrected) in the right and left precentral gyri, left inferior frontal gyrus, right an-terior cingulate, right medial frontal gyrus, left superior temporal gyrus, left parahippocampalgyrus and right insula, while, in comparison to HCs, ALS patients in stage 2B exhibited GM at-rophy (p<0.001, uncorrected) only in the left inferior frontal gyrus and right cuneus (Fig. 3).Conversely, comparing ALS patients in stage 3 to HCs, no significant differences in GM atro-phy were observed.
Differences between patient groups. In comparison to ALS patients in clinical stage 2A,the patients in stage 2B exhibited greater GM atrophy (p<0.001, uncorrected) in the left middletemporal gyrus, right parahippocampal gyrus and left posterior cingulate cortex. Instead, com-paring ALS patients in stage 3 to ALS patients in stage 2B, no significant difference in GM atro-phy was observed.
Fig 2. Voxel-wise correlation analyses between ALSFRS-R and ACE-R scores and FA in the threegroups of patients.Widespread patterns of positive correlations (p<0.05, corrected) between both disabilityscores and FA in all clinical stages examined, with overlaps between the three patients groups.
doi:10.1371/journal.pone.0119045.g002
Microstructural Brain Changes in ALS Course
PLOS ONE | DOI:10.1371/journal.pone.0119045 March 20, 2015 8 / 17
DiscussionEven if ALS is no longer considered as merely a motor disease, the actual spread of the neuro-degenerative process throughout the central nervous system has not been fully understood.This cross-sectional study presents the first in vivo evidence of a sequential propagation ofstructural damage during the clinical course of ALS, from diagnosis to more advanced and pro-gressive milestones of disease. We found a sequential dissemination of WM pathology frommotor toward extra-motor areas across different clinical milestones of ALS, with a widespreadpathway that may reflect the underlying mechanisms of spreading of the neurodegenerativeprocess. Conversely, GM damage, as detected by using VBM, was principally revealed in bothfrontal and temporal lobes in less advanced stages of disease, being unapparent in later stages.Probably, this may be interpreted as the radiologic correlate of an early neuronal cells shrinkageand loss, followed by a subsequent reactive gliosis.
We designed our study starting from the neuropathological assumption that ALS-related al-terations probably develop consecutively at different central nervous system sites and increasein severity with disease progression. This approach is in line with previous histochemical evi-dence regarding both ALS and other neurodegenerative disorders [17–19, 45] and with clinicalobservation of a progressive involvement of different functional sites during ALS evolution,corroborating the hypothesis that ALS-related pathology starts focally and progressivelyspreads through the anatomy of the motor system towards extra-motor areas [21, 45–47].Therefore, to investigate in vivo brain structural damage across different stages of disease, weclassified the ALS patients enrolled according to a recent staging system for ALS proposed byRoche et al. [33], which allows to identify the progressive clinical involvement of different bodysites during disease evolution on the basis of the sequential appearance of signs and symptomsof motor dysfunction identified as progressive milestones of disease.
In our population ALS patients in clinical stage 2A, corresponding to the phase of diagnosis,exhibited FA decrease and/or MD and RD increase in cerebral areas belonging to the motorsystem, such as WM underneath left primary motor cortex, brainstem at the ponto-mesenche-phalic junction, including CSTs, motor nuclei of cranial nerves V and VII, and the midbody ofCC, substantially formed by interhemispheric fibers connecting the motor cortices [48]. More-over, in this stage VBM data showed a widespread frontotemporal GM atrophy, including both
Fig 3. VBM results in 2A and 2B subsets compared to healthy controls. ALS patients in stage 2A showGM atrophy (p<0.001, uncorrected) in the right and left precentral gyri, left inferior frontal gyrus, right anteriorcingulate, right medial frontal gyrus, left superior temporal gyrus, left parahippocampal gyrus and right insula(left panels). ALS patients in stage 2B exhibit GM atrophy (p<0.001, uncorrected) only in the left inferiorfrontal gyrus and right cuneus (right panels).
doi:10.1371/journal.pone.0119045.g003
Microstructural Brain Changes in ALS Course
PLOS ONE | DOI:10.1371/journal.pone.0119045 March 20, 2015 9 / 17

motor and extra-motor areas, although at an uncorrected level of significance. These patternsof structural impairment resemble what has been previously described by histochemical analy-ses in early stages of disease, characterized by extensive accumulation of pathologic TDP-43 ag-gregates principally in cerebral and spinal motor areas [3, 22, 23]. In fact, early degeneration inALS has been proven in large Betz and smaller pyramidal neurons which projected their axonsto form CSTs [49, 50], with an active and at least partially independent bilateral cortical processof degeneration followed by secondary damage of the CC according to a corticofugal model[17, 46]. Moreover, degeneration of brainstem somatomotor nuclei has been previously de-scribed in early stages of ALS [3, 23], also showing significant correlations with clinical appear-ance of facial and mandibular weakness. In this regard, the small number of subjects withbulbar onset enrolled did not allow us to compare the DTI patterns depicted in these patientsto those observed in ALS patients with limbs onset. However, some neuropathological [23] andDTI [51, 52] analyses have reported different patterns of GM andWM damage in cortical andbrainstem motor areas when comparing ALS patients with different disease onset.
It is worth noting that in the earliest clinical stage of ALS we found widespread GM andWM alterations, involving several extra-motor frontotemporal regions, such as premotor, pre-frontal, anterior cingulate, orbitofrontal and parahippocampal cortices and insular gyri. Theseresults clearly resemble the cognitive and neuropsychiatric changes typical of frontotemporaldegeneration and described in ALS patients from early stages of disease [9–12]. Moreover, anumber of recent morphometric [9, 30–32, 53] and DTI [54–56] studies, performed in severalcohorts of mildly disabled, non-demented ALS patients, have revealed significant correlationsbetween measures of cognitive or behavioral dysfunctions and widespread GM andWM fron-totemporal abnormalities, corroborating the evidence that ALS belongs to the disease spectrumof FTLD.
When clinical impairment involved two functional regions, that is in ALS patients in clinicalstage 2B, we found that WM damage, corresponding to FA decrease and/or MD and RD in-crease, showed wider extension to some subcortical areas than in the previous clinical stage. Infact, in the second group of ALS patients compared to HCs we detected some clusters of voxelswith decreased FA and increased MD and RD in the WM within left cerebellar hemisphere andbrainstem precerebellar nuclei, especially the pontine inferior olivary complex, beyond observ-ing microstructural impairment of CC body and WM underneath left motor and premotorcortices, also described in the previous subset of patients.
With regard to brainstem and cerebellar damage in an intermediate stage of disease, it is totake into account that degeneration of pontine precerebellar nuclei, which receive direct or in-direct efferents from the layer V of the agranular neocortex within cortico-pontine-cerebellaror cortico-rubro-olivo-cerebellar tracts, has also been reported in autopsied ALS cases with oc-ulomotor dysfunction, but without axial or limbs ataxia [23, 57, 58]. None of our patients instage 2B exhibited oculomotor, axial or limbs alterations correlated to cerebellar damage, prob-ably because axial or limbs symptoms may have been masked by predominant spastic and/oratrophic alterations correlated to motor neurons degeneration, while oculomotility pathwayshave been proven frequently spared in ALS [59].
Notably, increasing neuropathological [60, 61] and MRI [62, 63] evidence lay for a multisys-temic neurodegeneration in ALS including damage of several subcortical areas, including cere-bellum. Furthermore, some recent studies have revealed that ALS cases associated with repeatexpansions in C9ORF72, characterized by phenotypes of frontotemporal dementia with motorneuron disease and without cerebellar signs, have typical cerebellar p62-positive, TDP-43 nega-tive cellular inclusions [60, 61] and show microstructural changes and cortical thinning in thecerebellum [64]. Furthermore, recent functional MRI [62, 65] and 18-fluorodeoxyglucose posi-tron emission tomography [66] findings, derived from investigation of some heterogeneous
Microstructural Brain Changes in ALS Course
PLOS ONE | DOI:10.1371/journal.pone.0119045 March 20, 2015 10 / 17

cohorts of ALS patients, have proven a marked networks hyper-connection and glucose hyper-metabolism spanning subcortical motor areas, principally involving putamen, midbrain, andcerebellum, probably related to an attempt to compensate for the limited primary motor cortexactivation. Hence, these results all together confirm that ALS pathology has impact on wide-spread non-cortical areas whose involvement is not apparent on clinical examination, reflect-ing the activation of functional plasticity mechanisms in response to the progressive spread ofthe degenerative process [62].
ALS cases in clinical stage 3, that is patients with involvement of a third functional region,showed the most widespread pattern of WM impairment affecting both motor and extra-motor fiber tracts, such as bilateral CSTs, CC body, bilateral superior and inferior longitudinaland fronto-occipital fasciculi and right uncinate fasciculus. Moreover, comparing ALS patientsin this advanced stage of disease to subjects in the previous stage 2B, it is noteworthy that WMof both hemispheres were impaired, with a more marked impairment of long associative tracts.This pattern of spreading of ALS-related pathology towards extra-motor neocortices, such asprefrontal and postcentral cortices, is consistent with the striking clinical evidence of cognitiveand behavioral dysfunctions and nociceptive alterations mostly described in ALS patients withsevere clinical pictures and longer disease course [12, 67, 68]. Moreover, histochemical data byBrettschneider et al. [23] about dissemination of TDP-43 lesions across brain areas with ongo-ing disease have revealed a wider spreading of TDP-43 pathology towards prefrontal cortices inadvanced ALS patients also affected by executive dysfunctions. In line with these correlations,in patients classified in stage 3 undergone a neuropsychological examination, we observed atrend of decrease of ACE-R scores and increase of FrSBe scale T-scores than in the other sub-sets of patients, which is indicative of more impaired cognitive and behavioral performances(Table 1).
It is worth noting that, although we showed some correspondence between the progressiveextent of microstructural abnormalities across three clinical stages of ALS and the spreadingpattern of TDP-43 pathology previously described by Brettschneider et al. [23], we did not aimto explore the DTI and VBM correlates of TDP-43 stages of disease, as performed in a recentfiber tracking analysis by Kassubek et al. [26]. Brettschneider et al. [23] showed the first evi-dence of the progression of TDP-43 pathology across 4 sequential stages in a large cohort ofALS autopsy cases. Conversely, in our cross-sectional study we analyzed DTI and VBM abnor-malities in three groups of phenotypically well-characterized ALS patients who exhibited dif-ferent milestones of ALS progression, observing a sequential pattern of microstructuraldamage which seems to resemble the process of disease spreading previously hypothesized atan anatomical level [21].
With regard to VBM results, widespread frontotemporal GM atrophy was observed in allALS patients compared to HCs, but, comparing each subset of patients to HCs, atrophic GMareas appeared to be progressively less numerous and widespread from stage 2A to stage 3. Spe-cifically, comparing patients in clinical stage 3 to HCs, we found no significant differences inGM atrophy. A similar decreasing ability of measuring GM atrophy from less to more ad-vanced stages of ALS has been reported in previous neuropathological [69, 70] and morpho-metric [29, 71, 72] studies, which emphasized the limitations of assessing longitudinalmeasures of cortical atrophy or thinning in ALS, especially within cortical motor areas. Howev-er, a recent 6-monthly longitudinal MRI analysis by Menke et al. [31], performed in a large co-hort of sporadic ALS patients, has revealed a limited progression of WM pathology in contrastwith increasing GM changes particularly in subcortical areas, including basal ganglia. A possi-ble explanation of these inconsistent results about longitudinal GMmeasures may derive fromthe occurrence of an hypothetical “ceiling phenomenon” in more advanced stages of disease re-lated to reactive gliosis in the deep layers of the motor cortex, which could “mask” tissue loss,
Microstructural Brain Changes in ALS Course
PLOS ONE | DOI:10.1371/journal.pone.0119045 March 20, 2015 11 / 17

especially in the motor cortex [69, 70]. Moreover, Kwan et al. [73], who examined longitudinalchanges of GM volume and cortical thickness in a cohort of 9 ALS and 12 primary lateral scle-rosis (PLS) patients, showed that disease duration may influence these longitudinal measures,revealing a greater rate of cortical thinning in ALS patients with shorter disease course. There-fore, it may be hypothesized that in ALS cortical damage occurs in a non-linear fashion, show-ing an early rapid phase of decline, detected in patients with faster disease evolution, followedby a longer, slower phase of cortical thinning, which may characterize patients with longer dis-ease course. This theory could be helpful to explain our observation of no significant GM atro-phy in the most advanced stage of disease, considering that ALS patients with longer diseaseduration were more represented in the subset of patients in stage 3 (Table 1).
With regard to correlation analysis between clinical features and DTI parameters, we identi-fied significant correlations between FA and both global and cognitive disability scores (i.e.,ALSFRS-R and ACE-R) in motor (i.e., WM underneath primary motor cortices, CSTs at theponto-mesenchephalic junction, midpart of CC) and extra-motor regions (i.e., WM under-neath premotor and visual cortices, inferior frontal and temporal gyri, supramarginal gyri, andsuperior, inferior longitudinal and fronto-occipital fasciculi), as well as between MD and RDand FrSBe scale T-scores. Remarkably, in all clinical stages examined we observed similar wide-spread patterns of voxelwise correlations. These data are consistent with previous correlationanalyses between diffusivity parameters and clinical measure of disease severity and progres-sion performed in heterogeneous cohorts of ALS patients [7, 63, 74]. However, our results sug-gest that ALSFRS-R, ACE-R and FrSBe total scores, though determinant to characterizedisability degree and cognitive status, do not allow to identify different stages of structuralbrain damage during the disease course. To note, cognitive abnormalities have not been con-sidered for establish an ALS staging system and clinical scores alone, such as disease durationand progression rate or ALSFRS-R score, have been shown lacking to define possible mile-stones for ALS staging. Specifically, disease progression over time has been proven to be notlinear, but curvilinear [75], and ALSFRS- R scale, which measures a single aggregate score relat-ed to many different modalities indicative of functional progression, does not include mile-stones [37]. Conversely, the staging system for ALS proposed by Roche et al. [33], based onsimple clinical milestones of the natural history of ALS, was particularly useful for classifyingthe patients examined in clinical stages, each one of which reflecting the increasing severity ofthe disease. Interestingly, the King's system proposed by Roche et al. [33] is easy to use becauseit corresponds both to information discovered by the neurologist and symptoms reported bythe patient, simply referring to the detection of neurological weakness in one or more of threecommonly body sites explored (i.e., bulbar, cervical and lumbar). However, a possible limita-tion of such classification may be related to the different clinical consequences of impairmentof different sites (especially with regard to bulbar or diaphragmatic involvement), althoughclinical progression, linked to degeneration of respiratory or swallowing function, implies theclassification in the highest stage of disease.
This study has a major limitation related to sample size and characteristics of patients stud-ied. In fact, the recruitment of ALS patients in three consecutive, intermediate stages of disease,although useful for depicting DTI and VBM structural patterns of abnormalities across mostpart of the ALS course, unavoidably hindered to investigate the whole spectrum of diseasewhich would have required the inclusion of patients at onset or later stages of disease. More-over, the sample of patients investigated was relatively small, although comparable with thoseanalyzed in previous DTI studies [5,7,8,24, 56,76]. As a consequence, DTI and VBM resultsmight not survive the correction for multiple comparisons, leading to the risk of false-positiveresults. Furthermore, we cannot exclude that neuroimaging findings may result borderline be-cause of confounding factors, such as clinical and pathological heterogeneity, typically
Microstructural Brain Changes in ALS Course
PLOS ONE | DOI:10.1371/journal.pone.0119045 March 20, 2015 12 / 17

underlying the ALS-related disease process [1]. Another relevant major limitation of our studyis linked to the cross-sectional design of our analysis, which allowed only to compare at onetime different clinical stages of disease from different groups of patients, instead of performinglongitudinal exams. However, it is to take into account that MRI longitudinal studies have beenproven quite difficult to be performed for longer periods than 12 months [31, 63, 76], probablybecause of the severe clinical progression typical of the disease, which makes arduous to exe-cute repeated MRI exams.
In conclusion, our findings imply that microstructural alterations disseminate in a sequen-tial manner across different clinical stages of ALS, helping to expand our understanding of theprogressive spread of neurodegeneration. However, the patterns observed could not reflect ex-actly the pathological process underlying disease evolution, also considering the limitationsderived from a relatively small number of subjects examined and the cross-sectional design ofthe study. In fact, although our results indicate a gradual dissemination of ALS-related patholo-gy from motor towards extra-motor areas across different clinical stages of disease, the bio-chemical mechanisms involved in dissemination of the neurodegenerative process are still tobe clarified.
Supporting InformationS1 Fig. Voxel-wise correlation analysis between FrSBe scale T-scores and RD and MDmea-sures.Widespread positive correlations (p<0.05, corrected) between FrSBe scale T-scores andRD and MD in all clinical stages examined, with overlapping patterns between the threepatients groups.(JPG)
Author ContributionsConceived and designed the experiments: FT GC DC FE GT. Performed the experiments: FTFE GC DC. Analyzed the data: FT GC DC. Contributed reagents/materials/analysis tools: FTMRMMC GP VC TF CF. Wrote the paper: FT FE GT.
References1. Kiernan MC, Vucic S, Cheah BC, Turner MR, Eisen A, Hardiman O, et al. Amyotrophic lateral sclerosis.
Lancet 2011; 377: 942–955. doi: 10.1016/S0140-6736(10)61156-7 PMID: 21296405
2. Geser F, Brandmeir NJ, Kwong LK, Martinez-Lage M, Elman L, McCluskey L, et al. Evidence of multi-system disorder in whole-brain map of pathological TDP-43 in amyotrophic lateral sclerosis. Arch Neu-rol. 2008; 65: 636–641. doi: 10.1001/archneur.65.5.636 PMID: 18474740
3. Geser F, Martinez-Lage M, Robinson J, Uryu K, Neumann M, Brandmeir NJ, et al. Clinical and patho-logical continuum of multisystem TDP-43 proteinopathies. Arch Neurol. 2009; 66: 180–189. doi: 10.1001/archneurol.2008.558 PMID: 19204154
4. Kassubek J, Ludolph AC, Müller HP. Neuroimaging of motor neuron diseases. Ther Adv Neurol Disord.2012; 5: 119–127. doi: 10.1177/1756285612437562 PMID: 22435076
5. Agosta F, Pagani E, Rocca MA, Caputo D, Perini M, Salvi F, et al. Voxel based morphometry study ofbrain volumetry and diffusivity in amyotrophic lateral sclerosis patients with mild disability. Hum BrainMapp. 2007; 28: 1430–1438. PMID: 17370339
6. Agosta F, Valsasina P, Riva N, Copetti M, Messina MJ, Prelle A, et al. The cortical signature of amyotro-phic lateral sclerosis. PLoS One 2012; 7: e42816. doi: 10.1371/journal.pone.0042816 PMID:22880116
7. Cirillo M, Esposito F, Tedeschi G, Caiazzo G, Sagnelli A, Piccirillo G, et al. Widespread microstructuralwhite matter involvement in amyotrophic lateral sclerosis: a whole-brain DTI study. AJNR Am J Neuror-adiol. 2012; 33: 1102–1108. doi: 10.3174/ajnr.A2918 PMID: 22300932
Microstructural Brain Changes in ALS Course
PLOS ONE | DOI:10.1371/journal.pone.0119045 March 20, 2015 13 / 17

8. Lillo P, Mioshi E, Burrell JR, Kiernan MC, Hodges JR, Hornberger M. Grey and white matter changesacross the amyotrophic lateral sclerosis/frontotemporal dementia continuum. PLoS One 2012; 7:e43993. doi: 10.1371/journal.pone.0043993 PMID: 22952843
9. Mioshi E, Lillo P, Yew B, Hsieh S, Savage S, Hodges JR, et al. Cortical atrophy in ALS is critically asso-ciated with neuropsychiatric and cognitive changes. Neurology 2013; 80: 1117–1123. doi: 10.1212/WNL.0b013e31828869da PMID: 23427327
10. Ringholz GM, Appel SH, BradshawM, Cooke NA, Mosnik DM, Schulz PE. Prevalence and patterns ofcognitive impairment in sporadic ALS. Neurology 2005; 65: 586–590. PMID: 16116120
11. Abrahams S, Leigh PN, Goldstein LH. Cognitive change in ALS: a prospective study. Neurology 2005;64: 1222–1226. PMID: 15824350
12. Phukan J, Pender NP, Hardiman O. Cognitive impairment in amyotrophic lateral sclerosis. Lancet Neu-rol. 2007; 6: 994–1003. PMID: 17945153
13. Renton AE, Majounie E, Waite A, Simón-Sánchez J, Rollinson S, Gibbs JR, et al. A hexanucleotide re-peat expansion in C9ORF72 is the cause of chromosome 9p21-linked ALS-FTD. Neuron 2011; 72:257–268. doi: 10.1016/j.neuron.2011.09.010 PMID: 21944779
14. Chiò A, Borghero G, Restagno G, Mora G, Drepper C, Traynor BJ, et al. Clinical characteristics of pa-tients with familial amyotrophic lateral sclerosis carrying the pathogenic GGGGCC hexanucleotide re-peat expansion of C9ORF72. Brain 2012; 135: 784–793. doi: 10.1093/brain/awr366 PMID: 22366794
15. Ling SC, Polymenidou M, Cleveland DV. Converging mechanisms in ALS and FTD: disrupted RNAand protein homeostasis. Neuron 2013; 79: 416–438. doi: 10.1016/j.neuron.2013.07.033 PMID:23931993
16. Thomas M, Alegre-Abarrategui J, Wade-Martins R. RNA dysfunction and aggrephagy at the centre ofan amyotrophic lateral sclerosis/frontotemporal dementia disease continuum. Brain 2012; 136: 1345–1360.
17. Braak H, Brettschneider J, Ludolph AC, Lee VM, Trojanowski JQ, Del Tredici K. Amyotrophic lateralsclerosis—a model of corticofugal axonal spread. Nat Rev Neurol. 2013; 9:708–714. doi: 10.1038/nrneurol.2013.221 PMID: 24217521
18. Clavaguera F, Bolmont T, Crowther RA, Abramowski D, Frank S, Probst A, et al. Transmission andspreading of tauopathy in transgenic mouse brain. Nat Cell Biol. 2009; 11: 909–913. doi: 10.1038/ncb1901 PMID: 19503072
19. Luk KC, Kehm V, Carroll J, Zhang B, O'Brien P, Trojanowski JQ, et al. Pathological alpha-synucleintransmission initiates Parkinson-like neurodegeneration in nontransgenic mice. Science 2012; 338:949–953. doi: 10.1126/science.1227157 PMID: 23161999
20. CushmanM, Johnson BS, King OD, Gitler AD, Shorter J. Prion-like disorders: blurring the divide be-tween transmissibility and infectivity. J Cell Sci 2010; 123: 1191–1201. doi: 10.1242/jcs.051672 PMID:20356930
21. Ravits JM, La Spada AR. ALSmotor phenotype heterogeneity, focality, and spread. Neurology 2009;73: 805–811. doi: 10.1212/WNL.0b013e3181b6bbbd PMID: 19738176
22. Ravits J, Paul P, Jorg C. Focality of upper and lower motor neuron degeneration at the clinical onset ofALS. Neurology 2007; 68: 1571–1575. PMID: 17485643
23. Brettschneider J, Del Tredici K, Toledo JB, Robinson JL, Irwin DJ, GrossmanM, et al. Stages of pTDP-43 pathology in amyotrophic lateral sclerosis. Ann Neurol. 2013; 74: 20–38. doi: 10.1002/ana.23937PMID: 23686809
24. Filippini N, Douaud G, Mackay CE, Knight S, Talbot K, Turner MR. Corpus callosum involvement is aconsistent feature of amyotrophic lateral sclerosis. Neurology 2010; 75:1645–1652. doi: 10.1212/WNL.0b013e3181fb84d1 PMID: 21041787
25. Tsermentseli S, Leigh PN, Goldstein LH. The anatomy of cognitive impairment in amyotrophic lateralsclerosis: more than frontal lobe dysfunction. Cortex 2012; 48: 166–182. doi: 10.1016/j.cortex.2011.02.004 PMID: 21396632
26. Kassubek J, Müller HP, Del Tredici K, Brettschneider J, Pinkhardt EH, Lulé D, et al. Diffusion tensor im-aging analysis of sequential spreading of disease in amyotrophic lateral sclerosis confirms patterns ofTDP-43 pathology. Brain 2014; 137: 1733–1740. doi: 10.1093/brain/awu090 PMID: 24736303
27. Ashburner J, Friston KJ. Voxel-based morphometry—the methods. NeuroImage 2000; 11: 805–821.PMID: 10860804
28. Fischl B, Dale AM. Measuring the thickness of the human cerebral cortex frommagnetic resonance im-ages. Proc Natl Acad Sci USA. 2000; 97:11050–1155. PMID: 10984517
29. Mezzapesa DM, Ceccarelli A, Dicuonzo F, Carella A, De Caro MF, Lopez M, et al. Whole-brain and re-gional brain atrophy in amyotrophic lateral sclerosis. AJNR Am J Neuroradiol. 2007; 28: 255–259.PMID: 17296989
Microstructural Brain Changes in ALS Course
PLOS ONE | DOI:10.1371/journal.pone.0119045 March 20, 2015 14 / 17

30. GrossmanM, Anderson C, Khan A, Avants B, Elman L, McCluskey L. Impaired action knowledge inamyotrophic lateral sclerosis. Neurology 2008; 71: 1396–1401. doi: 10.1212/01.wnl.0000319701.50168.8c PMID: 18784377
31. Menke RA, Körner S, Filippini N, Douaud G, Knight S, Talbot K, et al. Widespread grey matter patholo-gy dominates the longitudinal cerebral MRI and clinical landscape of amyotrophic lateral sclerosis.Brain 2014; 137: 2546–2555. doi: 10.1093/brain/awu162 PMID: 24951638
32. Schuster C, Kasper E, Dyrba M, Machts J, Bittner D, Kaufmann J, et al. Cortical thinning and its relationto cognition in amyotrophic lateral sclerosis. Neurobiol Aging 2014; 35: 240–246. doi: 10.1016/j.neurobiolaging.2013.07.020 PMID: 23992619
33. Roche JC, Rojas-Garcia R, Scott KM, Scotton W, Ellis CE, Burman R, et al. A proposed staging systemfor amyotrophic lateral sclerosis. Brain 2012; 135: 847–852. doi: 10.1093/brain/awr351 PMID:22271664
34. Smith SM, Jenkinson M, Johansen-Berg H, Rueckert D, Nichols TE, Mackay CE, et al. Tract-basedspatial statistics: voxelwise analysis of multi-subject diffusion data. NeuroImage 2006; 31: 1487–1505.PMID: 16624579
35. Brooks BR, Miller RG, Swash M, Munsat TL, World Federation of Neurology Research Group on MotorNeuron Diseases. El Escorial revisited: revised criteria for the diagnosis of amyotrophic lateral sclero-sis. Amyotroph Lateral Scler Other Motor Neuron Disord. 2000; 1: 293–299. PMID: 11464847
36. Chiò A, Calvo A, Moglia C, Mazzini L, Mora G, PARALS study group. Phenotypic heterogeneity ofamyotrophic lateral sclerosis: a population based study. J Neurol Neurosurg Psychiatry 2011; 82: 740–746. doi: 10.1136/jnnp.2010.235952 PMID: 21402743
37. Cedarbaum JM, Stambler N, Malta E, Fuller C, Hilt D, Thurmond B, et al. The ALSFRS-R: a revisedALS functional rating scale that incorporates assessments of respiratory function. BDNF ALS StudyGroup (Phase III). J Neurol Sci. 1999; 169: 13–21. PMID: 10540002
38. Turner MR, Cagnin A, Turkheimer FE, Miller CC, Shaw CE, Brooks DJ, et al. Evidence of widespreadcerebral microglial activation in amyotrophic lateral sclerosis: an [(11)C](R)-PK11195 positron emissiontomography study. Neurobiol Dis. 2004; 15: 601–609. PMID: 15056468
39. Mioshi E, Dawson K, Mitchell J, Arnold R, Hodges JR. The Addenbrooke’s Cognitive Examination Re-vised (ACE-R): a brief cognitive test battery for dementia screening. Int J Geriatr Psychiatry 2006; 21:1078–1085. PMID: 16977673
40. Grace J, Stout JC, Malloy PF. Assessing frontal lobe behavioral syndromes with the frontal lobe per-sonality scale. Assessment 1999; 6: 269–284. PMID: 10445964
41. Hua K, Zhang J, Wakana S, Jiang H, Li X, Reich DS, et al. Tract probability maps in stereotaxic spaces:analysis of white matter anatomy and tract-specific quantification. NeuroImage 2008; 39: 336–347.PMID: 17931890
42. Wakana S, Caprihan A, Panzenboeck MM, Fallon JH, Perry M, Gollub RL, et al. Reproducibility ofquantitative tractography methods applied to cerebral white matter. NeuroImage 2007; 36: 630–644.PMID: 17481925
43. Mazziotta J, Toga AW, Evans AC, Fox PT, Lancaster J, Zilles K, et al. A probabilistic atlas and refer-ence system for the human brain: International Consortium for Brain Mapping (ICBM). Philos Trans RSoc London B Biol Sci. 2001; 356: 1293–1322. PMID: 11545704
44. Mazziotta J, Toga AW, Evans AC, Fox PT, Lancaster J, Zilles K, et al. Four-dimensional probabilisticatlas of the human brain. J AmMed Inform Assoc. 2001; 8: 401–430. PMID: 11522763
45. Ozawa T, Paviour D, Quinn NP, Josephs KA, Sangha H, Kilford L, et al. The spectrum of pathologicalinvolvement of the striatonigral and olivopontocerebellar systems in multiple system atrophy: clinico-pathological correlations. Brain 2004; 127: 2657–2671. PMID: 15509623
46. Eisen A. Amyotrophic lateral sclerosis: evolutionary and other perspectives. Muscle Nerve 2009; 40:297–304. doi: 10.1002/mus.21404 PMID: 19609920
47. Rosenbohm A, Kassubek J, Weydt P, Marroquin N, Volk AE, Kubisch C, et al. Can lesions to the motorcortex induce amyotrophic lateral sclerosis? J Neurol. 2014; 261: 283–290. doi: 10.1007/s00415-013-7185-7 PMID: 24253481
48. Chao YP, Cho KH, Yeh CH, Chou KH, Chen JH, Lin CP. Probabilistic topography of human corpus cal-losum using cytoarchitectural parcellation and high angular resolution diffusion imaging tractography.Hum Brain Mapp. 2009; 30: 3172–3187. doi: 10.1002/hbm.20739 PMID: 19241418
49. Brownell B, Oppenheimer DR, Hughes JT. The central nervous system in motor neuron disease. J Neu-rol Neurosurg Psychiatry 1970; 33: 338–357. PMID: 5431724
50. Kiernan JA, Hudson AJ. Changes in sizes of cortical and lower motor neurons in amyotrophic lateralsclerosis. Brain 1991; 114: 843–853. PMID: 2043953
Microstructural Brain Changes in ALS Course
PLOS ONE | DOI:10.1371/journal.pone.0119045 March 20, 2015 15 / 17
51. Prell T, Peschel T, Hartung V, Kaufmann J, Klauschies R, Bodammer N, et al. Diffusion tensor imagingpatterns differ in bulbar and limb onset amyotrophic lateral sclerosis. Clin Neurol Neurosurg. 2013;115: 1281–1287. doi: 10.1016/j.clineuro.2012.11.031 PMID: 23266262
52. Bede P, Bokde A, Elamin M, Byrne S, McLaughlin RL, Jordan N, et al. Grey matter correlates of clinicalvariables in amyotrophic lateral sclerosis (ALS): a neuroimaging study of ALSmotor phenotype hetero-geneity and cortical focality. J Neurol Neurosurg Psychiatry 2013; 84: 766–773. doi: 10.1136/jnnp-2012-302674 PMID: 23085933
53. Libon DJ, McMillan C, Avants B, Boller A, Morgan B, Burkholder L, et al. Deficits in concept formation inamyotrophic lateral sclerosis. Neuropsychology 2012; 26: 422–429. doi: 10.1037/a0028668 PMID:22612577
54. Sarro L, Agosta F, Canu E, Riva N, Prelle A, Copetti M, et al. Cognitive functions and white matter tractdamage in amyotrophic lateral sclerosis: a diffusion tensor tractography study. AJNR Am J Neuroradiol.2011; 32: 1866–1872. doi: 10.3174/ajnr.A2658 PMID: 22016410
55. Pettit LD, Bastin ME, Smith C, Bak TH, Gillingwater TH, Abrahams S. Executive deficits, not processingspeed relates to abnormalities in distinct prefrontal tracts in amyotrophic lateral sclerosis. Brain 2013;136: 3290–3304. doi: 10.1093/brain/awt243 PMID: 24056536
56. Tsujimoto M, Senda J, Ishihara T, Niimi Y, Kawai Y, Atsuta N, et al. Behavioural changes in early ALScorrelate with voxel based morphometry and diffusion tensor imaging. J Neurol Sci. 2011; 307: 34–40.doi: 10.1016/j.jns.2011.05.025 PMID: 21641004
57. Donaghy C, Thurtell MJ, Pioro EP, Gibson JM, Leigh RJ. Eye movements in amyotrophic lateral sclero-sis and its mimics: a review with illustrative cases. J Neurol Neurosurg Psychiatry 2011; 82: 110–116.doi: 10.1136/jnnp.2010.212407 PMID: 21097546
58. Sharma R, Hicks S, Berna CM, Kennard C, Talbot K, Turner MR. Oculomotor dysfunction in amyotro-phic lateral sclerosis: a comprehensive review. Arch Neurol. 2011; 68: 857–861. doi: 10.1001/archneurol.2011.130 PMID: 21747027
59. Beaufils E, Corcia P, de Toffol B, Praline J. Occurrence of eye movement disorders in motor neuron dis-ease. Amyotroph Lateral Scler. 2012; 13: 84–86. doi: 10.3109/17482968.2011.580848 PMID:22117133
60. Al-Sarraj S, King A, Troakes C, Smith B, Maekawa S, Bodi I, et al. p62 positive, TDP-43 negative, neu-ronal cytoplasmic and intranuclear inclusions in the cerebellum and hippocampus define the pathologyof C9orf72-linked FTLD and MND/ALS. Acta Neuropathol. 2011; 122: 691–702. doi: 10.1007/s00401-011-0911-2 PMID: 22101323
61. Frick P, Neumann M. The neuropathology associated with repeat expansions in the C9ORF72 gene.Acta Neuropathol. 2014; 127: 347–357. doi: 10.1007/s00401-013-1232-4 PMID: 24356984
62. Fekete T, Zach N, Mujica-Parodi LR, Turner MR. Multiple kernel learning captures a systems-levelfunctional connectivity biomarker signature in amyotrophic lateral sclerosis. PLoS One 2013; 8:e85190. doi: 10.1371/journal.pone.0085190 PMID: 24391997
63. Keil C, Prell T, Peschel T, Hartung V, Dengler R, Grosskreutz J. Longitudinal diffusion tensor imaging inamyotrophic lateral sclerosis. BMC Neurosci. 2012; 13: 141. doi: 10.1186/1471-2202-13-141 PMID:23134591
64. Mahoney CJ, Beck J, Rohrer JD, Lashley T, Mok K, Shakespeare T, et al. Frontotemporal dementiawith the C9ORF72 hexanucleotide repeat expansion: clinical, neuroanatomical and neuropathologicalfeatures. Brain 2012; 135: 736–750. doi: 10.1093/brain/awr361 PMID: 22366791
65. Tessitore A, Esposito F, MonsurròMR, Graziano S, Panza D, Russo A, et al. Subcortical motor plastici-ty in patients with sporadic ALS: an fMRI study. Brain Res Bull. 2006; 69: 489–494. PMID: 16647577
66. Cistaro A, Valentini MC, Chiò A, Nobili F, Calvo A, Moglia C, et al. Brain hypermetabolism in amyotro-phic lateral sclerosis: a FDG PET study in ALS of spinal and bulbar onset. Eur J Nucl Med Mol Imaging2012; 39: 251–259. doi: 10.1007/s00259-011-1979-6 PMID: 22089661
67. Simone IL, Tortelli R, Samarelli V, D'Errico E, Sardaro M, Difruscolo O, et al. Laser evoked potentials inamyotrophic lateral sclerosis. J Neurol Sci. 2010; 288: 106–111. doi: 10.1016/j.jns.2009.09.023 PMID:19836030
68. Chiò A, Canosa A, Gallo S, Moglia C, Ilardi A, Cammarosano S, et al. Pain in amyotrophic lateral sclero-sis: a population-based controlled study. Eur J Neurol. 2012; 19: 551–555. doi: 10.1111/j.1468-1331.2011.03540.x PMID: 21972798
69. Eisen A,Weber M. The motor cortex and amyotrophiclateral sclerosis. Muscle Nerve 2001; 24: 564–573. PMID: 11268031
70. Ince PG, Highley JR, Kirby J, Wharton SB, Takahashi H, Strong MJ, et al. Molecular pathology and ge-netic advances in amyotrophic lateral sclerosis: an emerging molecular pathway and the significance of
Microstructural Brain Changes in ALS Course
PLOS ONE | DOI:10.1371/journal.pone.0119045 March 20, 2015 16 / 17

glial pathology. Acta Neuropathol. 2011; 122: 657–671. doi: 10.1007/s00401-011-0913-0 PMID:22105541
71. Verstraete E, Veldink JH, Hendrikse J, Schelhaas HJ, van den Heuvel MP, van den Berg LH. StructuralMRI reveals cortical thinning in amyotrophic lateral sclerosis. J Neurol Neurosurg Psychiatry 2012; 83:383–388. doi: 10.1136/jnnp-2011-300909 PMID: 21965521
72. d'Ambrosio A, Gallo A, Trojsi F, Corbo D, Esposito F, Cirillo M, et al. Frontotemporal cortical thinning inamyotrophic lateral sclerosis. AJNR Am J Neuroradiol. 2014; 35: 304–310. doi: 10.3174/ajnr.A3753PMID: 24113470
73. Kwan JY, Meoded A, Danielian LE, Wu T, Floeter MK. Structural imaging differences and longitudinalchanges in primary lateral sclerosis and amyotrophic lateral sclerosis. Neuroimage Clin. 2012; 2: 151–160. doi: 10.1016/j.nicl.2012.12.003 PMID: 24179768
74. Zhang J, Yin X, Zhao L, Evans AC, Song L, Xie B, et al. Regional alterations in cortical thickness andwhite matter integrity in amyotrophic lateral sclerosis. J Neurol. 2014; 261: 412–421. doi: 10.1007/s00415-013-7215-5 PMID: 24452838
75. Gordon PH, Cheng B, Salachas F, Pradat PF, Bruneteau G, Corcia P, et al. Progression in ALS is notlinear but is curvilinear. J Neurol. 2010; 257: 1713–1717. doi: 10.1007/s00415-010-5609-1 PMID:20532545
76. Senda J, Kato S, Kaga T, Ito M, Atsuta N, Nakamura T, et al. Progressive and widespread brain dam-age in ALS: MRI voxel-basedmorphometry and diffusion tensor imaging study. Amyotroph LateralScler. 2011; 12: 59–69. doi: 10.3109/17482968.2010.517850 PMID: 21271792
Microstructural Brain Changes in ALS Course
PLOS ONE | DOI:10.1371/journal.pone.0119045 March 20, 2015 17 / 17
Related Documents


