Microstructural and Macroscopic Aspects of the Plasticity of Complex Metallic Alloys Von der Fakultät für Mathematik, Informatik und Naturwissenschaften der Rheinisch- Westfälischen Technischen Hochschule Aachen zur Erlangung des akademischen Grades eines Doktors der Naturwissenschaften genehmigte Dissertation vorgelegt von Diplom-Physiker Stefan Roitsch aus Paderborn Berichter: Universitätsprofessor Dr. K. Urban Universitätsprofessor Dr. J. Mayer Tag der mündlichen Prüfung: 12. August 2008 Diese Dissertation ist auf den Internetseiten der Hochschulbibliothek online verfügbar.

Welcome message from author
This document is posted to help you gain knowledge. Please leave a comment to let me know what you think about it! Share it to your friends and learn new things together.
Transcript

Microstructural and Macroscopic Aspects of the
Plasticity of Complex Metallic Alloys
Von der Fakultät für Mathematik, Informatik und Naturwissenschaften der Rheinisch-Westfälischen Technischen Hochschule Aachen zur Erlangung des akademischen
Grades eines Doktors der Naturwissenschaften genehmigte Dissertation
vorgelegt von
Diplom-Physiker
Stefan Roitsch
aus Paderborn
Berichter: Universitätsprofessor Dr. K. Urban Universitätsprofessor Dr. J. Mayer
Tag der mündlichen Prüfung: 12. August 2008
Diese Dissertation ist auf den Internetseiten der Hochschulbibliothek online verfügbar.


Microstructural and Macroscopic Aspects of the Plasticity of Complex Metallic Alloys
Complex metallic alloys (CMAs) represent a class of materials which are based on crystal structures with exceptionally large unit cells comprising up to more than a thousand atoms. As a result of the structural attributes of these phases, their plastic deformation behaviour features significant differences to conventional mechanisms known from structurally simple materials. In the present work, the plasticity of the three CMA phases, hexagonal µ-Al-Mn, body-centred cubic Mg32(Al,Zn)49, and face-centred cubic ß-Al-Mg was investigated. Uniaxial deformation experiments on single crystalline samples of these alloys were carried out and thermodynamic activation parameters of the deformation processes were determined. Microstructural investigations by means of transmission electron microscopy (TEM) were carried out on µ-Al-Mn and Mg32(Al,Zn)49. The underlying deformation mechanisms of these phases were completely determined. Dislocation climb and associated diffusion of vacancies was found to play an essential role in the deformation processes of both materials.
Mikrostrukturelle und makroskopische Aspekte der Plastizität von komplexen intermetallischen Phasen
Komplexe intermetallische Phasen (CMAs) stellen eine Materialklasse dar deren Kristallstrukturen auf außergewöhnlich großen Einheitszellen, mit bis zu mehr als eintausend Atomen beruhen. Aufgrund ihrer besonderen strukturellen Merkmale unterscheidet sich das plastische Verformungsverhalten dieser Phasen maßgeblich von konventionellen, aus strukturell einfachen Systemen bekannten Verformungs-mechanismen. In der vorliegenden Arbeit wurde die Plastizität der drei Legierungssysteme µ-Al-Mn (hexagonal), Mg32(Al,Zn)49 (kubisch raumzentriert) und ß-Al-Mg (kubisch flächenzentriert) untersucht. Uniaxiale Verformungsexperimente wurden an einkristallinen Proben dieser Materialien durchgeführt und die thermodynamischen Aktivierungsparameter der Verformungsprozesse wurden bestimmt. Mikrostrukturelle Untersuchungen wurden an µ-Al-Mn und Mg32(Al,Zn)49 mittels Transmissionselektronenmikroskopie (TEM) ausgeführt. Die zugrunde liegenden Verformungsmechanismen dieser Materialien wurden vollständig ermittelt. In beiden Phasen sind die Verformungsprozesse maßgeblich durch Versetzungsklettern und der damit verbundenen Leerstellendiffusion geprägt.


Contents Introduction.....................................................................................................................1
1 Complex metallic alloys................................................................................................5
1.1 The structure of CMAs....................................................................................5
1.2 Defects in CMAs...........................................................................................10
2 Single-crystal growth..................................................................................................13
2.1 Fundamentals of single-crystal growth..........................................................13
2.2 Single-crystal growth techniques...................................................................16
Bridgman technique.................................................................................16
Czochralski technique..............................................................................17
2.3 Single-crystal growth of CMAs.....................................................................18
Mg32(Al,Zn)49...........................................................................................18
µ-Al-Mn...................................................................................................22
ß-Al-Mg...................................................................................................25
3 Crystal plasticity and plastic deformation experiments.........................................29
3.1 Fundamentals of crystal plasticity.................................................................29
Plasticity and dislocation motion.............................................................29
Thermal activation...................................................................................34
3.2 Incremental tests............................................................................................37
3.3 Uniaxial testing machine...............................................................................41
4 Plasticity of µ-Al-Mn..................................................................................................43
4.1 The structure of µ-Al-Mn..............................................................................43
4.2 Macroscopic deformation behaviour.............................................................47
4.3 Microstructural analysis.................................................................................56
4.4 Discussion......................................................................................................69
Macroscopic deformation behaviour.......................................................69
Microstructural analysis...........................................................................73
Contents
5 Plasticity of Mg32(Al,Zn)49.........................................................................................79
5.1 The structure of Mg32(Al,Zn)49......................................................................79
5.2 Macroscopic deformation behaviour.............................................................83
5.3 Microstructural analysis.................................................................................88
5.4 Discussion....................................................................................................103
Macroscopic deformation behaviour.....................................................103
Microstructural analysis.........................................................................106
6 Plasticity of ß-Al-Mg................................................................................................115
6.1 The structure of ß-Al-Mg.............................................................................115
6.2 Macroscopic deformation behaviour...........................................................118
6.3 Discussion....................................................................................................123
7 Comprehensive discussion: Plasticity of CMAs.....................................................129
7.1 Macroscopic deformation behaviour of CMAs...........................................129
7.2 Microstructural aspects................................................................................132
Summary......................................................................................................................145
Appendix A: Characterization of lattice defects by TEM.......................................147
References.....................................................................................................................151

Introduction Plastic deformation refers to the irreversible shape change of a piece of solid matter due to an externally applied force. In contrast to elastic deformation, plastic deformation is permanent and corresponds to a relative displacement of parts of the deformed material.
The plasticity of structurally simple materials has been investigated since the 1920s. It was proposed by Orowan (1934), Taylor (1934), and Polanyi (1934) that one-dimensional defects, termed dislocations, are the carriers of plastic deformation in most crystals. Motion of dislocations in atomic planes causes successive opening of atomic bonds and is therefore an energetically favoured process of plastic deformation in contrast to simultaneous opening of all bonds in one plane.
In the last decades, the plasticity of a multitude of metals and intermetallic compounds has been investigated and a variety of models basing on the process of dislocation motion has been proposed. Pioneering works on different types of dislocations and their movement were established, for example, by Peierls (1940) and Nabarro (1967). However, the understanding of the plastic-deformation behaviour of matter is still limited to structurally simple materials. Further progress in crystal plasticity is necessary in order to comprehend deformation mechanisms of more complex phases.
The class of complex metallic alloys (CMAs) comprises systems with giant unit cells containing up to more than a thousand atoms per cell (Urban and Feuerbacher, 2004). Despite the fact that CMAs have been studied since several decades in crystallography, physical properties and especially the plasticity of these phases are essentially unexplored. This fact is astonishing since the plastic deformation behaviour of CMAs is of particular interest: In these systems deformation mechanisms known from structurally simple materials are prone to failure. Due to the large lattice parameters (which usually exceed 10 Å in CMAs), perfect dislocations would require unphysically large elastic line energies. New concepts of microstructural processes are expected to appear in order to get effective and energetically favourable deformation mechanisms. Indeed, novel mechanisms were revealed in ξ’-Al-Pd-Mn (Klein et al., 1999), Al13Co4 (Heggen et al., 2007), and c2-Al-Pd-Fe (Heggen, 2003).
The intention of the present thesis is to gain comprehensive insight into the deformation behaviour and underlying mechanisms of CMA phases. For this purpose three selected phases, µ-Al-Mn, Mg32(Al,Zn)49, and ß-Al-Mg are investigated. The plasticity of these materials is examined for the first time. The work deals with three
1
Introduction
different crystal lattices, body-centred cubic, face-centred cubic, and hexagonal close-packed. In conjunction with investigations on orthorhombic CMAs reported in the literature (Klein et al., 1999, Feuerbacher et al., 2001, Feuerbacher and Caillard, 2004, Heggen et al., 2007), the most important crystal lattices in this materials class are covered.
The combination of macroscopic and microstructural investigations allows for a versatile and detailed view on the plasticity of the examined phases. The use of high-quality single-crystalline sample materials, grown in the frame of the present thesis, ensures that effects of impurities, secondary phases, and grain boundaries can be excluded and accordingly, only the intrinsic mechanical properties are examined.
The studied alloys are brittle at room temperature but show a brittle-to-ductile transition at elevated temperatures between 65 and 82 % of the respective melting temperature. The stress-strain behaviour exhibits remarkable features like high fracture stress or pronounced yielding behaviour. Thermodynamic activation parameters of the deformation processes were analyzed for all three materials.
The microstructural deformation behaviour of the two phases µ-Al-Mn and Mg32(Al,Zn)49 was successfully elaborated by means of transmission electron microscopy (TEM). Distinct differences to mechanisms known from structurally simple materials are observed. Both phases possess deformation mechanisms which are primarily based on dislocation climb. The interaction of different involved dislocation types by means of a chemical stress is a basic feature in the deformation processes of both CMAs.
The first chapter introduces the materials class of CMAs. Basic structural characteristics as well as the most common types of local order are described. The relations between these phases with structurally simple and quasicrystalline materials are discussed. One important example of a novel type of defect found in CMAs, the metadislocation, is briefly revisited.
The production of high-quality single-crystalline material is of decisive importance for reliable results of deformation experiments. The basics of single-crystal growth, the growth techniques applied, as well as details on the phase diagrams of the investigated materials are given in chapter 2.
In chapter 3 the fundamentals of crystal plasticity and the concept of dislocation-mediated deformation are reviewed. The theory of thermal activation is outlined and experimental procedures employed in this study are described in detail.
Chapters 4, 5, and 6 address the phases µ-Al-Mn, Mg32(Al,Zn)49, and ß-Al-Mg, respectively. The structure of the respective phase is illustrated in each chapter and
2

Introduction
results of macroscopic as well as microstructural investigations are presented and discussed.
In chapter 7, finally, a comprehensive discussion of the macroscopic and microstructural deformation behaviour of the investigated phases is presented. The results are compared with investigations on other CMAs in order to gain an overview and to find possible general characteristics in the plasticity of this materials class.
3

Introduction
4
Chapter 1 Complex metallic alloys 1.1 The structure of CMAs An ideal crystal is a solid in which the constituent atoms are packed in a regularly ordered, infinitely repeating pattern. In three-dimensional space 14 non-equivalent lattice types, the Bravais lattices, exist. The crystal structure can be constructed by a space-filling periodic arrangement of a unit cell. An identical set of atoms, the basis, is assigned to each lattice point.
The most common lattice types in elementary metallic materials are body-centred cubic (bcc), face-centred cubic (fcc) and hexagonal close packed (hcp), featuring 2, 4, and 2 atoms, respectively, in their unit cells. Examples are Fe (bcc), Al (fcc), and Zn (hcp). Intermetallic compounds usually possess bases consisting of several atoms. Therefore, alloys frequently hold more atoms per unit cell, e.g. the Al3Ni2 structure, zincblende (ZnS), and the Laves phase MgZn2 feature 5, 8, and 12 atoms per unit cell, respectively.
Complex metallic alloys (CMAs) are a class of intermetallic compounds comprising considerably more atoms per unit cell, reaching from some tens up to some thousands (Urban and Feuerbacher, 2004). Along with the large number of atoms, the size of the unit cells reaches large dimensions. Pauling, for example, described in 1923 the structure of the intermetallic phase NaCd2 with 1152 atoms per unit cell and a lattice parameter of 30.56 Å. Samson, a pioneer in the field of crystallography of intermetallic compounds, introduced the term “giant unit cell crystals” for these materials (Samson, 1969).
Due to the difference in magnitude of the lattice parameters and the inter-atomic distances, CMAs offer two different inherent physical length scales which may both influence their physical properties. Nowadays hundreds of intermetallic phases are known featuring giant unit cells (e.g. Villars et al., 1986 and Tamura, 1997) and new
5

1 Complex metallic alloys
phases of this class are steadily discovered especially in the course of investigations of ternary phase diagrams.
The inherent atom configuration in CMAs is frequently based on a cluster substructure (Urban and Feuerbacher, 2004). These clusters, which typically exhibit icosahedral symmetry, represent very compact elements of the crystal structure. The icosahedral arrangement of twelve atoms around a central atom, referred to by Pauling (1955) as “closer packing than closest packing”, leads to a high density within these clusters.
Frequently found examples of complex clusters comprising icosahedral symmetry are the Mackay icosahedron and the Bergman cluster. Both are based on a concentric shell structure with icosahedral configurations comprising 55 and 117 atoms, respectively. The shells correspond to symmetric polyhedra with atom sites located at the vertices. The structure of the Bergman cluster was discovered by Bergman et al. (1957) and is described in detail in chapter 5.1. The Mackay cluster consists of three concentric atom shells (Mackay, 1962). The first shell is an icosahedron (12 atoms) encasing a central atom. The second shell is an icosidodecahedron (30 atoms), i.e. a superposition of an icosahedron and a dodecahedron. It exhibits 12 pentagonal and 20 triangular faces. An icosahedron and an icosidodecahedron are illustrated in figure 1.1 (a) and (b), respectively. The last shell of the Mackay cluster is an icosahedron, the vertices of which are located above the pentagon centres of the icosidodecahedron, forming a surface with 80 triangular faces.
Figure 1.1: Shells of a Mackay cluster: (a) icosahedron, (b) icosidodecahedron.
6
1 Complex metallic alloys
As a result of the cluster substructure, many atom sites in complex metallic alloys possess icosahedral coordination. The clusters, however, are arranged according to usual crystallographic Bravais lattices. Long-range orientational order of CMAs is therefore determined by symmetry operations known from structurally simple materials.
Nearly all lattice types are observed in the class of complex metallic alloys. Cubic CMAs are e.g. the Bergman phase (Mg32(Al,Zn)49) (bcc, 162 atoms/unit cell, a = 14.2 Å) (Bergman et al., 1957), ß-Al-Mg (fcc, 1168 atoms/unit cell, a = 28.2 Å) (Samson, 1965), and the phase c2-Al-Pd-Fe (fcc, 255 atoms/unit cell, a = 15.52 Å) (Sugiyama et al., 2000). The phases µ-Al-Mn with 563 atoms per unit cell and lattice parameters a = 19.98 and c = 24.67 Å (Shoemaker et al., 1989), and κ-Al-Mn-(Fe,Ni) with 227 atoms per unit cell and lattice parameters a = 17.6 and c = 12.5 Å (Marsh, 1998) represent phases with hexagonal unit cells. Examples for orthorhombic phases are Al13Co4 (102 atoms/unit cell, a = 8.2 Å, b = 12.3 Å, c = 14.5 Å) (Grin et al., 1994) and the class of Taylor phases, i.e. T-Al-Mn (156 atoms/unit cell, a = 14.7 Å, b = 12.5 Å, c = 12.6 Å) (Taylor, 1960, Hiraga et al., 1993) and this phase with ternary elements Pd, Fe, Cr, and Ni (Balanetskyy et al., 2007, Balanetskyy, 2007a). A monoclinic CMA is e.g. Al13Fe4 (102 atoms/unit cell, a = 15.5 Å, b = 8.1 Å, c = 12.5 Å, ß = 107.7°) (Grin et al., 1994a).
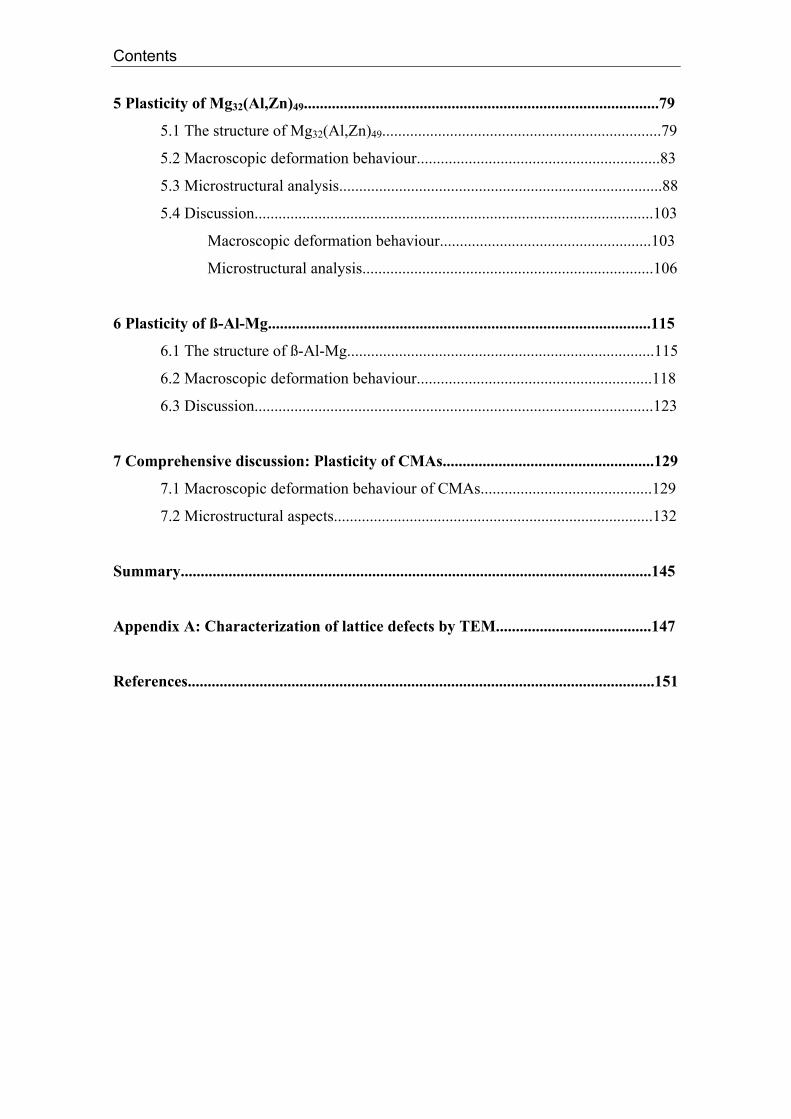
Besides this structural variety, several CMA phases in different alloy systems exist featuring related structures. A prominent example of such a class of structurally related phases are the ε-phases. The latter are found for example in the systems Al-Pd-(Mn, Fe, Rh, Re, Ru, Co, Ir) and the systems Al-Rh-(Ru, Cu, Ni) (Audier et al., 1993, Klein et al., 1996, Yurechko et al., 2001 and 2004, Balanetskyy et al., 2004 and 2004a). They are denoted εl (l = 6, 16, 22, 28, 341) according to the index of the strong (0,0,l) diffraction spot which corresponds to the interplanar spacing of about 0.2 nm occurring in all of those phases (Yurechko et al., 2001 and 2004, Balanetskyy et al., 2004). The εl-phases possess identical [1,0,0] and [0,1,0] lattice parameters in the respective alloy systems but exhibit different [0,0,1] lattice parameters. Basic structural building blocks of the ε-phases are pseudo-Mackay clusters arranged in columns along the [0,1,0] direction (Boudard et al., 1996). Viewed along this direction, the structures can be most conveniently described using a tiling representation.
One possible tiling approach applied for ε-phases consists of two different tiles, a flattened hexagon and a combination of a nine-edged banana-shaped polygon attached to a pentagon, termed phason line. Using this approach, the vertices of the tiles are located on the centres of the cluster columns.
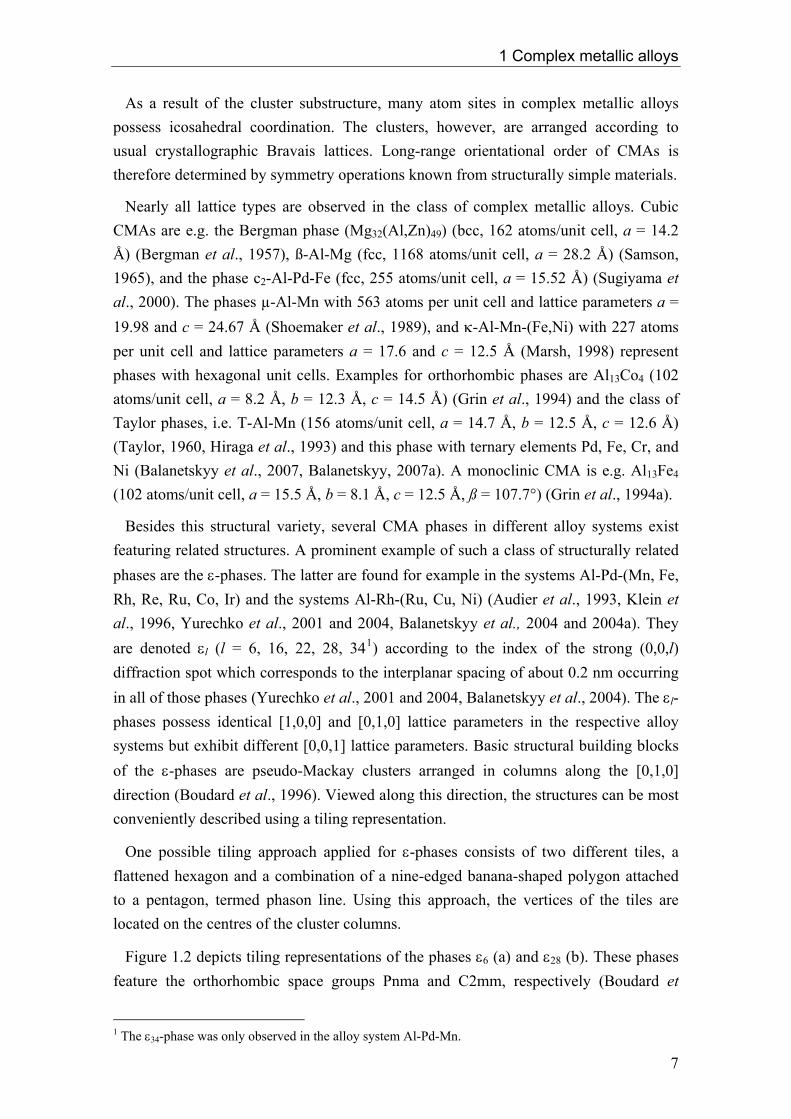
Figure 1.2 depicts tiling representations of the phases ε6 (a) and ε28 (b). These phases feature the orthorhombic space groups Pnma and C2mm, respectively (Boudard et
1 The ε34-phase was only observed in the alloy system Al-Pd-Mn.
7
1 Complex metallic alloys
al.,1996, Edler, 1997). The lattice parameters of ε6 are a = 23.541 Å, b = 16.566 Å and c = 12.339 Å including 320 atoms per unit cell (Boudard et al., 1996). ε28 features equal a- and b-lattice parameters as ε6 but a c-lattice parameter of 57 Å. The structure of ε6 can be represented by alternating rows of flattened hexagons arranged in two different orientations. In ε28 additional phason lines are present which are aligned in rows along the [1,0,0] direction. These rows of phason lines are called phason planes. In figure 1.2 (b) one phason line is indicated in dark grey and the phason planes are indicated in bright grey. The phases ε6 and ε28 are frequently referred to as ξ’ and Ψ, respectively, in the literature.
Figure 1.2: Schematic representation of the phases ε6 (a) and ε28 (b) by means of a tiling model along [0,1,0]. Grey rectangles indicate the respective unit cells. A single phason line is shown dark grey in (b) (Feuerbacher and Heggen, 2006). A further structural attribute of CMAs is the inherent disorder. Due to the complex atom arrangement in clusters and especially the frequently observed overlap of these clusters within the crystal lattice, many CMA phases show a considerable degree of disorder. Different types of disorder are observed:
Configurational disorder results from statistically altering orientations of a particular subcluster inside a given cage of atoms. This kind of disorder is found for example in c2-Al-Pd-Fe which possesses the space group 3Fm (Edler et al., 1998). Primary structural building blocks of this phase are edge-sharing icosahedral cages filled by two different cluster motives. One of these motives is formed by Al atoms located at the vertices of a cube. This cube occurs in five different orientations inside the icosahedral cage generating the configurational disorder. The average structure of the different cube
8

1 Complex metallic alloys
arrangements forms a regular dodecahedron. The structure of c2-Al-Pd-Fe is described in detail by Edler et al. (1998) and Sugiyama et al. (2000).
Chemical or substitutional disorder results from fractional occupancy of certain lattice sites by different elements. Usually elements with similar metallic radii are involved in this kind of disorder. The potential occupation by different elements causes a variable amount of these elements inside the crystal structure. This affects the extension of the stability range of the corresponding phase within the phase diagram. In Mg32(Al,Zn)49, for example, 3 different atom sites can be occupied by either Al or Zn atoms leading to an extension of the Mg32(Al,Zn)49 stabilty range in the Al-Mg-Zn system over a wide range of values of the Zn/Al ratio (cf. chapters 2.3 and 5.1).
Displacement disorder and fractional site occupation are types of disorder which arise from steric constraints. High amounts of these types of disorder occur for example in ß-Al-Mg from incompatibilities in the packing of Friauf polyhedra which primarily define the structure of this phase (chapter 6.1). Certain vertices of adjacent polyhedra should be occupied by a large atom (Mg) for one polyhedron and simultaneously by a small atom (Al) for the other. This incompatibility results in displacement disorder and fractional site occupation.
Split occupation is also caused by geometrical hindrances. In this case two lattice sites are too close to be occupied simultaneously, leading to an occupation of only one of these sites. The actual atomic content of the unit cell is then usually lower than indicated by the Pearson symbol of the corresponding phases. The latter can be characterized by a modified Pearson symbol, where a number subtracted from the site number indicates the reduced number of atoms per unit cell. Examples are Al68Pd20Ru12 with cP296-49 (Mahne and Steurer, 1996), Al2.75Ir with cP60-30 (Grin et al., 1997), and Al57.3Cu31.4Ru11.3 with cP140-25 (Sugiyama et al., 2000a).
As described above, the icosahedral symmetry frequently observed in CMA phases is restricted to local atom coordinations. Quasicrystals feature this kind of symmetry in the short-range as well as in the long-range orientational order. Shechtman et al. discovered in 1984 a metastable Al-Mn phase showing fivefold-rotational symmetry in its electron-diffraction pattern. This symmetry, however, is in contradiction to a space-filling translational symmetry (Kepler, 1619), and hence, the structure of quasicrystals can not be constructed by a periodic translation of a unit cell. The long-range orientational order of a quasicrystalline lattice can be described by means of higher-dimensional crystallography. Using the so-called cut procedure, the structure is constructed using a six-dimensional periodic hyperlattice (e.g. Katz and Duneau, 1984). Because of the similarity of the short-range order of CMAs and quasicrystals, CMAs are in the literature sometimes referred to as quasicrystal approximants (e.g. Goldman and Kelton, 1993).
9

1 Complex metallic alloys
1.2 Defects in CMAs Despite the fact that CMAs are known since the 1950s (Pauling, 1955) and large effort was spent on their crystallographic characterization, the physical properties of CMAs are largely unexplored. Only in recent times, dedicated investigations focusing on physical properties of this class of materials were carried out (e.g. Takeuchi and Mizutani, 1995, Feuerbacher et al., 2001, Belin-Ferré, 2002, Smontara et al., 2007).
Especially the plasticity of CMAs turned out to offer interesting properties and mechanisms since the underlying microstructural mechanisms of plastic deformation are prevalently different from known mechanisms in structurally simple materials (Feuerbacher et al., 2004). In the latter materials perfect dislocations are frequently observed to be carriers of crystal plasticity. The motion of these dislocations leaves the crystal structure entirely undistorted since the Burgers vectors correspond to translational invariant vectors of the lattice. In complex phases featuring larger lattice parameters, however, the occurrence of perfect dislocations becomes unfavourable. The elastic line energy of a dislocation is proportional to the square of its Burgers-vector length (Hirth and Lothe, 1992) and hence in CMAs, a Burgers vector corresponding to a translational invariant distance of the lattice, which usually amounts to 10 Å or more, would be energetically very costly. Therefore, perfect dislocations are not expected to be found in CMAs.
Physically more reasonable line energies occur for example, if perfect dislocations split into partial dislocations comprising Burgers vectors with only a fraction of a translational invariant distance in the lattice. The accommodation of partials into the lattice and their movement are necessarily accompanied by the introduction of planar defects as it is observed for µ-Al-Mn and the Bergman phase in the present work (chapters 4 and 5).
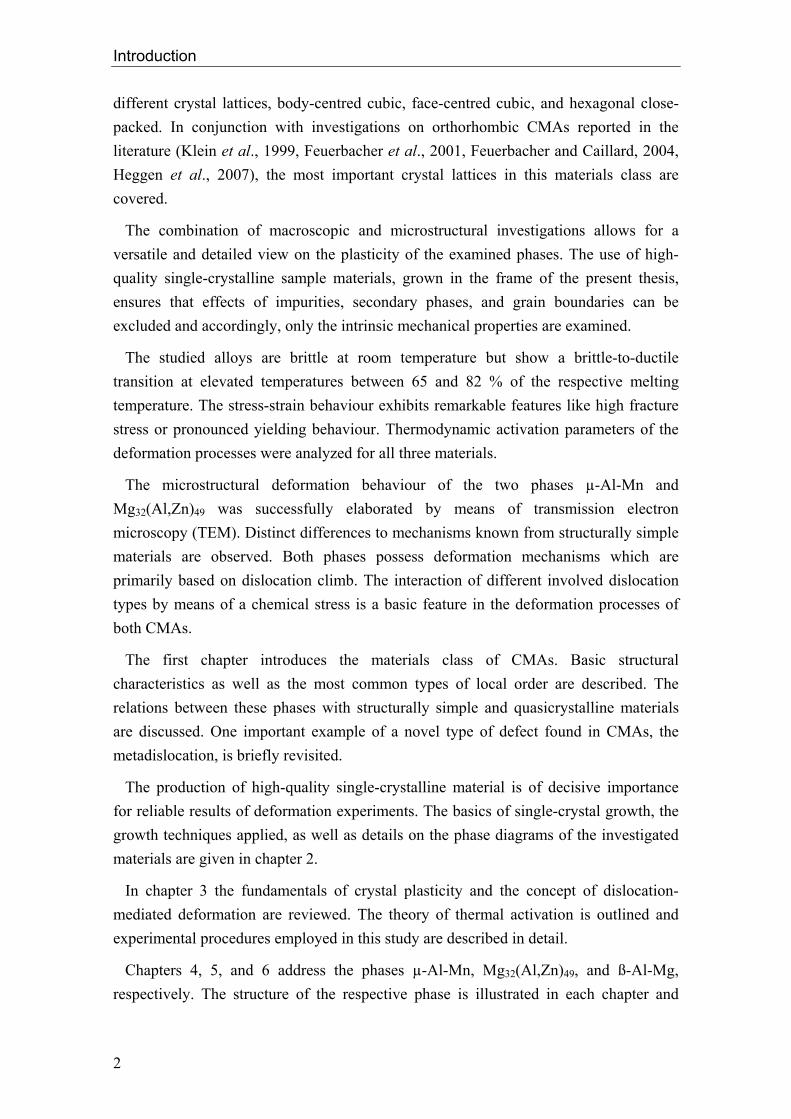
Novel types of defects were found in CMAs. One example are the so-called metadislocations, firstly observed in ξ’-Al-Pd-Mn (Klein et al., 1999). Figure 1.3 (a) shows a lattice-fringe image taken by means of TEM of a metadislocation along the [0,1,0] direction. The dislocation core is indicated by an arrow. The dislocation line lies perpendicular to the image plane, i.e. parallel to the [0,1,0] direction. Figure 1.3 (b) shows the same situation in a tiling representation. The dislocation core is shown as a dark-grey polygon. On the left of the core an area of pure ξ’-Al-Pd-Mn can be identified via the tiling of flattened hexagons. In the remainder of the picture additional phason planes are present, forming the phase ψ-Al-Pd-Mn on the right-hand side of the metadislocation core. The core of the metadislocation is decorated by a dislocation-like formation in ψ-Al-Pd-Mn consisting of six “inserted” phason halfplanes.
10

1 Complex metallic alloys
The Burgers vector of the metadislocation, determined by means of contrast extinction experiments, is parallel to the [0,0,1] direction (Klein and Feuerbacher, 2003). A Burgers-circuit analysis yields a Burgers-vector length of 1.83 Å (Klein et al., 1999). Despite the fact that the dislocation is a partial dislocation (the Burgers-vector length is a fraction of the lattice parameter), the whole arrangement, including the six attached halfplanes, can move without the introduction of additional planar faults into the structure of ψ-Al-Pd-Mn (Klein et al., 1999). Other [0,0,1] metadislocations with 4, 10, and 16 inserted phason halfplanes are also observed, featuring Burgers vectors of 2.96, 1.13, and 0.07 Å, respectively (Klein et al., 2000).
Figure 1.3: Metadislocation in ξ’-Al-Pd-Mn along the [0,1,0] direction. (a) Lattice-fringe image taken by means of TEM and (b) schematic representation (Feuerbacher et al., 2004)
11

1 Complex metallic alloys
12

Chapter 2 Single-crystal growth In this chapter the single-crystal growth of the investigated phases µ-Al-Mn, Mg32(Al,Zn)49, and ß-Al-Mg is described. The growth of large single crystals (exceeding 1 cm3) of these phases represents a challenge because of narrow stability ranges, other competing phases and/or incongruent solidification behaviour. In several attempts, the growth parameters were varied in order to find the optimum growth conditions and the corresponding appropriate growth techniques. An outline of the fundamentals of single-crystal growth, as well as short introductions to the applied techniques, i.e. Bridgman and Czochralski growth, are given in this chapter.
2.1 Fundamentals of single-crystal growth
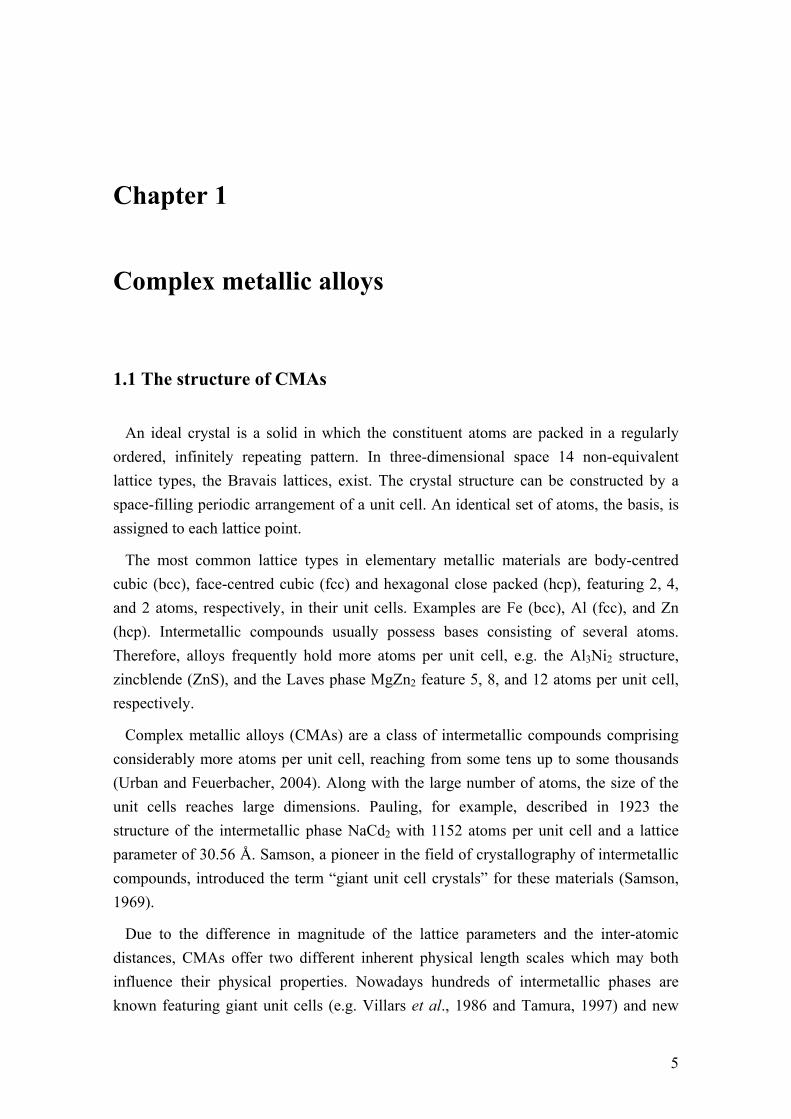
The process of single-crystal growth can be illustrated on the basis of a phase diagram as shown in figure 2.1. This fictitious binary phase diagram of the elements A and B comprises stability ranges of the solid phases α, β and γ, as well as the coexistence ranges α+β and β+γ. Regions where the phases α, β and γ are in equilibrium with the liquid phase L are labelled L+α, L+β and L+γ. The phase boundary between these regions and the pure liquid phase is called liquidus line. Melting temperatures of the elements A and B are labelled TA and TB, respectively. The peritectic point P denotes a point in the phase diagram where the stability range of a solid phase meets the coexistence range of another solid with the liquid phase. Heating of the first solid phase leads to decomposition into the other solid and the liquid phase by crossing the peritectic point (in the given example:
B
αβ +→ L ). At the eutectic point E, the pure
liquid phase meets a phase field where the two solid phases ß and γ coexist.
13

2 Single-crystal growth
Figure 2.1: Scheme of a binary phase diagram. Incongruent solidification behaviour is illustrated: By cooling a melt with composition c2, growth of the solid phase β with composition c1 is initiated at T2. One discerns congruent and incongruent solidification behaviour. Congruent solidification takes place if the composition of the solidifying phase equals the composition of the melt. In the phase diagram of figure 2.1 congruent solidification takes place if a melt consisting of pure element A or B is cooled below the respective melting temperature. On the other hand, if the composition of the solidifying phase differs from that of the liquid phase, incongruent solidification takes place. In this case, the melt composition varies during the solidification process.
A varying melt composition also causes a shift of the composition of the solidifying phase. Hence, the latter composition may leave the stability range of the desired phase during crystal growth, leading to the solidification of secondary phases.
Consider a melt of composition c1 in figure 2.1. Despite the fact that this composition lies (below temperature T2) within the stability range of the incongruently solidifying β phase, this phase can not solidify from a melt possessing this composition. With decreasing temperature a melt with composition c1 meets the liquidus line of the L+α region and therefore α is the primarily solidifying phase. In order to grow the β phase with final composition c1, a melt with appropriately chosen composition c2 has to be
14

2 Single-crystal growth
used since at this composition the melt is in equilibrium with the β phase. By cooling a melt with initial composition c2 this composition shifts, after reaching the liquidus line, to higher concentrations of element B along the liquidus line of the L+β region. Simultaneously, the composition of the β phase shifts during solidification from c1 to higher concentration of element B along the solidus line, i.e. the phase boundary between the stability range of the β phase and the L+β phase region.
The growth of pure β phase is possible until the melt composition reaches the eutectic point E. At the same time, the solidifying β phase reaches composition c1+x, i.e. the limit of the stability range of β. Further temperature decrease initiates eutectic solidification of the β and γ phase.
Figure 2.2 shows a sketch of a hypothetical two-dimensional crystal which grows radially from a centre point e.g. a single nucleus, by the solidification sequence described above. The melt L with initial composition c2 causes solidification of the β phase. At the beginning of the growth process (centre of the crystal) the ß phase solidifies with composition c1 (figure 2.2 (a)). Due to incongruent solidification behaviour the composition of the solidifying ß phase shifts towards the composition c1+x, leading to a radial composition gradient inside the crystal (red arrow in figure 2.2 (b)). After reaching the composition c1+x, the melt enters the two phase region β+γ which initiates solidification of these phases (figure 2.2 (c)).
Figure 2.2: Schematic sequence of incongruent solidification behaviour. A two-dimensional crystal grows radially in the melt L (a-c): (a) Solidification of phase ß with initial composition c1. (b) Shifting of the composition leads to a radial composition gradient between c1 and c1+x (red arrow). (c) Solidification of the secondary phase γ has set in.
15

2 Single-crystal growth
2.2 Single-crystal growth techniques Bridgman technique Figure 2.3 schematically illustrates the setup for crystal growth according to the Bridgman technique. Initially, the melt is located in a vertical tip-shaped crucible. The crucible is surrounded by a protection envelope and a heater which ideally generates an isothermal hot zone (dashed line in figure 2.3). Solidification is initiated by pulling the crucible downwards out of the hot zone. At the coldest part of the crucible, i.e. its lowermost part, the melt starts to solidify. Additionally, heat can be dissipated at the tip by a water-cooled finger at the pulling rod. In figure 2.3 the lower half of the crucible has left the hot zone and correspondingly in this part the melt is solidified.
Single-crystalline material of the phases µ-Al-Mn and Mg32(Al,Zn)49 investigated in the present thesis was grown by means of the Bridgman technique.
Figure 2.3: Schematic setup for single-crystal growth according to the Bridgman technique. The crucible is slowly pulled downwards out of the hot zone of the heater. The dashed line is the isotherm corresponding to the current solidification temperature. Solidification starts at the bottom (tip) of the crucible.
16

2 Single-crystal growth
Czochralski technique
The Czochralski-growth technique involves solidification of the melt at a seed crystal. The melt is located in a cylindrical crucible and surrounded by a heater. This setup is shown in figure 2.4. The seed crystal can be of the same phase as the desired crystal (homogenous seeding) or consist of another higher melting material (heterogeneous seeding). An advantage of homogenous seeding is the possibility of oriented growth if the solidifying crystal preferentially grows along the predefined direction of the seed. The seed crystal is connected to a pulling rod.
After dipping the seed into the melt, the pulling rod is lifted in order to achieve a stable meniscus at the solid-liquid interface. Solidification of the melt occurs at this location due to heat dissipation mainly into the pulling rod. Crystal growth is performed by lifting the pulling rod continuously from the melt. The size of the meniscus determines the diameter of the grown crystal and can be influenced by varying the melt temperature and/or the pulling velocity. Pulling rod and crucible counter-rotate during the growth process in order to achieve a good homogenisation of the melt.
If necessary, a “thin neck”, i.e. a thin crystal part of few mm length and less than 1 mm in diameter, can be grown. By this means, one grain can be selected for further growth from a crystal region which is containing several grains.
Figure 2.4: Setup of single-crystal growth according to the Czochralski technique. A seed crystal is dipped into the melt and is subsequently lifted upwards. The diameter of the meniscus, where the solidification takes place, can be controlled by the melt temperature and/or the pulling speed.
17
2 Single-crystal growth
Besides the possibility of oriented growth another advantage of the Czochralski technique is the absence of a confining crucible. This leads to an essentially unstrained cooling of the crystal and therefore mostly to a high structural perfection of the grown material (Feuerbacher et al., 2003).
More detailed descriptions of single-crystal growth and other growth techniques can be found e.g. in Tamura et al. (1996) and Feuerbacher et al. (2003).
2.3 Single-crystal growth of CMAs The growth of single-crystalline CMA phases is not well established until now. Therefore, growth procedures for Mg32(Al,Zn)49, µ-Al-Mn, and ß-Al-Mg had to be developed in the frame of the present thesis in order to achieve large (exceeding 1 cm³) and high-quality single crystals of these phases, allowing for direct conclusions on the intrinsic physical properties. Non-structure related influences, such as secondary phase or grain-boundary effects, can be excluded by this means. However, several facts make the single-crystal growth of CMAs technically challenging.
In case of Mg32(Al,Zn)49, µ-Al-Mn, and ß-Al-Mg narrow stability ranges and numerous competing phases in close compositional vicinity are present. The incongruent solidification behaviour of Mg32(Al,Zn)49 and µ-Al-Mn and the technically inconvenient elements Zn and Mg, which possess high vapour pressures, in Mg32(Al,Zn)49 and ß-Al-Mg cause additional difficulties. In the following, single-crystal growth of the phases Mg32(Al,Zn)49, µ-Al-Mn, and ß-Al-Mg is described.
Mg32(Al,Zn)49
Mg32(Al,Zn)49, frequently referred to as Bergman phase, has space group 3Im . Bergman et al. (1952) solved the structure and found that this cubic phase possesses 162 atoms per unit cell with a lattice parameter of 14.2 Å. The structure is described in detail in chapter 5.1.
In figure 2.5 the liquidus projection of the ternary Al-Mg-Zn system is depicted (Petrov et al., 1993). The liquidus surface of the Bergman phase (referred to as T in figure 2.5) is outlined in red. Twelve other solid phases are present in this system. At 335 °C eight phases coexist with the Bergman phase as it is visible in the corresponding isothermal section of the Al-Mg-Zn system in figure 2.6. All phases and their equilibrium conditions are described in detail by Petrov et al. (1993).
The stability range of the Bergman phase extends over a wide range of values of the Zn/Al ratio (cf. figure 2.6). This fact is also expressed in the stoichiometric formula
18

2 Single-crystal growth
Mg32(Al,Zn)49. Due to the similar metallic radii of Al and Zn atoms several atomic sites in this phase can be occupied by either atom type (see chapter 5.1). Therefore, various Al atoms can be substituted by Zn atoms and vice versa (chemical disorder). The atomic percentage of Mg is much less variable in this phase, and correspondingly the extension of the stability range much smaller in this direction, as is expected from the fact that the metallic radius of Mg is about 15 % larger than those of Al and Zn (Bergman et al., 1957).
Mg32(Al,Zn)49 solidifies incongruently. An initial melt composition of 32 at.% Al, 37 at.% Mg and 31 at.% Zn was used for Bridgman growth. The materials were pre-alloyed by means of a levitation inductive melting furnace in a water-cooled copper crucible under protective Ar atmosphere. Al and Zn had a purity of 99.999 % and Mg of 99.98 %. The crystal growth was performed in Ar at about 270 mbar in a graphite crucible. A pulling speed of 1 mm/h was applied. The final crystal is shown in figure 2.7 (a). A single crystalline part of about 2.5 cm3 was obtained.
Figure 2.5: Liquidus projection of the Al-Mg-Zn phase diagram (Petrov et al., 1993). The liquidus surface of the Bergman phase (T) is outlined in red.
19

2 Single-crystal growth
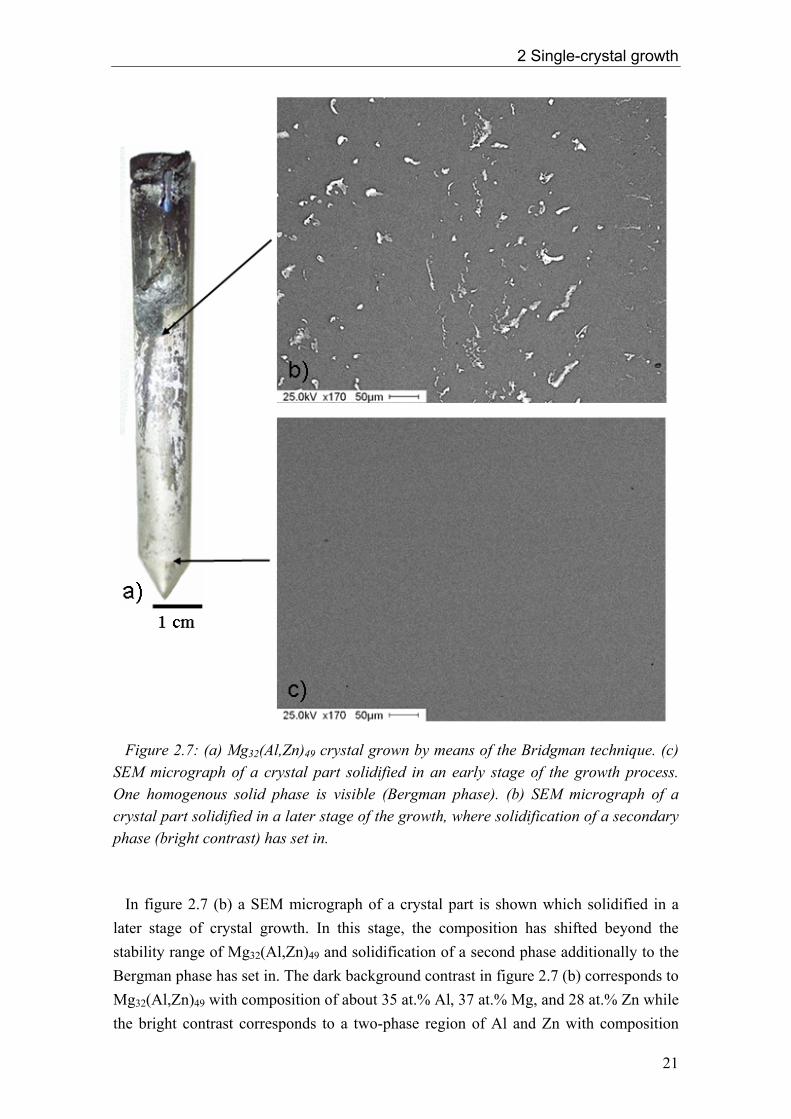
Figure 2.6: Isothermal section of the Al-Mg-Zn phase diagram at 335 °C (Petrov et al., 1993). The stability range of the Bergman phase (T) is outlined in red. Figures 2.7 (b) and (c) show micrographs taken by means of scanning electron microscopy (SEM) operated in back-scattering mode at two different positions of the crystal (indicated by arrows in figure 2.7). The micrographs were taken from polished slices which were cut perpendicular to the long axis of the crystal. The micrograph in figure 2.7 (c) corresponds to a crystal part close to the crystal tip which solidified in an early stage of the growth process. A single homogeneous phase is visible which possesses the composition 28.2 at.% Al, 36.6 at.% Mg, and 35.2 at.% Zn determined by means of energy dispersive X-ray spectroscopy (EDX). This composition lies within the stability range of Mg32(Al,Zn)49 (figure 2.6). The phase was identified by means of powder X-ray diffraction. Deformation samples used in the present thesis were prepared from this single-phase region of the crystal.
20
2 Single-crystal growth
Figure 2.7: (a) Mg32(Al,Zn)49 crystal grown by means of the Bridgman technique. (c) SEM micrograph of a crystal part solidified in an early stage of the growth process. One homogenous solid phase is visible (Bergman phase). (b) SEM micrograph of a crystal part solidified in a later stage of the growth, where solidification of a secondary phase (bright contrast) has set in. In figure 2.7 (b) a SEM micrograph of a crystal part is shown which solidified in a later stage of crystal growth. In this stage, the composition has shifted beyond the stability range of Mg32(Al,Zn)49 and solidification of a second phase additionally to the Bergman phase has set in. The dark background contrast in figure 2.7 (b) corresponds to Mg32(Al,Zn)49 with composition of about 35 at.% Al, 37 at.% Mg, and 28 at.% Zn while the bright contrast corresponds to a two-phase region of Al and Zn with composition
21

2 Single-crystal growth
between 13 and 17 at.% Al. Due to surface contamination, the boundary between pure Mg32(Al,Zn)49 and the two phase region on the crystal surface in figure 2.7 (a) is not visible by the naked eye.
In figure 2.8 an electron diffraction pattern of the single-phase part of Mg32(Al,Zn)49 along the [0,0,1] zone axis taken by means of TEM is shown. Sharp spots and the absence of diffuse scattering and satellite spots reflect a high structural perfection of the crystal. The pattern exhibits a two-fold rotational-symmetry axis along the [0,0,1] direction according to the symmetry operations of the space group 3Im .
Figure 2.8: Electron diffraction pattern of Mg32(Al,Zn)49 along the [0,0,1] zone axis. µ-Al-Mn The hexagonal phase µ-Al-Mn, space group P63/mmc, features a unit cell with 563 atoms and lattice parameters a = 19.98 and c = 24.67 Å. The structure is defined by a layer stacking along the c-axis consisting of 4 flat and 8 puckered layers. It was solved by Shoemaker et al. (1989) and is described in detail in chapter 4.1.
The Al-Mn phase diagram is shown in figure 2.9, where the stability range of the µ-phase is outlined in red. The µ-phase has a narrow stability range between about 19 and 20.8 at.% Mn and a melting temperature of 923 °C (McAlister and Murray, 1986). µ-Al-Mn coexists with the hexagonal λ-phase and the orthorhombic Al6Mn phase on the Al-rich side of its stability range and with the triclinic Al11Mn4 phase (LT) and orthorhombic Al11Mn4 phase (HT) on the Mn-rich side.
22

2 Single-crystal growth
Figure 2.9: Al-Mn phase diagram according to McAllister and Murray (1986). The stability range of the µ-phase is outlined in red. The applied melt composition cm for single-crystal growth is denoted by a dashed blue line. µ-Al-Mn features peritectic solidification behaviour. The melt composition 89 at.% Al and 11 at.% Mg (dashed blue line in figure 2.9) was chosen for Bridgman growth. During previous crystal-growth attempts with composition including higher amounts of Mn, a shift of the composition beyond the stability range of µ-Al-Mn was observed due to slightly selective evaporation of Al from the melt.
The constituents were pre-alloyed by levitation melting under protective argon atmosphere. The elements had a purity of 99.999 % Al and of 99.99 % Mn. Crystal growth was performed in vacuum with a pulling speed of 0.5 mm/h. A final crystal is shown in figure 2.10. To prevent sticking of the crystal to the crucible, a protective carbon layer was added to the inside of the alumina crucible. However, crystal fracture occurred during opening the crucible. A vertical crack is observable in figure 2.10 in the central part of the crystal. A grain boundary on the surface of a part of the crystal, solidified in a late stage of the growth, is indicated by an arrow.
23

2 Single-crystal growth
A single-crystalline part of about 1.5 cm3 was obtained and identified as µ-Al-Mn. The correct structure and appropriate composition are confirmed by powder X-ray diffraction and by EDX, respectively. In the crystal region which was used for deformation-sample preparation the composition amounts to 80.6 at.% Al and 19.4 at.% Mn. Figure 2.11 shows an electron diffraction pattern of this region along the [0,0,1]1 zone axis. No diffuse scattering or satellite spots are observed which reflects a high structural perfection.
Figure 2.10: µ-Al-Mn crystal grown by means of the Bridgman technique. A rest of the white alumina crucible is visible on the back side of the crystal. On the right-hand side a grain boundary can be observed on the crystal surface (arrow).
Figure 2.11: Electron diffraction pattern of µ-Al-Mn along the [0,0,1] zone axis.
1 The crystallographic notation of three-dimensional Miller indices is applied for hexagonal µ-Al-Mn in the present thesis.
24

2 Single-crystal growth
ß-Al-Mg
The phase β-Al-Mg with approximate composition Al3Mg2 has an fcc structure, space group mFd 3 , with lattice parameter of 28.2 Å and approximately 1168 atoms per unit cell. The atoms are located at 23 crystallographic positions arranged in 41 different polyhedra. A high amount of inherent disorder, apparent as fractional site occupation, is present in this phase. The structure was solved by Samson (1965) and is described in chapter 6.1.
The phase β-Al-Mg has a melting point of 450 °C and a stability range between 38.5 and 40.3 at.% Mg (Murray, 1986). On the Al-rich side, it coexists with the fcc α-phase, which is a solid solution of Mg in Al, and on the Mg-rich side with the two phases γ-Al12Mg17 (bcc) and the line compound R (hexagonal). The latter only exists in the temperature range 320 to 350 °C. The Al-Mg phase diagram is shown in figure 2.12 where the stability range of the ß-phase is outlined in red.
Figure 2.12: Al-Mg phase diagram (Murray, 1986). The stability range of the ß-phase is outlined in red (indicated by the approximate composition Al3Mg2). The applied melt composition cm for single crystal growth is denoted by a dashed blue line.
25

2 Single-crystal growth
Recent investigations of the Al-Mg phase diagram in the vicinity of the stability range of ß-Al3Mg2 by Feuerbacher et al. (2007) revealed that an additional low-temperature phase, called ß’-Al3Mg2, exists. However, up to now the transition temperature between these phases is only approximately known. At the composition Al61.5Mg38.5, for example, a first-order transition between ß and ß’ phase takes place in the range of 100 to 200 °C. The metastable high-temperature ß-phase is kinetically stabilized at temperatures below this phase transformation (Feuerbacher et al., 2007). The crystal system of ß’-Al-Mg was identified as rhombohedral (space group R3m) with lattice parameters a = 19.968 Å and c = 48.9114 Å.
Since ß-Al-Mg solidifies congruently at 61.5 at.% Al and 38.5 at.% Mg, the latter composition was applied for crystal growth (blue dashed line in figure 2.12). The materials were pre-alloyed by means of a levitation inductive melting furnace with a water-cooled copper crucible under protective Ar atmosphere. Single-crystalline material of the phase ß-Al-Mg investigated in the present thesis was grown by means of the Czochralski technique. However, the flux-growth technique has turned out to be applicable for single-crystal growth of this material, as well (Lipińska-Chwałek et al., 2007).
The growth was performed in a protective argon atmosphere at 400 mbar and with pulling speed of 15 mm/h. The counter rotation between pulling rod and crucible amounted to 25 min-1. The constituents had a purity of 99.9999 % Al and 99.98 % Mg. The final crystal had a size of about 3.2 cm3 and is shown in figure 2.13 together with a part of the growth apparatus. In this picture the crystal is still attached to the pulling rod and is located above the alumina crucible containing the residual melt. A part of the inductive heater surrounding the crucible is also visible.
The phase ß-Al-Mg was identified on the basis of its composition and structure by means of EDX and powder X-ray diffraction, respectively. The composition was determined to 38.7 at.% Mg and 61.3 at.% Al which corresponds to the initial melt composition within the precision of the EDX measurements. Single crystallinity of the complete crystal was confirmed by means of Laue X-ray diffraction operated in back-reflection geometry. In figure 2.14 an electron diffraction pattern of the grown ß-Al-Mg along the [0,0,1] zone axis taken by means of TEM is shown (Lipińska-Chwałek, 2007). The absence of satellite spots and diffuse scattering reflects the high quality of the crystal.
26

2 Single-crystal growth
Figure 2.13: ß-Al-Mg single crystal grown by means of the Czochralski technique. The inductive heater containing crucible and residual melt is also visible.
Figure 2.14: Electron diffraction pattern of ß-Al-Mg along the [0,0,1] zone axis (Lipińska-Chwałek, 2007).
27

2 Single-crystal growth
28

Chapter 3 Crystal plasticity and plastic deformation experiments In this Chapter an introduction to the fundamentals of crystal plasticity is given. The basic principles of dislocation motion as well as the corresponding theory of thermal activation are outlined. Experimental routines for the determination of thermodynamic activation parameters are introduced and procedures of deformation experiments performed in the frame of the present work are illustrated.
3.1 Fundamentals of crystal plasticity Plasticity and dislocation motion
Accessible experimental parameters of a deformation experiment are the force F applied at a sample, the dimensions of the sample, the time t, and the temperature T. If A is the sectional area of the sample to which the force is applied, the stress acting on the
sample can be calculated according to AF
=τ . The strain corresponds to 0llΔ
=ε , where
Δl and l0 are the length variation and the initial length of the sample, respectively. The strain consists of an elastic and a plastic contribution:
elplast εεε += . (3.1)
For small strains, where stress and strain are proportional, the deformation has purely elastic character and can be described by Hooke’s law: elE ετ ⋅= , where E is the
material-specific Young’s modulus. At higher strains a deviation from the proportionality between stress and strain appears when the deformation reaches the
29

3 Crystal plasticity and plastic deformation experiments
transition between the elastic and plastic regime. A plastically deformed sample shows a permanent change in shape.
Mostly, plastic deformation of crystals takes place by movement of dislocations (e.g. Kocks et al., 1975). Dislocations are line defects in the crystal structure characterized by
their line direction lr
and Burgers vector br
. The Burgers vector denotes the magnitude and direction of the distortion of the crystal lattice. Dislocations are called screw
dislocations if the Burgers vector lies parallel to the line direction. If br
and l are perpendicular to each other dislocations are called edge dislocations. Mixed dislocations also exist, which comprise Burgers vectors inclined with respect to the line direction.
r
An edge dislocation can be constructed by means of the Volterra process as illustrated in figure 3.1. An atomic half plane (red circles in figure 3.1 (a)) is removed from an ideal crystal lattice (figure 3.1 (b)). After closing the gap and relaxing the lattice, an edge dislocation has formed (figure 3.1 (c)). Lattice points around the dislocation core are shifted from their original positions generating a strained lattice in the vicinity of the dislocation core. This strain field remains invariant along the line direction (in figure 3.1 (c) perpendicular to the image plane).
a) b) c) Figure 3.1: The Volterra process: (a) In an ideal crystal lattice an atomic half plane is indicated by red spheres. (b) The half plane is removed. (c) The lattice is closed and relaxed. An edge dislocation is indicated.
30

3 Crystal plasticity and plastic deformation experiments
a) b) Figure 3.2: Definition of the Burgers vector b
r by means of a Burgers circuit. (a) A
Burgers circuit around an edge dislocation is shown with start (O) and finish (X) points on the same lattice point. (b) The Burgers circuit is transferred to an undistorted lattice. The Burgers vector is defined as the vector required to complete the circuit.
The Burgers vector br
is defined by means of a Burgers circuit around a dislocation as demonstrated in Figure 3.2. An atom-to-atom path which forms a closed loop around the dislocation is performed such that the start (O) and finish (X) points are located at the same lattice site (figure 3.2 (a)). The Burgers circuit transferred to a corresponding undistorted lattice is shown in figure 3.2 (b). In this case the finish and start points of the same atom-to-atom path do not coincide, i.e. the circuit shows a closure failure. The vector required to complete the circuit, i.e. to compensate the closure failure, is called the Burgers vector.
Two conventions are generally made in the literature in order to unambiguously define
the Burgers vector. First, when looking along the positive line vector lr
of the dislocation, the Burgers circuit is taken in a clockwise direction. Second, the Burgers vector is taken to run from the finish to the start point of the reference circuit in the perfect crystal (Hull and Bacon, 1984). Burgers circuits constructed around other defects, like vacancies or interstitials, do not lead to closure failures (cf. Hirth and Lothe, 1982).
An applied stress at a deformation sample generates a force on comprised
dislocations. This force Kr
is called Peach-Köhler force and acts perpendicular to the
dislocation line lr
lbKrrrr
×⋅= )(σ , (3.2)
31
3 Crystal plasticity and plastic deformation experiments
where σr is the stress tensor (e.g. Suzuki et al., 1991).
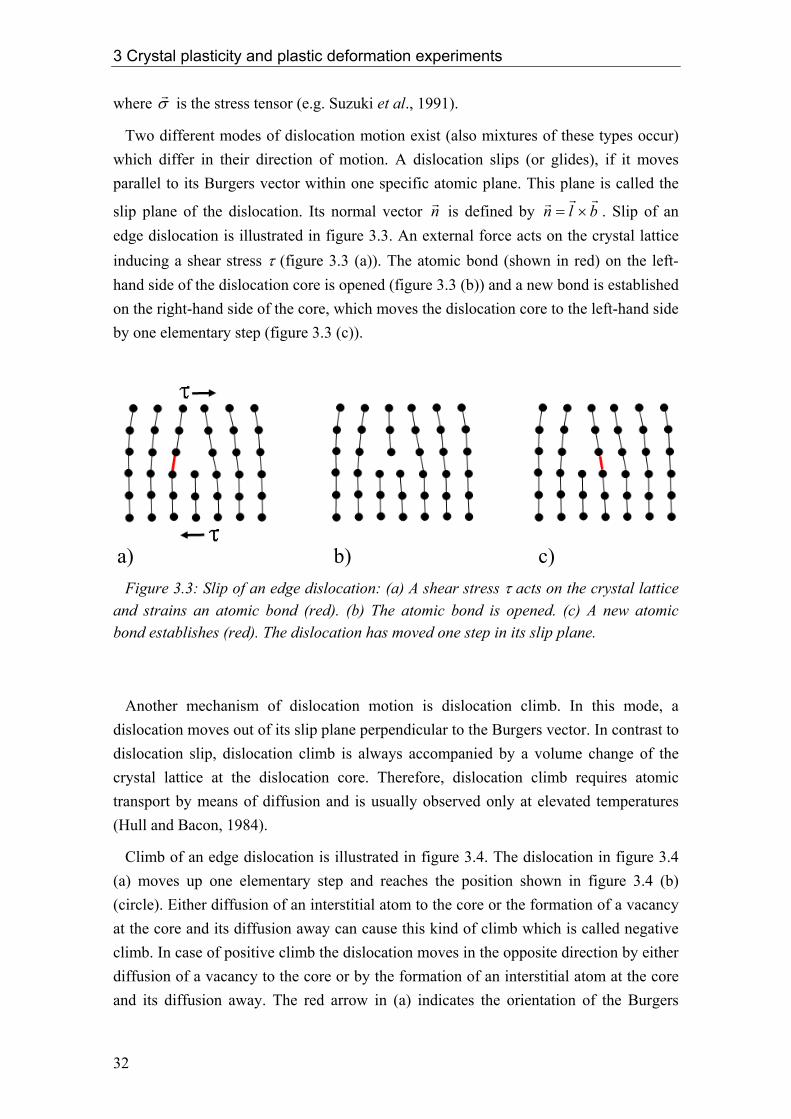
Two different modes of dislocation motion exist (also mixtures of these types occur) which differ in their direction of motion. A dislocation slips (or glides), if it moves parallel to its Burgers vector within one specific atomic plane. This plane is called the
slip plane of the dislocation. Its normal vector nr is defined by blnrrr
×= . Slip of an edge dislocation is illustrated in figure 3.3. An external force acts on the crystal lattice inducing a shear stress τ (figure 3.3 (a)). The atomic bond (shown in red) on the left-hand side of the dislocation core is opened (figure 3.3 (b)) and a new bond is established on the right-hand side of the core, which moves the dislocation core to the left-hand side by one elementary step (figure 3.3 (c)).
a) b) c)
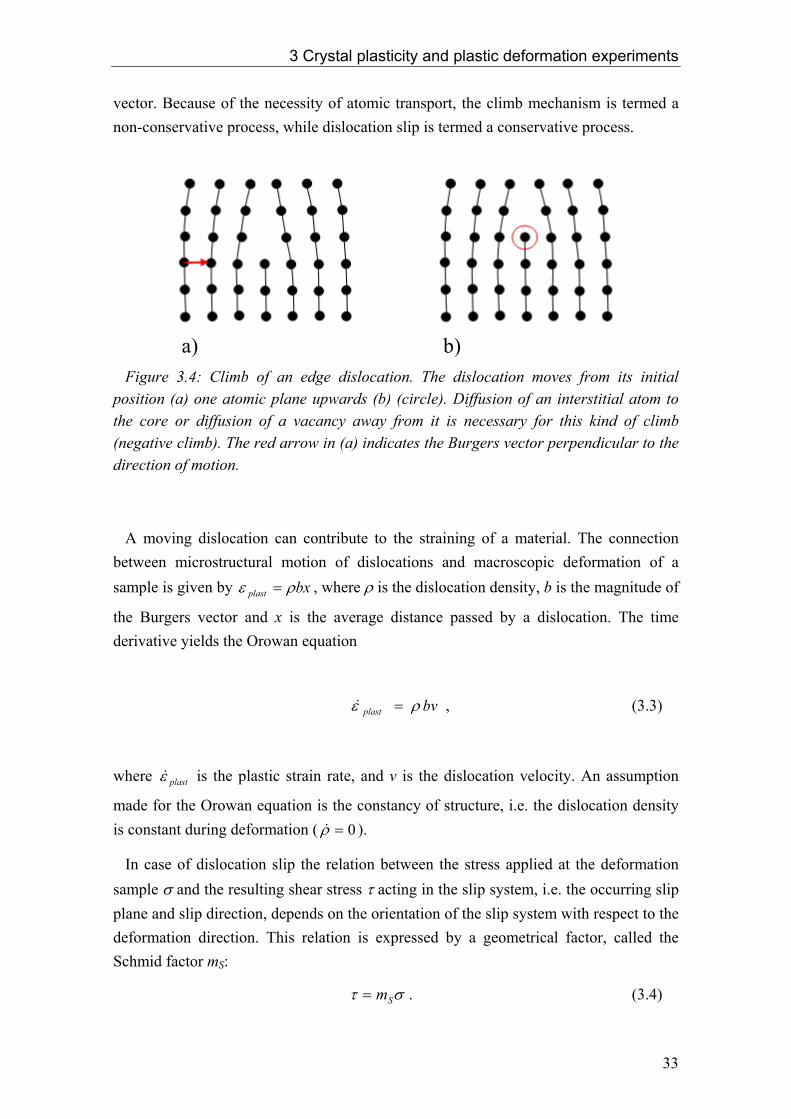
Figure 3.3: Slip of an edge dislocation: (a) A shear stress τ acts on the crystal lattice and strains an atomic bond (red). (b) The atomic bond is opened. (c) A new atomic bond establishes (red). The dislocation has moved one step in its slip plane. Another mechanism of dislocation motion is dislocation climb. In this mode, a dislocation moves out of its slip plane perpendicular to the Burgers vector. In contrast to dislocation slip, dislocation climb is always accompanied by a volume change of the crystal lattice at the dislocation core. Therefore, dislocation climb requires atomic transport by means of diffusion and is usually observed only at elevated temperatures (Hull and Bacon, 1984).
Climb of an edge dislocation is illustrated in figure 3.4. The dislocation in figure 3.4 (a) moves up one elementary step and reaches the position shown in figure 3.4 (b) (circle). Either diffusion of an interstitial atom to the core or the formation of a vacancy at the core and its diffusion away can cause this kind of climb which is called negative climb. In case of positive climb the dislocation moves in the opposite direction by either diffusion of a vacancy to the core or by the formation of an interstitial atom at the core and its diffusion away. The red arrow in (a) indicates the orientation of the Burgers
32
3 Crystal plasticity and plastic deformation experiments
vector. Because of the necessity of atomic transport, the climb mechanism is termed a non-conservative process, while dislocation slip is termed a conservative process.
a) b) Figure 3.4: Climb of an edge dislocation. The dislocation moves from its initial position (a) one atomic plane upwards (b) (circle). Diffusion of an interstitial atom to the core or diffusion of a vacancy away from it is necessary for this kind of climb (negative climb). The red arrow in (a) indicates the Burgers vector perpendicular to the direction of motion. A moving dislocation can contribute to the straining of a material. The connection between microstructural motion of dislocations and macroscopic deformation of a sample is given by bxplast ρε = , where ρ is the dislocation density, b is the magnitude of
the Burgers vector and x is the average distance passed by a dislocation. The time derivative yields the Orowan equation
bvplast ρε =& , (3.3)
where plastε& is the plastic strain rate, and v is the dislocation velocity. An assumption
made for the Orowan equation is the constancy of structure, i.e. the dislocation density is constant during deformation ( 0=ρ& ).
In case of dislocation slip the relation between the stress applied at the deformation sample σ and the resulting shear stress τ acting in the slip system, i.e. the occurring slip plane and slip direction, depends on the orientation of the slip system with respect to the deformation direction. This relation is expressed by a geometrical factor, called the Schmid factor mS:
στ Sm= . (3.4)
33

3 Crystal plasticity and plastic deformation experiments
The Schmid factor is calculated from the cosines of the angles between compression direction1 and slip-plane normal Φ and between compression direction and slip direction λ, respectively, according to ΦλmS coscos= . These angles are illustrated in
a schematic deformation sample in figure 3.5. The Schmid factor can take values between 0 and 0.5.
Figure 3.5: The orientation of the slip system with respect to the compression direction defines the Schmid factor mS. It is calculated from the angles between compression direction and slip-plane normal Φ and compression direction and slip direction λ, respectively. Thermal activation
Besides the shear stress τ other stresses may act on a dislocation, as well. Contributions occur from long-range stress fields of other dislocations or stress fields of extrinsic obstacles like point defects or precipitates. All these internal stresses τi counteract the movement of a dislocation and reduce the effective stress τeff acting on a dislocation (Seeger (1958)) according to
ieff τττ −= . (3.5)
1 The deformation experiments performed in the frame of the present thesis have been carried out exclusively as compression test. However, these geometrical considerations also hold for tensile tests.
34
3 Crystal plasticity and plastic deformation experiments
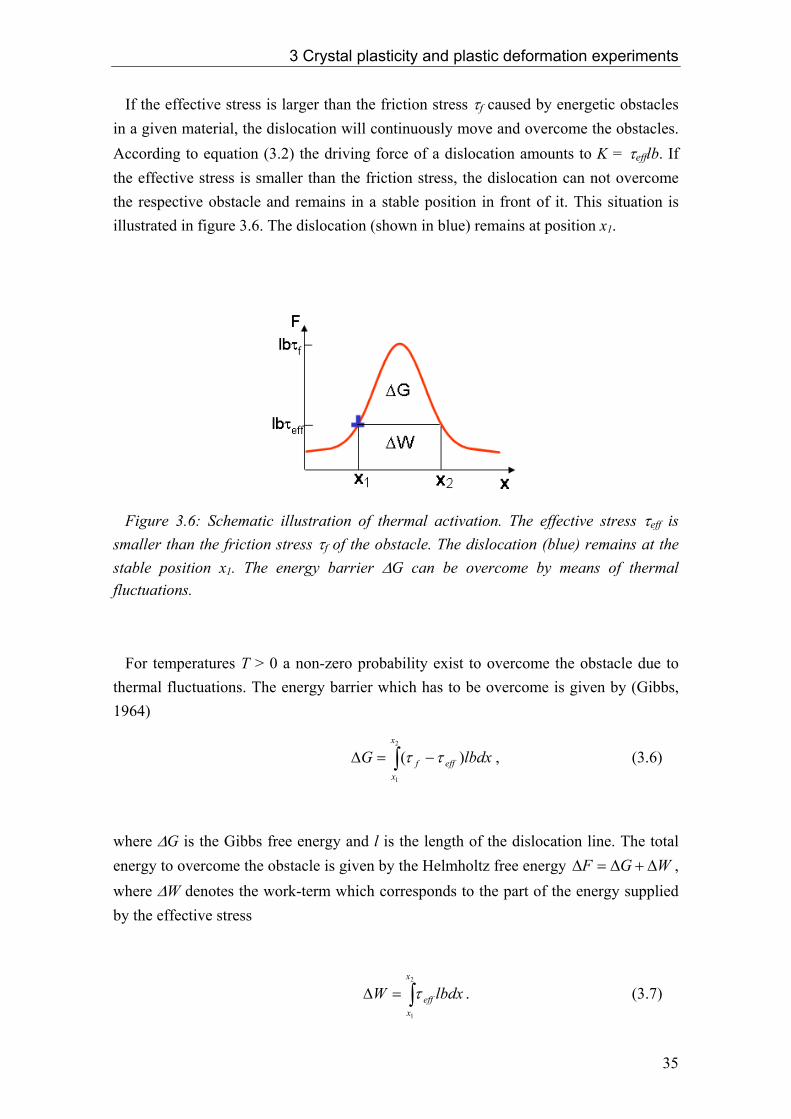
If the effective stress is larger than the friction stress τf caused by energetic obstacles in a given material, the dislocation will continuously move and overcome the obstacles. According to equation (3.2) the driving force of a dislocation amounts to K = τefflb. If the effective stress is smaller than the friction stress, the dislocation can not overcome the respective obstacle and remains in a stable position in front of it. This situation is illustrated in figure 3.6. The dislocation (shown in blue) remains at position x1.
Figure 3.6: Schematic illustration of thermal activation. The effective stress τeff is smaller than the friction stress τf of the obstacle. The dislocation (blue) remains at the stable position x1. The energy barrier ΔG can be overcome by means of thermal fluctuations. For temperatures T > 0 a non-zero probability exist to overcome the obstacle due to thermal fluctuations. The energy barrier which has to be overcome is given by (Gibbs, 1964)
, (3.6) ∫ −=Δ2
1
)(x
xefff lbdxG ττ
where ΔG is the Gibbs free energy and l is the length of the dislocation line. The total energy to overcome the obstacle is given by the Helmholtz free energy , where ΔW denotes the work-term which corresponds to the part of the energy supplied by the effective stress
WGF Δ+Δ=Δ
. (3.7) ∫=Δ2
1
x
xeff lbdxW τ
35
3 Crystal plasticity and plastic deformation experiments
Integration of equation (3.7) with τeff(x) = const yields
xlbW eff Δ=Δ τ , (3.8)
where Δx = x2-x1 is the distance moved by the dislocation to overcome the obstacle. The probability is given by (Vineyard, 1957)
kT
GP Δ−= exp , (3.9)
where k is Boltzmann’s constant and T is the absolute temperature. If the thermal overcoming of obstacles is rate controlling, the process is called thermally activated. In this case the probability of thermal activation (3.9) can be combined with the Orowan equation (3.3) (Schoeck, 1965) as
kT
Gplast
Δ−= exp0εε && , (3.10)
with the pre-exponential factor 00 xvbΔ= ρε& , where v0 is the attempt frequency
(Granato et al. (1964)). If the energy barrier is overcome isothermally and at constant stress, ΔG is a thermodynamic variable of state.
The differential of the Gibbs free energy is with the
definitions effdVSdTGd τ*)( −Δ−=Δ
eff
TGS
τ∂Δ∂
−≡Δ)( (3.11)
and
Teff
GVτ∂Δ∂
−≡)(* . (3.12)
ΔS is the activation entropy and V* is the activation volume. The activation volume can be calculated according to (Kocks et al., 1975)
36

3 Crystal plasticity and plastic deformation experiments
(3.13) AbxlbV Δ=Δ=*
and can be interpreted as the area which is passed by the dislocation during thermally activated overcoming of an obstacle multiplied with the Burgers vector of the dislocation. Figure 3.7 illustrates the interpretation of the activation volume. The dislocation line is pinned at two points indicated by P and stays at a stable position in front of an obstacle. By means of thermal fluctuations the dislocation can overcome the obstacle and pass the distance Δx.
Figure 3.7: Geometrical interpretation of the activation volume. The activation area ΔA is the area covered by the dislocation line during thermally-activated overcoming of an obstacle. The work term can be calculated from the activation volume in comparison with equation (3.8) according to
. (3.14) *VW effτ=Δ
3.2 Incremental tests Thermodynamic activation parameters described in the last section are not directly accessible from the experiments. They have to be calculated from the macroscopic parameters stress, strain, temperature, and time. The activation volume can be determined from the deformation experiment according to (Evans and Rawlings, 1969)
37

3 Crystal plasticity and plastic deformation experiments
T
plast
SmkTV
σε
∂
∂=
&ln. (3.15)
This experimental activation volume V is connected with V* via )1(*TiVV ττ ∂∂+=
(Evans and Rawlings, 1969, Hirth and Nix, 1969). V and V* are identical if τi is independent of τ. The activation volume provides information about the nature of dislocation obstacles since for thermally activated processes obstacles and activation volume have approximately the same size (Krausz and Eyring, 1975). Another important parameter is the strain-rate dependence of the stress calculated according to
Tplast
Iεσ&ln∂
∂≡ . (3.16)
From the approach (Ilschner, 1973) the stress exponent mplast σε ∝&
T
plastmσ
εln
ln∂
∂=
& (3.17)
can be deduced which may be used to classify deformation processes (e.g. Poirier, 1985).
The Gibbs free activation energy can not be determined directly from a deformation experiment. However, the activation enthalpy ΔH which is connected with the Gibbs free energy via
STGH Δ+Δ=Δ (3.18)
can be determined according to (Evans and Rawlings, 1969)
plast
TkTH
T
plast
ε
σσε
∂∂
∂
∂−=Δ
&ln2 . (3.19)
38
3 Crystal plasticity and plastic deformation experiments
The thermodynamic magnitudes described above cannot be determined by means of a dynamic compression experiment, i.e. deformation with constant strain rate. Additional incremental tests1 (stress-relaxation tests, temperature changes) during the deformations have to be performed in order to calculate the thermodynamic activation parameters.
Stress-relaxation tests
In order to perform a stress-relaxation test, a continuous deformation experiment is abruptly halted at constant strain and the stress decrease is measured as function of time. Since the total strain is kept constant the total strain rate is given by 0=+= elplast εεε &&&
(cf. equation (3.1)) and elastic strain is transferred into plastic strain, i.e. plastel εε && −= .
Following Hooke’s law, the elastic strain decreases proportional with the stress ( σε ∝el ) and accordingly σε && −∝plast . Using this relation with equations (3.15) and
(3.17), the activation volume and the stress exponent can be determined from stress-relaxation tests by
TSm
kTVσ
σ∂
−∂=
)ln( & (3.20)
and
T
mσσ
ln)ln(
∂−∂
=&
. (3.21)
Temperature changes
In order to perform temperature changes during a dynamic compression test, the deformation is interrupted and the sample is unloaded. After an equilibration time, the sample is reloaded with a temperature changed by ΔT and deformed with the initial strain rate. The resulting stress difference can be determined in the stress-strain curve. In combination with stress-relaxation tests the temperature dependence of the stress yields the activation enthalpy ΔH according to equation (3.19).
Δσ
1 Here, only incremental tests are described which are applied in the frame of the present thesis. For a broader overview of common tests see e.g. Feuerbacher (1996).
39

3 Crystal plasticity and plastic deformation experiments
For all deformation experiments performed in the present work, the same sequence of incremental tests was conducted. An exemplary stress-strain curve, illustrating the sequence of stress-relaxation tests “R” and temperature change “TC”, is shown in figure 3.8. The upper-yield point (uyp) and the lower-yield point (lyp) of the stress-strain curve are indicated. The dashed line denotes the interpolated course.
After reaching the lower-yield point in the stress-strain behaviour, a stress-relaxation test is performed for 60 s (120 s in the case of µ-Al-Mn), followed by unloading of the sample and a temperature increase by 10 °C. After an equilibration time of about 1200 s, the sample is reloaded and deformed by further 0.5 to 1 % plastic strain. Subsequently a second stress-relaxation test is performed again followed by an unloading of the sample and a temperature change back to the initial value. After equilibration and reloading of the sample, a third stress-relaxation test is performed. Afterwards deformation with initial temperature and strain rate is continued.
Figure 3.8: Exemplary stress-strain curve of a deformation experiment, illustrating the sequence of conducted stress-relaxation tests “R” and temperature changes “TC”. The upper- and the lower- yield point of the deformation behaviour are indicated “uyp” and “lyp”, respectively. The dashed line denotes the interpolated course of the curve.
40

3 Crystal plasticity and plastic deformation experiments
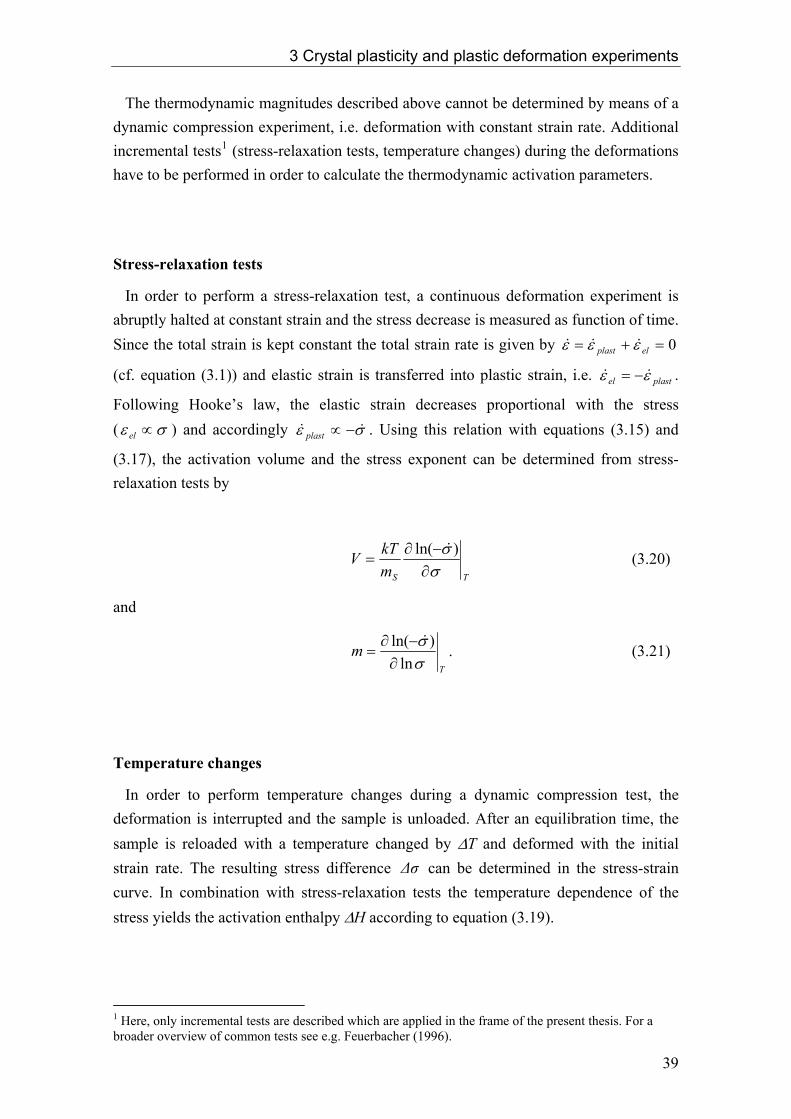
3.3 Uniaxial testing machine All deformation experiments performed in the frame of the present work have been carried out in compression using a modified Zwick Z050 uniaxial testing machine. The essential parts of this machine are schematically shown in figure 3.9. The deformation sample (1), which usually has a size of about 2 x 2 x 5 mm3, is located between two silicon-carbide compression anvils (2). The upper and lower anvil are connected via alumina compression rods (3) to a moveable crosshead and the frame of the machine, respectively. The load is measured by a 10 kN load cell (4) in series with the lower compression rod. The strain measurement is carried out by a linear inductive differential transducer which directly measures the length variation of the sample at the anvils via alumina rods (5) at an accuracy of ±10 nm. This setup is enclosed by a cylindrical furnace (6). The deformation temperature is controlled directly at the sample by means of a thermocouple (7), while the temperature gradient is controlled by two additional thermocouples (8) within the compression anvils.
The deformation experiments are computer-operated under closed-loop control and can be conducted as constant-strain-rate tests (dynamic-compression tests) or constant-stress tests (creep tests). Changes between this modes or additional incremental tests (see above) can be performed during a running experiment.
41
3 Crystal plasticity and plastic deformation experiments
Figure 3.9: Schematic setup of the Zwick Z050 deformation machine; for explanations see text.
42
Chapter 4 Plasticity of µ-Al-Mn In this chapter the structure of the CMA phase µ-Al-Mn is introduced and deformation experiments performed on this phase are described. Uniaxial compression tests at constant strain rate and with compression direction parallel to the c-axis of the hexagonal structure were carried out. Thermodynamic activation parameters of the deformation process are evaluated and discussed. A microstructural analysis of the deformed material is performed by means of TEM and the underlying microstructural deformation mechanisms are determined. Pure climb of two interacting sets of dislocations is found to be the primary microstructural deformation mechanism.
4.1 The structure of µ-Al-Mn The phase µ-Al-Mn exhibits a hexagonal crystal system with space group P63/mmc (Bendersky, 1987). The structure was investigated by Shoemaker et al. (1989) who found that this phase with approximate composition Al4Mn possesses the lattice parameters a = 19.98 and c = 24.67 Å. The unit cell contains 563 atoms whereby two of the 42 atomic positions are partially occupied.
In µ-Al-Mn no large atom clusters as known from other CMA phases (e.g. Bergman or Mackay cluster) occur, but different fragments of Mackay clusters (cf. chapter 1) are present. Nearly all Mn atom sites in µ-Al-Mn feature icosahedral coordination while the Al sites are coordinated by pentagonal prisms and other regular and irregular polyhedra featuring coordination numbers (CN) between 9 and 15 as shown in figure 4.1.
43

4 Plasticity of µ-Al-Mn
Figure 4.1: Coordination polyhedra in µ-Al-Mn for Mn (a) and Al (b-f) (after Shoemaker et al., 1989). Small and large spheres denote Mn and Al atom sites, respectively; numbers indicate atom sites with respect to the model of Shoemaker et al. (1989). (a) Trigonal coordination of Mn. The Al sites are partially occupied. (b) CN13 coordination of Al. (c) Friauf polyhedron with three additional Al atoms. (d) CN14 coordination of Al. (e,f) Examples for irregular CN12 coordinations of Al. The large and small spheres denote Al and Mn atom sites, respectively. Different atom positions are denoted by numbers according to the structure model of Shoemaker et al. (1989). One Mn atom site without icosahedral coordination is present in the structure. It is surrounded by a trigonal prism of Al atoms as shown in figure 4.1 (a). The Al sites in this polyhedron are partially occupied. Figure 4.1 (b) shows one of six occurring similar Al coordinations with CN13. Other atomic arrangements shown in figure 4.1 are (c) a Friauf polyhedron with three additional Al atoms, (d) a polyhedron featuring CN14 and irregular Al
44
4 Plasticity of µ-Al-Mn
coordinations (e) and (f) with CN12. The complete model with descriptions of all atom sites is given by Shoemaker et al. (1989).
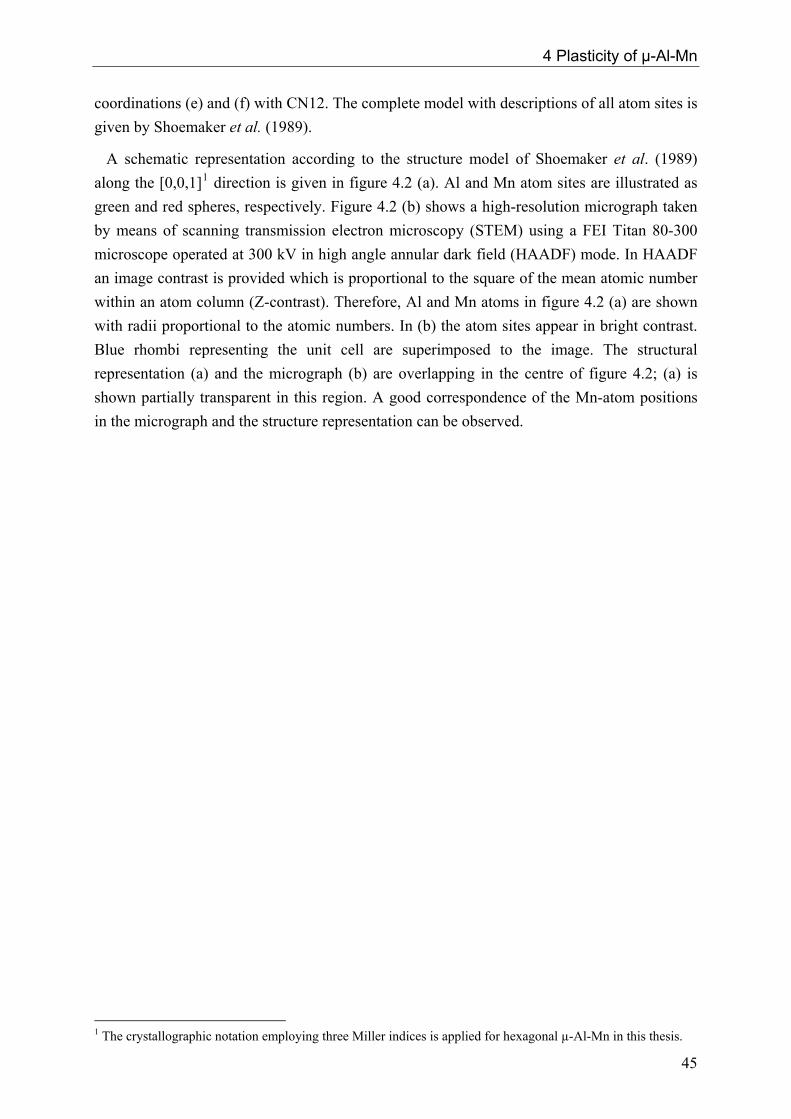
A schematic representation according to the structure model of Shoemaker et al. (1989) along the [0,0,1]1 direction is given in figure 4.2 (a). Al and Mn atom sites are illustrated as green and red spheres, respectively. Figure 4.2 (b) shows a high-resolution micrograph taken by means of scanning transmission electron microscopy (STEM) using a FEI Titan 80-300 microscope operated at 300 kV in high angle annular dark field (HAADF) mode. In HAADF an image contrast is provided which is proportional to the square of the mean atomic number within an atom column (Z-contrast). Therefore, Al and Mn atoms in figure 4.2 (a) are shown with radii proportional to the atomic numbers. In (b) the atom sites appear in bright contrast. Blue rhombi representing the unit cell are superimposed to the image. The structural representation (a) and the micrograph (b) are overlapping in the centre of figure 4.2; (a) is shown partially transparent in this region. A good correspondence of the Mn-atom positions in the micrograph and the structure representation can be observed.
1 The crystallographic notation employing three Miller indices is applied for hexagonal µ-Al-Mn in this thesis.
45

4 Plasticity of µ-Al-Mn
Figure 4.2: Projection of the µ-Al-Mn structure along the [0,0,1] direction. (a) Model according to Shoemaker et al. (1989). Al and Mn sites are shown in green and red, respectively. (b) High-resolution micrograph taken by means of STEM in high angle annular dark field mode (Houben and Roitsch, 2007). Atom sites appear in bright contrast. Unit cells are indicated blue in (a) and (b). Figure 4.3 shows schematic representations of the unit cell along the [1,0,0] (a) and ]0,1,1[
(b) directions. The structure comprises two different types of layers arranged in a symmetric stacking along the c-axis; F denotes flat and P denotes puckered layers. In the centre of the figure, layer positions along [0,0,1] are given in units of the lattice parameter c. The flat layers at c = 0.25 and 0.75 correspond to mirror planes. Therefore, the puckered layers at c = 0.325 and 0.425 can be generated from the layers at c = 0.175 and 0.075, respectively, by mirror-symmetry operations. Layers above c = 0.5 can be generated by the operation of a twofold-rotational symmetry along the [1,1,0] direction on layers below c = 0.5 (Shoemaker et al., 1989). Additionally, the layer at c = 0.5 corresponds to a pseudo-mirror with respect to its adjacent layers.
46

4 Plasticity of µ-Al-Mn
Concerning the layer stacking of the structure, µ-Al-Mn is closely related with several other hexagonal phases (Kreiner and Franzen, 1997). Especially the crystal structures of λ-Al-Mn and Al10Mn3 can be described by symmetric stackings of flat and puckered layers along the c-axis, which are comparable to those in µ-Al-Mn. An overview of various related hexagonal phases in terms of layer-stacking concepts is given by Kreiner and Franzen (1995).
(a) (b) Figure 4.3: Schematic projection of the µ-Al-Mn unit cell along the (a) and 0]0[1 ,, 0]1[1 ,, (b) direction. The unit cell features a structure of 4 flat (F) and 8 puckered (P) layers stacked along the c-axis. Al and Mn sites are shown in green and red, respectively. The layer positions along [0,0,1] are given in terms of the lattice parameter c. 4.2 Macroscopic deformation behaviour Experimental details
µ-Al-Mn was grown by means of the Bridgman technique as discussed in chapter 2.2. A single crystal of about 1.5 cm3 in size was obtained. The material was characterized as described in chapter 2.3. Neither secondary phases nor grain boundaries were found.
The crystal was oriented by Laue X-ray diffraction in back-reflection geometry. Rectangular samples of about 1.6 x 1.6 x 4.5 mm3 in size for uniaxial deformation experiments were cut from the crystal by means of spark erosion. The long axis of the samples, i.e. the compression direction, corresponds to the [0,0,1] direction (c-axis) of the hexagonal structure. The side
47

4 Plasticity of µ-Al-Mn
faces correspond to [1,0,0] and ]0,1,1[ directions, respectively. All surfaces were carefully
ground and polished in order to prevent crack formation at scratches. Care was taken to obtain flat and plan-parallel end faces in order to prevent inhomogeneous stress fields in the sample.
The deformation experiments were carried out as uniaxial compression tests in a modified Zwick Z050 testing system under closed-loop control. The setup of this deformation machine is described in chapter 3.3. The experiments were performed in air at temperatures between 700 °C and 875 °C and at a constant strain rate of 10-5 s-1. Additional incremental tests, i.e. stress-relaxation tests and temperature changes, were performed as described in chapter 3.2. After deformation, the samples were rapidly unloaded and quenched on a cold metal plate in order to preserve the microstructural state.
Results
First deformation experiments on µ-Al-Mn samples were carried out at a strain rate of 10-4 s-1. Sample fracture occurred shortly after entering the plastic deformation regime even at a high homologous temperature of TH = 0.9, where TH = T / Tm is the absolute temperature T scaled by the absolute melting temperature Tm which amounts to Tm = 1196 K (McAllister and Murray, 1986). Therefore, deformation experiments with a strain rate of 10-5 s-1 were performed.
In figure 4.4 stress-strain curves of µ-Al-Mn samples, deformed between 700 and 875 °C, are shown. Vertical dips in the curves at 750, 800, and 850 °C are due to incremental tests. The applied sequence of these tests is described in chapter 3.2. A stress-relaxation experiment and a deformation section with a temperature increased by 10 °C are labelled “R” and “TC”, respectively. Dashed lines in figure 4.4 indicate the interpolated course of the stress-strain curves. The deformation experiments at 800 and 850 °C were aborted at a total strain of about 4 %. At 875 °C the flow stress was too low to obtain reliable activation parameters and the deformation experiment was aborted at about ε = 1 %. At 750 and 700 °C sample fracture occurred during the deformation at 2 and 1.1 %, respectively.
All curves in figure 4.4 (except at 875 °C) show a pronounced yield-point effect. The yield drop, i.e. the difference between the maximum stress and the steady-state flow stress, increases with decreasing temperature. At 750 °C a huge yield drop of 50 % of the respective maximum stress is observed. Reloading of the sample does not induce additional yield-point effects: After stress-relaxations as well as after unloading for temperature changes the stress smoothly approaches an almost constant flow stress without exhibiting an overshoot. At 800 and 850 °C the stress-strain curves show a constant flow stress between 2.5 and 4 % strain. Neither work hardening nor work softening is observed.
48

4 Plasticity of µ-Al-Mn
Figure 4.4: Stress-strain curves of µ-Al-Mn at temperatures between 700 and 875 °C at a strain rate of 10-5 s-1. A stress relaxation test and a temperature change are exemplarily labelled “R” and “TC”. Interpolated courses of the stress-strain curves are plotted as dashed lines. In addition to the experiments shown in figure 4.4, another deformation experiment was performed at 750 °C using a sample pre-deformed at 875 °C up to a total strain of ε = 1 %. It was found that the pre-deformation strongly suppresses the yield-point effect. The stress-strain curves of these two deformation experiments performed at 750 °C are compared in figure 4.5.
The solid curve corresponds to the deformation of a previously undeformed, and the dashed curve to the deformation of a pre-deformed sample. While the deformation of a fresh sample leads to an upper-yield point of about 560 MPa, the pre-deformed sample shows a value of 360 MPa only. The flow stresses at higher strains (ε = 1 – 2 %), on the other hand, differ by about 15 MPa which corresponds to the usual experimental scatter, i.e. they can be considered essentially unaffected by the pre-deformation.
49

4 Plasticity of µ-Al-Mn
Figure 4.5: Stress-strain curves of µ-Al-Mn at 750 °C and 10-5 s-1. The continuous curve denotes an experiment carried out with a previously undeformed sample while the dashed curve denotes an experiment with a pre-deformed sample (T = 875 °C, ε&= 10-5 s-1, ε = 1 %). During the deformation experiment at 750 °C of the pre-deformed sample photographs of the sample were taken. Figure 4.6 shows a set of three pictures of the sample at different times of the experiment (a-c). The time intervals between the photographs are indicated. They were taken before the first stress-relaxation test was initiated, at strains between 0.7 and 1.2 %. The white arrows in figure 4.6 (a) indicate the load axis at the compression anvils. The cuboid shaped sample is oriented with one edge towards the camera so that two side faces are visible on the pictures.
At the beginning of the test (not shown), the sample surface displays a homogeneous grey appearance. In the course of the deformation process, bright horizontal lines appear on the surface and grow perpendicular to the compression direction. On one of the side faces a surface regions is marked by a rectangle and enlargements of this region are shown. At the end of the deformation experiment the surface of the sample was completely covered by bright lines.
50
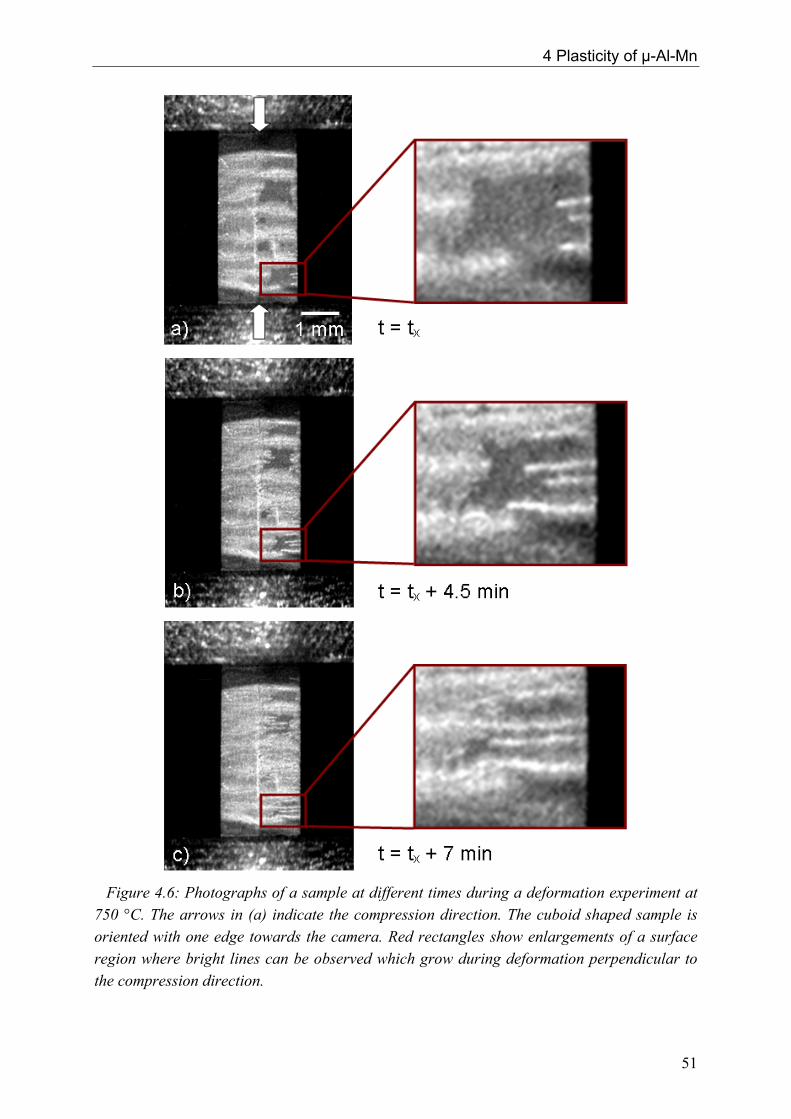
4 Plasticity of µ-Al-Mn
Figure 4.6: Photographs of a sample at different times during a deformation experiment at 750 °C. The arrows in (a) indicate the compression direction. The cuboid shaped sample is oriented with one edge towards the camera. Red rectangles show enlargements of a surface region where bright lines can be observed which grow during deformation perpendicular to the compression direction.
51

4 Plasticity of µ-Al-Mn
Figure 4.7 (a) shows an optical micrograph of a deformed sample. Black arrows denote the compression direction. The sample, deformed in air at 750 °C (same sample as shown in figure 4.6), is covered with an oxide layer (dark surface in figure 4.7) showing a pattern of bright lines, which are mostly oriented perpendicular to the compression direction. The other side faces of the sample show a similar appearance. The bright lines are caused by local flaking, and at these positions, the surface of the sample is visible.
Figure 4.7 (b) is a magnification of such an area. Fine steps or cracks oriented parallel and perpendicular to the compression direction are observed on the sample surface. Samples deformed at other temperatures exhibit a similar surface appearance.
Figure 4.7: Deformation sample (a) and enlarged surface region (b) after deformation at 750 °C up to ε = 3.6 %. Figure 4.8 shows the results of a stress relaxation test at 750 °C. The test was aborted after 2 minutes. In (a) the stress is plotted as function of time. The natural logarithm of the slope
)ln( σ&− is plotted as function of stress in (b). A linear fit is indicated by a solid line. Its slope
delivers, according to equation (3.20), the activation volume V. A Schmid factor of ms = 1 was implied in this calculation since the assumed microstructural mechanism for plastic deformation in this material is dislocation climb (see discussion in section 4.4).
52

4 Plasticity of µ-Al-Mn
Figure 4.8: Stress-relaxation test on µ-Al-Mn at 750 °C. The stress plotted as function of time is shown in (a). The natural logarithm of the slope )σln( &− plotted as function of stress is shown in (b). The solid line in (b) is a linear fit. Figure 4.9 shows the stress dependence of the activation volume. The dashed curve is a fit of the determined experimental activation volumes at different stresses and follows the hyperbolic function σ/5.85=V . The stress exponent m is calculated according to equation (3.21) and is shown in figure 4.10 as function of temperature. The stress exponent is nearly constant in the investigated temperature range. The dashed line corresponds to the average value of m = 5.5.
The activation enthalpy ΔH, calculated according to equation (3.19), is shown in figure 4.11 (squares). The values are strongly varying with the temperature from 4.5 to 9 eV. The dashed line shows a linear fit. The work term, corresponding to the part of the energy which is supplied by the applied stress, is calculated according to equation (3.14) by neglecting internal stresses, i.e. VW τ≈Δ . It is shown in figure 4.11 as circles. The work term is constant in the observed temperature range and amounts to about 0.5 eV, i.e. it is more than ten times smaller than the activation enthalpy.
53

4 Plasticity of µ-Al-Mn
Figure 4.9: Activation volume V of µ-Al-Mn, evaluated from stress-relaxation experiments, as a function of stress σ. The dashed curve follows the hyperbolic function σ/5.85=V .
Figure 4.10: Stress exponent m of µ-Al-Mn, evaluated from stress-relaxation experiments, as function of temperature. The dashed line indicates the average value of m = 5.5.
54

4 Plasticity of µ-Al-Mn
Figure 4.11: Activation enthalpy ΔH (squares) and work term ΔW (circles) of µ-Al-Mn as a function of temperature. The dashed line shows a linear fit of the activation enthalpy.
55

4 Plasticity of µ-Al-Mn
4.3 Microstructural analysis Experimental details
The microstructural investigations on µ-Al-Mn were carried out by means of a JEOL 4000FX transmission electron microscope operated at 400 kV. Fundamentals of the microstructural analysis are described in Appendix A
The sample material was cut into slices of about 0.7 mm thickness by means of a high
precision wire saw. Samples were cut with plane normals parallel to the [0,0,1] and ]0,1,1[
directions, i.e. parallel and perpendicular to the compression direction. Sample preparation was performed by mechanical grinding to a slice thickness of about 120 µm1. Further thinning was performed using a dimple grinder. By this means a sample thickness of about 25 µm is obtained at the thinnest sample area. Subsequently the specimens are polished with an alumina suspension (particle size smaller than 1µm) and finally thinned by argon-ion milling, carried out on a liquid-nitrogen cooled stage in a Gatan Dual Ion Mill 600. This process is performed in two steps using a gun voltage of 5 kV and subsequently 3 kV at an angle of incidence to the sample plane of 14 and 9°, respectively.
Results
Figure 4.12 shows a bright-field Bragg-contrast TEM micrograph of a µ-Al-Mn sample deformed at T = 850 °C up to ε = 4.4 %. The TEM specimen was prepared with plane normal parallel to the compression direction. The plane normal of figure 4.12 lies close to the [0,0,1] zone axis. The orientation of the TEM specimen with respect to the geometry of the deformation sample is illustrated by the inset on the right-hand side of figure 4.12. The
applied two-beam condition corresponds to the reciprocal vector )0,10,5(=gr (upper-left
inset).
Two different types of dislocations are visible in figure 4.12. One dislocation type possesses a line direction which lies within the TEM-specimen plane. Accordingly, long dislocation-line segments of this type are visible (white arrows). The second type of dislocations possesses line direction parallel to the surface normal of the TEM-specimen plane. Only short projections of the line segments of this dislocation type are visible in figure 4.12 (black arrows). In the following, orientations and habit planes of both types of dislocations are analyzed separately.
1 A more detailed description of sample-preparation procedures can be found e.g. in Wollgarten (1993).
56

4 Plasticity of µ-Al-Mn
Figure 4.12: Bright-field Bragg-contrast TEM micrograph of deformed µ-Al-Mn. The TEM-specimen possesses a surface normal parallel to [0,0,1]. The black and the white arrows indicate two different sets of dislocations. The inset on the right-hand side illustrates the specimen orientation with respect to the compression direction. The applied two-beam condition corresponds to ,0)10(5,g =
r (inset on the upper left). c-axis dislocations
The dislocations with line direction parallel to the surface normal of the specimen shown in figure 4.12 are imaged with higher magnification in figure 4.13. This micrograph reveals that the contrast, as seen in figure 4.12, stems from five closely arranged dislocations (black arrows). The plane normal of this micrograph is almost parallel to the [0,0,1] direction. The five dislocations have line direction along [0,0,1] (c-axis) and are correspondingly oriented nearly end-on in figure 4.13. In the following these dislocations are accordingly referred to as c-axis dislocations.
The five dislocations are located in a common habit plane whereby the distance between the exterior dislocations amounts to approximately 100 nm. Due to this narrow distance, the five individuals of each group can not be resolved in figure 4.12. Between the dislocations, stacking faults are present (white arrows in figure 4.13) indicating that the five individual dislocations are partial dislocations.
57

4 Plasticity of µ-Al-Mn
Figure 4.13: c-axis dislocation split into five partials (nearly end-on orientation, black arrows) with [0,0,1] line direction arranged in a common plane. Stacking faults (white arrows) are visible between the individual partials. The habit planes of the c-axis dislocations are arranged according to specific lattice directions. Their normal vectors lie within the (0,0,1) plane, parallel to or nr >< 0,0,1
>< 0,1,1 directions, which correspond to the short and long diagonal axes of the hexagonal
unit cell, respectively. Hence, twelve different orientations of these habit planes are observed.
In figure 4.14 several c-axis dislocations are shown in nearly end-on orientation. The five individual dislocations can not be clearly resolved in this micrograph, but the different orientations of the common habit planes can be observed. The orientations of some habit planes are indicated by white arrows (parallel to the plane normals). The directions according to the hexagonal structure are indicated.
Some of the twelve habit-plane orientations show preferential occurrence. The c-axis
dislocations featuring habit planes with ><= 0,1,1nr (long diagonal axis of unit cell) were
observed about four times more frequently than those with ><= 0,0,1nr (short diagonal axis
of unit cell).
58

4 Plasticity of µ-Al-Mn
Figure 4.14: c-axis dislocations in nearly end-on orientation. The five individual partials of each group (not clearly resolved in this micrograph) are arranged in common habit planes with or >< 001 ,, >< 011 ,, normal vectors. White arrows denote the orientations of some habit planes. The directions of the hexagonal structure are indicated. The applied two-beam condition corresponds to ,0)10(5,g =
r . One c-axis dislocation is shown in a TEM micrograph in figure 4.15. Here the specimen
was cut parallel to the ]0,1,1[ direction, i.e. perpendicular to the compression direction. Since
the dislocation line lies within the plane of the TEM sample, long segments of the dislocations are visible as dark diagonal lines. The c-axis is indicated by a long black arrow. Five individual dislocation lines are visible, whereby two dislocations on each side of the centre
line lie closely together. The habit plane of this dislocation corresponds to the )0,1,1( plane1,
which does not coincide exactly with the image plane. The dislocation lines of three partials leave the plane of the sample in the upper-right corner of figure 4.15, leading to a decreasing contrast of these partial dislocations (short black arrows).
1 Note that the ]0,1,1[ direction is parallel to the normal vector of the )0,1,1( plane which is only true for specific directions and planes offering identical indices in a hexagonal structure.
59

4 Plasticity of µ-Al-Mn
Figure 4.15: c-axis dislocation in a specimen prepared perpendicular to the compression direction (cf. inset in lower-right corner). The [0,0,1] direction (long black arrow) corresponds to the line direction of the partials. The image normal is close to the 0]1[1 ,, zone axis. In the lower-left corner of figure 4.15 two partial dislocations show a jog (white arrow) within their habit plane which changes the distance to the other dislocations. The inset in the lower-right corner of figure 4.15 illustrates the TEM-specimen orientation with respect to the compression direction.
Basal-plane dislocations
Figure 4.16 shows a TEM micrograph with orientation close to the [0,0,1] zone axis. Three dislocation lines, lying within the TEM-specimen plane, are visible as long dark line segments in the micrograph (white arrows). These segments are parts of loops extending in the (0,0,1) plane (basal plane of the hexagonal structure). In the following these dislocations are accordingly referred to as basal-plane dislocations. Basal-plane dislocations are facetted. Several straight segments of the dislocation lines can be observed in figure 4.16.
60

4 Plasticity of µ-Al-Mn
The orientations of the line segments correspond to specific crystallographic directions.
They are aligned along or >< 0,0,1 >< 0,1,1 directions, analogous to the orientations of habit
planes of c-axis dislocations (cf. figure 4.14). The straight loop segments possess an equal distribution along these directions. The occurrence of preferential directions, as in the case of habit planes of the c-axis dislocations, is not observed. The inset on the left-hand side of figure 4.16 indicates the directions according to the hexagonal structure. Some c-axis dislocations are observed in figure 4.16, as well (black arrows).
Figure 4.16: TEM micrograph close to the [0,0,1] zone axis. Parts of faceted dislocation loops with (0,0,1) habit planes are visible as long dark lines (white arrows). Facets have line directions parallel to >< 1,0,0 or >< ,011, directions as indicated by the inset on the left-hand side. c-axis dislocations are also visible (black arrows).
61
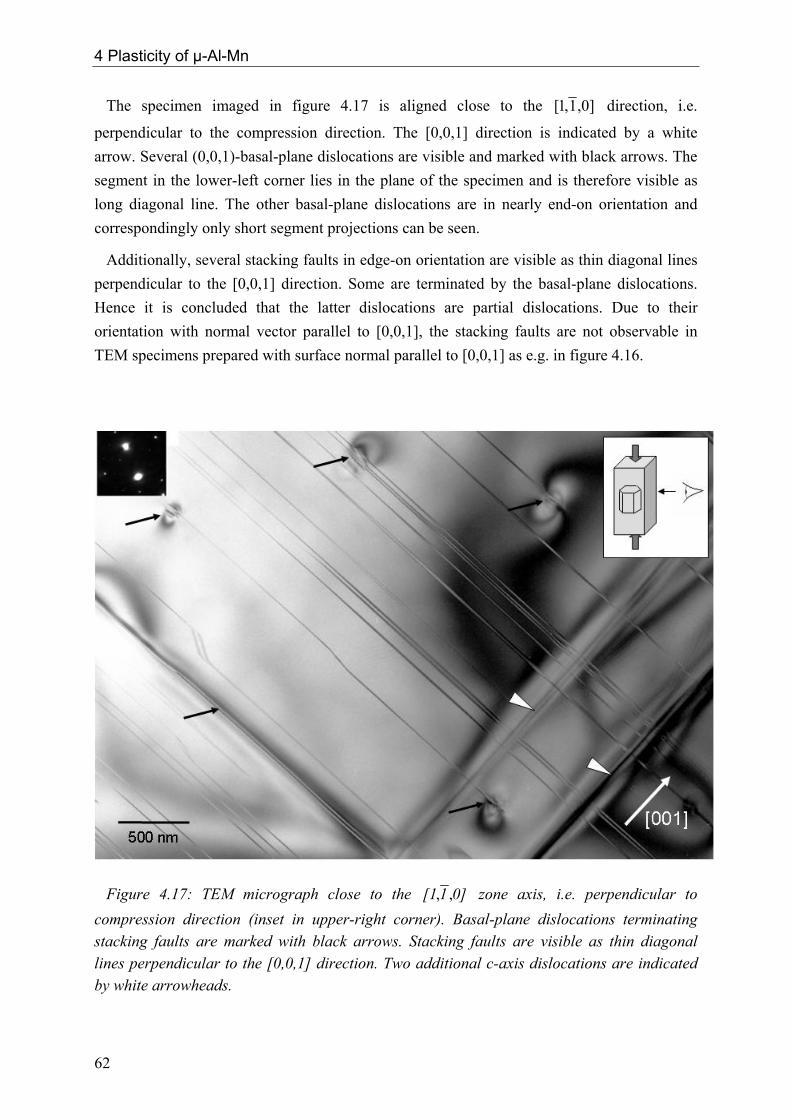
4 Plasticity of µ-Al-Mn
The specimen imaged in figure 4.17 is aligned close to the ]0,1,1[ direction, i.e.
perpendicular to the compression direction. The [0,0,1] direction is indicated by a white arrow. Several (0,0,1)-basal-plane dislocations are visible and marked with black arrows. The segment in the lower-left corner lies in the plane of the specimen and is therefore visible as long diagonal line. The other basal-plane dislocations are in nearly end-on orientation and correspondingly only short segment projections can be seen.
Additionally, several stacking faults in edge-on orientation are visible as thin diagonal lines perpendicular to the [0,0,1] direction. Some are terminated by the basal-plane dislocations. Hence it is concluded that the latter dislocations are partial dislocations. Due to their orientation with normal vector parallel to [0,0,1], the stacking faults are not observable in TEM specimens prepared with surface normal parallel to [0,0,1] as e.g. in figure 4.16.
Figure 4.17: TEM micrograph close to the 0]1[1 ,, zone axis, i.e. perpendicular to compression direction (inset in upper-right corner). Basal-plane dislocations terminating stacking faults are marked with black arrows. Stacking faults are visible as thin diagonal lines perpendicular to the [0,0,1] direction. Two additional c-axis dislocations are indicated by white arrowheads.
62

4 Plasticity of µ-Al-Mn
Additionally, two c-axis dislocations are visible in figure 4.17 as lines parallel to the [0,0,1] direction and indicated by white arrowheads. The five individual partials in each group can not be resolved because the habit planes of these dislocations do not correspond to the image plane.
Figure 4.18 shows a TEM micrograph close to the ]0,1,1[ zone axis using a two-beam
condition corresponding to )6,3,5(=gr . Several stacking faults in the upper half of the image
and a basal-plane dislocation loop in edge-on orientation, terminating a stacking fault in the centre of the image, can be observed. The inset in the lower-right corner shows the same loop using a different two-beam condition ( )12,0,0(=gr ) in nearly end-on view. It is recognizable
that each dislocation is split into two partial dislocations (black arrows) terminating another stacking fault.
Figure 4.18: TEM micrograph close to the 0]1[1 ,, zone axis using a two-beam condition
with )6,3,5(=gr . Several stacking faults and a dislocation loop in edge-on orientation are visible. The inset in the lower-right corner shows the loop in almost end-on orientation using
. Each segment is split into two partial dislocations (black arrows). )12,0,0(=gr
63

4 Plasticity of µ-Al-Mn
Burgers vector of basal-plane dislocations
In the following, a contrast-extinction analysis of the basal-plane dislocations is given. Figure 4.19 shows a TEM micrograph of a part of a basal-plane dislocation (white arrow) under various imaging conditions (a-d) with a specimen normal close to the [0,0,1] direction. Some c-axis dislocations are also visible and indicated in (a) by black arrows. The applied
two-beam conditions correspond to (a) )0,5,10(=gr , (b) )0,5,5(=gr , (c) )0,10,5(=gr , and (d)
. Depending on the applied two-beam conditions, the contrast of particular loop
segments is extinct. In (b), (c), and (d), the contrast of segments in the lower centre, in the upper-right corner, and in the centre of the micrograph is extinct, respectively.
)0,8,0(=gr
Figure 4.19: TEM micrograph close to the [0,0,1] zone axis. A part of a basal-plane dislocation (white arrow in (a)) and c-axis dislocations (black arrows in (a)) are visible under various imaging conditions (see text).
64
4 Plasticity of µ-Al-Mn
Considering equation (A.3), the contrast extinctions visible in (b-d) reveal that the Burgers vector of basal-plane dislocations is parallel to [0,0,1]. However, only specific segments of the dislocation are extinct in (b-d). Despite the fact that all reciprocal vectors applied in (a-d) fulfil equation (A.3), the loop segments often show a strong blurry residual contrast. This is due to the pure edge character of basal-plane dislocations, i.e. the Burgers vector is perpendicular to the line direction of all occurring loop segments. As described in Appendix A, the contrast of pure edge dislocations can be completely extinct only if condition (A.4) is fulfilled. In this case, additionally to condition (A.3), the reciprocal vector has to be
parallel to the line direction l
gr
r.
Figure 4.19 (b-d) reveals that only dislocation segments with lr
parallel to (cf. insets)
exhibit complete extinction. Hence, basal-plane dislocations are dislocation loops possessing pure edge character, which in the literature are referred to as prismatic loops (Hull and Bacon, 1984).
gr
The Burgers vector of the basal-plane dislocations lies parallel to the normal vector of the habit plane (parallel to [0,0,1]). Correspondingly, it can be concluded that basal-plane dislocations move by means of a pure climb mechanism.
A common technique for the determination of the Burgers-vector length in TEM is convergent-beam electron diffraction (CBED) (see e.g. Tanaka et al., 1988). However, in crystal lattices featuring large lattice parameters the reciprocal space is very dense. Due to this fact the density of Kikuchi lines is too high to unambiguously determine the number of splitting nodes in the strain field of the dislocation (Feuerbacher et al., 2004). Therefore, a determination of the Burgers-vector length by means of CBED was found practically impossible in µ-Al-Mn.
Figure 4.20 shows a lattice-fringe image of a specimen along the ]0,1,1[ zone axis
comprising a stacking fault caused by the motion of an (0,0,1)-basal-plane dislocation. The stacking fault is indicated by black arrows; its normal vector is parallel to [0,0,1]. Red rectangles indicate unit cells of µ-Al-Mn on both sides of the stacking fault. The stacking fault can best be seen under a grazing angle along the black arrows.
65
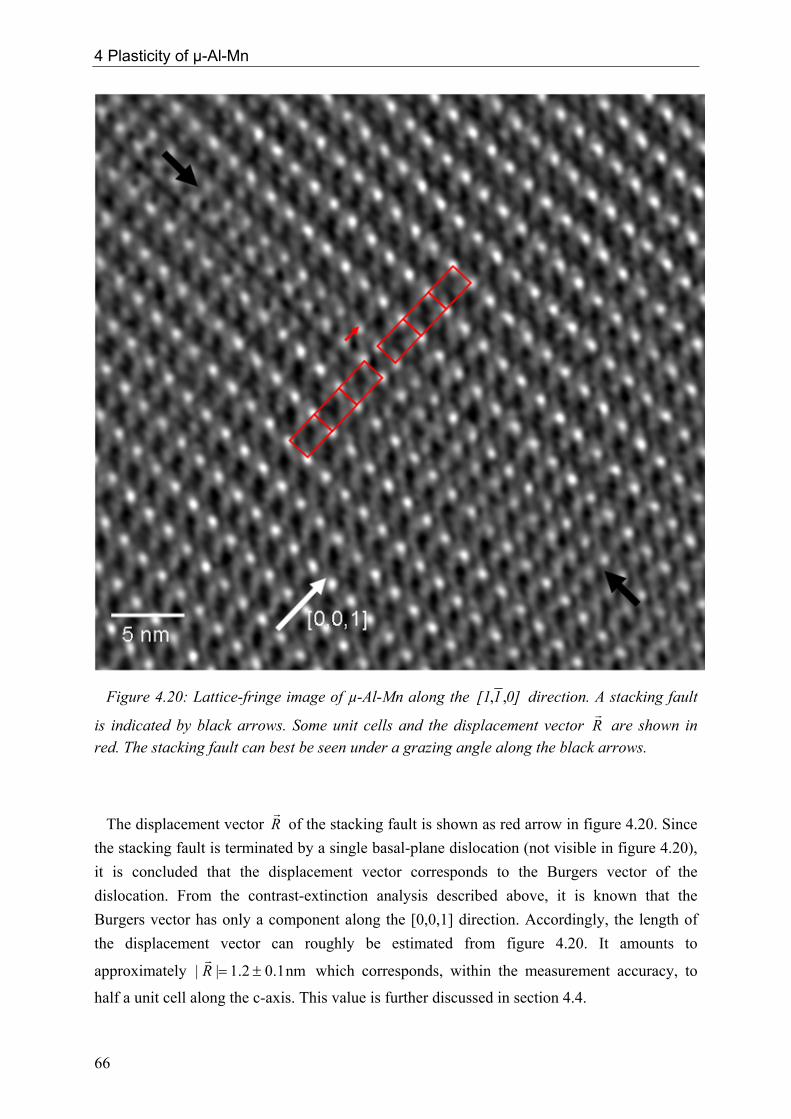
4 Plasticity of µ-Al-Mn
Figure 4.20: Lattice-fringe image of µ-Al-Mn along the 0]1[1 ,, direction. A stacking fault
is indicated by black arrows. Some unit cells and the displacement vector Rr
are shown in red. The stacking fault can best be seen under a grazing angle along the black arrows.
The displacement vector Rr
of the stacking fault is shown as red arrow in figure 4.20. Since the stacking fault is terminated by a single basal-plane dislocation (not visible in figure 4.20), it is concluded that the displacement vector corresponds to the Burgers vector of the dislocation. From the contrast-extinction analysis described above, it is known that the Burgers vector has only a component along the [0,0,1] direction. Accordingly, the length of the displacement vector can roughly be estimated from figure 4.20. It amounts to
approximately which corresponds, within the measurement accuracy, to
half a unit cell along the c-axis. This value is further discussed in section 4.4.
nm1.02.1|| ±=Rr
66

4 Plasticity of µ-Al-Mn
Burgers vector of c-axis dislocations
In figure 4.21 a TEM micrograph taken from a specimen with normal vector close to the
]0,1,1[ zone axis is shown by using two-beam conditions corresponding to (a) and
(b)
)0,8,8(=gr
)12,0,0(=gr . Three basal-plane dislocations and two c-axis dislocations are marked with
white and black arrows, respectively. The segment in the lower-right corner lies in the plane of the specimen and is extinct using imaging condition )0,8,8(=gr (equation (A.4) is
fulfilled). The two segments in the upper-left corner feature other line directions (almost end-on) and show residual contrast, since for these equation (A.3) but not equation (A.4) is fulfilled.
Figure 4.21: TEM micrograph close to the 0]1[1 ,, zone axis with two-beam conditions
corresponding to (a) and )0,8,8(=gr )12,0,0(=gr (b). Segments of basal-plane dislocations and c-axis dislocations are indicated by white and black arrows, respectively. The c-axis dislocations are in contrast using the reciprocal vector )0,8,8(=gr and extinct
using )12,0,0(=gr . In the latter case the applied reciprocal vector is parallel to the dislocation
line, which indicates that the Burgers vector is oriented perpendicular to the line direction (cf. condition (A.4)). Accordingly, the c-axis dislocations are identified as pure edge dislocations. However, a further determination of the Burgers-vector direction by means of extinction experiments turned out to be impossible. Two-beam conditions which fulfil equation (A.3) but not equation (A.4) cause strong residual contrast, which cannot be distinguished from full contrast. Hence, a reliable discrimination of residual and full contrast cannot be made.
A second condition, yielding complete extinction, would be necessary in order to fully determine the orientation of the Burgers vector. Since c-axis dislocations feature only one line
67
4 Plasticity of µ-Al-Mn
direction, only one reciprocal vector gr exists which satisfies equation (A.4) and causes a
complete extinction. The orientation and length of the Burgers vector of c-axis dislocations will be discussed in section 4.4 of this chapter.
Stacking faults created by the motion of basal-plane dislocations are extinct in figure 4.21 (a) and (b), i.e. equation (A.5) is fulfilled for both applied two-beam conditions.
Dislocation density
The dislocation density in µ-Al-Mn is calculated separately for basal-plane and c-axis dislocations. For the latter, the density is determined from TEM specimens cut with surface normal parallel to the [0,0,1] direction. Since the surface normal of the specimen is parallel to the line direction of the dislocations, the thickness of the specimen corresponds to the length of the observed dislocation line. In this case the dislocation density can be calculated from the number of dislocations n in an observed area A (cf. equation A.7):
An /=ρ . (4.1)
In case of basal-plane dislocations the density is determined from specimens prepared with
surface normal parallel to the ]0,1,1[ direction. It can be calculated from the amount of loop
segments in an observed area, taking different orientations of these segments into account. By considering a dislocation distribution in one plane instead of a distribution in space, equation (A.8) can be simplified to (Schöck, 1961):
∫ . (4.2) =
=2/
0
)(π
θ
θθρ dp
For a uniform distribution within the twelve observed directions, the density can be calculated according to
An
2πρ = . (4.3)
The investigated TEM specimens were prepared from a sample deformed at 850 °C and 10-5 s-1 up to a plastic strain of 4.1 %. Reference investigations were carried out on undeformed material which was heat treated and quenched in the same way as the deformed
68
4 Plasticity of µ-Al-Mn
sample. The densities of c-axis dislocations and basal-plane loops were determined according to equations (4.1) and (4.3), respectively, and are given in table (4.1). These densities are mean values of investigations performed in 20 to 30 randomly selected TEM-specimen areas in each case. No basal-plane dislocations were observed in undeformed µ-Al-Mn. Therefore, only an upper limit for the corresponding density is calculated. The densities of the dislocation types differ by about one order of magnitude, and both increase during deformation by two orders of magnitude.
ρ (undeformed sample) ρ (deformed sample)
basal-plane dislocations 25102 −⋅< cm 27105.1 −⋅ cm
c-axis dislocations 26101 −⋅ cm 27105.9 −⋅ cm
Table 4.1: Dislocation densities ρ of undeformed and deformed (850 °C, 4.1 %) µ-Al-Mn. Densities are given separately for basal-plane and c-axis dislocations.
4.4 Discussion Macroscopic deformation behaviour Stress-strain behaviour
Uniaxial compression experiments at constant strain rate of 10-5 s-1 were successfully performed in the temperature range of 750 to 850 °C. This corresponds to the homologous temperature range TH = 0.85 to 0.94.
During deformation at 700 °C sample fracture occurred shortly after the upper yield point. Therefore it is concluded that, at the applied strain rate, the brittle-to-ductile transition in this phase lies close to 700 °C. The observed transition temperature of TH = 0.82 is relatively high compared to other single-crystalline CMA phases (see chapter 7). High brittle-to-ductile transition temperatures indicate that considerable amounts of thermal energy are necessary for the activation of a deformation mechanism. This is in accordance with the results of the thermodynamic activation analysis (see discussion below), where high values of the activation enthalpy ΔH for dislocation motion were found.
The most prominent features of the macroscopic stress-strain behaviour of µ-Al-Mn, shown in figure 4.4, are the strong yield-point effect and the following steady-state flow-stress
69

4 Plasticity of µ-Al-Mn
regime. Taking values of up to 50 % of the upper yield stress, the yield drop is much larger than in other CMAs. In Al13Co4, for example, a maximum yield drop of about 28 % was found (Heggen et al., 2007), while in ß-Al-Mg and Mg32(Al,Zn)49 this value amounts to 20 % and 15 %, respectively (cf. chapter 6 and 5). Almost no yield-point effect (less than 3 %) was observed in ξ’-Al-Pd-Mn (Feuerbacher et al., 2001).
In the following, the yield-point effect is discussed in connection with the evolution of the dislocation density. In the microstructural investigation two sets of dislocations were identified as carriers of plastic deformation. Comparison of dislocation densities of deformed and undeformed samples confirms that the deformation mechanism in µ-Al-Mn is based on dislocation motion. In the deformed material (εtotal = 4.4 %) dislocation densities are about two orders of magnitude larger than in the undeformed reference sample for both dislocation types.
A model elaborated by Johnston and Gilman (1959) describes the correlation between flow stress and dislocation density in the course of plastic deformation. According to this model, the rate of dislocation multiplication shows a distinct dependence on the stress, and enhanced dislocation multiplication can occur by crossing a stress threshold. The appearance of a yield-point effect at the onset of plastic deformation can then be referred to an intense increase of the number of mobile dislocations which contribute to the deformation process. Accordingly it is assumed that the yield-point effects observed in the stress-strain curves of µ-Al-Mn are caused by a distinct dislocation multiplication at the onset of plastic deformation. The large magnitude of these yield-point effects implies that the stress dependence of the dislocation-multiplication rate in µ-Al-Mn is high.
Furthermore, it was observed that the yield drop of the stress-strain curve at 750 °C was reduced from 50 to about 20 % of the upper yield stress after pre-deformation at higher temperature (figure 4.5). The introduction of a large number of mobile dislocations into the material during the pre-deformation might has caused the reduced yield-point effect in the following deformation. This interpretation is in accordance with Johnston (1962), reporting that the strength of the yield-point effect strongly depends on the initial number of mobile dislocations in a given material.
The presence of yield-point effects after incremental tests is often associated with dislocation recovery, i.e. the decrease of the mobile dislocation density during unloading (Hull and Bacon, 1984). Therefore, the observed absence of yield-point effects in the stress-strain curves after incremental tests indicates that recovery takes place at low rates in this material. This conclusion is also corroborated by the comparison of the deformation experiments on pre-deformed and previously undeformed material: The dislocations, created during pre-deformation do not recover in the course of the repeated deformation, but are stored in the material and lead to a smaller yield-point effect.
70

4 Plasticity of µ-Al-Mn
Thermodynamic activation parameters
The activation volume of µ-Al-Mn (Fig. 4.9) was calculated premising climb as primary mode of dislocation motion. No Schmid factor is defined for this kind of dislocation motion. According to considerations in the literature (e.g. Nandy and Banerjee, 2000, Mitra et al., 2004, Malaplate et al., 2005) a value of ms = 1 was applied for calculations, since the climbing dislocations resolve the full applied stress.
The activation volume V scaled by the atomic volume Va (i.e. the average volume per atom), amounts to V/Va = 20 at a moderate stress of 300 MPa. This value is significantly larger than unity but of the same order of magnitude as the number of atoms in present clusters, i.e. fragments of Mackay clusters, icosahedra, and pentagonal prisms. These clusters may act as obstacles for dislocation motion and can therefore cause the large activation volumes observed. Analogously, the rate controlling process of dislocation motion can be provided by the interaction of dislocations with these clusters. In ξ’-Al-Pd-Mn, for example, Feuerbacher et al. (2001) have demonstrated that the intrinsic cluster substructure, which is based on Mackay-type clusters, determines the plastic deformation behaviour. The interaction of metadislocations with the Mackay clusters was found to be the rate-controlling mechanism in that material.
The activation enthalpy ΔH (figure 4.11) is considerably larger than the work term ΔW. Hence, it is concluded that deformation is a thermally activated process. In the investigated temperature range an activation enthalpy from about 5 to 9 eV is obtained. However, an activation enthalpy of 9 eV exceeds physically reasonable values, since processes involving such high values would run at very low rates and would not be observable on usual laboratory time scales. It is assumed that the thermodynamic analysis provides unreliable values in this case. The activation enthalpy at these high values is disregarded in following considerations.
It is demonstrated in the microstructural analysis of the present study that dislocation climb is the primary mechanism of plastic deformation in µ-Al-Mn. The stress exponent of µ-Al-Mn, determined to approximately m = 5.5, is in good agreement with the observed dislocation climb mechanism. In the literature it is a widely held belief that “five-power-law creep”, i.e. creep deformation with m = 5, is associated with dislocation climb (Kassner and Pérez-Prado, 2000).
However, it is generally assumed that the activation enthalpy for dislocation climb ΔH closely corresponds to that of lattice self-diffusion (Kassner and Pérez-Prado, 2000), since diffusion is typically the rate-controlling factor for this mechanism. No values of the diffusion enthalpy for µ-Al-Mn are reported in the literature. The value for self-diffusion in pure Al amounts to 1.28 eV (Messer et al., 1974) and the diffusion enthalpy for Mn in Al range between 2.2 and 2.4 eV (Beke et al., 1987). Assuming that the diffusion enthalpy for µ-Al-Mn compares to these values, the measurements of the activation enthalpy, amounting to more than 5 eV, reveal a significant difference to the diffusion enthalpy.
71
4 Plasticity of µ-Al-Mn
This discrepancy indicates that another mechanism besides diffusion dominates the process of dislocation motion in this phase. This finding is in good accordance with the results of the activation volume. It was suggested in the discussion above, that atom clusters act as obstacles against dislocation motion and that the thermally activated overcoming of these obstacles provides the rate-controlling mechanism for dislocation motion. This interaction between the dislocations and the cluster substructure can determine the magnitude of the activation enthalpy. Lattice diffusion, on the other hand, is energetically a subordinated process and is not the rate-controlling factor for dislocation motion in the investigated temperature range.
By extrapolation of the activation enthalpy to lower temperatures in figure 4.11, a value of ΔH = 0 is reached at about 900 K. However, according to Gibbs (1969) the activation enthalpy should be proportional to temperature if the deformation is controlled by a single thermally-activated process. A comparable deviation from the proportional temperature dependence of the activation enthalpy is also found in Mg32(Al,Zn)49 (chapter 5) and is reported in Al-Pd-Mn quasicrystals by Messerschmidt et al. (2000). The authors interpret this phenomenon by a continuous transition between two deformation-controlling processes at different temperatures in that material. At low temperatures a dislocation-cluster friction controls the deformation process while a diffusion-based recovery process becomes dominating at high temperatures in icosahedral Al-Pd-Mn.
The observed deviation of the activation enthalpy from proportional temperature dependence in µ-Al-Mn and Mg32(Al,Zn)49 can be also explained by a change of the rate-controlling process at different temperatures, i.e. dislocation-cluster friction and lattice diffusion. As estimated above, a reasonable value for the diffusion enthalpy in µ-Al-Mn is of the order of 2 eV. Extrapolation of the activation enthalpy reveals this energy level at temperatures close to 700 °C. The brittle-to-ductile transition which is also located close to this temperature might be interpreted as follows.
For the observed dislocation climb mechanisms, diffusion processes at adequate rates are necessary. At higher temperatures, however, lattice diffusion is only a subordinated factor as indicated by the high values of activation volume and enthalpy, and dislocation-cluster friction is rate-controlling. At lower temperatures where the (extrapolated) activation enthalpy approximates the assumed diffusion enthalpy, diffusion becomes a more relevant factor. The brittle-to-ductile transition may be attributed to a limitation of diffusion processes which can cause a suppression of the dislocation climb mechanisms in the vicinity of 700 °C. Analogous considerations are discussed for Mg32(Al,Zn)49 in chapter 5.4.
72
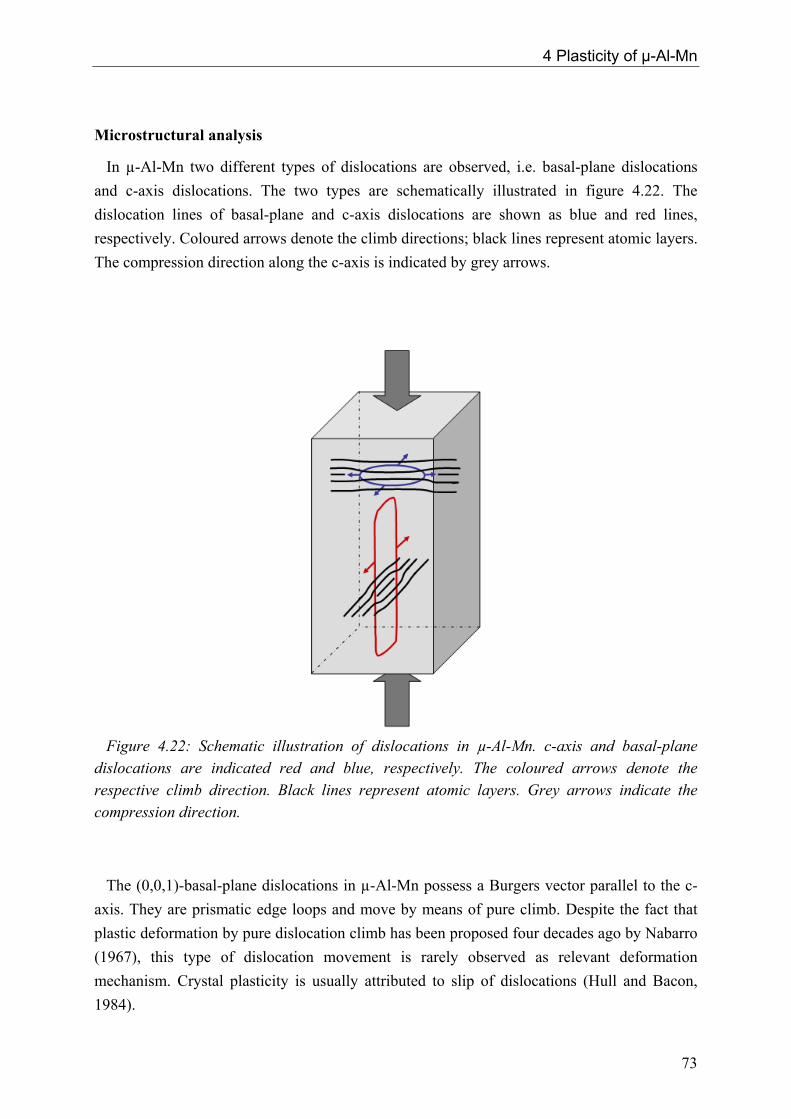
4 Plasticity of µ-Al-Mn
Microstructural analysis
In µ-Al-Mn two different types of dislocations are observed, i.e. basal-plane dislocations and c-axis dislocations. The two types are schematically illustrated in figure 4.22. The dislocation lines of basal-plane and c-axis dislocations are shown as blue and red lines, respectively. Coloured arrows denote the climb directions; black lines represent atomic layers. The compression direction along the c-axis is indicated by grey arrows.
Figure 4.22: Schematic illustration of dislocations in µ-Al-Mn. c-axis and basal-plane dislocations are indicated red and blue, respectively. The coloured arrows denote the respective climb direction. Black lines represent atomic layers. Grey arrows indicate the compression direction. The (0,0,1)-basal-plane dislocations in µ-Al-Mn possess a Burgers vector parallel to the c-axis. They are prismatic edge loops and move by means of pure climb. Despite the fact that plastic deformation by pure dislocation climb has been proposed four decades ago by Nabarro (1967), this type of dislocation movement is rarely observed as relevant deformation mechanism. Crystal plasticity is usually attributed to slip of dislocations (Hull and Bacon, 1984).
73
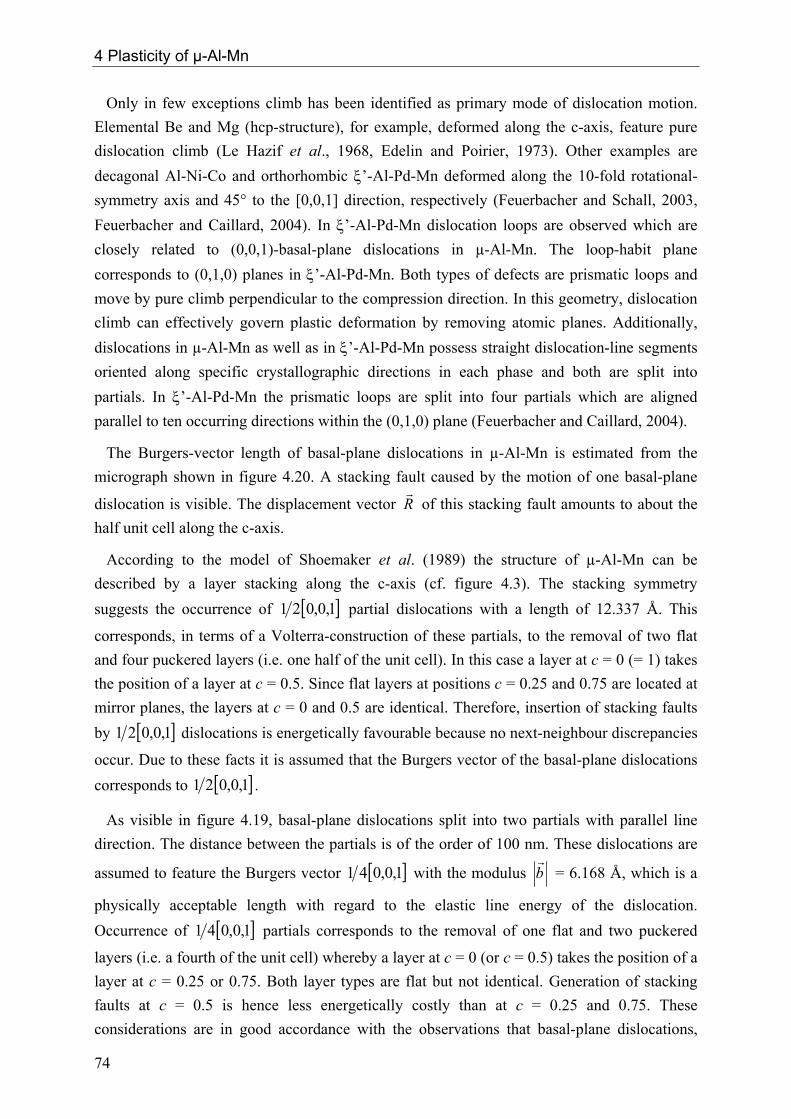
4 Plasticity of µ-Al-Mn
Only in few exceptions climb has been identified as primary mode of dislocation motion. Elemental Be and Mg (hcp-structure), for example, deformed along the c-axis, feature pure dislocation climb (Le Hazif et al., 1968, Edelin and Poirier, 1973). Other examples are decagonal Al-Ni-Co and orthorhombic ξ’-Al-Pd-Mn deformed along the 10-fold rotational-symmetry axis and 45° to the [0,0,1] direction, respectively (Feuerbacher and Schall, 2003, Feuerbacher and Caillard, 2004). In ξ’-Al-Pd-Mn dislocation loops are observed which are closely related to (0,0,1)-basal-plane dislocations in µ-Al-Mn. The loop-habit plane corresponds to (0,1,0) planes in ξ’-Al-Pd-Mn. Both types of defects are prismatic loops and move by pure climb perpendicular to the compression direction. In this geometry, dislocation climb can effectively govern plastic deformation by removing atomic planes. Additionally, dislocations in µ-Al-Mn as well as in ξ’-Al-Pd-Mn possess straight dislocation-line segments oriented along specific crystallographic directions in each phase and both are split into partials. In ξ’-Al-Pd-Mn the prismatic loops are split into four partials which are aligned parallel to ten occurring directions within the (0,1,0) plane (Feuerbacher and Caillard, 2004).
The Burgers-vector length of basal-plane dislocations in µ-Al-Mn is estimated from the micrograph shown in figure 4.20. A stacking fault caused by the motion of one basal-plane
dislocation is visible. The displacement vector Rr
of this stacking fault amounts to about the half unit cell along the c-axis.
According to the model of Shoemaker et al. (1989) the structure of µ-Al-Mn can be described by a layer stacking along the c-axis (cf. figure 4.3). The stacking symmetry suggests the occurrence of [ ]1,0,021 partial dislocations with a length of 12.337 Å. This
corresponds, in terms of a Volterra-construction of these partials, to the removal of two flat and four puckered layers (i.e. one half of the unit cell). In this case a layer at c = 0 (= 1) takes the position of a layer at c = 0.5. Since flat layers at positions c = 0.25 and 0.75 are located at mirror planes, the layers at c = 0 and 0.5 are identical. Therefore, insertion of stacking faults by [ ]1,0,021 dislocations is energetically favourable because no next-neighbour discrepancies
occur. Due to these facts it is assumed that the Burgers vector of the basal-plane dislocations corresponds to [ ]1,0,021 .
As visible in figure 4.19, basal-plane dislocations split into two partials with parallel line direction. The distance between the partials is of the order of 100 nm. These dislocations are
assumed to feature the Burgers vector [ ]1,0,041 with the modulus br
= 6.168 Å, which is a
physically acceptable length with regard to the elastic line energy of the dislocation. Occurrence of [ ]1,0,041 partials corresponds to the removal of one flat and two puckered
layers (i.e. a fourth of the unit cell) whereby a layer at c = 0 (or c = 0.5) takes the position of a layer at c = 0.25 or 0.75. Both layer types are flat but not identical. Generation of stacking faults at c = 0.5 is hence less energetically costly than at c = 0.25 and 0.75. These considerations are in good accordance with the observations that basal-plane dislocations,
74

4 Plasticity of µ-Al-Mn
which can be regarded as [ ]1,0,021 partials, insert expanded stacking faults into the material
and show a narrow splitting into [ ]1,0,041 partials.
The second type of dislocations in µ-Al-Mn, the c-axis dislocations, possesses pure edge character, as well. From contrast-extinction experiments it was found that its Burgers vector
br
lies within the (0,0,1) plane. However, a further determination of the orientation by means of contrast-extinction experiments is not possible. Rather it is argued that c-axis dislocations also move by means of a pure climb mechanism:
The five individual partials in each group are arranged in habit planes perpendicular to the compression direction. In this geometry a dislocation slip mechanism would involve a Schmid factor of ms = 0 which results in a zero shear stress. Additionally, this kind of dislocation motion can not contribute to deformation of the sample. On the other hand, a dislocation which moves by a climb mechanism perpendicular to the compression direction and with a Burgers vector within the (0,0,1) plane contributes to the deformation process. It introduces atomic planes with normal vector perpendicular to the compression direction into the material and hence causes a broadening of the sample.
However, the applied deformation geometry does not induce a resulting driving force for this type of dislocation motion. The driving force can be explained by means of a chemical stress, generated by a concentration gradient of vacancies (Le Hazif et al., 1968). The concentration gradient is caused by the climb mechanism of basal-plane dislocations. A chemical stress also occurs in Mg32(Al,Zn)49 and is further discussed in the comprehensive discussion (chapter 7.2).
Climb of basal-plane dislocations corresponds to positive climb (cf. chapter 3) and contributes to the deformation of the sample by removing atomic (0,0,1) planes. Either absorption of vacancies or generation of interstitial atoms takes place during this process. Climb of c-axis dislocations in µ-Al-Mn, on the other hand, corresponds to negative climb and hence acts as source and sink for vacancies and interstitials, respectively. Similar deformation mechanisms were observed in elemental Be and decagonal Al-Ni-Co (Le Hazif et al., 1968, Feuerbacher and Schall, 2003). In both materials deformation is primarily based on a climb mechanism which removes atomic planes with normal vector parallel to the deformation direction. A second climb mechanism acts as source for vacancies and is driven by a chemical stress due to a concentration gradient of the vacancies.
The geometry of the climb mechanisms observed in µ-Al-Mn (cf. figure 4.22) is in accordance with surface features observed during and after deformation experiments as shown in figure 4.6 and 4.7, respectively. The appearance of lines and steps or cracks, parallel and perpendicular to the deformation direction can be interpreted as surface effects resulting from the discussed dislocation-climb mechanisms.
75
4 Plasticity of µ-Al-Mn
The Burgers-vector length of c-axis dislocations in µ-Al-Mn is estimated by the following consideration. Complete c-axis dislocations do not terminate stacking faults (see e.g. figure 4.13). Hence it is concluded that the sum of the involved Burgers vectors corresponds to the lattice periodicity. The lengths of the single Burgers vectors are not necessarily equal, but since c-axis dislocations split into five partials, on average the single Burgers vectors correspond to a fifth of the lattice periodicity.
The long diagonal axis of the hexagonal unit cell, which corresponds to >< 0,1,1
directions, amounts to 34.6 Å. Hence, in case of c-axis dislocations featuring habit planes which lie along the long diagonal axis, the average Burgers-vector modulus amounts to approximately 7 Å. The short diagonal axis of the unit-cell rhomb >< 0,0,1( directions), on
the other hand, amounts to 19.98 Å. The average Burgers-vector length of the five partial dislocations featuring habit planes in this direction correspondingly amounts to about 4 Å.
Both lengths are physically acceptable values with regard to the elastic line energy of the dislocation. Furthermore, it is physically reasonable that the c-axis dislocations featuring shorter Burgers vectors, i.e. dislocations with habit planes which lie along the short diagonal axis of the unit cell, are observed four times more frequently than the c-axis dislocations featuring the longer Burgers vectors.
The two observed climb mechanisms in µ-Al-Mn, i.e. climb of basal-plane and c-axis dislocations, can effectively interact via diffusion by exchanging vacancies or interstitial atoms. In this case only diffusion distances between the involved dislocation sets have to be passed rather than the distances between dislocations and sample surface.
In the following, a rough estimation of possible diffusion distances in µ-Al-Mn during deformation is given. The diffusion range x of vacancies or interstitial atoms can be calculated
according to the Einstein-Smoluchowski equation Dtx 6= (e.g. Gottstein, 1998), where D is the diffusion coefficient and t is the diffusion time. Since no values for diffusion rates of µ-Al-Mn are given in the literature, the diffusion coefficient of Al self-diffusion at 1000 K, i.e.
(Stöcker, 1994), is adopted. 126106 −−⋅≈ smmD
Consider plastic deformation of a sample by an amount of strain corresponding to half a c-lattice parameter. This strain corresponds to the length change caused by climb of one basal-plane dislocation. Taking into account a strain rate of 10-5 s-1 (which is applied in the performed deformation experiments), the deformation time for the assumed strain is about 0.08 s. By assuming this time as effective diffusion time t, an average diffusion distance of about 10-3 mm results.
This value is of the same order of magnitude as the average distance between the two interacting sets of dislocations (according to the experimental dislocation-density values). On the other hand, the estimated diffusion range is about three orders of magnitude smaller than the average distance between the dislocation and the closest sample surface. This can be taken
76

4 Plasticity of µ-Al-Mn
as indication for the necessity of interaction of basal-plane and c-axis dislocations via diffusion, in order to provide an effective deformation mechanism based on dislocation climb in µ-Al-Mn.
77

4 Plasticity of µ-Al-Mn
78

Chapter 5 Plasticity of Mg32(Al,Zn)49
In this chapter the structure of the Bergman phase (Mg32(Al,Zn)49) is introduced and deformation experiments performed on this phase are described. Uniaxial compression tests along the [0,0,1] direction were carried out at constant strain rate. The results are presented and thermodynamic activation parameters of the deformation process are evaluated and discussed. A microstructural analysis of the deformed material was performed by means of TEM and the underlying microstructural deformation mechanisms are determined. Three different types of dislocations are found to be the carriers of plasticity. Pure climb and mixtures of climb and slip processes are identified as primary deformation mechanisms.
5.1 The structure of Mg32(Al,Zn)49
“The most complex metal structure known is that of Mg32(Zn,Al)49.”, Pauling (1955). Mg32(Al,Zn)49 was first structurally investigated by Laves et al. (1935) who found that this phase features a body-centred cubic structure with lattice parameter of 14.16 Å. Since the structure was solved by Bergman et al. (1952) this phase and its main structure element are frequently referred to as Bergman phase1 and Bergman cluster, respectively. A revised structure model was developed by Sun et al. (2000) which differs from that of Bergman et al. (1952) essentially in the occupation of one atomic site. Since the structure model of Bergman et al. (1952) is widely established in the literature, this model is applied in the present work, as well.
The unit cell of the Bergman phase involves 162 atoms located at 8 different atomic sites. Figure 5.1 illustrates the unit cell of Mg32(Al,Zn)49 according to the model of
1 The notation T-AlMgZn is common in the literature, as well.
79
5 Plasticity of Mg32(Al,Zn)49
Bergman et al. (1952). A high amount of chemical disorder is present in this phase. Due to the similar atomic radii of Al and Zn several atomic positions can be occupied by both, Al or Zn atoms (cf. chapter 2.3). These sites are shown in blue in figure 5.1. Sites which are exclusively occupied by Al and Mg atoms are shown in green and red, respectively. The two-fold rotation symmetry of this phase along >< 1,0,0 directions
(space group 3Im ) is visible in figure 5.1.
Figure 5.1: Unit cell of Mg32(Al,Zn)49 according to the model of Bergman et al. (1952). Main structure elements of the phase Mg32(Al,Zn)49 are Bergman clusters consisting of 117 atoms1. These complexes completely occupy the unit cell by means of a bcc arrangement. Bergman clusters are built up by successive atom-shells as illustrated in figure 5.2. One Al site in the centre (figure 5.2 (a)) is surrounded by twelve atoms located at the vertices of an icosahedron (figure 5.2 (b)). According to Bergman et al. (1957), the occupancy of these sites is about 80 % Zn and 20 % Al. The subsequent shell consists of 20 Mg atoms (red) located above the centres of the triangular faces of the icosahedron, forming a pentagonal dodecahedron.
1 In the literature these clusters are frequently characterized without the outermost shell of 12 Mg atoms and therefore considered as 105-atom Bergman clusters.
80
5 Plasticity of Mg32(Al,Zn)49
Figure 5.2: Successive atom-shell structure of the Bergman cluster (a-e) at the body-centred position of the Mg32(Al,Zn)49 unit cell (grey cubic frame). (f) Bergman clusters at centre and one corner position of the unit cell.
81
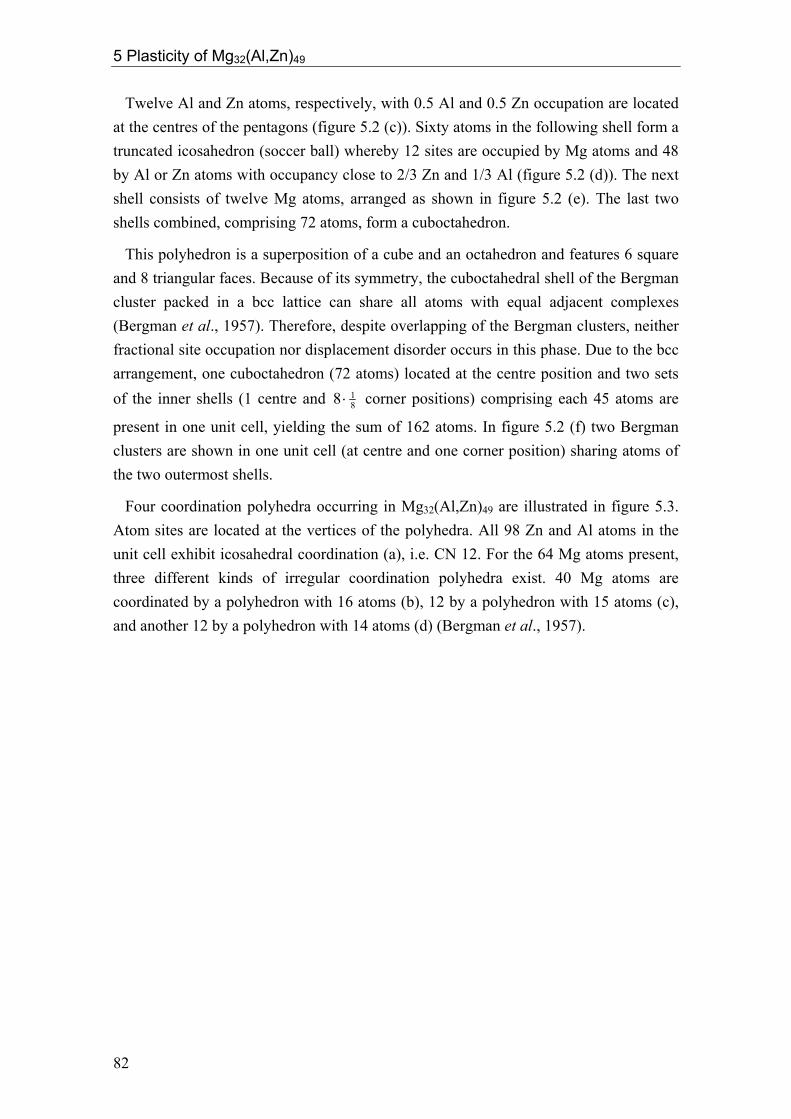
5 Plasticity of Mg32(Al,Zn)49
Twelve Al and Zn atoms, respectively, with 0.5 Al and 0.5 Zn occupation are located at the centres of the pentagons (figure 5.2 (c)). Sixty atoms in the following shell form a truncated icosahedron (soccer ball) whereby 12 sites are occupied by Mg atoms and 48 by Al or Zn atoms with occupancy close to 2/3 Zn and 1/3 Al (figure 5.2 (d)). The next shell consists of twelve Mg atoms, arranged as shown in figure 5.2 (e). The last two shells combined, comprising 72 atoms, form a cuboctahedron.
This polyhedron is a superposition of a cube and an octahedron and features 6 square and 8 triangular faces. Because of its symmetry, the cuboctahedral shell of the Bergman cluster packed in a bcc lattice can share all atoms with equal adjacent complexes (Bergman et al., 1957). Therefore, despite overlapping of the Bergman clusters, neither fractional site occupation nor displacement disorder occurs in this phase. Due to the bcc arrangement, one cuboctahedron (72 atoms) located at the centre position and two sets of the inner shells (1 centre and 8
18 ⋅ corner positions) comprising each 45 atoms are
present in one unit cell, yielding the sum of 162 atoms. In figure 5.2 (f) two Bergman clusters are shown in one unit cell (at centre and one corner position) sharing atoms of the two outermost shells.
Four coordination polyhedra occurring in Mg32(Al,Zn)49 are illustrated in figure 5.3. Atom sites are located at the vertices of the polyhedra. All 98 Zn and Al atoms in the unit cell exhibit icosahedral coordination (a), i.e. CN 12. For the 64 Mg atoms present, three different kinds of irregular coordination polyhedra exist. 40 Mg atoms are coordinated by a polyhedron with 16 atoms (b), 12 by a polyhedron with 15 atoms (c), and another 12 by a polyhedron with 14 atoms (d) (Bergman et al., 1957).
82
5 Plasticity of Mg32(Al,Zn)49
Figure 5.3: Coordination polyhedra in the Bergman phase: Icosahedral coordination polyhedron (a) of Al and Zn atoms (CN 12) and irregular coordination polyhedra of Mg atoms with CN 16 (b), CN 15 (c), and CN 14 (d). 5.2 Macroscopic deformation behaviour Experimental details
A crystal of the Mg32(Al,Zn)49 phase was grown by means of the Bridgman technique as discussed in chapter 2.2. Single-crystalline material of about 2.5 cm3 in size was obtained. The material was characterized as described in chapter 2.3. Neither secondary phases nor grain boundaries were observed. The absolute melting temperature of the material, determined by means of differential thermal analysis (DTA), amounts to Tm = 761.5 K (Balanetskyy, 2005).
Orientation of Mg32(Al,Zn)49 by Laue X-ray diffraction was not possible due to a lack of sufficient contrast. Therefore the single crystal was oriented by means of TEM. A TEM specimen was cut from the crystal and the orientation was determined using
83
5 Plasticity of Mg32(Al,Zn)49
electron diffraction. Subsequently, the bulk material was oriented with respect to the orientation of the TEM specimen. Rectangular samples for deformation experiments of about 1.6 x 1.6 x 4.5 mm3 in size were cut from the crystal by means of spark erosion. The long axis of the samples, i.e. the compression direction, as well as the normal vectors of the side faces correspond to <1,0,0> directions.
This deformation geometry was chosen in order to achieve a large Schmid factor for dislocation-slip systems with <1,1,1> slip directions on 1,1,0 planes. These are the most frequently occurring slip systems in structurally simple phases featuring bcc-lattices (e.g. Hull and Bacon, 1984). In the following, the compression direction is fixed as [0,0,1] direction. All surfaces were carefully ground and polished in order to prevent crack formation due to surface roughness. Care was taken to obtain flat and plan-parallel end faces in order to prevent inhomogeneous stress fields in the sample.
Uniaxial compression tests were carried out in a modified Zwick Z050 testing system under closed-loop control. The setup of this deformation machine is described in chapter 3.3. The deformation experiments were performed in air at temperatures between 320 and 400 °C and at a constant strain rate of 10-4 s-1. Additional incremental tests, i.e. stress-relaxation tests and temperature changes, were performed as described in chapter 3.2. After deformation, the samples were rapidly unloaded and quenched on a cold metal plate in order to preserve the microstructural state.
Results
The stress-strain behaviour of Mg32(Al,Zn)49 between 320 and 400 °C is shown in figure 5.4. During deformation at 320 °C sample fracture occurred at about 620 MPa. Vertical dips in the stress-strain curves are due to incremental tests. A stress-relaxation experiment and a deformation section with a temperature increased by 10 °C are exemplarily labelled “R” and “TC”, respectively, in the stress-strain curve at 340 °C. Dashed lines in figure 5.4 indicate interpolated courses of the stress-strain curves. The deformation experiments were aborted at total strains of about 6 %.
All curves in figure 5.4 show a pronounced yield-point effect, i.e. a strong overshoot of the stress at the onset of plastic deformation, leading to a large difference between upper and lower yield stresses. After the initial yield-point effect, reloading of the sample at the incremental tests does not induce additional overshoots. Only in the curves of 340 and 360 °C minor stress overshoots with respect to the interpolated courses are located after the second temperature change (arrows). A slight work-hardening regime is observed in the stress-strain curves after the initial yielding behaviour up to a strain of approximately 4 %, followed by a constant flow stress. Neither work hardening nor work softening takes place at higher strains (4 to 6 %).
84

5 Plasticity of Mg32(Al,Zn)49
Figure 5.4: Stress-strain curves of Mg32(Al,Zn)49 at temperatures between 320 and 400 °C at a strain rate of 10-4 s-1. A stress relaxation test and a temperature change are exemplary labelled “R” and “TC”. Interpolated courses of the stress-strain curves are shown as dashed lines. Arrows indicate small stress overshoots. The stress-strain curve at 400 °C shows a slight deviation from those at other temperatures. After the second temperature change (back to 400 °C) plastic deformation sets in at about 200 MPa which is approximately 50 MPa lower than the stress which was present before the first temperature change was initiated. During further deformation, however, work hardening takes place and the flow stress smoothly approaches the interpolated course at about ε = 4.5 %.
The dimensions of samples deformed at 380 and 400 °C were measured along the [0,1,0] and [1,0,0] directions before and after deformation experiments by means of a micrometre gauge (accuracy: ± 1 µm). In case of the deformation at 380 °C sample broadening during the deformation process of 40 and 70 µm was observed along [0,1,0] and [1,0,0], respectively. During the deformation test at 400 °C broadening of 50 and 80 µm was observed along [0,1,0] and [1,0,0], respectively. Both samples exhibit an increase of their dimensions parallel to the side faces. However, in each sample the increase in size was unequal along the two directions. Along the [0,0,1] direction, the increase is larger by approximately 40 % than along the [0,1,0] direction in both
85

5 Plasticity of Mg32(Al,Zn)49
samples. Precise measurement of samples deformed at lower temperatures was not possible due to cracks and inhomogeneous side surfaces.
Figure 5.5 shows the stress at the upper (squares) and lower (circles) yield point as a function of temperature. The stresses at these points, as well as the difference between these stresses, i.e. the yield drop, decrease continuously with increasing temperature. The dashed lines in figure 5.5 are guides to the eye.
Figure 5.5: Stress at the upper yield point (squares) and lower yield point (circles) of Mg32(Al,Zn)49 as function of temperature. Dashed lines are guides to the eye. The experimental activation volume V determined according to equation (3.20) is shown in figure 5.6 as function of stress. A Schmid factor of ms = 0.75 was implied in this calculation which is the mean value of the Schmid factor for dislocation climb and the maximum Schmid factor for dislocation slip (see discussion in section 5.4). Activation volumes between 0.3 and 0.6 nm3 occur in a stress range between about 200 and 500 MPa. A hyperbolic stress dependence of the activation volume is not identifiable from the experiments due to insufficient data points. However, as expected from the theory (cf. equation 3.15), the activation volume is analyzed presuming hyperbolic stress dependence. The activation volume follows the function σ/136=V represented by the dashed curve.
86

5 Plasticity of Mg32(Al,Zn)49
Figure 5.6: Activation volume V of Mg32(Al,Zn)49, evaluated from stress-relaxation experiments, as a function of stress σ. The dashed curve is a fit which follows the hyperbolic function σ/136=V .
The activation enthalpy ΔH, calculated according to equation (3.19), is shown in figure 5.7 (squares). The values range between 1.9 and 2.6 eV as function of temperature. The dashed line shows a linear fit. The work term, calculated according to equation (3.14), is shown as circles. The work term is constant in the observed temperature range and amounts to about 0.85 eV, i.e. the activation enthalpy is 2 to 3 times larger than the work term.
87

5 Plasticity of Mg32(Al,Zn)49
Figure 5.7: Activation enthalpy ΔH (squares) and work term ΔW (circles) of Mg32(Al,Zn)49 as a function of temperature. The dashed and solid lines are linear fits of the activation enthalpy and the work term, respectively.
5.3 Microstructural analysis Experimental details
Microstructural investigations on the Bergman phase were carried out by means of a JEOL 4000FX transmission electron microscope operated at 400 kV. Fundamentals of the microstructural analysis are described in Appendix A.
The sample material is cut into slices of about 0.7 mm thickness by means of a high-precision wire saw. Samples are prepared with a surface normal parallel to [0,0,1] and
directions, i.e. parallel and perpendicular to the compression direction,
respectively. Further preparation of samples is performed by standard procedures including subsequent grinding, dimpling, polishing and argon-ion milling as described in chapter 4.3.
]0,1,0[
In Mg32(Al,Zn)49, however, the argon-ion-milling process causes beam damage. Strong sample contamination by argon ions with characteristic, almost round contrast
88

5 Plasticity of Mg32(Al,Zn)49
appearance were found in TEM, preferentially located at dislocations and stacking faults. This beam damage considerably impedes the analysis of dislocations and stacking faults. Therefore, further thinning is performed by chemical etching. For chemical TEM-sample preparation an etchant with composition O66N17S17 (Vol. %) was used including the constituents O: orthophosphoric acid (H3PO4) 84%, N: nitric acid (HNO3, not smoking), and S: sulphuric acid (H2SO4) 68%. Powder samples, crushed by means of a mortar, were investigated, as well.
Results
Dislocation motion and stacking-fault orientation
Figure 5.8 shows a bright-field Bragg-contrast TEM image of a specimen prepared from a deformed sample (T = 340 °C, εplast = 0.25 %, ). The plane normal lies close to the [0,0,1] zone axis (compression direction). A two-beam condition corresponding to the reciprocal vector
1410 −−= sε&
)0,0,6(=gr (upper-left inset) was applied. In this
micrograph, as well as in following Bragg-contrast TEM images, projections of the coordinate axes onto the image plane are shown. The surface normal of the TEM specimen in figure 5.8 is parallel to the [0,0,1] direction. The inset on the right-hand side illustrates the viewing direction with respect to the compression direction.
Preferential orientation of the dislocation-line direction parallel to [0,1,0] is observed in Mg32(Al,Zn)49. One dislocation featuring this line direction is indicated by a white arrow in figure 5.8. The dislocation lies within the image plane and correspondingly, a long vertical line segment can be observed. Three stacking faults are visible, which are indicated by black arrows. The stacking fault in the centre has a normal vector perpendicular to the compression direction and is hence visible in edge-on orientation; it appears as sharp vertical line. The outer stacking faults are inclined by 45° with respect to the [0,0,1] direction and appear broad and blurry.
Additionally, several almost round features are visible (white arrowheads), which are preferentially located at the dislocations and the stacking faults. These are due to beam damage during TEM specimen preparation by means of argon-ion milling (see section “Experimental details”).
Dislocations with line directions along [1,0,0] are found as well, but possess a density lower by about a factor of 100 than that of dislocations with [0,1,0] line direction. The contribution of dislocations with [1,0,0] line direction to deformation processes in Mg32(Al,Zn)49 is hence assumed to be negligible (see discussion).
89
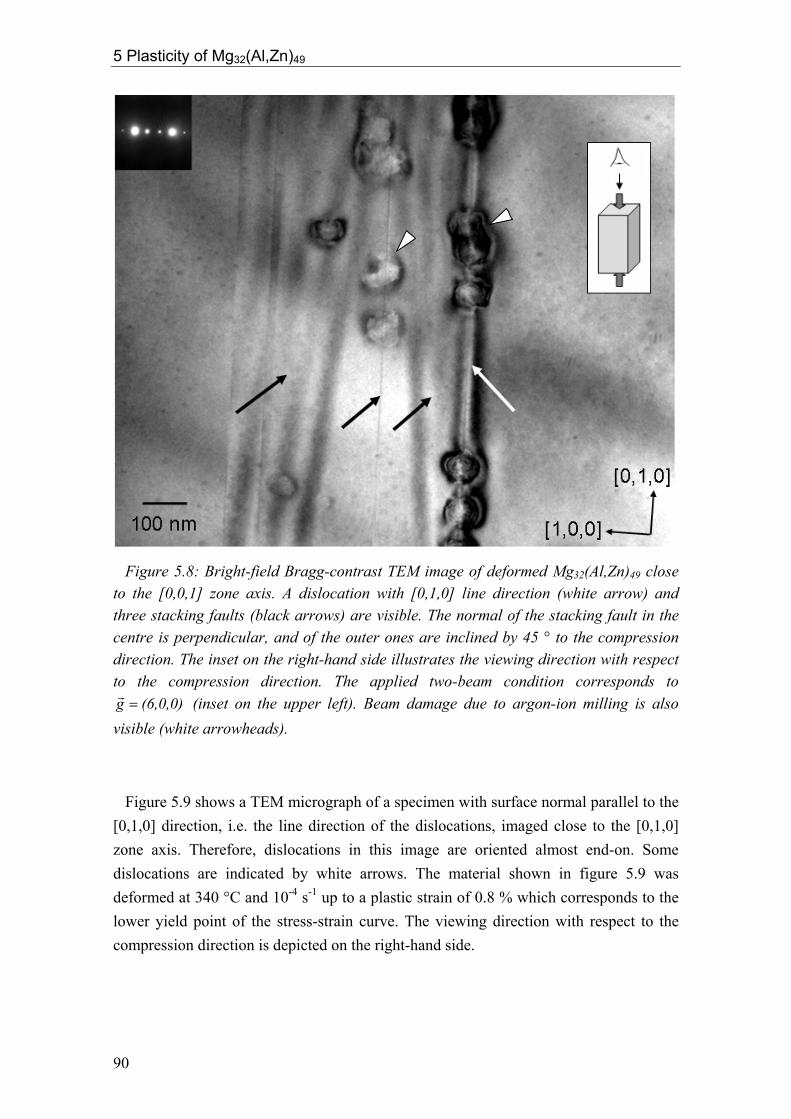
5 Plasticity of Mg32(Al,Zn)49
Figure 5.8: Bright-field Bragg-contrast TEM image of deformed Mg32(Al,Zn)49 close to the [0,0,1] zone axis. A dislocation with [0,1,0] line direction (white arrow) and three stacking faults (black arrows) are visible. The normal of the stacking fault in the centre is perpendicular, and of the outer ones are inclined by 45 ° to the compression direction. The inset on the right-hand side illustrates the viewing direction with respect to the compression direction. The applied two-beam condition corresponds to
(inset on the upper left). Beam damage due to argon-ion milling is also visible (white arrowheads).
(6,0,0)g =r
Figure 5.9 shows a TEM micrograph of a specimen with surface normal parallel to the [0,1,0] direction, i.e. the line direction of the dislocations, imaged close to the [0,1,0] zone axis. Therefore, dislocations in this image are oriented almost end-on. Some dislocations are indicated by white arrows. The material shown in figure 5.9 was deformed at 340 °C and 10-4 s-1 up to a plastic strain of 0.8 % which corresponds to the lower yield point of the stress-strain curve. The viewing direction with respect to the compression direction is depicted on the right-hand side.
90
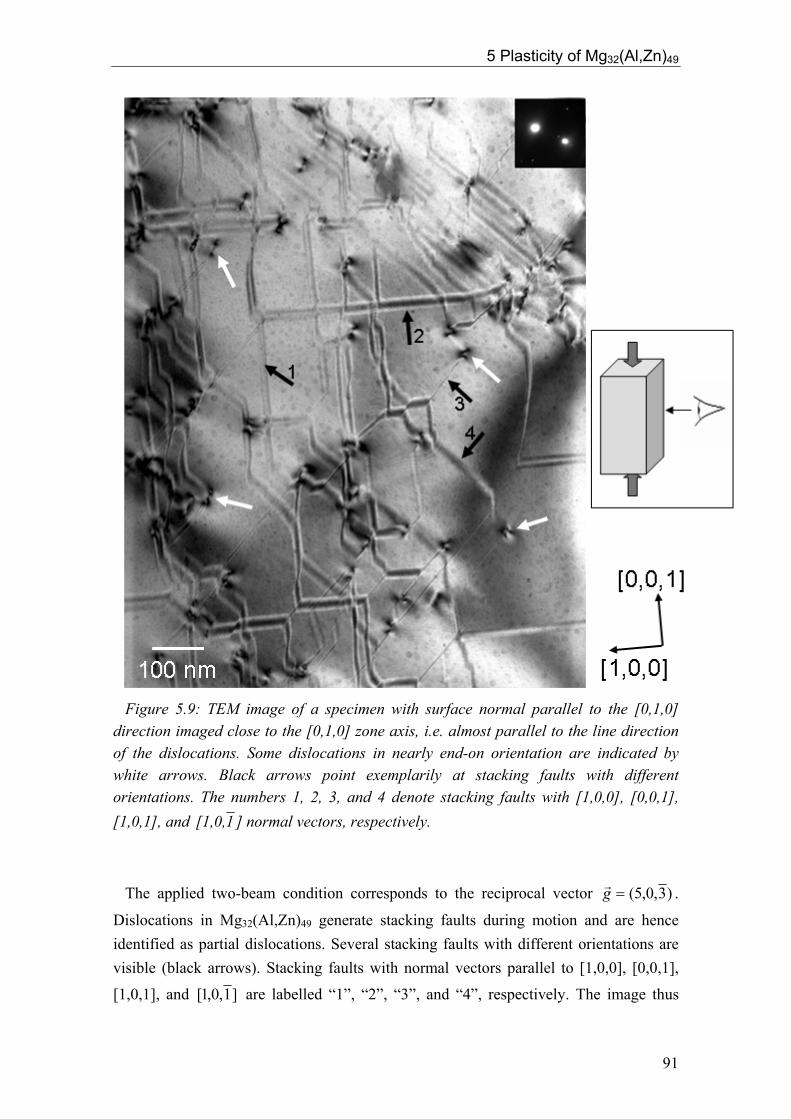
5 Plasticity of Mg32(Al,Zn)49
Figure 5.9: TEM image of a specimen with surface normal parallel to the [0,1,0] direction imaged close to the [0,1,0] zone axis, i.e. almost parallel to the line direction of the dislocations. Some dislocations in nearly end-on orientation are indicated by white arrows. Black arrows point exemplarily at stacking faults with different orientations. The numbers 1, 2, 3, and 4 denote stacking faults with [1,0,0], [0,0,1], [1,0,1], and ]1[1,0, normal vectors, respectively. The applied two-beam condition corresponds to the reciprocal vector )3,0,5(=gr .
Dislocations in Mg32(Al,Zn)49 generate stacking faults during motion and are hence identified as partial dislocations. Several stacking faults with different orientations are visible (black arrows). Stacking faults with normal vectors parallel to [1,0,0], [0,0,1],
[1,0,1], and ]1,0,1[ are labelled “1”, “2”, “3”, and “4”, respectively. The image thus
91
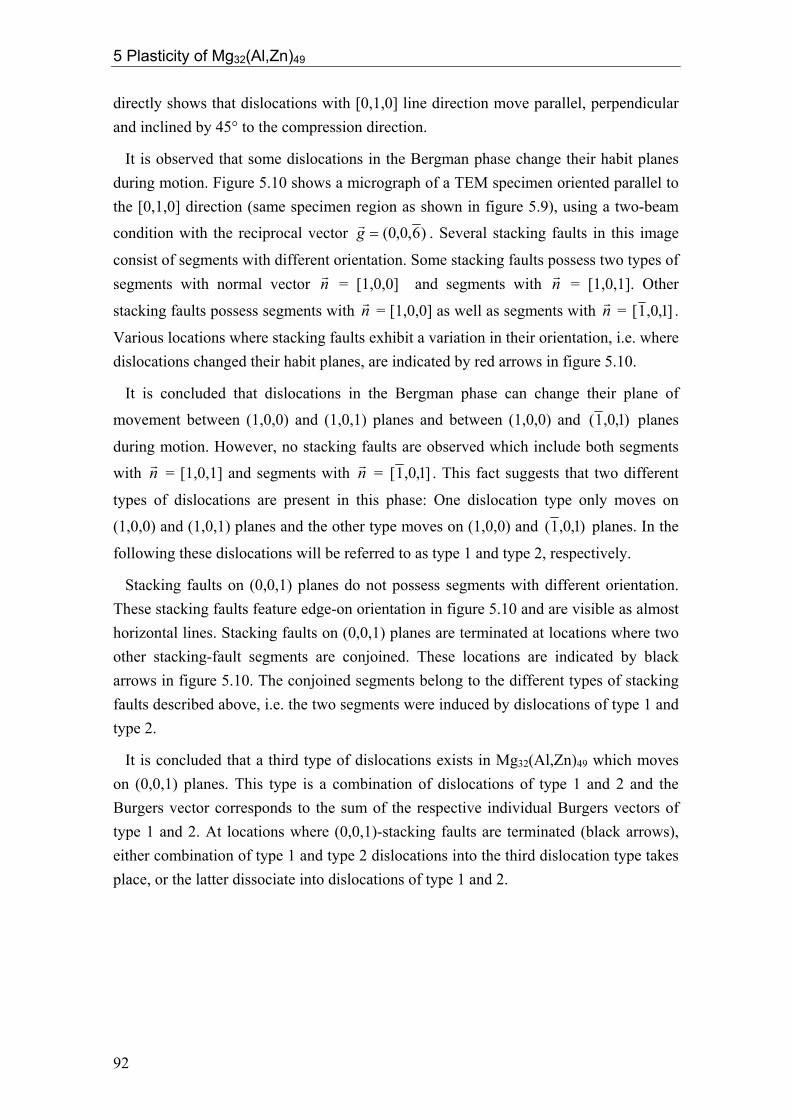
5 Plasticity of Mg32(Al,Zn)49
directly shows that dislocations with [0,1,0] line direction move parallel, perpendicular and inclined by 45° to the compression direction.
It is observed that some dislocations in the Bergman phase change their habit planes during motion. Figure 5.10 shows a micrograph of a TEM specimen oriented parallel to the [0,1,0] direction (same specimen region as shown in figure 5.9), using a two-beam
condition with the reciprocal vector )6,0,0(=gr . Several stacking faults in this image
consist of segments with different orientation. Some stacking faults possess two types of segments with normal vector n = [1,0,0] and segments with
r nr = [1,0,1]. Other
stacking faults possess segments with nr = [1,0,0] as well as segments with = nr ]1,0,1[ .
Various locations where stacking faults exhibit a variation in their orientation, i.e. where dislocations changed their habit planes, are indicated by red arrows in figure 5.10.
It is concluded that dislocations in the Bergman phase can change their plane of
movement between (1,0,0) and (1,0,1) planes and between (1,0,0) and )1,0,1( planes
during motion. However, no stacking faults are observed which include both segments
with = [1,0,1] and segments with nr nr = ]1,0,1[ . This fact suggests that two different
types of dislocations are present in this phase: One dislocation type only moves on
(1,0,0) and (1,0,1) planes and the other type moves on (1,0,0) and )1,0,1( planes. In the
following these dislocations will be referred to as type 1 and type 2, respectively.
Stacking faults on (0,0,1) planes do not possess segments with different orientation. These stacking faults feature edge-on orientation in figure 5.10 and are visible as almost horizontal lines. Stacking faults on (0,0,1) planes are terminated at locations where two other stacking-fault segments are conjoined. These locations are indicated by black arrows in figure 5.10. The conjoined segments belong to the different types of stacking faults described above, i.e. the two segments were induced by dislocations of type 1 and type 2.
It is concluded that a third type of dislocations exists in Mg32(Al,Zn)49 which moves on (0,0,1) planes. This type is a combination of dislocations of type 1 and 2 and the Burgers vector corresponds to the sum of the respective individual Burgers vectors of type 1 and 2. At locations where (0,0,1)-stacking faults are terminated (black arrows), either combination of type 1 and type 2 dislocations into the third dislocation type takes place, or the latter dissociate into dislocations of type 1 and 2.
92

5 Plasticity of Mg32(Al,Zn)49
Figure 5.10: TEM micrograph with optical axis close to the [0,1,0] zone axis of the specimen. A two-beam condition corresponding to the reciprocal vector )6(0,0,g =
r was applied. Red arrows indicate sites where dislocations changed their habit planes during motion. Black arrows indicate sites where (0,0,1)-stacking faults terminate (see text).
93

5 Plasticity of Mg32(Al,Zn)49
Burgers-vector orientation
The Burgers-vector orientation of dislocations in the Bergman phase was determined by means of contrast-extinction experiments in TEM. Figure 5.11 shows a TEM specimen with orientation close to the [0,0,1] zone axis. Two dislocations are visible as diagonal lines (white arrows) under various imaging conditions. The applied two-beam conditions correspond to the reciprocal vectors (a) )0,0,6(=gr , (b) , (c) )1,3,6(=gr
)1,3,6(=gr , and (d) . )0,6,0(=gr
In figure 5.11 (a) both dislocations show strong Bragg contrast while both are extinct in figure 5.11 (d). The reciprocal vector applied in (d) is parallel to the line directions of the dislocations. Hence, considering equation (A.3), the Burgers vectors lie perpendicular to the line directions of the dislocations, i.e. both dislocations posses pure edge character. In this case, the two-beam condition applied in (d) is the only condition which fulfils equation (A.4) and accordingly causes full extinction. Other reflections perpendicular to the Burgers vectors satisfy condition (A.3) but not (A.4) and hence cause residual contrast. Unlike the edge dislocations investigated in µ-Al-Mn (chapter 4.3), residual contrast of edge dislocations in the present case can be distinguished from usual Bragg contrast, which allows a determination of the Burgers-vector orientation.
Dislocations under residual contrast show a weak blurry appearance in Mg32(Al,Zn)49. The dislocation on the lower-left side of figure 5.11 shows residual contrast in (b). The Burgers vector of this dislocation can be determined using equation (A.3). Considering
the extinction in (d) and the residual contrast in (b), an orientation parallel to ]6,0,1[ is
calculated. The dislocation on the upper-right side shows residual contrast in (c) and hence possesses a Burgers vector parallel to [1,0,6]. In the following the discussed
dislocations will be referred to as [1,0,6] and ]6,0,1[ dislocations, according to their
respective Burgers-vector directions.
Figure 5.12 shows a TEM micrograph of a specimen prepared with surface normal parallel to the [0,0,1] direction (same specimen region as shown in figure 5.8). One dislocation and three stacking faults can be observed in (a), where a two-beam condition corresponding to )0,0,6(=gr was applied. They are indicated by white and black
arrows, respectively. The stacking fault in the centre possesses a normal vector parallel to [1,0,0] and exhibits almost edge-on orientation. By means of tilting experiments it was determined that the outer stacking faults possess a normal vector parallel to [1,0,1]. All defects are extinct in (b) using the reciprocal vector )0,6,0(=gr , i.e. equation (A.4)
is fulfilled in case of the dislocation and equation (A.6) is fulfilled in case of the stacking faults. Several almost round features, which are due to beam damage during TEM-sample preparation, are visible in figure 5.12; two are denoted by white arrowheads.
94
5 Plasticity of Mg32(Al,Zn)49
Figure 5.11: TEM micrograph of a specimen close to the [0,0,1] zone axis under different two-beam conditions (a-d, see text). Two dislocations with [0,1,0] line direction (diagonal lines) are indicated by white arrows.
95

5 Plasticity of Mg32(Al,Zn)49
Figure 5.12: TEM micrograph of a specimen close to the [0,0,1] zone axis (cf. figure 5.8). A dislocation and three stacking faults are marked by white and black arrows, respectively. The contrast of the defects is extinct in (b). Beam damage due to argon-ion milling is also visible (white arrowheads). Figure 5.13 shows stacking faults in a TEM specimen prepared parallel to the [0,1,0] direction. Due to sample tilting towards the [1,0,0] direction (about 25°), stacking faults
with [1,0,0], [1,0,1], and ]1,0,1[ plane normals show a broad fringe contrast. Stacking
faults with [0,0,1] normal vector are visible as narrow horizontal lines. The same specimen region is shown in this figure using different imaging conditions (a, c, d).
All planar defects show strong Bragg contrast in figure 5.13 (a) where a two-beam condition, corresponding to the reciprocal vector (0,0,6)g =
r was applied. Stacking
faults which are extinct in (c) and (d) are indicated by red and blue arrows, respectively. In (c), where the reciprocal vector )1,3,6(=gr was applied, all stacking faults with
and some with are extinct. For these stacking faults equation (A.6)
is fulfilled. Taking the contrast extinctions of the stacking faults in figure 5.13 (c) ( ) and in figure 5.12 (b) (
]1,0,1[=nr ]0,0,1[=nr
)1,3,6(=gr )0,6,0(=gr ) into account, a displacement vector
parallel to ]6,0,1[ is calculated.
It can be concluded that the latter stacking faults are generated by the motion of
]6,0,1[ dislocations. Hence, ]6,0,1[ dislocations move on (1,0,0) and (1,0,1) planes, i.e.
they correspond to the dislocations of type 1. The remaining stacking faults with
and all stacking faults with ]0,0,1[=nr ]1,0,1[=nr are extinct in figure 5.13 (d)
( )1,3,6(=gr ). Concluding analogously, we find that these stacking faults possess
96

5 Plasticity of Mg32(Al,Zn)49
displacement vectors parallel to [1,0,6] and are generated by dislocations. The
latter correspond to dislocations of type 2.
]6,0,1[
Figure 5.13: Stacking faults in a specimen with [0,1,0] orientation under various imaging conditions (see text). Complementary extinction of stacking faults can be observed in (c) and (d). Red and blue arrows indicate stacking faults with different displacement vectors (see text). (b) is a numerical superposition of (c) and (d).
97
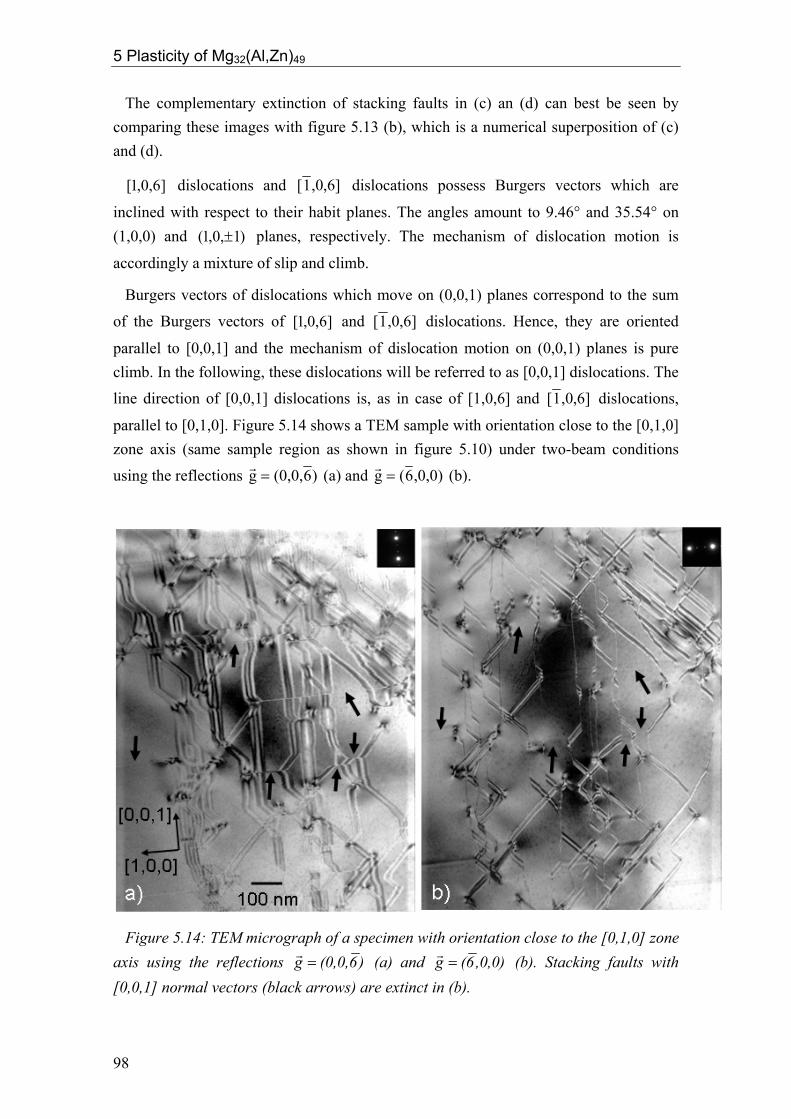
5 Plasticity of Mg32(Al,Zn)49
The complementary extinction of stacking faults in (c) an (d) can best be seen by comparing these images with figure 5.13 (b), which is a numerical superposition of (c) and (d).
dislocations and ]6,0,1[ ]6,0,1[ dislocations possess Burgers vectors which are
inclined with respect to their habit planes. The angles amount to 9.46° and 35.54° on (1,0,0) and planes, respectively. The mechanism of dislocation motion is
accordingly a mixture of slip and climb.
)1,0,1( ±
Burgers vectors of dislocations which move on (0,0,1) planes correspond to the sum
of the Burgers vectors of and ]6,0,1[ ]6,0,1[ dislocations. Hence, they are oriented
parallel to [0,0,1] and the mechanism of dislocation motion on (0,0,1) planes is pure climb. In the following, these dislocations will be referred to as [0,0,1] dislocations. The
line direction of [0,0,1] dislocations is, as in case of [1,0,6] and ]6,0,1[ dislocations,
parallel to [0,1,0]. Figure 5.14 shows a TEM sample with orientation close to the [0,1,0] zone axis (same sample region as shown in figure 5.10) under two-beam conditions
using the reflections )6(0,0,g =r
(a) and ,0,0)6(g =r
(b).
Figure 5.14: TEM micrograph of a specimen with orientation close to the [0,1,0] zone axis using the reflections )6(0,0,g =
r (a) and ,0,0)6(g =r (b). Stacking faults with
[0,0,1] normal vectors (black arrows) are extinct in (b).
98

5 Plasticity of Mg32(Al,Zn)49
Several stacking faults with normal vector parallel to [0,0,1] are indicated by arrows in figure 5.14. In (a) these stacking faults are in edge-on orientation. They are extinct in
(b) where the displacement vector Rr
is perpendicular to gr , i.e. equation (A.6) is
fulfilled.
Burgers-vector modulus
The length of the displacement vector Rr
of stacking faults created by the movement
of [1,0,6] and ]6,0,1[ dislocations is determined by means of contrast-extinction
experiments and fringe-contrast analysis. In the following, the displacement vector is
considered in the general form ],,[m1 zyxR =
r, and the factor m of the displacement
vectors Rr
parallel to [1,0,6] and ]6,0,1[ will be determined.
According to equation (A.6), the contrast of a stacking fault is extinct under two-beam
conditions if the scalar product of the displacement vector Rr
and the reciprocal vector equals an integer or zero. In the latter case these vectors are oriented perpendicular to
each other.
gr
In figure 5.15 stacking faults with displacement vectors parallel to [1,0,6] (blue
arrows) and ]6,0,1[ (red arrow) directions are imaged using different two-beam
conditions. In (a) ( ]6,0,0[=gr ) all stacking faults show strong Bragg contrast while in
(b) (dark field, ]12,0,8[=gr ) and (c) (dark field, ]12,0,8[=gr ) stacking faults with
displacement vectors parallel to ]6,0,1[ and [1,0,6] are extinct, respectively. The
displacement vectors Rr
and the reciprocal vectors gr are not oriented perpendicular to
each other in these cases. Therefore, the scalar product of Rr
and gr yields an integer in
order to achieve the observed contrast extinctions of the stacking faults, i.e. the
equations n]6,0,1[m1]12,0,8[ =⋅ and n]6,0,1[m1]12,0,8[ =⋅ (where n ≠ 0 is an
integer) are fulfilled in (b) and (c), respectively. In both cases the scalar product Rgrr
⋅
yields n64m1
= . Accordingly, the coefficient m is a divisor of 64 in order to fulfil
equation (A.6).
99
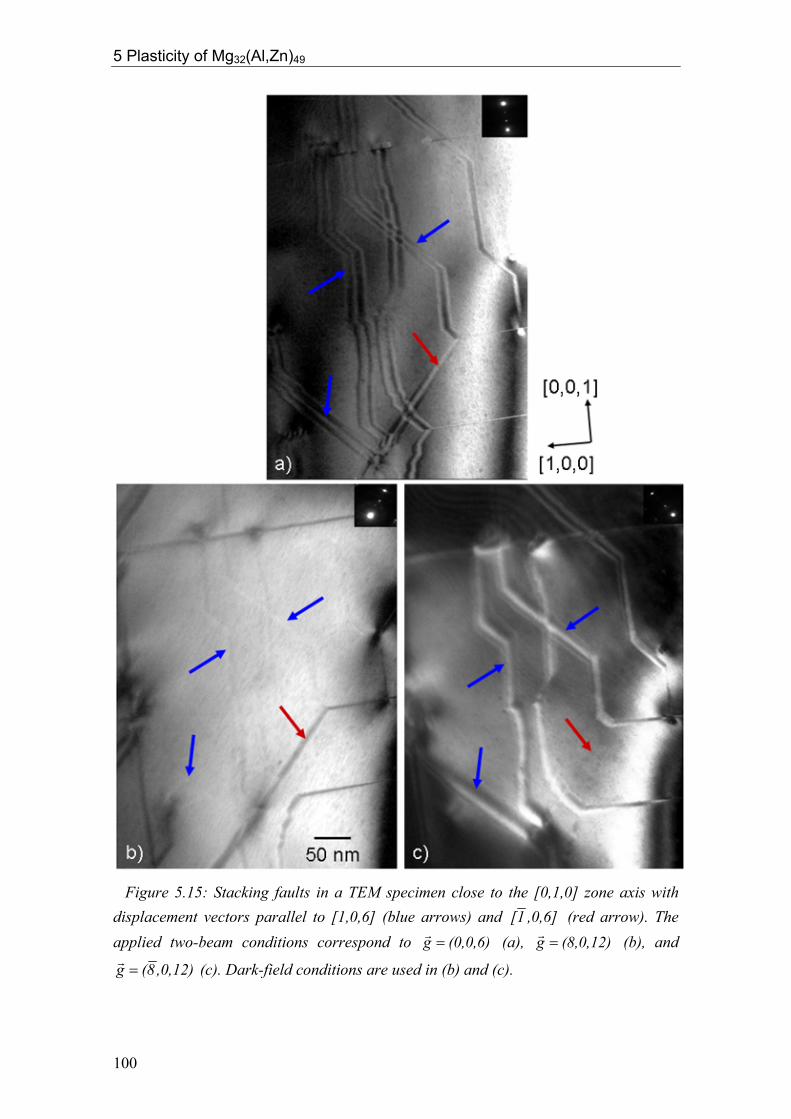
5 Plasticity of Mg32(Al,Zn)49
Figure 5.15: Stacking faults in a TEM specimen close to the [0,1,0] zone axis with displacement vectors parallel to [1,0,6] (blue arrows) and ,0,6]1[ (red arrow). The applied two-beam conditions correspond to (0,0,6)g =
r (a), (8,0,12)g =r (b), and
,0,12)8(g =r (c). Dark-field conditions are used in (b) and (c).
100
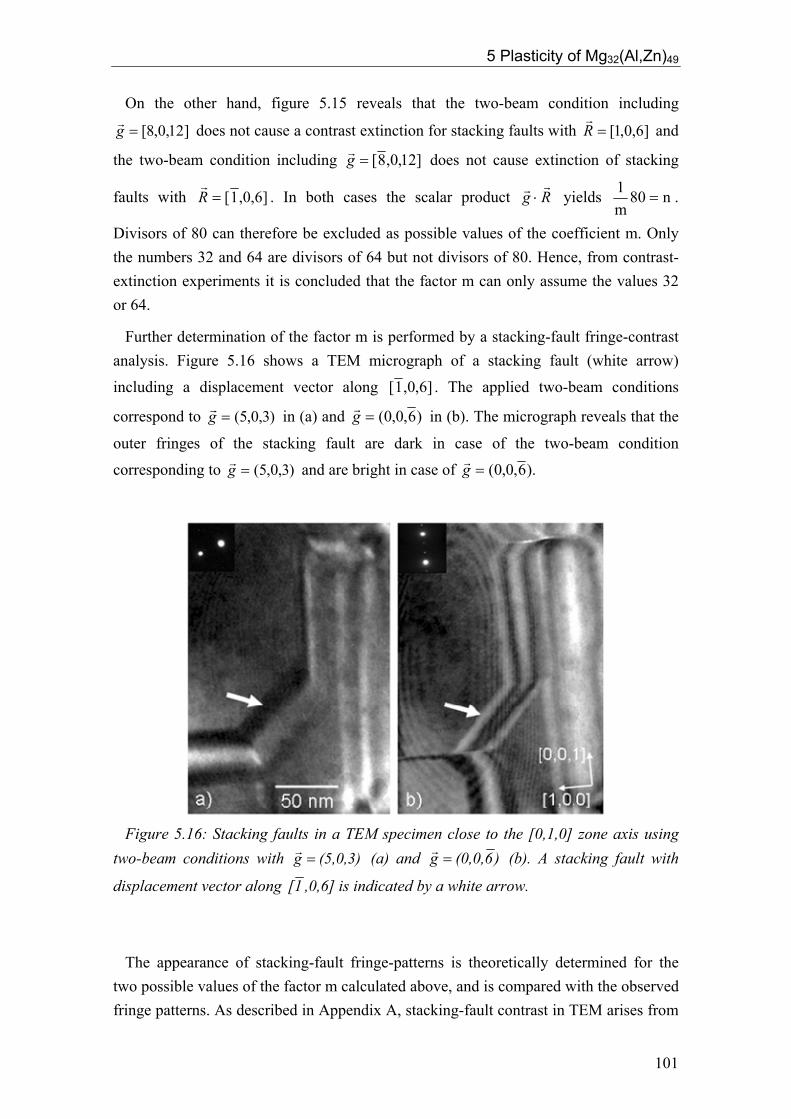
5 Plasticity of Mg32(Al,Zn)49
On the other hand, figure 5.15 reveals that the two-beam condition including
does not cause a contrast extinction for stacking faults with and
the two-beam condition including
]12,0,8[=gr ]6,0,1[=Rr
]12,0,8[=gr does not cause extinction of stacking
faults with ]6,0,1[=Rr
. In both cases the scalar product Rgrr
⋅ yields n80m1
= .
Divisors of 80 can therefore be excluded as possible values of the coefficient m. Only the numbers 32 and 64 are divisors of 64 but not divisors of 80. Hence, from contrast-extinction experiments it is concluded that the factor m can only assume the values 32 or 64.
Further determination of the factor m is performed by a stacking-fault fringe-contrast analysis. Figure 5.16 shows a TEM micrograph of a stacking fault (white arrow)
including a displacement vector along ]6,0,1[ . The applied two-beam conditions
correspond to in (a) and )3,0,5(=gr )6,0,0(=gr in (b). The micrograph reveals that the
outer fringes of the stacking fault are dark in case of the two-beam condition
corresponding to )3,0,5(=gr and are bright in case of ).6,0,0(=gr
Figure 5.16: Stacking faults in a TEM specimen close to the [0,1,0] zone axis using two-beam conditions with (a) and (5,0,3)g =
r )6(0,0,g =r (b). A stacking fault with
displacement vector along ,0,6]1[ is indicated by a white arrow. The appearance of stacking-fault fringe-patterns is theoretically determined for the two possible values of the factor m calculated above, and is compared with the observed fringe patterns. As described in Appendix A, stacking-fault contrast in TEM arises from
101

5 Plasticity of Mg32(Al,Zn)49
a phase shift α to which the electron wave is subjected and which can be calculated according to equation (A.5). The sign of the phase shift determines the appearance of the stacking fault. Gevers (1972) has shown that the outer fringes of a stacking fault in case of bright-field imaging are dark if sin(α) > 0 and are bright if sin(α) < 0. These conditions are used in order to analyze the displacement vector and determine the value of the factor m.
Table 5.1 shows an overview of the experimental and the calculated outer-fringe
contrast in case of the reciprocal vectors )3,0,5(=gr and ).6,0,0(=gr The displacement
vector corresponds to ]6,0,1[m1
=Rr
. The two possible values of m, 32 and 64, are
implied in the calculations. The contrast is bright in case of m = 32 and )6,0,0(=gr and
the contrast is dark in the residual cases of the calculations. The experimental results are in accordance with the calculated results using m = 32. For m = 64, on the other hand, the theoretically determined appearance of the outer stacking-fault fringes is dark for both reciprocal vectors. This is in contradiction to the
experimentally determined stacking-fault appearance in case of )6,0,0(=gr . Hence, 64
can be excluded as a value of m, and it is concluded that 32 is the correct value of the
coefficient m of the displacement vectors along [1,0,6] and ]6,0,1[ directions.
Calculated m = 32
Calculated m = 64
Experimental
)3,0,5(=gr dark dark dark
)6,0,0(=gr bright dark bright
Table 5.1: Calculated and experimental contrast of exterior stacking-fault fringes for two reciprocal vectors. The displacement vector ,0,6]1m[R 1=
r and the values m = 32
and 64 are implied in the calculations.
The coefficient m determines the lengths of the displacement vectors of the stacking
faults. The displacement vectors are given by ]6,0,1[321
±=Rr
and ]6,0,1[321
±=Rr
with
the modulus Å. The displacement vector of stacking faults on (0,0,1) planes
is given by the sum of the displacement vectors along [1,0,6] and
69.2|| =Rr
]6,0,1[ and amounts
to ]1,0,0[83
±=Rr
with the modulus 31.5|| =Rr
Å. It is argued in the discussion (section
5.4) that these displacement-vector lengths correspond to the Burgers-vector lengths of the respective dislocations.
102

5 Plasticity of Mg32(Al,Zn)49
Dislocation density
As discussed above, the density of dislocations with line direction along [0,1,0] is about two orders of magnitude larger in Mg32(Al,Zn)49 than the density of dislocations with line direction along [1,0,0]. The contribution of the latter to deformation processes in the Bergman phase is hence assumed to be negligible. The dislocation density in this phase is calculated ragarding only dislocations with [0,1,0] line direction.
The dislocation density in Mg32(Al,Zn)49 is calculated taking the three occurring dislocations types into account, i.e. dislocations with Burgers vectors parallel to [1,0,6],
]6,0,1[ , and [0,0,1] directions. Their densities are determined by means of TEM from
specimens prepared with plane normal parallel to the [0,1,0] direction, which corresponds to the line direction of the dislocations. Therefore, the thickness of the specimen equals the length of the observed dislocation lines, and the density can be calculated from the number of dislocations n in an observed area A according to equation (4.1).
The dislocation density is determined from a sample deformed at 340 °C and 10-4 s-1 up to a plastic strain of 0.8 %, i.e. the lower yield point of the stress-strain curve. Reference investigations were carried out on undeformed material which was heat treated and quenched in the same way as the deformed sample. The densities were determined by averaging values obtained in 20 randomly selected TEM specimen areas, and amount to ρundef = and ρ27101.1 −⋅ cm def = for the undeformed and deformed material, respectively.
29101.2 −⋅ cm
5.4 Discussion Macroscopic deformation behaviour Stress-strain behaviour
Deformation experiments were performed on single-crystalline Mg32(Al,Zn)49 with [0,0,1]-compression direction at . The experiments were carried out between 340 and 400 °C which corresponds to the homologous temperature range of T
1410 −−= sε&
H = 0.80 to 0.88. During deformation at 320 °C sample fracture occurred directly at the onset of plastic deformation. Hence, it is concluded that the brittle-to-ductile transition is close to this temperature (TH = 0.78) at the applied strain rate, which is a typical value in a medium range compared with other CMA phases (see chapter 7).
103
5 Plasticity of Mg32(Al,Zn)49
An increase of the dislocation density due to plastic deformation is observed in Mg32(Al,Zn)49. The dislocation density exhibits a difference of about two orders of magnitude between undeformed material and samples deformed up to the lower yield point, i.e. the stress minimum after the yield drop. This fact allows for the conclusion that the deformation process in the Bergman phase is based on dislocation motion.
The stress-strain curves exhibit pronounced yield-point effects at all investigated temperatures. The presence of a yield-point effect in connection with an increase of the dislocation density is in good agreement with a model of Johnston and Gilman (1959), which describes the dependence of the flow stress on the evolution of the dislocation density during plastic deformation. According to this model, the dislocation-multiplication rate shows a strong stress dependence. With the onset of plastic deformation an intense multiplication of dislocations occurs in Mg32(Al,Zn)49, leading to the difference in the dislocation densities of deformed and undeformed samples. The yield drop can therefore be attributed to an increased number of mobile dislocations which contribute to the deformation process.
From the observed absence of pronounced yield-point effects after incremental tests (figure 5.4) it is concluded, as in case of µ-Al-Mn (chapter 4.4), that recovery takes place at low rates in this material.
Thermodynamic activation parameters
According to microstructural investigations, plastic deformation of Mg32(Al,Zn)49 is mediated by different mechanisms involving dislocation slip and climb. The macroscopic activation volume cannot be determined separately for the contributing microstructural mechanisms. Therefore the activation volume is calculated by applying a mean value of the Schmid factor for dislocation slip and climb.
An estimation of the Schmid factor is admissible since a variation of the activation volume by, say, a factor of two has only marginal relevance for the interpretation of the results. For dislocation slip the maximum Schmid factor of 0.5 is implied which accords to the slip component of dislocations on planes (see section
“Microstructural deformation behaviour”). For dislocation climb no Schmid factor is defined since no slip plane exists. However, a value of m
]6,0,1[± )1,0,1(m
s = 1 is a widely accepted assumption for dislocation climb under normal stresses in the literature (e.g. Nandy and Banerjee, 2000, Mitra et al., 2004, Malaplate et al., 2005, cf. chapter 4). Hence, a Schmid factor of ms = 0.75 was assumed in the calculations for the activation Volume.
Taking these considerations into account, the activation volume of Mg32(Al,Zn)49 amounts to about 0.4 nm3 at a medium stress of 300 MPa. Scaled by the atomic volume
104
5 Plasticity of Mg32(Al,Zn)49
Va (i.e. the volume of the unit cube VCell = 2.86 nm3 divided by 162 atoms per cell) this value equals V/Va = 23.
Icosahedral atom arrangements in Mg32(Al,Zn)49 (cf. section 5.1) form stable entities in the structure. The activation volume is of the same order of magnitude as the number of atoms in these clusters. Previous investigations on the plasticity of CMA phases have shown that atom clusters can act as obstacles for dislocation motion (Feuerbacher et al., 2001, cf. chapter 4.4). It is hence supposed that primarily icosahedral atom arrangements act as obstacles for dislocation motion in the Bergman phase, and that friction between dislocations and the cluster substructure provides the rate-controlling factor of dislocation motion.
The activation enthalpy of Mg32(Al,Zn)49 ranges between 1.9 and 2.6 eV (figure 5.7). It is about 2 to 3 times larger than the work term which indicates that the deformation experiments in the investigated temperature range are thermally activated processes.
As observed in the microstructural analysis, dislocation climb plays a significant role in the deformation process. Diffusion processes at adequate rates are therefore essential for plastic deformation. Values of the diffusion enthalpy of Mg32(Al,Zn)49 are not reported in the literature. Self-diffusion enthalpies of Al, Mg, and Zn, as well as the diffusion enthalpies of Mg and Zn in Al amount between 1.1 and 1.5 eV (LeClair, 1992). Assuming that the diffusion enthalpy of the Bergman phase is of the same order, the activation enthalpy is about twice as large as the diffusion enthalpy. This difference between diffusion- an activation enthalpy is qualitatively found in µ-Al-Mn, as well (chapter 4).
It is concluded that besides diffusion another process dominates the rate of dislocation motion and affects the magnitude of the activation enthalpy. This could be the interaction between dislocations and the cluster substructure. The same conclusion is drawn for the activation enthalpy in case of µ-Al-Mn (chapter 4.4). It is suggested in the interpretation of the activation volume (see discussion above), that atom clusters act as obstacles against dislocation motion and that the thermally activated overcoming of these obstacles provides the rate-controlling mechanism for dislocation motion. The discrepancy between the values of diffusion- an activation enthalpy can be explained if the friction between the dislocations and the cluster substructure determines the magnitude of the activation enthalpy in the investigated temperature range rather than lattice diffusion.
As observed in the phase µ-Al-Mn, the activation enthalpy of Mg32(Al,Zn)49 shows a deviation from proportional temperature dependence, i.e. the condition 0)0( ==THΔ
(Gibbs, 1969) is not fulfilled. In analogy to the interpretation in case of µ-Al-Mn (chapter 4.4), this property may indicate a change of the rate-controlling processes at different temperatures. Extrapolation of the activation enthalpy to lower temperatures
105

5 Plasticity of Mg32(Al,Zn)49
reveals energies between 1.1 and 1.5 eV close to 320 °C, which corresponds to the approximate brittle-to-ductile transition temperature. This energy range is in accordance with the assumed diffusion enthalpy of Mg32(Al,Zn)49.
These results might be interpreted as follows. At temperatures between 340 and 400 °C the activation enthalpy is considerably larger than the diffusion enthalpy. In this region diffusion is only an energetically subordinated effect for dislocation motion and friction between dislocations and the cluster substructure can be dominant. At lower temperatures, however, lattice diffusion becomes rate-controlling and limit the climb process. With decreasing temperature, the decreasing diffusion rate suppresses the dislocation climb mechanisms, leading to the observed brittle-to-ductile transition at about 320 °C.
Microstructural analysis Dislocation motion and Burgers-vector orientation
The deformation processes in the Bergman phase are mediated by the motion of dislocation segments with [0,1,0] line direction. Due to their low density, dislocation segments with line direction along [1,0,0] are assumed to be negligible as carriers of deformation processes. This anisotropic deformation behaviour may be attributed to the crystal symmetry of Mg32(Al,Zn)49. The crystal structure possesses the space group
3Im which includes a two-fold rotational symmetry along <0,0,1> directions.
The anisotropy is also reflected in the macroscopic deformation behaviour of this phase. During deformation experiments at 380 and 400 °C broadening of samples along [1,0,0] is observed to be considerably larger than broadening along [0,1,0].
Three different types of partial dislocations with [0,1,0] line directions are observed in deformed Mg32(Al,Zn)49. All are dislocation segments with pure edge character. Two
dislocation types feature Burgers vectors parallel to and ]6,0,1[ ]6,0,1[ . The
combination of these two dislocation types forms the third kind of dislocations with Burgers vector parallel to the [0,0,1] direction. Networks of extended stacking faults are generated by the motion of these dislocations. Figure 5.17 shows a schematic illustration of the stacking-faults in the Bergman phase. Stacking faults generated by the
different dislocation types are indicated by colours. ]6,0,1[ dislocations move on (1,0,0)
and (1,0,1) planes (red planes) while dislocations move on (1,0,0) and ]6,0,1[ )1,0,1(
planes (blue planes). Green (0,0,1) planes in figure 5.17 denote stacking faults generated by dislocations featuring Burgers vectors parallel to [0,0,1].
106

5 Plasticity of Mg32(Al,Zn)49
Figure 5.17: Schematic illustration of stacking-fault arrangements in deformed Mg32(Al,Zn)49. Colours indicate the type of displacement vector of the stacking faults (see text). Grey arrows denote the applied compression direction. Burgers-vector modulus
The displacement-vector lengths of the stacking faults are determined by means of contrast-extinction experiments and fringe-contrast analyses. They amount to 2.69 Å in case of and (1,0,0) stacking faults and to 5.31 Å in case of (0,0,1) stacking
faults. The displacement vectors are determined from several independent stacking faults in the performed examinations (cf. figure 5.15). Additionally, several investigated stacking faults are terminated by dislocations (see e.g. figure 5.9). It is hence concluded, that the examined stacking faults are primarily generated by the motion of one dislocation in each case and that the displacement vectors correspond to the Burgers vectors of the dislocations.
)1,0,1(±
107

5 Plasticity of Mg32(Al,Zn)49
Angles between Burgers vectors and habit planes
The Burgers vectors of the dislocations are inclined by specific angles to the respective planes of movement. In case of [0,0,1] dislocations the Burgers vector is perpendicular to the habit plane, i.e. the (0,0,1) plane. ]6,0,1[± dislocations possess
Burgers vectors inclined by 9.46° and 35.54° with respect to the (1,0,0) and
planes, respectively.
)1,0,1(m
In figure 5.18 the Burgers-vector directions are schematically illustrated with respect to the movement planes along the [0,1,0] direction. Colours assign the Burgers vectors of dislocations to the respective planes of movement (according to colours in figure
5.17). The (1,0,0) plane, which is a habit plane of as well as of ]6,0,1[ ]6,0,1[
dislocations, is shown dashed in red and blue. Angles between Burgers vector and
planes of movement are exemplarily given for the ]6,0,1[ Burgers vector.
Figure 5.18: Schematic illustration of the Burgers-vector orientations in Mg32(Al,Zn)49 along the [0,1,0] direction. Angles between Burgers vector and planes of movement are exemplarily given for the ]6[1,0, Burgers vector (red).
108

5 Plasticity of Mg32(Al,Zn)49
Slip and climb components of dislocation motion
The angles between the Burgers vectors and the dislocation-habit planes define the mode of dislocation motion. Dislocations with Burgers vectors move on (0,0,1)
planes by pure climb, while dislocations move on (1,0,0) and planes
by mixtures of climb and slip mechanisms.
]1,0,0[
]6,0,1[± )1,0,1( m
The slip and climb components of dislocation motion are exemplarily illustrated for
the ]6,0,1[ dislocations in figure 5.19. The Burgers-vector orientation is shown with
respect to the habit planes of the dislocation (cf. figure 5.18). The (1,0,1) plane and the (1,0,0) plane are shown in (a) and (b), respectively. Arrows in bright grey denote the slip component and arrows in dark grey denote the climb component of the Burgers vector. The dislocation is indicated by “”. Figure 5.19 reveals that
dislocations possess a slip component on planes which is slightly larger than
the climb component. On (1,0,0) planes, dislocation slip is the dominating mode of dislocation motion, i.e. the slip component of
]6,0,1[±
)1,0,1(m
]6,0,1[± dislocations is considerably
larger than the climb component.
Figure 5.19: Illustration of the Burgers vector direction of ]6[1,0, dislocations “” with respect to (1,0,1) planes (a) and (1,0,0) planes (b). The slip and climb components are shown as arrows in bright grey and dark grey, respectively. The various components of dislocation motion on the different planes of movement contribute in different manners to the deformation process. These components, i.e. climb of [0,0,1] dislocations on (0,0,1) planes, slip and climb of ]6,0,1[± dislocations on
planes, and slip and climb of )1,0,1(m ]6,0,1[± dislocations on (0,0,1) planes, are
discussed in the following.
109

5 Plasticity of Mg32(Al,Zn)49
Dislocations with Burgers vectors parallel to move by pure climb on (0,0,1)
planes. These dislocations contribute to the deformation process by removing atomic layers (positive climb) with plane normals parallel to the compression direction and hence, cause a shortening of deformation samples. An equivalent mechanism was observed in µ-Al-Mn (chapter 4), where basal-plane dislocations remove atom layers with normal vector parallel to the c-axis by means of pure climb.
]1,0,0[
The motion of and ]6,0,1[ ]6,0,1[ dislocations on planes contributes to the
deformation process due to the slip components as well as the climb components of their Burgers vectors. The climb process removes atomic layers and hence corresponds to positive climb. This process is comparable with the climb mechanism of [0,0,1] dislocations on (0,0,1) planes. In case of
)1,0,1(m
]6,0,1[± dislocations, however, the removed
layers are inclined by 45° to the compression direction.
The slip components of dislocations on planes possess the maximum
possible Schmid factor for this mode of dislocation motion. In this geometry, the slip plane as well as the slip direction are inclined by 45° with respect to the compression direction, yielding the Schmid factor of m
]6,0,1[± )1,0,1(m
S = 0.5 (cf. chapter 3.1).
On (1,0,0) planes, on the other hand, slip of ]6,0,1[± dislocations possess a Schmid
factor of mS = 0, i.e. no resulting driving force for this mode of dislocation motion occurs from the experimental configuration. The large slip component of
dislocations on (1,0,0) planes parallel to the compression direction may occur due to the appearance of local shear stresses parallel to the [0,0,1] direction. The origin of these shear stresses can be explained by the interaction of the different modes of dislocation motion and is further discussed below.
]6,0,1[±
The climb component of dislocations on (1,0,0) planes introduces atomic
layers with normal vector parallel to [1,0,0] during motion. This mechanism corresponds to negative climb. It causes a broadening of the sample and by this way contributes to the deformation process. In the applied deformation geometry, however, no resulting driving force arises for a climb mechanism on (1,0,0) planes. The driving force occurs, in analogy to the driving force for motion of c-axis dislocations in µ-Al-Mn (chapter 4.4), from a chemical stress, which is generated by a concentration gradient of vacancies or interstitial atoms (Le Hazif et al., 1968). The concept of the chemical stress is further discussed in the comprehensive discussion (chapter 7.2).
]6,0,1[±
As in case of µ-Al-Mn, positive and negative climb mechanisms are present in Mg32(Al,Zn)49 acting complementary as sinks and sources for vacancies, respectively (or vice versa for interstitial atoms). The concentration gradient is caused by the positive climb mechanisms of [0,0,1] dislocations on (0,0,1) planes and ]6,0,1[± dislocations on
planes. The complementary climb mechanisms can effectively interact via )1,0,1(m
110

5 Plasticity of Mg32(Al,Zn)49
diffusion; only the diffusion distance between the involved dislocation types have to be passed. Taking dislocation densities of deformed samples (εplast = 0.8 %) into account, this distance is about 4 orders of magnitude smaller than the distance between dislocations and the sample surface.
Interaction of deformation mechanisms
In the following, the interaction between the different types of deformation mechanisms observed in Mg32(Al,Zn)49 is discussed. For this purpose, the effects of a
]6,0,1[ dislocation, which moves in a deformation sample on an (1,0,1) plane, on the
surrounding sample material is exemplarily considered.
Figure 5.20 schematically illustrates a section of a deformation sample along the [0,1,0] direction. An (1,0,1)-stacking fault is shown as red line in figure 5.20 (a). Grey arrows denote the compression direction. Two regions of the sample section, indicated “1” and “2” in (a), are separated by the (1,0,1)-stacking fault and two other stacking faults on (1,0,0) and (0,0,1) planes, respectively. These regions denote two parts of the deformation sample which exhibit a displacement in (b) and (c) with respect to each
other due to the motion of the ]6,0,1[ dislocation on the (1,0,1) plane. The displacement
vector is indicated as red arrow in (a).
The initial state of the process is illustrated in (a), i.e. no displacement between the parts “1” and “2” is present. The images in (b) and (c) show two states of the process,
revealing displacements caused by the slip and climb components of the ]6,0,1[
dislocation on the (1,0,1) plane.
Figure 5.20 (b) shows the hypothetical state if only the slip component causes a
displacement. A diagonal displacement between regions “1” and “2” along the ]1,0,1[
direction (black arrow) is visible. The dashed line denotes the initial position of region “1”. For this displacement, additional processes at the boundary between region “1” and region “2” have necessarily to take place. In the lower-right corner of figure 5.20 (b), sample material corresponding to an (0,0,1) layer has to be removed (green arrow). This material is illustrated by an overlap of regions “1” and “2” in dark grey. Climb of [0,0,1] dislocations on (0,0,1) planes removes the according atomic layers. In the upper-left corner, on the other hand, sample material corresponding to an (1,0,0) layer has to be inserted. This area is illustrated by a gap between regions “1” and “2” (brown arrows). The climb component of ]6,0,1[± dislocations on (1,0,0) planes introduces the
according atomic layers.
111

5 Plasticity of Mg32(Al,Zn)49
Figure 5.20: Schematic illustration of a Mg32(Al,Zn)49 deformation-sample element along the [0,1,0] direction. Two regions of the sample (denoted “1” and “2” in (a)) are separated by stacking faults on (1,0,0), (1,0,1), and (0,0,1) planes. Different states of the displacement (black arrows) caused by the motion of an ]6[1,0, dislocation on the (1,0,1) plane are shown in (a-c). (a) Initial state of the process; no displacement is present. (b) Displacement along ]1[1,0, induced by the slip component. (c) Additional
displacement along ]1,0,1[ induced by the climb component. Red arrows denote the displacement vector. Brown, green, and white arrows indicate effects of the displacement (see text). Figure 5.20 (c) shows the final state of the displacement of region “1” if the slip- as
well as the climb component of the ]6,0,1[ dislocation contribute to the displacement.
The climb component removes an atomic layer on the (1,0,1) plane (not removed in the illustration). This leads to a diagonal displacement of sample region “1” with respect to region “2”. Hence, in addition to the displacement shown in (b), a displacement along
the ]1,0,1[ direction (black arrow) is visible. The displacement is illustrated with an
overlap of regions “1” and “2” (brown arrow).
The final arrangement of region “1” with respect to region “2” corresponds to a vertical and horizontal displacement according to the direction of the displacement vector (red arrow). The vertical component of the displacement induces a shear stress parallel to the compression direction at the (1,0,0) stacking fault between regions “1” and “2”. In the upper-left corner of figure 5.20 (c) the shear stress is indicated by white arrows. This shear stress acts as driving force for slip of ]6,0,1[± dislocations on (1,0,0)
planes.
112

5 Plasticity of Mg32(Al,Zn)49
Occurrence of stacking-fault networks
The three types of dislocations with Burgers vectors parallel to [1,0,6], ]6,0,1[ , and
[0,0,1] interact with each other and insert extended networks of stacking faults in deformed Mg32(Al,Zn)49. These netwoks may arise as described in the following
scenario. Dislocations with [1,0,6] and ]6,0,1[ Burgers vectors move, driven by an
external stress applied at the deformation sample, on their habit planes, i.e. on
and (1,0,0) planes. These dislocation types occasionally combine and form [0,0,1] dislocations which move on (0,0,1) planes. The latter dislocations can again dissociate
and form [1,0,6] and
)1,0,1(m
]6,0,1[ dislocations.
The combination of [1,0,6] and ]6,0,1[ dislocations to [0,0,1] dislocations, however,
is associated with a significant enlargement of the elastic line energy of the dislocations. Since the elastic line energy of a dislocation is proportional to the square of the Burgers
vector length, a combination of [1,0,6] and ]6,0,1[ dislocations to [0,0,1] dislocations is
energetically unfavourable. Therefore, according to Frank’s rule (e.g. Hull and Bacon,
1984), combination of [1,0,6] and ]6,0,1[ dislocations is not feasible. The dissociation
of [0,0,1] dislocations into [1,0,6] and ]6,0,1[ dislocations, on the other hand, is
energetically advantageous and therefore likely.
Dislocation multiplication takes place during plastic deformation of Mg32(Al,Zn)49 as demonstrated by the increased dislocation density in deformed samples of this phase. The appearance of extended stacking-fault networks can be explained if preferentially dislocations with Burgers vector parallel to [0,0,1] are generated by this means. These dislocations dissociate, depending on the sign of their Burgers vectors, either into
[1,0,6] and ]6,0,1[ dislocations or into ]6,0,1[ and ]6,0,1[ dislocations. Due to the
long-range elastic stress-fields, dislocations with opposite signs of their Burgers vectors,
i.e. [1,0,6] and ]6,0,1[ dislocations as well as ]6,0,1[ and ]6,0,1[ dislocations, cause an
attractive force on each other (Hull and Bacon, 1984). Furthermore, dislocations with opposite Burgers vectors can annihilate.
The stacking-fault networks in the Bergman phase can occur if ]6,0,1[ and ]6,0,1[
dislocations and if and ]6,0,1[ ]6,0,1[ dislocations attract each other and annihilate.
This scenario is schematically illustrated in figure 5.21. An [0,0,1] dislocation and an
]1,0,0[ dislocation have inserted stacking faults on (0,0,1) planes (green) and split into
[1,0,6] and ]6,0,1[ dislocations and into ]6,0,1[ and ]6,0,1[ dislocations, respectively.
These dislocations insert stacking faults on their habit planes during motion (shown in red and blue). Four dislocations are indicated by “”. Black arrows denote the
113

5 Plasticity of Mg32(Al,Zn)49
movement directions of the dislocations and coloured arrows denote displacement vectors of the stacking faults. In the centre of figure 5.21 two dislocations with Burgers
vectors along ]6,0,1[ and ]6,0,1[ approach each other due to their attractive force.
Annihilation of these dislocations joins the inserted stacking faults.
Figure 5.21: Schematic illustration of dislocation motion in the Bergman phase. Coloured arrows indicate directions of displacement vectors (see text) and “” denotes dislocations. Black arrows indicate the movement directions of the dislocations.
114
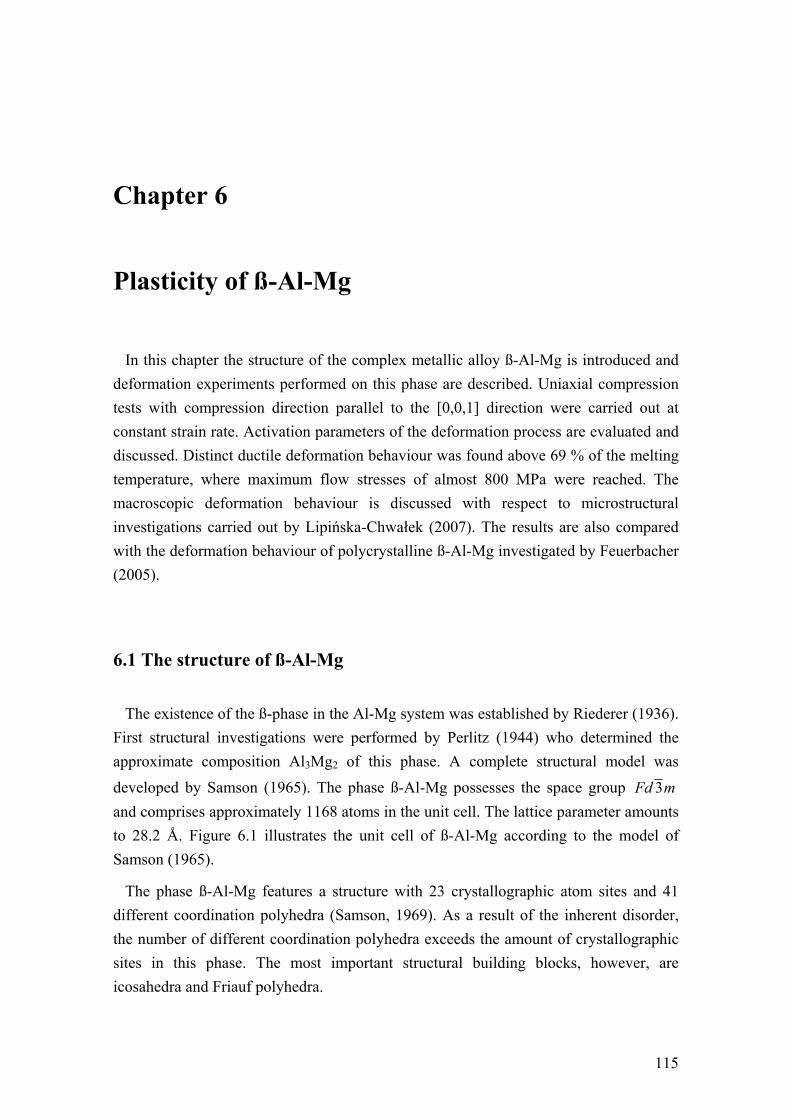
Chapter 6 Plasticity of ß-Al-Mg In this chapter the structure of the complex metallic alloy ß-Al-Mg is introduced and deformation experiments performed on this phase are described. Uniaxial compression tests with compression direction parallel to the [0,0,1] direction were carried out at constant strain rate. Activation parameters of the deformation process are evaluated and discussed. Distinct ductile deformation behaviour was found above 69 % of the melting temperature, where maximum flow stresses of almost 800 MPa were reached. The macroscopic deformation behaviour is discussed with respect to microstructural investigations carried out by Lipińska-Chwałek (2007). The results are also compared with the deformation behaviour of polycrystalline ß-Al-Mg investigated by Feuerbacher (2005).
6.1 The structure of ß-Al-Mg The existence of the ß-phase in the Al-Mg system was established by Riederer (1936). First structural investigations were performed by Perlitz (1944) who determined the approximate composition Al3Mg2 of this phase. A complete structural model was developed by Samson (1965). The phase ß-Al-Mg possesses the space group mFd 3 and comprises approximately 1168 atoms in the unit cell. The lattice parameter amounts to 28.2 Å. Figure 6.1 illustrates the unit cell of ß-Al-Mg according to the model of Samson (1965).
The phase ß-Al-Mg features a structure with 23 crystallographic atom sites and 41 different coordination polyhedra (Samson, 1969). As a result of the inherent disorder, the number of different coordination polyhedra exceeds the amount of crystallographic sites in this phase. The most important structural building blocks, however, are icosahedra and Friauf polyhedra.
115

6 Plasticity of ß-Al-Mg
A Friauf polyhedron can be regarded as a superposition of a truncated and a regular tetrahedron as illustrated in figure 6.2 (a) and (b). A wire model and a sphere model of a Friauf polyhedron are shown in (a) and (b), respectively. The atom sites are located at the vertices of the polyhedron. The truncated tetrahedron, consisting of 12 Al atoms, exhibits four triangular and four hexagonal faces. 4 Mg atoms of the regular tetrahedron are located at the centres of the hexagonal faces of the truncated tetrahedron1. The centre position of the polyhedron is occupied by a Mg atom. Five of these Friauf polyhedra can share hexagonal faces in order to form a larger structure complex consisting of 47 atoms, the VF-polyhedron (Samson, 1965). A VF-polyhedron is illustrated in figure 6.2 (c).
Figure 6.1: Unit cell of ß-Al-Mg according to the model of Samson (1965). Besides 672 icosahedra and 252 Friauf polyhedra the structure of ß-Al-Mg comprises 244 irregular polyhedra. Within the latter, the atomic coordination numbers range between 10 and 16. Icosahedra and Friauf polyhedra possess CN 12 and CN 16, respectively. All 672 atom sites with icosahedral coordination are occupied by Al atoms. Of the 48 residual Al atoms in the unit cell, 24 are coordinated by irregular 1 In the literature the Friauf polyhedron is sometimes characterized without the four atoms located at the centres of the hexagonal faces.
116
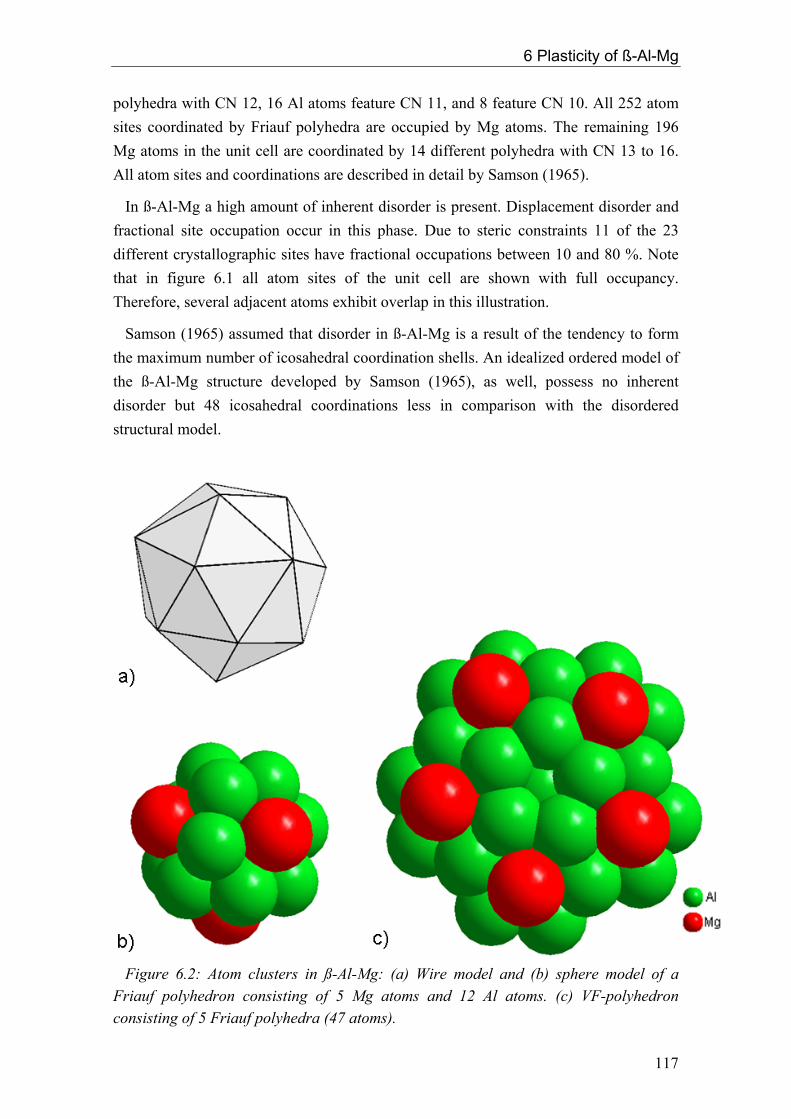
6 Plasticity of ß-Al-Mg
polyhedra with CN 12, 16 Al atoms feature CN 11, and 8 feature CN 10. All 252 atom sites coordinated by Friauf polyhedra are occupied by Mg atoms. The remaining 196 Mg atoms in the unit cell are coordinated by 14 different polyhedra with CN 13 to 16. All atom sites and coordinations are described in detail by Samson (1965).
In ß-Al-Mg a high amount of inherent disorder is present. Displacement disorder and fractional site occupation occur in this phase. Due to steric constraints 11 of the 23 different crystallographic sites have fractional occupations between 10 and 80 %. Note that in figure 6.1 all atom sites of the unit cell are shown with full occupancy. Therefore, several adjacent atoms exhibit overlap in this illustration.
Samson (1965) assumed that disorder in ß-Al-Mg is a result of the tendency to form the maximum number of icosahedral coordination shells. An idealized ordered model of the ß-Al-Mg structure developed by Samson (1965), as well, possess no inherent disorder but 48 icosahedral coordinations less in comparison with the disordered structural model.
Figure 6.2: Atom clusters in ß-Al-Mg: (a) Wire model and (b) sphere model of a Friauf polyhedron consisting of 5 Mg atoms and 12 Al atoms. (c) VF-polyhedron consisting of 5 Friauf polyhedra (47 atoms).
117

6 Plasticity of ß-Al-Mg
6.2 Macroscopic deformation behaviour Experimental details
ß-Al-Mg was grown by means of the Czochralski technique as described in chapter 2.2. A single crystal of about 3.2 cm3 in size was obtained. The material was characterized as described in chapter 2.3. Neither secondary phases nor grain boundaries were observed.
The crystal was oriented by Laue X-ray diffraction in back-reflection geometry. Rectangular deformation samples of about 1.6 x 1.6 x 4.5 mm3 in size were cut from the crystal by means of spark erosion. The long axis of the samples, i.e. the compression direction, as well as the side faces corresponded to <0,0,1> directions. All surfaces were carefully ground and polished in order to prevent crack formation at scratches. Care was taken to obtain flat and plan-parallel end faces in order to prevent inhomogeneous stress fields in the sample.
Uniaxial compression tests were carried out in a modified Zwick Z050 testing system under closed-loop control. The setup of this deformation machine is described in chapter 3.3. The deformation experiments were performed in air at temperatures between 200 and 375 °C and at constant strain rate of 10-4 s-1. Additional incremental tests, i.e. stress-relaxation tests and temperature changes, were performed as described in chapter 3.2. After deformation, the samples were rapidly unloaded and quenched on a cold metal plate in order to preserve the microstructural state.
Results
The stress-strain behaviour of ß-Al-Mg is shown in figure 6.3 at temperatures between 225 and 375 °C. Vertical dips in the stress-strain curves are due to incremental tests. Stress-relaxation experiments and a temperature-change cycle are labelled “R” and “TC”, respectively, in the stress-strain curve at 225 °C. Dashed lines in figure 6.3 indicate interpolated courses of the stress-strain curves. The deformation experiments were aborted at a total strain of 6 to 8 %.
At all temperatures the deformation behaviour shows a pronounced initial yield-point effect, i.e. an overshoot of the stress at the onset of plastic deformation. The magnitude of the yield drop, i.e. the difference between upper and lower yield points, ranges from 10 to 25 % of the lower yield stress and decreases with increasing temperature. Small yield-point effects are also observed after unloading of the samples during temperature-change experiments and after stress relaxations.
118
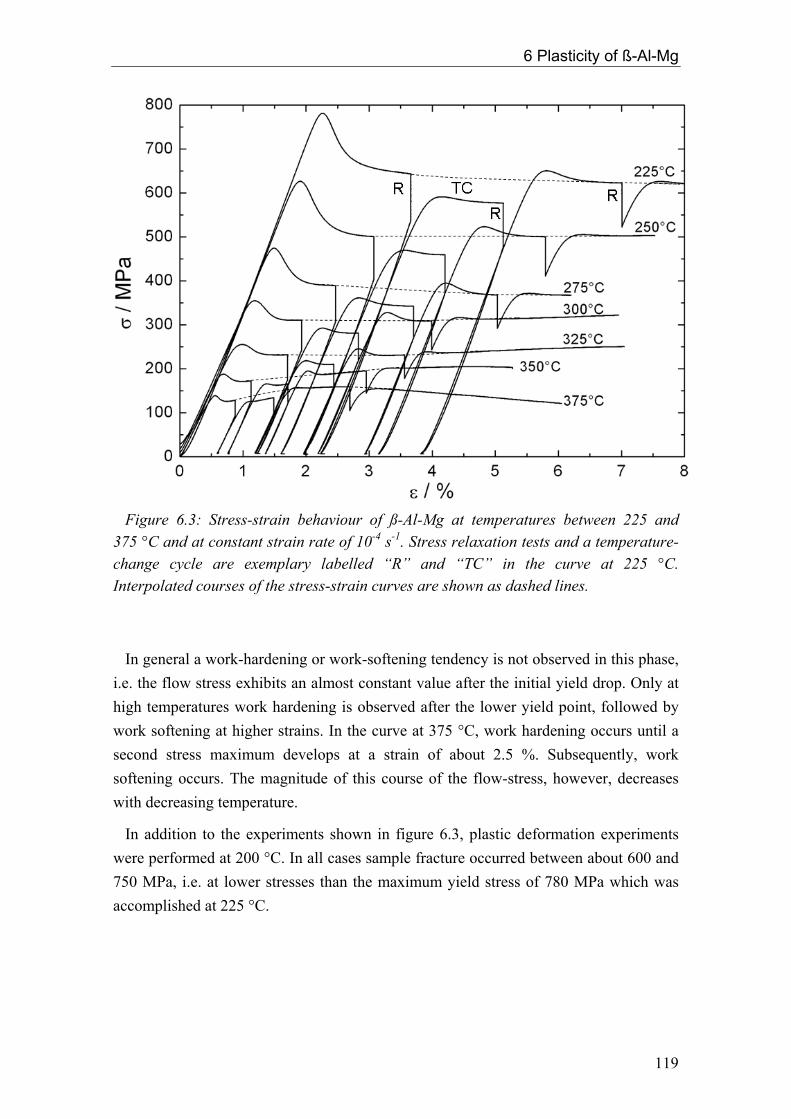
6 Plasticity of ß-Al-Mg
Figure 6.3: Stress-strain behaviour of ß-Al-Mg at temperatures between 225 and 375 °C and at constant strain rate of 10-4 s-1. Stress relaxation tests and a temperature-change cycle are exemplary labelled “R” and “TC” in the curve at 225 °C. Interpolated courses of the stress-strain curves are shown as dashed lines. In general a work-hardening or work-softening tendency is not observed in this phase, i.e. the flow stress exhibits an almost constant value after the initial yield drop. Only at high temperatures work hardening is observed after the lower yield point, followed by work softening at higher strains. In the curve at 375 °C, work hardening occurs until a second stress maximum develops at a strain of about 2.5 %. Subsequently, work softening occurs. The magnitude of this course of the flow-stress, however, decreases with decreasing temperature.
In addition to the experiments shown in figure 6.3, plastic deformation experiments were performed at 200 °C. In all cases sample fracture occurred between about 600 and 750 MPa, i.e. at lower stresses than the maximum yield stress of 780 MPa which was accomplished at 225 °C.
119
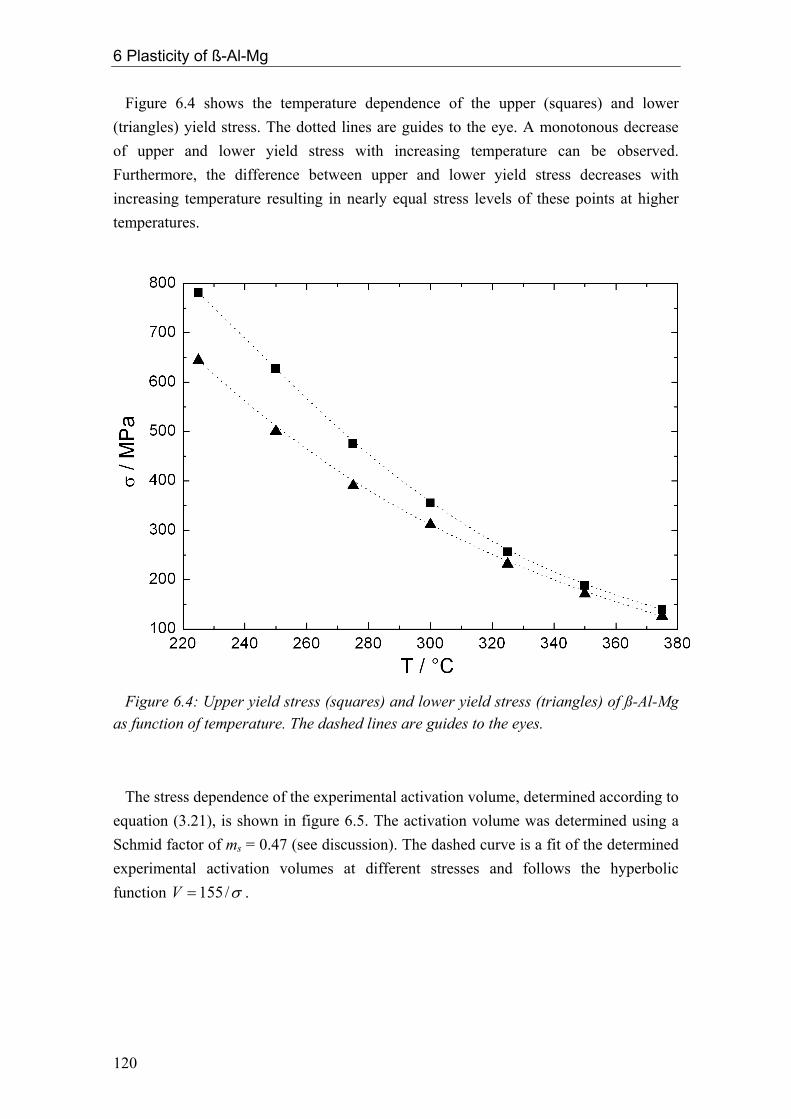
6 Plasticity of ß-Al-Mg
Figure 6.4 shows the temperature dependence of the upper (squares) and lower (triangles) yield stress. The dotted lines are guides to the eye. A monotonous decrease of upper and lower yield stress with increasing temperature can be observed. Furthermore, the difference between upper and lower yield stress decreases with increasing temperature resulting in nearly equal stress levels of these points at higher temperatures.
Figure 6.4: Upper yield stress (squares) and lower yield stress (triangles) of ß-Al-Mg as function of temperature. The dashed lines are guides to the eyes. The stress dependence of the experimental activation volume, determined according to equation (3.21), is shown in figure 6.5. The activation volume was determined using a Schmid factor of ms = 0.47 (see discussion). The dashed curve is a fit of the determined experimental activation volumes at different stresses and follows the hyperbolic function σ/155=V .
120

6 Plasticity of ß-Al-Mg
Figure 6.5: Activation volume V of ß-Al-Mg, evaluated from stress-relaxation experiments, as function of stress σ. The dashed curve is a fit of the data and follows the hyperbolic function σ/155=V .
The activation enthalpy ΔH, calculated according to equation (3.19), is shown in figure 6.6 as function of temperature (squares). The values range between 1.8 and 2.6 eV. A linear fit, featuring a slope of 4.2 meV/°C, is shown as solid line.
Extrapolation of the activation enthalpy to the absolute zero point of temperature fulfils the condition (Gibbs, 1969) within the accuracy of measurement.
The work term ΔW, corresponding to the part of the energy which is supplied by the applied stress, is calculated according to equation (3.14). In figure 6.6 it is shown as circles and amounts to about 0.4 eV. The work term is almost constant in the observed temperature range.
( ) 00 ==Δ TH
121
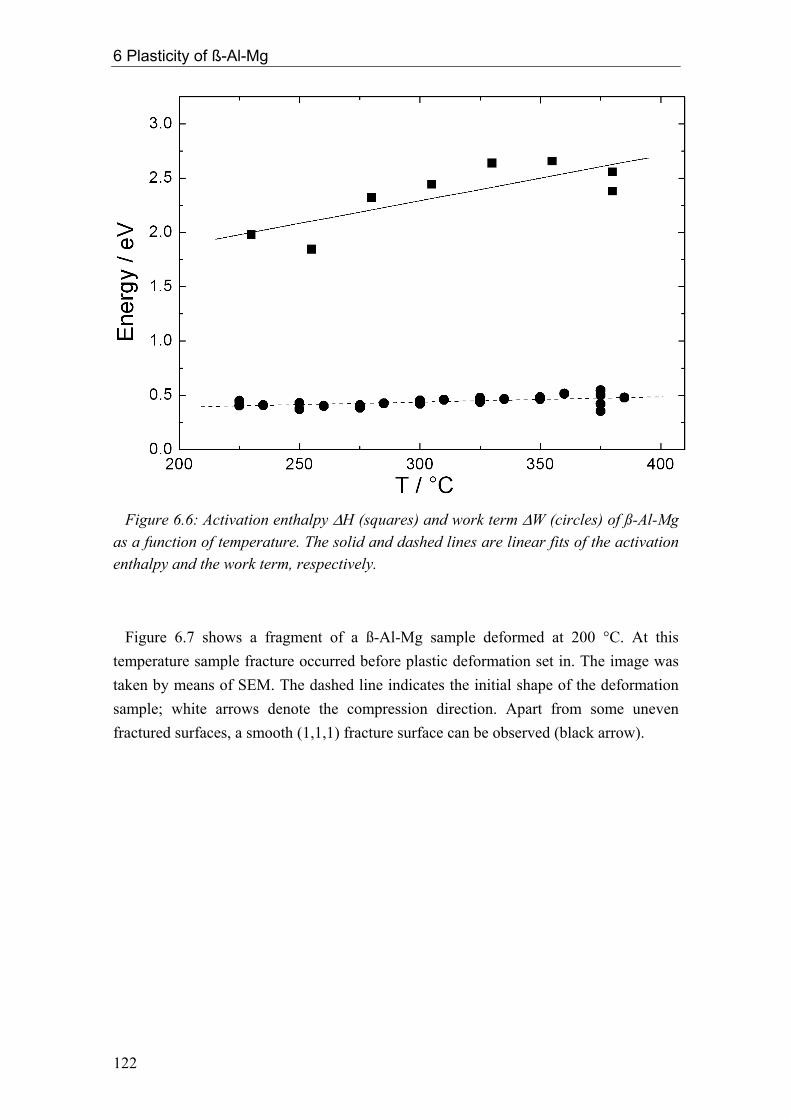
6 Plasticity of ß-Al-Mg
Figure 6.6: Activation enthalpy ΔH (squares) and work term ΔW (circles) of ß-Al-Mg as a function of temperature. The solid and dashed lines are linear fits of the activation enthalpy and the work term, respectively. Figure 6.7 shows a fragment of a ß-Al-Mg sample deformed at 200 °C. At this temperature sample fracture occurred before plastic deformation set in. The image was taken by means of SEM. The dashed line indicates the initial shape of the deformation sample; white arrows denote the compression direction. Apart from some uneven fractured surfaces, a smooth (1,1,1) fracture surface can be observed (black arrow).
122
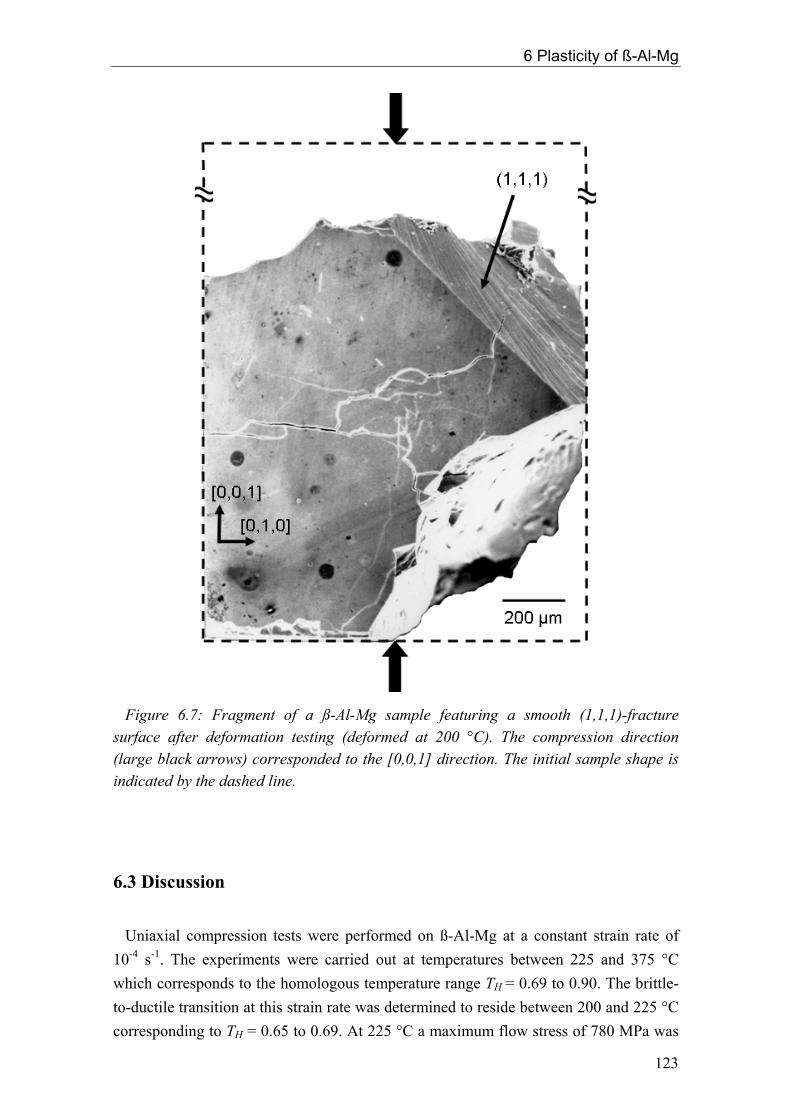
6 Plasticity of ß-Al-Mg
Figure 6.7: Fragment of a ß-Al-Mg sample featuring a smooth (1,1,1)-fracture surface after deformation testing (deformed at 200 °C). The compression direction (large black arrows) corresponded to the [0,0,1] direction. The initial sample shape is indicated by the dashed line.
6.3 Discussion Uniaxial compression tests were performed on ß-Al-Mg at a constant strain rate of 10-4 s-1. The experiments were carried out at temperatures between 225 and 375 °C which corresponds to the homologous temperature range TH = 0.69 to 0.90. The brittle-to-ductile transition at this strain rate was determined to reside between 200 and 225 °C corresponding to TH = 0.65 to 0.69. At 225 °C a maximum flow stress of 780 MPa was
123
6 Plasticity of ß-Al-Mg
measured. This value is considerably higher than the values found for commercial polycrystalline Al-Mg alloys used in technical applications. For these alloys, which have Al contents between 90 and 99 at.%, fracture stresses up to about 300 MPa (e.g. Dorn et al. 1950, Nakayama et al. 1996, Verdier et al. 1999) are found.
By means of incremental tests, thermodynamic activation parameters of the deformation process of single crystalline ß-Al-Mg were determined. The activation enthalpy ΔH (figure 6.7) is larger than the work term ΔW by about a factor of six which indicates that the deformation process is thermally activated. In the investigated temperature range, the activation enthalpy averages ΔH = 2.3 eV. The activation enthalpy shows proportional temperature dependence. According to Gibbs (1969) this indicates that the deformation behaviour is controlled by a single thermally-activated process.
In the literature no values of the diffusion enthalpy of ß-Al-Mg are reported. For an estimate consider the diffusion parameters of pure Al and pure Mg, which amount to 1.28 eV (Messer et al., 1974) and 1.40 eV (Shewmon, 1956), respectively. Values for other Al-Mg alloys range between 1.2 and 1.33 eV (Stoebe et al., 1965). Assuming that the diffusion enthalpy for β-Al-Mg compares to these values, a deviation between the activation enthalpy and the diffusion enthalpy is observed. It is concluded that the rate-controlling deformation mechanism is not provided by a diffusion process.
The activation volume of ß-Al-Mg is of the same order of magnitude as the values in other CMA phases (cf. chapter 7). A value of V = 0.5 nm3 is observed at a moderate stress of 300 MPa. Scaled by the atomic volume Va, i.e. the average volume per atom in the unit cell, it amounts to V/Va = 27.
This value is significantly larger than unity but of the same order of magnitude as the number of atoms in present clusters, i.e. icosahedra, Friauf polyhedra, and VF-polyhedra. These clusters can act as obstacles for dislocation motion and can therefore cause the large value of the activation volume. The rate-controlling process of dislocation motion can be provided by the interaction of dislocations with the cluster substructure as demonstrated for ξ’-Al-Pd-Mn by Feuerbacher et al. (2001). Friction between dislocations and the cluster substructure is also assumed as rate-controlling factors for dislocation motion in µ-Al-Mn and Mg32(Al,Zn)49 (chapter 4 and 5), respectively.
The plastic deformation behaviour of ß-Al-Mg single crystals reveals clear differences to the plasticity of polycrystalline ß-Al-Mg investigated by Feuerbacher (2005). Figure 6.8 shows stress-strain curves of single crystalline (blue) and polycrystalline (red) ß-Al-Mg deformed at 325 °C at constant strain rate of 10-4 s-1. The same sequence of incremental tests, as conducted on single crystalline samples (cf. chapter 3.2), was performed during deformation experiments on polycrystalline ß-Al-Mg. Hence, vertical
124
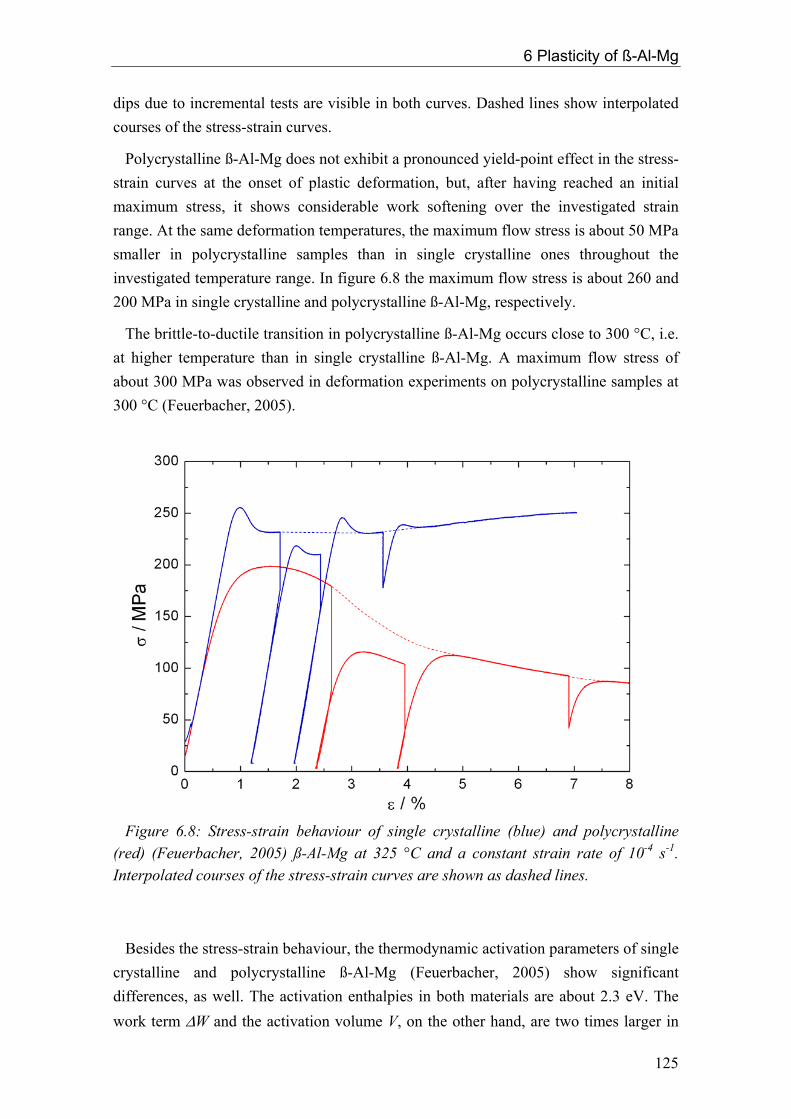
6 Plasticity of ß-Al-Mg
dips due to incremental tests are visible in both curves. Dashed lines show interpolated courses of the stress-strain curves.
Polycrystalline ß-Al-Mg does not exhibit a pronounced yield-point effect in the stress-strain curves at the onset of plastic deformation, but, after having reached an initial maximum stress, it shows considerable work softening over the investigated strain range. At the same deformation temperatures, the maximum flow stress is about 50 MPa smaller in polycrystalline samples than in single crystalline ones throughout the investigated temperature range. In figure 6.8 the maximum flow stress is about 260 and 200 MPa in single crystalline and polycrystalline ß-Al-Mg, respectively.
The brittle-to-ductile transition in polycrystalline ß-Al-Mg occurs close to 300 °C, i.e. at higher temperature than in single crystalline ß-Al-Mg. A maximum flow stress of about 300 MPa was observed in deformation experiments on polycrystalline samples at 300 °C (Feuerbacher, 2005).
Figure 6.8: Stress-strain behaviour of single crystalline (blue) and polycrystalline (red) (Feuerbacher, 2005) ß-Al-Mg at 325 °C and a constant strain rate of 10-4 s-1. Interpolated courses of the stress-strain curves are shown as dashed lines. Besides the stress-strain behaviour, the thermodynamic activation parameters of single crystalline and polycrystalline ß-Al-Mg (Feuerbacher, 2005) show significant differences, as well. The activation enthalpies in both materials are about 2.3 eV. The work term ΔW and the activation volume V, on the other hand, are two times larger in
125

6 Plasticity of ß-Al-Mg
single crystalline ß-Al-Mg. This gives rise to the assumption that different kinds of obstacles for dislocation motion are present in single- and polycrystalline ß-Al-Mg.
In addition, the significantly different courses of the stress-strain curves indicate that different processes contribute to the deformation mechanisms. In polycrystalline ß-Al-Mg, for example, grain boundary sliding may take place or grain boundaries may act as sources and sinks for dislocations. It is frequently observed that grain boundaries act as obstacles for dislocation motion and hence cause increased flow stresses in polycrystalline materials. The relationship between the yield strength in polycrystals σp and single crystals σs is given by the Hall-Petch equation (e.g. Gottstein, 1998):
Dk ysp += σσ , where ky is the material specific Hall-Petch coefficient and D is the
average grain diameter. Since , this relation implies that the yield strength of
polycrystalline samples is generally larger than that of single crystalline samples.
0>yk
In ß-Al-Mg, however, lower yield stresses occur in polycrystalline samples. This fact suggests that impediment of dislocation motion by grain boundaries has a negligible influence on the deformation process of this phase.
In single crystalline ß-Al-Mg, microstructural investigations performed by Lipińska-Chwałek (2007) reveal that plastic deformation is mediated by dislocation motion. The dislocations generate stacking faults during motion and are hence considered as partial dislocation. Two different mechanisms contribute to the deformation process in ß-Al-Mg. Dislocation motion takes place on 1,1,1 and on (0,0,1) planes and, correspondingly, stacking faults with normal vectors parallel to <1,1,1> and [0,0,1] directions are observed.
It was found by means of contrast-extinction experiments in TEM that the Burgers
vectors of dislocations with 1,1,1 habit planes are oriented parallel to >< 2,1,1
directions (Lipińska-Chwałek, 2007). Dislocations with (0,0,1) habit planes possess Burgers vectors parallel to [0,0,1]. The Burgers vector is oriented perpendicular to the line direction in both cases, i.e. the investigated dislocation segments feature pure edge character. The mode of dislocation motion is slip on 1,1,1 planes and is climb on (0,0,1) planes. The climb mechanism on (0,0,1) planes can contribute to the deformation process by removing atomic layers with normal vector parallel to the compression direction. Closely related climb mechanisms including dislocations with Burgers vector parallel to the compression direction are observed in µ-Al-Mn (chapter 4) and Mg32(Al,Zn)49 (chapter 5), as well.
The observed slip systems in ß-Al-Mg (Lipińska-Chwałek, 2007) are
in good accordance with the appearance of the deformation-sample fragment shown in figure 6.7. This SEM image shows a smooth fracture surface of the deformation sample corresponding to a (1,1,1) plane.
>< 2,1,11,1,1
126

6 Plasticity of ß-Al-Mg
The climb mechanism on (0,0,1) planes, however, is assumed to play only a marginal role in the deformation behaviour of ß-Al-Mg. As described above, the magnitude and the temperature dependence of the activation enthalpy (figure 6.6) indicate that a single thermally-activated mechanism, which is not rate-controlled by lattice diffusion, governs the deformation process. Furthermore, the climb mechanism corresponds to positive climb and acts as sink for vacancies. This can cause a decrease of the vacancy concentration. No specific mechanisms (besides thermal vacancy formation) are present which act as source for vacancies, as it is the case in µ-Al-Mn and Mg32(Al,Zn)49. The dislocation-climb mechanism on (0,0,1) planes may hence be hampered by a lack of vacancies if the vacancy concentration decreases during plastic deformation.
On the basis of these facts it is assumed that the slip mechanism with 1,1,1<1,1,2> slip systems is the primary process of plastic deformation in ß-Al-Mg. This mechanism is hence considered in the determination of the Schmid factor for the thermodynamic activation analysis. Investigations on the densities of the two observed dislocation types in deformed ß-Al-Mg may deliver further clues on the contribution of the mechanisms to the deformation process.
127

6 Plasticity of ß-Al-Mg
128

Chapter 7 Comprehensive discussion: Plasticity of CMAs In this thesis the plasticity of the three CMA phases µ-Al-Mn, Mg32(Al,Zn)49, and ß-Al-Mg is studied. Only few examples of investigations on the plasticity of CMAs, the phases ξ’-Al-Pd-Mn and Al13Co4, are given in the literature. Together with the phases investigated in the present thesis, now a basic set of materials is given representing the most important crystal lattices in the class of CMAs, i.e. body-centred cubic (Mg32(Al,Zn)49), face-centred cubic (ß-Al-Mg), hexagonal close-packed (µ-Al-Mn), and orthorhombic (ξ’-Al-Pd-Mn, Al13Co4). In this chapter, the results of investigations on µ-Al-Mn, Mg32(Al,Zn)49, ß-Al-Mg, ξ’-Al-Pd-Mn, and o-Al13Co4 are summarized and compared in order to gain an overview of the plastic deformation behaviour of CMAs and to find possible general characteristics in the plasticity of this materials class.
7.1 Macroscopic deformation behaviour of CMAs Stress-strain behaviour
All CMA phases investigated are brittle at room temperature and ductile at elevated temperatures. The brittle-to-ductile transition occurs at about TH = 0.82 (at
, 0.78, and 0.65 (both at for µ-Al-Mn, Mg)10 15 −−= sε& )10 14 −−= sε& 32(Al,Zn)49, and ß-
Al-Mg, respectively. Thermodynamic activation analyses of the deformation processes reveal that the underlying mechanism in these phases is thermally activated.
The macroscopic deformation behaviour of ξ’-Al-Pd-Mn and Al13Co4 (Feuerbacher et al., 2001, Heggen et al., 2007) is similar to that of µ-Al-Mn, Mg32(Al,Zn)49, and ß-Al-Mg. These materials also possess a thermally-activated deformation mechanism and a brittle-to-ductile transition close to TH = 0.82 (at ε& = 10-5 s-1) and TH = 0.64 (at
, respectively. The upper-yield stress observed for these phases is about )10 14 −−= sε&
129

7 Comprehensive discussion: Plasticity of CMAs
500 MPa for µ-Al-Mn , Mg)10( 15 −−= sε& 32(Al,Zn)49 ) , and ξ’-Al-Pd-Mn
and about 800 MPa for ß-Al-Mg and Al
10( 14 −−= sε&
)10( 14 −−= sε& )10( 14 −−= sε& 13Co4
. )10( 15 −−= sε&
None of the discussed CMA phases exhibits a distinct tendency to work hardening or work softening during deformation. Significant deviations from a constant flow stress at higher strains are only reported for ξ’-Al-Pd-Mn at temperatures close to the brittle-to-ductile transition (Feuerbacher et al., 2001). At 650 °C in this phase, for example, work hardening is observed to a strain of about 3 % followed by a work-softening regime.
The phase ξ’-Al-Pd-Mn also represents an exception in the class of CMAs concerning the initial yield-point effect. During compression, µ-Al-Mn, Mg32(Al,Zn)49, ß-Al-Mg, and Al13Co4 show pronounced overshoots of the stress at the onset of plastic deformation. The highest yield drops range from 15 % of the upper-yield stress in the Bergman phase up to 50 % in µ-Al-Mn. In ξ’-Al-Pd-Mn, however, yield drops are not pronounced and amount to less than 3 % of the upper-yield stress (Feuerbacher et al., 2001).
After incremental tests pronounced yield-point effects are only observed in the phase Al13Co4 (Heggen et al., 2007). The stress overshoots exhibit a similar magnitude as the initial yield-point effect at the onset of plastic deformation. The presence of yield-point effects after incremental tests can be attributed to recovery of dislocations during unloading of the samples (Hull and Bacon, 1984). According to this interpretation, significant recovery during unloading takes place in Al13Co4 in contrast to the phases µ-Al-Mn, Mg32(Al,Zn)49, ß-Al-Mg, and ξ’-Al-Pd-Mn, which do not show distinct yield-point effects after relaxation tests or unloading of deformation samples.
The characteristics discussed above are consistent, besides few exceptions, in all investigated CMAs. It may be concluded that these features, i.e. the thermally-activated deformation mechanism, the brittle-to-ductile transition above TH = 0.6, the absence of pronounced work hardening or -softening, the presence of a yield-point effect at the onset of plastic deformation, and the low rate of dislocation recovery, are prevalent attributes in the class of CMA phases.
130

7 Comprehensive discussion: Plasticity of CMAs
Activation volume
The activation volume of all CMAs discussed in this chapter, scaled by the respective atomic volume Va (i.e. the average volume per atom in the unit cell), is significantly larger than unity. The activation volumes differ, but are of the same order of magnitude, amounting to some tens of the corresponding atomic volumes. At a moderate stress of 300 MPa these values1 are V/Va = 20 (µ-Al-Mn), 27 (ß-Al-Mg), 30 (ξ’-Al-Pd-Mn, Feuerbacher et al., 2001), 40 (Mg32(Al,Zn)49), and 53 (Al13Co4, Heggen et al., 2007).
According to Krausz and Eyring (1975), the activation volume V of thermally activated deformation processes approximately reflects the size of the obstacles limiting dislocation motion. Possible obstacles in the CMA phases which can cause the large activation volumes are provided by the cluster substructure present in CMAs (cf. chapter 1).
The plasticity of icosahedral Al-Pd-Mn was described by Feuerbacher et al. (1997) in terms of the cluster friction model, which relates the macroscopic deformation behaviour to the interaction of dislocations with local clusters. Icosahedral Al-Pd-Mn possess atom clusters which are closely related to those present in CMAs and, additionally, the activation volume found for icosahedral Al-Pd-Mn (Feuerbacher et al., 1997) is of the same order of magnitude as the activation volumes of the CMA phases discussed in this chapter. Accordingly, the fact that the activation volumes of the CMA phases are significantly larger than the atomic volumes and the similarity of their cluster substructures to that of icosahedral Al-Pd-Mn can be taken as indication that the plastic deformation processes in the CMAs are also related to the cluster substructure and that the interaction of dislocations with these clusters provides the rate-controlling process.
Especially icosahedral atom coordinations, existent in all phases described above, form very stable structure elements which may act as obstacles for dislocation motion. In case of ξ’-Al-Pd-Mn Feuerbacher et al. (2001) have argued that the rate-controlling mechanism for dislocation motion is given by the interaction of dislocations with atom clusters, which act as extended obstacles.
The friction between dislocations and the cluster substructure is therefore assumed to be a basic feature in the deformation behaviour of CMA phases.
1 Note that the activation volume possesses hyperbolic stress dependence. The given volumes are guide values at a medium stress.
131

7 Comprehensive discussion: Plasticity of CMAs
7.2 Microstructural aspects In the following section, the microstructural mechanisms which contribute to the plastic deformation processes of the phases µ-Al-Mn, Mg32(Al,Zn)49, ß-Al-Mg, ξ’-Al-Pd-Mn, and Al13Co4 are summarized and compared.
The microstructural deformation behaviour of µ-Al-Mn and Mg32(Al,Zn)49 was investigated in the present work. The results are discussed in detail in chapter 4.4 and 5.4, respectively. In addition, the microstructural deformation behaviour of the CMA phases ξ’-Al-Pd-Mn (Klein et al., 1999, Feuerbacher and Caillard, 2004), Al13Co4 (Heggen et al., 2007), and ß-Al-Mg (Lipińska-Chwałek, 2007) was examined until now.
All investigations reveal that the plasticity of these phases is mediated by dislocation motion. The involved dislocations consistently are partial dislocations, i.e. their Burgers-vector length corresponds to a fraction of the lattice periodicity. The appearance of partial dislocations in CMA phases is in accordance with the considerations concerning the elastic line energy of the dislocations, described in chapter 1.2. Due to the large translational invariant distances in CMAs, and since the elastic line energy of a dislocation is proportional to the square of its Burgers-vector length (Hirth and Lothe, 1992), the Burgers vectors of perfect dislocations would lead to unfavourably high elastic-line energies of the dislocations. Physically more reasonable values occur in case of partial dislocations which feature shorter Burgers vectors.
The motion of partial dislocations, however, introduces planar defects into the crystal structure. Stacking faults are accordingly observed in all deformed CMA phases.
Metadislocations
In ξ’-Al-Pd-Mn and Al13Co4 a novel type of defect, the metadislocation, is observed (Klein et al., 1999, Heggen et al., 2007). A metadislocation consists of a core region and an associated region where the phase is structurally modified. The motion of metadislocations in ξ’-Al-Pd-Mn and Al13Co4 is not accompanied by the introduction of conventional stacking faults with a displacement at a sharp interface, but by slabs of structurally related phases. The core is a line defect which ideally extends along the [0,1,0] and the [1,0,0] direction in ξ’-Al-Pd-Mn and Al13Co4, respectively.
The motion of the dislocation core causes a local phase transformation to a phase which is structurally related to the matrix. The core region comprises structural features of both phases. In case of ξ’-Al-Pd-Mn a phase transformation to Ψ-Al-Pd-Mn takes place (Klein et al., 1999), while in case of Al13Co4 motion of metadislocations is
132
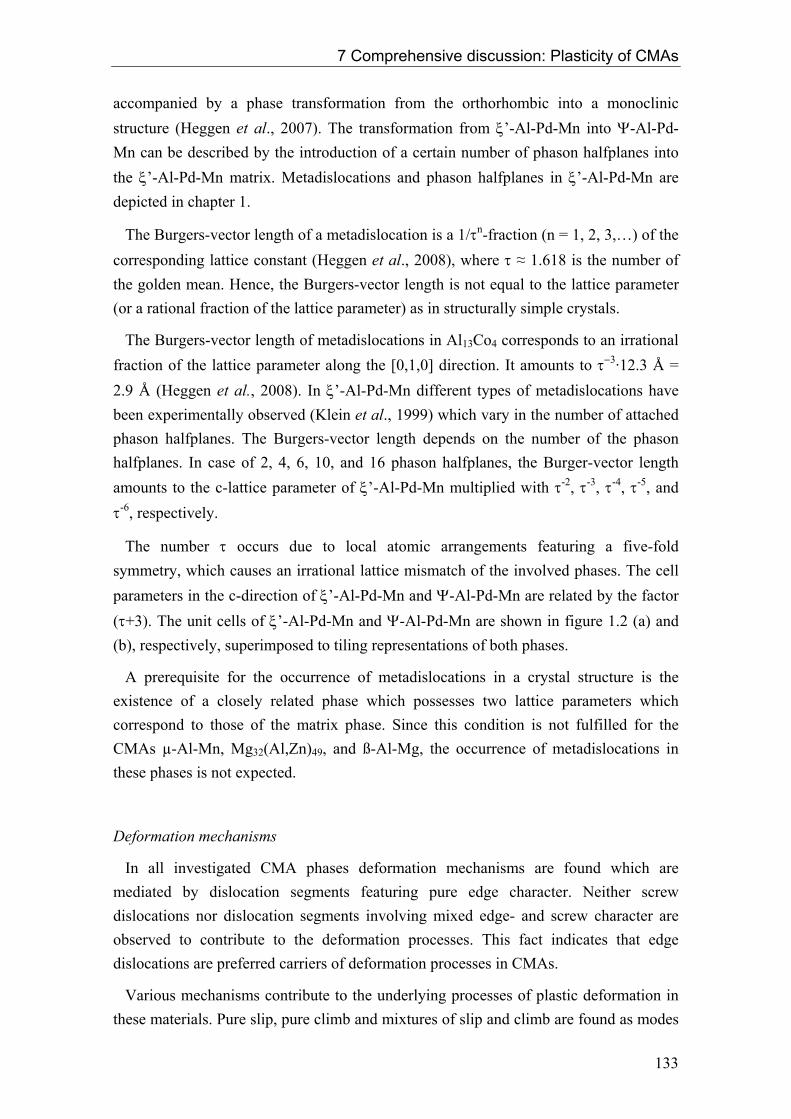
7 Comprehensive discussion: Plasticity of CMAs
accompanied by a phase transformation from the orthorhombic into a monoclinic structure (Heggen et al., 2007). The transformation from ξ’-Al-Pd-Mn into Ψ-Al-Pd-Mn can be described by the introduction of a certain number of phason halfplanes into the ξ’-Al-Pd-Mn matrix. Metadislocations and phason halfplanes in ξ’-Al-Pd-Mn are depicted in chapter 1.
The Burgers-vector length of a metadislocation is a 1/τn-fraction (n = 1, 2, 3,…) of the corresponding lattice constant (Heggen et al., 2008), where τ ≈ 1.618 is the number of the golden mean. Hence, the Burgers-vector length is not equal to the lattice parameter (or a rational fraction of the lattice parameter) as in structurally simple crystals.
The Burgers-vector length of metadislocations in Al13Co4 corresponds to an irrational fraction of the lattice parameter along the [0,1,0] direction. It amounts to τ−3·12.3 Å = 2.9 Å (Heggen et al., 2008). In ξ’-Al-Pd-Mn different types of metadislocations have been experimentally observed (Klein et al., 1999) which vary in the number of attached phason halfplanes. The Burgers-vector length depends on the number of the phason halfplanes. In case of 2, 4, 6, 10, and 16 phason halfplanes, the Burger-vector length amounts to the c-lattice parameter of ξ’-Al-Pd-Mn multiplied with τ-2, τ-3, τ-4, τ-5, and τ-6, respectively.
The number τ occurs due to local atomic arrangements featuring a five-fold symmetry, which causes an irrational lattice mismatch of the involved phases. The cell parameters in the c-direction of ξ’-Al-Pd-Mn and Ψ-Al-Pd-Mn are related by the factor (τ+3). The unit cells of ξ’-Al-Pd-Mn and Ψ-Al-Pd-Mn are shown in figure 1.2 (a) and (b), respectively, superimposed to tiling representations of both phases.
A prerequisite for the occurrence of metadislocations in a crystal structure is the existence of a closely related phase which possesses two lattice parameters which correspond to those of the matrix phase. Since this condition is not fulfilled for the CMAs µ-Al-Mn, Mg32(Al,Zn)49, and ß-Al-Mg, the occurrence of metadislocations in these phases is not expected.
Deformation mechanisms
In all investigated CMA phases deformation mechanisms are found which are mediated by dislocation segments featuring pure edge character. Neither screw dislocations nor dislocation segments involving mixed edge- and screw character are observed to contribute to the deformation processes. This fact indicates that edge dislocations are preferred carriers of deformation processes in CMAs.
Various mechanisms contribute to the underlying processes of plastic deformation in these materials. Pure slip, pure climb and mixtures of slip and climb are found as modes
133

7 Comprehensive discussion: Plasticity of CMAs
of dislocation motion. Rather conventional processes, processes which are rarely observed in structurally simple materials, as well as novel processes of plastic deformation occur in CMAs. The various deformation mechanisms of the different phases investigated in the present work and reported in the literature are summarized in table 7.1. The crystal systems of the materials and the deformation geometry of the performed experiments are also given.
The microstructural deformation mechanisms are schematically illustrated in figure 7.1 (a-e). The deformation direction is denoted by grey arrows. Coloured lines indicate planar defects and coloured arrows indicate the Burgers vectors of the dislocations (); green, red and blue refers to pure climb, pure slip and mixed climb and slip of dislocations, respectively. The direction of dislocation motion is denoted by black arrows. The green planes in (a) and (c) correspond to planar defects which are terminated by dislocation loops and which lie within the paper plane.
Phase Crystal system Compression direction
Mode of dislocation motion and orientation of habit planes
µ-Al-Mn (this work)
Hexagonal [0,0,1] Climb on (0,0,1) planes Climb on 1,0,0 and 0,1,1 planes
Mg32(Al,Zn)49 (this work)
Cubic [0,0,1] Climb on (0,0,1) planes Slip/Climb on (1,0,0) planes Slip/Climb on planes )1,0,1( ±
ξ’-Al-Pd-Mn (Klein et al., 1999, Feuerbacher and Caillard, 2004)
Orthorhombic various Climb of metadislocations on (0,0,1) planes Climb on (0,1,0) planes
Al13Co4(Heggen et al., 2007)
Orthorhombic inclined 45° to [1,0,0]
Slip of metadislocations on (0,0,1) planes
ß-Al-Mg Cubic [0,0,1] Slip on 1,1,1 planes Climb on (0,0,1) planes (Lipińska-Chwałek,
2007, this work)
Table 7.1: Crystal systems, deformation geometry, and microstructural deformation mechanisms of different CMA phases.
134
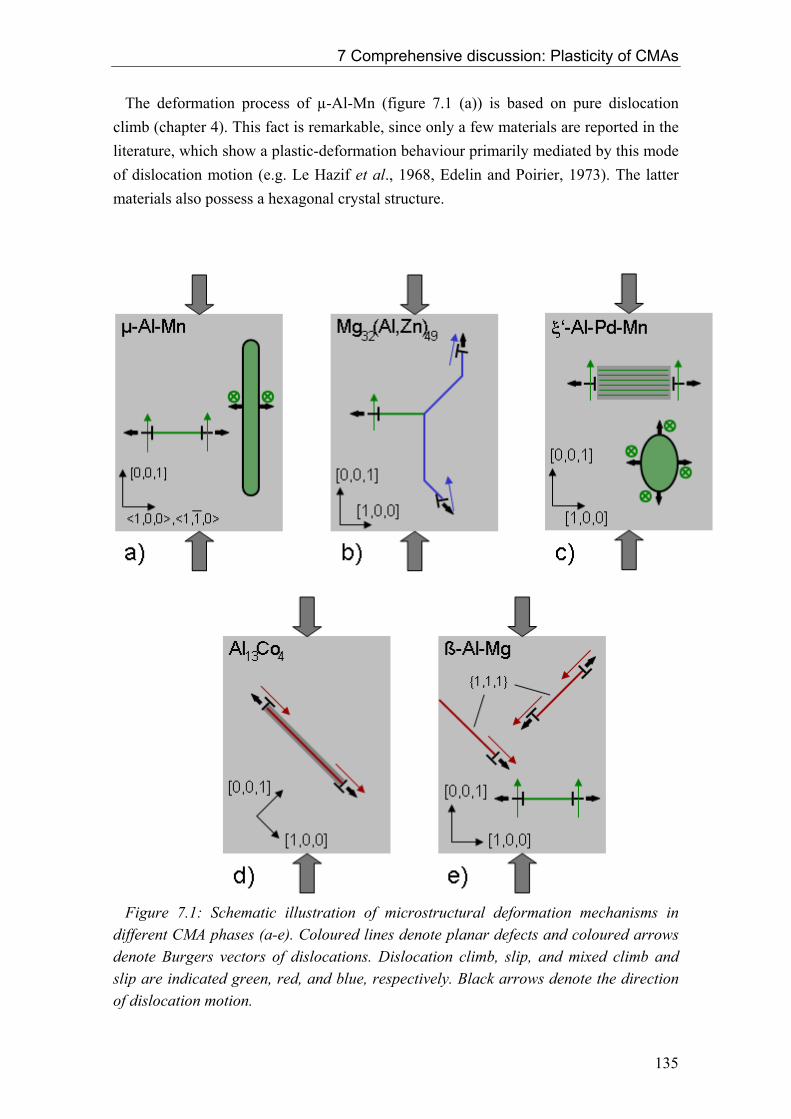
7 Comprehensive discussion: Plasticity of CMAs
The deformation process of µ-Al-Mn (figure 7.1 (a)) is based on pure dislocation climb (chapter 4). This fact is remarkable, since only a few materials are reported in the literature, which show a plastic-deformation behaviour primarily mediated by this mode of dislocation motion (e.g. Le Hazif et al., 1968, Edelin and Poirier, 1973). The latter materials also possess a hexagonal crystal structure.
Figure 7.1: Schematic illustration of microstructural deformation mechanisms in different CMA phases (a-e). Coloured lines denote planar defects and coloured arrows denote Burgers vectors of dislocations. Dislocation climb, slip, and mixed climb and slip are indicated green, red, and blue, respectively. Black arrows denote the direction of dislocation motion.
135
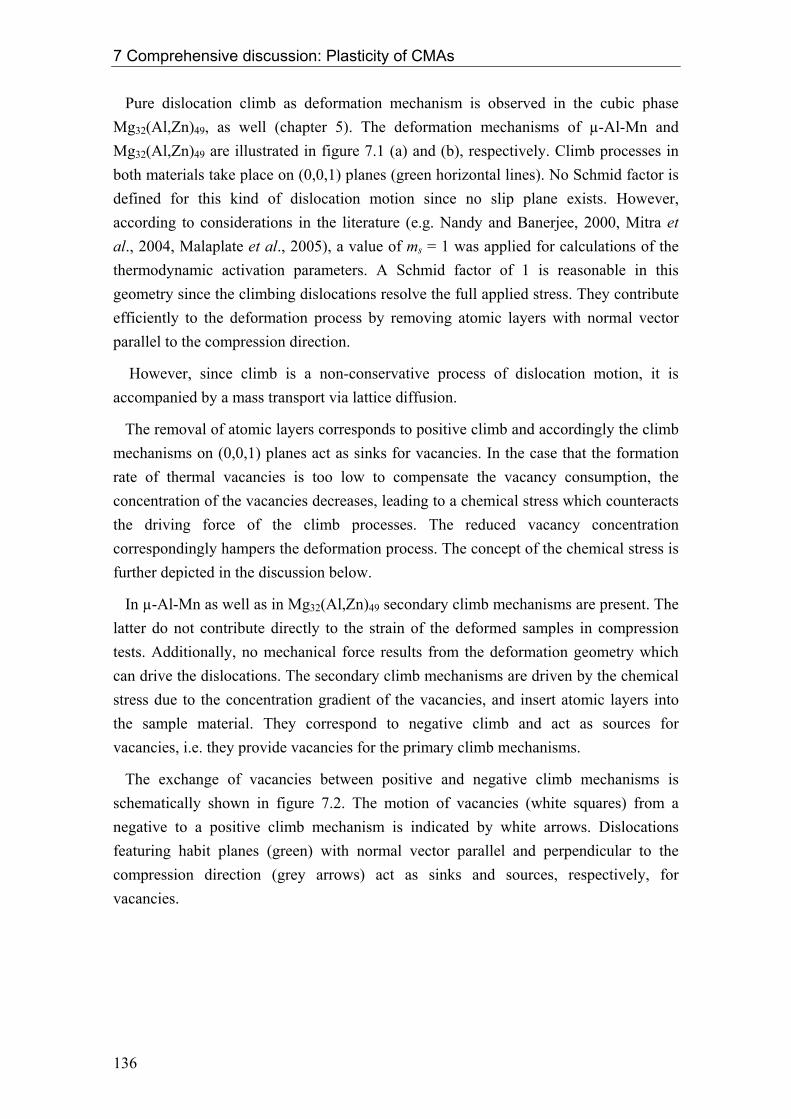
7 Comprehensive discussion: Plasticity of CMAs
Pure dislocation climb as deformation mechanism is observed in the cubic phase Mg32(Al,Zn)49, as well (chapter 5). The deformation mechanisms of µ-Al-Mn and Mg32(Al,Zn)49 are illustrated in figure 7.1 (a) and (b), respectively. Climb processes in both materials take place on (0,0,1) planes (green horizontal lines). No Schmid factor is defined for this kind of dislocation motion since no slip plane exists. However, according to considerations in the literature (e.g. Nandy and Banerjee, 2000, Mitra et al., 2004, Malaplate et al., 2005), a value of ms = 1 was applied for calculations of the thermodynamic activation parameters. A Schmid factor of 1 is reasonable in this geometry since the climbing dislocations resolve the full applied stress. They contribute efficiently to the deformation process by removing atomic layers with normal vector parallel to the compression direction.
However, since climb is a non-conservative process of dislocation motion, it is accompanied by a mass transport via lattice diffusion.
The removal of atomic layers corresponds to positive climb and accordingly the climb mechanisms on (0,0,1) planes act as sinks for vacancies. In the case that the formation rate of thermal vacancies is too low to compensate the vacancy consumption, the concentration of the vacancies decreases, leading to a chemical stress which counteracts the driving force of the climb processes. The reduced vacancy concentration correspondingly hampers the deformation process. The concept of the chemical stress is further depicted in the discussion below.
In µ-Al-Mn as well as in Mg32(Al,Zn)49 secondary climb mechanisms are present. The latter do not contribute directly to the strain of the deformed samples in compression tests. Additionally, no mechanical force results from the deformation geometry which can drive the dislocations. The secondary climb mechanisms are driven by the chemical stress due to the concentration gradient of the vacancies, and insert atomic layers into the sample material. They correspond to negative climb and act as sources for vacancies, i.e. they provide vacancies for the primary climb mechanisms.
The exchange of vacancies between positive and negative climb mechanisms is schematically shown in figure 7.2. The motion of vacancies (white squares) from a negative to a positive climb mechanism is indicated by white arrows. Dislocations featuring habit planes (green) with normal vector parallel and perpendicular to the compression direction (grey arrows) act as sinks and sources, respectively, for vacancies.
136
7 Comprehensive discussion: Plasticity of CMAs
Figure 7.2: Schematic illustration of vacancy exchange between complementary climb systems. Dislocations and vacancies are shown black and white, respectively. Stacking faults generated by dislocation motion (black arrows) are indicated green.
These complementary climb systems (Feuerbacher, 2007) ensure short diffusion distances for vacancies in µ-Al-Mn and Mg32(Al,Zn)49. In case of µ-Al-Mn it is estimated in chapter 4.4 that the approximate diffusion range under the applied experimental deformation conditions is of the same order of magnitude as the distance between the two dislocation types of the complementary climb systems. The distance between dislocations and the sample surface, on the other hand, which corresponds to the necessary vacancy-diffusion range for dislocation climb if no vacancy exchange between the dislocation types would take place, is about three orders of magnitude larger. This indicates that the secondary climb mechanisms in µ-Al-Mn and Mg32(Al,Zn)49 are essential components of the deformation processes in these phases.
From the temperature dependence of the activation enthalpies of µ-Al-Mn and Mg32(Al,Zn)49 it is concluded (chapter 4.4 and 5.4) that the brittle-to-ductile transitions in both materials are caused by a thermal limitation of the diffusion processes, which are essential for the dislocation climb mechanisms.
The secondary climb process in µ-Al-Mn takes place on 1,0,0 and 0,1,1 planes. c-
axis dislocations, which are groups of five partial dislocations closely aligned in a common habit plane, are carriers of this mechanism (cf. chapter 4). The Burgers-vector
direction of c-axis dislocations, parallel to >< 0,1,1 and >< 0,0,1 directions, are
indicated by “ ⊗ ” in figure 7.1 (a). The secondary climb process, which acts as source for vacancies, inserts atomic layers with normal vector perpendicular to the compression direction (green plane in figure 7.1 (a)).
137

7 Comprehensive discussion: Plasticity of CMAs
In the Bergman phase, besides climb on (0,0,1) planes, mixtures of slip and climb takes place on (1,0,0) and planes (blue in figure 7.1 (b)). The slip component of
dislocation motion on planes contributes to the deformation with the maximum
possible Schmid factor for dislocation slip of m
)1,0,1( ±
)1,0,1( ±
S = 0.5. The climb component on these planes contributes to the deformation by the removal of atomic layers, i.e. positive climb. The climb component on (1,0,0) planes, on the other hand, is the secondary climb mechanism in Mg32(Al,Zn)49. It inserts atomic layers with normal vector perpendicular to the compression direction and acts as source for vacancies. The slip component of dislocation motion on (1,0,0) planes occurs due to local stresses parallel to the compression direction which are caused by the other discussed mechanisms. The interaction of the mechanisms is described in chapter 5.4 and illustrated in figure 5.20.
The plastic deformation behaviour of ξ’-Al-Pd-Mn is related to that of µ-Al-Mn and Mg32(Al,Zn)49. Two mechanisms are reported to act in ξ’-Al-Pd-Mn under various deformation geometries which are both based on dislocation climb (Klein et al., 2000, Feuerbacher and Caillard, 2004). One mechanism corresponds to climb of prismatic loops. The habit planes of these loops accord to (0,1,0) planes, i.e. planes with normal vector parallel to the compression direction. This mechanism resembles to the climb mechanisms in µ-Al-Mn and Mg32(Al,Zn)49 on (0,0,1) planes. It possesses a Schmid factor of 1 and removes atomic layers perpendicular to the compression direction. Hence, this mechanism corresponds to positive climb and acts as sink for vacancies, as well.
The second deformation mechanism observed in ξ’-Al-Pd-Mn comprises motion of metadislocations. Metadislocations in ξ’-Al-Pd-Mn possess line directions along [0,1,0] and move by climb on (0,0,1) planes (Klein et al., 1999). Their motion is accompanied by the introduction of phason halfplanes which corresponds to a structural transition to the phase Ψ-Al-Pd-Mn. This additional phase is indicated in dark grey in figure 7.1 (c). Metadislocations in ξ’-Al-Pd-Mn are introduced in chapter 1.2.
It is assumed that in ξ’-Al-Pd-Mn, deformed along [0,0,1], metadislocations and prismatic loops exchange vacancies via diffusion and a form complementary climb system in full analogy with the deformation mechanisms in µ-Al-Mn and Mg32(Al,Zn)49 (Feuerbacher, 2008). This situation is illustrated in figure 7.1 (c).
In deformed ß-Al-Mg (fcc-structure) dislocation slip on 1,1,1 planes and dislocation climb on (0,0,1) planes is observed (Lipińska-Chwałek, 2007). However, it is argued in chapter 6.3 that plastic deformation of ß-Al-Mg is primarily mediated by the slip mechanism. A schematic illustration of both mechanisms is shown in figure 7.1 (e). The slip mechanism includes dislocations with Burgers vectors parallel to <1,1,2> directions (Lipińska-Chwałek, 2007). The movement direction and Burgers-vector orientation are
138

7 Comprehensive discussion: Plasticity of CMAs
equivalent to those of Shockley partials, which are frequently observed as carriers of plastic deformation in structurally simple phases featuring fcc lattices (e.g. Ray and Cockayne, 1971, Lee et al., 2001). However, the Burgers-vector modulus of Shockley
partials, calculated according to 6
|| ab =r
(Hull and Bacon, 1984), where a is the lattice
parameter, would amount to more than 11 Å in case of ß-Al-Mg. This value would exceed physically reasonable lengths of Burgers vectors. The occurrence of dislocations in ß-Al-Mg with equivalent characteristics of Shockley partials is hence energetically unfavourable and unlikely.
The plastic-deformation mechanism of Al13Co4 is illustrated in figure 7.1 (d). The material was deformed using a compression direction inclined by 45° to the [1,0,0] direction. In this geometry a deformation process is reported which is based on slip of metadislocations on (1,0,0) planes (Heggen et al., 2007). The inserted planar defects correspond to structurally modified slabs (indicated in dark grey). A transformation from orthorhombic Al13Co4 to monoclinic Al13Co4 takes place during dislocation motion in this material (Heggen et al., 2008).
The chemical stress
It was discussed above that complementary climb systems, i.e. positive and negative climb mechanisms, occur in the three CMA phases µ-Al-Mn, Mg32(Al,Zn)49, and ξ’-Al-Pd-Mn. The positive climb mechanism contributes to plastic deformation by removing atomic layers with normal vector parallel to the compression direction1 and acts as sink for vacancies. In the following, consequences of the vacancy consumption by positive climb mechanisms are discussed on the example of µ-Al-Mn.
In the case that the formation rate of thermal vacancies is too low to compensate the vacancy consumption, the concentration c of the vacancies decreases. The concentration is defined by if n is the number of vacancies in a crystal consisting of N atoms. In a thermodynamic equilibrium the vacancy concentration is given by (e.g. Gottstein, 1998):
Nnc /=
)exp(0 TkG
cB
f−= , (7.1)
where Gf is the free enthalpy of vacancy formation, kB is Boltzmann’s constant and T is the temperature.
B
1 In Mg32(Al,Zn)49 positive climb takes place on (0,0,1) as well as on )1,0,1( ± planes.
139
7 Comprehensive discussion: Plasticity of CMAs
Since the formation enthalpy of interstitial atoms is typically two to four times larger than that of vacancies, the concentration of interstitial atoms is several orders of magnitude smaller and, correspondingly, is negligible in comparison with that of vacancies. It is hence assumed that primarily vacancies are involved in the discussed climb mechanisms.
The free enthalpy of vacancy formation can be written as vff TSHG −= , where Hf is
the enthalpy of vacancy formation and Sv is the entropy of vibration (e.g. Gottstein, 1998). The vacancy concentration can be calculated according to
)exp()exp(0 TkH
kS
cB
f
B
v −= . (7.2)
Hf and Sv for µ-Al-Mn are not reported in the literature. Corresponding values for pure Al are 0.66 eV and 0.7 kB, respectively. Assuming that the enthalpy of vacancy formation and the entropy of vibration of µ-Al-Mn compare to these values, a vacancy concentration in thermal equilibrium at 850 °C of approximately 2·10 is calculated. Most microstructural TEM-investigations have been performed on samples which were deformed in this temperature range.
B
-3
The vacancy consumption due to positive climb mechanisms causes a local decrease of the vacancy concentration which builds up the chemical potential (Hirth and Lothe, 1982)
0
lncc
Tk disB=μ , (7.3)
where cdis is the local vacancy concentration at the dislocation. The negative gradient of the chemical potential corresponds to a force which can act on the dislocations. The according chemical stress1 caused by the vacancy-concentration difference can then be determined by (Caillard and Martin, 2003)
dis
Bch c
cΩTk 0ln=σ , (7.4)
where Ω is the average atomic volume (for µ-Al-Mn Ω ≈ 0.015 nm³). Assuming a vacancy concentration cdis which is 15 % lower than the equilibrium concentration c0, a chemical stress is calculated at 850 °C of approximately 150 MPa. This value closely corresponds to the flow stress observed in deformation experiments on µ-Al-Mn at 850 °C (cf. figure 4.4). The calculation thus demonstrates that even small deviations of 1 The chemical stress is also referred to as osmotic stress in the literature.
140
7 Comprehensive discussion: Plasticity of CMAs
the vacancy concentration from thermal equilibrium result in chemical stresses which can act as driving force for dislocation motion. Hence, the appearance of dislocation-climb mechanisms which possess no resulting driving force from the deformation geometry can be explained by the chemical stress due to the vacancy-concentration gradient.
Dislocation climb
An interesting issue in the plastic-deformation behaviour of the discussed CMA phases is the frequent occurrence of dislocation climb. In contrast to structurally simple materials, dislocation climb seems to be a prevalent process of plastic deformation in CMAs. In general, dislocation slip is the most common process of plastic deformation in crystalline solids (Hull and Bacon, 1984).
The reason for this deviation of the microstructural plasticity of CMAs is not known until now. However, one has to take into account that the climb mechanisms in CMAs take place at comparatively high deformation temperatures usually far above TH = 0.7. Slip processes reported in the literature, on the other hand, are frequently observed in materials plastically deformed at considerably lower homologous temperatures (e.g. Frost and Ashby, 1982, Cadek, 1988), where possible climb mechanisms are hampered by low diffusion rates.
The plastic deformation behaviour of numerous quasicrystalline phases is also mediated by dislocation climb (Caillard et al., 2000, Feuerbacher and Schall, 2003). The occurrence of dislocation climb in quasicrystals is structurally advantageous in comparison with dislocation slip, which can be illustrated by means of a Penrose tiling, which is a two-dimensional tiling representation of a quasicrystalline structure. A Penrose tiling is constructed by a non-periodic pattern consisting of two different sets of rhombi which possess equal side lengths but different angles.
A Penrose tiling is shown in figure 7.3 (a). The blue line denotes an arbitrary horizontal cut along the tile edges which separates the Penrose tiling into an upper and a lower section. Considering a dislocation which moves along this line, the upper section of the Penrose tiling will be displaced with respect to the lower one. In case of dislocation climb, atomic layers are introduced or removed from a crystal structure. This corresponds to a vertical displacement of the two tiling sections as shown in figure 7.3 (b). A horizontal displacement of the tiling sections, corresponding to dislocation slip along the blue line, is shown in (c).
The vertical as well as the horizontal displacement of the upper section with respect to the lower one causes a misfit in the tiling. In case of the vertical displacement, however, the misfit only consists of faults in the tiling order. While the tiles of the two sections
141
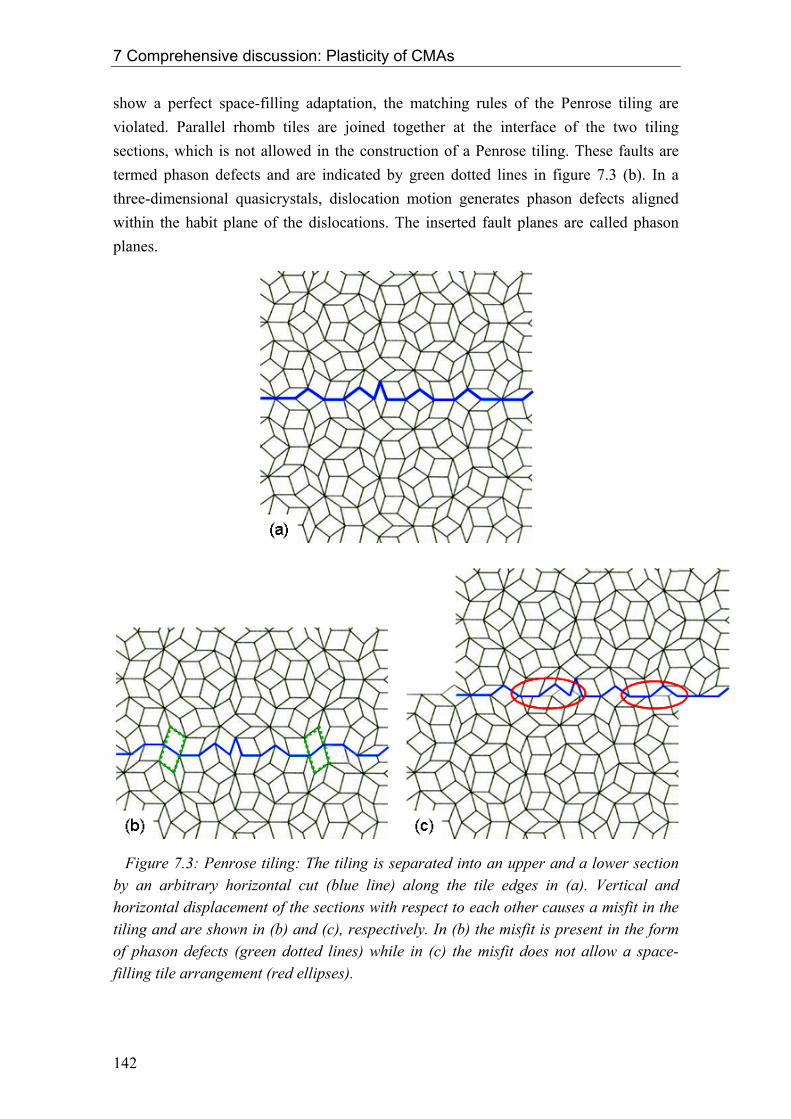
7 Comprehensive discussion: Plasticity of CMAs
show a perfect space-filling adaptation, the matching rules of the Penrose tiling are violated. Parallel rhomb tiles are joined together at the interface of the two tiling sections, which is not allowed in the construction of a Penrose tiling. These faults are termed phason defects and are indicated by green dotted lines in figure 7.3 (b). In a three-dimensional quasicrystals, dislocation motion generates phason defects aligned within the habit plane of the dislocations. The inserted fault planes are called phason planes.
Figure 7.3: Penrose tiling: The tiling is separated into an upper and a lower section by an arbitrary horizontal cut (blue line) along the tile edges in (a). Vertical and horizontal displacement of the sections with respect to each other causes a misfit in the tiling and are shown in (b) and (c), respectively. In (b) the misfit is present in the form of phason defects (green dotted lines) while in (c) the misfit does not allow a space-filling tile arrangement (red ellipses).
142
7 Comprehensive discussion: Plasticity of CMAs
In the case of the horizontal displacement shown in figure 7.3 (c), on the other hand, the misfit of the two tiling sections cannot be described by phason defects. At some locations the tiling is disturbed in such a way that no perfect adaptation of the two sections can be found using the two sets of tiles, i.e. no space-filling tile arrangement is possible at the interface of the tiling sections. These locations are emphasized in (c) by red ellipses.
This fact indicates that dislocation slip causes more local discrepancies in the structural arrangement in comparison to dislocation climb, and is therefore an energetically less favourable mode of dislocation motion in quasicrystalline structures. However, this argumentation cannot be adopted directly to CMA phases since the latter possess translational symmetry.
However, the frequent occurrence of dislocation climb in quasicrystals and CMAs suggests that a correlation between both materials classes exists. The short-range orientational order is often similar in quasicrystals and CMAs (cf. chapter 1.1). Icosahedral Al-Pd-Mn and ξ’-Al-Pd-Mn, for example, possess local atom coordinations defined by Mackay clusters (chapter 1.1) and pseudo Mackay clusters, respectively, which are almost identical (Beraha et al., 1997). Furthermore, both phases feature pure dislocation-climb mechanisms (Caillard et al., 2000, Feuerbacher and Caillard, 2004) which possess identical Burgers vectors (Feuerbacher et al., 2000). Since the (pseudo) Mackay clusters define the atomic arrangement on the length scale of the Burgers vectors and the strain fields of the dislocations, it is assumed that the similar short-range order determines the climb mechanisms in both phases.
Hence, it is reasonable to assume that the climb mechanisms found in other CMA phases can also be referred to the local atomic order which is similar to that of quasicrystals (cf. chapter 1). Investigations on microstructural deformation mechanisms of structurally related CMAs and quasicrystals might yield further insights in this issue.
143

7 Comprehensive discussion: Plasticity of CMAs
144

Summary In the present work, the plasticity of complex metallic alloys was investigated. Macroscopic as well as microstructural examinations on three selected phases, hexagonal µ-Al-Mn, body-centred cubic Mg32(Al,Zn)49, and face-centred cubic ß-Al-Mg were carried out. In conjunction with investigations on orthorhombic CMAs reported in the literature, the most important crystal lattices in this class of materials are covered.
High-quality single crystals of the three phases were grown in the frame of the present thesis. Using single crystalline materials the determination of the intrinsic deformation behaviour without effects of secondary phases or grain boundaries is ensured.
Uniaxial-compression tests on all three phases were performed at different temperatures along the respective [0,0,1] direction. Stress-strain curves of µ-Al-Mn, Mg32(Al,Zn)49, and ß-Al-Mg were recorded for the first time. The three phases were found to be brittle at room temperature and ductile at elevated temperatures. None of them exhibits distinct work hardening or work softening at high strains and all show pronounced yield-point effects at the onset of plastic deformation. In ß-Al-Mg fracture stresses were observed which considerably exceed those of commercial Al-Mg alloys used in technical applications.
Thermodynamic activation parameters of the deformation processes at different temperatures were determined by means of incremental tests. Activation volumes of all three phases indicate that atom clusters, present in the crystal structures, form primary obstacles against dislocation motion. It is argued that friction between dislocations and the cluster substructure provides the rate-controlling mechanism of the deformation processes in the investigated temperature range. The activation enthalpy indicates that plastic deformation is thermally activated in all three phases. The temperature dependence of the activation enthalpy of µ-Al-Mn and Mg32(Al,Zn)49 suggests that in both phases lattice diffusion dominates the deformation-controlling factor at temperatures close to the brittle-to-ductile transition. The findings of the macroscopic investigations are in good accordance with the respective results of other CMAs. This suggests that several observed characteristics, as e.g. the friction between dislocations and the cluster substructure, are characteristic features of the macroscopic deformation behaviour of this materials class.
Macroscopic deformation experiments were complemented by detailed microstructural investigations on µ-Al-Mn and Mg32(Al,Zn)49 by means of TEM. Analyses of the dislocation densities of plastically deformed and undeformed samples reveal that deformation in both
145

Summary
phases is mediated by dislocation motion. The underlying deformation mechanisms were successfully determined. All dislocations involved are partial dislocations. Accordingly stacking faults are inserted into the crystal structure by dislocation motion.
The microstructural deformation mechanisms of µ-Al-Mn and Mg32(Al,Zn)49 possess remarkable features and exhibit distinct differences to mechanisms known from structurally simple materials. In µ-Al-Mn pure climb of prismatic dislocation loops takes place. The dislocation-habit planes have normal vectors parallel to the compression direction ((0,0,1) planes). This climb mechanism contributes efficiently to the deformation process by the removal of atomic layers and acts as sink for vacancies. It is accompanied by diffusion of vacancies towards the dislocation core, leading to a vacancy-concentration gradient within the material. This gradient causes a chemical stress which counteracts the driving force of this climb process.
A secondary climb process acts as source for vacancies and is driven by the chemical stress. The two climb mechanisms interact via diffusion and exchange vacancies (complementary climb systems). The secondary climb mechanism takes place on planes with normal vector perpendicular to the compression direction along six specific directions of the hexagonal structure. Groups of five closely aligned partial dislocations are carriers of this mechanism.
In Mg32(Al,Zn)49 the deformation process is efficiently mediated by the interaction of three dislocation mechanisms. Pure climb of edge dislocations takes place on planes with normal vector parallel to the compression direction ((0,0,1) planes). These dislocations can split into two other types of dislocations which move on (1,0,0) and on )1,0,1( ± planes. The mode of
dislocation motion on these planes is a mixture of climb and slip. The climb components on (0,0,1), (1,0,0), and planes correspond to complementary climb systems which
exchange vacancies via diffusion. Another interesting feature of the plastic deformation behaviour of Mg
)1,0,1( ±
32(Al,Zn)49 is the pronounced anisotropy of the dislocation-line directions which can be attributed to the two-fold rotational symmetry of the structure along <0,0,1> directions.
Several similarities as well as significant differences are present in the microstructural deformation processes of µ-Al-Mn and Mg32(Al,Zn)49 in comparison with other CMAs. In particular the edge character of dislocation segments which mediate the plastic deformation, and climb as mode of dislocation motion are favoured concepts in the deformation processes of CMA phases. In the majority of the investigated CMAs complementary climb systems are present which interact via diffusion and affect each other by means of a chemical stress. The friction between dislocations and the cluster substructure is concluded to be a basic feature in the deformation behaviour of CMAs, as well.
146

Appendix A Characterization of lattice defects by TEM The wave-like characteristics of electrons, firstly described by de Broglie (1925), permit the diffraction of an electron beam at a crystal lattice. This circumstance is used as the major contrast-forming process for imaging of crystal defects in TEM. The condition for the diffraction of a wave is constructive interference of multiple scattering events of the wave at a set of lattice planes. It is given by the Bragg condition
λnd =Θsin2 with Zn ∈ , (A.1)
where d is the distance of the lattice planes, λ is the wavelength and Θ is the angle of the incident wave with respect to the crystal planes. The equivalent to the Bragg condition in direct space is the Laue condition in reciprocal space:
gk rr=Δ , (A.2)
where is a reciprocal lattice vector and gr 0kkk g
rrr−=Δ , where 0k
r and are the wave
vectors of the incident and the diffracted wave, respectively. In figure A.1 the Laue condition is visualized by means of the Ewald construction for the case of elastic scattering, i.e.
gkr
0kkg
rr= . The reciprocal lattice is shown as point lattice and the incident and diffracted
electron beams as arrows which define the Ewald sphere. The wave vector of the incident beam points at the origin of the reciprocal lattice. If the Ewald sphere cuts a reciprocal lattice point, condition (A.2) is fulfilled and constructive interference takes place in the radial
direction parallel to . gkr
147
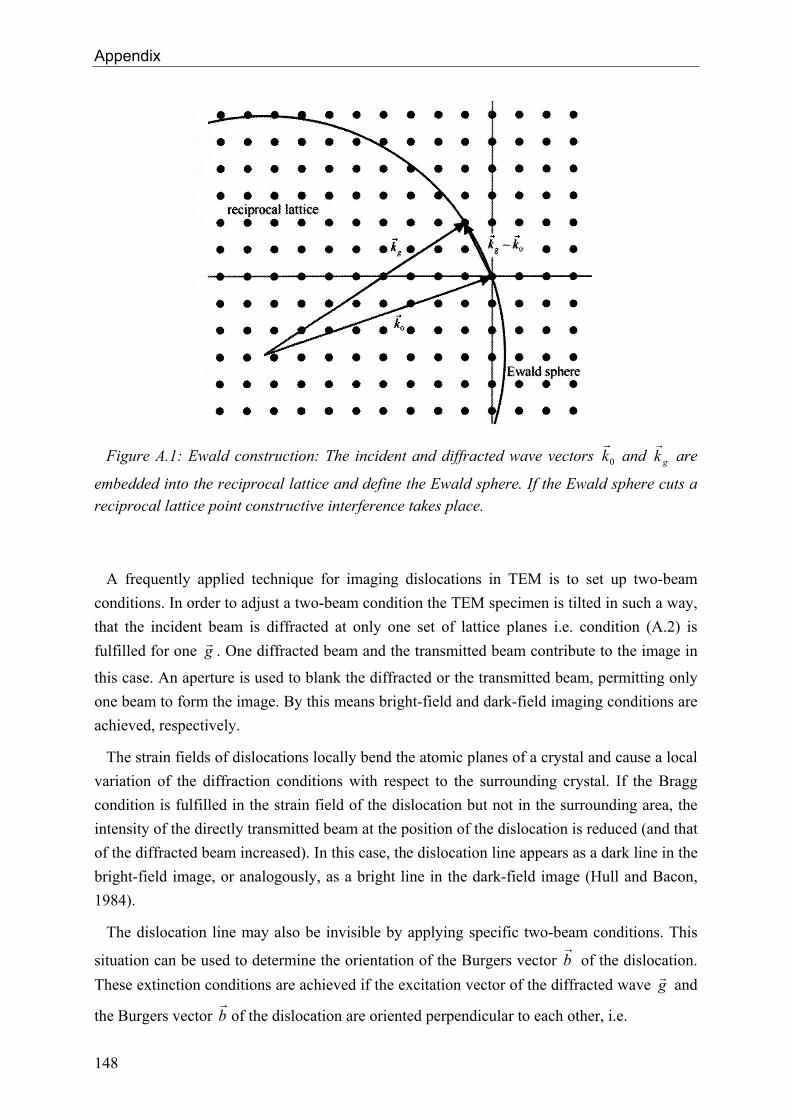
Appendix
Figure A.1: Ewald construction: The incident and diffracted wave vectors 0kr
and gkr
are
embedded into the reciprocal lattice and define the Ewald sphere. If the Ewald sphere cuts a reciprocal lattice point constructive interference takes place.
A frequently applied technique for imaging dislocations in TEM is to set up two-beam conditions. In order to adjust a two-beam condition the TEM specimen is tilted in such a way, that the incident beam is diffracted at only one set of lattice planes i.e. condition (A.2) is fulfilled for one . One diffracted beam and the transmitted beam contribute to the image in
this case. An aperture is used to blank the diffracted or the transmitted beam, permitting only one beam to form the image. By this means bright-field and dark-field imaging conditions are achieved, respectively.
gr
The strain fields of dislocations locally bend the atomic planes of a crystal and cause a local variation of the diffraction conditions with respect to the surrounding crystal. If the Bragg condition is fulfilled in the strain field of the dislocation but not in the surrounding area, the intensity of the directly transmitted beam at the position of the dislocation is reduced (and that of the diffracted beam increased). In this case, the dislocation line appears as a dark line in the bright-field image, or analogously, as a bright line in the dark-field image (Hull and Bacon, 1984).
The dislocation line may also be invisible by applying specific two-beam conditions. This
situation can be used to determine the orientation of the Burgers vector br
of the dislocation. These extinction conditions are achieved if the excitation vector of the diffracted wave gr and
the Burgers vector br
of the dislocation are oriented perpendicular to each other, i.e.
148

Appendix
0=⋅bgrr , (A.3)
since atomic planes parallel to the dislocation line remain flat in an isotropic material (Hull and Bacon, 1984). The determination of a Burgers-vector direction is possible if two linearly independent excitation vectors are found which fulfil the extinction condition (A.3). In case of pure edge dislocations, however, a strong residual contrast is frequently observed even if condition (A.3) is fulfilled. A full extinction of edge dislocations is achieved only if the condition
0=×⋅ lbgrrr (A.4)
is additionally fulfilled, taking the line direction lr
of the dislocation into account (Edington, 1975).
A stacking fault features a constant displacement between the crystal parts on both sides of
the fault plane. The displacement is characterized by the displacement vector Rr
. An electron wave passing through the stacking fault is subjected to a phase shift induced by the displacement. Hence, a phase factor α is added to the transmitted and diffracted beams. This phase shift causes a contrast in TEM. When the fault is inclined to the specimen surface, the contrast takes the form of bright and dark fringes parallel to the line of intersection of the fault plane with the surface. The phase shift is given by (Edington, 1975)
Rgrr
⋅= πα 2 . (A.5)
If no phase shift is present, no contrast appears and accordingly the stacking fault is invisible. Hence, the extinction condition of a stacking fault is fulfilled if the scalar product of excitation vector and displacement vector equals zero or an integer:
,...2,1,0 ±±=⋅ Rgrr . (A.6)
The dislocation density ρ is a measure for the number of dislocations in a material. It is defined as the entire dislocation length L in a given volume V (Hirth and Lothe, 1982)
149
Appendix
VL
=ρ (A.7)
with the unit cm/cm3 = cm-2. Since imaging of dislocations by TEM delivers only a projection of the dislocation on the image plane, knowledge about the orientation of the investigated dislocation is required in order to determine the correct length L. According to Schöck (1961) a dislocation distribution with orientation within the element of the solid angle dΩ is given by p(φ,θ) if θ and φ are the azimuth and the longitude angle, respectively. The dislocation density can then be calculated according to
. (A.8) ∫ ∫= =
=2/
0
2
0
sincos),(2π
φ
π
θ
θφφφθφρ ddp
150
References Audier M., Durand-Charre M., de Boissieu M. (1993), Phil. Mag. B 68, p. 607 Balanetsky S., Grushko B., Velikanova T.Y., Urban K. (2004), J. All. Comp. 376,
p. 158
Balanetskyy S., Grushko B., Velikanova T.Y. (2004a), Z. Kristallogr. 219, p. 548 Balanetskyy S. (2005), private communication Balanetskyy S., Meisterernst G., Heggen M., Feuerbacher M. (2007), Intermetallics,
in press Balanetskyy S. (2007a), unpublished results Beke D.L., Godeny I., Erdelyi G., Kedves F.J. (1987), Mat. Sci. For. 15-18, p. 425 Belin-Ferré E. (2002), J. Phys.: Cond. Mat. 14 p. R789 Bendersky L. (1987), J. Microsc. 146, p. 303 Beraha L., Duneau M., Klein H., Audier M. (1997), Phil. Mag. A 76, p. 587 Bergman G., Waugh J.L.T., Pauling L. (1952), Nature 169, p. 1057 Bergman G., Waugh J.L.T., Pauling L. (1957), Acta Cryst. 10, p. 254 Boudard M., Klein H., DeBoissieu M., Audier M., Vincent H. (1996), Phil. Mag. A 74, p. 939 Burgers J.M. (1940), Proc. Phys. Soc. 52, p. 23 Cadek J. (1988), “Creep in metallic materials”, Elsevier, Amsterdam Caillard D., Martin J.L. (2003), in “Thermally activated mechanisms in crystal
plasticity” (Ed. Cahn R.W.), Pergamon materials series, Pergamon press, Oxford de Broglie L. (1925), Ann. de Physique 3, p.22 Dorn J.E., Pietrokowsky P., Tietz T.E. (1950), J. Metals 188, p. 933 Edler F.J. (1997), thesis, Diss. ETH Nr. 12384, ETH Zuerich Edler F.J., Gramlich V., Steurer W. (1998), J. All. Comp. 269, p. 7
151
References
Edington J.W. (1975), “Practical Electron Microscopy in Material Science: 3 Interpretation of Transmission Electron Micrographs”, MacMillan Press, London
Evans A.G., Rawlings R.D. (1969), Phys. Stat. Sol. 34, p. 9 Feuerbacher M. (1996), “Mechanische Eigenschaften von ikosaedrischen Al-Pd-Mn-Quasikristallen”, thesis, RWTH-Aachen Feuerbacher M., Metzmacher C., Wollgarten M, Urban K., Baufeld B., Bartsch M.,
Messerschmidt U (1997), Mat. Sci. Eng. A 233, p. 103 Feuerbacher M., Klein H., Bartsch M., Messerschmidt U., Urban K.(2000),
Mat. Sci. Eng. A 294, p. 736 Feuerbacher M., Klein H., Urban K. (2001), Phil. Mag. Let. 81, p. 639 Feuerbacher M., Schall P. (2003), Scrip. Mat. 49, p. 25 Feuerbacher M., Thomas C., Urban K. (2003), „Plastic Behaviour of Quasicrystalline
Materials“ in „Quasicrystals – Structure and Physical Properties“ (Ed.: Trebin H.-R.), VHC Wiley
Feuerbacher M., Caillard D. (2004), Acta Mat. 52, p. 1297 Feuerbacher M., Heggen M., Urban K. (2004), Mat. Sci. Eng. A 375-377, p. 84 Feuerbacher M. (2005), unpublished results Feuerbacher M., Heggen M. (2006), Phil. Mag. 86, p. 935 Feuerbacher M. (2007), private communication Feuerbacher M., Thomas C., Makongo J.P.A., Hoffmann S., Carrillo-Cabrera W., et al.
(2007), Z. Kristallogr. 222, p. 259 Feuerbacher M. (2008), private communication Frost H.J., Ashby M.F. (1982), “Deformation mechanism maps: the plasticity and creep
of metals and ceramics”, Pergamon press, Oxford Gevers R. (1972), Dèfauts plans in „Methodes et Techniques Nouvelles d’Observation
en Metallurgie Physique” (Ed. Jouffrey B.), SFME, Paris Gibbs G.B. (1964), Phys. Stat. Sol. B 5, p. 693 Gibbs G.B. (1969), Phil. Mag. 20, p. 867 Goldman A.I., Kelton R.F. (1993), Rev. Mod. Phys. 65, p. 213 Gottstein G. (1998), “Physikalische Grundlagen der Materialkunde”, Springer, Berlin
152

References
Granato A.V., Lücke K., Schlipf J., Teutonico L.J. (1964), J. Appl. Phys. 35, p. 2732 Grin Y., Burkhard U., Ellner M., Peters K. (1994), J. All. Comp. 206, p. 243 Grin Y., Burkhard U., Ellner M., Peters K. (1994a), Z. Kristallogr. 209, p. 479 Grin Y., Peters K., Burkhardt U., Gotzmann K., Ellner M. (1997), Z. Kristallogr. 212,
p. 439 Heggen M. (2003), “Plastic behaviour of quasicrystals and related intermetallic phases”, thesis, RWTH-Aachen Heggen M., Deng D., Feuerbacher M. (2007), Intermetallics 15, p. 1425 Heggen M., Engel M., Balanetskyy S., Trebin H.-R., Feuerbacher M. (2007a), Phil.
Mag., in press
Heggen M., Houben L., Feuerbacher M. (2008), Phil. Mag., in press Hiraga K., Kaneko M., Matsuo Y., Hashimoto S. (1993) Phil. Mag. B 68, p. 193 Hirth J.P., Lothe J. (1982), “Theory of Dislocations”, Wiley, New York Hirth J.P., Lothe J. (1992), “Theory of Dislocations”, Krieger Publishing, Malabar, p. 91 Hirth J.P., Nix W.D. (1969), Phys. Stat. Sol. 35, p. 177 Houben L., Roitsch S. (2007), unpublished results Hull D., Bacon D.J. (1984), “Introduction to Dislocations”, 3rd edition, Pergamon press,
Oxford Ilschner B. (1973), „Hochtemperatur-Plastizität“, Springer, Berlin Johnston W.G., Gilman J.J. (1959), J. Appl. Phys. 30, p. 129 Johnston W.G. (1962), J. Appl. Phys. 33, p. 2716 Kassner M.E., Pérez-Prado M.-T. (2000), Prog. Mat. Sci. 45, p. 1 Katz A., Duneau M. (1986), J. Phys. (Paris) 47, p. 181 Kepler J. (1619), “Harmonices Mundi”, volume 2 Klein H., Audier M., Boudard M., de Boissieu M., Beraha L., Duneau M. (1996),
Phil. Mag. 73, p. 309 Klein H., Boudard M., Audier M., de Boissieu M., Vincent H., Beraha L. et al. (1997),
Phil. Mag. Let. 75, p. 197
153
References
Klein H., Feuerbacher M., Schall P., Urban K. (1999), Phys. Rev. Let. 82, p. 3468 Klein H., Feuerbacher M., Urban K. (2000), Mater. Sci. Eng. 294-296, p. 769 Klein H., Feuerbacher M, Schall P., Urban K. (2000a), Phil. Mag. Let. 80, p. 11 Klein H., Feuerbacher M. (2003), Phil. Mag. 83, p. 4103 Kocks U.F., Argon A.S., Ashby M.F. (1975), “Thermodynamics and Kinetics of Slip”, Pergamon press, Oxford Krausz A.S., Eyring H. (1975), “Deformation Kinetics”, Wiley, New York Kreiner G., Franzen H.F. (1995), J. All. Comp. 221, p. 15 Kreiner G., Franzen H.F. (1997), J. All. Comp. 261, p. 83 Laves F., Löhberg K., Witte H. (1935), Metallwirtschaft 14, p. 793 LeClair A.D. (1992), „Diffusion in Metals“ in „Smithells Metals Reference Book“
(Eds. Brandes E.A., Brook G.B.), 7th Edition, Butterworth-Heinemann, Oxford Lee E.H., Byun T.S., Hunn J.D., Yoo M.H., Farell K., Mansur L.K. (2001),
Acta mater. 49, p. 3269 Le Hazif R., Antolin J., Dupouy J.M. (1968), Trans. JIM 9, p. 247 Lipińska-Chwałek M., Balanetskyy S., Thomas C., Roitsch S., Feuerbacher M. (2007),
Intermetallics 15, p. 1678 Lipińska-Chwałek M. (2007), unpublished results Mackay A.L. (1962), Acta Cryst. 15, p. 916 Mahne S., Steurer W. (1996), Z. Kristallogr. 211, p. 17 Malaplate J., Caillard D., Couret A. (2005), Mat. Sci. Eng. A 400, p. 105 Marsh R.E. (1998), Acta Cryst. B 54, p. 925 McAllister A.J., Murray J.L. (1986), “Al-Mn” in “Binary Alloy Phase Diagrams” (Ed.
Massalski T.B.), American Soc. for Met., Ohio Messer R., Dais S., Wolf D. (1974), „Proceedings of the 18th Ampère Congress”, Vol.2 (Eds. Allen P.S., Andrew E.R., Bates C.A.), Nottingham, p.327 Messerschmidt U., Bartsch M., Geyer B., Feuerbacher M., Urban K. (2000),
Phil. Mag. 80, p. 1165 Mitra R., Sadananda K., Feng C.R. (2004), Intermetallics 12, p. 827
154

References
Murray J.L. (1986), „Al-Mg“ in „Binary Alloy Phase Diagrams“ (Ed. Massalski T.B.), American Soc. for Met., Ohio
Nabarro F.R.N. (1967), Phil. Mag. 16, p. 231 Nakayama Y., Takaai T., Jin D. (1996), Mat. Sci. For. 217, p. 1269 Nandy T.K., Banerjee D. (2000), Intermetallics 8, p. 1269 Orowan E. (1934), Z. Phys. 89, p.614 Pauling L. (1923), J. Am. Chem. Soc. 45, p. 2777 Pauling L. (1955), Am. Sci. 43, p. 285 Peierls R. (1940), Proc. Phys. Soc. 52, p. 34 Perlitz H. (1944), Nature (Lond.) 154, p. 607 Petrov D., updated by Watson A., Gröbner J., Rogl P., Tedenac J.-C., Bulanova M.,
Turkevich V. (1993), “Al-Mg-Zn” in “Ternary Alloys” (Ed. Petzow G., Effenberg G.), VCH Weinheim, New York, Vol.7
Poirier J.P. (1985), „Creep of Crystals“, Cambridge University Press, New York Polanyi G. (1934), Z. Phys. 89, p. 660 Ray I.L.F., Cockayne D.J.H. (1971), Proc. Roy. Soc. London A 325, p. 543
Riederer K. (1936), Z. Metallk. 28, p. 312 Samson S. (1965), Acta Cryst. 19, p. 401 Samson S. (1969), in Giessen B.C. (Ed.), “Developments in the Structural Chemistry of Alloys Phases”, Plenum, New York, p. 65 Schöck G. (1961), J. Appl. Phys. 33, p. 1745 Schöck G. (1965), Phys. Stat. Sol. 8, p. 499 Seeger A. (1958), „Handbuch der Physik“ (Ed. Flügge S.), Springer, Berlin Shechtman D., Blech I., Gratias D., Cahn J.W. (1984), Phys. Rev. Lett. 53, p. 1951 Shewmon P.G. (1956), J. Metals (N.Y.) 8, p. 918 Shoemaker C., Keszler D.A., Shoemaker D.P. (1989), Acta Cryst. B 45, p. 13 Smontara A., Smilijanic I., Bilusic A., Jaglicic Z., Klanjsek M., Roitsch S., Dolinsek J., Feuerbacher M. (2007), J. All. Comp. 430, p. 29
155

References
Stoebe T.G., Gulliver II R.D., Ogurtani T.O., Huggins R.A. (1965), Acta Met. 13, p. 701
Stöcker H. (1994), “Taschenbuch der Physik”, Harri Deutsch, Frankfurt a.M. Sugiyama K., Hiraga K., Saito K. (2000), Mat. Sci. Eng. A 294-296, p. 345 Sugiyama K., Kato T., Ogawa T., Hiraga K., Saito K. (2000a), J. Alloys. Comp. 299,
p. 169 Sun W., Licoln F.J., Sugiyama K., Hiraga K. (2000), Mat. Sci. Eng. A 294-296, p. 327 Suzuki T., Takeuchi S., Yoshinaga H. (1991), “Dislocation Dynamics and Plasticity”, Springer, Berlin Takeuchi T., Mizutani U. (1995), Phys. Rev. B 52, p. 9300 Tamura N. (1997), Phil Mag. A 76, p. 337 Tanaka M., Terauchi M., Kaneyama T. (1988), Convergent beam electron diffraction II,
Jeol Ltd. Taylor G.I. (1934), Proc. Roy. Soc. (London) A 145, p. 362 Taylor M.A. (1960), Acta Met. 8, p. 256 Urban K., Feuerbacher M. (2004), J. Non-Cryst. Sol. 334&335, p. 143 Verdier M., Brechet Y., Guyot P. (1999), Acta mater. 47, p. 127 Vineyard G.H. (1957), J. Phys. Chem. Solids 3, p. 121 Williams D.B, Carter C.B. (1996), “Transmission Electron Microscopy: A Textbook for Materials Science”, Plenum Press, New York Wollgarten M. (1993), „Elektronenmikroskopische Untersuchungen Von Defekten in ikosaedrischen Quasikristallen“, thesis, RWTH-Aachen Yurechko M., Fattah A., Velikanova T.Y., Grushko B. (2001), J. All. Comp. 329,
p. 173 Yurechko M., Grushko B., Velikanova T.Y., Urban K. (2004), ”Phase Diagrams in
Materials Science“, Proceedings of the 6th International School-Conference (Ed. T.Y. Velikanova), PDMS VI-2001, p. 92
156
Danksagung An dieser Stelle möchte ich mich bei all jenen bedanken, die zum Gelingen dieser Arbeit beigetragen und mich bei der Erstellung unterstützt haben. Ich bedanke mich herzlich bei Professor Dr. K. Urban für die Betreuung dieser Arbeit, für Rat und Hinweise die zu ihrem Gelingen beigetragen haben und für die Möglichkeit diese Arbeit an seinem Institut für Mikrostrukturforschung anzufertigen. Ohne die engagierte Förderung von Dr. M. Feuerbacher wäre die Erstellung dieser Doktorarbeit nicht möglich gewesen. Ich danke ihm für die fachlichen Erklärungen, die praktische Unterstützung während der Experimente, die aufschlussreichen Diskussionen und das angenehme Arbeitsklima in seiner Arbeitsgruppe. Dr. M. Heggen danke ich für die permanente Hilfsbereitschaft und das Interesse an dieser Arbeit. Sein Fachwissen und seine praktischen Tipps waren mir stets eine große Hilfe. Dr. M. Feuerbacher und Dr. M. Heggen danke ich auch für das Korrekturlesen dieser Arbeit. Ein großer Dank gilt auch Herrn Dipl.-Ing. C. Thomas, Herrn Dr. S. Balanetskyy, Frau E.-M. Würtz und Frau M. Schmidt für die angenehme und erfolgreiche Zusammenarbeit bei der Herstellung und der Charakterisierung der untersuchten Proben. Frau M. Lipińska-Chwałek danke ich für die gute Zusammenarbeit und den Austausch bei der Untersuchung von ß-Al-Mg-Proben und Dr. J. Barthel für die Hilfe bei Computerproblemen und für Erläuterungen zu Grundlagen der Elektronenmikroskopie. Allen Büronachbarn und Mitgliedern der Arbeitsgruppe „Metalle“ danke ich für die Freundschaftlichkeit und die schöne gemeinsame Zeit. Ein großer Dank gilt Herrn Dipl.-Ing. W. Pieper und Frau D. Meertens für die technische Unterstützung und schnelle Hilfe bei auftretenden Problemen. Frau I. Rische-Radloff und Frau G. Wassenhoven danke ich für die administrative und organisatorische Unterstützung. Ich möchte mich herzlich bei allen Mitgliedern des Instituts für Mikrostrukturforschung für die freundliche Aufnahme, die geleistete Unterstützung und vor allem für viel Spaß bedanken. Mein größter Dank gilt jedoch den wichtigsten Menschen in meinem Privatleben, die mich in jeder Hinsicht unterstützt und mir Rückhalt gegeben haben, meiner Frau Cindy, meinen Eltern und meinen Geschwistern.
157

158

Lebenslauf Name: Stefan Roitsch Anschrift: Lourdesstraat 88
NL-6465 BP Kerkrade, Niederlande Geburtsdatum: 28. Juni 1979 Geburtsort: Paderborn Nationalität: deutsch Eltern: Hellmut Roitsch Hildegard Roitsch, geb. Broich Familienstand: verheiratet mit Cindy Roitsch, geb. Brull Schulbildung:
1985-1989 Grundschule Brilon-Gudenhagen 1989-1995 Marien-Realschule, Brilon 1995-1998 Höhere Berufsfachschule für Technische Assistenten, Fachrichtung Physik, Olsberg Abschluss: Staatlich geprüfter Physikalisch-
Technischer Assistent, Fachabitur Wehrdienst:
1998-1999 Grundwehrdienst, Luftwaffe, Erndtebrück Studium:
1999-2004 Studium der Physik/Diplom an der Universität Paderborn 10/2003-9/2004 Diplomarbeit in der Arbeitsgruppe Hochdruckphysik (Prof. Dr. G.
Wortmann) an der Universität Paderborn. 10/2004-12/2004 Hilfswissenschaftler an der Universität Paderborn in der
Arbeitsgruppe Hochdruckphysik (Prof. Dr. G. Wortmann) Promotion: ab Januar 2005 am Institut für Mikrostrukturforschung,
Forschungszentrum Jülich, bei Prof. Dr. K. Urban mündliche Doktorprüfung am 12.08.08, RWTH Aachen
159
Related Documents