Knowledge Sharing Session Microsoft PowerPoint Slide Makeover Zamani Umar Husin 22 December 2020 Part2

Welcome message from author
This document is posted to help you gain knowledge. Please leave a comment to let me know what you think about it! Share it to your friends and learn new things together.
Transcript
Knowledge Sharing Session
Microsoft PowerPoint Slide Makeover
Zamani Umar Husin22 December 2020
Part2
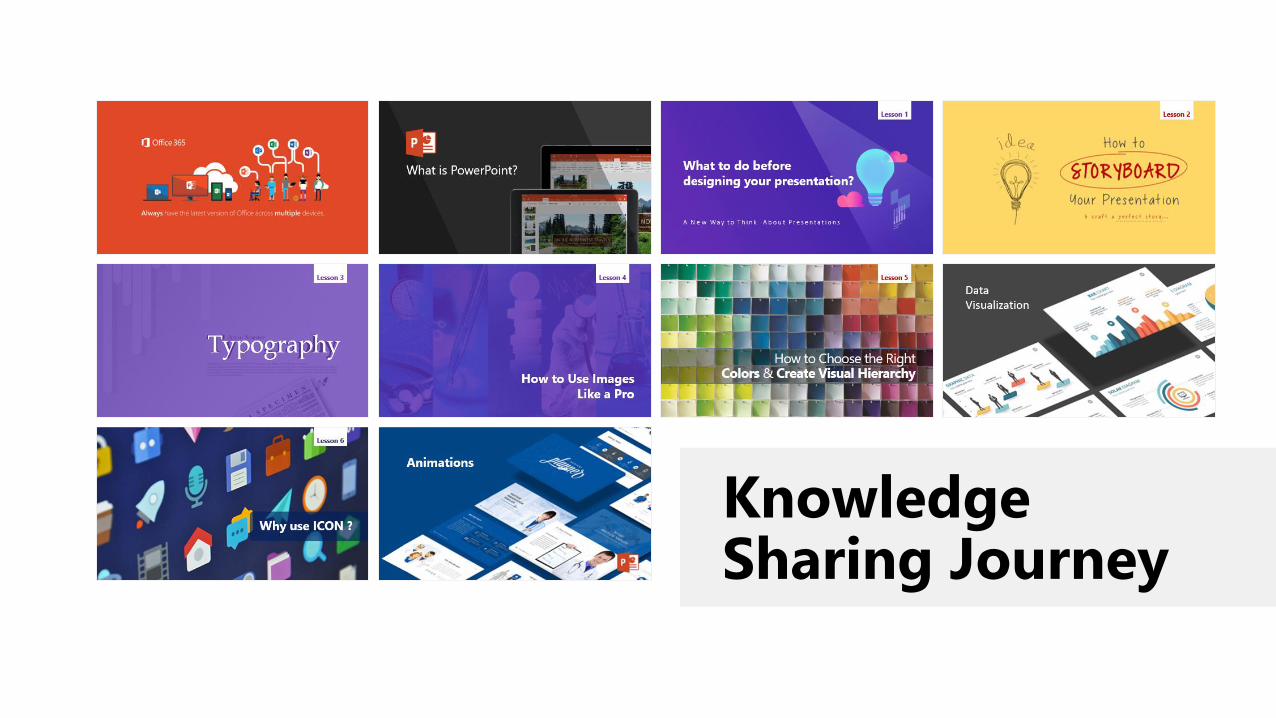
Knowledge Sharing Journey
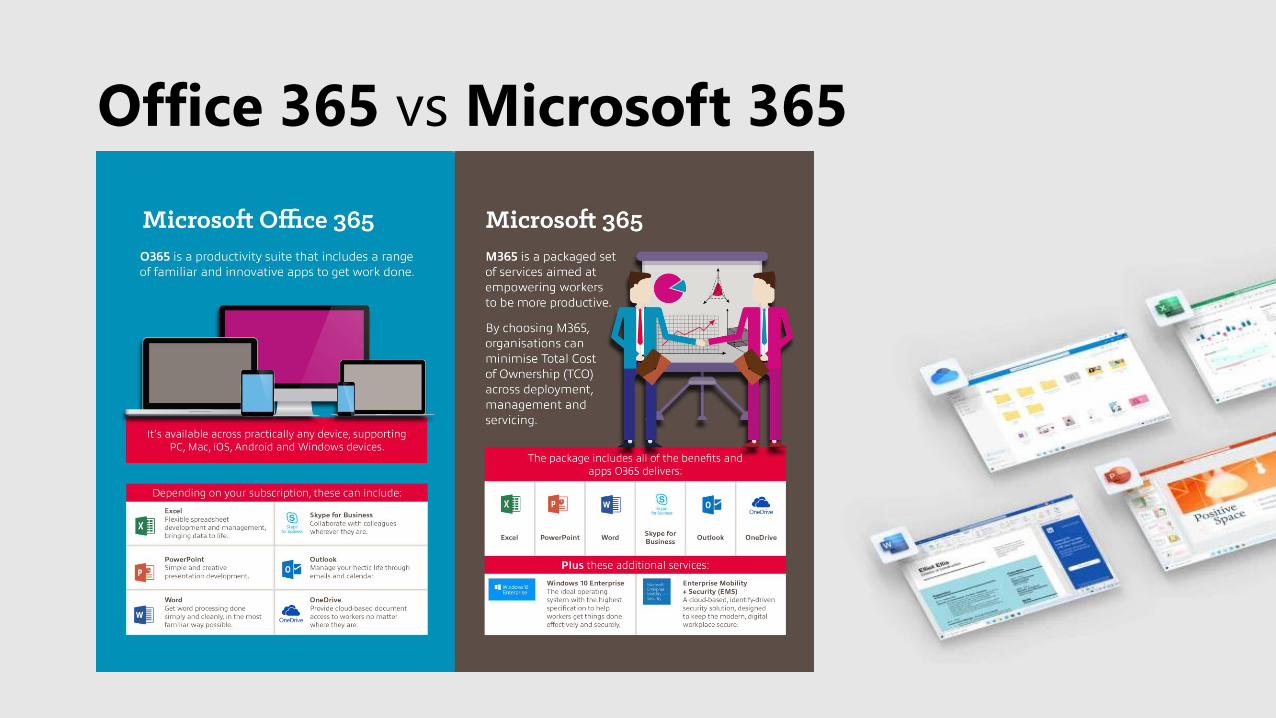
Office 365 vs Microsoft 365
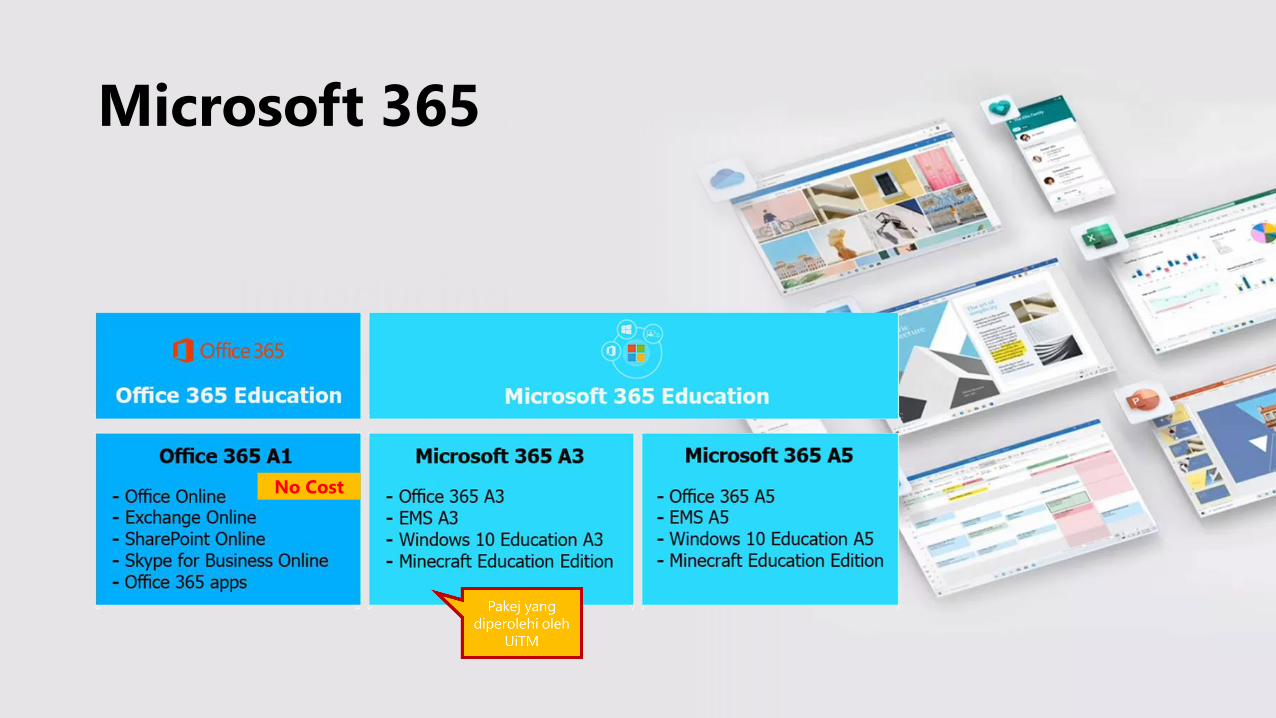
Microsoft 365
No Cost
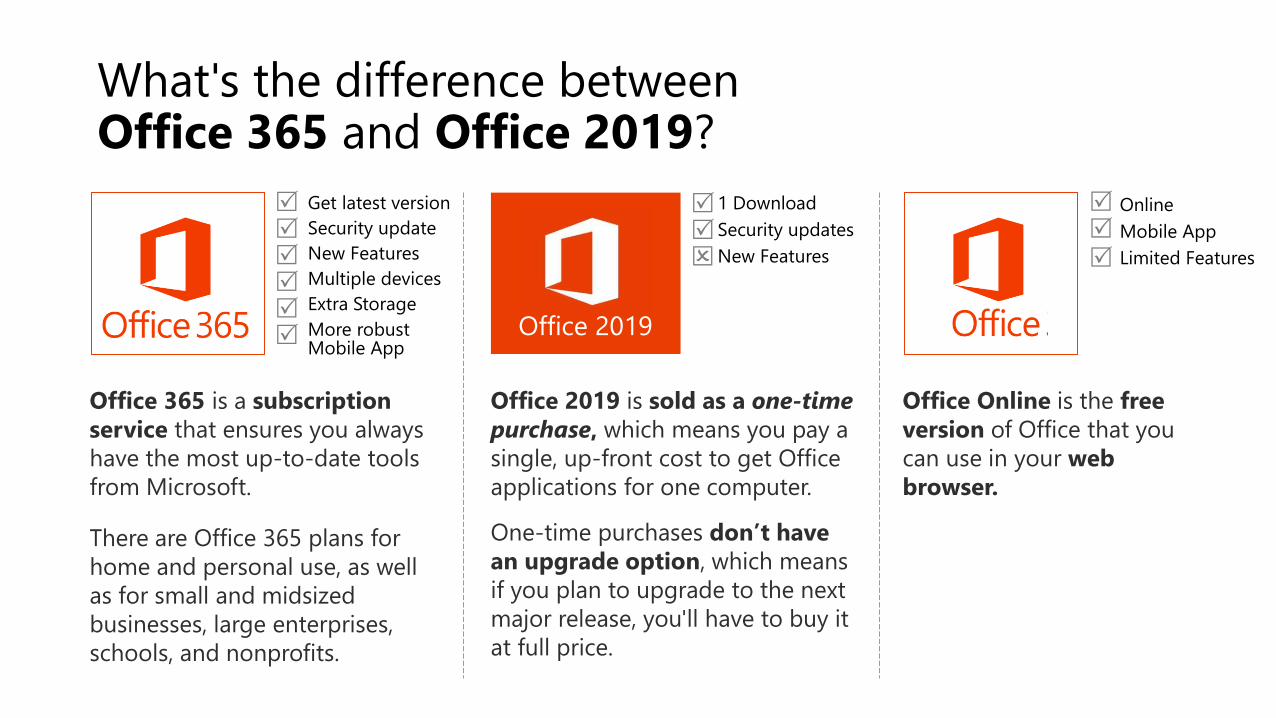
What's the difference between Office 365 and Office 2019?
Office 365 is a subscription
service that ensures you always
have the most up-to-date tools
from Microsoft.
There are Office 365 plans for
home and personal use, as well
as for small and midsized
businesses, large enterprises,
schools, and nonprofits.
Office 2019 is sold as a one-time
purchase, which means you pay a
single, up-front cost to get Office
applications for one computer.
One-time purchases don’t have
an upgrade option, which means
if you plan to upgrade to the next
major release, you'll have to buy it
at full price.
One-time purchases are available
Office Online is the free
version of Office that you
can use in your web
browser.
Office 2019
1 Download
Security updates
New Features
Get latest version
Security update
New Features
Multiple devices
Extra Storage
More robust Mobile App
Online
Mobile App
Limited Features
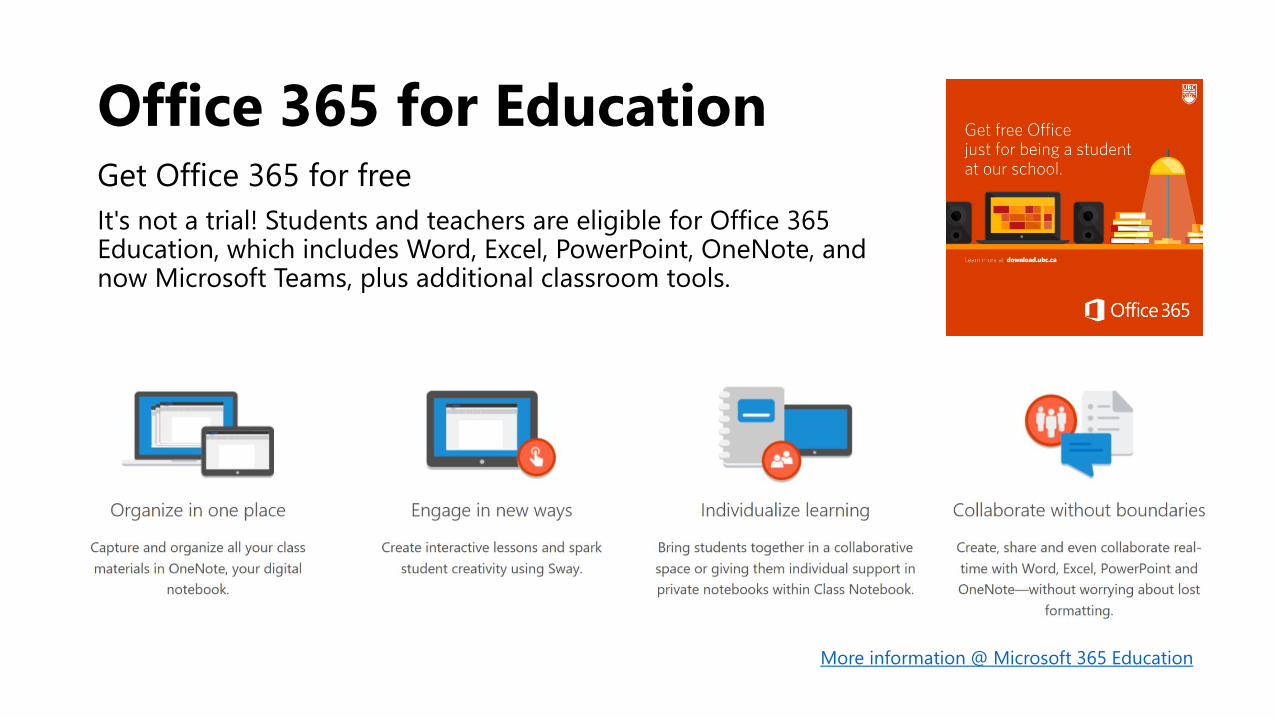
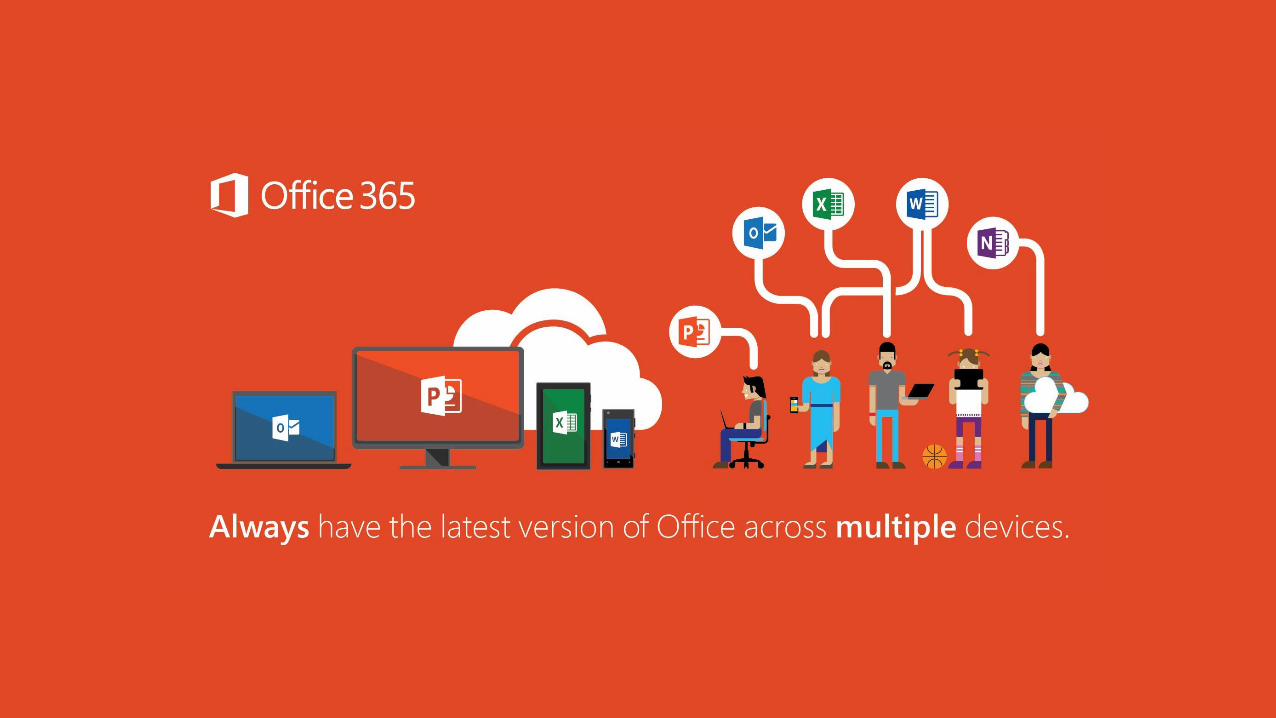
Office 365 for EducationGet Office 365 for free
It's not a trial! Students and teachers are eligible for Office 365 Education, which includes Word, Excel, PowerPoint, OneNote, and now Microsoft Teams, plus additional classroom tools.
More information @ Microsoft 365 Education
What is PowerPoint?
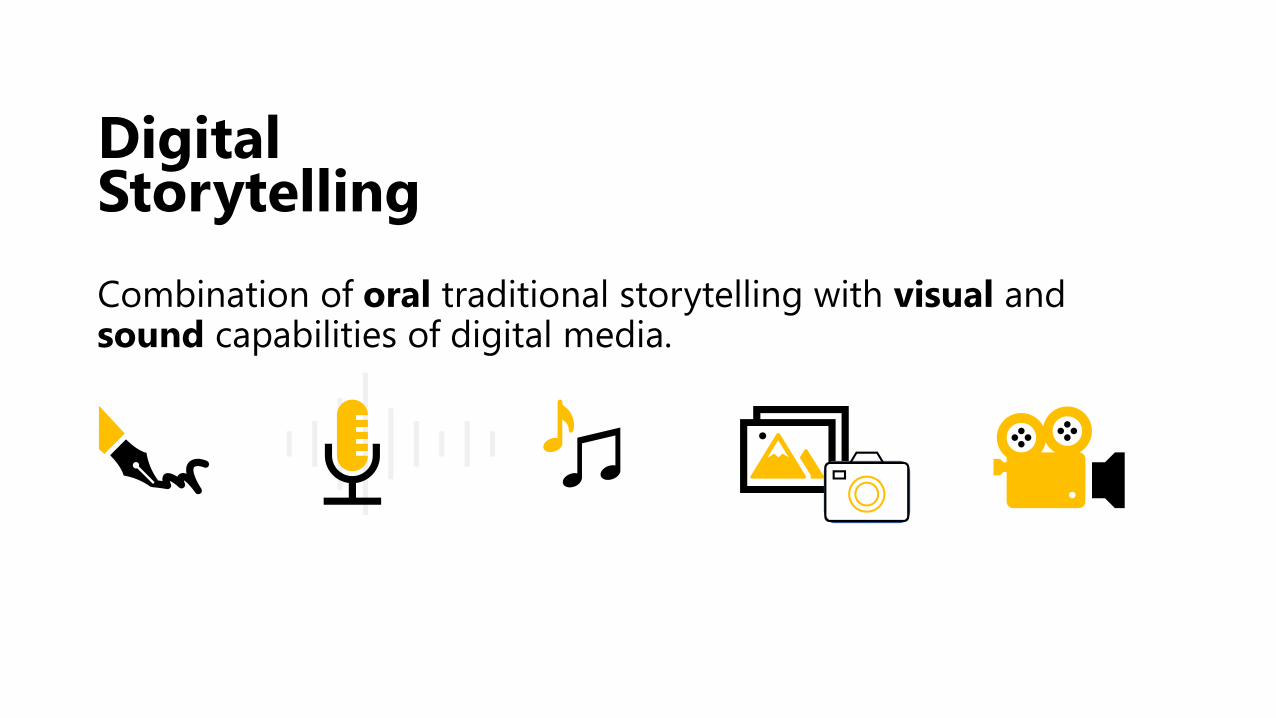
Digital Storytelling
Combination of oral traditional storytelling with visual and sound capabilities of digital media.
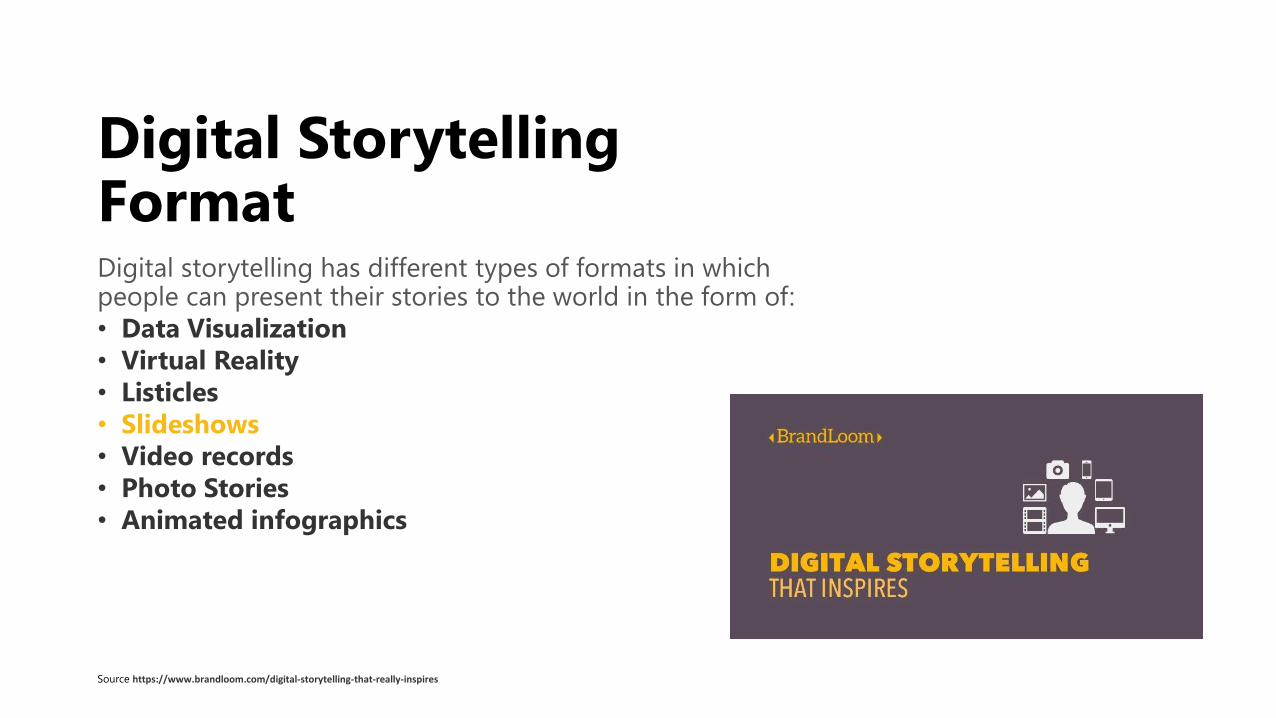
Digital Storytelling FormatDigital storytelling has different types of formats in which people can present their stories to the world in the form of:
• Data Visualization
• Virtual Reality
• Listicles
• Slideshows
• Video records
• Photo Stories
• Animated infographics
Source https://www.brandloom.com/digital-storytelling-that-really-inspires
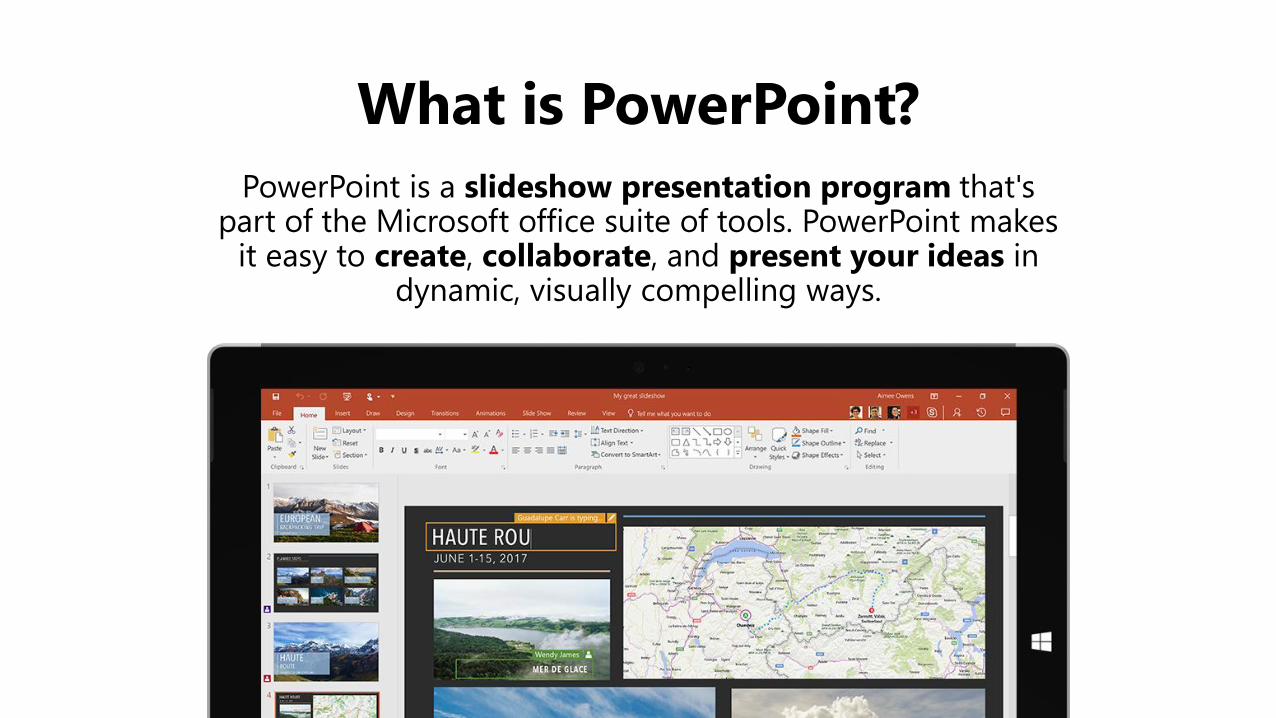
What is PowerPoint?
PowerPoint is a slideshow presentation program that's part of the Microsoft office suite of tools. PowerPoint makes
it easy to create, collaborate, and present your ideas in dynamic, visually compelling ways.
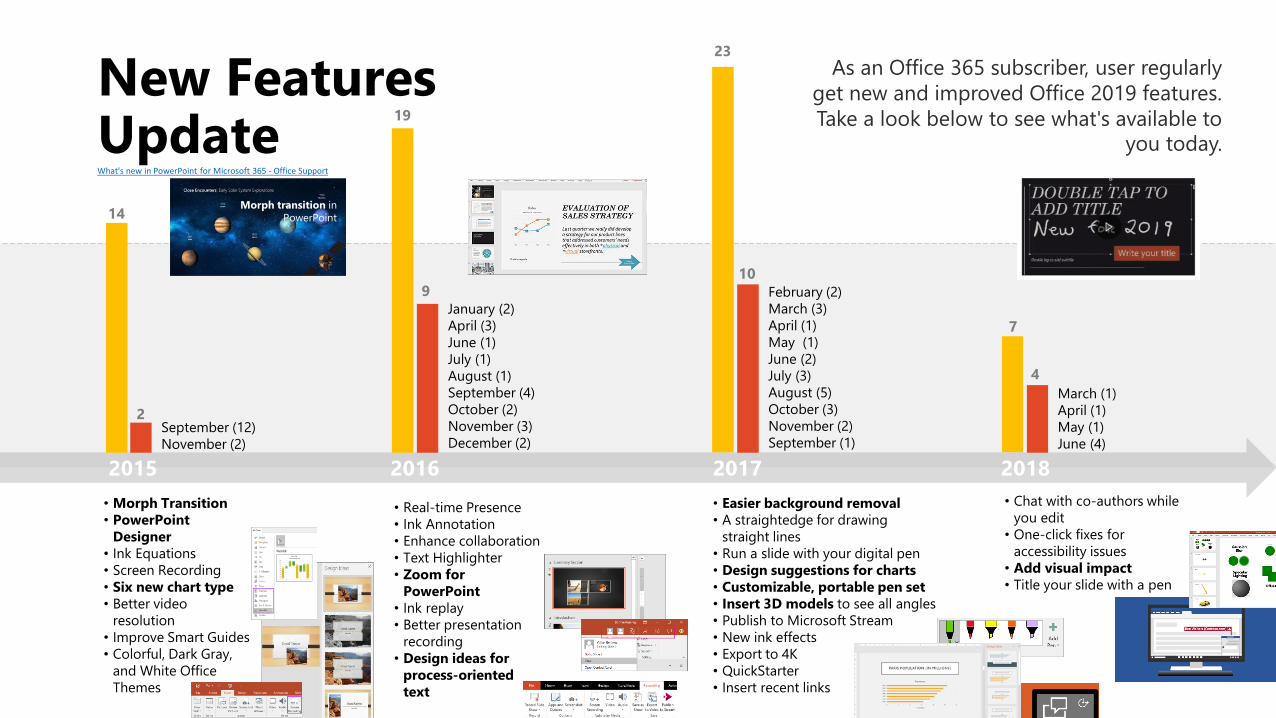
New Features Update
As an Office 365 subscriber, user regularly
get new and improved Office 2019 features.
Take a look below to see what's available to
you today.
2015 2016 2017 2018
• Chat with co-authors while
you edit
• One-click fixes for
accessibility issues
• Add visual impact
• Title your slide with a pen
September (12)
November (2)
January (2)
April (3)
June (1)
July (1)
August (1)
September (4)
October (2)
November (3)
December (2)
February (2)
March (3)
April (1)
May (1)
June (2)
July (3)
August (5)
October (3)
November (2)
September (1)
March (1)
April (1)
May (1)
June (4)
• Morph Transition
• PowerPoint
Designer
• Ink Equations
• Screen Recording
• Six new chart type
• Better video
resolution
• Improve Smart Guides
• Colorful, Dark Gray,
and White Office
Themes
• Real-time Presence
• Ink Annotation
• Enhance collaboration
• Text Highlighter
• Zoom for
PowerPoint
• Ink replay
• Better presentation
recording
• Design ideas for
process-oriented
text
• Easier background removal
• A straightedge for drawing
straight lines
• Run a slide with your digital pen
• Design suggestions for charts
• Customizable, portable pen set
• Insert 3D models to see all angles
• Publish to Microsoft Stream
• New ink effects
• Export to 4K
• QuickStarter
• Insert recent links
14
2
19
9
23
10
7
4
Morph transition in
PowerPoint
What's new in PowerPoint for Microsoft 365 - Office Support
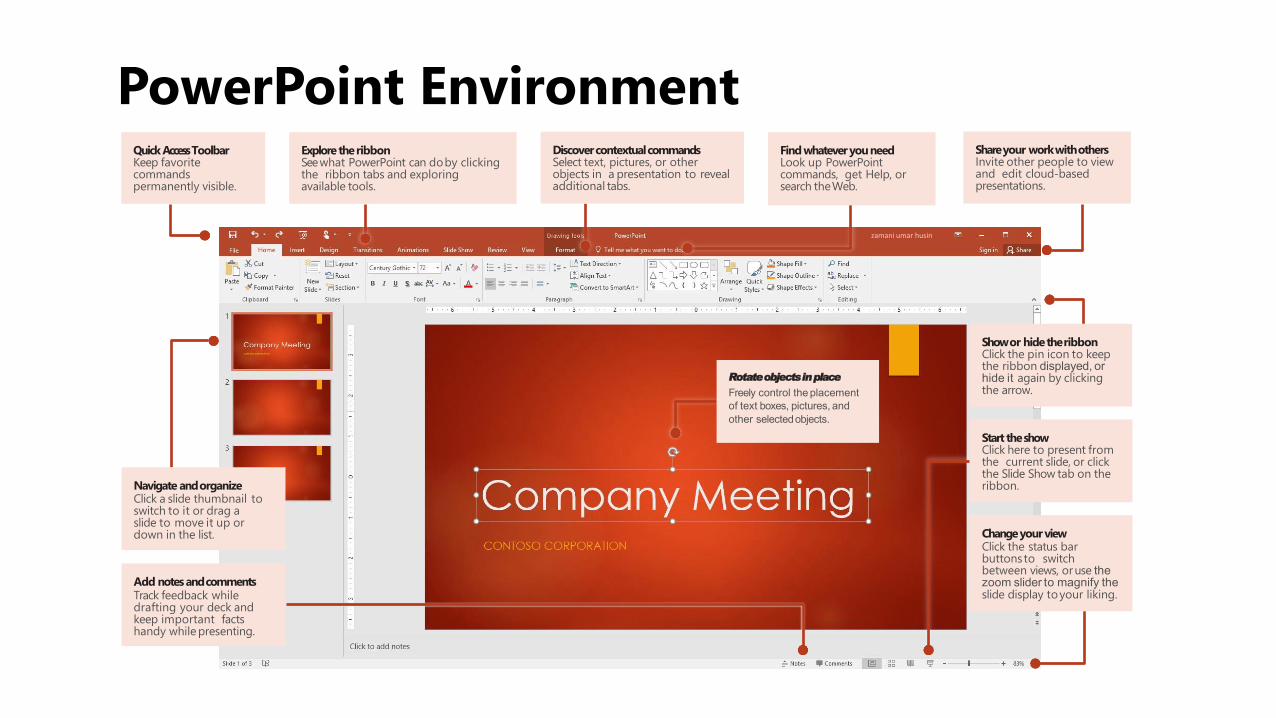
PowerPoint Environment
Navigate andorganizeClick a slide thumbnail to switch to it or drag a slide to move it up ordown in the list.
Start theshowClick here to present fromthe current slide, or clickthe Slide Show tab on theribbon.
Show or hide theribbonClick the pin icon to keepthe ribbon displayed, orhide it again by clickingthe arrow.
Change yourviewClick the status bar buttonsto switch between views, oruse thezoom slider to magnify theslide display toyour liking.
Explore theribbonSee what PowerPoint can doby clicking the ribbon tabs and exploringavailable tools.
Quick AccessToolbarKeep favoritecommands permanently visible.
Discover contextualcommandsSelect text, pictures, or other objects in a presentation to reveal additional tabs.
Share your work withothersInvite other people to viewand edit cloud-basedpresentations.
Rotate objects inplace
Freely control the placement
of text boxes, pictures, and
other selectedobjects.
Add notes andcommentsTrack feedback whiledrafting your deck andkeep important facts handy while presenting.
Find whatever youneedLook up PowerPointcommands, get Help, or search theWeb.
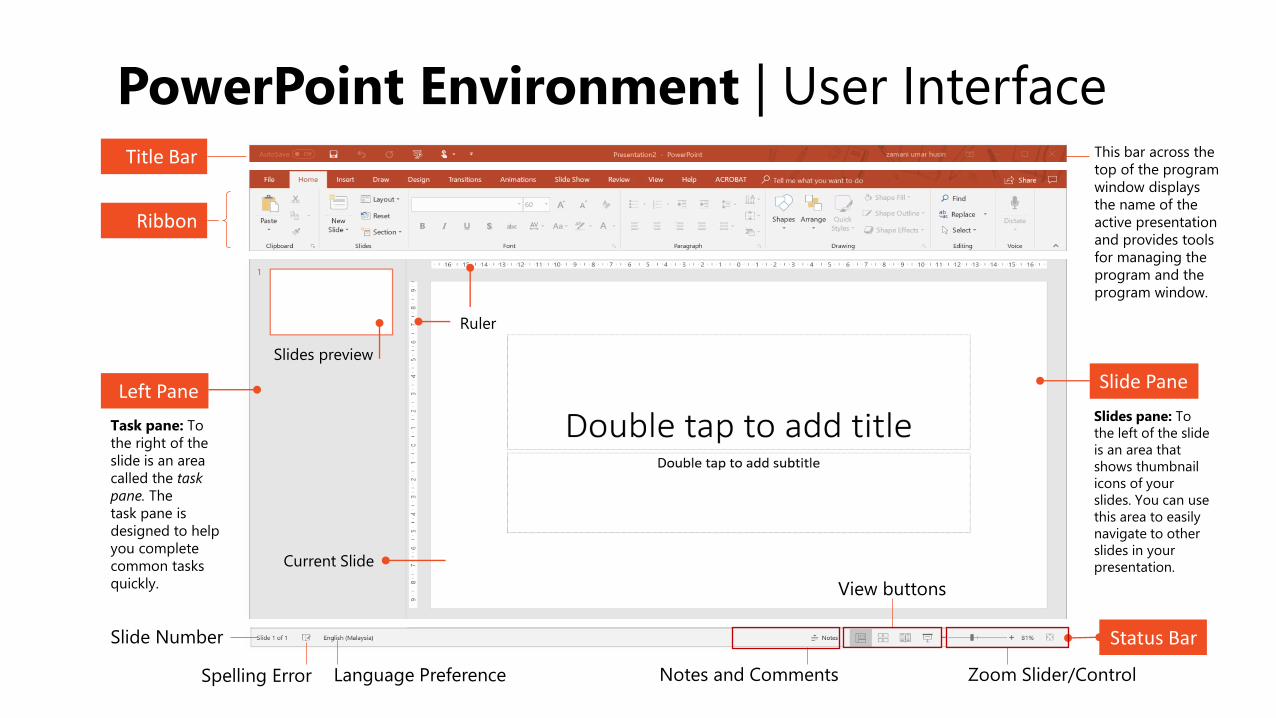
PowerPoint Environment | User InterfaceTitle Bar
Ribbon
Left Pane Slide Pane
Status Bar
Slides pane: To
the left of the slide
is an area that
shows thumbnail
icons of your
slides. You can use
this area to easily
navigate to other
slides in your
presentation.
Task pane: To
the right of the
slide is an area
called the task
pane. The
task pane is
designed to help
you complete
common tasks
quickly.
This bar across the
top of the program
window displays
the name of the
active presentation
and provides tools
for managing the
program and the
program window.
Ruler
Slides preview
Current Slide
Notes and Comments
View buttons
Zoom Slider/Control
Slide Number
Spelling Error Language Preference
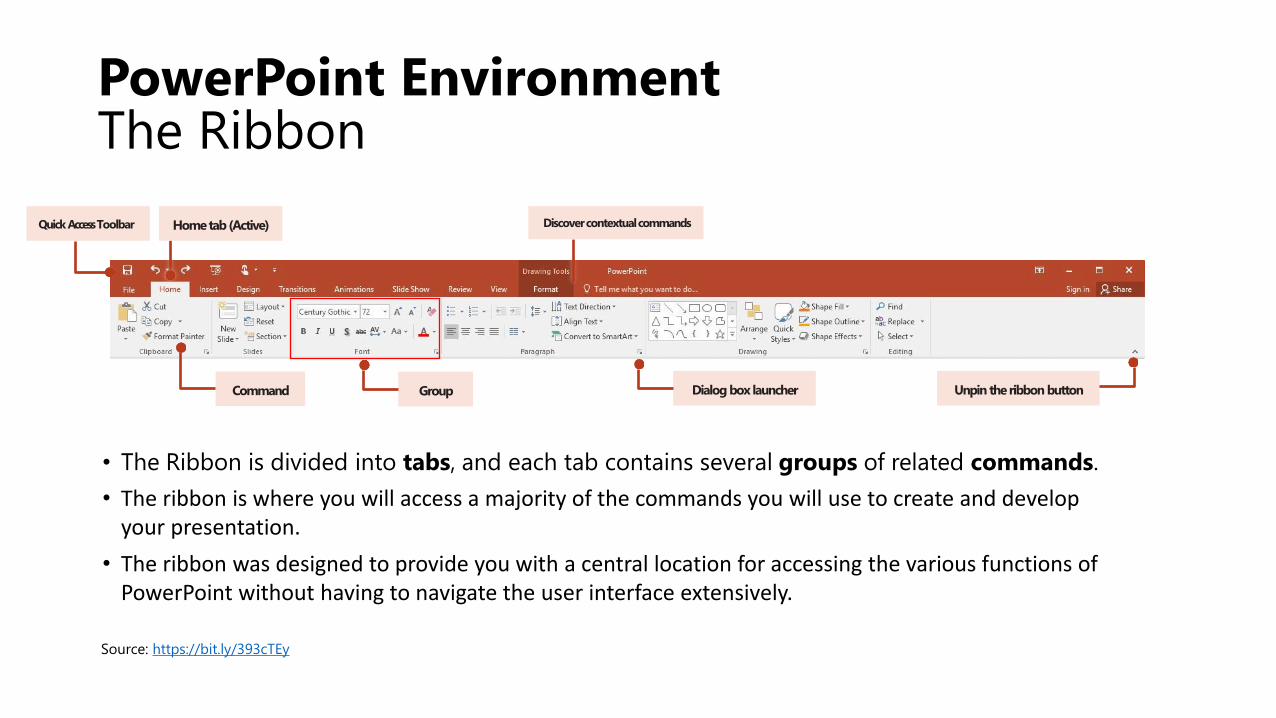
PowerPoint EnvironmentThe Ribbon
• The Ribbon is divided into tabs, and each tab contains several groups of related commands.
• The ribbon is where you will access a majority of the commands you will use to create and develop your presentation.
• The ribbon was designed to provide you with a central location for accessing the various functions of PowerPoint without having to navigate the user interface extensively.
Quick AccessToolbar Home tab (Active)
Dialog box launcher
Discover contextualcommands
Group Unpin the ribbon buttonCommand
Source: https://bit.ly/393cTEy
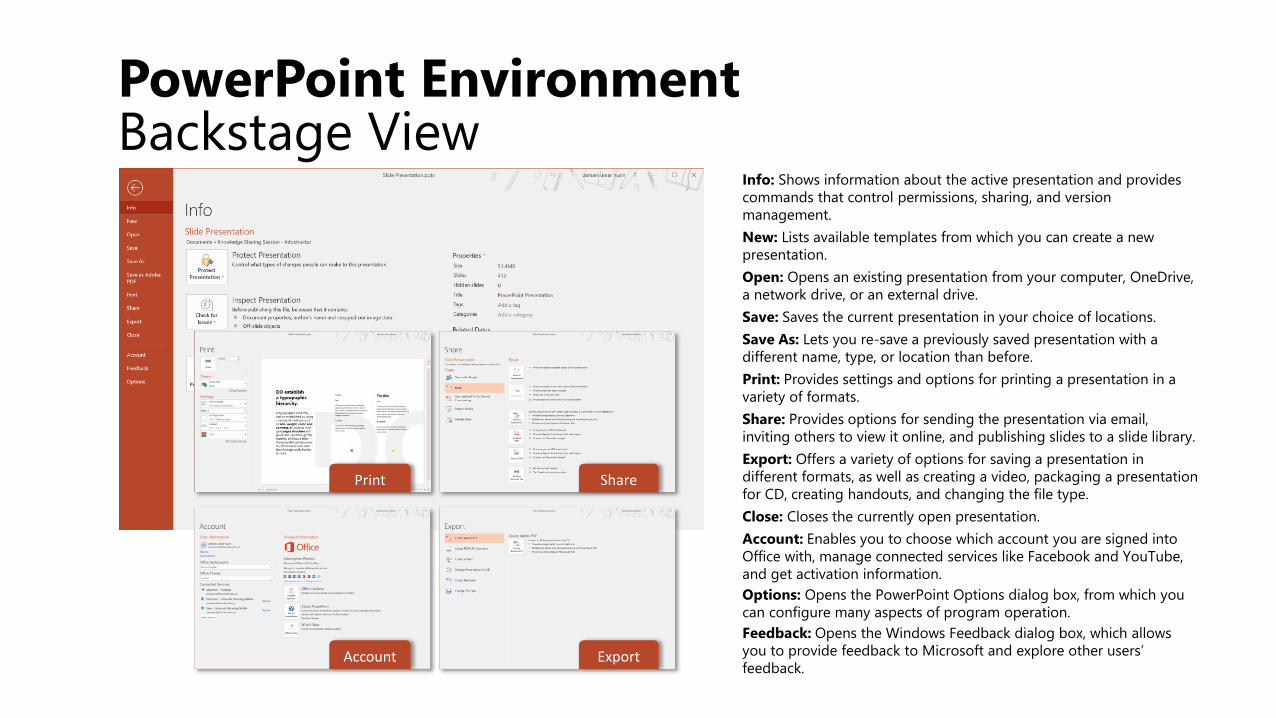
PowerPoint EnvironmentBackstage View
Info: Shows information about the active presentation and provides
commands that control permissions, sharing, and version
management.
New: Lists available templates from which you can create a new
presentation.
Open: Opens an existing presentation from your computer, OneDrive,
a network drive, or an external drive.
Save: Saves the current presentation in your choice of locations.
Save As: Lets you re-save a previously saved presentation with a
different name, type, or location than before.
Print: Provides settings and options for printing a presentation in a
variety of formats.
Share: Provides options for sending the presentation via email,
inviting others to view it online, and publishing slides to a slide library.
Export: Offers a variety of options for saving a presentation in
different formats, as well as creating a video, packaging a presentation
for CD, creating handouts, and changing the file type.
Close: Closes the currently open presentation.
Account: Enables you to choose which account you are signed into
Office with, manage connected services like Facebook and YouTube,
and get activation information.
Options: Opens the PowerPoint Options dialog box, from which you
can configure many aspects of program operation.
Feedback: Opens the Windows Feedback dialog box, which allows
you to provide feedback to Microsoft and explore other users’
feedback.
Print Share
Account Export
Find recentfiles
Stay connected
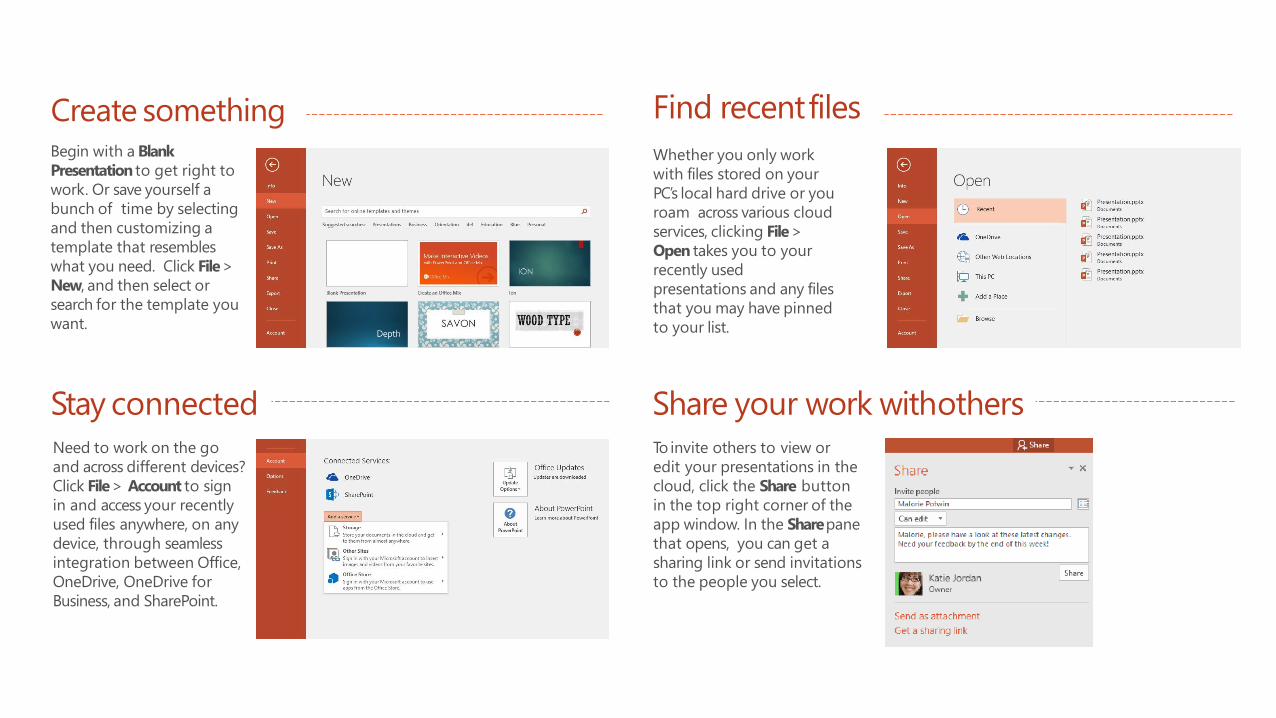
Begin with a Blank
Presentation to get right to
work. Or save yourself a
bunch of time by selecting
and then customizing a
template that resembles
what you need. Click File>
New, and then select or
search for the template you
want.
Share your work withothers
Create something
Whether you only work
with files stored on your
PC’s local hard drive or you
roam across various cloud
services, clicking File >
Open takes you to your
recently used
presentations and any files
that you may have pinned
to your list.
Need to work on the go
and across different devices?
Click File> Account to sign
in and access your recently
used files anywhere, on any
device, through seamless
integration between Office,
OneDrive, OneDrive for
Business, and SharePoint.
To invite others to view or
edit your presentations in the
cloud, click the Share button
in the top right corner of the
app window. In the Sharepane
that opens, you can get a
sharing link or send invitations
to the people you select.
PowerPoint2016Morph images andobjectsGet inspired while you work
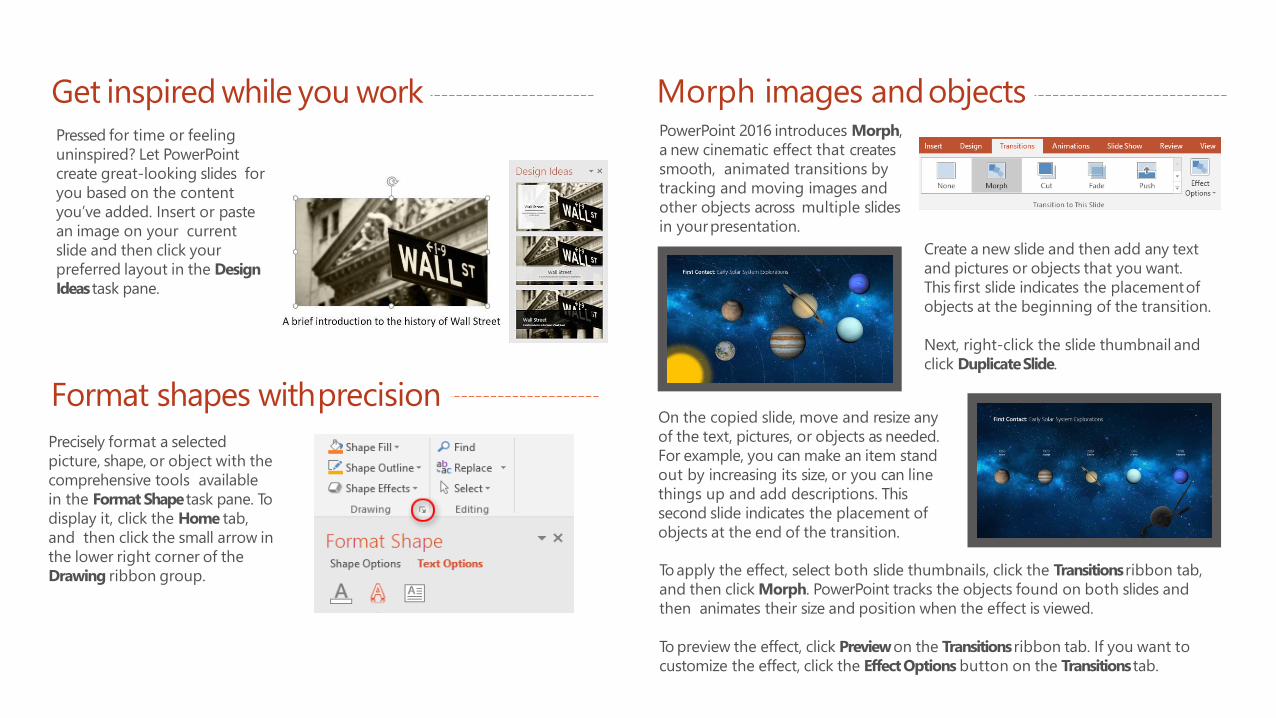
Format shapes withprecisionOn the copied slide, move and resize any
of the text, pictures, or objects as needed.
For example, you can make an item stand
out by increasing its size, or you can line
things up and add descriptions. This
second slide indicates the placement of
objects at the end of the transition.
Create a new slide and then add any text
and pictures or objects that you want.
This first slide indicates the placementof
objects at the beginning of the transition.
Next, right-click the slide thumbnail and
click DuplicateSlide.
Pressed for time or feeling
uninspired? Let PowerPoint
create great-looking slides for
you based on the content
you’ve added. Insert or paste
an image on your current
slide and then click your
preferred layout in the Design
Ideastask pane.
Precisely format a selected
picture, shape, or object with the
comprehensive tools available
in the Format Shape task pane. To
display it, click the Home tab,
and then click the small arrow in
the lower right corner of the
Drawing ribbon group.
PowerPoint 2016 introduces Morph,
a new cinematic effect that creates
smooth, animated transitions by
tracking and moving images and
other objects across multiple slides
in yourpresentation.
To apply the effect, select both slide thumbnails, click the Transitions ribbon tab,
and then click Morph. PowerPoint tracks the objects found on both slides and
then animates their size and position when the effect is viewed.
To preview the effect, click Preview on the Transitions ribbon tab. If you want to
customize the effect, click the EffectOptions button on the Transitions tab.
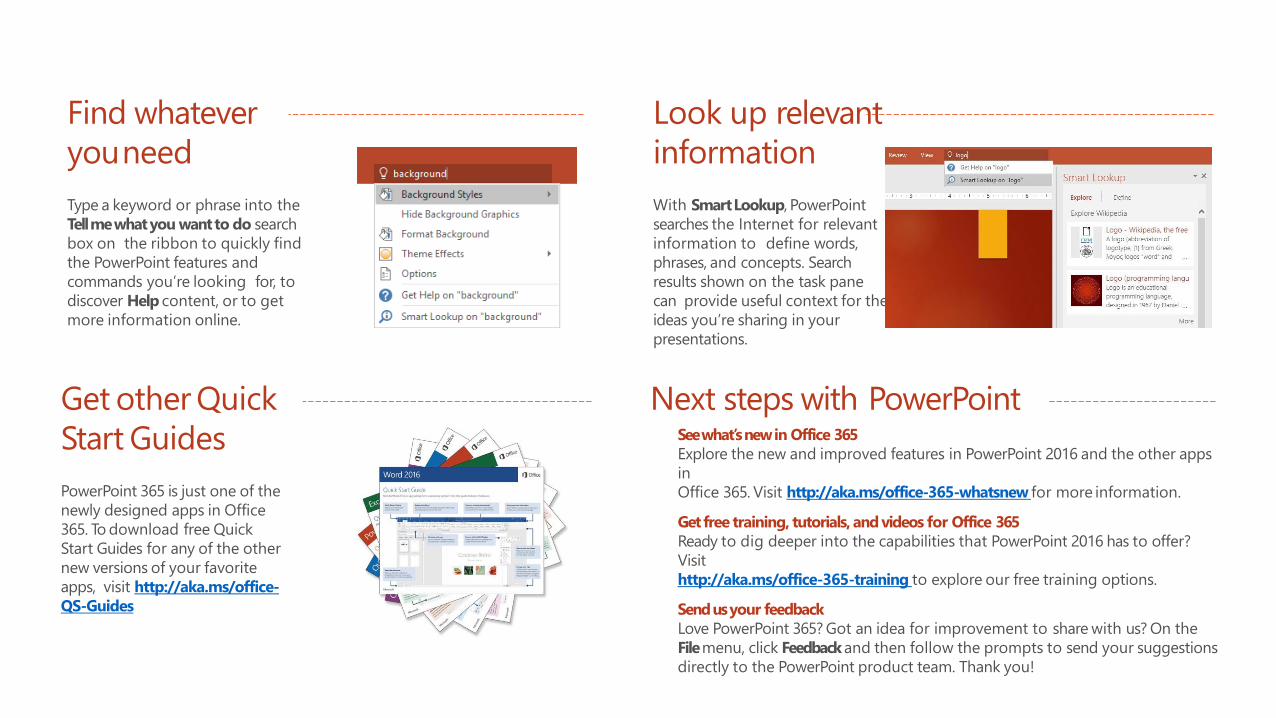
Get other Quick
Start Guides
PowerPoint 365 is just one of the
newly designed apps in Office
365. To download free Quick
Start Guides for any of the other
new versions of your favorite
apps, visit http://aka.ms/office-
QS-Guides
Next steps with PowerPoint
Find whatever
youneed
Type a keyword or phrase into the
Tell me what you want to do search
box on the ribbon to quickly find
the PowerPoint features and
commands you’re looking for, to
discover Help content, or to get
more information online.
Look up relevant
information
With Smart Lookup, PowerPoint
searches the Internet for relevant
information to define words,
phrases, and concepts. Search
results shown on the task pane
can provide useful context for the
ideas you’re sharing in your
presentations.
See what’s new in Office 365
Explore the new and improved features in PowerPoint 2016 and the other apps
in
Office 365. Visit http://aka.ms/office-365-whatsnew for more information.
Get free training, tutorials, and videos for Office 365
Ready to dig deeper into the capabilities that PowerPoint 2016 has to offer?
Visit
http://aka.ms/office-365-training to explore our free training options.
Send us your feedback
Love PowerPoint 365? Got an idea for improvement to share with us? On the
Filemenu, click Feedbackand then follow the prompts to send your suggestions
directly to the PowerPoint product team. Thank you!
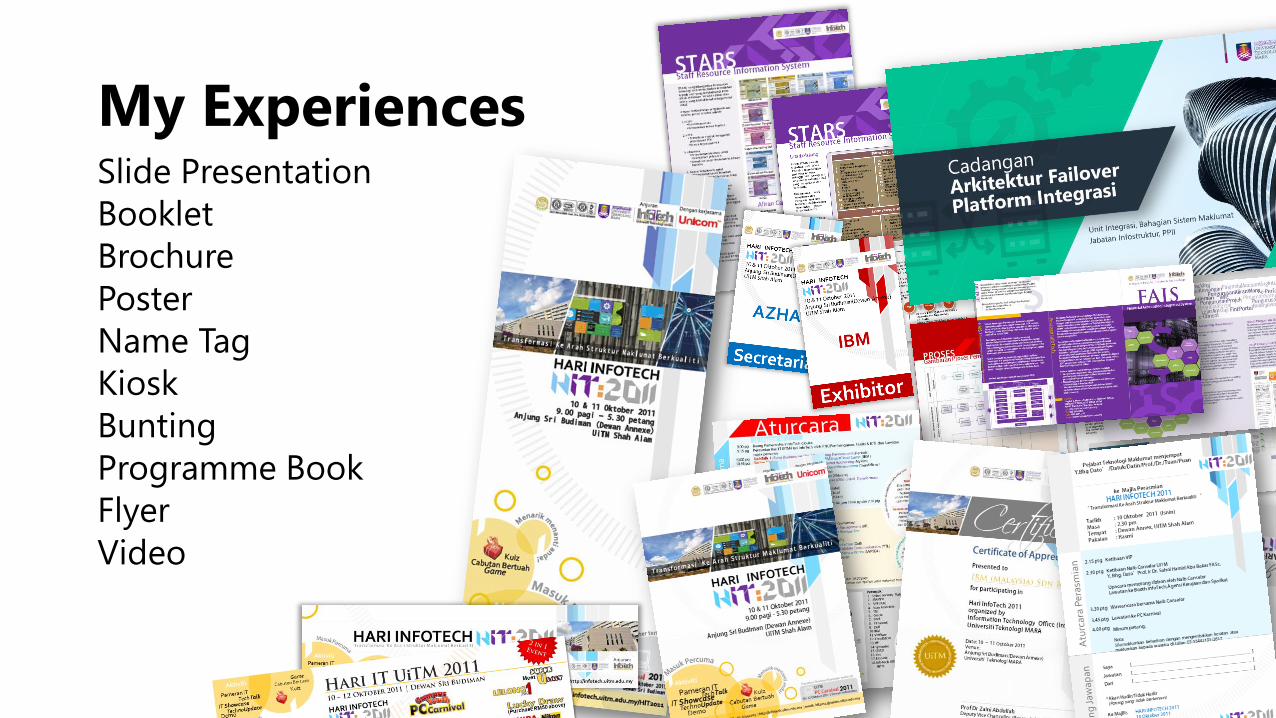
My ExperiencesSlide Presentation
Booklet
Brochure
Poster
Name Tag
Kiosk
Bunting
Programme Book
Flyer
Video
What to do before
designing your presentation?
A N e w W a y t o T h i n k A b o u t P r e s e n t a t i o n s
Lesson 1
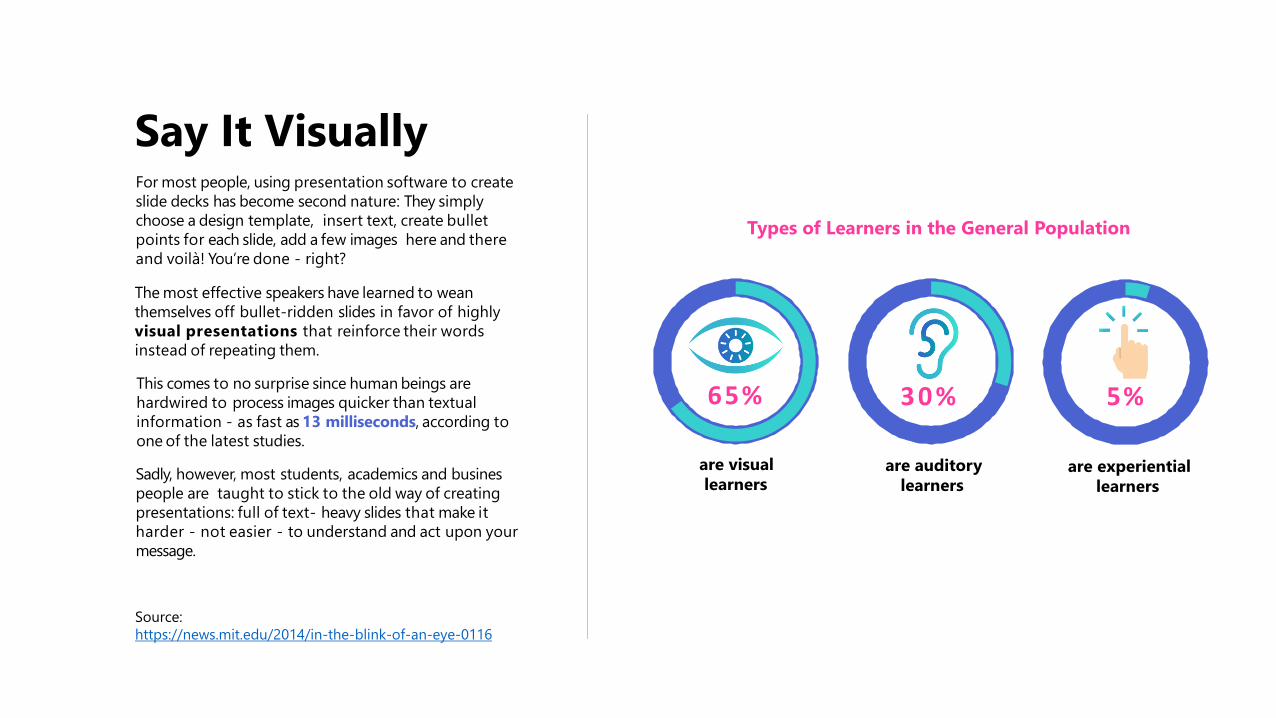
For most people, using presentation software to create
slide decks has become second nature: They simply
choose a design template, insert text, create bullet
points for each slide, add a few images here and there
and voilà! You’re done - right?
The most effective speakers have learned to wean
themselves off bullet-ridden slides in favor of highly
visual presentations that reinforce their words
instead of repeating them.
This comes to no surprise since human beings are
hardwired to process images quicker than textual
information - as fast as 13 milliseconds, according to
one of the latest studies.
Sadly, however, most students, academics and busines
people are taught to stick to the old way of creating
presentations: full of text- heavy slides that make it
harder - not easier - to understand and act upon your
message.
Say It Visually
are visual
learners
65% 3 0 % 5%
Types of Learners in the General Population
are auditory
learnersare experiential
learners
Source:
https://news.mit.edu/2014/in-the-blink-of-an-eye-0116
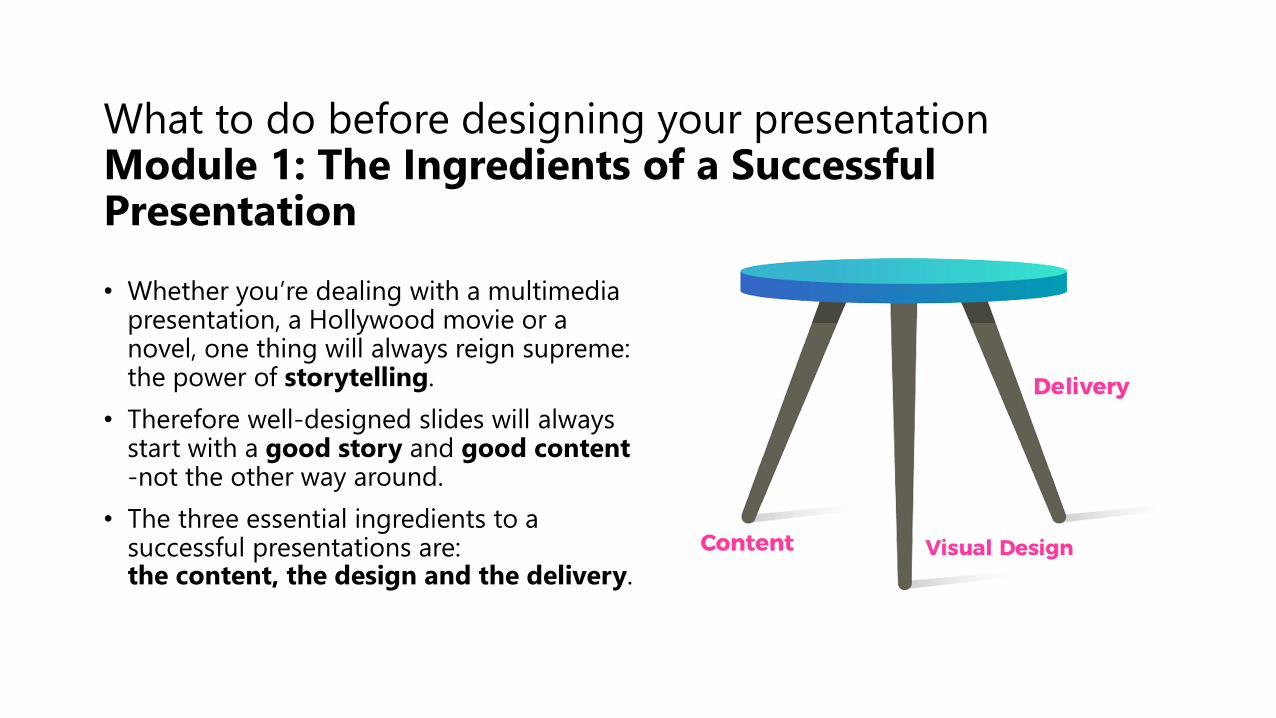
What to do before designing your presentation Module 1: The Ingredients of a Successful Presentation
• Whether you’re dealing with a multimedia presentation, a Hollywood movie or a novel, one thing will always reign supreme: the power of storytelling.
• Therefore well-designed slides will always start with a good story and good content -not the other way around.
• The three essential ingredients to a successful presentations are:the content, the design and the delivery.
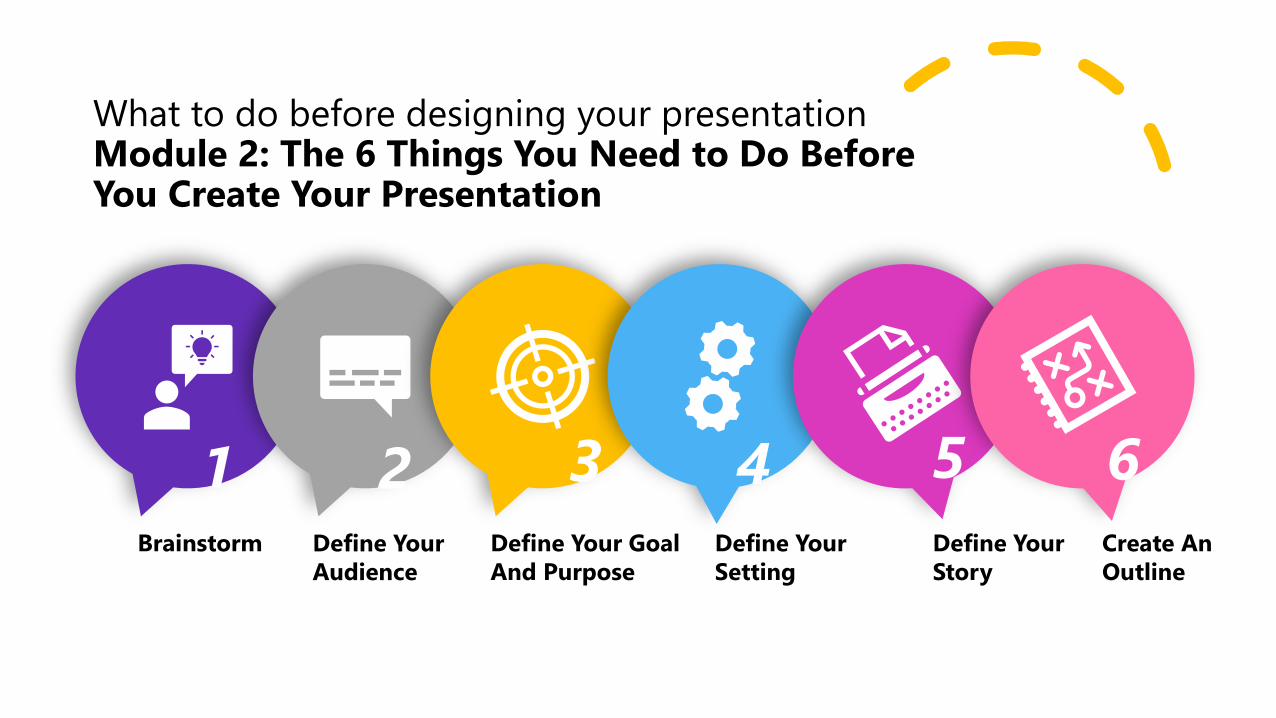
What to do before designing your presentation Module 2: The 6 Things You Need to Do Before You Create Your Presentation
Brainstorm Define Your
Audience
Define Your Goal
And Purpose
Define Your
Setting
Define Your
Story
Create An
Outline
2 3 4 5 61
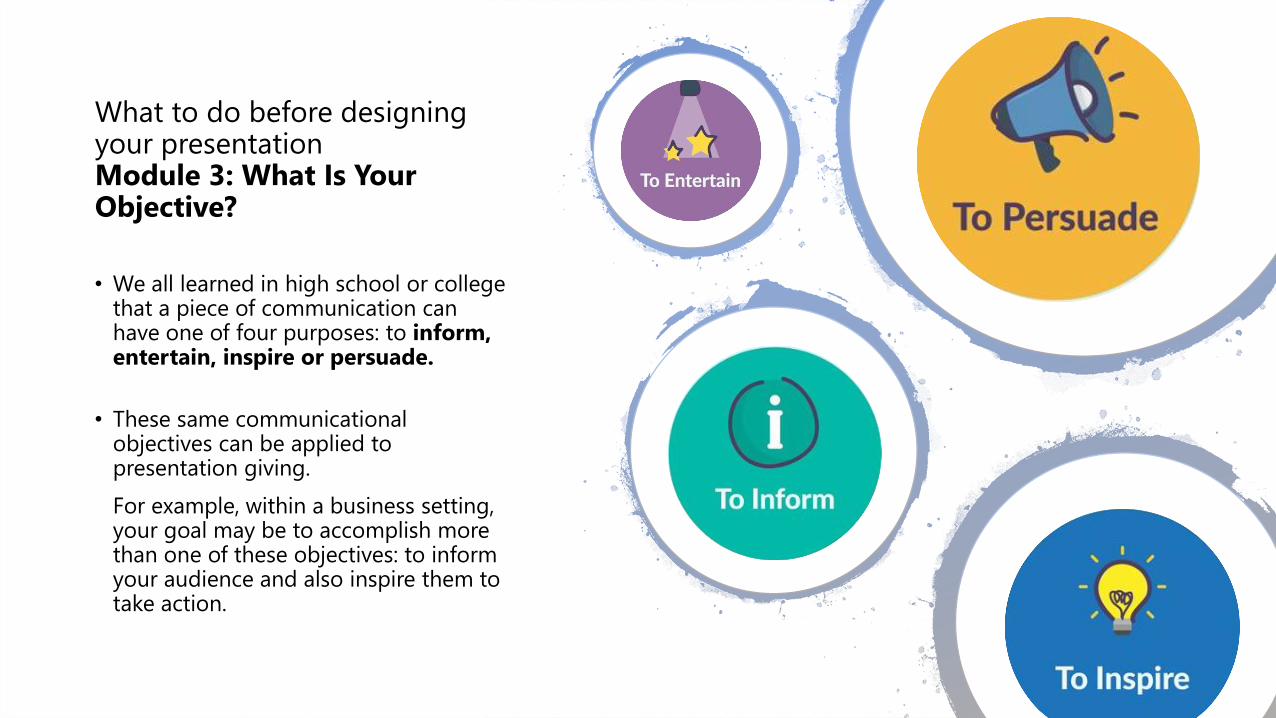
• We all learned in high school or college that a piece of communication can have one of four purposes: to inform, entertain, inspire or persuade.
• These same communicational objectives can be applied to presentation giving.
For example, within a business setting, your goal may be to accomplish more than one of these objectives: to inform your audience and also inspire them to take action.
What to do before designing your presentation Module 3: What Is Your Objective?
What to do before designing your presentation Module 4: What Is Your Message?
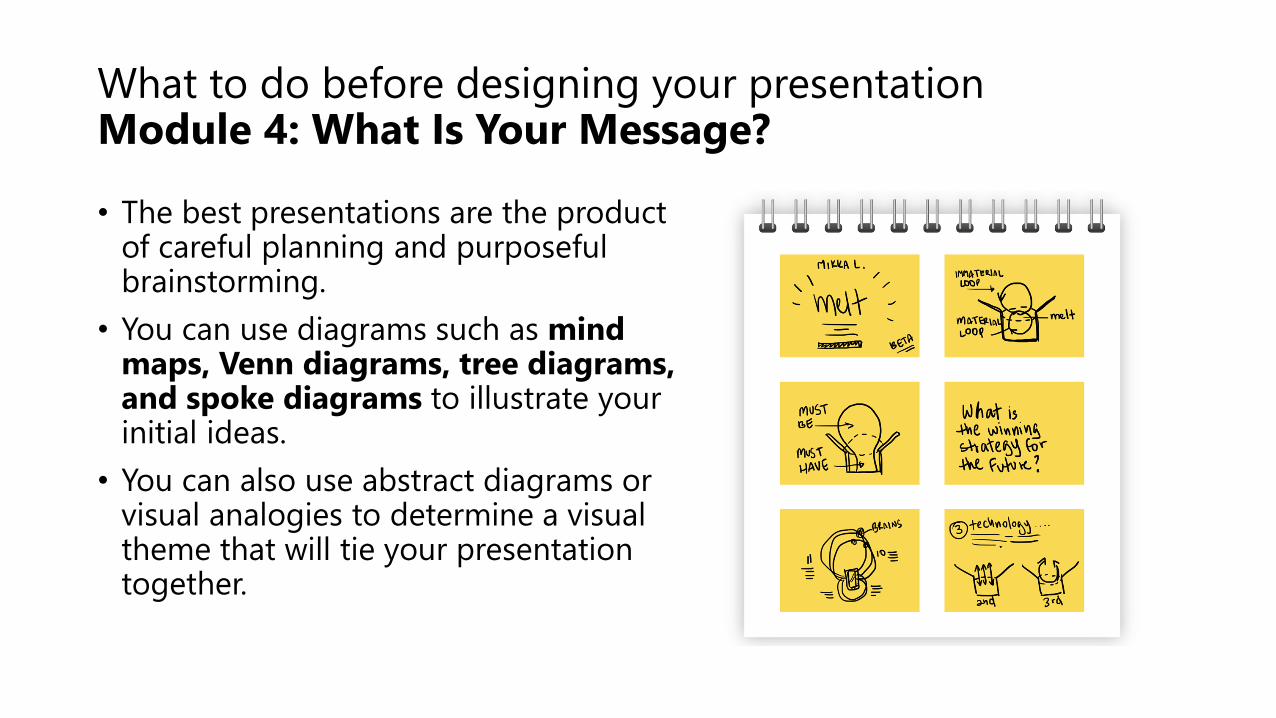
• The best presentations are the product of careful planning and purposeful brainstorming.
• You can use diagrams such as mind maps, Venn diagrams, tree diagrams, and spoke diagrams to illustrate your initial ideas.
• You can also use abstract diagrams or visual analogies to determine a visual theme that will tie your presentation together.
What to do before designing your presentation Module 5: Create Audience Personas
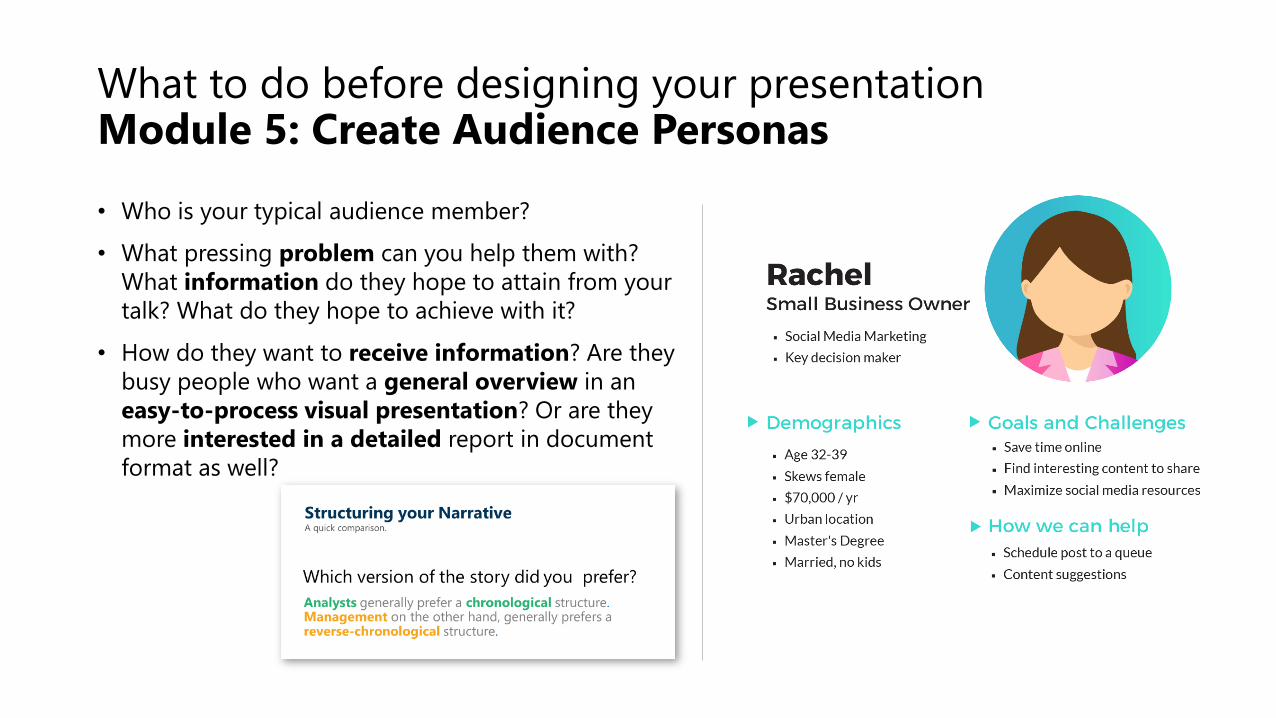
• Who is your typical audience member?
• What pressing problem can you help them with?
What information do they hope to attain from your
talk? What do they hope to achieve with it?
• How do they want to receive information? Are they
busy people who want a general overview in an
easy-to-process visual presentation? Or are they
more interested in a detailed report in document
format as well?
What to do before designing your presentationModule 6: Create an Audience Journey Map
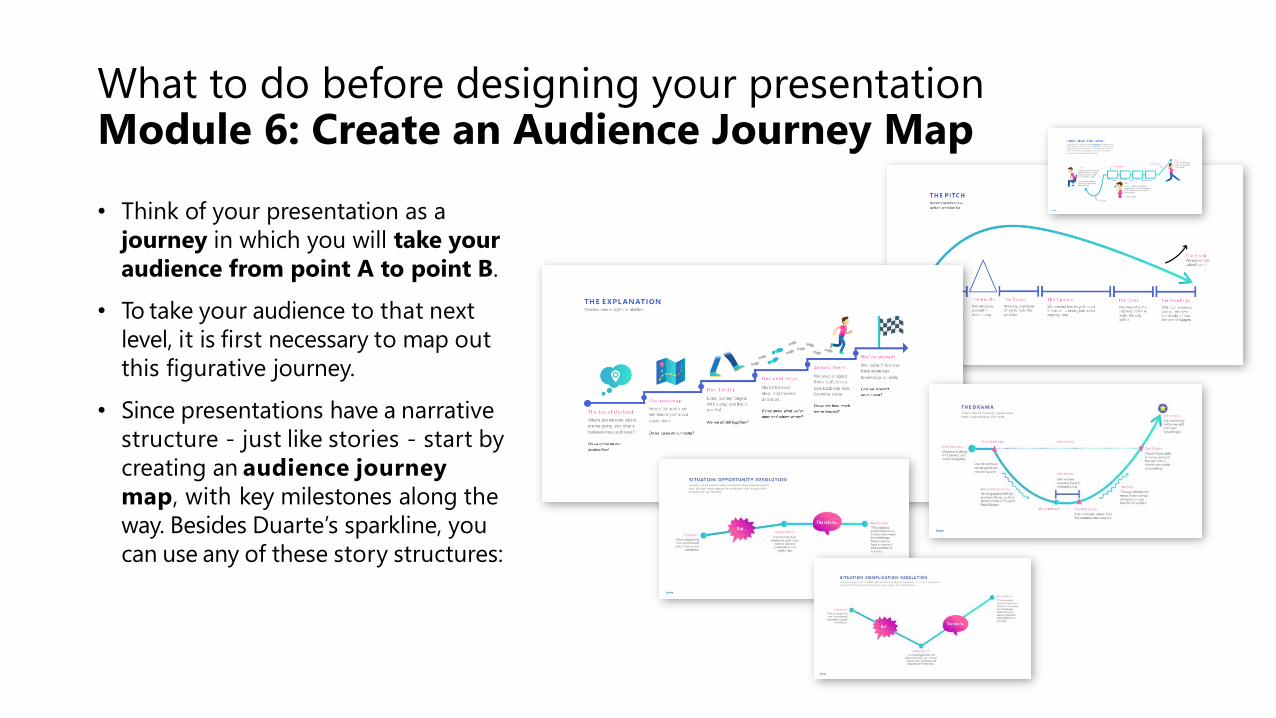
• Think of your presentation as a
journey in which you will take your
audience from point A to point B.
• To take your audience to that next
level, it is first necessary to map out
this figurative journey.
• Since presentations have a narrative
structure - just like stories - start by
creating an audience journey
map, with key milestones along the
way. Besides Duarte’s sparkline, you
can use any of these story structures:
What to do before designing your presentation Module 7: The Big Idea
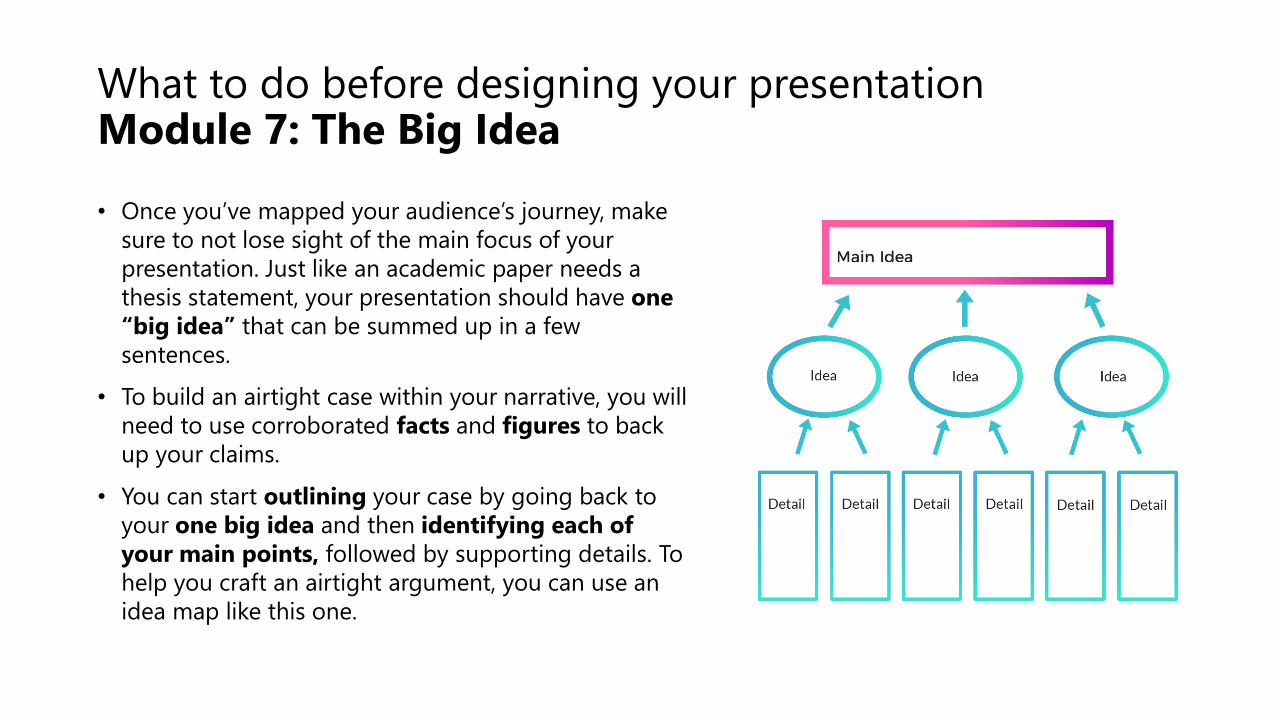
• Once you’ve mapped your audience’s journey, make
sure to not lose sight of the main focus of your
presentation. Just like an academic paper needs a
thesis statement, your presentation should have one
“big idea” that can be summed up in a few
sentences.
• To build an airtight case within your narrative, you will
need to use corroborated facts and figures to back
up your claims.
• You can start outlining your case by going back to
your one big idea and then identifying each of
your main points, followed by supporting details. To
help you craft an airtight argument, you can use an
idea map like this one.
Lesson 2
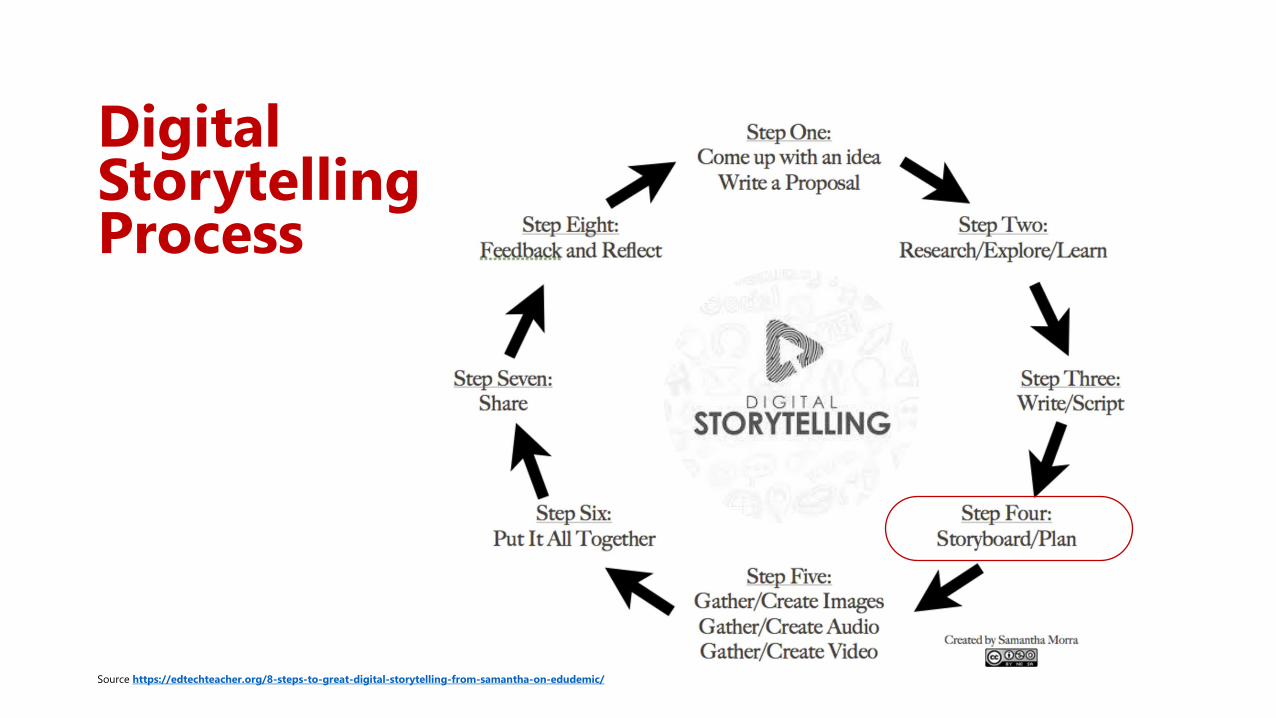
Digital Storytelling Process
Source https://edtechteacher.org/8-steps-to-great-digital-storytelling-from-samantha-on-edudemic/
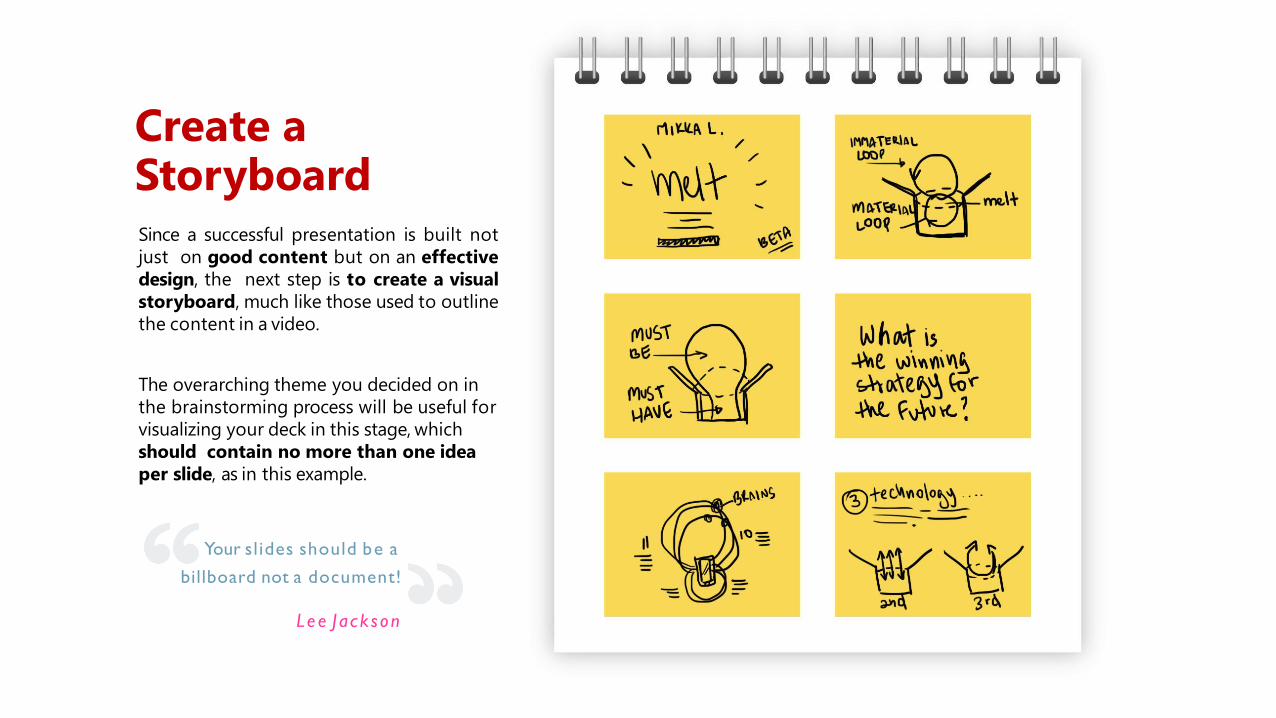
Since a successful presentation is built not
just on good content but on an effective
design, the next step is to create a visual
storyboard, much like those used to outline
the content in a video.
The overarching theme you decided on in
the brainstorming process will be useful for
visualizing your deck in this stage, which
should contain no more than one idea
per slide, as in this example.
Create a Storyboard
Your slides should be a
billboard not a document!
L e e Jac kson
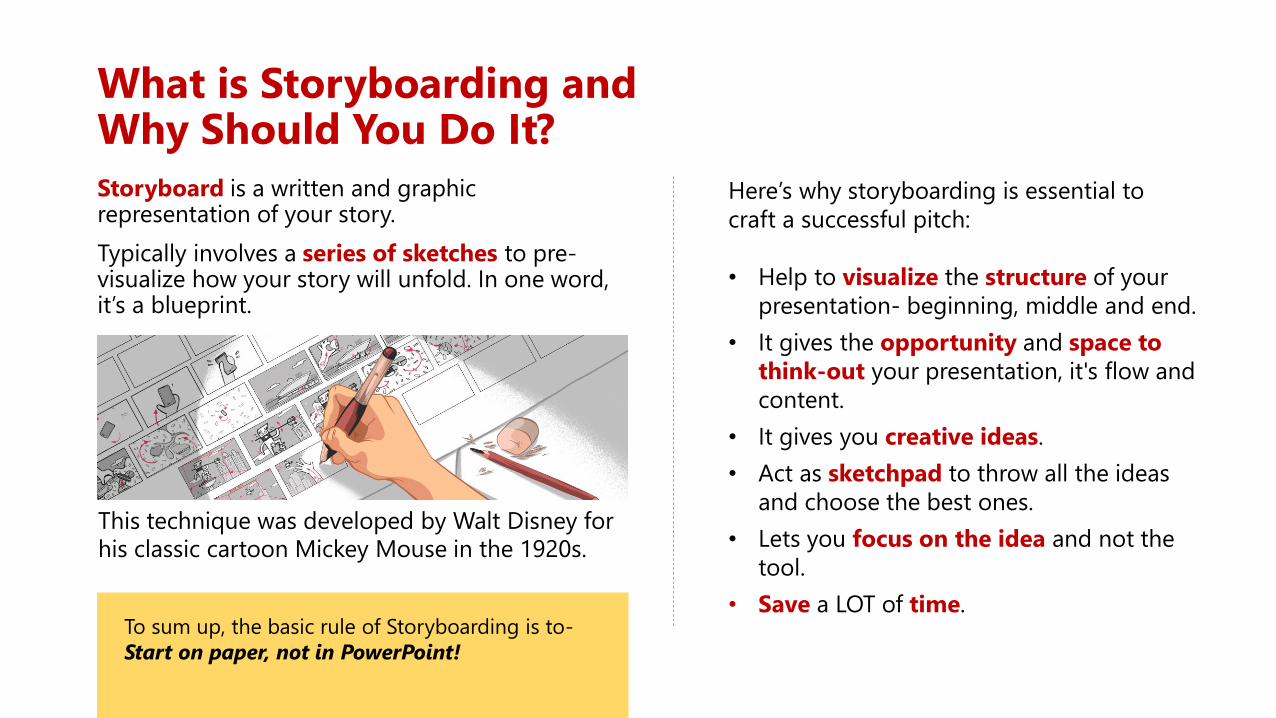
What is Storyboarding and Why Should You Do It?
Storyboard is a written and graphic representation of your story.
Typically involves a series of sketches to pre-visualize how your story will unfold. In one word, it’s a blueprint.
Here’s why storyboarding is essential to
craft a successful pitch:
• Help to visualize the structure of your
presentation- beginning, middle and end.
• It gives the opportunity and space to
think-out your presentation, it's flow and
content.
• It gives you creative ideas.
• Act as sketchpad to throw all the ideas
and choose the best ones.
• Lets you focus on the idea and not the
tool.
• Save a LOT of time.
This technique was developed by Walt Disney for
his classic cartoon Mickey Mouse in the 1920s.
To sum up, the basic rule of Storyboarding is to-
Start on paper, not in PowerPoint!
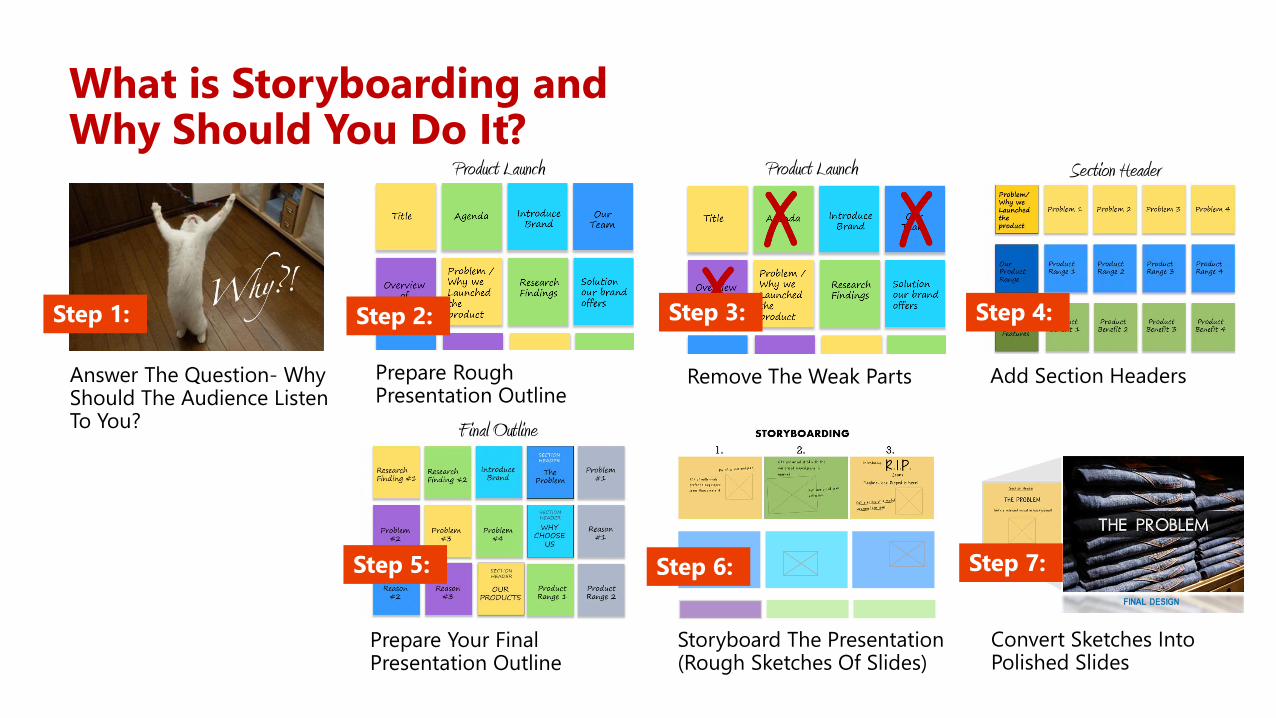
Answer The Question- Why Should The Audience Listen To You?
Prepare Rough Presentation Outline
Remove The Weak Parts Add Section Headers
Prepare Your Final Presentation Outline
Storyboard The Presentation (Rough Sketches Of Slides)
Convert Sketches Into Polished Slides
What is Storyboarding and Why Should You Do It?
Step 1: Step 2: Step 3: Step 4:
Step 5: Step 6: Step 7:
Product Launch Product Launch Section Header
Final Outline
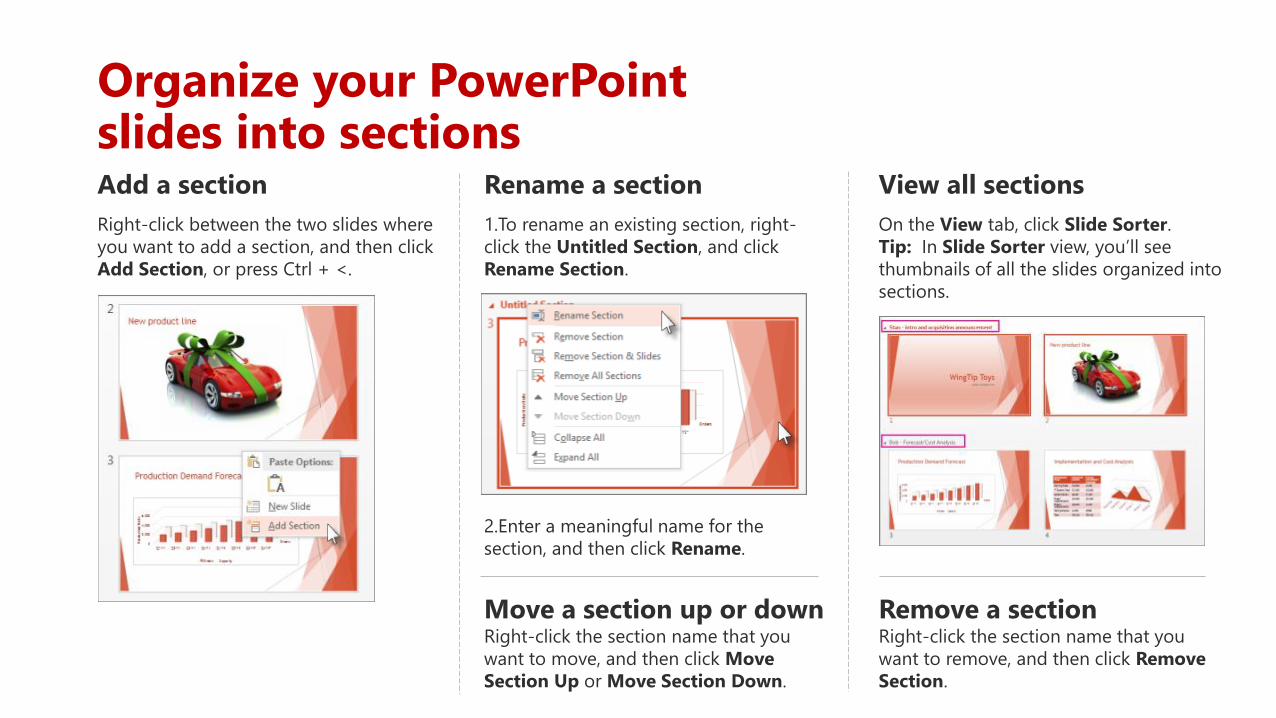
Organize your PowerPoint slides into sectionsAdd a section
Right-click between the two slides where
you want to add a section, and then click
Add Section, or press Ctrl + <.
Move a section up or down Right-click the section name that you
want to move, and then click Move
Section Up or Move Section Down.
View all sections
On the View tab, click Slide Sorter.
Tip: In Slide Sorter view, you’ll see
thumbnails of all the slides organized into
sections.
Rename a section
1.To rename an existing section, right-
click the Untitled Section, and click
Rename Section.
2.Enter a meaningful name for the
section, and then click Rename.
Remove a sectionRight-click the section name that you
want to remove, and then click Remove
Section.
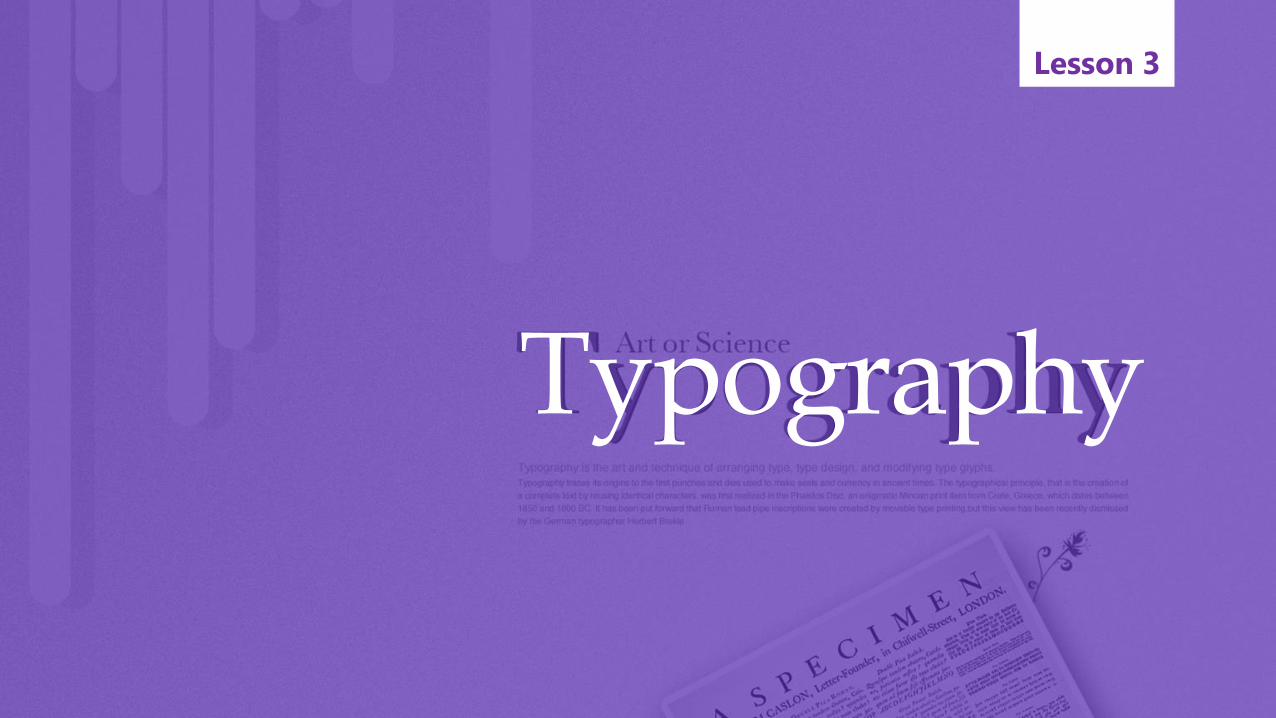
Typography
Lesson 3
How to Handle Text Like a Designer
Quick Tips for Pairing Fonts
What Is Leading?
List Your Favorite Fonts
Pairing Fonts: Before and After Examples
How to Use Images Like a Pro
Types of Images: How to Choose the Right One
Use Full-Screen Images
Use Partial-Bleed Images
Use High-Resolution Images
Cropping Images
Use One Image per Slide
How to Combine Text With Images
Module
Lesson 3: How to combine text and images like a pro.
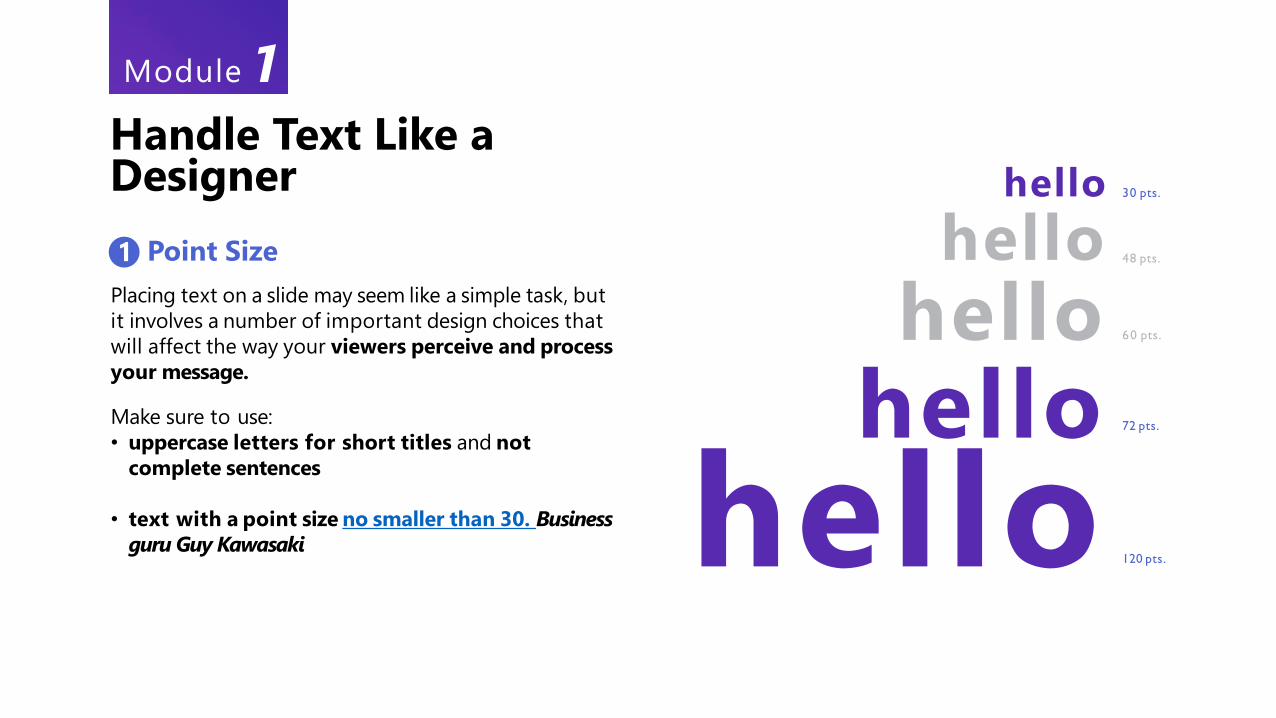
Placing text on a slide may seem like a simple task, but
it involves a number of important design choices that
will affect the way your viewers perceive and process
your message.
Make sure to use:
• uppercase letters for short titles and not
complete sentences
• text with a point size no smaller than 30. Business
guru Guy Kawasaki
Handle Text Like a Designer
1 Point Size
hello 30 pts.
72 pts.
120 pts.
48 pts.
60 pts.
hello
hello
hello
hello
Module 1
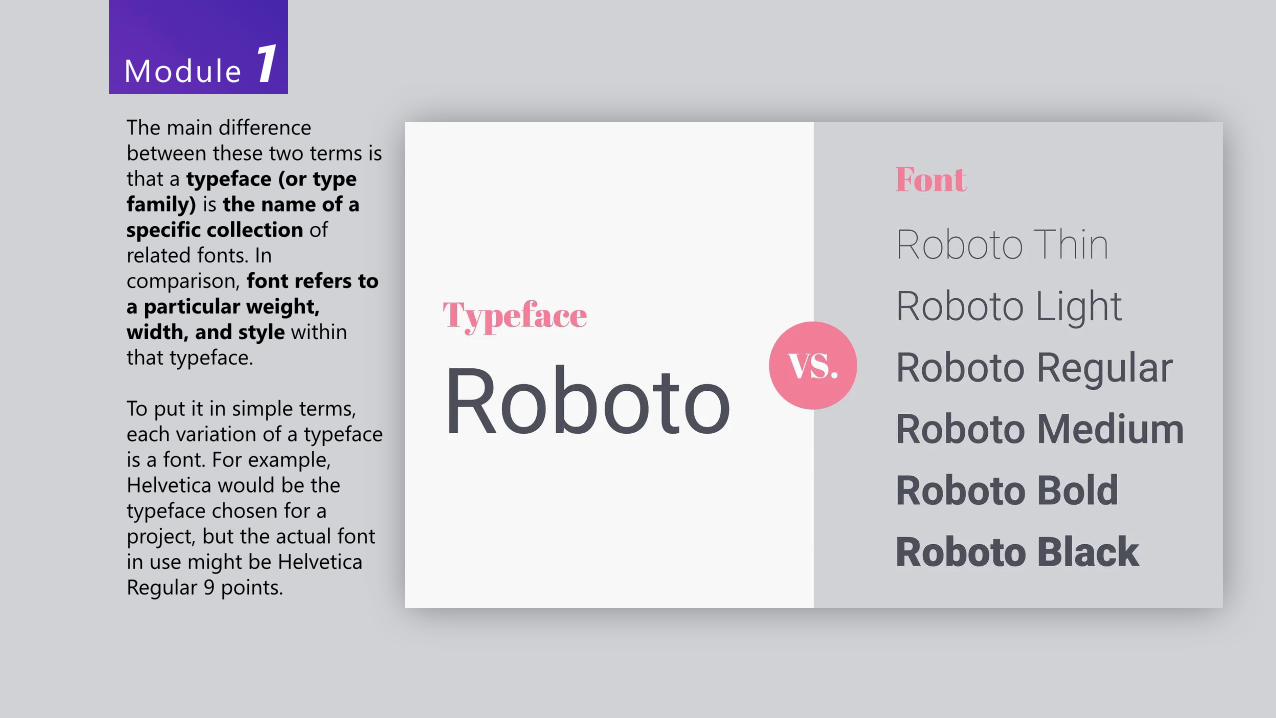
Module 1The main difference
between these two terms is
that a typeface (or type
family) is the name of a
specific collection of
related fonts. In
comparison, font refers to
a particular weight,
width, and style within
that typeface.
To put it in simple terms,
each variation of a typeface
is a font. For example,
Helvetica would be the
typeface chosen for a
project, but the actual font
in use might be Helvetica
Regular 9 points.
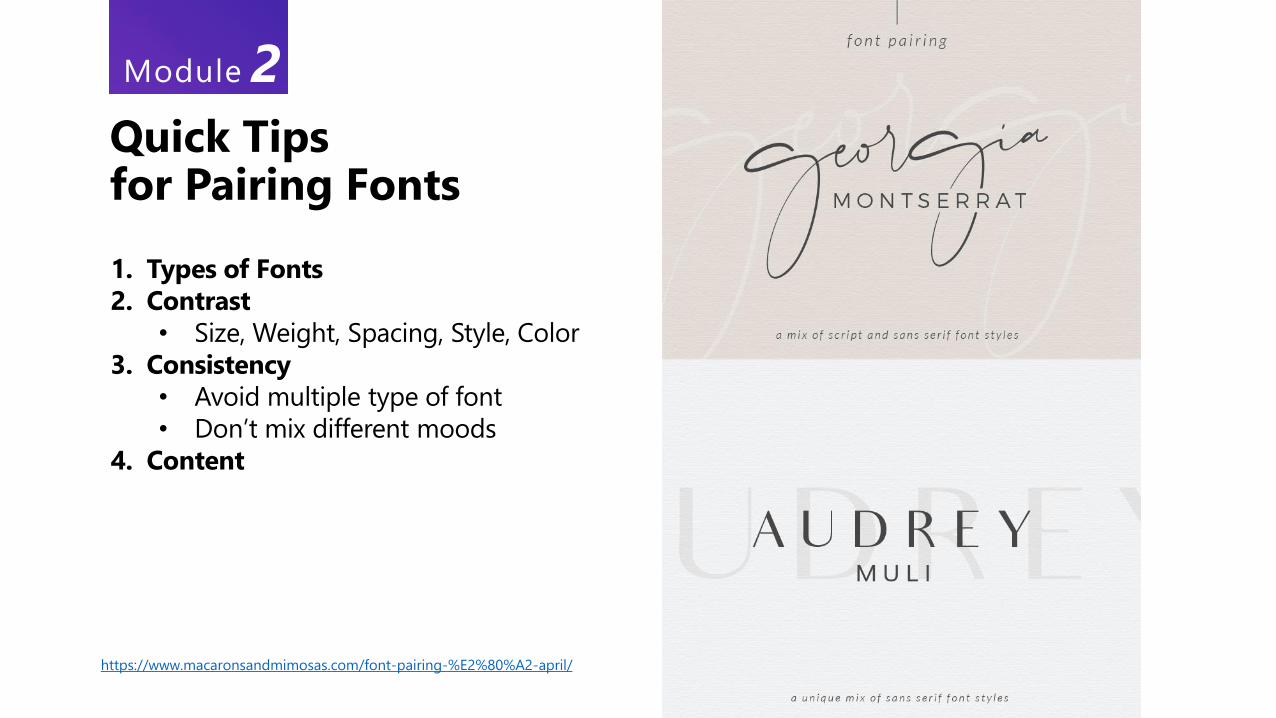
1. Types of Fonts
2. Contrast
• Size, Weight, Spacing, Style, Color
3. Consistency
• Avoid multiple type of font
• Don’t mix different moods
4. Content
Quick Tips for Pairing Fonts
Module 2
https://www.macaronsandmimosas.com/font-pairing-%E2%80%A2-april/
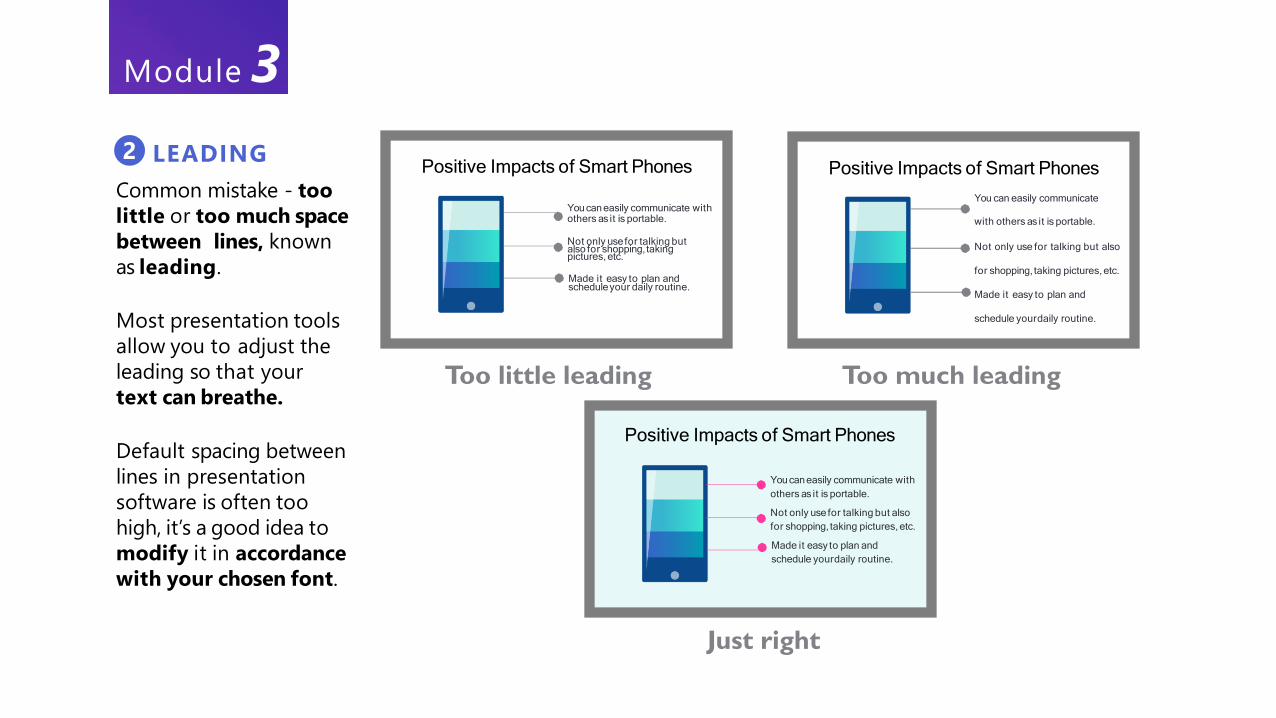
Common mistake - too
little or too much space
between lines, known
as leading.
Most presentation tools
allow you to adjust the
leading so that your
text can breathe.
Default spacing between
lines in presentation
software is often too
high, it’s a good idea to
modify it in accordance
with your chosen font.
LEADING2Positive Impacts of Smart Phones
Youcaneasily communicate withothers as it is portable.
Not only usefor talking butalso for shopping,takingpictures, etc.
Made it easy to plan and scheduleyour daily routine.
Positive Impacts of Smart Phones
You can easily communicate
with others as it is portable.
Not only use for talking but also
for shopping, taking pictures, etc.
Made it easy to plan and
schedule yourdaily routine.
Positive Impacts of Smart Phones
Youcaneasily communicate with
others as it is portable.
Not only use for talking but also
for shopping, taking pictures, etc.
Made it easy to plan and
schedule yourdaily routine.
Too little leading Too much leading
Just right
Module 3
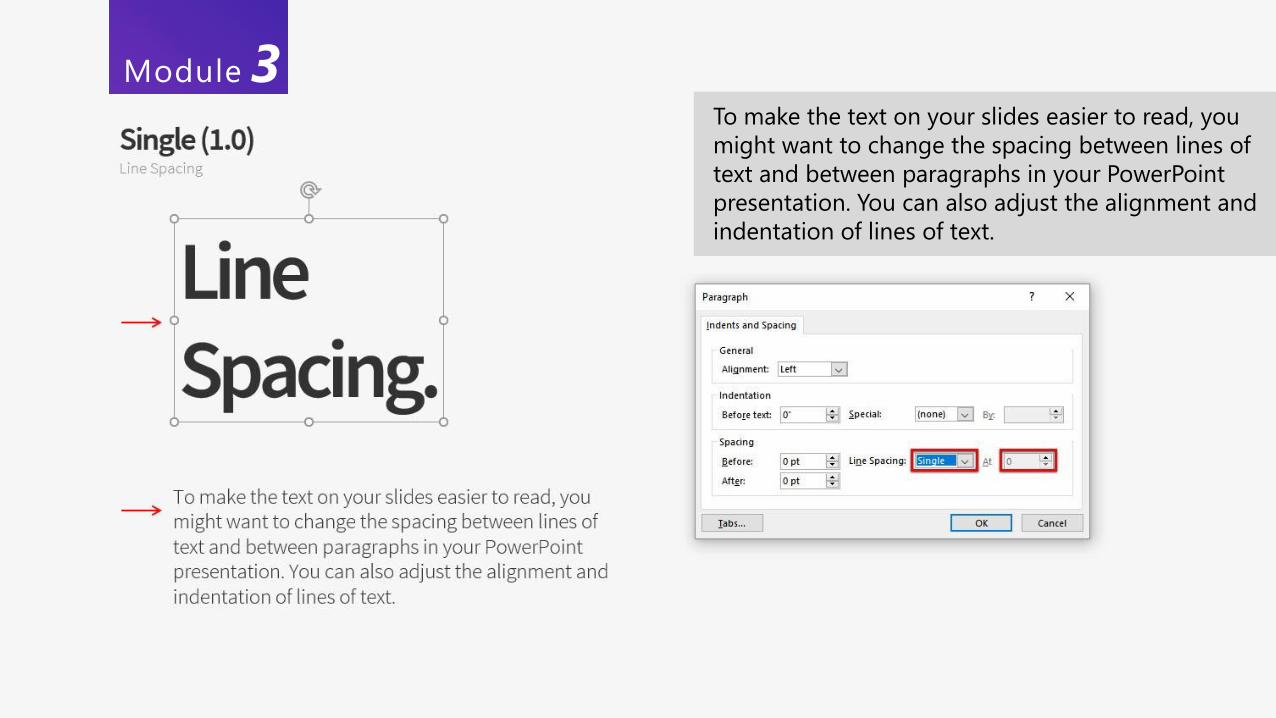
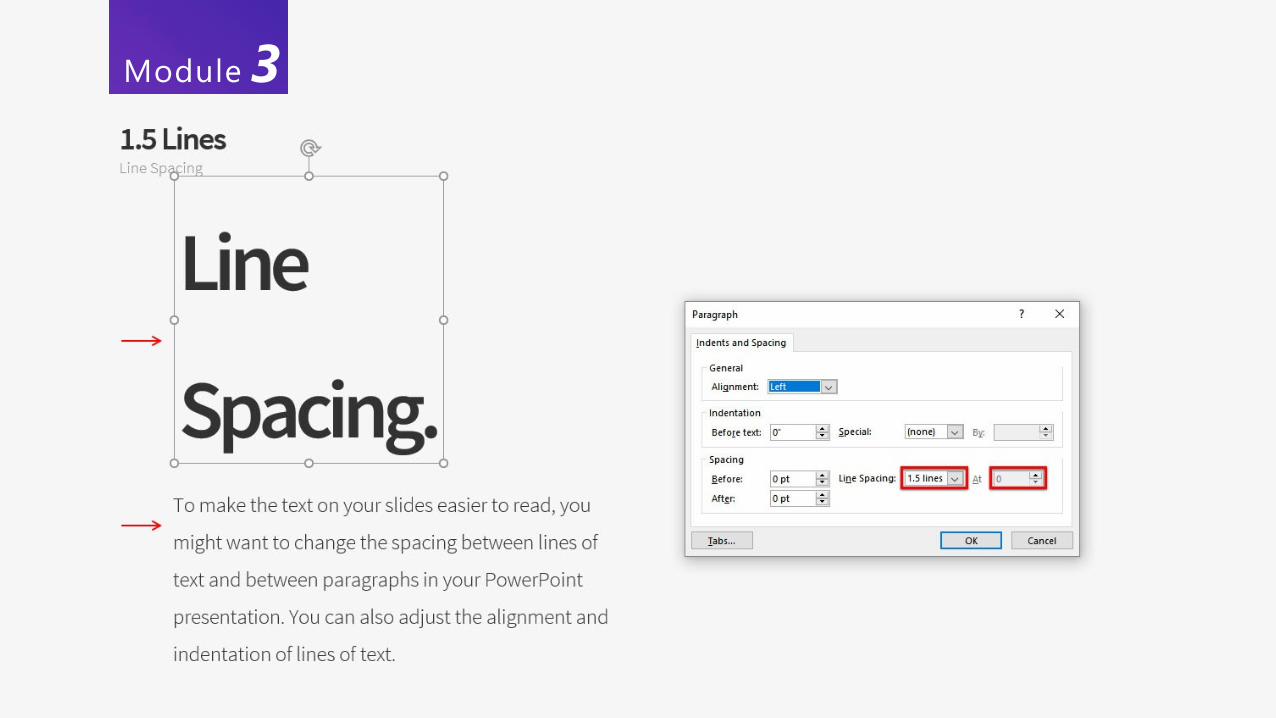
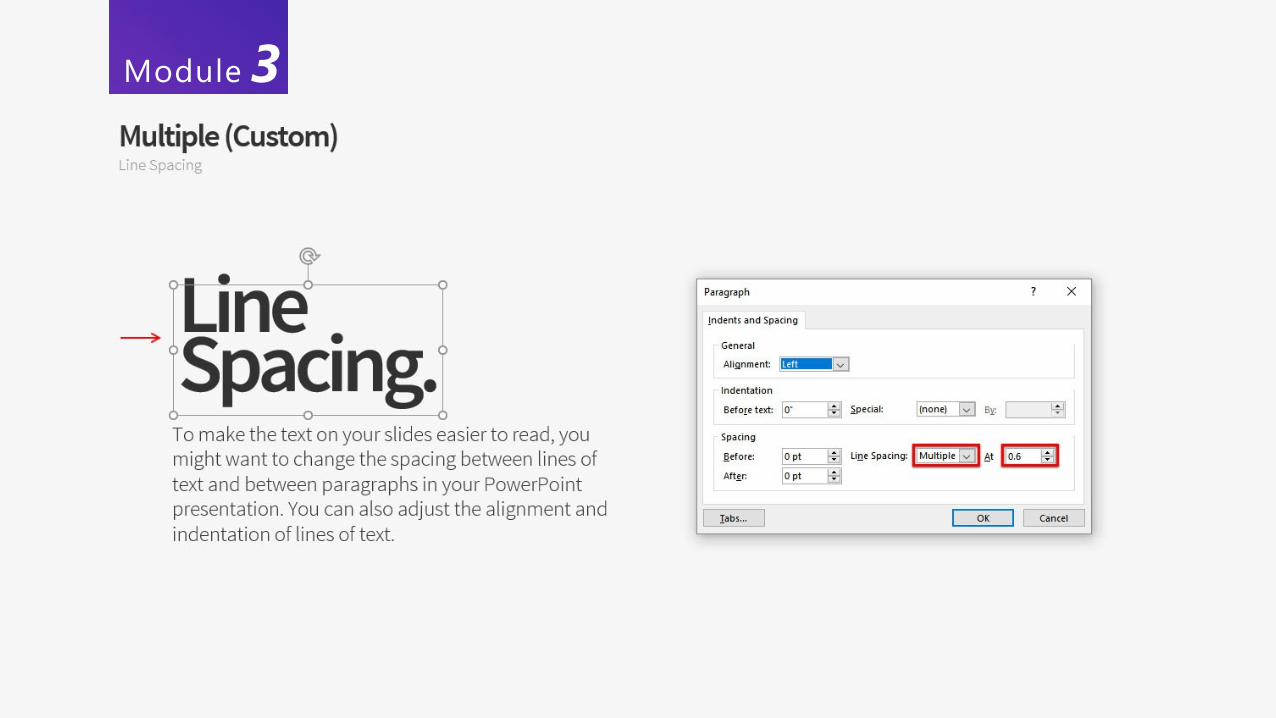
Module 3To make the text on your slides easier to read, you
might want to change the spacing between lines of
text and between paragraphs in your PowerPoint
presentation. You can also adjust the alignment and
indentation of lines of text.
Module 3
Module 3
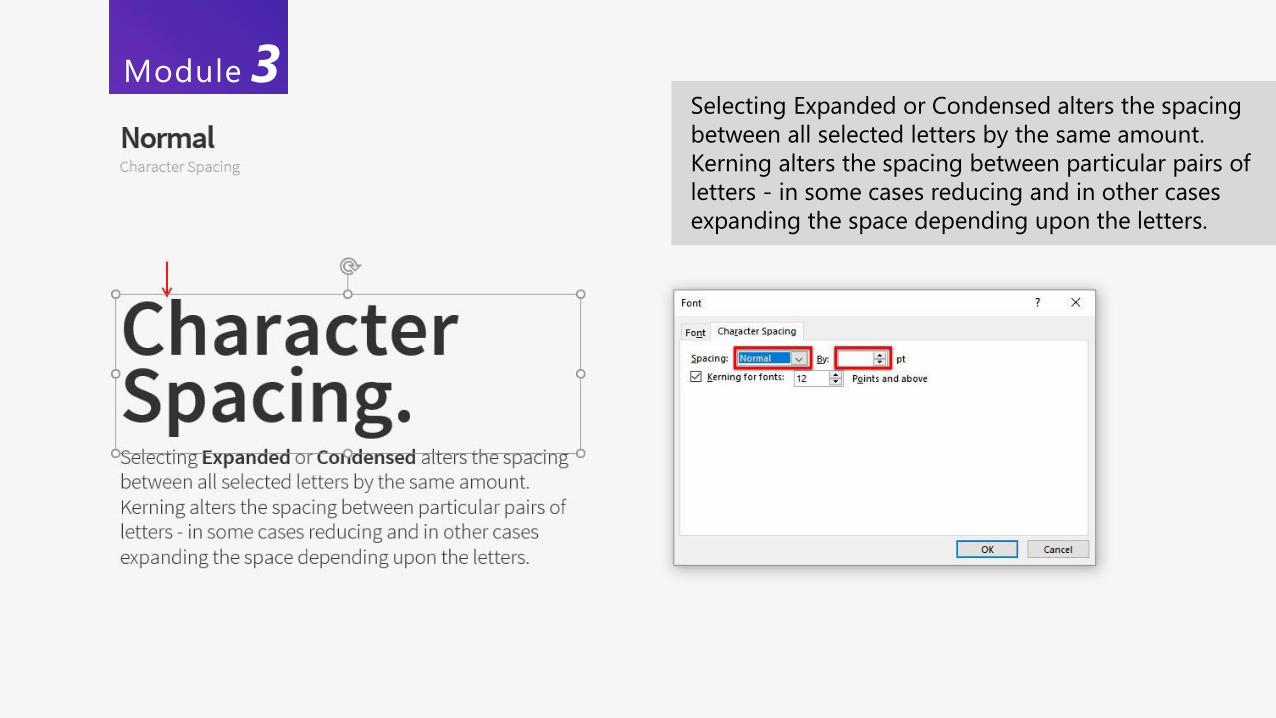
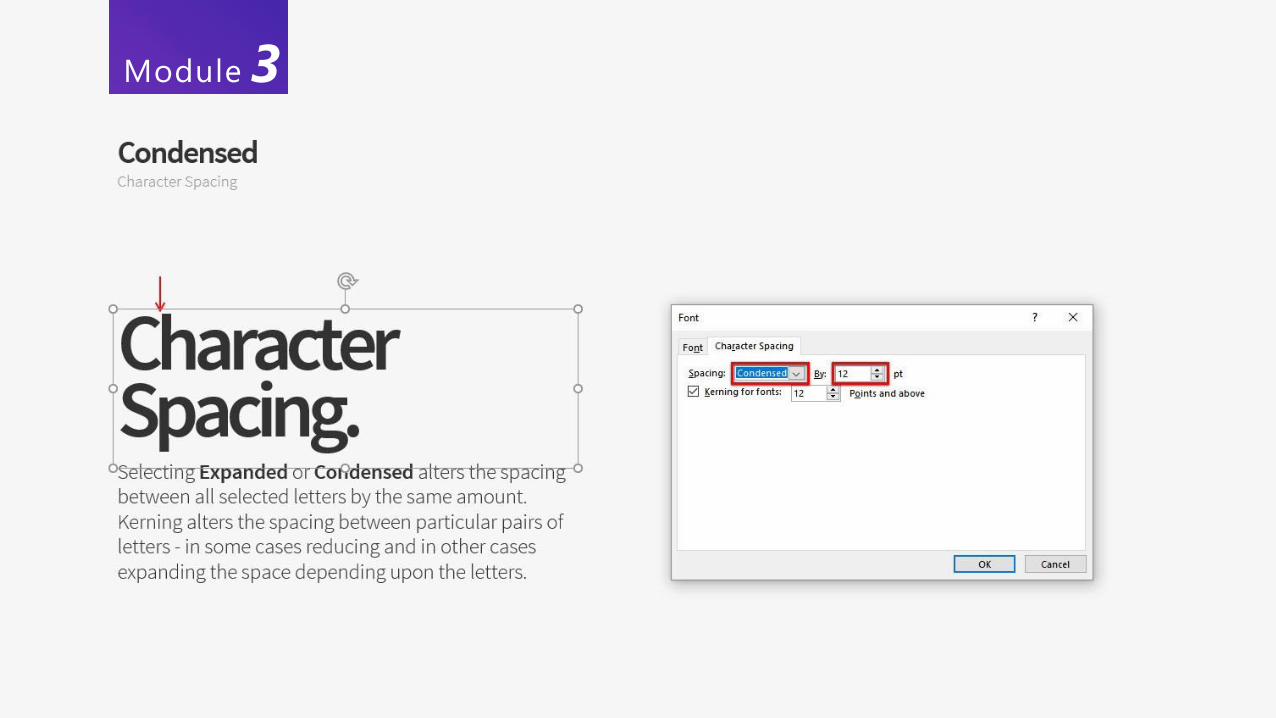
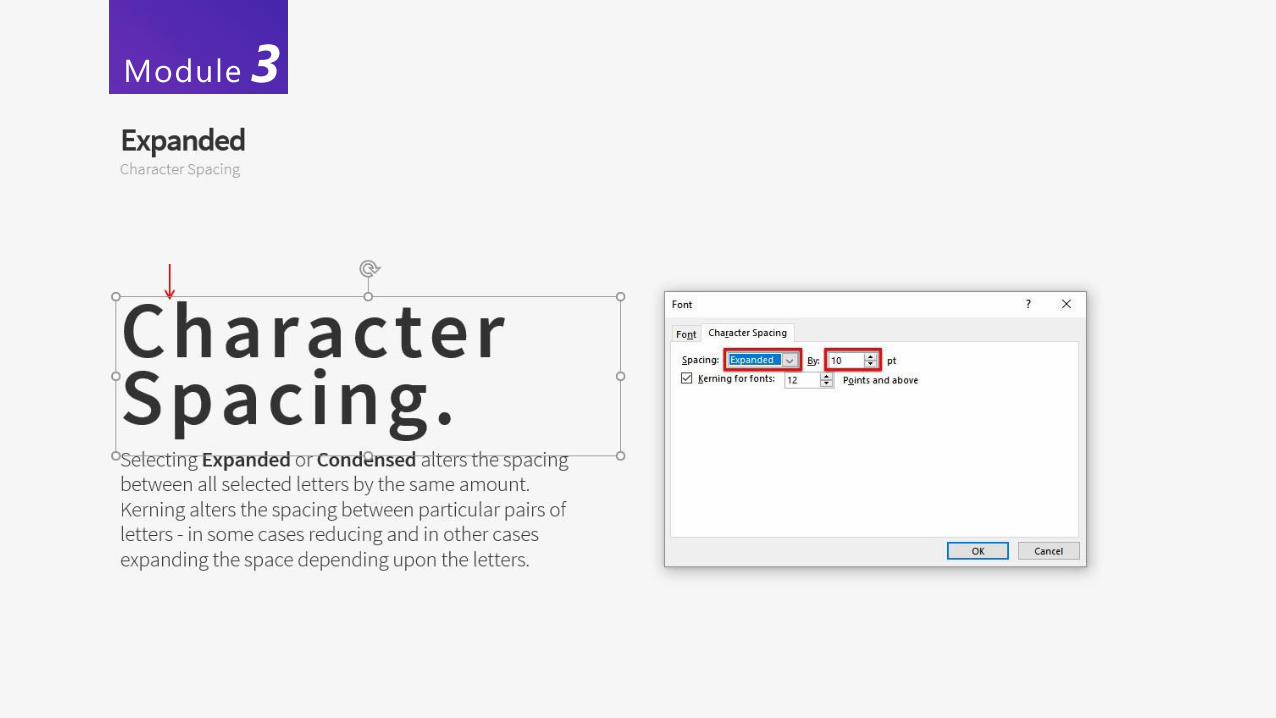
Module 3Selecting Expanded or Condensed alters the spacing
between all selected letters by the same amount.
Kerning alters the spacing between particular pairs of
letters - in some cases reducing and in other cases
expanding the space depending upon the letters.
Module 3
Module 3
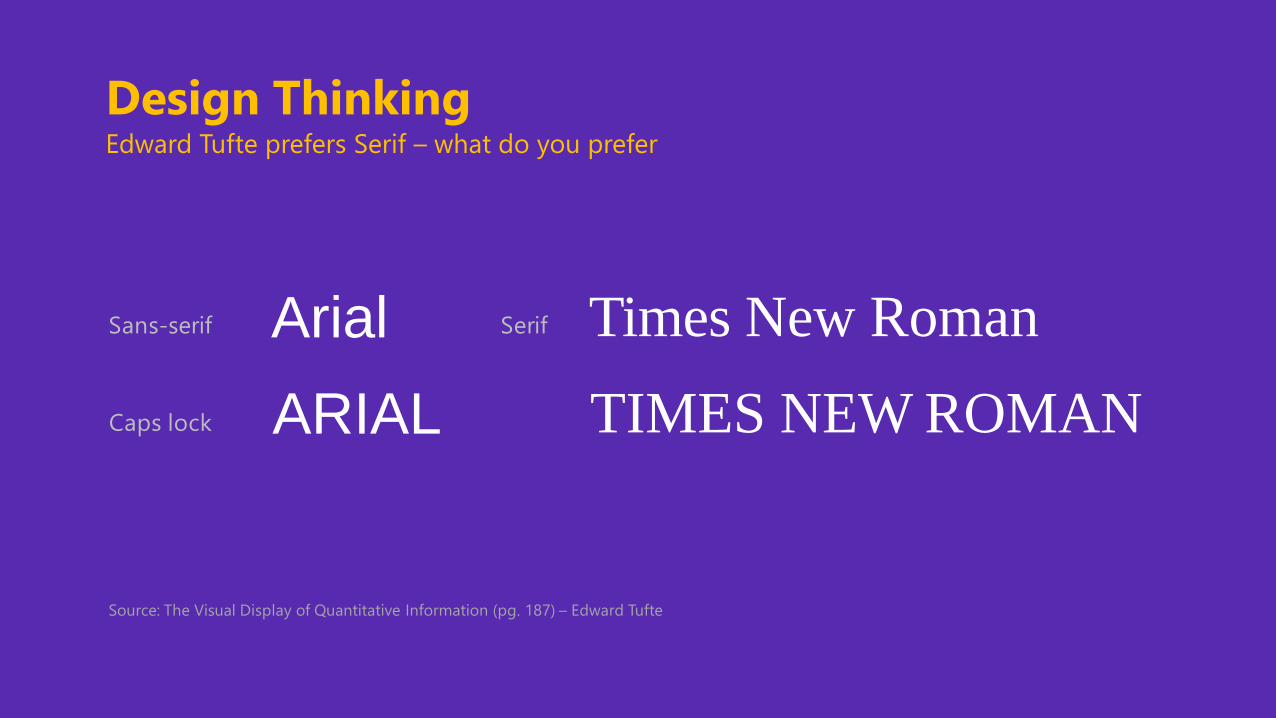
Arial
ARIAL
Times New Roman
TIMES NEW ROMAN
Sans-serif Serif
Caps lock
Source: The Visual Display of Quantitative Information (pg. 187) – Edward Tufte
Design ThinkingEdward Tufte prefers Serif – what do you prefer
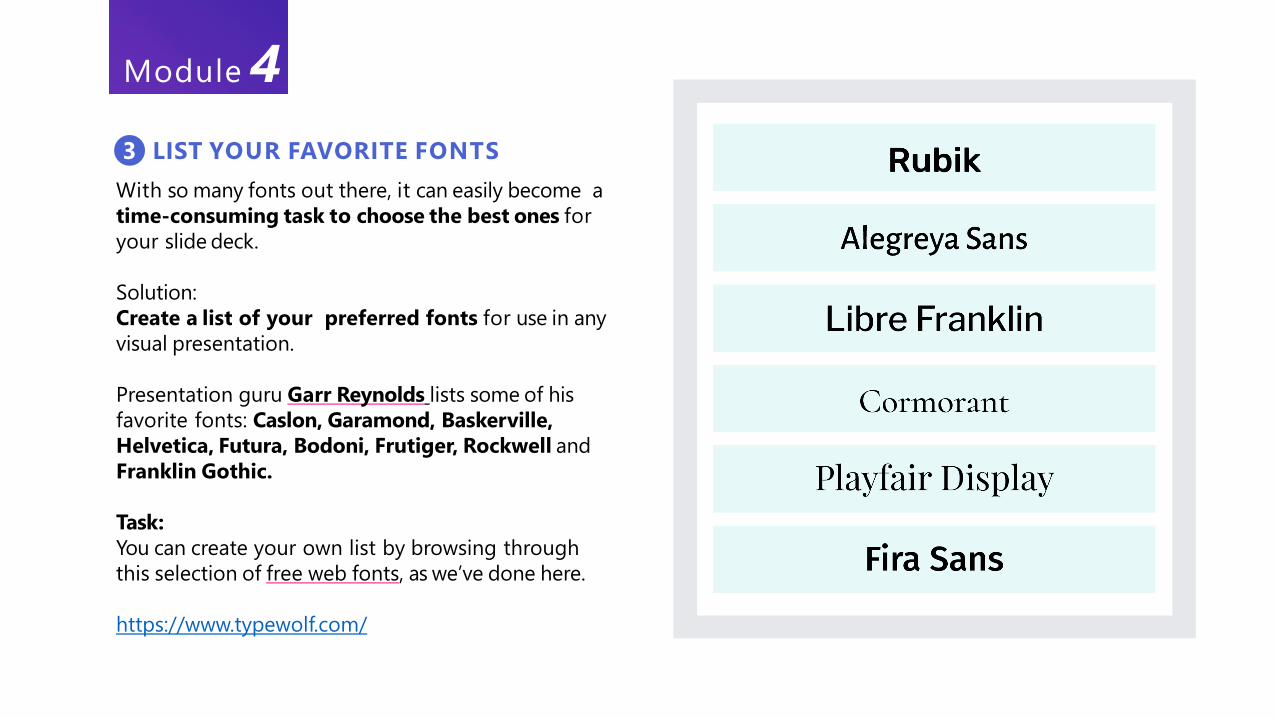
With so many fonts out there, it can easily become a
time-consuming task to choose the best ones for
your slide deck.
Solution:
Create a list of your preferred fonts for use in any
visual presentation.
Presentation guru Garr Reynolds lists some of his
favorite fonts: Caslon, Garamond, Baskerville,
Helvetica, Futura, Bodoni, Frutiger, Rockwell and
Franklin Gothic.
Task:
You can create your own list by browsing through
this selection of free web fonts, as we’ve done here.
https://www.typewolf.com/
LIST YOUR FAVORITE FONTS3
Module 4
H O W TO PAIR FONTS4
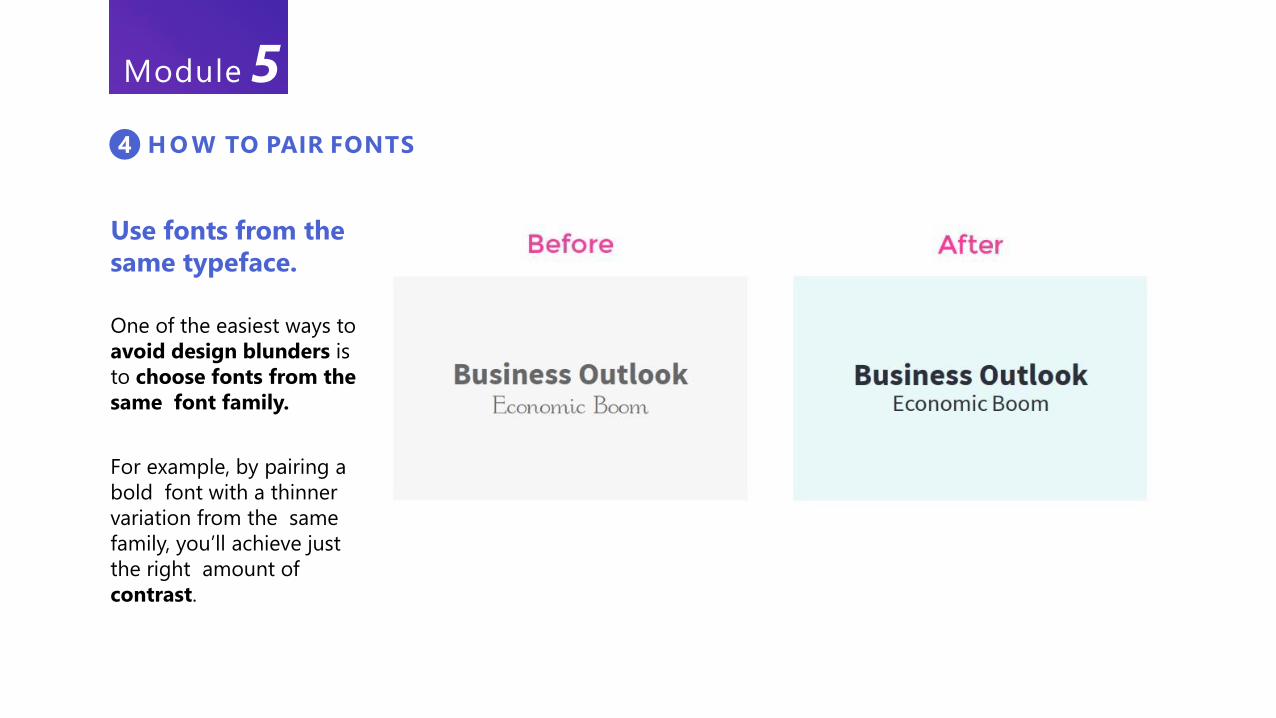
Use fonts from the
same typeface.
One of the easiest ways to
avoid design blunders is
to choose fonts from the
same font family.
For example, by pairing a
bold font with a thinner
variation from the same
family, you’ll achieve just
the right amount of
contrast.
Module 5

Stick to two - max
three typefaces.
You might be looking too
hard for just the right
combination. Instead of
overthinking it, just stick to
two or three
combinations and, above
all, keep it simple.
Module 5
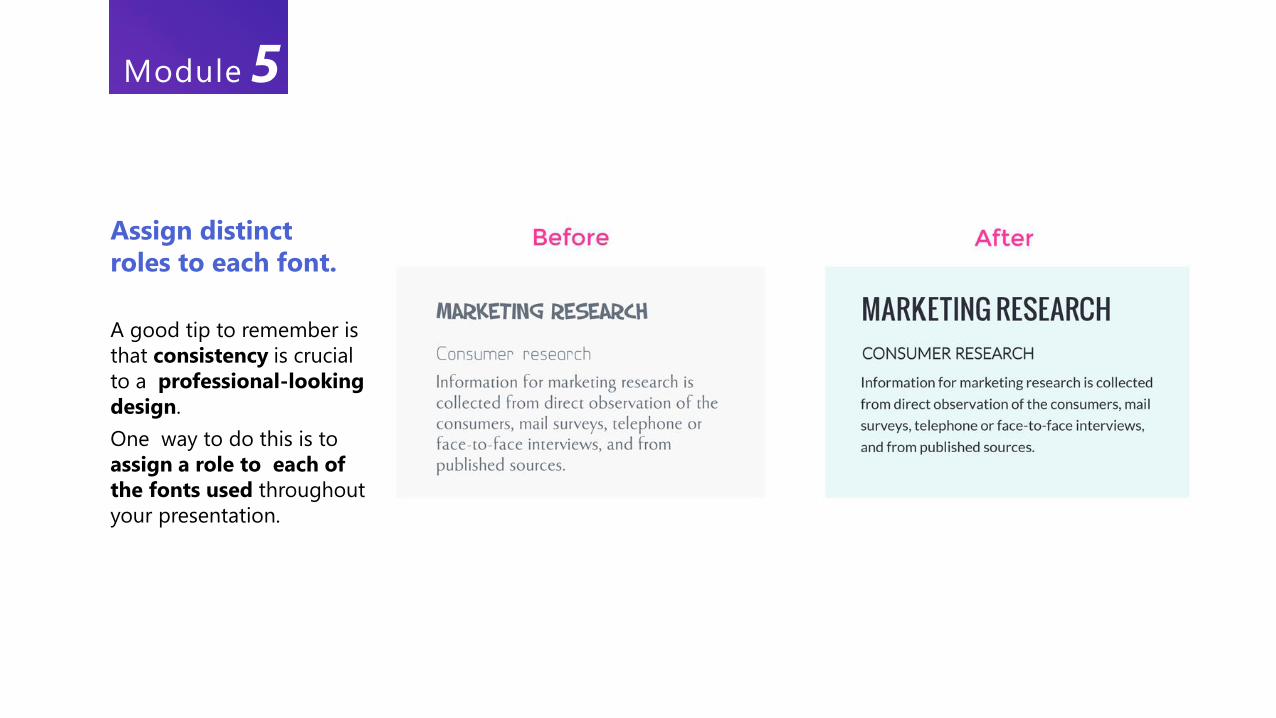
Assign distinct
roles to each font.
A good tip to remember is
that consistency is crucial
to a professional-looking
design.
One way to do this is to
assign a role to each of
the fonts used throughout
your presentation.
Module 5

Choose fonts with
the right personality.
Another key to pairing fonts is
recognizing that each font has
a personality and a mood.
Don’t make the mistake of
• pairing fonts that simply
aren’t meant to go
together or
• don’t match the visual
theme of your slide deck.
Module 5
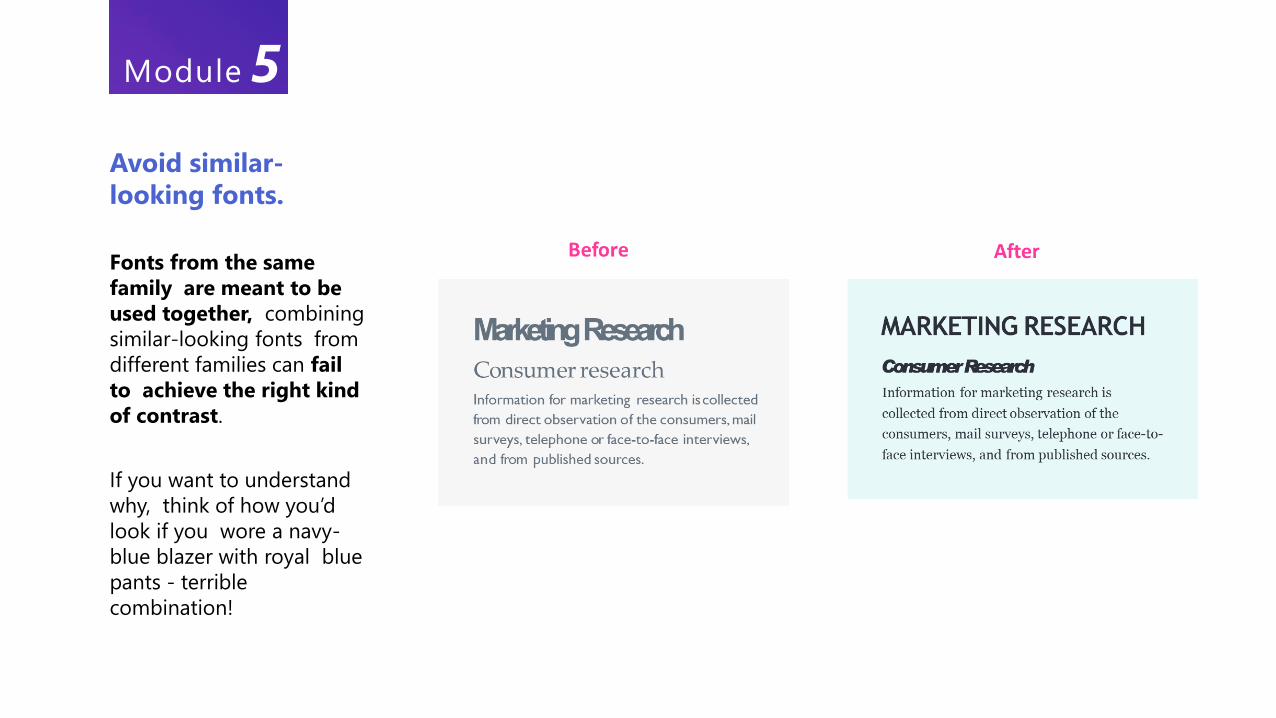
Avoid similar-
looking fonts.
Fonts from the same
family are meant to be
used together, combining
similar-looking fonts from
different families can fail
to achieve the right kind
of contrast.
If you want to understand
why, think of how you’d
look if you wore a navy-
blue blazer with royal blue
pants - terrible
combination!
Module 5
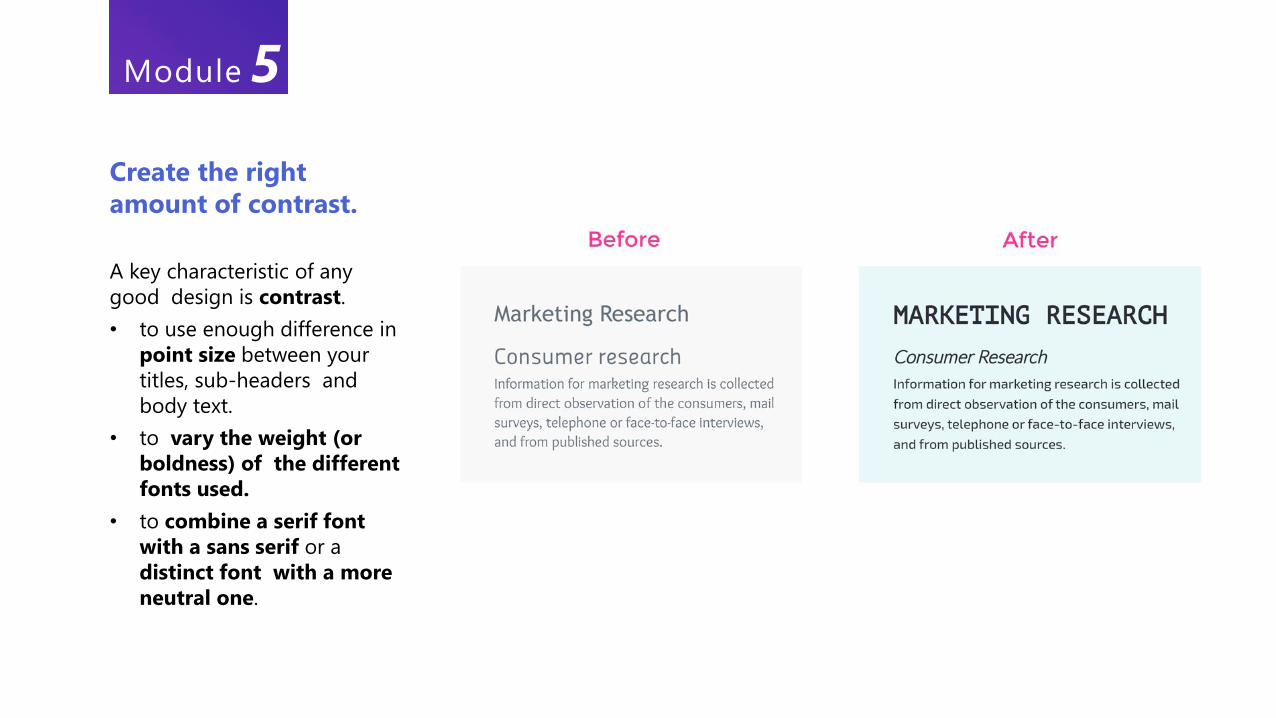
Create the right
amount of contrast.
A key characteristic of any
good design is contrast.
• to use enough difference in
point size between your
titles, sub-headers and
body text.
• to vary the weight (or
boldness) of the different
fonts used.
• to combine a serif font
with a sans serif or a
distinct font with a more
neutral one.
Module 5
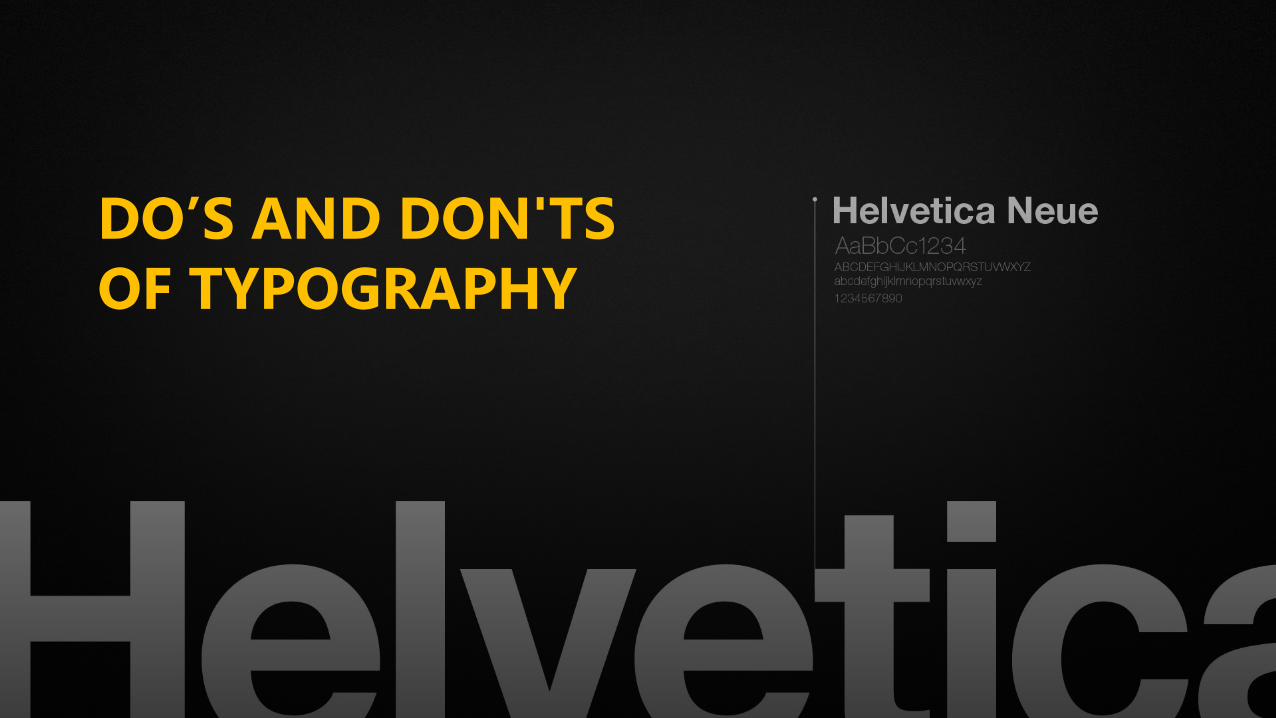
DO’S AND DON'TS
OF TYPOGRAPHY
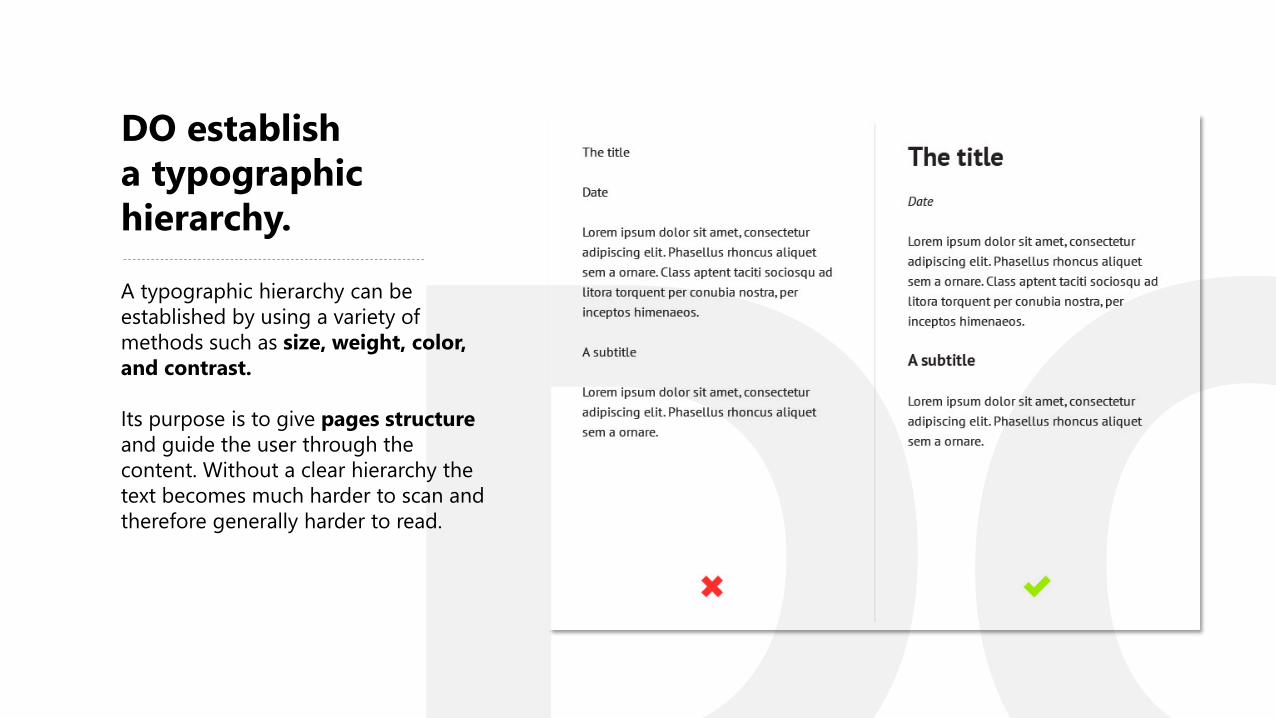
DO establish
a typographic
hierarchy.
A typographic hierarchy can be
established by using a variety of
methods such as size, weight, color,
and contrast.
Its purpose is to give pages structure
and guide the user through the
content. Without a clear hierarchy the
text becomes much harder to scan and
therefore generally harder to read.
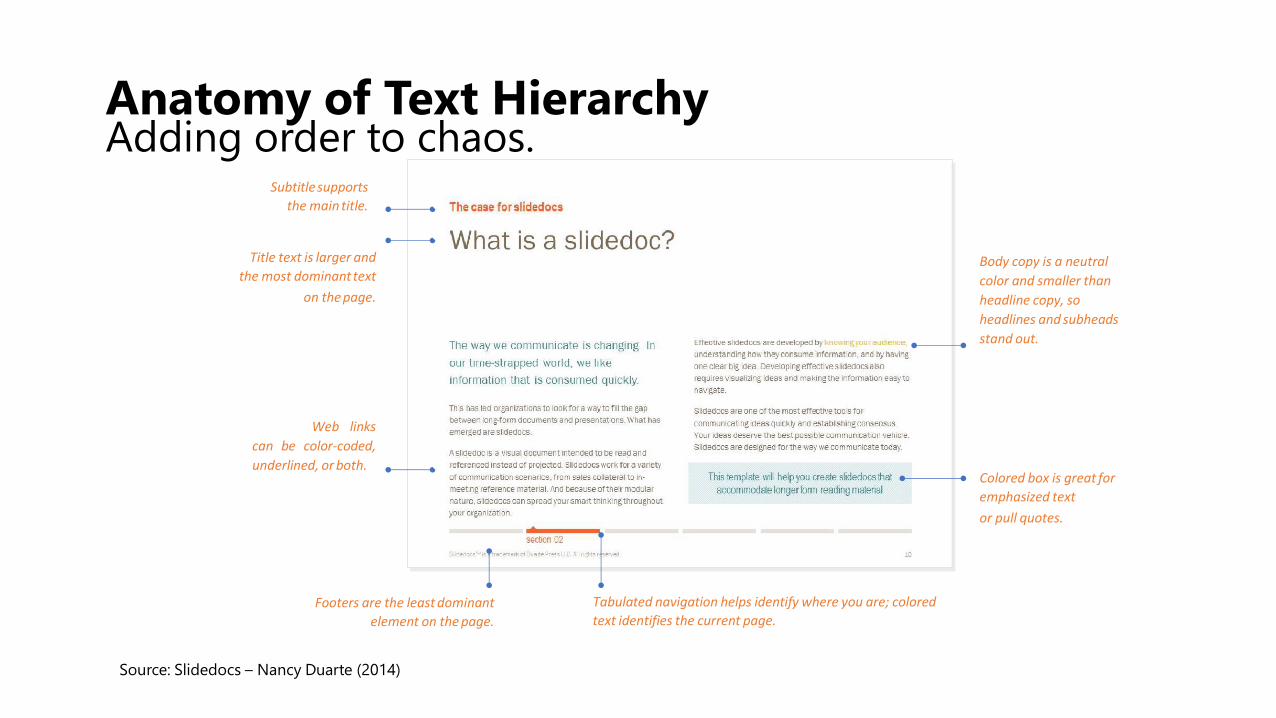
Subtitlesupports
the main title.
Title text is larger and
the most dominanttext
on the page.
Web links
can be color-coded,
underlined, or both.
Body copy is a neutral
color and smaller than
headline copy, so
headlines and subheads
stand out.
Colored box is great for
emphasized text
or pull quotes.
Footers are the least dominant
element on the page.
Tabulated navigation helps identify where you are; colored
text identifies the current page.
Source: Slidedocs – Nancy Duarte (2014)
Anatomy of Text Hierarchy Adding order to chaos.
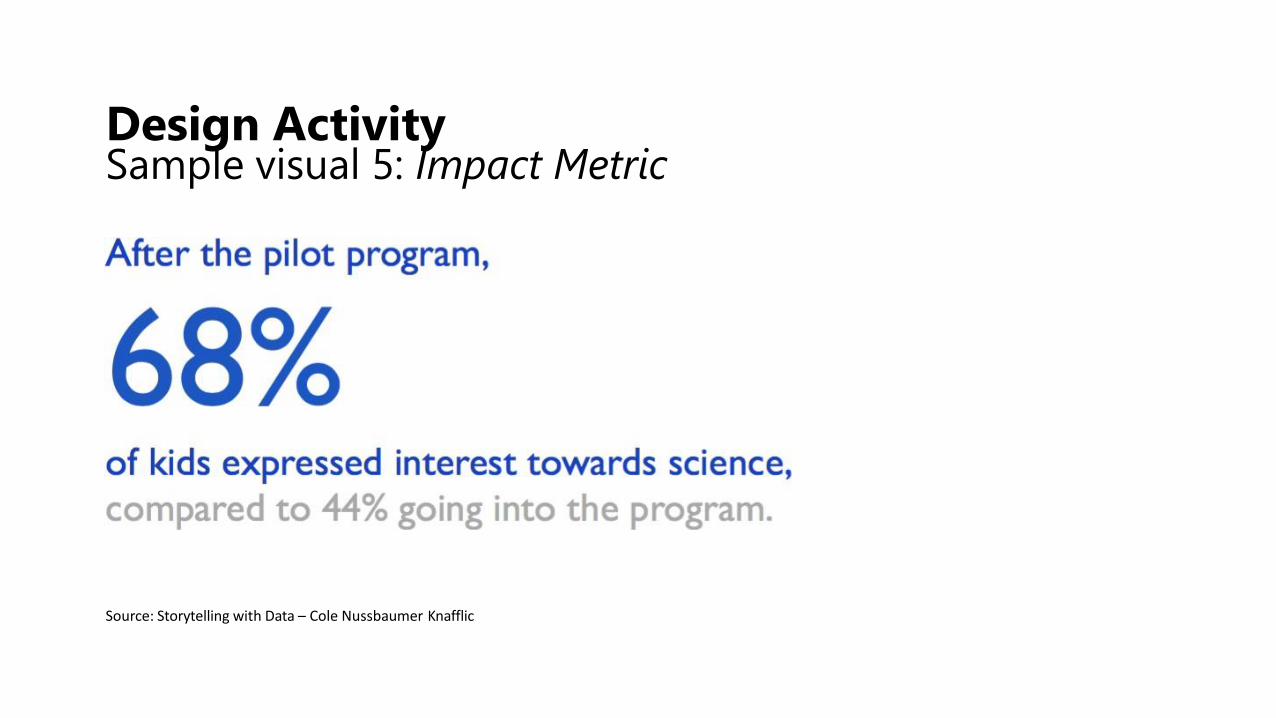
Source: Storytelling with Data – Cole Nussbaumer Knafflic
Design Activity Sample visual 5: Impact Metric
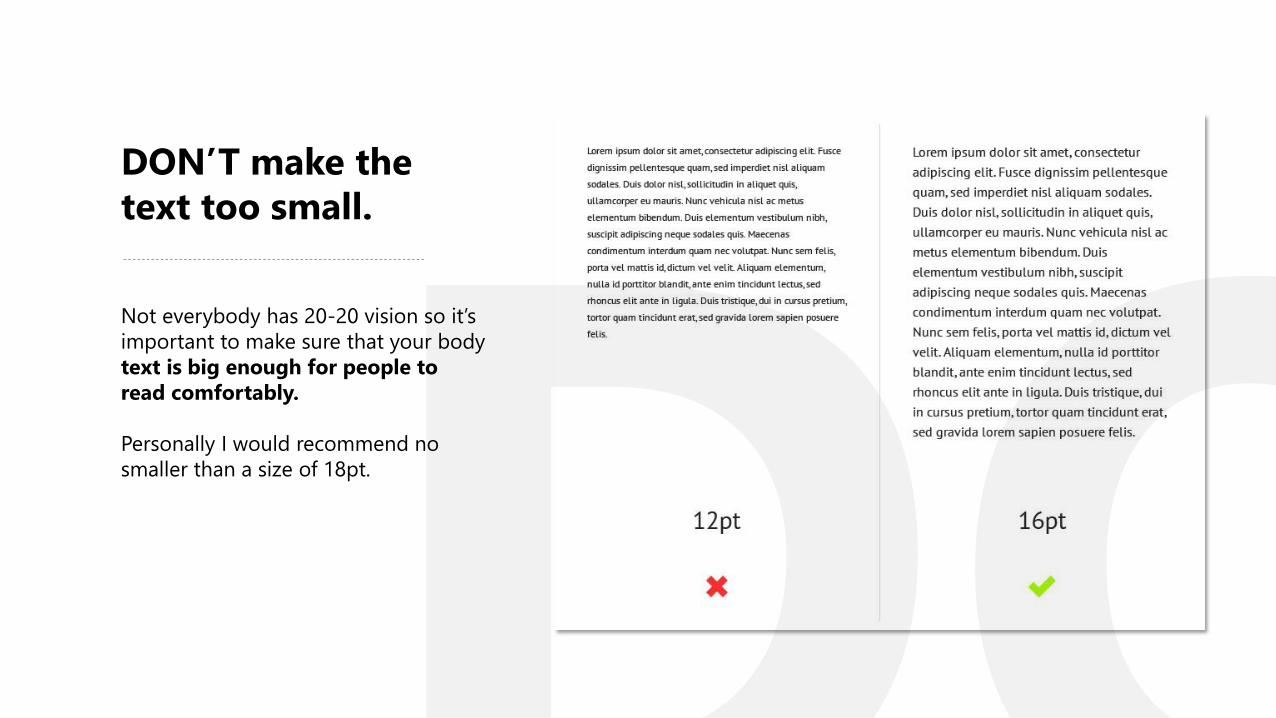
DON’T make the
text too small.
Not everybody has 20-20 vision so it’s
important to make sure that your body
text is big enough for people to
read comfortably.
Personally I would recommend no
smaller than a size of 18pt.
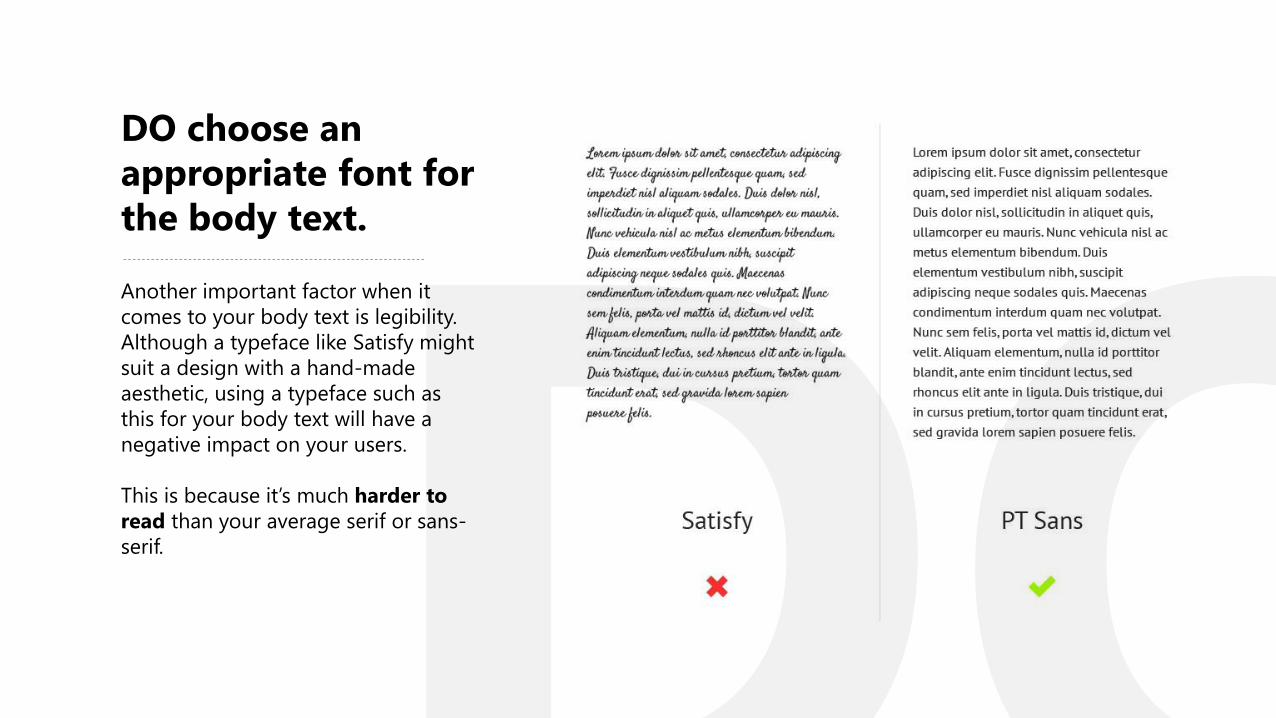
DO choose an
appropriate font for
the body text.
Another important factor when it
comes to your body text is legibility.
Although a typeface like Satisfy might
suit a design with a hand-made
aesthetic, using a typeface such as
this for your body text will have a
negative impact on your users.
This is because it’s much harder to
read than your average serif or sans-
serif.
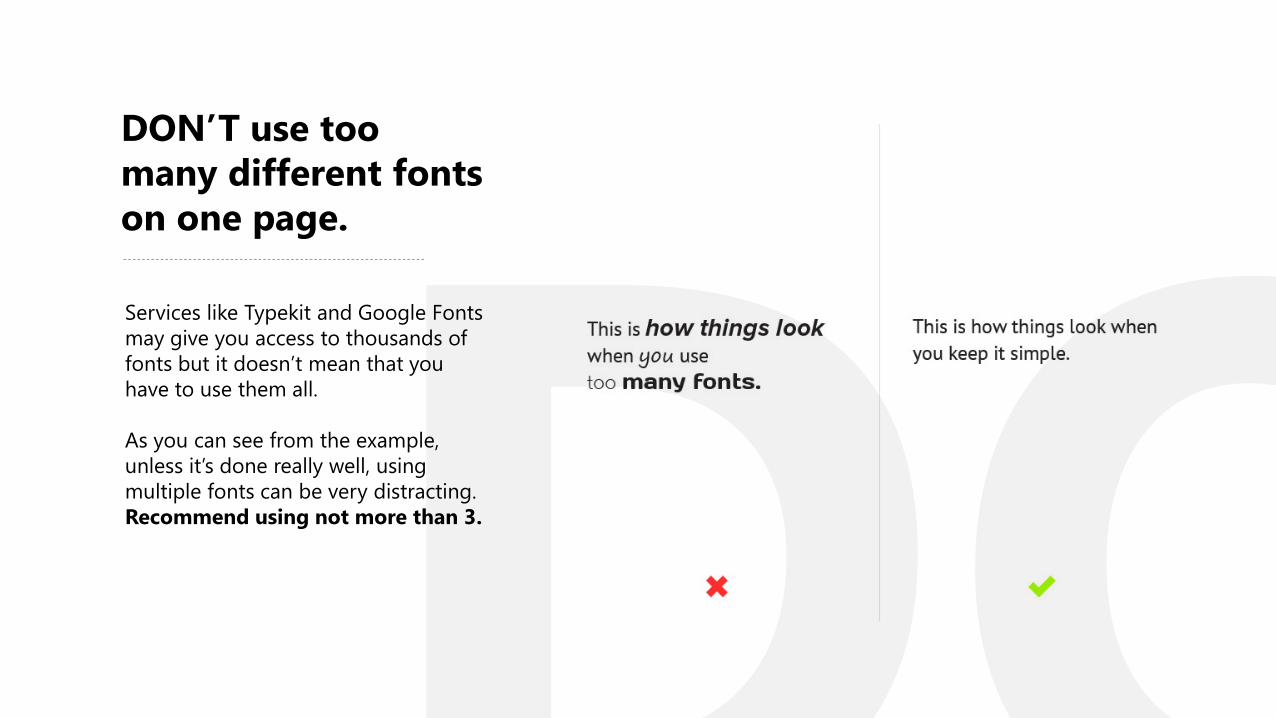
DON’T use too
many different fonts
on one page.
Services like Typekit and Google Fonts
may give you access to thousands of
fonts but it doesn’t mean that you
have to use them all.
As you can see from the example,
unless it’s done really well, using
multiple fonts can be very distracting.
Recommend using not more than 3.
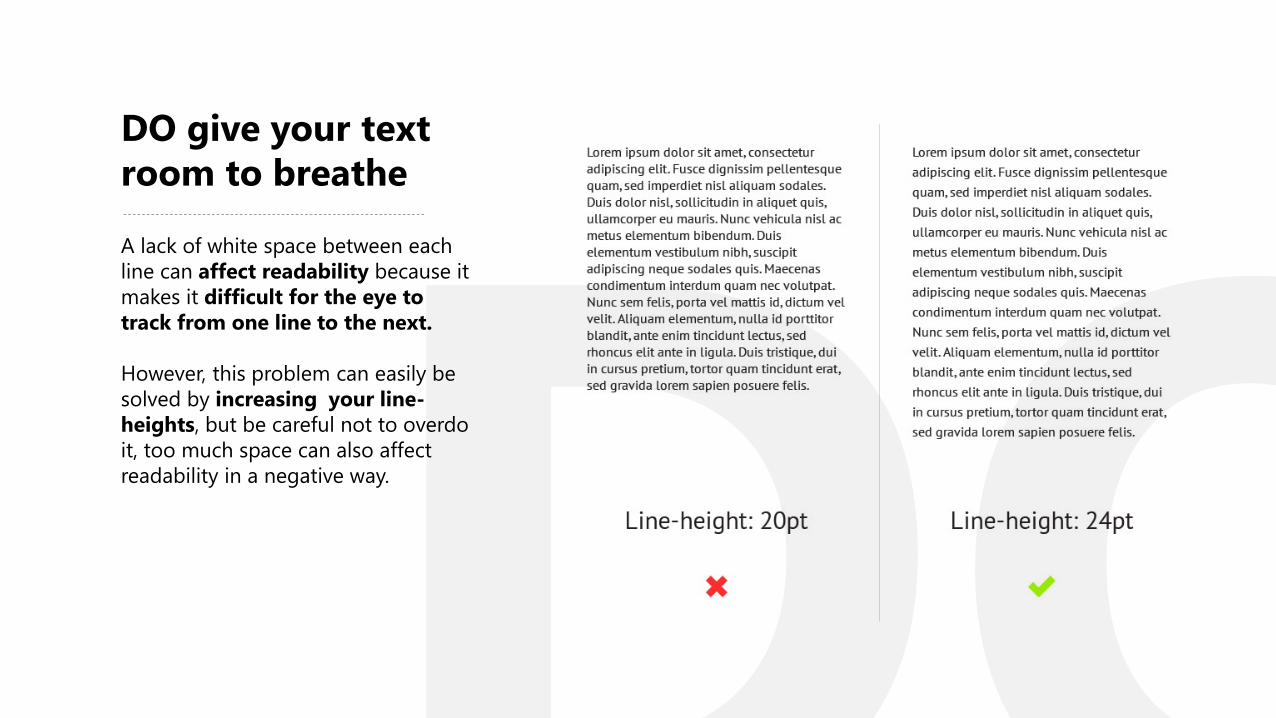
DO give your text
room to breathe
A lack of white space between each
line can affect readability because it
makes it difficult for the eye to
track from one line to the next.
However, this problem can easily be
solved by increasing your line-
heights, but be careful not to overdo
it, too much space can also affect
readability in a negative way.
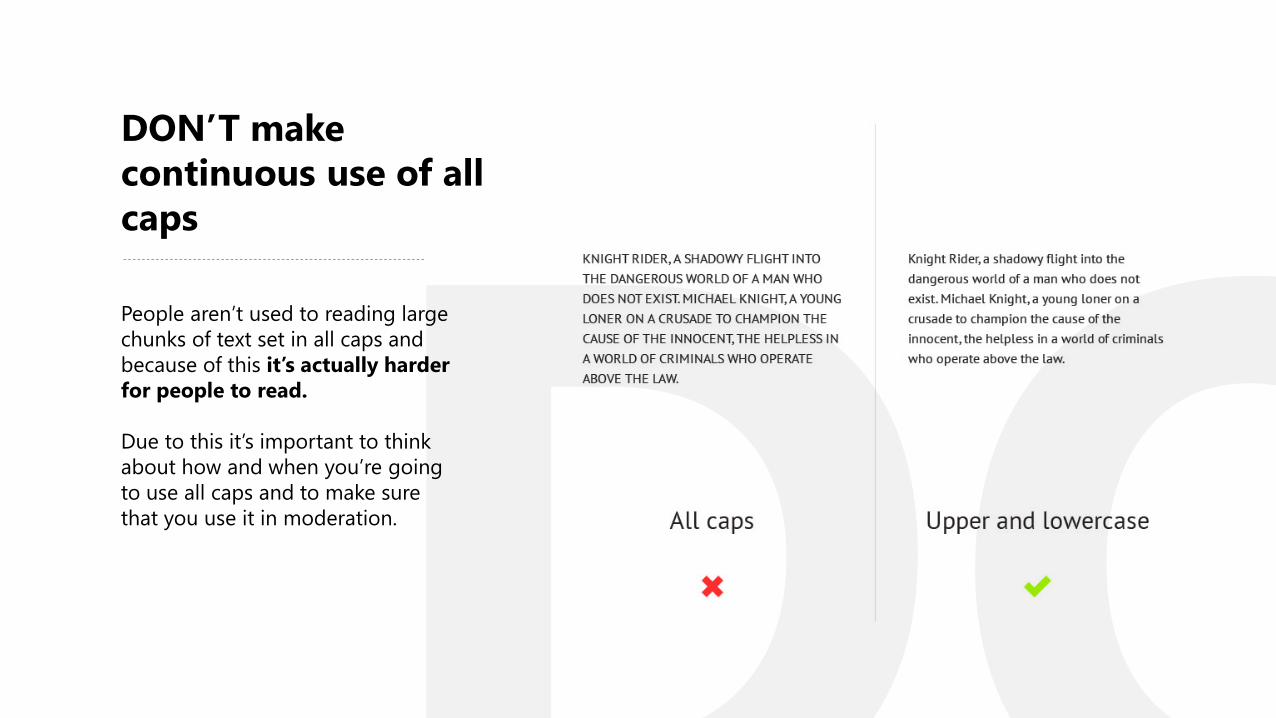
DON’T make
continuous use of all
caps
People aren’t used to reading large
chunks of text set in all caps and
because of this it’s actually harder
for people to read.
Due to this it’s important to think
about how and when you’re going
to use all caps and to make sure
that you use it in moderation.
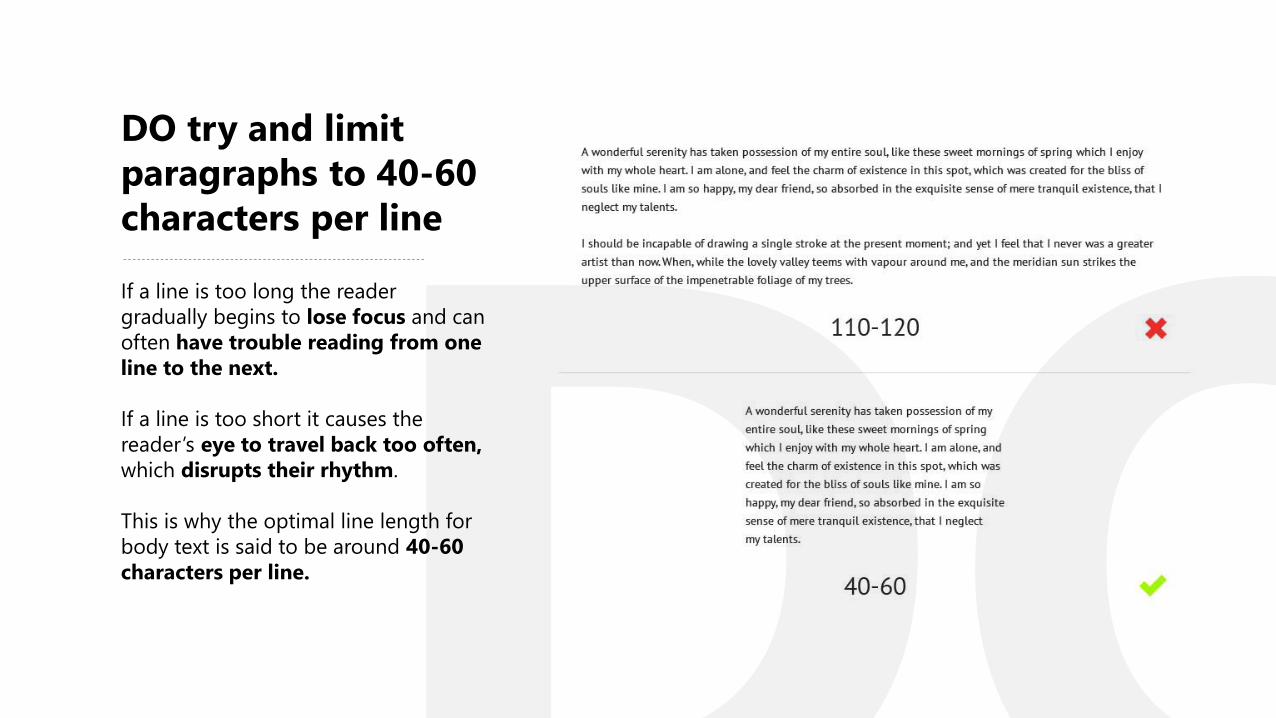
DO try and limit
paragraphs to 40-60
characters per line
If a line is too long the reader
gradually begins to lose focus and can
often have trouble reading from one
line to the next.
If a line is too short it causes the
reader’s eye to travel back too often,
which disrupts their rhythm.
This is why the optimal line length for
body text is said to be around 40-60
characters per line.
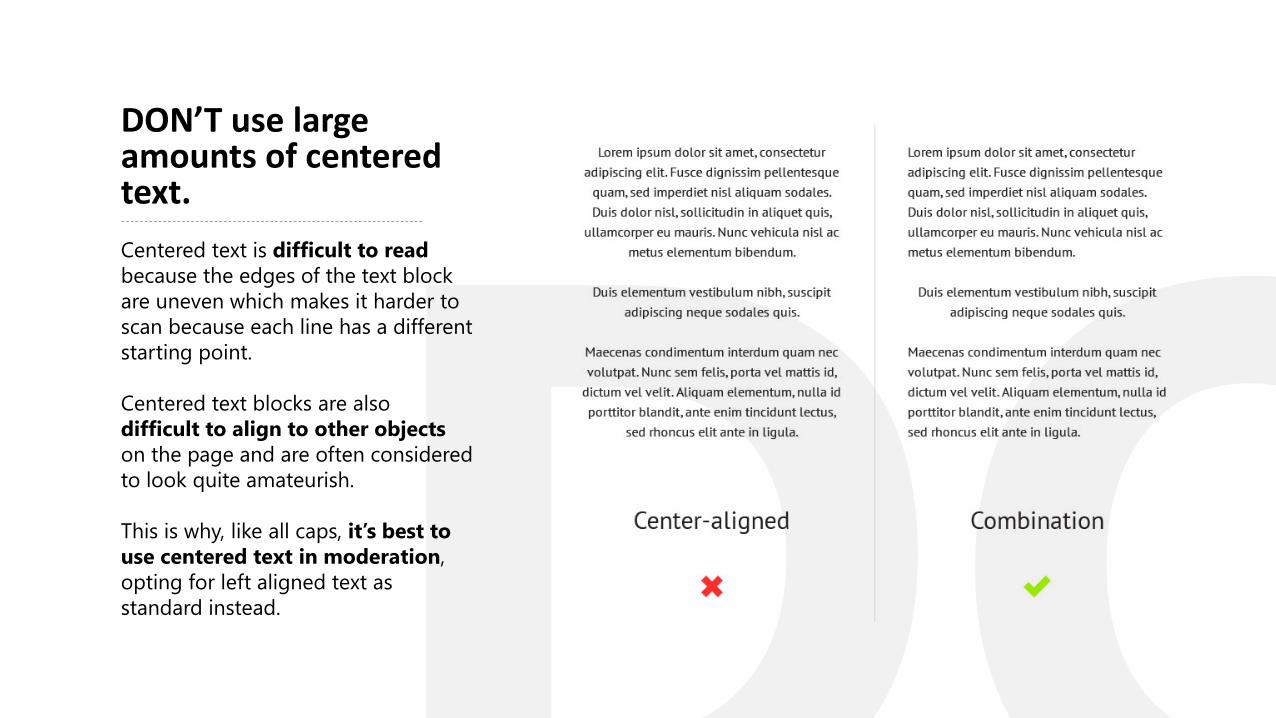
DON’T use large amounts of centered text.
Centered text is difficult to read
because the edges of the text block
are uneven which makes it harder to
scan because each line has a different
starting point.
Centered text blocks are also
difficult to align to other objects
on the page and are often considered
to look quite amateurish.
This is why, like all caps, it’s best to
use centered text in moderation,
opting for left aligned text as
standard instead.
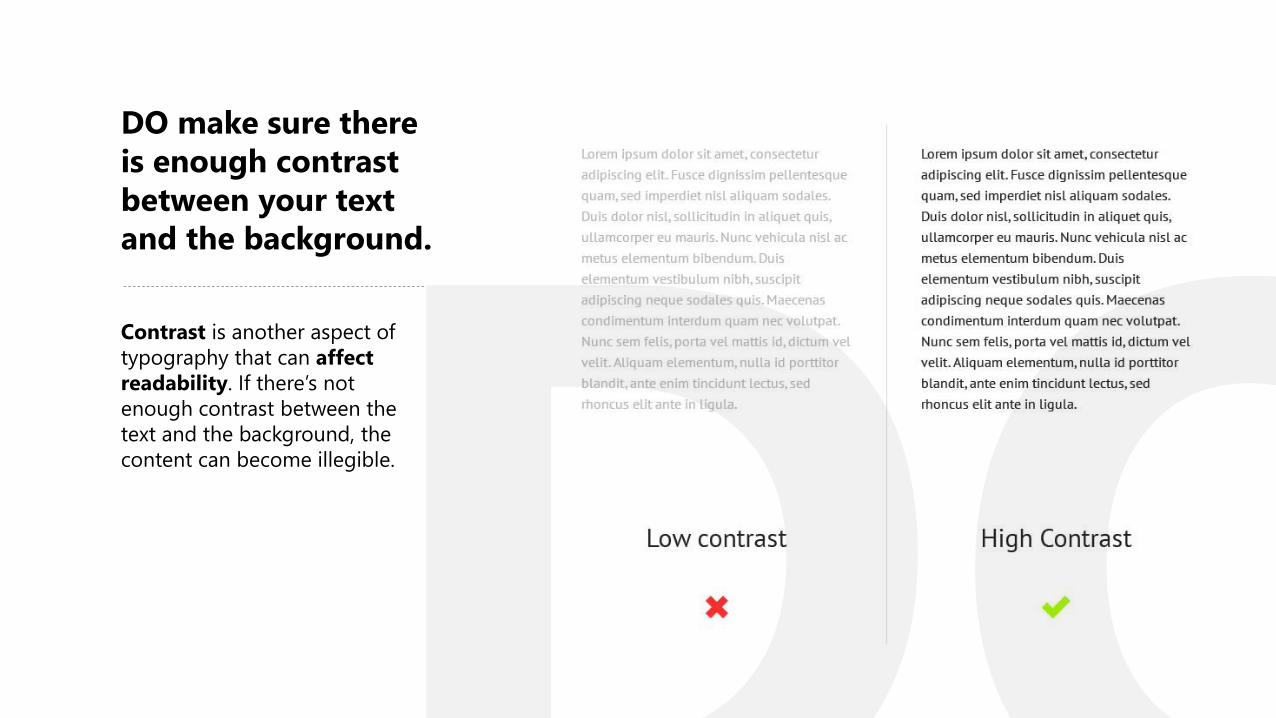
DO make sure there
is enough contrast
between your text
and the background.
Contrast is another aspect of
typography that can affect
readability. If there’s not
enough contrast between the
text and the background, the
content can become illegible.

How to Use Images
Like a Pro
Lesson 4
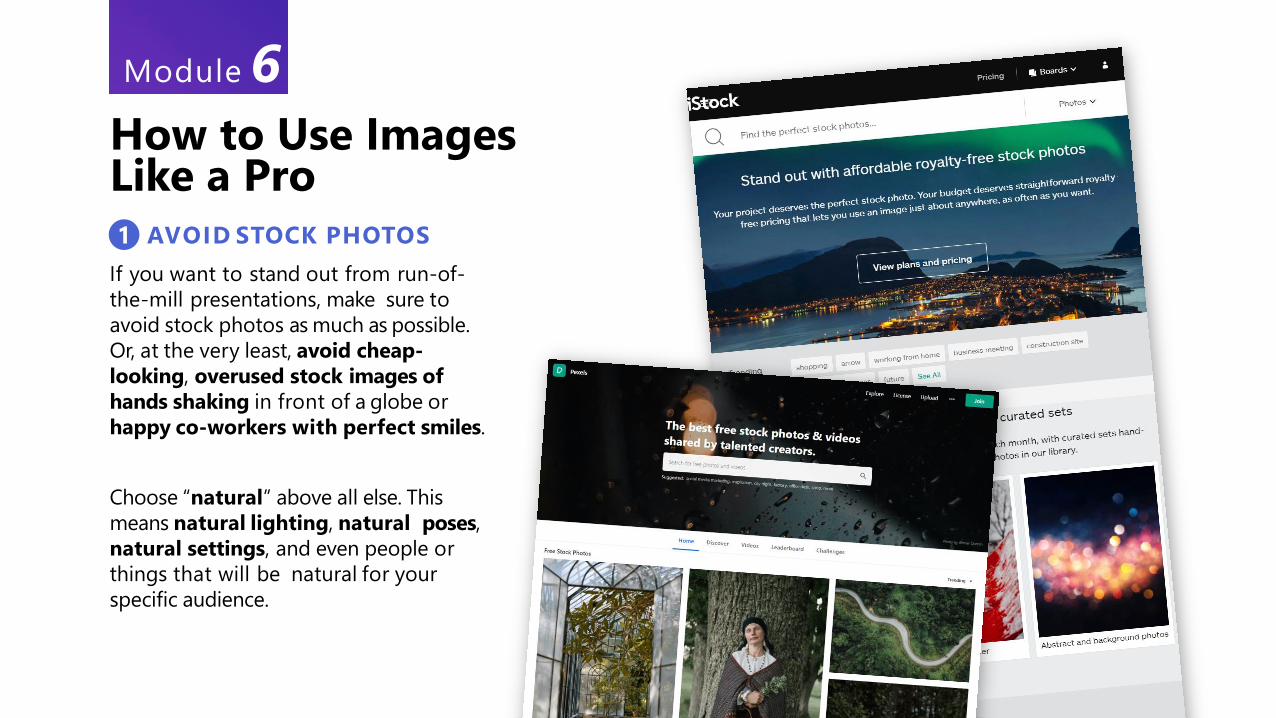
If you want to stand out from run-of-
the-mill presentations, make sure to
avoid stock photos as much as possible.
Or, at the very least, avoid cheap-
looking, overused stock images of
hands shaking in front of a globe or
happy co-workers with perfect smiles.
Choose “natural” above all else. This
means natural lighting, natural poses,
natural settings, and even people or
things that will be natural for your
specific audience.
AVOID STOCK PHOTOS1
How to Use Images Like a Pro
Module 6
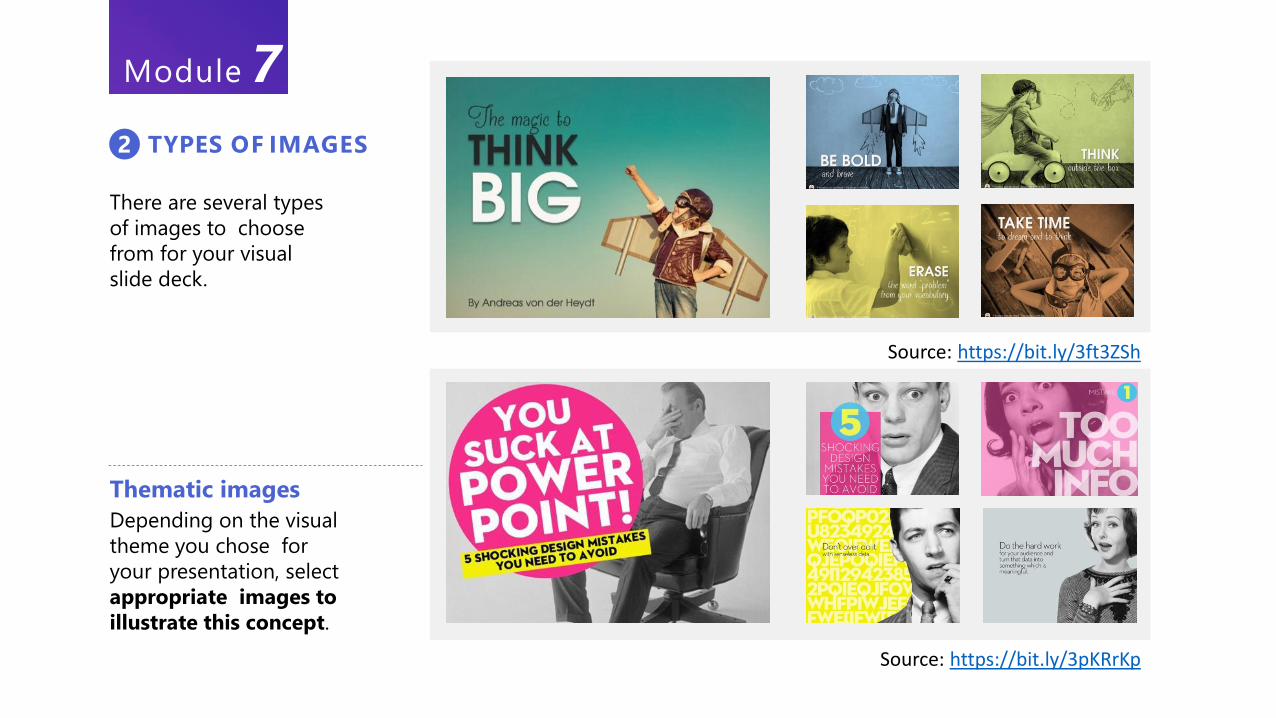
There are several types
of images to choose
from for your visual
slide deck.
Thematic images
Depending on the visual
theme you chose for
your presentation, select
appropriate images to
illustrate this concept.
TYPES OF IMAGES2
Source: https://bit.ly/3ft3ZSh
Source: https://bit.ly/3pKRrKp
Module 7
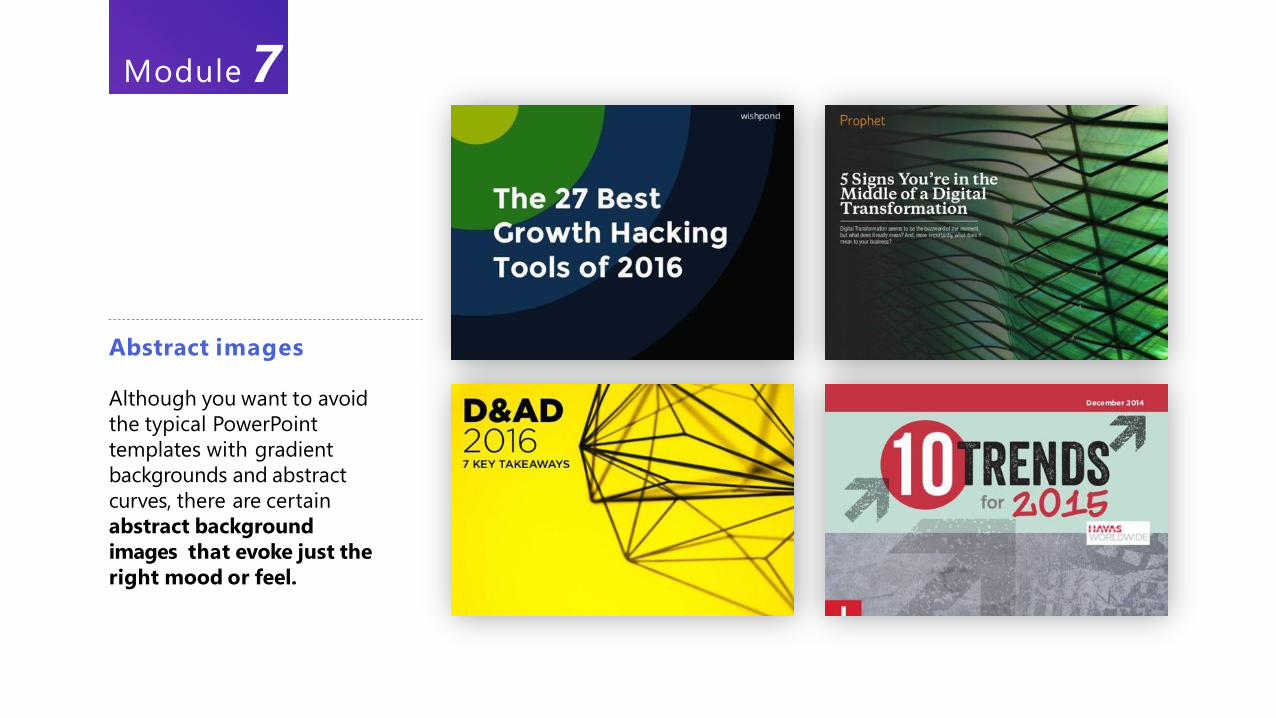
Abstract images
Although you want to avoid
the typical PowerPoint
templates with gradient
backgrounds and abstract
curves, there are certain
abstract background
images that evoke just the
right mood or feel.
Module 7

Real-life images
If you’re going to refer to
real-life examples in
your presentation, you
can also use your
smartphone or camera to
take your own images.
Module 7
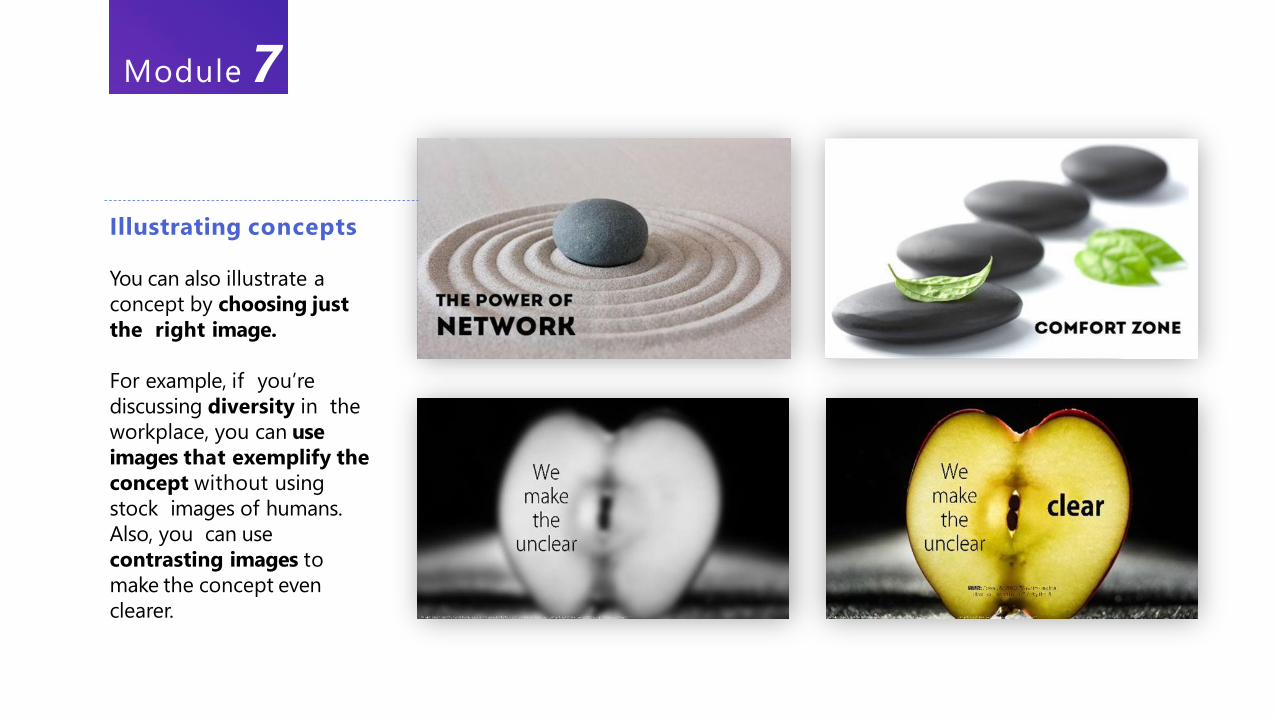
Illustrating concepts
You can also illustrate a
concept by choosing just
the right image.
For example, if you’re
discussing diversity in the
workplace, you can use
images that exemplify the
concept without using
stock images of humans.
Also, you can use
contrasting images to
make the concept even
clearer.
Module 7
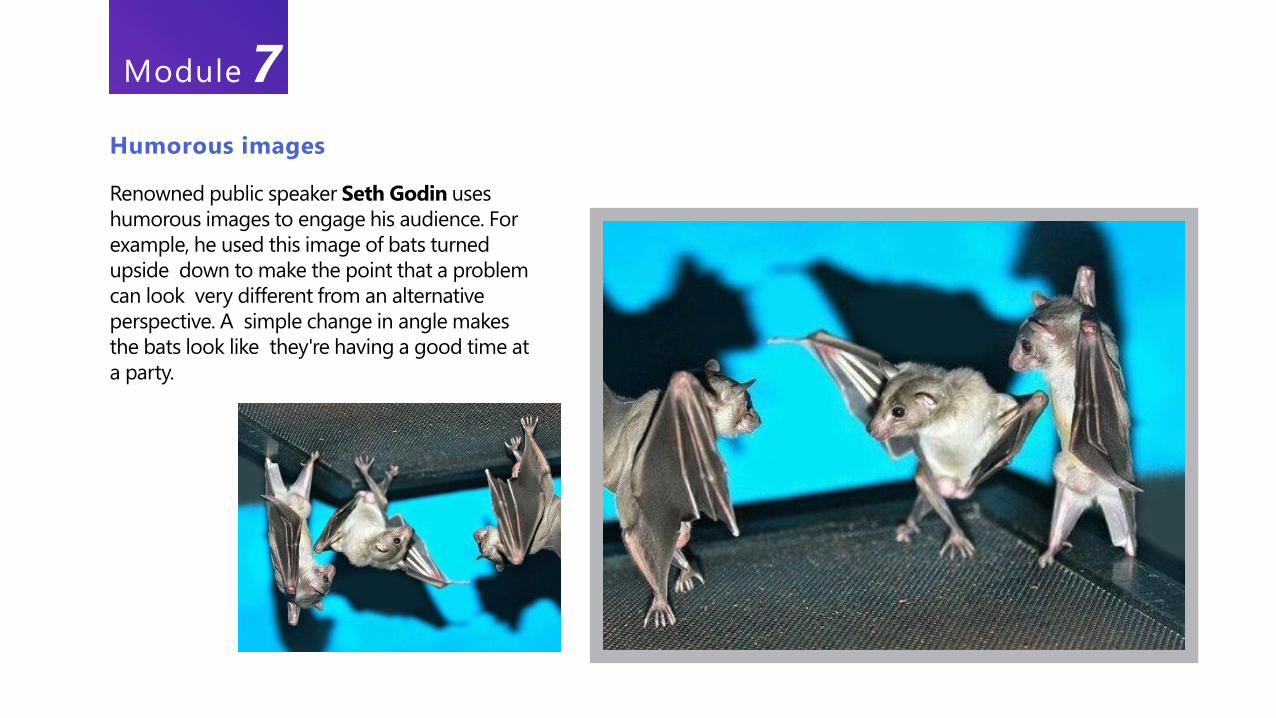
Humorous images
Renowned public speaker Seth Godin uses
humorous images to engage his audience. For
example, he used this image of bats turned
upside down to make the point that a problem
can look very different from an alternative
perspective. A simple change in angle makes
the bats look like they're having a good time at
a party.
Module 7
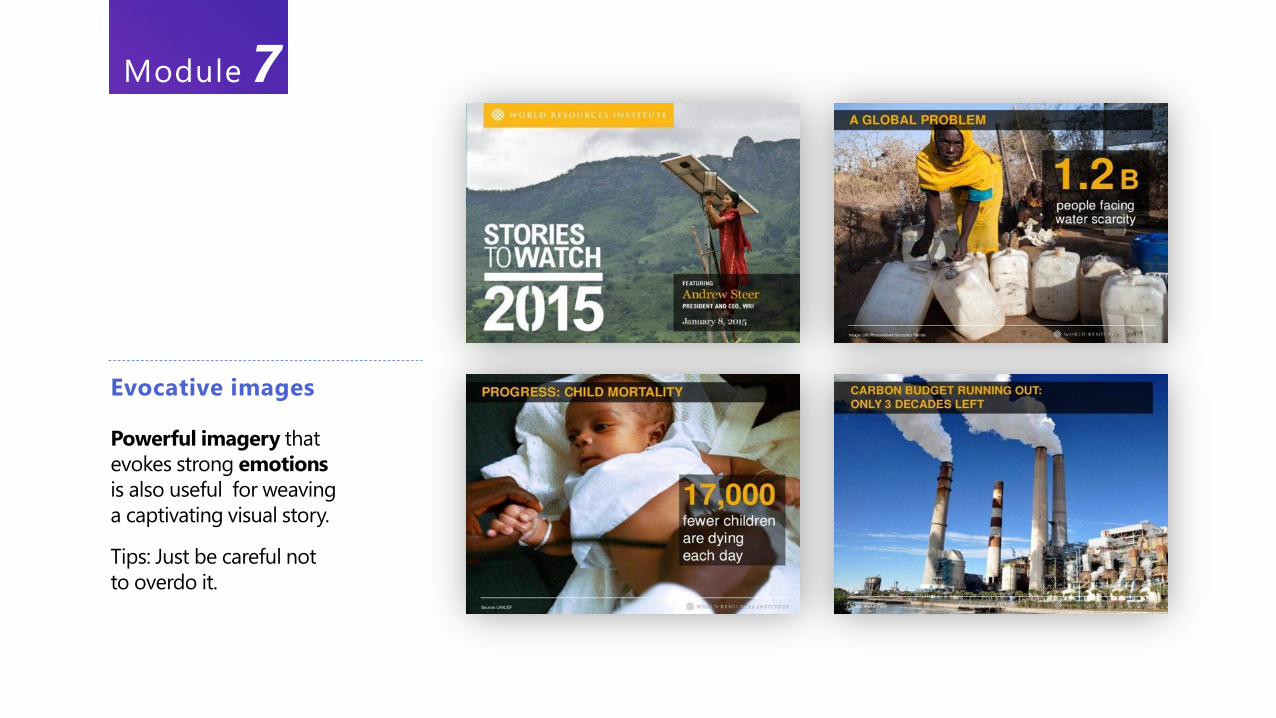
Evocative images
Powerful imagery that
evokes strong emotions
is also useful for weaving
a captivating visual story.
Tips: Just be careful not
to overdo it.
Module 7
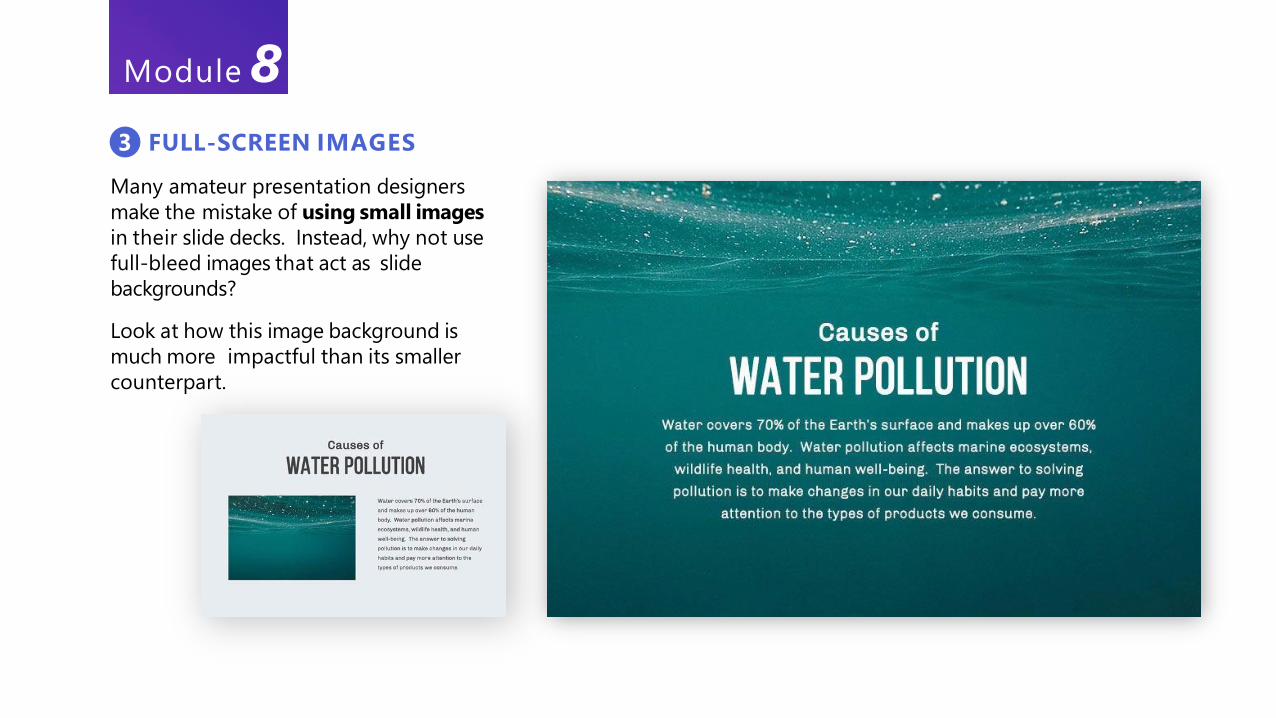
Many amateur presentation designers
make the mistake of using small images
in their slide decks. Instead, why not use
full-bleed images that act as slide
backgrounds?
Look at how this image background is
much more impactful than its smaller
counterpart.
FULL-SCREEN IMAGES3
Module 8
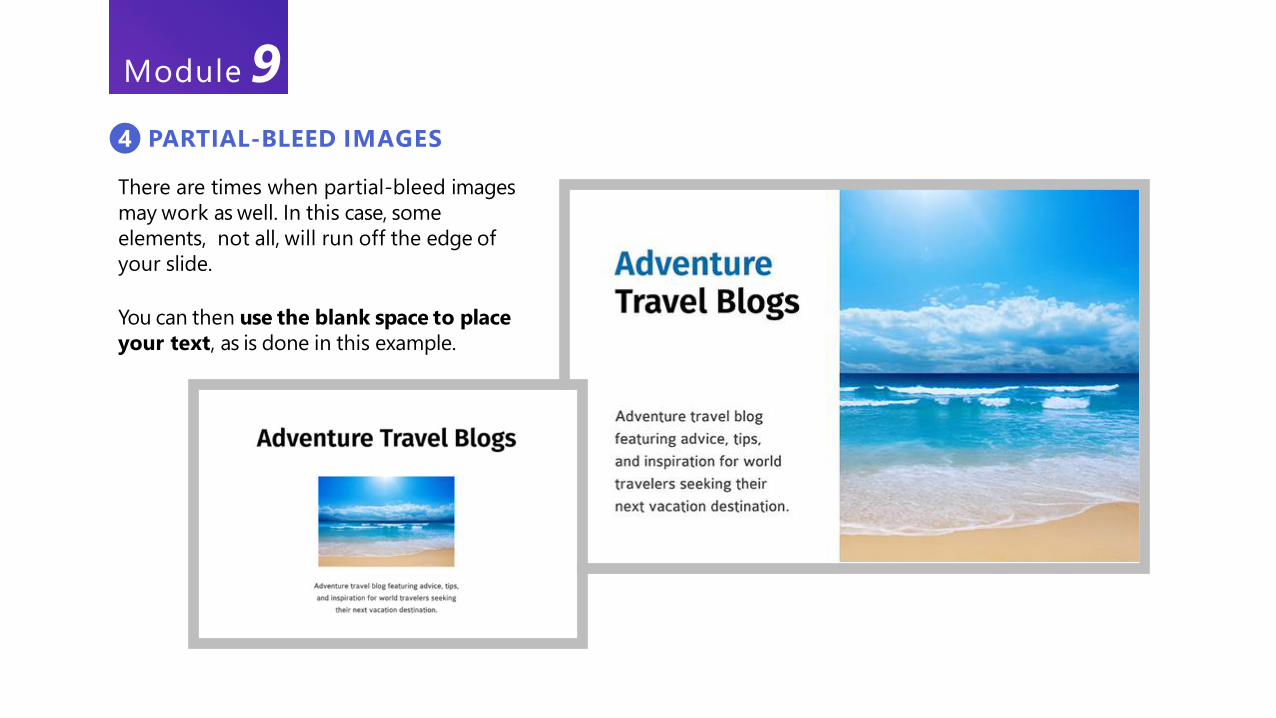
There are times when partial-bleed images
may work as well. In this case, some
elements, not all, will run off the edge of
your slide.
You can then use the blank space to place
your text, as is done in this example.
PARTIAL-BLEED IMAGES4
Module 9
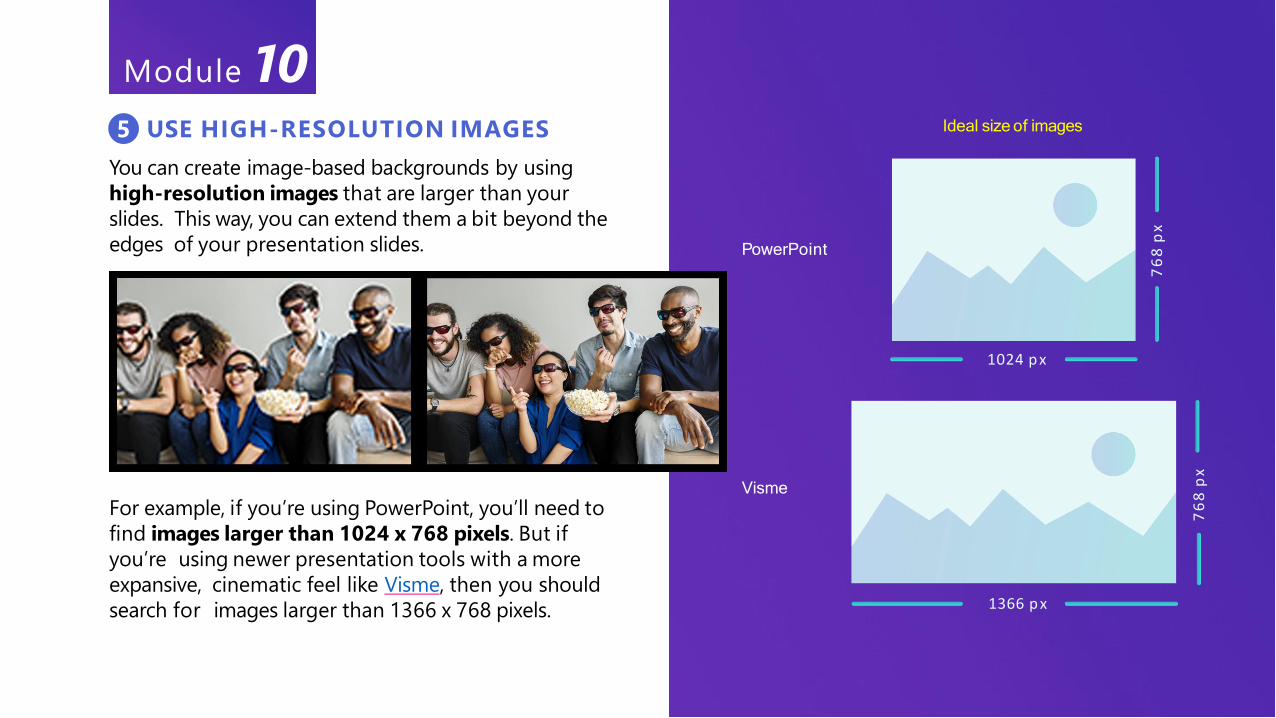
You can create image-based backgrounds by using
high-resolution images that are larger than your
slides. This way, you can extend them a bit beyond the
edges of your presentation slides.
For example, if you’re using PowerPoint, you’ll need to
find images larger than 1024 x 768 pixels. But if
you’re using newer presentation tools with a more
expansive, cinematic feel like Visme, then you should
search for images larger than 1366 x 768 pixels.
USE HIGH-RESOLUTION IMAGES5 Ideal size of images
1024 p x
1366 p x
76
8p
x
76
8p
x
PowerPoint
Visme
Module 10
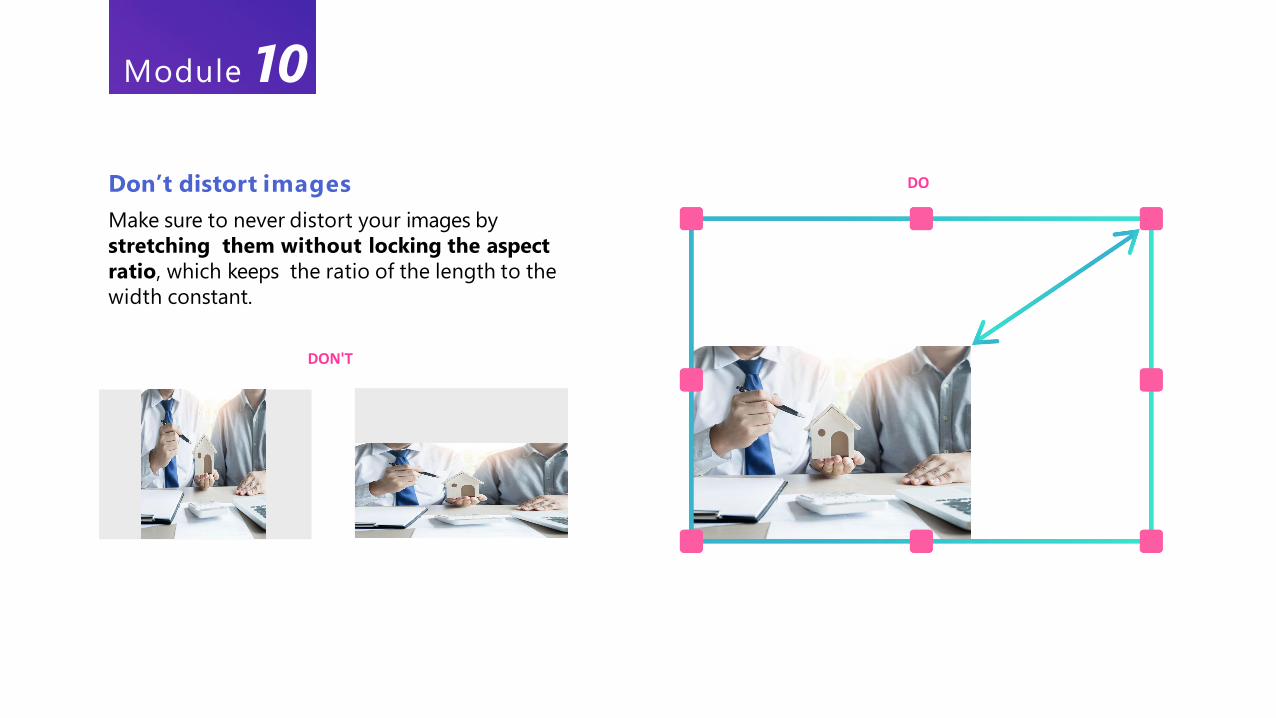
Don’t distort images
Make sure to never distort your images by
stretching them without locking the aspect
ratio, which keeps the ratio of the length to the
width constant.
DON'T
DO
Module 10
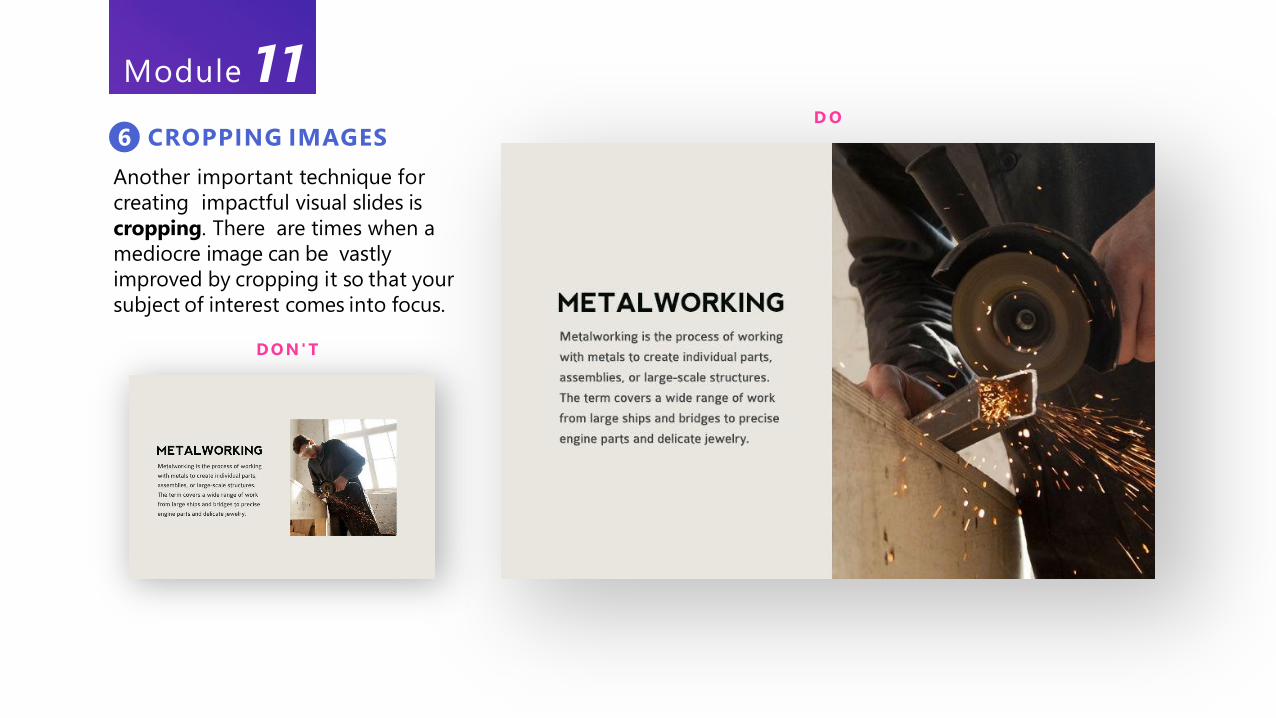
Another important technique for
creating impactful visual slides is
cropping. There are times when a
mediocre image can be vastly
improved by cropping it so that your
subject of interest comes into focus.
CROPPING IMAGES6
DON'T
D O
Module 11
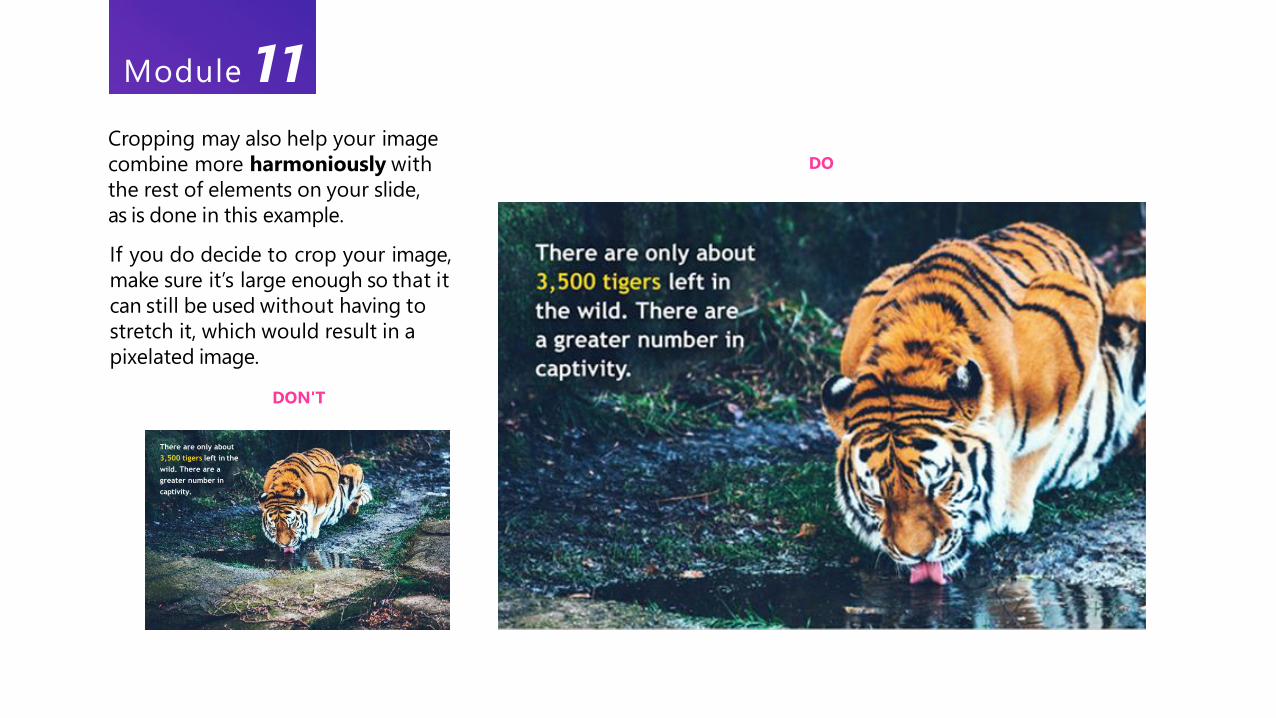
Cropping may also help your image
combine more harmoniously with
the rest of elements on your slide,
as is done in this example.
If you do decide to crop your image,
make sure it’s large enough so that it
can still be used without having to
stretch it, which would result in a
pixelated image.
DON'T
DO
There are only about
3,500 tigers left in the
wild. There are a
greater number in
captivity.
Module 11
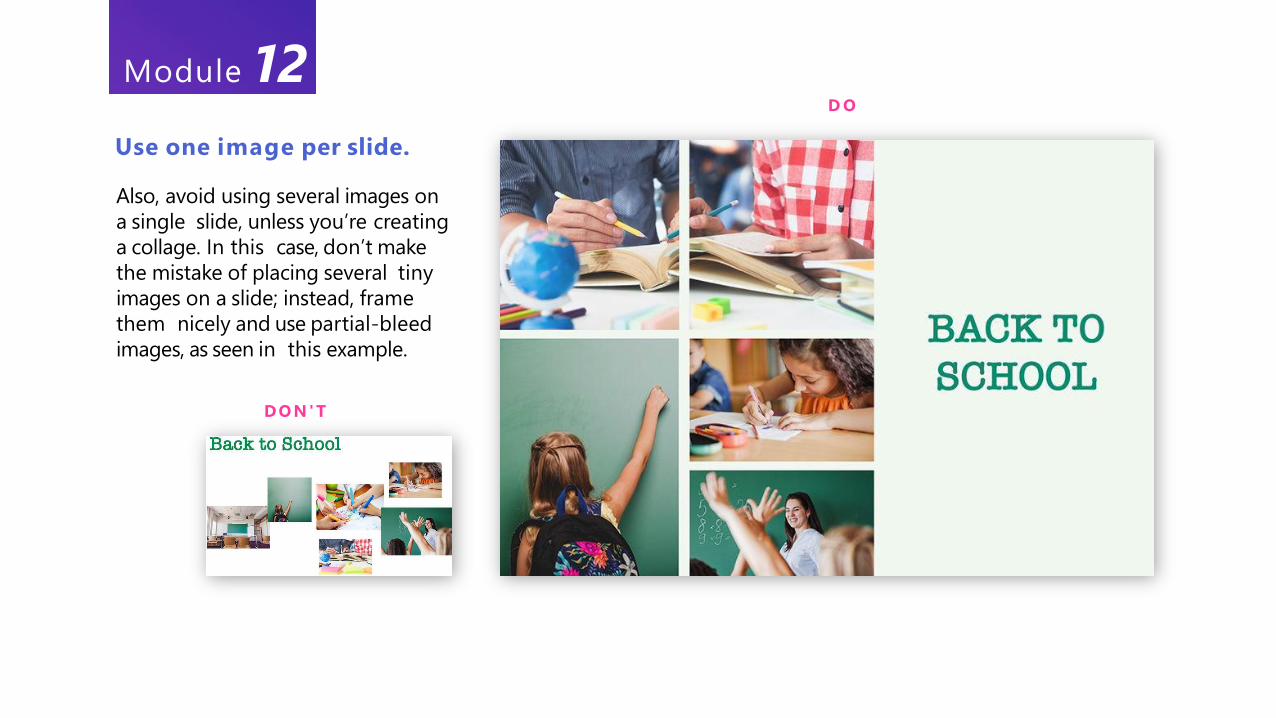
Use one image per slide.
Also, avoid using several images on
a single slide, unless you’re creating
a collage. In this case, don’t make
the mistake of placing several tiny
images on a slide; instead, frame
them nicely and use partial-bleed
images, as seen in this example.
DON'T
D O
Module 12
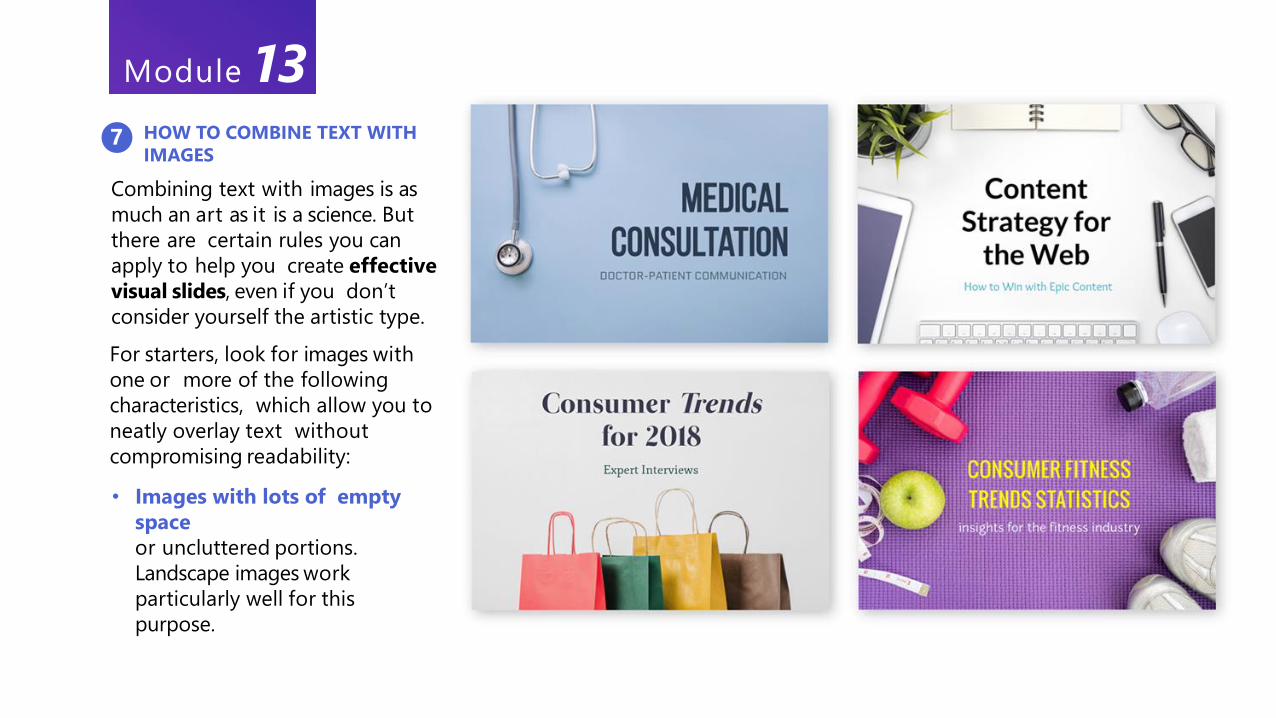
HOW TO COMBINE TEXT WITH
IMAGES7
Combining text with images is as
much an art as it is a science. But
there are certain rules you can
apply to help you create effective
visual slides, even if you don’t
consider yourself the artistic type.
For starters, look for images with
one or more of the following
characteristics, which allow you to
neatly overlay text without
compromising readability:
• Images with lots of empty
space
or uncluttered portions.
Landscape images work
particularly well for this
purpose.
Module 13
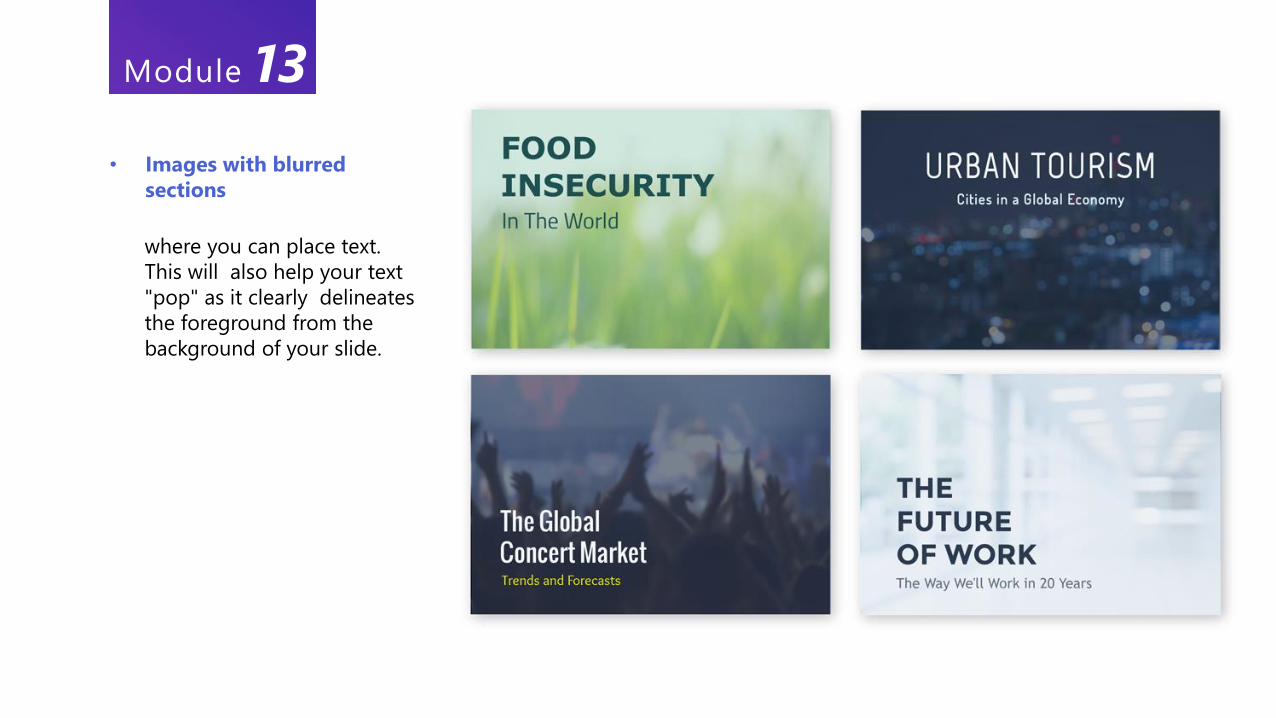
• Images with blurred
sections
where you can place text.
This will also help your text
"pop" as it clearly delineates
the foreground from the
background of your slide.
Module 13
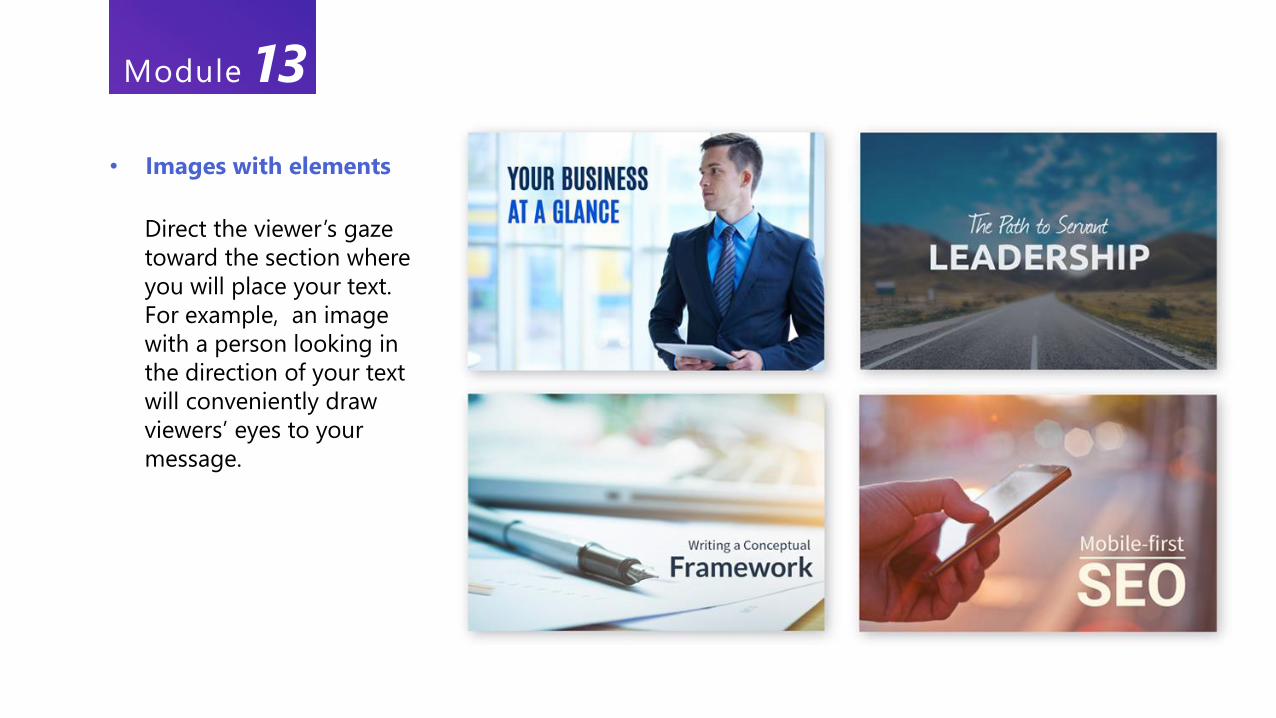
• Images with elements
Direct the viewer’s gaze
toward the section where
you will place your text.
For example, an image
with a person looking in
the direction of your text
will conveniently draw
viewers’ eyes to your
message.
Module 13
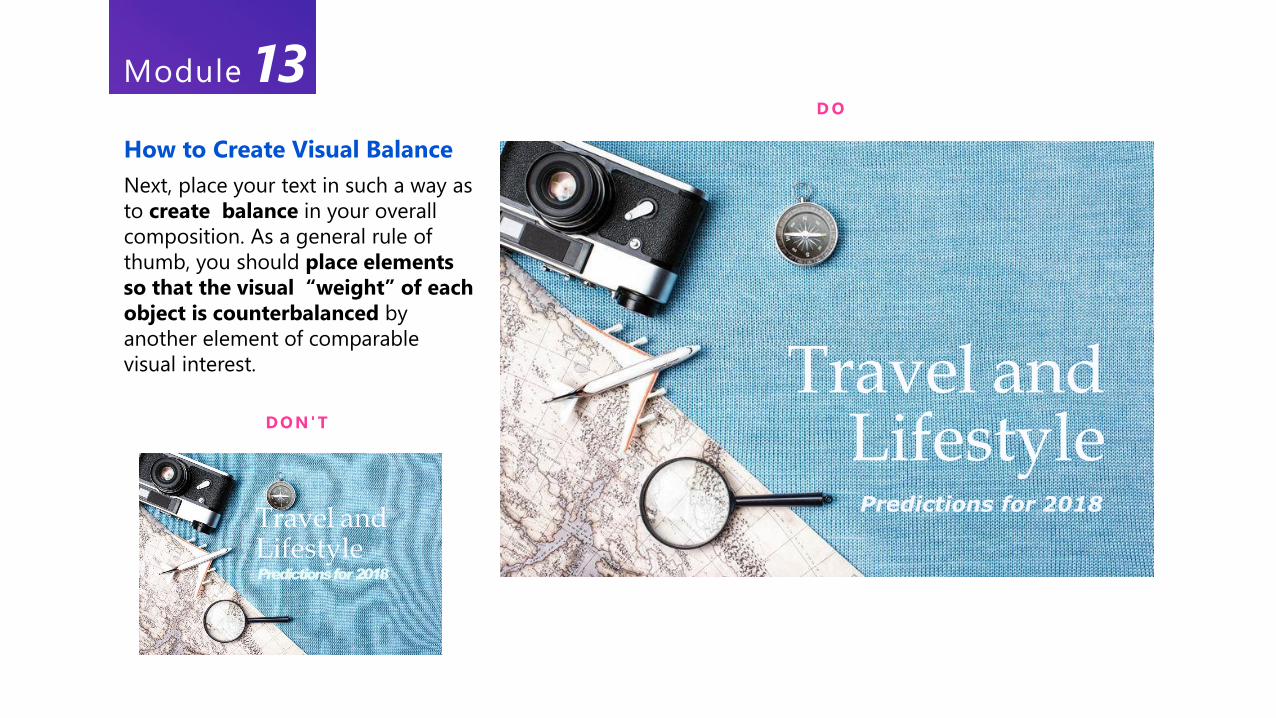
How to Create Visual Balance
Next, place your text in such a way as
to create balance in your overall
composition. As a general rule of
thumb, you should place elements
so that the visual “weight” of each
object is counterbalanced by
another element of comparable
visual interest. Travel and LifestylePredictions for 2018
Travel and LifestylePredictions for2018
DON'T
D O
Module 13
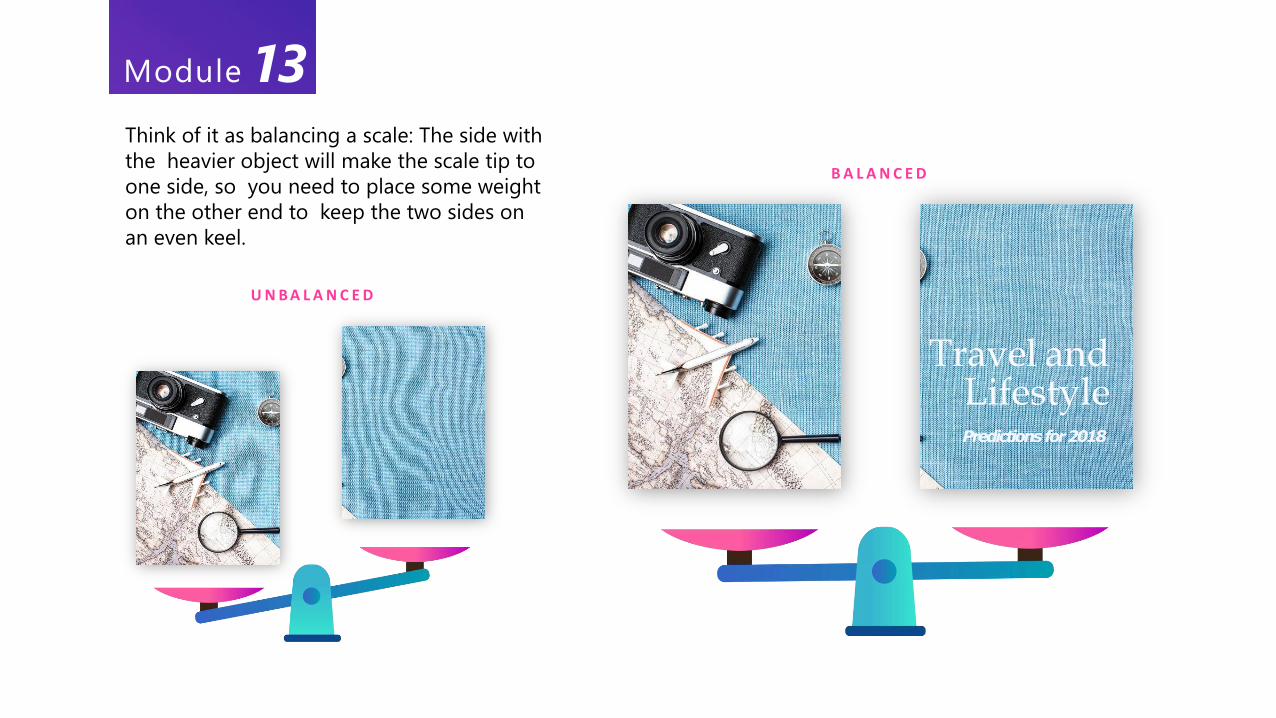
Think of it as balancing a scale: The side with
the heavier object will make the scale tip to
one side, so you need to place some weight
on the other end to keep the two sides on
an even keel.
Travel and LifestylePredictions for 2018
U N B A L A N C E D
B A L A N C E D
Module 13
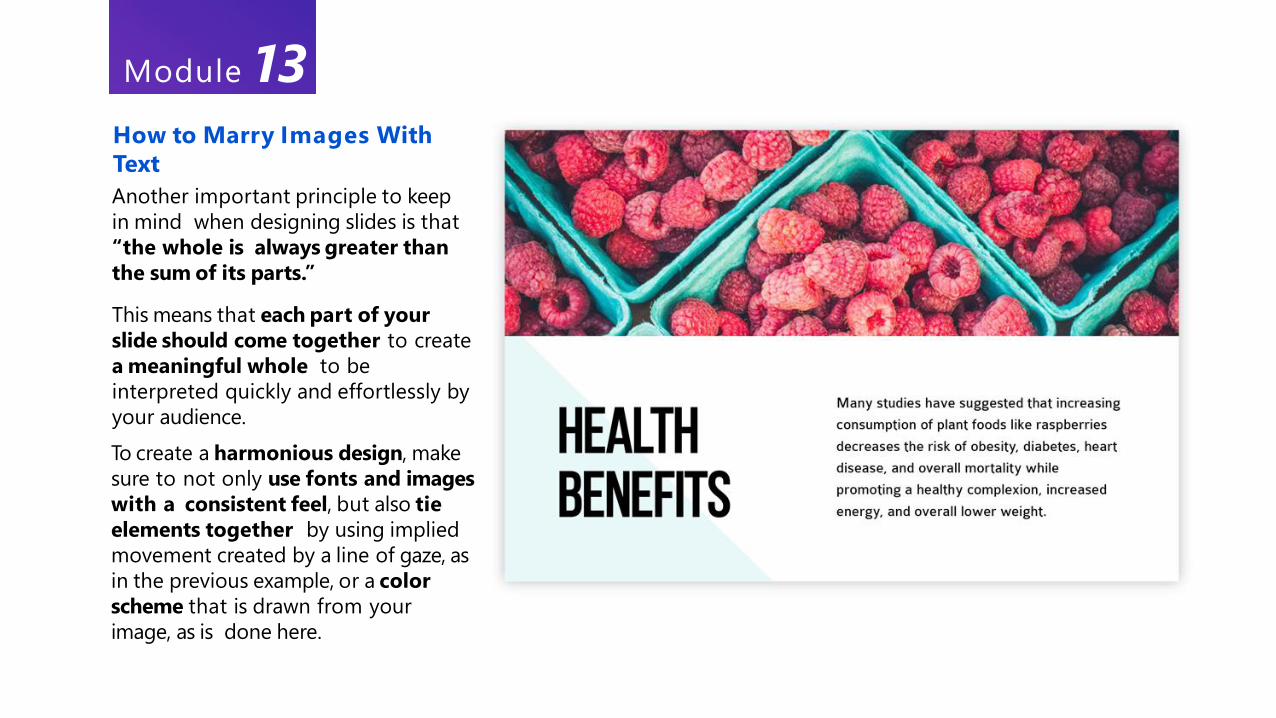
How to Marry Images With
Text
Another important principle to keep
in mind when designing slides is that
“the whole is always greater than
the sum of its parts.”
This means that each part of your
slide should come together to create
a meaningful whole to be
interpreted quickly and effortlessly by
your audience.
To create a harmonious design, make
sure to not only use fonts and images
with a consistent feel, but also tie
elements together by using implied
movement created by a line of gaze, as
in the previous example, or a color
scheme that is drawn from your
image, as is done here.
Module 13
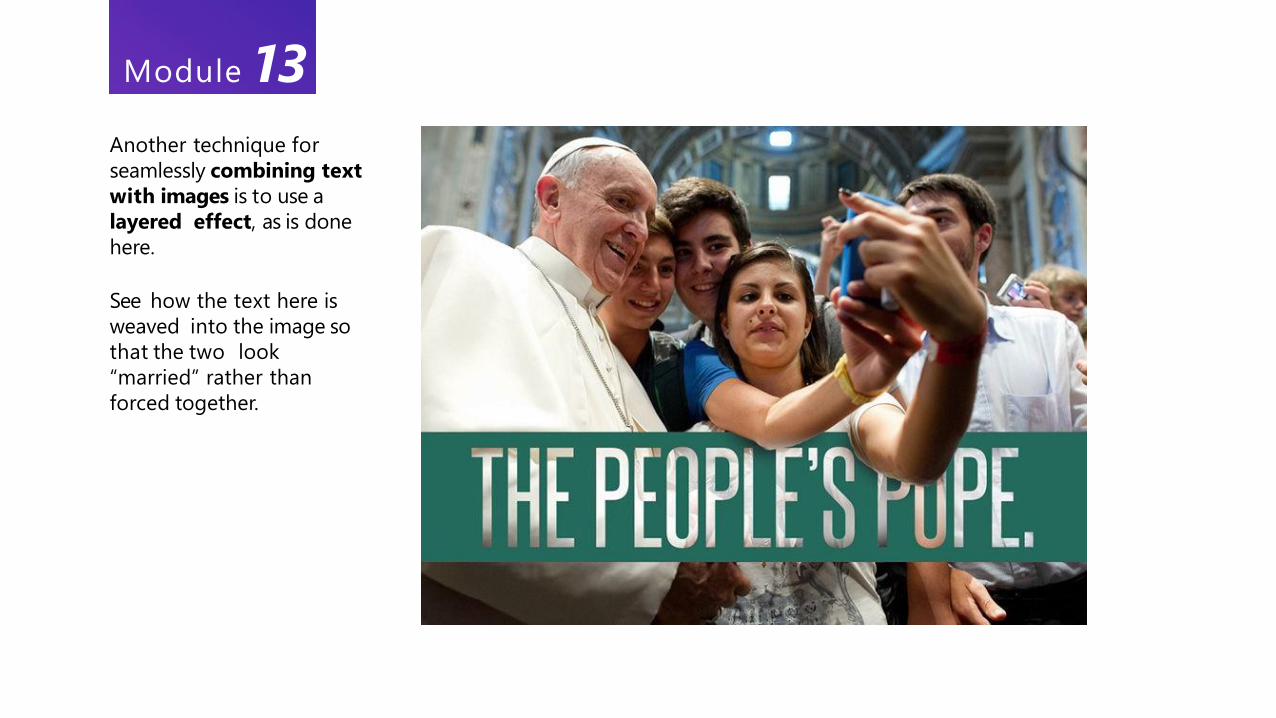
Another technique for
seamlessly combining text
with images is to use a
layered effect, as is done
here.
See how the text here is
weaved into the image so
that the two look
“married” rather than
forced together.
Module 13
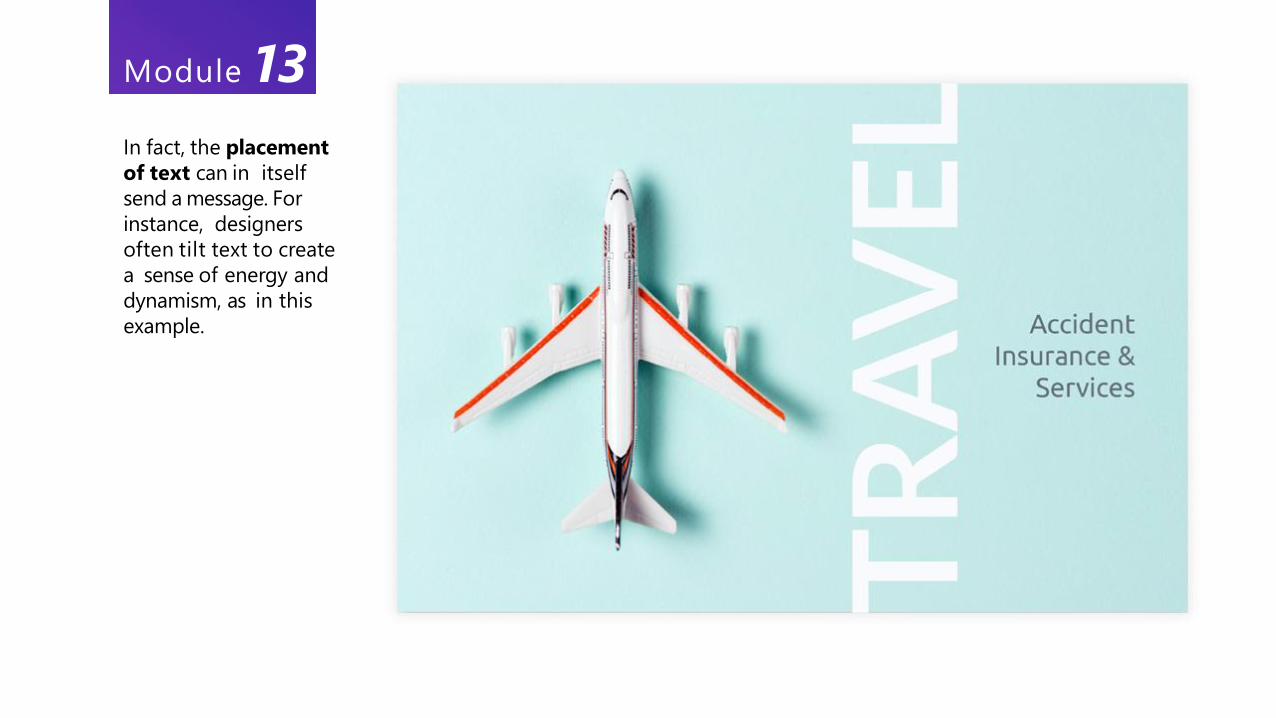
In fact, the placement
of text can in itself
send a message. For
instance, designers
often tilt text to create
a sense of energy and
dynamism, as in this
example.
Module 13
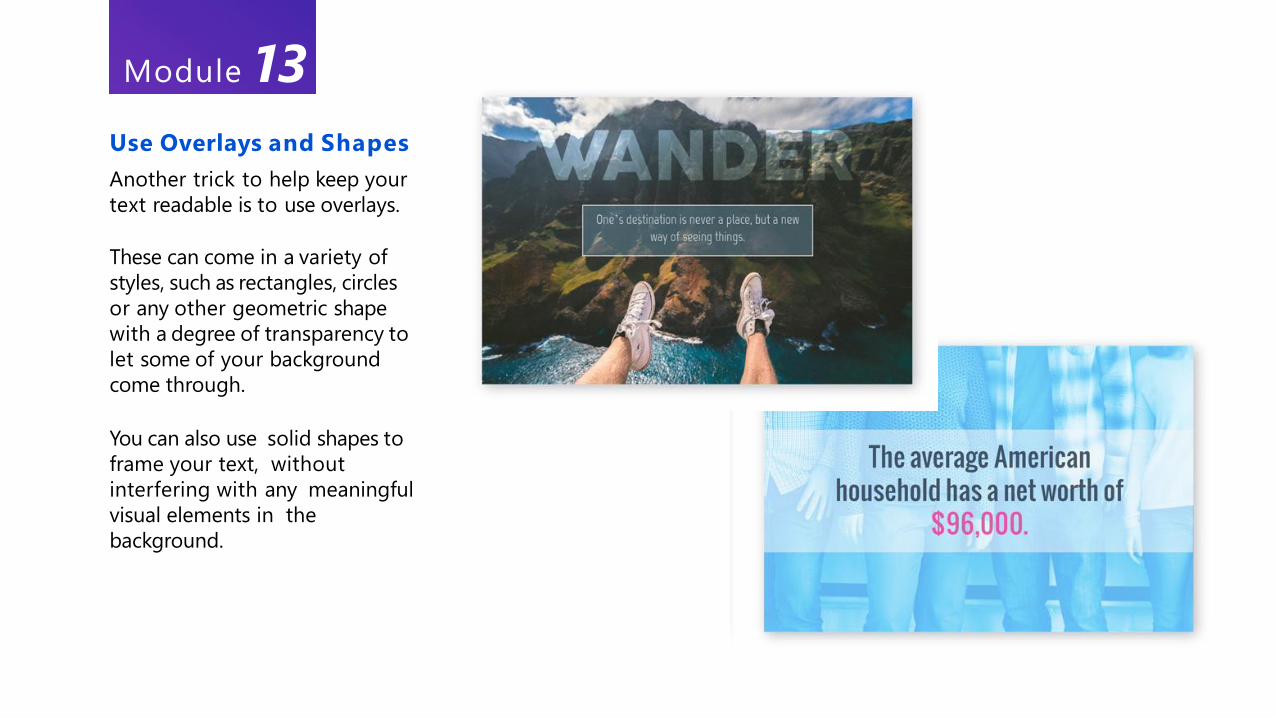
Use Overlays and Shapes
Another trick to help keep your
text readable is to use overlays.
These can come in a variety of
styles, such as rectangles, circles
or any other geometric shape
with a degree of transparency to
let some of your background
come through.
You can also use solid shapes to
frame your text, without
interfering with any meaningful
visual elements in the
background.
Module 13
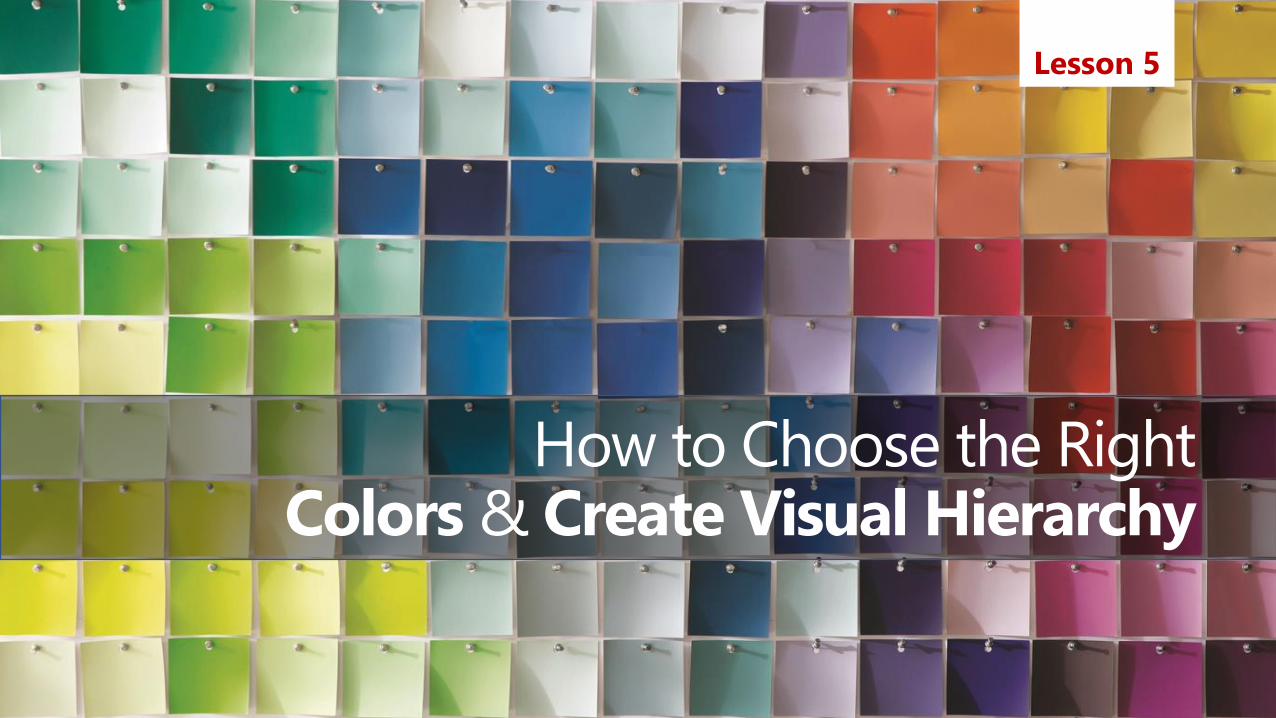
How to Choose the Right Colors & Create Visual Hierarchy
Lesson 5
How to Choose the Right Color SchemeThe Meaning of ColorsHow to Combine ColorsHow to Choose a High-Contrast Color SchemeColor Scheme ToolsQuick Tips: Slide Design RulesHow to Create Your Own PalettesApply Your Color Scheme to a SlideAdjust the Color of Your ImagesHow to Achieve Visual HierarchyPay Attention to Color Depth
Module
Lesson 5: How to Choose the Right Colors and Create Visual Hierarchy
Create an Illusion of DepthUse Contrast to Attract Viewers' EyesUse Alignment to Direct the EyesUse the Rule of Thirds to Create a Focal PointUse Negative Space to Emphasize Key ElementsHow to Create a Coherent DesignSuggest a Visual Connection Through ClosureUse Repeated Elements to Tie Your Design TogetherInvert the Color Scheme to Create Visual InterestUse Proximity to Group Similar Elements

Colors speak volumes all on their own. Color is so
powerful, in fact, that it can improve learning by up to
75 percent and increase comprehension on a subject
by up to 73 percent.
While warm colors communicate energy, optimism
and enthusiasm, cool colors send a message of
dependability, professionalism and peace.
Within these categories, each color is associated with
an emotion or concept, depending on the cultural
context (while red can mean passion and love in the
West, in China, it is associated with prosperity).
H o w to C h o o s e the Per fec t Colors
THE MEANING OF COLORS1
Module 1
Video: https://www.youtube.com/watch?v=A-slfeWiQ1A&feature=youtu.be
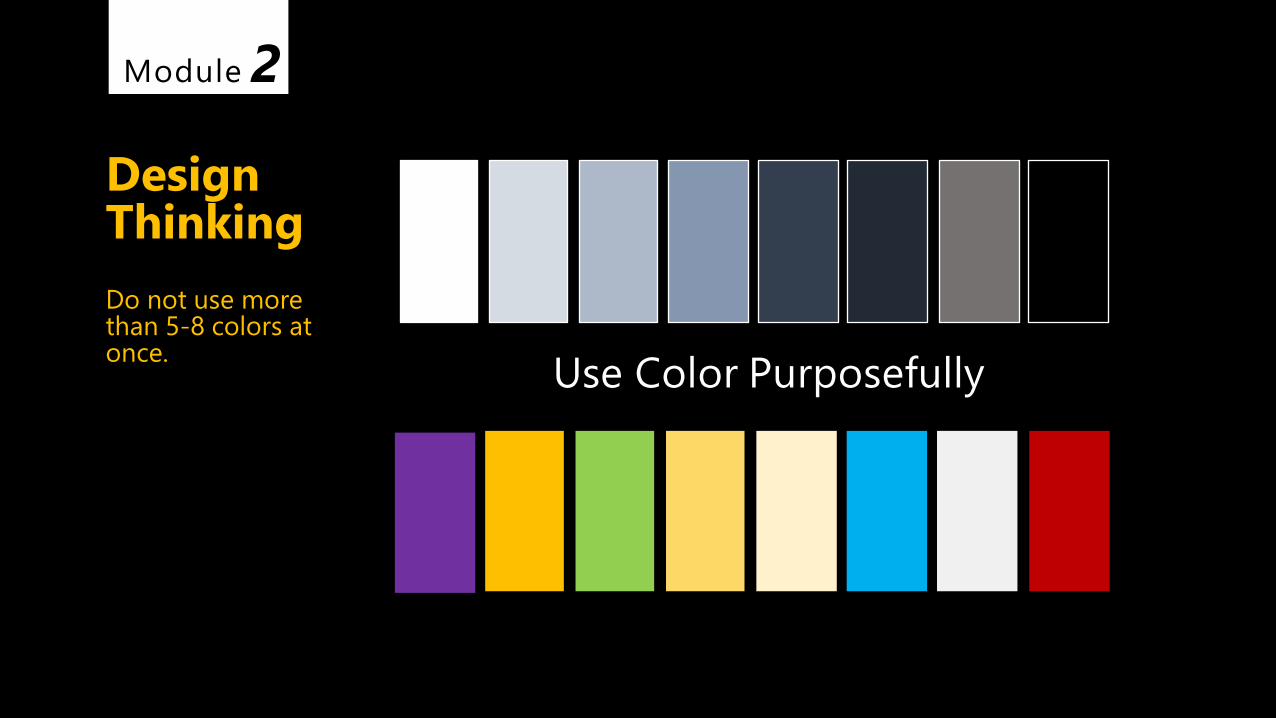
Design Thinking
Do not use more than 5-8 colors at once.
Use Color Purposefully
Module 2
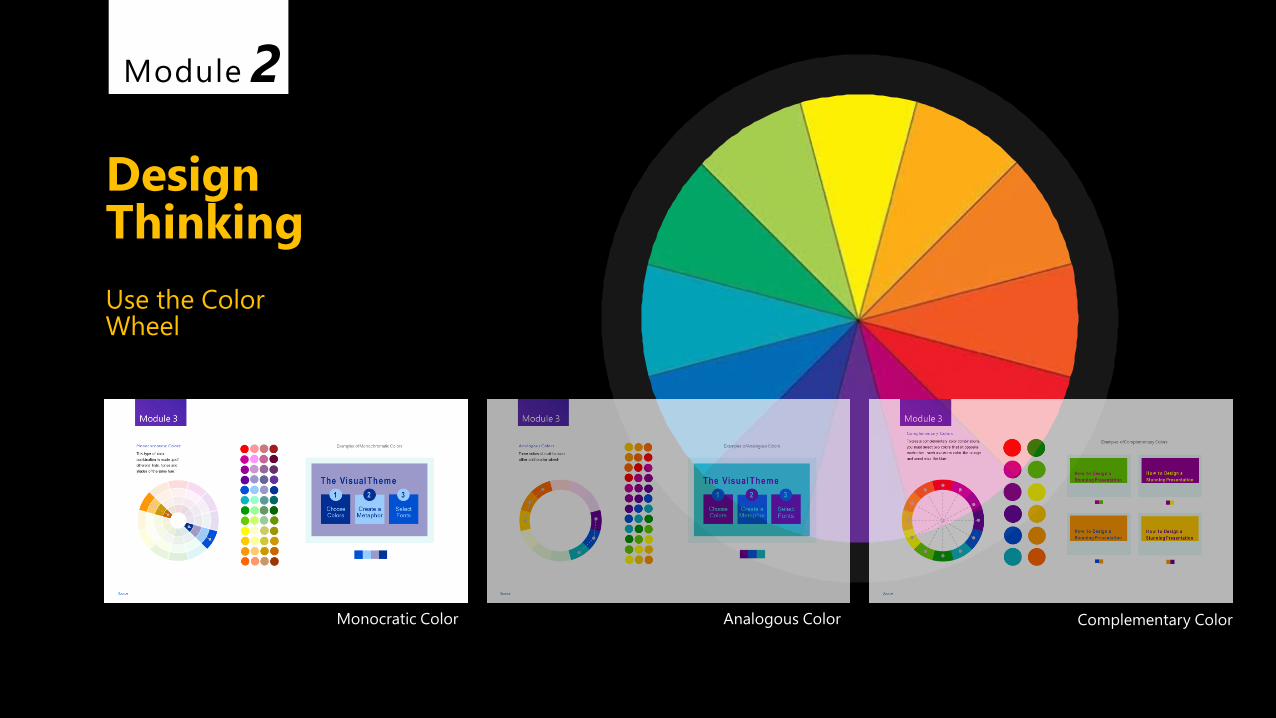
Design Thinking
Use the Color Wheel
Monocratic Color Analogous Color Complementary Color
Module 2
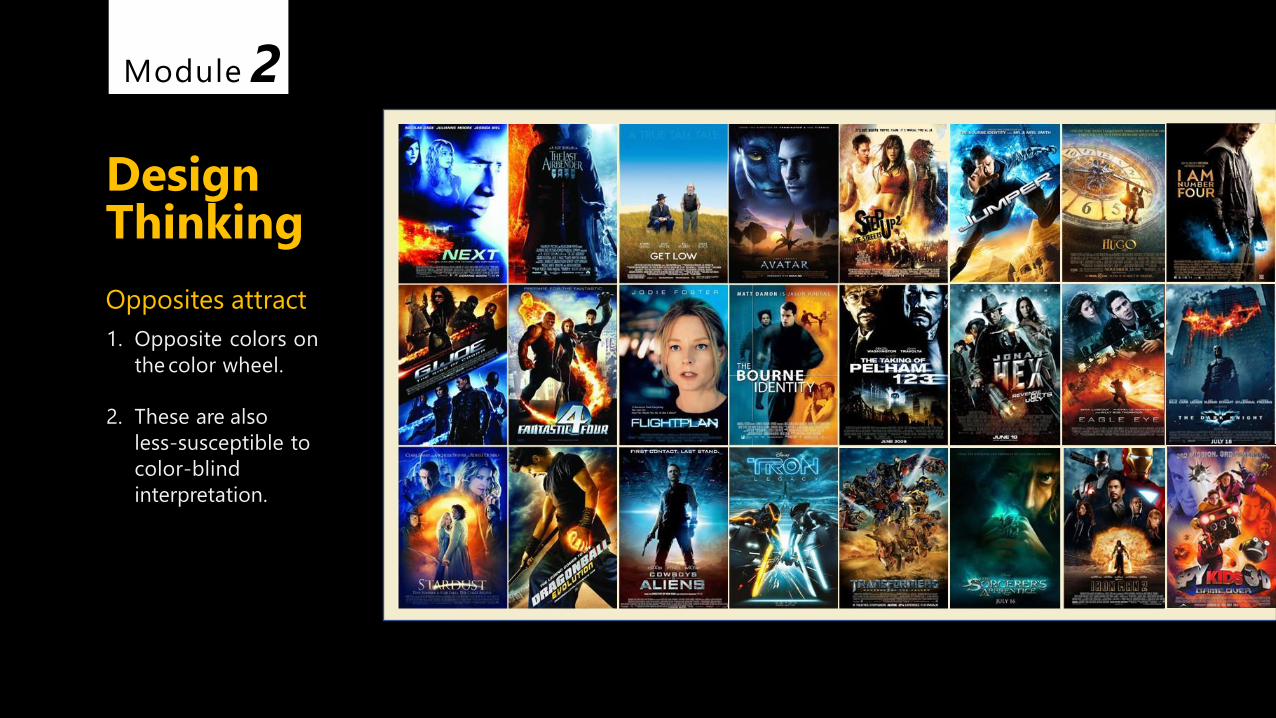
Design Thinking
Opposites attract
1. Opposite colors on
the color wheel.
2. These are also
less-susceptible to
color-blind
interpretation.
Module 2
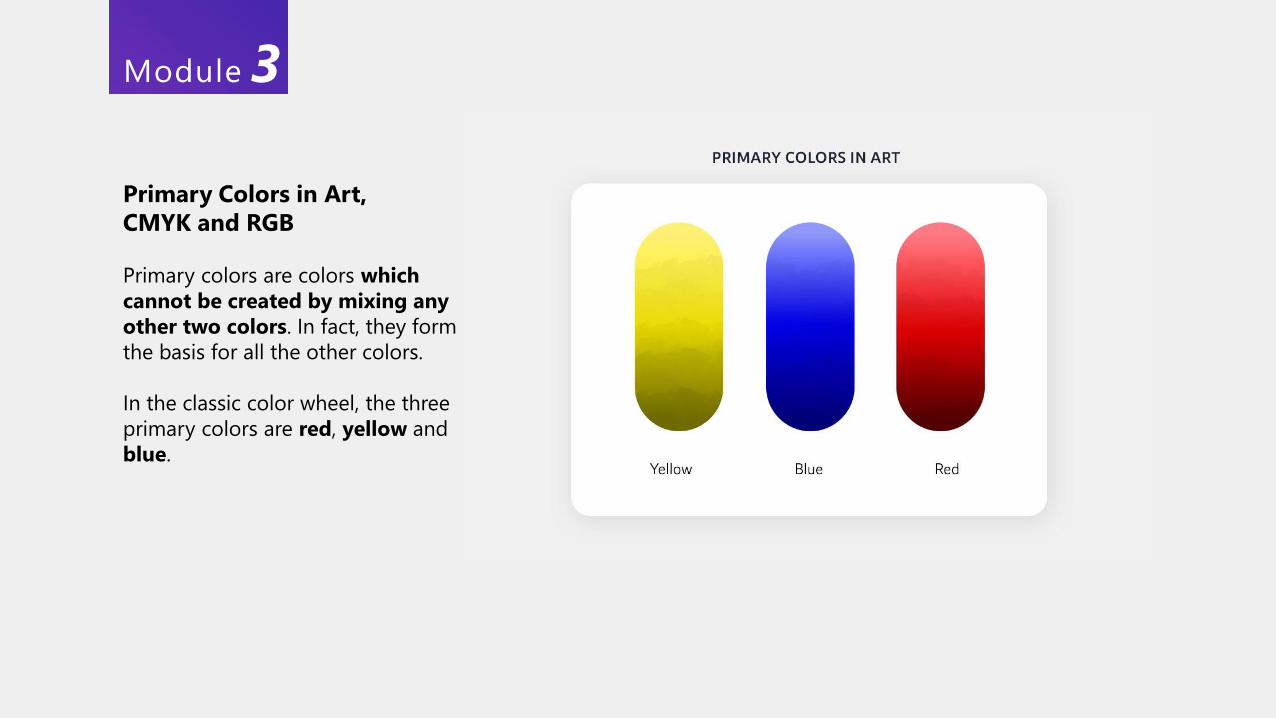
Primary Colors in Art,
CMYK and RGB
Primary colors are colors which
cannot be created by mixing any
other two colors. In fact, they form
the basis for all the other colors.
In the classic color wheel, the three
primary colors are red, yellow and
blue.
Module 3
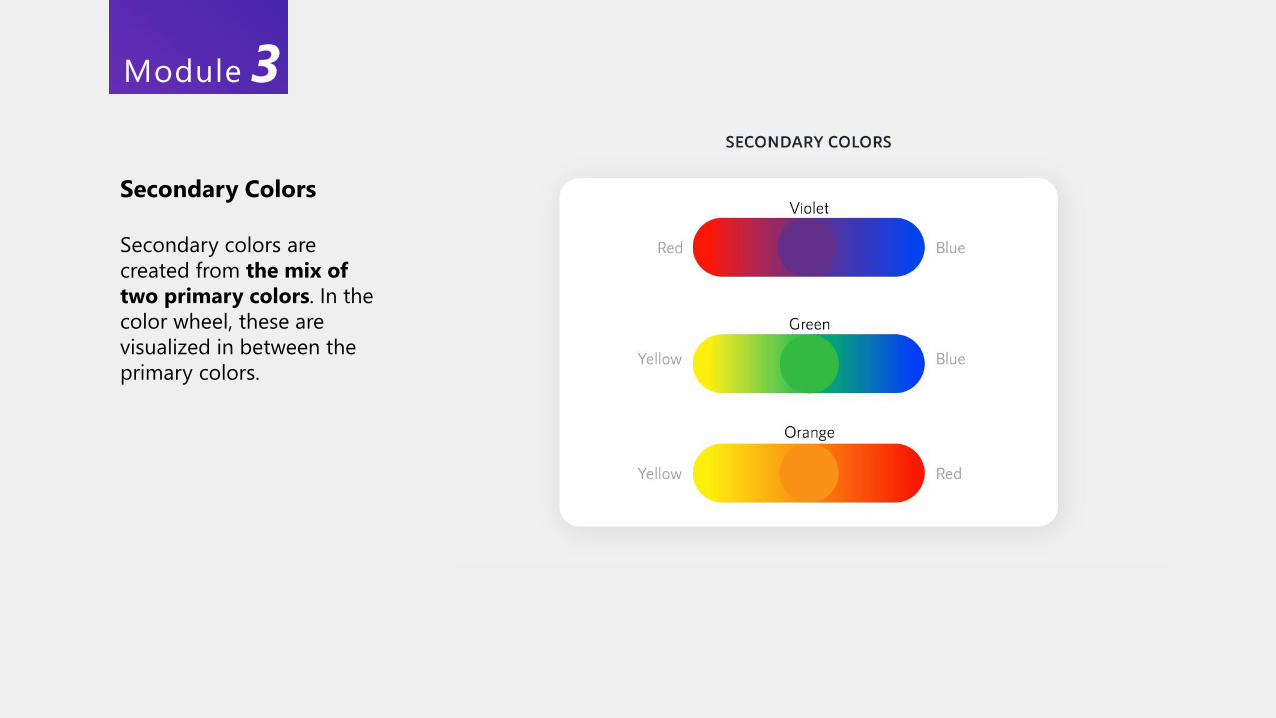
Secondary Colors
Secondary colors are
created from the mix of
two primary colors. In the
color wheel, these are
visualized in between the
primary colors.
Module 3
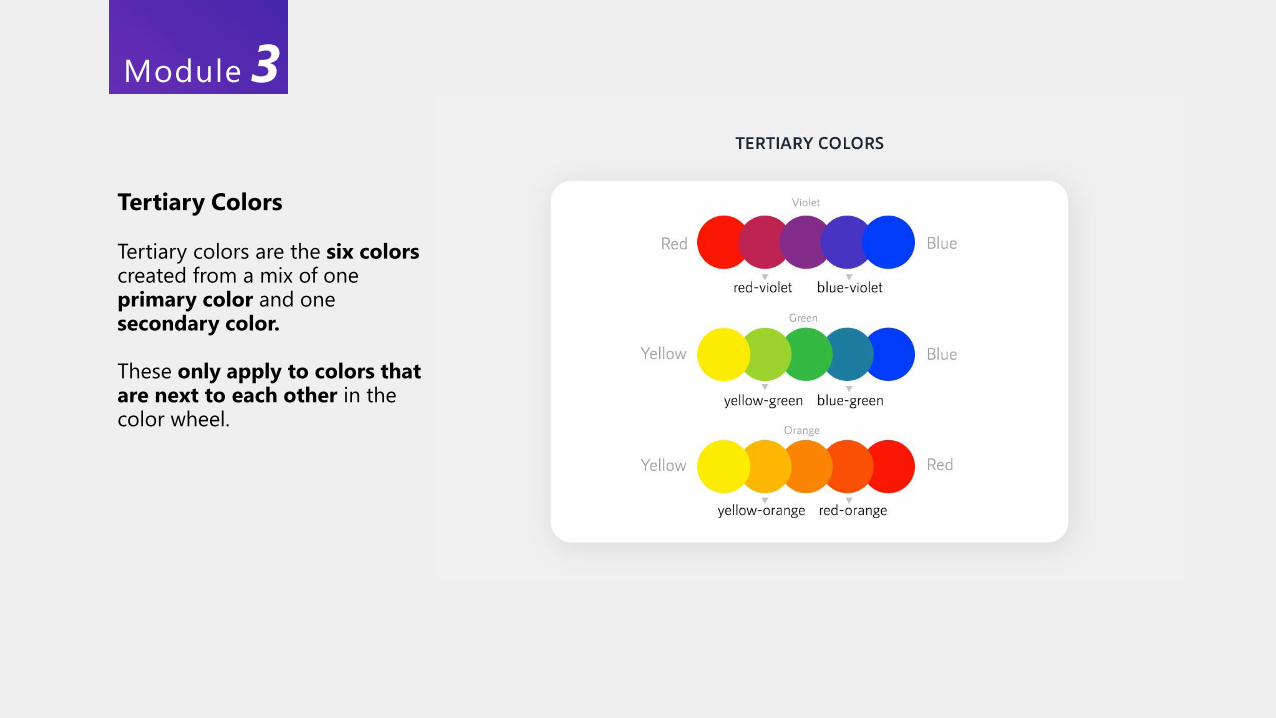
Tertiary Colors
Tertiary colors are the six colors created from a mix of one primary color and one secondary color.
These only apply to colors that are next to each other in the color wheel.
Module 3
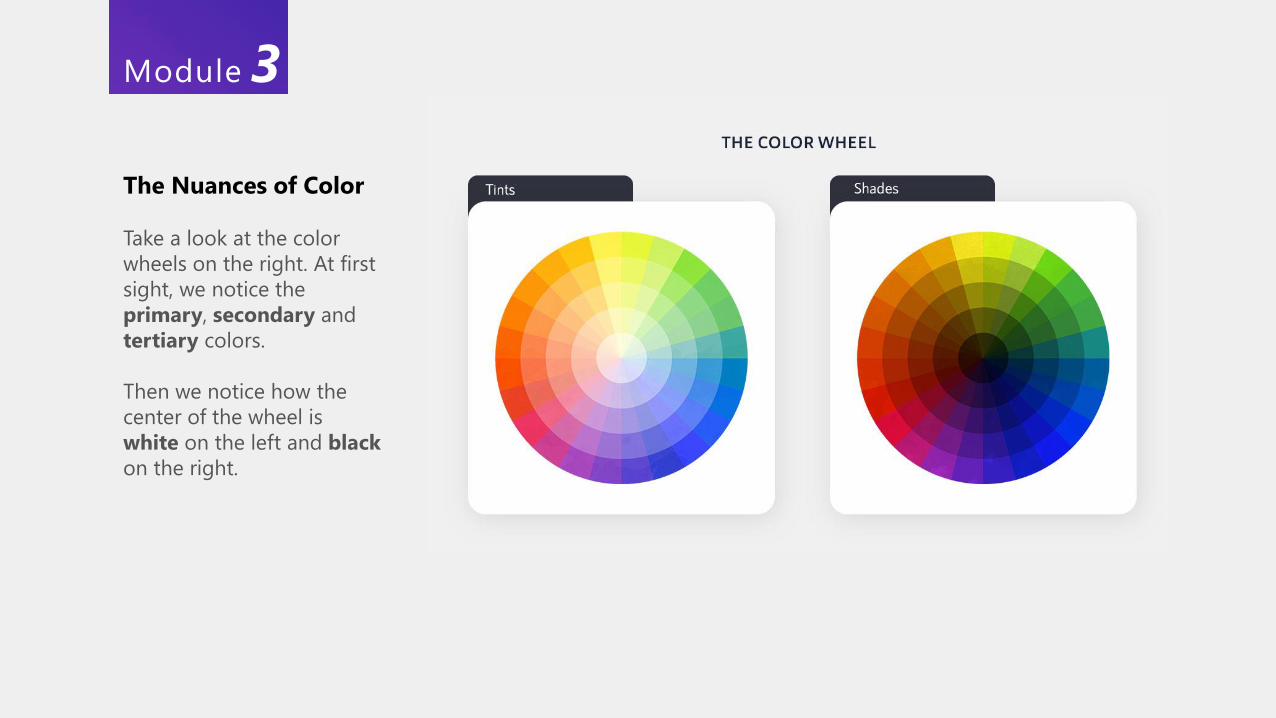
The Nuances of Color
Take a look at the color
wheels on the right. At first
sight, we notice the
primary, secondary and
tertiary colors.
Then we notice how the
center of the wheel is
white on the left and black
on the right.
Module 3
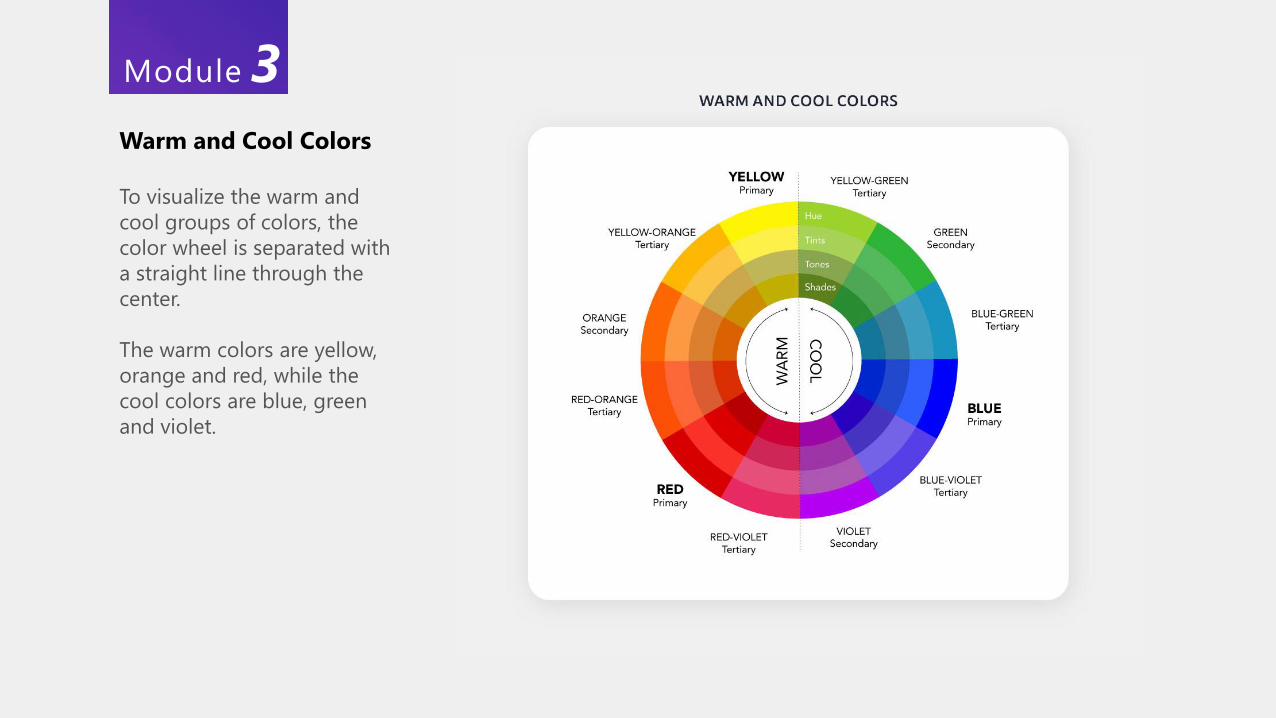
Warm and Cool Colors
To visualize the warm and
cool groups of colors, the
color wheel is separated with
a straight line through the
center.
The warm colors are yellow,
orange and red, while the
cool colors are blue, green
and violet.
Module 3
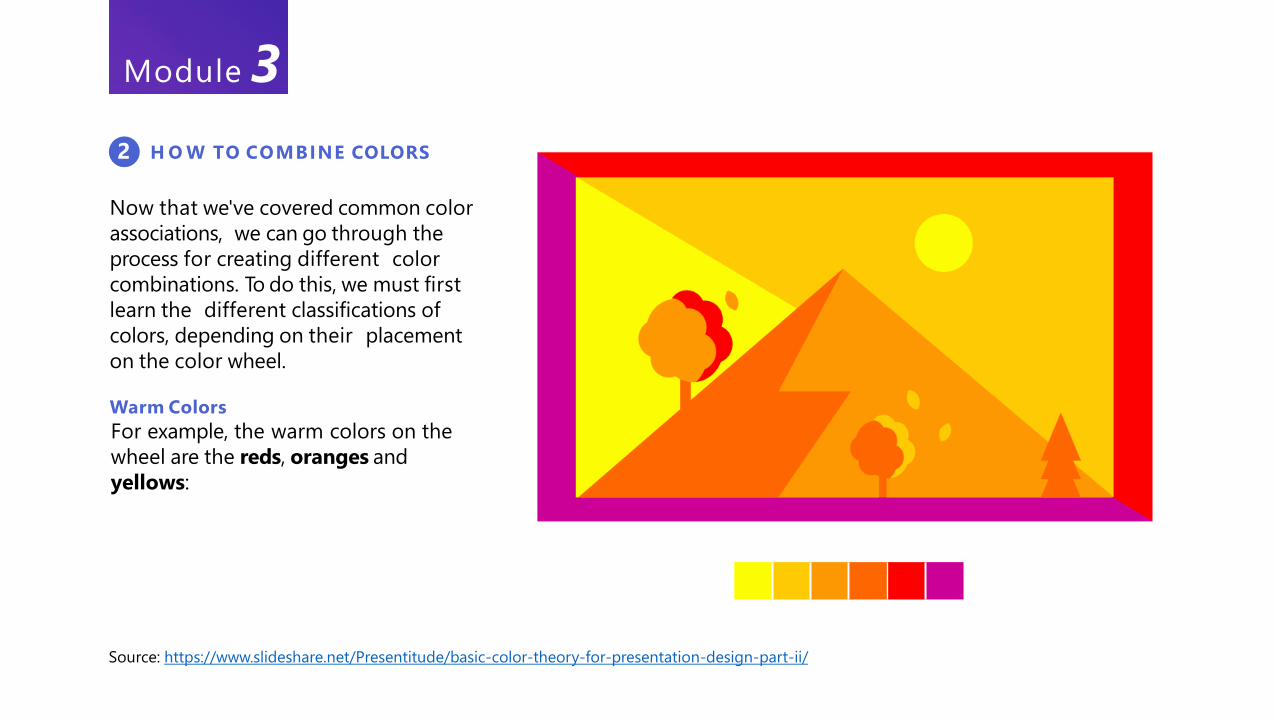
2 H O W TO COMBINE COLORS
Now that we've covered common color
associations, we can go through the
process for creating different color
combinations. To do this, we must first
learn the different classifications of
colors, depending on their placement
on the color wheel.
Warm Colors
For example, the warm colors on the
wheel are the reds, oranges and
yellows:
Source: https://www.slideshare.net/Presentitude/basic-color-theory-for-presentation-design-part-ii/
Module 3
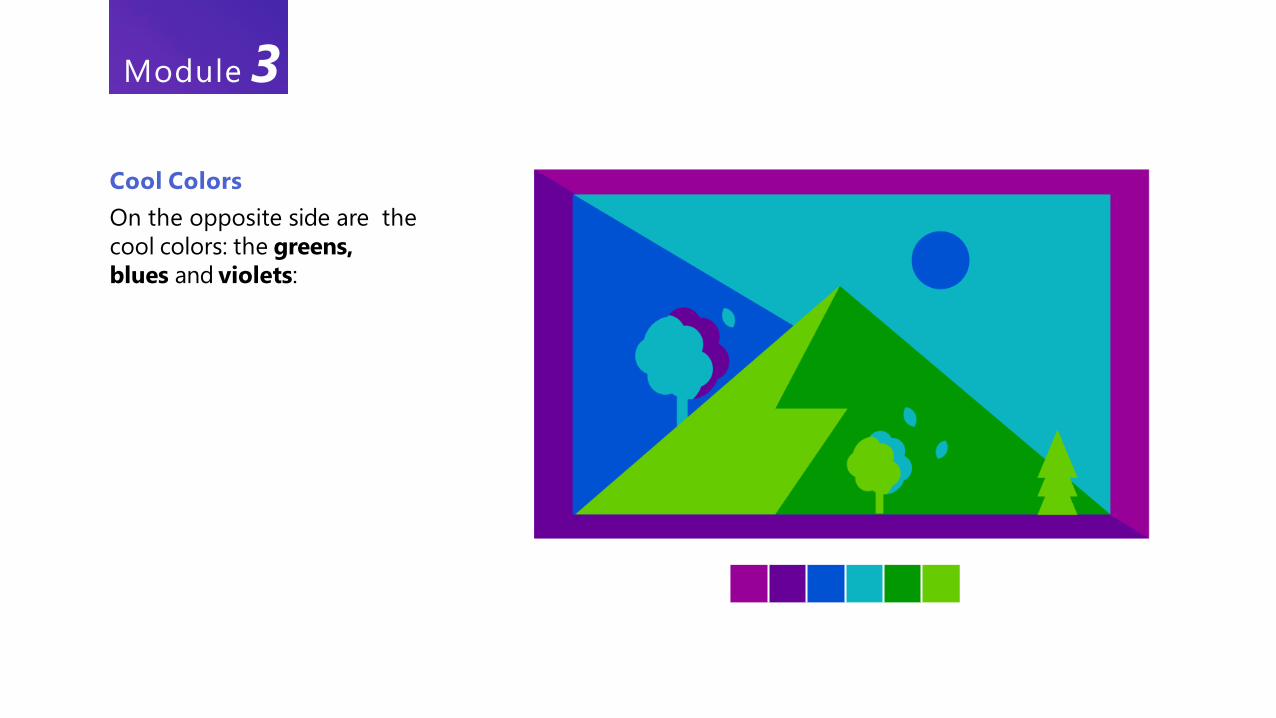
Cool Colors
On the opposite side are the
cool colors: the greens,
blues and violets:
Module 3
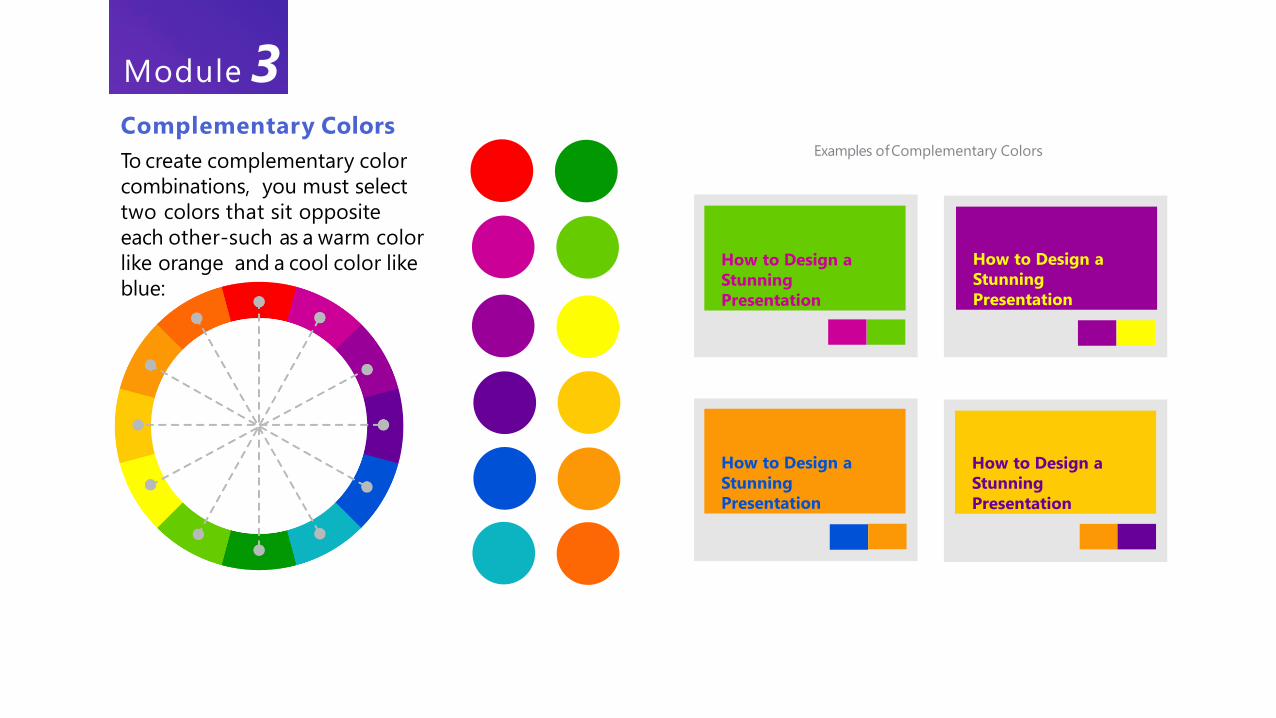
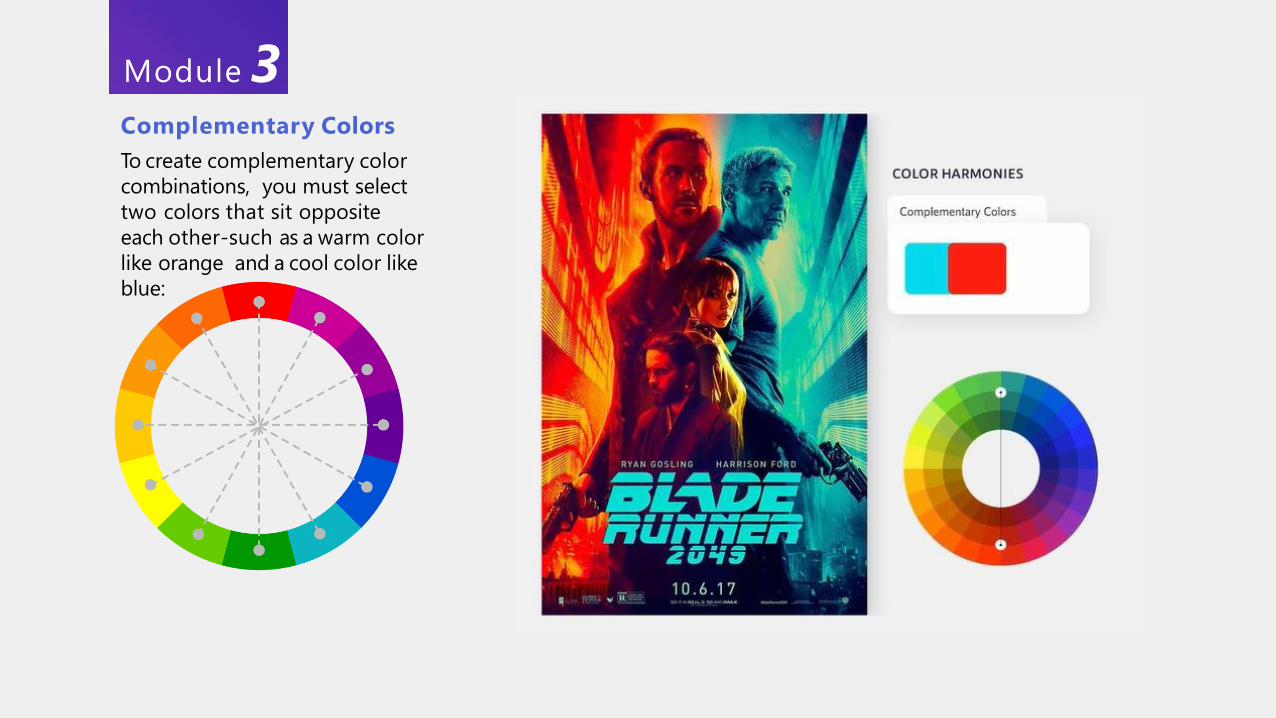
Complementary Colors
To create complementary color
combinations, you must select
two colors that sit opposite
each other-such as a warm color
like orange and a cool color like
blue:
How to Design a
Stunning
Presentation
How to Design a
Stunning
Presentation
How to Design a
Stunning
Presentation
How to Design a
Stunning
Presentation
Examples ofComplementary Colors
Module 3
Complementary Colors
To create complementary color
combinations, you must select
two colors that sit opposite
each other-such as a warm color
like orange and a cool color like
blue:
Module 3
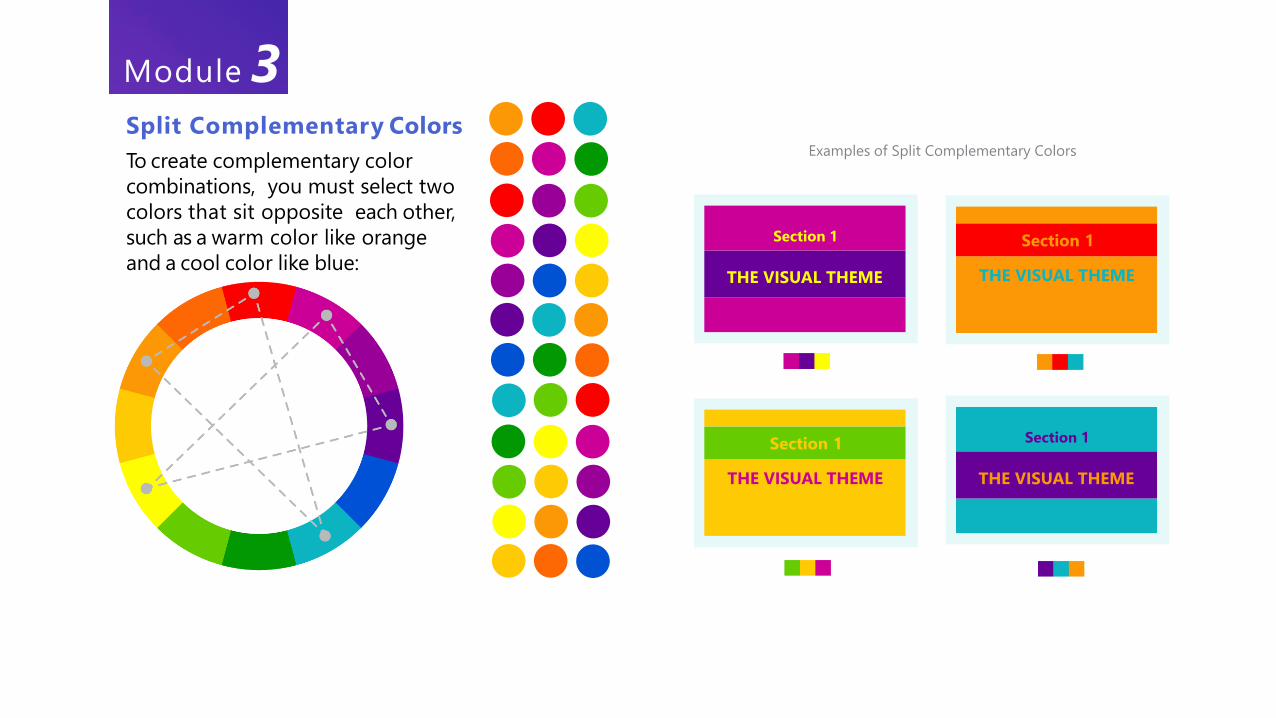
Split Complementary Colors
To create complementary color
combinations, you must select two
colors that sit opposite each other,
such as a warm color like orange
and a cool color like blue:
Examples of Split Complementary Colors
Section 1
THE VISUAL THEME
Section 1
THE VISUAL THEME
Section 1
THE VISUAL THEME
Section 1
THE VISUAL THEME
Module 3
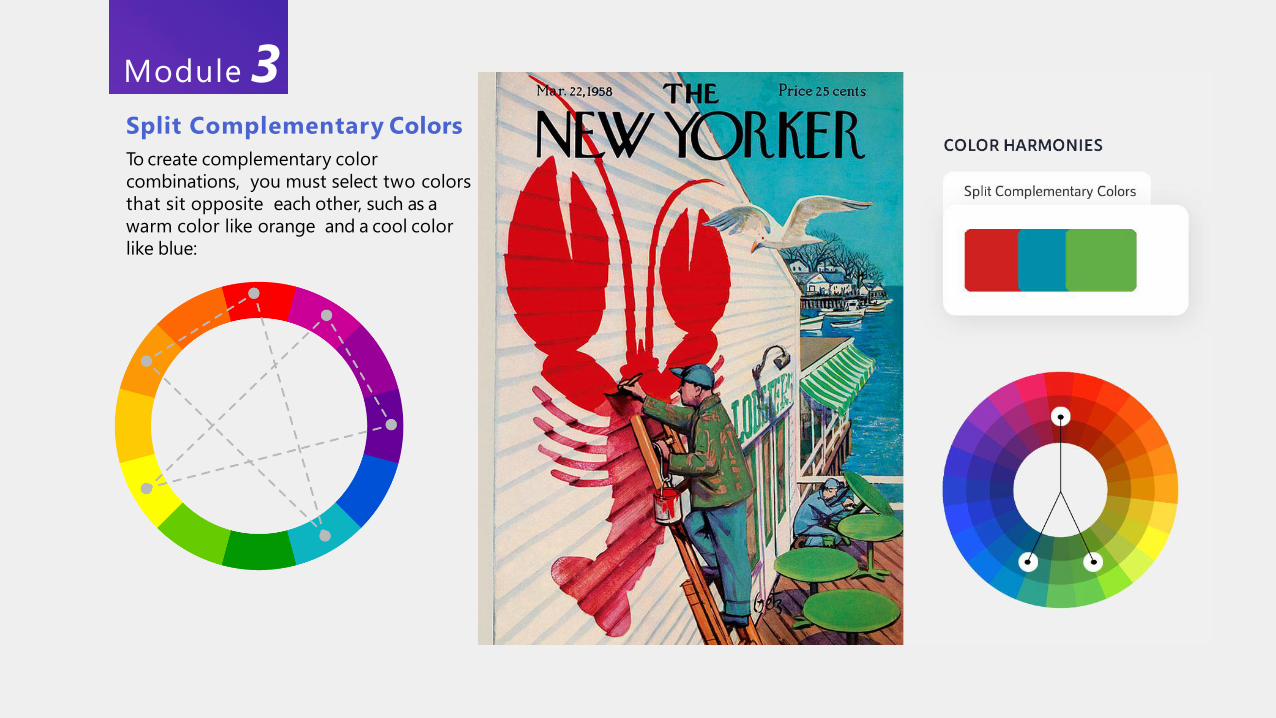
Split Complementary Colors
To create complementary color
combinations, you must select two colors
that sit opposite each other, such as a
warm color like orange and a cool color
like blue:
Module 3
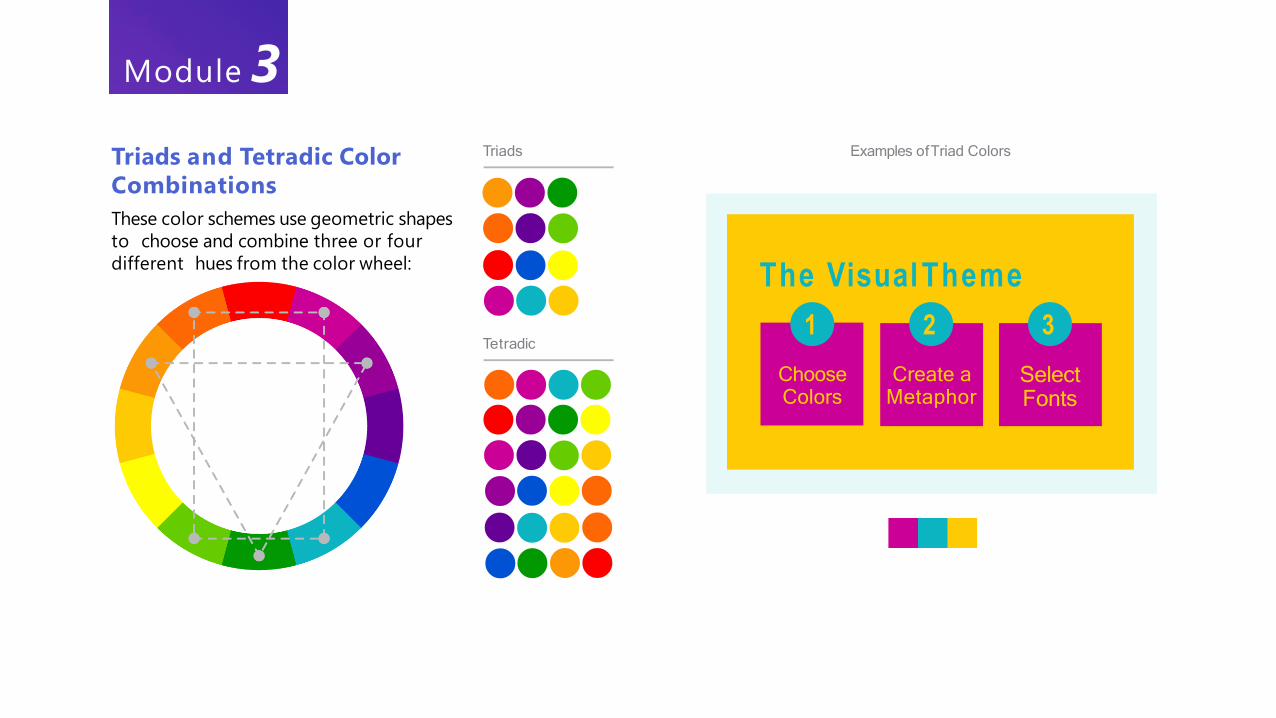
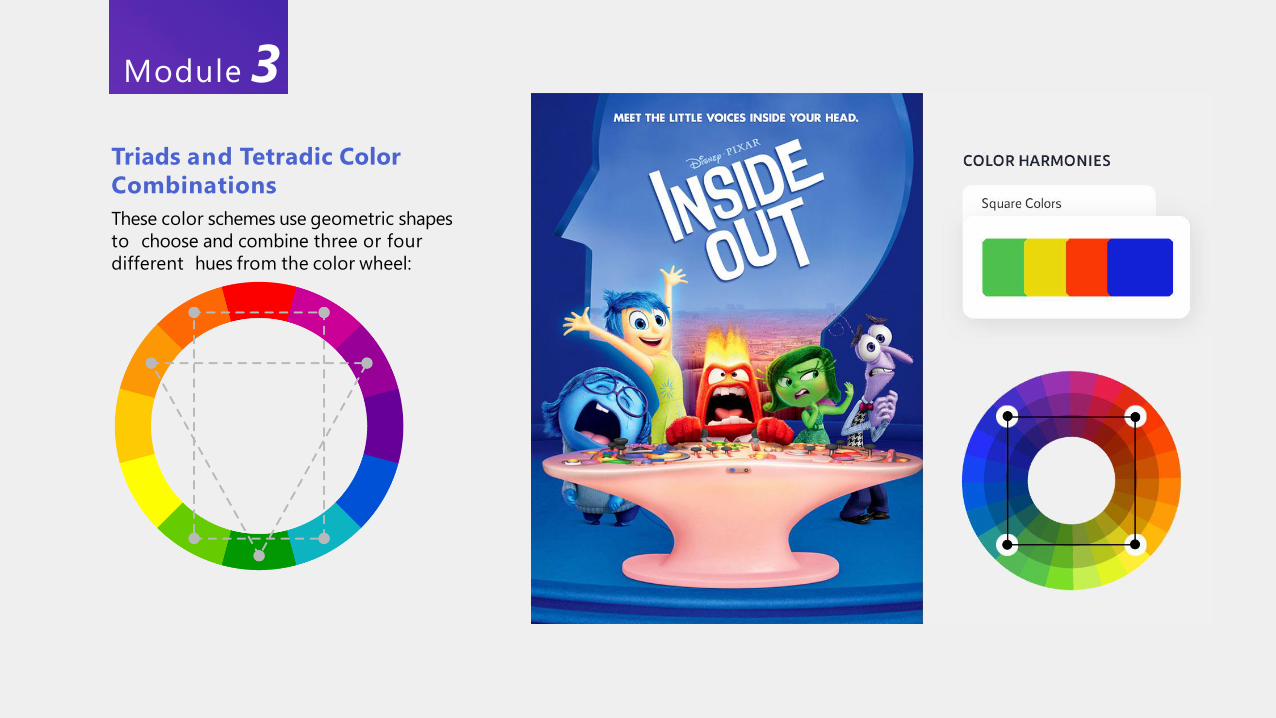
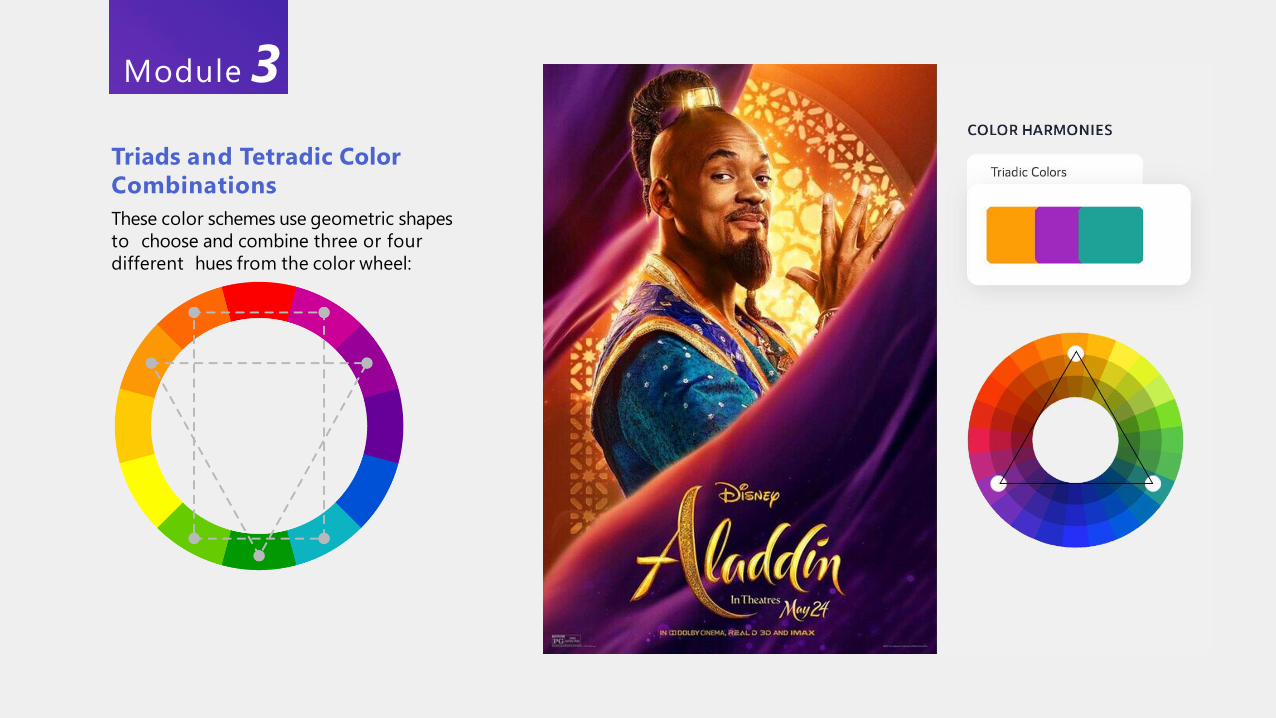
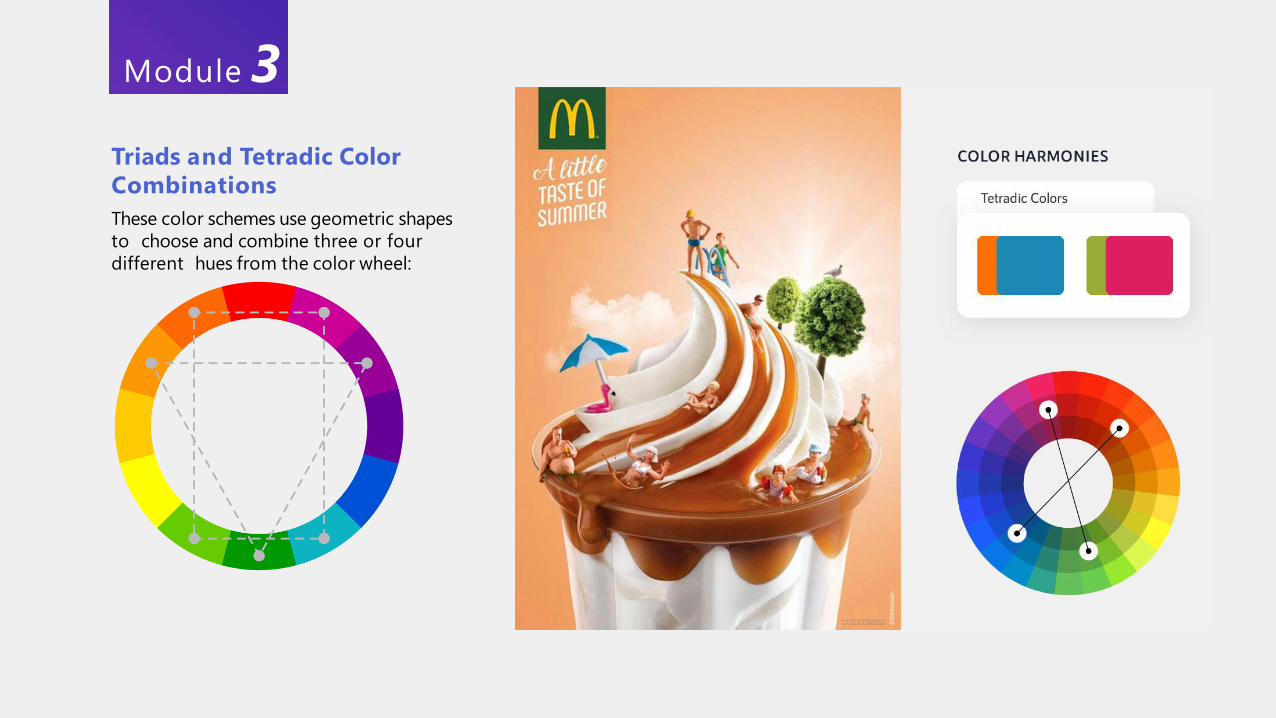
Triads and Tetradic Color
Combinations
These color schemes use geometric shapes
to choose and combine three or four
different hues from the color wheel:The VisualTheme
Examples ofTriad ColorsTriads
Tetradic1
Choose Colors
2
Create a Metaphor
3
Select Fonts
Module 3
Triads and Tetradic Color
Combinations
These color schemes use geometric shapes
to choose and combine three or four
different hues from the color wheel:
Module 3
Triads and Tetradic Color
Combinations
These color schemes use geometric shapes
to choose and combine three or four
different hues from the color wheel:
Module 3
Triads and Tetradic Color
Combinations
These color schemes use geometric shapes
to choose and combine three or four
different hues from the color wheel:
Module 3
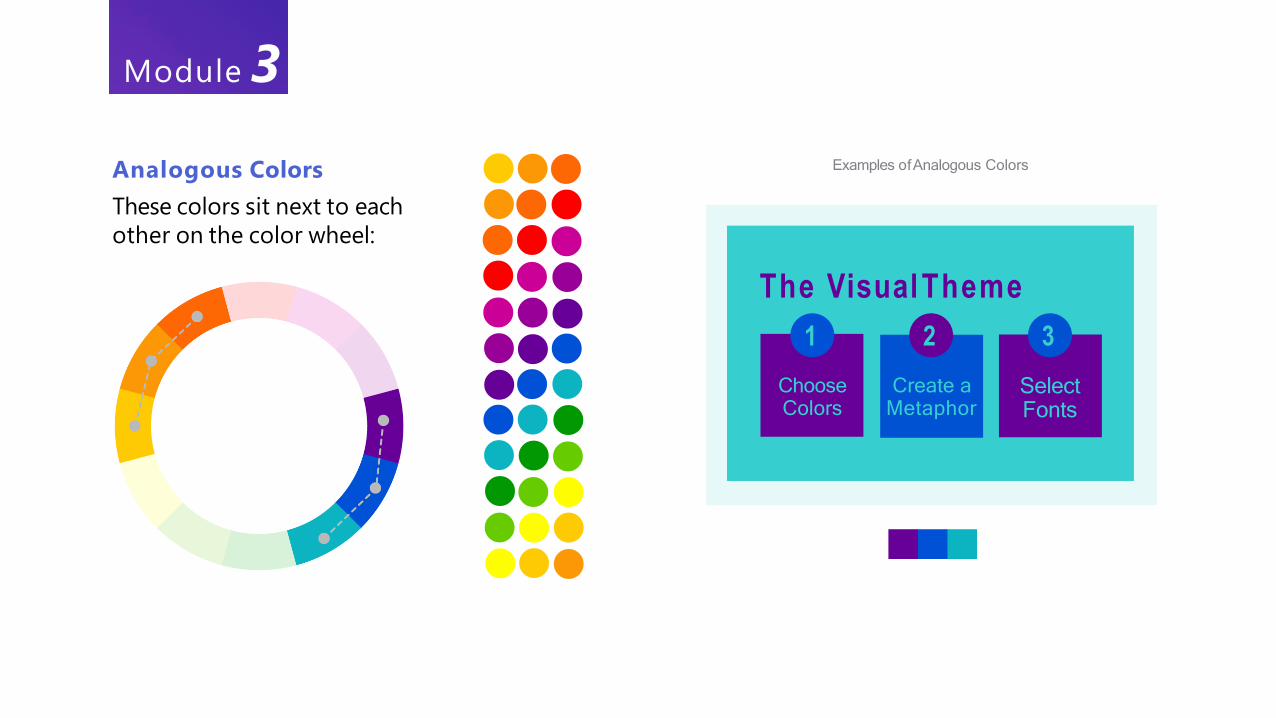
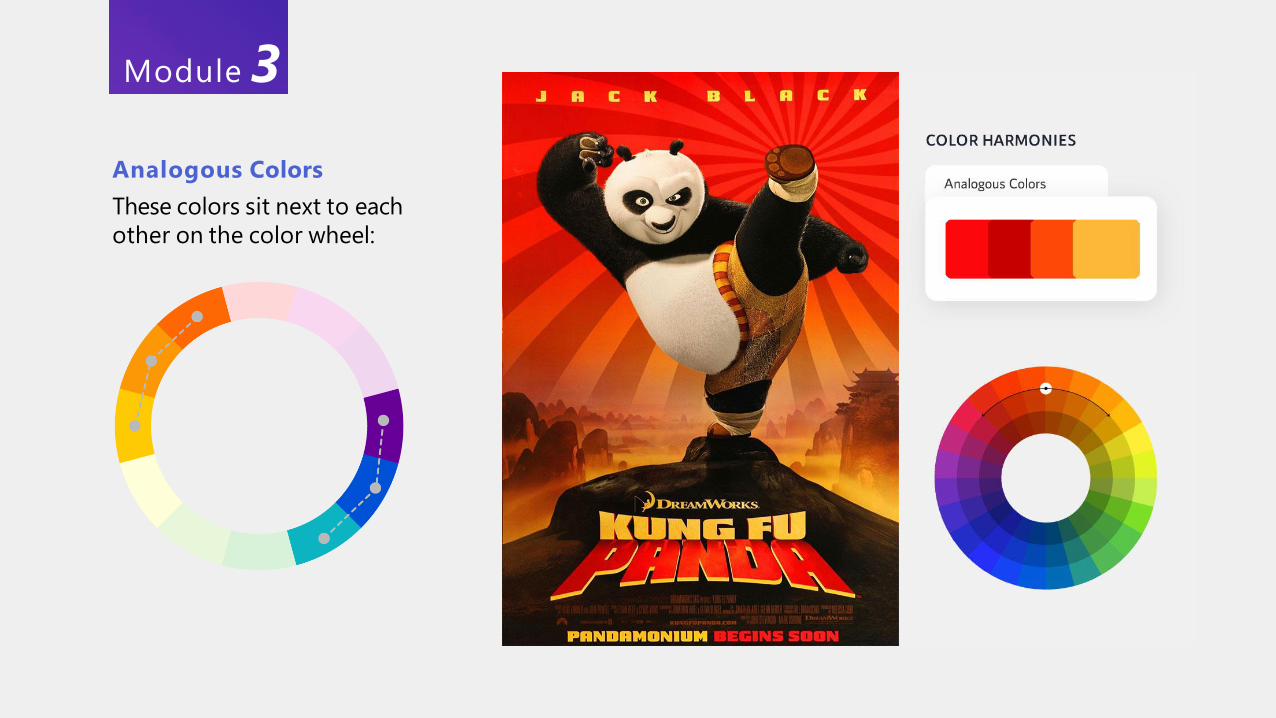
Analogous Colors
These colors sit next to each
other on the color wheel:
The VisualTheme
Examples ofAnalogous Colors
1
Choose Colors
2
Create a Metaphor
3
Select Fonts
Module 3
Analogous Colors
These colors sit next to each
other on the color wheel:
Module 3
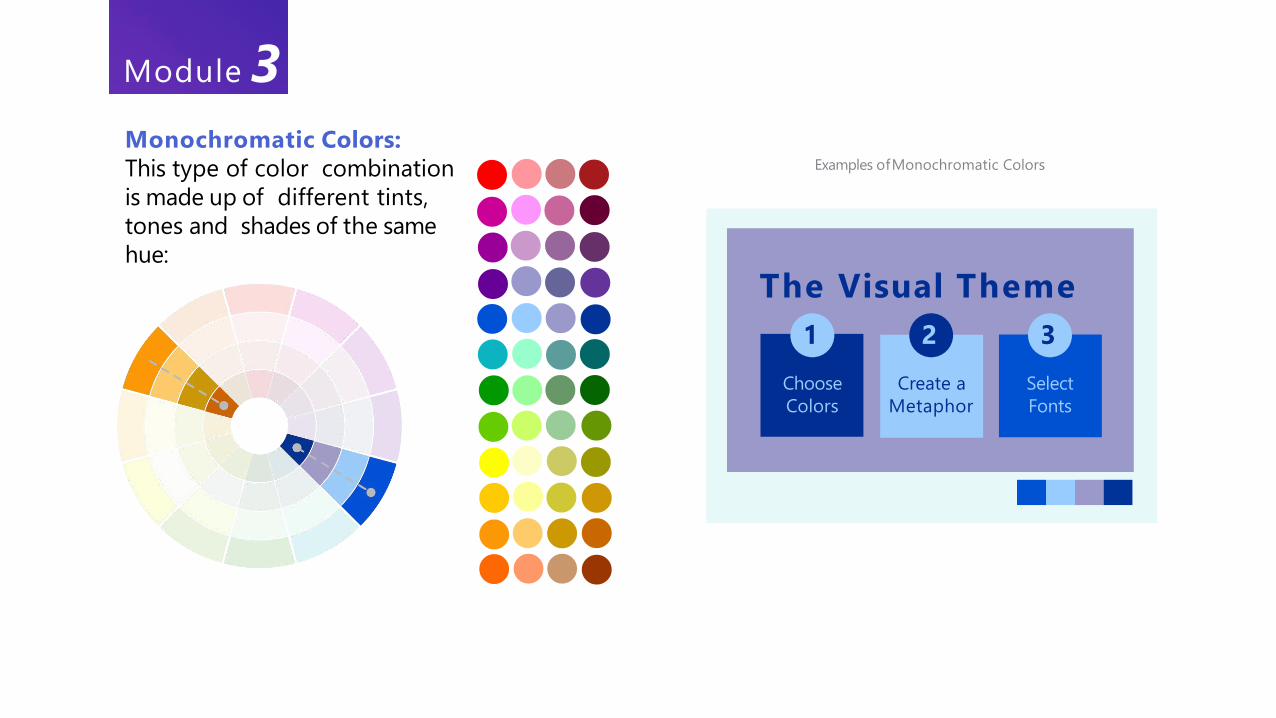
Monochromatic Colors:
This type of color combination
is made up of different tints,
tones and shades of the same
hue:
The Visual Theme
Examples ofMonochromatic Colors
1
Choose
Colors
2
Create a
Metaphor
3
Select
Fonts
Module 3
Module 3
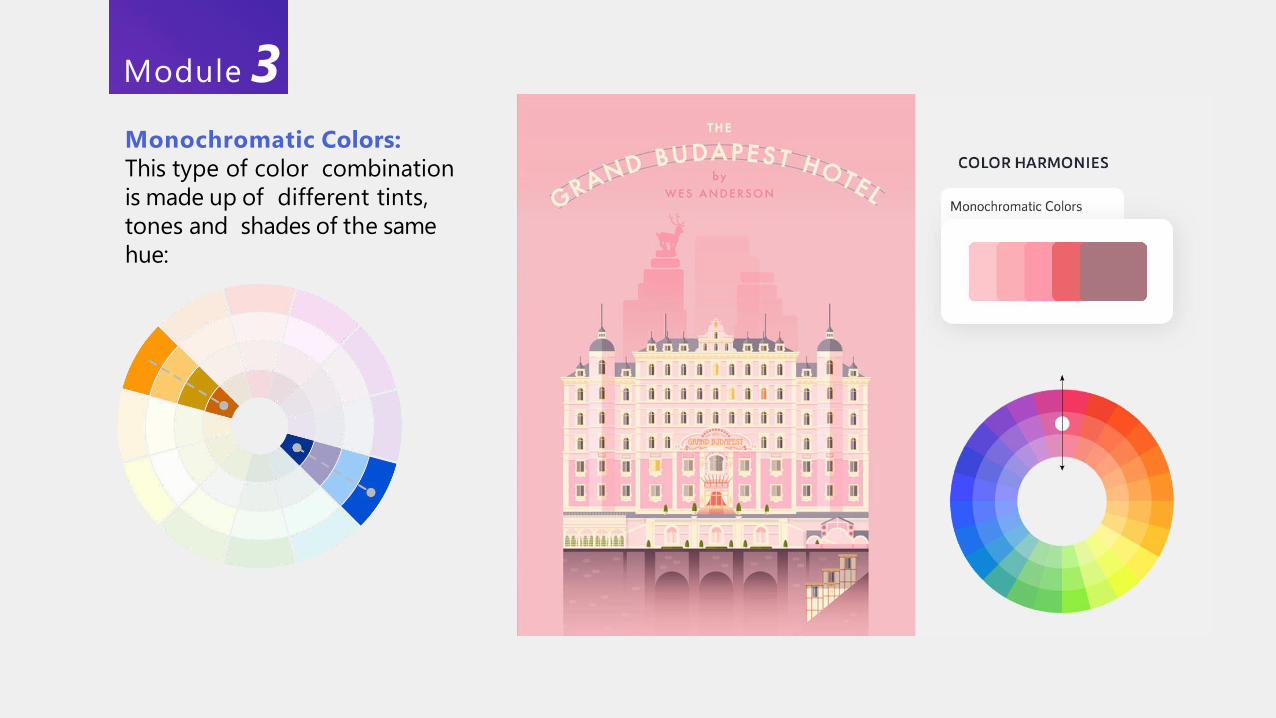
Monochromatic Colors:
This type of color combination
is made up of different tints,
tones and shades of the same
hue:
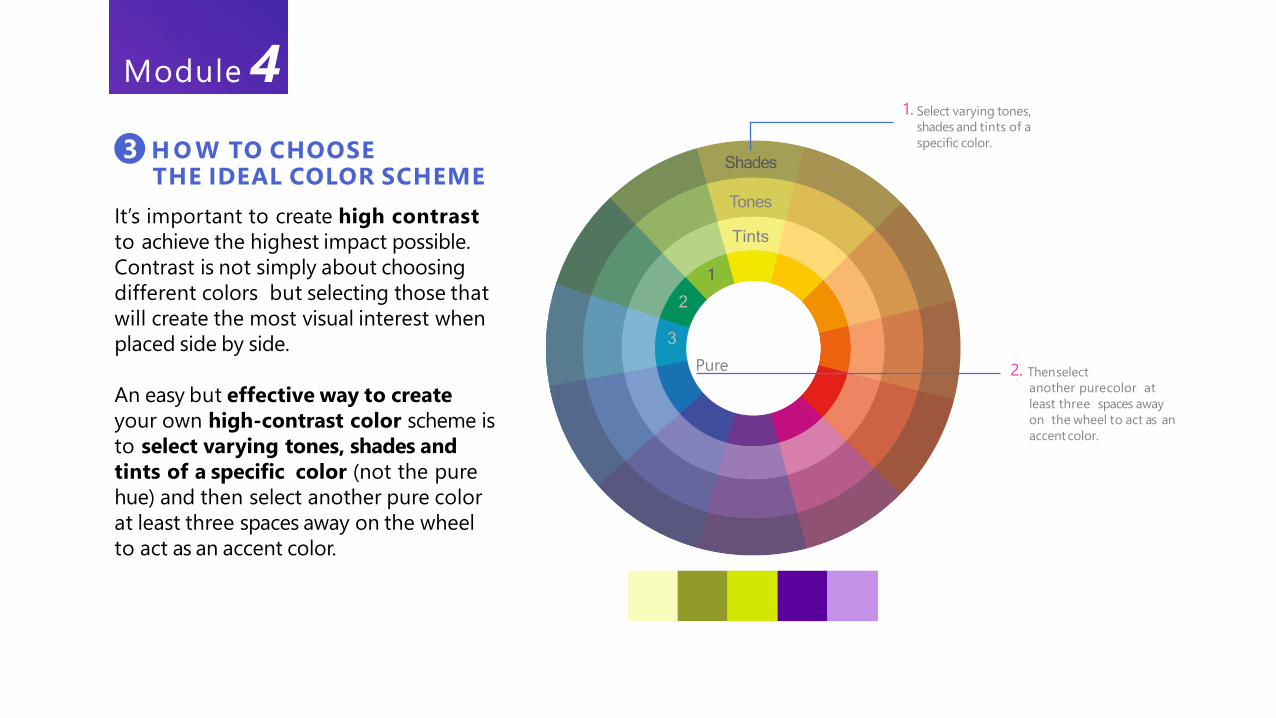
It’s important to create high contrast
to achieve the highest impact possible.
Contrast is not simply about choosing
different colors but selecting those that
will create the most visual interest when
placed side by side.
An easy but effective way to create
your own high-contrast color scheme is
to select varying tones, shades and
tints of a specific color (not the pure
hue) and then select another pure color
at least three spaces away on the wheel
to act as an accent color.
THE IDEAL COLOR SCHEME3 H O W TO CHOOSE
Shades
Tones
Tints
1
2
3
1. Select varying tones,
shades and tints of a
specific color.
Pure 2. Thenselect
another purecolor at
least three spaces away
on the wheel to act as an
accent color.
Module 4
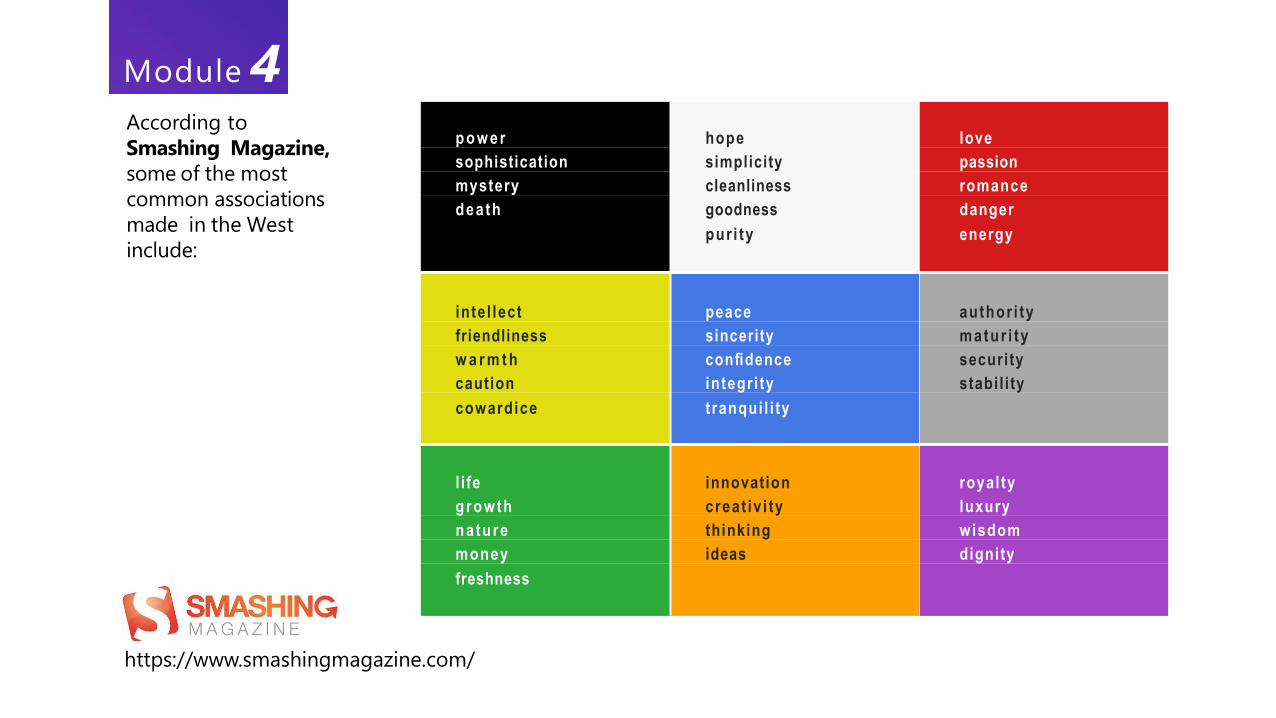
According to
Smashing Magazine,
some of the most
common associations
made in the West
include:
p o w e r hope love
sophistication simplicity passion
mystery cleanliness romance
death goodness danger
pur i ty energy
intel lect peace author i ty
friendliness sincerity matur i ty
w a r m t h confidence security
caution integri ty stabi l i ty
cowardice tranqui l i ty
l i fe innovation royal ty
growth creat iv i ty luxury
nature thinking wisdom
money ideas dignity
freshness
https://www.smashingmagazine.com/
Module 4
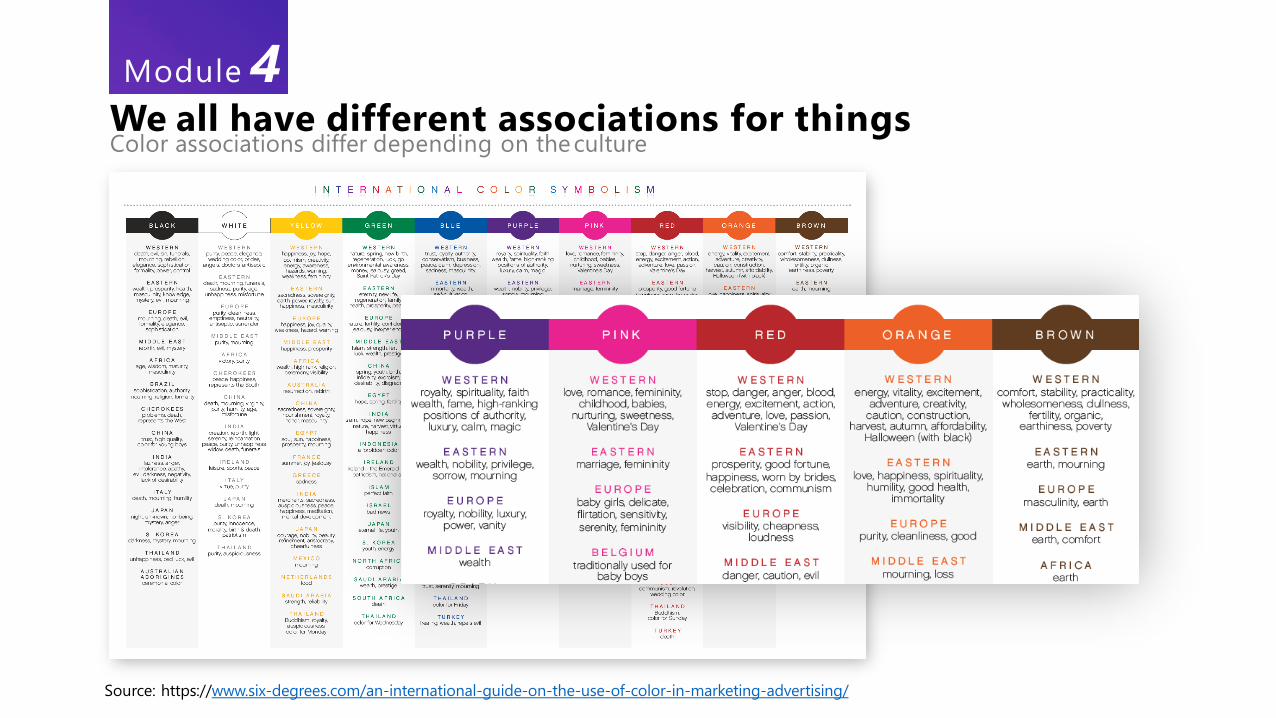
Source: https://www.six-degrees.com/an-international-guide-on-the-use-of-color-in-marketing-advertising/
We all have different associations for thingsColor associations differ depending on theculture
Module 4
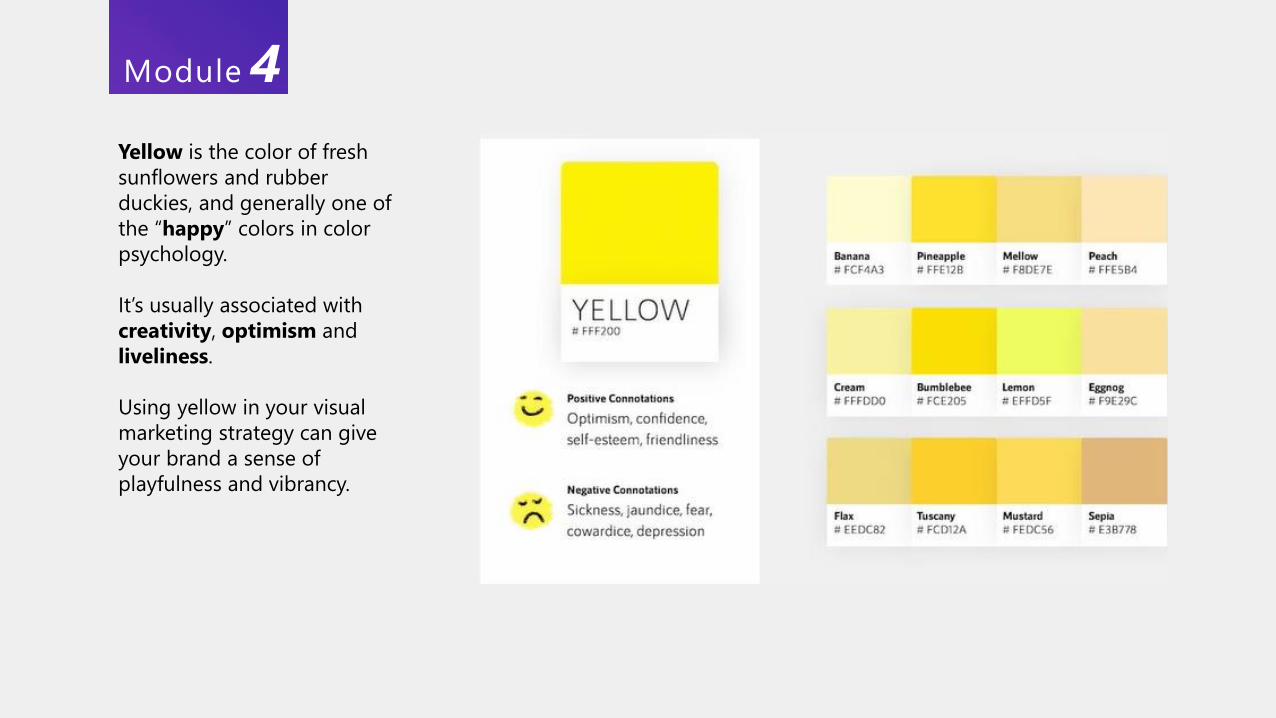
Yellow is the color of fresh
sunflowers and rubber
duckies, and generally one of
the “happy” colors in color
psychology.
It’s usually associated with
creativity, optimism and
liveliness.
Using yellow in your visual
marketing strategy can give
your brand a sense of
playfulness and vibrancy.
Module 4
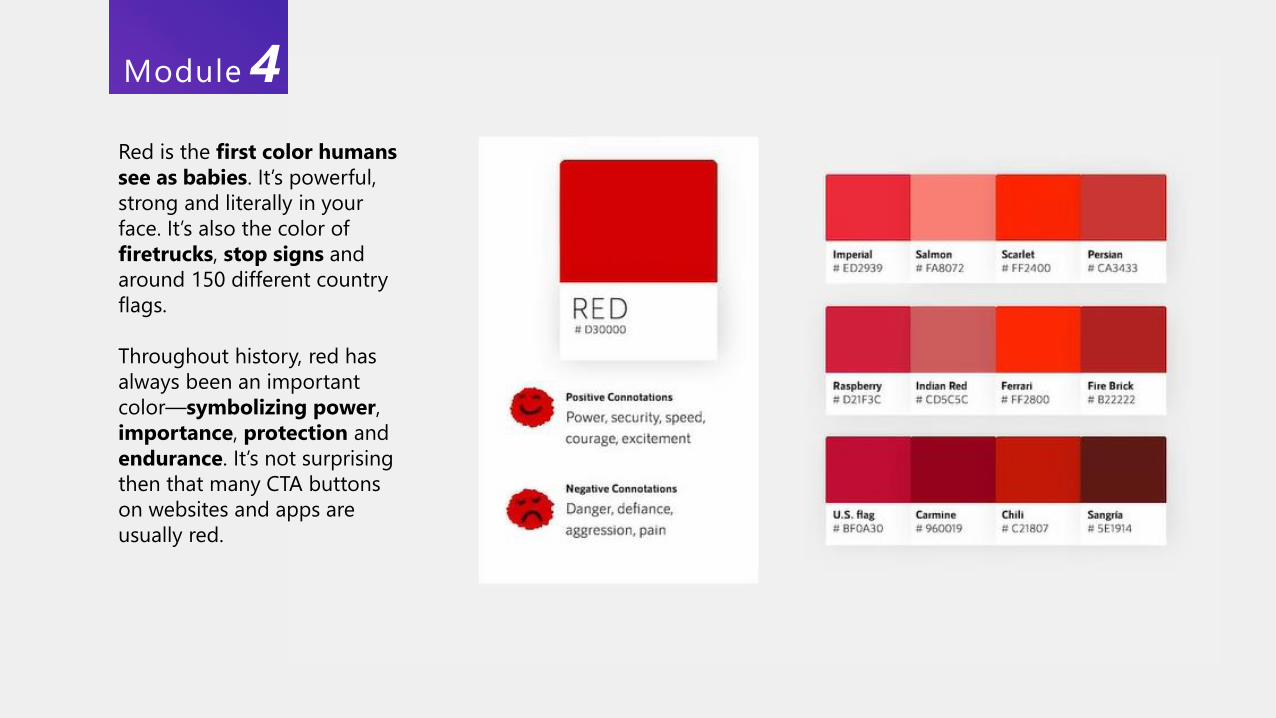
Red is the first color humans
see as babies. It’s powerful,
strong and literally in your
face. It’s also the color of
firetrucks, stop signs and
around 150 different country
flags.
Throughout history, red has
always been an important
color—symbolizing power,
importance, protection and
endurance. It’s not surprising
then that many CTA buttons
on websites and apps are
usually red.
Module 4
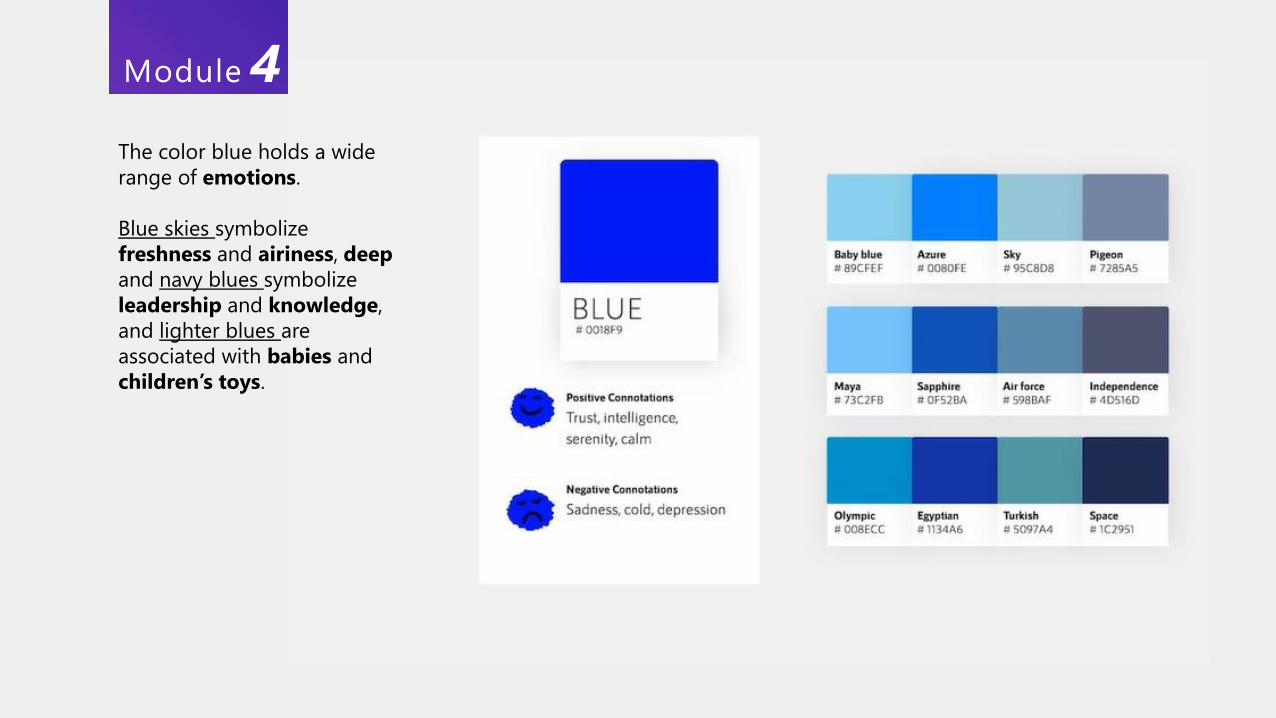
The color blue holds a wide
range of emotions.
Blue skies symbolize
freshness and airiness, deep
and navy blues symbolize
leadership and knowledge,
and lighter blues are
associated with babies and
children’s toys.
Module 4
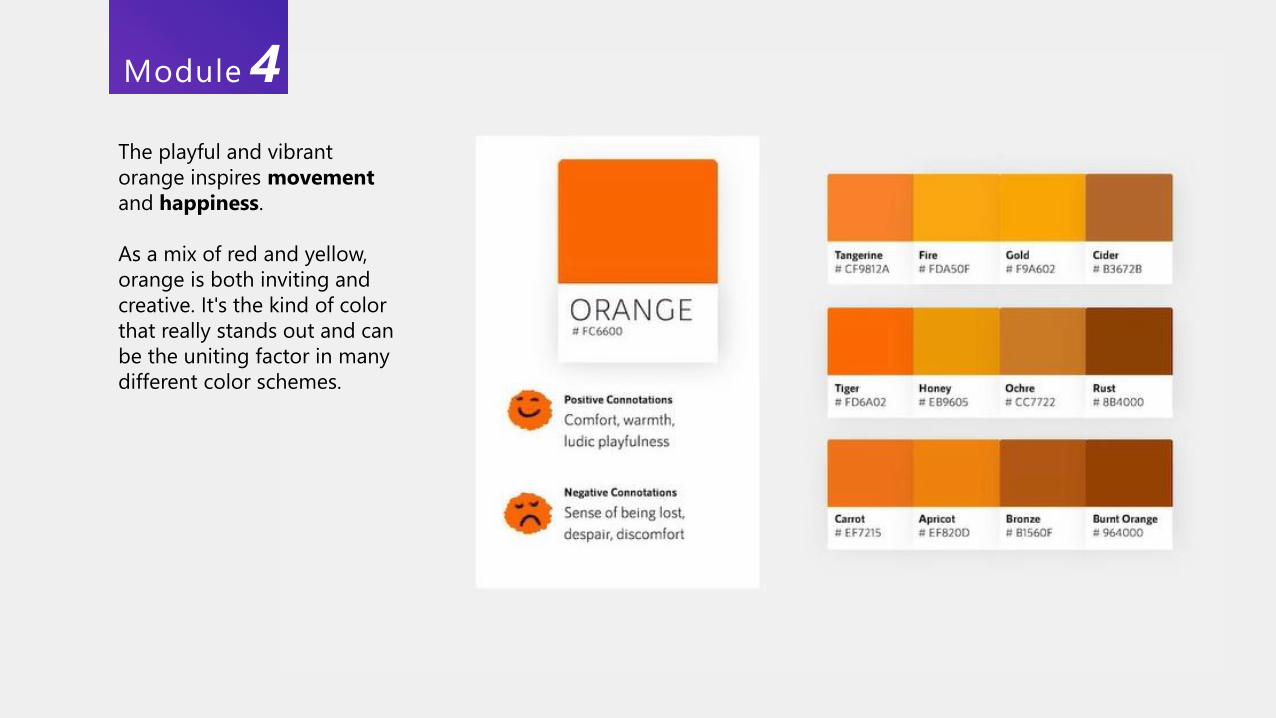
The playful and vibrant
orange inspires movement
and happiness.
As a mix of red and yellow,
orange is both inviting and
creative. It's the kind of color
that really stands out and can
be the uniting factor in many
different color schemes.
Module 4
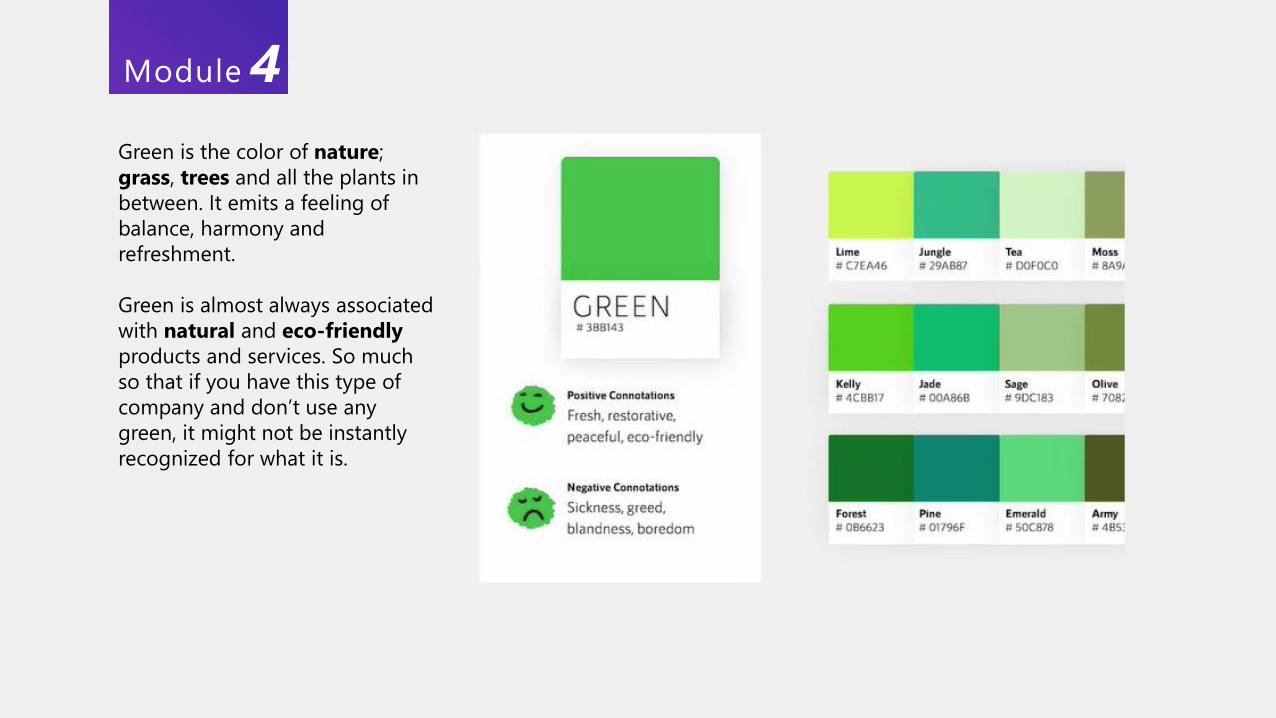
Green is the color of nature;
grass, trees and all the plants in
between. It emits a feeling of
balance, harmony and
refreshment.
Green is almost always associated
with natural and eco-friendly
products and services. So much
so that if you have this type of
company and don’t use any
green, it might not be instantly
recognized for what it is.
Module 4
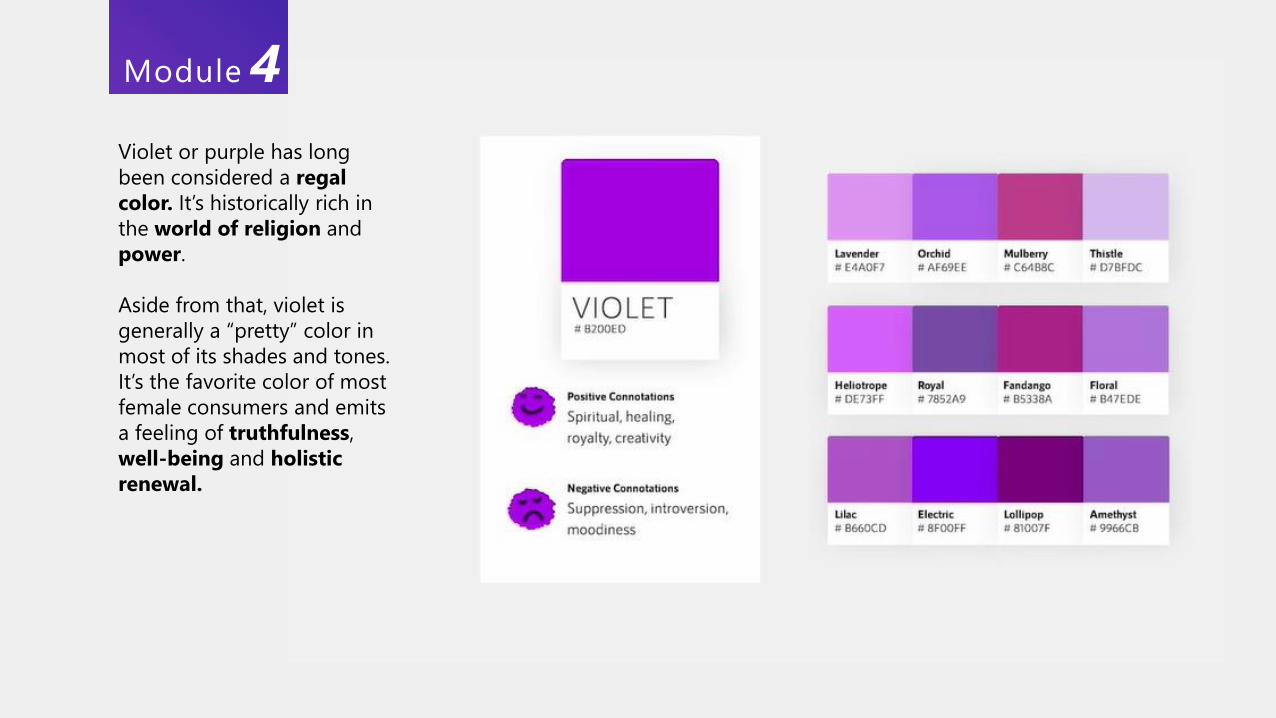
Violet or purple has long
been considered a regal
color. It’s historically rich in
the world of religion and
power.
Aside from that, violet is
generally a “pretty” color in
most of its shades and tones.
It’s the favorite color of most
female consumers and emits
a feeling of truthfulness,
well-being and holistic
renewal.
Module 4
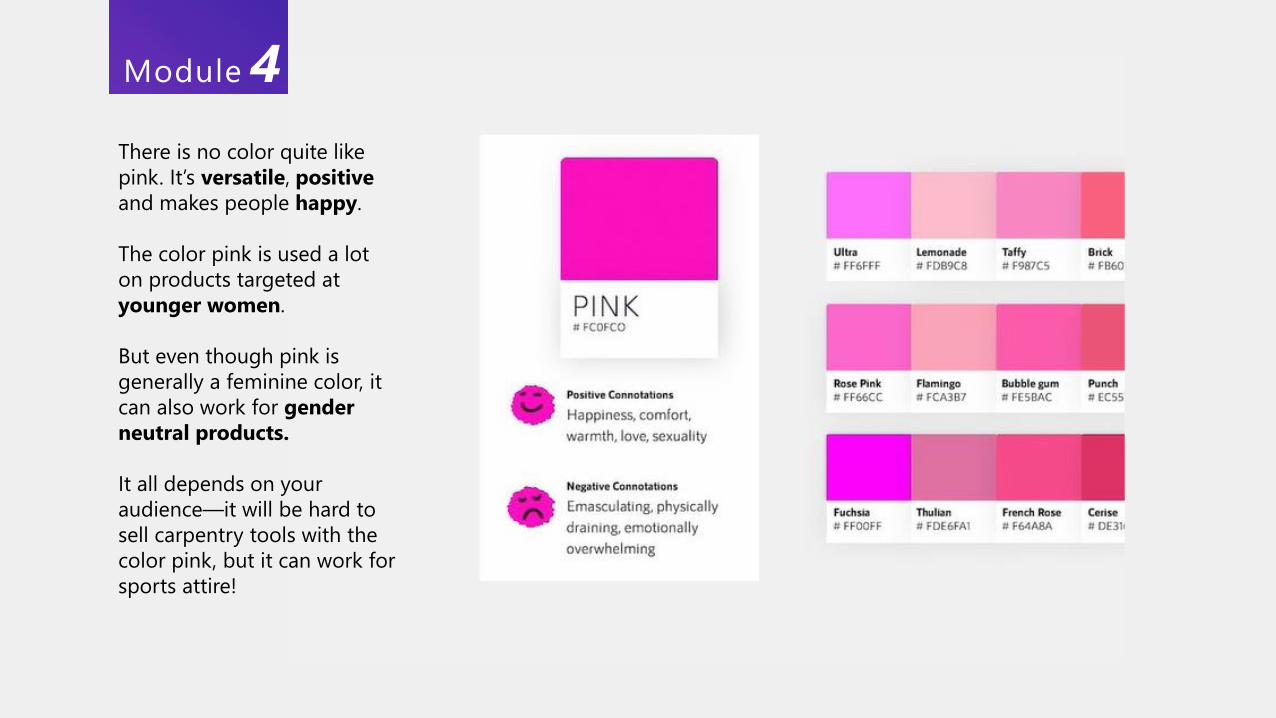
There is no color quite like
pink. It’s versatile, positive
and makes people happy.
The color pink is used a lot
on products targeted at
younger women.
But even though pink is
generally a feminine color, it
can also work for gender
neutral products.
It all depends on your
audience—it will be hard to
sell carpentry tools with the
color pink, but it can work for
sports attire!
Module 4
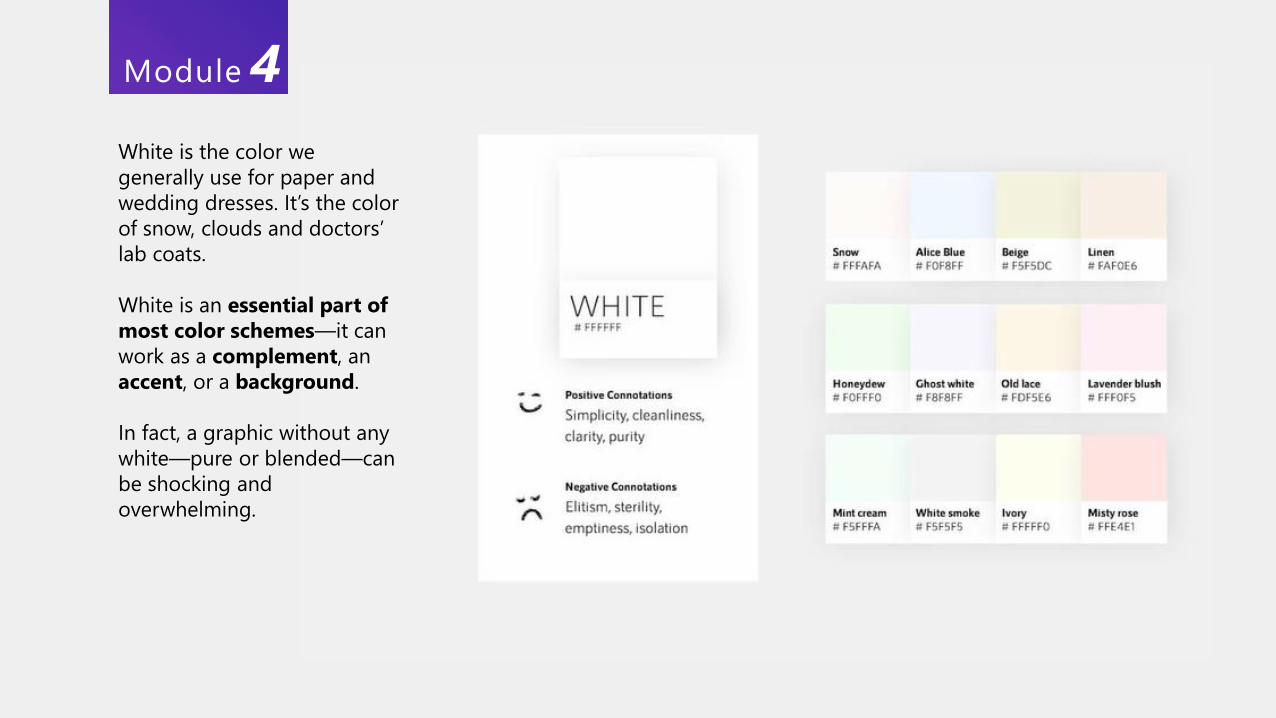
White is the color we
generally use for paper and
wedding dresses. It’s the color
of snow, clouds and doctors’
lab coats.
White is an essential part of
most color schemes—it can
work as a complement, an
accent, or a background.
In fact, a graphic without any
white—pure or blended—can
be shocking and
overwhelming.
Module 4
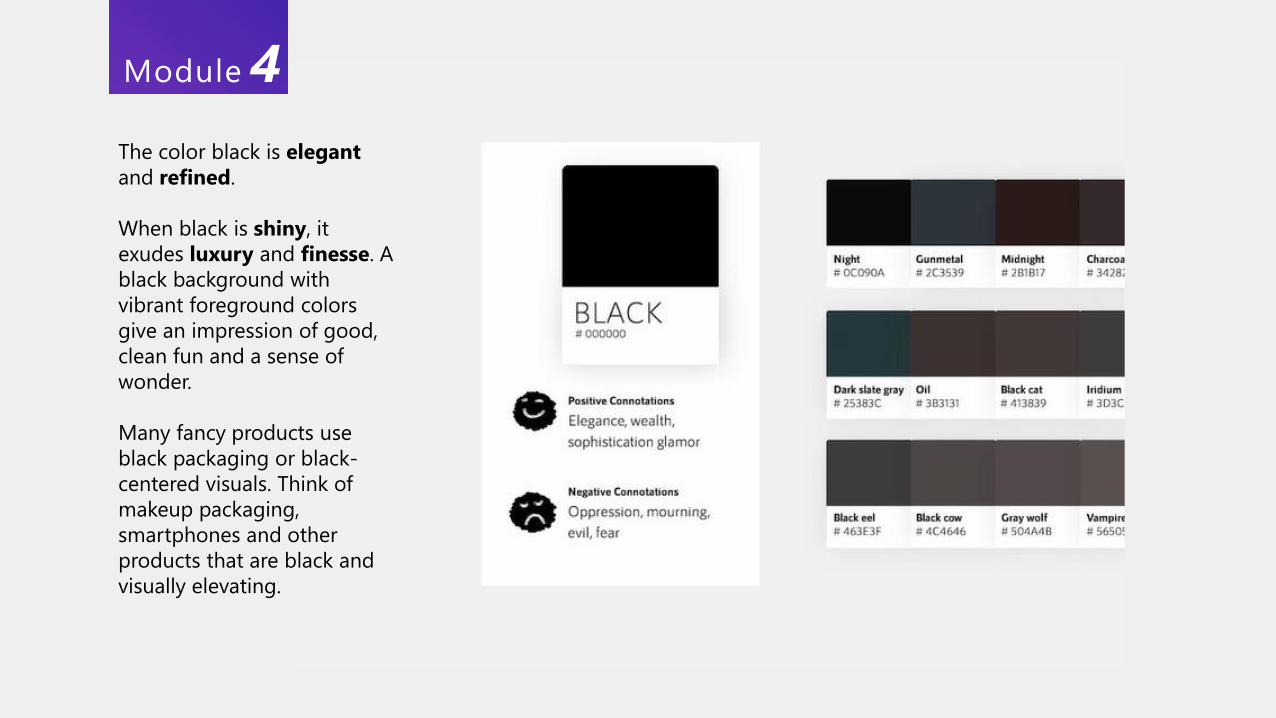
The color black is elegant
and refined.
When black is shiny, it
exudes luxury and finesse. A
black background with
vibrant foreground colors
give an impression of good,
clean fun and a sense of
wonder.
Many fancy products use
black packaging or black-
centered visuals. Think of
makeup packaging,
smartphones and other
products that are black and
visually elevating.
Module 4
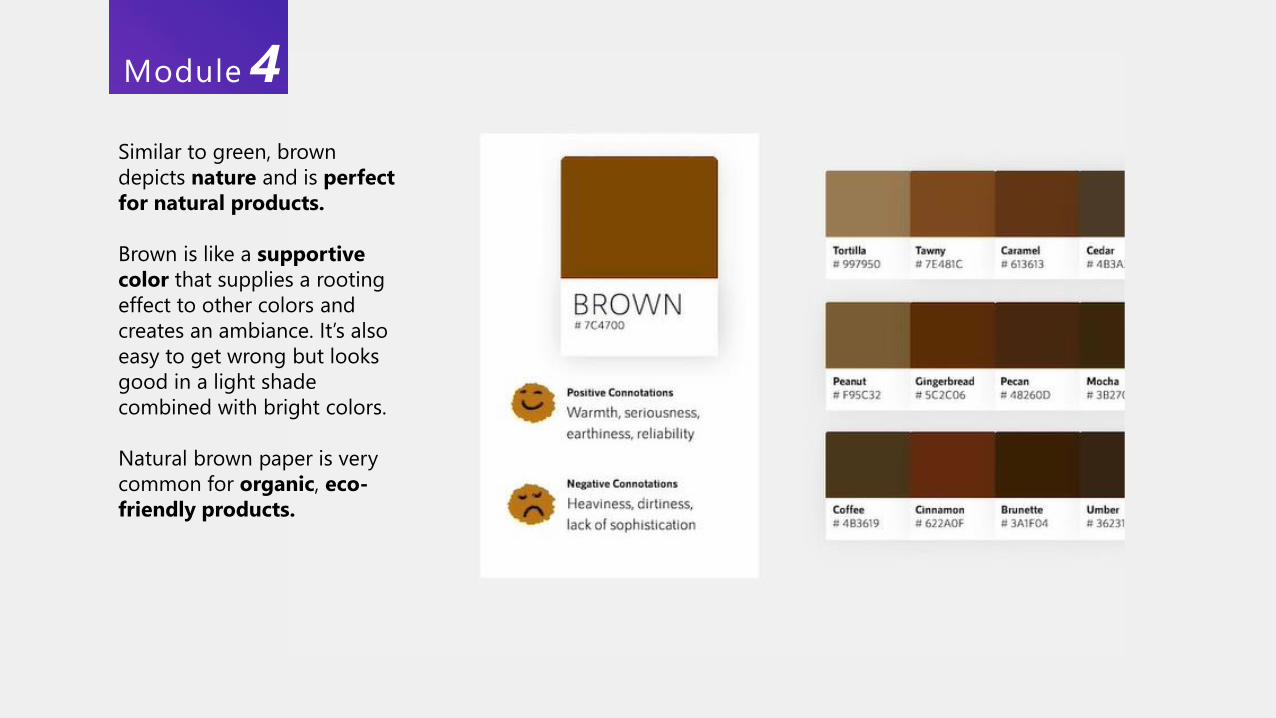
Similar to green, brown
depicts nature and is perfect
for natural products.
Brown is like a supportive
color that supplies a rooting
effect to other colors and
creates an ambiance. It’s also
easy to get wrong but looks
good in a light shade
combined with bright colors.
Natural brown paper is very
common for organic, eco-
friendly products.
Module 4
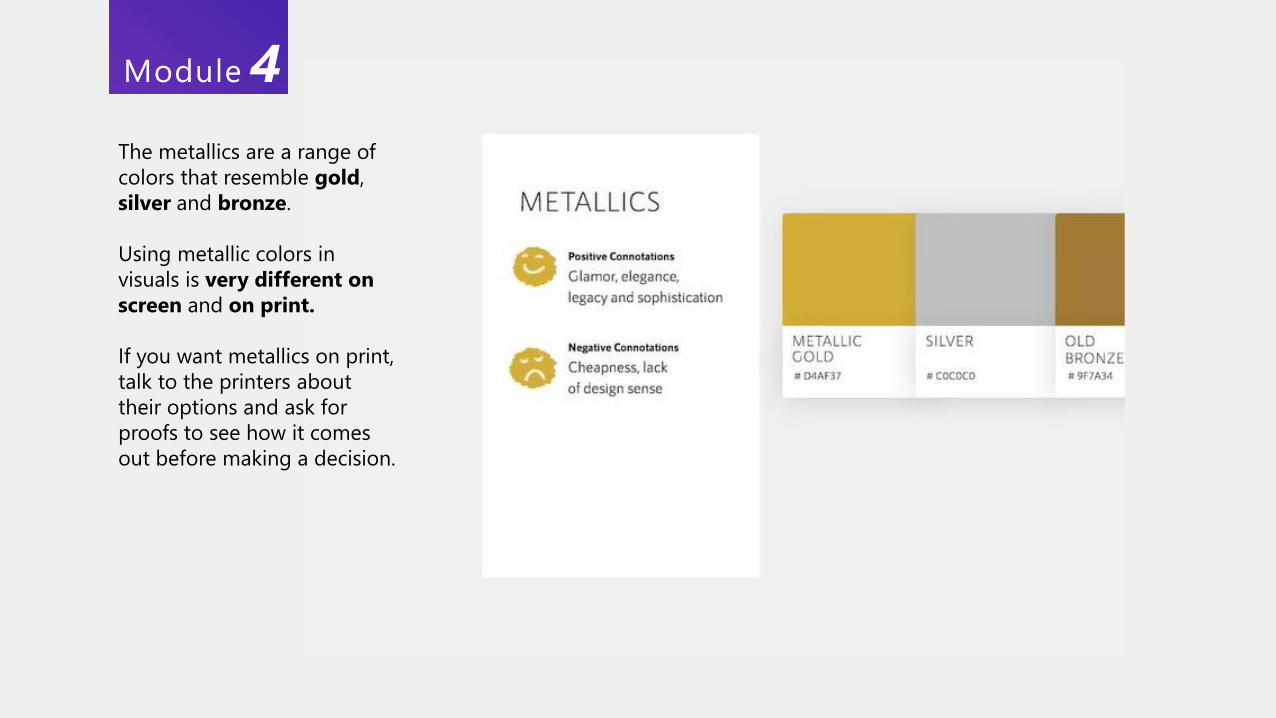
The metallics are a range of
colors that resemble gold,
silver and bronze.
Using metallic colors in
visuals is very different on
screen and on print.
If you want metallics on print,
talk to the printers about
their options and ask for
proofs to see how it comes
out before making a decision.
Module 4
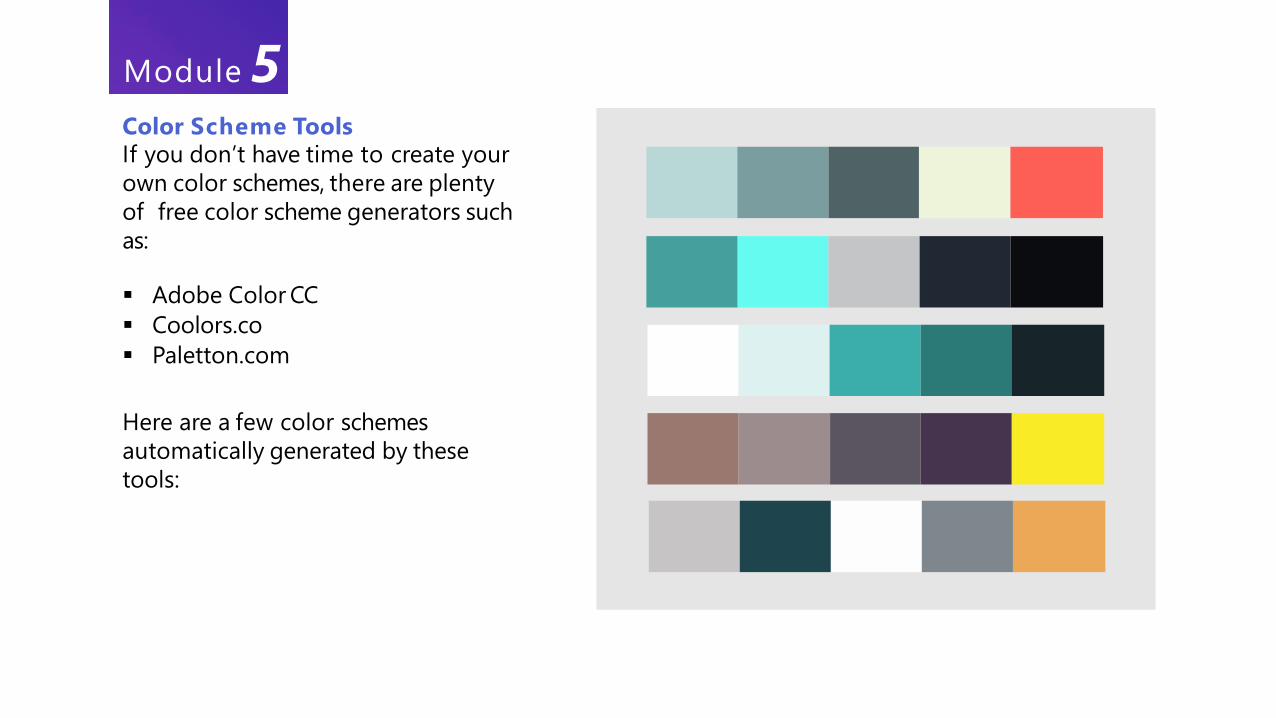
If you don’t have time to create your
own color schemes, there are plenty
of free color scheme generators such
as:
Color Scheme Tools
▪ Adobe Color CC
▪ Coolors.co
▪ Paletton.com
Here are a few color schemes
automatically generated by these
tools:
Module 5
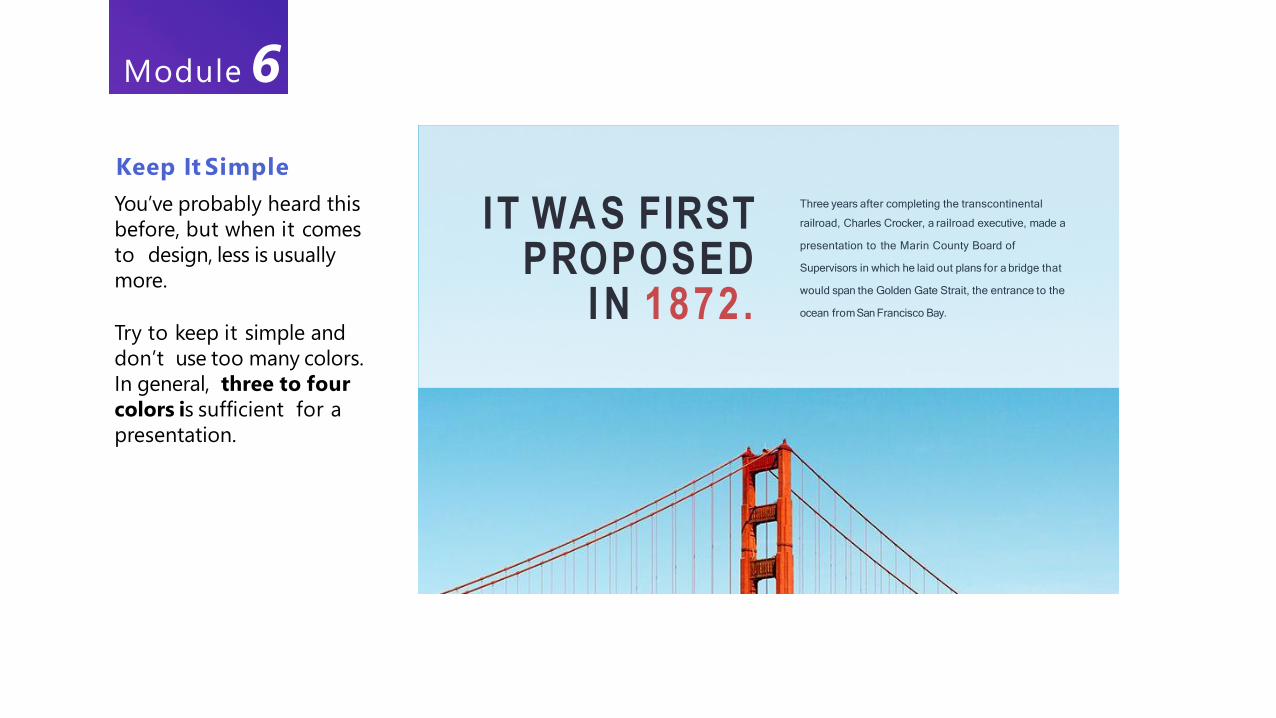
You’ve probably heard this
before, but when it comes
to design, less is usually
more.
Try to keep it simple and
don’t use too many colors.
In general, three to four
colors is sufficient for a
presentation.
Keep It Simple
IT WAS FIRST PROPOSED
I N 1872.
Three years after completing the transcontinental
railroad, Charles Crocker, a railroad executive, made a
presentation to the Marin County Board of
Supervisors in which he laid out plans for a bridge that
would span the Golden Gate Strait, the entrance to the
ocean fromSan Francisco Bay.
Module 6
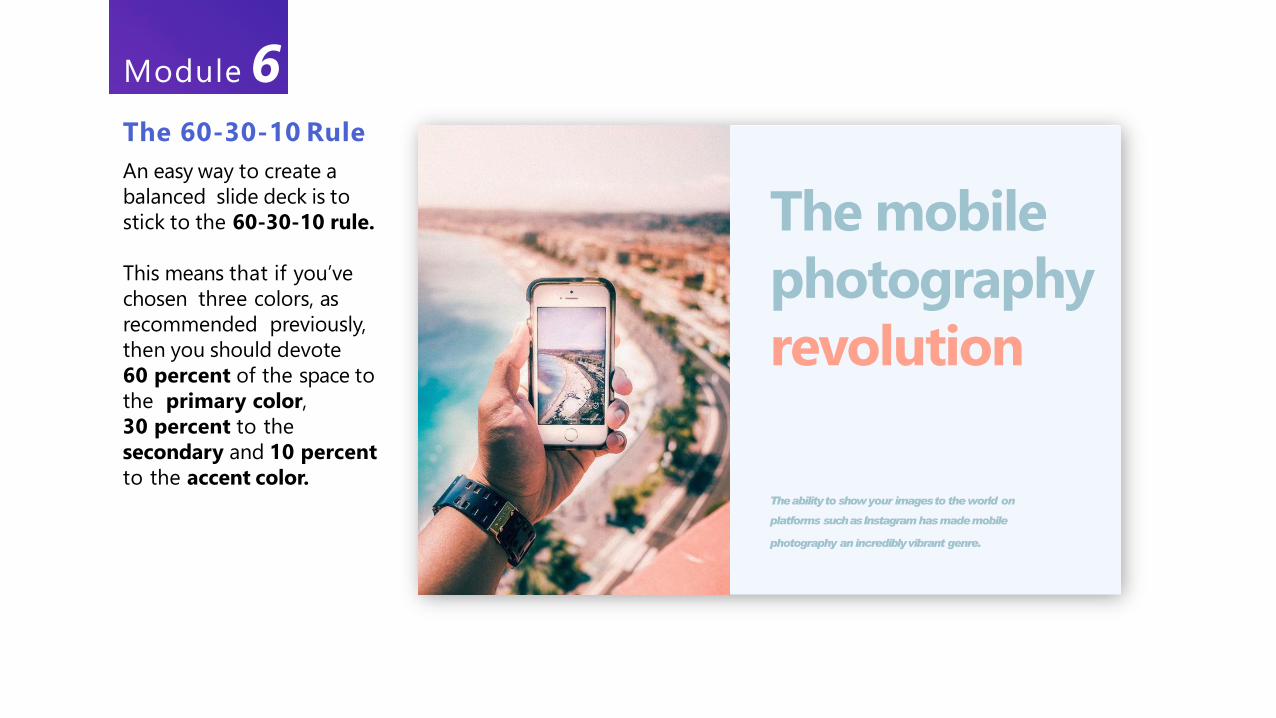
The 60-30-10 Rule
An easy way to create a
balanced slide deck is to
stick to the 60-30-10 rule.
This means that if you’ve
chosen three colors, as
recommended previously,
then you should devote
60 percent of the space to
the primary color,
30 percent to the
secondary and 10 percent
to the accent color.
The mobile
photography
revolution
The ability to show your images to the world on
platforms such as Instagram has made mobile
photography an incredibly vibrant genre.
Module 6
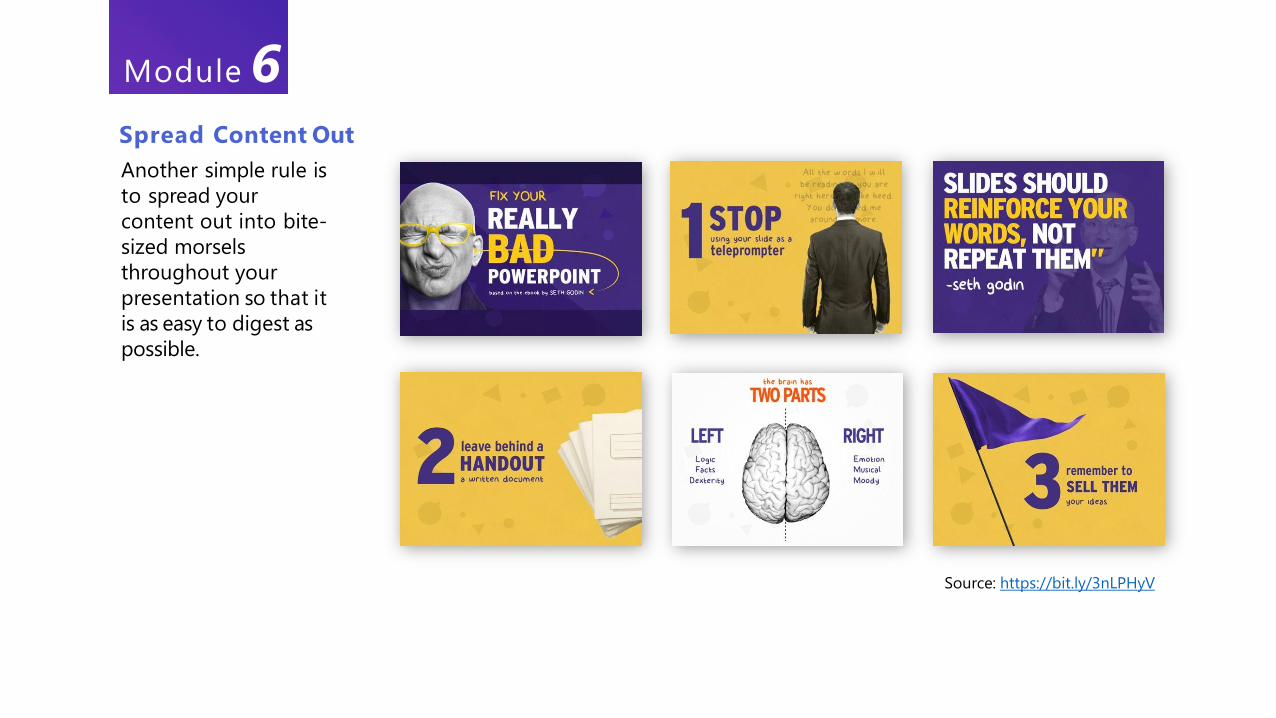
Another simple rule is
to spread your
content out into bite-
sized morsels
throughout your
presentation so that it
is as easy to digest as
possible.
Spread Content Out
Source: https://bit.ly/3nLPHyV
Module 6
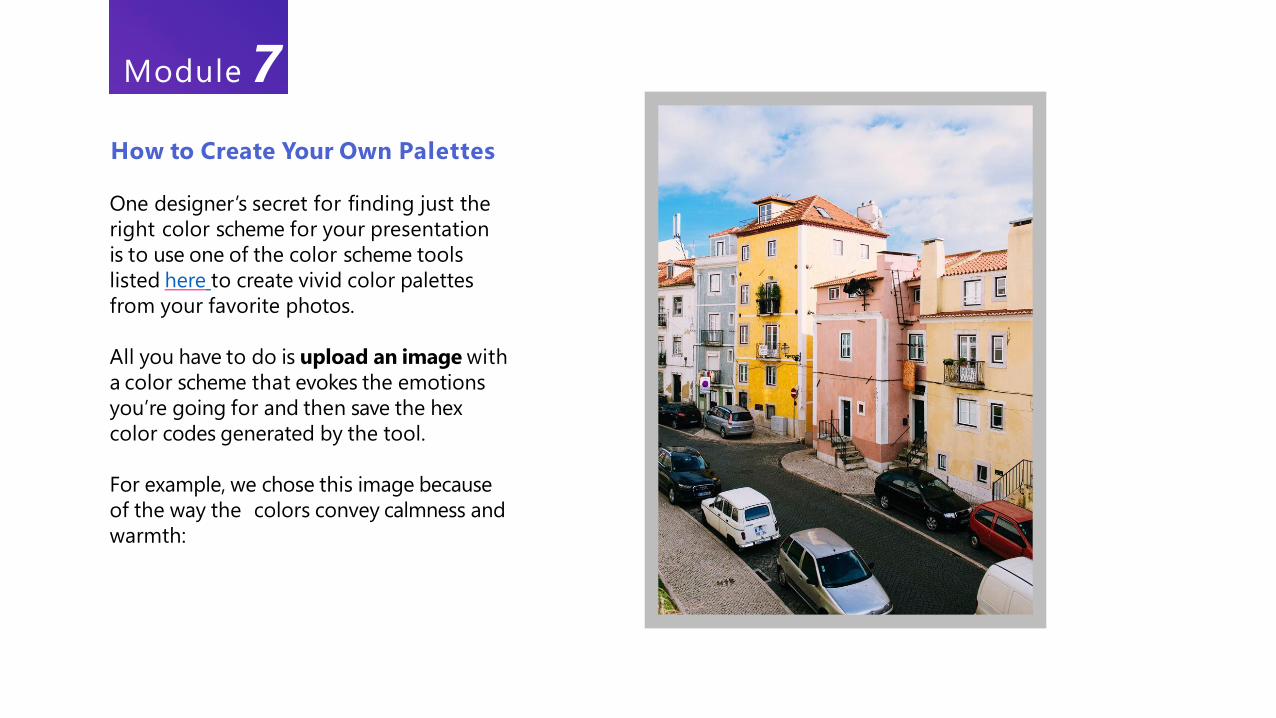
How to Create Your Own Palettes
One designer’s secret for finding just the
right color scheme for your presentation
is to use one of the color scheme tools
listed here to create vivid color palettes
from your favorite photos.
All you have to do is upload an image with
a color scheme that evokes the emotions
you’re going for and then save the hex
color codes generated by the tool.
For example, we chose this image because
of the way the colors convey calmness and
warmth:
Module 7
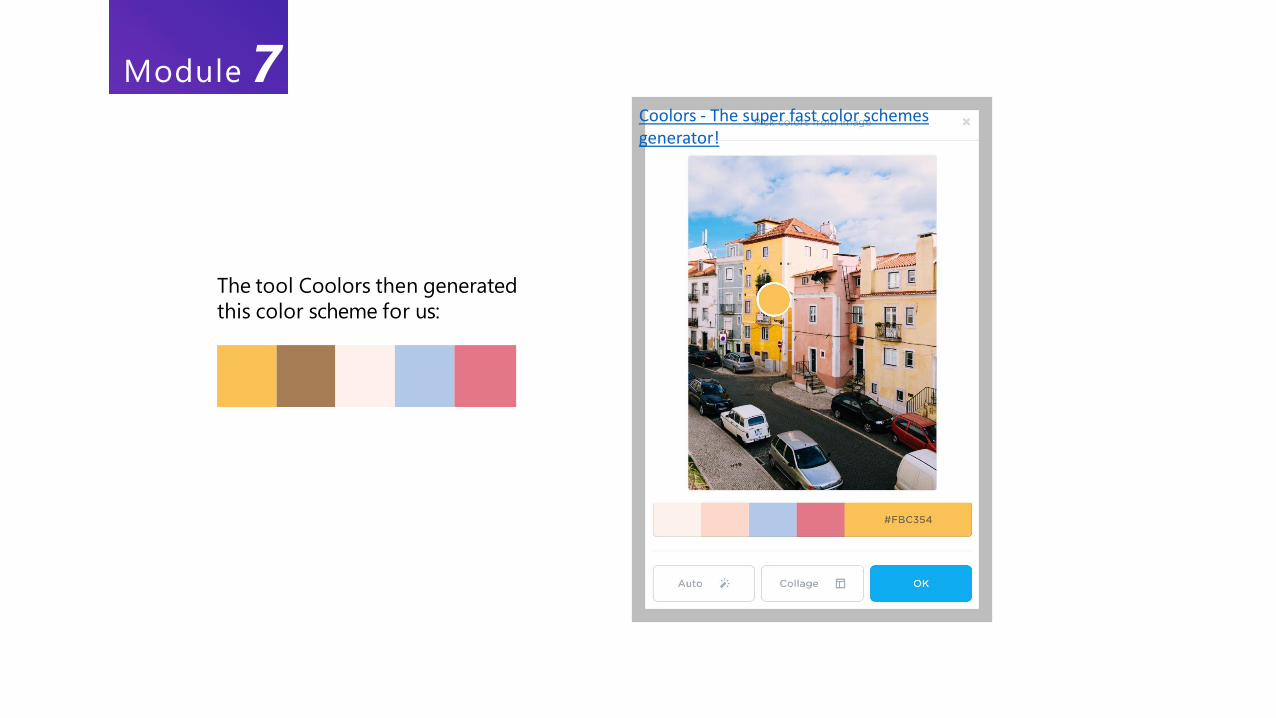
The tool Coolors then generated
this color scheme for us:
Coolors - The super fast color schemes generator!
Module 7
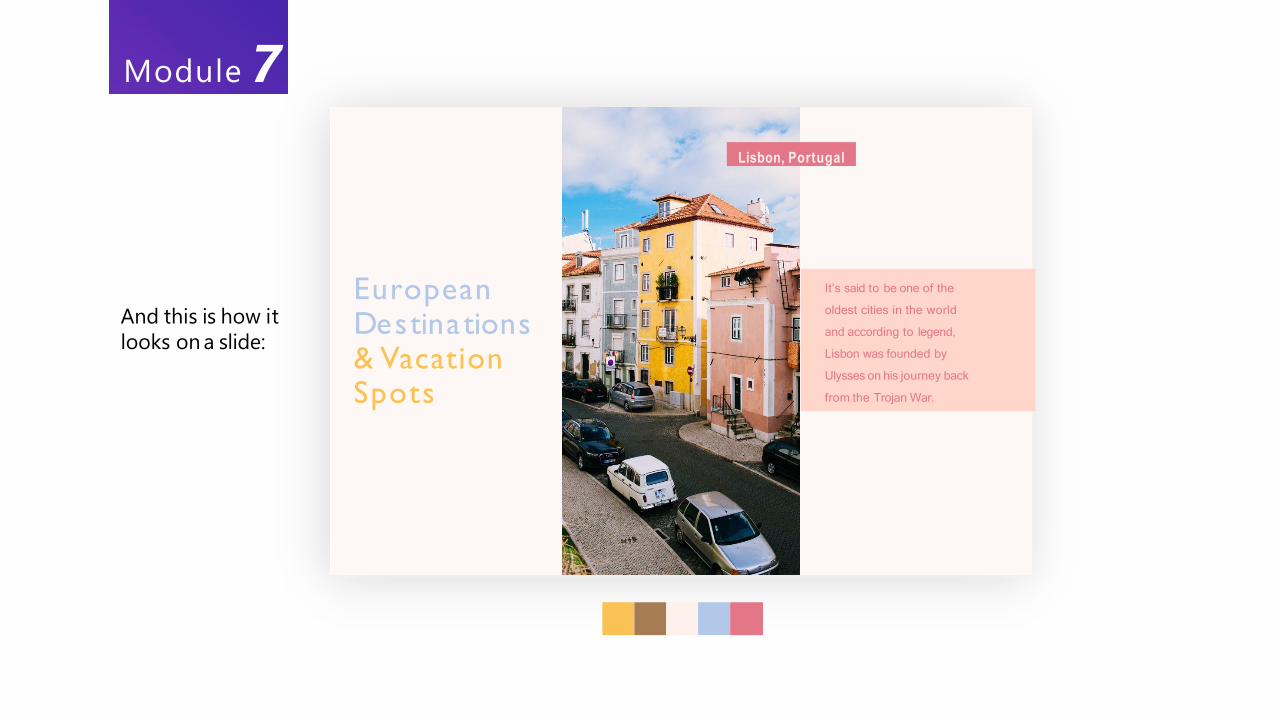
And this is how it
looks on a slide:
European Destinations & Vacation Spots
Lisbon, Portugal
It’s said to be one of the
oldest cities in the world
and according to legend,
Lisbon was founded by
Ulysses on his journey back
from the Trojan War.
Module 7
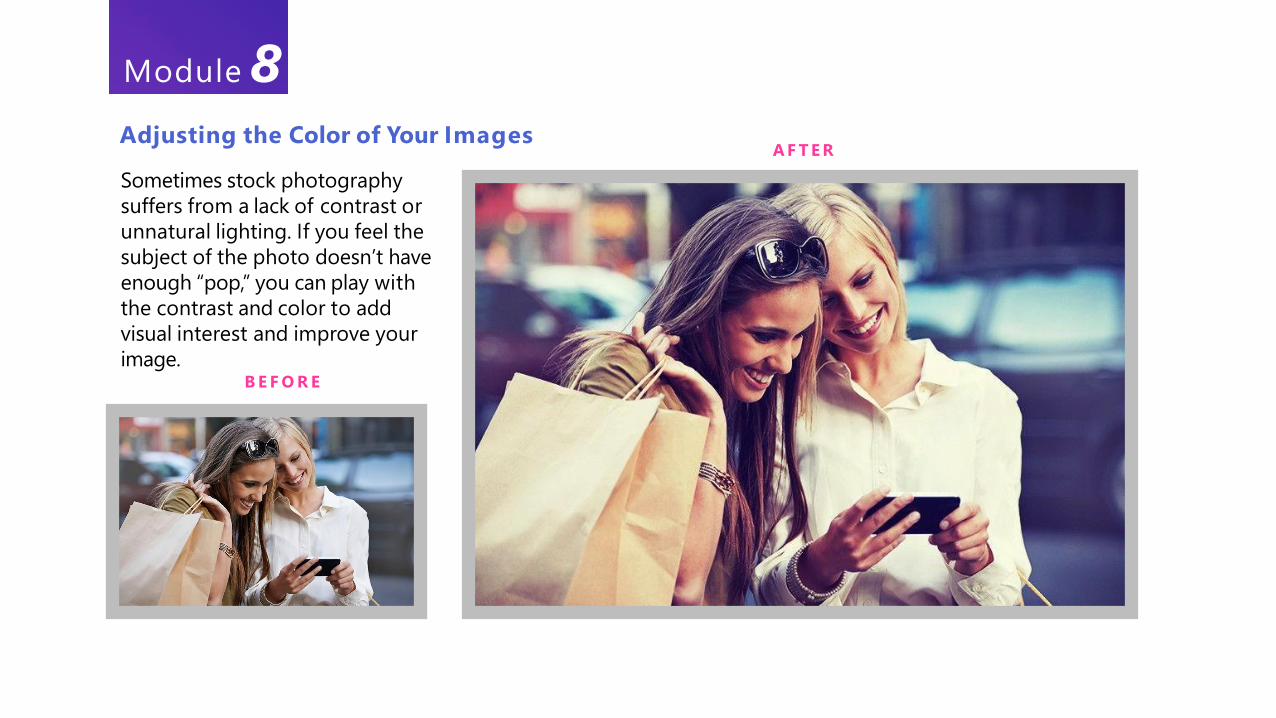
Adjusting the Color of Your ImagesA F T E R
Sometimes stock photography
suffers from a lack of contrast or
unnatural lighting. If you feel the
subject of the photo doesn’t have
enough “pop,” you can play with
the contrast and color to add
visual interest and improve your
image.B E F O R E
Module 8
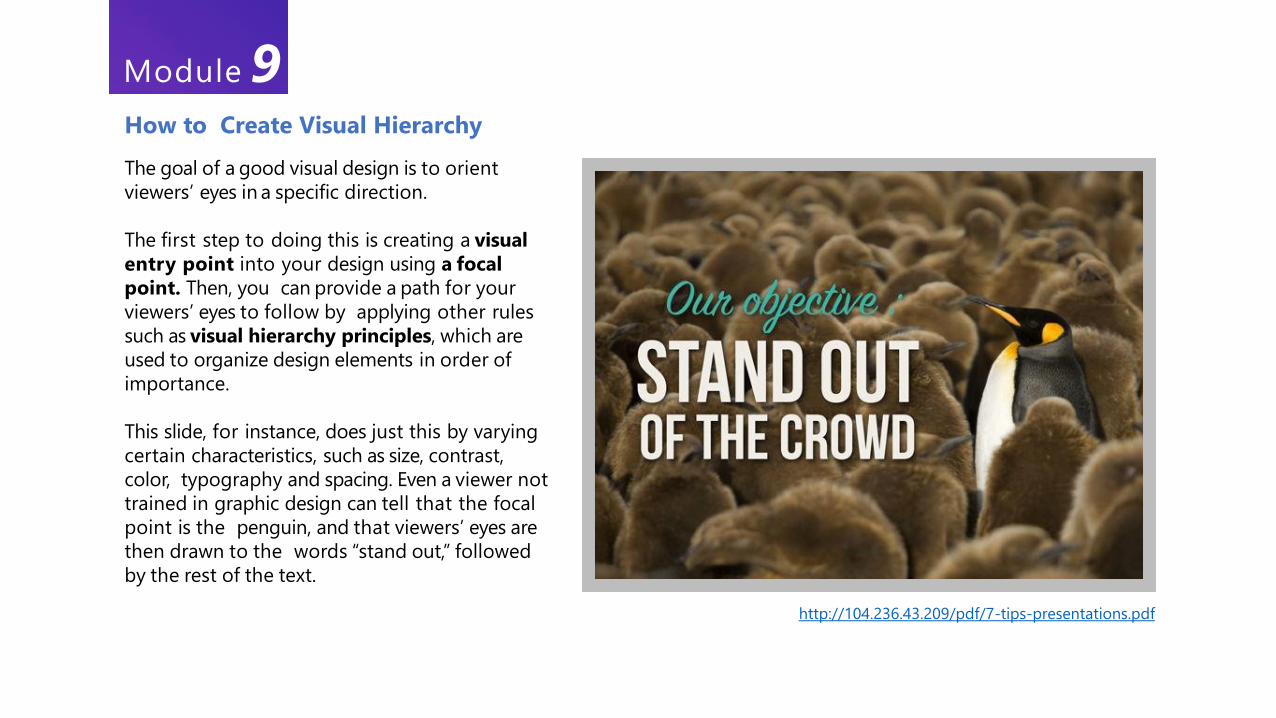
The goal of a good visual design is to orient
viewers’ eyes in a specific direction.
The first step to doing this is creating a visual
entry point into your design using a focal
point. Then, you can provide a path for your
viewers’ eyes to follow by applying other rules
such as visual hierarchy principles, which are
used to organize design elements in order of
importance.
This slide, for instance, does just this by varying
certain characteristics, such as size, contrast,
color, typography and spacing. Even a viewer not
trained in graphic design can tell that the focal
point is the penguin, and that viewers’ eyes are
then drawn to the words “stand out,” followed
by the rest of the text.
How to Create Visual Hierarchy
http://104.236.43.209/pdf/7-tips-presentations.pdf
Module 9
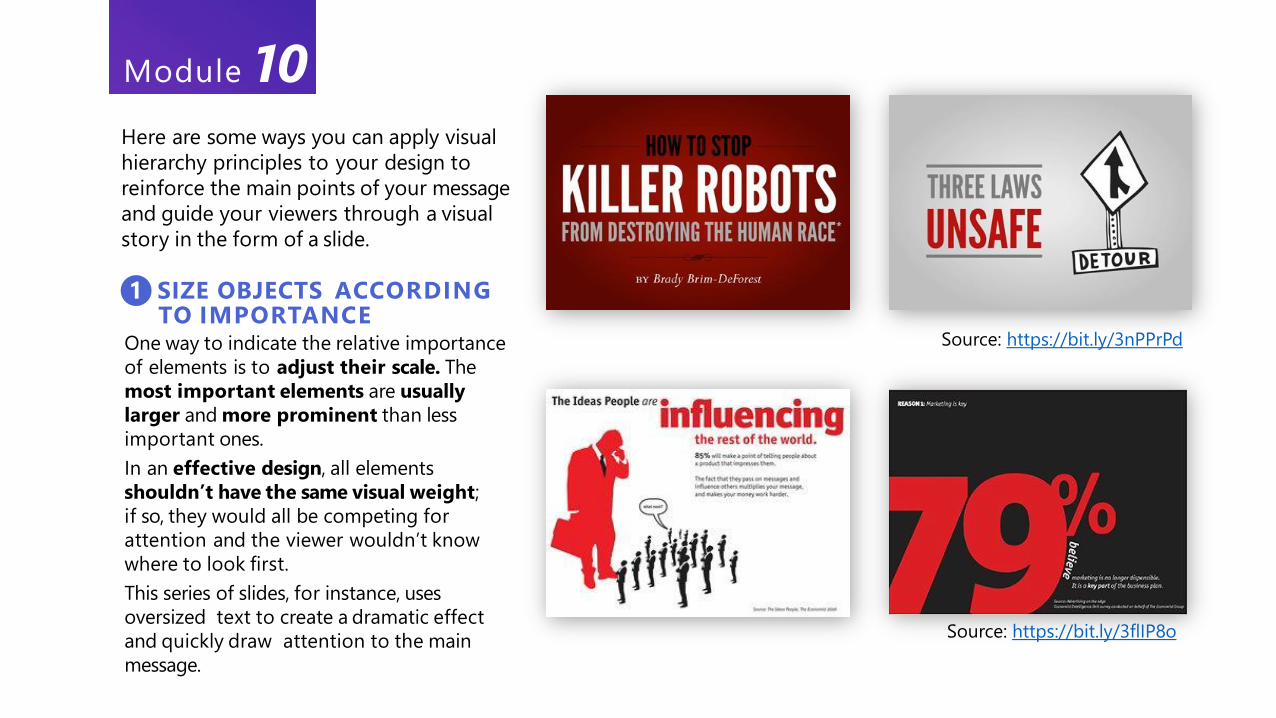
One way to indicate the relative importance
of elements is to adjust their scale. The
most important elements are usually
larger and more prominent than less
important ones.
In an effective design, all elements
shouldn’t have the same visual weight;
if so, they would all be competing for
attention and the viewer wouldn’t know
where to look first.
This series of slides, for instance, uses
oversized text to create a dramatic effect
and quickly draw attention to the main
message.
1 SIZE OBJECTS ACCORDING
Here are some ways you can apply visual
hierarchy principles to your design to
reinforce the main points of your message
and guide your viewers through a visual
story in the form of a slide.
Module 10
TO IMPORTANCESource: https://bit.ly/3nPPrPd
Source: https://bit.ly/3flIP8o
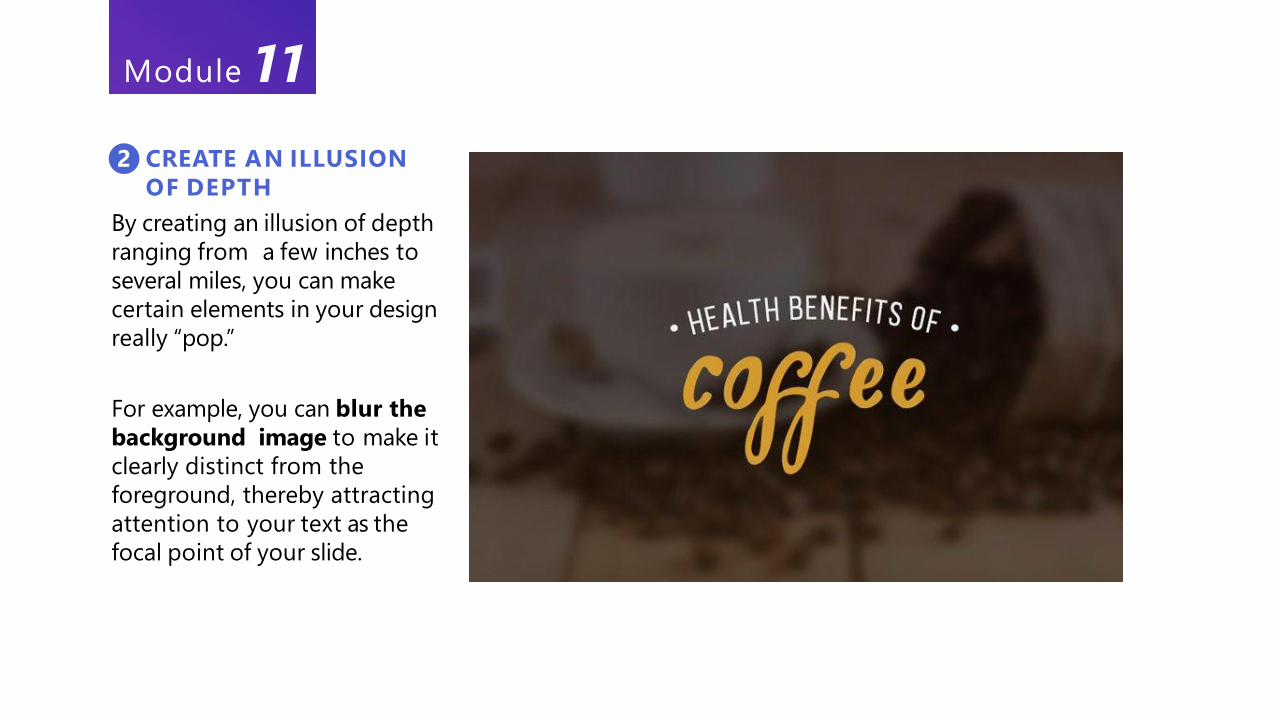
2 CREATE AN ILLUSION
OF DEPTH
By creating an illusion of depth
ranging from a few inches to
several miles, you can make
certain elements in your design
really “pop.”
For example, you can blur the
background image to make it
clearly distinct from the
foreground, thereby attracting
attention to your text as the
focal point of your slide.
Module 11
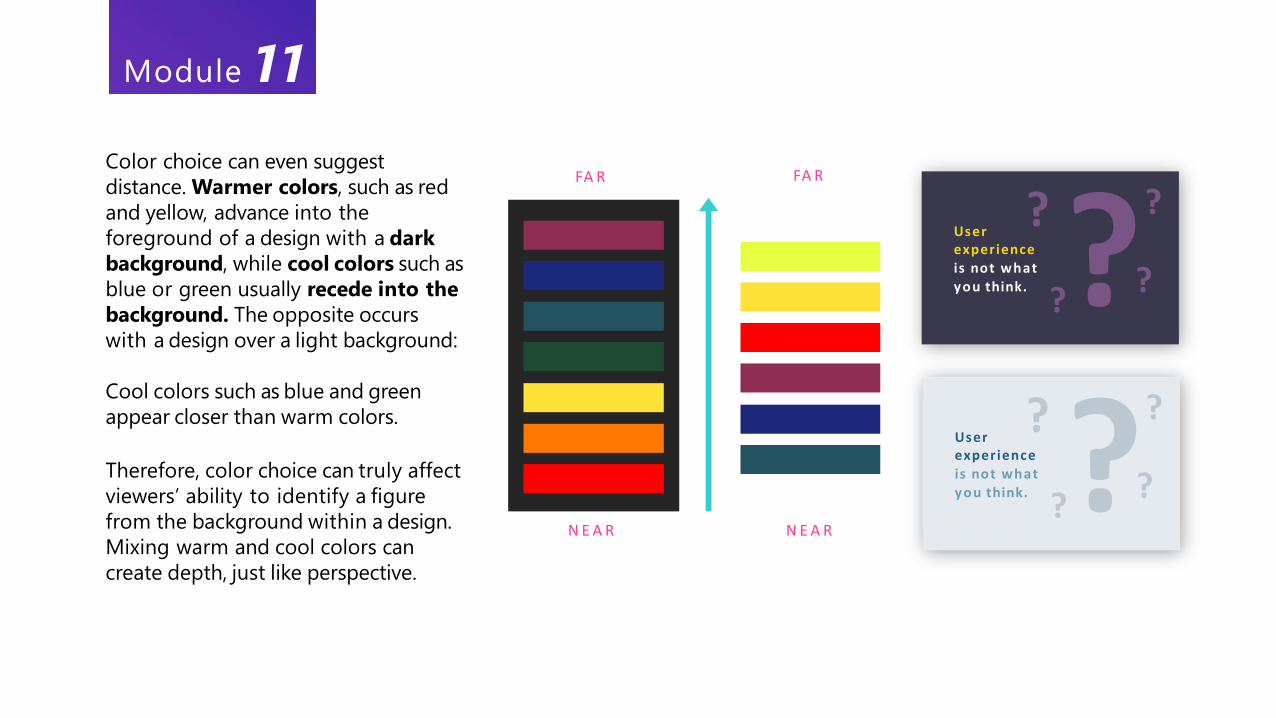
Color choice can even suggest
distance. Warmer colors, such as red
and yellow, advance into the
foreground of a design with a dark
background, while cool colors such as
blue or green usually recede into the
background. The opposite occurs
with a design over a light background:
Cool colors such as blue and green
appear closer than warm colors.
Therefore, color choice can truly affect
viewers’ ability to identify a figure
from the background within a design.
Mixing warm and cool colors can
create depth, just like perspective.
?Userexperienceis not whatyou think.
? ?
??
?Userexperienceis not whatyou think.
? ?
??
FA R
N E A R
FA R
N E A R
Module 11
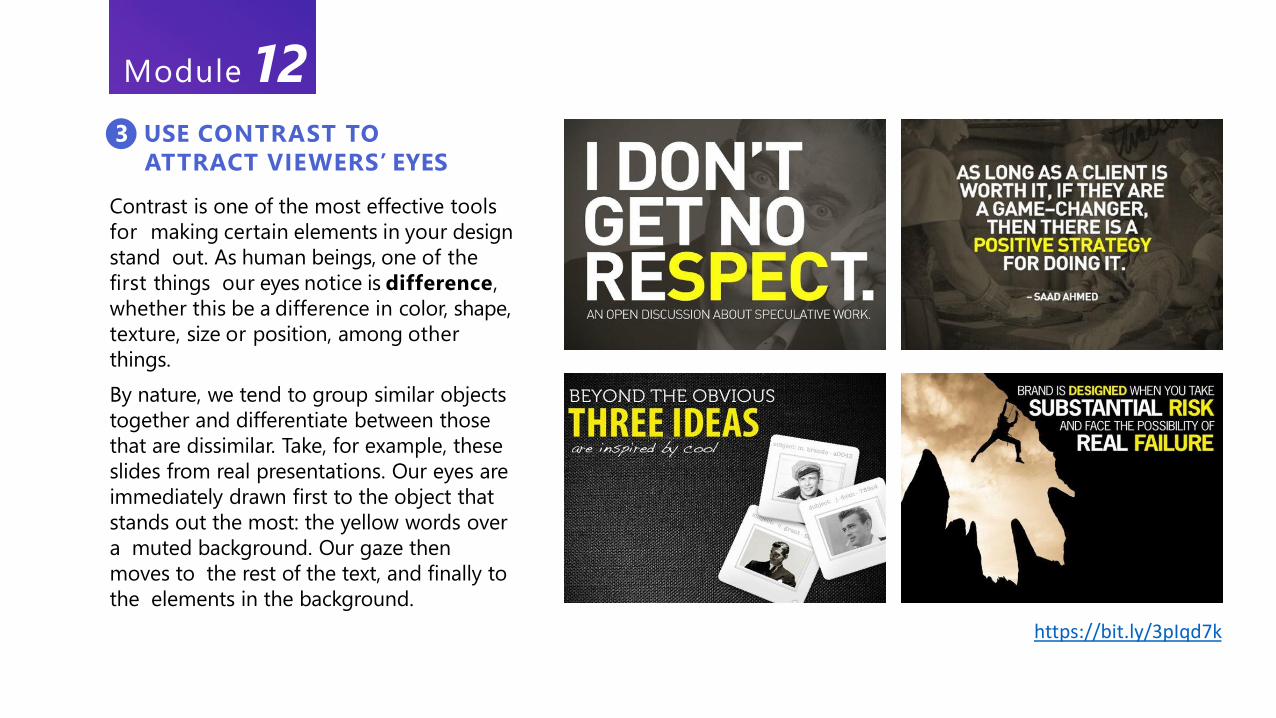
Contrast is one of the most effective tools
for making certain elements in your design
stand out. As human beings, one of the
first things our eyes notice is difference,
whether this be a difference in color, shape,
texture, size or position, among other
things.
By nature, we tend to group similar objects
together and differentiate between those
that are dissimilar. Take, for example, these
slides from real presentations. Our eyes are
immediately drawn first to the object that
stands out the most: the yellow words over
a muted background. Our gaze then
moves to the rest of the text, and finally to
the elements in the background.
3 USE CONTRAST TO
ATTRACT VIEWERS’ EYES
https://bit.ly/3pIqd7k
Module 12
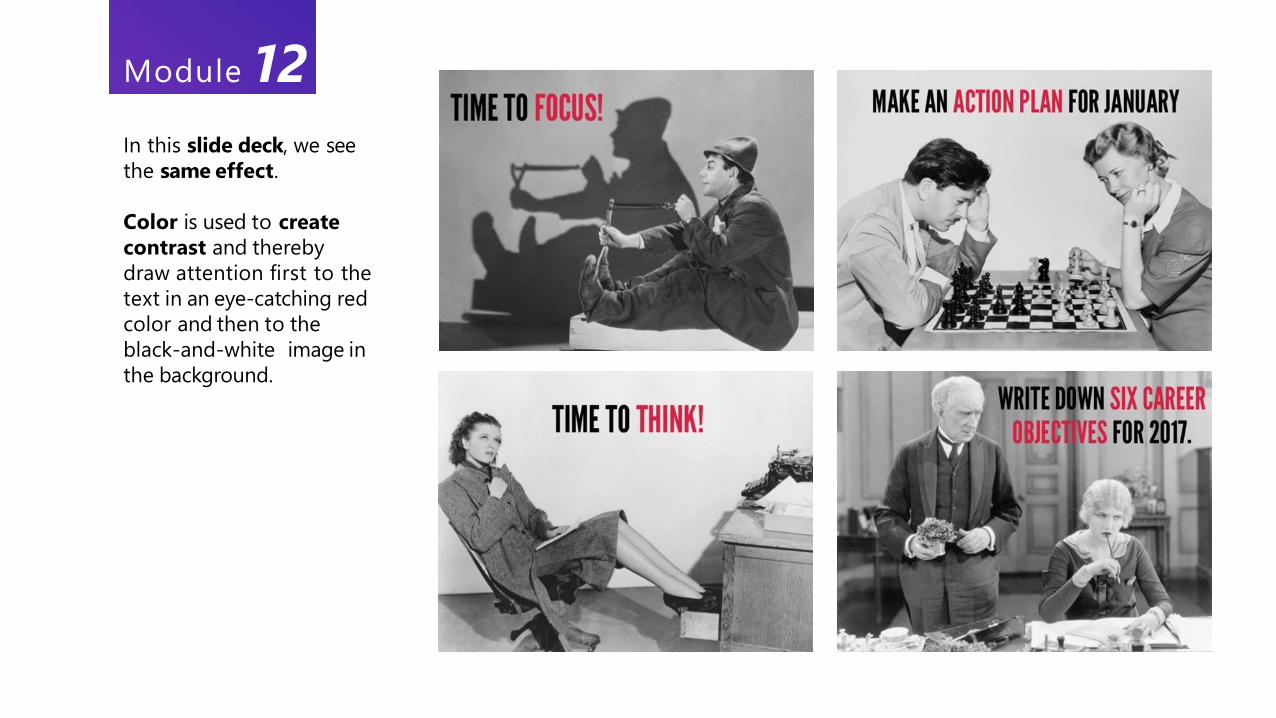
In this slide deck, we see
the same effect.
Color is used to create
contrast and thereby
draw attention first to the
text in an eye-catching red
color and then to the
black-and-white image in
the background.
Module 12
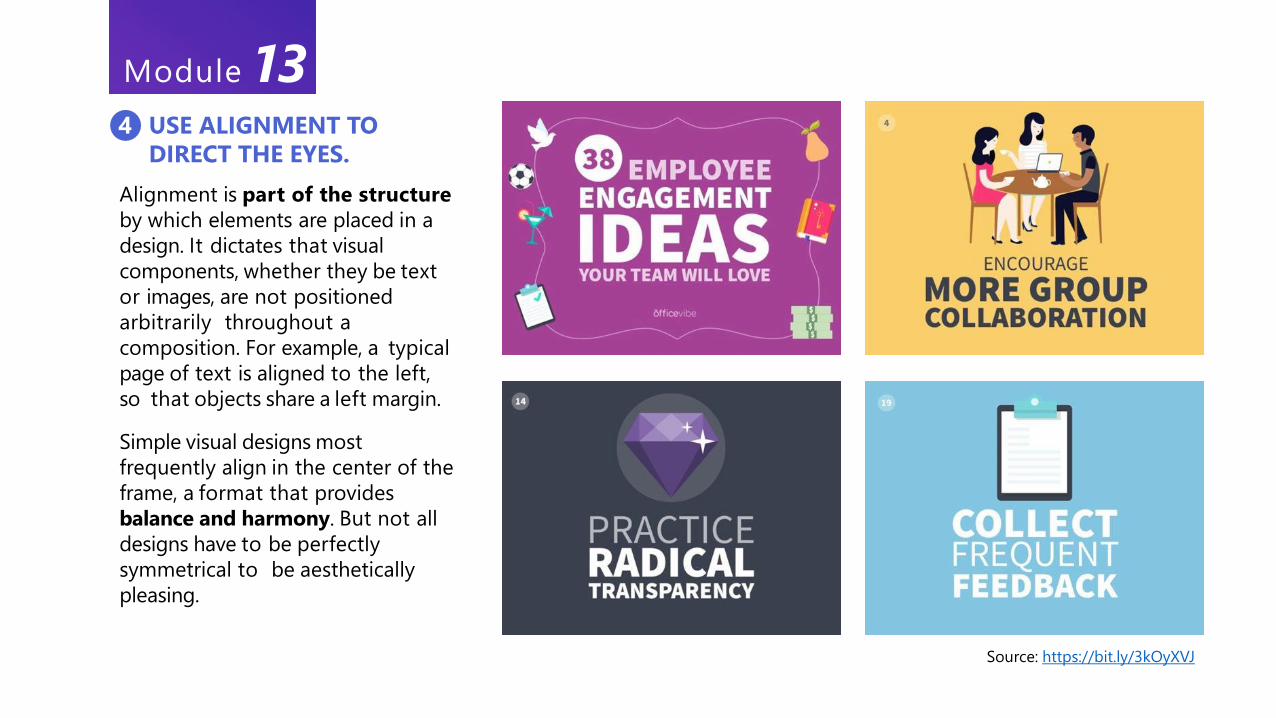
Alignment is part of the structure
by which elements are placed in a
design. It dictates that visual
components, whether they be text
or images, are not positioned
arbitrarily throughout a
composition. For example, a typical
page of text is aligned to the left,
so that objects share a left margin.
Simple visual designs most
frequently align in the center of the
frame, a format that provides
balance and harmony. But not all
designs have to be perfectly
symmetrical to be aesthetically
pleasing.
4 USE ALIGNMENT TO
DIRECT THE EYES.
Source: https://bit.ly/3kOyXVJ
Module 13
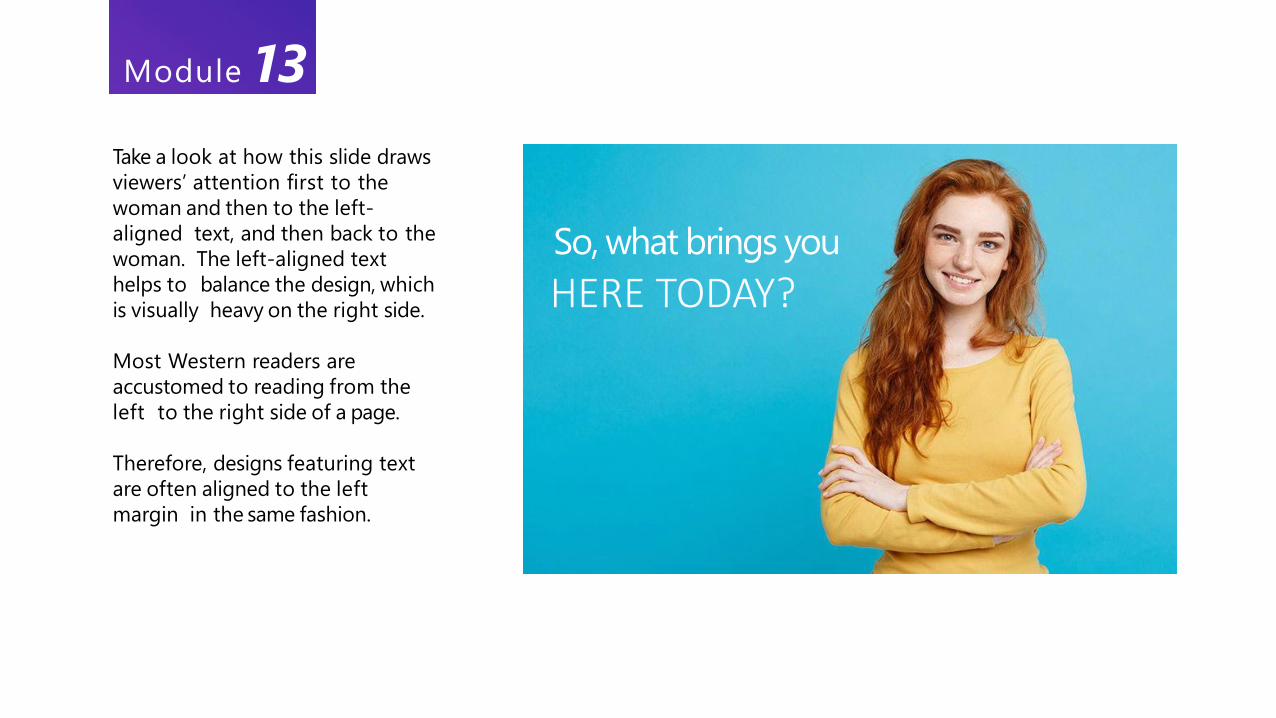
Take a look at how this slide draws
viewers’ attention first to the
woman and then to the left-
aligned text, and then back to the
woman. The left-aligned text
helps to balance the design, which
is visually heavy on the right side.
Most Western readers are
accustomed to reading from the
left to the right side of a page.
Therefore, designs featuring text
are often aligned to the left
margin in the same fashion.
So, what brings you
HERE TODAY?
Module 13
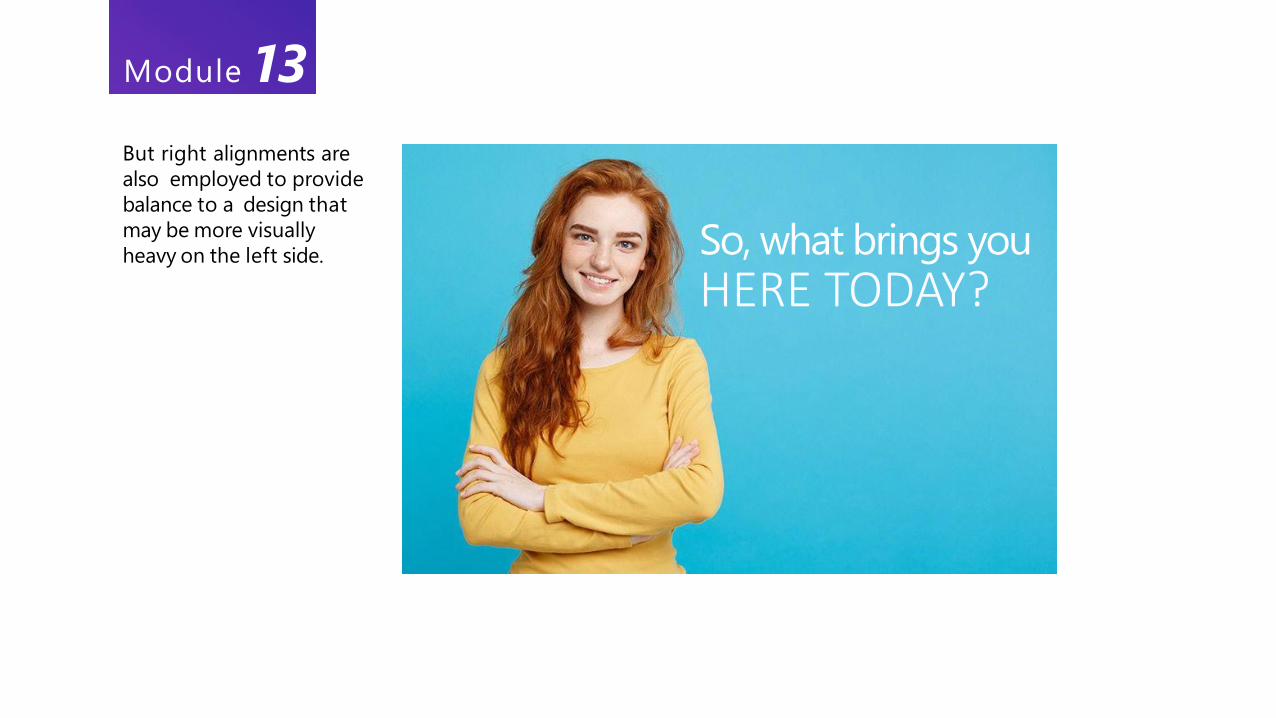
But right alignments are
also employed to provide
balance to a design that
may be more visually
heavy on the left side. So, what brings you
HERE TODAY?
Module 13
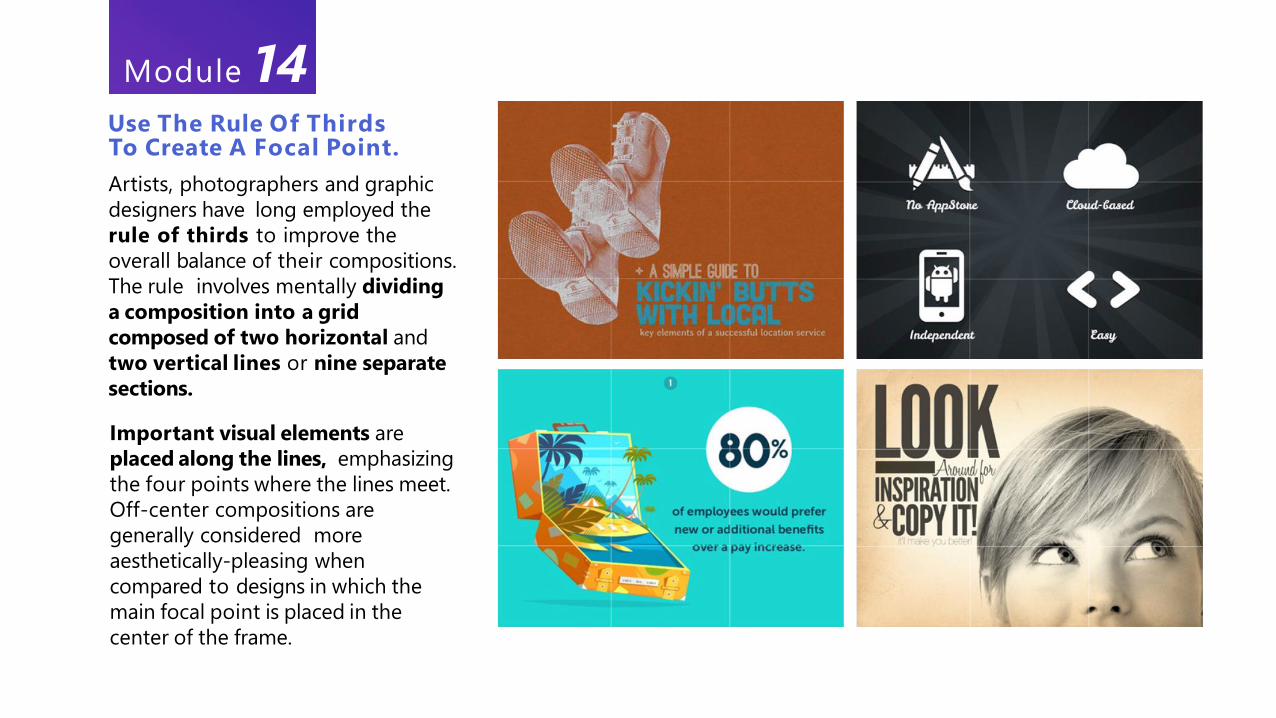
Important visual elements are
placed along the lines, emphasizing
the four points where the lines meet.
Off-center compositions are
generally considered more
aesthetically-pleasing when
compared to designs in which the
main focal point is placed in the
center of the frame.
Artists, photographers and graphic
designers have long employed the
rule of thirds to improve the
overall balance of their compositions.
The rule involves mentally dividing
a composition into a grid
composed of two horizontal and
two vertical lines or nine separate
sections.
Use The Rule Of Thirds To Create A Focal Point.
Module 14
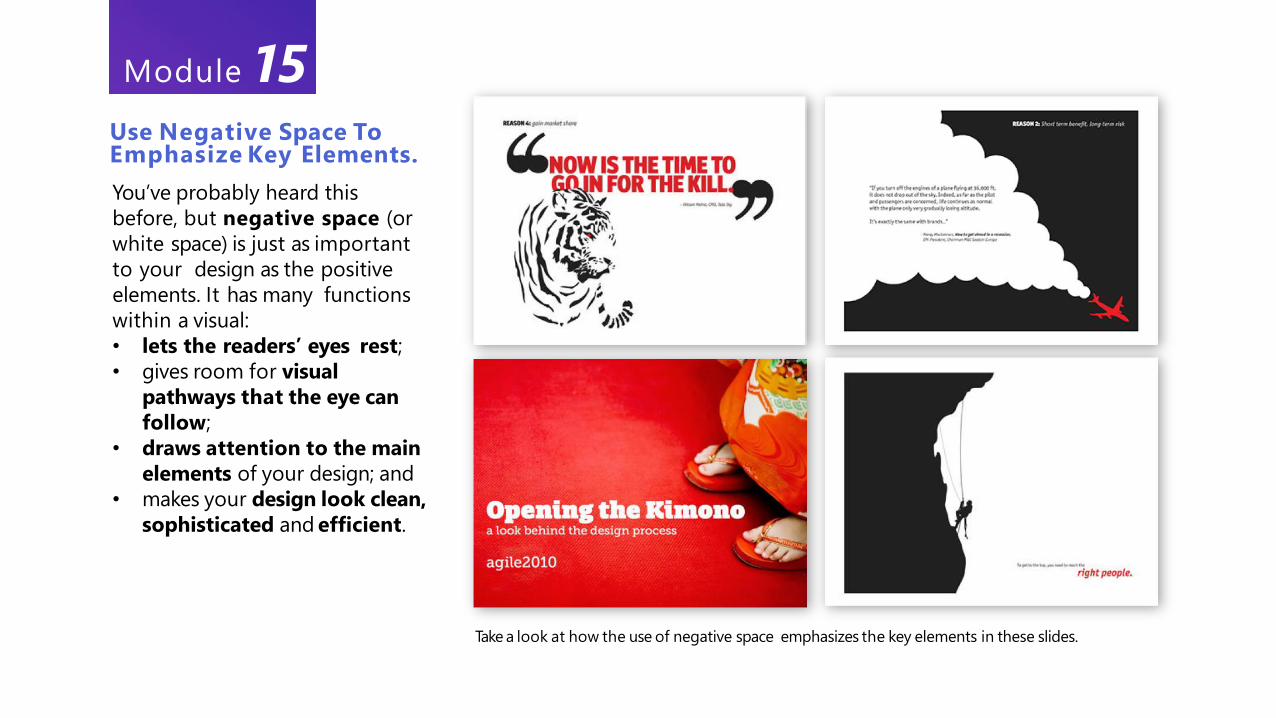
You’ve probably heard this
before, but negative space (or
white space) is just as important
to your design as the positive
elements. It has many functions
within a visual:
• lets the readers’ eyes rest;
• gives room for visual
pathways that the eye can
follow;
• draws attention to the main
elements of your design; and
• makes your design look clean,
sophisticated and efficient.
Take a look at how the use of negative space emphasizes the key elements in these slides.
Use Negative Space To Emphasize Key Elements.
Module 15
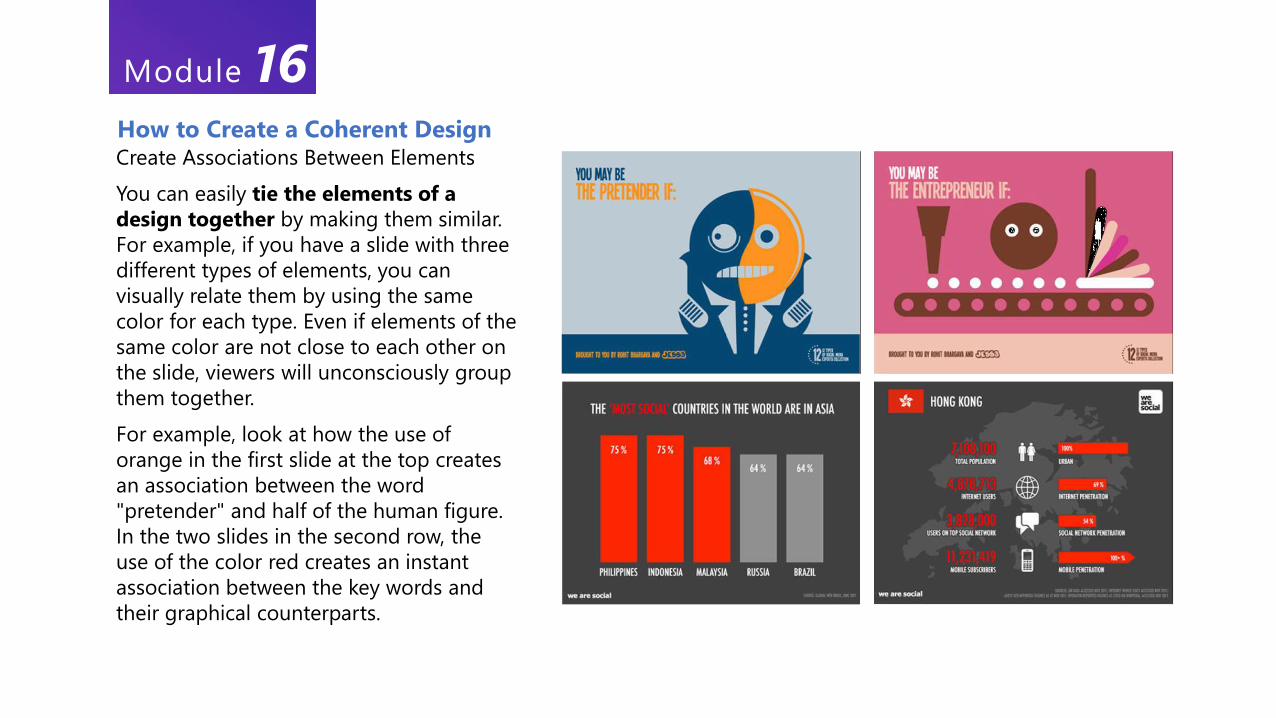
Create Associations Between Elements
You can easily tie the elements of a
design together by making them similar.
For example, if you have a slide with three
different types of elements, you can
visually relate them by using the same
color for each type. Even if elements of the
same color are not close to each other on
the slide, viewers will unconsciously group
them together.
For example, look at how the use of
orange in the first slide at the top creates
an association between the word
"pretender" and half of the human figure.
In the two slides in the second row, the
use of the color red creates an instant
association between the key words and
their graphical counterparts.
How to Create a Coherent Design
Module 16
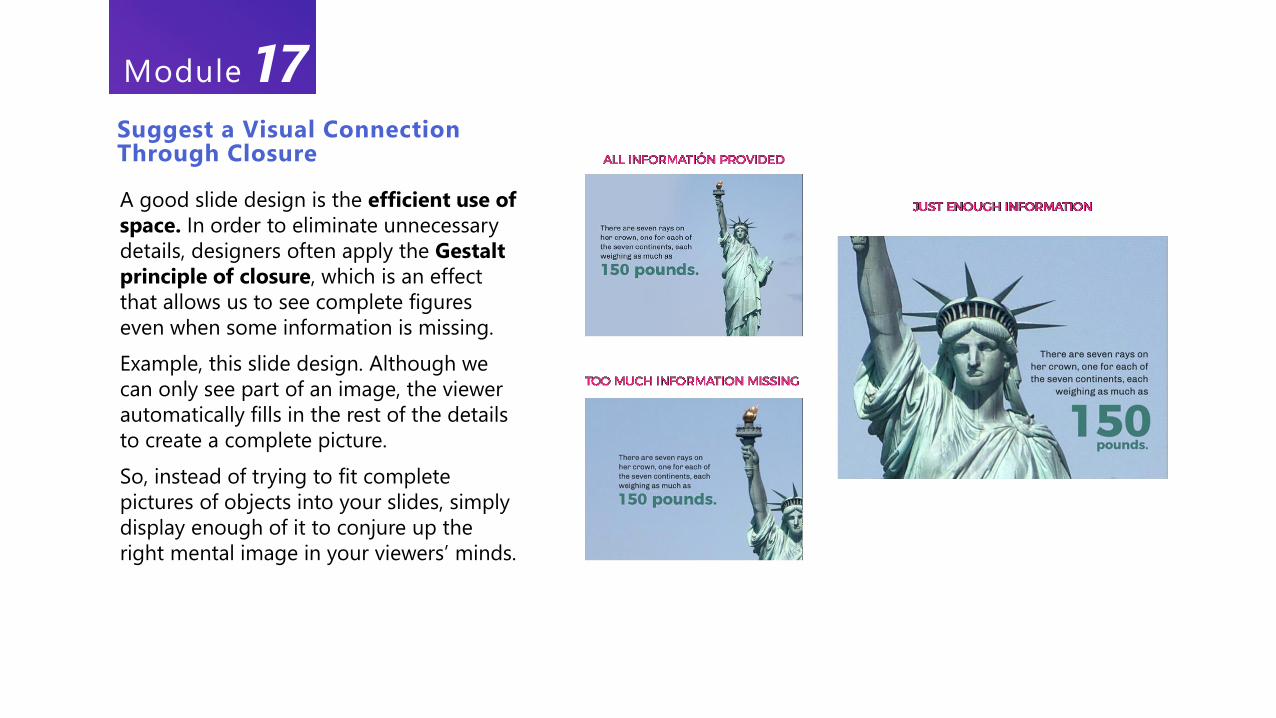
A good slide design is the efficient use of
space. In order to eliminate unnecessary
details, designers often apply the Gestalt
principle of closure, which is an effect
that allows us to see complete figures
even when some information is missing.
Example, this slide design. Although we
can only see part of an image, the viewer
automatically fills in the rest of the details
to create a complete picture.
So, instead of trying to fit complete
pictures of objects into your slides, simply
display enough of it to conjure up the
right mental image in your viewers’ minds.
Suggest a Visual Connection Through Closure
Module 17
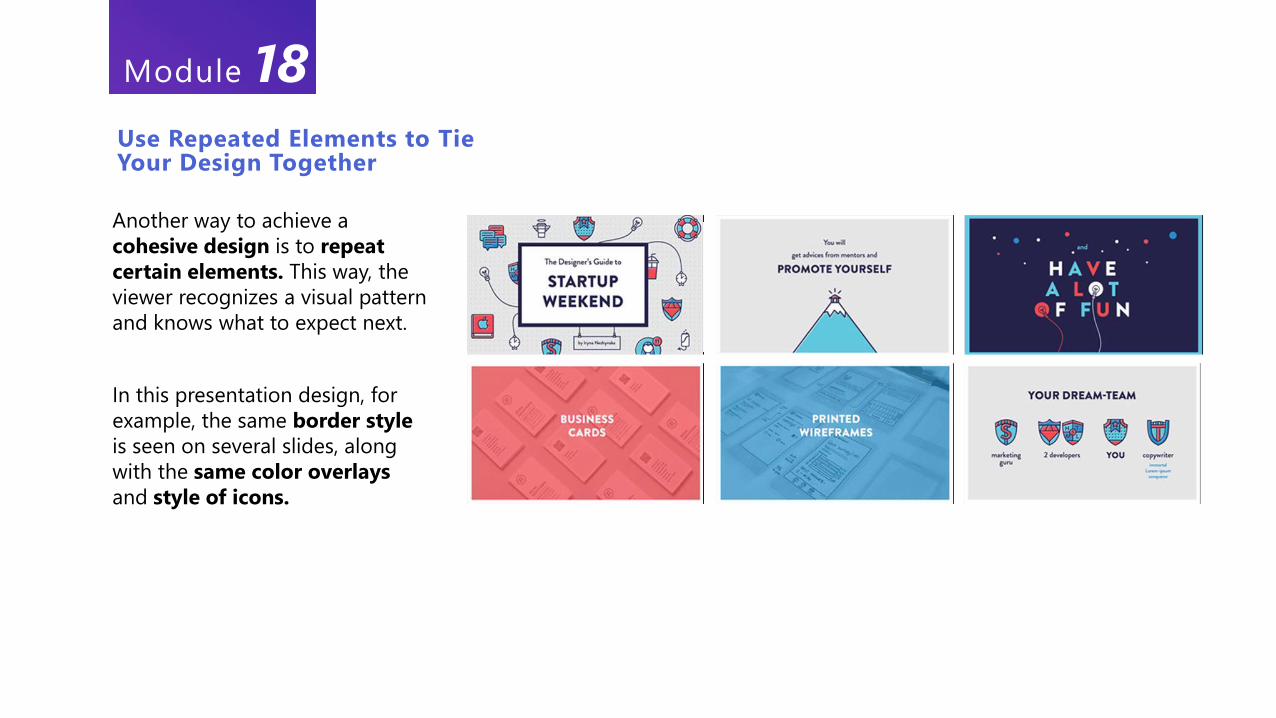
Another way to achieve a
cohesive design is to repeat
certain elements. This way, the
viewer recognizes a visual pattern
and knows what to expect next.
In this presentation design, for
example, the same border style
is seen on several slides, along
with the same color overlays
and style of icons.
Use Repeated Elements to Tie Your Design Together
Module 18
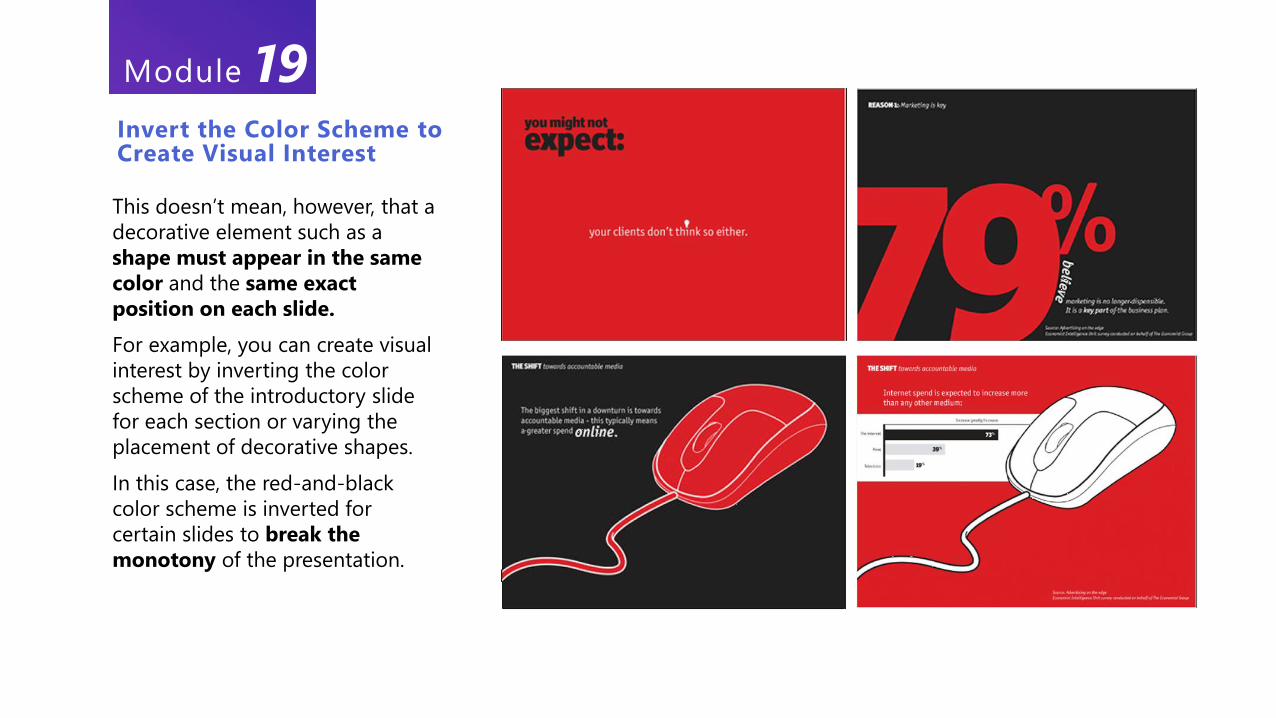
This doesn’t mean, however, that a
decorative element such as a
shape must appear in the same
color and the same exact
position on each slide.
For example, you can create visual
interest by inverting the color
scheme of the introductory slide
for each section or varying the
placement of decorative shapes.
In this case, the red-and-black
color scheme is inverted for
certain slides to break the
monotony of the presentation.
Invert the Color Scheme to Create Visual Interest
Module 19
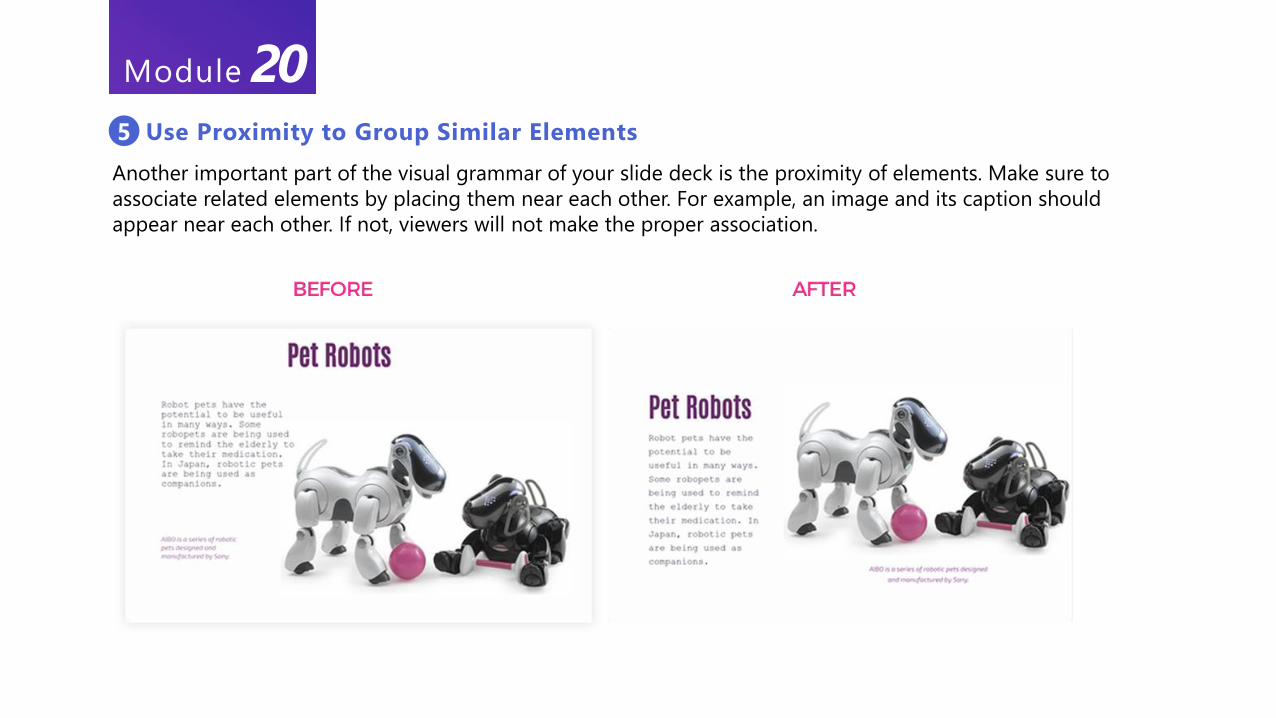
Another important part of the visual grammar of your slide deck is the proximity of elements. Make sure to
associate related elements by placing them near each other. For example, an image and its caption should
appear near each other. If not, viewers will not make the proper association.
5 Use Proximity to Group Similar Elements
Module 20
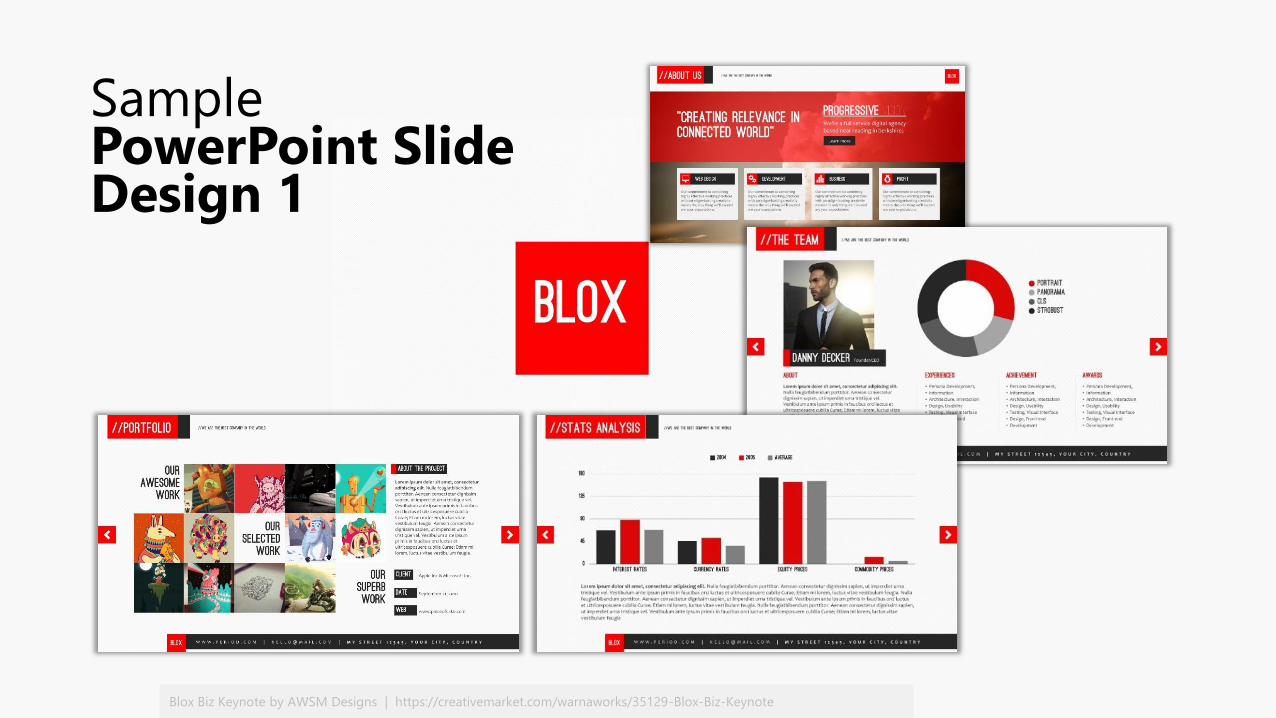
SamplePowerPoint Slide Design 1
Blox Biz Keynote by AWSM Designs | https://creativemarket.com/warnaworks/35129-Blox-Biz-Keynote
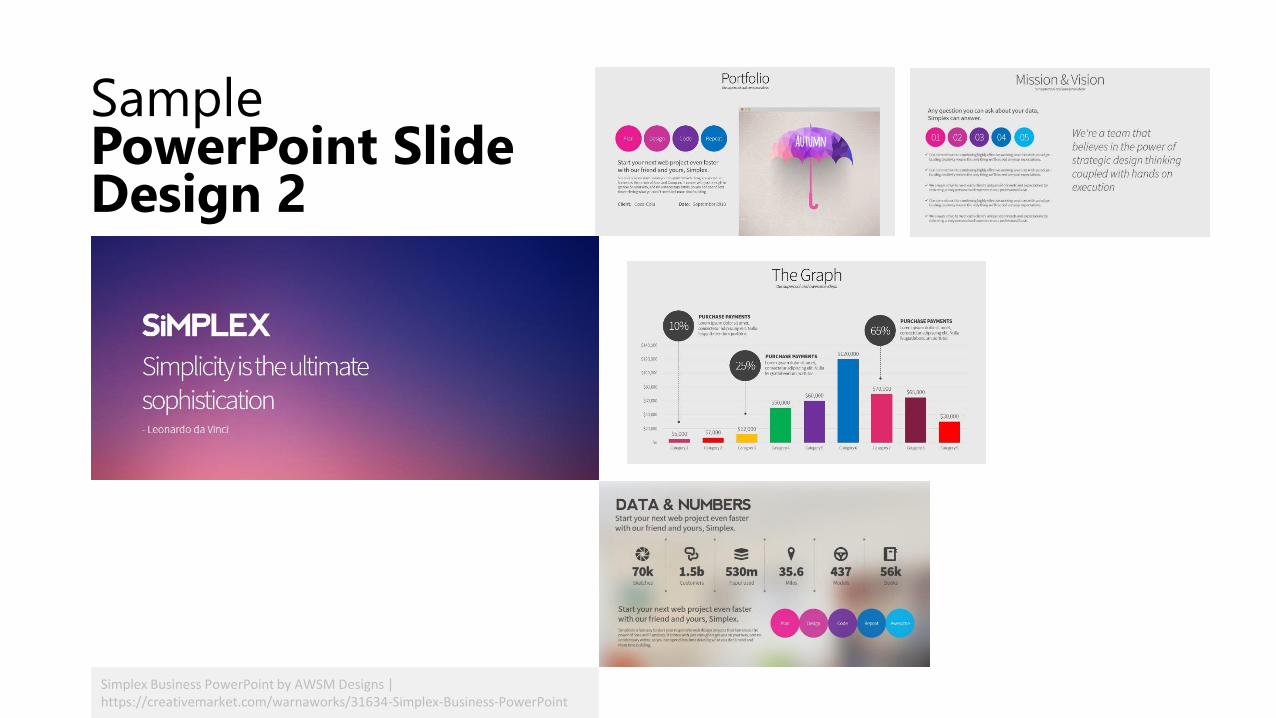
Simplex Business PowerPoint by AWSM Designs | https://creativemarket.com/warnaworks/31634-Simplex-Business-PowerPoint
SamplePowerPoint Slide Design 2
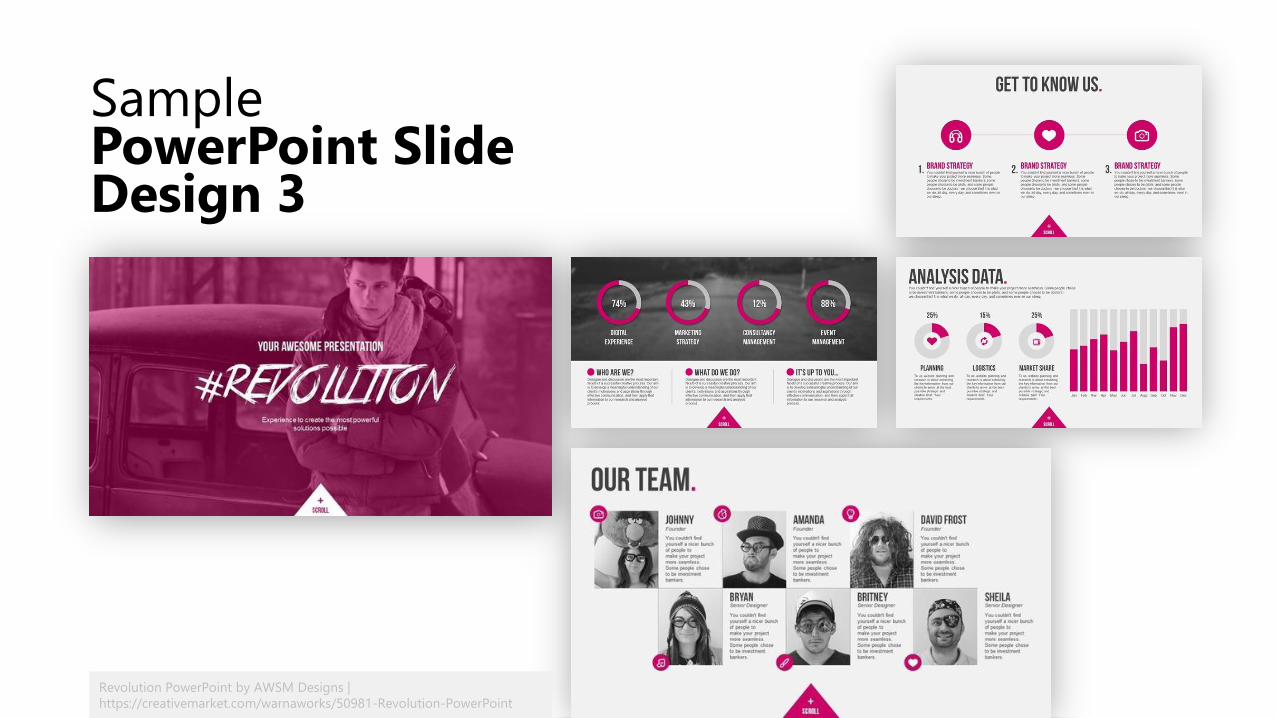
Revolution PowerPoint by AWSM Designs |
https://creativemarket.com/warnaworks/50981-Revolution-PowerPoint
SamplePowerPoint Slide Design 3
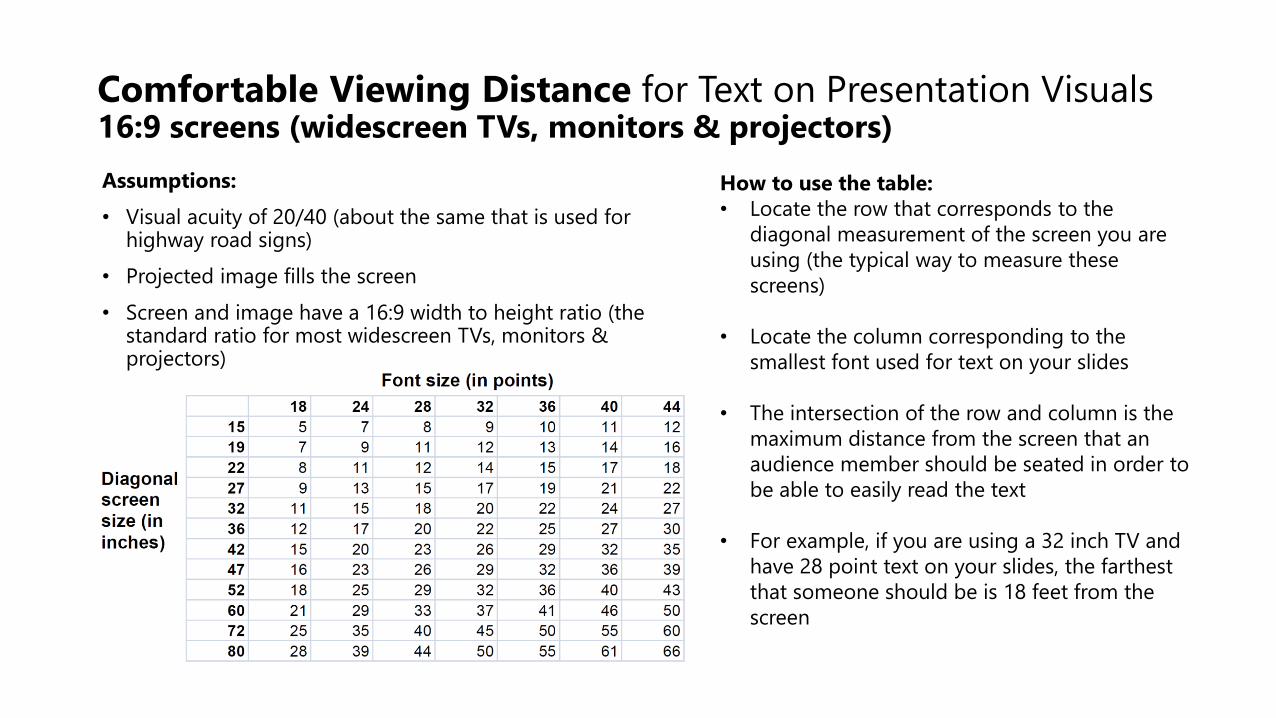
Comfortable Viewing Distance for Text on Presentation Visuals 16:9 screens (widescreen TVs, monitors & projectors)
Assumptions:
• Visual acuity of 20/40 (about the same that is used for highway road signs)
• Projected image fills the screen
• Screen and image have a 16:9 width to height ratio (the standard ratio for most widescreen TVs, monitors & projectors)
How to use the table:
• Locate the row that corresponds to the
diagonal measurement of the screen you are
using (the typical way to measure these
screens)
• Locate the column corresponding to the
smallest font used for text on your slides
• The intersection of the row and column is the
maximum distance from the screen that an
audience member should be seated in order to
be able to easily read the text
• For example, if you are using a 32 inch TV and
have 28 point text on your slides, the farthest
that someone should be is 18 feet from the
screen
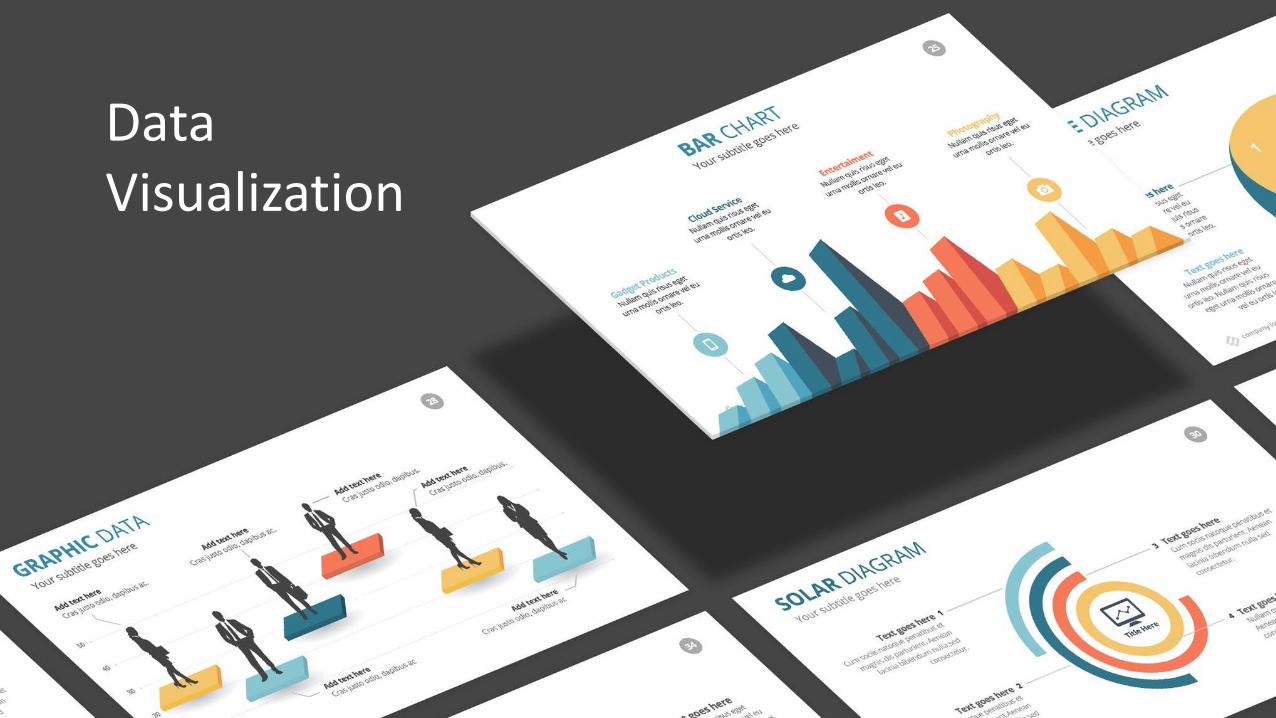
Data Visualization
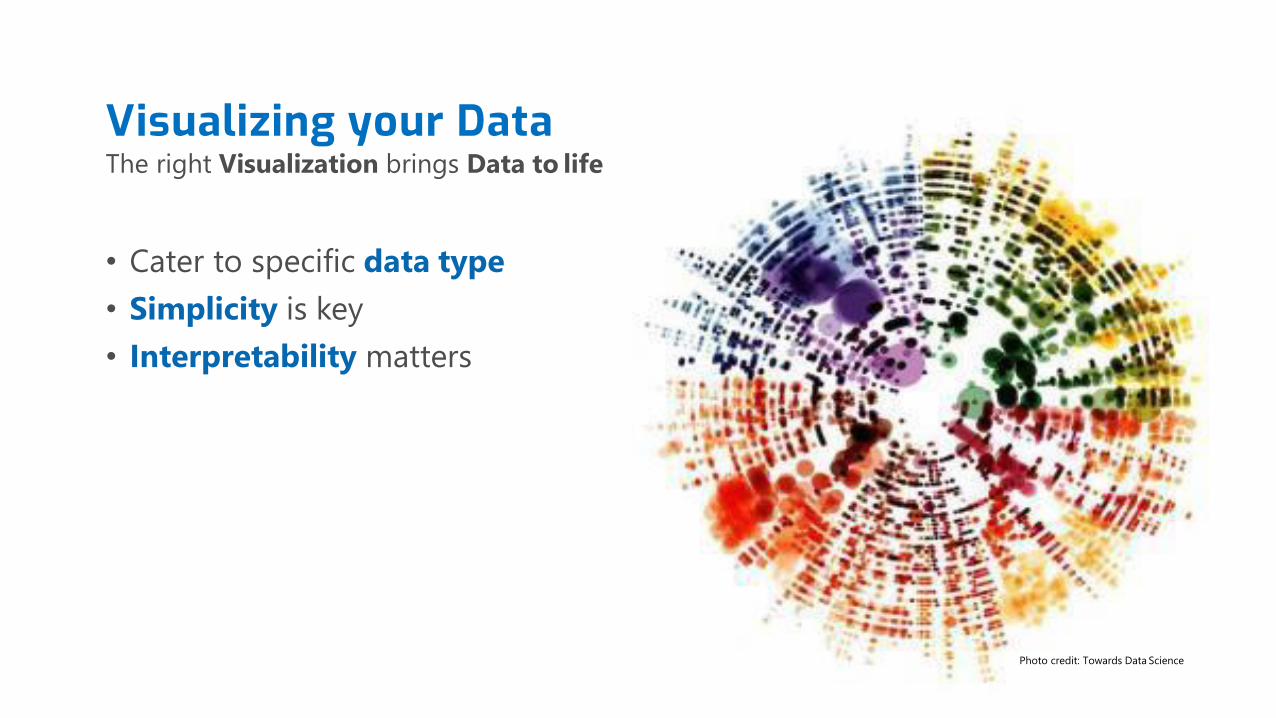
Visualizing your DataThe right Visualization brings Data to life
• Cater to specific data type
• Simplicity is key
• Interpretability matters
Photo credit: Towards Data Science
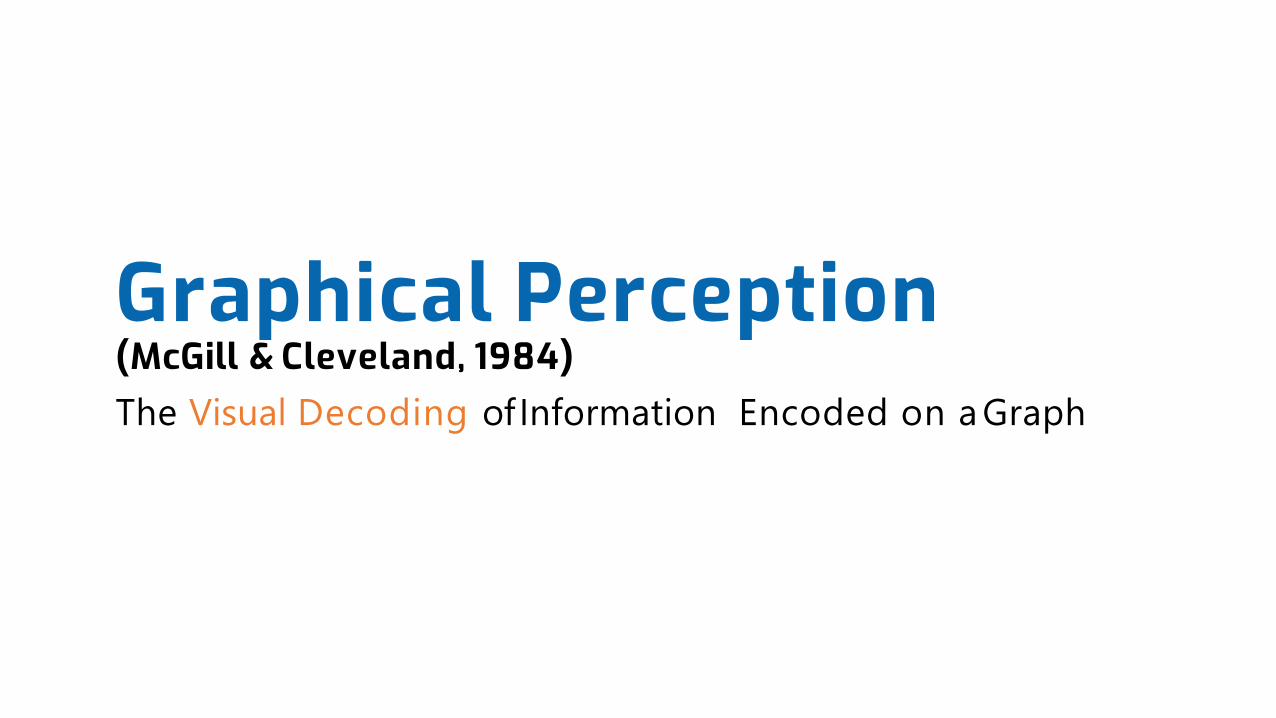
Graphical Perception(McGill & Cleveland, 1984)The Visual Decoding of Information Encoded on a Graph
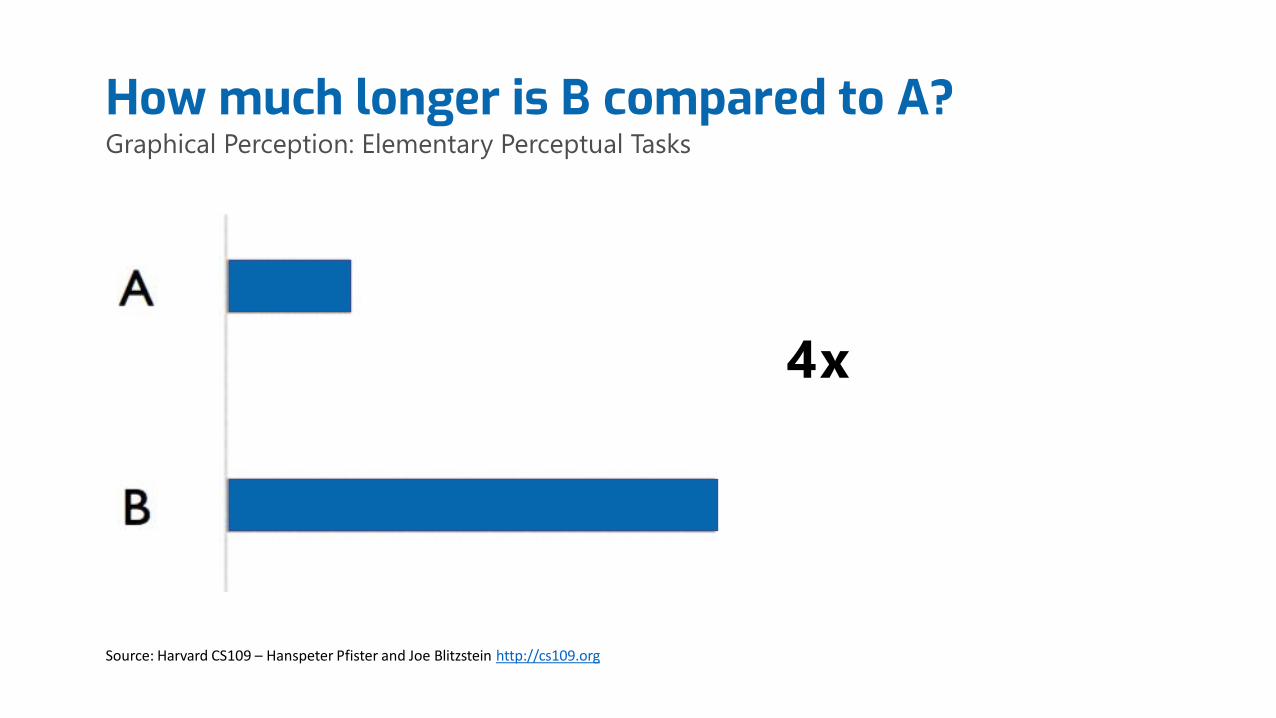
4x
How much longer is B compared to A?Graphical Perception: Elementary Perceptual Tasks
Source: Harvard CS109 – Hanspeter Pfister and Joe Blitzstein http://cs109.org
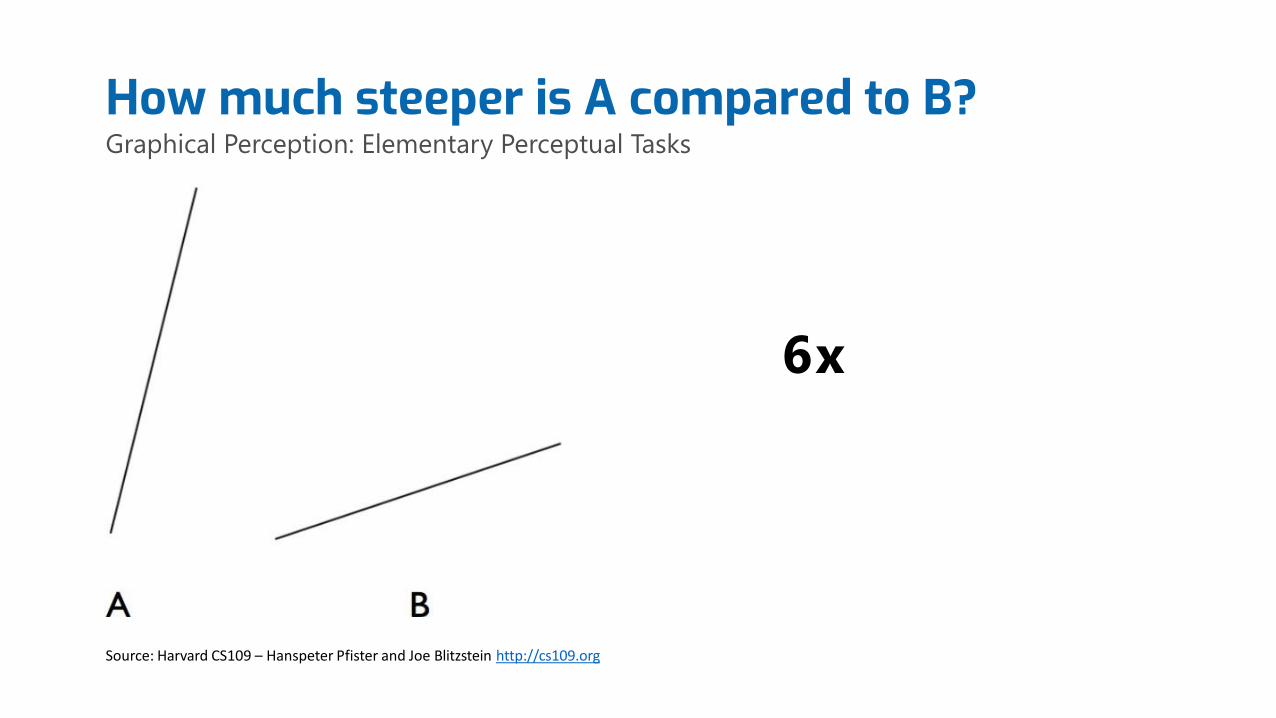
6x
Source: Harvard CS109 – Hanspeter Pfister and Joe Blitzstein http://cs109.org
How much steeper is A compared to B?Graphical Perception: Elementary Perceptual Tasks
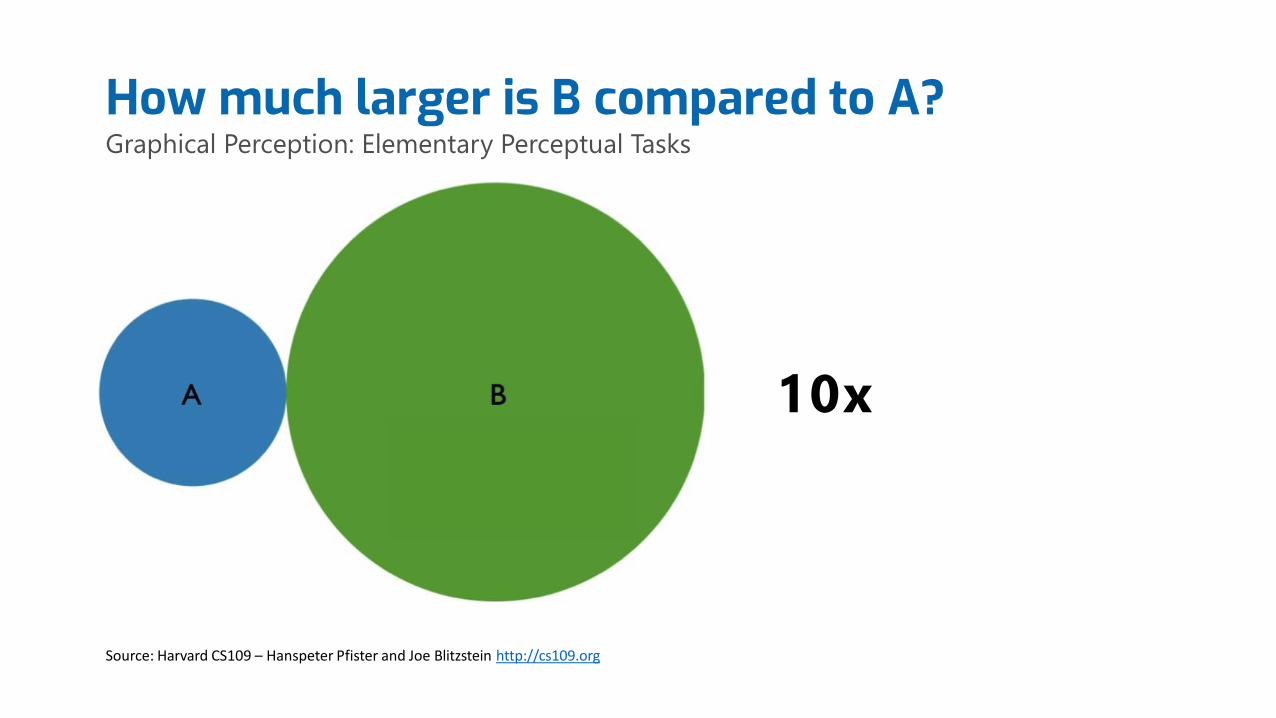
10x
Source: Harvard CS109 – Hanspeter Pfister and Joe Blitzstein http://cs109.org
How much larger is B compared to A?Graphical Perception: Elementary Perceptual Tasks
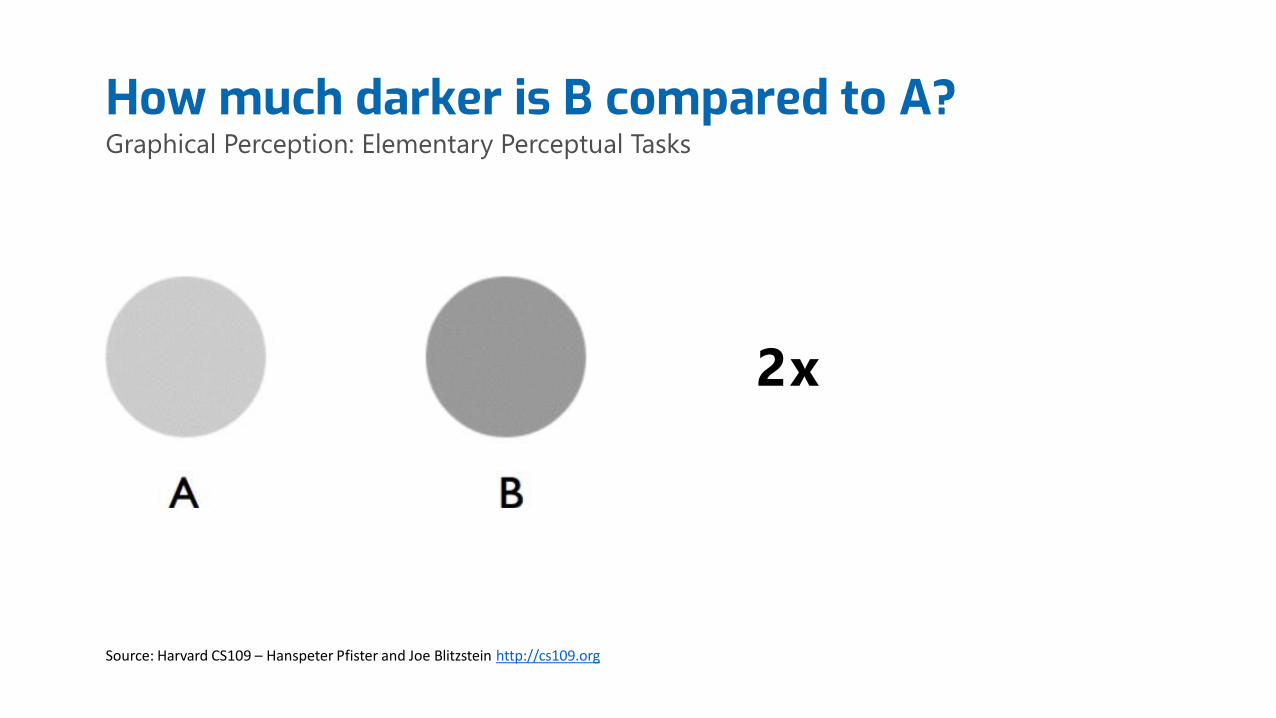
Source: Harvard CS109 – Hanspeter Pfister and Joe Blitzstein http://cs109.org
How much darker is B compared to A?Graphical Perception: Elementary Perceptual Tasks
2x
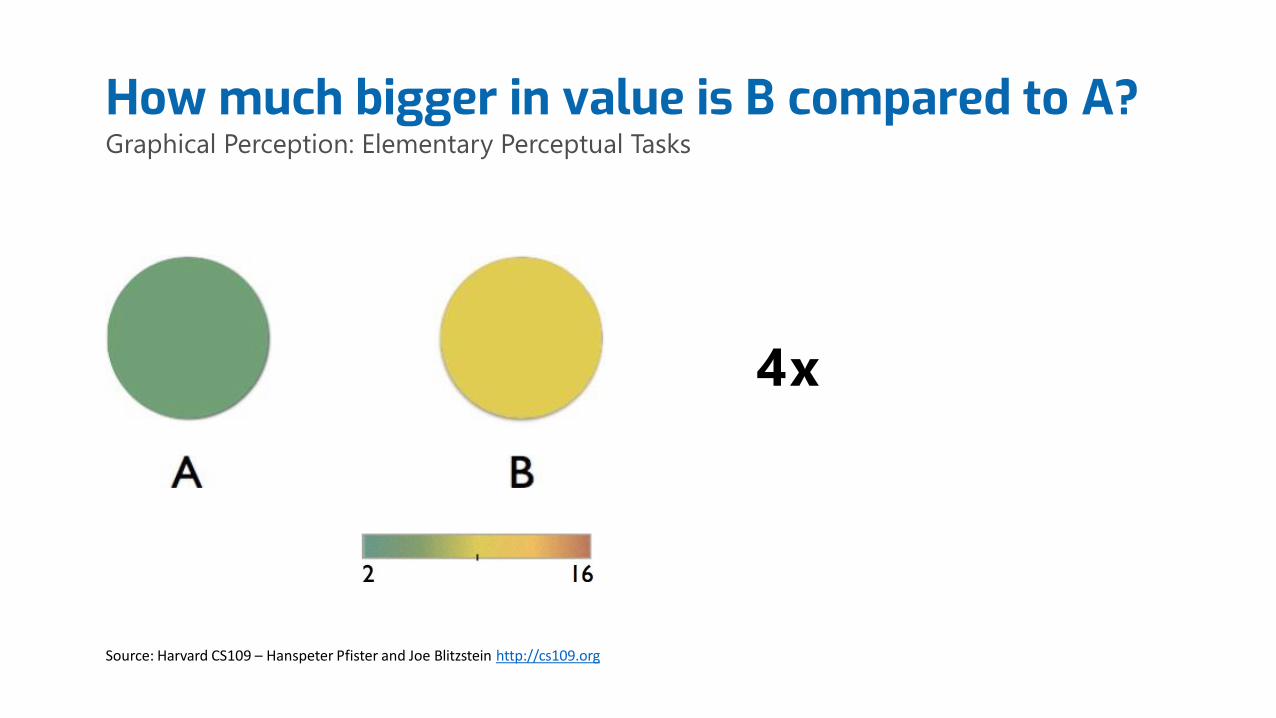
4x
How much bigger in value is B compared to A?Graphical Perception: Elementary Perceptual Tasks
Source: Harvard CS109 – Hanspeter Pfister and Joe Blitzstein http://cs109.org
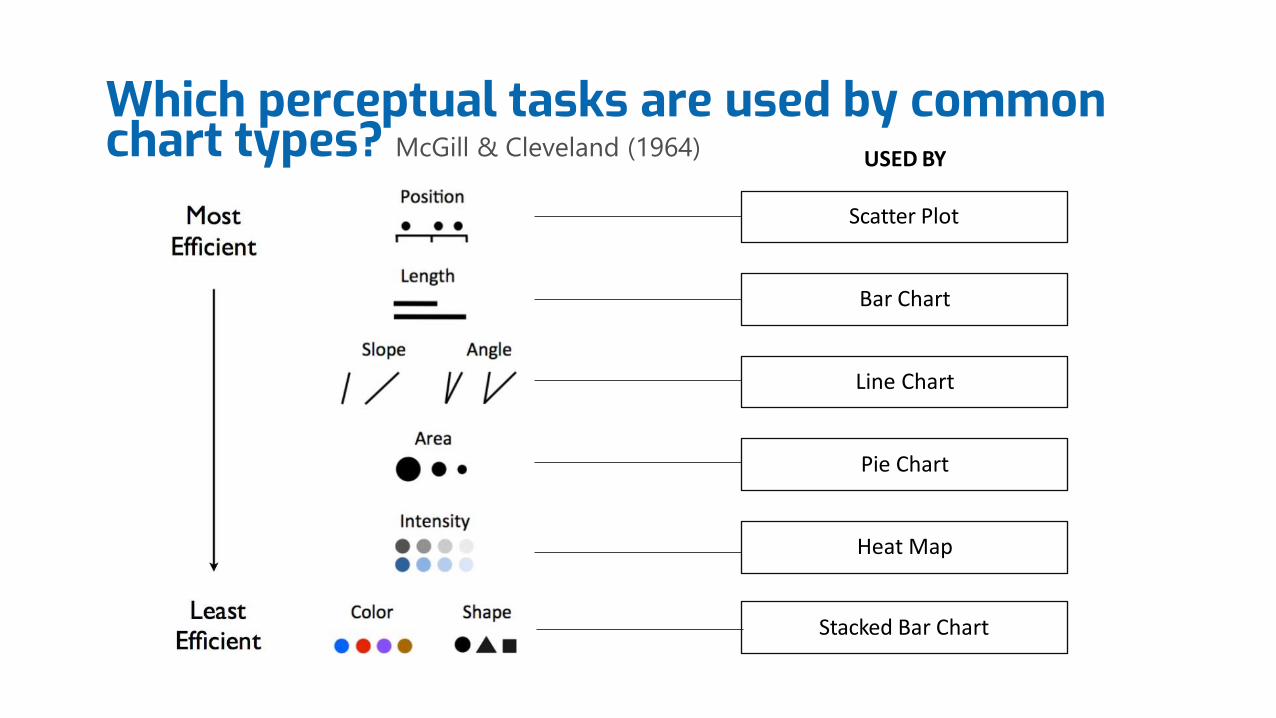
Which perceptual tasks are used by common chart types? McGill & Cleveland (1964)
Scatter Plot
Bar Chart
Line Chart
Pie Chart
Heat Map
Stacked Bar Chart
USED BY
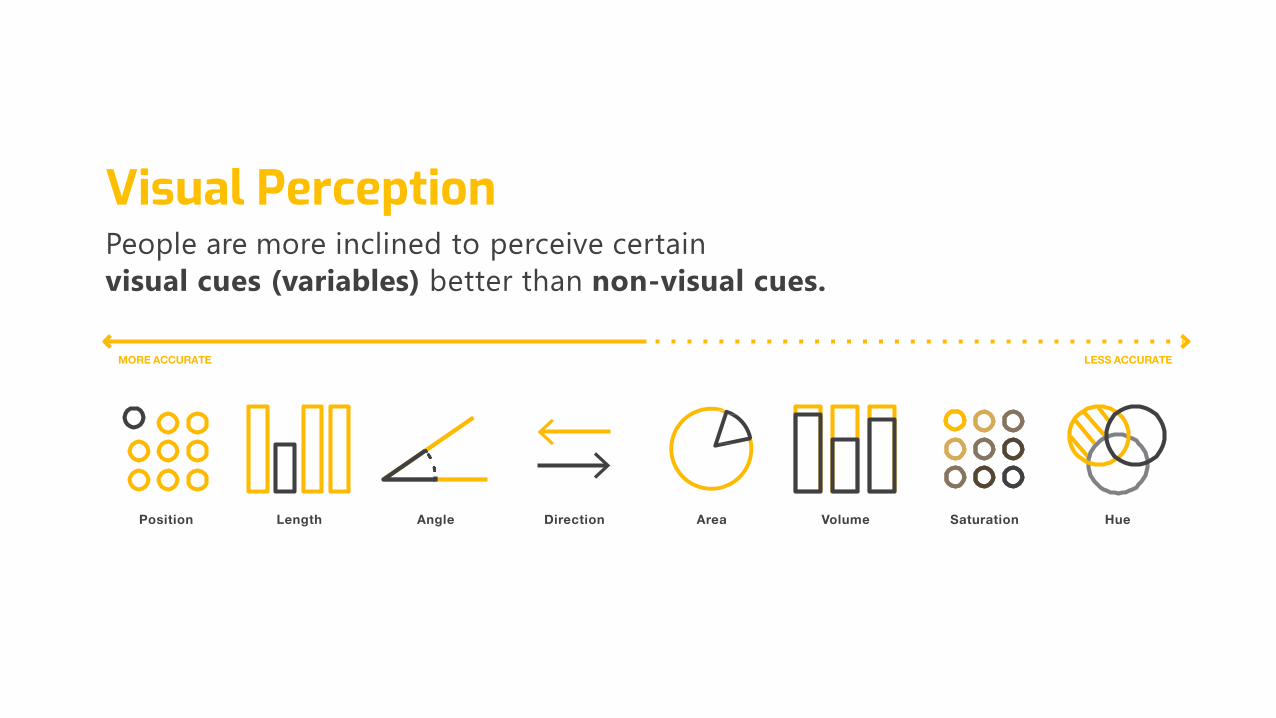
People are more inclined to perceive certain
visual cues (variables) better than non-visual cues.
Position Length Angle Direction Area Volume Saturation Hue
MOREACCURATE LESS ACCURATE
Visual Perception
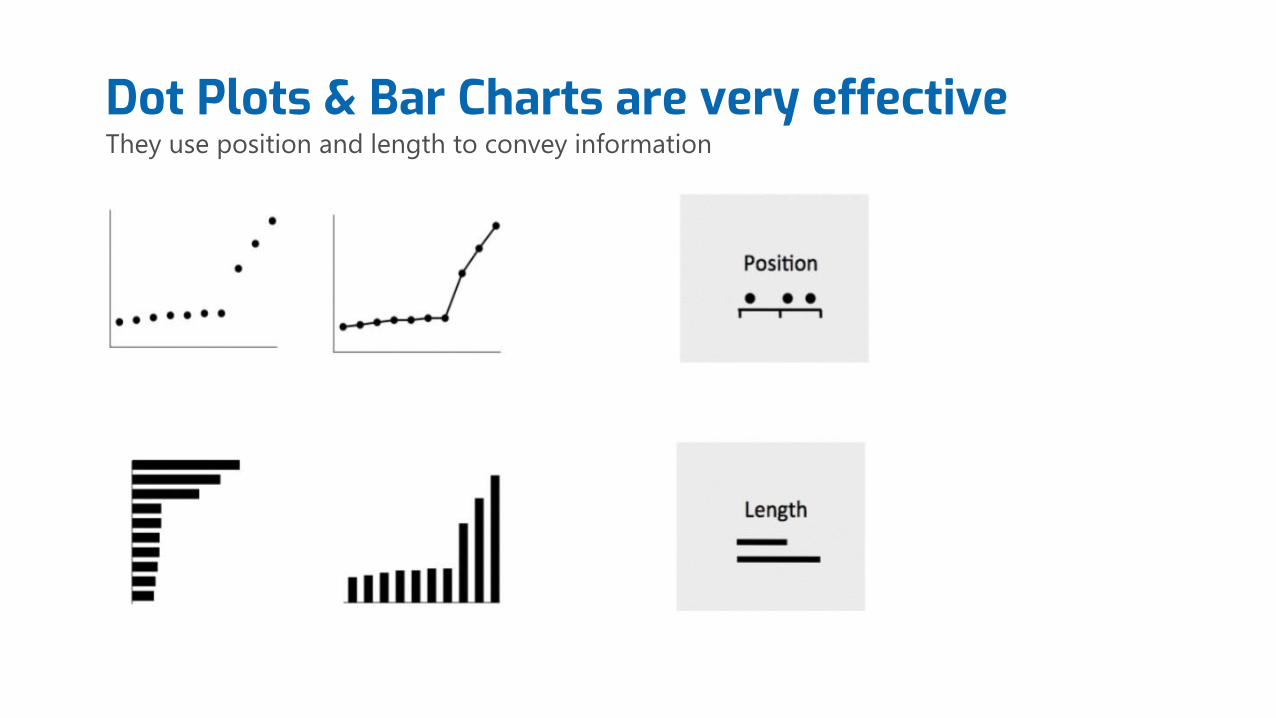
Dot Plots & Bar Charts are very effectiveThey use position and length to convey information
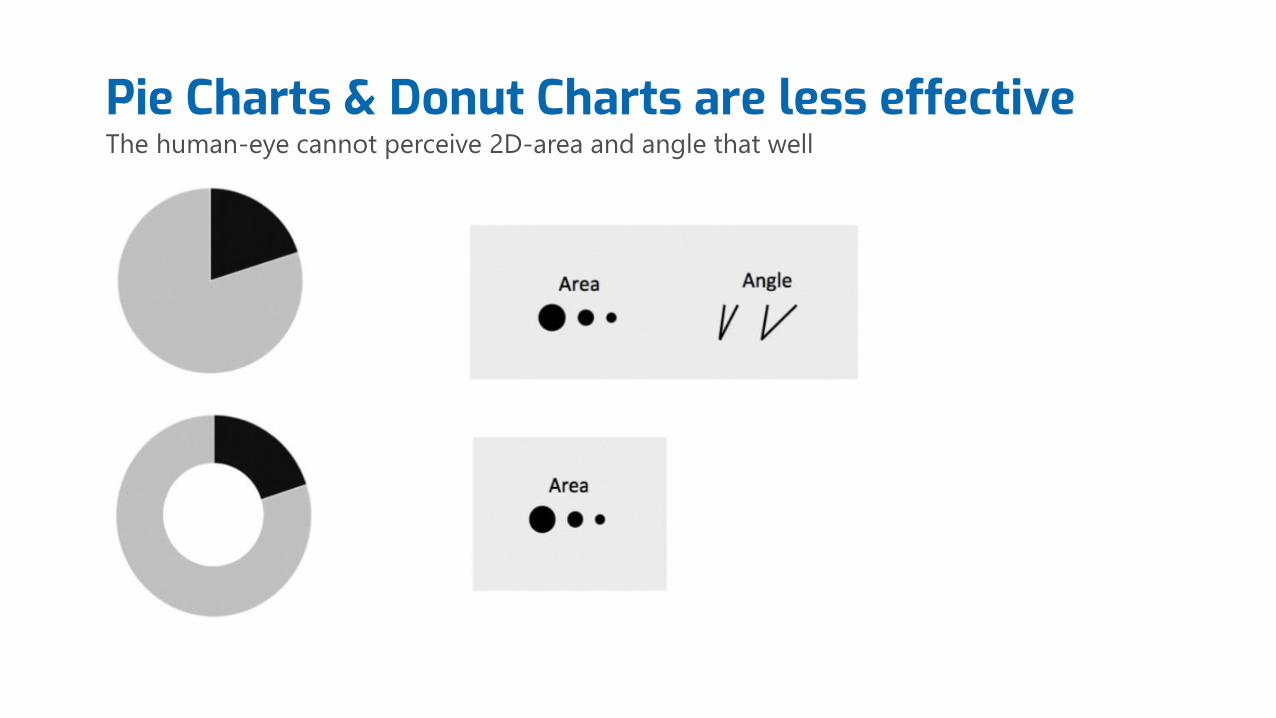
Pie Charts & Donut Charts are less effectiveThe human-eye cannot perceive 2D-area and angle that well
8
7
6
5
4
3
2
1
0Cat 1 Cat 2 Cat 3 Cat 4 Cat 5
Single Series
8
7
6
5
4
3
2
1
0
Cat 1 Cat 2 Cat 4 Cat 5
Multiple Series
Cat 3
A B C D
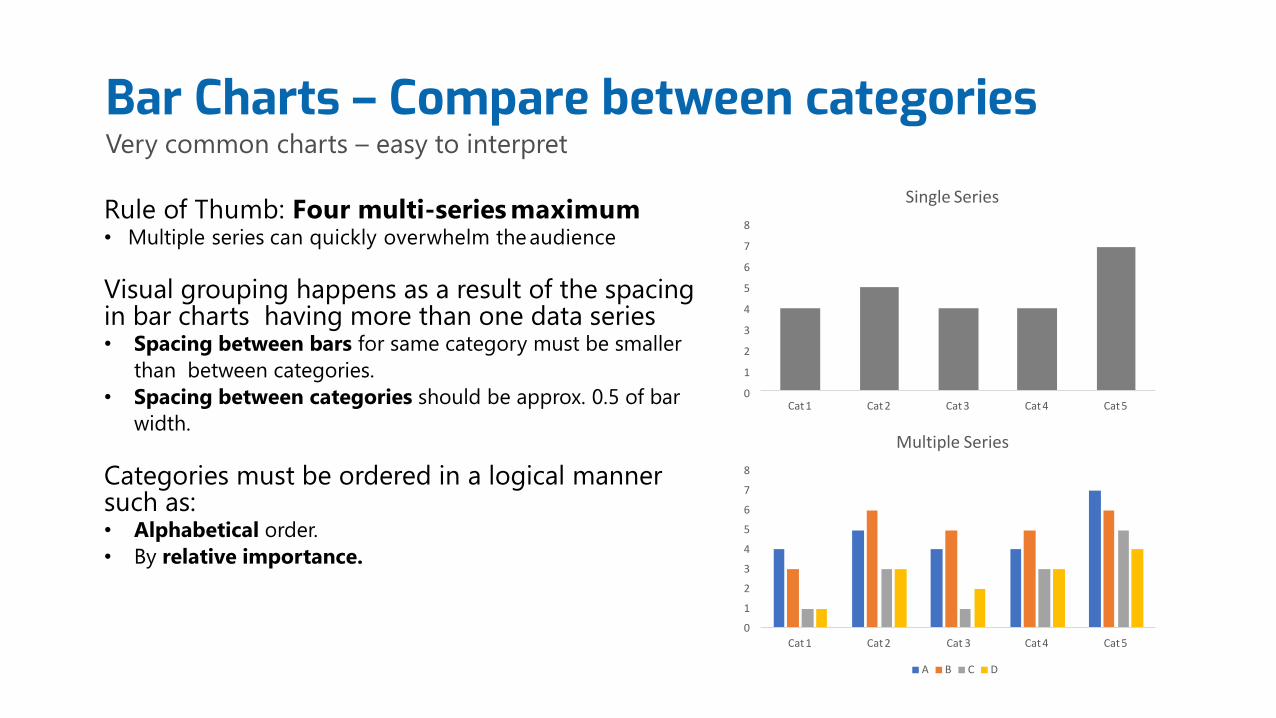
Rule of Thumb: Four multi-series maximum• Multiple series can quickly overwhelm theaudience
Visual grouping happens as a result of the spacing in bar charts having more than one data series• Spacing between bars for same category must be smaller
than between categories.
• Spacing between categories should be approx. 0.5 of bar
width.
Categories must be ordered in a logical manner such as:• Alphabetical order.
• By relative importance.
Bar Charts – Compare between categoriesVery common charts – easy to interpret
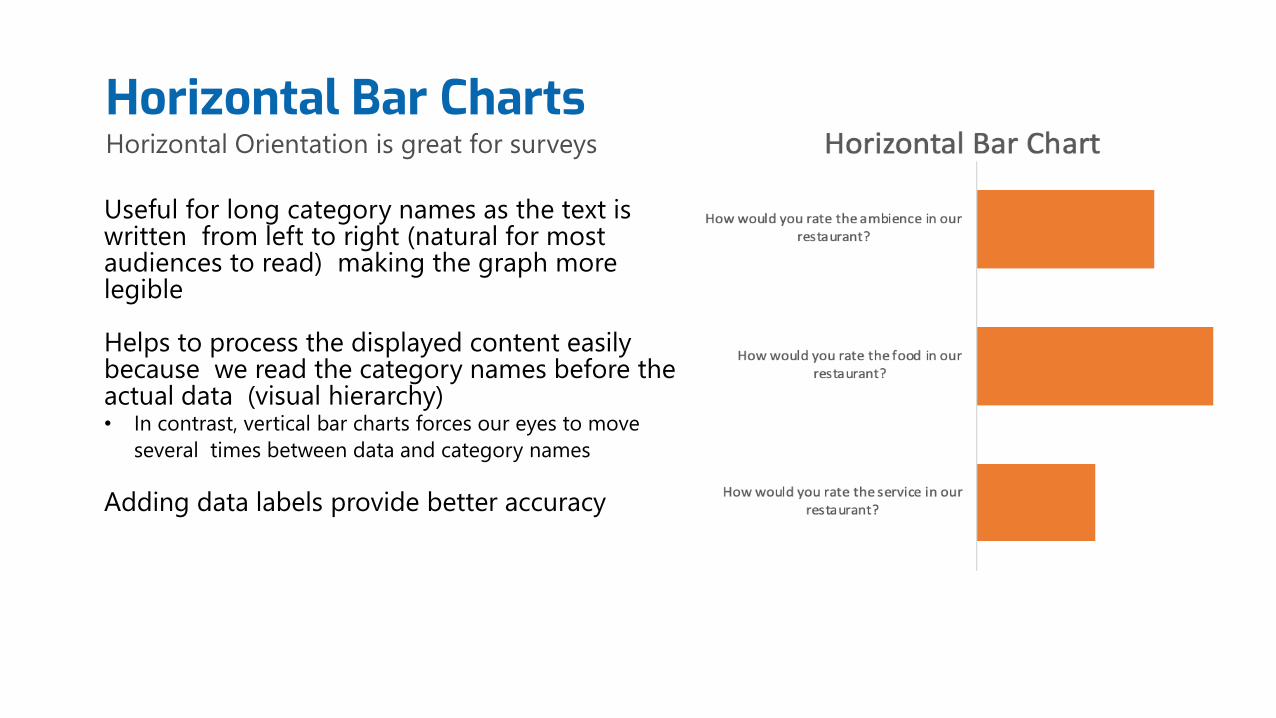
Horizontal Bar ChartsHorizontal Orientation is great for surveys
Useful for long category names as the text is written from left to right (natural for most audiences to read) making the graph more legible
Helps to process the displayed content easily because we read the category names before the actual data (visual hierarchy)• In contrast, vertical bar charts forces our eyes to move
several times between data and category names
Adding data labels provide better accuracy
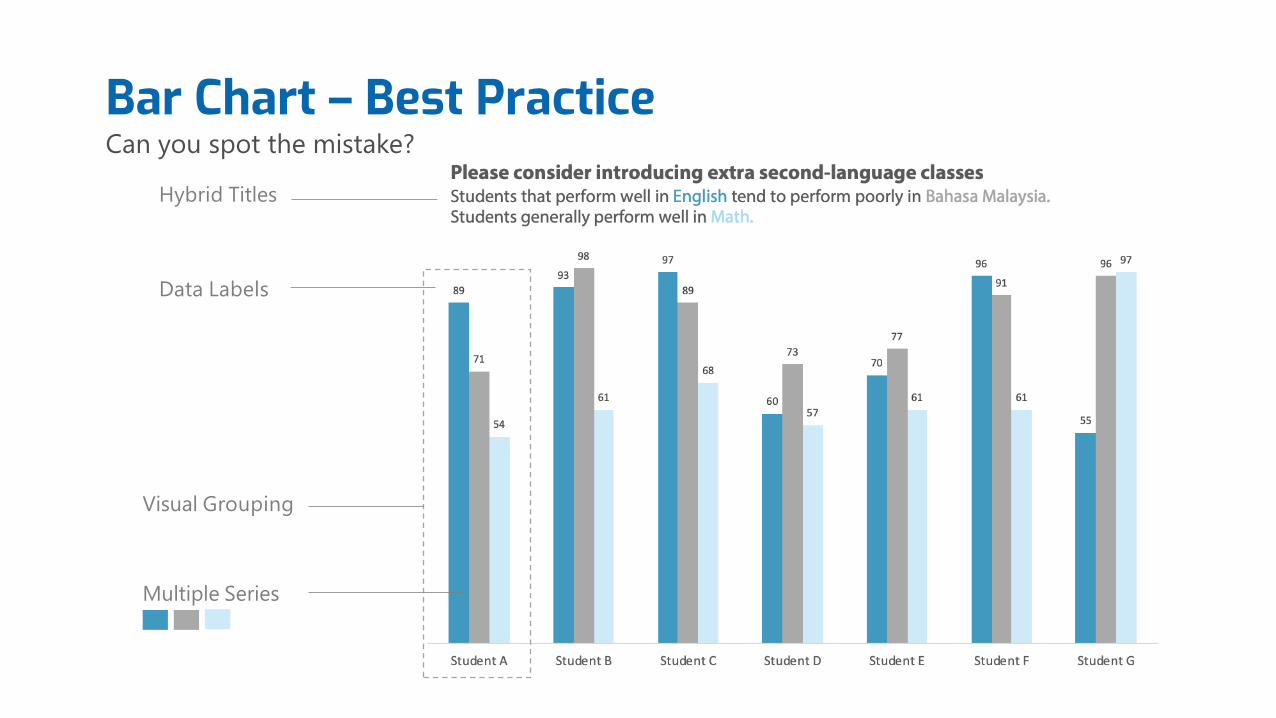
Visual Grouping
Data Labels
Bar Chart – Best PracticeCan you spot the mistake?
Hybrid Titles
Multiple Series
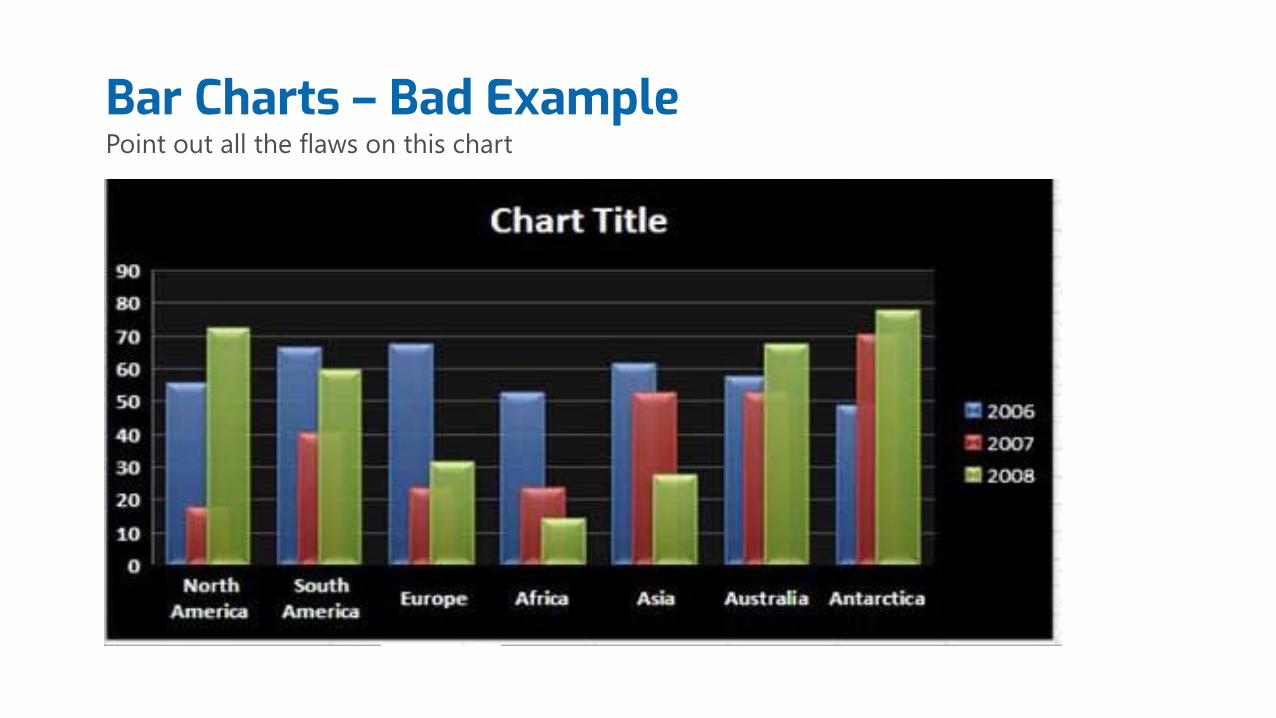
Bar Charts – Bad ExamplePoint out all the flaws on this chart
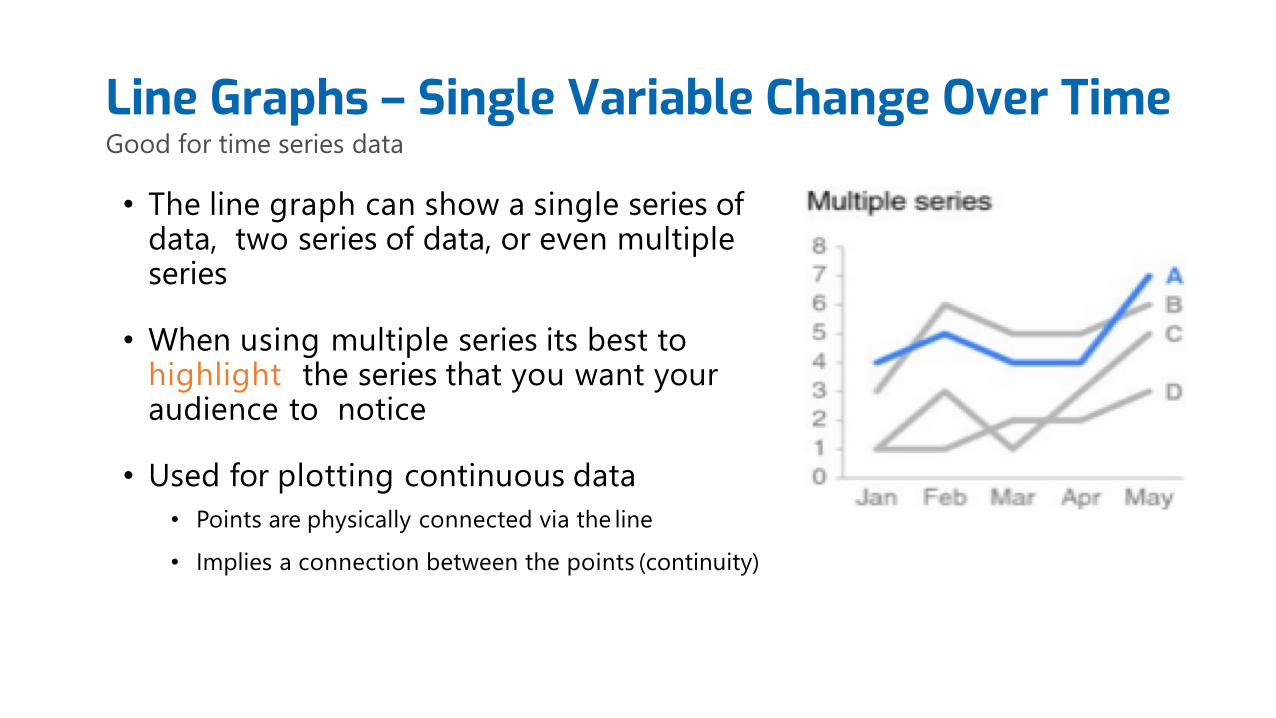
• The line graph can show a single series ofdata, two series of data, or even multipleseries
• When using multiple series its best tohighlight the series that you want your audience to notice
• Used for plotting continuous data
• Points are physically connected via the line
• Implies a connection between the points (continuity)
Line Graphs – Single Variable Change Over TimeGood for time series data
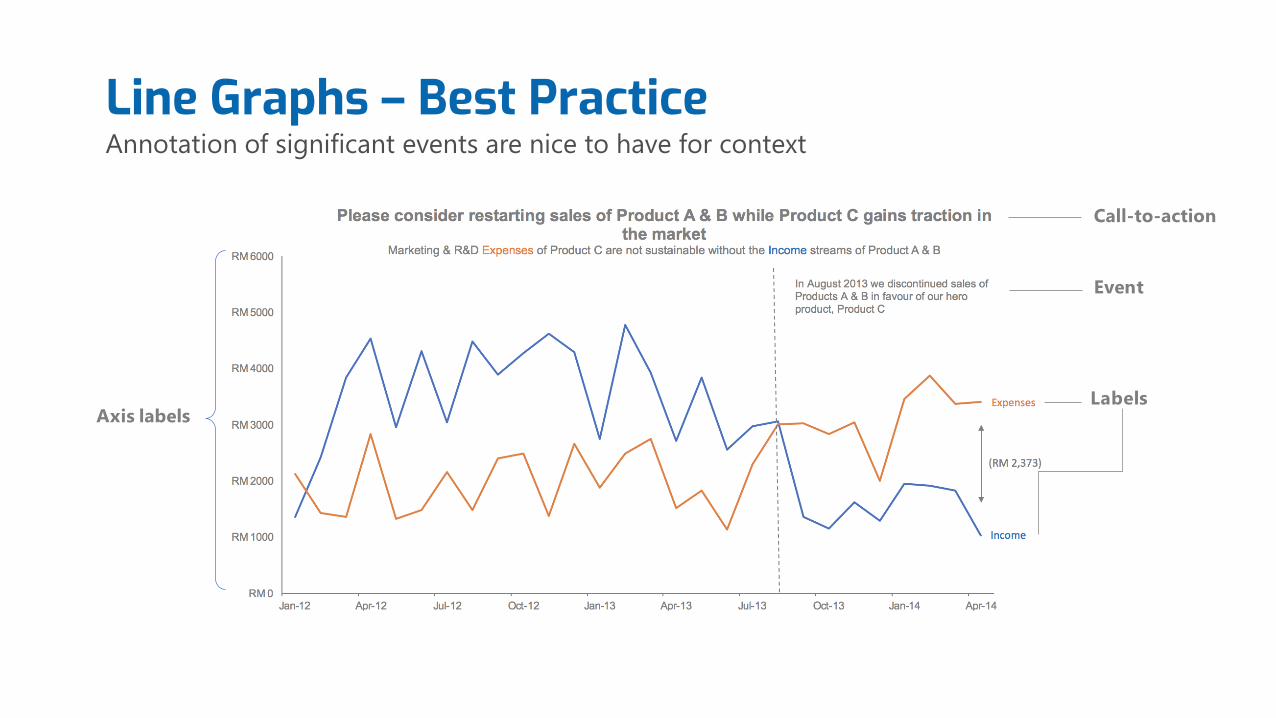
Labels
Event
Call-to-action
Axis labels
Line Graphs – Best PracticeAnnotation of significant events are nice to have for context
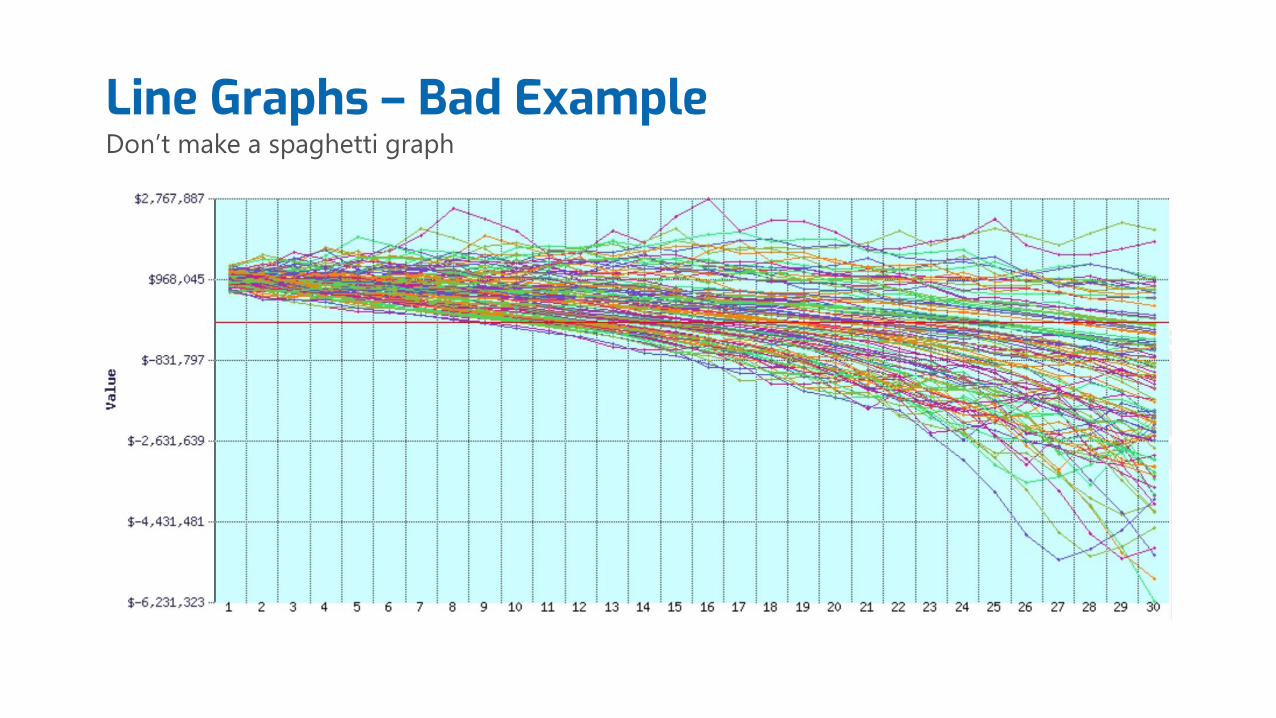
Line Graphs – Bad ExampleDon’t make a spaghetti graph
0
2
4
6
8
10
12
14
16
18
20
Cat
1
Cat
2
Cat
4
Cat
5
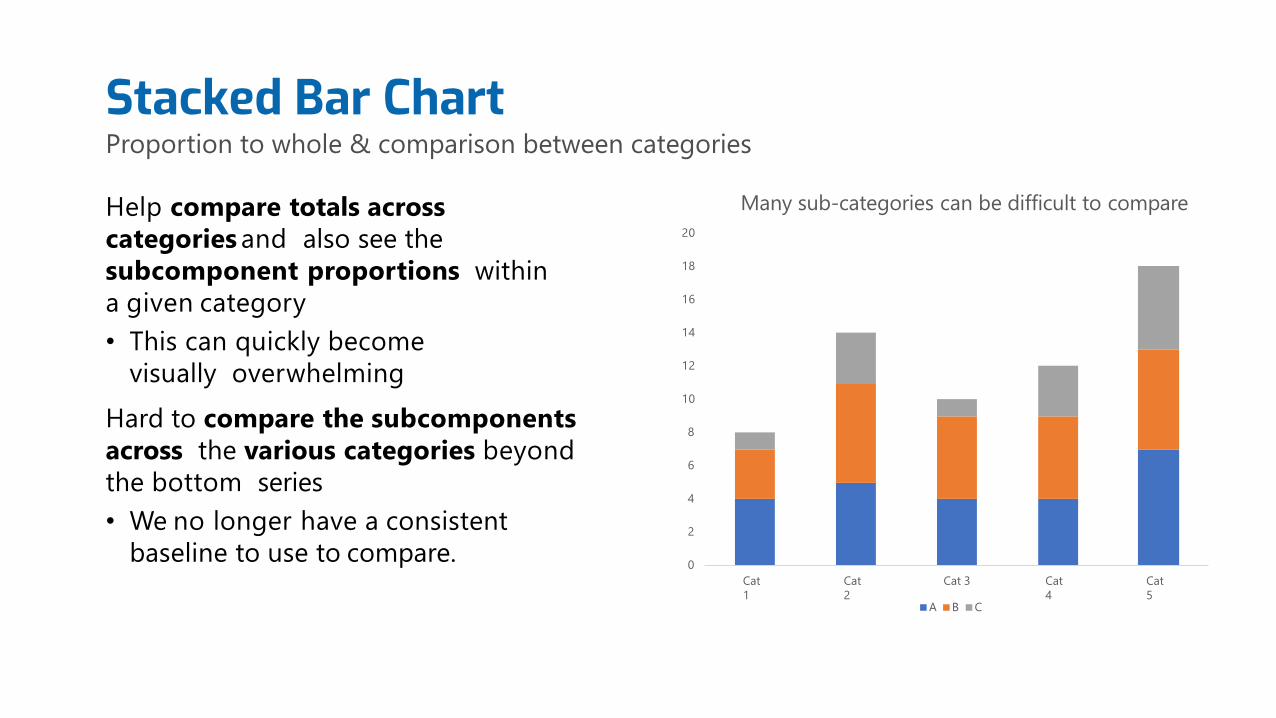
Many sub-categories can be difficult to compare
Cat 3
A B C
Help compare totals across
categories and also see the
subcomponent proportions within
a given category
• This can quickly become
visually overwhelming
Hard to compare the subcomponents
across the various categories beyond
the bottom series
• We no longer have a consistent
baseline to use to compare.
Stacked Bar ChartProportion to whole & comparison between categories
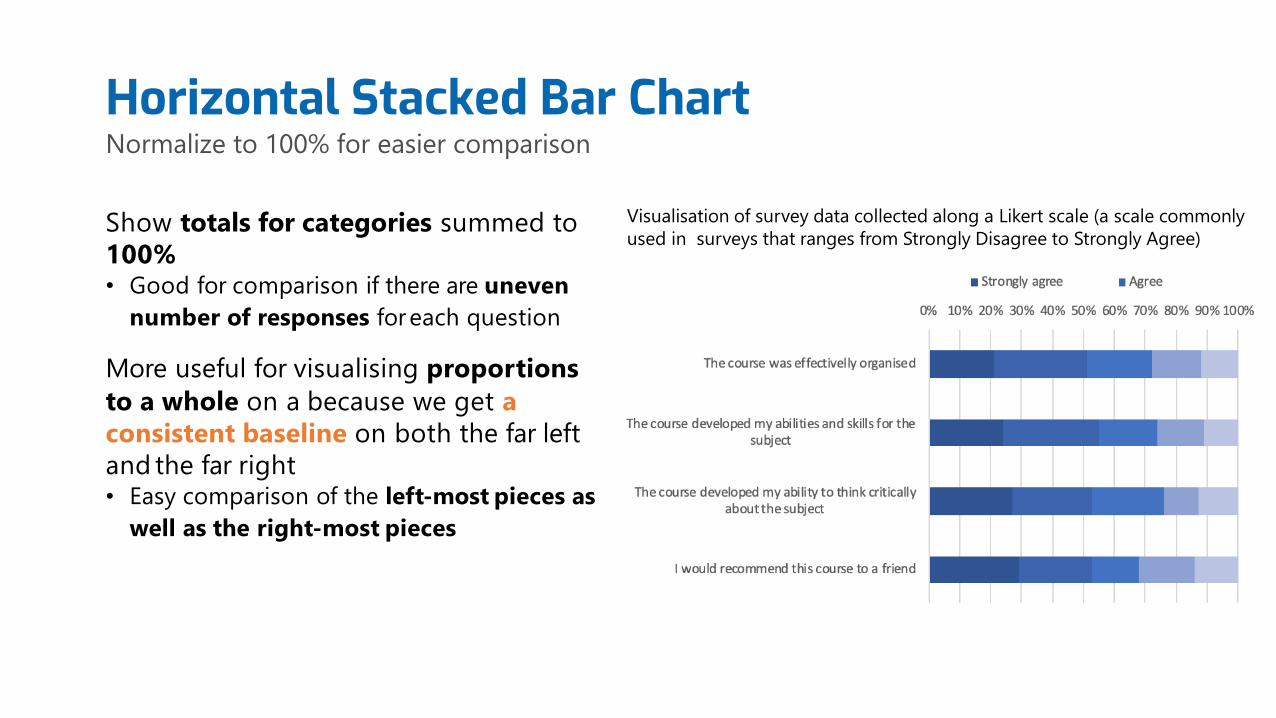
Show totals for categories summed to
100%• Good for comparison if there are uneven
number of responses foreach question
More useful for visualising proportions
to a whole on a because we get a
consistent baseline on both the far left
and the far right• Easy comparison of the left‐most pieces as
well as the right‐most pieces
Visualisation of survey data collected along a Likert scale (a scale commonly
used in surveys that ranges from Strongly Disagree to Strongly Agree)
Horizontal Stacked Bar ChartNormalize to 100% for easier comparison
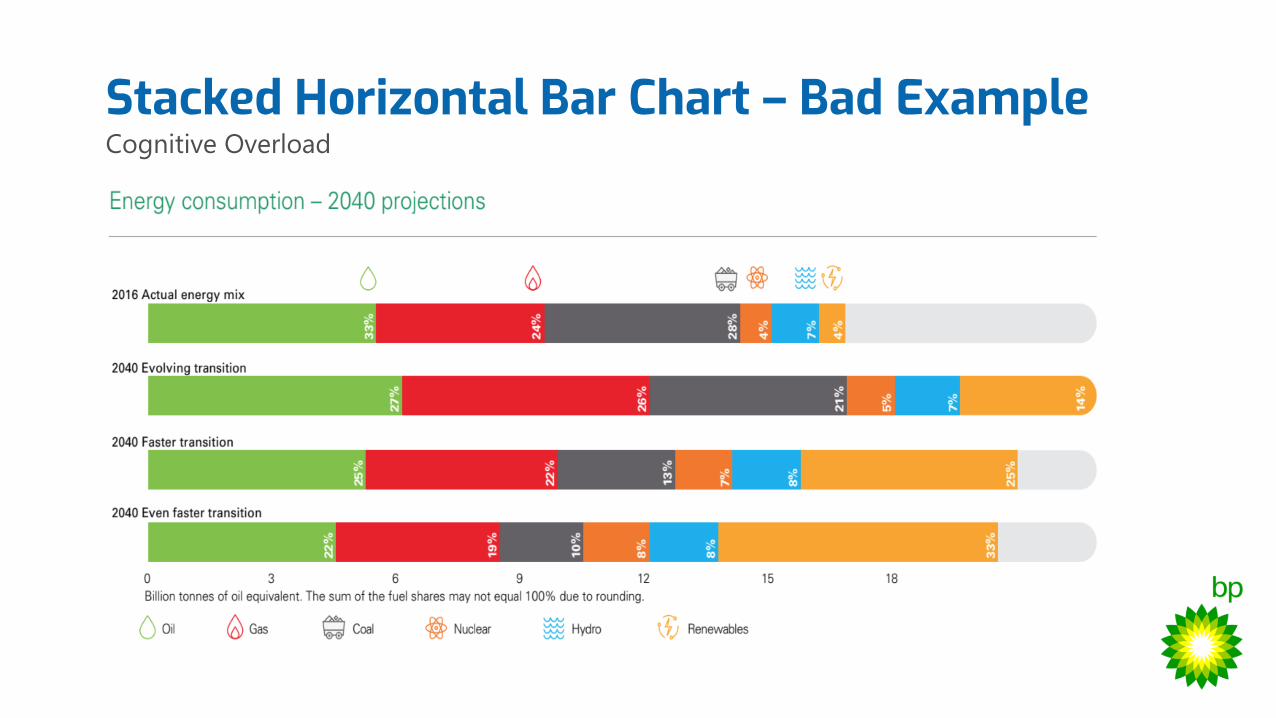
Stacked Horizontal Bar Chart – Bad ExampleCognitive Overload
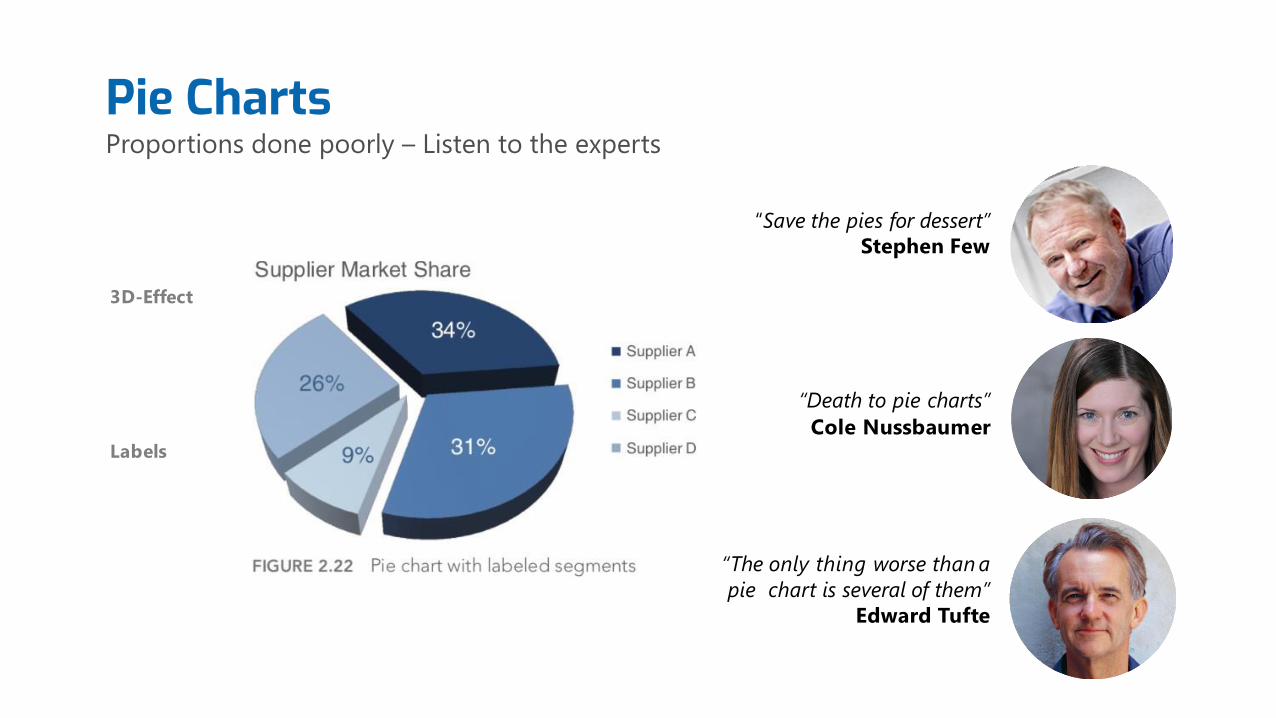
“Save the pies for dessert”
Stephen Few
“Death to pie charts”
Cole Nussbaumer
“The only thing worse than a
pie chart is several of them”
Edward Tufte
3D-Effect
Labels
Pie ChartsProportions done poorly – Listen to the experts
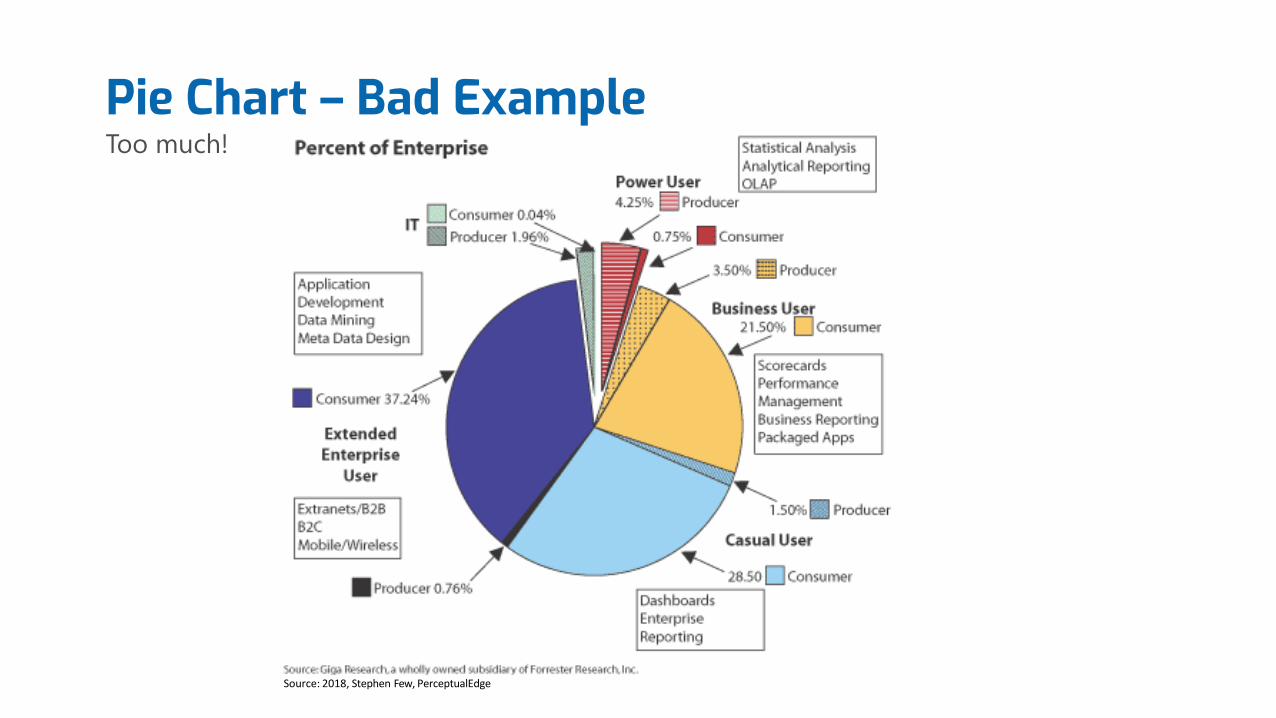
Source: 2018, Stephen Few, PerceptualEdge
Pie Chart – Bad ExampleToo much!
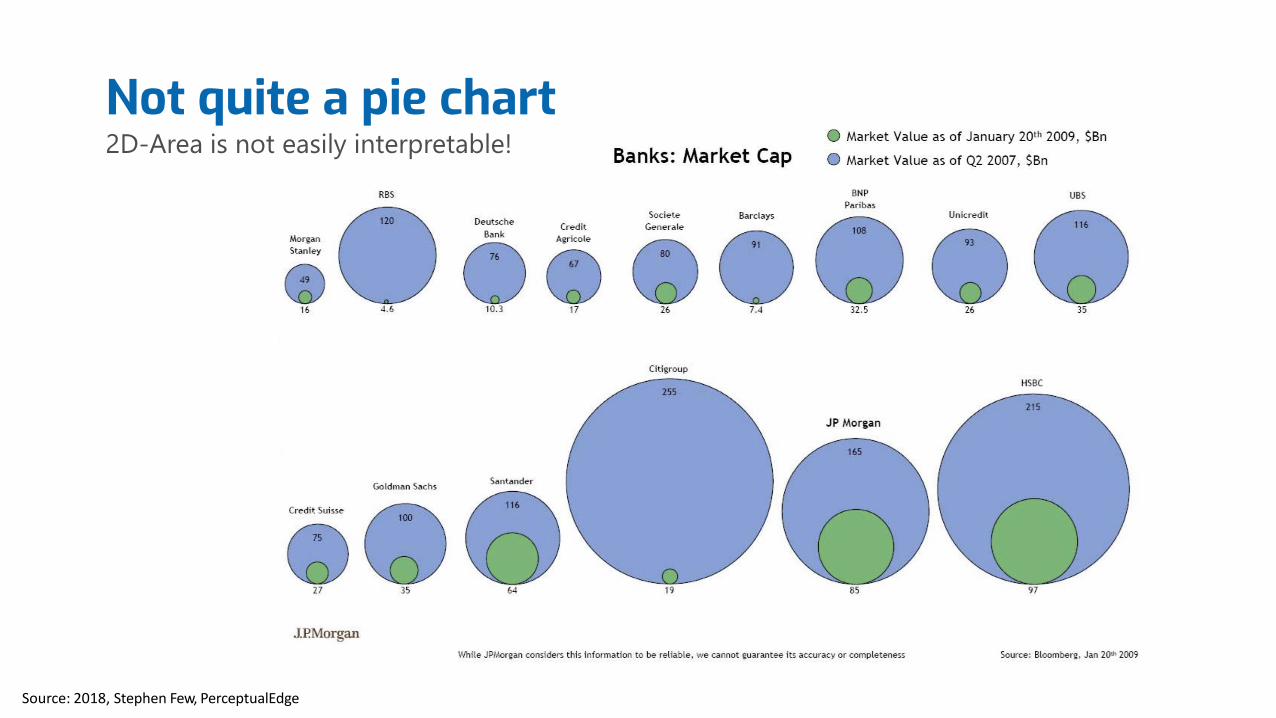
Source: 2018, Stephen Few, PerceptualEdge
Not quite a pie chart2D-Area is not easily interpretable!
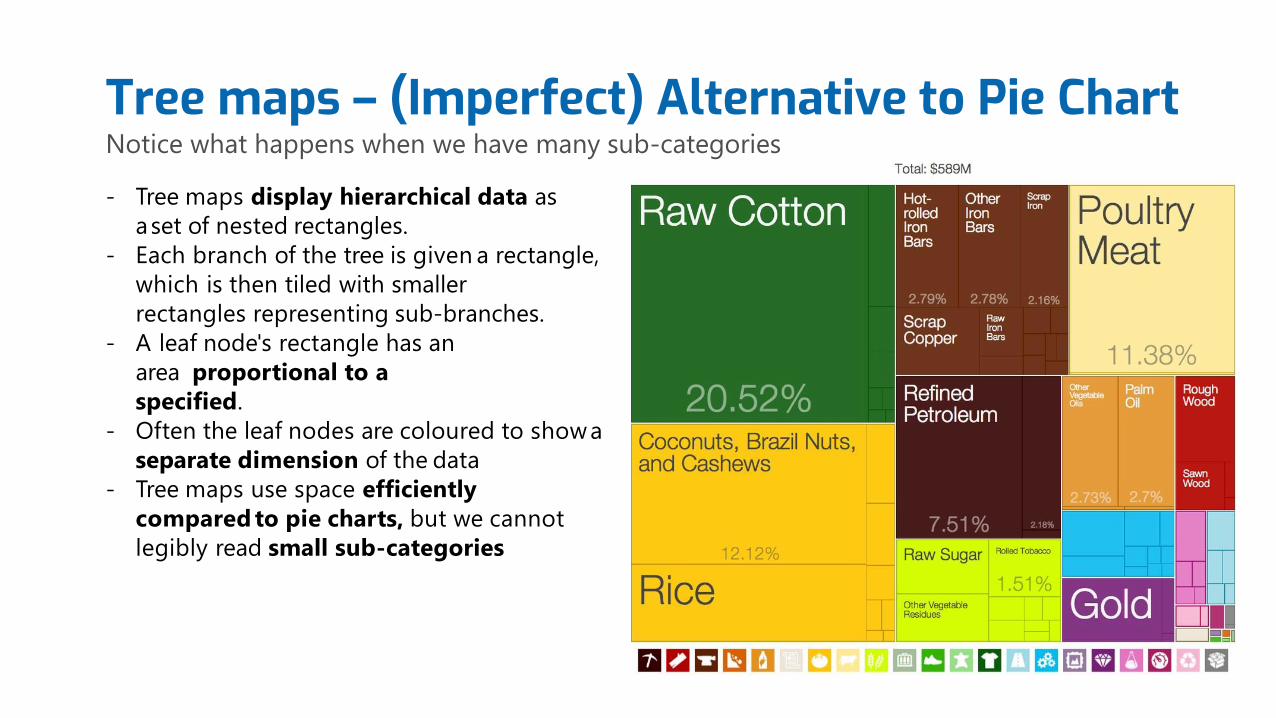
- Tree maps display hierarchical data as
aset of nested rectangles.
- Each branch of the tree is given a rectangle,
which is then tiled with smaller
rectangles representing sub-branches.
- A leaf node's rectangle has an
area proportional to a
specified.
- Often the leaf nodes are coloured to showa
separate dimension of the data
- Tree maps use space efficiently
compared to pie charts, but we cannot
legibly read small sub-categories
Tree maps – (Imperfect) Alternative to Pie ChartNotice what happens when we have many sub-categories
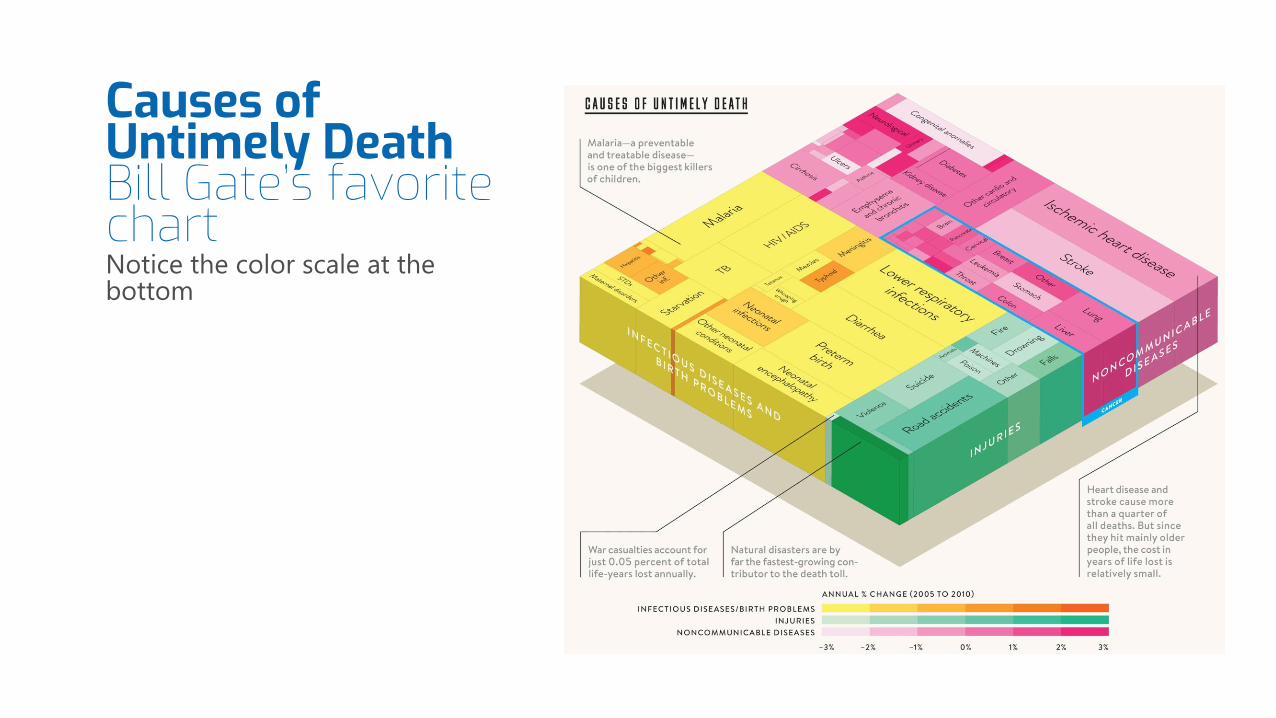
Causes of Untimely Death Bill Gate’s favorite chartNotice the color scale at the bottom
Source: https://www.urban.org/data-viz
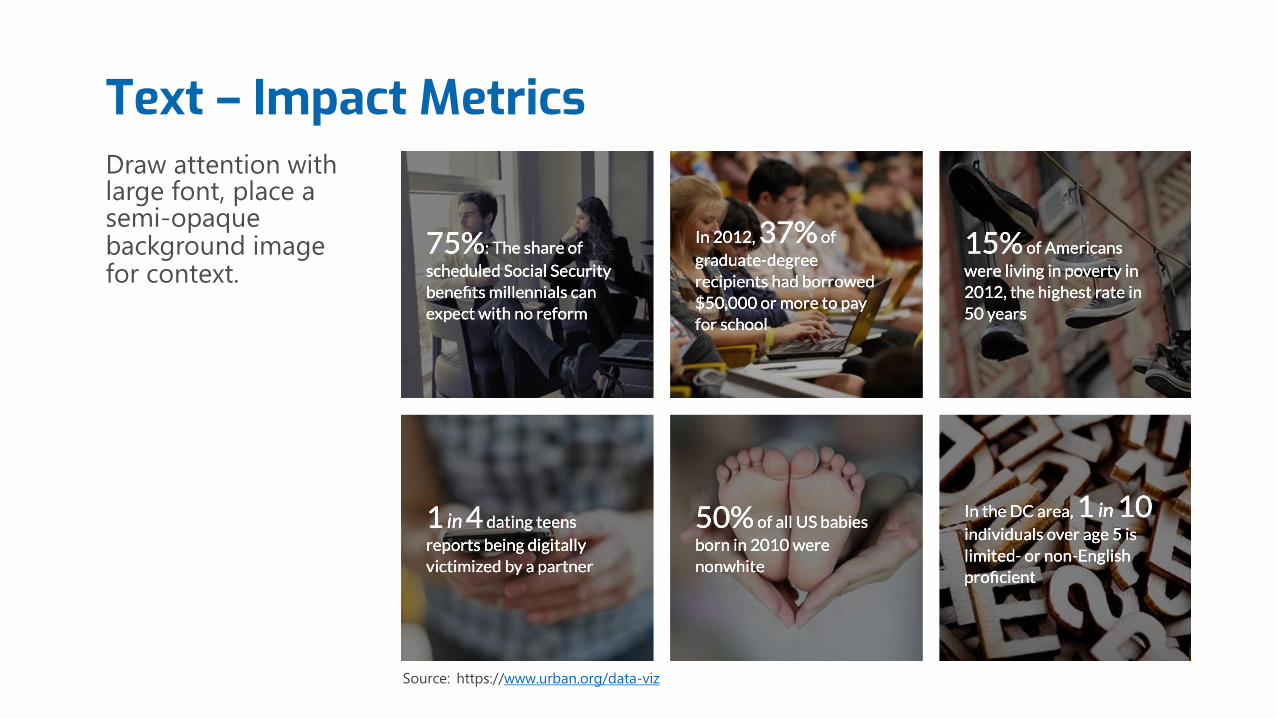
Text – Impact MetricsDraw attention with large font, place a semi-opaque background image for context.
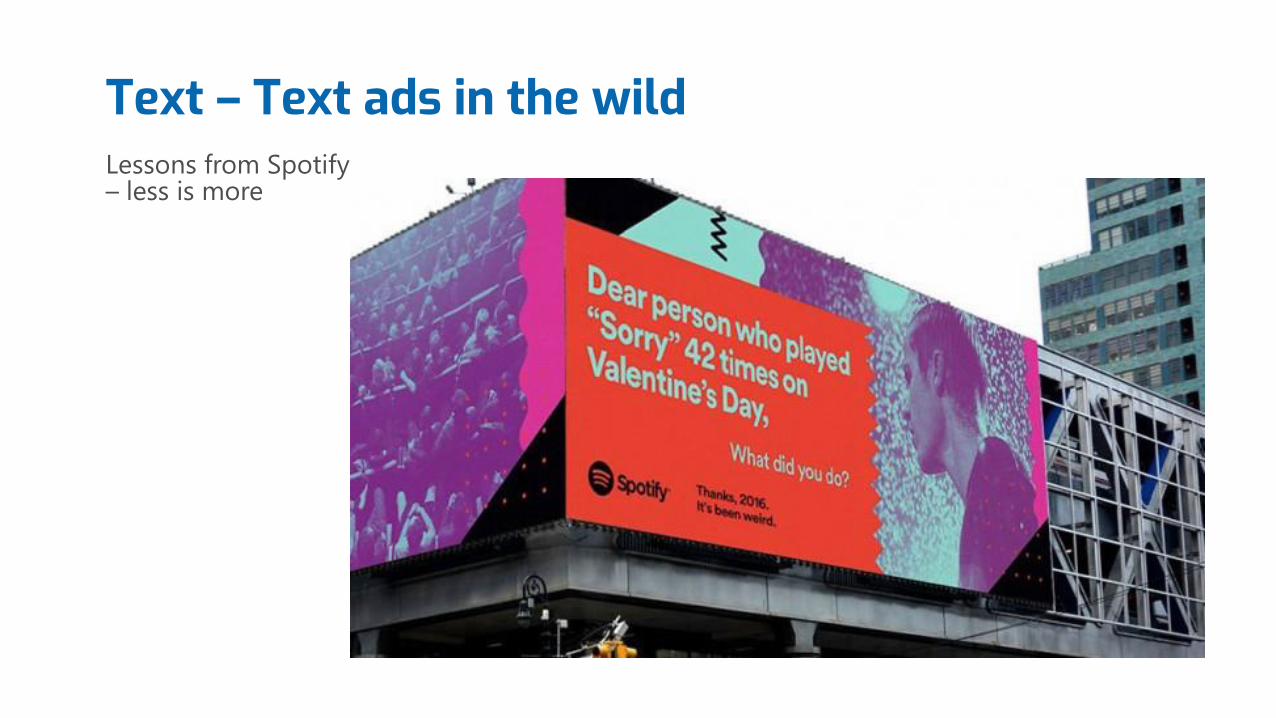
Text – Text ads in the wildLessons from Spotify – less is more
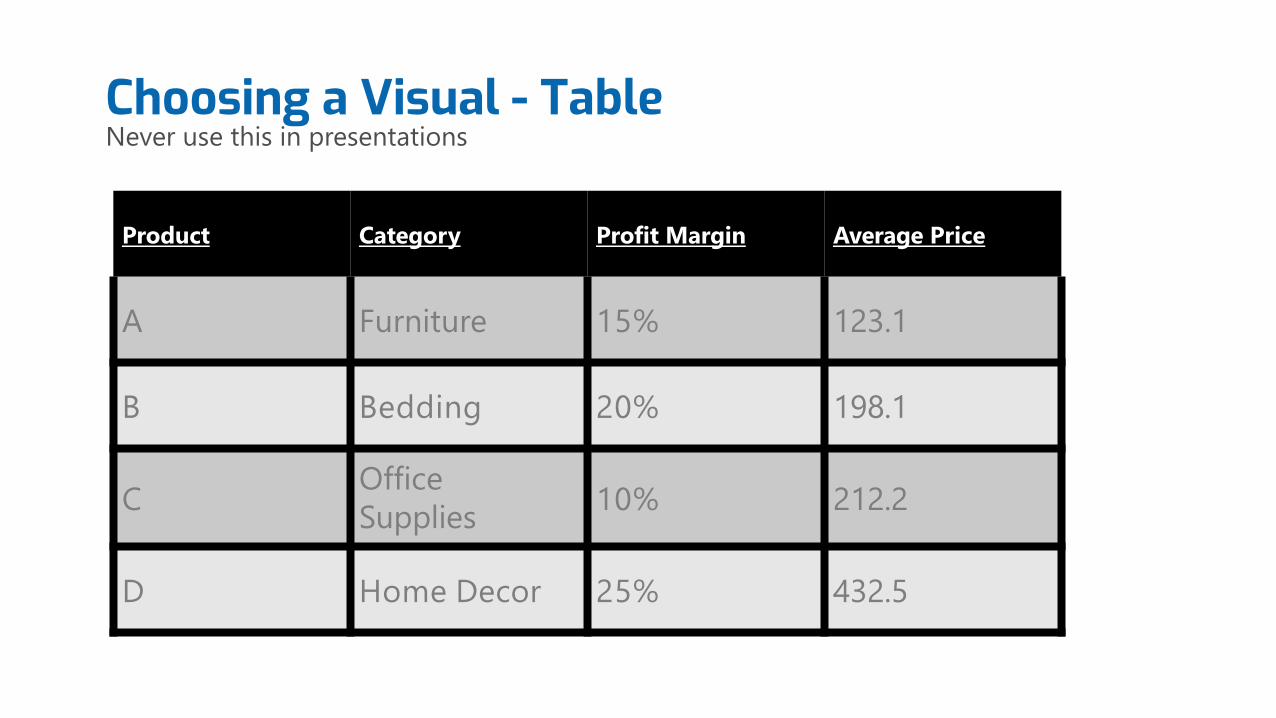
Product Category Profit Margin Average Price
A Furniture 15% 123.1
B Bedding 20% 198.1
COffice
Supplies10% 212.2
D Home Decor 25% 432.5
Choosing a Visual - TableNever use this in presentations
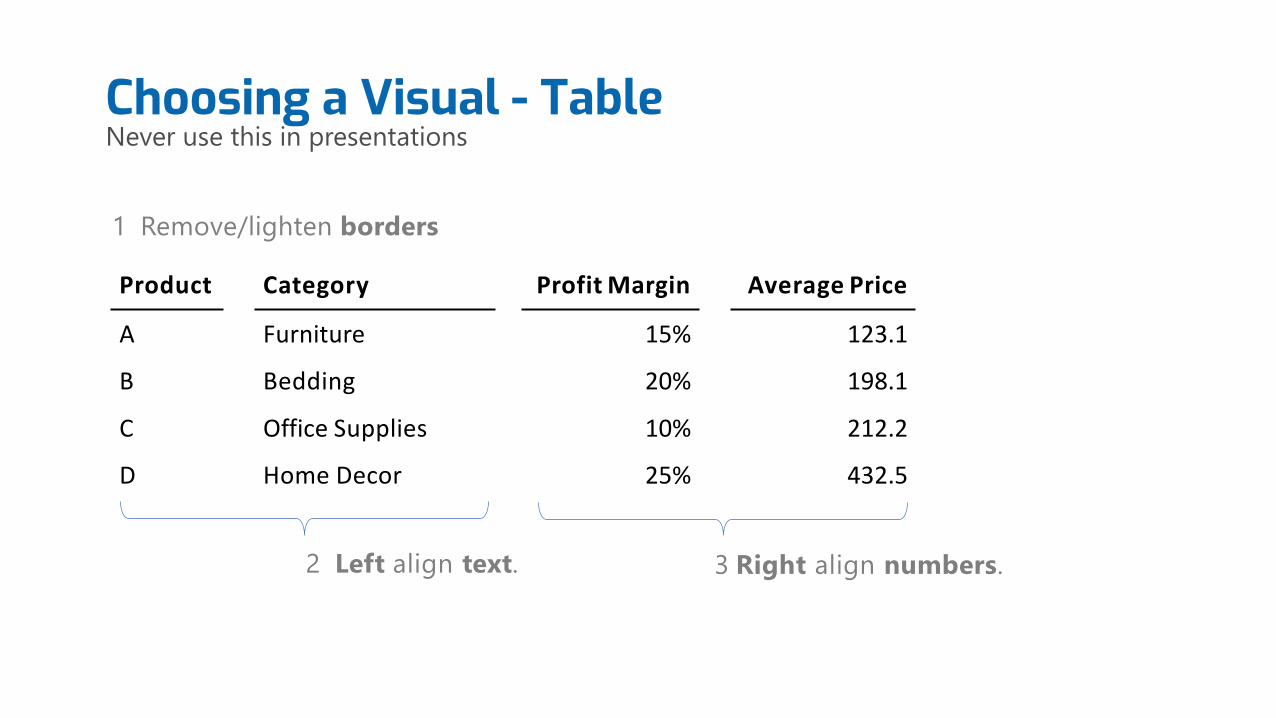
Product Category Profit Margin Average Price
A Furniture 15% 123.1
B Bedding 20% 198.1
C Office Supplies 10% 212.2
D Home Decor 25% 432.5
2 Left align text. 3 Right align numbers.
1 Remove/lighten borders
Choosing a Visual - TableNever use this in presentations
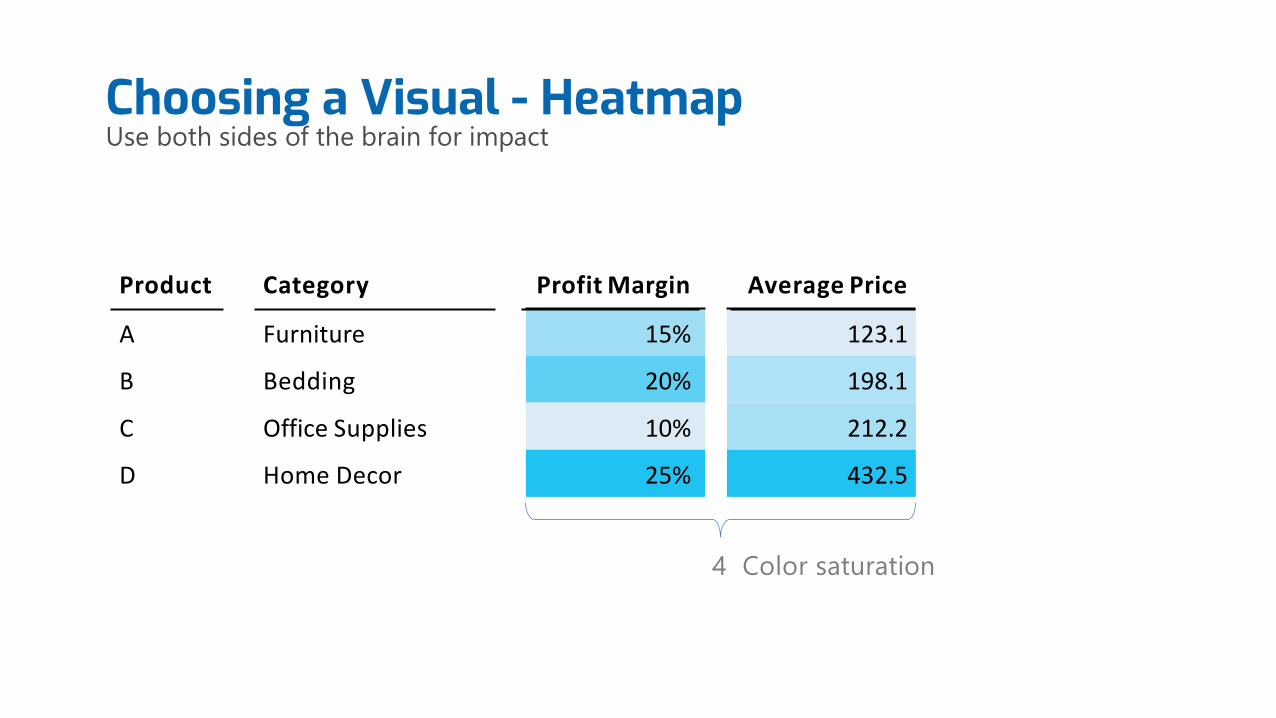
4 Color saturation
Choosing a Visual - HeatmapUse both sides of the brain for impact
Product Category Profit Margin Average Price
A Furniture 15% 123.1
B Bedding 20% 198.1
C Office Supplies 10% 212.2
D Home Decor 25% 432.5
Pre-attentive attributes
Two dimensions maximum
Use color to differentiate
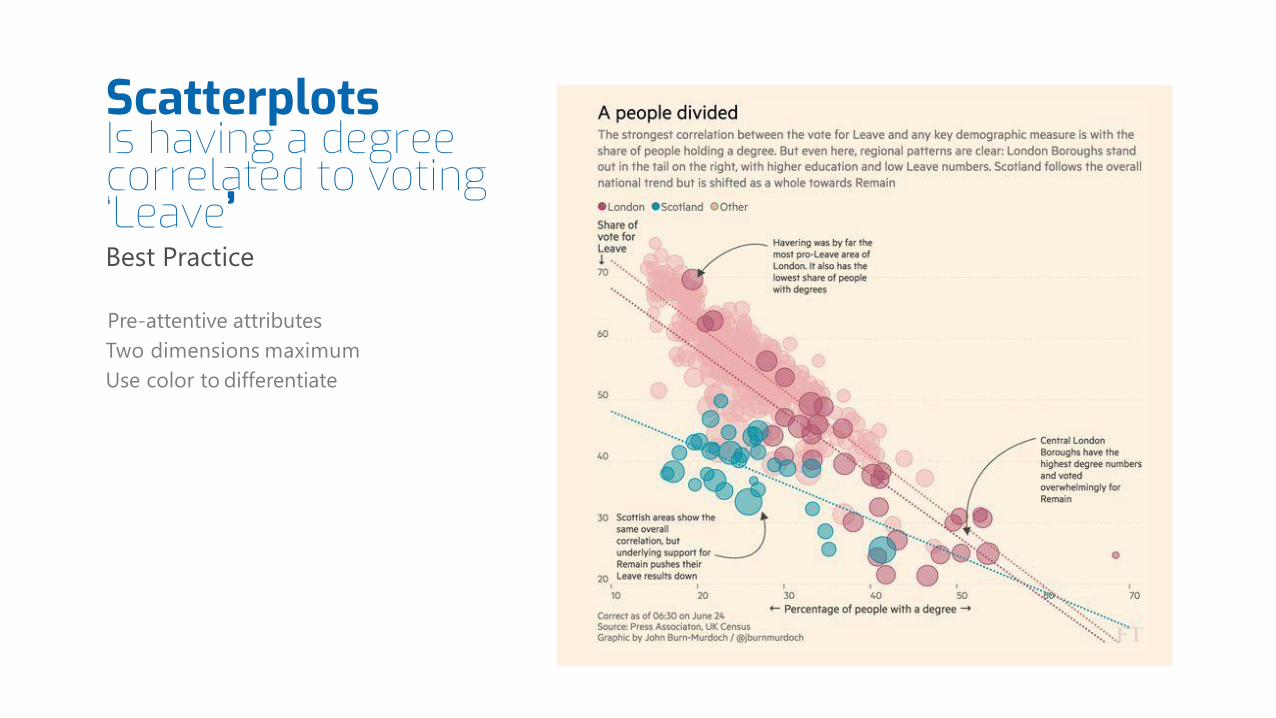
Scatterplots Is having a degree correlated to voting ‘Leave’Best Practice
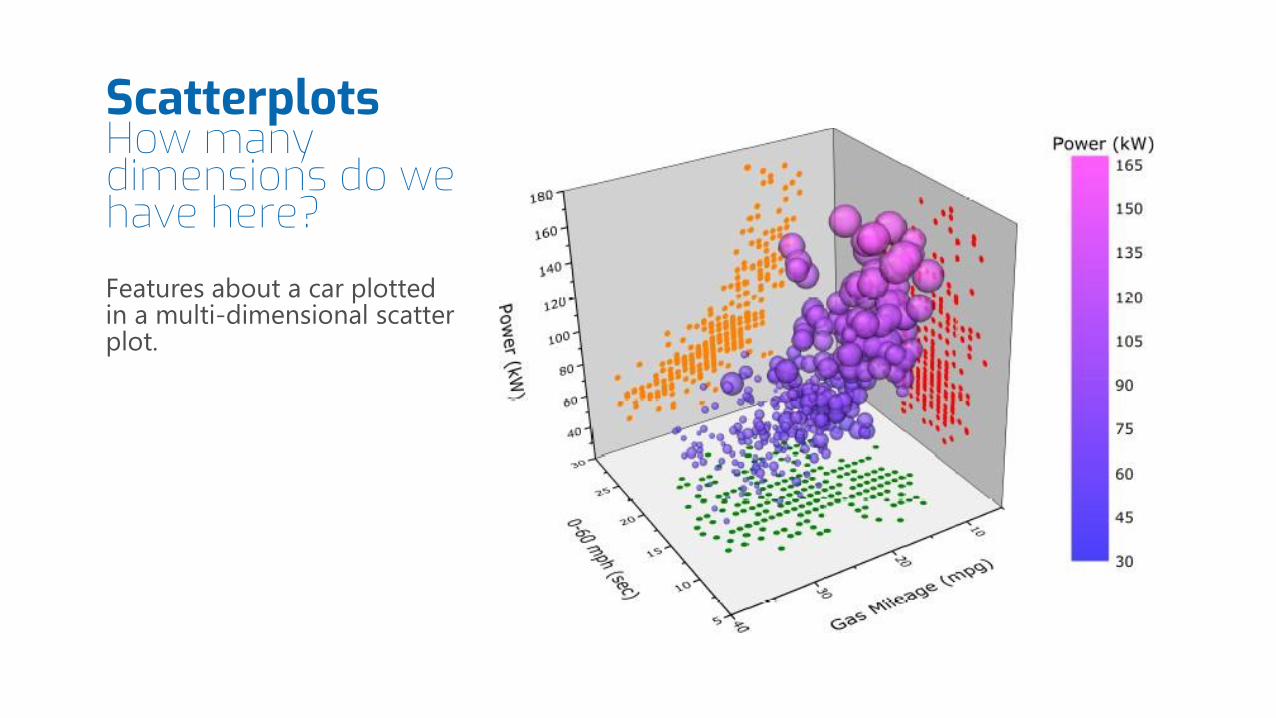
Scatterplots How many dimensions do we have here?Features about a car plotted in a multi-dimensional scatter plot.
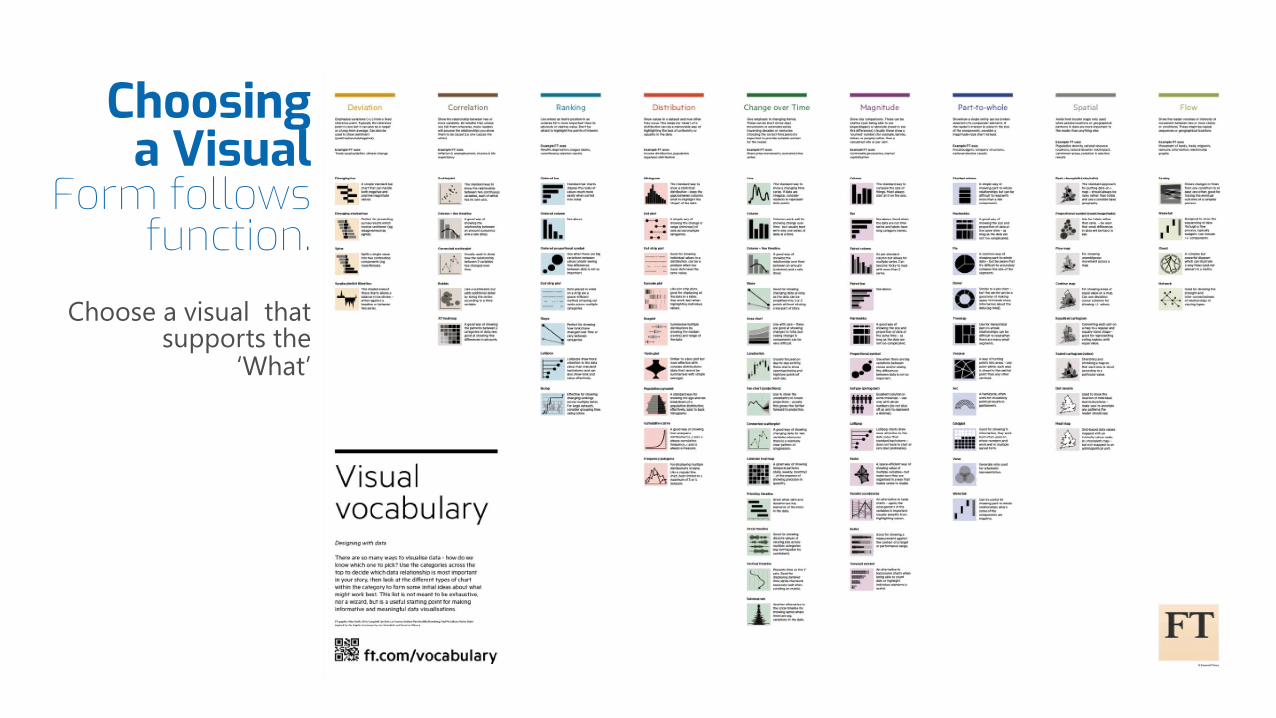
Choosing a Visual
Form followsfunction.
Choose a visual that supports the
‘What’
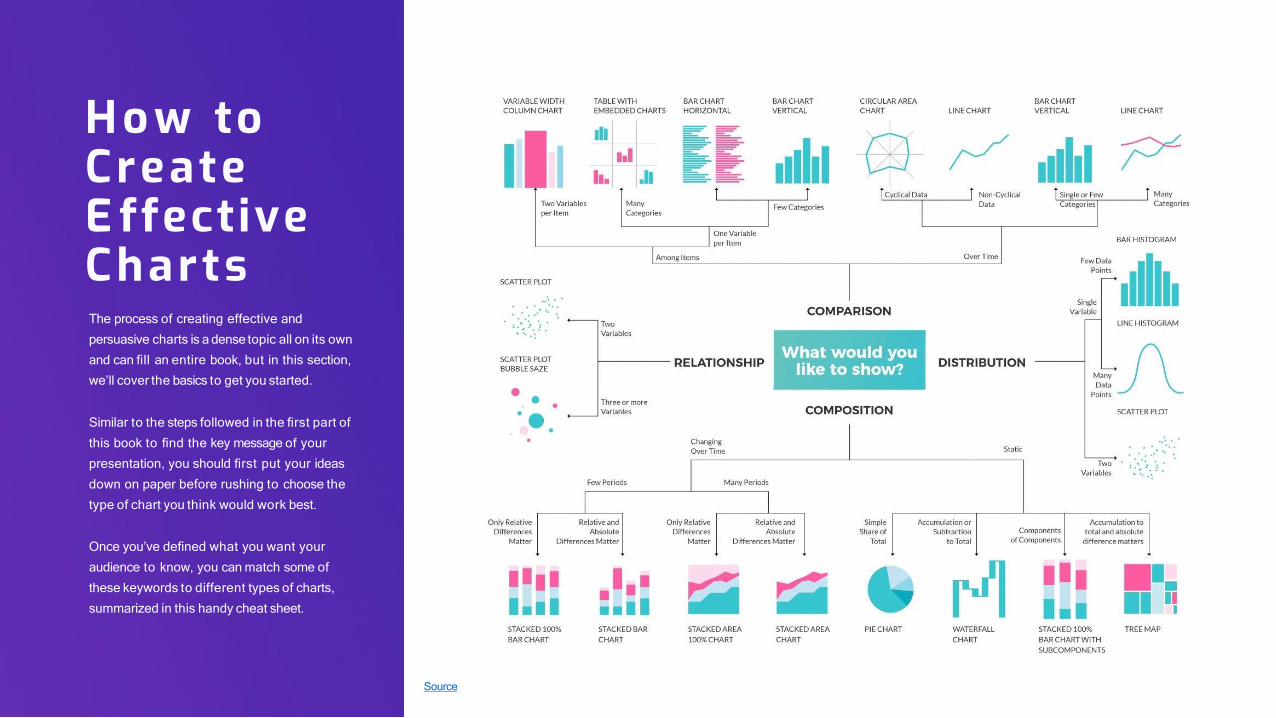
The process of creating effective and
persuasive charts is a dense topic all on its own
and can fill an entire book, but in this section,
we’ll cover the basics to get you started.
Similar to the steps followed in the first part of
this book to find the key message of your
presentation, you should first put your ideas
down on paper before rushing to choose the
type of chart you think would work best.
Once you’ve defined what you want your
audience to know, you can match some of
these keywords to different types of charts,
summarized in this handy cheat sheet.
How to Create E ffective Charts
Source
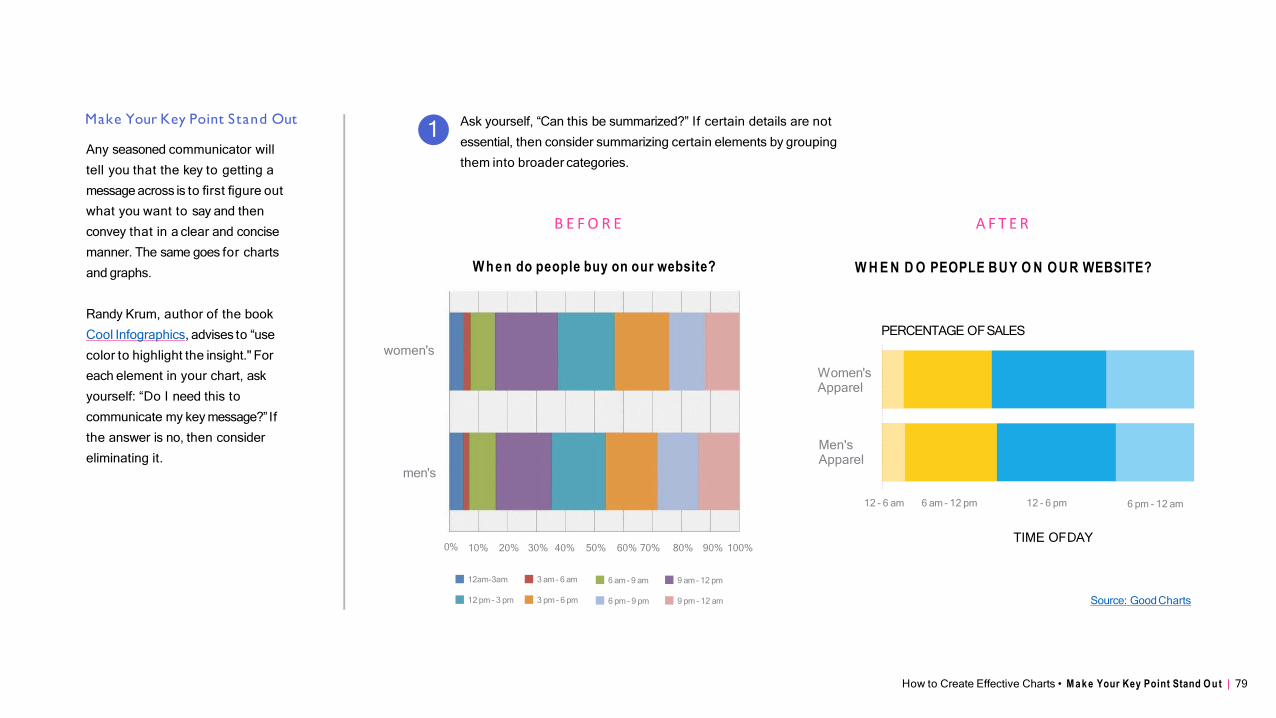
How to Create Effective Charts • M ake Your Key Point Stand O ut | 79
Make Your Key Point Stand Out
Any seasoned communicator will
tell you that the key to getting a
message across is to first figure out
what you want to say and then
convey that in a clear and concise
manner. The same goes for charts
and graphs.
Randy Krum, author of the book
Cool Infographics, advises to “use
color to highlight the insight." For
each element in your chart, ask
yourself: “Do I need this to
communicate my key message?” If
the answer is no, then consider
eliminating it.
A F T E RB E F O R E
Ask yourself, “Can this be summarized?” If certain details are not
essential, then consider summarizing certain elements by grouping
them into broader categories.
1
W he n do people buy on our website?
women's
men's
0% 10% 20% 30% 40% 50% 60% 70% 80% 90% 100%
W H E N D O PEOPLE BUY O N O U R WEBSITE?
12am-3am 3 am- 6 am 6 am- 9 am 9 am- 12 pm
12 pm - 3 pm 3 pm - 6 pm 6 pm - 9 pm 9 pm - 12 am
PERCENTAGE OFSALES
Women's Apparel
Men's Apparel
12 - 6 am 6 am - 12 pm 12 - 6 pm 6 pm - 12 am
TIME OFDAY
Source: GoodCharts
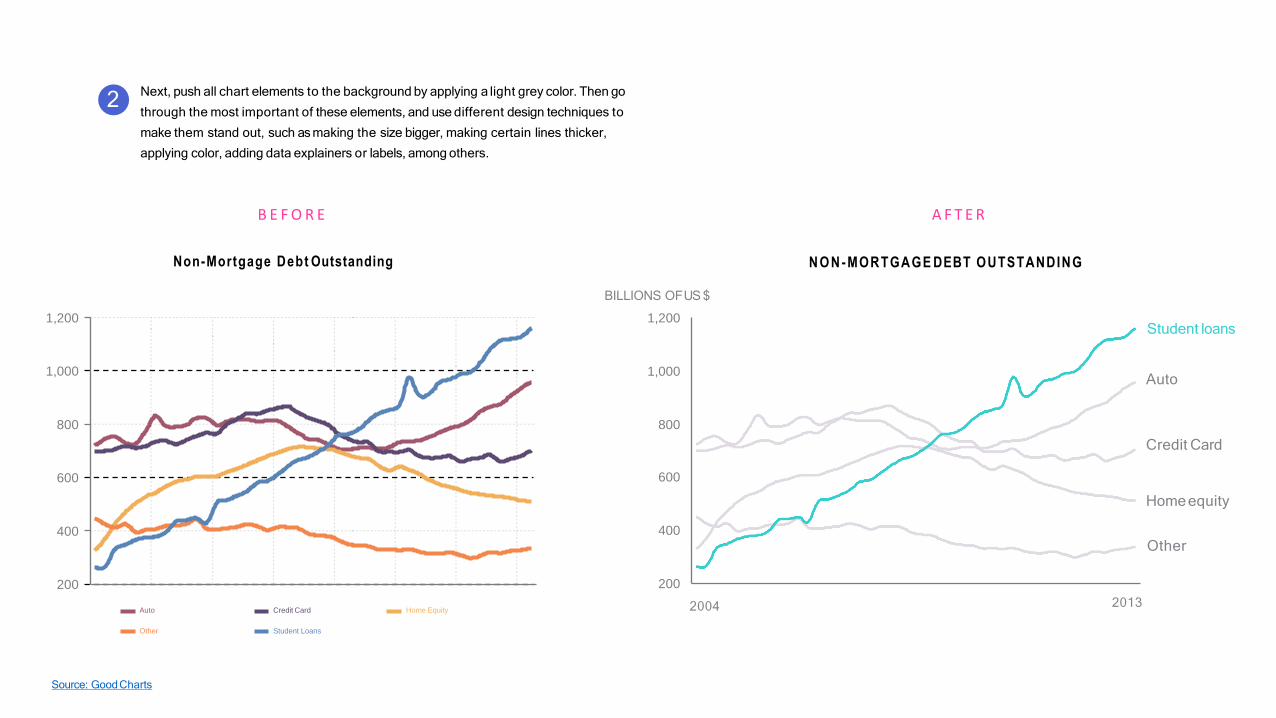
A F T E RB E F O R E
Next, push all chart elements to the background by applying a light grey color. Then go
through the most important of these elements, and use different design techniques to
make them stand out, such as making the size bigger, making certain lines thicker,
applying color, adding data explainers or labels, among others.
2
N O N -MORTGAGE DEBT OUTSTANDING
400
600
800
1,000
1,200
200
Auto Credit Card Home Equity
Other Student Loans
Non-Mortgage Debt Outstanding
200
Source: GoodCharts
400
600
800
1,000
1,200
2004
BILLIONS OFUS $
2013
Auto
Credit Card
Home equity
Other
Student loans
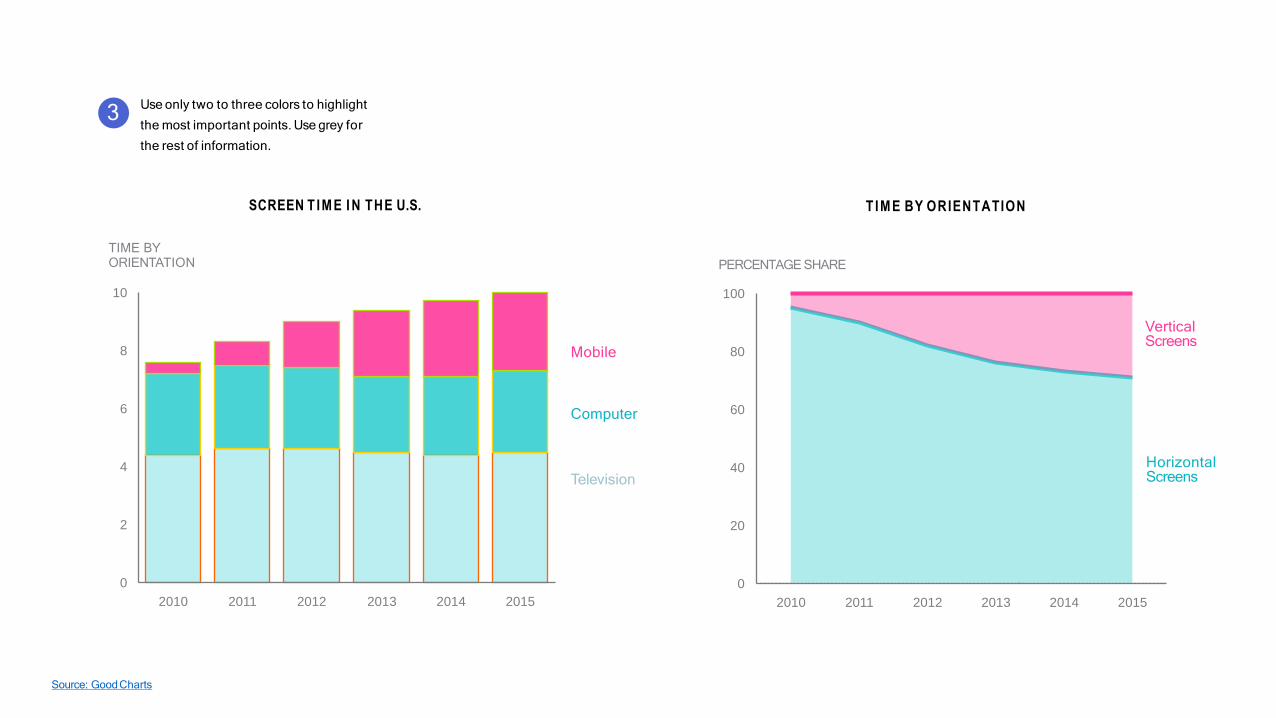
2010 2011 2012 2013 2014 2015
0
2
4
6
8
10
Use only two to three colors to highlight
the most important points. Use grey for
the rest of information.
3
T IME BY ORIENTATIONSCREEN T IME I N THE U.S.
TIME BY ORIENTATION
Mobile
Computer
Television
2010
Source: GoodCharts
2011 2012 2013 2014 2015
0
20
40
60
80
100
PERCENTAGE SHARE
Vertical Screens
Horizontal Screens
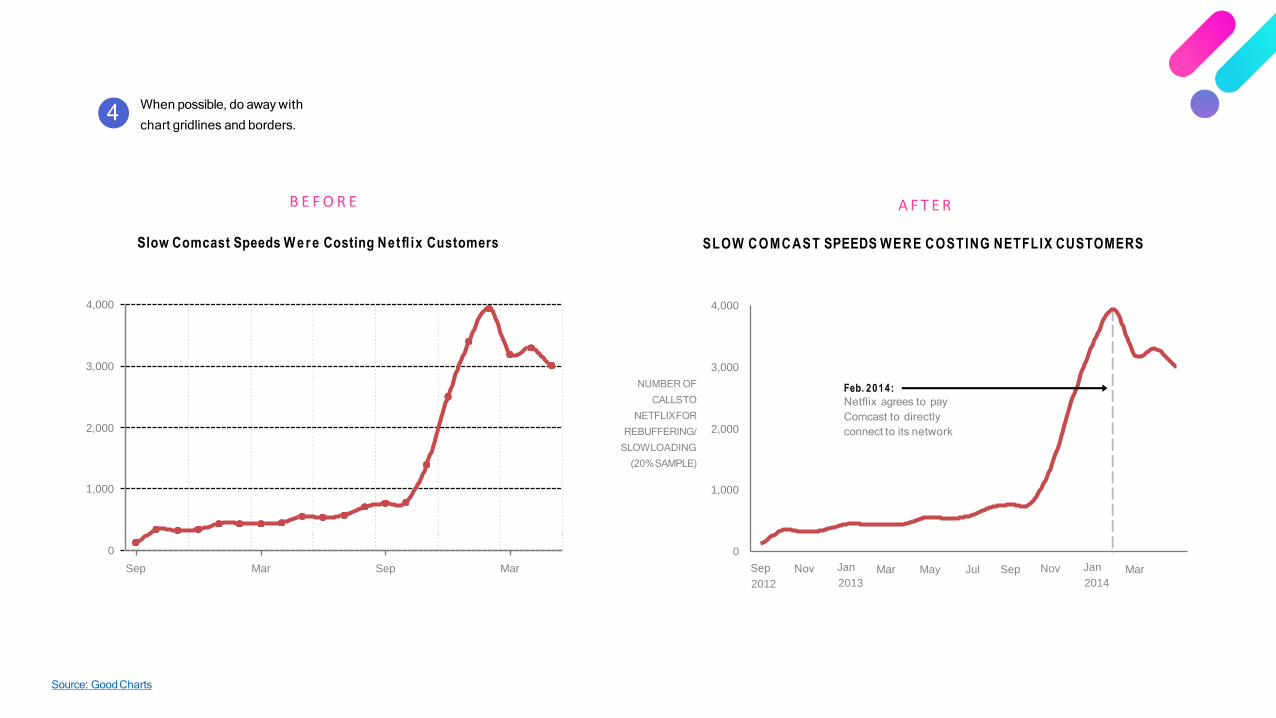
Sep
2012
When possible, do away with
chart gridlines and borders.4
SLOW COMCAST SPEEDS WERE COSTING NETFLIX CUSTOMERSSlow Comcast Speeds W e r e Costing Netflix Customers
NUMBER OF
CALLSTO
NETFLIXFOR
REBUFFERING/
SLOWLOADING
(20%SAMPLE)
Sep
Source: GoodCharts
Mar Sep Mar
0
1,000
2,000
3,000
4,000
A F T E RB E F O R E
Mar Jul Sep Mar
0
1,000
2,000
3,000
4,000
Nov Jan
2013
May Nov Jan
2014
Feb. 2014:
Netflix agrees to pay
Comcast to directly
connect to its network
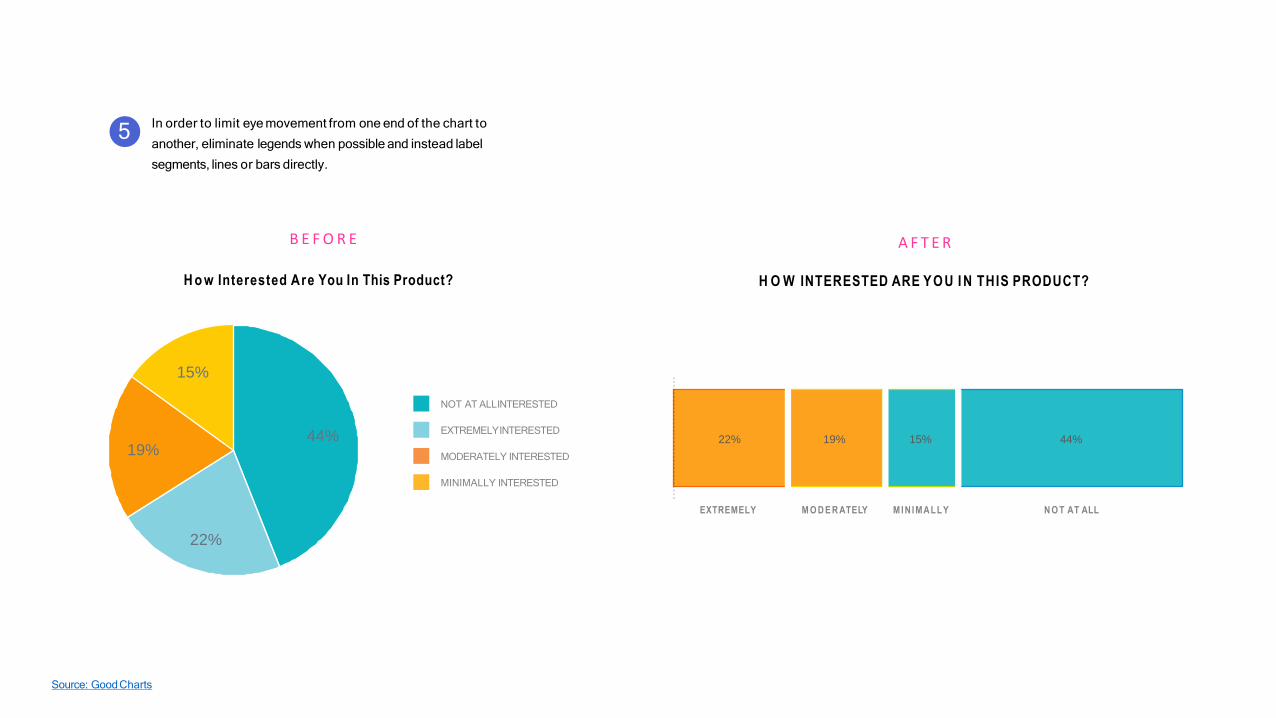
22% 19% 15% 44%
In order to limit eye movement from one end of the chart to
another, eliminate legends when possible and instead label
segments, lines or bars directly.
5
H O W INTERESTED ARE YO U I N THIS PRODUCT?H o w Interested Are You In This Product?
NOT AT ALLINTERESTED
EXTREMELYINTERESTED
MODERATELY INTERESTED
MINIMALLY INTERESTED
A F T E RB E F O R E
EXTREMELY
44%
22%
19%
15%
M O D E R ATELY
Source: GoodCharts
MI NI MALLY N O T AT ALL
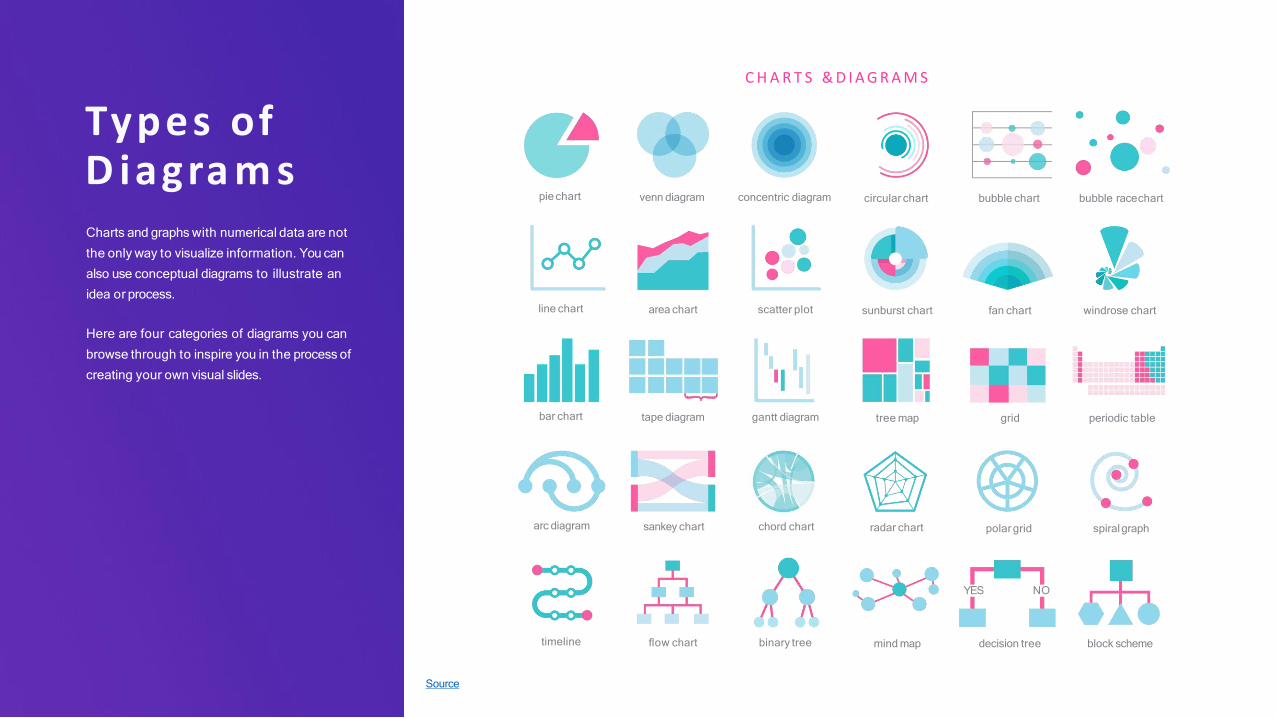
Here are four categories of diagrams you can
browse through to inspire you in the process of
creating your own visual slides.
Types of D iagra m sCharts and graphs with numerical data are not
the only way to visualize information. You can
also use conceptual diagrams to illustrate an
idea or process.
pie chart venn diagram concentric diagram circular chart bubble chart bubble racechart
line chart area chart scatter plot sunburst chart fan chart windrose chart
C H A R T S & D I A G R A M S
bar chart tape diagram gantt diagram tree map grid periodic table
arc diagram sankey chart chord chart
timeline flow chart binary tree mind map decision tree block scheme
radar chart polar grid spiralgraph
YES NO
Source
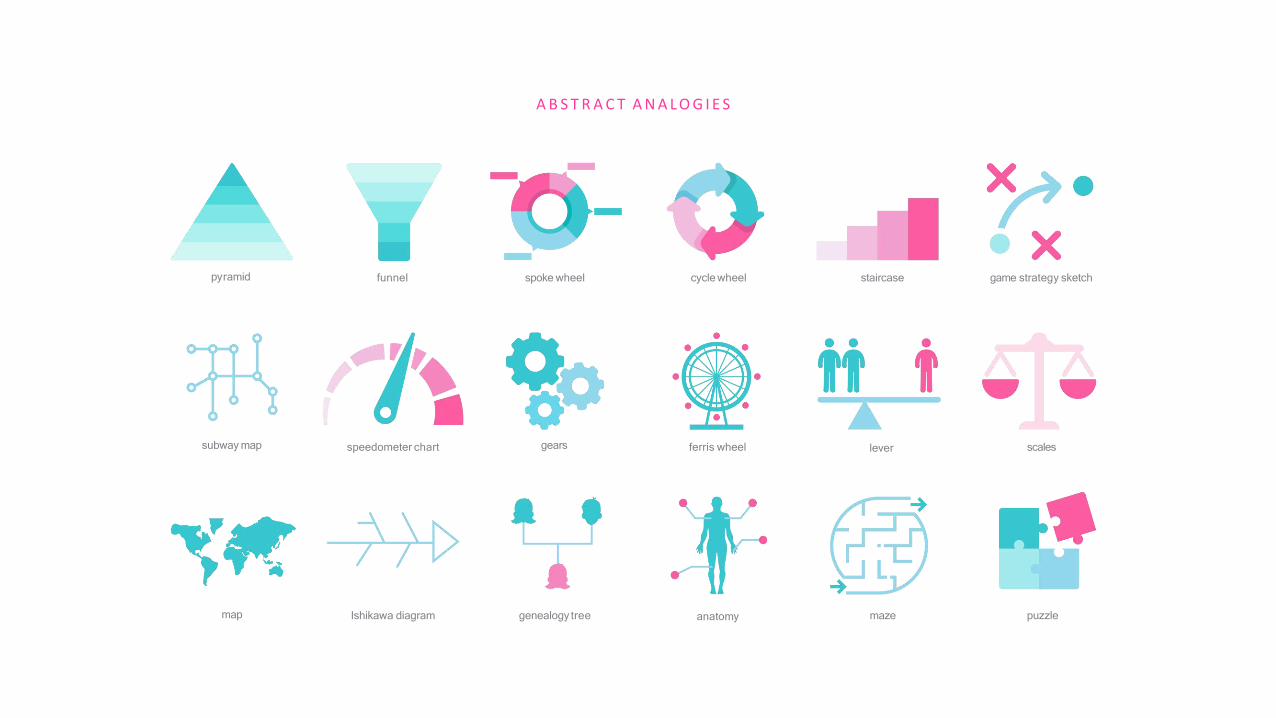
pyramid funnel
A B S T R A C T A N A L O G I E S
subway map speedometer chart
map Ishikawa diagram
gears ferris wheel scaleslever
game strategy sketch
puzzlemaze
staircasespoke wheel cycle wheel
anatomygenealogy tree
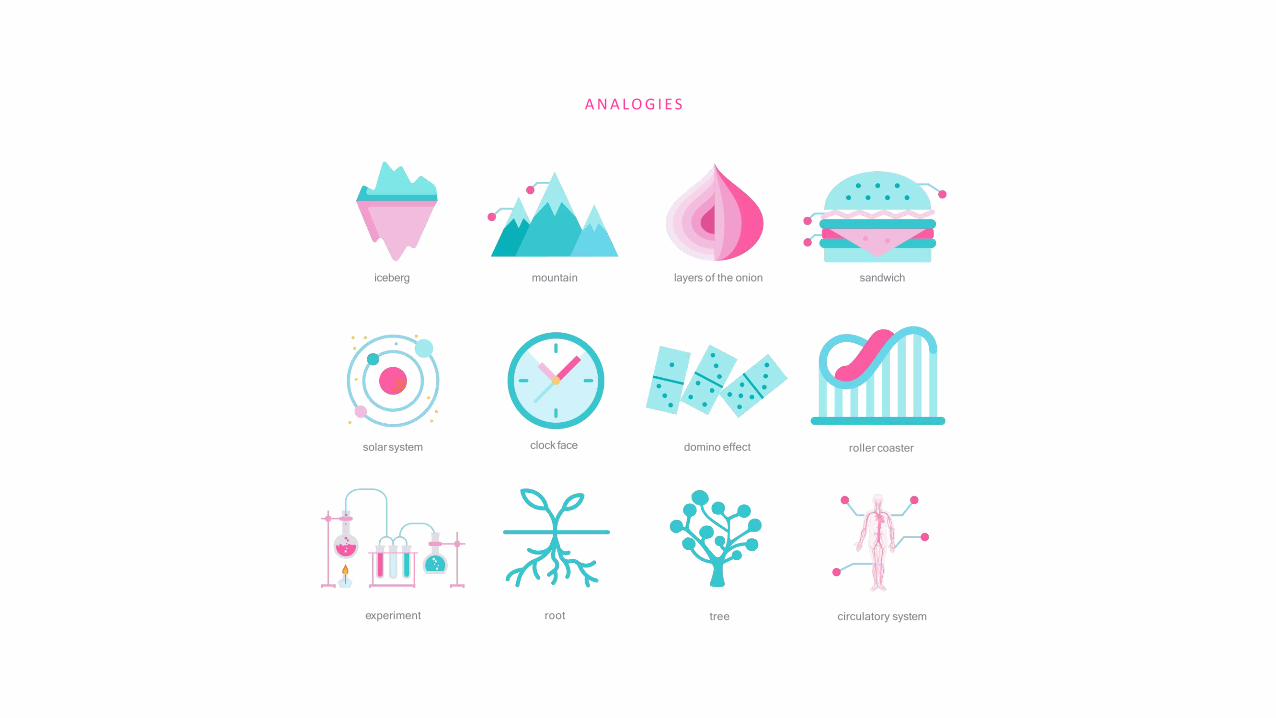
iceberg
A N A L O G I E S
solarsystem
experiment
clock face domino effect roller coaster
circulatory system
sandwichmountain layers of the onion
treeroot
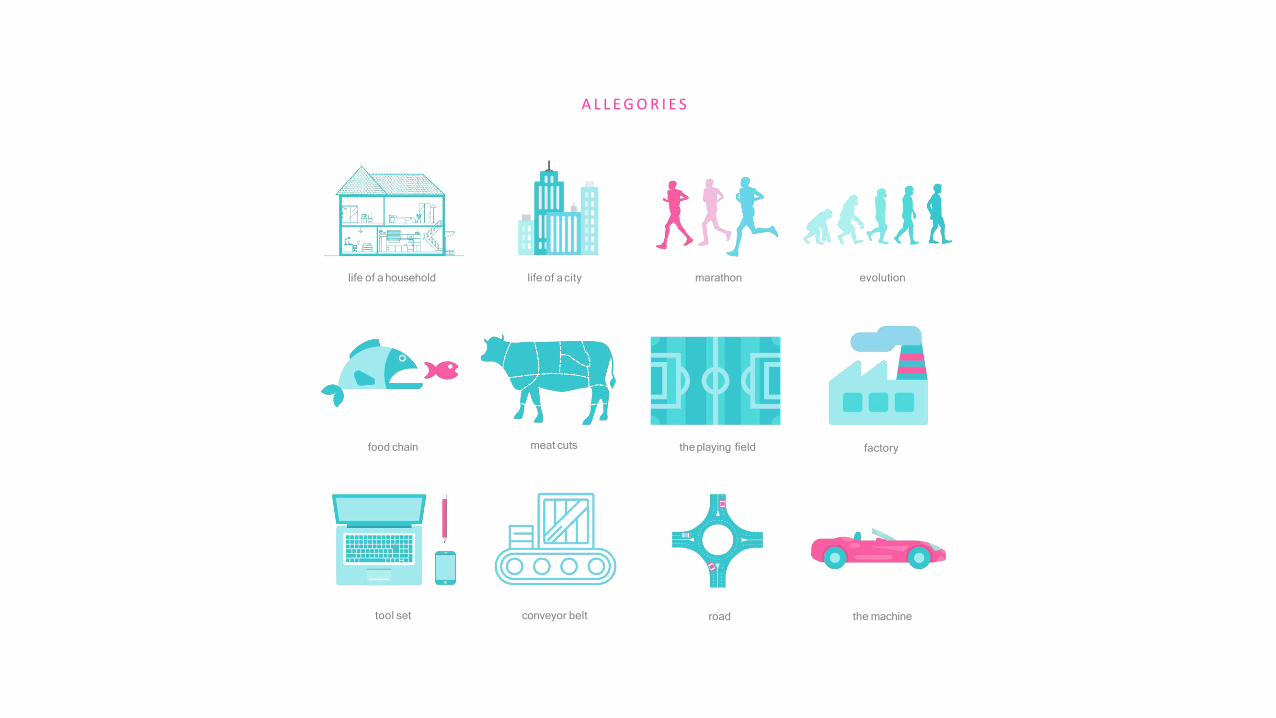
life of a household
A L L E G O R I E S
food chain
tool set
meat cuts theplaying field factory
the machine
evolutionlife of acity marathon
roadconveyor belt
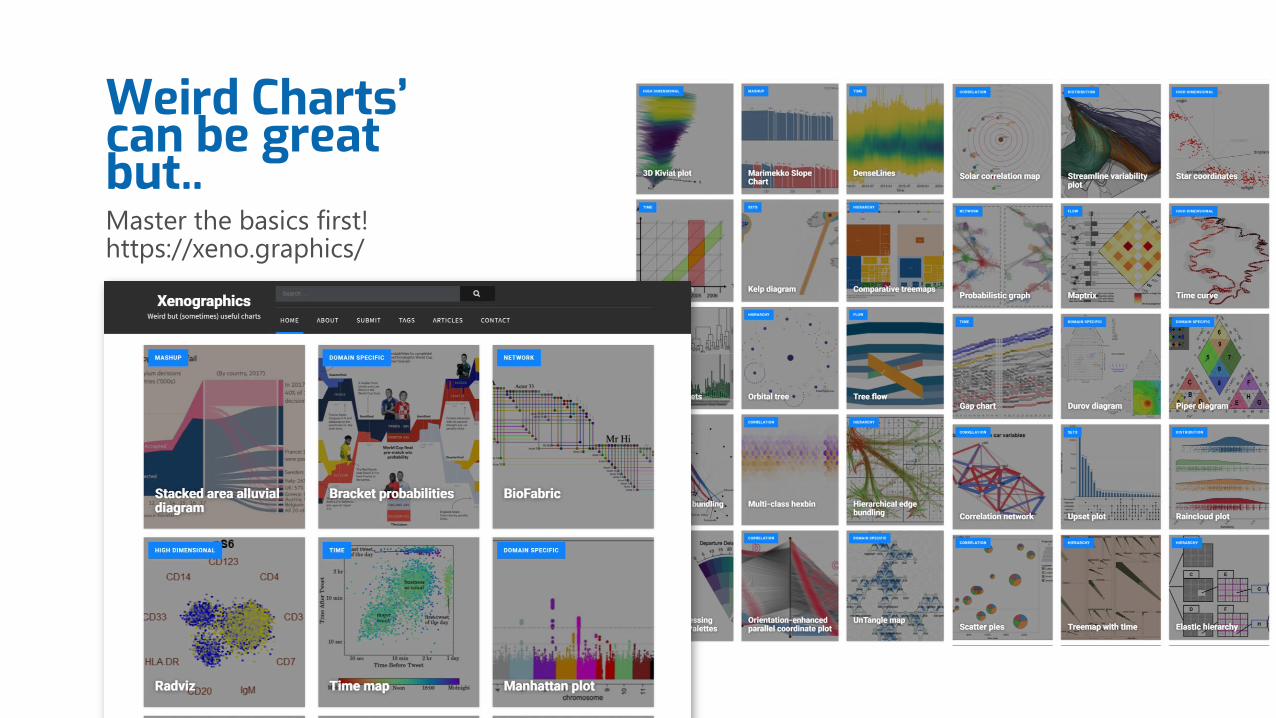
Weird Charts’ can be great but..Master the basics first!https://xeno.graphics/
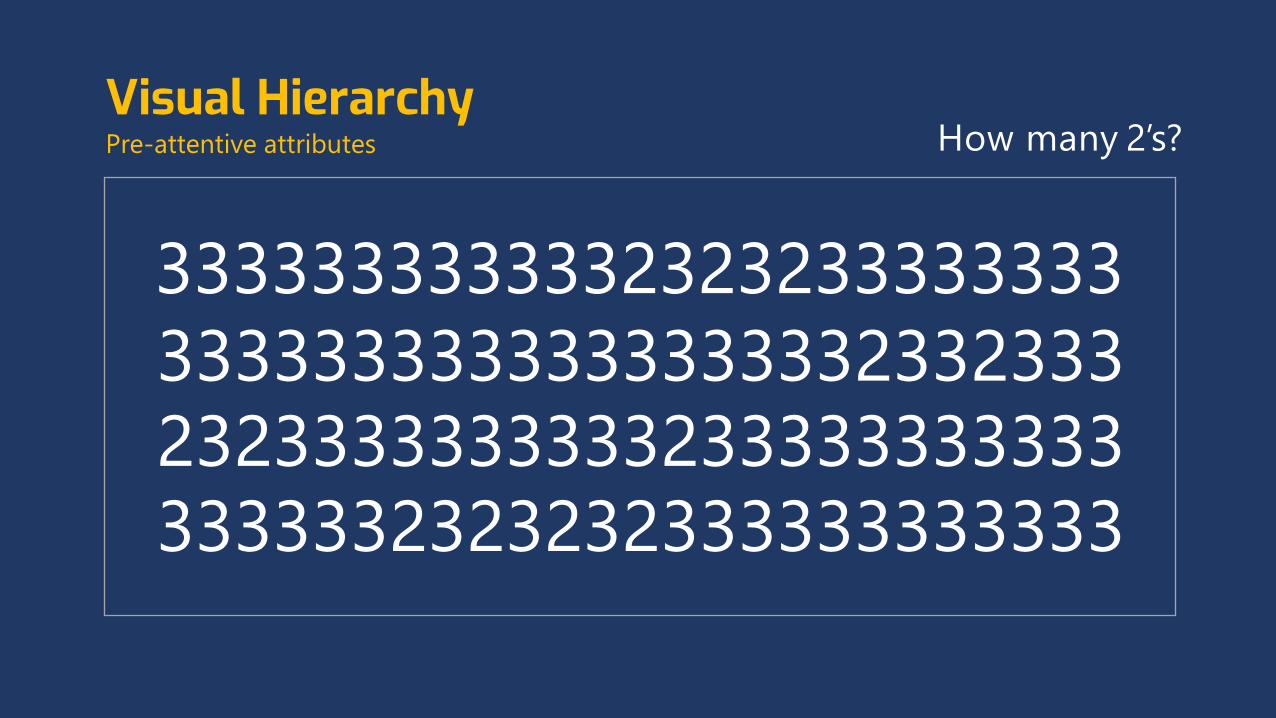
3333333333332323233333333
3333333333333333332332333
2323333333333233333333333
3333332323232333333333333
How many 2’s?Visual HierarchyPre-attentive attributes
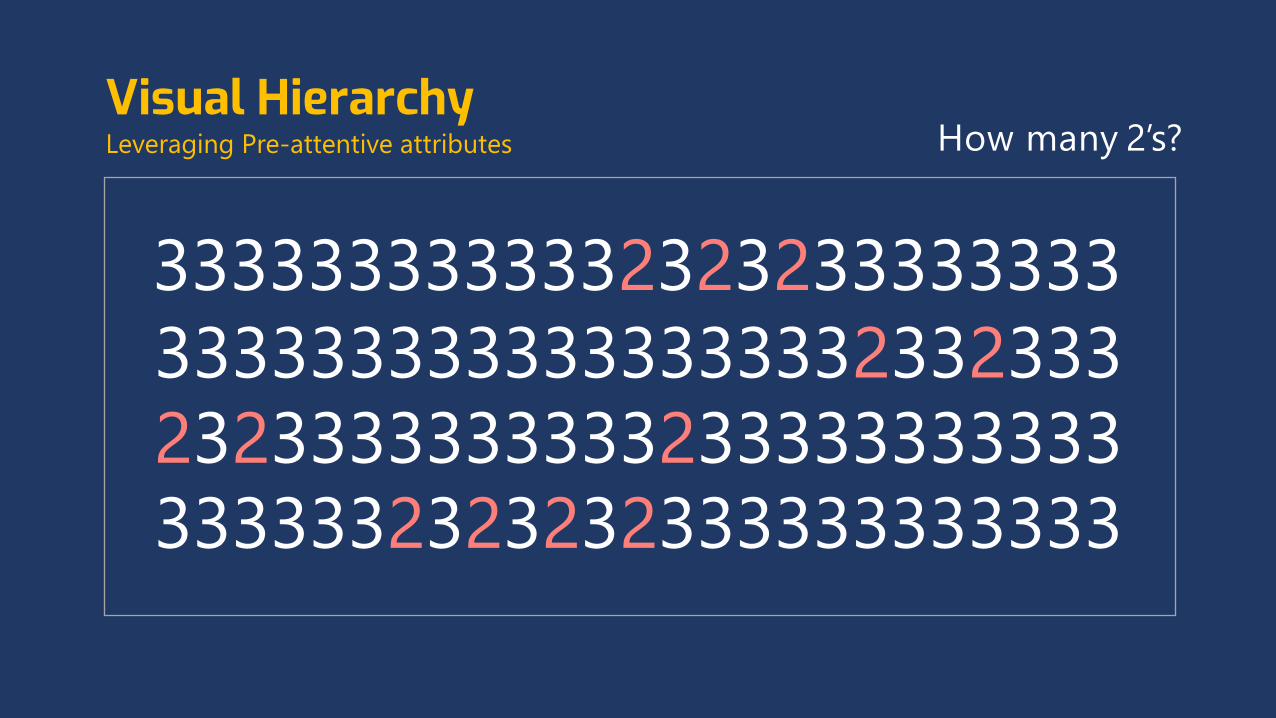
3333333333332323233333333
3333333333333333332332333
2323333333333233333333333
3333332323232333333333333
Visual HierarchyLeveraging Pre-attentive attributes How many 2’s?
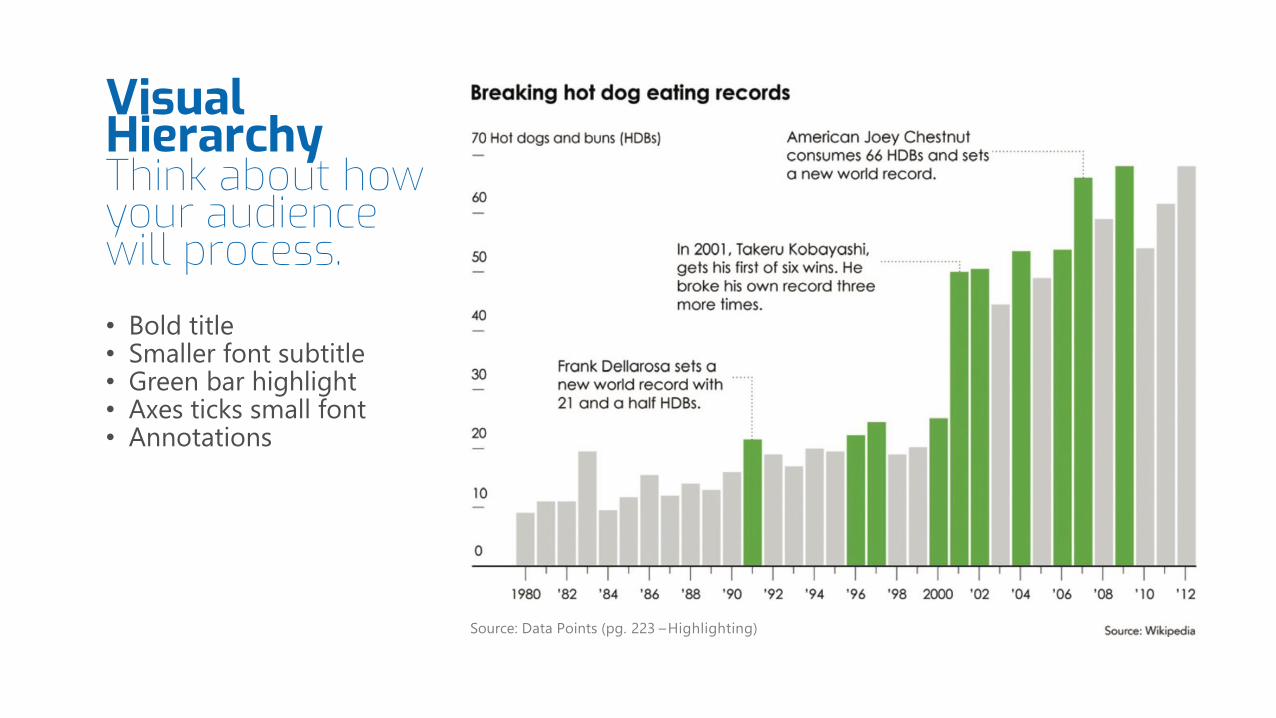
Source: Data Points (pg. 223 –Highlighting)
Visual HierarchyThink about how your audience will process.• Bold title• Smaller font subtitle • Green bar highlight • Axes ticks small font• Annotations
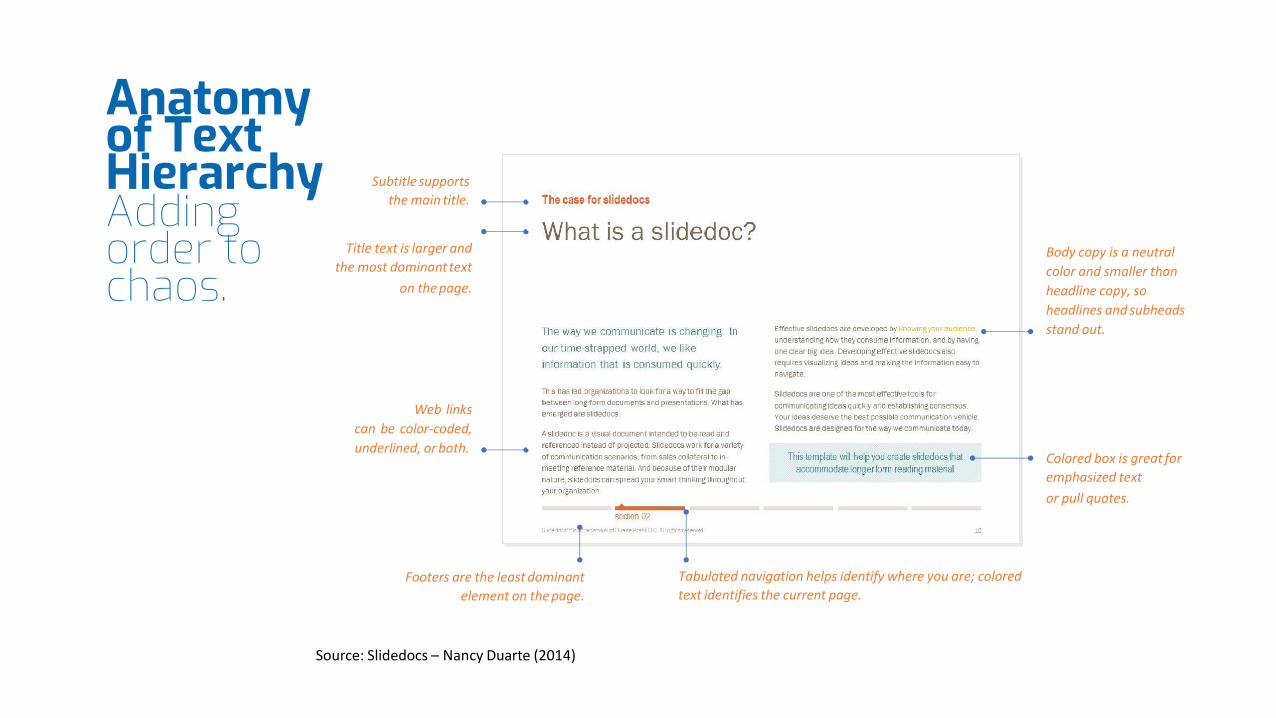
Subtitlesupports
the main title.
Title text is larger and
the most dominant text
on the page.
Web links
can be color-coded,
underlined, or both.
Body copy is a neutral
color and smaller than
headline copy, so
headlines and subheads
stand out.
Colored box is great for
emphasized text
or pull quotes.
Footers are the least dominant
element on the page.
Tabulated navigation helps identify where you are; colored
text identifies the current page.
Source: Slidedocs – Nancy Duarte (2014)
Anatomy of Text Hierarchy Adding order to chaos.
“Data is boring, so I need to make an attractive
visual to grab the audience’s attention”
Chart Junk – Wasted space / graphics on a visualNote: You won’t worry about this if you have a clear story
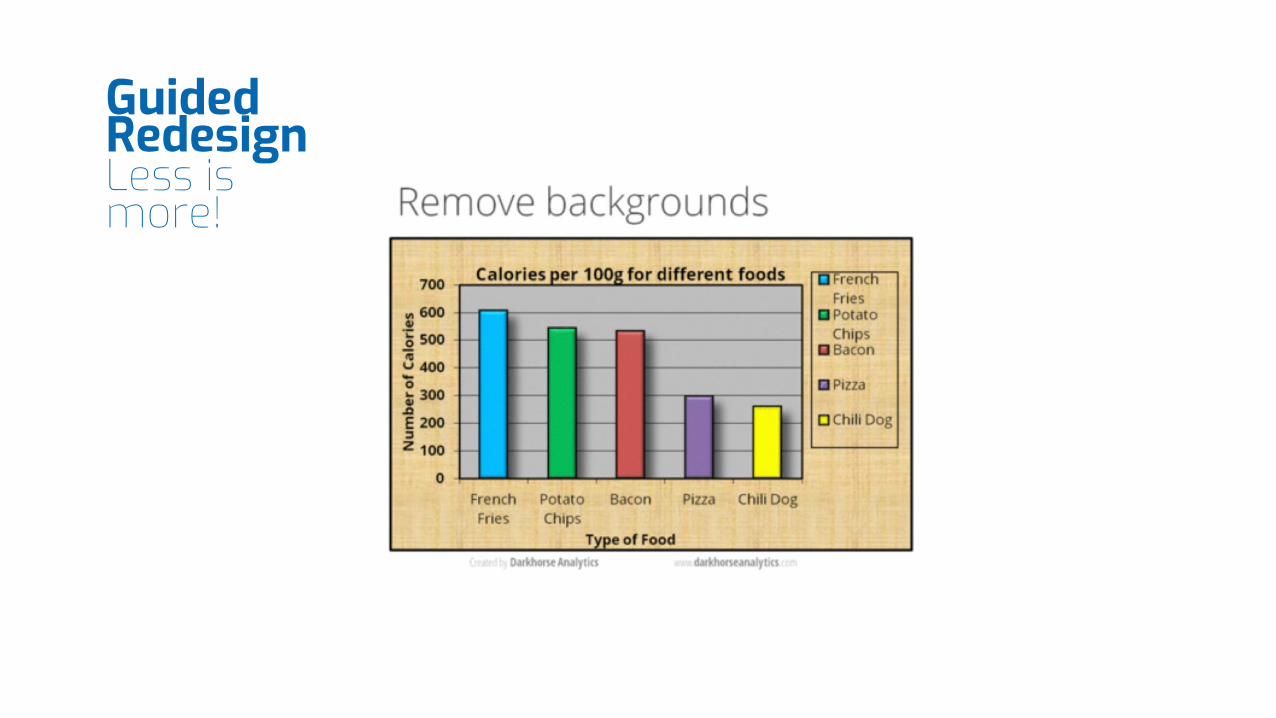
Guided RedesignLess is more!
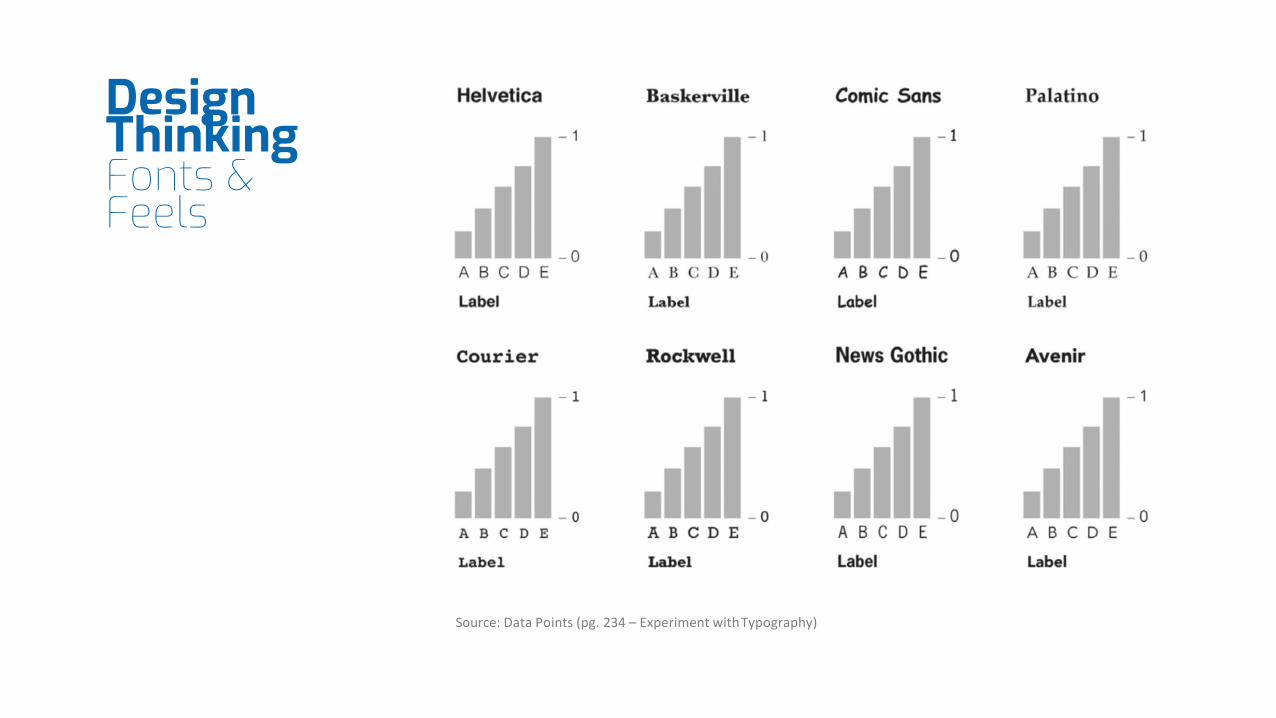
Source: Data Points (pg. 234 – Experiment withTypography)
Design ThinkingFonts & Feels
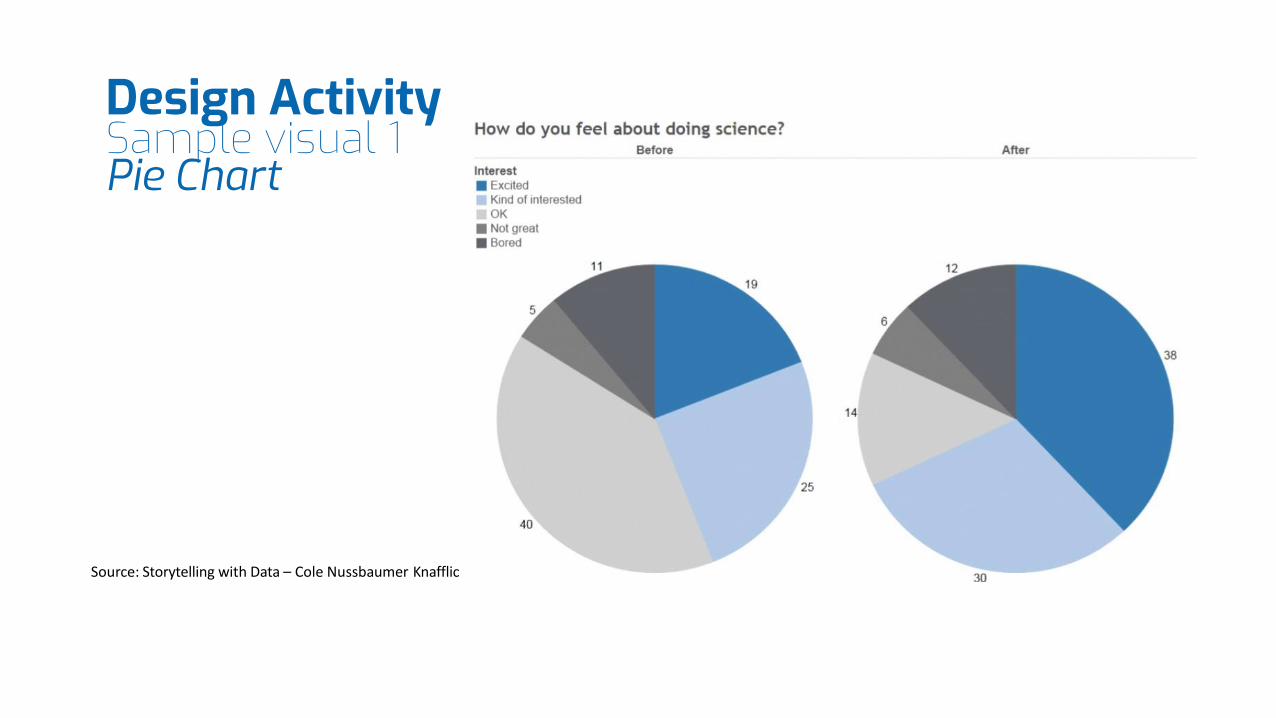
Source: Storytelling with Data – Cole Nussbaumer Knafflic
Design ActivitySample visual 1 Pie Chart

Source: Storytelling with Data – Cole Nussbaumer Knafflic
Design Activity Sample visual 2 100% Stacked Horizontal Bar Chart
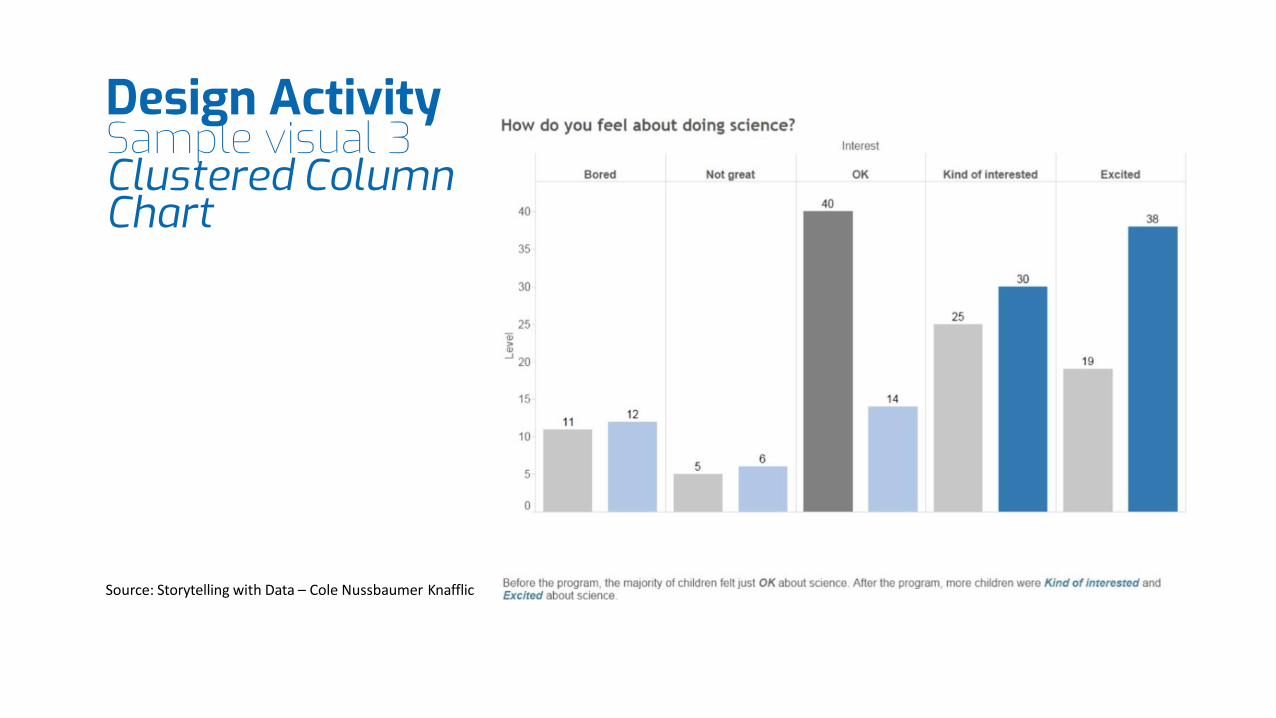
Source: Storytelling with Data – Cole Nussbaumer Knafflic
Design Activity Sample visual 3 Clustered Column Chart
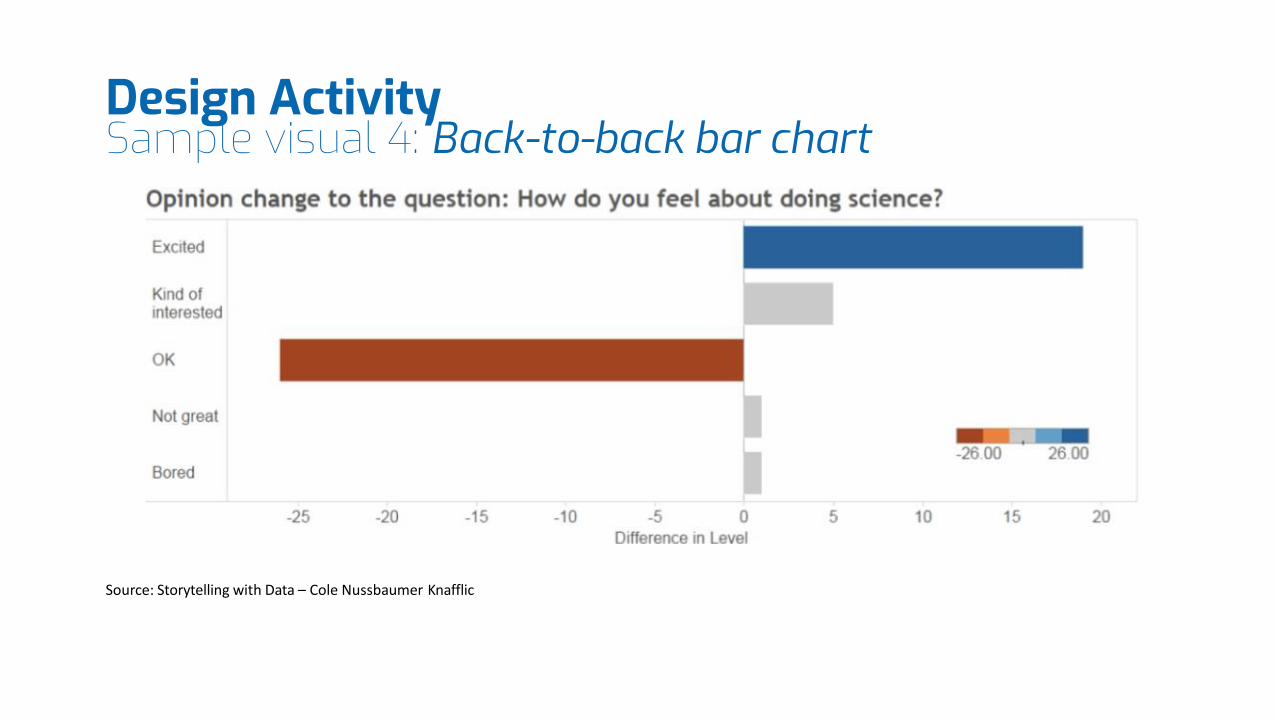
Source: Storytelling with Data – Cole Nussbaumer Knafflic
Design Activity Sample visual 4: Back-to-back bar chart
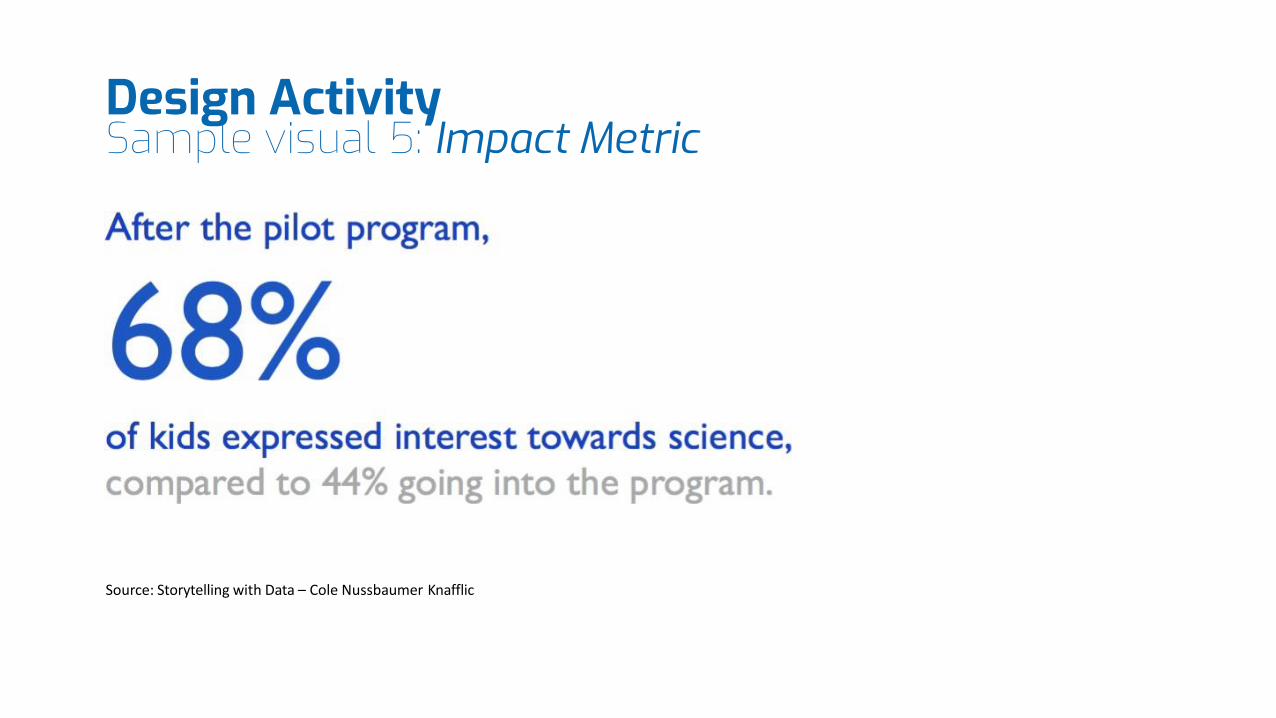
Source: Storytelling with Data – Cole Nussbaumer Knafflic
Design Activity Sample visual 5: Impact Metric

Why use ICON ?
Lesson 6
Why use icons?
Icons are VERY popular these days in 2D design. You may seem them a
lot on websites and on mobile devices, but also in other marketing
materials. Icons may take the place of text labels or be included along
with labels.
• They help organize a page or a slide, giving the audience or reader
a clearer understanding of complex material.
• Icons are usually minimalist, so they look modern. Often, they are
one color and many are gray or black.
• Because they are vector images, it can resize without that grainy
look.
Module 1
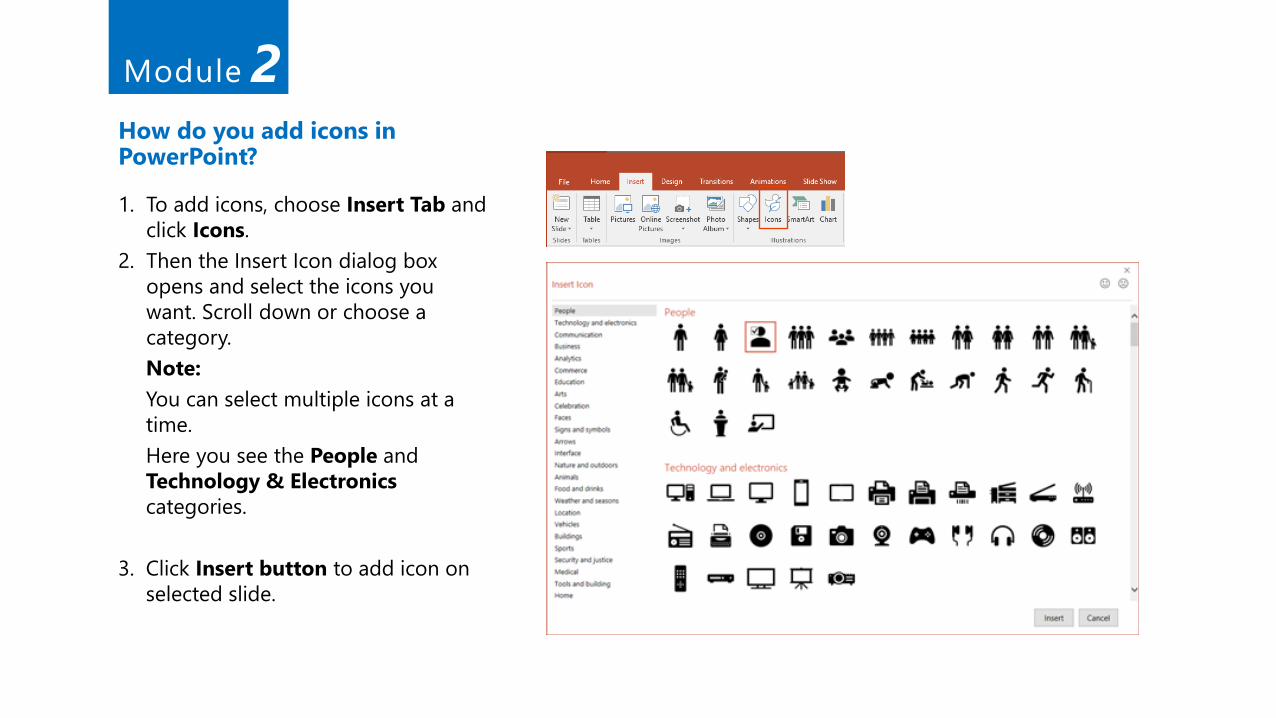
How do you add icons in PowerPoint?
1. To add icons, choose Insert Tab and
click Icons.
2. Then the Insert Icon dialog box
opens and select the icons you
want. Scroll down or choose a
category.
Note:
You can select multiple icons at a
time.
Here you see the People and
Technology & Electronics
categories.
3. Click Insert button to add icon on
selected slide.
Module 2
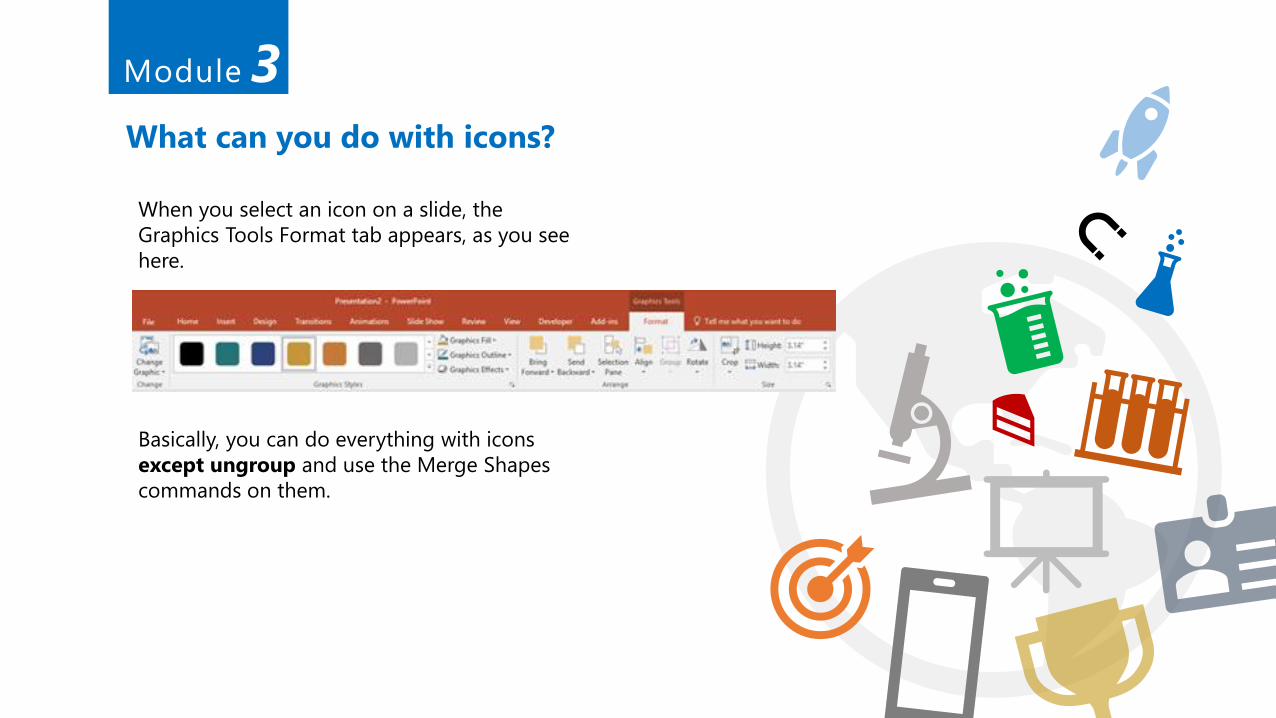
What can you do with icons?
When you select an icon on a slide, the
Graphics Tools Format tab appears, as you see
here.
Basically, you can do everything with icons
except ungroup and use the Merge Shapes
commands on them.
Module 3
Animations
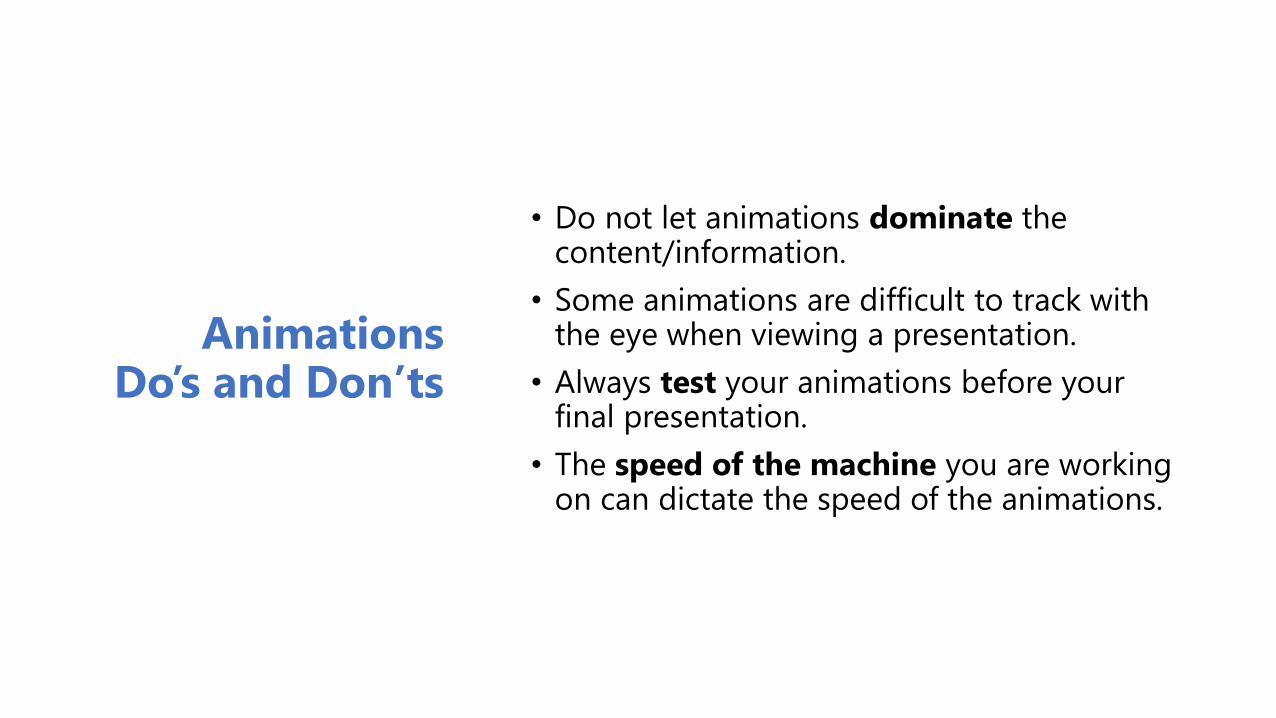
Animations Do’s and Don’ts
• Do not let animations dominate the content/information.
• Some animations are difficult to track with the eye when viewing a presentation.
• Always test your animations before your final presentation.
• The speed of the machine you are working on can dictate the speed of the animations.
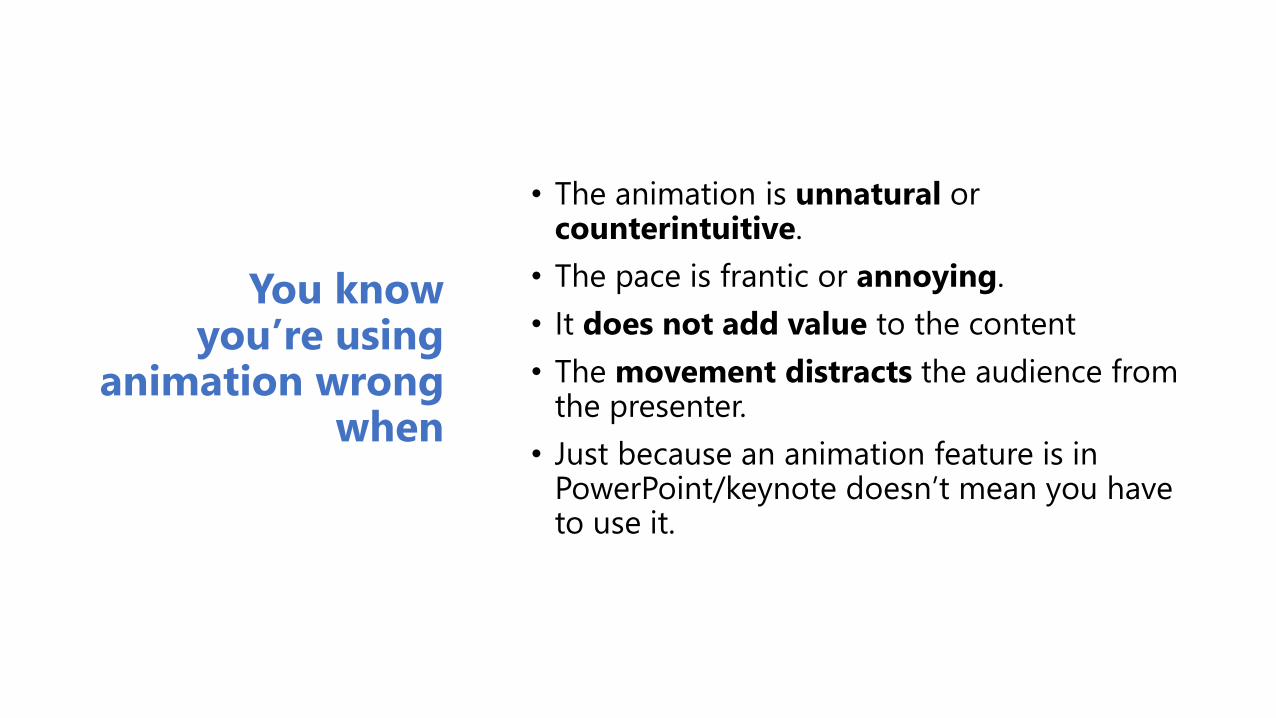
You know you’re using
animation wrongwhen
• The animation is unnatural or counterintuitive.
• The pace is frantic or annoying.
• It does not add value to the content
• The movement distracts the audience from the presenter.
• Just because an animation feature is in PowerPoint/keynote doesn’t mean you have to use it.
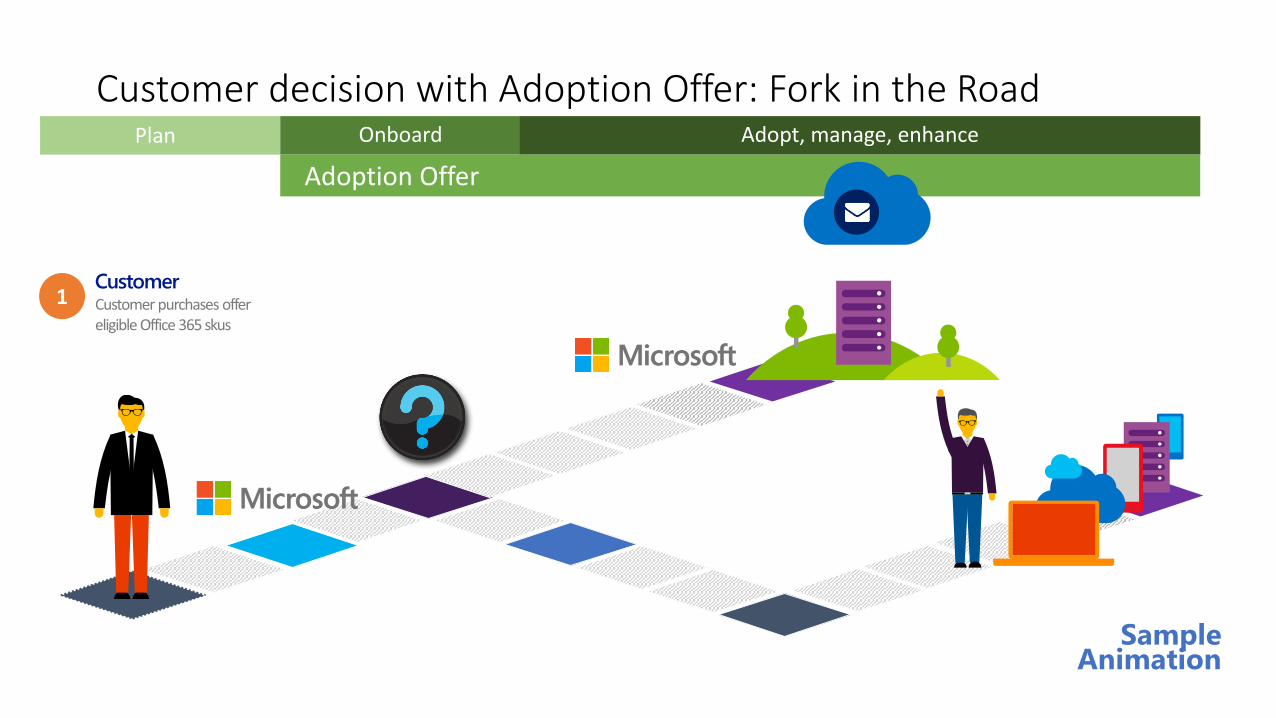
Customer decision with Adoption Offer: Fork in the Road
Customer
Sample Animation
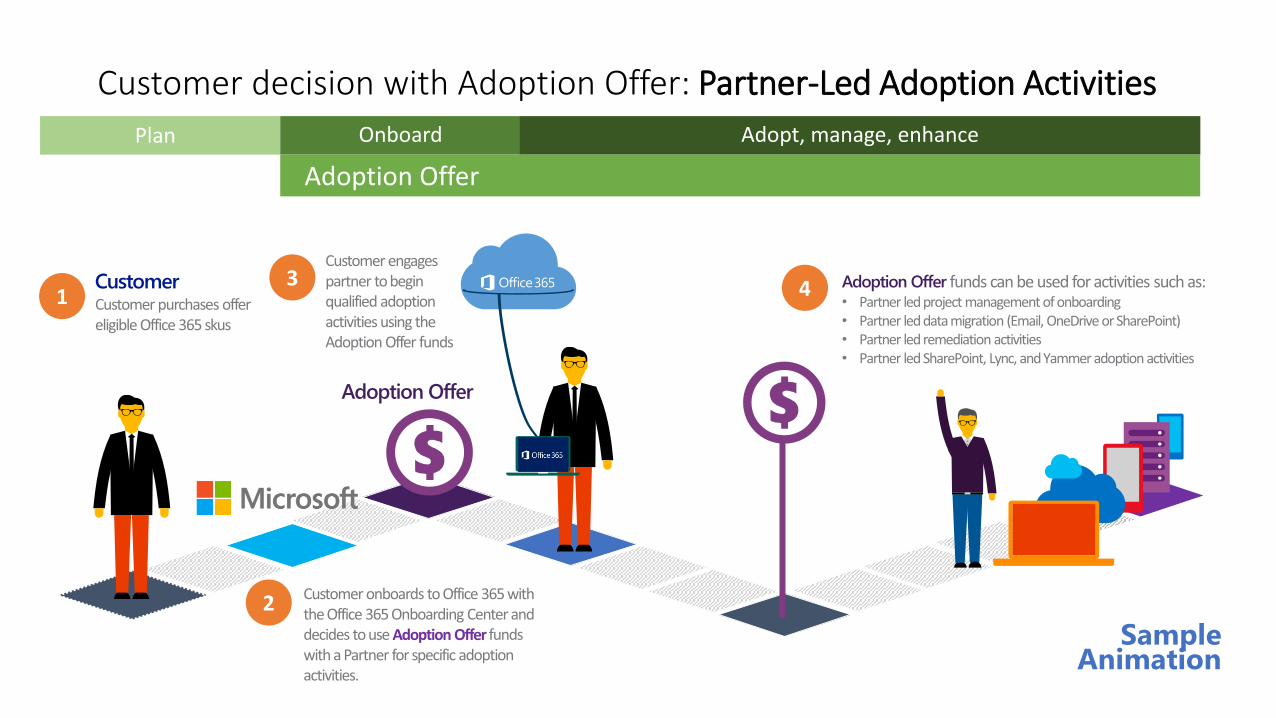
Customer decision with Adoption Offer: Partner-Led Adoption Activities
Customer
Adoption Offer
Adoption Offer
Adoption Offer
Sample Animation
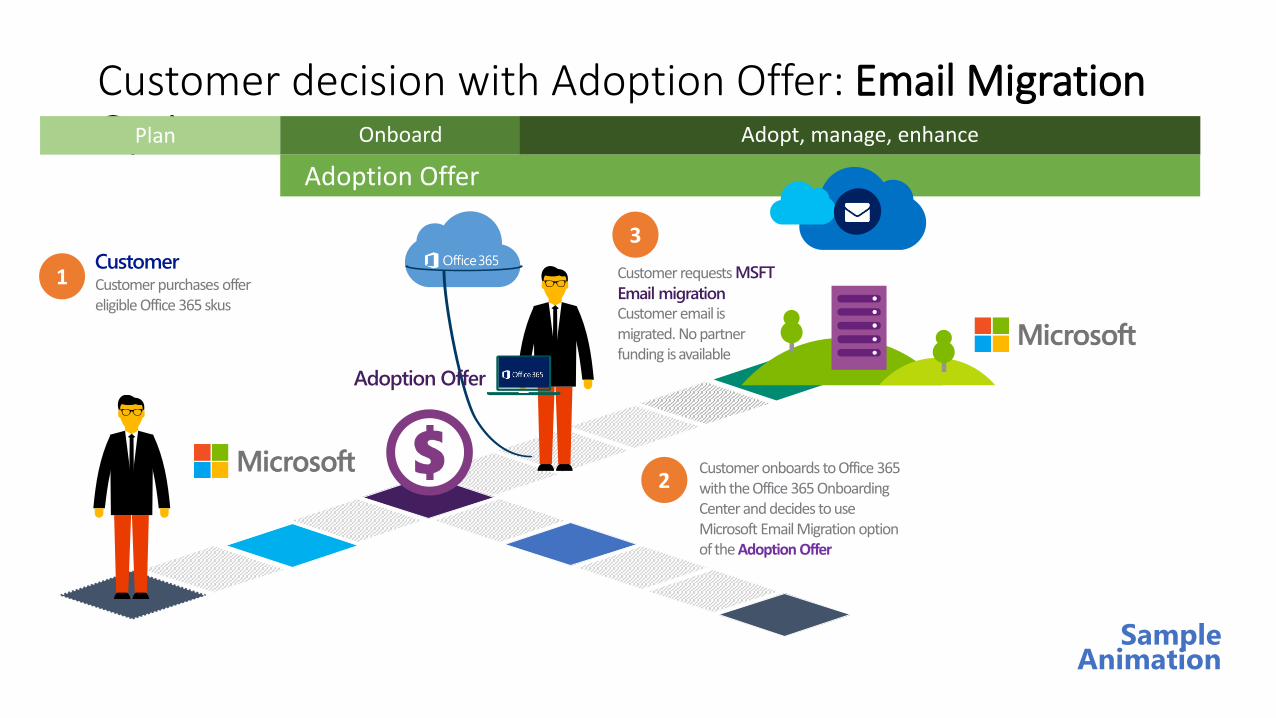
Customer decision with Adoption Offer: Email Migration Option
CustomerMSFT
Email migration
Adoption Offer
Adoption Offer
Sample Animation
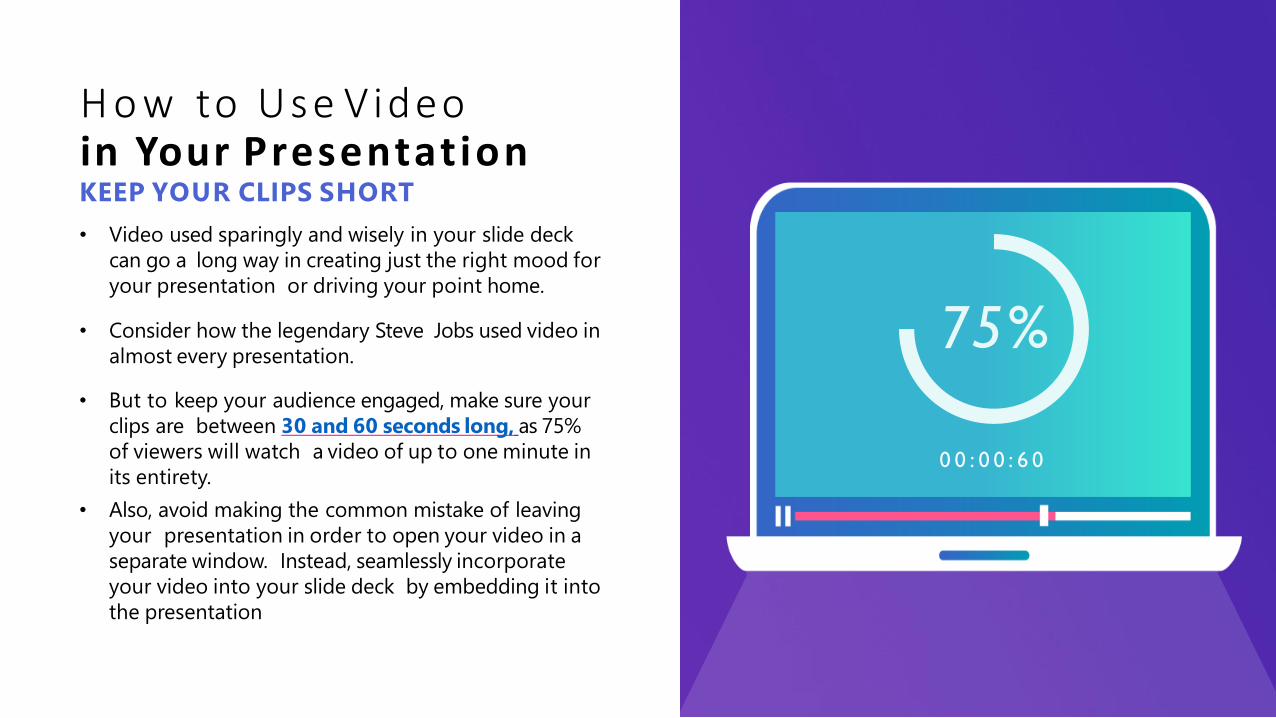
• Video used sparingly and wisely in your slide deck
can go a long way in creating just the right mood for
your presentation or driving your point home.
• Consider how the legendary Steve Jobs used video in
almost every presentation.
• But to keep your audience engaged, make sure your
clips are between 30 and 60 seconds long, as 75%
of viewers will watch a video of up to one minute in
its entirety.
• Also, avoid making the common mistake of leaving
your presentation in order to open your video in a
separate window. Instead, seamlessly incorporate
your video into your slide deck by embedding it into
the presentation
H o w to Use Videoin Your PresentationKEEP YOUR CLIPS SHORT
0 0 : 0 0 : 6 0
75%
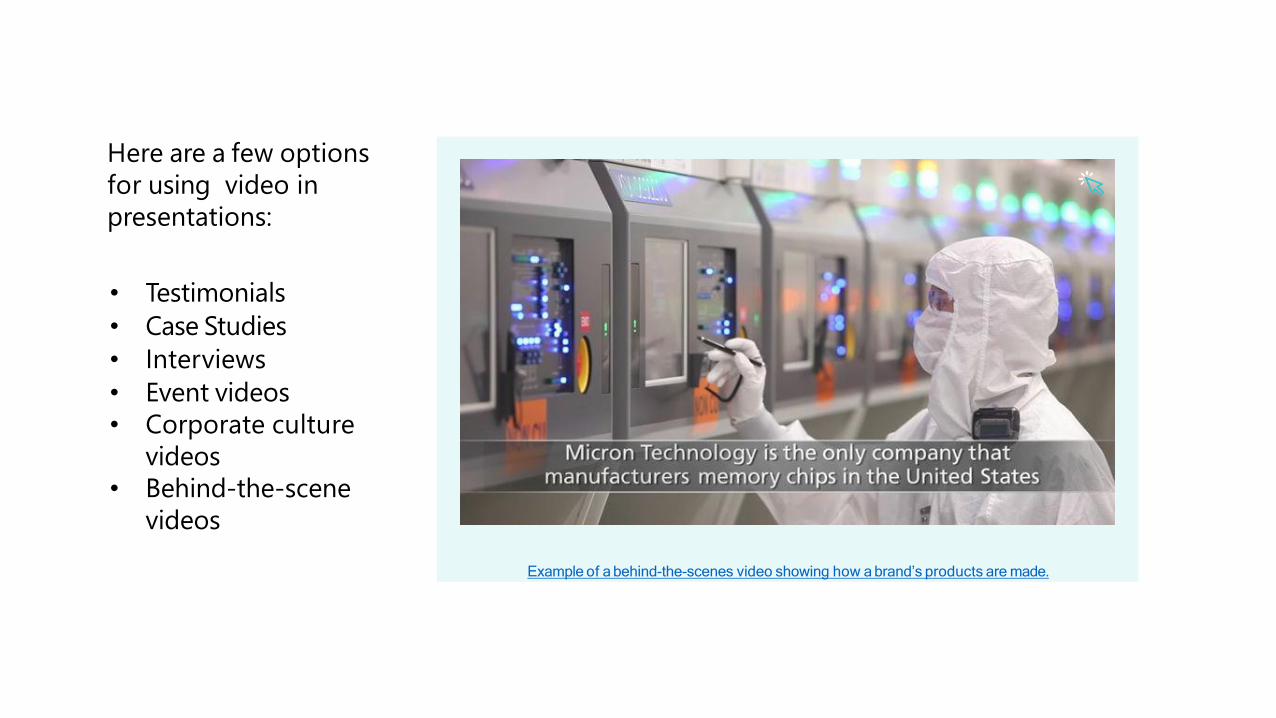
Here are a few options
for using video in
presentations:
Example of a behind-the-scenes video showing how a brand’s products are made.
• Testimonials
• Case Studies
• Interviews
• Event videos
• Corporate culture
videos
• Behind-the-scene
videos
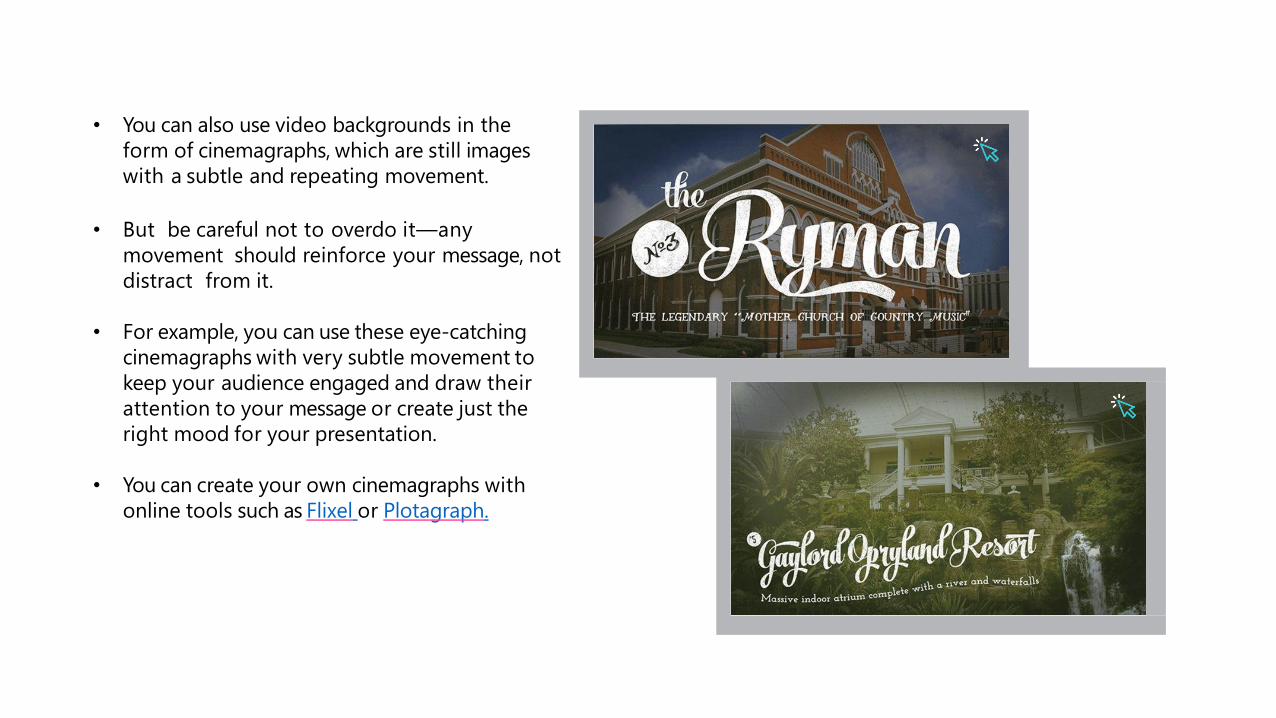
• You can also use video backgrounds in the
form of cinemagraphs, which are still images
with a subtle and repeating movement.
• But be careful not to overdo it—any
movement should reinforce your message, not
distract from it.
• For example, you can use these eye-catching
cinemagraphs with very subtle movement to
keep your audience engaged and draw their
attention to your message or create just the
right mood for your presentation.
• You can create your own cinemagraphs with
online tools such as Flixel or Plotagraph.

Thank YouContact Us Zamani Umar Husin
03-55442252
Please Scan QR Code for You
Feedback & Attendance
Please Scan QR Code to participate in
Microsoft PowerPoint Slide Makeover Challenge
Related Documents