MicroRNA profiling in pediatric pilocytic astrocytoma reveals biologically relevant targets including PBX3, NFIB, and METAP2 Cheng-Ying Ho 1 , Eli Bar 1 , Caterina Giannini 2 , Luigi Marchionni 3 , Matthias A. Karajannis 4,5 , David Zagzag 4,6,7 , David H. Gutmann 8 , Charles G. Eberhart 1 , Fausto J. Rodriguez 1 1 Division of Neuropathology, Department of Pathology, Johns Hopkins University; 720 Rutland Avenue, Baltimore, MD 21205 (CH,EB,CGE, FJR); 2 Department of Laboratory Medicine and Pathology, Mayo Clinic, 200 1 st Street SW, Rochester, MN 55905 (CG); 3 Cancer Biology Program, the Sidney Kimmel Comprehensive Cancer Center, Johns Hopkins University, CRB II Rm 554, Baltimore, MD 21205(LM), 4 NYU Cancer Institute, New York, New York; 5 Division of Pediatric Hematology/Oncology, Department of Pediatrics, 6 Department of Neurosurgery, and 7 Division of Neuropathology, Department of Pathology, NYU Langone Medical Center, 160 East 32nd Street New York, New York 10016 (MAK, DZ); 8 Department of Neurology, Washington University School of Medicine, 660 S. Euclid Avenue, St. Louis, MO 63110. Running Title: MicroRNA profiles of pilocytic astrocytoma Address Correspondence to: Fausto J. Rodriguez M.D. Department of Pathology Division of Neuropathology Johns Hopkins Hospital Sheikh Zayed Tower, Room M2101 1800 Orleans Street Baltimore, MD 21231 Phone: 443-287-6646 *Manuscript (Revised)

Welcome message from author
This document is posted to help you gain knowledge. Please leave a comment to let me know what you think about it! Share it to your friends and learn new things together.
Transcript

MicroRNA profiling in pediatric pilocytic astrocytoma reveals biologically relevant targets
including PBX3, NFIB, and METAP2
Cheng-Ying Ho1, Eli Bar
1, Caterina Giannini
2, Luigi Marchionni
3, Matthias A. Karajannis
4,5,
David Zagzag4,6,7
, David H. Gutmann8, Charles G. Eberhart
1, Fausto J. Rodriguez
1
1Division of Neuropathology, Department of Pathology, Johns Hopkins University; 720 Rutland
Avenue, Baltimore, MD 21205 (CH,EB,CGE, FJR); 2Department of Laboratory Medicine and
Pathology, Mayo Clinic, 200 1st Street SW, Rochester, MN 55905 (CG);
3Cancer Biology
Program, the Sidney Kimmel Comprehensive Cancer Center, Johns Hopkins University, CRB II
Rm 554, Baltimore, MD 21205(LM), 4NYU Cancer Institute, New York, New York;
5Division
of Pediatric Hematology/Oncology, Department of Pediatrics, 6Department of Neurosurgery, and
7Division of Neuropathology, Department of Pathology, NYU Langone Medical Center, 160
East 32nd Street New York, New York 10016 (MAK, DZ); 8Department of Neurology,
Washington University School of Medicine, 660 S. Euclid Avenue, St. Louis, MO 63110.
Running Title: MicroRNA profiles of pilocytic astrocytoma
Address Correspondence to:
Fausto J. Rodriguez M.D.
Department of Pathology
Division of Neuropathology
Johns Hopkins Hospital
Sheikh Zayed Tower, Room M2101
1800 Orleans Street
Baltimore, MD 21231
Phone: 443-287-6646
*Manuscript (Revised)

Fax: 410-614-9310
Email: [email protected]
Funding: This work was funded in part by the Childhood Brain Tumor Foundation (FJR), the
Pilocytic/Pilomyxoid Astrocytoma Fund (CGE), the Pediatric Low Grade Astrocytoma
Association (CGE), Ian’s Friends Foundation (MAK), Mayo Clinic CTSA through grant number
UL1 RR024150 from the National Center for Research Resources (NCRR) (FJR), and the P50
CA108961 Mayo Clinic SPORE in Brain Cancer (CG). Samples quality assessment and
microarray analysis were conducted at The Sidney Kimmel Cancer Center Microarray Core
Facility at Johns Hopkins University, supported by NIH grant P30 CA006973 entitled Regional
Oncology Research Center.
Conflict of Interest: The authors have no conflict of interest to disclose.
Abstract
Background: Pilocytic astrocytoma (PA) is a WHO grade I glioma that occurs most commonly
in children and young adults. Specific genetic alterations have been described in PA, but the
pathogenesis remains poorly understood. We studied microRNA (miRNA) alterations in a large
cohort of PA.
Methods: A total of 43 PA, including 35 sporadic grade I PA, 4 neurofibromatosis-1 (NF1)-
associated PA, 4 PA with pilomyxoid features, and 5 non-neoplastic brain controls were
examined. BRAF fusion status was assessed in most cases. RNA was examined using the Agilent
Human miRNA Microarray V3 platform. Expression of miRNAs subsets was validated by
quantitative real-time PCR (qRT-PCR) with Taqman probes. Validation of predicted protein
targets was performed on tissue microarrays by immunohistochemistry
Results: We identified a subset of miRNAs that were differentially expressed in pediatric PAs
versus normal brain tissue: 13 miRNAs were underexpressed and 20 miRNAs were
overexpressed in tumors. Differences were validated by qRT-PCR in a subset, with average fold
change in tumor vs. brain of -17 (miR-124), -15 (miR-129), and 19.8 (miR-21). Searching for
predicted protein targets in Targetscan, we identified a number of known and putative oncogenes
that were predicted targets of miRNA sets relatively underexpressed in PA. Predicted targets
with increased expression at the mRNA and/or protein level in PA, included PBX3, METAP2,
and NFIB.
Conclusions: A unique miRNA profile exists in PA as compared to brain tissue. These miRNAs
and their targets may play a role in the pathogenesis of PA.
Key Words: Glioma; microRNA; pilocytic astrocytoma; neurofibromatosis; BRAF
Introduction
Pilocytic astrocytoma (PA) is a WHO grade I neoplasm representing the most frequent primary
glioma of children and young adults. Most PAs have an excellent outcome after gross total
resection, particularly when they arise in accessible anatomic locations such as the cerebellum.
However, a subset may behave in a more aggressive fashion, and clinically progress despite the
use of conventional treatments. Histologic features associated with a more aggressive course
include the presence of monomorphous pilomyxoid features (i.e. pilomyxoid variant)1 and
anaplasia in the form of brisk mitotic activity with or without necrosis2.
Recent studies have highlighted novel genetic alterations associated with PA. Tandem
duplications of the BRAF kinase domain, leading to a BRAF:KIAA1549 fusion, is present in most
PAs3-10
. A subset of tumors have other, usually mutually exclusive, alterations including RAF1
rearrangements, a FAM131B-BRAF fusion mediated by a small interstitial deletion, or small
BRAF insertions10-12
. In addition, PA is the most frequent glioma in patients with
neurofibromatosis type 113
, resulting from germline mutations in the NF1 gene and homozygous
inactivation in associated tumors, leading to RAS activation. All these genetic alterations lead to
downstream activation of the MAPK signaling pathway14
.
In recent years, an increasing role for non-coding small RNA (i.e. microRNA) has been
uncovered in carcinogenesis. Mature microRNAs are small single stranded RNA molecules that
bind to regulatory sequences of key mRNAs, promoting their degradation and/or inhibiting
translation. In the process of carcinogenesis the upregulation of particular microRNAs may
affect tumor suppressors, while downregulation may allow overexpression of oncoproteins
resulting in deregulation of cell proliferation and survival.
Several microRNAs have been shown to be involved in brain tumorigenesis, including
miR-21, miR-7, miR-181a/b, miR-221 and miR-22215-19
, and also seem to regulate oncogenic
signaling pathways in diffuse gliomas, such as glioblastoma20,21
. PTEN in particular is a key
tumor suppressor gene frequently inactivated in diffusely infiltrating gliomas, and may in fact be
targeted, albeit not exclusively, by specific microRNAs such as miR-2122
. Since microRNAs
may have more than one target, microRNA profiling may stratify biological and clinically
relevant subgroups more accurately than conventional mRNA profiling23
. Low grade pediatric
gliomas, such as PAs in particular, are attractive for microRNA study since they lack gross
genomic alterations24
, suggesting undiscovered epigenetic and subtle genetic changes may
contribute to their pathogenesis. In addition, microRNA profiling may lead to further, biology-
based refinements in classifying histopathologically ambiguous low grade gliomas that defy
traditional classification schemes, and potentially may have prognostic or therapeutic
significance.
Given the low level of genetic instability observed in PAs, we hypothesized that
epigenetic or posttranscriptional regulation may play an important role in its pathogenesis, as
described in other low grade neuroectodermal tumors such as schwannomas25-27
. Some studies
have also highlighted a possible role for microRNAs in pediatric brain tumors28,29
, including
medulloblastoma and ependymoma30
. A small number of PAs have also been tested for
microRNA levels, which may be differentially expressed in this tumor type29
. Furthermore,
overexpression of specific microRNAs has been observed in papillary carcinoma of the thyroid,
another tumor characterized by BRAF aberrations31
. Identification of key microRNAs also
provides a rationale for developing inhibitory RNA strategies for therapeutic purposes in cancer
patients 32
.In the current study, we investigated global microRNA expression in a large series of
genetically characterized PAs, including various pathologic subtypes, followed by
characterization of possible relevant biologic targets.
Methods
Patients and tumor samples
A total of 43 PAs were obtained from patients undergoing surgery at Johns Hopkins Hospital,
New York University or Mayo Clinic, including 35 sporadic WHO grade I PAs, 4 NF1-
associated PAs and 4 PAs with pilomyxoid features. All patients (except for 2) were 18 years or
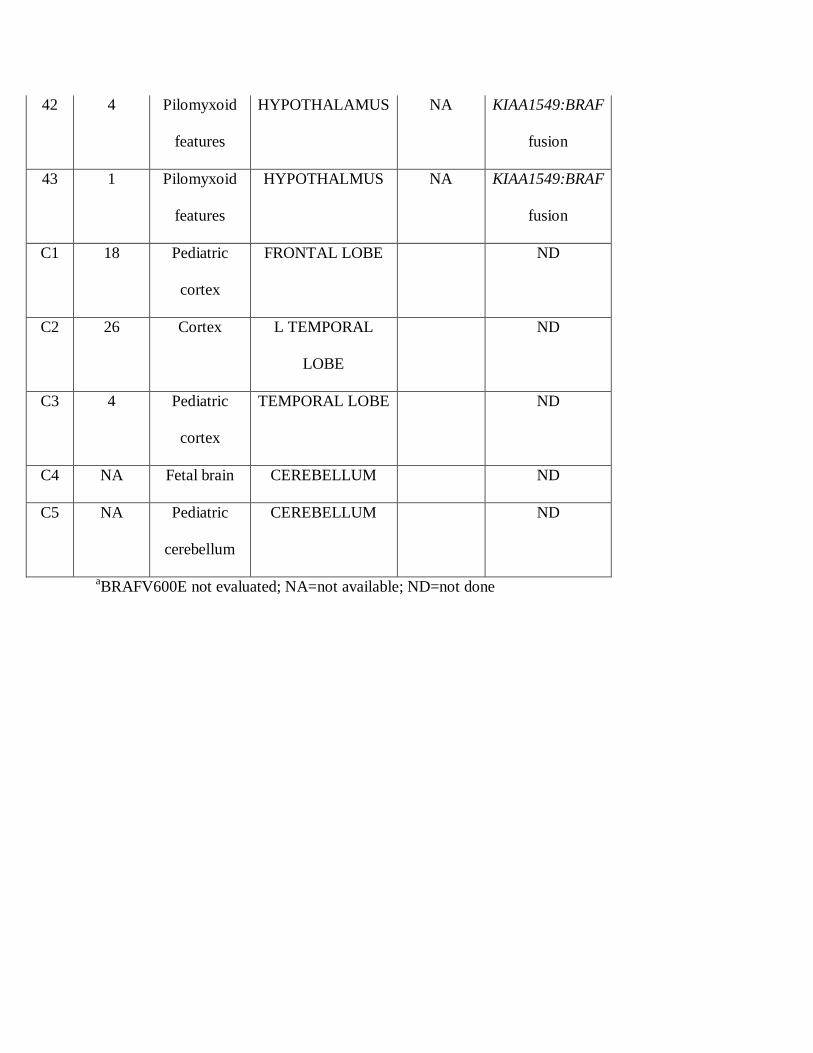
younger at the time of surgery (median 10 years). Non-neoplastic tissue controls included fetal
cerebellum (n=1) pediatric cerebellum (n=1) obtained from autopsy, as well as cerebral cortex
obtained during seizure surgery (n=2) or biopsy for a non-specific neurologic disorder with
gliosis (n=1). Nine additional autopsy-derived cerebellar tissues were included for qRT-PCR
experiments.
Anatomic locations for tumor samples included optic pathways (n=10), supratentorial
(n=11), and infratentorial compartments (n=22). Most tumors were previously evaluated for
BRAF alterations as part of a separate study and by PCR and sequencing as reported7. Tumors
were classified as aggressive if they progressed significantly within a year despite conventional
therapies, or recurred after gross total resections. Five patients met these criteria. Patient and
tumor data is summarized in table 1. All studies were approved by the Johns Hopkins, NYU and
Mayo Clinic Institutional Review boards.
MicroRNA profiling
Snap frozen fresh tumor tissue was used for the microRNA studies. Sample quality assessment
and microarray analysis were performed at the Sidney Kimmel Comprehensive Cancer Center
Microarray Core Facility at Johns Hopkins University, Baltimore. Briefly, total RNA was
isolated using miRNeasy Mini kits (Qiagen, Valencia, CA) followed by quality checks of both
total RNA and small RNA using a 2100 Bioanalyzer and software which detect 28S and 18S
ribosomal RNA ratio, total RNA Integrity Number (RIN), small RNA and miRNA
concentrations in the total RNA isolated. Only samples with adequate total and microRNA were
used in the study.
Samples were hybridized to a Human miRNA Microarray V3 kit (G4470C, Agilent
Technologies, Santa Clara, CA) platform, previously proven to produce reproducible results as
described 33
. This array contains 866 human and 89 human viral microRNAs from the Sanger
database v12.0. (URL:http://microrna.sanger.ac.uk/sequences/). Each miRNA species is printed
20 times with replicate probes on the array. Total RNA (150 ng) was first dephosphorylated with
11.2 units of calf intestine alkaline phosphatase at 37°C for 30 minutes and followed by end-
labeling with pCp-Cy3 (Agilent Technologies) and 15 units of T4 RNA ligase (GE Healthcare,
Little Chalfont, United Kingdom) at 16°C for 2 hours. Labeled samples were purified with Micro
Bio-Spin 6 columns (Bio-Rad, Hercules, CA). Labeling efficiency and nucleic acid concentration
were measured using Nanodrop 1000. Samples were then mixed with 10x blocking agent and 2x
Hi-RPM hybridization buffer (Agilent Technologies) and hybridizations were carried out at 55°C
with rotation at 20 rpm in a designated Agilent G2545A hybridization oven for 20 hours. Finally,
microarrays were washed and scanned using an Agilent scanner controlled by Agilent Scan
Control 7.0 software. Data were acquired with Agilent Feature Extraction 9.5.3.1 software for
miRNA microarray generating a GeneView file that contains summarized signal intensities for
each miRNA by combining intensities of replicate probes and background subtraction.
MicroRNA Data analysis
Data normalization and analysis were performed using GeneSpring GX 11 following the
standard software recommendations (Agilent Technologies). Briefly, miRNA signal intensities
from GeneView files were subjected to quantile normalization. Expression differences were
compared using the T Test unpaired unequal variance (Welch) between pairs of interest. An
adjusted p value was obtained using the Benjamini-Hochberg false discover rate (FDR) for
multiple comparisons.
MicroRNA validation
Validation of selected targets (mature miR-21, miR-124, mir-129) was performed with Taqman®
microRNA assays (Applied Biosystems, Foster City, CA) using the manufacturers
recommendations. All samples were tested in triplicate using 96 well plates. The non-coding
small nuclear RNA U6 was used as internal control. Wells lacking template were used as
negative controls. Expression changes were compared by relative quantification in the form of
fold changes obtained with the ΔΔCt method34
.
MicroRNA target prediction
Predicted mRNA targets for differentially expressed microRNAs were obtained from the
TargetScan Human online database (Release 6.0). Using this strategy, microRNA targets are
predicted by matching the seed region of the specific microRNA with conserved 8mer and 7mer
sites as described35
(http://www.targetscan.org).
Analysis of Functional Annotation (AFA) results
We tested the association between the lists of mRNA targets for selected differentially miRs and
relevant cancer signaling pathways available from the NCI Pathway Commons database via
Analysis of Functional Annotation, as previously described36
. Briefly, the chi-squared test was
used to identify the specific signaling pathways significantly over-represented among the genes
targeted by the microRNAs differentially expressed in PA. The Benjamini-Hochberg method
was applied to correct the obtained P-values for multiple testing, and a FDR of less than 5% was
considered significant.
Gene Expression analysis
Differences in candidate mRNA targets were studied using data files obtained with Affymetrix
HG-U133 Plus 2.0 chips. Sources included newly profiled 17 sporadic PAs (5 of which subjected
to microRNA analysis as well) and one non-neoplastic cortex; 47 PA samples from our
previously reported study37
, and 19 normal brain samples from various anatomic regions
(cerebral cortex (n=4), occipital lobe (n=4), cerebellum (n=3), and hypothalamus (n=8) obtained
from a publically available dataset at the NCBI gene expression omnibus(GSE7307). Raw gene
expression data preprocessing and normalization was performed at the probe level using the
Frozen Robust Multi-array Analysis (FRMA) approach described by McCall and colleagues38
.
Tissue microarray (TMA) and Immunohistochemistry
Validation of protein targets was performed using three PA and one diffuse glioma TMAs
containing 103 sporadic PAs, 17 NF1-associated PAs, 15 anaplastic PAs, and 79 diffuse gliomas
of various grades. TMAs contained 3-4 cores per tumor. Immunohistochemical studies were
performed using the following antibodies: PBX3 (Clone 1A11, LifeSpan BioSciences Inc.,
Seattle, WA, 1:400), METAP2 (Rabbit polyclonal, Abnova, Taipei, Taiwan, 1:50), and NFIB
(Clone 2D6, LifeSpan BioSciences Inc., 1:100). Immunohistochemical stains were scored by two
independent observers (FJR, CH) using the following semiquantitative scale which combined
staining intensity and number of positive cells: 3+(strong immunoreactivity in>50% tumor cells),
2+( medium to weak immunoreactivity in 50-100% of cells or strong immunoreactivity in 10-
50% tumor cells), 1+(strong immunoreactivity in 1-10% or medium to weak immunoreactivity in
10-50% tumor cells), 0=negative. For PBX3 and NFIB only nuclear reactivity was considered
significant, while only cytoplasmic METAP2 reactivity was scored. Chi Square or Fisher exact
tests were used to compare proportions, and student t-test or Wilcoxon rank sum to compare
quantitative variables. All tests were two sided with p-values less than 0.05 considered
statistically significant.
Results
A subset of microRNAs are differentially expressed in pediatric PAs
Comparisons were made between tumors and non-neoplastic brain, as well as different tumor
subsets. The most robust differences were evident between tumors as a group and non-neoplastic
brain tissues, as illustrated by unsupervised hierarchichal clustering (Figure 1). The volcano plot
comparing tumor tissue and non-neoplastic brain using an adjusted p value of 0.05 and fold
change of 2 as cutoffs demonstrated 13 human microRNAs relatively underexpressed in tumors
(Table 2) and 20 overexpressed (Table 3)(Figure 2). Next, we tested a subset of the cases (9
sporadic PA, 5 non-neoplastic brains) for hsa-miR-124, hsa-miR-129, and hsa-miR-21 using
quantitative PCR. Average miR-124 expression fold change in tumor vs. brain was -17
(p=0.006), miR-129: -15 (p=0.009), and miR-21: 19.8 (p=0.003), respectively (Figure 3A,B.C).
Next, we expanded the control group to include 9 additional non-neoplastic cerebellar examples,
and also tested the 4 NF1-PA. The lowest expression of miR-124 and miR-129 was actually
present in the NF1-PA group, compared to sporadic PA and non-neoplastic brain, while the
converse was true for miR-21 (Figure 3D,E,F). These last differences were also present in the
initial Agilent array profiling experiments (not shown).
Differentially expressed microRNA in NF1 associated vs. BRAF fusion positive tumors
We also searched for specific differences in hsa-microRNA expression among different PA
groups, in particular by anatomic location, pathologic subtype, genetic background, and clinical
aggressiveness, although the differences were not as robust as between tumor and non-neoplastic
brain. A volcano plot using an adjusted p value of 0.05 and fold change of 2 demonstrated 4
microRNAs differentially expressed between NF1-associated and tumors with BRAF alterations:
hsa-miR-650 and hsa-miR-1276 were differentially overexpressed in NF1 tumors (3.7 fold),
while hsa-miR-744* and hsa-miR-187
* were underexpressed (2 and 2.5 fold). However, the
overall expression levels of these microRNAs were relatively low, and further validation of miR-
650 by qRT-PCR was non contributory (data not shown). These findings suggest that expression
differences between NF1-PA and sporadic PA may exist at the miRNA level in addition to the
mRNA level as previously reported37
.
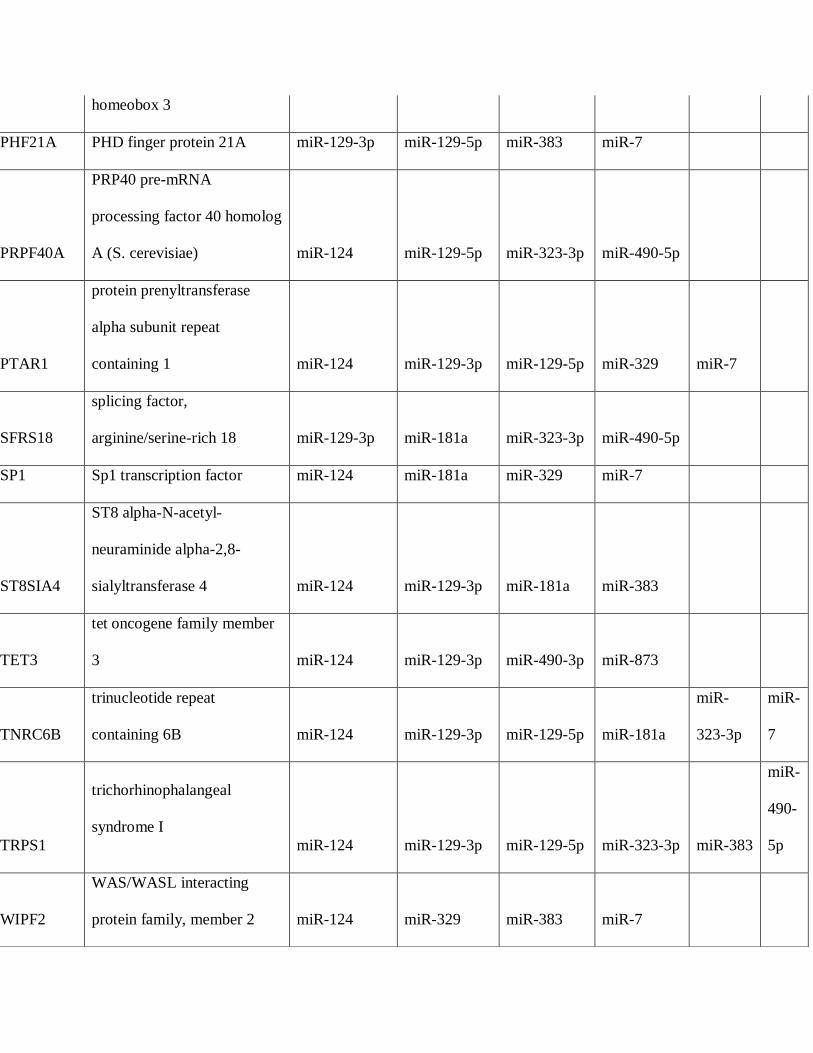
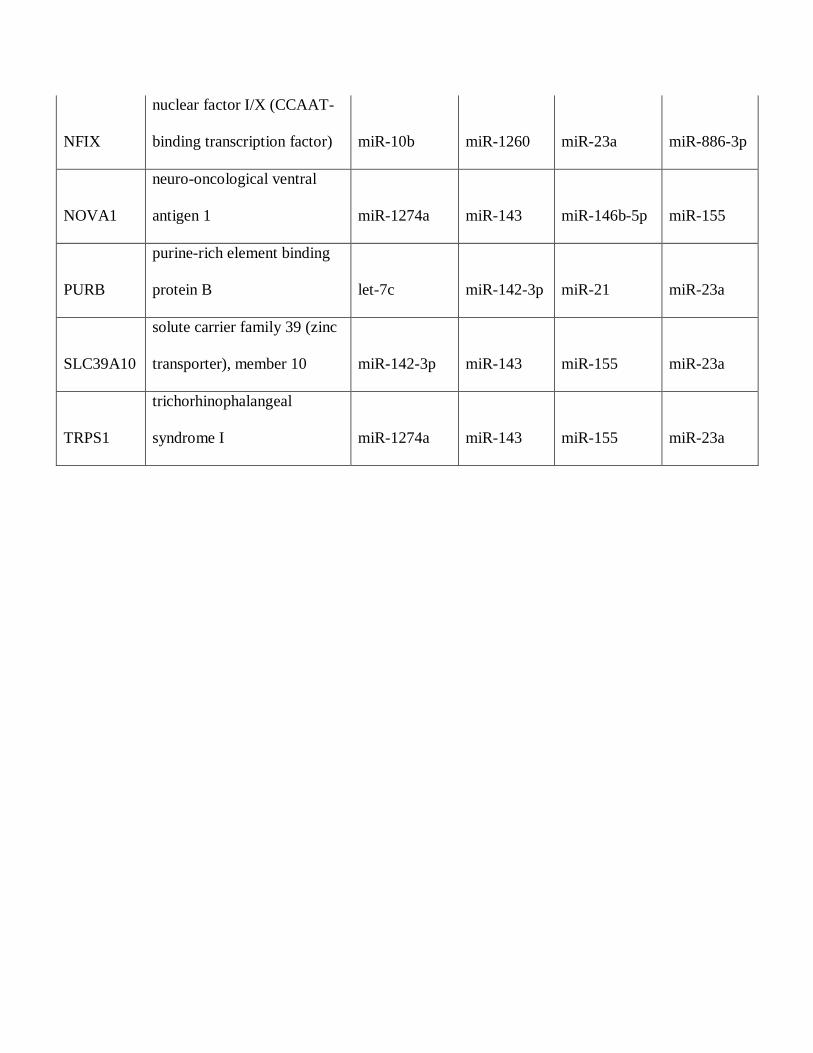
Biologically relevant microRNA targets in PAs
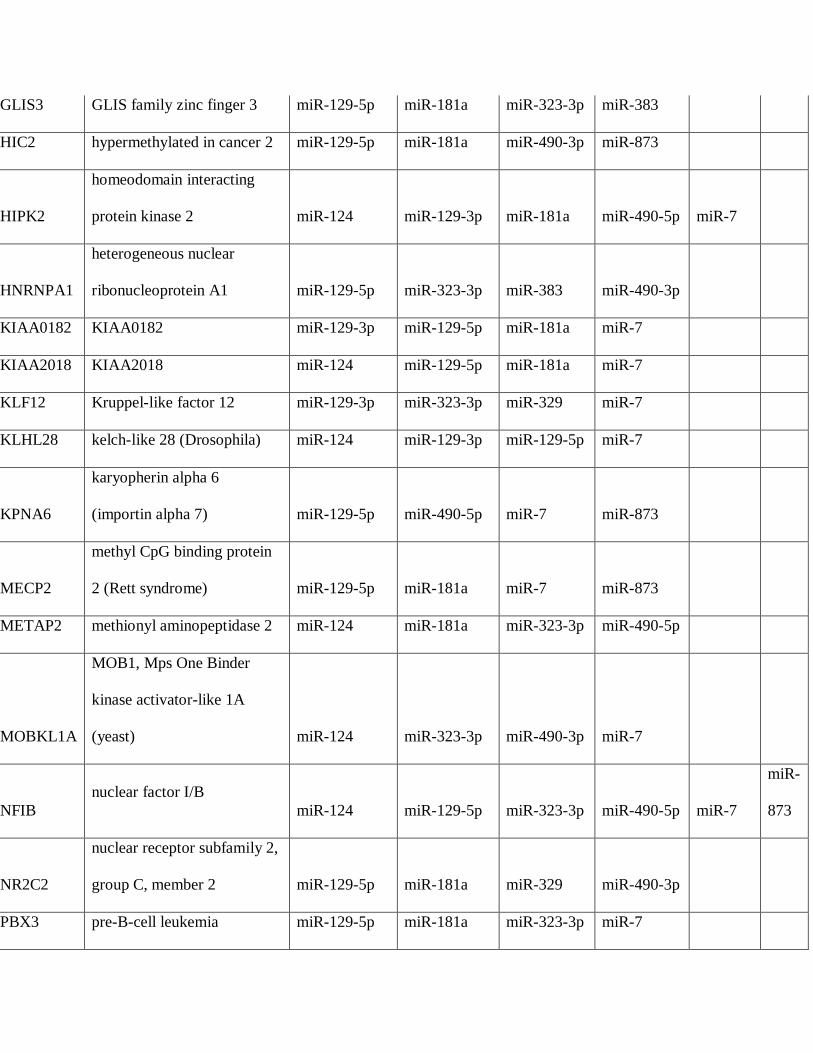
We used the online program TargetScan to discover target mRNAs for microRNAs
differentially expressed in PAs. A total of 36 mRNAs were predicted targets of 4 or more
microRNAs differentially underexpressed in PAs compared to brain, several encoding known
and putative oncoproteins (Table 4), while 10 mRNAs were predicted targets for microRNAs
differentially overexpressed in PAs (Table 5). We searched for these predicted mRNAs in a
combined dataset containing a total of 64 PA and 20 normal brain samples representing different
anatomical regions. Most of these predicted targets were overexpressed in PA compared to
normal brain, and unsupervised clustering demonstrated clear separation between tumor and
brain samples (Figure 4). Conversely, none of the mRNAs predicted targets of overexpressed
microRNAs in PA were underexpressed. When searching for genes differentially expressed in
NF1 vs. BRAF altered tumors, Targetscan search revealed 7 genes that were predicted targets of
the overexpressed microRNAs (miR-650 and miR-1276)(Table 6). There were no combined
predicted targets of -miR-744 and hsa-miR-187.
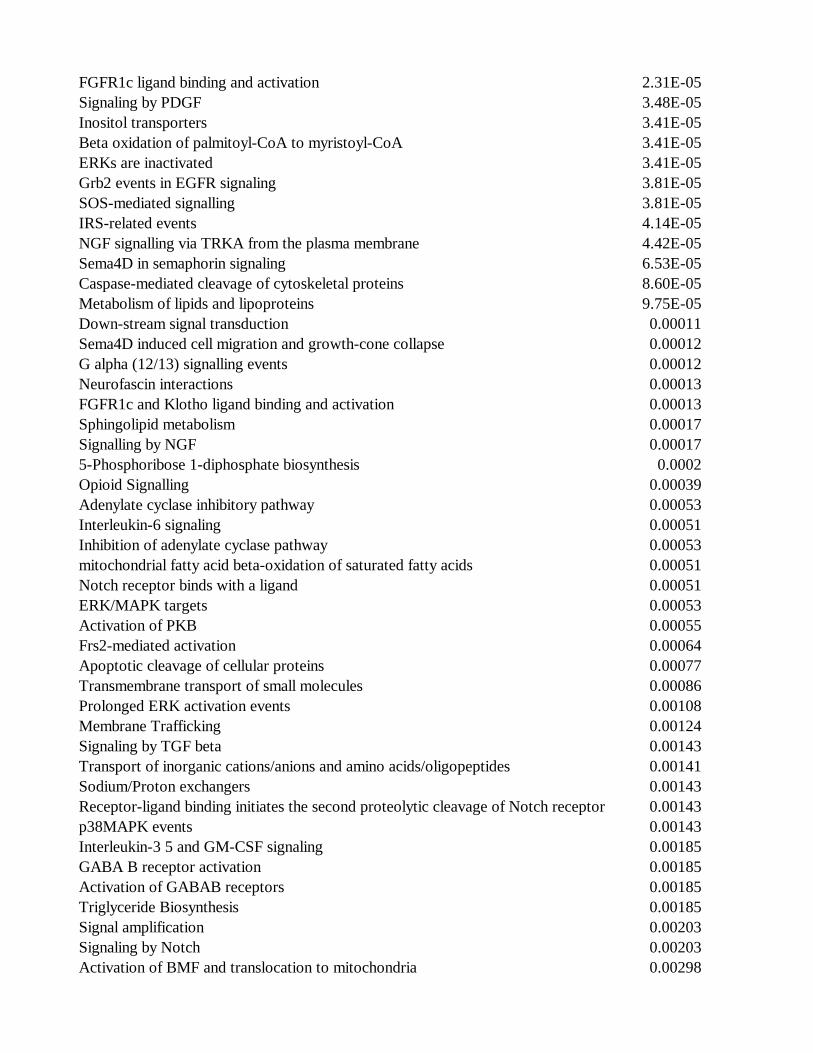
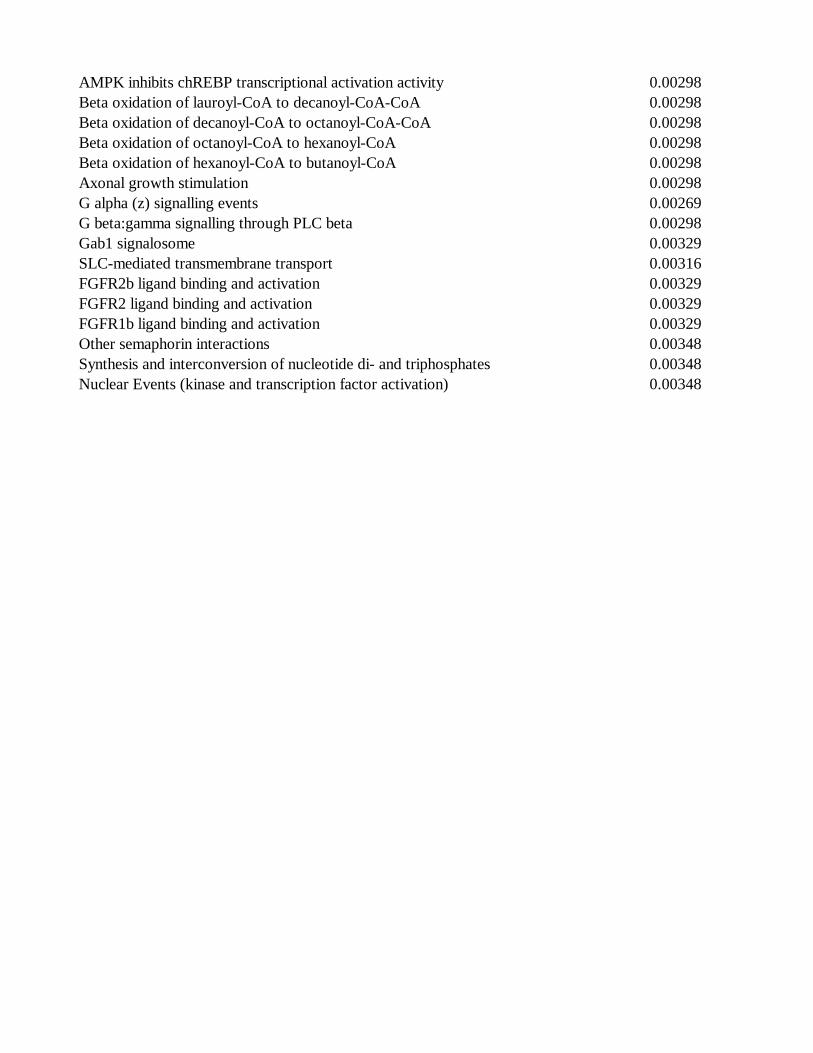
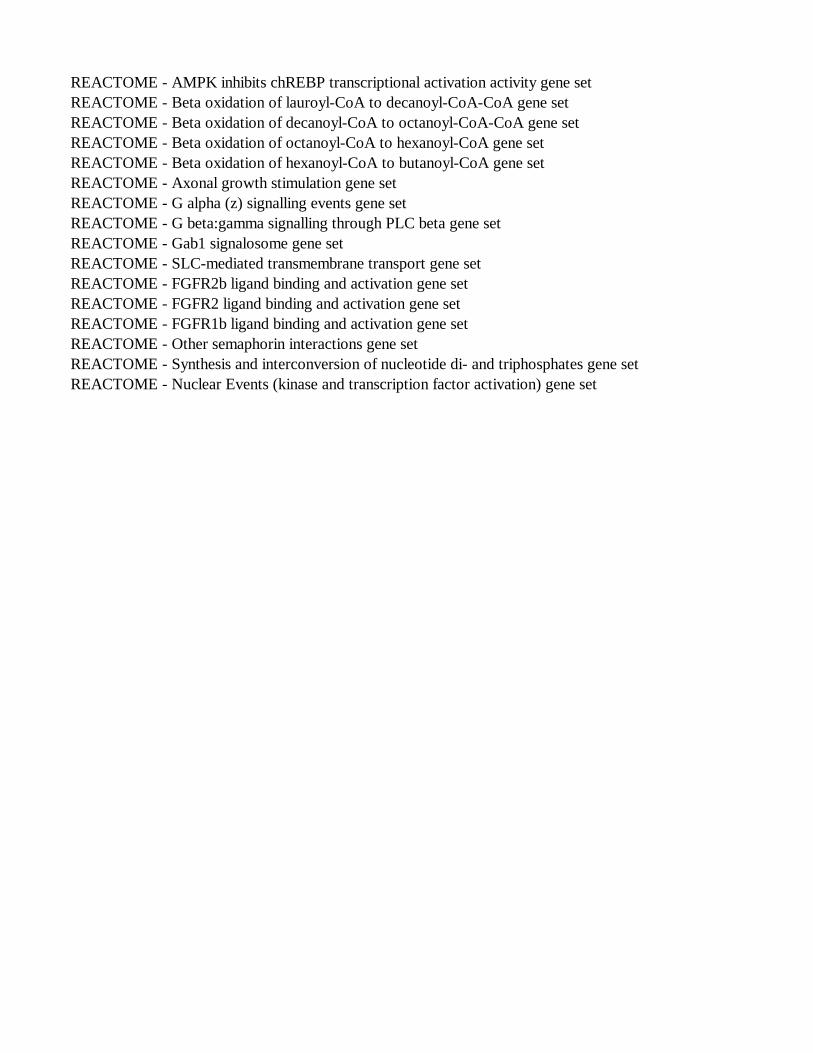
Next, we performed Analysis of Functional Annotation to compare microRNA PA targets
to signaling pathways. Interestingly, many of the gene sets identified for two of the microRNAs
with the lowest differential expression (miR-124 and miR-129-5p) targeted multiple components
of receptor tyrosine kinase/MAPK/ERK signaling pathways (Supplementary tables 1 and 2).
Since microRNAs may have a more important role in interfering with protein translation,
we further tested candidate targets by immunohistochemistry using commercially available
antibodies. From the cases studied for microRNA expression by qRT-PCR, paraffin sections
were available for 5 tumors and 3 cerebral cortex controls. Most of these cases underexpressed
miR-124 (-3.5 to -67 fold) and miR-129 (-1.33 to -772.16 fold) compared to normal brain. In this
subset 5 (of 5) tumor samples showed increased (moderate to marked expression) of the
corresponding predicted targets PBX3 and NFIB, while 2 (of 5) tumors showed increased
expression of METAP2. In this limited dataset, the tightest inverse correlation was noted
between miR-124 expression and NFIB IHC (R2 =0.47, p=0.05), followed by miR-129 and NFIB
(R2=0.30) and miR-129 and PBX3 (R
2=0.23). A linear correlation between miR-124 and
METAP2 was not observed (R2=0.006).
Next, we searched for expression differences of these proteins in a large set of
independent tumors obtained from four different microarrays. We identified strong (3+)PBX3
nuclear staining in most PAs, independent of subtype when compared to non-neoplastic brain
and diffuse gliomas (p<0.001) (Figure 5)(Table 7). Cytoplasmic METAP2 was expressed most
strongly in NF1-associated PAs compared to sporadic PAs (p<0.001), and less so in sporadic
examples, which in turn were mildly overexpressed compared to diffuse gliomas and non-
neoplastic brain(p=0.001) (Figure 5)(Table 7). Strong (3+) nuclear NFIB labeling was also
highest in anaplastic PAs followed by sporadic PAs, compared to non-neoplastic brain and
diffuse gliomas (p<0.001). The kappa statistic comparing the scores from each observer were
0.25 (PBX3), 0.26 (NFIB) and 0.37 (METAP2) reflecting fair agreement on each. Importantly,
the major differences between the groups were also reflected in the individual scores from each
observer (data not shown).
Discussion
Numerous roles have been proposed and studied for microRNA in physiologic and pathologic
states, including cancer. MicroRNA regulation has been a fruitful area of research in brain
cancer, particularly glioblastoma. In fact, extensive post-transcriptional regulatory networks in
this specific tumor type, where microRNAs are key components, have emerged using
bioinformatic and experimental approaches20
.
However, less is known about microRNA regulation of low grade gliomas, and PAs in
particular. MicroRNA and mRNA profiling studies using 4 PA samples have demonstrated
separate clustering for PAs from other pediatric brain tumors28,29
. In a study of WHO grade I–III
astrocytomas, Li et al. identified a number of microRNAs to be underexpressed in all glioma
grades compared to brain, including miR-12421
, which in our study was differentially
underexpressed as well.
miR-21 seems to target multiple components of key tumor suppressor and anti-apoptotic
pathways, including p53, transforming growth factor beta, and mitochondria 39-42
, as well as
matrix metalloproteinases, which contribute to invasion in glioma43
. Elevation of miR-21 has
been found in a variety of tumor types compared to normal tissues, and highlights the potential
of microRNA to serve as glioma biomarkers, for example in cerebrospinal fluid samples44
. One
important (but not exclusive) target, of miR-21 is PTEN, a key suppressor of the
PI3K/AKT/mTOR pathway. PTEN loss is a frequent molecular property of high grade gliomas,
and we have previously observed decreased levels in PAs with aggressive histologic features45
.
One of the main patterns identified in the current study is relative underexpression of a
subset of microRNAs in PAs compared to non-neoplastic brain, several of which may target
known and putative oncogenes. MiR-124 is enriched in brain tissue, is downregulated in
glioblastoma, and negatively affects glioblastoma proliferation and migration in vitro21,46
.
Several miR-129 cluster members were underexpressed in PAs in our study. Other investigators
have also found this microRNA to be underexpressed in pediatric brain tumors, including four
PAs28
.
We also found increased gene expression and protein levels of putative oncogenes that
may be important in the biology of PA, and appeared to be targets of microRNA sets relatively
underexpressed in PAs compared to non-neoplastic brain. This is a novel aspect of our study,
since these oncoproteins have not been associated with PA before, but may provide insights into
low grade glioma biology. Many oncoproteins in pediatric brain tumors play essential roles
during central nervous system development. For example, PBX3 (pre-B-cell leukemia homeobox
3) is one member of a group of PBX transcription factors belonging to the TALE (three amino
acid loop extension) homeobox gene family. They seem to play important developmental roles
and affect gene signatures associated with cancers, particularly of hematolymphoid origin. In the
nervous system PBX3 is expressed in many anatomical regions during development, including
areas of the medulla oblongata responsible for respiration control47
. In fact, Pbx3 null mice die
from central respiratory failure47
. Pbx3 also seems to be important in the development of a subset
of glutaminergic neurons in the developing dorsal horn of the spinal cord in murine studies48
, as
well as the striatum and intercalated cell masses of the amygdala in monkey and rat49,50
.
Recent studies have described post-transcriptional regulation of PBX3 in cancer,
particularly by microRNAs. Downregulation of miR-181a and upregulation of a gene expression
signature that includes PBX3, was associated with an adverse outcome in cytogenetically
abnormal acute myeloid leukemia51
. However, PBX3 has been found to play a role in non
lymphoid malignancies as well, including prostate cancer, where it may be regulated by a
different microRNA (e.g. Let 7d) in response to androgen52
. In the current study we identified
underexpression of miR-181a and increased PBX3 mRNA and protein levels in PAs compared to
normal brain. Furthermore, PBX3 nuclear staining was higher in PAs compared to diffuse
gliomas, which raises the possibility that PBX3 may play a relatively specific role in PAs
compared to other gliomas. However, this finding will require further confirmation by alternative
methods, functional experiments and independent samples in the future.
In the current study a subset of underexpressed microRNAs also had methionine
aminopeptidase 2 (METAP2) as a predicted target. METAP2 functions include facilitation of
protein translation53
, probably by protecting eukaryotic initiation factor 2 from inhibition by
phosphorylation54]. When evaluating protein levels by immunohistochemistry, the highest levels
were present in NF1-associated PAs, with a more modest elevation in some sporadic PAs. Of
relevance to our present, METAP2 was identified to be elevated in the cerebrospinal fluid of
mice with optic gliomas, and NF1-associated PAs in human and murine optic glioma tissue54
. In
the same study, METAP2 was not overexpressed in Tsc1-deficient mouse brains or TSC-
associated tumors, nor was it overexpressed in the small number of sporadic PA we examined,
and therefore increased levels were a consequence of neurofibromin loss and a property of NF1-
associated tumors. METAP2 represents an attractive therapeutic target, since it is inactivated by
fumagillin, a known fungal toxin55
. METAP2 mRNA and/or protein overexpression has been
reported in several cancers, including cholangiocarcinoma56
, colorectal carcinoma57
, and
mesothelioma58
. Fumagillin also inhibits hepatocellular carcinoma growth in vivo59
, and
pharmacologic inhibition of METAP2 also inhibits melanoma growth60
.
Another predicted target of a subset of underexpressed microRNAs with increased
mRNA and protein levels in PAs was NFIB. NFIB, a CCAAT box-binding transcription factor,
has been implicated as an oncogene in other tumors, being amplified in small cell carcinoma of
the lung61
, overexpressed in breast cancer subsets62
, and is involved in a novel fusion in salivary
gland tumors and adenoid cystic carcinoma of the breast63,64
. Additionally, NFIB functionally
validated as a target of miR-124, with a number of proteins being downregulated by miR-124
introduction in cultured HeLa cells at the protein and mRNA level, including NFIB65
.
Interestingly, we saw an inverse correlation between miR-124 and NFIB extent of expression in
the limited number of cases tested (5 S-PA and 3 brain controls).
Our results highlight the complementary value of microRNA profiling in the
identification of biologically relevant targets in pediatric low grade glioma. The most notable
differences were between PA tumors and pediatric brain tissues. As a cautionary note, it must be
noted that for the initial profiling experiments, 3 (of 5) of the non-neoplastic brain samples were
obtained from cortex, while most PA arise in the cerebellum or in the optic pathways. We did
find the same microRNA expression differences in additional cerebellar samples by qRT-PCR,
but unfortunately we were unable to test optic pathway normal samples, given the difficulties in
obtaining them as normal controls.
Modest differences between different tumor subsets, by location, histologic and
molecular subtypes, were also observed but to a lesser extent. By looking at combined fold
change differences and statistical significance, asubset of microRNAs were differentially
expressed in NF1-associated PA compared to tumors with BRAF alterations. In addition, the
expression differences for miR-21, miR-124, and miR-129 that were subsequently validated by
qRT-PCR were more conspicuous in the NF1-PA group. However, given the relatively small
number (4 tumors) tested in this study, the findings must be interpreted with caution and must be
validated in the future in larger tumor datasets.
Prior mRNA gene expression studies which have identified clear molecular differences in
PAs by anatomic site and NF1 status37,66
, as well as specific transcriptional regulatory networks
for PA67
. Of note, in a recent study repressed expression of ONECUT2 was part of a PA specific
transcriptional network67
, and we identified it as a predicted target of two microRNAs
differentially overexpressed in NF1-associated PA.
Our study has revealed some novel, putative oncogene targets that may be specifically
upregulated in PA compared to brain and diffuse gliomas. However, it is possible that specific
microRNAs in PA may be regulated (or regulate) by canonical pathways that have been
validated to play key roles in PA biology. One such pathway is MAPK, which is constitutively
activated in the vast majority of PA by rearrangements and/or mutations involving BRAF and its
family members3,5,6,8,9,12
. Interestingly, miR-21 is up-regulated by increased MAPK activity in
breast cancer68
, as well as in v-Ki-ras transformed NIH3T3 (DT) cells (compared to
nontransformed NIH3T3 cells)69
, and therefore acts as a downstream effector in this pathway. As
mentioned above, miR-124 is enriched in brain, and is evolutionarily conserved even in other
species, including snails. In a study focusing on the marine snail Aplysia, serotonin
downregulates miR-124, an effect that is abolished by MAPK inhibition70
, suggesting that
MAPK is a negative regulator of miR-124. Interestingly, through our analysis of functional
annotation analysis we found multiple sets of receptor tyrosine kinase/MAPK/ERK signaling
components as possible targets. Collectively, these prior observations and our findings raise the
intriguing possibility that MAPK pathway activation leads to alterations in key microRNA
levels, that these microRNAs may be important downstream mediators of the pathway in PA,
and may also themselves regulate pathway components. This interesting possibility merits
further study.
In summary, we have identified molecular differences based on microRNA expression
levels in a large cohort of pediatric PAs compared with human brain samples. Some investigators
have highlighted current limitations in microRNA profiling in pediatric brain tumors29
, which
may require platforms with larger microRNA coverage and increased samples sizes. However, in
the current study we demonstrate the feasibility in microRNA profiling as a novel approach to
identify relevant targets in PA. Furthermore, we have identified increases in protein levels of
putative oncogenes that may be of relevance to PA biology. At the present time suitable in vivo
or in vitro models to follow these observations are lacking but may become available in the near
future. Additional studies are needed to confirm our findings, address the possible functional
consequences and clinical relevance for pathologic diagnosis and management of PA patients.
Acknowledgements
The authors also acknowledge Wayne Yu at the Sidney Kimmel Cancer Center Microarray Core
Facility of Johns Hopkins for excellent technical assistance.
References
1. Tihan T, Fisher PG, Kepner JL, et al. Pediatric astrocytomas with monomorphous
pilomyxoid features and a less favorable outcome. J Neuropathol Exp Neurol. Oct
1999;58(10):1061-1068.
2. Rodriguez FJ, Scheithauer BW, Burger PC, Jenkins S, Giannini C. Anaplasia in pilocytic
astrocytoma predicts aggressive behavior. Am J Surg Pathol. Feb 2010;34(2):147-160.
3. Bar EE, Lin A, Tihan T, Burger PC, Eberhart CG. Frequent gains at chromosome 7q34
involving BRAF in pilocytic astrocytoma. J Neuropathol Exp Neurol. Sep
2008;67(9):878-887.
4. Dougherty MJ, Santi M, Brose MS, et al. Activating mutations in BRAF characterize a
spectrum of pediatric low-grade gliomas. Neuro Oncol. Jul 2010;12(7):621-630.
5. Jacob K, Albrecht S, Sollier C, et al. Duplication of 7q34 is specific to juvenile pilocytic
astrocytomas and a hallmark of cerebellar and optic pathway tumours. Br J Cancer. Aug
18 2009;101(4):722-733.
6. Jones DT, Kocialkowski S, Liu L, et al. Tandem duplication producing a novel oncogenic
BRAF fusion gene defines the majority of pilocytic astrocytomas. Cancer Res. Nov 1
2008;68(21):8673-8677.
7. Lin A, Rodriguez FJ, Karajannis MA, et al. BRAF alterations in primary glial and
glioneuronal neoplasms of the central nervous system with identification of 2 novel
KIAA1549: BRAF fusion variants. J Neuropathol Exp Neurol. Jan 2012;71(1):66-72.
8. Pfister S, Janzarik WG, Remke M, et al. BRAF gene duplication constitutes a mechanism
of MAPK pathway activation in low-grade astrocytomas. J Clin Invest. May
2008;118(5):1739-1749.
9. Sievert AJ, Jackson EM, Gai X, et al. Duplication of 7q34 in pediatric low-grade
astrocytomas detected by high-density single-nucleotide polymorphism-based genotype
arrays results in a novel BRAF fusion gene. Brain Pathol. Jul 2009;19(3):449-458.
10. Yu J, Deshmukh H, Gutmann RJ, et al. Alterations of BRAF and HIPK2 loci
predominate in sporadic pilocytic astrocytoma. Neurology. Nov 10 2009;73(19):1526-
1531.
11. Cin H, Meyer C, Herr R, et al. Oncogenic FAM131B-BRAF fusion resulting from 7q34
deletion comprises an alternative mechanism of MAPK pathway activation in pilocytic
astrocytoma. Acta Neuropathol. Jun 2011;121(6):763-774.
12. Jones DT, Kocialkowski S, Liu L, Pearson DM, Ichimura K, Collins VP. Oncogenic
RAF1 rearrangement and a novel BRAF mutation as alternatives to KIAA1549:BRAF
fusion in activating the MAPK pathway in pilocytic astrocytoma. Oncogene. May 21
2009;28(20):2119-2123.
13. Rodriguez FJ, Perry A, Gutmann DH, et al. Gliomas in neurofibromatosis type 1: a
clinicopathologic study of 100 patients. J Neuropathol Exp Neurol. Mar 2008;67(3):240-
249.
14. Jones DT, Gronych J, Lichter P, Witt O, Pfister SM. MAPK pathway activation in
pilocytic astrocytoma. Cell Mol Life Sci. Dec 13 2011.
15. Chan JA, Krichevsky AM, Kosik KS. MicroRNA-21 is an antiapoptotic factor in human
glioblastoma cells. Cancer Res. Jul 15 2005;65(14):6029-6033.
16. Ciafre SA, Galardi S, Mangiola A, et al. Extensive modulation of a set of microRNAs in
primary glioblastoma. Biochem Biophys Res Commun. Sep 9 2005;334(4):1351-1358.
17. Kefas B, Godlewski J, Comeau L, et al. microRNA-7 inhibits the epidermal growth
factor receptor and the Akt pathway and is down-regulated in glioblastoma. Cancer Res.
May 15 2008;68(10):3566-3572.
18. Medina R, Zaidi SK, Liu CG, et al. MicroRNAs 221 and 222 bypass quiescence and
compromise cell survival. Cancer Res. Apr 15 2008;68(8):2773-2780.
19. Shi L, Cheng Z, Zhang J, et al. hsa-mir-181a and hsa-mir-181b function as tumor
suppressors in human glioma cells. Brain Res. Oct 21 2008;1236:185-193.
20. Sumazin P, Yang X, Chiu HS, et al. An extensive microRNA-mediated network of RNA-
RNA interactions regulates established oncogenic pathways in glioblastoma. Cell. Oct 14
2011;147(2):370-381.
21. Li D, Chen P, Li XY, et al. Grade-specific expression profiles of miRNAs/mRNAs and
docking study in human grade I-III astrocytomas. Omics. Oct 2011;15(10):673-682.
22. Nicoloso MS, Calin GA. MicroRNA involvement in brain tumors: from bench to
bedside. Brain pathology (Zurich, Switzerland). Jan 2008;18(1):122-129.
23. Lu J, Getz G, Miska EA, et al. MicroRNA expression profiles classify human cancers.
Nature. Jun 9 2005;435(7043):834-838.
24. White FV, Anthony DC, Yunis EJ, Tarbell NJ, Scott RM, Schofield DE. Nonrandom
chromosomal gains in pilocytic astrocytomas of childhood. Hum Pathol. Sep
1995;26(9):979-986.
25. Cioffi JA, Yue WY, Mendolia-Loffredo S, Hansen KR, Wackym PA, Hansen MR.
MicroRNA-21 overexpression contributes to vestibular schwannoma cell proliferation
and survival. Otol Neurotol. Dec 2010;31(9):1455-1462.
26. Erkan EP, Breakefield XO, Saydam O. miRNA signature of schwannomas: possible
role(s) of "tumor suppressor" miRNAs in benign tumors. Oncotarget. Mar
2011;2(3):265-270.
27. Saydam O, Senol O, Wurdinger T, et al. miRNA-7 attenuation in Schwannoma tumors
stimulates growth by upregulating three oncogenic signaling pathways. Cancer Res. Feb
1 2011;71(3):852-861.
28. Birks DK, Barton VN, Donson AM, Handler MH, Vibhakar R, Foreman NK. Survey of
MicroRNA expression in pediatric brain tumors. Pediatr Blood Cancer. Feb
2011;56(2):211-216.
29. Sredni ST, Huang CC, Bonaldo Mde F, Tomita T. MicroRNA expression profiling for
molecular classification of pediatric brain tumors. Pediatr Blood Cancer. Jul 15
2011;57(1):183-184.
30. Costa FF, Bischof JM, Vanin EF, et al. Identification of microRNAs as potential
prognostic markers in ependymoma. PLoS One. 2011;6(10):e25114.
31. Cahill S, Smyth P, Denning K, et al. Effect of BRAFV600E mutation on transcription
and post-transcriptional regulation in a papillary thyroid carcinoma model. Mol Cancer.
2007;6:21.
32. Croce CM, Calin GA. miRNAs, cancer, and stem cell division. Cell. Jul 15
2005;122(1):6-7.
33. Wang H, Ach RA, Curry B. Direct and sensitive miRNA profiling from low-input total
RNA. RNA. Jan 2007;13(1):151-159.
34. Winer J, Jung CK, Shackel I, Williams PM. Development and validation of real-time
quantitative reverse transcriptase-polymerase chain reaction for monitoring gene
expression in cardiac myocytes in vitro. Anal Biochem. May 15 1999;270(1):41-49.
35. Lewis BP, Burge CB, Bartel DP. Conserved seed pairing, often flanked by adenosines,
indicates that thousands of human genes are microRNA targets. Cell. Jan 14
2005;120(1):15-20.
36. Ross AE, Marchionni L, Vuica-Ross M, et al. Gene expression pathways of high grade
localized prostate cancer. Prostate. Feb 25 2011.
37. Rodriguez FJ, Giannini C, Asmann YW, et al. Gene expression profiling of NF-1-
associated and sporadic pilocytic astrocytoma identifies aldehyde dehydrogenase 1
family member L1 (ALDH1L1) as an underexpressed candidate biomarker in aggressive
subtypes. J Neuropathol Exp Neurol. Dec 2008;67(12):1194-1204.
38. McCall MN, Bolstad BM, Irizarry RA. Frozen robust multiarray analysis (fRMA).
Biostatistics. Apr 2010;11(2):242-253.
39. Papagiannakopoulos T, Shapiro A, Kosik KS. MicroRNA-21 targets a network of key
tumor-suppressive pathways in glioblastoma cells. Cancer Res. Oct 1 2008;68(19):8164-
8172.
40. Chan JA, Krichevsky AM, Kosik KS. MicroRNA-21 is an antiapoptotic factor in human
glioblastoma cells. Cancer Res. Jul 15 2005;65(14):6029-6033.
41. Chen Y, Liu W, Chao T, et al. MicroRNA-21 down-regulates the expression of tumor
suppressor PDCD4 in human glioblastoma cell T98G. Cancer Lett. Dec 18
2008;272(2):197-205.
42. Li Y, Li W, Yang Y, et al. MicroRNA-21 targets LRRFIP1 and contributes to VM-26
resistance in glioblastoma multiforme. Brain Res. Aug 25 2009;1286:13-18.
43. Gabriely G, Wurdinger T, Kesari S, et al. MicroRNA 21 promotes glioma invasion by
targeting matrix metalloproteinase regulators. Mol Cell Biol. Sep 2008;28(17):5369-
5380.
44. Baraniskin A, Kuhnhenn J, Schlegel U, et al. Identification of microRNAs in the
cerebrospinal fluid as biomarker for the diagnosis of glioma. Neuro Oncol. Jan
2012;14(1):29-33.
45. Rodriguez EF, Scheithauer BW, Giannini C, et al. PI3K/AKT pathway alterations are
associated with clinically aggressive and histologically anaplastic subsets of pilocytic
astrocytoma. Acta Neuropathol. Mar 2011;121(3):407-420.
46. Silber J, Lim DA, Petritsch C, et al. miR-124 and miR-137 inhibit proliferation of
glioblastoma multiforme cells and induce differentiation of brain tumor stem cells. BMC
Med. 2008;6:14.
47. Rhee JW, Arata A, Selleri L, et al. Pbx3 deficiency results in central hypoventilation. Am
J Pathol. Oct 2004;165(4):1343-1350.
48. Rottkamp CA, Lobur KJ, Wladyka CL, Lucky AK, O'Gorman S. Pbx3 is required for
normal locomotion and dorsal horn development. Dev Biol. Feb 1 2008;314(1):23-39.
49. Takahashi K, Liu FC, Oishi T, et al. Expression of FOXP2 in the developing monkey
forebrain: comparison with the expression of the genes FOXP1, PBX3, and MEIS2. J
Comp Neurol. Jul 10 2008;509(2):180-189.
50. Kaoru T, Liu FC, Ishida M, et al. Molecular characterization of the intercalated cell
masses of the amygdala: implications for the relationship with the striatum.
Neuroscience. Mar 10 2010;166(1):220-230.
51. Li Z, Huang H, Li Y, et al. Up-regulation of a HOXA-PBX3 homeobox-gene signature
following down-regulation of miR-181 is associated with adverse prognosis in patients
with cytogenetically-abnormal AML. Blood. Jan 17 2012.
52. Ramberg H, Alshbib A, Berge V, Svindland A, Tasken KA. Regulation of PBX3
expression by androgen and Let-7d in prostate cancer. Mol Cancer. 2011;10:50.
53. Datta B, Majumdar A, Datta R, Balusu R. Treatment of cells with the angiogenic
inhibitor fumagillin results in increased stability of eukaryotic initiation factor 2-
associated glycoprotein, p67, and reduced phosphorylation of extracellular signal-
regulated kinases. Biochemistry. Nov 23 2004;43(46):14821-14831.
54. Dasgupta B, Yi Y, Hegedus B, Weber JD, Gutmann DH. Cerebrospinal fluid proteomic
analysis reveals dysregulation of methionine aminopeptidase-2 expression in human and
mouse neurofibromatosis 1-associated glioma. Cancer Res. Nov 1 2005;65(21):9843-
9850.
55. Sin N, Meng L, Wang MQ, Wen JJ, Bornmann WG, Crews CM. The anti-angiogenic
agent fumagillin covalently binds and inhibits the methionine aminopeptidase, MetAP-2.
Proc Natl Acad Sci U S A. Jun 10 1997;94(12):6099-6103.
56. Sawanyawisuth K, Wongkham C, Pairojkul C, et al. Methionine aminopeptidase 2 over-
expressed in cholangiocarcinoma: potential for drug target. Acta Oncol. 2007;46(3):378-
385.
57. Selvakumar P, Lakshmikuttyamma A, Dimmock JR, Sharma RK. Methionine
aminopeptidase 2 and cancer. Biochim Biophys Acta. Apr 2006;1765(2):148-154.
58. Catalano A, Romano M, Robuffo I, Strizzi L, Procopio A. Methionine aminopeptidase-2
regulates human mesothelioma cell survival: role of Bcl-2 expression and telomerase
activity. Am J Pathol. Aug 2001;159(2):721-731.
59. Sheen IS, Jeng KS, Jeng WJ, et al. Fumagillin treatment of hepatocellular carcinoma in
rats: an in vivo study of antiangiogenesis. World J Gastroenterol. Feb 14 2005;11(6):771-
777.
60. Hannig G, Lazarus DD, Bernier SG, et al. Inhibition of melanoma tumor growth by a
pharmacological inhibitor of MetAP-2, PPI-2458. Int J Oncol. Apr 2006;28(4):955-963.
61. Dooley AL, Winslow MM, Chiang DY, et al. Nuclear factor I/B is an oncogene in small
cell lung cancer. Genes Dev. Jul 15 2011;25(14):1470-1475.
62. Moon HG, Hwang KT, Kim JA, et al. NFIB is a potential target for estrogen receptor-
negative breast cancers. Mol Oncol. Dec 2011;5(6):538-544.
63. Mitani Y, Rao PH, Futreal PA, et al. Novel chromosomal rearrangements and break
points at the t(6;9) in salivary adenoid cystic carcinoma: association with MYB-NFIB
chimeric fusion, MYB expression, and clinical outcome. Clin Cancer Res. Nov 15
2011;17(22):7003-7014.
64. Wetterskog D, Lopez-Garcia MA, Lambros MB, et al. Adenoid cystic carcinomas
constitute a genomically distinct subgroup of triple-negative and basal-like breast
cancers. J Pathol. Jan 2012;226(1):84-96.
65. Baek D, Villen J, Shin C, Camargo FD, Gygi SP, Bartel DP. The impact of microRNAs
on protein output. Nature. Sep 4 2008;455(7209):64-71.
66. Sharma MK, Mansur DB, Reifenberger G, et al. Distinct genetic signatures among
pilocytic astrocytomas relate to their brain region origin. Cancer Res. Feb 1
2007;67(3):890-900.
67. Deshmukh H, Yu J, Shaik J, et al. Identification of transcriptional regulatory networks
specific to pilocytic astrocytoma. BMC Med Genomics. 2011;4:57.
68. Huang TH, Wu F, Loeb GB, et al. Up-regulation of miR-21 by HER2/neu signaling
promotes cell invasion. J Biol Chem. Jul 3 2009;284(27):18515-18524.
69. Loayza-Puch F, Yoshida Y, Matsuzaki T, Takahashi C, Kitayama H, Noda M. Hypoxia
and RAS-signaling pathways converge on, and cooperatively downregulate, the RECK
tumor-suppressor protein through microRNAs. Oncogene. May 6 2010;29(18):2638-
2648.
70. Rajasethupathy P, Fiumara F, Sheridan R, et al. Characterization of small RNAs in
Aplysia reveals a role for miR-124 in constraining synaptic plasticity through CREB.
Neuron. Sep 24 2009;63(6):803-817.
Figure Legends
Figure 1: A subset of microRNAs are differentially expressed between pilocytic
astrocytomas (PAs) and non-neoplastic brain. Heatmap illustrates expression differences
between PAs and non-neoplastic brain as illustrated by hierarchical clustering. The non-
neoplastic brain controls, representing cortex (C1-3), as well as fetal (C4) and pediatric
cerebellum (C5)(box). Data was obtained using the Agilent miRNA Microarray V3 kit platform.
Figure 2: Differential microRNA expression in PAs compared with non-neoplastic brain.
Volcano plot illustrates microRNA expression differences between PA and non-neoplastic brain
based on a cutoff value of 2 fold differential expression and adjusted p value <0.05.
Figure 3: Differential expression of microRNAs between PAs and non-neoplastic brain
confirmed by qRT-PCR. miR-124 (A) and miR-129 (B) were relatively underexpressed in
sporadic PA (n=9) compared to non-neoplastic brain (pediatric cerebellum (n=1), cortex (n=3),
and fetal cerebellum (n=1)), while miR-21 was relatively overexpressed (C) in an internal
validation experiment. Additionally, independent non-neoplastic cerebellar samples and the 4
NF1-associated PA were analyzed. The lowest expression of miR-124 (D) and miR-129 (E) was
evident in NF1-PA (n=4), compared to sporadic PA (n=9) and non-neoplastic brain controls
(cortex n=3, cerebellum n=11). An opposite effect was observed with miR-21 (F). Each dot
represents the average of three replicates. Error bars are illustrated. p values were obtained by the
Wilcoxon rank sum test.
Figure 4: microRNA predicted mRNA target differences in PAs and non-neoplastic brain
samples. Unsupervised hierarchical clustering of normal brain and PA cases according to the
expression of the genes targeted by the identified microRNAs down-regulated in PA (profiling
by Affymetrix HG-U133 Plus 2.0 chips). Target genes are shown by row, while the different
samples are shown by column. A total of 64 PAs were studied. Non-neoplastic controls included
cerebral cortex (CC)(n=9), hypothalamus (n=8), and cerebellum (Cbll)(n=3). The centered
Pearson’s distance and the Ward’s clustering methods were used. The color scale represents
increased (red) or decreased (green) gene expression.
Figure 5: microRNA protein target differences in PAs and non-neoplastic brain samples.
Proteins that were predicted to be targets of differentially underexpressed microRNAs in PAs,
included putative oncogenes such as PBX3, METAP2 and NFIB. Using immunohistochemistry
on tissue microarray sections, PBX3 and NFIB demonstrated strong nuclear staining in PAs
compared to brain, while METAP2 demonstrated modest cytoplasmic staining in a subset of
PAs, and was strongest in NF1-associated PAs.
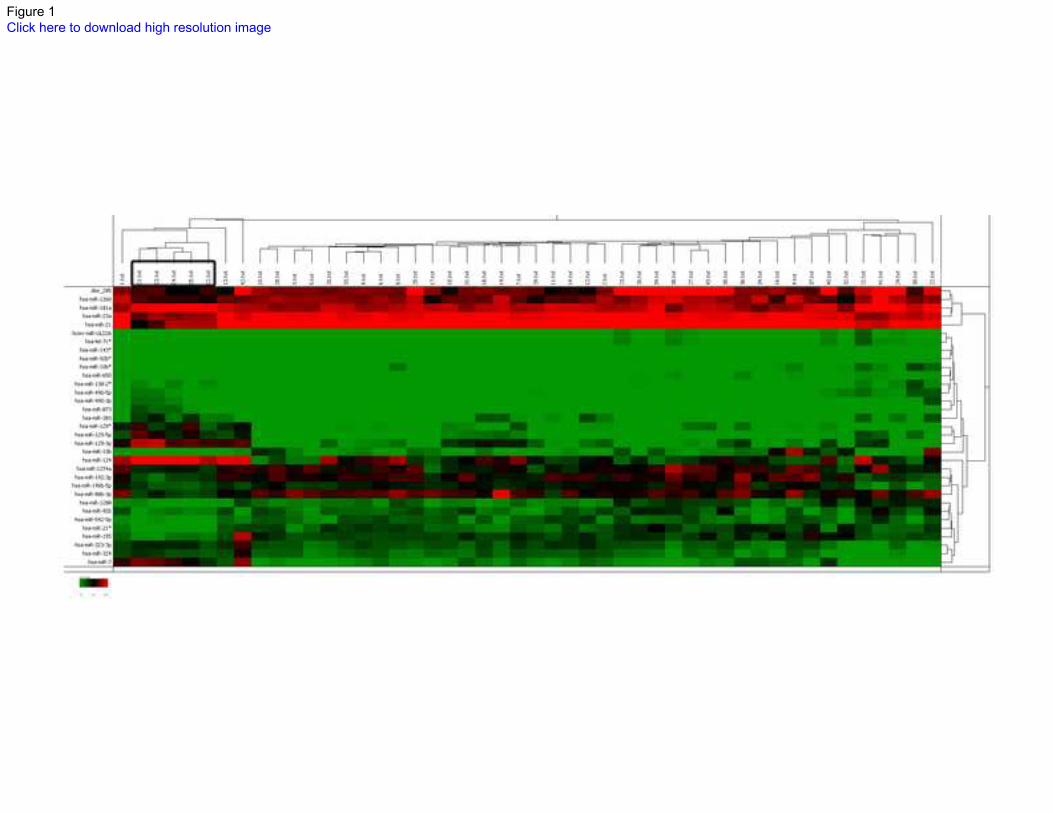
Figure 1Click here to download high resolution image
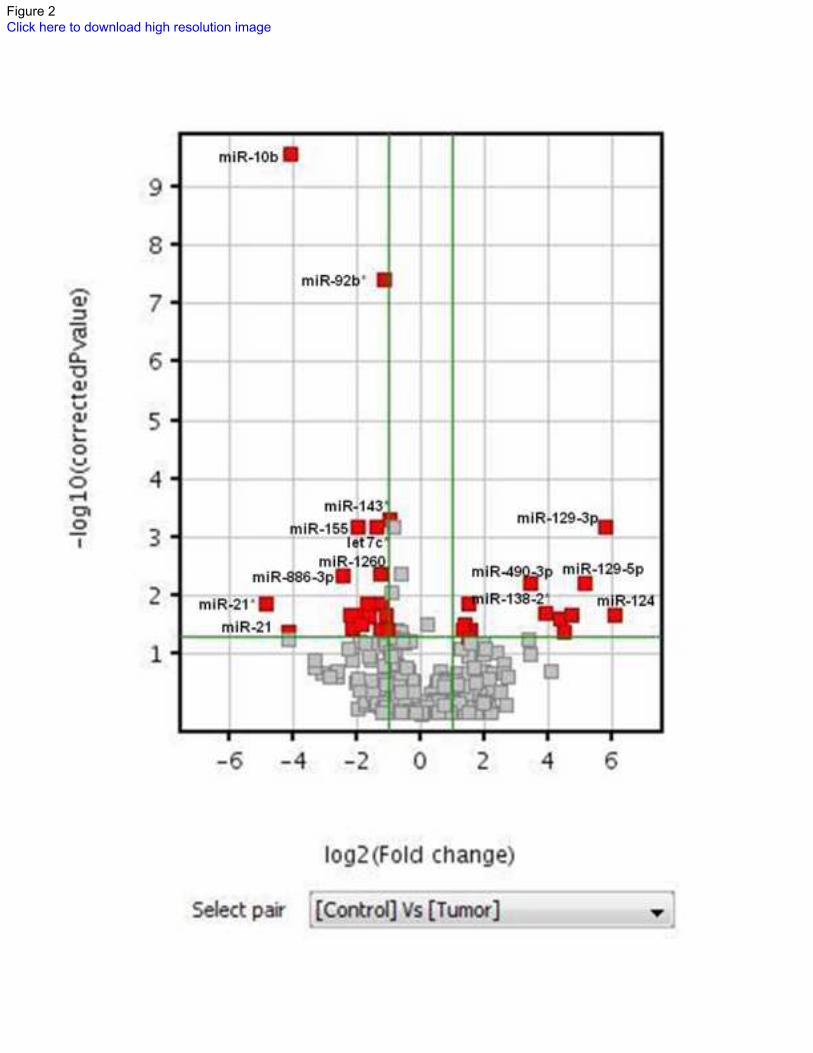
Figure 2Click here to download high resolution image
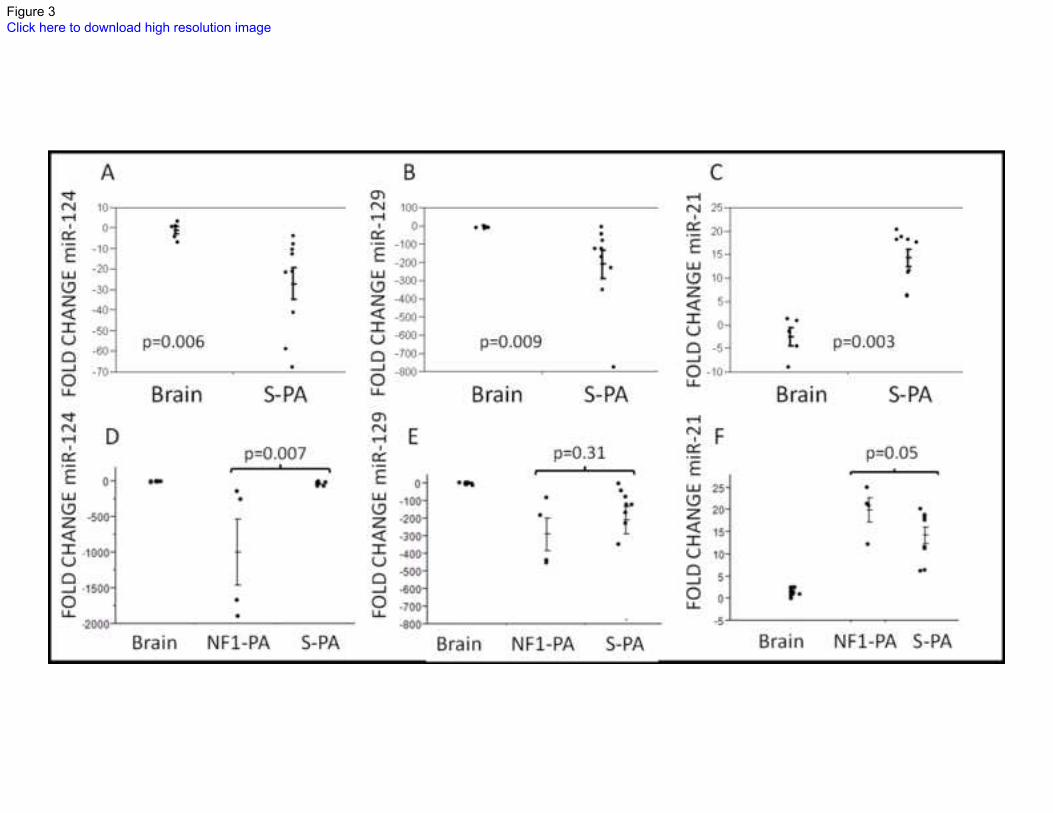
Figure 3Click here to download high resolution image
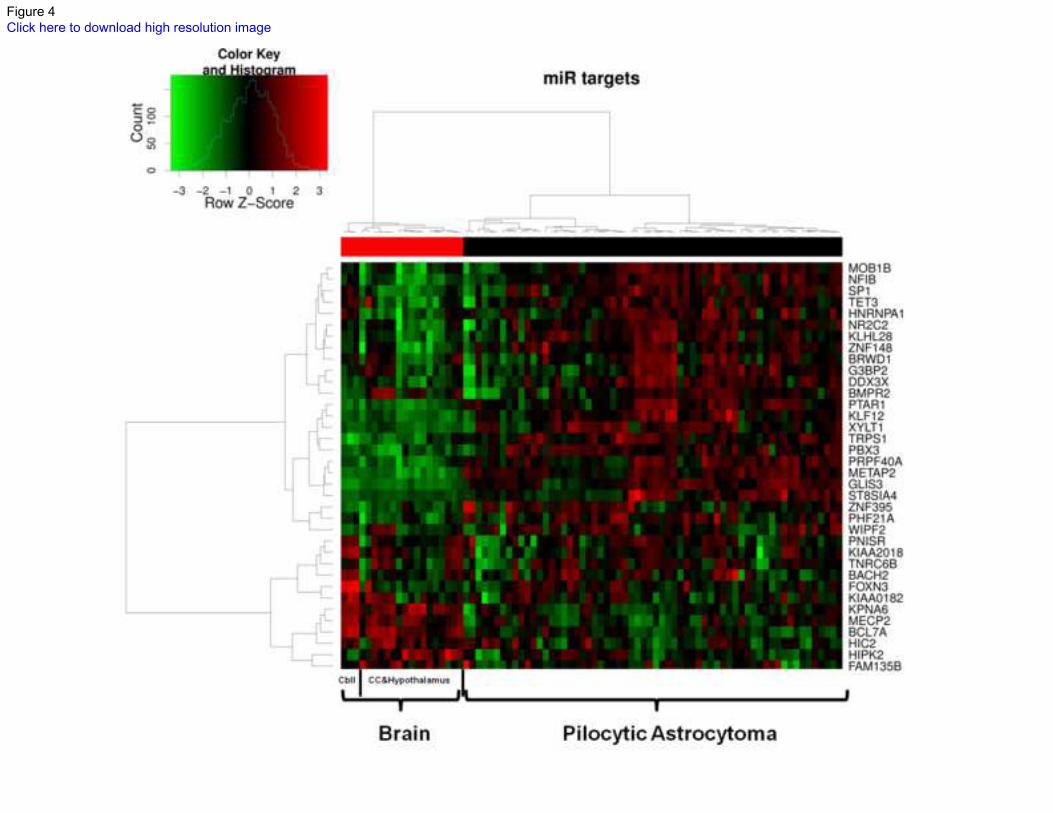
Figure 4Click here to download high resolution image
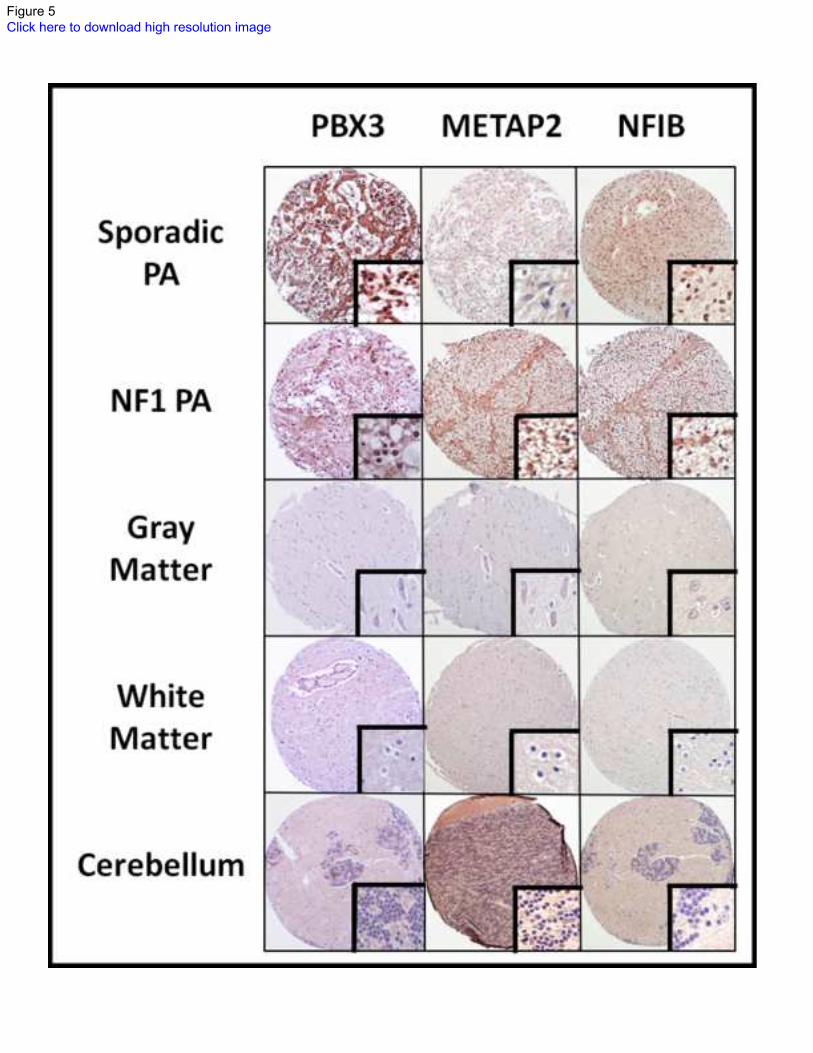
Figure 5Click here to download high resolution image
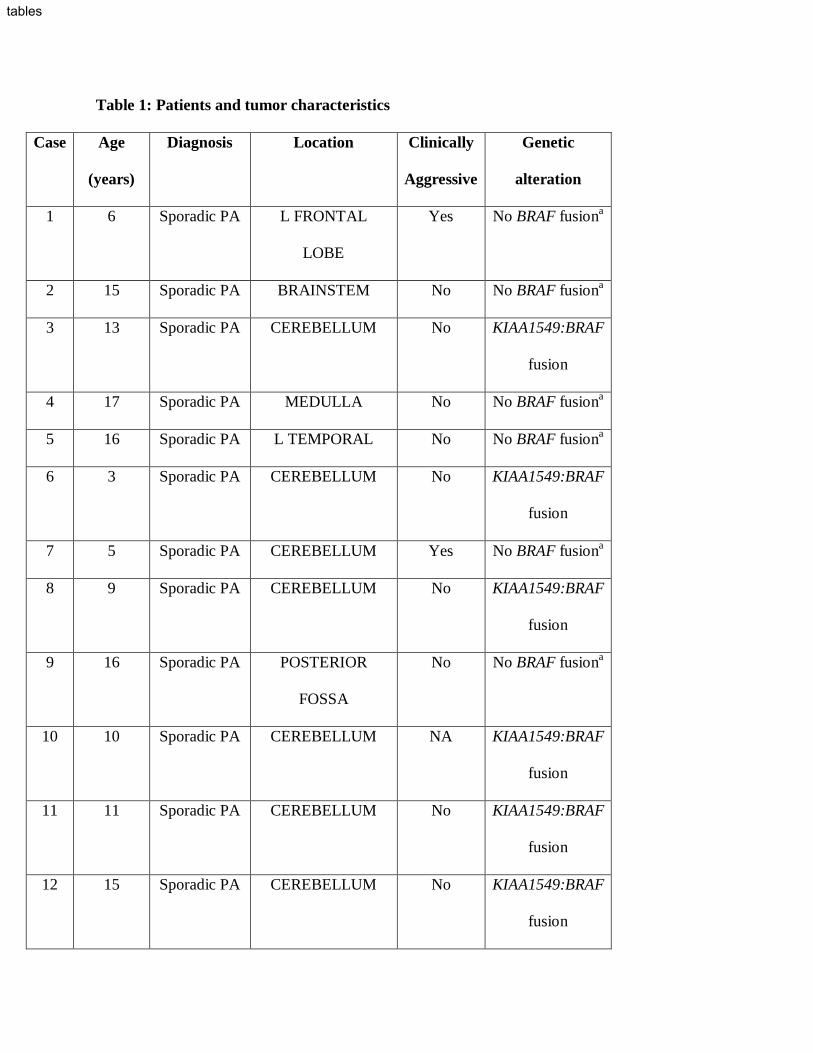
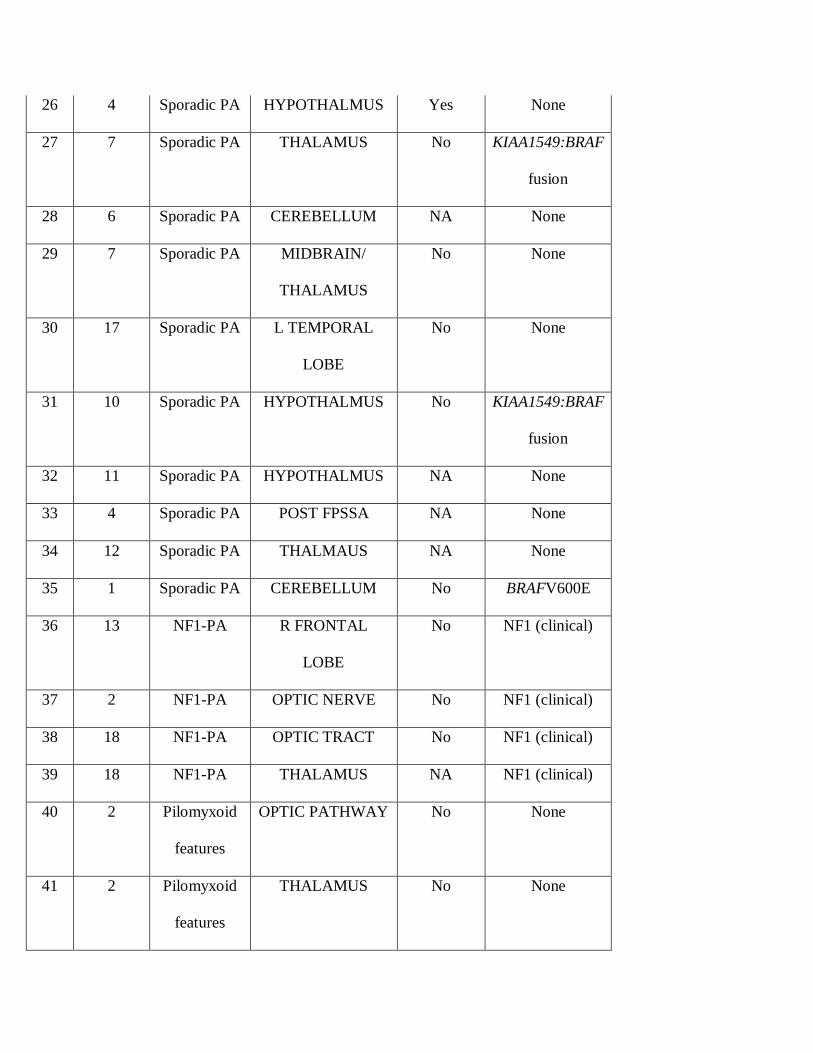
Table 1: Patients and tumor characteristics
Case Age
(years)
Diagnosis Location Clinically
Aggressive
Genetic
alteration
1 6 Sporadic PA L FRONTAL
LOBE
Yes No BRAF fusiona
2 15 Sporadic PA BRAINSTEM No No BRAF fusiona
3 13 Sporadic PA CEREBELLUM No KIAA1549:BRAF
fusion
4 17 Sporadic PA MEDULLA No No BRAF fusiona
5 16 Sporadic PA L TEMPORAL No No BRAF fusiona
6 3 Sporadic PA CEREBELLUM No KIAA1549:BRAF
fusion
7 5 Sporadic PA CEREBELLUM Yes No BRAF fusiona
8 9 Sporadic PA CEREBELLUM No KIAA1549:BRAF
fusion
9 16 Sporadic PA POSTERIOR
FOSSA
No No BRAF fusiona
10 10 Sporadic PA CEREBELLUM NA KIAA1549:BRAF
fusion
11 11 Sporadic PA CEREBELLUM No KIAA1549:BRAF
fusion
12 15 Sporadic PA CEREBELLUM No KIAA1549:BRAF
fusion
tables

13 11 Sporadic PA CEREBELLUM No None
14 9 Sporadic PA CEREBELLUM No KIAA1549:BRAF
fusion
15 14 Sporadic PA CEREBELLUM No KIAA1549:BRAF
fusion
16 25 Sporadic PA OPTIC CHIASM No KIAA1549:BRAF
fusion
17 12 Sporadic PA CEREBELLUM No KIAA1549:BRAF
fusion
18 5 Sporadic PA BRAINSTEM No KIAA1549:BRAF
fusion
19 4 Sporadic PA POSTERIOR
FOSSA
No KIAA1549:BRAF
fusion
20 9 Sporadic PA CEREBELLUM No None
21 20 Sporadic PA THALAMUS Yes None
22 10 Sporadic PA CERVICAL No KIAA1549:BRAF
fusion
23 9 Sporadic PA OPTIC TRACT Yes KIAA1549:BRAF
fusion
24 16 Sporadic PA TECTUM No KIAA1549:BRAF
fusion
25 5 Sporadic PA THALAMUS No KIAA1549:BRAF
fusion
26 4 Sporadic PA HYPOTHALMUS Yes None
27 7 Sporadic PA THALAMUS No KIAA1549:BRAF
fusion
28 6 Sporadic PA CEREBELLUM NA None
29 7 Sporadic PA MIDBRAIN/
THALAMUS
No None
30 17 Sporadic PA L TEMPORAL
LOBE
No None
31 10 Sporadic PA HYPOTHALMUS No KIAA1549:BRAF
fusion
32 11 Sporadic PA HYPOTHALMUS NA None
33 4 Sporadic PA POST FPSSA NA None
34 12 Sporadic PA THALMAUS NA None
35 1 Sporadic PA CEREBELLUM No BRAFV600E
36 13 NF1-PA R FRONTAL
LOBE
No NF1 (clinical)
37 2 NF1-PA OPTIC NERVE No NF1 (clinical)
38 18 NF1-PA OPTIC TRACT No NF1 (clinical)
39 18 NF1-PA THALAMUS NA NF1 (clinical)
40 2 Pilomyxoid
features
OPTIC PATHWAY No None
41 2 Pilomyxoid
features
THALAMUS No None
42 4 Pilomyxoid
features
HYPOTHALAMUS NA KIAA1549:BRAF
fusion
43 1 Pilomyxoid
features
HYPOTHALMUS NA KIAA1549:BRAF
fusion
C1 18 Pediatric
cortex
FRONTAL LOBE ND
C2 26 Cortex L TEMPORAL
LOBE
ND
C3 4 Pediatric
cortex
TEMPORAL LOBE ND
C4 NA Fetal brain CEREBELLUM ND
C5 NA Pediatric
cerebellum
CEREBELLUM ND
aBRAFV600E not evaluated; NA=not available; ND=not done
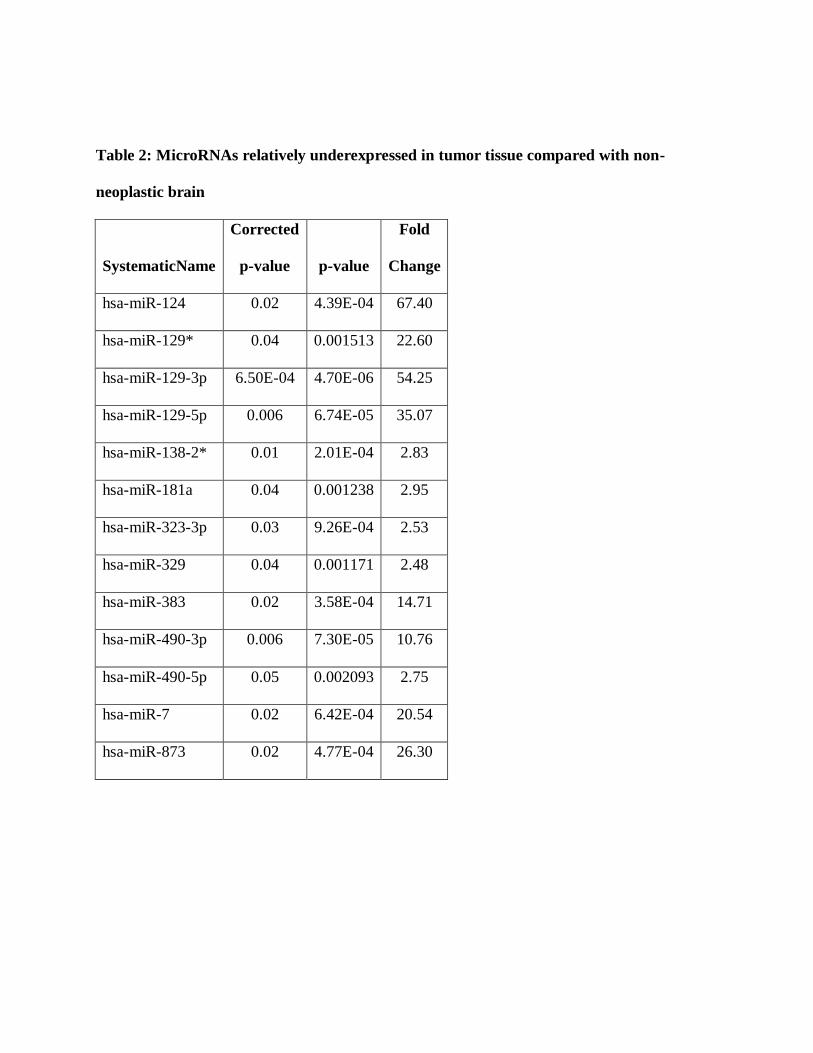
Table 2: MicroRNAs relatively underexpressed in tumor tissue compared with non-
neoplastic brain
SystematicName
Corrected
p-value p-value
Fold
Change
hsa-miR-124 0.02 4.39E-04 67.40
hsa-miR-129* 0.04 0.001513 22.60
hsa-miR-129-3p 6.50E-04 4.70E-06 54.25
hsa-miR-129-5p 0.006 6.74E-05 35.07
hsa-miR-138-2* 0.01 2.01E-04 2.83
hsa-miR-181a 0.04 0.001238 2.95
hsa-miR-323-3p 0.03 9.26E-04 2.53
hsa-miR-329 0.04 0.001171 2.48
hsa-miR-383 0.02 3.58E-04 14.71
hsa-miR-490-3p 0.006 7.30E-05 10.76
hsa-miR-490-5p 0.05 0.002093 2.75
hsa-miR-7 0.02 6.42E-04 20.54
hsa-miR-873 0.02 4.77E-04 26.30
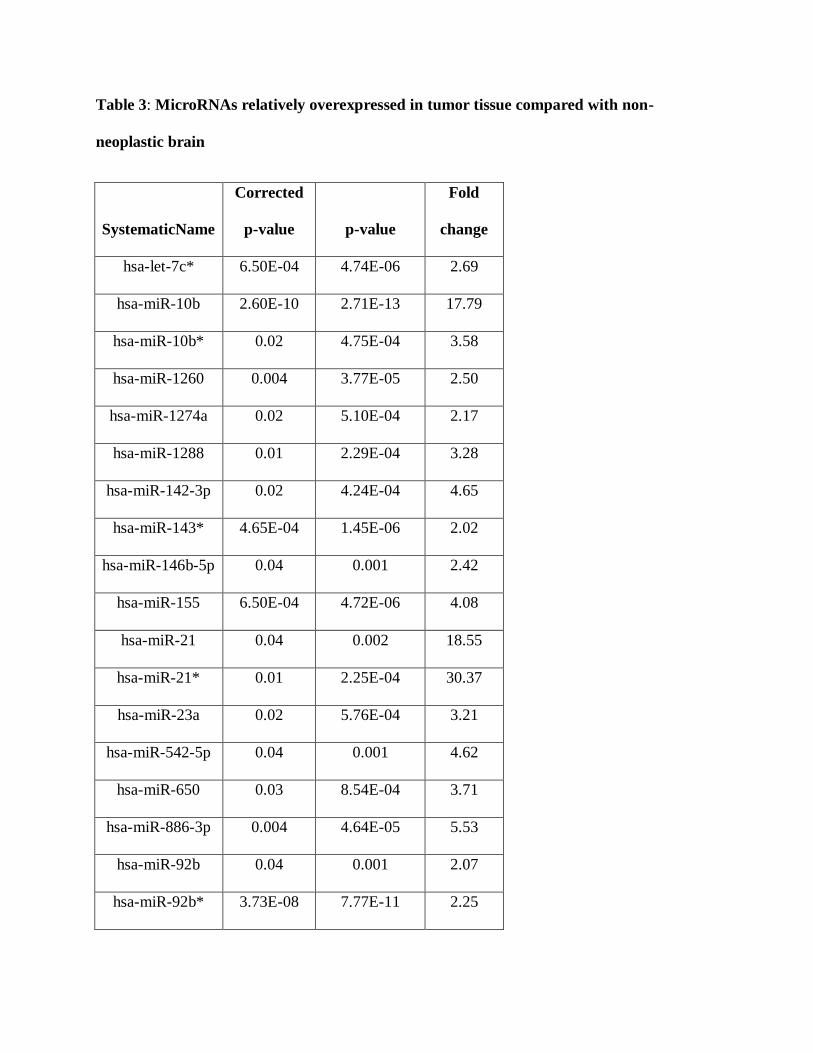
Table 3: MicroRNAs relatively overexpressed in tumor tissue compared with non-
neoplastic brain
SystematicName
Corrected
p-value p-value
Fold
change
hsa-let-7c* 6.50E-04 4.74E-06 2.69
hsa-miR-10b 2.60E-10 2.71E-13 17.79
hsa-miR-10b* 0.02 4.75E-04 3.58
hsa-miR-1260 0.004 3.77E-05 2.50
hsa-miR-1274a 0.02 5.10E-04 2.17
hsa-miR-1288 0.01 2.29E-04 3.28
hsa-miR-142-3p 0.02 4.24E-04 4.65
hsa-miR-143* 4.65E-04 1.45E-06 2.02
hsa-miR-146b-5p 0.04 0.001 2.42
hsa-miR-155 6.50E-04 4.72E-06 4.08
hsa-miR-21 0.04 0.002 18.55
hsa-miR-21* 0.01 2.25E-04 30.37
hsa-miR-23a 0.02 5.76E-04 3.21
hsa-miR-542-5p 0.04 0.001 4.62
hsa-miR-650 0.03 8.54E-04 3.71
hsa-miR-886-3p 0.004 4.64E-05 5.53
hsa-miR-92b 0.04 0.001 2.07
hsa-miR-92b* 3.73E-08 7.77E-11 2.25

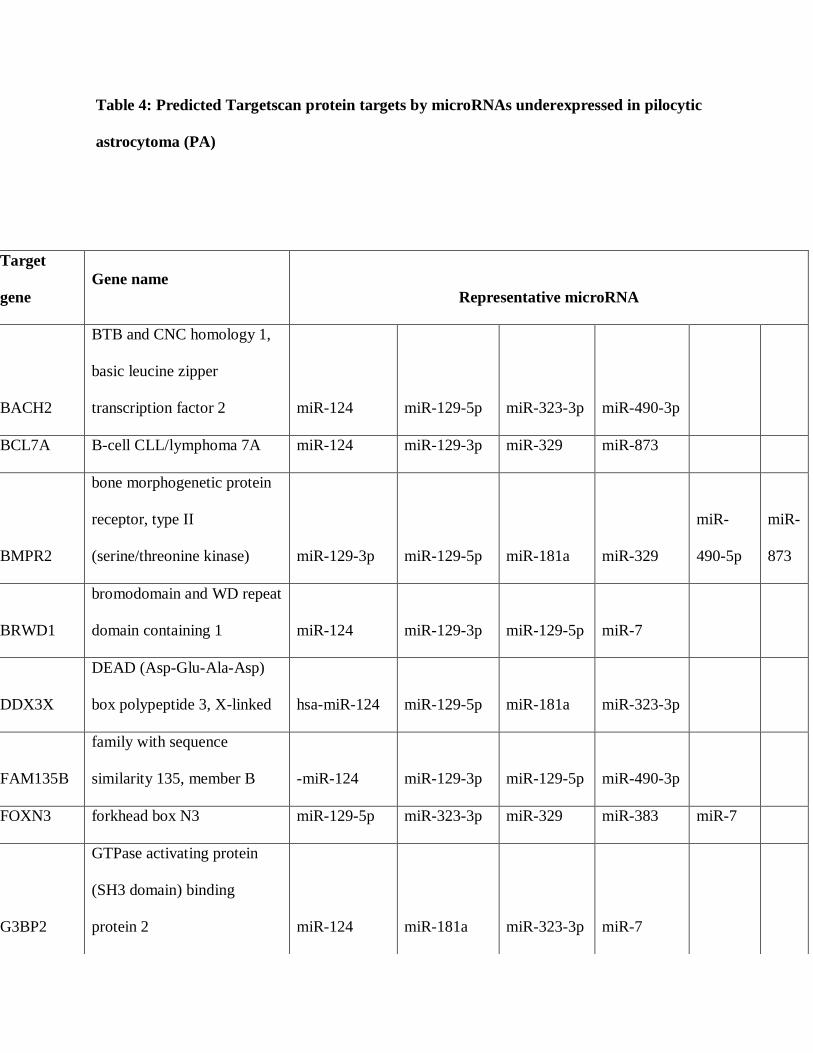
Table 4: Predicted Targetscan protein targets by microRNAs underexpressed in pilocytic
astrocytoma (PA)
Target
gene
Gene name
Representative microRNA
BACH2
BTB and CNC homology 1,
basic leucine zipper
transcription factor 2 miR-124 miR-129-5p miR-323-3p miR-490-3p
BCL7A B-cell CLL/lymphoma 7A miR-124 miR-129-3p miR-329 miR-873
BMPR2
bone morphogenetic protein
receptor, type II
(serine/threonine kinase) miR-129-3p miR-129-5p miR-181a miR-329
miR-
490-5p
miR-
873
BRWD1
bromodomain and WD repeat
domain containing 1 miR-124 miR-129-3p miR-129-5p miR-7
DDX3X
DEAD (Asp-Glu-Ala-Asp)
box polypeptide 3, X-linked hsa-miR-124 miR-129-5p miR-181a miR-323-3p
FAM135B
family with sequence
similarity 135, member B -miR-124 miR-129-3p miR-129-5p miR-490-3p
FOXN3 forkhead box N3 miR-129-5p miR-323-3p miR-329 miR-383 miR-7
G3BP2
GTPase activating protein
(SH3 domain) binding
protein 2 miR-124 miR-181a miR-323-3p miR-7
GLIS3 GLIS family zinc finger 3 miR-129-5p miR-181a miR-323-3p miR-383
HIC2 hypermethylated in cancer 2 miR-129-5p miR-181a miR-490-3p miR-873
HIPK2
homeodomain interacting
protein kinase 2 miR-124 miR-129-3p miR-181a miR-490-5p miR-7
HNRNPA1
heterogeneous nuclear
ribonucleoprotein A1 miR-129-5p miR-323-3p miR-383 miR-490-3p
KIAA0182 KIAA0182 miR-129-3p miR-129-5p miR-181a miR-7
KIAA2018 KIAA2018 miR-124 miR-129-5p miR-181a miR-7
KLF12 Kruppel-like factor 12 miR-129-3p miR-323-3p miR-329 miR-7
KLHL28 kelch-like 28 (Drosophila) miR-124 miR-129-3p miR-129-5p miR-7
KPNA6
karyopherin alpha 6
(importin alpha 7) miR-129-5p miR-490-5p miR-7 miR-873
MECP2
methyl CpG binding protein
2 (Rett syndrome) miR-129-5p miR-181a miR-7 miR-873
METAP2 methionyl aminopeptidase 2 miR-124 miR-181a miR-323-3p miR-490-5p
MOBKL1A
MOB1, Mps One Binder
kinase activator-like 1A
(yeast) miR-124 miR-323-3p miR-490-3p miR-7
NFIB
nuclear factor I/B
miR-124 miR-129-5p miR-323-3p miR-490-5p miR-7
miR-
873
NR2C2
nuclear receptor subfamily 2,
group C, member 2 miR-129-5p miR-181a miR-329 miR-490-3p
PBX3 pre-B-cell leukemia miR-129-5p miR-181a miR-323-3p miR-7
homeobox 3
PHF21A PHD finger protein 21A miR-129-3p miR-129-5p miR-383 miR-7
PRPF40A
PRP40 pre-mRNA
processing factor 40 homolog
A (S. cerevisiae) miR-124 miR-129-5p miR-323-3p miR-490-5p
PTAR1
protein prenyltransferase
alpha subunit repeat
containing 1 miR-124 miR-129-3p miR-129-5p miR-329 miR-7
SFRS18
splicing factor,
arginine/serine-rich 18 miR-129-3p miR-181a miR-323-3p miR-490-5p
SP1 Sp1 transcription factor miR-124 miR-181a miR-329 miR-7
ST8SIA4
ST8 alpha-N-acetyl-
neuraminide alpha-2,8-
sialyltransferase 4 miR-124 miR-129-3p miR-181a miR-383
TET3
tet oncogene family member
3 miR-124 miR-129-3p miR-490-3p miR-873
TNRC6B
trinucleotide repeat
containing 6B miR-124 miR-129-3p miR-129-5p miR-181a
miR-
323-3p
miR-
7
TRPS1
trichorhinophalangeal
syndrome I
miR-124 miR-129-3p miR-129-5p miR-323-3p miR-383
miR-
490-
5p
WIPF2
WAS/WASL interacting
protein family, member 2 miR-124 miR-329 miR-383 miR-7

XYLT1 xylosyltransferase I miR-124 miR-129-3p miR-181a miR-323-3p
ZNF148 zinc finger protein 148 miR-124 miR-129-3p miR-323-3p miR-7
ZNF395 zinc finger protein 395 miR-129-5p miR-323-3p miR-490-3p miR-7
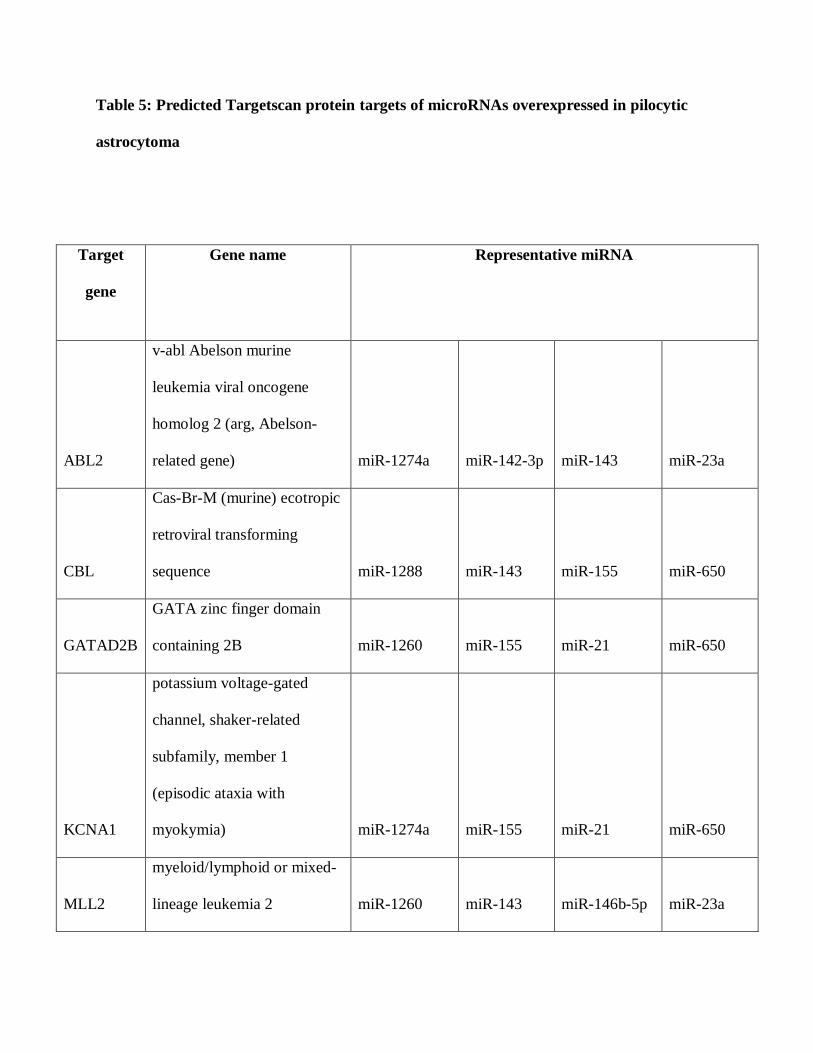
Table 5: Predicted Targetscan protein targets of microRNAs overexpressed in pilocytic
astrocytoma
Target
gene
Gene name Representative miRNA
ABL2
v-abl Abelson murine
leukemia viral oncogene
homolog 2 (arg, Abelson-
related gene) miR-1274a miR-142-3p miR-143 miR-23a
CBL
Cas-Br-M (murine) ecotropic
retroviral transforming
sequence miR-1288 miR-143 miR-155 miR-650
GATAD2B
GATA zinc finger domain
containing 2B miR-1260 miR-155 miR-21 miR-650
KCNA1
potassium voltage-gated
channel, shaker-related
subfamily, member 1
(episodic ataxia with
myokymia) miR-1274a miR-155 miR-21 miR-650
MLL2
myeloid/lymphoid or mixed-
lineage leukemia 2 miR-1260 miR-143 miR-146b-5p miR-23a
NFIX
nuclear factor I/X (CCAAT-
binding transcription factor) miR-10b miR-1260 miR-23a miR-886-3p
NOVA1
neuro-oncological ventral
antigen 1 miR-1274a miR-143 miR-146b-5p miR-155
PURB
purine-rich element binding
protein B let-7c miR-142-3p miR-21 miR-23a
SLC39A10
solute carrier family 39 (zinc
transporter), member 10 miR-142-3p miR-143 miR-155 miR-23a
TRPS1
trichorhinophalangeal
syndrome I miR-1274a miR-143 miR-155 miR-23a
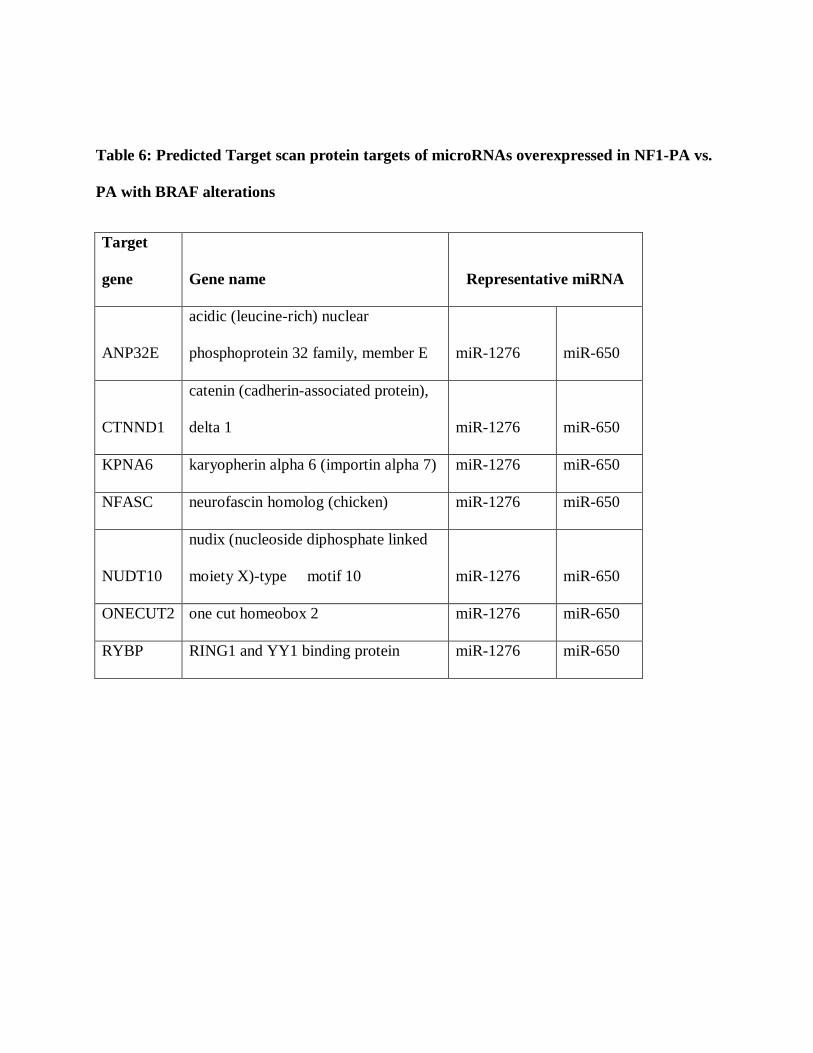
Table 6: Predicted Target scan protein targets of microRNAs overexpressed in NF1-PA vs.
PA with BRAF alterations
Target
gene Gene name Representative miRNA
ANP32E
acidic (leucine-rich) nuclear
phosphoprotein 32 family, member E miR-1276 miR-650
CTNND1
catenin (cadherin-associated protein),
delta 1 miR-1276 miR-650
KPNA6 karyopherin alpha 6 (importin alpha 7) miR-1276 miR-650
NFASC neurofascin homolog (chicken) miR-1276 miR-650
NUDT10
nudix (nucleoside diphosphate linked
moiety X)-type motif 10 miR-1276 miR-650
ONECUT2 one cut homeobox 2 miR-1276 miR-650
RYBP RING1 and YY1 binding protein miR-1276 miR-650
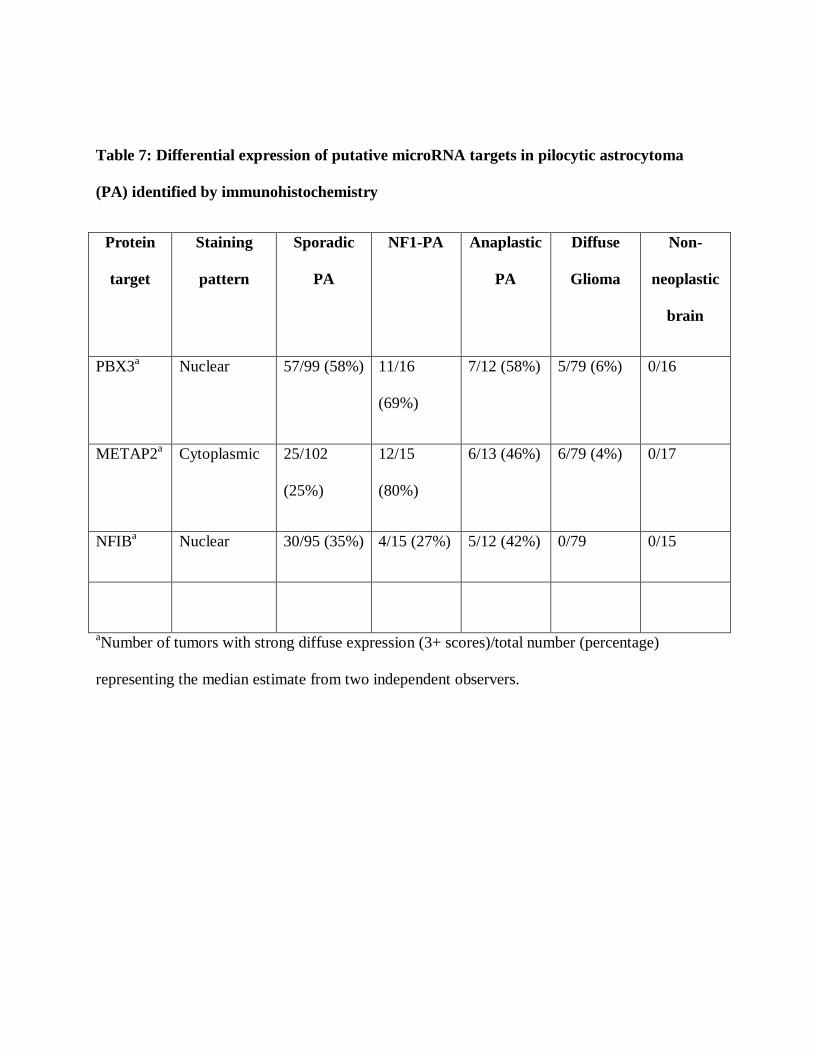
Table 7: Differential expression of putative microRNA targets in pilocytic astrocytoma
(PA) identified by immunohistochemistry
Protein
target
Staining
pattern
Sporadic
PA
NF1-PA Anaplastic
PA
Diffuse
Glioma
Non-
neoplastic
brain
PBX3a
Nuclear 57/99 (58%) 11/16
(69%)
7/12 (58%) 5/79 (6%) 0/16
METAP2a
Cytoplasmic 25/102
(25%)
12/15
(80%)
6/13 (46%) 6/79 (4%) 0/17
NFIBa
Nuclear 30/95 (35%) 4/15 (27%) 5/12 (42%) 0/79 0/15
aNumber of tumors with strong diffuse expression (3+ scores)/total number (percentage)
representing the median estimate from two independent observers.
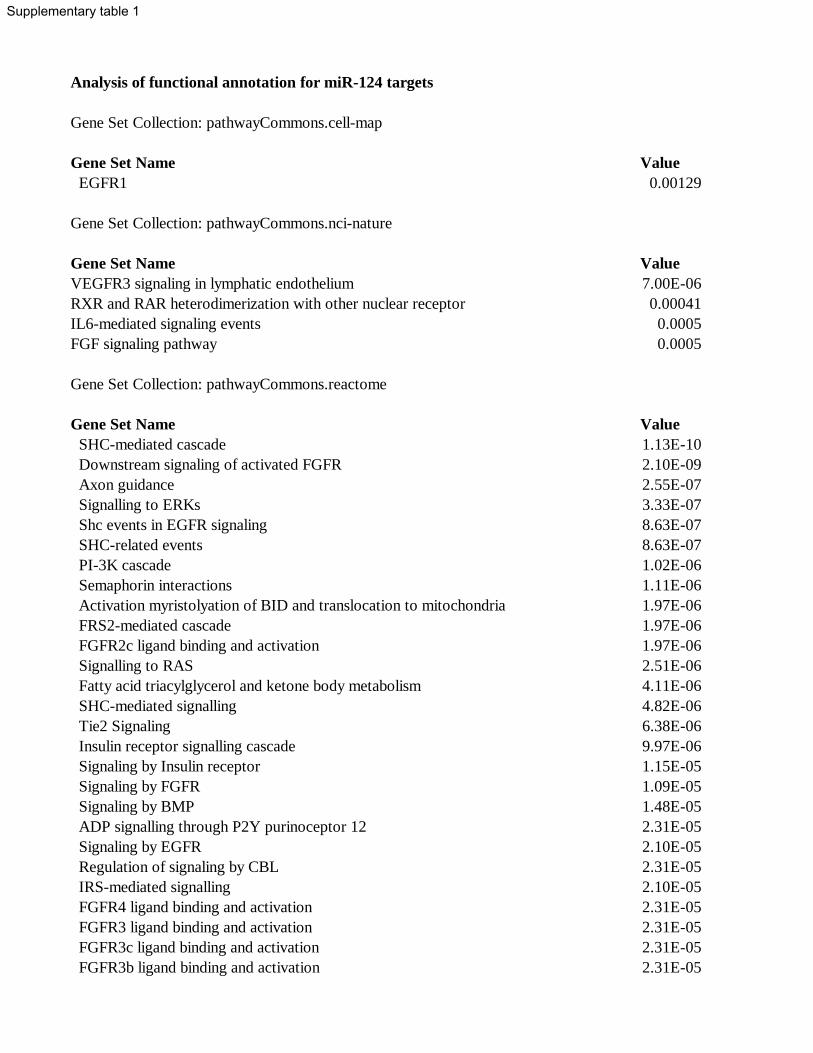
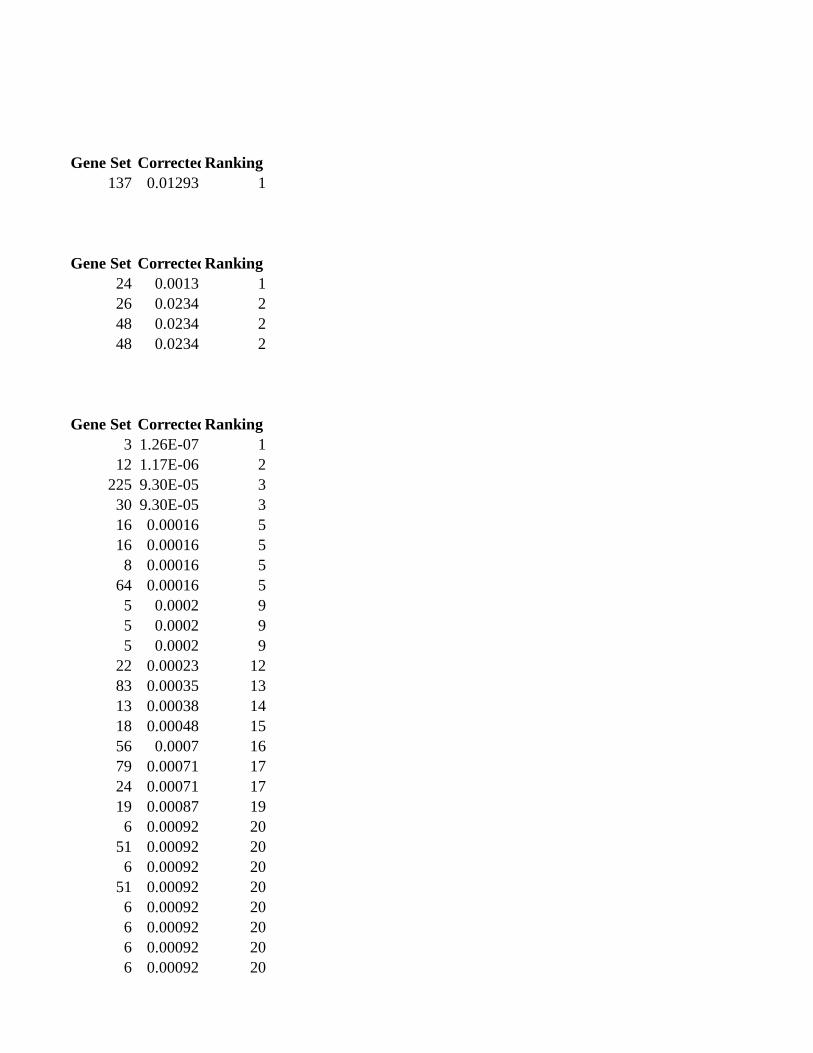
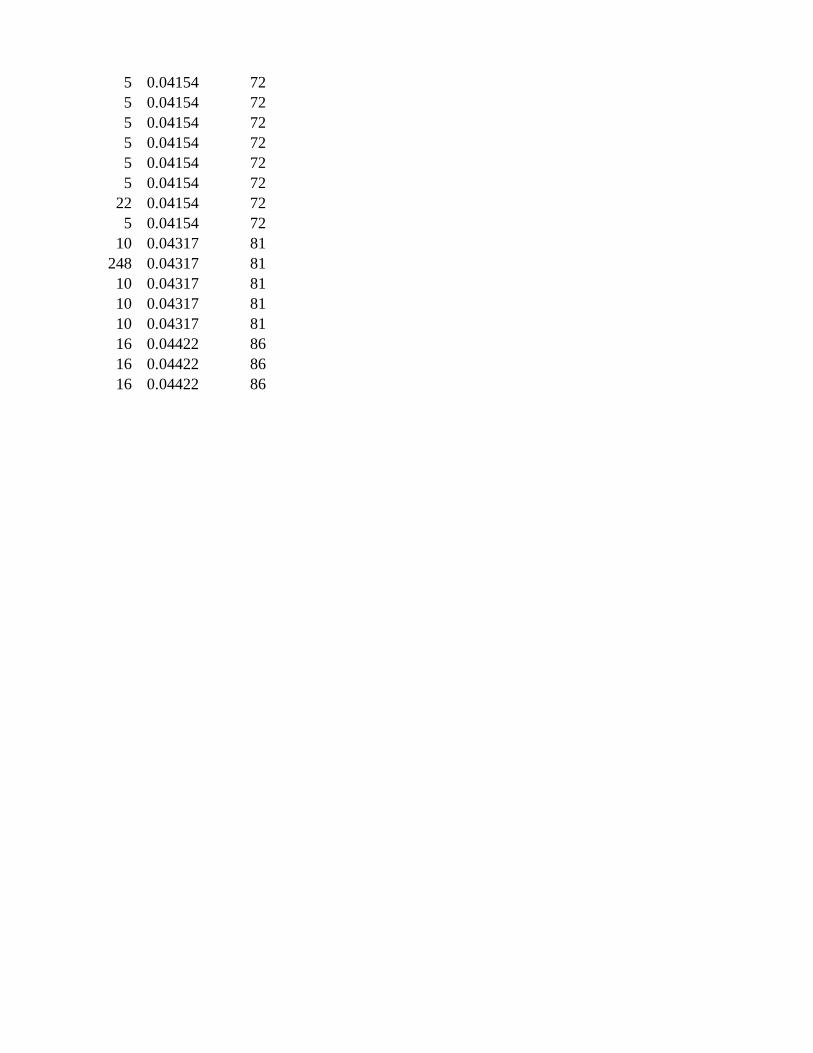
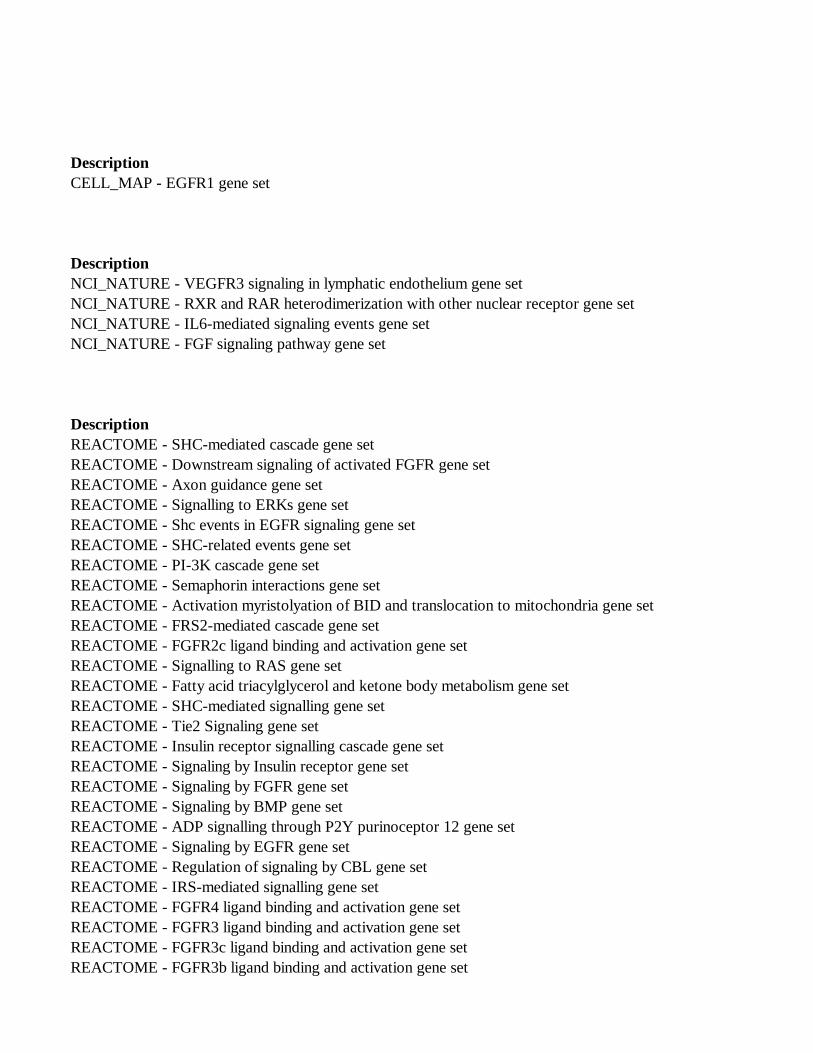
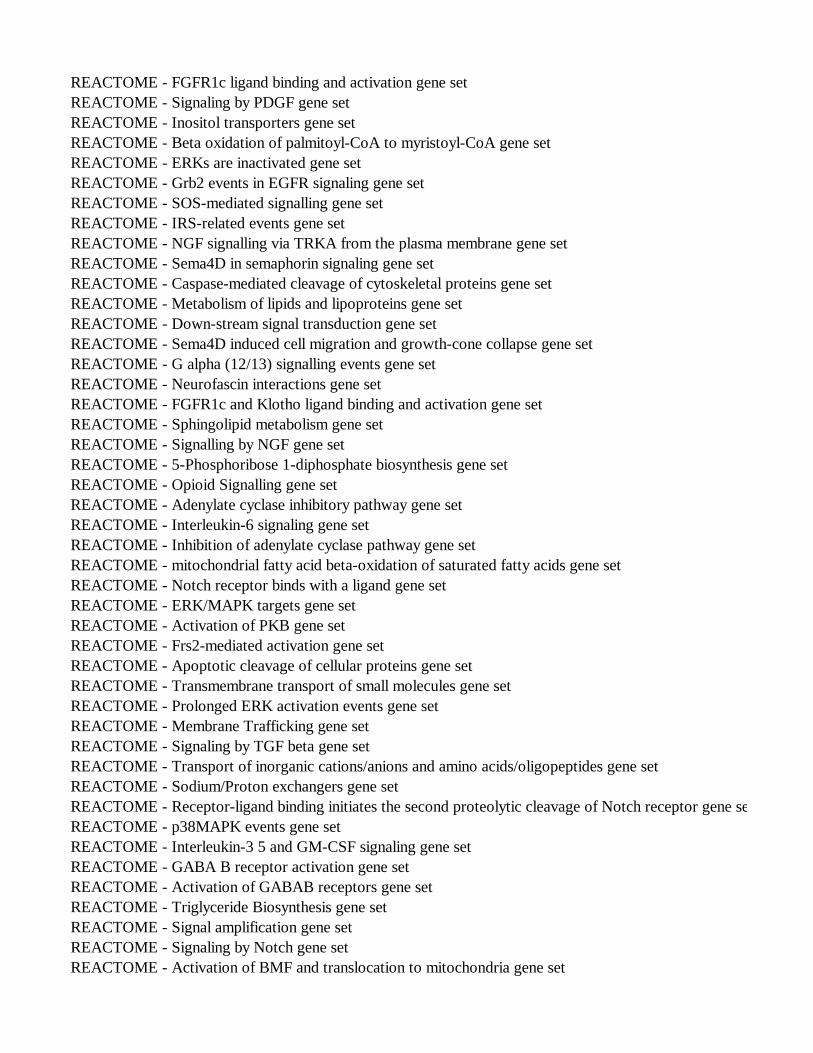
Analysis of functional annotation for miR-124 targets
Gene Set Collection: pathwayCommons.cell-map
Gene Set Name Value
EGFR1 0.00129
Gene Set Collection: pathwayCommons.nci-nature
Gene Set Name Value
VEGFR3 signaling in lymphatic endothelium 7.00E-06
RXR and RAR heterodimerization with other nuclear receptor 0.00041
IL6-mediated signaling events 0.0005
FGF signaling pathway 0.0005
Gene Set Collection: pathwayCommons.reactome
Gene Set Name Value
SHC-mediated cascade 1.13E-10
Downstream signaling of activated FGFR 2.10E-09
Axon guidance 2.55E-07
Signalling to ERKs 3.33E-07
Shc events in EGFR signaling 8.63E-07
SHC-related events 8.63E-07
PI-3K cascade 1.02E-06
Semaphorin interactions 1.11E-06
Activation myristolyation of BID and translocation to mitochondria 1.97E-06
FRS2-mediated cascade 1.97E-06
FGFR2c ligand binding and activation 1.97E-06
Signalling to RAS 2.51E-06
Fatty acid triacylglycerol and ketone body metabolism 4.11E-06
SHC-mediated signalling 4.82E-06
Tie2 Signaling 6.38E-06
Insulin receptor signalling cascade 9.97E-06
Signaling by Insulin receptor 1.15E-05
Signaling by FGFR 1.09E-05
Signaling by BMP 1.48E-05
ADP signalling through P2Y purinoceptor 12 2.31E-05
Signaling by EGFR 2.10E-05
Regulation of signaling by CBL 2.31E-05
IRS-mediated signalling 2.10E-05
FGFR4 ligand binding and activation 2.31E-05
FGFR3 ligand binding and activation 2.31E-05
FGFR3c ligand binding and activation 2.31E-05
FGFR3b ligand binding and activation 2.31E-05
Supplementary table 1
FGFR1c ligand binding and activation 2.31E-05
Signaling by PDGF 3.48E-05
Inositol transporters 3.41E-05
Beta oxidation of palmitoyl-CoA to myristoyl-CoA 3.41E-05
ERKs are inactivated 3.41E-05
Grb2 events in EGFR signaling 3.81E-05
SOS-mediated signalling 3.81E-05
IRS-related events 4.14E-05
NGF signalling via TRKA from the plasma membrane 4.42E-05
Sema4D in semaphorin signaling 6.53E-05
Caspase-mediated cleavage of cytoskeletal proteins 8.60E-05
Metabolism of lipids and lipoproteins 9.75E-05
Down-stream signal transduction 0.00011
Sema4D induced cell migration and growth-cone collapse 0.00012
G alpha (12/13) signalling events 0.00012
Neurofascin interactions 0.00013
FGFR1c and Klotho ligand binding and activation 0.00013
Sphingolipid metabolism 0.00017
Signalling by NGF 0.00017
5-Phosphoribose 1-diphosphate biosynthesis 0.0002
Opioid Signalling 0.00039
Adenylate cyclase inhibitory pathway 0.00053
Interleukin-6 signaling 0.00051
Inhibition of adenylate cyclase pathway 0.00053
mitochondrial fatty acid beta-oxidation of saturated fatty acids 0.00051
Notch receptor binds with a ligand 0.00051
ERK/MAPK targets 0.00053
Activation of PKB 0.00055
Frs2-mediated activation 0.00064
Apoptotic cleavage of cellular proteins 0.00077
Transmembrane transport of small molecules 0.00086
Prolonged ERK activation events 0.00108
Membrane Trafficking 0.00124
Signaling by TGF beta 0.00143
Transport of inorganic cations/anions and amino acids/oligopeptides 0.00141
Sodium/Proton exchangers 0.00143
Receptor-ligand binding initiates the second proteolytic cleavage of Notch receptor 0.00143
p38MAPK events 0.00143
Interleukin-3 5 and GM-CSF signaling 0.00185
GABA B receptor activation 0.00185
Activation of GABAB receptors 0.00185
Triglyceride Biosynthesis 0.00185
Signal amplification 0.00203
Signaling by Notch 0.00203
Activation of BMF and translocation to mitochondria 0.00298
AMPK inhibits chREBP transcriptional activation activity 0.00298
Beta oxidation of lauroyl-CoA to decanoyl-CoA-CoA 0.00298
Beta oxidation of decanoyl-CoA to octanoyl-CoA-CoA 0.00298
Beta oxidation of octanoyl-CoA to hexanoyl-CoA 0.00298
Beta oxidation of hexanoyl-CoA to butanoyl-CoA 0.00298
Axonal growth stimulation 0.00298
G alpha (z) signalling events 0.00269
G beta:gamma signalling through PLC beta 0.00298
Gab1 signalosome 0.00329
SLC-mediated transmembrane transport 0.00316
FGFR2b ligand binding and activation 0.00329
FGFR2 ligand binding and activation 0.00329
FGFR1b ligand binding and activation 0.00329
Other semaphorin interactions 0.00348
Synthesis and interconversion of nucleotide di- and triphosphates 0.00348
Nuclear Events (kinase and transcription factor activation) 0.00348
Gene Set SizeCorrected ValueRanking
137 0.01293 1
Gene Set SizeCorrected ValueRanking
24 0.0013 1
26 0.0234 2
48 0.0234 2
48 0.0234 2
Gene Set SizeCorrected ValueRanking
3 1.26E-07 1
12 1.17E-06 2
225 9.30E-05 3
30 9.30E-05 3
16 0.00016 5
16 0.00016 5
8 0.00016 5
64 0.00016 5
5 0.0002 9
5 0.0002 9
5 0.0002 9
22 0.00023 12
83 0.00035 13
13 0.00038 14
18 0.00048 15
56 0.0007 16
79 0.00071 17
24 0.00071 17
19 0.00087 19
6 0.00092 20
51 0.00092 20
6 0.00092 20
51 0.00092 20
6 0.00092 20
6 0.00092 20
6 0.00092 20
6 0.00092 20

6 0.00092 20
32 0.00122 29
3 0.00122 29
3 0.00122 29
3 0.00122 29
15 0.00125 33
15 0.00125 33
53 0.00132 35
110 0.00137 36
27 0.00197 37
11 0.00253 38
252 0.00279 39
28 0.00304 40
22 0.00308 41
22 0.00308 41
7 0.00343 43
7 0.00343 43
29 0.00424 45
146 0.00424 45
1 0.00469 47
53 0.00904 48
13 0.01102 49
8 0.01102 49
13 0.01102 49
8 0.01102 49
8 0.01102 49
13 0.01102 49
4 0.01118 55
19 0.01276 56
40 0.01503 57
367 0.01657 58
20 0.02052 59
84 0.02304 60
9 0.02462 61
94 0.02462 61
9 0.02462 61
9 0.02462 61
9 0.02462 61
28 0.02992 66
28 0.02992 66
28 0.02992 66
28 0.02992 66
15 0.03187 70
15 0.03187 70
5 0.04154 72
5 0.04154 72
5 0.04154 72
5 0.04154 72
5 0.04154 72
5 0.04154 72
5 0.04154 72
22 0.04154 72
5 0.04154 72
10 0.04317 81
248 0.04317 81
10 0.04317 81
10 0.04317 81
10 0.04317 81
16 0.04422 86
16 0.04422 86
16 0.04422 86
Description
CELL_MAP - EGFR1 gene set
Description
NCI_NATURE - VEGFR3 signaling in lymphatic endothelium gene set
NCI_NATURE - RXR and RAR heterodimerization with other nuclear receptor gene set
NCI_NATURE - IL6-mediated signaling events gene set
NCI_NATURE - FGF signaling pathway gene set
Description
REACTOME - SHC-mediated cascade gene set
REACTOME - Downstream signaling of activated FGFR gene set
REACTOME - Axon guidance gene set
REACTOME - Signalling to ERKs gene set
REACTOME - Shc events in EGFR signaling gene set
REACTOME - SHC-related events gene set
REACTOME - PI-3K cascade gene set
REACTOME - Semaphorin interactions gene set
REACTOME - Activation myristolyation of BID and translocation to mitochondria gene set
REACTOME - FRS2-mediated cascade gene set
REACTOME - FGFR2c ligand binding and activation gene set
REACTOME - Signalling to RAS gene set
REACTOME - Fatty acid triacylglycerol and ketone body metabolism gene set
REACTOME - SHC-mediated signalling gene set
REACTOME - Tie2 Signaling gene set
REACTOME - Insulin receptor signalling cascade gene set
REACTOME - Signaling by Insulin receptor gene set
REACTOME - Signaling by FGFR gene set
REACTOME - Signaling by BMP gene set
REACTOME - ADP signalling through P2Y purinoceptor 12 gene set
REACTOME - Signaling by EGFR gene set
REACTOME - Regulation of signaling by CBL gene set
REACTOME - IRS-mediated signalling gene set
REACTOME - FGFR4 ligand binding and activation gene set
REACTOME - FGFR3 ligand binding and activation gene set
REACTOME - FGFR3c ligand binding and activation gene set
REACTOME - FGFR3b ligand binding and activation gene set
REACTOME - FGFR1c ligand binding and activation gene set
REACTOME - Signaling by PDGF gene set
REACTOME - Inositol transporters gene set
REACTOME - Beta oxidation of palmitoyl-CoA to myristoyl-CoA gene set
REACTOME - ERKs are inactivated gene set
REACTOME - Grb2 events in EGFR signaling gene set
REACTOME - SOS-mediated signalling gene set
REACTOME - IRS-related events gene set
REACTOME - NGF signalling via TRKA from the plasma membrane gene set
REACTOME - Sema4D in semaphorin signaling gene set
REACTOME - Caspase-mediated cleavage of cytoskeletal proteins gene set
REACTOME - Metabolism of lipids and lipoproteins gene set
REACTOME - Down-stream signal transduction gene set
REACTOME - Sema4D induced cell migration and growth-cone collapse gene set
REACTOME - G alpha (12/13) signalling events gene set
REACTOME - Neurofascin interactions gene set
REACTOME - FGFR1c and Klotho ligand binding and activation gene set
REACTOME - Sphingolipid metabolism gene set
REACTOME - Signalling by NGF gene set
REACTOME - 5-Phosphoribose 1-diphosphate biosynthesis gene set
REACTOME - Opioid Signalling gene set
REACTOME - Adenylate cyclase inhibitory pathway gene set
REACTOME - Interleukin-6 signaling gene set
REACTOME - Inhibition of adenylate cyclase pathway gene set
REACTOME - mitochondrial fatty acid beta-oxidation of saturated fatty acids gene set
REACTOME - Notch receptor binds with a ligand gene set
REACTOME - ERK/MAPK targets gene set
REACTOME - Activation of PKB gene set
REACTOME - Frs2-mediated activation gene set
REACTOME - Apoptotic cleavage of cellular proteins gene set
REACTOME - Transmembrane transport of small molecules gene set
REACTOME - Prolonged ERK activation events gene set
REACTOME - Membrane Trafficking gene set
REACTOME - Signaling by TGF beta gene set
REACTOME - Transport of inorganic cations/anions and amino acids/oligopeptides gene set
REACTOME - Sodium/Proton exchangers gene set
REACTOME - Receptor-ligand binding initiates the second proteolytic cleavage of Notch receptor gene set
REACTOME - p38MAPK events gene set
REACTOME - Interleukin-3 5 and GM-CSF signaling gene set
REACTOME - GABA B receptor activation gene set
REACTOME - Activation of GABAB receptors gene set
REACTOME - Triglyceride Biosynthesis gene set
REACTOME - Signal amplification gene set
REACTOME - Signaling by Notch gene set
REACTOME - Activation of BMF and translocation to mitochondria gene set
REACTOME - AMPK inhibits chREBP transcriptional activation activity gene set
REACTOME - Beta oxidation of lauroyl-CoA to decanoyl-CoA-CoA gene set
REACTOME - Beta oxidation of decanoyl-CoA to octanoyl-CoA-CoA gene set
REACTOME - Beta oxidation of octanoyl-CoA to hexanoyl-CoA gene set
REACTOME - Beta oxidation of hexanoyl-CoA to butanoyl-CoA gene set
REACTOME - Axonal growth stimulation gene set
REACTOME - G alpha (z) signalling events gene set
REACTOME - G beta:gamma signalling through PLC beta gene set
REACTOME - Gab1 signalosome gene set
REACTOME - SLC-mediated transmembrane transport gene set
REACTOME - FGFR2b ligand binding and activation gene set
REACTOME - FGFR2 ligand binding and activation gene set
REACTOME - FGFR1b ligand binding and activation gene set
REACTOME - Other semaphorin interactions gene set
REACTOME - Synthesis and interconversion of nucleotide di- and triphosphates gene set
REACTOME - Nuclear Events (kinase and transcription factor activation) gene set

URL
www.pathwaycomm...
URL
www.pathwaycomm...
www.pathwaycomm...
www.pathwaycomm...
www.pathwaycomm...
URL
www.pathwaycomm...
www.pathwaycomm...
www.pathwaycomm...
www.pathwaycomm...
www.pathwaycomm...
www.pathwaycomm...
www.pathwaycomm...
www.pathwaycomm...
www.pathwaycomm... myristolyation ...
www.pathwaycomm...
www.pathwaycomm...
www.pathwaycomm...
www.pathwaycomm... triacylglycerol... and ketone body...
www.pathwaycomm...
www.pathwaycomm...
www.pathwaycomm...
www.pathwaycomm...
www.pathwaycomm...
www.pathwaycomm...
www.pathwaycomm...
www.pathwaycomm...
www.pathwaycomm...
www.pathwaycomm...
www.pathwaycomm...
www.pathwaycomm...
www.pathwaycomm...
www.pathwaycomm...

www.pathwaycomm...
www.pathwaycomm...
www.pathwaycomm...
www.pathwaycomm...
www.pathwaycomm...
www.pathwaycomm...
www.pathwaycomm...
www.pathwaycomm...
www.pathwaycomm...
www.pathwaycomm...
www.pathwaycomm...
www.pathwaycomm...
www.pathwaycomm...
www.pathwaycomm...
www.pathwaycomm...
www.pathwaycomm...
www.pathwaycomm...
www.pathwaycomm...
www.pathwaycomm...
www.pathwaycomm...
www.pathwaycomm...
www.pathwaycomm...
www.pathwaycomm...
www.pathwaycomm...
www.pathwaycomm...
www.pathwaycomm...
www.pathwaycomm...
www.pathwaycomm...
www.pathwaycomm...
www.pathwaycomm...
www.pathwaycomm...
www.pathwaycomm...
www.pathwaycomm...
www.pathwaycomm...
www.pathwaycomm...
www.pathwaycomm...
www.pathwaycomm...
www.pathwaycomm...
www.pathwaycomm... 5 and GM-CSF si...
www.pathwaycomm...
www.pathwaycomm...
www.pathwaycomm...
www.pathwaycomm...
www.pathwaycomm...
www.pathwaycomm...

www.pathwaycomm...
www.pathwaycomm...
www.pathwaycomm...
www.pathwaycomm...
www.pathwaycomm...
www.pathwaycomm...
www.pathwaycomm...
www.pathwaycomm...
www.pathwaycomm...
www.pathwaycomm...
www.pathwaycomm...
www.pathwaycomm...
www.pathwaycomm...
www.pathwaycomm...
www.pathwaycomm...
www.pathwaycomm...
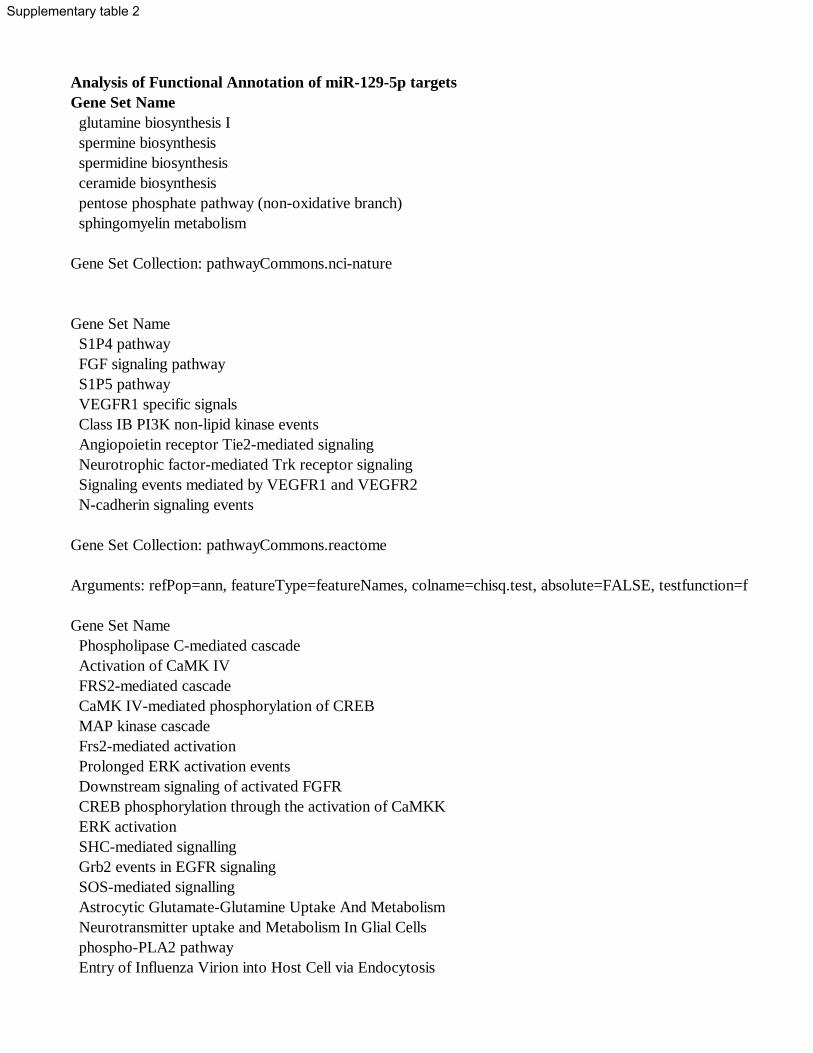
Analysis of Functional Annotation of miR-129-5p targets
Gene Set Name
glutamine biosynthesis I
spermine biosynthesis
spermidine biosynthesis
ceramide biosynthesis
pentose phosphate pathway (non-oxidative branch)
sphingomyelin metabolism
Gene Set Collection: pathwayCommons.nci-nature
Gene Set Name
S1P4 pathway
FGF signaling pathway
S1P5 pathway
VEGFR1 specific signals
Class IB PI3K non-lipid kinase events
Angiopoietin receptor Tie2-mediated signaling
Neurotrophic factor-mediated Trk receptor signaling
Signaling events mediated by VEGFR1 and VEGFR2
N-cadherin signaling events
Gene Set Collection: pathwayCommons.reactome
Arguments: refPop=ann, featureType=featureNames, colname=chisq.test, absolute=FALSE, testfunction=function
Gene Set Name
Phospholipase C-mediated cascade
Activation of CaMK IV
FRS2-mediated cascade
CaMK IV-mediated phosphorylation of CREB
MAP kinase cascade
Frs2-mediated activation
Prolonged ERK activation events
Downstream signaling of activated FGFR
CREB phosphorylation through the activation of CaMKK
ERK activation
SHC-mediated signalling
Grb2 events in EGFR signaling
SOS-mediated signalling
Astrocytic Glutamate-Glutamine Uptake And Metabolism
Neurotransmitter uptake and Metabolism In Glial Cells
phospho-PLA2 pathway
Entry of Influenza Virion into Host Cell via Endocytosis
Supplementary table 2
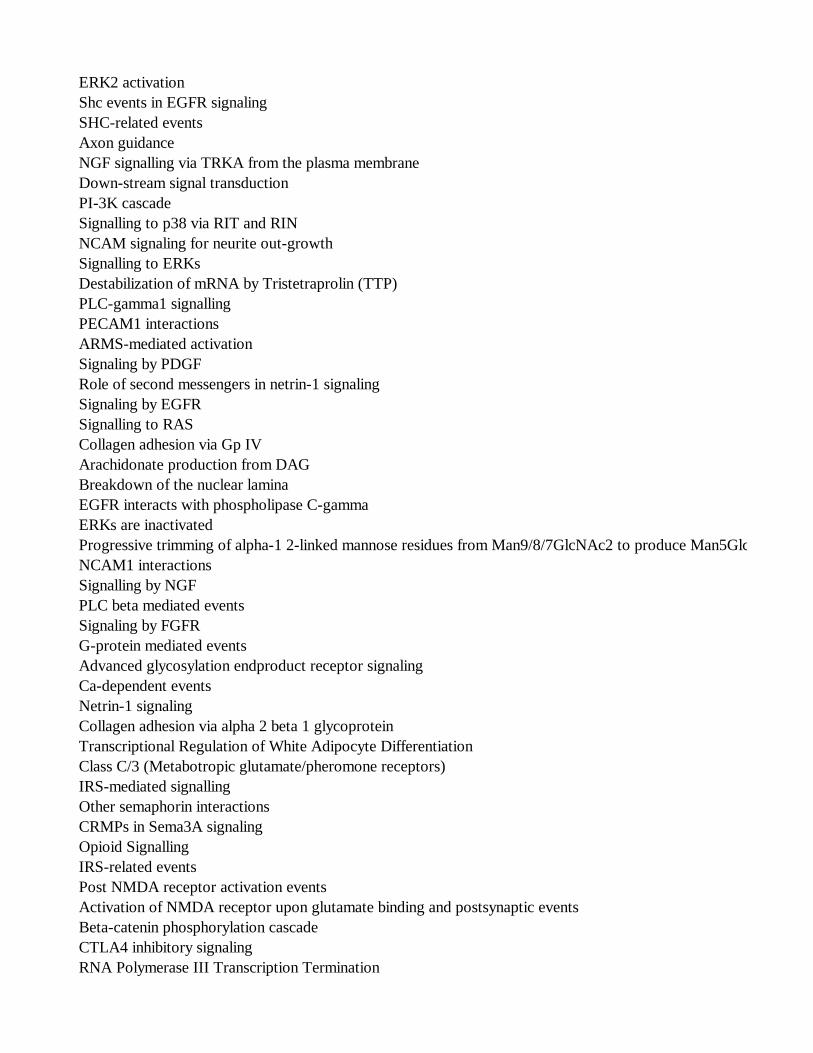
ERK2 activation
Shc events in EGFR signaling
SHC-related events
Axon guidance
NGF signalling via TRKA from the plasma membrane
Down-stream signal transduction
PI-3K cascade
Signalling to p38 via RIT and RIN
NCAM signaling for neurite out-growth
Signalling to ERKs
Destabilization of mRNA by Tristetraprolin (TTP)
PLC-gamma1 signalling
PECAM1 interactions
ARMS-mediated activation
Signaling by PDGF
Role of second messengers in netrin-1 signaling
Signaling by EGFR
Signalling to RAS
Collagen adhesion via Gp IV
Arachidonate production from DAG
Breakdown of the nuclear lamina
EGFR interacts with phospholipase C-gamma
ERKs are inactivated
Progressive trimming of alpha-1 2-linked mannose residues from Man9/8/7GlcNAc2 to produce Man5GlcNAc2
NCAM1 interactions
Signalling by NGF
PLC beta mediated events
Signaling by FGFR
G-protein mediated events
Advanced glycosylation endproduct receptor signaling
Ca-dependent events
Netrin-1 signaling
Collagen adhesion via alpha 2 beta 1 glycoprotein
Transcriptional Regulation of White Adipocyte Differentiation
Class C/3 (Metabotropic glutamate/pheromone receptors)
IRS-mediated signalling
Other semaphorin interactions
CRMPs in Sema3A signaling
Opioid Signalling
IRS-related events
Post NMDA receptor activation events
Activation of NMDA receptor upon glutamate binding and postsynaptic events
Beta-catenin phosphorylation cascade
CTLA4 inhibitory signaling
RNA Polymerase III Transcription Termination

S6K1 signalling
FGFR2c ligand binding and activation
RAF activation
N-glycan trimming and elongation in the cis-Golgi
Destabilization of mRNA by Butyrate Response Factor 1 (BRF1)
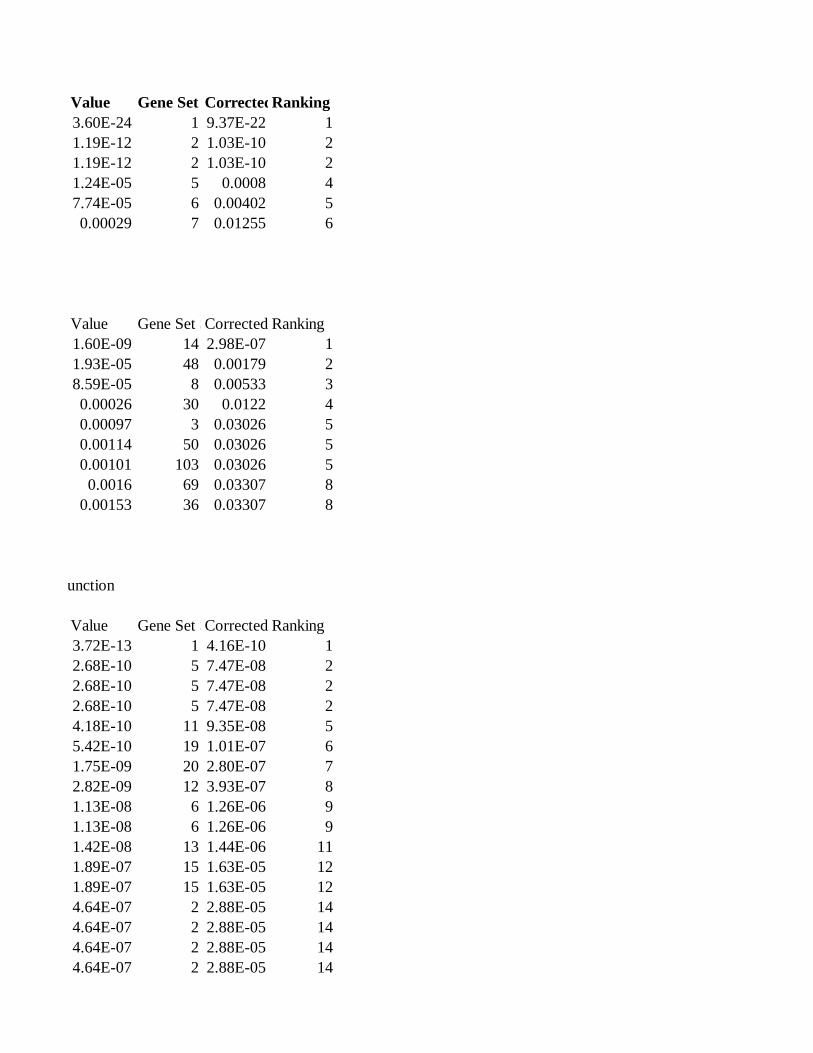
Value Gene Set SizeCorrected ValueRanking
3.60E-24 1 9.37E-22 1
1.19E-12 2 1.03E-10 2
1.19E-12 2 1.03E-10 2
1.24E-05 5 0.0008 4
7.74E-05 6 0.00402 5
0.00029 7 0.01255 6
Value Gene Set SizeCorrected ValueRanking
1.60E-09 14 2.98E-07 1
1.93E-05 48 0.00179 2
8.59E-05 8 0.00533 3
0.00026 30 0.0122 4
0.00097 3 0.03026 5
0.00114 50 0.03026 5
0.00101 103 0.03026 5
0.0016 69 0.03307 8
0.00153 36 0.03307 8
Arguments: refPop=ann, featureType=featureNames, colname=chisq.test, absolute=FALSE, testfunction=function
Value Gene Set SizeCorrected ValueRanking
3.72E-13 1 4.16E-10 1
2.68E-10 5 7.47E-08 2
2.68E-10 5 7.47E-08 2
2.68E-10 5 7.47E-08 2
4.18E-10 11 9.35E-08 5
5.42E-10 19 1.01E-07 6
1.75E-09 20 2.80E-07 7
2.82E-09 12 3.93E-07 8
1.13E-08 6 1.26E-06 9
1.13E-08 6 1.26E-06 9
1.42E-08 13 1.44E-06 11
1.89E-07 15 1.63E-05 12
1.89E-07 15 1.63E-05 12
4.64E-07 2 2.88E-05 14
4.64E-07 2 2.88E-05 14
4.64E-07 2 2.88E-05 14
4.64E-07 2 2.88E-05 14
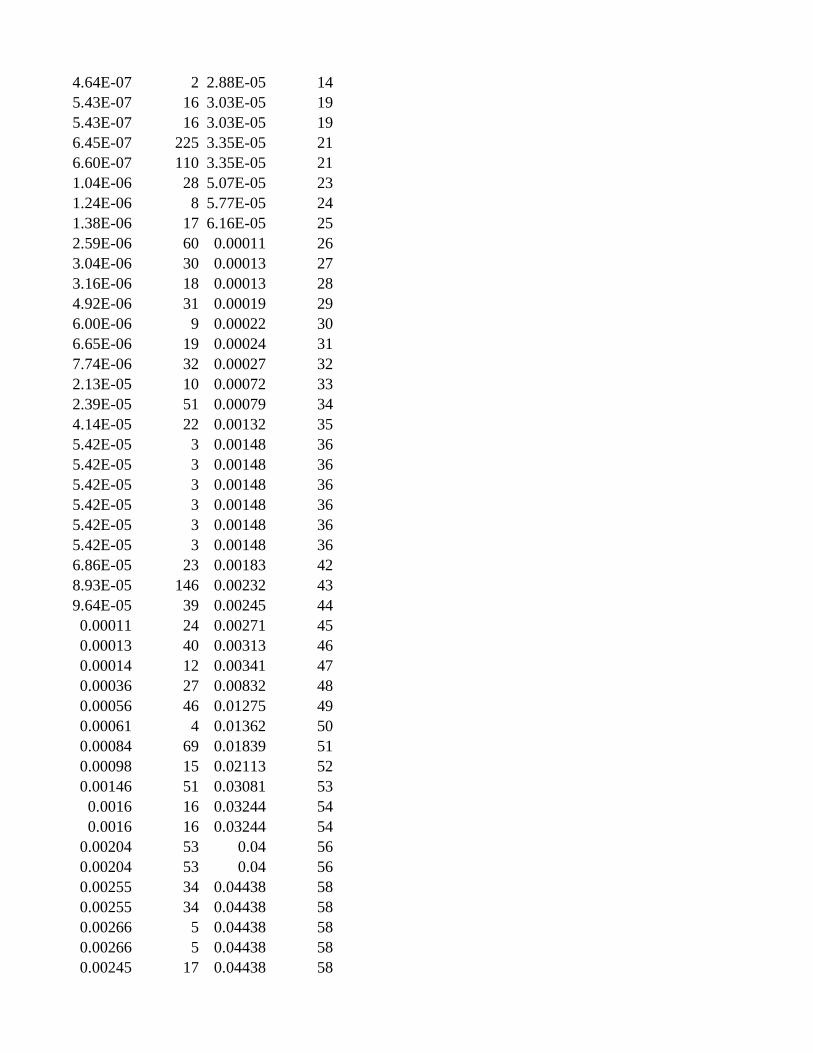
4.64E-07 2 2.88E-05 14
5.43E-07 16 3.03E-05 19
5.43E-07 16 3.03E-05 19
6.45E-07 225 3.35E-05 21
6.60E-07 110 3.35E-05 21
1.04E-06 28 5.07E-05 23
1.24E-06 8 5.77E-05 24
1.38E-06 17 6.16E-05 25
2.59E-06 60 0.00011 26
3.04E-06 30 0.00013 27
3.16E-06 18 0.00013 28
4.92E-06 31 0.00019 29
6.00E-06 9 0.00022 30
6.65E-06 19 0.00024 31
7.74E-06 32 0.00027 32
2.13E-05 10 0.00072 33
2.39E-05 51 0.00079 34
4.14E-05 22 0.00132 35
5.42E-05 3 0.00148 36
5.42E-05 3 0.00148 36
5.42E-05 3 0.00148 36
5.42E-05 3 0.00148 36
5.42E-05 3 0.00148 36
5.42E-05 3 0.00148 36
6.86E-05 23 0.00183 42
8.93E-05 146 0.00232 43
9.64E-05 39 0.00245 44
0.00011 24 0.00271 45
0.00013 40 0.00313 46
0.00014 12 0.00341 47
0.00036 27 0.00832 48
0.00056 46 0.01275 49
0.00061 4 0.01362 50
0.00084 69 0.01839 51
0.00098 15 0.02113 52
0.00146 51 0.03081 53
0.0016 16 0.03244 54
0.0016 16 0.03244 54
0.00204 53 0.04 56
0.00204 53 0.04 56
0.00255 34 0.04438 58
0.00255 34 0.04438 58
0.00266 5 0.04438 58
0.00266 5 0.04438 58
0.00245 17 0.04438 58

0.00266 5 0.04438 58
0.00266 5 0.04438 58
0.00266 5 0.04438 58
0.00266 5 0.04438 58
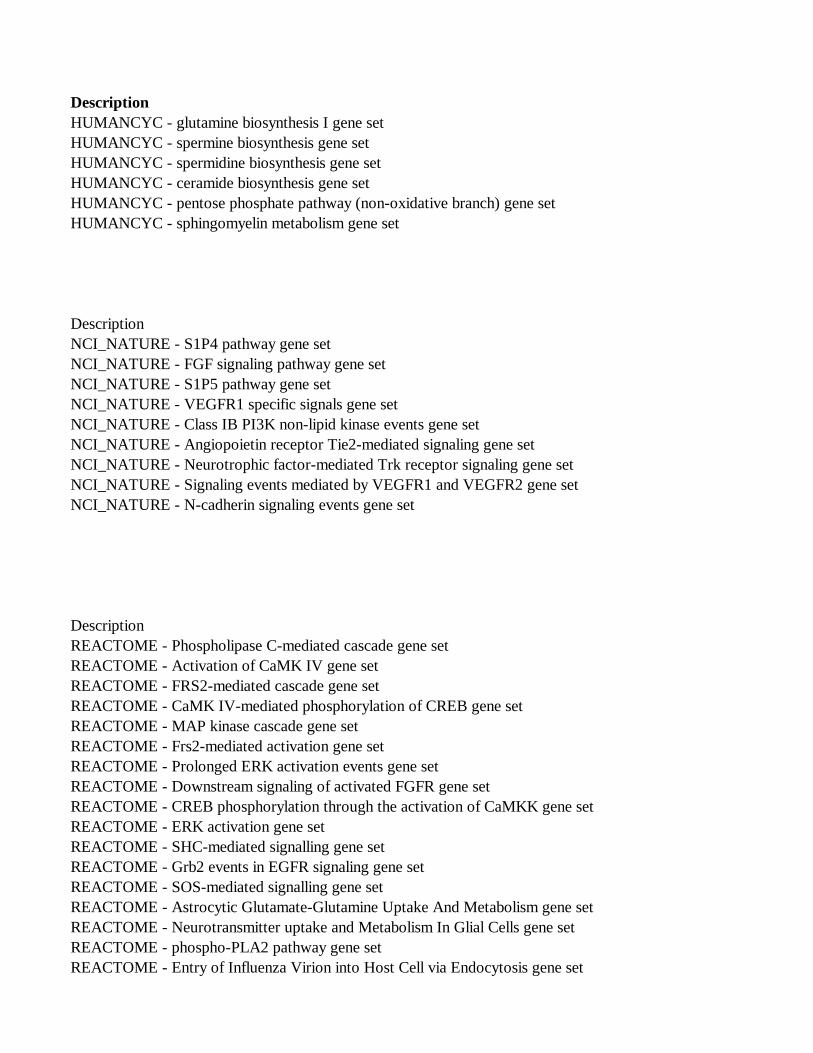
Description
HUMANCYC - glutamine biosynthesis I gene set
HUMANCYC - spermine biosynthesis gene set
HUMANCYC - spermidine biosynthesis gene set
HUMANCYC - ceramide biosynthesis gene set
HUMANCYC - pentose phosphate pathway (non-oxidative branch) gene set
HUMANCYC - sphingomyelin metabolism gene set
Description
NCI_NATURE - S1P4 pathway gene set
NCI_NATURE - FGF signaling pathway gene set
NCI_NATURE - S1P5 pathway gene set
NCI_NATURE - VEGFR1 specific signals gene set
NCI_NATURE - Class IB PI3K non-lipid kinase events gene set
NCI_NATURE - Angiopoietin receptor Tie2-mediated signaling gene set
NCI_NATURE - Neurotrophic factor-mediated Trk receptor signaling gene set
NCI_NATURE - Signaling events mediated by VEGFR1 and VEGFR2 gene set
NCI_NATURE - N-cadherin signaling events gene set
Description
REACTOME - Phospholipase C-mediated cascade gene set
REACTOME - Activation of CaMK IV gene set
REACTOME - FRS2-mediated cascade gene set
REACTOME - CaMK IV-mediated phosphorylation of CREB gene set
REACTOME - MAP kinase cascade gene set
REACTOME - Frs2-mediated activation gene set
REACTOME - Prolonged ERK activation events gene set
REACTOME - Downstream signaling of activated FGFR gene set
REACTOME - CREB phosphorylation through the activation of CaMKK gene set
REACTOME - ERK activation gene set
REACTOME - SHC-mediated signalling gene set
REACTOME - Grb2 events in EGFR signaling gene set
REACTOME - SOS-mediated signalling gene set
REACTOME - Astrocytic Glutamate-Glutamine Uptake And Metabolism gene set
REACTOME - Neurotransmitter uptake and Metabolism In Glial Cells gene set
REACTOME - phospho-PLA2 pathway gene set
REACTOME - Entry of Influenza Virion into Host Cell via Endocytosis gene set
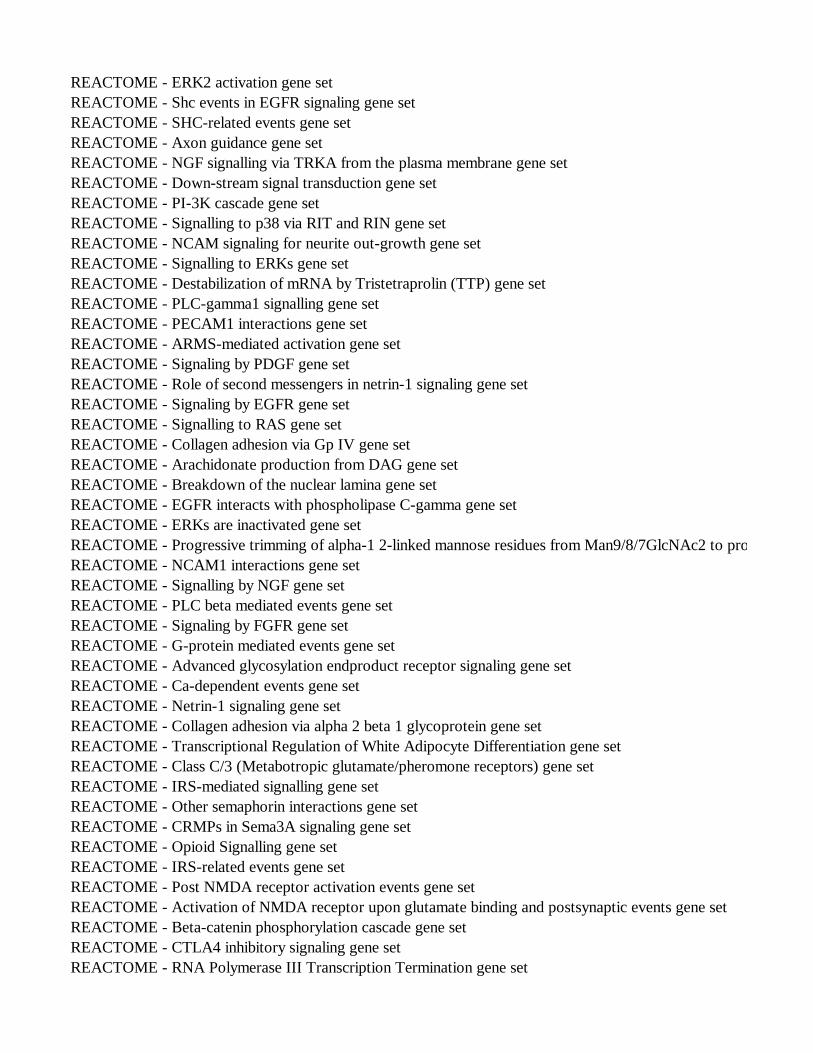
REACTOME - ERK2 activation gene set
REACTOME - Shc events in EGFR signaling gene set
REACTOME - SHC-related events gene set
REACTOME - Axon guidance gene set
REACTOME - NGF signalling via TRKA from the plasma membrane gene set
REACTOME - Down-stream signal transduction gene set
REACTOME - PI-3K cascade gene set
REACTOME - Signalling to p38 via RIT and RIN gene set
REACTOME - NCAM signaling for neurite out-growth gene set
REACTOME - Signalling to ERKs gene set
REACTOME - Destabilization of mRNA by Tristetraprolin (TTP) gene set
REACTOME - PLC-gamma1 signalling gene set
REACTOME - PECAM1 interactions gene set
REACTOME - ARMS-mediated activation gene set
REACTOME - Signaling by PDGF gene set
REACTOME - Role of second messengers in netrin-1 signaling gene set
REACTOME - Signaling by EGFR gene set
REACTOME - Signalling to RAS gene set
REACTOME - Collagen adhesion via Gp IV gene set
REACTOME - Arachidonate production from DAG gene set
REACTOME - Breakdown of the nuclear lamina gene set
REACTOME - EGFR interacts with phospholipase C-gamma gene set
REACTOME - ERKs are inactivated gene set
REACTOME - Progressive trimming of alpha-1 2-linked mannose residues from Man9/8/7GlcNAc2 to produce Man5GlcNAc2 gene set
REACTOME - NCAM1 interactions gene set
REACTOME - Signalling by NGF gene set
REACTOME - PLC beta mediated events gene set
REACTOME - Signaling by FGFR gene set
REACTOME - G-protein mediated events gene set
REACTOME - Advanced glycosylation endproduct receptor signaling gene set
REACTOME - Ca-dependent events gene set
REACTOME - Netrin-1 signaling gene set
REACTOME - Collagen adhesion via alpha 2 beta 1 glycoprotein gene set
REACTOME - Transcriptional Regulation of White Adipocyte Differentiation gene set
REACTOME - Class C/3 (Metabotropic glutamate/pheromone receptors) gene set
REACTOME - IRS-mediated signalling gene set
REACTOME - Other semaphorin interactions gene set
REACTOME - CRMPs in Sema3A signaling gene set
REACTOME - Opioid Signalling gene set
REACTOME - IRS-related events gene set
REACTOME - Post NMDA receptor activation events gene set
REACTOME - Activation of NMDA receptor upon glutamate binding and postsynaptic events gene set
REACTOME - Beta-catenin phosphorylation cascade gene set
REACTOME - CTLA4 inhibitory signaling gene set
REACTOME - RNA Polymerase III Transcription Termination gene set

REACTOME - S6K1 signalling gene set
REACTOME - FGFR2c ligand binding and activation gene set
REACTOME - RAF activation gene set
REACTOME - N-glycan trimming and elongation in the cis-Golgi gene set

URL
www.pathwaycomm...
www.pathwaycomm...
www.pathwaycomm...
www.pathwaycomm...
www.pathwaycomm...
www.pathwaycomm...
URL
www.pathwaycomm...
www.pathwaycomm...
www.pathwaycomm...
www.pathwaycomm...
www.pathwaycomm...
www.pathwaycomm...
www.pathwaycomm...
www.pathwaycomm...
www.pathwaycomm...
URL
www.pathwaycomm...
www.pathwaycomm...
www.pathwaycomm...
www.pathwaycomm...
www.pathwaycomm...
www.pathwaycomm...
www.pathwaycomm...
www.pathwaycomm...
www.pathwaycomm...
www.pathwaycomm...
www.pathwaycomm...
www.pathwaycomm...
www.pathwaycomm...
www.pathwaycomm...
www.pathwaycomm...
www.pathwaycomm...
www.pathwaycomm...

www.pathwaycomm...
www.pathwaycomm...
www.pathwaycomm...
www.pathwaycomm...
www.pathwaycomm...
www.pathwaycomm...
www.pathwaycomm...
www.pathwaycomm...
www.pathwaycomm...
www.pathwaycomm...
www.pathwaycomm...
www.pathwaycomm...
www.pathwaycomm...
www.pathwaycomm...
www.pathwaycomm...
www.pathwaycomm...
www.pathwaycomm...
www.pathwaycomm...
www.pathwaycomm...
www.pathwaycomm...
www.pathwaycomm...
www.pathwaycomm...
www.pathwaycomm...
www.pathwaycomm... 2-linked mannos...
www.pathwaycomm...
www.pathwaycomm...
www.pathwaycomm...
www.pathwaycomm...
www.pathwaycomm...
www.pathwaycomm...
www.pathwaycomm...
www.pathwaycomm...
www.pathwaycomm...
www.pathwaycomm...
www.pathwaycomm...
www.pathwaycomm...
www.pathwaycomm...
www.pathwaycomm...
www.pathwaycomm...
www.pathwaycomm...
www.pathwaycomm...
www.pathwaycomm...
www.pathwaycomm...
www.pathwaycomm...
www.pathwaycomm...

www.pathwaycomm...
www.pathwaycomm...
www.pathwaycomm...
www.pathwaycomm...
Related Documents