MicroRNA in Diabetic and TGFbeta-Related Renal Glomerulopathy by Yi-Chun Lai A dissertation submitted in partial fulfillment of the requirements for the degree of Doctor of Philosophy (Cellular and Molecular Biology) in The University of Michigan 2013 Doctoral Committee: Assistant Professor Markus Bitzer, Chair Professor Frank C. Brosius III Professor Christin Carter-Su Professor Ram K. Menon Associate Professor Robert C. Thompson

Welcome message from author
This document is posted to help you gain knowledge. Please leave a comment to let me know what you think about it! Share it to your friends and learn new things together.
Transcript

MicroRNA in Diabetic and TGFbeta-Related Renal Glomerulopathy
by
Yi-Chun Lai
A dissertation submitted in partial fulfillment of the requirements for the degree of
Doctor of Philosophy (Cellular and Molecular Biology)
in The University of Michigan 2013
Doctoral Committee: Assistant Professor Markus Bitzer, Chair Professor Frank C. Brosius III Professor Christin Carter-Su Professor Ram K. Menon Associate Professor Robert C. Thompson

© Yi-Chun Lai 2013

ii
Acknowledgments
First of all, I would like to show my greatest appreciation to my thesis advisor, Dr. Markus
Bitzer, for his guidance and teaching. When I first met Markus in 2008, after a small
discussion about his research, I immediately grew the enthusiasm to work with him and
follow him. From clinical research to basic science, I enjoyed brainstorming with Markus,
and under his leadership, I am capable of being intellectually independent. I am deeply
grateful for Markus’s patience to help me grow and I am also indebted to him for giving me
this opportunity to pursue my PhD degree.
I am also thankful for the valuable feedback from my thesis committee members, Dr. Frank
Brosius, Dr. Christin Carter-Su, Dr. Ram Menon, and Dr. Robert Thompson. With their
insightful suggestion and assistance, I am able to advance my thesis work and make a good
progress. I especially thank Dr. Frank Brosius and Dr. Robert Thompson for their support and
help regarding fellowship application. In addition, I would like to thank Dr. Jessica Schwartz
for recruiting me in the Cell and Molecular Biology program, and Cathy Mitchell for helping
me with all kinds of presentation arrangement and financial support.
It has been a wonderful experience to work with my lab members, Jinghui Luo and
Christopher O’Connor. I thank Jinghui for her technical support and experience sharing. I
particularly give my deepest gratitude to Christopher O’Connor for all the experiments he has
performed for me as well as the help to continue the research whenever I was not available.

iii
Furthermore, I thank all the collaborators to our lab. Dr. David Turner and Huanqing Zhang
have helped us with numerous microRNA experiments, and I thank for their generous sharing.
I especially would like to acknowledge Dr. Matthias Kretzler’s lab. I owe all my
bioinformatics skills to them. I thank Celine Berthier, Felix Eichinger, Claudiu Komorowsky,
Sebastian Martini, and Viji Nair for their system biology instruction. I also thank Ann
Randolph to process the sample, and Courtenay Vining for any experiment support.
Furthermore, I show my most gratefulness to Dr. Matthias Kretzler and Dr. Wenjun Ju for
their insight, advice, and direction.
Other collaborators outside University of Michigan include Dr. Iddo Ben-Dov and Dr.
Thomas Tuschl in The Rockefeller University. I am thankful for their assistance in terms of
microRNA biology and bioinformatics. I also thank Robert G. Nelson in NIDDK, National
Institutes of Health for his support in studying diabetic nephropathy of PIMA Indians. Finally,
I would like to thank Dr. Stuart Orkin in Dana Farber Cancer Institute, Boston, for providing
microRNA21 knockout mice.
Ultimately, I am deeply indebted to my parents for their unconditional love and endless care.
5 years ago, when I changed over my career path to United States, I totally appreciated their
unselfishness and understanding. Moreover, I would like to recognize my two older brothers.
Being medical professors and great physicians in National Taiwan University Hospital, they
are always my heroes whom I look up to. I also would like to thank my previous mentor in
National Taiwan University Children Hospital, Dr. Mei-Hwan Wu. Without her
encouragement and endorsement, I would not have come to United States to fulfill my
academic enthusiasm.
In the end, many thanks to my dearest husband for his heart to love me as the way I am, for
his understanding to deal with my long working hour, for his gentleness to support any aspect
I need, and for his patience to equip me with kindness and compassion.
iv
TABLE OF CONTENTS
Acknowledgements ii
List of Figures vi
List of Tables viii
Abstract ix
Chapter
I. Introduction 1
Figures 18
References 25
II. MicroRNA-21 ameliorates TGF-beta mediated glomerular injury 31
Abstract 31
Introduction 33
Result 35
Discussion 45
Methods and materials 50
Tables and figures 57
References 74
III. Loss of miR-21 promotes mesangial cell proliferation and leads to increased
mesangial expansion in diabetic mice 79
Abstract 79
v
Introduction 81
Result 83
Discussion 86
Methods and materials 91
Tables and figures 95
References 103
IV. Linking disease-associated miRNA and disease-associated mRNA identifies
miRNA-mRNA interaction 106
Abstract 106
Introduction 108
Result 111
Discussion 116
Methods and materials 121
Tables and figures 125
References 135
V. Conclusions and future directions 139
Conclusions 139
Future directions 149
Figures 155
References 156
vi
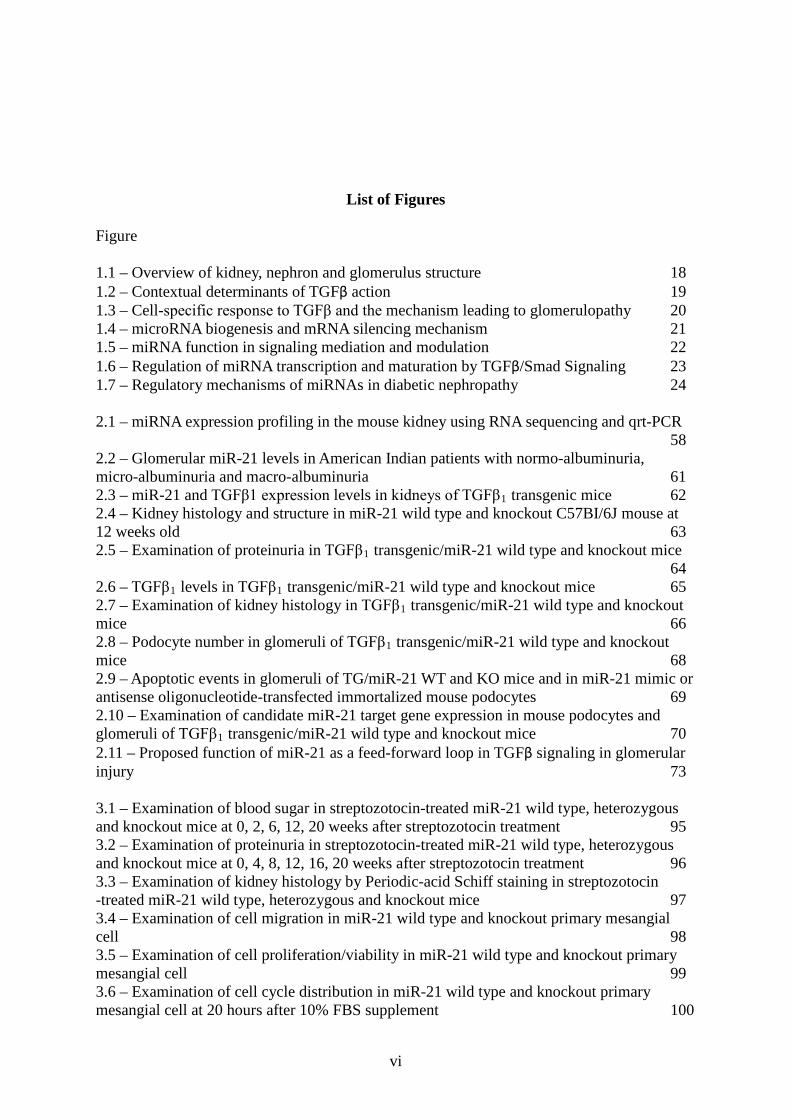
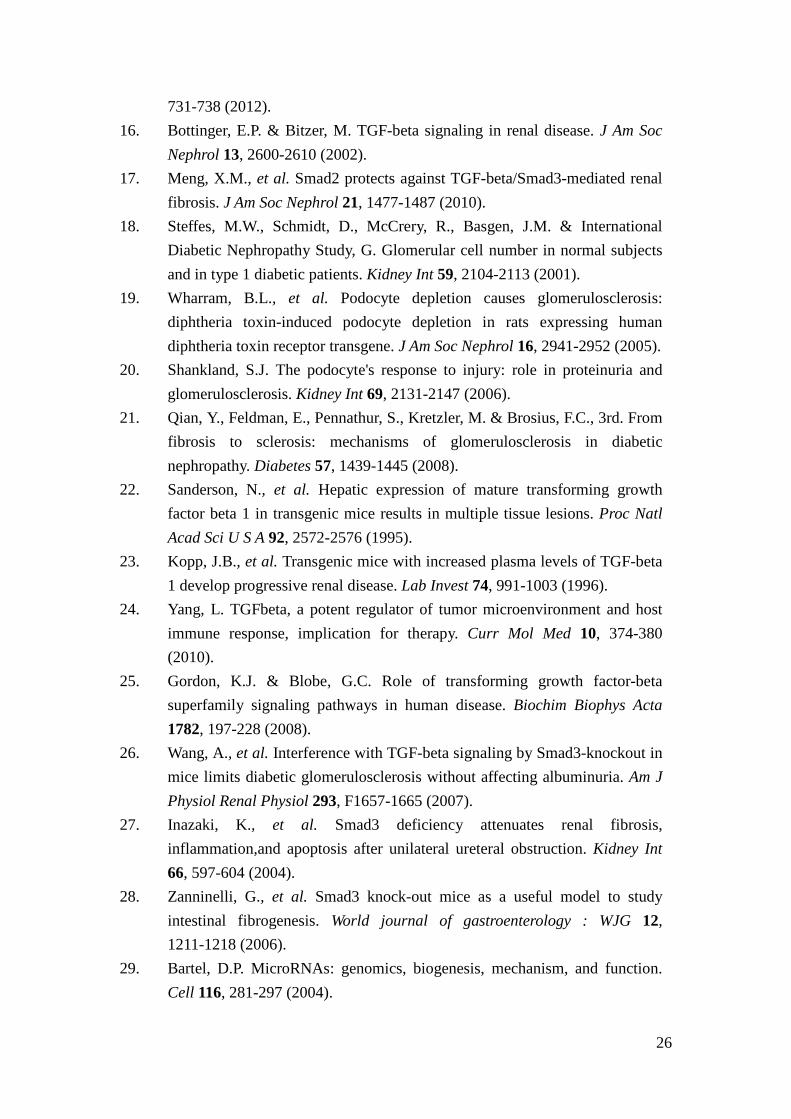
List of Figures Figure 1.1 – Overview of kidney, nephron and glomerulus structure 18 1.2 – Contextual determinants of TGFβ action 19 1.3 – Cell-specific response to TGFβ and the mechanism leading to glomerulopathy 20 1.4 – microRNA biogenesis and mRNA silencing mechanism 21 1.5 – miRNA function in signaling mediation and modulation 22 1.6 – Regulation of miRNA transcription and maturation by TGFβ/Smad Signaling 23 1.7 – Regulatory mechanisms of miRNAs in diabetic nephropathy 24 2.1 – miRNA expression profiling in the mouse kidney using RNA sequencing and qrt-PCR 58 2.2 – Glomerular miR-21 levels in American Indian patients with normo-albuminuria, micro-albuminuria and macro-albuminuria 61 2.3 – miR-21 and TGFβ1 expression levels in kidneys of TGFβ1 transgenic mice 62 2.4 – Kidney histology and structure in miR-21 wild type and knockout C57BI/6J mouse at 12 weeks old 63 2.5 – Examination of proteinuria in TGFβ1 transgenic/miR-21 wild type and knockout mice 64 2.6 – TGFβ1 levels in TGFβ1 transgenic/miR-21 wild type and knockout mice 65 2.7 – Examination of kidney histology in TGFβ1 transgenic/miR-21 wild type and knockout mice 66 2.8 – Podocyte number in glomeruli of TGFβ1 transgenic/miR-21 wild type and knockout mice 68 2.9 – Apoptotic events in glomeruli of TG/miR-21 WT and KO mice and in miR-21 mimic or antisense oligonucleotide-transfected immortalized mouse podocytes 69 2.10 – Examination of candidate miR-21 target gene expression in mouse podocytes and glomeruli of TGFβ1 transgenic/miR-21 wild type and knockout mice 70 2.11 – Proposed function of miR-21 as a feed-forward loop in TGFβ signaling in glomerular injury 73 3.1 – Examination of blood sugar in streptozotocin-treated miR-21 wild type, heterozygous and knockout mice at 0, 2, 6, 12, 20 weeks after streptozotocin treatment 95 3.2 – Examination of proteinuria in streptozotocin-treated miR-21 wild type, heterozygous and knockout mice at 0, 4, 8, 12, 16, 20 weeks after streptozotocin treatment 96 3.3 – Examination of kidney histology by Periodic-acid Schiff staining in streptozotocin -treated miR-21 wild type, heterozygous and knockout mice 97 3.4 – Examination of cell migration in miR-21 wild type and knockout primary mesangial cell 98 3.5 – Examination of cell proliferation/viability in miR-21 wild type and knockout primary mesangial cell 99 3.6 – Examination of cell cycle distribution in miR-21 wild type and knockout primary mesangial cell at 20 hours after 10% FBS supplement 100
vii
3.7 – Examination of potential regulatory genes of miR-21 in glomeruli of streptozotocin- treated miR-21 wild type and knockout mice 101 3.8 – Examination of the protein level of PTEN in miR-21 mimic-transfected human embryonic kidney cells and DBA/2J mice 102 4.1 – Cytoscape illustration of correlation between ACR-correlated miRNAs and genes in the same American Indian cohort 130 4.2 – Cytoscape illustration of the target prediction between ACR-correlated miRNAs and ACR-correlated genes 131 4.3 – Examination of miR-200a level in different cell lines 132 4.4 – Examination of the predicted target between miR-200a and selected ACR-correlated genes 133 4.5 – Examination of direct target between EXOC7 and miR-200a 134
viii
List of Tables Table 2.1 – Characteristics of American Indian testing and validating cohort 57 2.2A – Correlation between miRNA and ACR in testing cohort 59 2.2B – Correlation between miRNA and ACR in validating cohort 60 4.1 – Characteristics of American Indian cohort 125 4.2 – The top 10 ACR-correlated miRNAs 126 4.3 – Correlation between genes and ACR-correlated miRNAs 127 4.4 – Target prediction between ACR-correlated genes and ACR-correlated miRNAs 128 4.5 – Correlation between ACR-correlated miRNAs and their target-predicted ACR-correlated genes 129
ix
ABSTRACT
MicroRNAs in Diabetic and TGF-beta-Related Renal Glomerular Injury
by
Jennifer Yi-Chun Lai
Chair: Markus Bitzer
Chronic kidney disease (CKD) decreases quality of life, increases mortality, and has
limited treatment options. Glomerular injury is an early stage of diabetic nephropathy
(DN), which is a leading cause of CKD, and is characterized by mesangial cell
proliferation and hypertrophy, loss of podocytes, and increased extracellular matrix
(ECM) deposition. Critical aspects of these cellular events are mediated by activation
of the Transforming Growth Factor-beta (TGFβ) signaling cascade. MicroRNAs
(miRNAs) regulate gene expression in a post-transcriptional level and have been
implicated as important regulatory elements in the TGFβ signaling cascade. To
determine the role of miRNAs in DN, we examined miRNA expression in
micro-dissected glomeruli from kidney biopsies of patients with clinically early DN
and correlated the expression levels with clinical manifestations.
x
We determined that miR-21 exhibits high expression in renal glomeruli and
significant correlation with urine albumin-to-creatinine-ratio (ACR) of patients.
miR-21 is a known regulator of TGFβ signaling and its level is positively associated
with severity of renal phenotype in TGFβ transgenic mice. We further found that loss
of miR-21 in TGFβ transgenic mice resulted in accelerated podocyte apoptosis and
glomerulosclerosis. A similar phenotype was detected in streptozotocin-induced
diabetic mice. In cultured glomerular cells, loss or inhibition of miR-21 led to
increased apoptosis of podocytes and increased proliferation of primary mesangial
cells. Further studies showed that miR-21 represses multiple pro-apoptotic pathways,
including TGFβ/Smad7, P53, and PDCD4, cell cycle-related genes such as Cdk6 and
Cdc25a, and ECM-related genes. These results suggest that miR-21 ameliorates
glomerular injury through repression of multiple injury-mediating signaling pathways.
To further elucidate a miRNA-mediated network mediating DN progression, we
examined mRNA expression in the same glomerular samples. We identified
ACR-associated genes that are predicted targets of ACR-associated miRNAs and
experimentally validated the sequence-dependent repression of candidate target genes
of miR-200a. This led to the discovery of EXOC7 as a sequence-dependent target of
xi
miR-200a.
In summary, correlating miRNA expression with specific clinical outcomes identified
novel mechanisms regulating DN, including a protective role for miR-21 in
glomerular injury. Furthermore, the approach, which links disease-associated
miRNAs and mRNAs by target prediction, appears to facilitate identification of
context-relevant miRNA-mRNA interactions.

1
Chapter I
Introduction
Chronic kidney disease (CKD) is the pathological change that develops after renal
injury, such as high blood sugar (hyperglycemia), oxidative stress, or
immune-mediated damage. CKD can lead to end-stage renal disease (ESRD)
requiring dialysis support or kidney transplantation. It also results in high morbidity
and mortality, partially due to an increased cardiovascular event rate, and thereby
imposes a heavy burden on medical economics1. The increasing prevalence of CKD
during the past 20 years highlights the public health importance of this disease2.
According to the 2011 United States Renal Data System (USRDS), Taiwan, Japan,
and United States are the three countries having the highest prevalence rate of ESRD
worldwide3. In the United States, the incidence rate of ESRD in 2011 was about 1.3%
among the Medicare population, but accounted for 8.1% of Medicare costs. Despite
the high prevalence of ESRD and excessive costs, interventions to prevent or delay
complications and progression of CKD remain limited. Furthermore, development of
new treatment options is hampered by our limited understanding of the molecular
2
events associated with the progression from renal injury to ESRD. Facing such a
medical difficulty, we felt there was an urgent need to advance the knowledge.
Among various renal injuries, diabetic nephropathy (DN), which is caused by
diabetic mellitus (DM), is the leading cause of ESRD in the United States3.
Therefore, it is essential to investigate the molecular mechanisms of DN in order to
ameliorate the development of ESRD.
Kidney structure
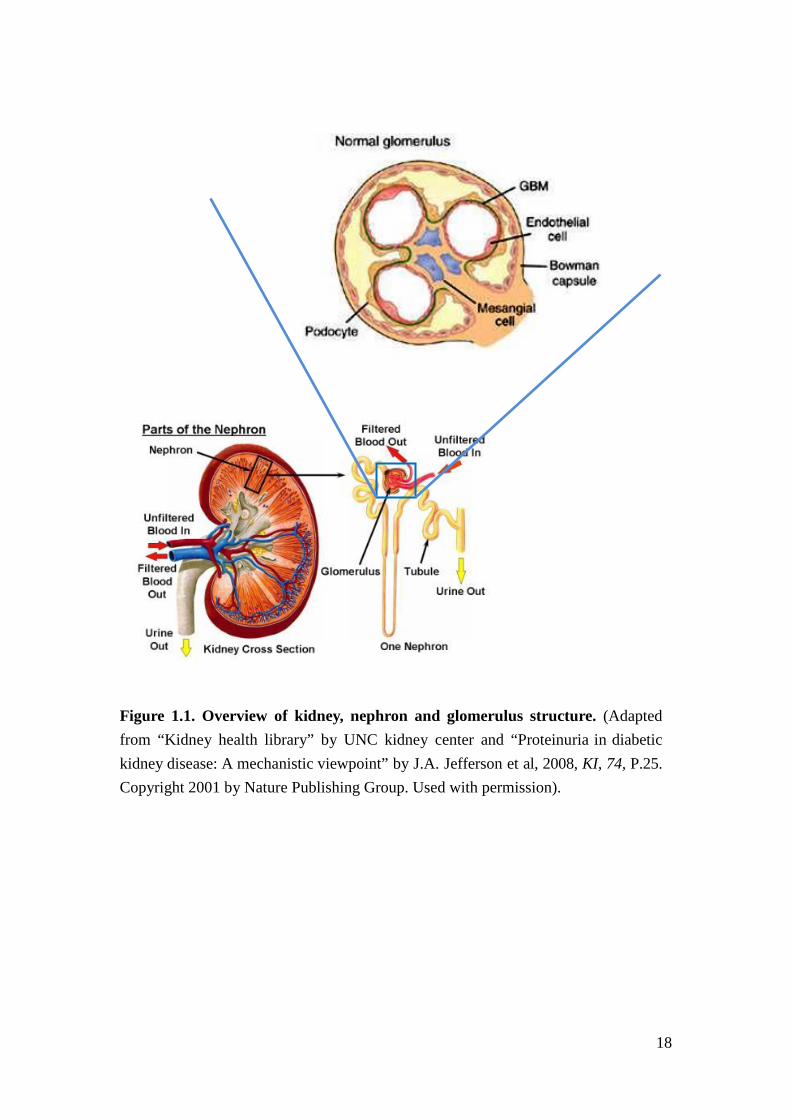
The nephron is the functional unit of the kidney (Figure 1.1). It has two major
compartments to maintain homeostasis. One is the renal glomerulus, a convolution
of capillary loops that harbors mesangial, endothelial, and visceral glomerular
epithelial cells (podocytes). Podocytes stand with extended pedicles on the urinary
side of the glomerular basement membrane (GBM) of the capillary loops. The foot
processes of podocytes are interdigiated and connected via a slit diaphragm. The
endothelium, GBM, and the slit diaphragm and body of podocytes form the
glomerular filtration barrier to generate primary urine. Mesangial cells are
specialized smooth muscle cells that are located between the capillary loops, are not
separated from endothelial cells by the GBM, and are thought to regulate renal blood
3
flow and pressure through glomerular capillaries. The other compartment is the
tubulo-interstitium, which is composed of tubules that are lined by tubular epithelial
cells which regulate urine composition through reabsorbing and excreting specific
molecules from the primary urine. Injuries to the glomeruli (glomerulopathy) or
tubule-interstitium can initiate a fibrotic response that leads to renal scaring and
CKD. It has been proposed that glomerulopathy is an early event of DN, and
initiates the damage in the tubulo-interstitial compartments of the kidney4,5.
Diabetic Nephropathy
DN results from longstanding DM and is associated with the activation of the
transforming growth factor-beta (TGFβ) signaling6. The earliest pathological finding
of DN is glomerulopathy7, characterized by mesangial expansion, podocyte
depletion, nodular glomerulosclerosis. It clinically manifests as proteinuria followed
by decreased glomerular filtration function8. The molecular events in glomeruli
induced by hyperglycemia include increased TGFβ production in the glomerular
cells leading to mesangial cell proliferation and hypertrophy, podocyte detachment
from the basement and death, and increased extracellular matrix (ECM) deposition9.
It has been proposed that podocyte depletion is the initiating event resulting in other
pathological changes in glomerulopathy10,11.
4
Transforming growth factor beta (TGFβ)
The TGFβ superfamily of ligands include Bone Morphogenetic Proteins (BMPs),
Growth and Differentiation Factors (GDFs), Anti-müllerian Hormone (AMH),
Activin, Nodal and TGFβs. Members of the TGFβ family are cytokines that bind to
TGF beta type II receptor, a serine/threonine receptor kinase, which catalyzes the
phosphorylation of the Type I receptor. Each class of ligands binds to specific type II
receptors. In mammals, there are seven known type I receptors and five type II
receptors. TGFβs promote cell proliferation, differentiation, regeneration, and
apoptosis, but the effects of TGFβ are dependent on the context and organ
system12,13. In general TGFβs maintain tissue homeostasis and regulate immunity,
cancer, and fibrotic diseases14.
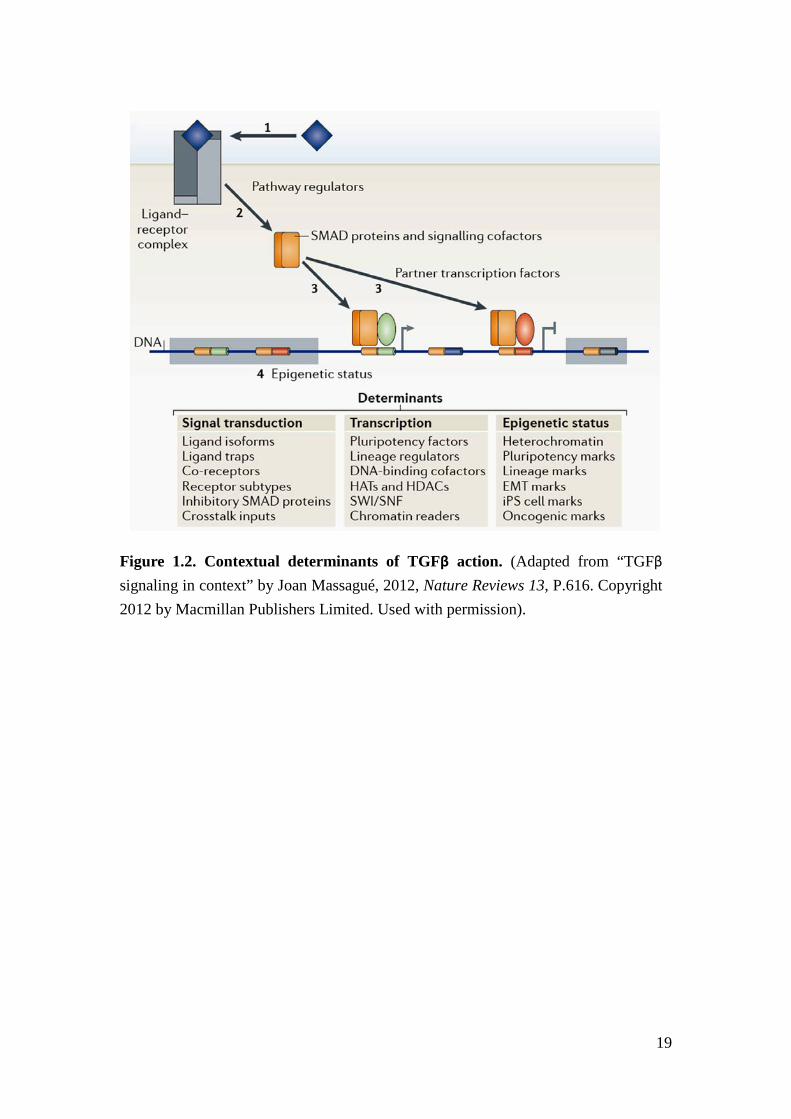
Intracellular signaling is initiated by the binding of TGFβ to a type II receptor dimer,
which recruits a type I receptor dimer to form a hetero-tetrameric complex with the
ligand. This complex then phosphorylates intracellular signaling molecules. The
receptor-phosphorylated Smad proteins (Smad2 and Smad3) are central downstream
effectors to convey and carry out many important context-dependent TGFβ actions
in the kidney, which are determined by the binding cofactors and the epigenetic
status of the target gene13 (Figure 1.2). Other than the canonical TGFβ-Smad
signaling pathway, TGFβ receptor I and II can each individually phosphorylate and
5
activate other downstream kinases that regulate diverse biological functions13.
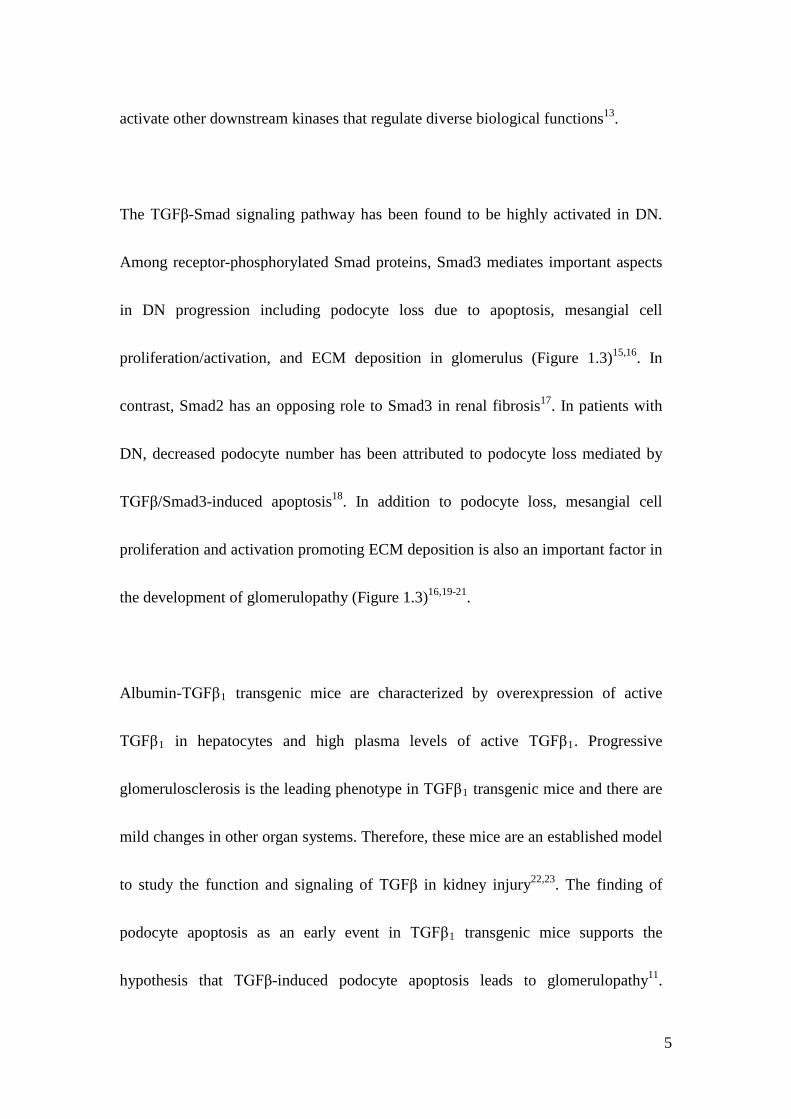
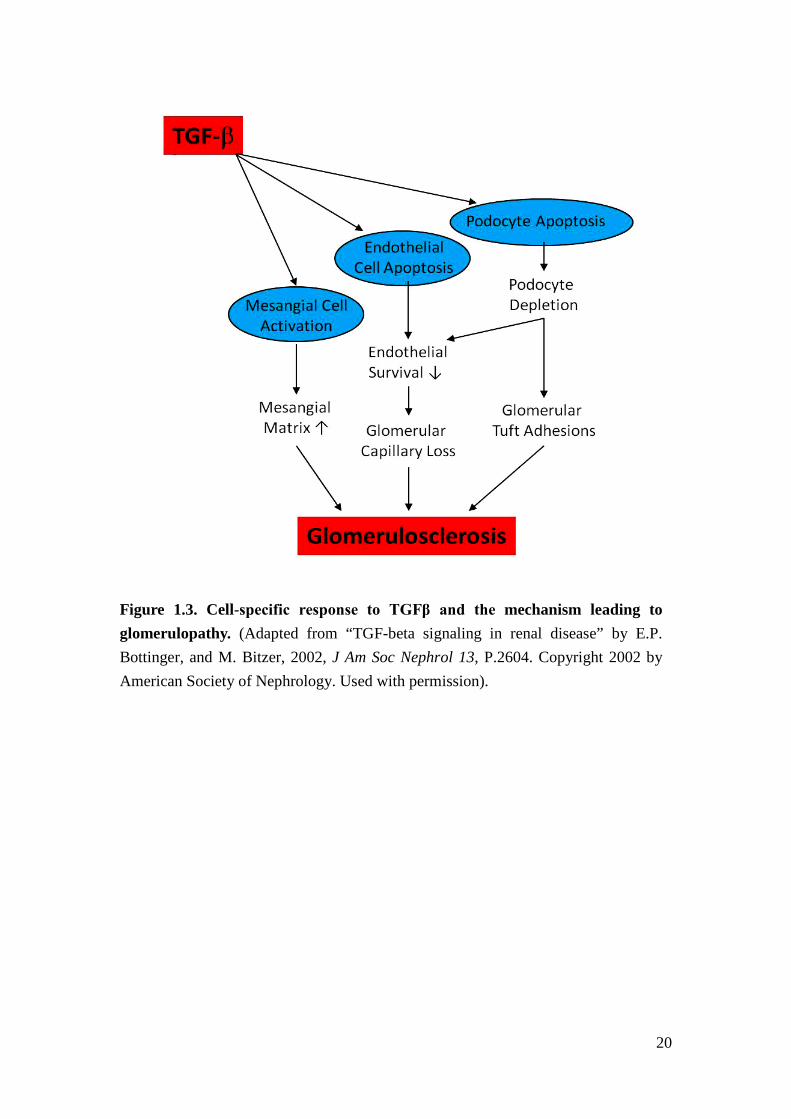
The TGFβ-Smad signaling pathway has been found to be highly activated in DN.
Among receptor-phosphorylated Smad proteins, Smad3 mediates important aspects
in DN progression including podocyte loss due to apoptosis, mesangial cell
proliferation/activation, and ECM deposition in glomerulus (Figure 1.3)15,16. In
contrast, Smad2 has an opposing role to Smad3 in renal fibrosis17. In patients with
DN, decreased podocyte number has been attributed to podocyte loss mediated by
TGFβ/Smad3-induced apoptosis18. In addition to podocyte loss, mesangial cell
proliferation and activation promoting ECM deposition is also an important factor in
the development of glomerulopathy (Figure 1.3)16,19-21.
Albumin-TGFβ1 transgenic mice are characterized by overexpression of active
TGFβ1 in hepatocytes and high plasma levels of active TGFβ1. Progressive
glomerulosclerosis is the leading phenotype in TGFβ1 transgenic mice and there are
mild changes in other organ systems. Therefore, these mice are an established model
to study the function and signaling of TGFβ in kidney injury22,23. The finding of
podocyte apoptosis as an early event in TGFβ1 transgenic mice supports the
hypothesis that TGFβ-induced podocyte apoptosis leads to glomerulopathy11.

6
However, despite the deleterious effects of increased TGFβ activity, TGFβ regulates
essential homeostatic processes and inhibition of TGFβ ligands or inhibition of the
ligand binding to its receptors causes pathologic changes24,25. Moreover, although
Smad3 knockout (KO) mice, have attenuated fibrosis after renal injury26,27, they
develop mucosal abscesses and have a strongly reduced lifespan28. Therefore, it is
critical to identify specific downstream signaling mediators in the TGFβ signaling
cascade that can serve as potential therapeutic targets.
MicroRNAs (miRNAs)
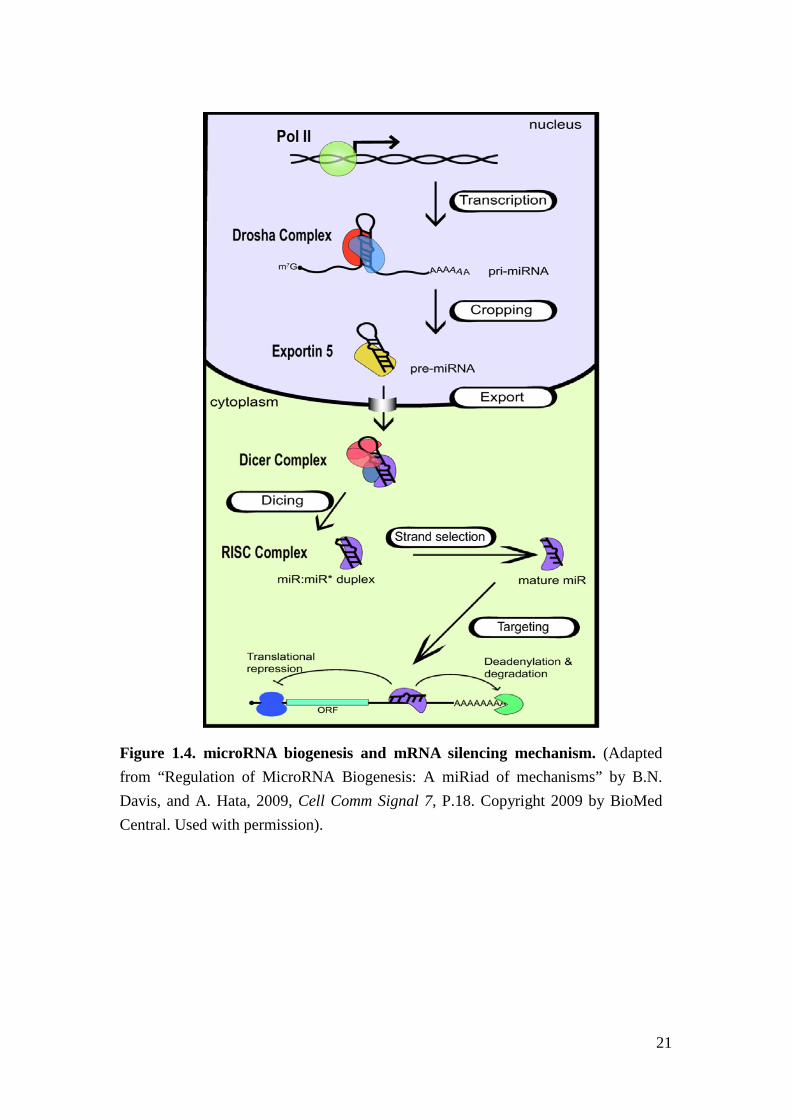
MiRNAs are small non-coding RNAs that regulate gene expression at
post-transcriptional level29. They were discovered in 1993 from C. elegans studies30
and were found to be broadly conserved among different species31. MiRNAs are
transcribed by RNA polymerase II to form approximately 70 nucleotide long
pri-miRNAs with a hair-pin loop and stem structure32,33 (Figure 1.4). Pri-miRNAs
are cleaved by Drosha complex to form pre-miRNA33 and then exported to
cytoplasm to be further processed by Dicer to form 22 to 24 nucleotides
double-strand miRNAs (ds-miRNAs)34. Integrating with RNA-induced silencing
complex (RISC), the ds-miRNAs become mature single-strand miRNAs (ss-RNAs)
and bind to complementary sequences in 3’ untranslated region (3’UTR) of the
7
target messenger RNAs (mRNAs) causing translational repression or mRNA
degradation35,36 (Figure 1.4).
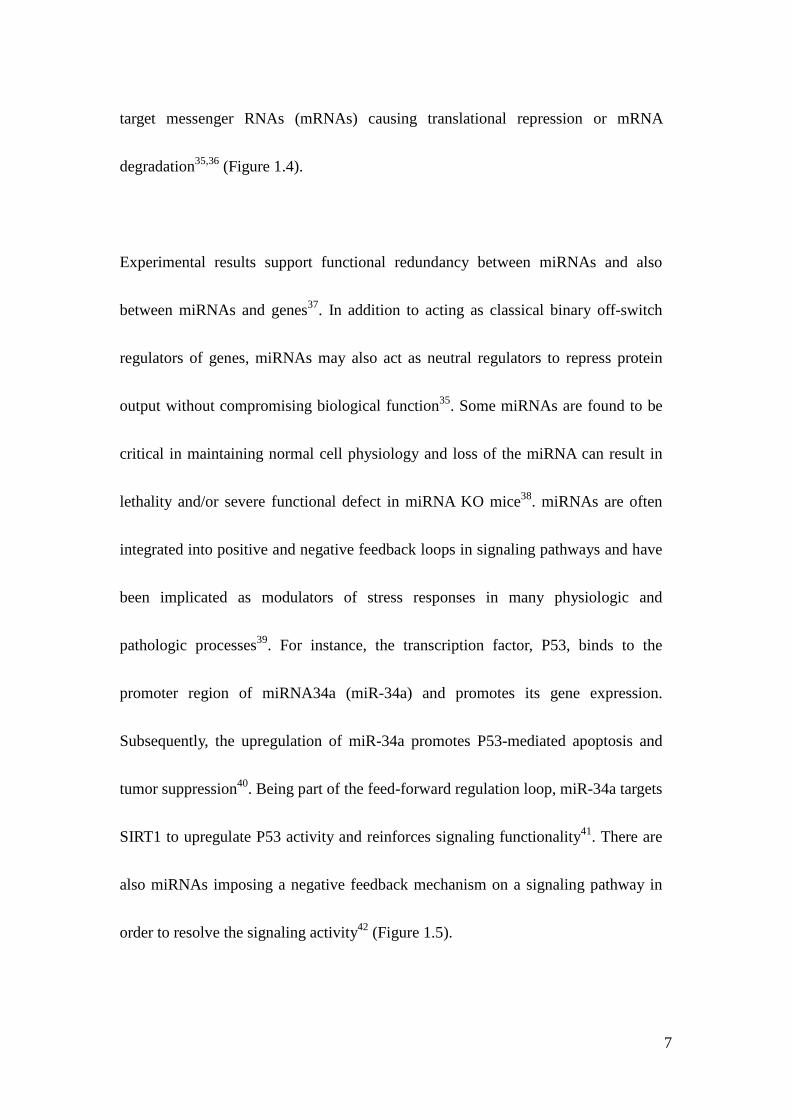
Experimental results support functional redundancy between miRNAs and also
between miRNAs and genes37. In addition to acting as classical binary off-switch
regulators of genes, miRNAs may also act as neutral regulators to repress protein
output without compromising biological function35. Some miRNAs are found to be
critical in maintaining normal cell physiology and loss of the miRNA can result in
lethality and/or severe functional defect in miRNA KO mice38. miRNAs are often
integrated into positive and negative feedback loops in signaling pathways and have
been implicated as modulators of stress responses in many physiologic and
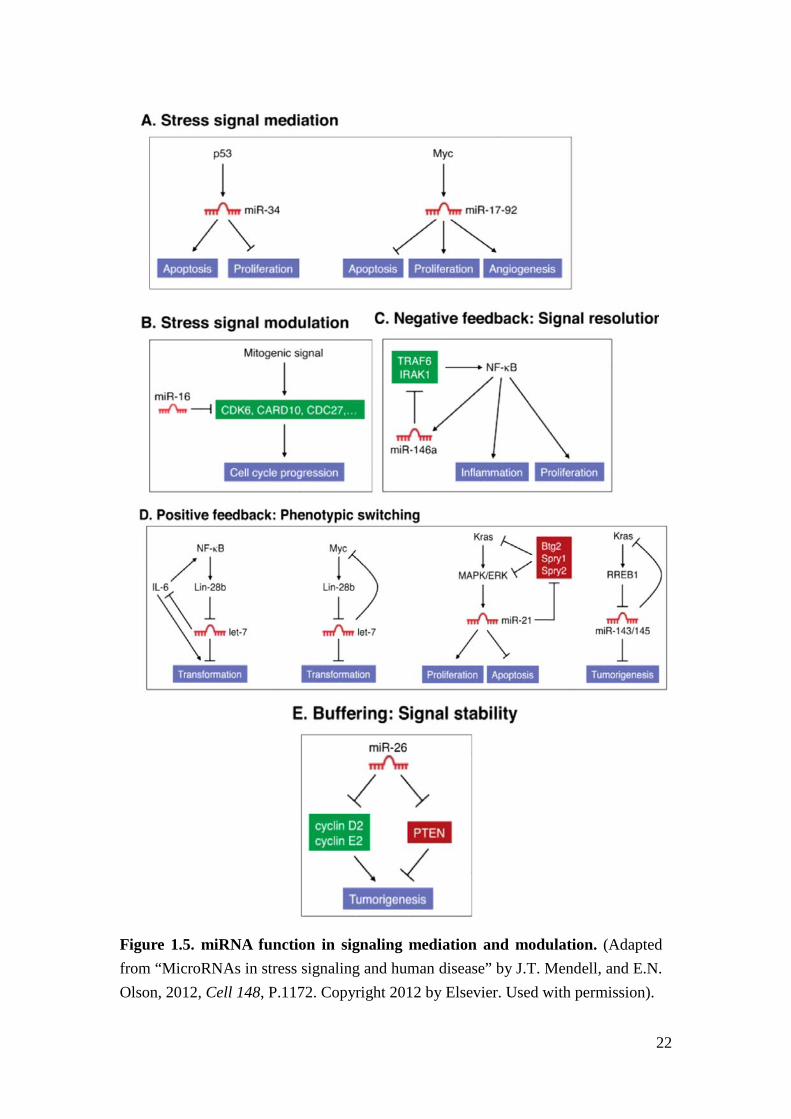
pathologic processes39. For instance, the transcription factor, P53, binds to the
promoter region of miRNA34a (miR-34a) and promotes its gene expression.
Subsequently, the upregulation of miR-34a promotes P53-mediated apoptosis and
tumor suppression40. Being part of the feed-forward regulation loop, miR-34a targets
SIRT1 to upregulate P53 activity and reinforces signaling functionality41. There are
also miRNAs imposing a negative feedback mechanism on a signaling pathway in
order to resolve the signaling activity42 (Figure 1.5).
8
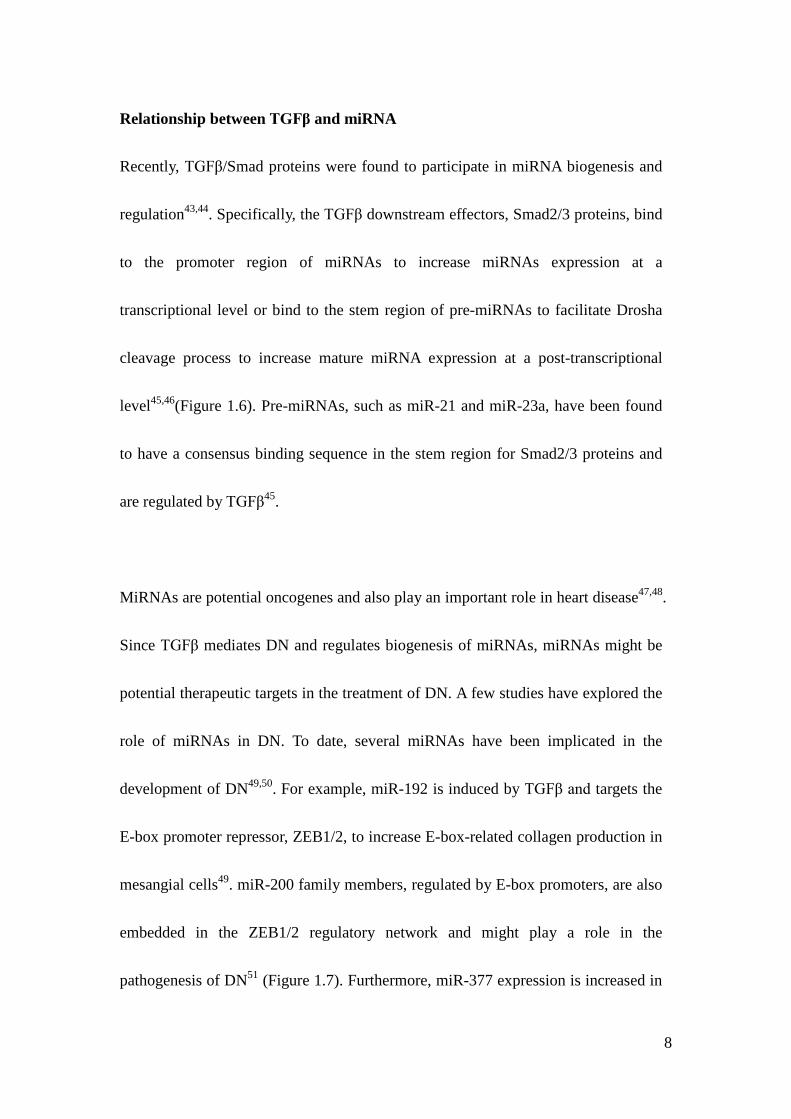
Relationship between TGFβ and miRNA
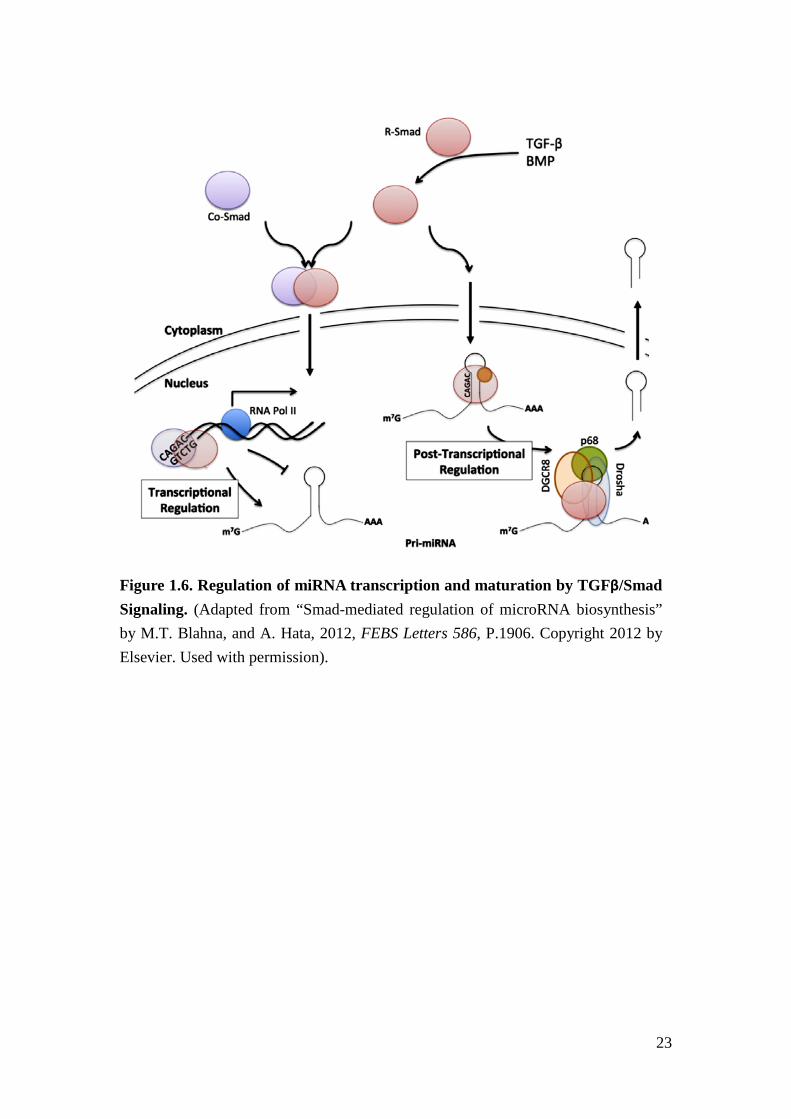
Recently, TGFβ/Smad proteins were found to participate in miRNA biogenesis and
regulation43,44. Specifically, the TGFβ downstream effectors, Smad2/3 proteins, bind
to the promoter region of miRNAs to increase miRNAs expression at a
transcriptional level or bind to the stem region of pre-miRNAs to facilitate Drosha
cleavage process to increase mature miRNA expression at a post-transcriptional
level45,46(Figure 1.6). Pre-miRNAs, such as miR-21 and miR-23a, have been found
to have a consensus binding sequence in the stem region for Smad2/3 proteins and
are regulated by TGFβ45.
MiRNAs are potential oncogenes and also play an important role in heart disease47,48.
Since TGFβ mediates DN and regulates biogenesis of miRNAs, miRNAs might be
potential therapeutic targets in the treatment of DN. A few studies have explored the
role of miRNAs in DN. To date, several miRNAs have been implicated in the
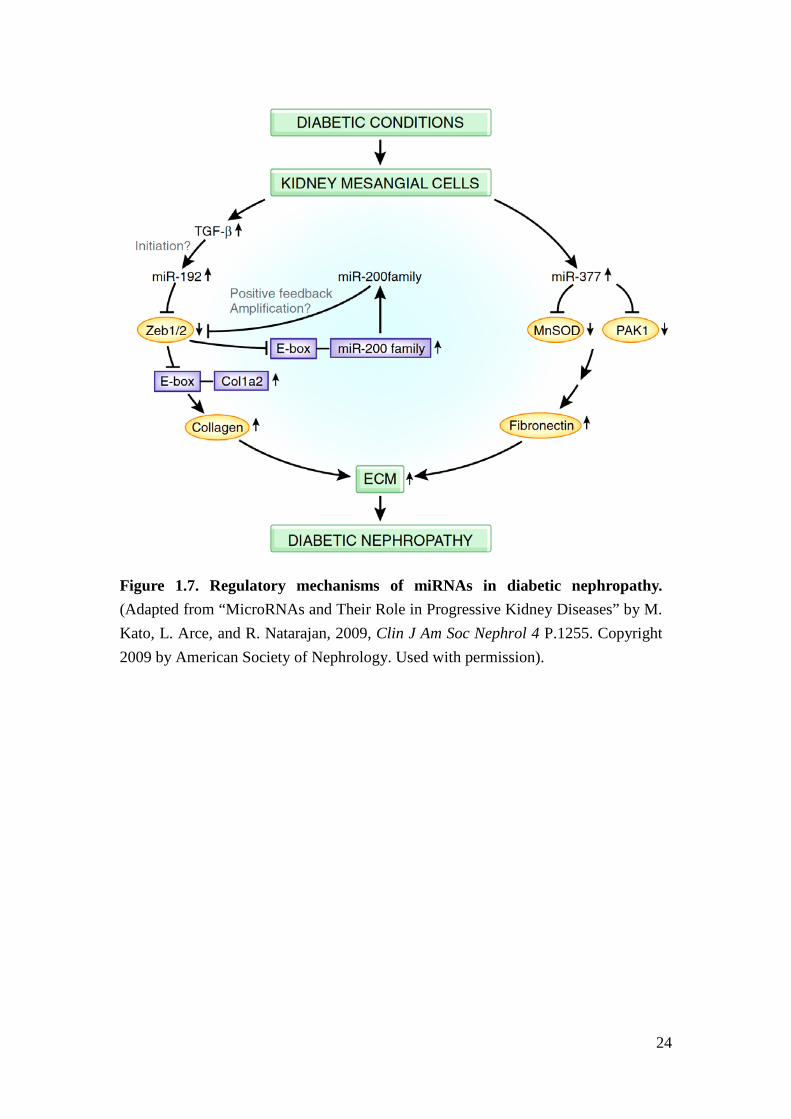
development of DN49,50. For example, miR-192 is induced by TGFβ and targets the
E-box promoter repressor, ZEB1/2, to increase E-box-related collagen production in
mesangial cells49. miR-200 family members, regulated by E-box promoters, are also
embedded in the ZEB1/2 regulatory network and might play a role in the
pathogenesis of DN51 (Figure 1.7). Furthermore, miR-377 expression is increased in
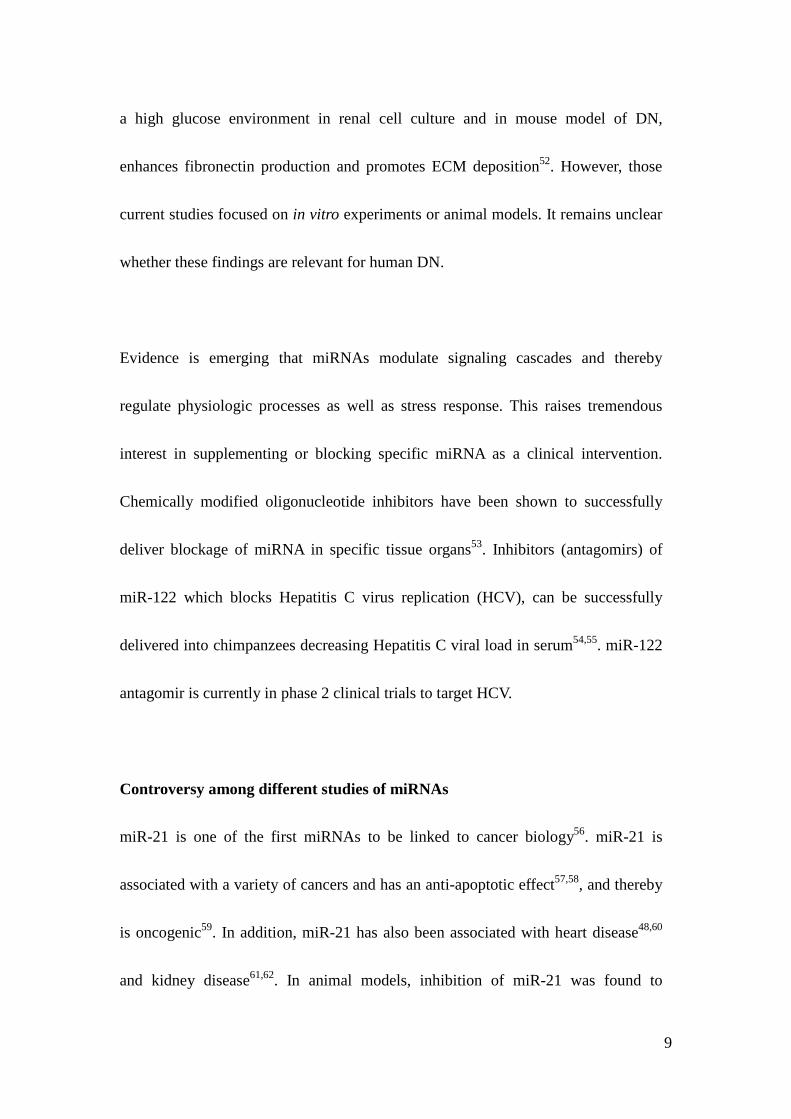
9
a high glucose environment in renal cell culture and in mouse model of DN,
enhances fibronectin production and promotes ECM deposition52. However, those
current studies focused on in vitro experiments or animal models. It remains unclear
whether these findings are relevant for human DN.
Evidence is emerging that miRNAs modulate signaling cascades and thereby
regulate physiologic processes as well as stress response. This raises tremendous
interest in supplementing or blocking specific miRNA as a clinical intervention.
Chemically modified oligonucleotide inhibitors have been shown to successfully
deliver blockage of miRNA in specific tissue organs53. Inhibitors (antagomirs) of
miR-122 which blocks Hepatitis C virus replication (HCV), can be successfully
delivered into chimpanzees decreasing Hepatitis C viral load in serum54,55. miR-122
antagomir is currently in phase 2 clinical trials to target HCV.
Controversy among different studies of miRNAs
miR-21 is one of the first miRNAs to be linked to cancer biology56. miR-21 is
associated with a variety of cancers and has an anti-apoptotic effect57,58, and thereby
is oncogenic59. In addition, miR-21 has also been associated with heart disease48,60
and kidney disease61,62. In animal models, inhibition of miR-21 was found to
10
attenuate tubulo-interstitial fibrosis in unilateral ureteral obstruction (UUO)61 and
unilateral ischemia-reperfusion injury62.
Because miR-21 is an anti-apoptotic factor, miR-21 might play a role in diabetic
glomerulopathy, which is characterized by podocyte apoptosis. Furthermore, TGFβ
signaling activity is known to induce podocyte apoptosis and regulates miR-21
biogenesis. However, previous studies about miR-21 focused on the
tubulointerstitium of kidney61,62.
As kidney is composed of different cell types and most miRNAs are multifaceted as
well as cell-type-specific, results across different studies and strategies are often not
consistent49,50,63. For example, Krupa et al. found that loss of miR-192 associates
with increased fibrosis in kidney biopsies of human DN and loss of miR-192
promotes fibrogenesis in renal tubular cells50. However, Kato et al. proposed that
miR-192 promotes fibrogenesis through enhancing TGFβ-induced collagen1a2
expression in mesangial cells49. Controversy still exists among different miRNA
studies related to DN and therapeutic development is actively ongoing. For that
reason, we were prompted to investigate whether miRNA plays a role specifically in
diabetic glomerulopathy (DG).
11
MiRNA and mRNA interaction
MiRNAs repress gene expression by binding to mRNA transcripts thereby
regulating their expression levels and the relationship between miRNA and mRNA
expression has been broadly studied64. Several algorithms have been developed to
predict the targeting between miRNAs and mRNA 3’UTR. One such algorithm is
TargetScan, which is based on matching seed sequences and affinity and
conservation across species of miRNA:mRNA binding sites64-66. MiRanda,
calculates the thermodynamic energy of complimentary binding and dynamic
alignment between miRNAs and mRNA67,68. However, the false prediction rate of
those algorithms remains high and the number of experimentally verified targets is
still low69. For example, human miR-21 has 164 predicted targets in Targetscan64-66,
but only has 42 validated target genes according to miRecord70, a resource of
experimentally verified miR-target interaction. The other 122 predicted targets were
either not the sequence-dependent targets of miR-21 or have not been
experimentally verified.
As a result, many studies have developed new approaches to explore
miRNA-mRNA interaction that involves more than sequence binding prediction. For
example, MAGIA integrates the correlation between miRNA and mRNA expression
12
data from the same subjects with pre-existing prediction algorithms71. Other tools
apply new regression models72,73 or Bayesian inference74 to facilitate the search for
target genes. However, it is still questionable whether these approaches improve the
preciseness of identifying target genes or effectively determine the regulatory role of
miRNA in disease progression.
Therefore, while studying the role of miRNA in human DG, we proposed a new
approach to investigate miRNA-mRNA interaction based on the association between
miRNA or mRNA levels and clinical manifestation of specific diseases.
Objectives and aims
American Indians of the Gila River Indian Community in Arizona are an ethnic
group that exhibits high rates of type 2 diabetes mellitus and DN75. Previous studies
have shown an association between inheritability and DN susceptibility in this
cohort76. This research project, which aims at investigating whether miRNA plays a
role specifically in DG, examined glomerular miRNA expression in those American
Indian patients with early diabetic nephropathy in order to (1) determine the
association between miRNA and human DG, and (2) identify miRNA that may
modify disease progression. Using animal models including Albumin-TGFβ1
13
transgenic mice, mice with streptozotocin (STZ)-induced beta cell dysfunction and
DN, and miRNA KO mice23,38, we further examined the role and the regulatory
mechanisms of miR-21 in TGFβ-related renal glomerulopathy. At last, we proposed
a new approach to effectively identify miRNA targets based on their association
with clinical manifestations of specific diseases.
We address the aims and hypothesis in the following three chapters
Chapter II: MicroRNA-21 ameliorates transforming growth factor-beta-mediated
glomerular injury
In this chapter, we determined the association between miRNAs and diabetic clinical
manifestations, such as the urine albumin-to-creatinine ratio (ACR) and glomerular
filtration rate (GFR). We profiled miRNA expression in renal glomeruli from kidney
biopsies of American Indian diabetic patients by quantitative real-time PCR
(qrt-PCR). We determined that several kidney-related miRNAs exhibited relatively
high expression in renal glomeruli compared to other miRNAs and had a significant
correlation with ACR. Among ACR-associated miRNAs, miR-21 had the highest
expression in renal glomeruli.
In Albumin-TGFβ1 transgenic mice levels of expression of miR-21 and TGFβ1 are
positively associated with severity of kidney damage based on histology scores77.
14
Consistent with the previous studies43,62, our data suggested that the higher level of
TGFβ increases miR-21 in animals with greater renal damage. Apoptosis is a
process in which cells are eliminated by a specific program78. Since TGFβ induces
podocyte apoptosis16 and miR-21 has been proposed as an anti-apoptotic factor in
cancer and ovarian granulosa cells57,58, we further hypothesize that miR-21 acts as a
negative regulator to limit TGFβ-induced podocyte apoptosis.
We obtained ubiquitous miR-21 KO mice, which were generated by Cre-Lox
recombination to remove the sequence of pri-miR21 from the genome79. In order to
test the hypothesis that miR-21 protects against TGFβ-related glomerulopathy, we
introduced progressive glomerulopathy into genetically mir21-deficient mice by
crossing TGFβ1 transgenic (TG) mice with miR-21 KO mice to generate TG/miR-21
WT and TG/miR-21 KO offspring mice.
The renal phenotype of TG/miR-21 WT and TG/miR-21 KO littermates showed that
loss of miR-21 resulted in increased podocyte apoptosis and loss, and progressive
glomerulopathy. We further examined apoptosis in cultured mouse podocytes
expressing miR-21 mimics or anti-miR-21 oligonucleotides (inhibitors). We found
that depletion of miR-21 increased podocyte apoptosis.
TGFβ induces apoptosis through Smad7 and phosphorylation of Smad316. In
addition, P53 and programmed cell death 4 (PDCD4) are tumor suppressor proteins,
15
which induce apoptosis80,81. P53 is indirectly suppressed by miR-2180 and PDCD4 is
targeted by miR-21 in cancer cells81. Other important proteins involved in
glomerulosclerosis are members of the metalloproteinase (MMP) family and the
MMP inhibitor, tissue inhibitor of metalloproteinase (TIMP). TIMP inhibits MMP to
breakdown ECM, and therefore TIMP promotes fibrosis in glomeruli82,83.
In order to investigate miR-21 regulatory mechanisms in TGFβ-related
glomerulopathy, we examined the expression levels of the apoptosis-related genes
and ECM-related genes in TG/miR-21 WT and KO mice and mouse podocytes. We
found that the mRNA levels of TGFβ receptor 2 (Tgfbr2), TGFβ induced (Tgfbi),
Smad7, tissue inhibitor of metalloproteinase 3 (Timp3), collagen4a1 (Col4a1), and
p53 (Tp53) were increased in glomeruli of TG/miR-21 KO mice, the protein levels
of Pdcd4 as well as phosphorylation of Smad3 were increased in miR-21
inhibitors-transfected mouse podocytes. We further determined that Smad7 is a
sequence-dependent target of miR-21.
Chapter III: Loss of miR-21 promotes mesangial cell proliferation and leads to
increased mesangial expansion in diabetic mice
In order to test the protective role of miR-21 in glomerulopathy to a greater extent,
we examined the role of miR-21 in STZ-induced diabetic mice84. We injected STZ
16
into miR-21 WT and KO mice to induce beta-cell dysfunction and thereby
hyperglycemia and diabetic glomerulopathy. Our results indicated that loss of
miR-21 in STZ-induced diabetic mice results in more proteinuria and mesangial
expansion.
We further found that loss of miR-21 promotes baseline proliferation and cell cycle
progression of mouse primary mesangial cells (PMC). Cell cycle represents a series
of events leading from replication of the genetic material to cell division. It
consisted of G0/G1, S, G2, and M phases and is facilitated by cyclin and
cyclin-dependent kinases (CDK) complex, 85. Cyclin-dependent kinase 6 (Cdk6) is a
member of cyclin-dependent protein kinase family, which facilitates cell cycle
progression86. Cell division cycle 25A (Cdc25a) is a member of phosphatase family
that is required for cell cycle progression87. Both of them have been proposed as the
sequence-dependent target of miR-21 in cancer cells81,88. For that reason, we
performed qrt-PCR to demonstrate that the expression of Cdk6 and Cdc25a was
increased in the glomeruli of STZ-treated miR-21 KO mice versus STZ-treated
miR-21 WT mice. Therefore, we suggest that loss of miR-21 facilitates
TGFβ-induced proliferation of mesangial cells by regulating cell cycle-related
genes.
17
Chapter IV: Linking disease-associated miRNA and disease-associated mRNA
identifies miRNA-mRNA interaction
In this chapter, miRNA and mRNA were profiled in the renal glomeruli from kidney
biopsies of the patients with early DN. The levels of expression of both miRNA and
mRNA were correlated with ACR of patients with early DN. Linking
ACR-correlated miRNA and ACR-correlated mRNA by two prediction algorithms
and data from Photoactivatable Ribonucleoside Enhanced Crosslinking and
Immunoprecipitation (PAR-CLIP) RNA sequencing89, we identified potential targets
of miR-200a.
We further verified the potential targets of miR-200a experimentally. In human
embryonic kidney (HEK) cells expressing miR-200a mimics, miR-200a repressed
the expression of RALGPS2, SUPT6H, and EXOC7. We further confirmed that
EXOC7 is a sequence-dependent target of miR200a by a luciferase assay. We
concluded that miRNAs and their downstream regulatory genes are associated with
diseases. Together with the previous findings about miR-21, we propose that some
miRNAs increase with disease progression as an attempt to limit disease-associated
gene upregulation and some miRNAs increase with disease progression to further
repress gene downregulation in disease process. This new concept might provide an
alternative approach to identify miR-mRNA interactions.
18
Figure 1.1. Overview of kidney, nephron and glomerulus structure. (Adapted from “Kidney health library” by UNC kidney center and “Proteinuria in diabetic kidney disease: A mechanistic viewpoint” by J.A. Jefferson et al, 2008, KI, 74, P.25. Copyright 2001 by Nature Publishing Group. Used with permission).
19
Figure 1.2. Contextual determinants of TGFβ action. (Adapted from “TGFβ signaling in context” by Joan Massagué, 2012, Nature Reviews 13, P.616. Copyright 2012 by Macmillan Publishers Limited. Used with permission).
20
Figure 1.3. Cell-specific response to TGFβ and the mechanism leading to glomerulopathy. (Adapted from “TGF-beta signaling in renal disease” by E.P. Bottinger, and M. Bitzer, 2002, J Am Soc Nephrol 13, P.2604. Copyright 2002 by American Society of Nephrology. Used with permission).
21
Figure 1.4. microRNA biogenesis and mRNA silencing mechanism. (Adapted from “Regulation of MicroRNA Biogenesis: A miRiad of mechanisms” by B.N. Davis, and A. Hata, 2009, Cell Comm Signal 7, P.18. Copyright 2009 by BioMed Central. Used with permission).
22
Figure 1.5. miRNA function in signaling mediation and modulation. (Adapted from “MicroRNAs in stress signaling and human disease” by J.T. Mendell, and E.N. Olson, 2012, Cell 148, P.1172. Copyright 2012 by Elsevier. Used with permission).
23
Figure 1.6. Regulation of miRNA transcription and maturation by TGFβ/Smad Signaling. (Adapted from “Smad-mediated regulation of microRNA biosynthesis” by M.T. Blahna, and A. Hata, 2012, FEBS Letters 586, P.1906. Copyright 2012 by Elsevier. Used with permission).
24
Figure 1.7. Regulatory mechanisms of miRNAs in diabetic nephropathy. (Adapted from “MicroRNAs and Their Role in Progressive Kidney Diseases” by M. Kato, L. Arce, and R. Natarajan, 2009, Clin J Am Soc Nephrol 4 P.1255. Copyright 2009 by American Society of Nephrology. Used with permission).
25
References
1. Go, A.S., Chertow, G.M., Fan, D., McCulloch, C.E. & Hsu, C.Y. Chronic kidney disease and the risks of death, cardiovascular events, and hospitalization. N Engl J Med 351, 1296-1305 (2004).
2. Coresh, J., et al. Prevalence of chronic kidney disease in the United States. JAMA 298, 2038-2047 (2007).
3. US Renal Data System. USRDS 2011 Annual Data Report: Atlas of Chronic Kidney Disease and Eng Stage Renal Disease in the United States. (National Institutes of Health, National Institute of Diabetes and Digestive and Kidney Diseases, Bethesda, MD, 2011).
4. Wolf, G., Chen, S. & Ziyadeh, F.N. From the periphery of the glomerular capillary wall toward the center of disease: podocyte injury comes of age in diabetic nephropathy. Diabetes 54, 1626-1634 (2005).
5. Reddy, G.R., Kotlyarevska, K., Ransom, R.F. & Menon, R.K. The podocyte and diabetes mellitus: is the podocyte the key to the origins of diabetic nephropathy? Curr Opin Nephrol Hypertens 17, 32-36 (2008).
6. Goldfarb, S. & Ziyadeh, F.N. TGF-beta: a crucial component of the pathogenesis of diabetic nephropathy. Transactions of the American Clinical and Climatological Association 112, 27-32; discussion 33 (2001).
7. Marshall, S.M. Recent advances in diabetic nephropathy. Postgrad Med J 80, 624-633 (2004).
8. Jefferson, J.A., Shankland, S.J. & Pichler, R.H. Proteinuria in diabetic kidney disease: a mechanistic viewpoint. Kidney Int 74, 22-36 (2008).
9. Fioretto, P. & Mauer, M. Histopathology of diabetic nephropathy. Semin Nephrol 27, 195-207 (2007).
10. Kim, Y.H., et al. Podocyte depletion and glomerulosclerosis have a direct relationship in the PAN-treated rat. Kidney Int 60, 957-968 (2001).
11. Schiffer, M., et al. Apoptosis in podocytes induced by TGF-beta and Smad7. J Clin Invest 108, 807-816 (2001).
12. Massague, J. How cells read TGF-beta signals. Nat Rev Mol Cell Biol 1, 169-178 (2000).
13. Massague, J. TGFbeta signalling in context. Nat Rev Mol Cell Biol 13, 616-630 (2012).
14. Blobe, G.C., Schiemann, W.P. & Lodish, H.F. Role of transforming growth factor beta in human disease. N Engl J Med 342, 1350-1358 (2000).
15. Lan, H.Y. Transforming growth factor-beta/Smad signalling in diabetic nephropathy. Clinical and experimental pharmacology & physiology 39,
26
731-738 (2012). 16. Bottinger, E.P. & Bitzer, M. TGF-beta signaling in renal disease. J Am Soc
Nephrol 13, 2600-2610 (2002). 17. Meng, X.M., et al. Smad2 protects against TGF-beta/Smad3-mediated renal
fibrosis. J Am Soc Nephrol 21, 1477-1487 (2010). 18. Steffes, M.W., Schmidt, D., McCrery, R., Basgen, J.M. & International
Diabetic Nephropathy Study, G. Glomerular cell number in normal subjects and in type 1 diabetic patients. Kidney Int 59, 2104-2113 (2001).
19. Wharram, B.L., et al. Podocyte depletion causes glomerulosclerosis: diphtheria toxin-induced podocyte depletion in rats expressing human diphtheria toxin receptor transgene. J Am Soc Nephrol 16, 2941-2952 (2005).
20. Shankland, S.J. The podocyte's response to injury: role in proteinuria and glomerulosclerosis. Kidney Int 69, 2131-2147 (2006).
21. Qian, Y., Feldman, E., Pennathur, S., Kretzler, M. & Brosius, F.C., 3rd. From fibrosis to sclerosis: mechanisms of glomerulosclerosis in diabetic nephropathy. Diabetes 57, 1439-1445 (2008).
22. Sanderson, N., et al. Hepatic expression of mature transforming growth factor beta 1 in transgenic mice results in multiple tissue lesions. Proc Natl Acad Sci U S A 92, 2572-2576 (1995).
23. Kopp, J.B., et al. Transgenic mice with increased plasma levels of TGF-beta 1 develop progressive renal disease. Lab Invest 74, 991-1003 (1996).
24. Yang, L. TGFbeta, a potent regulator of tumor microenvironment and host immune response, implication for therapy. Curr Mol Med 10, 374-380 (2010).
25. Gordon, K.J. & Blobe, G.C. Role of transforming growth factor-beta superfamily signaling pathways in human disease. Biochim Biophys Acta 1782, 197-228 (2008).
26. Wang, A., et al. Interference with TGF-beta signaling by Smad3-knockout in mice limits diabetic glomerulosclerosis without affecting albuminuria. Am J Physiol Renal Physiol 293, F1657-1665 (2007).
27. Inazaki, K., et al. Smad3 deficiency attenuates renal fibrosis, inflammation,and apoptosis after unilateral ureteral obstruction. Kidney Int 66, 597-604 (2004).
28. Zanninelli, G., et al. Smad3 knock-out mice as a useful model to study intestinal fibrogenesis. World journal of gastroenterology : WJG 12, 1211-1218 (2006).
29. Bartel, D.P. MicroRNAs: genomics, biogenesis, mechanism, and function. Cell 116, 281-297 (2004).
27
30. Lee, R.C., Feinbaum, R.L. & Ambros, V. The C. elegans heterochronic gene lin-4 encodes small RNAs with antisense complementarity to lin-14. Cell 75, 843-854 (1993).
31. Pasquinelli, A.E., et al. Conservation of the sequence and temporal expression of let-7 heterochronic regulatory RNA. Nature 408, 86-89 (2000).
32. Lee, Y., et al. MicroRNA genes are transcribed by RNA polymerase II. EMBO J 23, 4051-4060 (2004).
33. Gregory, R.I., Chendrimada, T.P. & Shiekhattar, R. MicroRNA biogenesis: isolation and characterization of the microprocessor complex. Methods Mol Biol 342, 33-47 (2006).
34. Lund, E. & Dahlberg, J.E. Substrate selectivity of exportin 5 and Dicer in the biogenesis of microRNAs. Cold Spring Harb Symp Quant Biol 71, 59-66 (2006).
35. Bartel, D.P. MicroRNAs: target recognition and regulatory functions. Cell 136, 215-233 (2009).
36. Kusenda, B., Mraz, M., Mayer, J. & Pospisilova, S. MicroRNA biogenesis, functionality and cancer relevance. Biomed Pap Med Fac Univ Palacky Olomouc Czech Repub 150, 205-215 (2006).
37. Brenner, J.L., Jasiewicz, K.L., Fahley, A.F., Kemp, B.J. & Abbott, A.L. Loss of individual microRNAs causes mutant phenotypes in sensitized genetic backgrounds in C. elegans. Current biology : CB 20, 1321-1325 (2010).
38. Park, C.Y., Choi, Y.S. & McManus, M.T. Analysis of microRNA knockouts in mice. Human molecular genetics 19, R169-175 (2010).
39. Mendell, J.T. & Olson, E.N. MicroRNAs in stress signaling and human disease. Cell 148, 1172-1187 (2012).
40. Chang, T.C., et al. Transactivation of miR-34a by p53 broadly influences gene expression and promotes apoptosis. Mol Cell 26, 745-752 (2007).
41. Feng, Z., Zhang, C., Wu, R. & Hu, W. Tumor suppressor p53 meets microRNAs. Journal of molecular cell biology 3, 44-50 (2011).
42. Leung, A.K. & Sharp, P.A. MicroRNA functions in stress responses. Mol Cell 40, 205-215 (2010).
43. Davis, B.N., Hilyard, A.C., Lagna, G. & Hata, A. SMAD proteins control DROSHA-mediated microRNA maturation. Nature 454, 56-61 (2008).
44. Kong, W., et al. MicroRNA-155 is regulated by the transforming growth factor beta/Smad pathway and contributes to epithelial cell plasticity by targeting RhoA. Mol Cell Biol 28, 6773-6784 (2008).
45. Davis, B.N., Hilyard, A.C., Nguyen, P.H., Lagna, G. & Hata, A. Smad proteins bind a conserved RNA sequence to promote microRNA maturation
28
by Drosha. Mol Cell 39, 373-384 (2010). 46. Blahna, M.T. & Hata, A. Smad-mediated regulation of microRNA
biosynthesis. FEBS Lett 586, 1906-1912 (2012). 47. He, L., et al. A microRNA polycistron as a potential human oncogene.
Nature 435, 828-833 (2005). 48. Thum, T., et al. MicroRNAs in the human heart: a clue to fetal gene
reprogramming in heart failure. Circulation 116, 258-267 (2007). 49. Kato, M., et al. MicroRNA-192 in diabetic kidney glomeruli and its function
in TGF-beta-induced collagen expression via inhibition of E-box repressors. Proc Natl Acad Sci U S A 104, 3432-3437 (2007).
50. Krupa, A., et al. Loss of MicroRNA-192 promotes fibrogenesis in diabetic nephropathy. J Am Soc Nephrol 21, 438-447 (2010).
51. Kato, M., Arce, L. & Natarajan, R. MicroRNAs and their role in progressive kidney diseases. Clinical journal of the American Society of Nephrology : CJASN 4, 1255-1266 (2009).
52. Wang, Q., et al. MicroRNA-377 is up-regulated and can lead to increased fibronectin production in diabetic nephropathy. FASEB journal : official publication of the Federation of American Societies for Experimental Biology 22, 4126-4135 (2008).
53. Krutzfeldt, J., et al. Silencing of microRNAs in vivo with 'antagomirs'. Nature 438, 685-689 (2005).
54. Lanford, R.E., et al. Therapeutic silencing of microRNA-122 in primates with chronic hepatitis C virus infection. Science 327, 198-201 (2010).
55. Jopling, C.L., Yi, M., Lancaster, A.M., Lemon, S.M. & Sarnow, P. Modulation of hepatitis C virus RNA abundance by a liver-specific MicroRNA. Science 309, 1577-1581 (2005).
56. Cho, W.C. OncomiRs: the discovery and progress of microRNAs in cancers. Molecular cancer 6, 60 (2007).
57. Chan, J.A., Krichevsky, A.M. & Kosik, K.S. MicroRNA-21 is an antiapoptotic factor in human glioblastoma cells. Cancer Res 65, 6029-6033 (2005).
58. Carletti, M.Z., Fiedler, S.D. & Christenson, L.K. MicroRNA 21 blocks apoptosis in mouse periovulatory granulosa cells. Biol Reprod 83, 286-295 (2010).
59. Medina, P.P., Nolde, M. & Slack, F.J. OncomiR addiction in an in vivo model of microRNA-21-induced pre-B-cell lymphoma. Nature 467, 86-90 (2010).
60. Thum, T., et al. MicroRNA-21 contributes to myocardial disease by
29
stimulating MAP kinase signalling in fibroblasts. Nature 456, 980-984 (2008).
61. Zhong, X., Chung, A.C., Chen, H.Y., Meng, X.M. & Lan, H.Y. Smad3-mediated upregulation of miR-21 promotes renal fibrosis. J Am Soc Nephrol 22, 1668-1681 (2011).
62. Chau, B.N., et al. MicroRNA-21 promotes fibrosis of the kidney by silencing metabolic pathways. Sci Transl Med 4, 121ra118 (2012).
63. Eddy, A.A. The TGF-beta route to renal fibrosis is not linear: the miR-21 viaduct. J Am Soc Nephrol 22, 1573-1575 (2011).
64. Lewis, B.P., Burge, C.B. & Bartel, D.P. Conserved seed pairing, often flanked by adenosines, indicates that thousands of human genes are microRNA targets. Cell 120, 15-20 (2005).
65. Grimson, A., et al. MicroRNA targeting specificity in mammals: determinants beyond seed pairing. Mol Cell 27, 91-105 (2007).
66. Friedman, R.C., Farh, K.K., Burge, C.B. & Bartel, D.P. Most mammalian mRNAs are conserved targets of microRNAs. Genome Res 19, 92-105 (2009).
67. Enright, A.J., et al. MicroRNA targets in Drosophila. Genome Biol 5, R1 (2003).
68. Betel, D., Wilson, M., Gabow, A., Marks, D.S. & Sander, C. The microRNA.org resource: targets and expression. Nucleic Acids Res 36, D149-153 (2008).
69. Yue, D., Liu, H. & Huang, Y. Survey of Computational Algorithms for MicroRNA Target Prediction. Curr Genomics 10, 478-492 (2009).
70. Xiao, F., et al. miRecords: an integrated resource for microRNA-target interactions. Nucleic Acids Res 37, D105-110 (2009).
71. Sales, G., et al. MAGIA, a web-based tool for miRNA and Genes Integrated Analysis. Nucleic Acids Res 38, W352-359 (2010).
72. Li, X., Gill, R., Cooper, N.G., Yoo, J.K. & Datta, S. Modeling microRNA-mRNA interactions using PLS regression in human colon cancer. BMC Med Genomics 4, 44 (2011).
73. Muniategui, A., et al. Quantification of miRNA-mRNA interactions. PLoS One 7, e30766 (2012).
74. Huang, J.C., Morris, Q.D. & Frey, B.J. Bayesian inference of MicroRNA targets from sequence and expression data. J Comput Biol 14, 550-563 (2007).
75. Nelson, R.G., et al. Incidence of end-stage renal disease in type 2 (non-insulin-dependent) diabetes mellitus in Pima Indians. Diabetologia 31,
30
730-736 (1988). 76. Imperatore, G., Knowler, W.C., Nelson, R.G. & Hanson, R.L. Genetics of
diabetic nephropathy in the Pima Indians. Curr Diab Rep 1, 275-281 (2001). 77. Ju, W., et al. Renal gene and protein expression signatures for prediction of
kidney disease progression. Am J Pathol 174, 2073-2085 (2009). 78. Kerr, J.F., Wyllie, A.H. & Currie, A.R. Apoptosis: a basic biological
phenomenon with wide-ranging implications in tissue kinetics. Br J Cancer 26, 239-257 (1972).
79. Orban, P.C., Chui, D. & Marth, J.D. Tissue- and site-specific DNA recombination in transgenic mice. Proc Natl Acad Sci U S A 89, 6861-6865 (1992).
80. Papagiannakopoulos, T., Shapiro, A. & Kosik, K.S. MicroRNA-21 targets a network of key tumor-suppressive pathways in glioblastoma cells. Cancer Res 68, 8164-8172 (2008).
81. Frankel, L.B., et al. Programmed cell death 4 (PDCD4) is an important functional target of the microRNA miR-21 in breast cancer cells. J Biol Chem 283, 1026-1033 (2008).
82. Keeling, J. & Herrera, G.A. Human matrix metalloproteinases: characteristics and pathologic role in altering mesangial homeostasis. Microsc Res Tech 71, 371-379 (2008).
83. Thrailkill, K.M., Clay Bunn, R. & Fowlkes, J.L. Matrix metalloproteinases: their potential role in the pathogenesis of diabetic nephropathy. Endocrine 35, 1-10 (2009).
84. Like, A.A. & Rossini, A.A. Streptozotocin-induced pancreatic insulitis: new model of diabetes mellitus. Science 193, 415-417 (1976).
85. Nigg, E.A. Cyclin-dependent protein kinases: key regulators of the eukaryotic cell cycle. Bioessays 17, 471-480 (1995).
86. Ekholm, S.V. & Reed, S.I. Regulation of G(1) cyclin-dependent kinases in the mammalian cell cycle. Current opinion in cell biology 12, 676-684 (2000).
87. Boutros, R., Lobjois, V. & Ducommun, B. CDC25 phosphatases in cancer cells: key players? Good targets? Nature reviews. Cancer 7, 495-507 (2007).
88. Wang, P., et al. microRNA-21 negatively regulates Cdc25A and cell cycle progression in colon cancer cells. Cancer Res 69, 8157-8165 (2009).
89. Hafner, M., et al. Transcriptome-wide identification of RNA-binding protein and microRNA target sites by PAR-CLIP. Cell 141, 129-141 (2010).
31
Chapter II
MicroRNA-21 Ameliorates TGF-beta Mediated Glomerular Injury
Abstract
Glomerulopathy is a hallmark of diabetic nephropathy (DN), the leading cause of
end-stage renal disease (ESRD) in the US. Glomerulopathy is associated with
imbalance of signaling cascades regulated by transforming growth factor-beta (TGFβ),
contributing to loss of podocytes and albuminuria. MicroRNAs (miRNAs) regulate
cellular functions through modulation of signaling cascades via feed-forward loops.
To identify miRNAs that regulate initiation and development of human DN, we
associated miRNA expression with albuminuria in micro-dissected glomeruli of 26
American Indian patients exhibiting clinically early stages of DN. Twenty out of 377
miRNAs exhibited significant correlation with urine albumin-to-creatinine ratio (ACR)
(R>0.6; P<0.0001); of those, miR-21 was highly abundant and also exhibited
significant correlation with ACR in a second cohort (n=22). miR-21 is regulated by
TGFβ1, which is increased in glomeruli of patients with DN. miR-21-deficient TGFβ1
transgenic mice exhibit increased proteinuria and glomerular extracellular matrix
32
(ECM) deposition, and decreased number of podocytes. MiR-21-deficiency was
accompanied by increased TGFβ/Smad-signaling activity and expression of p53,
Smad7, Pdcd4 and Timp3.
We conclude that miR-21 functions as a feed-forward loop ameliorating glomerular
injury through inhibition of TGFβ-induced podocyte loss and ECM deposition,
consistent with its role in cancer.
33
Introduction
DN is a common and devastating microvascular complication in patients with
diabetes and the leading cause of renal failure in patients requiring dialysis1.
Although understanding of the underlying mechanisms has progressed significantly
and interventions have been implemented, diabetic patients with kidney disease
continue to have a much higher risk of death than diabetic patients with normal renal
function2, suggesting the need for new drug targets.
MiRNAs are ~22 nucleotide RNAs that guide RISC to 3’UTR of target mRNAs and
thereby repress expression of protein-coding genes. miRNAs can regulate large
numbers of target genes and are often integrated in positive and negative feedback
loops and have been implicated as modulators of stress responses in many
physiologic and pathologic processes3.
In animal models, several miRNAs have been identified that mediate initiation and
development of DN by altering the expression of TGFβ signaling components4.
TGFβ is a key factor in the initiation and progression of DN by promoting
extracellular matrix deposition and loss of podocytes5. TGFβ also regulates
expression of miRNAs on a transcriptional and post-transcritpional level6.
Significantly less is known about the role of miRNAs in human DN, but available
data support that the current knowledge about miRNAs in murine models of DN is
34
also relevant in patients with DN7.
Here we report our findings from the analysis of miRNA expression in
micro-dissected glomeruli of kidney biopsies from patients with DN and its
associations with proteinuria, a clinically relevant parameter of kidney damage and
prognostic marker of DN progression. Furthermore, we provide experimental
evidence that miR-21 protects against TGFβ-mediated renal injury by preventing
podocyte apoptosis via inhibition of pro-apoptotic members of the TGFβ signaling
cascade. This finding is contrary to the reported pro-fibrotic role of miR-21 in
models of tubulo-interstitial kidney injury, but it is in line with its well-established
oncogenic and anti-apoptotic capacity in cancer.
35
Results
General characteristics of study cohorts
Study subjects were divided into two cohorts for testing and validation. Both cohorts
included more female subjects. Urine was collected over 24 hours and urine albumin
to creatinine ratio (ACR) was measured. Participants in our cohorts exhibited a
broad range of ACR (μg/mg), while the mean glomerular filtration rate (GFR,
iothalamate clearance) was above 90 ml/min/1.73m2 for both cohorts (Table 2.1).
There was no statistical difference in age, gender distribution, ACR, or GFR at time
of biopsy between the cohorts.
MiRNA expression profiles generated by RNA sequencing and quantitative
reanl time PCR (qrt-PCR) exhibit a high correlation
The amount of total RNA isolated from micro-dissected glomeruli is limited (usually
ranging from 20 to 200ng per sample). The Taqman-based miRNA array (Applied
Biosystems) is suitable for these small amounts of total RNA when using
pre-amplification. We did not detect significant differences in miRNA expression
with or without pre-amplification using human kidney biopsy tissues. As different
miRNA profiling methods have been shown to exhibit variable correlations8,9, we
compared the Taqman-qrt-PCR-based array method with RNA sequencing using the
36
same RNA pool from whole kidneys of a 3 month- old C57BI/6J mouse. We found
that miRNA sequence reads from RNA sequencing correlated with miRNA cycle
time generated from qrt-PCR-based miR array (R=0.7, Figure 2.1). For example,
miR-21 showed very high expression using both RNA sequencing and qrt-PCR array.
In view of the low RNA content in renal glomeruli and good correlation of miRNA
profiling between RNA sequencing and qrt-PCR array, we proceeded to apply
qrt-PCR-based miRNA array with amplification to profile miRNA in the renal
glomeruli of our cohorts as described10.
Correlation of miRNA expression with ACR
To identify miRNA relevant for glomerular injury, we associated miRNA expression
levels with clinical-relevant phenotypes, such as ACR or GFR in our American
Indian cohorts. Highly significant correlations with ACR were detected for 20
miRNAs. Among those, miR-21 has the lowest CT value (highest relative abundance
in the glomeruli) and a statistically very high correlation with ACR in cohort 1
(testing cohort) (R=0.8, Table 2.2A). Because validation in the same sample was not
feasible due to a limited amount of RNA, we further validated these findings in
cohort 2 (validating cohort). miR-21 maintained the high expression in renal
glomeruli as well as the significant correlation with ACR (R=0.51, Table 2.2B).
37
However, there was no significant correlation between miRNA and GFR (P-value >
0.05 for all miRNA). Patients with normo- versus micro-albuminuria did not have
differences in miR-21 levels, whereas patients with macro-albuminuria exhibited
significantly increased miR-21 in glomeruli (Figure 2.2).
Increased TGFβ gene expression in human DN
Glomerular mRNA expression profiles of living donors and the American Indian
subjects with DN have been recently reported11. In this data set, TGFβ1 mRNA
expression (TGFB1) was higher in glomeruli of subjects with DN compared with
living donor (fold change=1.22, FDR<0.0001), consistent with previous findings in
other cohorts12.
miR-21 and TGFβ levels correlate with kidney damage severity in TGFβ1
transgenic mice
As miR-21 has been shown to be regulated by TGFβ1, transgenic overexpression of
TGFβ1 causes proteinuria and progressive glomerulosclerosis13,14, and miR-21
levels are highly correlated with proteinuria in humans, we examined miR-21
expression in TGFβ1 transgenic mice. We found that miR-21 expression in kidneys
of TGFβ1 transgenic mice increased progressively with the severity of kidney
38
damage based on histological scores as described15 (Figure 2.3A). Furthermore,
TGFβ1 mRNA levels also positively correlated with the severity of kidney damage
(Figure 2.3B). Therefore, we chose TGFβ1 transgenic mice to further examine the
function of miR-21 in glomerular injury.
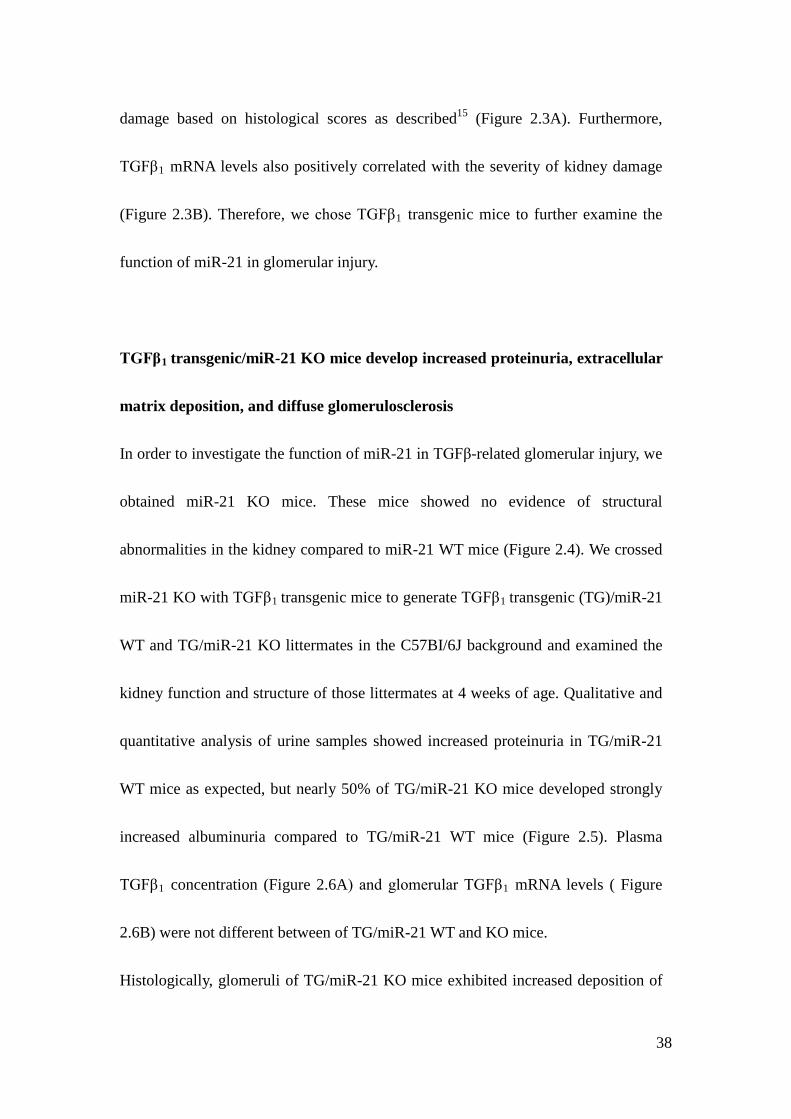
TGFβ1 transgenic/miR-21 KO mice develop increased proteinuria, extracellular
matrix deposition, and diffuse glomerulosclerosis
In order to investigate the function of miR-21 in TGFβ-related glomerular injury, we
obtained miR-21 KO mice. These mice showed no evidence of structural
abnormalities in the kidney compared to miR-21 WT mice (Figure 2.4). We crossed
miR-21 KO with TGFβ1 transgenic mice to generate TGFβ1 transgenic (TG)/miR-21
WT and TG/miR-21 KO littermates in the C57BI/6J background and examined the
kidney function and structure of those littermates at 4 weeks of age. Qualitative and
quantitative analysis of urine samples showed increased proteinuria in TG/miR-21
WT mice as expected, but nearly 50% of TG/miR-21 KO mice developed strongly
increased albuminuria compared to TG/miR-21 WT mice (Figure 2.5). Plasma
TGFβ1 concentration (Figure 2.6A) and glomerular TGFβ1 mRNA levels ( Figure
2.6B) were not different between of TG/miR-21 WT and KO mice.
Histologically, glomeruli of TG/miR-21 KO mice exhibited increased deposition of
39
Periodic Acid-Schiff (PAS)-positive material (Figure 2.7A) as well as picrosirius red
staining intensity (Figure 2.7A&B). Consistent with these results, in glomeruli,
collagen III protein (Figure 2.7A), and collagen III, IV and VI mRNA expression
were increased (Figure 2.7C). The pattern of ECM deposition in glomeruli of
TG/miR-21 KO was nodular (Figure 2.7A). No differences were detected in the
tubulointerstitium between TG/miR-21 WT and TG/miR-21 KO mice. The findings
are consistent with accelerated glomerulosclerosis induced by TGFβ in the absence
of miR-21.
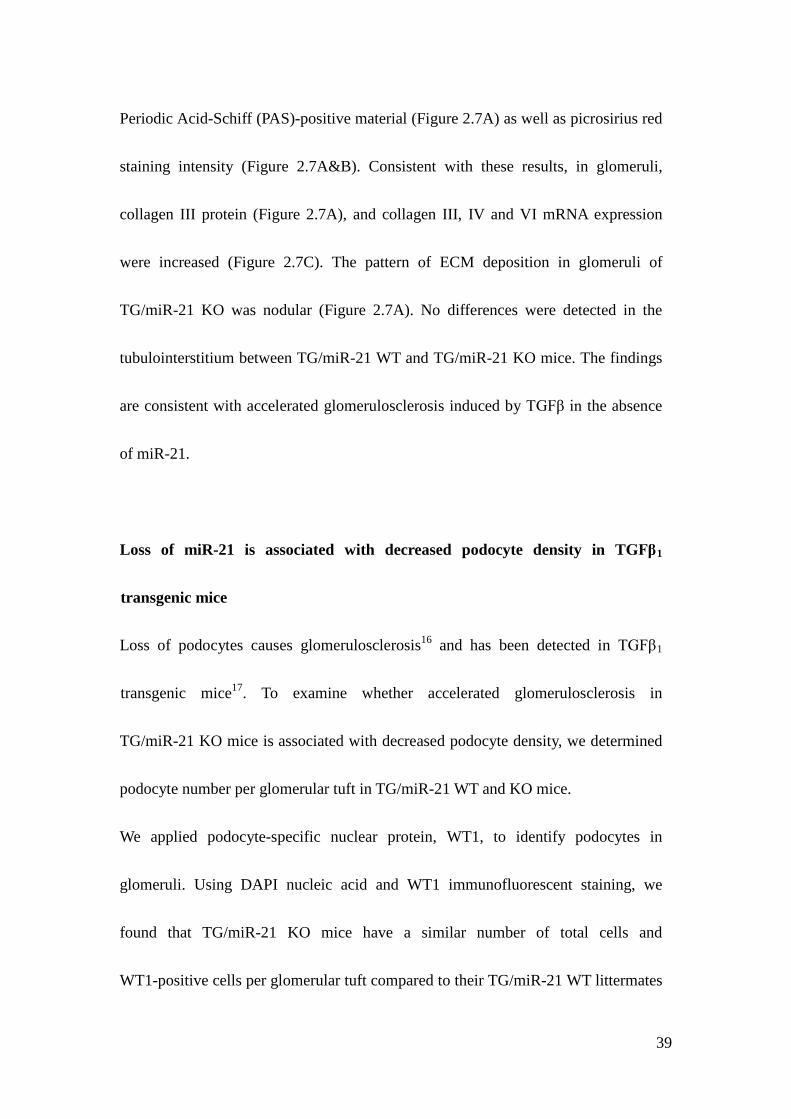
Loss of miR-21 is associated with decreased podocyte density in TGFβ1
transgenic mice
Loss of podocytes causes glomerulosclerosis16 and has been detected in TGFβ1
transgenic mice17. To examine whether accelerated glomerulosclerosis in
TG/miR-21 KO mice is associated with decreased podocyte density, we determined
podocyte number per glomerular tuft in TG/miR-21 WT and KO mice.
We applied podocyte-specific nuclear protein, WT1, to identify podocytes in
glomeruli. Using DAPI nucleic acid and WT1 immunofluorescent staining, we
found that TG/miR-21 KO mice have a similar number of total cells and
WT1-positive cells per glomerular tuft compared to their TG/miR-21 WT littermates
40
at 2 weeks of age (Figure 2.8A). At 4 weeks of age, we detected a decreased number
of total cells and WT1-positive nuclei per glomerular tuft in TG/miR-21-KO mice
compared to the WT littermates (Figure 2.8B). The data suggested that the decreased
number of total cells and WT1-positive cells in TG/miR-21 KO mice is due to loss
of podocytes from 2 weeks old to 4 weeks old.
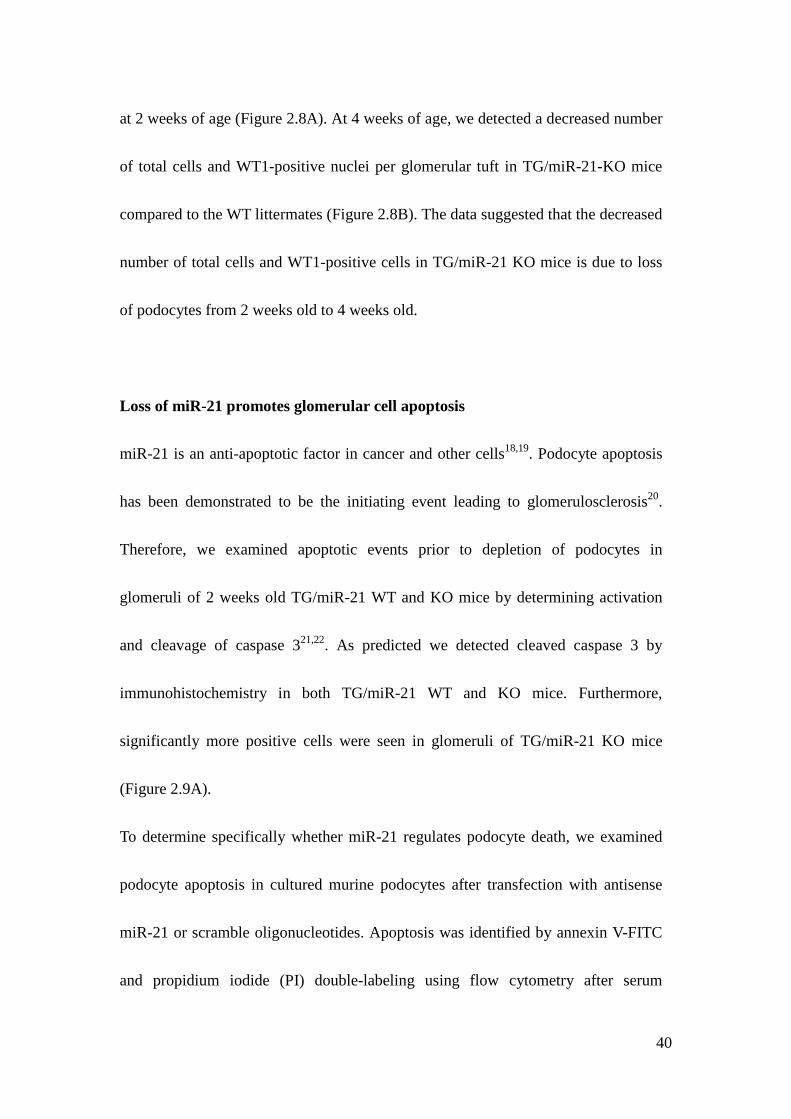
Loss of miR-21 promotes glomerular cell apoptosis
miR-21 is an anti-apoptotic factor in cancer and other cells18,19. Podocyte apoptosis
has been demonstrated to be the initiating event leading to glomerulosclerosis20.
Therefore, we examined apoptotic events prior to depletion of podocytes in
glomeruli of 2 weeks old TG/miR-21 WT and KO mice by determining activation
and cleavage of caspase 321,22. As predicted we detected cleaved caspase 3 by
immunohistochemistry in both TG/miR-21 WT and KO mice. Furthermore,
significantly more positive cells were seen in glomeruli of TG/miR-21 KO mice
(Figure 2.9A).
To determine specifically whether miR-21 regulates podocyte death, we examined
podocyte apoptosis in cultured murine podocytes after transfection with antisense
miR-21 or scramble oligonucleotides. Apoptosis was identified by annexin V-FITC
and propidium iodide (PI) double-labeling using flow cytometry after serum
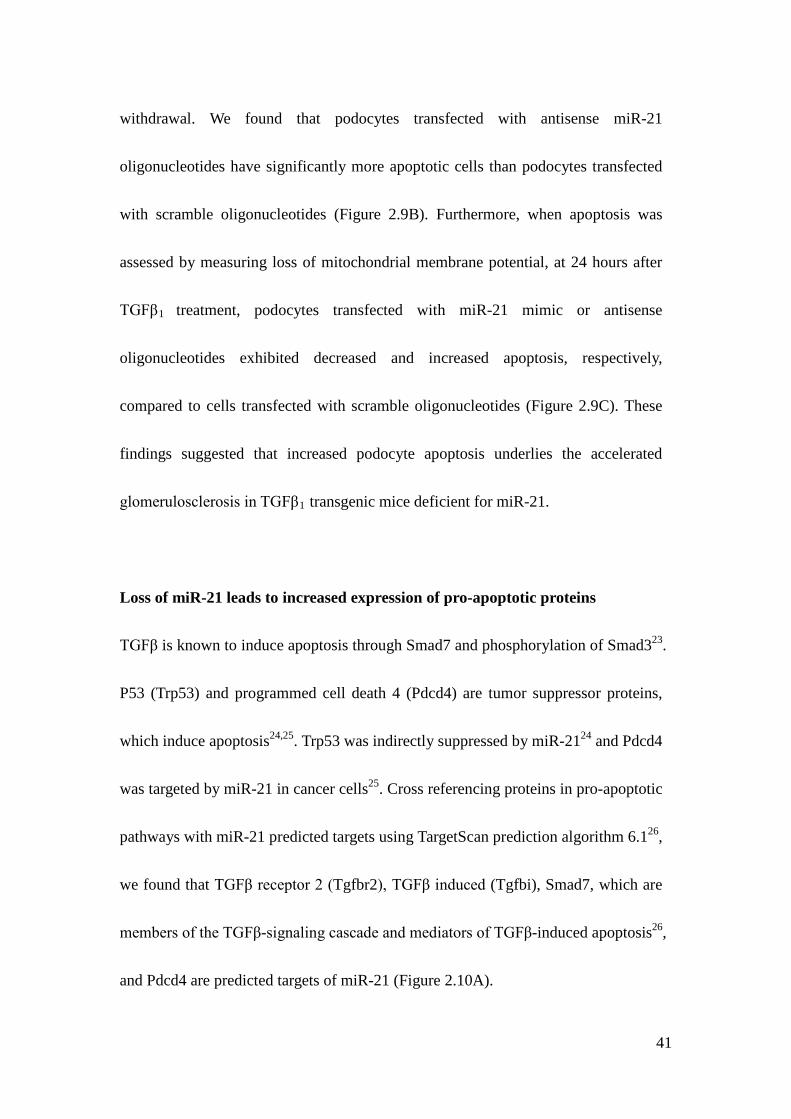
41
withdrawal. We found that podocytes transfected with antisense miR-21
oligonucleotides have significantly more apoptotic cells than podocytes transfected
with scramble oligonucleotides (Figure 2.9B). Furthermore, when apoptosis was
assessed by measuring loss of mitochondrial membrane potential, at 24 hours after
TGFβ1 treatment, podocytes transfected with miR-21 mimic or antisense
oligonucleotides exhibited decreased and increased apoptosis, respectively,
compared to cells transfected with scramble oligonucleotides (Figure 2.9C). These
findings suggested that increased podocyte apoptosis underlies the accelerated
glomerulosclerosis in TGFβ1 transgenic mice deficient for miR-21.
Loss of miR-21 leads to increased expression of pro-apoptotic proteins
TGFβ is known to induce apoptosis through Smad7 and phosphorylation of Smad323.
P53 (Trp53) and programmed cell death 4 (Pdcd4) are tumor suppressor proteins,
which induce apoptosis24,25. Trp53 was indirectly suppressed by miR-2124 and Pdcd4
was targeted by miR-21 in cancer cells25. Cross referencing proteins in pro-apoptotic
pathways with miR-21 predicted targets using TargetScan prediction algorithm 6.126,
we found that TGFβ receptor 2 (Tgfbr2), TGFβ induced (Tgfbi), Smad7, which are
members of the TGFβ-signaling cascade and mediators of TGFβ-induced apoptosis26,
and Pdcd4 are predicted targets of miR-21 (Figure 2.10A).
42
To determine whether miR-21 regulates TGFβ-signaling activity in podocytes, we
first examined Smad signaling activity in murine podocytes exposed to TGFβ and
transfected with antisense miR-21 oligonucleotides. Smad3 phosphorylation was
increased 4 and 24 hours after exposure to TGFβ1 and the phosphorylation of Smad3
was even higher when miR-21 was suppressed (Figure 2.10B). Levels of Pdcd4 was
downregulated by TGFβ1 (Figure 2.10C). However, levels of Pdcd4 were increased
in cells when miR-21 was suppressed. In vivo, Tgfbr2, Tgfbi, Smad7, and Trp53
mRNAs expression were increased in glomeruli of TG/miR-21 KO mice compared
to TG/miR-21 WT mice (Figure 2.10D). miR-21 has been reported to target the
3’UTRs of Pdcd425 and Tgfbr227.
In podocytes, Smad7 is shown to be induced by TGFβ and induces apoptosis28.
While inhibition of miR-21 had no effect on Smad7 levels in unchallenged
podocytes, inhibition of miR-21 led to increased mRNA levels of Smad7 after 24
hours exposure to TGFβ1 (Figure 2.10E). In a luciferase assay, we co-transfected
Smad7 3’UTR luciferase construct and miR-21 mimic or antisense miR-21
oligonucleotides into 293T human embryonic kidney cells. We found the luciferase
activity of Smad7 3’UTR decreased by miR-21 overexpression and increased by
miR-21 inhibition in cells (Figure 2.10F). We confirmed that Smad7 is a direct target
of miR-21 as previously reported29. These results suggest that the anti-apoptotic
43
capacity of miR-21 is at least in part mediated by inhibition of multiple
pro-apoptotic signals, including Smad7, Trp53, Pdcd4, and TGFβ/Smad3 signaling
via Tgfbr2.
miR-21 regulates glomerular ECM deposition
Increased ECM deposition is another hallmark of TGFβ-related glomerulopathy and
contributes to development and progression of glomerulosclerosis. ECM deposition
is enhanced by increased collagen production or decreased breakdown of
extracellular collagen by metalloproteinases (MMPs). Tissue inhibitors of
metalloproteinase (TIMP) diminish the degradative capacity of extracellular MMPs.
We found collagen4a1 (Col4a1) as well as Timp3 mRNA was increased in glomeruli
of TG/miR-21 KO mice versus TG/miR-21 WT mice (Figure 2.7C & 2.10D). Both
mRNAs are predicted targets of miR-21 (Figure 2.10A). To demonstrate the
specificity of the increased mRNA levels of the listed miR-21 predicted targets in
our mice, we showed that Ras homolog gene family member B (RhoB), another
predicted target genes of miR-21, which have also been implicated in TGFβ
signaling30, remained unchanged in TG/miR-21 KO mice versus TG/miR-21 WT
mice (Figure 2.10D). Furthermore, we also found that Timp3 mRNA levels were
increased in cultured mouse podocytes transfected with antisense miR-21

44
oligonucleotides (Figure 2.10E), and Timp3 mRNA has been experimentally
confirmed as a miR-21 target in glioma cells31.
45
Discussion
In this study, we determined the expression of glomerular miR-21 and miR-221
exhibiting significant correlation with ACR in a total of 48 patients with early to
intermediate histopathologic alterations of DN secondary to type 2 diabetes
mellitus11. Few studies have explored miRNA expression in patients with DN. Krupa
et al. have identified miRNAs that differentially expressed in kidney tissues of 22
patients with progressive and non-progressive DN as well as with different disease
stages7. Because of the different designs from our study including pooled
formalin-fixed material from whole kidney biopsies, which constitutes mainly
tubulo-interstitium, significant lower eGFR, and using miR-16 as the reference
miRNA for normalization, the results from Krupa et al. and ours are not comparable.
Another study has shown that urinary miR-21 levels were higher in adolescent Hong
Kong Chinese with albuminuria than that without albuminuria32. We also detected
increased miR-21 levels in adolescent patients with FSGS compared to controls or
minimal change disease (personal communication Robert P. Woroniecki and Markus
Bitzer, unpublished results; ASN 2008, abstract [TH-P0349]). miR-21 is important
also because it has been identified as a widely expressed and consistently elevated
miRNA in human cancer and it is a candidate target for intervention because
inhibition of miR-21 limits tumor growth33. In animal models of kidney injury,
46
miR-21 expression is consistently increased. However, its function remains
controversial as it has been shown to promote or protect from tubulo-interstitial34,35
as well as glomerular36,37 damage in different model systems.
miR-21 is of special interest because in murine models of tubulo-interstitial kidney35
and lung disease38, miR-21 promotes fibrosis through multiple mechanisms
including regulation of TGFβ signaling. But the function of miR-21 is complex. In
the heart, miR-21 has been reported to contribute to myocardial disease39,
ameliorates development of heart failure after cardiac ischemia40, but is not essential
for cardiac remodeling41. We have recently shown that inhibition of miR-21 in a
murine model of myelodysplastic syndrome leads to stimulation of hematopoiesis
and improvement of phenotype29. Furthermore, miR-21 exhibits oncogenic activity
through inhibition of apoptosis in most solid cancers and is explored as a therapeutic
target33. Podocytopenia is an important cause of glomerulosclerosis16 and is a robust
predictor of disease progression in DN5. Podocyte apoptosis has been detected in
various animal models of glomerular injury including DN42 and TGFβ1 transgenic
mice17, and can be induced by TGFβ in cultured podocytes17. Our finding that loss
of miR-21 results in increased podocyte loss is consistent with anti-apoptotic
function of miR-21 in cancer, thereby promoting cancer progression24. Albuminuria
is strongly associated with podocyte damage and miR-21 is strongly correlated with
47
ACR. Therefore, promoting podocyte survival is an important and possibly the most
prominent function of miR-21 in glomerular injury.
We determined that miR-21 represses multiple signals that have been shown to
promote apoptosis in podocytes, including TGFβ/Smad3 signaling17, Smad728 and
Trp5343. Furthermore, Pdcd4 has been shown to be a pro-apoptotic molecule
involved in TGFβ1-induced apoptosis in human hepatocellular carcinoma cells.
Increased Smad3 phosphorylation is likely mediated by de-repression of Tgfbr2, a
previously reported target of miR-2127. While miR-21 binds the 3’UTR thereby
repressing expression of Smad738 and Pdcd424, miR-21 inhibits Trp53 expression
indirectly via targeting Trp53-binding proteins24. Tgfbi induces apoptosis in cancer
cells44 and it is a predicted target of miR-21, however, it has not been studied in
podocytes. The increased detection of pro-apoptotic signals in TGmiR-21 KO mice
is not mediated through TGFβ1 per se, because plasma and intra-renal TGFβ1 levels
were not different between genotypes (Figure 2.6). Thus, miR-21 mediates its
function through a large set of target genes.
The diverse function of miR-21 depends on organ systems and injuries and it is also
likely to be secondary to the differential expression of target genes. TGFβ activates
multiple signaling cascades, exhibits cell-type and context-specific functions, and is
integrated in a complex regulatory network with feed-forward and feedback loops23.
48
Furthermore, maintaining a tight homeostasis of TGFβ-signaling is essential for
proper function of cells and organ system, underscored by the fact that abundant
TGFβ1 leads to organ fibrosis45 whereas TGFβ1-deficiency leads to excessive
inflammatory responses46. Similar to miR-21, miR-192 and miR-200a have been
implicated in feedback regulation of TGF-beta signaling in DN4.
The high abundance of miR-21 in human glomeruli and mouse kidneys (Figure 2.1
& Table 2.2) suggests its high biological activity, because miRNAs are in
stoichiometric competition with other miRNAs on RISC-loading and they target
equivalent amounts of mRNA47. Therefore, it is somewhat surprising that
miR-21-deficient mice do not exhibit developmental or anatomic abnormalities and
are fertile48 (Figure 2.4). This is consistent with the concept that few target genes are
repressed by miR-21 under normal cellular conditions but the repression is enhanced
under cellular stress49.
In addition to its anti-apoptotic effect, miR-21 regulates ECM deposition. Collagen
4a1 is a direct target of miR-2150 and was increased in glomeruli of TG.miR-21 KO
mice. TIMPs inhibit the capacity of MMPs to degrade extracellular collagens and
thus promote ECM accumulation. We had shown inverse correlation of Timp3 and
miR-21 expression in human tissues51 and others confirmed repression of Timp3
expression by miR-21 via direct targeting of the Timp3 3’UTR31. In our study, we
49
showed increased ECM deposition and Timp3 expression in glomeruli of
TG/miR-21 KO mice. These findings suggest that inhibition of ECM deposition by
miR-21 contributes to protection against glomerulopathy.
In summary, our findings support a feed-forward loop in the TGFβ/Smad signaling
cascade, in which miR-21 represses multiple TGFβ target genes thereby preventing
TGFβ-induced podocyte apoptosis and ECM deposition in glomeruli (Figure 2.11).
Our findings further support a context-dependent function and interaction between
TGFβ-signaling and miR-21.
50
Methods and Materials
Study subjects. Kidney biopsy samples were collected from 111 Southwestern
American Indians enrolled in a randomized, placebo-controlled, clinical trial to test
the renoprotective efficacy of losartan in early type 2 diabetic kidney disease
(ClinicalTrials.gov No. NCT00340678) as described52. In brief, subjects were
treated with either losartan or placebo for a median of 5.9 years and a percutaneous
kidney biopsy was obtained at the end of the treatment period. Kidney biopsy
specimens were placed into RNAlater® and stored in -20ºC until glomeruli were
micro-dissected from biopsy cores as described53. Tissue specimens from 48
subjects were included in this study.
Urinary albumin and creatinine as well as iothalamate concentrations for GFR
determination were measured as described52 and values of the examination closest to
the kidney biopsy were used in the present analyses. This study was approved by the
Review Board of the National Institute of Diabetes and Digestive and Kidney
Diseases. Each participant gave informed consent.
miRNA expression analysis. miRNA profiling was obtained using TaqMan miRNA
assays (Applied Biosystems) as described54. In brief, small RNA fraction (<200 nt)
was isolated from micro-dissected glomeruli using RNeasy® and MinElute®
51
Cleanup kits (Qiagen) and reverse transcribed using TaqMan Megaplex RT primers
(Applied Biosystems). Human glomerular small RNA was amplified by Megaplex
PreAmp primers (Applied Biosystems). TaqMan array human and rodent miRNA ‘A’
cards (Applied Biosystems) were used to obtain miRNA profiles according to the
manufacturer’s protocol. miRNA expression values, threshold cycle (CT), were
normalized by U6 small nuclear RNA (snRNA), and RNU44 and RNU48 small
nucleolar RNA (snoRNA). Delta cycle time (ΔCT) was calculated by subtracting
miRNAs’ CT from geometric mean of snRNA’s and snoRNA’s CT. Expression level
in arbitrary units were calculated from 2 to the power of delta cycle time (2ΔΔCT).
The same protocol was used to determine miRNA expression in kidneys of C57Bl/6j
mice for comparison with RNA-sequencing method as described below.
RNA sequencing. Total RNA was isolated from kidneys of 3 months old, male
C57Bl/6j wildtype mice (Jackson lab) using TRIzol® (Invitrogen) as described55
and 1 µg of total RNA was used for isolation of the small RNA fraction ranging
from 18 to 40nt size by denaturing polyacrylamide gel electrophoresis. Library
preparation and sequencing was performed in the Genomics Core Facility of Albert
Einstein College of Medicine using Illumina’s Genome Analyzer III. The protocol
was described as (http://wasp.einstein.yu.edu/index.php/Protocol:RNA_seq).
52
Sequence reads (approximately 8x10⁶ per sample) were aligned to the Genome
Reference Consortium Mouse and miRNAs were annotated using a published
automated bioinformatics pipeline56.
Qrt-PCR. For expression analysis of specific transcripts, mRNA and
miRNA-specific stem-loop primers and TaqMan probe sets (Applied Biosystem)
were used according to manufacturer’s protocols, on an ABI 7900HT real-time PCR
system as described54.
Mouse models. miR-21 knockout mice (miR-21-KO) were generated from
disruption of the miR-21 sequence as described48, and crossed with albumin-TGFβ1
transgenic mice (TGFb-TG)45. Experiments were conducted in male littermates in
C57Bl/6j background. These procedures were in accordance with the policies of the
University of Michigan Institutional Animal Care and Use Committee.
Tissue staining. Periodic acid Schiff and picrosirius red staining was performed on
formalin-fixed paraffin-embedded mouse kidney sections as described28. For
picrosirius red staining, percent glomerular area exceeding a minimum HSI (hue,
saturation, intensity) threshold were determined from images of at least 50 glomeruli
53
per sample at 20x magnification using MetaMorph® image analysis software. WT1
staining was performed as described28.
Glomerular podocyte density. Podocyte density was determined for at least 30
glomeruli of each sample using nuclear (DAPI-staining) and podocyte
(WT1-staining) counts normalized to glomerular volume calculated using
glomerular tuft area measurements and the Weibel equation as described57.
Urine protein and creatinine measurement. Spot urine samples were collected
non-invasively from mice. Urine creatinine concentrations were determined by
QuantiChromTM Creatinine Assay Kit (BioAssay Systems). Urine protein was
qualitatively assessed by Coomassie blue staining of SDS-PAGE gel loaded with
equal amounts of urine and quantitatively by Bio-Rad protein assay (Bio-Rad).
Isolation of mouse glomeruli. Isolation of glomeruli from TG/miR-21 WT and KO
mice using beads and sieving method was performed as described achieving >90%
purity58 .
Cell culture. Conditionally immortalized murine podocytes were cultured as
54
described28.
miRNA transfection. miR-21 oligonucleotide mimic (Ambion) or inhibitor (Exiqon)
were applied with Lipofectamine® RNAiMAX Reagent (Invitrogen) to transfect
podocytes at least 10 days after thermoshift. Using fluorescence-labeled scrambled
oligo’s we detected about 40 to 50% of cells with positive fluorescence signals.
Immunoblot assay. Total and phosphorylated proteins were detected by Western
blotting using the following primary antibodies: phospho-smad3 (Rockland,
600-401-919), total smad2/3 (cell signaling, #3102) and GAPDH (Sigma, G8795).
IRDye® secondary antibodies and Odyssey infrared imaging system (LI-COR
Biosciences) were used for quantification.
Apoptosis assays. In vivo apoptosis was detected by immunohistochemistry with
cleaved-caspase-3 antibody (Cell Signaling, Asp175) on FFPE tissue sections and
manual counting of positive cells. For quantification of apoptosis of cultured cells,
annexin-V/propidium iodide positive cells (determined by flow cytometry,
Invitrogen assay kit) and cells negative for mitochondrial membrane potential
(DePsipher assay, R&D system; fluorescent plate reader) were assayed as
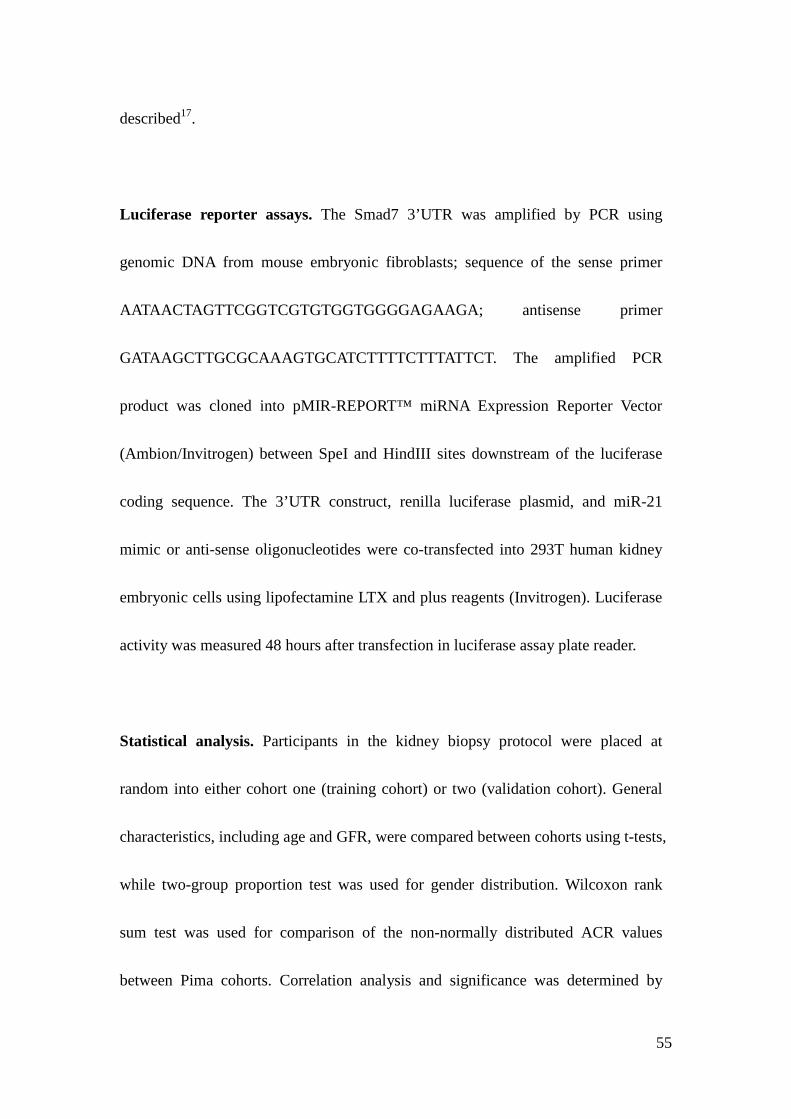
55
described17.
Luciferase reporter assays. The Smad7 3’UTR was amplified by PCR using
genomic DNA from mouse embryonic fibroblasts; sequence of the sense primer
AATAACTAGTTCGGTCGTGTGGTGGGGAGAAGA; antisense primer
GATAAGCTTGCGCAAAGTGCATCTTTTCTTTATTCT. The amplified PCR
product was cloned into pMIR-REPORT™ miRNA Expression Reporter Vector
(Ambion/Invitrogen) between SpeI and HindIII sites downstream of the luciferase
coding sequence. The 3’UTR construct, renilla luciferase plasmid, and miR-21
mimic or anti-sense oligonucleotides were co-transfected into 293T human kidney
embryonic cells using lipofectamine LTX and plus reagents (Invitrogen). Luciferase
activity was measured 48 hours after transfection in luciferase assay plate reader.
Statistical analysis. Participants in the kidney biopsy protocol were placed at
random into either cohort one (training cohort) or two (validation cohort). General
characteristics, including age and GFR, were compared between cohorts using t-tests,
while two-group proportion test was used for gender distribution. Wilcoxon rank
sum test was used for comparison of the non-normally distributed ACR values
between Pima cohorts. Correlation analysis and significance was determined by

56
Pearson correlation using an R script. T-tests were used to compare sirius red
intensity, cell numbers, mRNA and protein levels between miR-21-WT and -KO
mice.
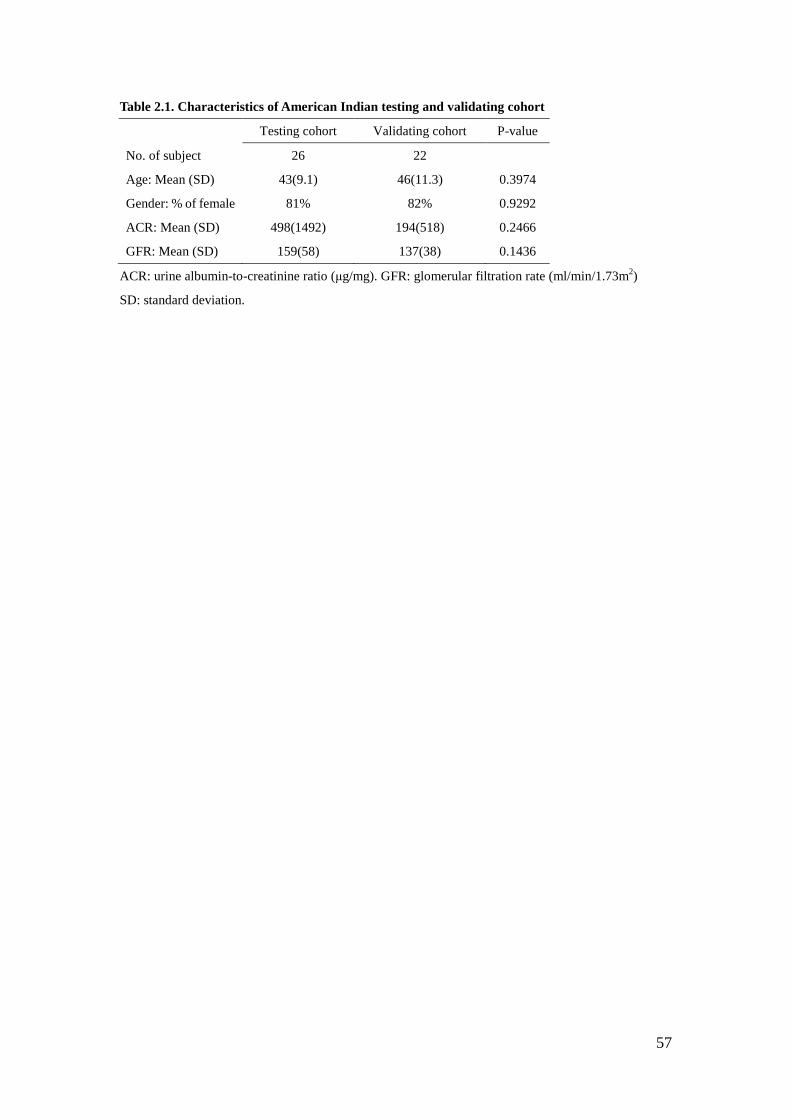
57
Table 2.1. Characteristics of American Indian testing and validating cohort
Testing cohort Validating cohort P-value
No. of subject 26 22
Age: Mean (SD) 43(9.1) 46(11.3) 0.3974
Gender: % of female 81% 82% 0.9292
ACR: Mean (SD) 498(1492) 194(518) 0.2466
GFR: Mean (SD) 159(58) 137(38) 0.1436
ACR: urine albumin-to-creatinine ratio (μg/mg). GFR: glomerular filtration rate (ml/min/1.73m2)
SD: standard deviation.
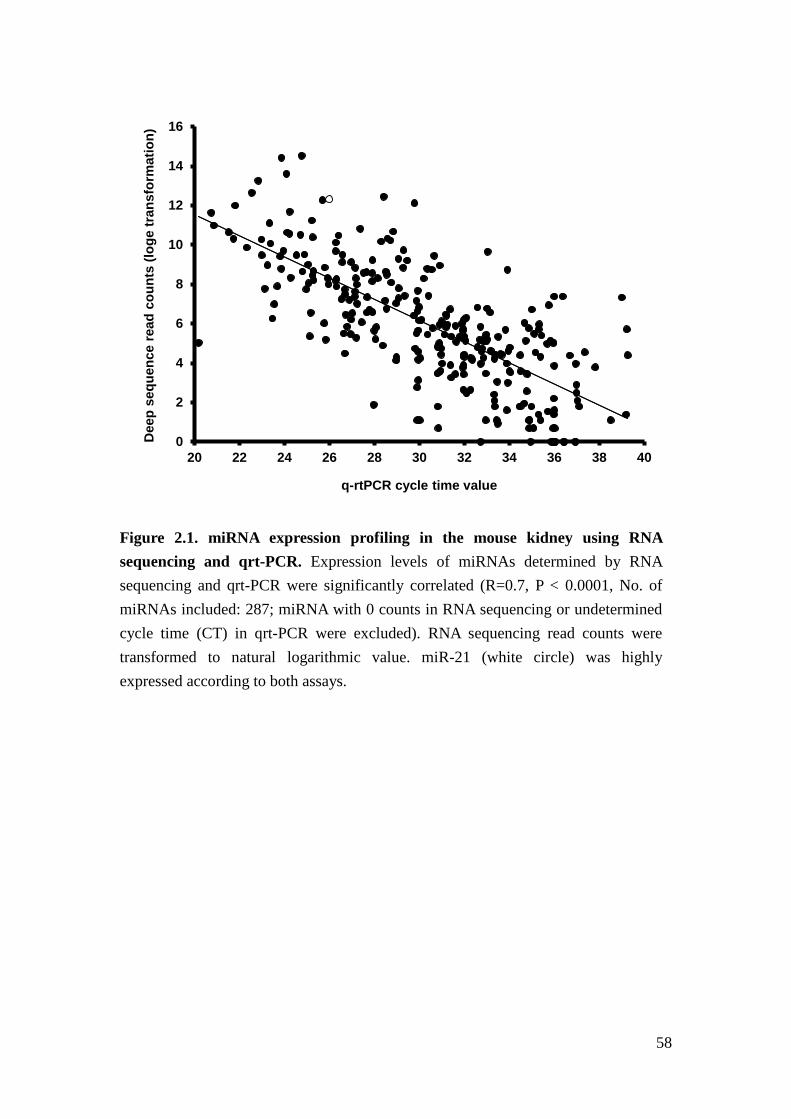
58
Figure 2.1. miRNA expression profiling in the mouse kidney using RNA sequencing and qrt-PCR. Expression levels of miRNAs determined by RNA sequencing and qrt-PCR were significantly correlated (R=0.7, P < 0.0001, No. of miRNAs included: 287; miRNA with 0 counts in RNA sequencing or undetermined cycle time (CT) in qrt-PCR were excluded). RNA sequencing read counts were transformed to natural logarithmic value. miR-21 (white circle) was highly expressed according to both assays.
0
2
4
6
8
10
12
14
16
20 22 24 26 28 30 32 34 36 38 40
Dee
p se
quen
ce re
ad c
ount
s (lo
ge tr
ansf
orm
atio
n)
q-rtPCR cycle time value
59
Table 2.2A. Correlation between miRNA and ACR in testing cohort
miRNA P value Correlation with ACR Expression level
hsa-miR-21 <0.00001 0.80 high
hsa-miR-150 <0.00001 0.74 high
hsa-miR-192 <0.00001 0.70 high
hsa-miR-221 <0.00001 0.67 high
hsa-miR-532-3p <0.00001 0.64 high
hsa-miR-135a <0.00001 0.81 medium
hsa-miR-429 <0.00001 0.79 medium
hsa-miR-660 <0.00001 0.77 medium
hsa-miR-142-3p <0.00001 0.77 medium
hsa-miR-200a <0.00001 0.76 medium
hsa-miR-218 <0.00001 0.74 medium
hsa-miR-455-5p <0.00001 0.71 medium
hsa-miR-450a <0.00001 0.66 medium
hsa-miR-181a <0.00001 0.65 medium
hsa-miR-642 <0.00001 0.89 low
hsa-miR-32 <0.00001 0.85 low
hsa-miR-511 <0.00001 0.77 low
hsa-miR-187 <0.00001 0.74 low
hsa-miR-452 <0.00001 0.69 low
hsa-miR-501-5p <0.00001 0.65 low

60
Table 2.2B. Correlation between miRNA and ACR in validating cohort
miRNA P value Correlation with ACR Expression level
hsa-miR-132 <0.00001 0.64 high
hsa-miR-454 <0.00001 0.59 high
hsa-miR-337-5p <0.00001 0.58 high
hsa-miR-21 0.01 0.51 high
hsa-miR-191 0.03 0.47 high
hsa-miR-221 0.03 0.46 high
hsa-miR-186 0.03 0.46 high
hsa-miR-140-5p 0.03 0.46 high
hsa-miR-125a-5p 0.03 0.46 high
hsa-miR-212 <0.00001 0.96 medium
hsa-miR-224 <0.00001 0.94 medium
hsa-miR-133b <0.00001 0.58 medium
hsa-miR-18a 0.02 0.51 medium
hsa-miR-140-3p 0.03 0.46 medium
hsa-miR-148b 0.03 0.46 medium
hsa-miR-133a 0.04 0.43 medium
hsa-miR-299-5p <0.00001 0.83 low
hsa-miR-34c 0.02 0.48 low
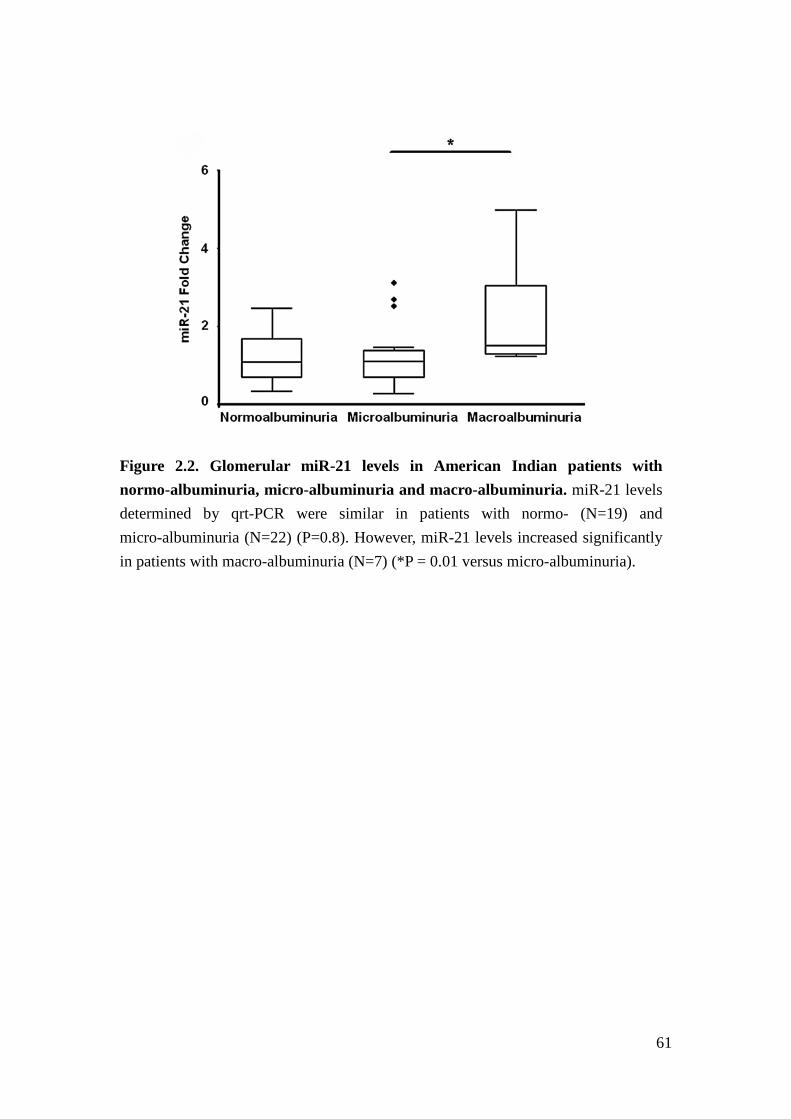
61
Figure 2.2. Glomerular miR-21 levels in American Indian patients with normo-albuminuria, micro-albuminuria and macro-albuminuria. miR-21 levels determined by qrt-PCR were similar in patients with normo- (N=19) and micro-albuminuria (N=22) (P=0.8). However, miR-21 levels increased significantly in patients with macro-albuminuria (N=7) (*P = 0.01 versus micro-albuminuria).
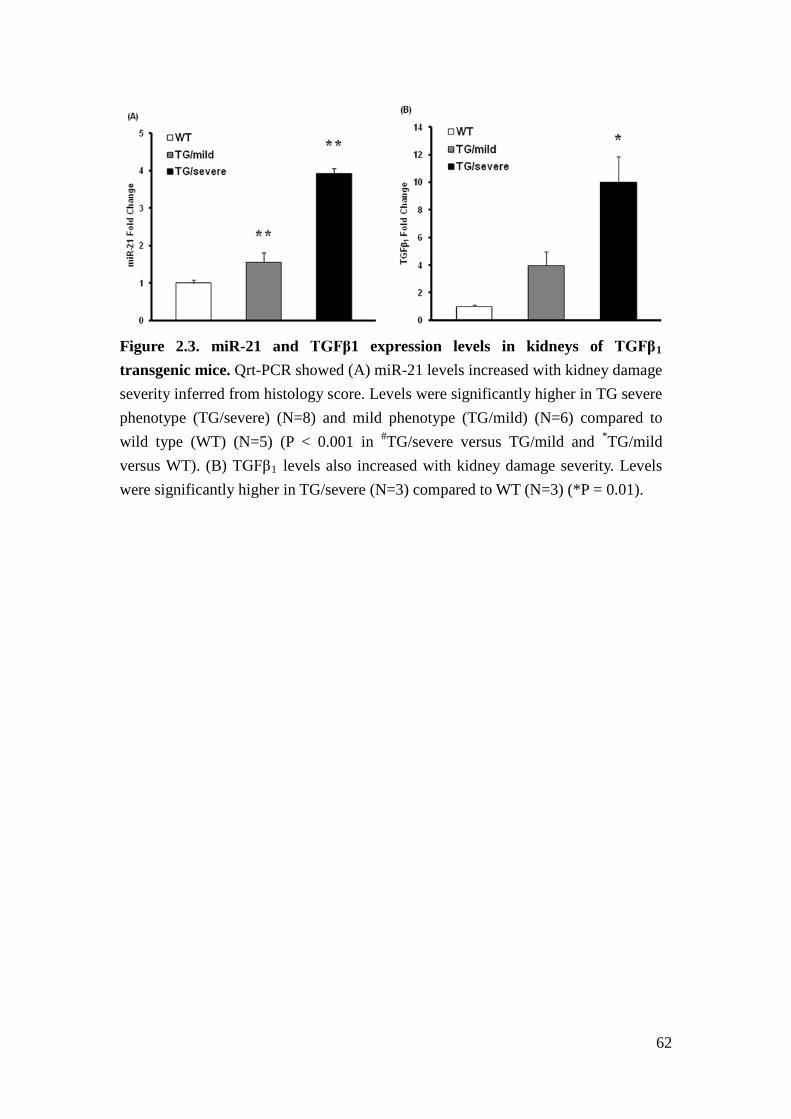
62
Figure 2.3. miR-21 and TGFβ1 expression levels in kidneys of TGFβ1 transgenic mice. Qrt-PCR showed (A) miR-21 levels increased with kidney damage severity inferred from histology score. Levels were significantly higher in TG severe phenotype (TG/severe) (N=8) and mild phenotype (TG/mild) (N=6) compared to wild type (WT) (N=5) (P < 0.001 in #TG/severe versus TG/mild and *TG/mild versus WT). (B) TGFβ1 levels also increased with kidney damage severity. Levels were significantly higher in TG/severe (N=3) compared to WT (N=3) (*P = 0.01).
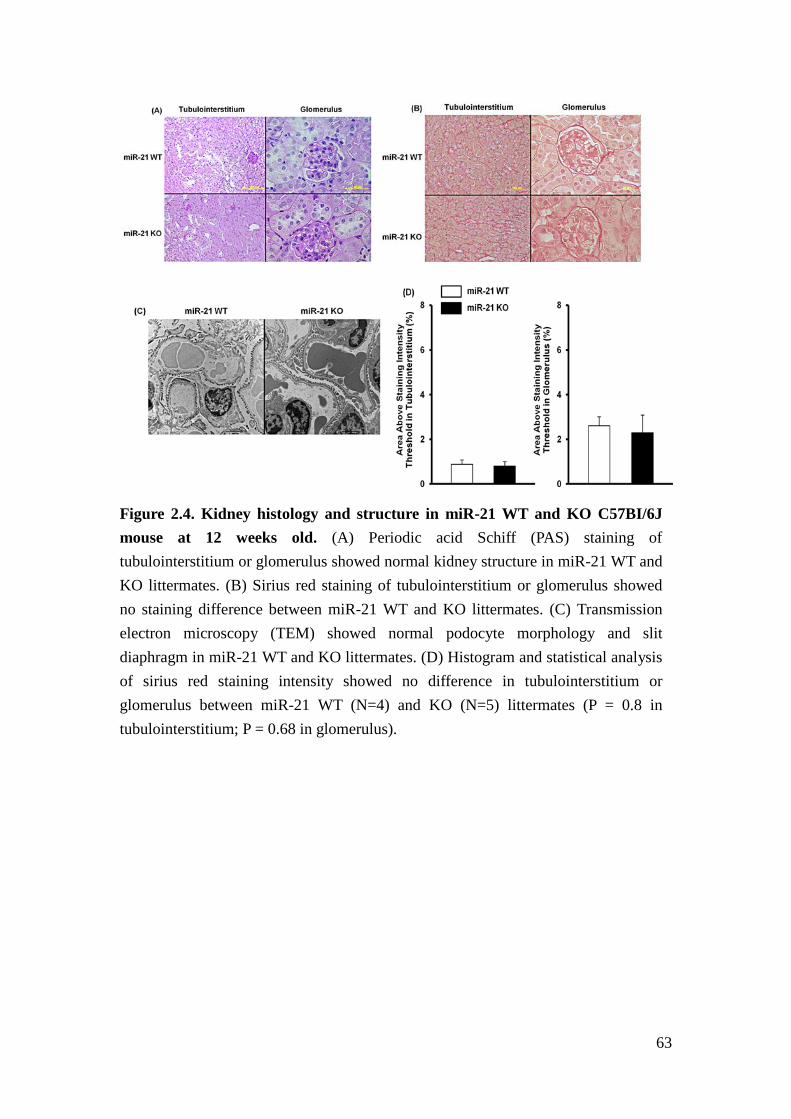
63
Figure 2.4. Kidney histology and structure in miR-21 WT and KO C57BI/6J mouse at 12 weeks old. (A) Periodic acid Schiff (PAS) staining of tubulointerstitium or glomerulus showed normal kidney structure in miR-21 WT and KO littermates. (B) Sirius red staining of tubulointerstitium or glomerulus showed no staining difference between miR-21 WT and KO littermates. (C) Transmission electron microscopy (TEM) showed normal podocyte morphology and slit diaphragm in miR-21 WT and KO littermates. (D) Histogram and statistical analysis of sirius red staining intensity showed no difference in tubulointerstitium or glomerulus between miR-21 WT (N=4) and KO (N=5) littermates (P = 0.8 in tubulointerstitium; P = 0.68 in glomerulus).
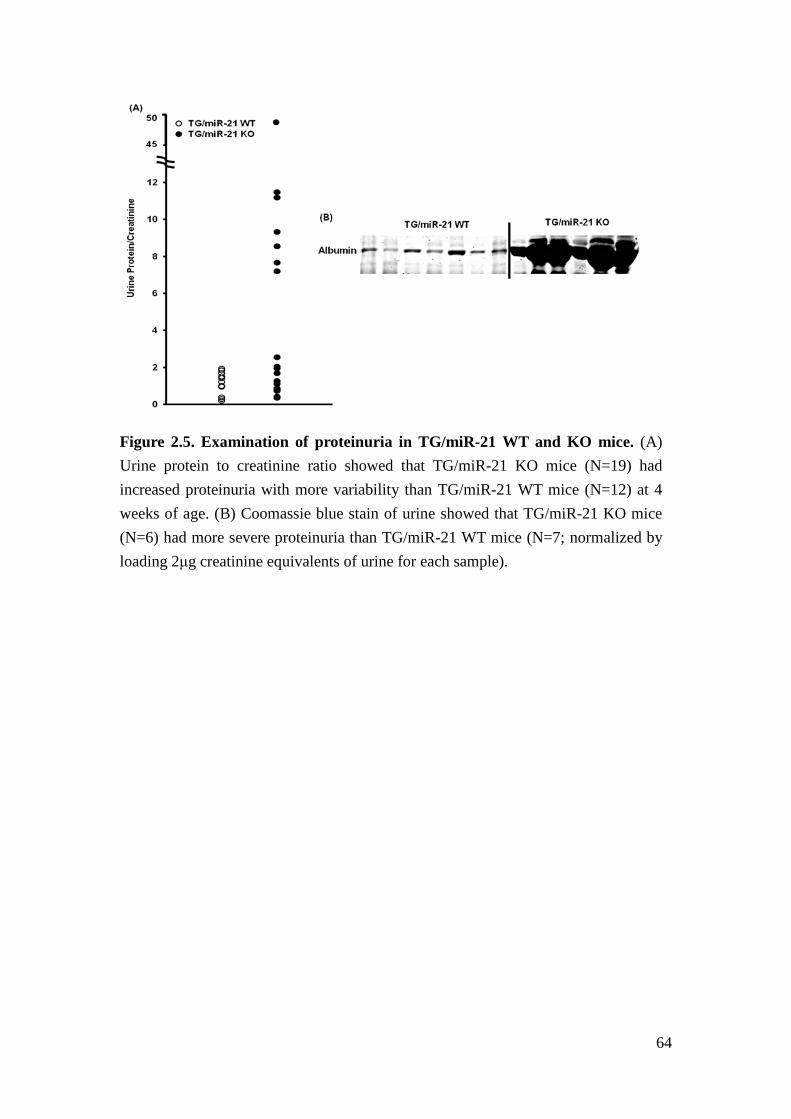
64
Figure 2.5. Examination of proteinuria in TG/miR-21 WT and KO mice. (A) Urine protein to creatinine ratio showed that TG/miR-21 KO mice (N=19) had increased proteinuria with more variability than TG/miR-21 WT mice (N=12) at 4 weeks of age. (B) Coomassie blue stain of urine showed that TG/miR-21 KO mice (N=6) had more severe proteinuria than TG/miR-21 WT mice (N=7; normalized by loading 2μg creatinine equivalents of urine for each sample).
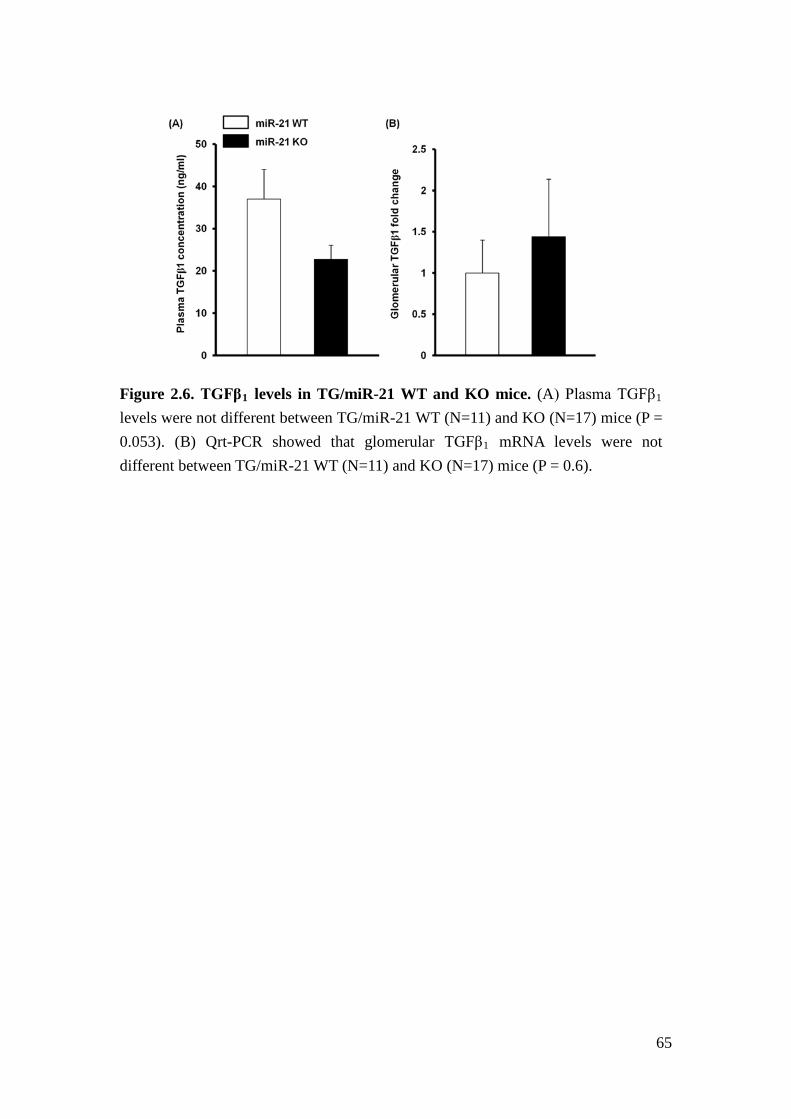
65
Figure 2.6. TGFβ1 levels in TG/miR-21 WT and KO mice. (A) Plasma TGFβ1 levels were not different between TG/miR-21 WT (N=11) and KO (N=17) mice (P = 0.053). (B) Qrt-PCR showed that glomerular TGFβ1 mRNA levels were not different between TG/miR-21 WT (N=11) and KO (N=17) mice (P = 0.6).
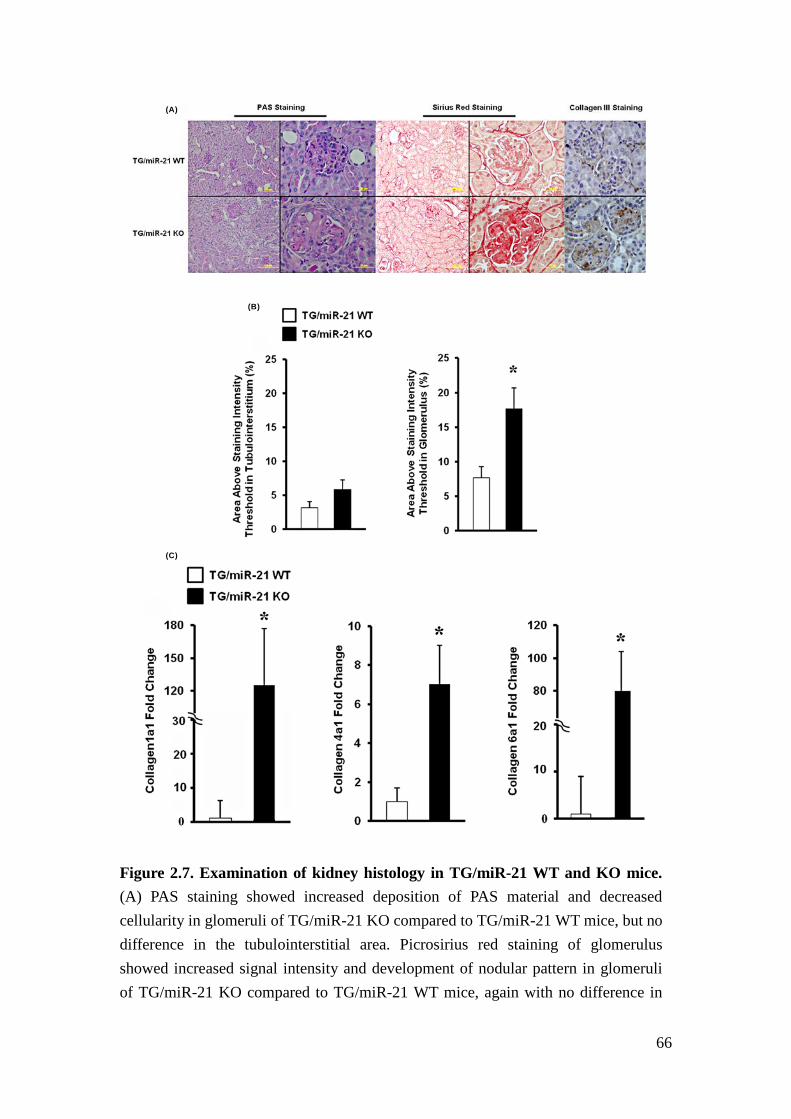
66
Figure 2.7. Examination of kidney histology in TG/miR-21 WT and KO mice. (A) PAS staining showed increased deposition of PAS material and decreased cellularity in glomeruli of TG/miR-21 KO compared to TG/miR-21 WT mice, but no difference in the tubulointerstitial area. Picrosirius red staining of glomerulus showed increased signal intensity and development of nodular pattern in glomeruli of TG/miR-21 KO compared to TG/miR-21 WT mice, again with no difference in
(A)
(B)
(C)

67
the tubulointerstitial area. Consistent with increased ECM deposition detected by picrosirius red staining, immunohistochemistry staining showed increased collagen III deposition in the glomerulus of TG/miR-21 KO. (B) Histogram and statistical analysis of picrosirius red staining intensity showed significantly higher staining intensity in glomeruli of TG/miR-21 KO (N=7) versus WT mice (N=9) (*P < 0.01). In the tubulointerstitium, staining intensity between TG/miR-21 WT and KO mice was not significantly difference (P = 0.08). (C) Qrt-PCR showed higher expression of collagen1a1, collagen4a1, collagen6a1 mRNA levels in glomeruli of TG/miR-21 KO mice (N=3) compared to WT mice (N=4) (*P < 0.05).
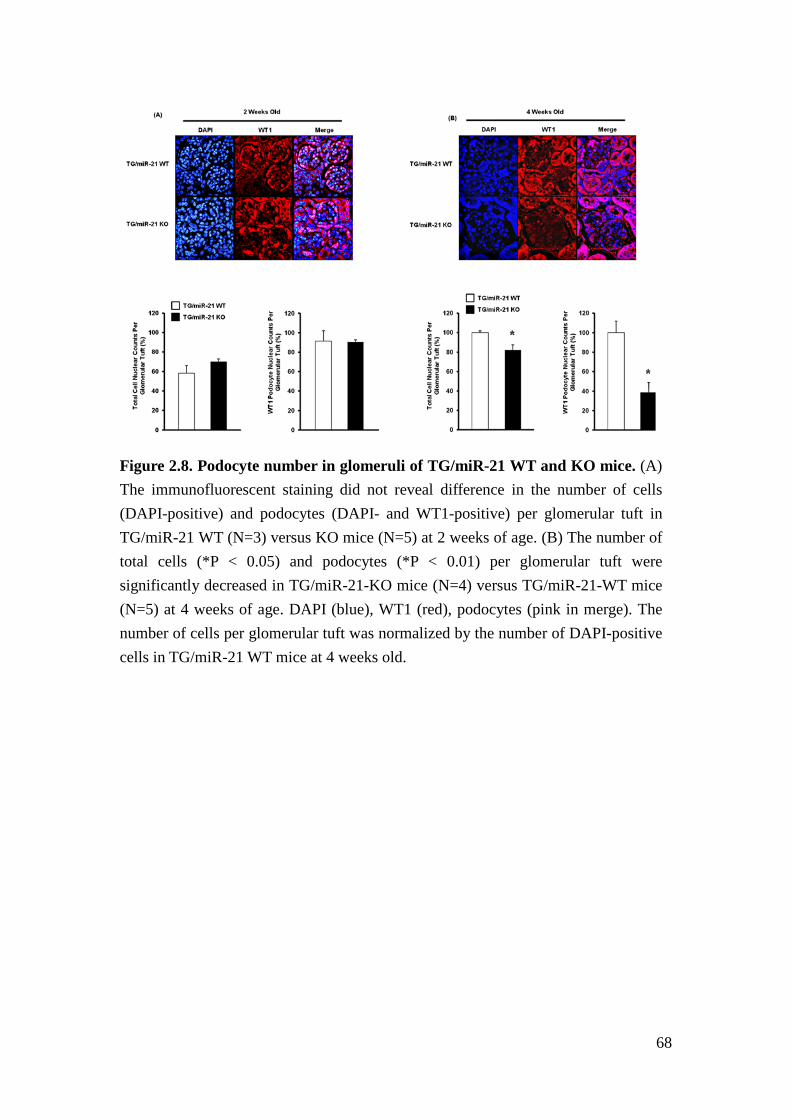
68
Figure 2.8. Podocyte number in glomeruli of TG/miR-21 WT and KO mice. (A) The immunofluorescent staining did not reveal difference in the number of cells (DAPI-positive) and podocytes (DAPI- and WT1-positive) per glomerular tuft in TG/miR-21 WT (N=3) versus KO mice (N=5) at 2 weeks of age. (B) The number of total cells (*P < 0.05) and podocytes (*P < 0.01) per glomerular tuft were significantly decreased in TG/miR-21-KO mice (N=4) versus TG/miR-21-WT mice (N=5) at 4 weeks of age. DAPI (blue), WT1 (red), podocytes (pink in merge). The number of cells per glomerular tuft was normalized by the number of DAPI-positive cells in TG/miR-21 WT mice at 4 weeks old.
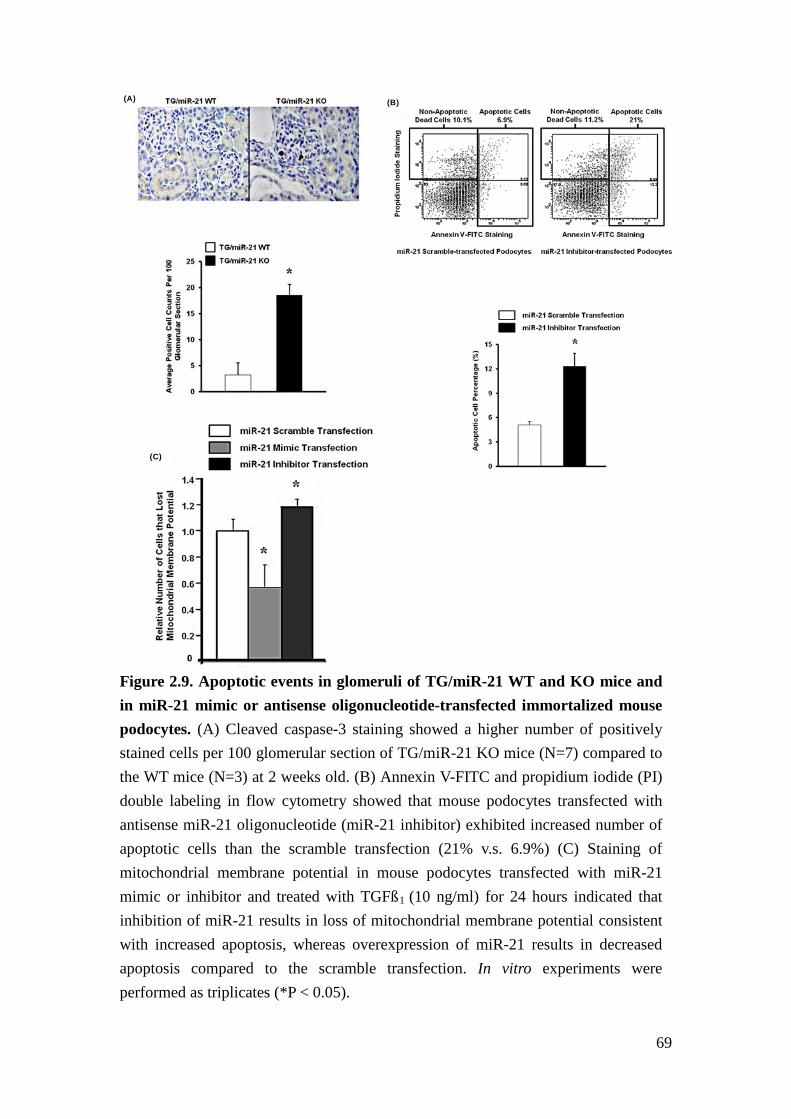
69
Figure 2.9. Apoptotic events in glomeruli of TG/miR-21 WT and KO mice and in miR-21 mimic or antisense oligonucleotide-transfected immortalized mouse podocytes. (A) Cleaved caspase-3 staining showed a higher number of positively stained cells per 100 glomerular section of TG/miR-21 KO mice (N=7) compared to the WT mice (N=3) at 2 weeks old. (B) Annexin V-FITC and propidium iodide (PI) double labeling in flow cytometry showed that mouse podocytes transfected with antisense miR-21 oligonucleotide (miR-21 inhibitor) exhibited increased number of apoptotic cells than the scramble transfection (21% v.s. 6.9%) (C) Staining of mitochondrial membrane potential in mouse podocytes transfected with miR-21 mimic or inhibitor and treated with TGFß1 (10 ng/ml) for 24 hours indicated that inhibition of miR-21 results in loss of mitochondrial membrane potential consistent with increased apoptosis, whereas overexpression of miR-21 results in decreased apoptosis compared to the scramble transfection. In vitro experiments were performed as triplicates (*P < 0.05).
(A) (B)
(C)
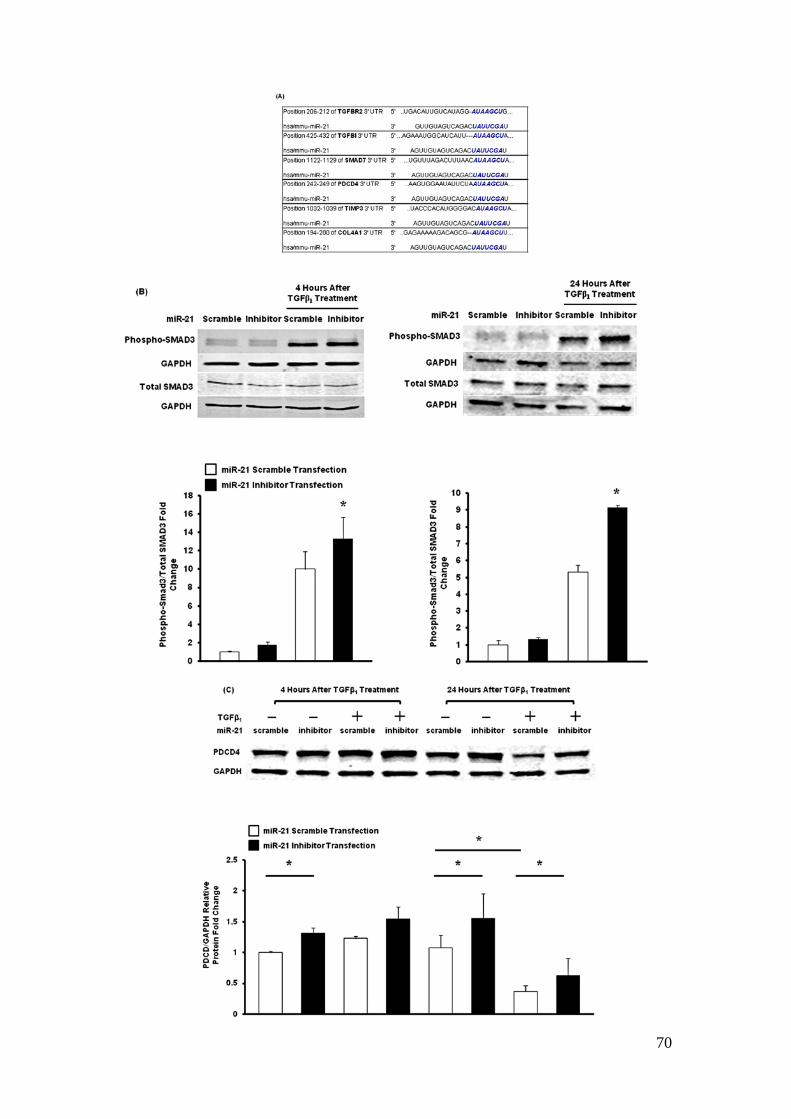
70
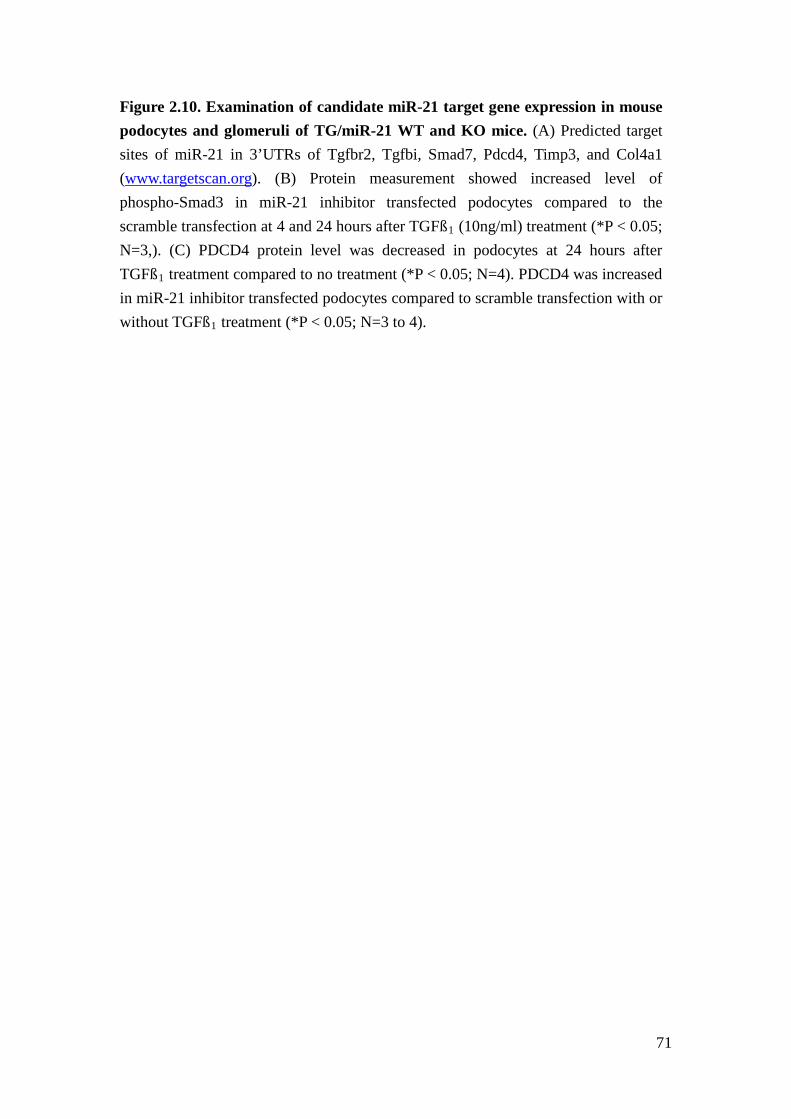
71
Figure 2.10. Examination of candidate miR-21 target gene expression in mouse podocytes and glomeruli of TG/miR-21 WT and KO mice. (A) Predicted target sites of miR-21 in 3’UTRs of Tgfbr2, Tgfbi, Smad7, Pdcd4, Timp3, and Col4a1 (www.targetscan.org). (B) Protein measurement showed increased level of phospho-Smad3 in miR-21 inhibitor transfected podocytes compared to the scramble transfection at 4 and 24 hours after TGFß1 (10ng/ml) treatment (*P < 0.05; N=3,). (C) PDCD4 protein level was decreased in podocytes at 24 hours after TGFß1 treatment compared to no treatment (*P < 0.05; N=4). PDCD4 was increased in miR-21 inhibitor transfected podocytes compared to scramble transfection with or without TGFß1 treatment (*P < 0.05; N=3 to 4).
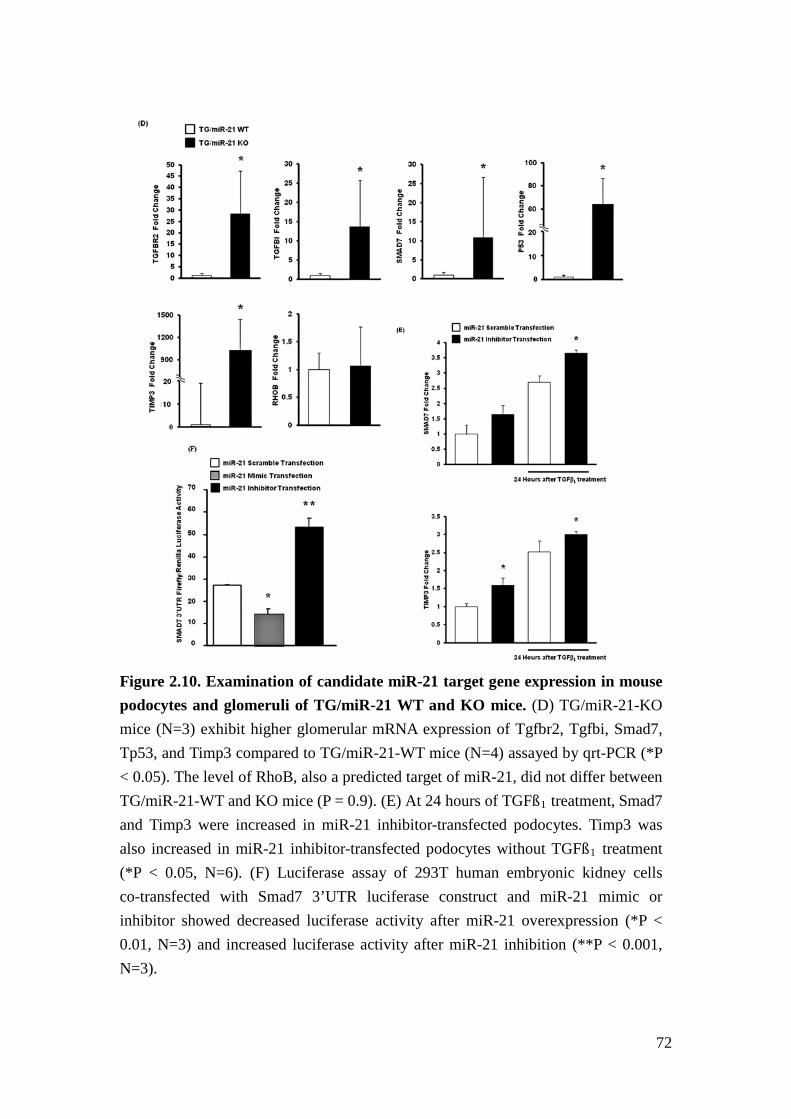
72
Figure 2.10. Examination of candidate miR-21 target gene expression in mouse podocytes and glomeruli of TG/miR-21 WT and KO mice. (D) TG/miR-21-KO mice (N=3) exhibit higher glomerular mRNA expression of Tgfbr2, Tgfbi, Smad7, Tp53, and Timp3 compared to TG/miR-21-WT mice (N=4) assayed by qrt-PCR (*P < 0.05). The level of RhoB, also a predicted target of miR-21, did not differ between TG/miR-21-WT and KO mice (P = 0.9). (E) At 24 hours of TGFß1 treatment, Smad7 and Timp3 were increased in miR-21 inhibitor-transfected podocytes. Timp3 was also increased in miR-21 inhibitor-transfected podocytes without TGFß1 treatment (*P < 0.05, N=6). (F) Luciferase assay of 293T human embryonic kidney cells co-transfected with Smad7 3’UTR luciferase construct and miR-21 mimic or inhibitor showed decreased luciferase activity after miR-21 overexpression (*P < 0.01, N=3) and increased luciferase activity after miR-21 inhibition (**P < 0.001, N=3).
73
Figure 2.11. Proposed function of miR-21 as a feed-forward loop in TGFβ signaling in glomerular injury. The role of Pdcd4 (dashed line) in TGFβ-induced renal cell survival and death has not been explored yet. Trp53 is indirectly regulated by miR-21 (dot line).
74
Reference
1. US Renal Data System. USRDS 2012 Annual Data Report. in Atlas of Chronic Kidney Disease and End-Stage Renal Disease in the United States, Vol. 1 (National Institutes of Health, National Institute of Diabetes and Digestive and Kidney Diseases, Bethesda, MD, 2012).
2. Afkarian, M., et al. Kidney disease and increased mortality risk in type 2 diabetes. J Am Soc Nephrol 24, 302-308 (2013).
3. Mendell, J.T. & Olson, E.N. MicroRNAs in stress signaling and human disease. Cell 148, 1172-1187 (2012).
4. Kato, M. & Natarajan, R. MicroRNA circuits in transforming growth factor-beta actions and diabetic nephropathy. Semin Nephrol 32, 253-260 (2012).
5. Pagtalunan, M.E., et al. Podocyte loss and progressive glomerular injury in type II diabetes. J Clin Invest 99, 342-348 (1997).
6. Davis, B.N., Hilyard, A.C., Lagna, G. & Hata, A. SMAD proteins control DROSHA-mediated microRNA maturation. Nature 454, 56-61 (2008).
7. Krupa, A., et al. Loss of MicroRNA-192 promotes fibrogenesis in diabetic nephropathy. J Am Soc Nephrol 21, 438-447 (2010).
8. Git, A., et al. Systematic comparison of microarray profiling, real-time PCR, and next-generation sequencing technologies for measuring differential microRNA expression. RNA 16, 991-1006 (2010).
9. Willenbrock, H., et al. Quantitative miRNA expression analysis: comparing microarrays with next-generation sequencing. RNA 15, 2028-2034 (2009).
10. Bitzer, M., Ju, W., Jing, X. & Zavadil, J. Quantitative analysis of miRNA expression in epithelial cells and tissues. Methods Mol. Biol. 820, 55-70 (2012).
11. Hodgin, J.B., et al. Identification of Cross-Species Shared Transcriptional Networks of Diabetic Nephropathy in Human and Mouse Glomeruli. Diabetes (2012).
12. Border, W.A. & Noble, N.A. TGF-beta in kidney fibrosis: a target for gene therapy. Kidney Int 51, 1388-1396 (1997).
13. Kopp, J.B., et al. Transgenic mice with increased plasma levels of TGF-beta 1 develop progressive renal disease. Laboratory Investigation 74, 991-1003 (1996).
14. Sanderson, N., et al. Hepatic expression of mature transforming growth factor beta 1 in transgenic mice results in multiple tissue lesions. Proceedings of the National Academy of Sciences of the United States of
75
America 92, 2572-2576 (1995). 15. Ju, W., et al. Renal gene and protein expression signatures for prediction of
kidney disease progression. American Journal of Pathology 174, 2073-2085 (2009).
16. Wharram, B.L., et al. Podocyte depletion causes glomerulosclerosis: diphtheria toxin-induced podocyte depletion in rats expressing human diphtheria toxin receptor transgene. J Am Soc Nephrol 16, 2941-2952 (2005).
17. Wu, D.T., Bitzer, M., Ju, W., Mundel, P. & Bottinger, E.P. TGF-beta concentration specifies differential signaling profiles of growth arrest/differentiation and apoptosis in podocytes. J Am Soc Nephrol 16, 3211-3221 (2005).
18. Chan, J.A., Krichevsky, A.M. & Kosik, K.S. MicroRNA-21 is an antiapoptotic factor in human glioblastoma cells. Cancer Research 65, 6029-6033 (2005).
19. Carletti, M.Z., Fiedler, S.D. & Christenson, L.K. MicroRNA 21 blocks apoptosis in mouse periovulatory granulosa cells. Biology of Reproduction 83, 286-295 (2010).
20. Kim, Y.H., et al. Podocyte depletion and glomerulosclerosis have a direct relationship in the PAN-treated rat. Kidney International 60, 957-968 (2001).
21. Erhardt, P. & Cooper, G.M. Activation of the CPP32 apoptotic protease by distinct signaling pathways with differential sensitivity to Bcl-xL. Journal of Biological Chemistry 271, 17601-17604 (1996).
22. Nicholson, D.W., et al. Identification and inhibition of the ICE/CED-3 protease necessary for mammalian apoptosis. Nature 376, 37-43 (1995).
23. Bottinger, E.P. & Bitzer, M. TGF-beta signaling in renal disease. J Am Soc Nephrol 13, 2600-2610 (2002).
24. Papagiannakopoulos, T., Shapiro, A. & Kosik, K.S. MicroRNA-21 targets a network of key tumor-suppressive pathways in glioblastoma cells. Cancer Res 68, 8164-8172 (2008).
25. Frankel, L.B., et al. Programmed cell death 4 (PDCD4) is an important functional target of the microRNA miR-21 in breast cancer cells. J Biol Chem 283, 1026-1033 (2008).
26. Lewis, B.P., Burge, C.B. & Bartel, D.P. Conserved seed pairing, often flanked by adenosines, indicates that thousands of human genes are microRNA targets. Cell 120, 15-20 (2005).
27. Yu, Y., et al. MicroRNA-21 induces stemness by downregulating transforming growth factor beta receptor 2 (TGFbetaR2) in colon cancer cells. Carcinogenesis 33, 68-76 (2012).
76
28. Schiffer, M., et al. Apoptosis in podocytes induced by TGF-beta and Smad7. J Clin Invest 108, 807-816 (2001).
29. Bhagat, T.D., et al. miR-21 mediates hematopoietic suppression in MDS by activating TGF-beta signaling. Blood (2013).
30. Engel, M.E., Datta, P.K. & Moses, H.L. RhoB is stabilized by transforming growth factor beta and antagonizes transcriptional activation. J Biol Chem 273, 9921-9926 (1998).
31. Gabriely, G., et al. MicroRNA 21 promotes glioma invasion by targeting matrix metalloproteinase regulators. Molecular and Cellular Biology 28, 5369-5380 (2008).
32. Kong, A.P., et al. Associations between microRNA (miR-21, 126, 155 and 221), albuminuria and heavy metals in Hong Kong Chinese adolescents. Clinica Chimica Acta 413, 1053-1057 (2012).
33. Pan, X., Wang, Z.X. & Wang, R. MicroRNA-21: a novel therapeutic target in human cancer. Cancer Biol Ther 10, 1224-1232 (2010).
34. Xu, X., et al. Delayed ischemic preconditioning contributes to renal protection by upregulation of miR-21. Kidney Int 82, 1167-1175 (2012).
35. Chau, B.N., et al. MicroRNA-21 promotes fibrosis of the kidney by silencing metabolic pathways. Sci Transl Med 4, 121ra118 (2012).
36. Dey, N., et al. MicroRNA-21 orchestrates high glucose-induced signals to TOR complex 1, resulting in renal cell pathology in diabetes. J Biol Chem 286, 25586-25603 (2011).
37. Zhang, Z., et al. MicroRNA-21 protects from mesangial cell proliferation induced by diabetic nephropathy in db/db mice. FEBS Lett 583, 2009-2014 (2009).
38. Liu, G., et al. miR-21 mediates fibrogenic activation of pulmonary fibroblasts and lung fibrosis. J Exp Med 207, 1589-1597 (2010).
39. Thum, T., et al. MicroRNA-21 contributes to myocardial disease by stimulating MAP kinase signalling in fibroblasts. Nature 456, 980-984 (2008).
40. Sayed, D., et al. MicroRNA-21 is a downstream effector of AKT that mediates its antiapoptotic effects via suppression of Fas ligand. J Biol Chem 285, 20281-20290 (2010).
41. Patrick, D.M., et al. Stress-dependent cardiac remodeling occurs in the absence of microRNA-21 in mice. J Clin Invest 120, 3912-3916 (2010).
42. Susztak, K., Raff, A.C., Schiffer, M. & Bottinger, E.P. Glucose-induced reactive oxygen species cause apoptosis of podocytes and podocyte depletion at the onset of diabetic nephropathy. Diabetes 55, 225-233 (2006).
77
43. Niranjan, T., et al. The Notch pathway in podocytes plays a role in the development of glomerular disease. Nature medicine 14, 290-298 (2008).
44. Zamilpa, R., et al. C-terminal fragment of transforming growth factor beta-induced protein (TGFBIp) is required for apoptosis in human osteosarcoma cells. Matrix Biol 28, 347-353 (2009).
45. Sanderson, N., et al. Hepatic expression of mature transforming growth factor beta 1 in transgenic mice results in multiple tissue lesions. Proc Natl Acad Sci U S A 92, 2572-2576 (1995).
46. Kulkarni, A.B., et al. Transforming growth factor beta 1 null mutation in mice causes excessive inflammatory response and early death. Proceedings of the National Academy of Sciences of the United States of America 90, 770-774 (1993).
47. Mukherji, S., et al. MicroRNAs can generate thresholds in target gene expression. Nature Genetics 43, 854-859 (2011).
48. Lu, T.X., et al. MicroRNA-21 limits in vivo immune response-mediated activation of the IL-12/IFN-gamma pathway, Th1 polarization, and the severity of delayed-type hypersensitivity. J Immunol 187, 3362-3373 (2011).
49. Androsavich, J.R., Chau, B.N., Bhat, B., Linsley, P.S. & Walter, N.G. Disease-linked microRNA-21 exhibits drastically reduced mRNA binding and silencing activity in healthy mouse liver. RNA 18, 1510-1526 (2012).
50. Mase, Y., et al. MiR-21 is Enriched in the RNA-Induced Silencing Complex and Targets COL4A1 in Human Granulosa Cell Lines. Reprod Sci 19, 1030-1040 (2012).
51. Zavadil, J. & Bitzer, M. MicroRNAs in epithelial cell plasticity and carcinogenesis. in Human Epithelial Tumor Cell Plasticity:Implications for Cancer Progression and Metastasis (ed. Higgins, P.J.) (2008).
52. Weil EJ, et al. Effect of losartan on prevention and progression of early diabetic nephropathy in American Indians with type 2 diabetes. Diabetes in press(2013).
53. Cohen, C.D., Frach, K., Schlondorff, D. & Kretzler, M. Quantitative gene expression analysis in renal biopsies: a novel protocol for a high-throughput multicenter application. Kidney International 61, 133-140 (2002).
54. Bitzer, M., Ju, W., Jing, X. & Zavadil, J. Quantitative analysis of miRNA expression in epithelial cells and tissues. Methods Mol Biol 820, 55-70 (2012).
55. Bitzer, M., et al. A mechanism of suppression of TGF-beta/SMAD signaling by NF-kappa B/RelA. Genes & development 14, 187-197 (2000).
56. Farazi, T.A., et al. Bioinformatic analysis of barcoded cDNA libraries for

78
small RNA profiling by next-generation sequencing. Methods 58, 171-187 (2012).
57. Fukuda, A., et al. Angiotensin II-dependent persistent podocyte loss from destabilized glomeruli causes progression of end stage kidney disease. Kidney International 81, 40-55 (2012).
58. Takemoto, M., et al. A new method for large scale isolation of kidney glomeruli from mice. Am J Pathol 161, 799-805 (2002).
79
Chapter III
Loss of miR-21 promotes mesangial cell proliferation and leads to increased
mesangial expansion in diabetic mice
Abstract
DN is the leading cause of ESRD and imposes heavy burden on the medical economy.
Mesangial expansion is an early finding in DN, and is associated with mesangial cell
proliferation as well as hypertrophy. We have previously identified miR-21 to be
increased in micro-dissected glomeruli of patients with early to intermediate
pathologic changes of DN. In addition, we had shown that loss of miR-21 is
associated with acceleration of glomerulopathy in Albumin-TGFß transgenic mcie. To
test the hypothesis that miR-21 inhibits the development of mesangial expansion and
DN, we examined glomerular pathology in streptozotocin (STZ)-induced
hyperglycemic, miR-21 KO mice.
STZ (50mg/kg) was injected intraperitoneally (IP) into 10 weeks old miR-21 wildtype
(WT), heterozygous (HET), and knockout (KO) mice in pure DBA background for 5
days. Proteinuria was assessed every 4 weeks for 20 weeks after STZ treatment.
80
Kidney histology and mRNA expression were examined at 20 weeks after STZ
treatment. For in vitro studies, primary mesangial cells (PMC) were isolated from
miR-21 WT and KO mice. Cell proliferation and cell cycle distribution were studied
in miR-21WT and KO PMCs.
STZ-treated miR-21 KO mice developed more albuminuria and glomerular
mesangial expansion compared to the WT or HET littermates. miR-21 KO PMC
showed faster proliferation and more cells accumulating at the synthesis (S) phase of
the cell cycle than miR-21 WT PMC. The mRNA expression of cell cycle regulators,
cyclin-dependent kinase 6 (Cdk6) and cell division cycle 25A (Cdc25a), were
increased in the renal glomeruli of STZ-treated miR-21 KO mice versus STZ-treated
miR-21 WT mice.
Our results suggested that miR-21 targets Cdk6 and Cdc25a to protect against
mesangial expansion in DN. Therefore, we propose that miR-21 limits DN by
inhibiting cell cycle progression in mesangial cells.
81
Introduction
DN is the renal injury caused by hyperglycemia. Clinically, it manifests as
proteinuria and loss of kidney function. Histologically, it is characterized by
mesangial expansion, glomerulosclerosis and tubulointerstitial fibrosis1. DN is the
leading cause of ESRD in the United States and increases cardiovascular events as
well as mortality2. Therefore, several different diabetic murine models have been
developed to mimic human DN to explore mechanisms for DN and develop new
therapies3. Nevertheless, to date, none of these diabetic murine models recapitulate
all the microvascular and macrovascular injury observed in human DN3.
STZ-induced DN in mice is a well-established diabetic murine model. It is
characterized by mesangial expansion, nodular sclerosis, and arteriolar hyalinosis3.
However, different susceptibilities to DN were noted in different inbred mouse
strains. For instance, C57BL/6 mice are relatively resistant to diabetic kidney injury,
while DBA mice develop mesangial expansion and mesangial sclerosis, which
represent early human DN3,4.
In previous chapters, we determined the role and regulatory mechanisms of miR-21
in progressive glomerulopathy in TGFβ transgenic mice. We noticed that miR-21
inhibits apoptosis in podocytes exposed to TGFβ. However, because miR-21 has
been linked to fibroblast activation in heart disease5 and epithelial mesenchymal
82
transition (EMT) in rat tubular cells6, the latter findings suggest that the interaction
of miR-21 with TGFβ signaling may be context-dependent and/or cell-specific.
Therefore, the function of miR-21 in DN needs to be further validated.
Therefore, we used STZ-induced glomerulopathy in DBA mice to test our
hypothesis that miR-21 has a protective role in mesangial expansion and DN. We
also determined the function of miR-21 in primary mesangial cells from miR-21 WT
and KO mice to study the impact of loss of miR-21 in vitro.
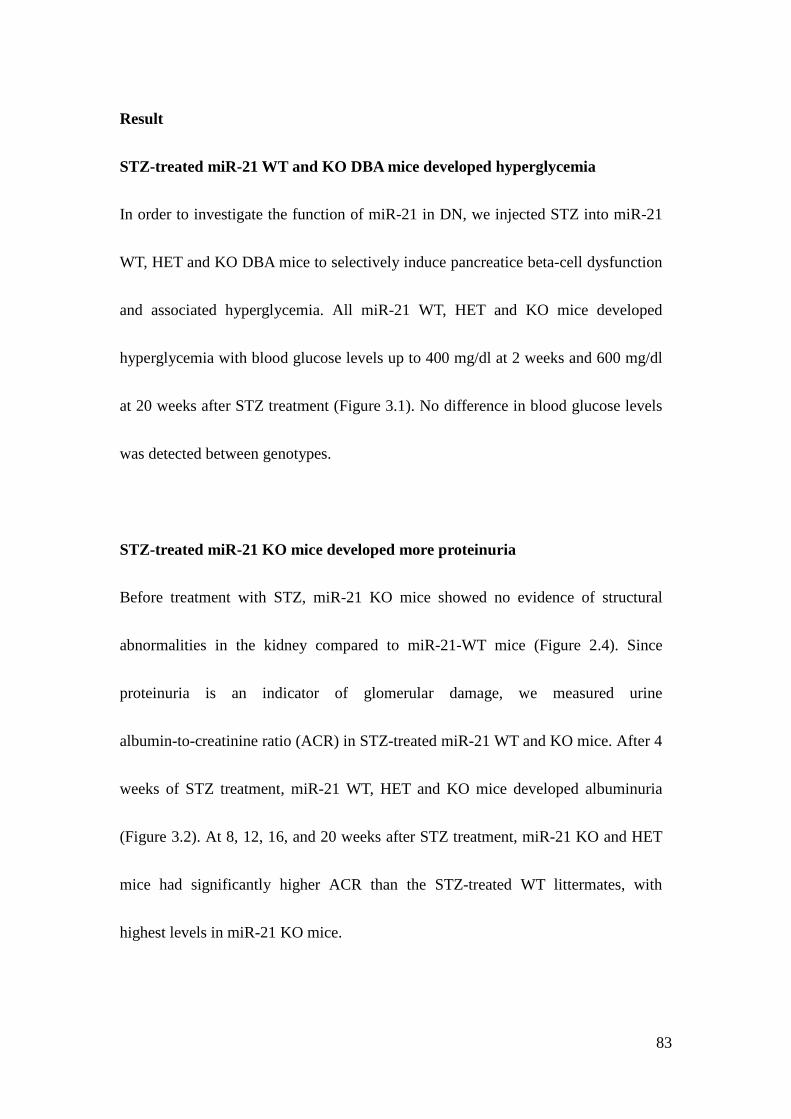
83
Result
STZ-treated miR-21 WT and KO DBA mice developed hyperglycemia
In order to investigate the function of miR-21 in DN, we injected STZ into miR-21
WT, HET and KO DBA mice to selectively induce pancreatice beta-cell dysfunction
and associated hyperglycemia. All miR-21 WT, HET and KO mice developed
hyperglycemia with blood glucose levels up to 400 mg/dl at 2 weeks and 600 mg/dl
at 20 weeks after STZ treatment (Figure 3.1). No difference in blood glucose levels
was detected between genotypes.
STZ-treated miR-21 KO mice developed more proteinuria
Before treatment with STZ, miR-21 KO mice showed no evidence of structural
abnormalities in the kidney compared to miR-21-WT mice (Figure 2.4). Since
proteinuria is an indicator of glomerular damage, we measured urine
albumin-to-creatinine ratio (ACR) in STZ-treated miR-21 WT and KO mice. After 4
weeks of STZ treatment, miR-21 WT, HET and KO mice developed albuminuria
(Figure 3.2). At 8, 12, 16, and 20 weeks after STZ treatment, miR-21 KO and HET
mice had significantly higher ACR than the STZ-treated WT littermates, with
highest levels in miR-21 KO mice.
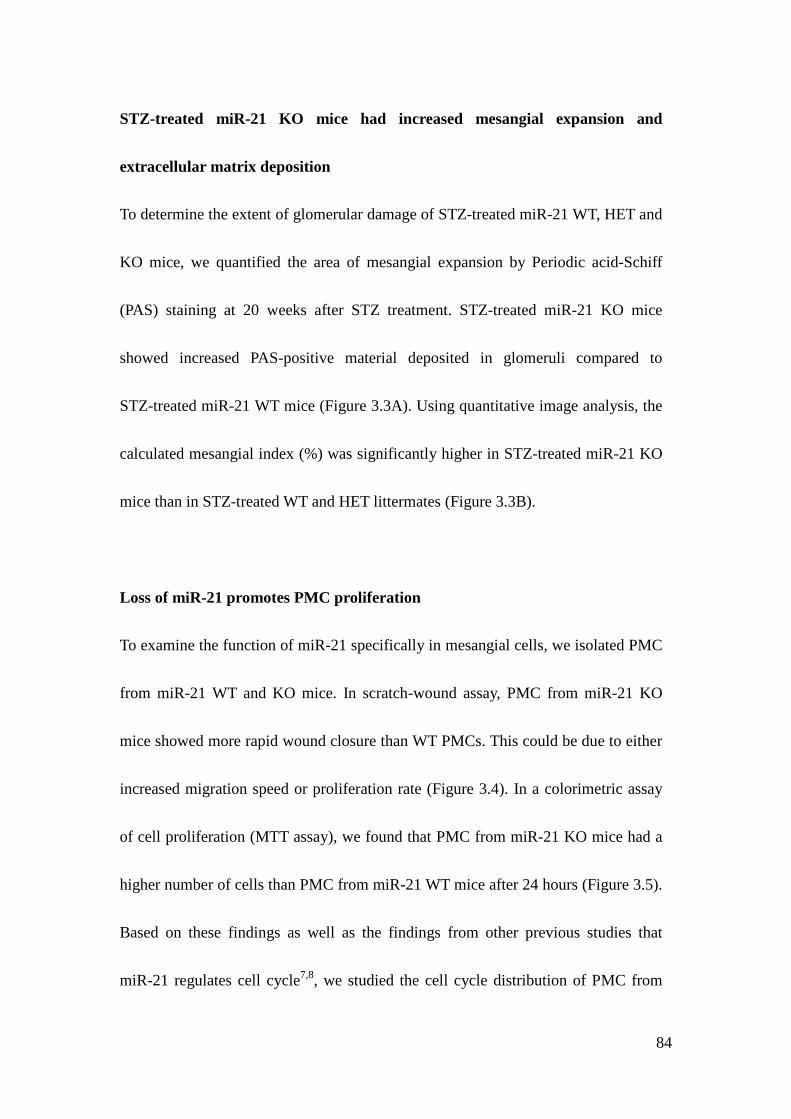
84
STZ-treated miR-21 KO mice had increased mesangial expansion and
extracellular matrix deposition
To determine the extent of glomerular damage of STZ-treated miR-21 WT, HET and
KO mice, we quantified the area of mesangial expansion by Periodic acid-Schiff
(PAS) staining at 20 weeks after STZ treatment. STZ-treated miR-21 KO mice
showed increased PAS-positive material deposited in glomeruli compared to
STZ-treated miR-21 WT mice (Figure 3.3A). Using quantitative image analysis, the
calculated mesangial index (%) was significantly higher in STZ-treated miR-21 KO
mice than in STZ-treated WT and HET littermates (Figure 3.3B).
Loss of miR-21 promotes PMC proliferation
To examine the function of miR-21 specifically in mesangial cells, we isolated PMC
from miR-21 WT and KO mice. In scratch-wound assay, PMC from miR-21 KO
mice showed more rapid wound closure than WT PMCs. This could be due to either
increased migration speed or proliferation rate (Figure 3.4). In a colorimetric assay
of cell proliferation (MTT assay), we found that PMC from miR-21 KO mice had a
higher number of cells than PMC from miR-21 WT mice after 24 hours (Figure 3.5).
Based on these findings as well as the findings from other previous studies that
miR-21 regulates cell cycle7,8, we studied the cell cycle distribution of PMC from
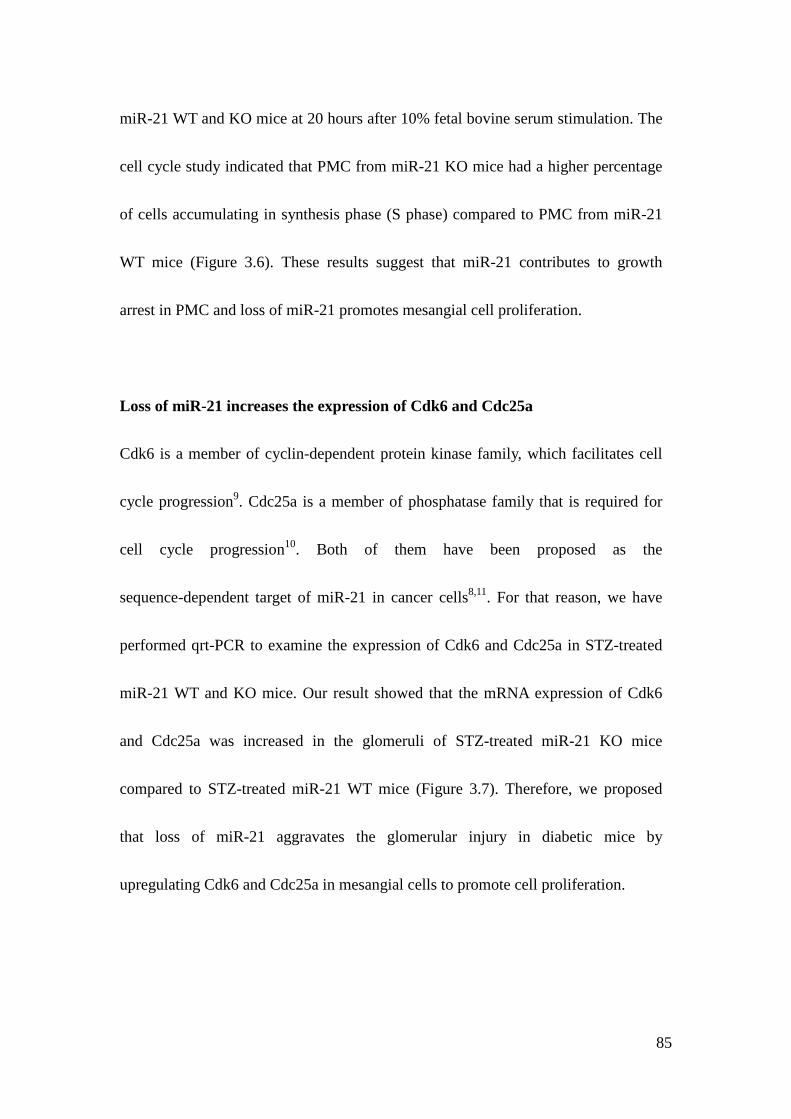
85
miR-21 WT and KO mice at 20 hours after 10% fetal bovine serum stimulation. The
cell cycle study indicated that PMC from miR-21 KO mice had a higher percentage
of cells accumulating in synthesis phase (S phase) compared to PMC from miR-21
WT mice (Figure 3.6). These results suggest that miR-21 contributes to growth
arrest in PMC and loss of miR-21 promotes mesangial cell proliferation.
Loss of miR-21 increases the expression of Cdk6 and Cdc25a
Cdk6 is a member of cyclin-dependent protein kinase family, which facilitates cell
cycle progression9. Cdc25a is a member of phosphatase family that is required for
cell cycle progression10. Both of them have been proposed as the
sequence-dependent target of miR-21 in cancer cells8,11. For that reason, we have
performed qrt-PCR to examine the expression of Cdk6 and Cdc25a in STZ-treated
miR-21 WT and KO mice. Our result showed that the mRNA expression of Cdk6
and Cdc25a was increased in the glomeruli of STZ-treated miR-21 KO mice
compared to STZ-treated miR-21 WT mice (Figure 3.7). Therefore, we proposed
that loss of miR-21 aggravates the glomerular injury in diabetic mice by
upregulating Cdk6 and Cdc25a in mesangial cells to promote cell proliferation.
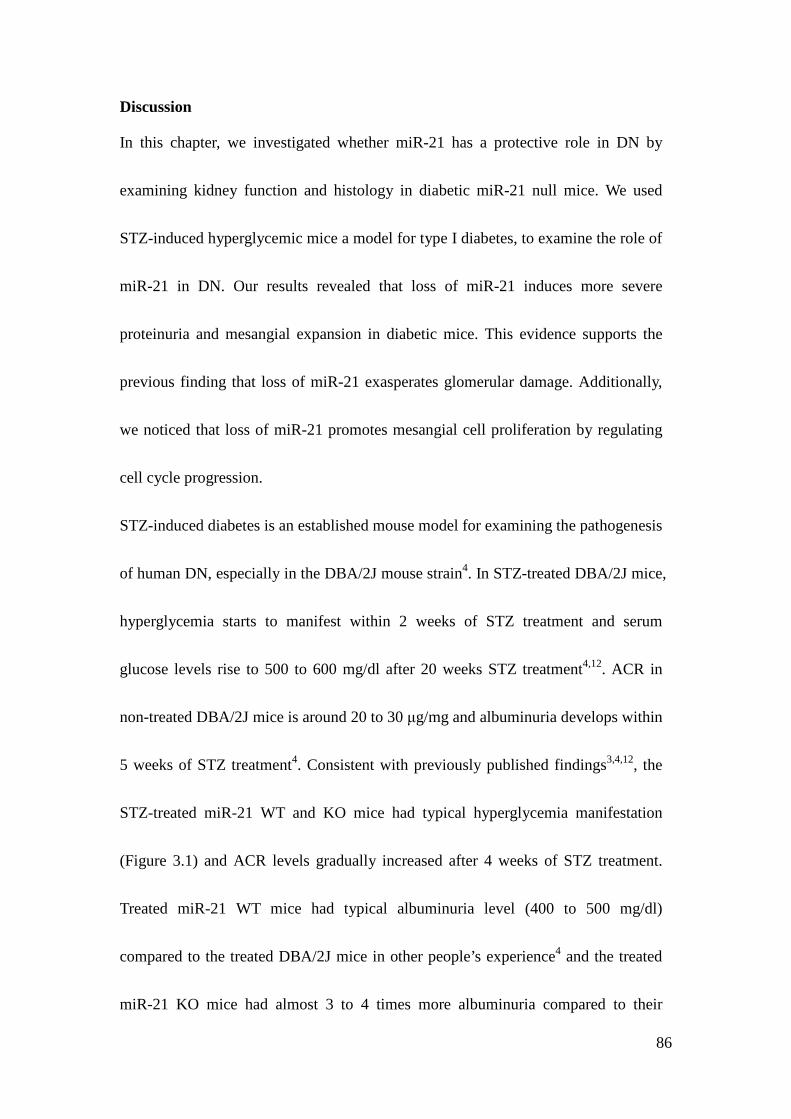
86
Discussion
In this chapter, we investigated whether miR-21 has a protective role in DN by
examining kidney function and histology in diabetic miR-21 null mice. We used
STZ-induced hyperglycemic mice a model for type I diabetes, to examine the role of
miR-21 in DN. Our results revealed that loss of miR-21 induces more severe
proteinuria and mesangial expansion in diabetic mice. This evidence supports the
previous finding that loss of miR-21 exasperates glomerular damage. Additionally,
we noticed that loss of miR-21 promotes mesangial cell proliferation by regulating
cell cycle progression.
STZ-induced diabetes is an established mouse model for examining the pathogenesis
of human DN, especially in the DBA/2J mouse strain4. In STZ-treated DBA/2J mice,
hyperglycemia starts to manifest within 2 weeks of STZ treatment and serum
glucose levels rise to 500 to 600 mg/dl after 20 weeks STZ treatment4,12. ACR in
non-treated DBA/2J mice is around 20 to 30 μg/mg and albuminuria develops within
5 weeks of STZ treatment4. Consistent with previously published findings3,4,12, the
STZ-treated miR-21 WT and KO mice had typical hyperglycemia manifestation
(Figure 3.1) and ACR levels gradually increased after 4 weeks of STZ treatment.
Treated miR-21 WT mice had typical albuminuria level (400 to 500 mg/dl)
compared to the treated DBA/2J mice in other people’s experience4 and the treated
miR-21 KO mice had almost 3 to 4 times more albuminuria compared to their
87
control WT littermates.
In terms of kidney histopathological change, at as early as 5 weeks after STZ
treatment, glomerular hypertrophy is the typical feature in STZ-treated DBA mice12.
When disease progresses, mesangial expansion becomes the major pathological
feature similar to what we have found in treated-miR-21 WT and KO mice at 20
weeks after STZ treatment. Furthermore, mesangial sclerosis developed in treated
miR-21 KO mice (Figure 3.3). Other features of DN including arteriolar hyalinosis
or nodular glomerulosclerosis seldom develop in STZ-treated DBA/2J mice12 and
there is no current diabetic murine model that recapitulates all of the clinical features
of human DN3. In addition, despite being more susceptible to DN, STZ-treated
DBA/2J mice only develop mesangial expansion and sclerosis, which represent the
early stage of DG. Therefore, STZ-treated miR-21 KO mouse is a suitable model to
test the protective role of miR-21 in glomerulopathy.
miR-21 is of special interest because in murine models of renal interstitial fibrosis13
and lung disease14, miR-21 promotes fibrosis through multiple mechanisms
including regulation of TGFβ signaling. On the other hand, in both TGFβ1
transgenic and diabetic mice, miR-21 protects against glomerulopathy. This diverse
function of miR-21 may depend on different organ systems and injuries. It is also
likely to be secondary to the differential expression of target genes in different cells.
88
For example, tumor suppressor PTEN was shown to be target gene of miR-21 in
mesangial cells15 and cancer cells16. However, in our culture system, while
overexpressing miR-21 in 293T human embryonic kidney cells, we did not observe
repression of miR-21 on PTEN (Figure 3.8A). We also did not detect the difference
in the protein expression of PTEN in miR-21 WT, HET, and KO DBA/2J mice
(Figure 3.8B).
The cell cycle, consisting of G0, G1, S, G2, and M phases, represents a series of
events leading cells from replication to cell division. The check-point of each phase
transition is tightly regulated by cyclin and cyclin-dependent kinases (CDK)17,18.
Dysregulation of these proteins can promote cancer formation19 as well as contribute
to the pathogenesis of DG17. In vitro, TGFβ has been shown to induce CDK
inhibitors, block cell cycle progression, and result in PMC hypertrophy20-22. In our
PMC culture system, we noticed that loss of miR-21 promoted PMC proliferation.
Consistent with our findings, Wang et al. also found that miR-21 targets Cdc25a and
inhibits G1 to S transition in colon cancer cells8. In addition, miR-21 is reported to
upregulate CDK inhibitor, P21, by targeting its transcriptional inhibitor, Nf1b
(Nuclear factor 1 B-type)23. Our results using a cell proliferation assay and assessing
the cell cycle support that loss of miR-21 upregulates cell cycle-related proteins to
prompt cell cycle progression.
89
Cdk6 is a member of the cyclin-dependent protein kinase family. This kinase first
appears in mid-G1 phase, together with Cdk4, is important for cell cycle G1 phase
progression and G1 to S transition9. Cdc25a is a member of phosphatase family that
dephosphorylates and activates CDK–cyclin complexes, such as CDK2–cyclin E at
the G1–S transition and CDK1–cyclin B at the entry into mitosis10. Interestingly,
Cdk6 and Cdc25a mRNA has been shown to be a sequence-dependent target of
miR-21 in cancer cells8,11. Our in vivo results also showed that Cdk6 and Cdc25a
mRNA level were increased in glomeruli of STZ-treated KO mice. This supports the
hypothesis that loss of miR-21 promotes mesangial cell proliferation from
upregulating Cdk6 and Cdc25a.
Despite previous findings that TGFβ or hyperglycemia induces CDK inhibitors to
cause cell cycle arrest and mesangial cell hypertrophy24,25, a biphasic growth
response of mesangial cells to TGFβ has been described17. It is possible that before
the hypertrophic stage, an increase of Cdk6 or Cdc25a caused by loss of miR-21
facilitates an initial proliferation stage of mesangial cells leading to mesangial
expansion. In support of this, Zhang et al. have shown that overexpression of
miR-21 inhibits mesangial cell proliferation in diabetic db/db mice26.
In summary, the findings in our diabetic mouse model provide additional evidence
that miR-21 has a protective role in TGFβ-related glomerulopathy including DG.

90
miR-21 targets different regulatory mechanisms in different glomerular cells, which
reiterates the cell-specific and multi-facet nature of miRNA. Our study suggests an
unconventional and unrecognized role of miR-21 in different compartments of
kidney.
91
Methods and Materials
Mouse model. miR-21-KO C57BL/6J mice were generated from disruption of the
miR-21 sequence as described27. miR-21 WT and KO DBA/2J mice were obtained
by backcrossing the C57BL/6J mice colony onto the DBA background strain for 6 or
more generations. STZ, dissolved in sodium citrate buffer, was IP injected into 10
weeks old miR-21 WT and KO DBA/2J mice in a dose of 50mg/kg as previously
described28. These procedures were in accordance with the policies of the University
of Michigan Institutional Animal Care and Use Committee.
Blood glucose measurement. Adequate amount of blood was obtained from tail
vein of mice. Blood glucose was measured by using Accu-Chek Comfort Curve
Diabetic Test Strips before STZ treatment and at 2 weeks, 6 weeks, 12 weeks, and
20 weeks after STZ treatment.
Urine albumin and creatinine measurement. Spot mouse urine was collected
non-invasively from mice 1-2 days before STZ treatment and at 4 weeks, 8 weeks,
12 weeks, 16 weeks and 20 weeks after STZ treatment. Urine albumin was
measured by Albuwell M kit (Exocell Inc) and urine creatinine was measured by the
Creatinine Companion Kit (Exocell Inc).
92
Tissue staining and analysis. Mouse kidneys were harvested, fixed in 4%
paraformaldehyde overnight, and paraffin-embedded. The kidney sections were cut
in 3μm thickness, deparaffinized with xylene, and dehydrated in water through
graded ethanol. For PAS staining, the kidney section was incubated in 0.5% periodic
acid solution for 10 minutes, Schiff reagent for 15 minutes, and then was
counterstained with Weigert’s hematoxylin for 30 seconds. After the staining, the
kidney sections were rehydrated in water through graded alcohol, cleaned, and
mounted with Permount.
Mesangial Index. In order to establish what percent of glomerular area is occupied
by mesangial matrix, we took a sufficient number of images at 40x magnification to
ensure a minimum of 25 glomeruli per animal were represented. The mesangial
index quantification was described as before29. In brief, ImageJ was used to set a
minimum HSI (hue, saturation, intensity) threshold according to PAS-positive
material which if exceeded would count as mesangial matrix. The software was
further used to calculate the total area and percent area exceeding threshold of each
mesangial tuft.
93
Cell culture. Primary mouse mesangial cells were isolated from glomeruli of 6 to 8
weeks old miR-21 WT and KO mice as described before30,31. In brief, mouse
kidneys were harvested. Cortex was removed from medulla, cut into 1mm cube, and
past through a series of cell strainers from 200μm, 100μm to 70μm. At last,
glomeruli were collected on the 70μm cell strainer and digested in collagenase A
solution (1mg/ml) for 30 minutes. The digested glomeruli were then cultured in
collagen type I-coated 6cm dish for 3 to 5 days. Once the mesangial cell clusters
were formed, they were subcultured and kept propagating. The experiments were
performed in PMC between 5 to 15 passages. The cells were cultured in RPMI 1640
medium supplemented with 20% fetal bovine serum (FBS), 1%
penicillin/streptomycin, and 1% insulin-transferrin-selenium (Invitrogen) and were
incubated in 37°C, 5% CO2 incubator.
Proliferation assay. PMC were trypsinized and cell number was counted using
trypan blue exclusion method including trypan blue solution 0.4% (invitrogen) and
haemocytometer per manufacturer’s protocol. The miR-21 WT and KO PMC were
grown in a 96 well plate at the same cell number for 5 repeats. After 24 hours of cell
growth in 10% FBS, cell proliferation was examined by MTT (Tetrazolium dye) cell
proliferation assay kit per manufacturer’s protocol (Cayman Chemical Company).
94
Cell cycle distribution measurement. PMC were serum-starved (0.2%) for 24
hours and shifted to 10% FBS with or without TGFβ treatment (10ng/ml). After
another 20 hours, the cells were harvested and fixed in 70% ethanol. Cell cycle
distribution was determined by staining the cells with propidium iodide and
examining the staining intensity in flow cytometry as described32.
Statistical analysis
Proteinuria, mesangial index and picro-sirius staining intensity were compared
between miR-21 WT and KO mice using t-test. The cell proliferation and cell cycle
distribution were also compared using t-test.
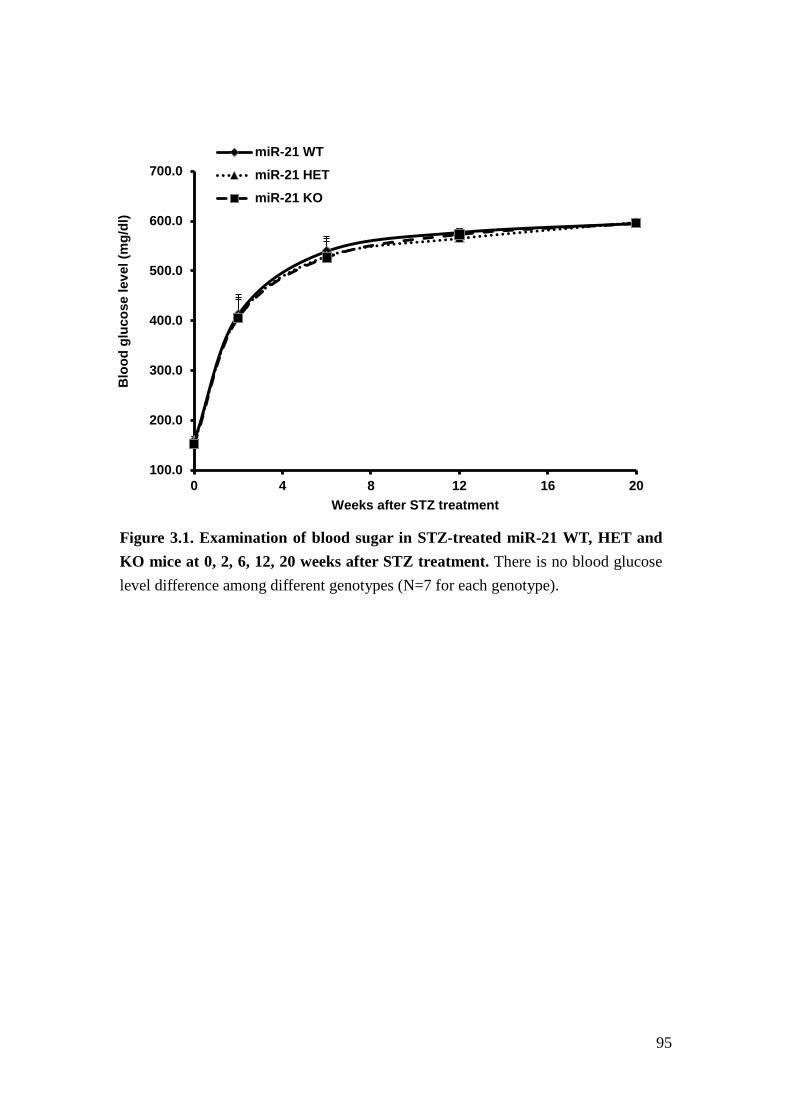
95
Figure 3.1. Examination of blood sugar in STZ-treated miR-21 WT, HET and KO mice at 0, 2, 6, 12, 20 weeks after STZ treatment. There is no blood glucose level difference among different genotypes (N=7 for each genotype).
100.0
200.0
300.0
400.0
500.0
600.0
700.0
0 4 8 12 16 20
Blo
od g
luco
se le
vel (
mg/
dl)
Weeks after STZ treatment
miR-21 WTmiR-21 HETmiR-21 KO
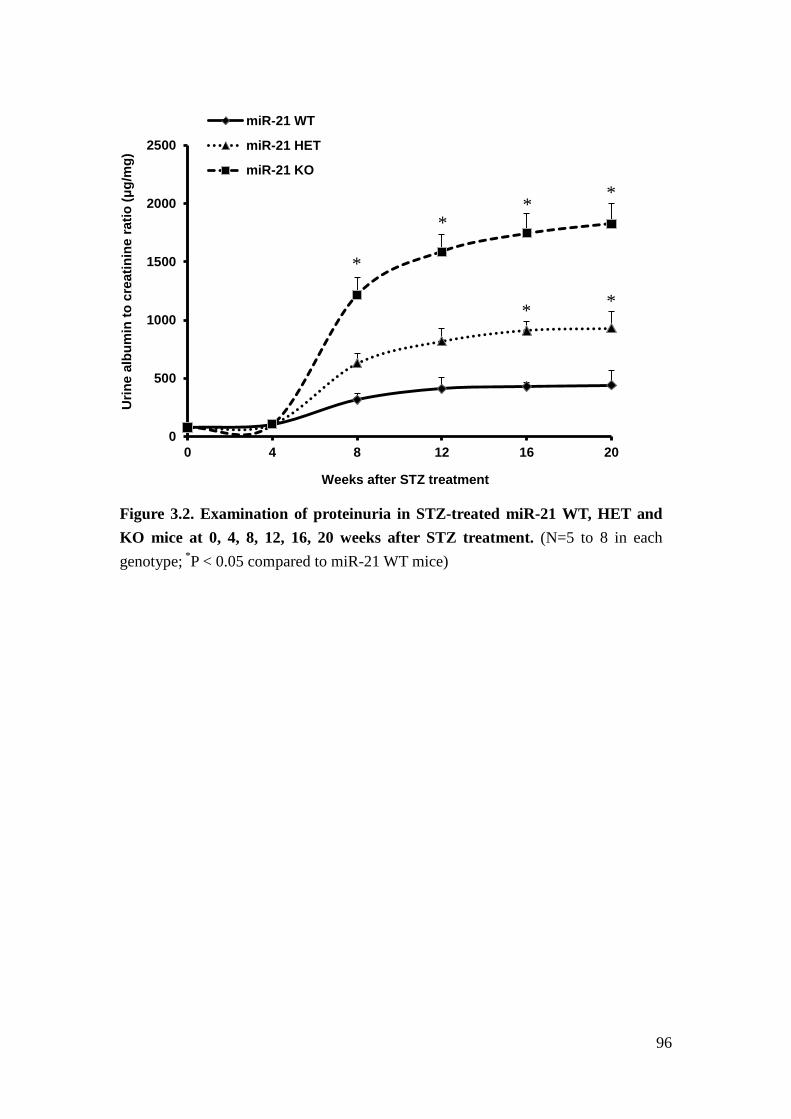
96
Figure 3.2. Examination of proteinuria in STZ-treated miR-21 WT, HET and KO mice at 0, 4, 8, 12, 16, 20 weeks after STZ treatment. (N=5 to 8 in each genotype; *P < 0.05 compared to miR-21 WT mice)
0
500
1000
1500
2000
2500
0 4 8 12 16 20
Urin
e al
bum
in to
cre
atin
ine
ratio
(μg/
mg)
Weeks after STZ treatment
miR-21 WT
miR-21 HET
miR-21 KO
*
* *
* *
*
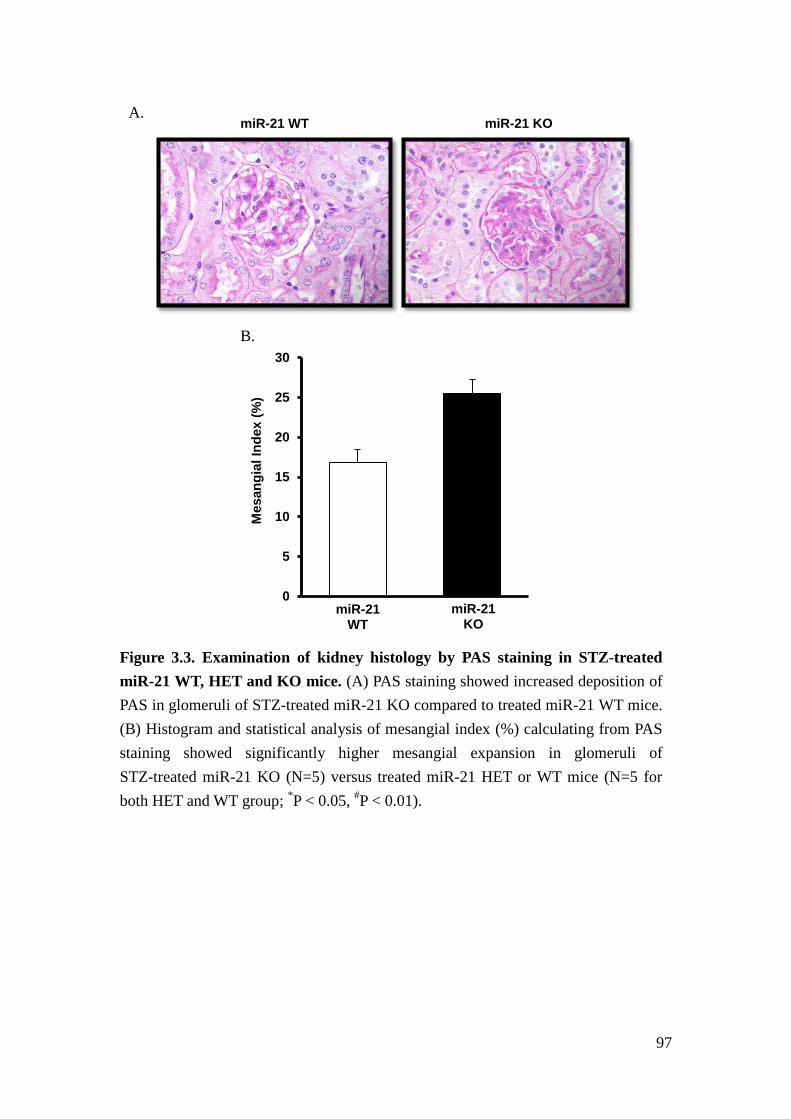
97
Figure 3.3. Examination of kidney histology by PAS staining in STZ-treated miR-21 WT, HET and KO mice. (A) PAS staining showed increased deposition of PAS in glomeruli of STZ-treated miR-21 KO compared to treated miR-21 WT mice. (B) Histogram and statistical analysis of mesangial index (%) calculating from PAS staining showed significantly higher mesangial expansion in glomeruli of STZ-treated miR-21 KO (N=5) versus treated miR-21 HET or WT mice (N=5 for both HET and WT group; *P < 0.05, #P < 0.01).
A. miR-21 WT
miR-21 KO
miR-21 WT
miR-21 KO
0
5
10
15
20
25
30
Mes
angi
al In
dex
(%)
B.
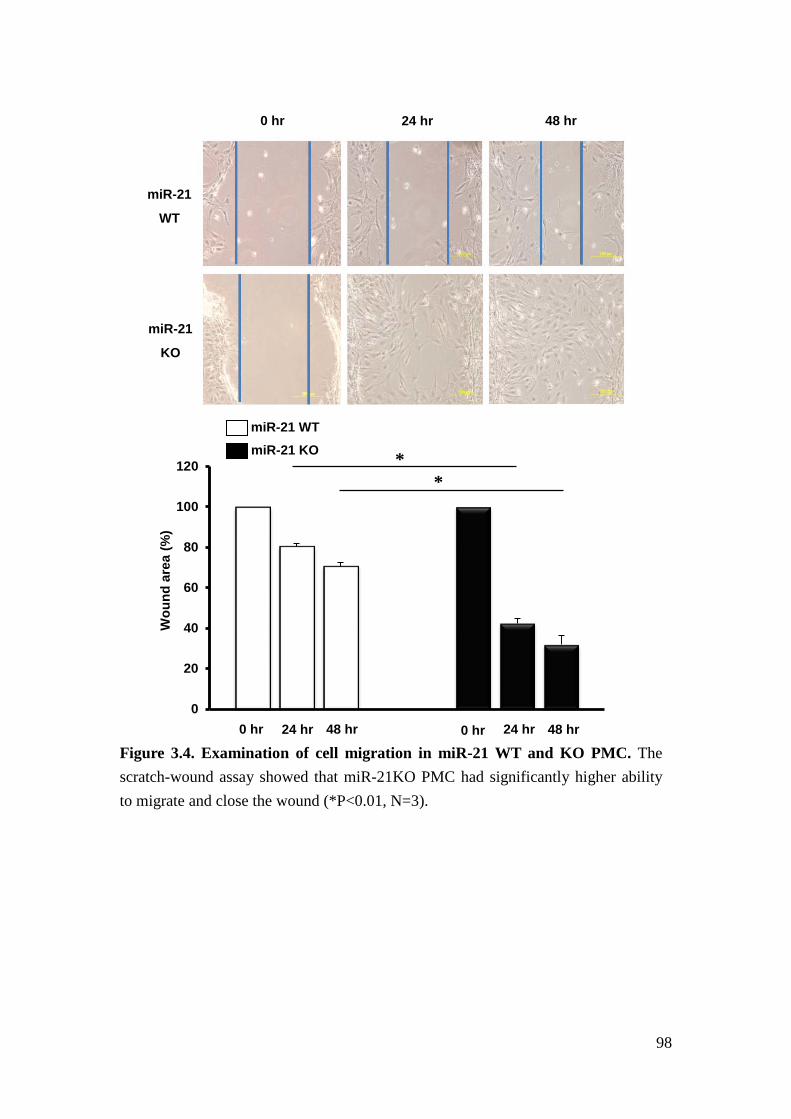
98
Figure 3.4. Examination of cell migration in miR-21 WT and KO PMC. The scratch-wound assay showed that miR-21KO PMC had significantly higher ability to migrate and close the wound (*P<0.01, N=3).
miR-21
KO
miR-21
WT
0 hr 24 hr 48 hr
0
20
40
60
80
100
120
Wou
nd a
rea
(%)
0 hr 24 hr 48 hr 0 hr 24 hr 48 hr
miR-21 WT miR-21 KO *
*
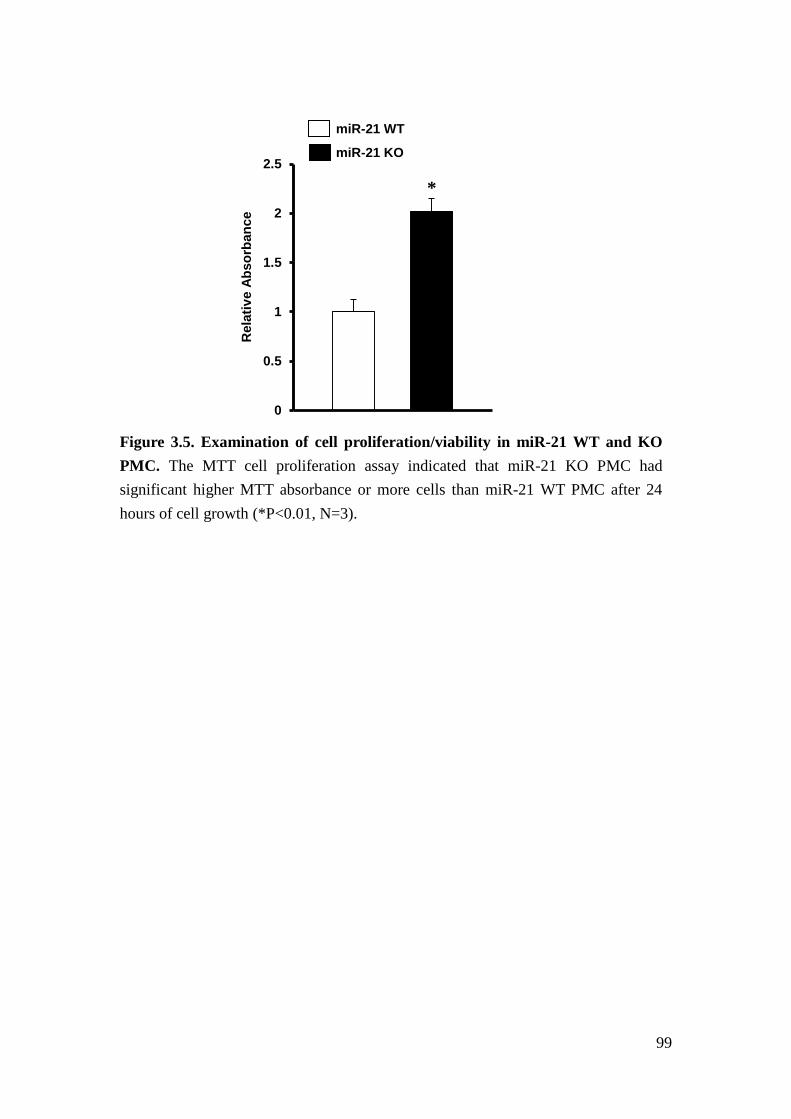
99
Figure 3.5. Examination of cell proliferation/viability in miR-21 WT and KO PMC. The MTT cell proliferation assay indicated that miR-21 KO PMC had significant higher MTT absorbance or more cells than miR-21 WT PMC after 24 hours of cell growth (*P<0.01, N=3).
0
0.5
1
1.5
2
2.5
Rel
ativ
e Ab
sorb
ance
miR-21 WT miR-21 KO
*
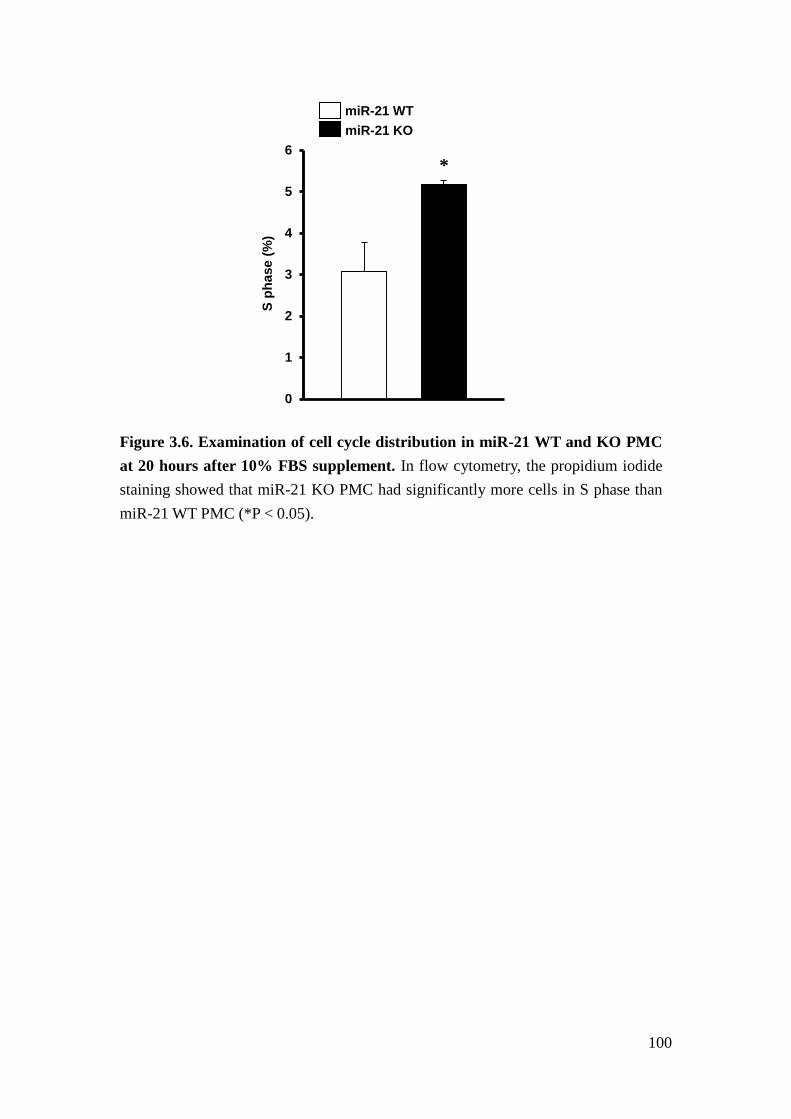
100
Figure 3.6. Examination of cell cycle distribution in miR-21 WT and KO PMC at 20 hours after 10% FBS supplement. In flow cytometry, the propidium iodide staining showed that miR-21 KO PMC had significantly more cells in S phase than miR-21 WT PMC (*P < 0.05).
0
1
2
3
4
5
6
S ph
ase
(%)
miR-21 WT miR-21 KO
*
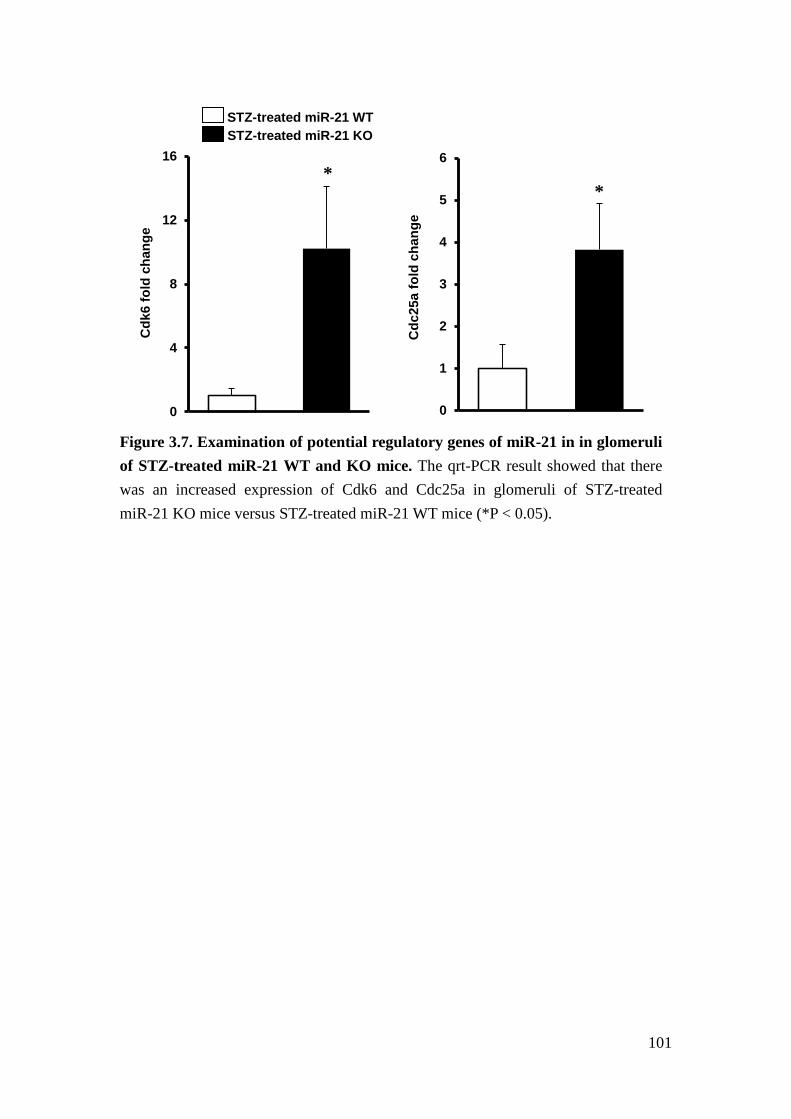
101
Figure 3.7. Examination of potential regulatory genes of miR-21 in in glomeruli of STZ-treated miR-21 WT and KO mice. The qrt-PCR result showed that there was an increased expression of Cdk6 and Cdc25a in glomeruli of STZ-treated miR-21 KO mice versus STZ-treated miR-21 WT mice (*P < 0.05).
0
4
8
12
16C
dk6
fold
cha
nge
0
1
2
3
4
5
6
Cdc
25a
fold
cha
nge
STZ-treated miR-21 WT STZ-treated miR-21 KO
* *
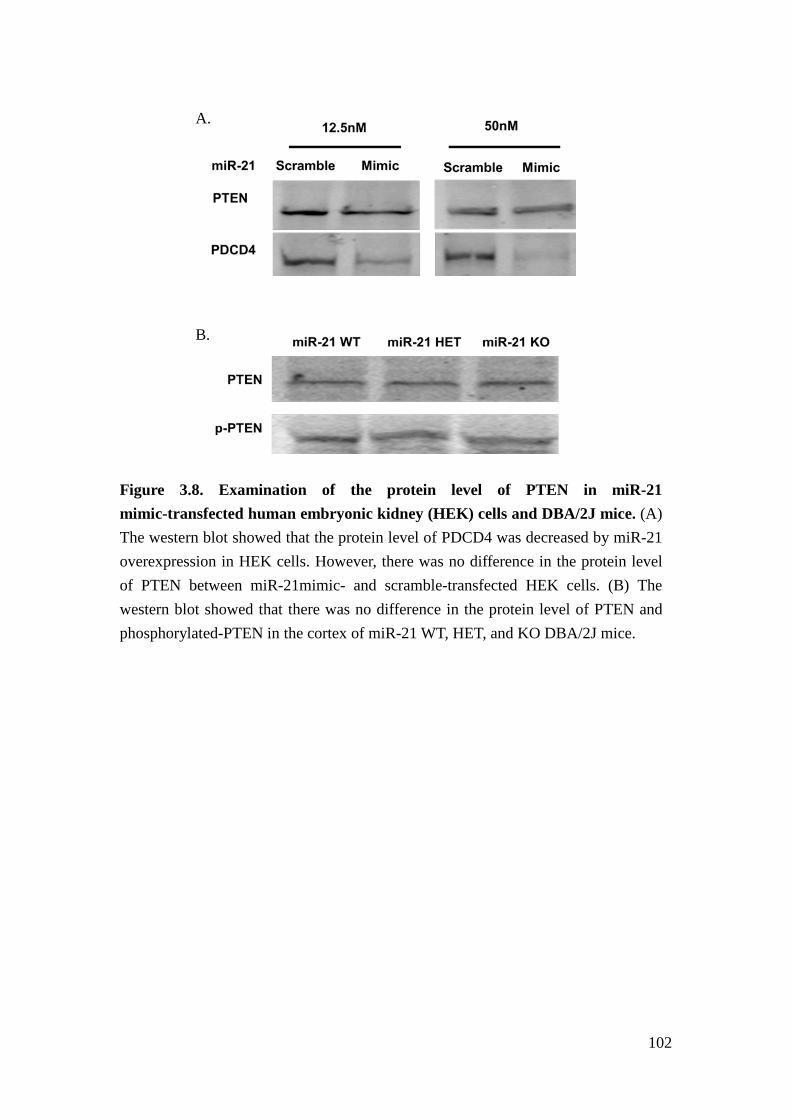
102
Figure 3.8. Examination of the protein level of PTEN in miR-21 mimic-transfected human embryonic kidney (HEK) cells and DBA/2J mice. (A) The western blot showed that the protein level of PDCD4 was decreased by miR-21 overexpression in HEK cells. However, there was no difference in the protein level of PTEN between miR-21mimic- and scramble-transfected HEK cells. (B) The western blot showed that there was no difference in the protein level of PTEN and phosphorylated-PTEN in the cortex of miR-21 WT, HET, and KO DBA/2J mice.
A.
B.
103
References
1. Mauer, M., Mogensen, C.E. & Friedman, E.A. Diseases of the Kidney. in Diabetic nephropathy (eds. Schrier, R.W. & Gottschalk, C.W.) p.2019-2061 (Little,Brown and Company, New York, 1997).
2. US Renal Data System. USRDS 2011 Annual Data Report: Atlas of Chronic Kidney Disease and Eng Stage Renal Disease in the United States. (National Institutes of Health, National Institute of Diabetes and Digestive and Kidney Diseases, Bethesda, MD, 2011).
3. Brosius, F.C., 3rd, et al. Mouse models of diabetic nephropathy. J Am Soc Nephrol 20, 2503-2512 (2009).
4. Qi, Z., et al. Characterization of susceptibility of inbred mouse strains to diabetic nephropathy. Diabetes 54, 2628-2637 (2005).
5. Thum, T., et al. MicroRNA-21 contributes to myocardial disease by stimulating MAP kinase signalling in fibroblasts. Nature 456, 980-984 (2008).
6. Denby, L., et al. miR-21 and miR-214 are consistently modulated during renal injury in rodent models. Am J Pathol 179, 661-672 (2011).
7. Zhong, Z., Dong, Z., Yang, L. & Gong, Z. miR-21 induces cell cycle at S phase and modulates cell proliferation by down-regulating hMSH2 in lung cancer. Journal of cancer research and clinical oncology 138, 1781-1788 (2012).
8. Wang, P., et al. microRNA-21 negatively regulates Cdc25A and cell cycle progression in colon cancer cells. Cancer Res 69, 8157-8165 (2009).
9. Ekholm, S.V. & Reed, S.I. Regulation of G(1) cyclin-dependent kinases in the mammalian cell cycle. Current opinion in cell biology 12, 676-684 (2000).
10. Boutros, R., Lobjois, V. & Ducommun, B. CDC25 phosphatases in cancer cells: key players? Good targets? Nature reviews. Cancer 7, 495-507 (2007).
11. Frankel, L.B., et al. Programmed cell death 4 (PDCD4) is an important functional target of the microRNA miR-21 in breast cancer cells. J Biol Chem 283, 1026-1033 (2008).
12. Breyer, M.D., et al. Mouse models of diabetic nephropathy. J Am Soc Nephrol 16, 27-45 (2005).
13. Chau, B.N., et al. MicroRNA-21 promotes fibrosis of the kidney by silencing metabolic pathways. Sci Transl Med 4, 121ra118 (2012).
14. Liu, G., et al. miR-21 mediates fibrogenic activation of pulmonary fibroblasts and lung fibrosis. J Exp Med 207, 1589-1597 (2010).
104
15. Dey, N., et al. MicroRNA-21 orchestrates high glucose-induced signals to TOR complex 1, resulting in renal cell pathology in diabetes. J Biol Chem 286, 25586-25603 (2011).
16. Meng, F., et al. MicroRNA-21 regulates expression of the PTEN tumor suppressor gene in human hepatocellular cancer. Gastroenterology 133, 647-658 (2007).
17. Wolf, G. Cell cycle regulation in diabetic nephropathy. Kidney Int Suppl 77, S59-66 (2000).
18. Marshall, C.B. & Shankland, S.J. Cell cycle regulatory proteins in podocyte health and disease. Nephron Exp Nephrol 106, e51-59 (2007).
19. Stewart, Z.A., Westfall, M.D. & Pietenpol, J.A. Cell-cycle dysregulation and anticancer therapy. Trends in pharmacological sciences 24, 139-145 (2003).
20. Schoecklmann, H.O., Rupprecht, H.D., Zauner, I. & Sterzel, R.B. TGF-beta1-induced cell cycle arrest in renal mesangial cells involves inhibition of cyclin E-cdk 2 activation and retinoblastoma protein phosphorylation. Kidney Int 51, 1228-1236 (1997).
21. Liu, B. & Preisig, P. TGF-beta1-mediated hypertrophy involves inhibiting pRB phosphorylation by blocking activation of cyclin E kinase. The American journal of physiology 277, F186-194 (1999).
22. Choi, M.E., Kim, E.G., Huang, Q. & Ballermann, B.J. Rat mesangial cell hypertrophy in response to transforming growth factor-beta 1. Kidney Int 44, 948-958 (1993).
23. Dellago, H., et al. High levels of oncomiR-21 contribute to the senescence-induced growth arrest in normal human cells and its knock-down increases the replicative lifespan. Aging cell (2013).
24. Awazu, M., Omori, S., Ishikura, K., Hida, M. & Fujita, H. The lack of cyclin kinase inhibitor p27(Kip1) ameliorates progression of diabetic nephropathy. J Am Soc Nephrol 14, 699-708 (2003).
25. Wolf, G., et al. Glomerular expression of p27Kip1 in diabetic db/db mouse: role of hyperglycemia. Kidney Int 53, 869-879 (1998).
26. Zhang, Z., et al. MicroRNA-21 protects from mesangial cell proliferation induced by diabetic nephropathy in db/db mice. FEBS Lett 583, 2009-2014 (2009).
27. Lu, T.X., et al. MicroRNA-21 limits in vivo immune response-mediated activation of the IL-12/IFN-gamma pathway, Th1 polarization, and the severity of delayed-type hypersensitivity. J Immunol 187, 3362-3373 (2011).
28. Tesch, G.H. & Allen, T.J. Rodent models of streptozotocin-induced diabetic nephropathy. Nephrology 12, 261-266 (2007).
105
29. Zhang, H., et al. Podocyte-specific overexpression of GLUT1 surprisingly reduces mesangial matrix expansion in diabetic nephropathy in mice. Am J Physiol Renal Physiol 299, F91-98 (2010).
30. Cortes-Hernandez, J., et al. Murine glomerular mesangial cell uptake of apoptotic cells is inefficient and involves serum-mediated but complement-independent mechanisms. Clinical and experimental immunology 130, 459-466 (2002).
31. Mene, P. & Stoppacciaro, A. Isolation and propagation of glomerular mesangial cells. Methods Mol Biol 466, 3-17 (2009).
32. Pozarowski, P. & Darzynkiewicz, Z. Analysis of cell cycle by flow cytometry. Methods Mol Biol 281, 301-311 (2004).

106
Chapter IV
Linking disease-associated miRNA and disease-associated mRNA identifies
miRNA-mRNA interaction
Abstract
miRNAs regulate gene expression on a post-transcriptional level by binding to the
primary transcript of target genes, thereby repressing translation into protein and
facilitating degradation. Because experimental identification of target genes remains
challenging, different computational algorithms have been developed to predict
miRNA-mRNA interactions. Unfortunately, overlap between different algorithms
and prediction accuracy for specific cell types and disease contexts are poor.
Therefore, we developed a new algorithm to identify miRNA-mRNA interaction
based on associations of expression with disease clinical manifestation.
To test this algorithm, we used miRNA and mRNA expression data obtained from
the same micro-dissected glomeruli of kidney biopsies of American Indian patients
with DN (testing and validating cohorts, total n=48). The miRNA and mRNA
expression levels were correlated independently with patients’ urine albumin to
107
creatinine ratio (ACR). ACR-associated miRNAs and mRNAs were integrated with
two computational prediction algorithms and experimental results from
Photoactivatable-Ribonucleoside-Enhanced Crosslinking and Immunoprecipitation
(PAR-CLIP) RNA sequencing. We determined that among 10 miRNAs, which were
highly correlated with ACR (P < 0.0001, R > 0.6), 6 showed high expression in renal
glomeruli and are broadly conserved. 245 transcripts of protein-coding genes were
correlated with ACR (P < 0.0001, R > 0.4 or < -0.4). Among them, 25 transcripts had
been found to be candidate targets for at least one of the ACR-associated 6 miRNAs
by two prediction algorithms and PAR-CLIP RNA sequencing. We further determined
that overexpression of miR-200a repressed RALGPS2, SUPT6H and EXOC7 mRNA
levels and that the 3’UTR of EXOC7 is a sequence-dependent target of miR-200a.
We propose that integrating phenotype-associated miRNA and mRNA expression with
experimental and computational target identification methods facilitates
miRNA-mRNA interactions discovery.
108
Introduction
Mature miRNAs, with RNA-induced silencing complex (RISC), bind to
complementary sequences of mRNA 3’UTR to repress the mRNA expression at a
post-transcriptional level1,2. The exact repression mechanism, though explored, is still
unclear but it is involved in mRNA deadenylation, decapping and translational
ribosomal inhibition3,4. Lately, miRNAs have also been shown to bind to mRNA
5’UTR and coding region to repress the mRNA expression5-8. miRNA are critical in
maintaining normal cell physiology and regulating disease pathogenesis9,10. The
expression of miR-17-92 cluster targets hundreds of genes and is strongly associated
with oncogenic activity11. On the other hand, depletion of miR-17-92 in mice is
postnatal lethal and leads to cardiac and lung defects12. Therefore, a significant
number of studies have investigated the interaction and targeting between miRNAs
and mRNAs. To date, several algorithms are available to predict the targeting between
miRNAs and mRNAs, such as TargetScan13-15, which is based on the matched seed
sequences and conservative binding sites. MiRNAanda 16,17, which applies dynamic
programming alignment and thermodynamic calculation for complimentary binding
between miRNAs and mRNAs, is another commonly used application. However, the
false prediction rate for those prediction algorithms remains high18 and the number of
experimentally-verified targets is still low. For example, human miR-21 has only 42
109
validated target genes according to miRNAecord19, a resource of
experimentally-verified miRNA-target interaction, but it has 164 predicted targets in
Targetscan 13-15.
For that reason, many studies developed new approaches to explore miRNA-mRNA
interaction more than just sequence binding prediction. That includes MAGIA20,
which integrates miRNA-mRNA correlation from the expression data with
pre-existing prediction algorithms. The other tools apply new regression models21,22
or Bayesian inference23 to facilitate target genes searching. Nevertheless, it is still
unclear whether these approaches improve the preciseness to identify target genes or
determine the regulatory role of miRNA-mRNA interaction in disease progression.
Therefore, we developed an alternative approach to investigate miRNA-mRNA
interaction based on their associations with disease clinical manifestation.
We previously had identified miRNAs that exhibit high correlation with ACR, a
disease relevant outcome. We noticed that current knowledge about potential
functions of these miRNAs remains very limited and the number of potential target
genes predicted by computational algorithms is very large. To facilitate identification
of mechanisms regulated by ACR-associated miRNAs, we developed an in-silico
approach to link disease-associated miRNAs and disease-associated genes together,
based on the correlation with disease clinical manifestation, to uncover

110
disease-relevant target genes. With this approach, we identify miRNAs target genes as
well as the regulatory role of miRNA-mRNA interaction in disease progression.
111
Result
miRNAs correlate with proteinuria in human diabetic nephropathy
To identify miRNAs relevant for glomerular injury, we profiled the miRNA
expression from renal glomeruli of kidney biopsies of 48 American Indian DN
patients. To identify miRNAs with potential mechanistic relevance, we associated
glomerular miRNA expression levels with clinical relevant manifestations, such as
urine ACR or GFR in our cohorts. The participants exhibited a broad range of
proteinuria (quantified as ACR in μg/mg), while the mean GFR (iothalamate
clearance) was above 90 ml/min/1.73m2 (Table 4.1). Highly significant and positive
correlations with ACR were detected for 49 miRNAs out of 377 (P < 0.0001, R > 0.4).
Interestingly, none of the tested miRNAs exhibited significant negative correlation
with ACR. Moreover, we did not notice significant correlation between miRNAs and
GFR (P-value > 0.05 for all miRNAs). We listed the top 10 miRNAs, which had the
most positive correlation with ACR (Table 4.2). Because highly abundant miRNAs
are in general thought to be more likely to mediate significant target gene repression,
we ranked the miRNAs by their relative expression level in renal glomeruli and
identified the broadly-conserved miRNAs24,25. We chose 6 miRNAs, miR-21,
miR-135a, miR-200a, miR-218, miR-429, and miR-142-3p that are both
highly-expressed in renal glomeruli and broadly-conserved cross species to identify
112
miRNA-mediated mechanisms of DN.
Most miRNA-correlated genes are not predicted targets of miRNAs
To identify candidate miRNA-mRNA interaction, the mRNA from the same renal
glomeruli of kidney biopsies of the same American Indian cohorts was profiled. The
correlation analysis was performed between the 6 miRNAs and genes on the array.
Table 4.3 listed the top 10 genes that had the most negative correlation (R ranges from
-0.48 to -0.67) with each 6 miRNAs. Figure 4.1 illustrated the correlated connection
between miRNAs and genes. Among 44 top 10 miRNA-correlated genes, only
ANTXR2 and IFNAR1 (4.5%) are predicted as sequence-dependent targets of
miRNA218 and miRNA200a based on targetscan13-15, respectively. If we expand the
number up to the top 50 most miRNA-correlated genes, 7 out of 194 correlated genes
are targetscan predicted targets (3.6%), and among the top 100 most
miRNA-correlated genes, 19 out of 349 correlated genes are targetscan predicted
targets of the corresponding miRNA (5.4%).
ACR-correlated genes are ACR-correlated miRNAs’ predicted targets
To test our hypothesis that miRNA expression is driven by disease status to negatively
feedback the change of disease-associated genes. We correlated mRNA expression
113
with disease clinical manifestation, ACR. The result showed that 245 mRNAs
significantly correlated with ACR (R > 0.4 or R < -0.4, P < 0.0001). Among those 245
genes, 39 genes (16%) are the TargetScan-predicted targets for the previous chosen 6
miRNAs (Table 4.4). We additionally examined whether there were RNA read
clusters in those 39 genes 3’UTR by PAR-CLIP RNA sequencing in human
embryonic kidney (HEK) cells26. We also applied the second prediction algorithm,
miRNAanda16,17, to further verify the possible miRNAs’ targets. We found that 25 out
of the 39 genes had RNA read clusters in 3’UTR and at the same are predicted as the
corresponding miRNA’s targets in miRNAanda. Figures 4.2 illustrated the target
predictions between the chosen 6 ACR-correlated miRNAs and ACR-correlated genes
that both have RNA read clusters in 3’UTR and are predicted targets of the
corresponding miRNA’s by two prediction algorithms, TargetScan and miRNAanda.
We regarded those 25 genes as the most likely targets of the corresponding miRNAs
and the interaction with miRNAs might play a role in disease progression.
To further understand the relationship between those 25 genes and their predicted
miRNAs, we examined their associations from the miRNA and mRNA expression
data by Pearson correlation (Table 4.5). The result showed that the correlation
between the most likely targets and their predicted miRNAs was moderate (R ranges
from -0.17 to -0.45 and 0.05 to 0.37) and less than 50% of the correlation was

114
significant (P < 0.05). Moreover, the 25 genes did not rank high according to the most
negative or positive correlation.
miR-200a has repression effect on SUPT6H and EXOC7
miR-200a is known to regulate epithelial-mesenchymal transition (EMT)27 and is
implicative to protect against DN28. To verify the potential targets that were identified
by linking ACR-correlated miRNAs and genes, we proceeded to demonstrate the
targeting between miR-200a and its potential targets. Among miR-200a potential
targets, we chose the top 3 most positively-correlated genes, RALGPS2, LYPD6,
AGPS, and top 3 most negatively-correlated genes, NFASC, SUPT6H, EXOC7, to
perform the experimental validation.
To identify a suitable cell system to test candidate miR-200a target genes, we first
examined the endogenous miR-200a level in different cells. Our qrt-PCR result
showed that HEK cells had very low endogenous miR-200a compared to podocyte
and renal proximal tubular cell lines (Figure 4.3). ZEB2 is a known target of
miR-200a27. Consequently, we measured ZEB2, RALGPS2, LYPD6, AGPS, SUPT6H,
EXOC7, and NFASC mRNA level by transfecting miR-200a mimic into HEK cells.
The qrt-PCR result revealed that the miR-200a mimic-transfected HEK cells had
significantly lower ZEB2, RALGPS2, SUPT6H and EXOC7 level compared to the
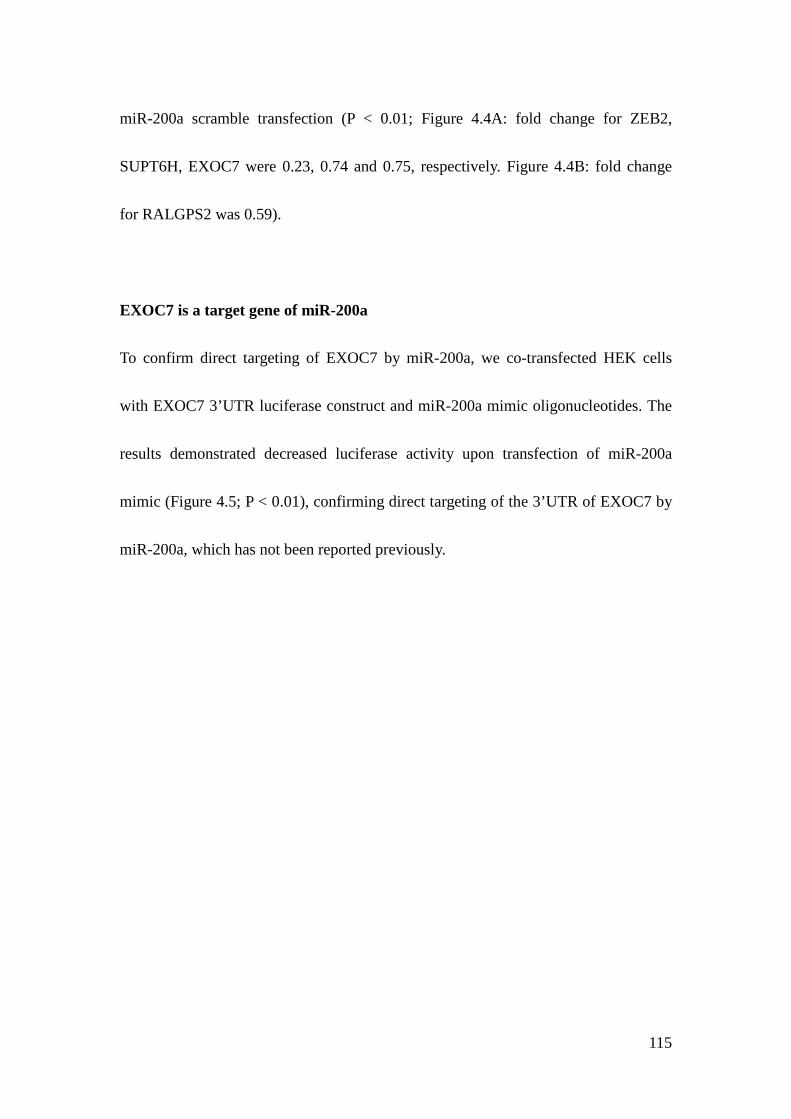
115
miR-200a scramble transfection (P < 0.01; Figure 4.4A: fold change for ZEB2,
SUPT6H, EXOC7 were 0.23, 0.74 and 0.75, respectively. Figure 4.4B: fold change
for RALGPS2 was 0.59).
EXOC7 is a target gene of miR-200a
To confirm direct targeting of EXOC7 by miR-200a, we co-transfected HEK cells
with EXOC7 3’UTR luciferase construct and miR-200a mimic oligonucleotides. The
results demonstrated decreased luciferase activity upon transfection of miR-200a
mimic (Figure 4.5; P < 0.01), confirming direct targeting of the 3’UTR of EXOC7 by
miR-200a, which has not been reported previously.
116
Discussion
In this study, we identified miRNAs and mRNAs in renal glomeruli that exhibit
significant correlation with ACR in patients with DN. We further discovered that
many ACR-correlated genes are predicted targets of ACR-correlated miRNAs by two
different prediction algorithms and PAR-CLIP RNA sequencing. We verified that
EXOC7 are the sequence-dependent target of miR-200a, and RALGPS2 and SUPT6H
are regulated by miR-200a. This approach, linking miRNAs and genes by their
associations with disease status, provide an alternative way to identify miRNA target
genes.
Among the top 10 miRNAs that had the most positive correlation with ACR, 6 were
highly-expressed in renal glomeruli and broadly conserved. Some of the significant
miRNAs were widely studied in cancer biology. For instance, miR-135a promotes
growth and migration of cancer cells29,30, while miR-218 limits the invasiveness of
cancer cells31, and miR-142-3p regulates myeloid differentiation and leukemia
development32. Nevertheless, there are miRNAs related to kidney diseases, such as
miR-21, which plays a role in renal fibrosis33,34. Furthermore, our previous study
showed that miR-21 protects against TGFβ-related renal glomerulopathy. In addition,
miR-200a and miR-429, which all belong to the miR-200 family, have been shown to
regulate EMT and prevent renal fibrosis27,28.
117
To identify the target genes of ACR-correlated miRNAs, we correlated the miRNA
and mRNA expression from the same samples. Interestingly, we did not find many
predicted targets from the negative correlation of mRNAs with miRNAs (Table 4.3).
We further correlated genes with ACR, and unexpectedly found that many
ACR-correlated genes (both positive and negative correlation) are the predicted
targets of the ACR-correlated miRNAs (Table 4.4). However, we also noticed that the
correlations between the ACR-correlated miRNAs and their target-predicted
ACR-correlated genes are less significant (Table 4.5). As studies have observed that
miRNAs can form negative feedback loop in the signaling pathway35,36, miRNAs
might go up with disease progression as an attempt to limit the disease damage. Under
this concept, for the miRNA-targeted genes that increase with disease progression
(positive correlation with ACR), miRNAs will also increase as an attempt to repress
the upregulation. For that reason, we observed many ACR positively-correlated genes
are predicted targets of miRNAs (Table 4.4). However, due to the negative feedback
cannot completely reverse the original change, we did not detect significant negative
correlation between miRNAs and their targets from miRNAs and mRNA expression
data (Table 4.5).
We additionally noticed that many ACR negatively-correlated genes are also predicted
targets of miRNAs (Table 4.4). Based on this observation, we proposed another
118
mechanism that genes decrease as a consequence of progression of disease. This
concept suggests that miRNAs mediate additional gene repression. This positive
enforcement regulation loop was also observed in previous studies36. Due to the
negatively-correlated genes are directly driven by the disease itself and miRNAs
targeting only contributes to additional repression, we did not detect very significant
negative correlation between the ACR-correlated miRNAs and their predicted targets,
which are negatively correlated with ACR. Importantly, we did not detect miRNAs
that were negatively correlated with ACR. This is consistent with our hypotheses that
miRNAs increase with disease progression to limit disease-upregulated genes or
miRNAs increase with disease progression to further repress the
disease-downregualted genes.
Since miR-200a is highly correlated with ACR and together with miR-429, which also
belongs to miR-200 sequence family, suppresses EMT to protect against renal
fibrosis27,28, we chose miR-200a to verify the finding from linking the ACR-correlated
miRNAs and ACR-correlated genes. Among 245 genes, which are associated with
ACR, 10 of them are the targetscan-predicted targets of miR-200a (Table 4.4). The
basic functions of those genes were studied. NFASC (neurofascin) is a cell adhesion
molecule, which links extracellular matrix to the intracellular cytoskeleton, and plays
a role in neuron growth during development37. EXOC7 (exocyst complex component
119
7) is the component of exocytosis complex and it is involved in the docking of
exocytic vesicles with fusion sites on the plasma membrane38. EXOC7 is required for
targeting glucose transporter 4 (Glut4) to the plasma membrane in response to
insulin39. RALGPS2 (Guanine nucleotide exchange factor for the small GTPase
RALA) plays a role in cytoskeleton organization40. In addition, SUPT6H (suppressor
of Ty 6 homolog), ZNF629 and ZNF793 (zinc finger protein) regulates gene
translation41,42. Although these genes have not been broadly studied in DN, the new
miRNA-mRNA interactions we are proposing here bring a new prospect to DN
disease mechanism. Exocytosis forms the basis of the delivery of secretory proteins
and intracellular signaling, such as insulin secretion as well as the cellular response to
inuslin43. Reduced insulin exocytosis in human pancreatic β cells is related type 2
diabetes44 and diabetes also affects the ability of exocytosis in other cells45.
Furthermore, Exocytosis is involved in aquaporin 2 water channel activity in renal
collecting tubule46 and has a role in renal ischemia-reperfusion injury47. Our result,
which showed EXOC7 being the target of miR-200a, provides additional evidence
that miR-200a and exocytosis might play an important role in DN, and it urges
additional studies to explore these intriguing findings.
Despite our result that miR-200a regulates SUPT6H and EXOC7, compared to the
well-known target of miR-200a, ZEB227, the repression effect of miR-200a on
120
EXOC7 and SUPT6H seems marginal (fold change ≈ 0.7; Figure 4.4A). Nevertheless,
miRNAs can have tuning interactions with genes to marginally repress the protein to
the target level1. For example, miR-375 targets myotrophin to lower its level to an
optimal level but still remains functional for insulin secretion48. miR-8 in Drosophila
reduces atrophin to a level to prevent neurodegeneration without compromising
viability49.
Our concepts that miRNAs increase with disease progression to limit gene
upregulation or to further repress gene downregulation can effectively narrow down
the potential miRNA targets among hundreds of candidates. Nevertheless, our method
to link disease-associated miRNA and disease-associated mRNA needs to be
accompanied by prediction algorithms or other supporting experiments, such as
PAR-CLIP RNA sequencing. Therefore, to effectively identify miRNA’s
sequence-dependent targets, we proposed creating a ranking system by using disease
associations with miRNAs and mRNA plus prediction algorithms and the interaction
with AGO proteins.
In summary, we have shown linking disease-associated miRNAs and
disease-associated mRNA by target prediction is an alternative way to identify
miRNA-mRNA interaction. The findings that miR-200a targets EXOC7 and other
genes open up potential disease mechanisms to be explored in the future.
121
Methods and Materials
Study Subjects. The kidney biopsy samples had been collected from enrolled
participants in a randomized, placebo-controlled, clinical trial (ClinicalTrials.gov No.
NCT00340678) as the previous chapter described50. Urinary albumin and creatinine
as well as iothalamate concentrations for GFR determination were measured as
described51 and values of the examination closest to the kidney biopsy were used in
the present analyses. This study was approved by the Review Board of the National
Institute of Diabetes and Digestive and Kidney Diseases. Each participant gave
informed consent.
miRNA expression analysis. miRNA profiling was obtained using TaqMan miRNA
assays (Applied Biosystems) as described52. In brief, small RNA fraction (<200 nt)
was isolated from micro-dissected glomeruli using RNeasy® and MinElute®
Cleanup kits (Qiagen) and reverse transcribed using TaqMan Megaplex RT primers
(Applied Biosystems). Human glomerular small RNA was amplified by Megaplex
PreAmp primers (Applied Biosystems). TaqMan array human and rodent miRNA ‘A’
cards (Applied Biosystems) were used to obtain miRNA profiles according to the
manufacturer’s protocol. miRNA expression values, threshold cycle (CT), were
normalized by U6 small nuclear RNA (snRNA), and RNU44 and RNU48 small

122
nucleolar RNA (snoRNA). Delta cycle time (ΔCT) was calculated by subtracting
miRNAs’ CT from geometric mean of snRNA’s and snoRNA’s CT. Expression level
in arbitrary units were calculated from 2 to the power of delta cycle time (2ΔΔCT).
mRNA microarray and analysis. Total RNA was isolated from micro-dissected
glomeruli of kidney biopsy according to a protocol, which was described before53.
The total RNA was reverse-transcribed and linearly amplified to be applied to
Affymetrix HG-U133A microarray. The fragmentation, hybridization, staining and
imaging were performed by the Affymetrix Expression Analysis Technical Manual.
The microarray analysis was described before and Robust Multichip Average (RMA)
was used to normalize the data54.
Batch correction. Our study cohort consisted of one testing cohort (N=22) and one
validating cohort (N=26). Subjects of both cohorts tested in this study were pulled
from the same pool of participants of the American Indian study. In order to increase
analysis power, we combined miRNA or mRNA expression data from two cohorts to
increase sample size (total subjects = 48). We applied ComBat55, a method of
combining batches of gene expression microarray data, to adjust the batch effects.
123
Correlation analysis. Pearson correlation was performed in the correlation analysis.
miRNA ΔCT was correlated with mRNA hybridization log2 transformed intensity,
mRNA hybridization log2 transformed intensity was correlated with patient’s urine
albumin-creatinine ratio (ACR), and arbitrary fold change of miRNAs, which was
calculated from 2 to the power of ΔCT, was correlated with patient’s ACR.
Photoactivatable Ribonucleoside Enhanced Crosslinking and
Immunoprecipitation (PAR-CLIP). Argonaute proteins (AGO) 1-4, which are the
component of RISC and bind to both miRNAs and mRNA, were
immunoprecipitated to examine the binding RNA fragments. The PAR-CLIP method
was used and described as previous26. In brief, HEK cells stably expressing
FLAG/HA-tagged AGO1-4 were grown overnight in the medium supplemented with
100 μM 4-thiouridine (4-SU), which is photoactivatable nucleosides. The living
cells were irradiated with 365 nm UV light to introduce crosslinking between the
AGO1-4 and RNA. Then, the AGO 1-4 were immunoprecipitated and the binding
RNA with the AGO1-4 was recovered to cDNA library to be Solexa deep sequenced.
miRNA transfection. miR-200a mimic oligonucleotides (Thermo Scientific
Dhamacon miRNAIDIAN microRNA Mimics) were applied with Lipofectamine®
124
RNAiMAX Reagent (Invitrogen) to transfect HEK cells. The cell transfection was
processed per manufacturer’s protocol.
Quantitative real-time PCR. Qrt-PCR for measuring mRNA levels were conducted
using TaqMan validated primers and probe sets (Applied Biosystem), according to
manufacturer’s protocols, on an ABI 7900HT real-time PCR system.
Luciferase reporter assays. The full length EXOC7 3’UTR was constructed with
firefly luciferase (abm, BC, Canada). The 3’UTR vector, Renilla luciferase plasmid,
and miR-200a mimic oligonucleotides were co-transfected into HEK cells using
lipofectamine LTX and plus reagents (Invitrogen). Luciferase activity was measured
48 hours after transfection in luciferase assay plate reader.
Statistical analysis. The correlation analysis and significance was determined by
Pearson correlation and R script was used. T-test was used to compare mRNA level
and luciferase activity between miR-200a mimic and scramble transfection.

125
Table 4.1. Characteristics of American Indian cohort
American Indian
No. of subject 48
Age: Mean (SD) 44.4 (10.2)
Gender: % of female 81%
GFR: Mean (SD) 149.2 (50.6)
ACR: Mean (SD) 358.7 (1151.8)
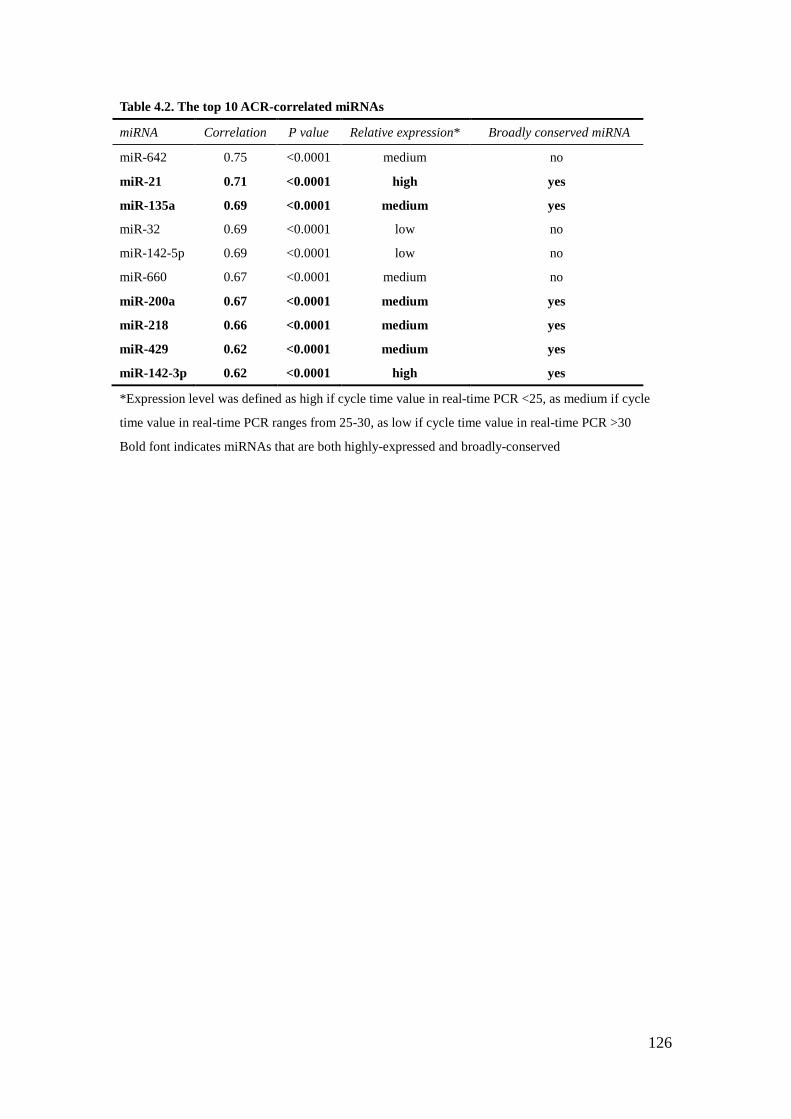
126
Table 4.2. The top 10 ACR-correlated miRNAs
miRNA Correlation P value Relative expression* Broadly conserved miRNA
miR-642 0.75 <0.0001 medium no
miR-21 0.71 <0.0001 high yes
miR-135a 0.69 <0.0001 medium yes
miR-32 0.69 <0.0001 low no
miR-142-5p 0.69 <0.0001 low no
miR-660 0.67 <0.0001 medium no
miR-200a 0.67 <0.0001 medium yes
miR-218 0.66 <0.0001 medium yes
miR-429 0.62 <0.0001 medium yes
miR-142-3p 0.62 <0.0001 high yes
*Expression level was defined as high if cycle time value in real-time PCR <25, as medium if cycle
time value in real-time PCR ranges from 25-30, as low if cycle time value in real-time PCR >30
Bold font indicates miRNAs that are both highly-expressed and broadly-conserved
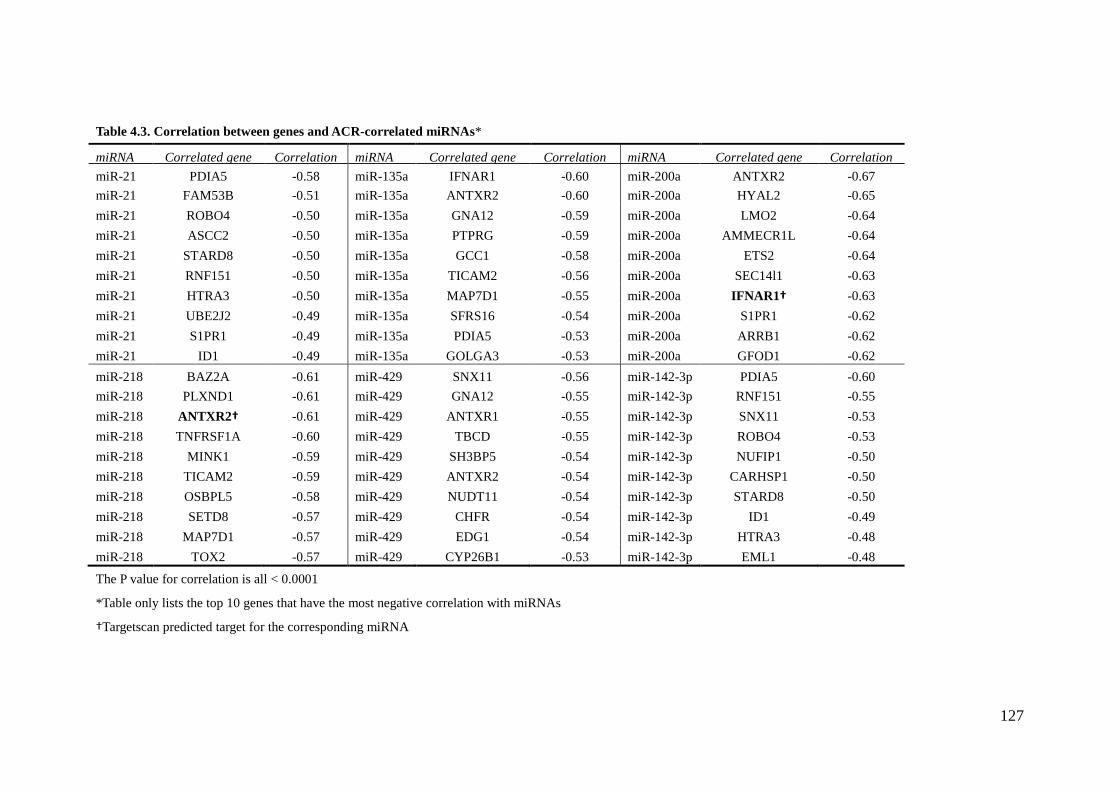
127
Table 4.3. Correlation between genes and ACR-correlated miRNAs*
miRNA Correlated gene Correlation miRNA Correlated gene Correlation miRNA Correlated gene Correlation miR-21 PDIA5 -0.58 miR-135a IFNAR1 -0.60 miR-200a ANTXR2 -0.67 miR-21 FAM53B -0.51 miR-135a ANTXR2 -0.60 miR-200a HYAL2 -0.65 miR-21 ROBO4 -0.50 miR-135a GNA12 -0.59 miR-200a LMO2 -0.64 miR-21 ASCC2 -0.50 miR-135a PTPRG -0.59 miR-200a AMMECR1L -0.64 miR-21 STARD8 -0.50 miR-135a GCC1 -0.58 miR-200a ETS2 -0.64 miR-21 RNF151 -0.50 miR-135a TICAM2 -0.56 miR-200a SEC14l1 -0.63 miR-21 HTRA3 -0.50 miR-135a MAP7D1 -0.55 miR-200a IFNAR1† -0.63 miR-21 UBE2J2 -0.49 miR-135a SFRS16 -0.54 miR-200a S1PR1 -0.62 miR-21 S1PR1 -0.49 miR-135a PDIA5 -0.53 miR-200a ARRB1 -0.62 miR-21 ID1 -0.49 miR-135a GOLGA3 -0.53 miR-200a GFOD1 -0.62 miR-218 BAZ2A -0.61 miR-429 SNX11 -0.56 miR-142-3p PDIA5 -0.60 miR-218 PLXND1 -0.61 miR-429 GNA12 -0.55 miR-142-3p RNF151 -0.55 miR-218 ANTXR2† -0.61 miR-429 ANTXR1 -0.55 miR-142-3p SNX11 -0.53 miR-218 TNFRSF1A -0.60 miR-429 TBCD -0.55 miR-142-3p ROBO4 -0.53 miR-218 MINK1 -0.59 miR-429 SH3BP5 -0.54 miR-142-3p NUFIP1 -0.50 miR-218 TICAM2 -0.59 miR-429 ANTXR2 -0.54 miR-142-3p CARHSP1 -0.50 miR-218 OSBPL5 -0.58 miR-429 NUDT11 -0.54 miR-142-3p STARD8 -0.50 miR-218 SETD8 -0.57 miR-429 CHFR -0.54 miR-142-3p ID1 -0.49 miR-218 MAP7D1 -0.57 miR-429 EDG1 -0.54 miR-142-3p HTRA3 -0.48 miR-218 TOX2 -0.57 miR-429 CYP26B1 -0.53 miR-142-3p EML1 -0.48
The P value for correlation is all < 0.0001
*Table only lists the top 10 genes that have the most negative correlation with miRNAs
†Targetscan predicted target for the corresponding miRNA
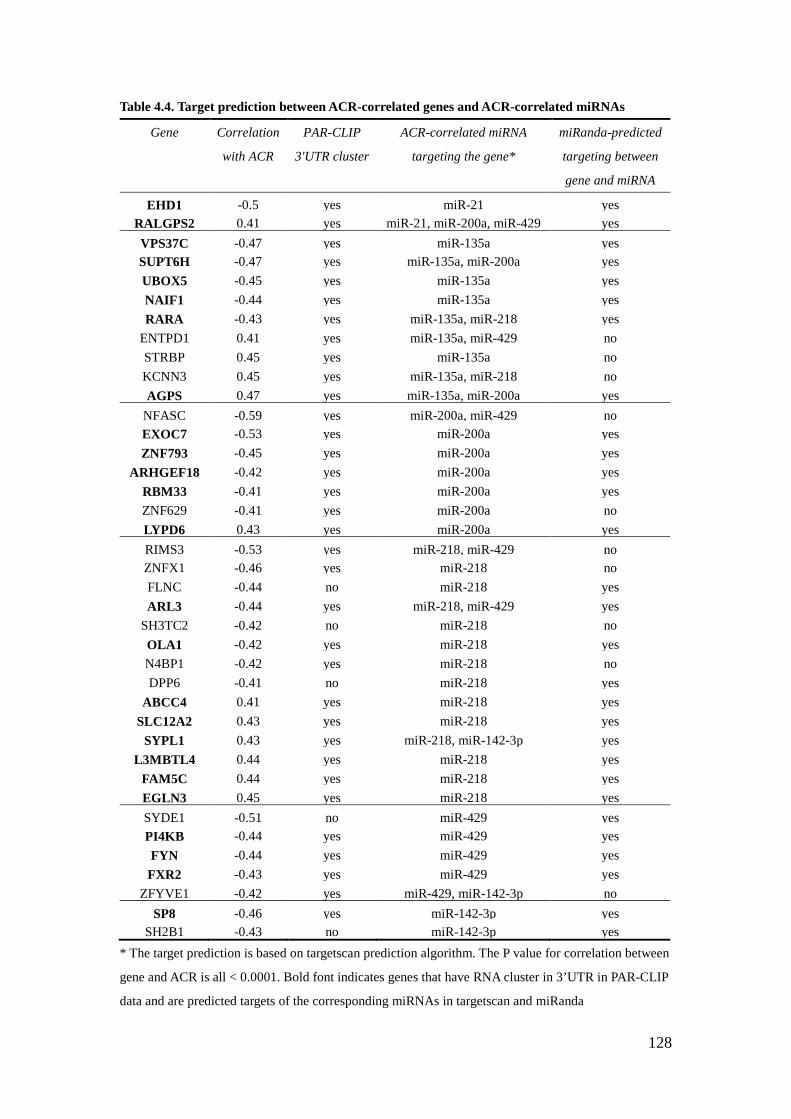
128
Table 4.4. Target prediction between ACR-correlated genes and ACR-correlated miRNAs
Gene Correlation
with ACR
PAR-CLIP
3'UTR cluster
ACR-correlated miRNA
targeting the gene*
miRanda-predicted
targeting between
gene and miRNA
EHD1 -0.5 yes miR-21 yes RALGPS2
0.41
yes miR-21, miR-200a, miR-429 yes VPS37C -0.47 yes miR-135a yes SUPT6H -0.47 yes miR-135a, miR-200a yes UBOX5 -0.45 yes miR-135a yes NAIF1 -0.44 yes miR-135a yes RARA -0.43 yes miR-135a, miR-218 yes
ENTPD1
0.41
yes miR-135a, miR-429 no STRBP
0.45
yes miR-135a no KCNN3
0.45
yes miR-135a, miR-218 no AGPS
0.47
yes miR-135a, miR-200a yes NFASC -0.59 yes miR-200a, miR-429 no EXOC7 -0.53 yes miR-200a yes ZNF793 -0.45 yes miR-200a yes
ARHGEF18 -0.42 yes miR-200a yes RBM33 -0.41 yes miR-200a yes ZNF629 -0.41 yes miR-200a no LYPD6
0.43
yes miR-200a yes RIMS3 -0.53 yes miR-218, miR-429 no ZNFX1 -0.46 yes miR-218 no FLNC -0.44 no miR-218 yes ARL3 -0.44 yes miR-218, miR-429 yes
SH3TC2 -0.42 no miR-218 no OLA1 -0.42 yes miR-218 yes N4BP1 -0.42 yes miR-218 no DPP6 -0.41 no miR-218 yes
ABCC4
0.41
yes miR-218 yes SLC12A2
0.43
yes miR-218 yes SYPL1
0.43
yes miR-218, miR-142-3p yes L3MBTL4
0.44
yes miR-218 yes FAM5C
0.44
yes miR-218 yes EGLN3
0.45
yes miR-218 yes SYDE1 -0.51 no miR-429 yes PI4KB -0.44 yes miR-429 yes FYN -0.44 yes miR-429 yes
FXR2 -0.43 yes miR-429 yes ZFYVE1 -0.42 yes miR-429, miR-142-3p no
SP8 -0.46 yes miR-142-3p yes SH2B1 -0.43 no miR-142-3p yes
* The target prediction is based on targetscan prediction algorithm. The P value for correlation between
gene and ACR is all < 0.0001. Bold font indicates genes that have RNA cluster in 3’UTR in PAR-CLIP
data and are predicted targets of the corresponding miRNAs in targetscan and miRanda
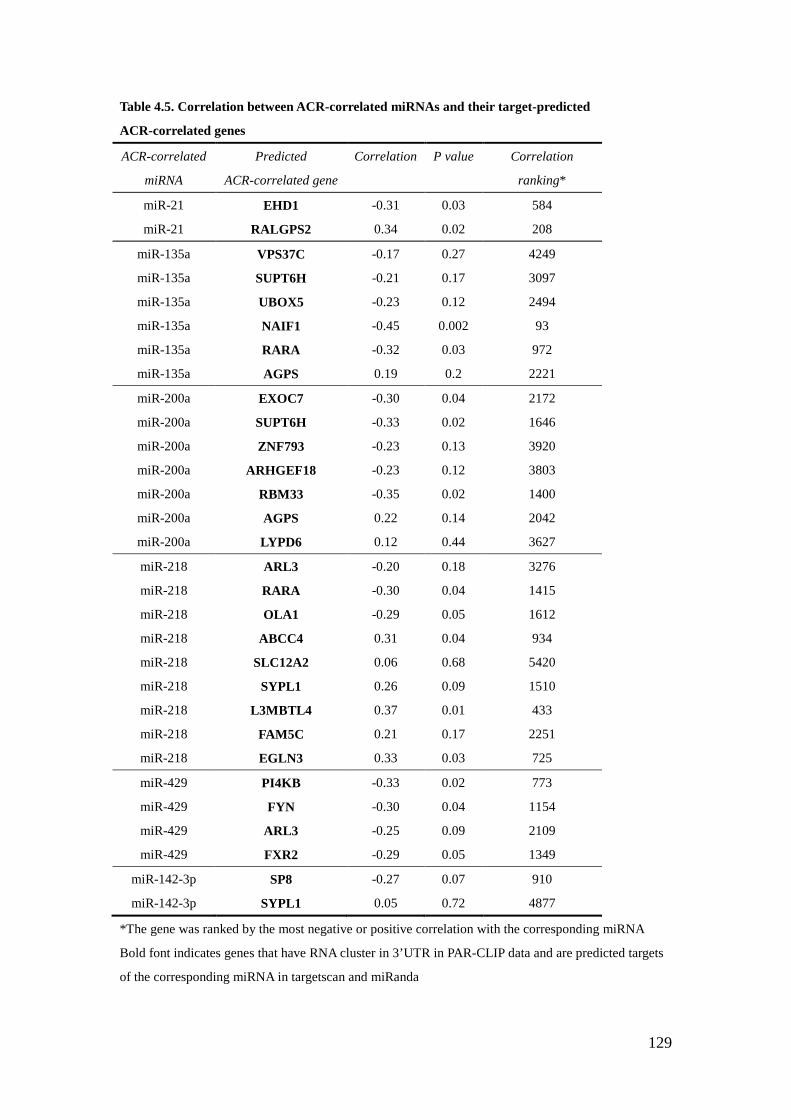
129
Table 4.5. Correlation between ACR-correlated miRNAs and their target-predicted
ACR-correlated genes
ACR-correlated
miRNA
Predicted
ACR-correlated gene
Correlation P value Correlation
ranking*
miR-21 EHD1 -0.31 0.03 584
miR-21 RALGPS2 0.34 0.02 208
miR-135a VPS37C -0.17 0.27 4249
miR-135a SUPT6H -0.21 0.17 3097
miR-135a UBOX5 -0.23 0.12 2494
miR-135a NAIF1 -0.45 0.002 93
miR-135a RARA -0.32 0.03 972
miR-135a AGPS 0.19 0.2 2221
miR-200a EXOC7 -0.30 0.04 2172
miR-200a SUPT6H -0.33 0.02 1646
miR-200a ZNF793 -0.23 0.13 3920
miR-200a ARHGEF18 -0.23 0.12 3803
miR-200a RBM33 -0.35 0.02 1400
miR-200a AGPS 0.22 0.14 2042
miR-200a LYPD6 0.12 0.44 3627
miR-218 ARL3 -0.20 0.18 3276
miR-218 RARA -0.30 0.04 1415
miR-218 OLA1 -0.29 0.05 1612
miR-218 ABCC4 0.31 0.04 934
miR-218 SLC12A2 0.06 0.68 5420
miR-218 SYPL1 0.26 0.09 1510
miR-218 L3MBTL4 0.37 0.01 433
miR-218 FAM5C 0.21 0.17 2251
miR-218 EGLN3 0.33 0.03 725
miR-429 PI4KB -0.33 0.02 773
miR-429 FYN -0.30 0.04 1154
miR-429 ARL3 -0.25 0.09 2109
miR-429 FXR2 -0.29 0.05 1349
miR-142-3p SP8 -0.27 0.07 910
miR-142-3p SYPL1 0.05 0.72 4877
*The gene was ranked by the most negative or positive correlation with the corresponding miRNA
Bold font indicates genes that have RNA cluster in 3’UTR in PAR-CLIP data and are predicted targets
of the corresponding miRNA in targetscan and miRanda
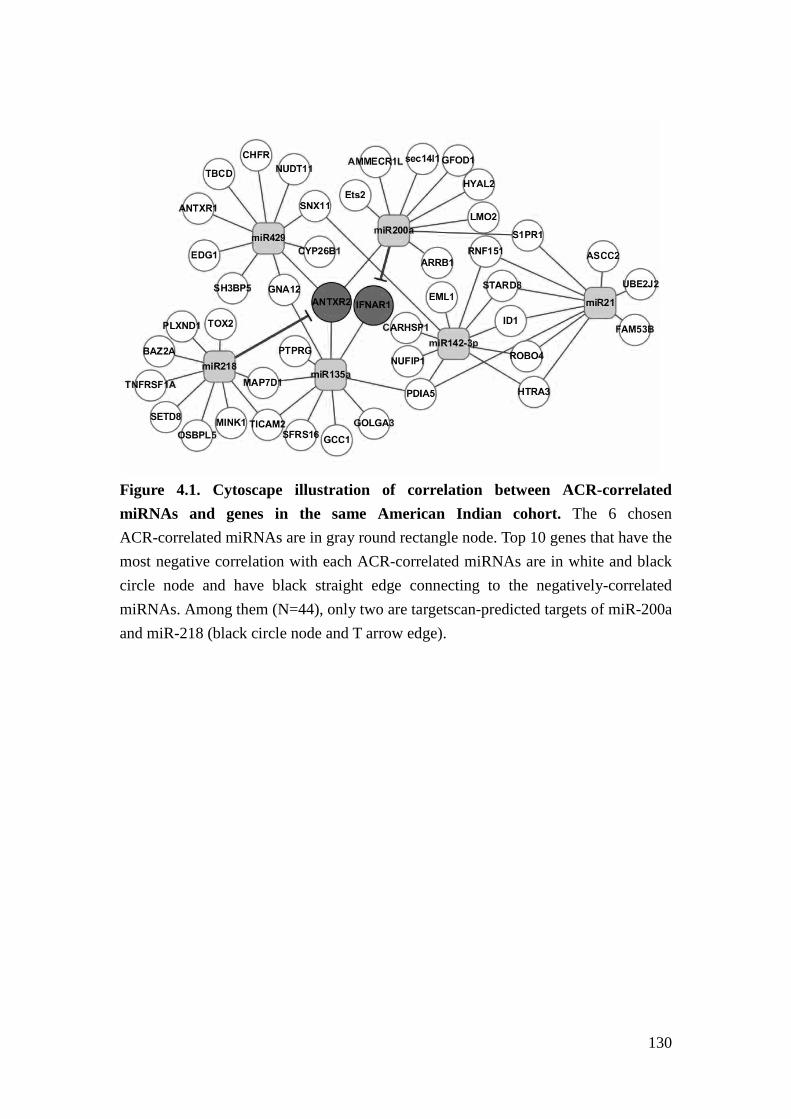
130
Figure 4.1. Cytoscape illustration of correlation between ACR-correlated miRNAs and genes in the same American Indian cohort. The 6 chosen ACR-correlated miRNAs are in gray round rectangle node. Top 10 genes that have the most negative correlation with each ACR-correlated miRNAs are in white and black circle node and have black straight edge connecting to the negatively-correlated miRNAs. Among them (N=44), only two are targetscan-predicted targets of miR-200a and miR-218 (black circle node and T arrow edge).
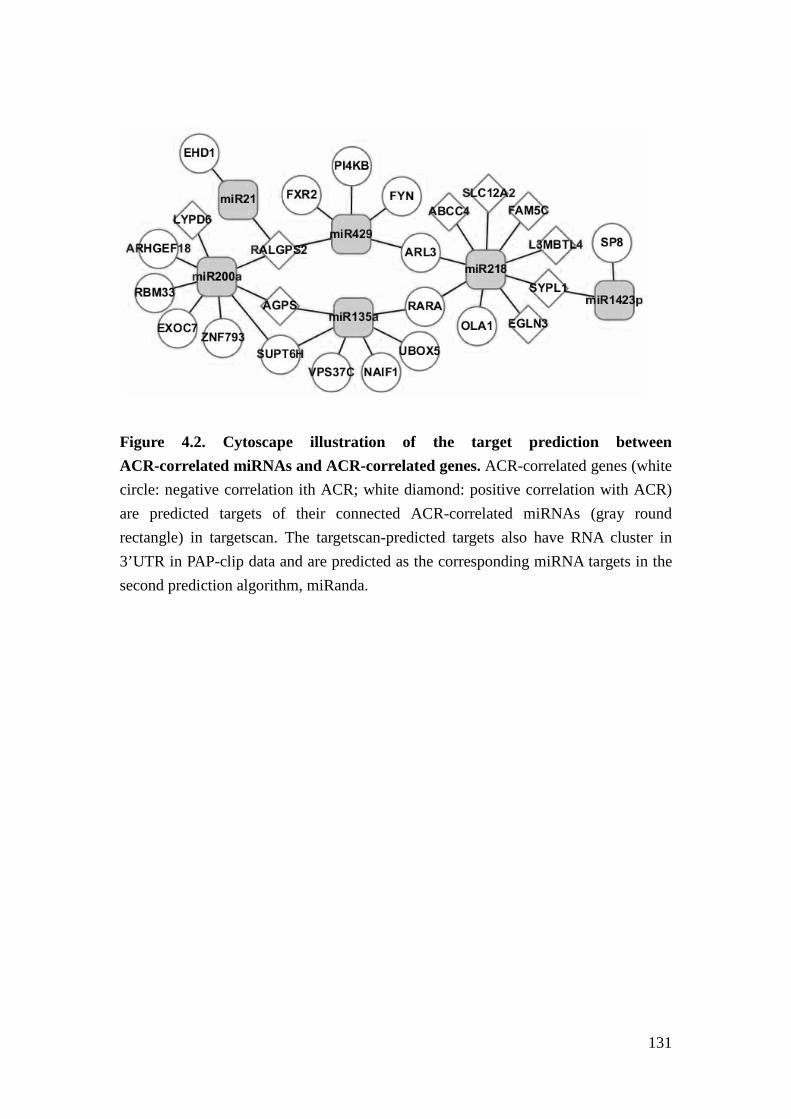
131
Figure 4.2. Cytoscape illustration of the target prediction between ACR-correlated miRNAs and ACR-correlated genes. ACR-correlated genes (white circle: negative correlation ith ACR; white diamond: positive correlation with ACR) are predicted targets of their connected ACR-correlated miRNAs (gray round rectangle) in targetscan. The targetscan-predicted targets also have RNA cluster in 3’UTR in PAP-clip data and are predicted as the corresponding miRNA targets in the second prediction algorithm, miRanda.
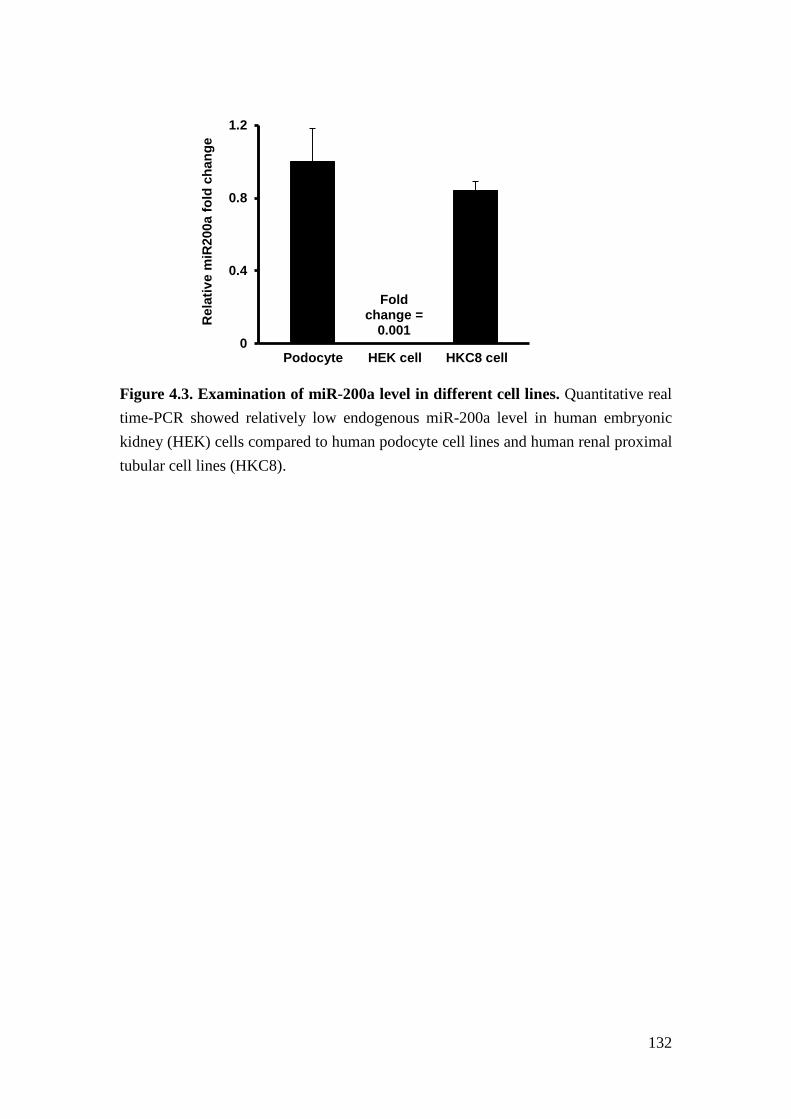
132
Figure 4.3. Examination of miR-200a level in different cell lines. Quantitative real time-PCR showed relatively low endogenous miR-200a level in human embryonic kidney (HEK) cells compared to human podocyte cell lines and human renal proximal tubular cell lines (HKC8).
Fold change =
0.001 0
0.4
0.8
1.2
Rel
ativ
e m
iR20
0a fo
ld c
hang
e
Podocyte
HEK cell
HKC8 cell
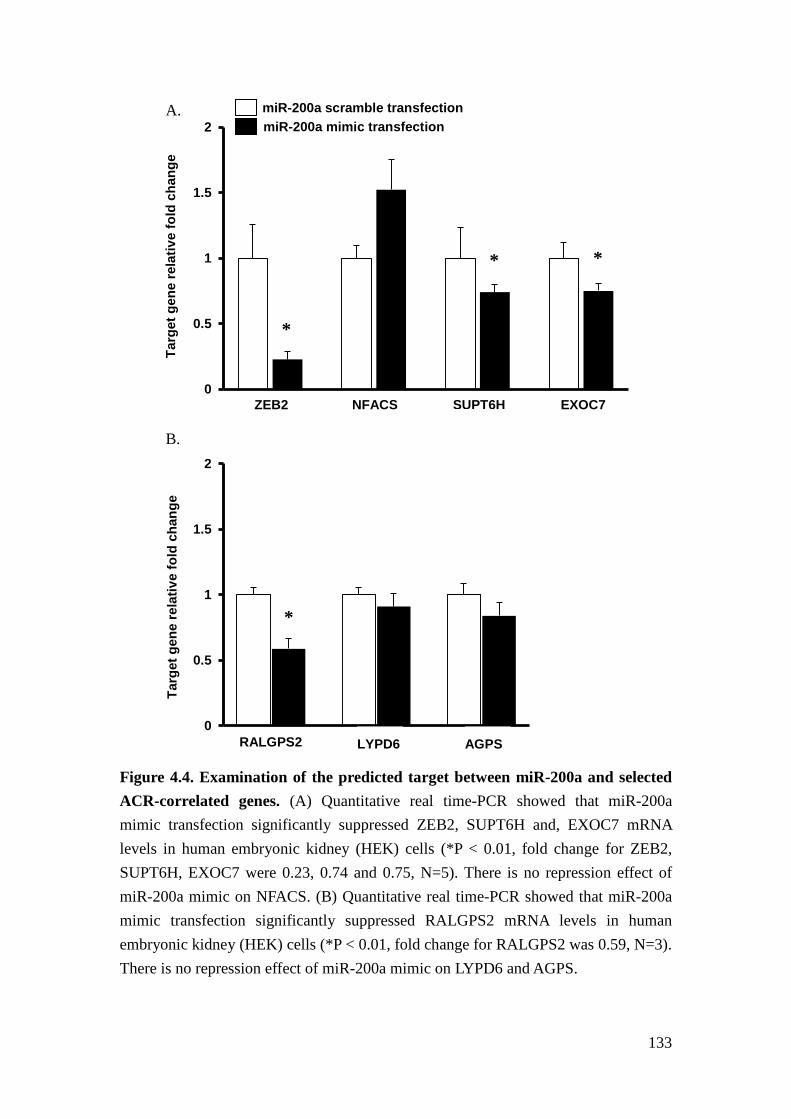
133
Figure 4.4. Examination of the predicted target between miR-200a and selected ACR-correlated genes. (A) Quantitative real time-PCR showed that miR-200a mimic transfection significantly suppressed ZEB2, SUPT6H and, EXOC7 mRNA levels in human embryonic kidney (HEK) cells (*P < 0.01, fold change for ZEB2, SUPT6H, EXOC7 were 0.23, 0.74 and 0.75, N=5). There is no repression effect of miR-200a mimic on NFACS. (B) Quantitative real time-PCR showed that miR-200a mimic transfection significantly suppressed RALGPS2 mRNA levels in human embryonic kidney (HEK) cells (*P < 0.01, fold change for RALGPS2 was 0.59, N=3). There is no repression effect of miR-200a mimic on LYPD6 and AGPS.
0
0.5
1
1.5
2
Targ
et g
ene
rela
tive
fold
cha
nge
A. miR-200a scramble transfection miR-200a mimic transfection
ZEB2
NFACS
SUPT6H
EXOC7
0
0.5
1
1.5
2
Targ
et g
ene
rela
tive
fold
cha
nge
B.
RALGPS2 LYPD6 AGPS
*
*
*
*
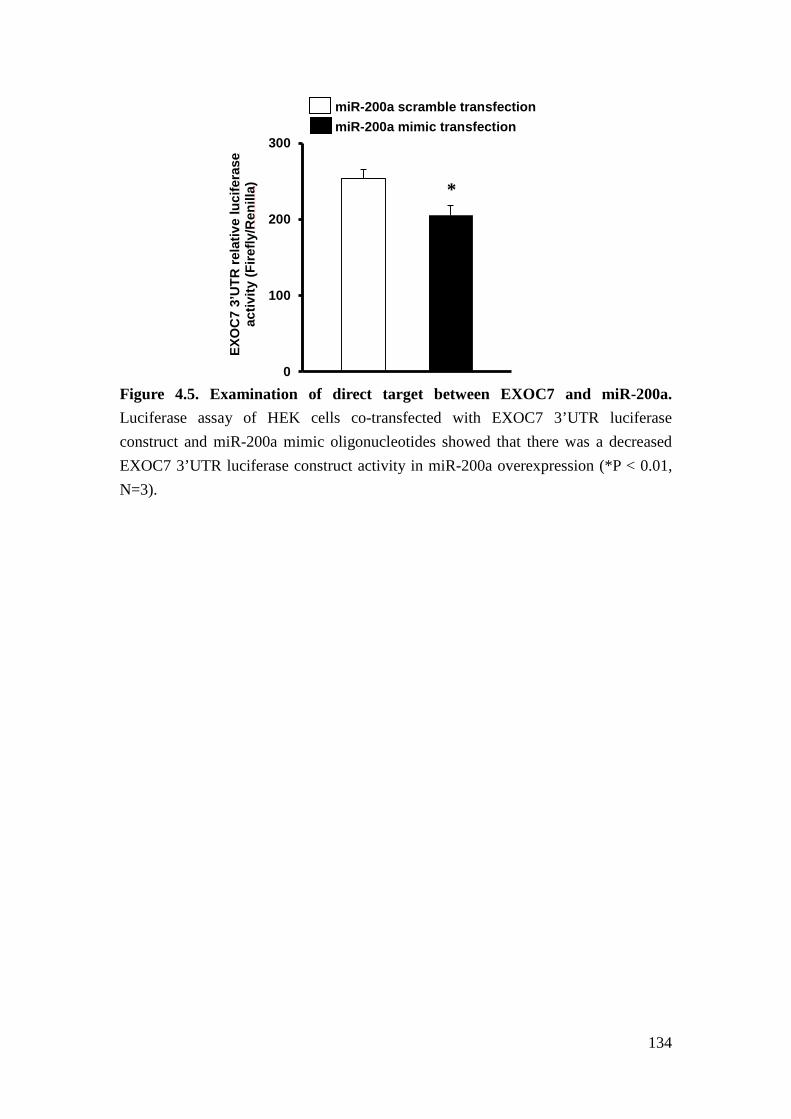
134
Figure 4.5. Examination of direct target between EXOC7 and miR-200a. Luciferase assay of HEK cells co-transfected with EXOC7 3’UTR luciferase construct and miR-200a mimic oligonucleotides showed that there was a decreased EXOC7 3’UTR luciferase construct activity in miR-200a overexpression (*P < 0.01, N=3).
0
100
200
300
EXO
C7
3’U
TR re
lativ
e lu
cife
rase
ac
tivity
(Fire
fly/R
enill
a)
miR-200a scramble transfection miR-200a mimic transfection
*
135
Reference
1. Bartel, D.P. MicroRNAs: target recognition and regulatory functions. Cell 136, 215-233 (2009).
2. Kusenda, B., Mraz, M., Mayer, J. & Pospisilova, S. MicroRNA biogenesis, functionality and cancer relevance. Biomed Pap Med Fac Univ Palacky Olomouc Czech Repub 150, 205-215 (2006).
3. Filipowicz, W., Bhattacharyya, S.N. & Sonenberg, N. Mechanisms of post-transcriptional regulation by microRNAs: are the answers in sight? Nature reviews. Genetics 9, 102-114 (2008).
4. Shukla, G.C., Singh, J. & Barik, S. MicroRNAs: Processing, Maturation, Target Recognition and Regulatory Functions. Molecular and cellular pharmacology 3, 83-92 (2011).
5. Lytle, J.R., Yario, T.A. & Steitz, J.A. Target mRNAs are repressed as efficiently by microRNA-binding sites in the 5' UTR as in the 3' UTR. Proc Natl Acad Sci U S A 104, 9667-9672 (2007).
6. Ajay, S.S., Athey, B.D. & Lee, I. Unified translation repression mechanism for microRNAs and upstream AUGs. BMC genomics 11, 155 (2010).
7. Tay, Y., Zhang, J., Thomson, A.M., Lim, B. & Rigoutsos, I. MicroRNAs to Nanog, Oct4 and Sox2 coding regions modulate embryonic stem cell differentiation. Nature 455, 1124-1128 (2008).
8. Orom, U.A., Nielsen, F.C. & Lund, A.H. MicroRNA-10a binds the 5'UTR of ribosomal protein mRNAs and enhances their translation. Mol Cell 30, 460-471 (2008).
9. Wolf, G., Chen, S. & Ziyadeh, F.N. From the periphery of the glomerular capillary wall toward the center of disease: podocyte injury comes of age in diabetic nephropathy. Diabetes 54, 1626-1634 (2005).
10. Thum, T., et al. MicroRNAs in the human heart: a clue to fetal gene reprogramming in heart failure. Circulation 116, 258-267 (2007).
11. Olive, V., Jiang, I. & He, L. mir-17-92, a cluster of miRNAs in the midst of the cancer network. Int J Biochem Cell Biol 42, 1348-1354 (2010).
12. Park, C.Y., Choi, Y.S. & McManus, M.T. Analysis of microRNA knockouts in mice. Human molecular genetics 19, R169-175 (2010).
13. Lewis, B.P., Burge, C.B. & Bartel, D.P. Conserved seed pairing, often flanked by adenosines, indicates that thousands of human genes are microRNA targets. Cell 120, 15-20 (2005).
14. Grimson, A., et al. MicroRNA targeting specificity in mammals: determinants beyond seed pairing. Mol Cell 27, 91-105 (2007).
136
15. Friedman, R.C., Farh, K.K., Burge, C.B. & Bartel, D.P. Most mammalian mRNAs are conserved targets of microRNAs. Genome Res 19, 92-105 (2009).
16. Enright, A.J., et al. MicroRNA targets in Drosophila. Genome Biol 5, R1 (2003).
17. Betel, D., Wilson, M., Gabow, A., Marks, D.S. & Sander, C. The microRNA.org resource: targets and expression. Nucleic Acids Res 36, D149-153 (2008).
18. Yue, D., Liu, H. & Huang, Y. Survey of Computational Algorithms for MicroRNA Target Prediction. Curr Genomics 10, 478-492 (2009).
19. Xiao, F., et al. miRecords: an integrated resource for microRNA-target interactions. Nucleic Acids Res 37, D105-110 (2009).
20. Sales, G., et al. MAGIA, a web-based tool for miRNA and Genes Integrated Analysis. Nucleic Acids Res 38, W352-359 (2010).
21. Li, X., Gill, R., Cooper, N.G., Yoo, J.K. & Datta, S. Modeling microRNA-mRNA interactions using PLS regression in human colon cancer. BMC Med Genomics 4, 44 (2011).
22. Muniategui, A., et al. Quantification of miRNA-mRNA interactions. PLoS One 7, e30766 (2012).
23. Huang, J.C., Morris, Q.D. & Frey, B.J. Bayesian inference of MicroRNA targets from sequence and expression data. J Comput Biol 14, 550-563 (2007).
24. Kozomara A, G.-J.S. miRBase: integrating microRNA annotation and deep-sequencing data. NAR 2011 2039(Database Issue):D2152-D2157.
25. Ambros, V., et al. A uniform system for microRNA annotation. RNA 9, 277-279 (2003).
26. Hafner, M., et al. Transcriptome-wide identification of RNA-binding protein and microRNA target sites by PAR-CLIP. Cell 141, 129-141 (2010).
27. Gregory, P.A., et al. The miR-200 family and miR-205 regulate epithelial to mesenchymal transition by targeting ZEB1 and SIP1. Nat Cell Biol 10, 593-601 (2008).
28. Wang, B., et al. miR-200a Prevents renal fibrogenesis through repression of TGF-beta2 expression. Diabetes 60, 280-287 (2011).
29. Zhou, W., et al. MiR-135a promotes growth and invasion of colorectal cancer via metastasis suppressor 1 in vitro. Acta Biochim Biophys Sin (Shanghai) 44, 838-846 (2012).
30. Chen, Y., et al. miRNA-135a promotes breast cancer cell migration and invasion by targeting HOXA10. BMC Cancer 12, 111 (2012).
31. Liu, Y., et al. MiR-218 reverses high invasiveness of glioblastoma cells by targeting the oncogenic transcription factor LEF1. Oncol Rep 28, 1013-1021
137
(2012). 32. Wang, X.S., et al. MicroRNA-29a and microRNA-142-3p are regulators of
myeloid differentiation and acute myeloid leukemia. Blood 119, 4992-5004 (2012).
33. Zhong, X., Chung, A.C., Chen, H.Y., Meng, X.M. & Lan, H.Y. Smad3-mediated upregulation of miR-21 promotes renal fibrosis. J Am Soc Nephrol 22, 1668-1681 (2011).
34. Chau, B.N., et al. MicroRNA-21 promotes fibrosis of the kidney by silencing metabolic pathways. Sci Transl Med 4, 121ra118 (2012).
35. Petrocca, F., et al. E2F1-regulated microRNAs impair TGFbeta-dependent cell-cycle arrest and apoptosis in gastric cancer. Cancer Cell 13, 272-286 (2008).
36. Mendell, J.T. & Olson, E.N. MicroRNAs in stress signaling and human disease. Cell 148, 1172-1187 (2012).
37. Kriebel, M., Wuchter, J., Trinks, S. & Volkmer, H. Neurofascin: a switch between neuronal plasticity and stability. Int J Biochem Cell Biol 44, 694-697 (2012).
38. Kee, Y., et al. Subunit structure of the mammalian exocyst complex. Proc Natl Acad Sci U S A 94, 14438-14443 (1997).
39. Inoue, M., Chang, L., Hwang, J., Chiang, S.H. & Saltiel, A.R. The exocyst complex is required for targeting of Glut4 to the plasma membrane by insulin. Nature 422, 629-633 (2003).
40. Ceriani, M., et al. Functional analysis of RalGPS2, a murine guanine nucleotide exchange factor for RalA GTPase. Experimental cell research 313, 2293-2307 (2007).
41. Endoh, M., et al. Human Spt6 stimulates transcription elongation by RNA polymerase II in vitro. Mol Cell Biol 24, 3324-3336 (2004).
42. Hall, T.M. Multiple modes of RNA recognition by zinc finger proteins. Curr Opin Struct Biol 15, 367-373 (2005).
43. Gerber, S.H. & Sudhof, T.C. Molecular determinants of regulated exocytosis. Diabetes 51 Suppl 1, S3-11 (2002).
44. Rosengren, A.H., et al. Reduced insulin exocytosis in human pancreatic beta-cells with gene variants linked to type 2 diabetes. Diabetes 61, 1726-1733 (2012).
45. Gaspar, J.M., et al. Diabetes differentially affects the content of exocytotic proteins in hippocampal and retinal nerve terminals. Neuroscience 169, 1589-1600 (2010).
46. Procino, G., et al. AQP2 exocytosis in the renal collecting duct -- involvement
138
of SNARE isoforms and the regulatory role of Munc18b. J Cell Sci 121, 2097-2106 (2008).
47. Yasuda, K., et al. Functional consequences of inhibiting exocytosis of Weibel-Palade bodies in acute renal ischemia. Am J Physiol Renal Physiol 302, F713-721 (2012).
48. Poy, M.N., et al. A pancreatic islet-specific microRNA regulates insulin secretion. Nature 432, 226-230 (2004).
49. Karres, J.S., Hilgers, V., Carrera, I., Treisman, J. & Cohen, S.M. The conserved microRNA miR-8 tunes atrophin levels to prevent neurodegeneration in Drosophila. Cell 131, 136-145 (2007).
50. Weil, E.J., et al. Podocyte detachment in type 2 diabetic nephropathy. Am J Nephrol 33 Suppl 1, 21-24 (2011).
51. Weil EJ, et al. Effect of losartan on prevention and progression of early diabetic nephropathy in American Indians with type 2 diabetes. Diabetes in press(2013).
52. Bitzer, M., Ju, W., Jing, X. & Zavadil, J. Quantitative analysis of miRNA expression in epithelial cells and tissues. Methods Mol Biol 820, 55-70 (2012).
53. Hodgin, J.B., et al. Identification of Cross-Species Shared Transcriptional Networks of Diabetic Nephropathy in Human and Mouse Glomeruli. Diabetes (2012).
54. Cohen, C.D., et al. Improved elucidation of biological processes linked to diabetic nephropathy by single probe-based microarray data analysis. PLoS One 3, e2937 (2008).
55. Johnson, W.E., Li, C. & Rabinovic, A. Adjusting batch effects in microarray expression data using empirical Bayes methods. Biostatistics 8, 118-127 (2007).
139
Chapter V
Conclusions and future directions
Conclusions
CKD is an important public health issue consuming a significant portion of medical
resources and has limited options for effective treatment. To prevent development and
progression of CKD, new targets for intervention need to be identified and it requires
better understanding of the underlying mechanisms. DN accounts for more than 40%
of new cases of ESRD in the United States1. Despite significant improvement made
for understanding the mechanism for DN, current interventions have limited success.
TGFβ is a cytokine that mediates the progression of DN and other types of kidney
disease. Because TGFβ is a multi-functional cytokine that also exhibits protective
effects after renal injury including limiting the inflammatory response2, inhibition of
TGFβ itself harbors significant complications. Thus, it is critical to identify new
therapeutic targets other than TGFβ.
140
Recent data suggest a mechanistic involvement of miRNAs in the progression of DN
as well as other kidney diseases3-6. To identify candidate miRNAs that may mediate
glomerular injury in human DN, we quantitatively determined miRNA expression in
the glomeruli of patients with DN and examined the association of miRNAs with
relevant clinical outcomes. Our analysis uncovered that the expression of miR-21 in
glomeruli was highly associated with the severity of glomerulopathy. miR-21 is
known to regulate TGFβ signaling activity7,8 and has been shown to promote fibrosis
after tubular injuries kidney3-6. However, the role of miR-21 in glomerular injury has
not been examined and the function of miR-21 has been shown to be cell
type-specific9. Therefore, we questioned whether miR-21 plays a different role in
glomerular injury. We interrogated this question by examining the impact of loss of
miR-21 on two mice models of glomerulopathy, TGFβ1 transgenic mice and
STZ-induced diabetic mice in which the expression of miR-21 increases early
during disease development.
In TGFβ1 transgenic mice, we determined that loss of miR-21 resulted in accelerated
glomerular injury and loss of podocytes. We also found that miR-21 inhibits
podocyte apoptosis in vivo and in vitro. Furthermore, we showed that miR-21
represses the activity of multiple TGFβ-regulated pro-apoptotic pathways. In
141
STZ-induced diabetic mice, miR-21 appeared to inhibit cell cycle regulators, Cdk6
and Cdc25a, to inhibit mesangial expansion. These findings suggest that miR-21
mediates cell type-specific functions in the kidney.
Through our investigations, we suggest that miRNAs exhibit specific functions in
glomeruli through the repression of disease relevant mRNAs. Computational
algorithms for predicting targets of miRNAs were widely used. However, due to the
lack of preciseness of the prediction, new methods are still needed to guide
mechanistic studies. Therefore, we developed a novel approach integrating
disease-associated miRNAs and mRNAs with target predictions. We determined that
miR-200a, which has been implicated as a regulator of DN, represses the expression
of EXOC7, RALGPS2, and SUPT6H. These newly identified target genes of
miR-200a may constitute novel regulators of DN.
This work has identified a novel role of miR-21 in glomerular injury and developed
a new approach, which is based on the association of miRNAs and mRNAs with
specific disease phenotypes, to identify candidate miRNA targets. These findings
provide new directions for future research projects. Here, we elaborated on the
conclusion from this body of work and discussed the perspectives of the possible
142
future projects aiming at determining the cell-type specific role of miR-21 and the
regulatory role of other miRNAs in DN.
miRNAs and human DN
Significant differences in gene expression have been observed between patients with
DN and murine models of DN10. Therefore, we determined the expression of
miRNA in patients with DN. Interestingly, we found that the expression of several
miRNAs, such as miR-21 and miR-200a, was positively correlated with the levels of
proteinuria of patients with DN. Although these associations do not reveal the
function of miRNAs in human DN, examining associations between miRNAs and
clinical manifestations can suggest candidate mechanisms. In addition, these data
enable us to generate new hypotheses on specific miRNAs and potentially build
models of mechanistic interactions.
miR-21 and TGFβ-related glomerulopathy
We discovered that miR-21 is protective in glomerulopathy. In TGFβ1 transgenic
mice, miR-21 inhibits TGFβ-induced podocyte apoptosis and protects against
glomerulosclerosis. miR-21 targets many tumor suppressor genes and has
anti-apoptotic effect in cancer cells11,12. The innovation of the current finding lies on
143
the ability of miR-21 to inhibit podocyte apoptosis and the protective effect of
miR-21 in glomerular injury.
miR-21 elevates with renal damage in mice with different injury models and in
patients with transplant nephropathy6,13,14. The increase of miR-21 promotes
interstitial fibrosis after renal ischemia reperfusion and unilateral ureteral
obstruction in mice6,13. However, the fibrogenic role of miR-21 remains
controversial because results across different studies have not always been
consistent15-17. For example, the inhibition of miR-21 in the heart disease induced by
pressure overload attenuates interstitial fibrosis in mice, while the miR-21 null mice
do not have the improved phenotype in the same disease model.
In TGFβ1 transgenic mice, a model of progressive glomerulopathy, miR-21
increased with the severity of the renal damage. Podocyte apoptosis induces
glomerulopathy in TGFβ1 transgenic mice and miR-21 inhibits apoptosis of cancer
cells. For that reason, we hypothesized that miR-21 can inhibit podocyte apoptosis
to ameliorate glomerulopathy.
Our experiments in mice confirmed the hypothesis that miR-21 is protective in
144
glomerulopathy, as TGFβ1 transgenic/miR-21 null mice displayed increased
proteinuria, glomerulosclerosis, and ECM deposition in the glomeruli. The
determination of podocyte number and the examination of podocyte apoptosis in
TGFβ1 transgenic/miR-21 null mice confirmed that miR-21 protects against
glomerulopathy through the inhibition of podocyte apoptosis. The anti-apoptotic
effect of miR-21 was also shown in the cultured mouse podocytes. miR-21
inhibition in mouse podocytes promoted cell apoptosis while miR-21 overexpression
attenuated TGFβ-induced podocyte apoptosis.
miR-21 targets multiple pro-apoptotic pathways, including Tgfbr2, Tgfbi, Smad7
and Tp53. miR-21 also targets ECM-related factors, such as Timp3 and Col4a1. This
is supported by our findings that the expression of those genes was increased in the
glomeruli of TGFβ1 transgenic/miR-21 null mice. In addition, inhibition of miR-21
in mouse podocytes increased the level of phosphorylation of Smad3, consistent
with activation of TGFβ/Smad signaling. The inhibition of miR-21 in mouse
podocytes also increased the protein level of PDCD4, a pro-apoptotic factor and a
well-known target of miR-21.
The luciferase assay confirmed that Smad7 is the sequence-dependent target of
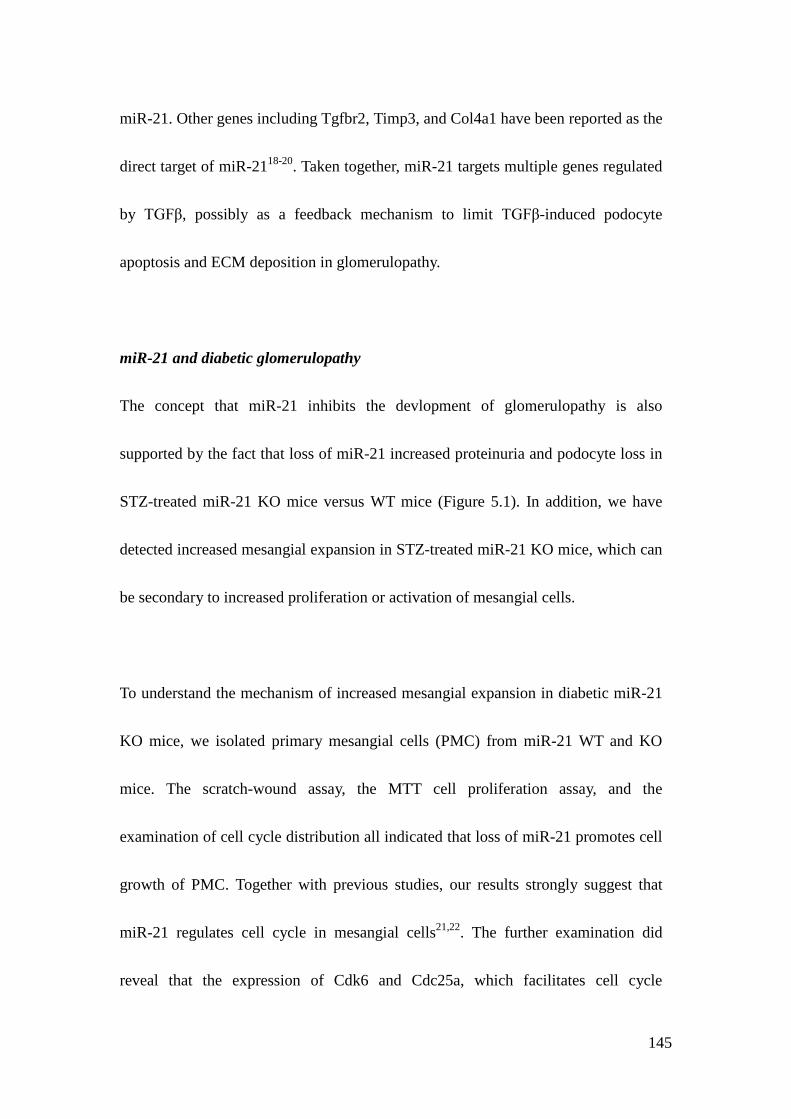
145
miR-21. Other genes including Tgfbr2, Timp3, and Col4a1 have been reported as the
direct target of miR-2118-20. Taken together, miR-21 targets multiple genes regulated
by TGFβ, possibly as a feedback mechanism to limit TGFβ-induced podocyte
apoptosis and ECM deposition in glomerulopathy.
miR-21 and diabetic glomerulopathy
The concept that miR-21 inhibits the devlopment of glomerulopathy is also
supported by the fact that loss of miR-21 increased proteinuria and podocyte loss in
STZ-treated miR-21 KO mice versus WT mice (Figure 5.1). In addition, we have
detected increased mesangial expansion in STZ-treated miR-21 KO mice, which can
be secondary to increased proliferation or activation of mesangial cells.
To understand the mechanism of increased mesangial expansion in diabetic miR-21
KO mice, we isolated primary mesangial cells (PMC) from miR-21 WT and KO
mice. The scratch-wound assay, the MTT cell proliferation assay, and the
examination of cell cycle distribution all indicated that loss of miR-21 promotes cell
growth of PMC. Together with previous studies, our results strongly suggest that
miR-21 regulates cell cycle in mesangial cells21,22. The further examination did
reveal that the expression of Cdk6 and Cdc25a, which facilitates cell cycle
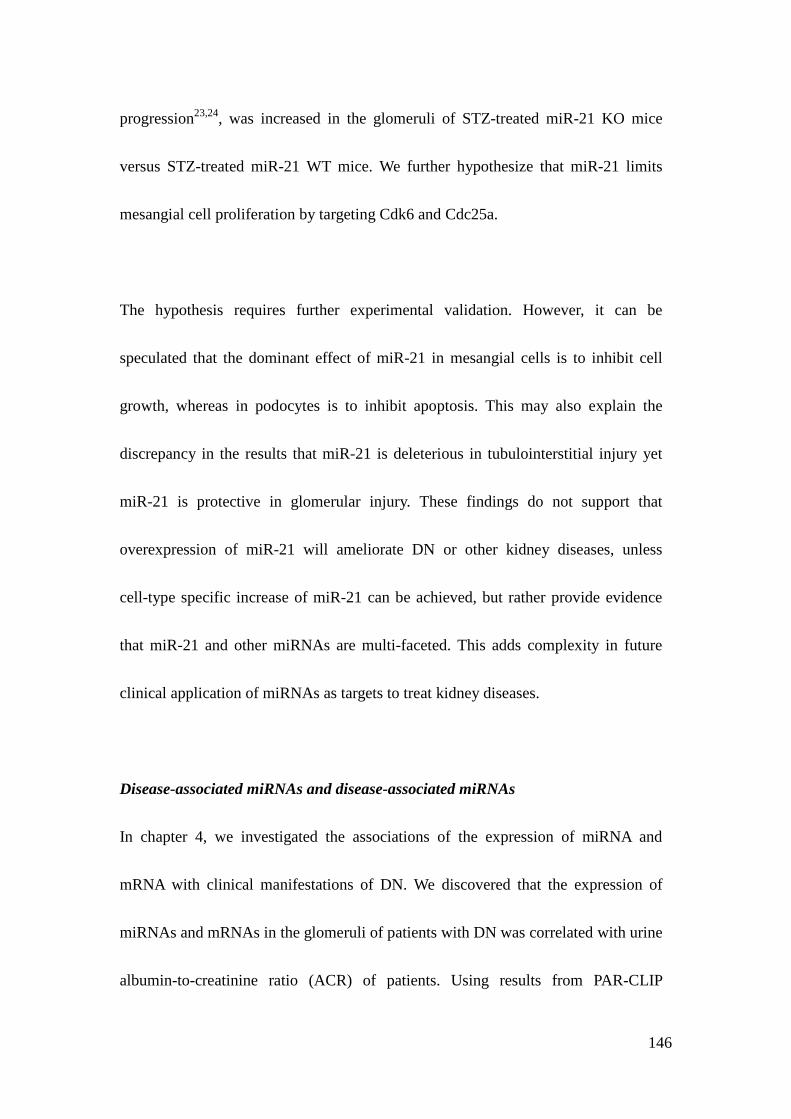
146
progression23,24, was increased in the glomeruli of STZ-treated miR-21 KO mice
versus STZ-treated miR-21 WT mice. We further hypothesize that miR-21 limits
mesangial cell proliferation by targeting Cdk6 and Cdc25a.
The hypothesis requires further experimental validation. However, it can be
speculated that the dominant effect of miR-21 in mesangial cells is to inhibit cell
growth, whereas in podocytes is to inhibit apoptosis. This may also explain the
discrepancy in the results that miR-21 is deleterious in tubulointerstitial injury yet
miR-21 is protective in glomerular injury. These findings do not support that
overexpression of miR-21 will ameliorate DN or other kidney diseases, unless
cell-type specific increase of miR-21 can be achieved, but rather provide evidence
that miR-21 and other miRNAs are multi-faceted. This adds complexity in future
clinical application of miRNAs as targets to treat kidney diseases.
Disease-associated miRNAs and disease-associated miRNAs
In chapter 4, we investigated the associations of the expression of miRNA and
mRNA with clinical manifestations of DN. We discovered that the expression of
miRNAs and mRNAs in the glomeruli of patients with DN was correlated with urine
albumin-to-creatinine ratio (ACR) of patients. Using results from PAR-CLIP
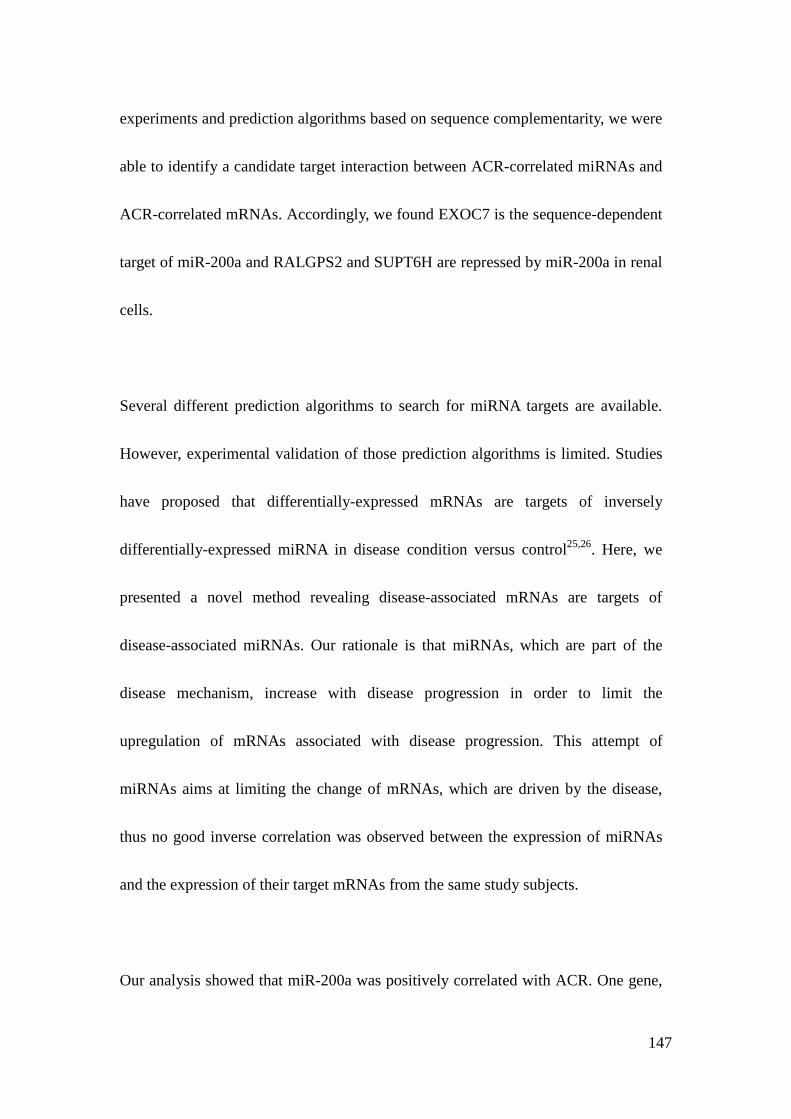
147
experiments and prediction algorithms based on sequence complementarity, we were
able to identify a candidate target interaction between ACR-correlated miRNAs and
ACR-correlated mRNAs. Accordingly, we found EXOC7 is the sequence-dependent
target of miR-200a and RALGPS2 and SUPT6H are repressed by miR-200a in renal
cells.
Several different prediction algorithms to search for miRNA targets are available.
However, experimental validation of those prediction algorithms is limited. Studies
have proposed that differentially-expressed mRNAs are targets of inversely
differentially-expressed miRNA in disease condition versus control25,26. Here, we
presented a novel method revealing disease-associated mRNAs are targets of
disease-associated miRNAs. Our rationale is that miRNAs, which are part of the
disease mechanism, increase with disease progression in order to limit the
upregulation of mRNAs associated with disease progression. This attempt of
miRNAs aims at limiting the change of mRNAs, which are driven by the disease,
thus no good inverse correlation was observed between the expression of miRNAs
and the expression of their target mRNAs from the same study subjects.
Our analysis showed that miR-200a was positively correlated with ACR. One gene,
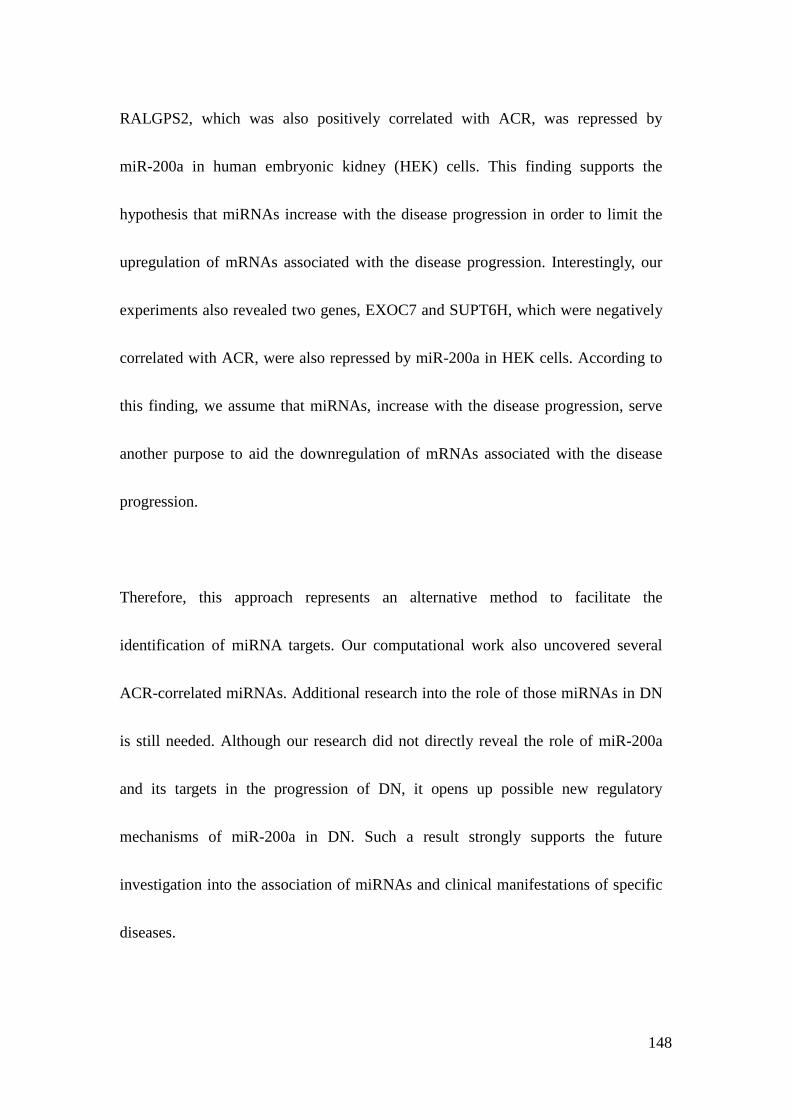
148
RALGPS2, which was also positively correlated with ACR, was repressed by
miR-200a in human embryonic kidney (HEK) cells. This finding supports the
hypothesis that miRNAs increase with the disease progression in order to limit the
upregulation of mRNAs associated with the disease progression. Interestingly, our
experiments also revealed two genes, EXOC7 and SUPT6H, which were negatively
correlated with ACR, were also repressed by miR-200a in HEK cells. According to
this finding, we assume that miRNAs, increase with the disease progression, serve
another purpose to aid the downregulation of mRNAs associated with the disease
progression.
Therefore, this approach represents an alternative method to facilitate the
identification of miRNA targets. Our computational work also uncovered several
ACR-correlated miRNAs. Additional research into the role of those miRNAs in DN
is still needed. Although our research did not directly reveal the role of miR-200a
and its targets in the progression of DN, it opens up possible new regulatory
mechanisms of miR-200a in DN. Such a result strongly supports the future
investigation into the association of miRNAs and clinical manifestations of specific
diseases.
149
Future Directions
Cell-specific role of miR-21
In the body of our work, we discovered that miR-21 inhibits podocyte apoptosis and
limits mesangial expansion in glomerulopathy. This protective role of miR-21 is
contrary to the finding that miR-21 promotes fibrogenesis in tubulointerstitial injury.
This controversy adds to the complexity of therapeutic application aimed at using
miR-21 inhibitor as a therapeutic drug in human kidney diseases. Additional
research into the cell type-specific role and the mechanisms leading to this cell
type-specific action of miR-21 is urgently needed.
Although our initial result is intriguing, further studies need to be conducted to
accurately define the cell type-specific role of miR-21. One standard approach to
address this question is to challenge podocyte-specific or tubular cell-specific
conditional miR-21 knockout (KO) mice with specific renal injury and examine the
renal phenotype. The Podocin-Cre and Cdh16-Cre mice are mice expressing Cre
recombinase specific to podocytes and renal tubule cells, respectively27,28. By
crossing Podocin-Cre or Cdh16-Cre mice with miR-21 flox/flox mice29, we can
evaluate the impact of loss of miR-21 on podocytes or tubule cells in specific renal
injuries and explore the cell type-specific regulatory mechanisms of miR-21. If

150
miR-21 has a bi-faceted role of inhibiting podocyte apoptosis in renal glomeruli and
promoting fibrotic change of tubular cells in tubulointerstitium6, we can interrogate
the question whether the protective effect of miR-21 outweighs the deleterious effect
of miR-21 in specific renal injuries. To answer this question, we now need to
generate double podocyte-specific and tubular cell-specific conditional miR-21 KO
mice. Challenging the double cell-specific miR-21 KO mice with glomerular and
tubulointerstitial injury, we can more accurately evaluate the therapeutic effect of the
inhibition of miR-21. Unfortunately, at present, mice expressing Cre recombinase
specific to mesangial cells are not available.
miR-21 as a biomarker in human kidney disease
Our experiment showed that miR-21 increases with renal damage. This finding is
consistent across different studies with different renal injuries and even in humans
with different kidney diseases6,13,14. If the levels of miR-21 reflect the severity of
renal damage, one can speculate that miR-21 serves as a biomarker of kidney
damage and its higher level predicts the decline of renal function. This capacity of
miR-21 would be independent of its function, but rather reflect its regulation by
disease-promoting mechanisms, including TGFβ, TNF-alpha, and interleukins29.
151
For long, the level of albuminuria has been used as the primary predictive marker
for the progression of DN. However, recent studies have revealed the uncoupling
between the progression of albuminuria and the declining of renal function30-32. The
predictive accuracy of albuminuria by itself is still unsatisfactory. Despite many new
biomarkers described, proper validation for the predictive ability of those new
biomarkers is lacking33. To date, research into additional biomarkers is still needed.
Urine collection is easily accessible and non-invasive. The analyses of urinary
components other than albumin and the expression of genes, which are derived from
urinary cells, have been described to monitor disease activity33-35. Lately, miRNAs
have also been identified in urine supernatant containing microvesicles, which are
the membrane-enclosed structure released by renal cells36,37. Because of these
exciting results, we have established the method to measure the expression of
miRNAs in urine supernatant. Using this assay, we are able to quantify the levels of
miR-21 in the urine. The hypothesis is that miR-21, increased with renal damage,
will be released by renal cells to urine supernatant either by microvesicles or in a
circulating form. Future experiments will correlate the levels of urinary miR-21 with
the expression of renal miR-21. If the levels of urinary miR-21 reflect the levels of
miR-21 in the kidney, the next logical step is to correlate the levels of urinary
152
miR-21 with the severity of renal damage, such as kidney morphometry. Ultimately,
we will examine the predictive ability of the levels of urinary miR-21 in the decline
of renal function and in the development of end stage renal disease.
Identify regulatory mechanism of miR-21 in diabetic mice
Our findings suggest that miR-21 limits mesangial cell proliferation by targeting
Cdk6 and Cdc25a,. To stringently test this hypothesis, confirmation of the protein
level of Cdk6 and Cdc25a in renal glomeruli using immunohistochemical staining or
western blot is required. In addition, in vitro experiments need to be conducted to
support the findings in mice. We will examine the proliferation, cell cycle
distribution, and the expression of Cdk6 and Cdc25a in PMC expressing antisense
miR-21 oligonucleotides to test whether miR-21 targets Cdk6 and Cdc25a to inhibit
mesangial cell growth.
miR-200a and diabetic glomerulopathy
In chapter 4, we have shown that miR-200a correlates with ACR of patients. We also
developed a new computational method to identify potential targets of miRNAs. By
this method, we discovered that miR-200a targets EXOC7 and miR-200a regulates
RALGPS2 and SUPT6H in HEK cells.
153
At present, the role of miR-200a in diabetic glomerulopathy is still unclear. Kato et
al. proposed that miR-200a, upregulated by TGFβ, targets Zeb1/Zeb2 to promote the
expression of collagen1a2 in mesangial cells38. However, other studies showed that
the downregulation of miR-200a by TGFβ increases the expression of Zeb1/Zeb2 to
induce epithelial-to-mesenchymal transition (EMT) in cancer cells39,40. To address
this issue, we need to first determine the level of the expression of miR-200a in the
glomeruli of diabetic mice. To further determine the role of miR-200a in diabetic
glomerulopathy, we will generate the miR-200a null diabetic mice or inject the
diabetic mice with antisense miR-200a oligonucleotides. If there is a regulation or a
role of miR-200a in diabetic glomerulopathy, the expression of Exoc7, Ralgps2, and
Supt6h will also be determined in the glomeruli of the mice. From these data,
additional hypotheses regarding the interrelation of miR-200a and its targets in
diabetic glomerulopathy can be generated.
Identity disease-associated miRNAs
Our analyses identified several miRNAs exhibit significant correlation with ACR.
The functions of some of those miRNAs have been explored in cancer model
systems, including miR-135a promoting growth and migration of cancer cells41,42,
154
miR-218 limiting the invasiveness of cancer cells43, and miR-142-3p regulating
differentiation of myeloid cells44. For each miRNA, new hypotheses can be
generated and validated in animal models of DN.
The data of kidney morphometry of the kidney biopsies of patients with DN, which
were used for profiling the expression of miRNAs and mRNAs, are available.
Examining associations of miRNAs and mRNAs with kidney morphometry can
identify miRNAs and mRNAs correlating with specific parameters. Using the
newly-proposed method in chapter 4 for discovering targets of miRNAs, we are able
to generate additional hypotheses about the modulations among miRNAs, mRNAs,
and DN. Besides validating the hypotheses experimentally in tissue culture as well
as in mouse models, we will further use Ingenuity Pathway Analysis45 to construct
dynamic pathway networks among kidney morphometry-associated miRNAs and
mRNAs. This approach will generate a broader view of how miRNAs modulate DN
and possible other diseases through an intertwining regulatory complex.
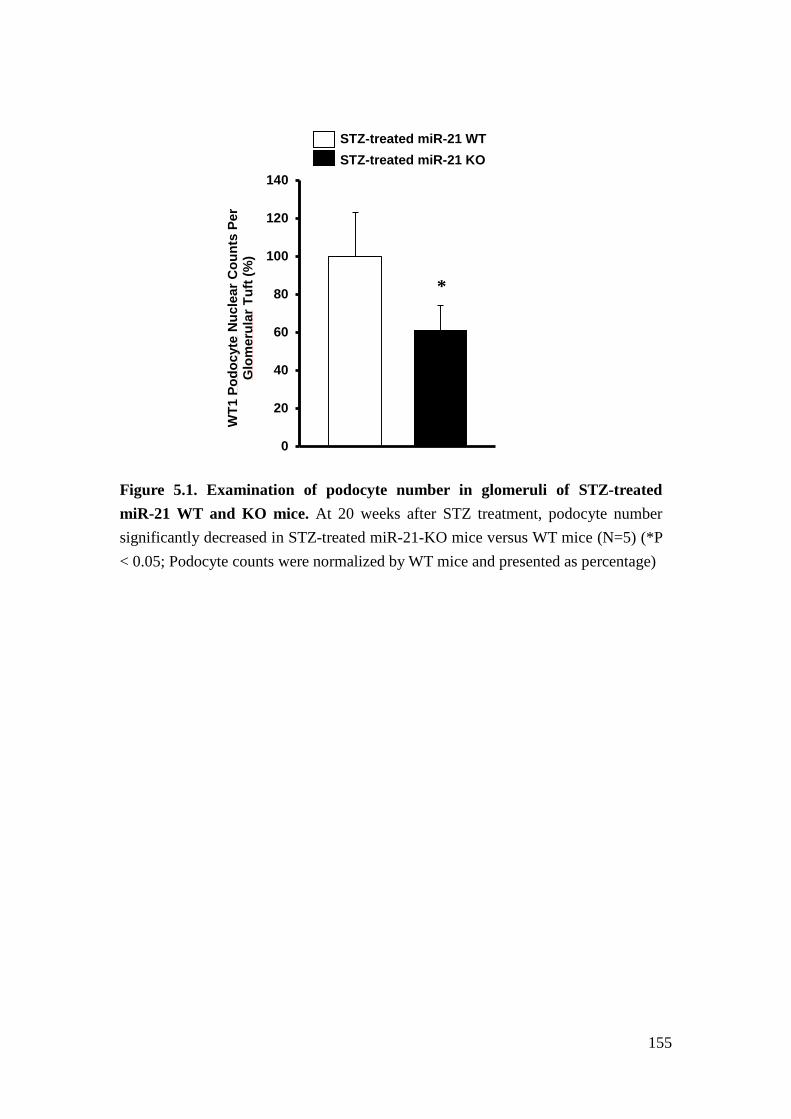
155
Figure 5.1. Examination of podocyte number in glomeruli of STZ-treated miR-21 WT and KO mice. At 20 weeks after STZ treatment, podocyte number significantly decreased in STZ-treated miR-21-KO mice versus WT mice (N=5) (*P < 0.05; Podocyte counts were normalized by WT mice and presented as percentage)
0
20
40
60
80
100
120
140
WT1
Pod
ocyt
e N
ucle
ar C
ount
s Pe
r G
lom
erul
ar T
uft (
%)
STZ-treated miR-21 WT STZ-treated miR-21 KO
*
156
References
1. Molitch, M.E., et al. Nephropathy in diabetes. Diabetes care 27 Suppl 1, S79-83 (2004).
2. Yang, L. TGFbeta, a potent regulator of tumor microenvironment and host immune response, implication for therapy. Curr Mol Med 10, 374-380 (2010).
3. Kato, M., et al. MicroRNA-192 in diabetic kidney glomeruli and its function in TGF-beta-induced collagen expression via inhibition of E-box repressors. Proc Natl Acad Sci U S A 104, 3432-3437 (2007).
4. Krupa, A., et al. Loss of MicroRNA-192 promotes fibrogenesis in diabetic nephropathy. J Am Soc Nephrol 21, 438-447 (2010).
5. Godwin, J.G., et al. Identification of a microRNA signature of renal ischemia reperfusion injury. Proc Natl Acad Sci U S A 107, 14339-14344 (2010).
6. Zhong, X., Chung, A.C., Chen, H.Y., Meng, X.M. & Lan, H.Y. Smad3-mediated upregulation of miR-21 promotes renal fibrosis. J Am Soc Nephrol 22, 1668-1681 (2011).
7. Davis, B.N., Hilyard, A.C., Lagna, G. & Hata, A. SMAD proteins control DROSHA-mediated microRNA maturation. Nature 454, 56-61 (2008).
8. Davis, B.N., Hilyard, A.C., Nguyen, P.H., Lagna, G. & Hata, A. Smad proteins bind a conserved RNA sequence to promote microRNA maturation by Drosha. Mol Cell 39, 373-384 (2010).
9. Krichevsky, A.M. & Gabriely, G. miR-21: a small multi-faceted RNA. Journal of cellular and molecular medicine 13, 39-53 (2009).
10. Hodgin, J.B., et al. Identification of Cross-Species Shared Transcriptional Networks of Diabetic Nephropathy in Human and Mouse Glomeruli. Diabetes (2012).
11. Chan, J.A., Krichevsky, A.M. & Kosik, K.S. MicroRNA-21 is an antiapoptotic factor in human glioblastoma cells. Cancer Res 65, 6029-6033 (2005).
12. Meng, F., et al. MicroRNA-21 regulates expression of the PTEN tumor suppressor gene in human hepatocellular cancer. Gastroenterology 133, 647-658 (2007).
13. Chau, B.N., et al. MicroRNA-21 promotes fibrosis of the kidney by silencing metabolic pathways. Sci Transl Med 4, 121ra118 (2012).
14. Zhong, X., et al. miR-21 is a key therapeutic target for renal injury in a mouse model of type 2 diabetes. Diabetologia 56, 663-674 (2013).
15. Eddy, A.A. The TGF-beta route to renal fibrosis is not linear: the miR-21
157
viaduct. J Am Soc Nephrol 22, 1573-1575 (2011). 16. Thum, T., et al. MicroRNA-21 contributes to myocardial disease by
stimulating MAP kinase signalling in fibroblasts. Nature 456, 980-984 (2008).
17. Patrick, D.M., et al. Stress-dependent cardiac remodeling occurs in the absence of microRNA-21 in mice. J Clin Invest 120, 3912-3916 (2010).
18. Yu, Y., et al. MicroRNA-21 induces stemness by downregulating transforming growth factor beta receptor 2 (TGFbetaR2) in colon cancer cells. Carcinogenesis 33, 68-76 (2012).
19. Gabriely, G., et al. MicroRNA 21 promotes glioma invasion by targeting matrix metalloproteinase regulators. Molecular and Cellular Biology 28, 5369-5380 (2008).
20. Mase, Y., et al. MiR-21 is Enriched in the RNA-Induced Silencing Complex and Targets COL4A1 in Human Granulosa Cell Lines. Reprod Sci 19, 1030-1040 (2012).
21. Zhong, Z., Dong, Z., Yang, L. & Gong, Z. miR-21 induces cell cycle at S phase and modulates cell proliferation by down-regulating hMSH2 in lung cancer. Journal of cancer research and clinical oncology 138, 1781-1788 (2012).
22. Wang, P., et al. microRNA-21 negatively regulates Cdc25A and cell cycle progression in colon cancer cells. Cancer Res 69, 8157-8165 (2009).
23. Boutros, R., Lobjois, V. & Ducommun, B. CDC25 phosphatases in cancer cells: key players? Good targets? Nature reviews. Cancer 7, 495-507 (2007).
24. Ekholm, S.V. & Reed, S.I. Regulation of G(1) cyclin-dependent kinases in the mammalian cell cycle. Current opinion in cell biology 12, 676-684 (2000).
25. Mayor-Lynn, K., Toloubeydokhti, T., Cruz, A.C. & Chegini, N. Expression profile of microRNAs and mRNAs in human placentas from pregnancies complicated by preeclampsia and preterm labor. Reprod Sci 18, 46-56 (2011).
26. Nam, S., et al. MicroRNA and mRNA integrated analysis (MMIA): a web tool for examining biological functions of microRNA expression. Nucleic Acids Res 37, W356-362 (2009).
27. Moeller, M.J., Sanden, S.K., Soofi, A., Wiggins, R.C. & Holzman, L.B. Podocyte-specific expression of cre recombinase in transgenic mice. Genesis 35, 39-42 (2003).
28. Shao, X., Somlo, S. & Igarashi, P. Epithelial-specific Cre/lox recombination in the developing kidney and genitourinary tract. J Am Soc Nephrol 13,
158
1837-1846 (2002). 29. Lu, T.X., et al. MicroRNA-21 limits in vivo immune response-mediated
activation of the IL-12/IFN-gamma pathway, Th1 polarization, and the severity of delayed-type hypersensitivity. J Immunol 187, 3362-3373 (2011).
30. Perkins, B.A., et al. Microalbuminuria and the risk for early progressive renal function decline in type 1 diabetes. J Am Soc Nephrol 18, 1353-1361 (2007).
31. Tsalamandris, C., et al. Progressive decline in renal function in diabetic patients with and without albuminuria. Diabetes 43, 649-655 (1994).
32. Perkins, B.A., Ficociello, L.H., Roshan, B., Warram, J.H. & Krolewski, A.S. In patients with type 1 diabetes and new-onset microalbuminuria the development of advanced chronic kidney disease may not require progression to proteinuria. Kidney Int 77, 57-64 (2010).
33. Jim, B., Santos, J., Spath, F. & Cijiang He, J. Biomarkers of diabetic nephropathy, the present and the future. Current diabetes reviews 8, 317-328 (2012).
34. Thongboonkerd, V. Practical points in urinary proteomics. Journal of proteome research 6, 3881-3890 (2007).
35. Thongboonkerd, V. Urinary proteomics: towards biomarker discovery, diagnostics and prognostics. Molecular bioSystems 4, 810-815 (2008).
36. Wang, G. & Szeto, C.C. Methods of microRNA quantification in urinary sediment. Methods Mol Biol 1024, 211-220 (2013).
37. Wang, G., et al. Expression of microRNAs in the urine of patients with bladder cancer. Clinical genitourinary cancer 10, 106-113 (2012).
38. Kato, M., Arce, L. & Natarajan, R. MicroRNAs and their role in progressive kidney diseases. Clinical journal of the American Society of Nephrology : CJASN 4, 1255-1266 (2009).
39. Gregory, P.A., et al. The miR-200 family and miR-205 regulate epithelial to mesenchymal transition by targeting ZEB1 and SIP1. Nat Cell Biol 10, 593-601 (2008).
40. Burk, U., et al. A reciprocal repression between ZEB1 and members of the miR-200 family promotes EMT and invasion in cancer cells. EMBO reports 9, 582-589 (2008).
41. Zhou, W., et al. MiR-135a promotes growth and invasion of colorectal cancer via metastasis suppressor 1 in vitro. Acta Biochim Biophys Sin (Shanghai) 44, 838-846 (2012).
42. Chen, Y., et al. miRNA-135a promotes breast cancer cell migration and invasion by targeting HOXA10. BMC Cancer 12, 111 (2012).
159
43. Liu, Y., et al. MiR-218 reverses high invasiveness of glioblastoma cells by targeting the oncogenic transcription factor LEF1. Oncol Rep 28, 1013-1021 (2012).
44. Wang, X.S., et al. MicroRNA-29a and microRNA-142-3p are regulators of myeloid differentiation and acute myeloid leukemia. Blood 119, 4992-5004 (2012).
45. The <networks, functional analyses, etc.> were generated through the use of Ingenuity Pathways Analysis (Ingenuity® Systems, www.ingenuity.com).”.
Related Documents