MicroRNA Expression Profiling of the Porcine Developing Brain Agnieszka Podolska 1 , Bogumil Kaczkowski 2 , Peter Kamp Busk 3¤ , Rolf Søkilde 4 , Thomas Litman 4 , Merete Fredholm 1 , Susanna Cirera 1 * 1 Department of Basic Animal and Veterinary Sciences, Section of Genetics and Bioinformatics, Faculty of Life Sciences, University of Copenhagen, Copenhagen, Denmark, 2 Department of Biology and Biotech Research and Innovation Centre, Bioinformatics Centre, University of Copenhagen, Copenhagen, Denmark, 3 Molecular Biology, Exiqon A/S, Vedbæk, Denmark, 4 Biomarker Discovery, Exiqon A/S, Vedbæk, Denmark Abstract Background: MicroRNAs are small, non-coding RNA molecules that regulate gene expression at the post-transcriptional level and play an important role in the control of developmental and physiological processes. In particular, the developing brain contains an impressive diversity of microRNAs. Most microRNA expression profiling studies have been performed in human or rodents and relatively limited knowledge exists in other mammalian species. The domestic pig is considered to be an excellent, alternate, large mammal model for human-related neurological studies, due to its similarity in both brain development and the growth curve when compared to humans. Considering these similarities, studies examining microRNA expression during porcine brain development could potentially be used to predict the expression profile and role of microRNAs in the human brain. Methodology/Principal Findings: MicroRNA expression profiling by use of microRNA microarrays and qPCR was performed on the porcine developing brain. Our results show that microRNA expression is regulated in a developmentally stage- specific, as well as a tissue-specific manner. Numerous developmental stage or tissue-specific microRNAs including, miR-17, miR-18a, miR-29c, miR-106a, miR-135a and b, miR-221 and miR-222 were found by microarray analysis. Expression profiles of selected candidates were confirmed by qPCR. Conclusions/Significance: The differential expression of specific microRNAs in fetal versus postnatal samples suggests that they likely play an important role in the regulation of developmental and physiological processes during brain development. The data presented here supports the notion that microRNAs act as post-transcriptional switches which may regulate gene expression when required. Citation: Podolska A, Kaczkowski B, Kamp Busk P, Søkilde R, Litman T, et al. (2011) MicroRNA Expression Profiling of the Porcine Developing Brain. PLoS ONE 6(1): e14494. doi:10.1371/journal.pone.0014494 Editor: Joel S. Bader, Johns Hopkins University, United States of America Received March 1, 2010; Accepted December 9, 2010; Published January 6, 2011 Copyright: ß 2011 Podolska et al. This is an open-access article distributed under the terms of the Creative Commons Attribution License, which permits unrestricted use, distribution, and reproduction in any medium, provided the original author and source are credited. Funding: PKB and TL were employed by Exiqon A/S during the conduct of the study. As such, Exiqon A/S has provided economic support and know how for the project. Study design, data analysis and decision to publish was the responsibility of the academic partners. This study was supported by a grant from the Danish National Advanced Technology Foundation for the project ‘‘Pigs and Health’’, and from a grant from Faculty of Life Sciences, University of Copenhagen for a Ph.D. scholarship to Agnieszka Podolska. These founders had no role in study design, data collection and analysis, decision to publish or preparation of the manuscript. Competing Interests: Peter Kamp Busk and Thomas Litman were employees of Exiqon A/S when the study was performed. In addition, Peter Kamp Busk is the inventor on a patent application for miRNA quantitative PCR but all rights to the patent have been granted to Exiqon A/S. In conclusion they no longer have any competing interest. No other author has any financial or other competing interest. The affiliation with Exiqon A/S does not alter the authors’ adherence to all the PLoS ONE policies on sharing data and materials. * E-mail: [email protected] ¤ Current address: Copenhagen Institute of Technology, Aalborg University, Copenhagen, Denmark Introduction MicroRNAs (miRNAs) are small (approximately 22 nucleotides long), highly conserved, non-coding RNA molecules that modulate gene expression at the post-transcriptional level by binding to their target mRNAs [1]. MiRNAs are believed to fine-regulate most biological processes, such as developmental timing and tissue differentiation. Moreover, miRNA deregulation is implicated in various diseases including inflammation and cancer [2]. Within the last decade, a large number of miRNAs from many different organisms has been discovered and these appear to be highly conserved across species. The most recent release of miRBase 16.0 (September 2010) [3] includes 15172 miRNA precursor entries in 142 species: 799 entries represent individual Mus musculus mature miRNAs and 1240 represent mature miRNAs from Homo sapiens. At present, only 211 mature miRNAs are annotated for Sus scrofa in miRBase 16.0, and more than half of these are in silico predictions. In the last three years, many studies on identification and characterization of porcine miRNAs have been published. A number of studies are based on cloning and sequencing [4], [5], [6], [7]. Others focus on computer predictions of miRNAs using EST or genomic sequencing data [8], [9]. Some studies use microarray profiling in order to identify miRNAs expressed in porcine tissues [10]. More recently, miRNA investigation have been performed by deep sequencing of small RNA libraries using the Solexa platform [11], [12], [13], [14]. Together, these studies PLoS ONE | www.plosone.org 1 January 2011 | Volume 6 | Issue 1 | e14494

Welcome message from author
This document is posted to help you gain knowledge. Please leave a comment to let me know what you think about it! Share it to your friends and learn new things together.
Transcript
MicroRNA Expression Profiling of the Porcine DevelopingBrainAgnieszka Podolska1, Bogumil Kaczkowski2, Peter Kamp Busk3¤, Rolf Søkilde4, Thomas Litman4, Merete
Fredholm1, Susanna Cirera1*
1 Department of Basic Animal and Veterinary Sciences, Section of Genetics and Bioinformatics, Faculty of Life Sciences, University of Copenhagen, Copenhagen, Denmark,
2 Department of Biology and Biotech Research and Innovation Centre, Bioinformatics Centre, University of Copenhagen, Copenhagen, Denmark, 3 Molecular Biology,
Exiqon A/S, Vedbæk, Denmark, 4 Biomarker Discovery, Exiqon A/S, Vedbæk, Denmark
Abstract
Background: MicroRNAs are small, non-coding RNA molecules that regulate gene expression at the post-transcriptionallevel and play an important role in the control of developmental and physiological processes. In particular, the developingbrain contains an impressive diversity of microRNAs. Most microRNA expression profiling studies have been performed inhuman or rodents and relatively limited knowledge exists in other mammalian species. The domestic pig is considered to bean excellent, alternate, large mammal model for human-related neurological studies, due to its similarity in both braindevelopment and the growth curve when compared to humans. Considering these similarities, studies examining microRNAexpression during porcine brain development could potentially be used to predict the expression profile and role ofmicroRNAs in the human brain.
Methodology/Principal Findings: MicroRNA expression profiling by use of microRNA microarrays and qPCR was performedon the porcine developing brain. Our results show that microRNA expression is regulated in a developmentally stage-specific, as well as a tissue-specific manner. Numerous developmental stage or tissue-specific microRNAs including, miR-17,miR-18a, miR-29c, miR-106a, miR-135a and b, miR-221 and miR-222 were found by microarray analysis. Expression profiles ofselected candidates were confirmed by qPCR.
Conclusions/Significance: The differential expression of specific microRNAs in fetal versus postnatal samples suggests thatthey likely play an important role in the regulation of developmental and physiological processes during braindevelopment. The data presented here supports the notion that microRNAs act as post-transcriptional switches which mayregulate gene expression when required.
Citation: Podolska A, Kaczkowski B, Kamp Busk P, Søkilde R, Litman T, et al. (2011) MicroRNA Expression Profiling of the Porcine Developing Brain. PLoS ONE 6(1):e14494. doi:10.1371/journal.pone.0014494
Editor: Joel S. Bader, Johns Hopkins University, United States of America
Received March 1, 2010; Accepted December 9, 2010; Published January 6, 2011
Copyright: � 2011 Podolska et al. This is an open-access article distributed under the terms of the Creative Commons Attribution License, which permitsunrestricted use, distribution, and reproduction in any medium, provided the original author and source are credited.
Funding: PKB and TL were employed by Exiqon A/S during the conduct of the study. As such, Exiqon A/S has provided economic support and know how for theproject. Study design, data analysis and decision to publish was the responsibility of the academic partners. This study was supported by a grant from the DanishNational Advanced Technology Foundation for the project ‘‘Pigs and Health’’, and from a grant from Faculty of Life Sciences, University of Copenhagen for a Ph.D.scholarship to Agnieszka Podolska. These founders had no role in study design, data collection and analysis, decision to publish or preparation of the manuscript.
Competing Interests: Peter Kamp Busk and Thomas Litman were employees of Exiqon A/S when the study was performed. In addition, Peter Kamp Busk is theinventor on a patent application for miRNA quantitative PCR but all rights to the patent have been granted to Exiqon A/S. In conclusion they no longer have anycompeting interest. No other author has any financial or other competing interest. The affiliation with Exiqon A/S does not alter the authors’ adherence to all thePLoS ONE policies on sharing data and materials.
* E-mail: [email protected]
¤ Current address: Copenhagen Institute of Technology, Aalborg University, Copenhagen, Denmark
Introduction
MicroRNAs (miRNAs) are small (approximately 22 nucleotides
long), highly conserved, non-coding RNA molecules that modulate
gene expression at the post-transcriptional level by binding to their
target mRNAs [1]. MiRNAs are believed to fine-regulate most
biological processes, such as developmental timing and tissue
differentiation. Moreover, miRNA deregulation is implicated in
various diseases including inflammation and cancer [2]. Within
the last decade, a large number of miRNAs from many different
organisms has been discovered and these appear to be highly
conserved across species. The most recent release of miRBase 16.0
(September 2010) [3] includes 15172 miRNA precursor entries in
142 species: 799 entries represent individual Mus musculus mature
miRNAs and 1240 represent mature miRNAs from Homo sapiens.
At present, only 211 mature miRNAs are annotated for Sus scrofa
in miRBase 16.0, and more than half of these are in silico
predictions. In the last three years, many studies on identification
and characterization of porcine miRNAs have been published. A
number of studies are based on cloning and sequencing [4], [5],
[6], [7]. Others focus on computer predictions of miRNAs using
EST or genomic sequencing data [8], [9]. Some studies use
microarray profiling in order to identify miRNAs expressed in
porcine tissues [10]. More recently, miRNA investigation have
been performed by deep sequencing of small RNA libraries using
the Solexa platform [11], [12], [13], [14]. Together, these studies
PLoS ONE | www.plosone.org 1 January 2011 | Volume 6 | Issue 1 | e14494

have contributed substantially to increase the number of annotated
porcine miRNAs within a variety of tissues. Despite these
advances, this study is the first to profile miRNAs in the porcine
central nervous system (CNS) by use of microarray and quantita-
tive PCR.
The abundance and diversity of miRNAs varies in different
tissues. A number of miRNAs are expressed in highly tissue- or
stage-specific patterns [15], [16], while others are more broadly
expressed [17], [18]. The CNS is by far the most complex organ of
the mammalian body, and houses an impressive diversity of
miRNAs. In fact, more than 50% of the known miRNAs have
been detected in human and mouse brain [19]. Moreover,
miRNAs play an important role in modulating gene expression
during neuronal development, from early neurogenesis to
synaptogenesis, as well as in maintenance of neuron function
[20]. Dynamic changes in miRNA gene expression profiles have
also been detected during brain development [21], [22].
Therefore, the CNS is a particularly interesting target for miRNA
studies.
Various techniques, such as miRNA cloning, fluorescent in situ
hybridization (FISH), northern blot, microarray, deep-sequencing
and quantitative real-time PCR (qPCR), have been successfully
used for miRNA investigation. Currently, microarrays and deep
sequencing are the most commonly used techniques for high-
throughput profiling of miRNA expression. Quantitative real-time
PCR is an extremely sensitive technique that enables validation of
selected candidate miRNAs. Both microarray and qPCR can
benefit from the Locked Nucleic Acid (LNA) technology, which
increases the thermal stability of the oligonucleotides [23]. These
techniques have been used successfully in various studies focused
on analysis of miRNA expression in the CNS particularly in model
organisms, such as the mouse. In one particular study investigating
miRNA expression in mouse brain, 66 miRNAs showed altered
expression levels during brain development [22]. In addition,
numerous miRNAs have been shown to be ubiquitously expressed
in the CNS of mice [24].
The majority of the reported miRNA research has been focused
on disease-related studies in either human or rodents. However,
there is a need to examine miRNAs further in other mammals,
such as the domestic pig. The pig brain shows more similarity to
the human brain, with respect to anatomy, size, growth and
development, compared to brains of other laboratory animals
[25], which makes the pig an important model to be considered
within biomedical sciences. Therefore, it is highly relevant to
generate knowledge about miRNA gene expression in pig tissues.
This would provide useful comparative information between
species. One further advantage in studying the pig is that tissues
from different developmental stages are easily accessible.
Results and Discussion
In this study, expression of miRNAs in the pig developing brain
was investigated by microarray analysis and subsequently
validated by qPCR. Expression profiling of two distinct brain
regions was performed. These regions were acquired from three
different developmental stages: gestation day 50 (F50), gestation
day 100 (F100) and three month-old postnatal brain (termed
adult). We selected these three particular stages of development,
for the following reasons: At F50, the cerebellum and cortex are in
an intensive neural differentiation stage [26]; at F100, the
neuronal growth spurt takes place and in a 3 month adult brain,
there is active myelination and growth of glial cells [27].
Investigating different developmental time points may be useful
in identifying the function of different miRNAs. Detailed studies
have previously been performed in the rodent CNS [24], [28],
[29], [30], although there is currently a lack of information
regarding miRNA expression in the porcine CNS. The present
study reveals miRNA expression patterns within the porcine
developing brain and provides information on trends in the
expression of particularly interesting miRNAs.
miRCURYTM LNA microRNA MicroarrayThe normalization and data filtering resulted in 1088 high
quality probe signals, which represented both human and porcine
miRNAs. In the initial analysis of the data, we identified general
similarities and differences between the samples by means of
principal component analysis (PCA). The analysis of the micro-
array data in Figure 1 indicated, that the miRNA expression
patterns within the cortex and cerebellum from gestation day 50
(F50) were highly similar to one other. The expression patterns
from the F50 samples differed considerably from the F100 and
adult tissue, which suggests that changes in the global miRNA
expression take place in brain between F50 and late F100
gestation. Differences between F100 cortex and adult cortex were
also detected and were greater than the variation observed
between the F100 cerebellum and adult cerebellum. This
particular pattern may be explained by the underlying biology of
brain development, with respect to different timing in the
development of the cortex compared to the cerebellum during
late gestation and also within the adult brain [26]. The variation in
gene expression among biological replicates could originate from
both technical noise and biological variation. The biological
replicates of each developmental stage were highly similar in the
PCA plots for both cortex and cerebellum, suggesting a low
amount of technical noise and a consistent similarity in gene
expression pattern among biological replicates. Additionally, the
distances between developmental stages and tissue types were
much larger between groups, than within groups. This illustrates
that the within group variation does not pose a problem in
modeling differences between the groups. Very similar microarray
results were obtained from three replicates, revealing a high level
of reproducibility.
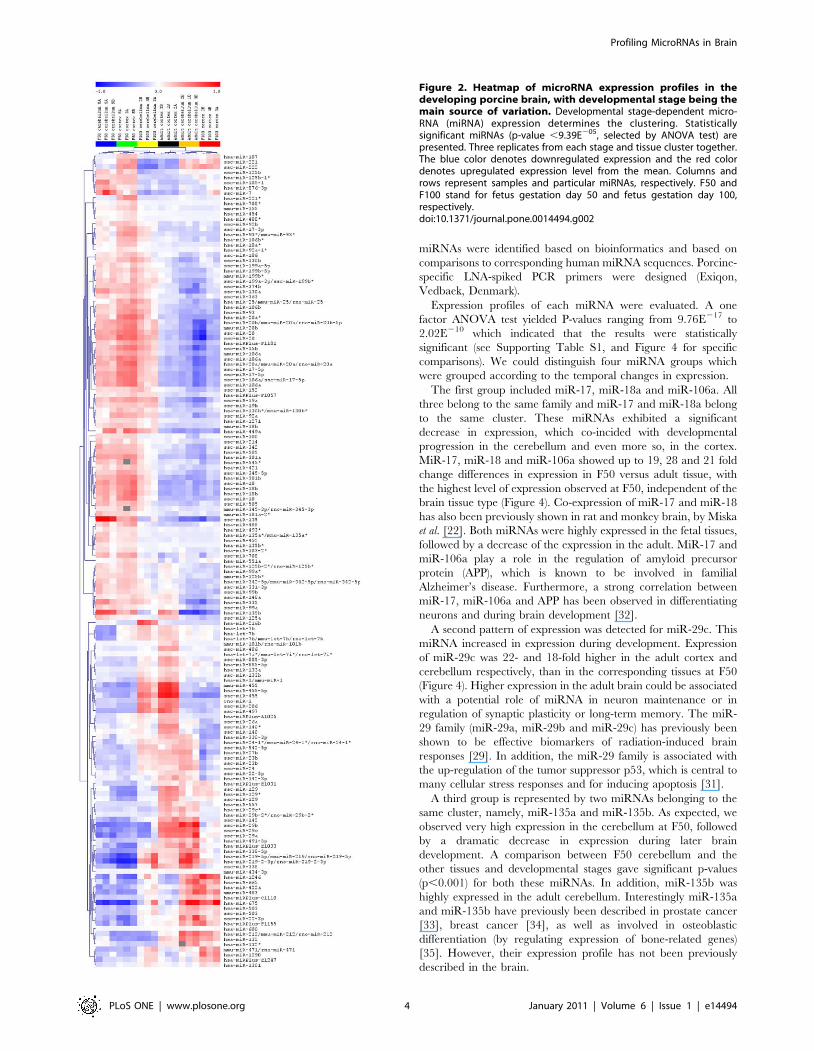
Analysis of the expression of individual miRNAs revealed two
different patterns of expression. The first pattern is presented in
Figure 2, where developmental, stage-dependent miRNAs were
used to generate the clustering. All the probes shown in Figure 2
were highly significant with p-values ,9.77E205. A number of
miRNAs including the entire miR-17/92 cluster (with miR-17 and
miR-18a being particularly significant), as well as the miR-106a/
363 cluster, excluding miR-19b-2 and miR-92a-2 (with miR-106a
and miR-18b having the lowest p-values), exhibited decreasing
expression throughout development. The second group, e.g.; the
miR-29 family (containing miR-29a –b –c) and miR-22, miR-24,
miR-27b and miR-142-5p showed increasing expression with age
progression, with a particularly high expression in the adult tissues.
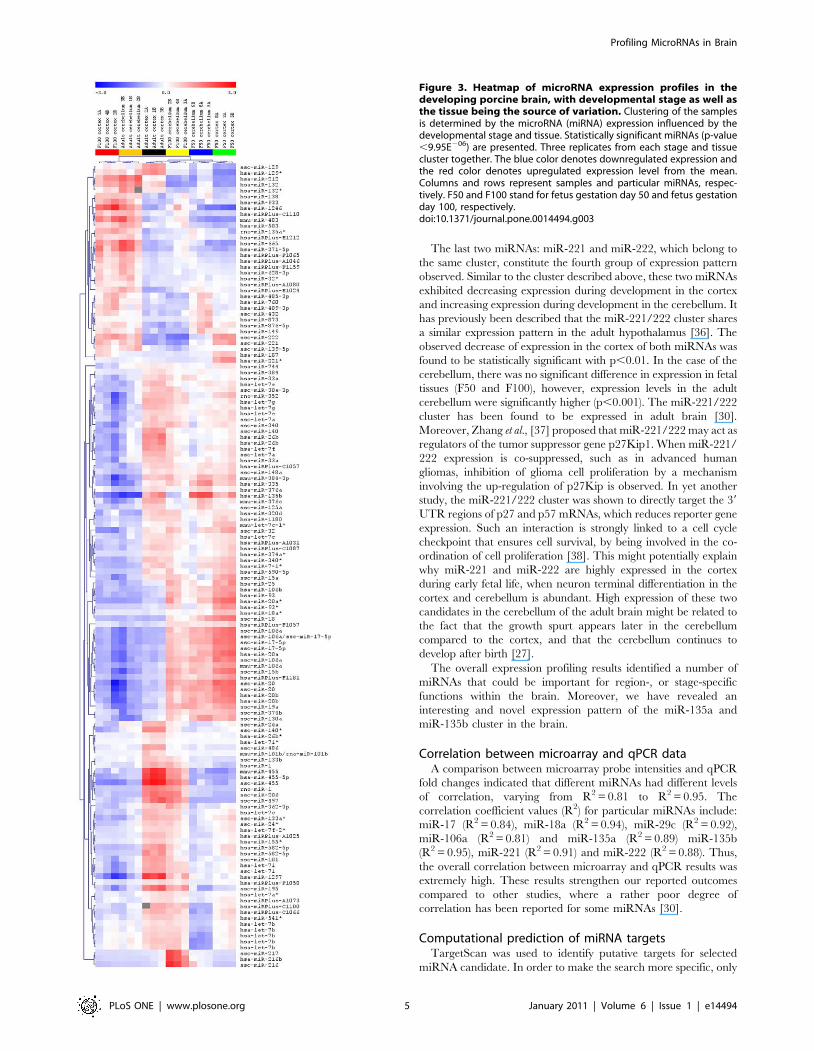
The two most interesting miRNAs within this group include the
miR-221/222 cluster. This cluster had high expression within the
F50 cortex and F100 cortex, compared to the adult (where high
expression is detected mostly in the cerebellum). Interestingly,
miR-455-3p and miR-455-5p were highly expressed in both the
F100 cerebellum and the adult cortex, which suggests that the
same miRNAs are expressed in both regions, but seem to reach a
maximum level of expression at different time points during
development. An interesting expression pattern is represented by
miR-216a, miR-216b and miR-217 which were found to be
exclusively expressed in the F100 cerebellum, implying that they
are highly stage- and tissue-specific miRNAs. These three
Profiling MicroRNAs in Brain
PLoS ONE | www.plosone.org 2 January 2011 | Volume 6 | Issue 1 | e14494

particular miRNAs represent very promising biomarker candi-
dates (see Figure 3).
The expression profiles of many microRNAs were variable and
distinct. This lead to the general conclusion that miRNAs are highly
stage-specific regulatory elements. One striking observation was that
many miRNAs exhibited significantly different expression patterns
between F50 and adult brain tissue. It could be considered that
miRNAs which were highly expressed in fetal tissue might be
involved in the development and growth of a particular region of the
brain, such as the frontal cortex or cerebellum (e.g. miR-17, miR-18
or miR-106a). Furthermore, these miRNAs might be involved in
control of neurogenesis, which peaks just prior to birth. During the
early postnatal period, neurons undergo terminal differentiation.
Therefore, it is plausible that miRNAs prominently expressed at this
time (for instance miR-24 and the miR-29 family members) might
regulate this process. The cerebellum starts to develop very early in
fetal life. Therefore, miRNAs up-regulated in F50 cerebellum (e.g.
miR-135a, miR-135b and miR-7, see Figure 2) and F100
cerebellum (e.g. miR-216a and miR-216) make promising candi-
dates for developmental switches in the cerebellum. The cortex is
undergoing growth and intensive development at the end of
gestation, as well as after birth and in youth. Therefore, miRNAs
found to be over-expressed in the cortex (e.g. miR-455-3p, miR-
455-5p) might be responsible for growth and neuron formation. The
brain continues to grow after birth, but this primarily reflects an
increase in the number of oligodendrocytes, which are responsible
for brain myelination [27]. Moreover, an immense amount of new
synapses are formed after birth [27]. Thus, miRNAs expressed at a
high level in the adult brain (for instance let-7i, miR-22 and miR-
29a-b and -c, miR-142-5p), could be involved in myelination,
synapse formation and/or maintenance of synaptic plasticity.
Candidates for qPCR validation were chosen among the
miRNAs that showed statistically significant differences between
tissues or developmental stages. P-values for chosen candidates
were as follows: miR-17(1.92E209), miR-18a(2.62E209), miR-
29c(4.71E209), miR-106a(1.84E208), miR-135a(8.26E209), miR-
135b(1.99E208), miR-221(9.19E205), miR-222(2.04E205) (see
Supporting Table S2) Expression profiles of these candidates can
be found in Figure 2. Three out of eight miRNAs exhibited
decreasing expression during brain development (miR-17, miR-
18a (belonging to the same cluster), miR-106a) [24]. Interestingly,
miR-17, miR-18a and miR-106a belong to the same miRNA
family. We also analyzed one miRNA which displayed an increase
in expression during development (miR-29c). This miRNA has
previously been documented to be involved in regulation of p53
expression levels [31]. The miR-135a/135b cluster was chosen
because of its very interesting expression pattern in the brain and
because it has not been previously described in the brain. We also
analyzed the miR-221/222 cluster, due to a detectable decrease in
expression within the cortex and an increase within the cerebellum
during brain development.
Validation of the miRNA candidates by qPCREight selected candidate miRNAs and two miRNAs used as
reference genes were assayed by qPCR in order to confirm the
expression profiles found by the microarray study. Porcine
Figure 1. Principal Component Analysis (PCA) plot of microarray data. Clustering of the samples according to their origin is shown. In eachcase, three replicates from each particular developmental stage and tissue cluster together. F50 and F100 stand for fetus gestation day 50 and fetusgestation day 100, respectively.doi:10.1371/journal.pone.0014494.g001
Profiling MicroRNAs in Brain
PLoS ONE | www.plosone.org 3 January 2011 | Volume 6 | Issue 1 | e14494
miRNAs were identified based on bioinformatics and based on
comparisons to corresponding human miRNA sequences. Porcine-
specific LNA-spiked PCR primers were designed (Exiqon,
Vedbaek, Denmark).
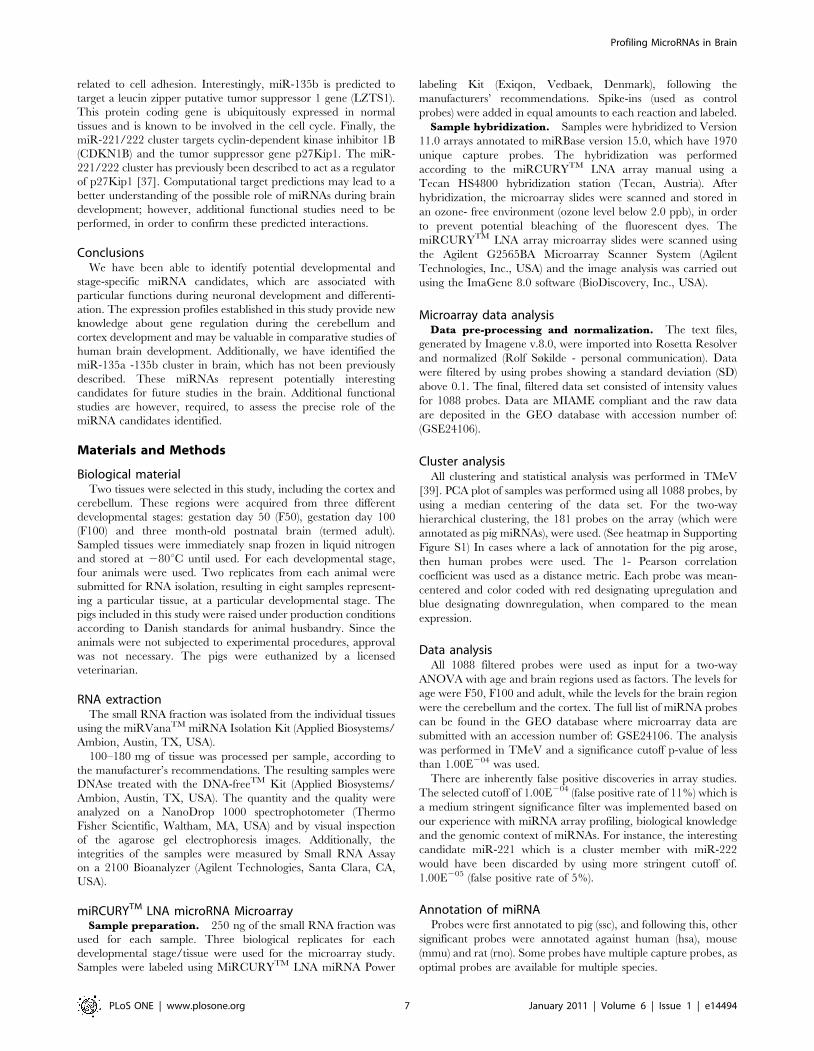
Expression profiles of each miRNA were evaluated. A one
factor ANOVA test yielded P-values ranging from 9.76E217 to
2.02E210 which indicated that the results were statistically
significant (see Supporting Table S1, and Figure 4 for specific
comparisons). We could distinguish four miRNA groups which
were grouped according to the temporal changes in expression.
The first group included miR-17, miR-18a and miR-106a. All
three belong to the same family and miR-17 and miR-18a belong
to the same cluster. These miRNAs exhibited a significant
decrease in expression, which co-incided with developmental
progression in the cerebellum and even more so, in the cortex.
MiR-17, miR-18 and miR-106a showed up to 19, 28 and 21 fold
change differences in expression in F50 versus adult tissue, with
the highest level of expression observed at F50, independent of the
brain tissue type (Figure 4). Co-expression of miR-17 and miR-18
has also been previously shown in rat and monkey brain, by Miska
et al. [22]. Both miRNAs were highly expressed in the fetal tissues,
followed by a decrease of the expression in the adult. MiR-17 and
miR-106a play a role in the regulation of amyloid precursor
protein (APP), which is known to be involved in familial
Alzheimer’s disease. Furthermore, a strong correlation between
miR-17, miR-106a and APP has been observed in differentiating
neurons and during brain development [32].
A second pattern of expression was detected for miR-29c. This
miRNA increased in expression during development. Expression
of miR-29c was 22- and 18-fold higher in the adult cortex and
cerebellum respectively, than in the corresponding tissues at F50
(Figure 4). Higher expression in the adult brain could be associated
with a potential role of miRNA in neuron maintenance or in
regulation of synaptic plasticity or long-term memory. The miR-
29 family (miR-29a, miR-29b and miR-29c) has previously been
shown to be effective biomarkers of radiation-induced brain
responses [29]. In addition, the miR-29 family is associated with
the up-regulation of the tumor suppressor p53, which is central to
many cellular stress responses and for inducing apoptosis [31].
A third group is represented by two miRNAs belonging to the
same cluster, namely, miR-135a and miR-135b. As expected, we
observed very high expression in the cerebellum at F50, followed
by a dramatic decrease in expression during later brain
development. A comparison between F50 cerebellum and the
other tissues and developmental stages gave significant p-values
(p,0.001) for both these miRNAs. In addition, miR-135b was
highly expressed in the adult cerebellum. Interestingly miR-135a
and miR-135b have previously been described in prostate cancer
[33], breast cancer [34], as well as involved in osteoblastic
differentiation (by regulating expression of bone-related genes)
[35]. However, their expression profile has not been previously
described in the brain.
Figure 2. Heatmap of microRNA expression profiles in thedeveloping porcine brain, with developmental stage being themain source of variation. Developmental stage-dependent micro-RNA (miRNA) expression determines the clustering. Statisticallysignificant miRNAs (p-value ,9.39E205, selected by ANOVA test) arepresented. Three replicates from each stage and tissue cluster together.The blue color denotes downregulated expression and the red colordenotes upregulated expression level from the mean. Columns androws represent samples and particular miRNAs, respectively. F50 andF100 stand for fetus gestation day 50 and fetus gestation day 100,respectively.doi:10.1371/journal.pone.0014494.g002
Profiling MicroRNAs in Brain
PLoS ONE | www.plosone.org 4 January 2011 | Volume 6 | Issue 1 | e14494
The last two miRNAs: miR-221 and miR-222, which belong to
the same cluster, constitute the fourth group of expression pattern
observed. Similar to the cluster described above, these two miRNAs
exhibited decreasing expression during development in the cortex
and increasing expression during development in the cerebellum. It
has previously been described that the miR-221/222 cluster shares
a similar expression pattern in the adult hypothalamus [36]. The
observed decrease of expression in the cortex of both miRNAs was
found to be statistically significant with p,0.01. In the case of the
cerebellum, there was no significant difference in expression in fetal
tissues (F50 and F100), however, expression levels in the adult
cerebellum were significantly higher (p,0.001). The miR-221/222
cluster has been found to be expressed in adult brain [30].
Moreover, Zhang et al., [37] proposed that miR-221/222 may act as
regulators of the tumor suppressor gene p27Kip1. When miR-221/
222 expression is co-suppressed, such as in advanced human
gliomas, inhibition of glioma cell proliferation by a mechanism
involving the up-regulation of p27Kip is observed. In yet another
study, the miR-221/222 cluster was shown to directly target the 39
UTR regions of p27 and p57 mRNAs, which reduces reporter gene
expression. Such an interaction is strongly linked to a cell cycle
checkpoint that ensures cell survival, by being involved in the co-
ordination of cell proliferation [38]. This might potentially explain
why miR-221 and miR-222 are highly expressed in the cortex
during early fetal life, when neuron terminal differentiation in the
cortex and cerebellum is abundant. High expression of these two
candidates in the cerebellum of the adult brain might be related to
the fact that the growth spurt appears later in the cerebellum
compared to the cortex, and that the cerebellum continues to
develop after birth [27].
The overall expression profiling results identified a number of
miRNAs that could be important for region-, or stage-specific
functions within the brain. Moreover, we have revealed an
interesting and novel expression pattern of the miR-135a and
miR-135b cluster in the brain.
Correlation between microarray and qPCR dataA comparison between microarray probe intensities and qPCR
fold changes indicated that different miRNAs had different levels
of correlation, varying from R2 = 0.81 to R2 = 0.95. The
correlation coefficient values (R2) for particular miRNAs include:
miR-17 (R2 = 0.84), miR-18a (R2 = 0.94), miR-29c (R2 = 0.92),
miR-106a (R2 = 0.81) and miR-135a (R2 = 0.89) miR-135b
(R2 = 0.95), miR-221 (R2 = 0.91) and miR-222 (R2 = 0.88). Thus,
the overall correlation between microarray and qPCR results was
extremely high. These results strengthen our reported outcomes
compared to other studies, where a rather poor degree of
correlation has been reported for some miRNAs [30].
Computational prediction of miRNA targetsTargetScan was used to identify putative targets for selected
miRNA candidate. In order to make the search more specific, only
Figure 3. Heatmap of microRNA expression profiles in thedeveloping porcine brain, with developmental stage as well asthe tissue being the source of variation. Clustering of the samplesis determined by the microRNA (miRNA) expression influenced by thedevelopmental stage and tissue. Statistically significant miRNAs (p-value,9.95E206) are presented. Three replicates from each stage and tissuecluster together. The blue color denotes downregulated expression andthe red color denotes upregulated expression level from the mean.Columns and rows represent samples and particular miRNAs, respec-tively. F50 and F100 stand for fetus gestation day 50 and fetus gestationday 100, respectively.doi:10.1371/journal.pone.0014494.g003
Profiling MicroRNAs in Brain
PLoS ONE | www.plosone.org 5 January 2011 | Volume 6 | Issue 1 | e14494

the most significant gene targets were taken into consideration.
The same predicted targets were found for miR-17 and miR-106a.
This is due to a high sequence similarity of these two miRNAs.
One of the interesting targets included the myelin transcription
factor 1-like (MYT1L) gene, which is considered to play a role in
the development of neurons and oligodendroglia in the CNS.
MiR-18a is predicted to target another CNS related gene, i.e. the
neural precursor cell expressed developmentally down-regulated
protein 9 (NEDD9). NEDD9 is a docking protein which plays a
central co-ordinating role for tyrosine-kinase-based signalling
Figure 4. Quantitative PCR expression profiles of selected microRNAs. MicroRNA specific qPCR expression profiles. Expression ratesbetween various samples are presented by fold changes in relation to the lowest, normalized expressed value. The error bars of qPCR represent astandard deviation of the mean of 16 replicates.doi:10.1371/journal.pone.0014494.g004
Profiling MicroRNAs in Brain
PLoS ONE | www.plosone.org 6 January 2011 | Volume 6 | Issue 1 | e14494
related to cell adhesion. Interestingly, miR-135b is predicted to
target a leucin zipper putative tumor suppressor 1 gene (LZTS1).
This protein coding gene is ubiquitously expressed in normal
tissues and is known to be involved in the cell cycle. Finally, the
miR-221/222 cluster targets cyclin-dependent kinase inhibitor 1B
(CDKN1B) and the tumor suppressor gene p27Kip1. The miR-
221/222 cluster has previously been described to act as a regulator
of p27Kip1 [37]. Computational target predictions may lead to a
better understanding of the possible role of miRNAs during brain
development; however, additional functional studies need to be
performed, in order to confirm these predicted interactions.
ConclusionsWe have been able to identify potential developmental and
stage-specific miRNA candidates, which are associated with
particular functions during neuronal development and differenti-
ation. The expression profiles established in this study provide new
knowledge about gene regulation during the cerebellum and
cortex development and may be valuable in comparative studies of
human brain development. Additionally, we have identified the
miR-135a -135b cluster in brain, which has not been previously
described. These miRNAs represent potentially interesting
candidates for future studies in the brain. Additional functional
studies are however, required, to assess the precise role of the
miRNA candidates identified.
Materials and Methods
Biological materialTwo tissues were selected in this study, including the cortex and
cerebellum. These regions were acquired from three different
developmental stages: gestation day 50 (F50), gestation day 100
(F100) and three month-old postnatal brain (termed adult).
Sampled tissues were immediately snap frozen in liquid nitrogen
and stored at 280uC until used. For each developmental stage,
four animals were used. Two replicates from each animal were
submitted for RNA isolation, resulting in eight samples represent-
ing a particular tissue, at a particular developmental stage. The
pigs included in this study were raised under production conditions
according to Danish standards for animal husbandry. Since the
animals were not subjected to experimental procedures, approval
was not necessary. The pigs were euthanized by a licensed
veterinarian.
RNA extractionThe small RNA fraction was isolated from the individual tissues
using the miRVanaTM miRNA Isolation Kit (Applied Biosystems/
Ambion, Austin, TX, USA).
100–180 mg of tissue was processed per sample, according to
the manufacturer’s recommendations. The resulting samples were
DNAse treated with the DNA-freeTM Kit (Applied Biosystems/
Ambion, Austin, TX, USA). The quantity and the quality were
analyzed on a NanoDrop 1000 spectrophotometer (Thermo
Fisher Scientific, Waltham, MA, USA) and by visual inspection
of the agarose gel electrophoresis images. Additionally, the
integrities of the samples were measured by Small RNA Assay
on a 2100 Bioanalyzer (Agilent Technologies, Santa Clara, CA,
USA).
miRCURYTM LNA microRNA MicroarraySample preparation. 250 ng of the small RNA fraction was
used for each sample. Three biological replicates for each
developmental stage/tissue were used for the microarray study.
Samples were labeled using MiRCURYTM LNA miRNA Power
labeling Kit (Exiqon, Vedbaek, Denmark), following the
manufacturers’ recommendations. Spike-ins (used as control
probes) were added in equal amounts to each reaction and labeled.
Sample hybridization. Samples were hybridized to Version
11.0 arrays annotated to miRBase version 15.0, which have 1970
unique capture probes. The hybridization was performed
according to the miRCURYTM LNA array manual using a
Tecan HS4800 hybridization station (Tecan, Austria). After
hybridization, the microarray slides were scanned and stored in
an ozone- free environment (ozone level below 2.0 ppb), in order
to prevent potential bleaching of the fluorescent dyes. The
miRCURYTM LNA array microarray slides were scanned using
the Agilent G2565BA Microarray Scanner System (Agilent
Technologies, Inc., USA) and the image analysis was carried out
using the ImaGene 8.0 software (BioDiscovery, Inc., USA).
Microarray data analysisData pre-processing and normalization. The text files,
generated by Imagene v.8.0, were imported into Rosetta Resolver
and normalized (Rolf Søkilde - personal communication). Data
were filtered by using probes showing a standard deviation (SD)
above 0.1. The final, filtered data set consisted of intensity values
for 1088 probes. Data are MIAME compliant and the raw data
are deposited in the GEO database with accession number of:
(GSE24106).
Cluster analysisAll clustering and statistical analysis was performed in TMeV
[39]. PCA plot of samples was performed using all 1088 probes, by
using a median centering of the data set. For the two-way
hierarchical clustering, the 181 probes on the array (which were
annotated as pig miRNAs), were used. (See heatmap in Supporting
Figure S1) In cases where a lack of annotation for the pig arose,
then human probes were used. The 1- Pearson correlation
coefficient was used as a distance metric. Each probe was mean-
centered and color coded with red designating upregulation and
blue designating downregulation, when compared to the mean
expression.
Data analysisAll 1088 filtered probes were used as input for a two-way
ANOVA with age and brain regions used as factors. The levels for
age were F50, F100 and adult, while the levels for the brain region
were the cerebellum and the cortex. The full list of miRNA probes
can be found in the GEO database where microarray data are
submitted with an accession number of: GSE24106. The analysis
was performed in TMeV and a significance cutoff p-value of less
than 1.00E204 was used.
There are inherently false positive discoveries in array studies.
The selected cutoff of 1.00E204 (false positive rate of 11%) which is
a medium stringent significance filter was implemented based on
our experience with miRNA array profiling, biological knowledge
and the genomic context of miRNAs. For instance, the interesting
candidate miR-221 which is a cluster member with miR-222
would have been discarded by using more stringent cutoff of.
1.00E205 (false positive rate of 5%).
Annotation of miRNAProbes were first annotated to pig (ssc), and following this, other
significant probes were annotated against human (hsa), mouse
(mmu) and rat (rno). Some probes have multiple capture probes, as
optimal probes are available for multiple species.
Profiling MicroRNAs in Brain
PLoS ONE | www.plosone.org 7 January 2011 | Volume 6 | Issue 1 | e14494

qPCRcDNA synthesis. Synthesis of cDNA for miRNA qPCR was
performed as a one tube reaction where polyA tailing and reverse
transcription was conducted simultaneously (Exiqon, Vedbaek,
Denmark). Two technical replicates were used for reverse
transcription, resulting in 16 cDNA samples for each particular
stage and tissue. Briefly, 10 ng of the small RNA fractions was
used for cDNA synthesis in a 10 ml reaction. The resulting cDNA
was diluted 8 times and 1 ml was used for each qPCR reaction.
Each miRNA candidate was evaluated in a total panel of 96
samples.
Candidate genesEight different candidate miRNAs: hsa-miR-17, hsa-miR-18a,
hsa-miR-29c, hsa-miR-106a, hsa-miR-135a hsa-miR-135b, hsa-
miR-221 hsa-miR-222 and two reference miRNAs: hsa-miR-103
and hsa-miR-191 were profiled by qPCR. The choice of candidate
genes was based on the statistical significance obtained following
an ANOVA test of the microarray results (see results section). The
choice of reference genes was based on recommendation from the
literature [40].
qPCR reactionOne qPCR reaction per sample for each miRNA candidate was
performed, using 5 ml of QuantiFast SYBR Green PCR master
mix (Qiagen, Germany), 0.25 mM of each primer, 1 ml of 8x
diluted cDNA, milliQ water up to 10 ml total reaction volume.
PCR amplification was performed in white PCR plates (ABgene,
Epsom, UK); on an MX3000P machine (Stratagene, Le Jolla, CA,
USA). The cycling conditions were: 1 cycle at 95uC/10 min,
followed by 40 two-segment cycles of amplification (95uC/30 sec,
60uC/60 sec. The fluorescence was automatically measured
during the PCR, and one three-segment cycle of the product
melting curve was performed (95uC/1 min, 55uC/30 sec, 95uC/
30 sec). Mx3000/Mx Pro software was used to construct a melting
curve. Standard curves with 5 fold dilutions (made from the pool
consisting of equal amounts of the 96 cDNA samples), were
performed for each assay and the PCR efficiency calculations were
based on the slopes of the standard curves. Quantification cycle
(Cq) and initial template quantities for each reaction were
determined with use of the baseline adjustment method from the
Mx3000/MxPro software (Stratagene, Le Jolla, CA, USA).
qPCR data analysisQuantities of each sample were used for the analysis. GeNorm
software was used to analyze the stability of the reference genes:
miR-103 and miR-191. An M value below 1.5, which represents
gene stability, was considered as acceptable. The two reference
genes, namely miR-191 and miR-103 (M value for both was
0.787), were used for calculation of normalization factors (NF).
Samples were normalized by the NF and fold changes were
calculated in relation to the lowest, normalized expressed value,
and then tested for normal distribution by GraphPad InStat 3
software. The one factor Analysis of Variance (ANOVA) statistical
test was performed to test for significant differences between the
means of the analyzed groups (for detailed comparisons see
Supporting Table S1).
Supporting Information
Figure S1 Heatmap of microRNA expression profiles for all
high quality probes. Heat maps showing relative expression values
of all high quality probes. F100 refers to fetus gestation day 100.
F50 refers to fetus gestation day 50. The blue color denotes down
regulation expression and alternately, the red color denotes up
regulation expression levels above the mean. Columns and rows
represent samples and particular microRNAs, respectively.
Found at: doi:10.1371/journal.pone.0014494.s001 (9.10 MB TIF)
Table S1 The results of Tukey-Kramer multiple comparisons
test between each sample group representing particular develop-
mental stage and tissue. One-way ANOVA was applied to
determine the probability values presented.
Found at: doi:10.1371/journal.pone.0014494.s002 (0.02 MB
XLS)
Table S2 The list of probability values following ANOVA
analysis of the microarray data, resulted in a number of
microRNA (miRNA) candidates chosen for qPCR validation. P-
values for miR-221/222 were obtained when both stage and tissue
was considered statistically variable. Values for other miRNAs
were obtained when the developmental stage was the considered
variable. Ssc and hsa stand for Sus scrofa and Homo sapiens
probe, respectively.
Found at: doi:10.1371/journal.pone.0014494.s003 (0.02 MB
XLS)
Acknowledgments
The authors would like to thank Mette T. Christensen and Minna
Jakobsen for excellent technical assistance regarding qPCR.
Author Contributions
Conceived and designed the experiments: PKB TL MF SC. Performed the
experiments: AP BK PKB RS. Analyzed the data: AP BK PKB RS TL.
Contributed reagents/materials/analysis tools: MF. Wrote the paper: AP
SC.
References
1. Guo H, Ingolia NT, Weissman JS, Bartel DP (2010) Mammalian microRNAs
predominantly act to decrease target mRNA levels. Nature 466: 835–840.
nature09267 [pii];10.1038/nature09267.
2. Schetter AJ, Heegaard NH, Harris CC (2010) Inflammation and cancer:
interweaving microRNA, free radical, cytokine and p53 pathways. Carcinogen-
esis 31: 37–49. bgp272 [pii];10.1093/carcin/bgp272.
3. Griffiths-Jones S (2006) miRBase: the microRNA sequence database. Me-
thods Mol Biol 342: 129–138. 1-59745-123-1:129 [pii];10.1385/1-59745-123-
1:129.
4. Kim J, Bartel DP (2009) Allelic imbalance sequencing reveals that single-
nucleotide polymorphisms frequently alter microRNA-directed repression. Nat
Biotechnol 27: 472–477. nbt.1540 [pii];10.1038/nbt.1540.
5. McDaneld TG, Smith TP, Doumit ME, Miles JR, Coutinho LL, et al. (2009)
MicroRNA transcriptome profiles during swine skeletal muscle develop-
ment. BMC Genomics 10: 77. 1471-2164-10-77 [pii];10.1186/1471-2164-10-
77.
6. Cho IS, Kim J, Seo HY, Lim DH, Hong JS, et al. (2010) Cloning and
characterization of microRNAs from porcine skeletal muscle and adipose tissue.
Mol Biol Rep; 10.1007/s11033-010-0005-6.
7. Xie SS, Huang TH, Shen Y, Li XY, Zhang XX, et al. (2010) Identification and
characterization of microRNAs from porcine skeletal muscle. Anim Genet 41:
179–190. AGE1991 [pii];10.1111/j.1365-2052.2009.01991.x.
8. Xiao B, Zhang X, Li Y, Tang Z, Yang S, et al. (2009) Identification,
bioinformatic analysis and expression profiling of candidate mRNA-like non-
coding RNAs in Sus scrofa. J Genet Genomics 36: 695–702. S1673-
8527(08)60162-9 [pii];10.1016/S1673-8527(08)60162-9.
9. Zhou B, Liu HL (2010) Computational identification of new porcine
microRNAs and their targets. Anim Sci J 81: 290–296. ASJ742 [pii];10.1111/
j.1740-0929.2010.00742.x.
10. Huang TH, Zhu MJ, Li XY, Zhao SH (2008) Discovery of porcine microRNAs
and profiling from skeletal muscle tissues during development. PLoS One 3:
e3225. 10.1371/journal.pone.0003225.
Profiling MicroRNAs in Brain
PLoS ONE | www.plosone.org 8 January 2011 | Volume 6 | Issue 1 | e14494
11. Reddy AM, Zheng Y, Jagadeeswaran G, Macmil SL, Graham WB, et al. (2009)
Cloning, characterization and expression analysis of porcine microRNAs. BMC
Genomics 10: 65.: 65.
12. Sharbati S, Friedlander MR, Sharbati J, Hoeke L, Chen W, et al. (2010)
Deciphering the porcine intestinal microRNA transcriptome. BMC Genomics
11: 275. 1471-2164-11-275 [pii];10.1186/1471-2164-11-275.
13. Nielsen M, Hansen JH, Hedegaard J, Nielsen RO, Panitz F, et al. (2010)
MicroRNA identity and abundance in porcine skeletal muscles determined by
deep sequencing. Anim Genet 41: 159–168. AGE1981 [pii];10.1111/j.1365-
2052.2009.01981.x.
14. Li M, Xia Y, Gu Y, Zhang K, Lang Q, et al. (2010) MicroRNAome of porcine pre-
and postnatal development. PLoS One 5: e11541. 10.1371/journal.pone.0011541.
15. Babak T, Zhang W, Morris Q, Blencowe BJ, Hughes TR (2004) Probing
microRNAs with microarrays: tissue specificity and functional inference. RNA
10: 1813–1819. 10/11/1813 [pii];10.1261/rna.7119904.
16. Wheeler G, Ntounia-Fousara S, Granda B, Rathjen T, Dalmay T (2006)
Identification of new central nervous system specific mouse microRNAs. FEBS Lett
580: 2195–2200. S0014-5793(06)00320-6 [pii];10.1016/j.febslet.2006.03.019.
17. Lagos-Quintana M, Rauhut R, Lendeckel W, Tuschl T (2001) Identification of
novel genes coding for small expressed RNAs. Science 294: 853–858. 10.1126/
science.1064921.
18. Lee RC, Ambros V (2001) An extensive class of small RNAs in Caenorhabditis
elegans. Science 294: 862–864. 10.1126/science.1065329.
19. Sempere LF, Freemantle S, Pitha-Rowe I, Moss E, Dmitrovsky E, et al. (2004)
Expression profiling of mammalian microRNAs uncovers a subset of brain-
expressed microRNAs with possible roles in murine and human neuronal
differentiation. Genome Biol 5: R13. 10.1186/gb-2004-5-3-r13;gb-2004-5-3-
r13.
20. Gao FB (2008) Posttranscriptional control of neuronal development by
microRNA networks. Trends Neurosci 31: 20–26. S0166-2236(07)00295-0
[pii];10.1016/j.tins.2007.10.004.
21. Krichevsky AM, King KS, Donahue CP, Khrapko K, Kosik KS (2003) A
microRNA array reveals extensive regulation of microRNAs during brain
development. RNA 9: 1274–1281.
22. Miska EA, Alvarez-Saavedra E, Townsend M, Yoshii A, Sestan N, et al. (2004)
Microarray analysis of microRNA expression in the developing mammalian
brain. Genome Biol 5: R68. 10.1186/gb-2004-5-9-r68;gb-2004-5-9-r68.
23. Kauppinen S, Vester B, Wengel J (2006) Locked nucleic acid: high-affinity
targeting of complementary RNA for RNomics. Handb Exp Pharmacol. pp
405–422.
24. Bak M, Silahtaroglu A, Moller M, Christensen M, Rath MF, et al. (2008)
MicroRNA expression in the adult mouse central nervous system. RNA 14:
432–444. rna.783108;10.1261/rna.783108.
25. Lind NM, Moustgaard A, Jelsing J, Vajta G, Cumming P, et al. (2007) The use
of pigs in neuroscience: modeling brain disorders. Neurosci Biobehav Rev 31:
728–751. S0149-7634(07)00019-X;10.1016/j.neubiorev.2007.02.003.
26. Larsell O (1954) The development of the cerebellum of the pig. Anat Rec 118:
73–107.
27. Pond WG, Boleman SL, Fiorotto ML, Ho H, Knabe DA, et al. (2000) Perinatal
ontogeny of brain growth in the domestic pig. Proc Soc Exp Biol Med 223:102–108. pse22314.
28. Coolen M, Bally-Cuif L (2009) MicroRNAs in brain development and
physiology. Curr Opin Neurobiol 19: 461–470. S0959-4388(09)00128-7[pii];10.1016/j.conb.2009.09.006.
29. Koturbash I, Zemp F, Kolb B, Kovalchuk O (2010) Sex-specific radiation-induced microRNAome responses in the hippocampus, cerebellum and frontal
cortex in a mouse model. Mutat Res;S1383-5718(10)00173-7 [pii];10.1016/
j.mrgentox.2010.05.007.30. Olsen L, Klausen M, Helboe L, Nielsen FC, Werge T (2009) MicroRNAs show
mutually exclusive expression patterns in the brain of adult male rats. PLoS One4: e7225. 10.1371/journal.pone.0007225.
31. Park SY, Lee JH, Ha M, Nam JW, Kim VN (2009) miR-29 miRNAs activatep53 by targeting p85 alpha and CDC42. Nat Struct Mol Biol 16: 23–29.
nsmb.1533 [pii];10.1038/nsmb.1533.
32. Hebert SS, Horre K, Nicolai L, Bergmans B, Papadopoulou AS, et al. (2009)MicroRNA regulation of Alzheimer’s Amyloid precursor protein expre-
ssion. Neurobiol Dis 33: 422–428. S0969-9961(08)00298-2 [pii];10.1016/j.nbd.2008.11.009.
33. Wang G, Wang Y, Feng W, Wang X, Yang JY, et al. (2008) Transcription factor
and microRNA regulation in androgen-dependent and -independent prostatecancer cells. BMC Genomics 9(Suppl 2): S22. 1471-2164-9-S2-S22
[pii];10.1186/1471-2164-9-S2-S22.34. Lowery AJ, Miller N, Devaney A, McNeill RE, Davoren PA, et al. (2009)
MicroRNA signatures predict oestrogen receptor, progesterone receptor andHER2/neu receptor status in breast cancer. Breast Cancer Res 11: R27.
bcr2257 [pii];10.1186/bcr2257.
35. Schaap-Oziemlak AM, Raymakers RA, Bergevoet SM, Gilissen C, Jansen BJ,et al. (2010) MicroRNA hsa-miR-135b regulates mineralization in osteogenic
differentiation of human unrestricted somatic stem cells. Stem Cells Dev 19:877–885. 10.1089/scd.2009.0112.
36. Kapsimali M, Kloosterman WP, de BE, Rosa F, Plasterk RH, et al. (2007)
MicroRNAs show a wide diversity of expression profiles in the developing andmature central nervous system. Genome Biol 8: R173. gb-2007-8-8-r173
[pii];10.1186/gb-2007-8-8-r173.37. Zhang C, Kang C, You Y, Pu P, Yang W, et al. (2009) Co-suppression of miR-
221/222 cluster suppresses human glioma cell growth by targeting p27kip1 invitro and in vivo. Int J Oncol 34: 1653–1660.
38. Medina R, Zaidi SK, Liu CG, Stein JL, van Wijnen AJ, et al. (2008) MicroRNAs
221 and 222 bypass quiescence and compromise cell survival. Cancer Res 68:2773–2780. 68/8/2773 [pii];10.1158/0008-5472.CAN-07-6754.
39. Saeed AI, Bhagabati NK, Braisted JC, Liang W, Sharov V, et al. (2006) TM4microarray software suite. Methods Enzymol 411: 134–193. S0076-
6879(06)11009-5 [pii];10.1016/S0076-6879(06)11009-5.
40. Peltier HJ, Latham GJ (2008) Normalization of microRNA expression levels inquantitative RT-PCR assays: identification of suitable reference RNA targets in
normal and cancerous human solid tissues. RNA 14: 844–852. rna.939908[pii];10.1261/rna.939908.
Profiling MicroRNAs in Brain
PLoS ONE | www.plosone.org 9 January 2011 | Volume 6 | Issue 1 | e14494
Related Documents