RESEARCH ARTICLE Open Access MicroRNA expression profile in head and neck cancer: HOX-cluster embedded microRNA-196a and microRNA-10b dysregulation implicated in cell proliferation Patricia Severino 1* , Holger Brüggemann 2 , Flavia Maziero Andreghetto 1 , Carme Camps 3 , Maria de Fatima Garrido Klingbeil 4 , Welbert Oliveira de Pereira 1 , Renata Machado Soares 1 , Raquel Moyses 5 , Victor Wünsch-Filho 6 , Monica Beatriz Mathor 4 , Fabio Daumas Nunes 7 , Jiannis Ragoussis 2 and Eloiza Helena Tajara 8 Abstract Background: Current evidence implicates aberrant microRNA expression patterns in human malignancies; measurement of microRNA expression may have diagnostic and prognostic applications. Roles for microRNAs in head and neck squamous cell carcinomas (HNSCC) are largely unknown. HNSCC, a smoking-related cancer, is one of the most common malignancies worldwide but reliable diagnostic and prognostic markers have not been dis- covered so far. Some studies have evaluated the potential use of microRNA as biomarkers with clinical application in HNSCC. Methods: MicroRNA expression profile of oral squamous cell carcinoma samples was determined by means of DNA microarrays. We also performed gain-of-function assays for two differentially expressed microRNA using two squamous cell carcinoma cell lines and normal oral keratinocytes. The effect of the over-expression of these molecules was evaluated by means of global gene expression profiling and cell proliferation assessment. Results: Altered microRNA expression was detected for a total of 72 microRNAs. Among these we found well studied molecules, such as the miR-17-92 cluster, comprising potent oncogenic microRNA, and miR-34, recently found to interact with p53. HOX-cluster embedded miR-196a/b and miR-10b were up- and down-regulated, respectively, in tumor samples. Since validated HOX gene targets for these microRNAs are not consistently deregulated in HNSCC, we performed gain-of-function experiments, in an attempt to outline their possible role. Our results suggest that both molecules interfere in cell proliferation through distinct processes, possibly targeting a small set of genes involved in cell cycle progression. Conclusions: Functional data on miRNAs in HNSCC is still scarce. Our data corroborate current literature and brings new insights into the role of microRNAs in HNSCC. We also show that miR-196a and miR-10b, not previously associated with HNSCC, may play an oncogenic role in this disease through the deregulation of cell proliferation. The study of microRNA alterations in HNSCC is an essential step to the mechanistic understanding of tumor formation and could lead to the discovery of clinically relevant biomarkers. * Correspondence: [email protected] 1 Albert Einstein Research and Education Institute, Hospital Israelita Albert Einstein, Sao Paulo, Brazil Full list of author information is available at the end of the article © 2013 Severino et al.; licensee BioMed Central Ltd. This is an open access article distributed under the terms of the Creative Commons Attribution License (http://creativecommons.org/licenses/by/2.0), which permits unrestricted use, distribution, and reproduction in any medium, provided the original work is properly cited. Severino et al. BMC Cancer 2013, 13:533 http://www.biomedcentral.com/1471-2407/13/533

Welcome message from author
This document is posted to help you gain knowledge. Please leave a comment to let me know what you think about it! Share it to your friends and learn new things together.
Transcript

Severino et al. BMC Cancer 2013, 13:533http://www.biomedcentral.com/1471-2407/13/533
RESEARCH ARTICLE Open Access
MicroRNA expression profile in head and neckcancer: HOX-cluster embedded microRNA-196aand microRNA-10b dysregulation implicated incell proliferationPatricia Severino1*, Holger Brüggemann2, Flavia Maziero Andreghetto1, Carme Camps3,Maria de Fatima Garrido Klingbeil4, Welbert Oliveira de Pereira1, Renata Machado Soares1, Raquel Moyses5,Victor Wünsch-Filho6, Monica Beatriz Mathor4, Fabio Daumas Nunes7, Jiannis Ragoussis2 and Eloiza Helena Tajara8
Abstract
Background: Current evidence implicates aberrant microRNA expression patterns in human malignancies;measurement of microRNA expression may have diagnostic and prognostic applications. Roles for microRNAs inhead and neck squamous cell carcinomas (HNSCC) are largely unknown. HNSCC, a smoking-related cancer, is oneof the most common malignancies worldwide but reliable diagnostic and prognostic markers have not been dis-covered so far. Some studies have evaluated the potential use of microRNA as biomarkers with clinical applicationin HNSCC.
Methods: MicroRNA expression profile of oral squamous cell carcinoma samples was determined by means of DNAmicroarrays. We also performed gain-of-function assays for two differentially expressed microRNA using twosquamous cell carcinoma cell lines and normal oral keratinocytes. The effect of the over-expression of thesemolecules was evaluated by means of global gene expression profiling and cell proliferation assessment.
Results: Altered microRNA expression was detected for a total of 72 microRNAs. Among these we found wellstudied molecules, such as the miR-17-92 cluster, comprising potent oncogenic microRNA, and miR-34, recentlyfound to interact with p53. HOX-cluster embedded miR-196a/b and miR-10b were up- and down-regulated,respectively, in tumor samples. Since validated HOX gene targets for these microRNAs are not consistentlyderegulated in HNSCC, we performed gain-of-function experiments, in an attempt to outline their possible role. Ourresults suggest that both molecules interfere in cell proliferation through distinct processes, possibly targeting a smallset of genes involved in cell cycle progression.
Conclusions: Functional data on miRNAs in HNSCC is still scarce. Our data corroborate current literature andbrings new insights into the role of microRNAs in HNSCC. We also show that miR-196a and miR-10b, not previouslyassociated with HNSCC, may play an oncogenic role in this disease through the deregulation of cell proliferation. Thestudy of microRNA alterations in HNSCC is an essential step to the mechanistic understanding of tumor formation andcould lead to the discovery of clinically relevant biomarkers.
* Correspondence: [email protected] Einstein Research and Education Institute, Hospital Israelita AlbertEinstein, Sao Paulo, BrazilFull list of author information is available at the end of the article
© 2013 Severino et al.; licensee BioMed Central Ltd. This is an open access article distributed under the terms of the CreativeCommons Attribution License (http://creativecommons.org/licenses/by/2.0), which permits unrestricted use, distribution, andreproduction in any medium, provided the original work is properly cited.

Severino et al. BMC Cancer 2013, 13:533 Page 2 of 15http://www.biomedcentral.com/1471-2407/13/533
BackgroundMicroRNAs (miRNAs) are ~22 nt non-coding RNAmolecules that negatively regulate gene expression bydegrading or destabilizing the messenger RNA (mRNA)or by inhibiting protein translation [1]; some reportsdemonstrate that they may also function as positive reg-ulators [2,3]. MiRNAs have been shown to contribute tocancer development and progression, and are differen-tially expressed between normal tissues and cancers [4].Although the function of most of the miRNAs identifiedto date has yet to be determined, their use as potentialbiomarkers or therapeutic targets has been considered inseveral human diseases and cancers [5,6].Head and neck squamous cell carcinoma (HNSCC) is a
significant public health entity, representing the sixth lead-ing cancer by incidence worldwide [7,8]. Genetic changesthat bring about HNSCC are usually a consequence ofcontinued exposure to carcinogens associated with to-bacco. Despite advances in medical and surgical treatment,the overall 5-year survival rate for patients with HNSCCremains around 50% [8]. A recent work by Liu et al., 2009[9] analyzed data compiled by the American Cancer Soci-ety and points out that new cases of HNSCC increased25% during the past 5 years, highlighting the need for abetter understanding of the molecular events leading tothe development of this disease.The number of studies addressing the contribution of
miRNA deregulation in the context of HNSCC is, how-ever, limited [10,11]. Some of these studies have evalu-ated the potential use of miRNAs as biomarkers withclinical application, associating the expression levels ofsome of these miRNAs with survival rates or metastaticpotential [12-16]. Overall, results are promising, but stillpreliminary and lacking corroboration.In our study we determined the miRNA expression
profile of oral squamous cell carcinoma (OSCC) sam-ples, a type of cancer that represents 90% of all HNSCC[9]. We also performed functional assays for two differ-entially expressed miRNAs, miR-196 and miR-10b, sinceneither have been previously associated with HNSCC.Despite studies linking these miRNAs to the regulationof homeobox (HOX) genes [17,18] our data suggest that,in the case of HNSCC, they have little impact in HOXgene expression. We demonstrate that miR-10b andmiR-196a interfere in cell proliferation through distinctprocesses and in a cell-type dependent manner.
MethodsSamplesFifteen patients with OSCC (tongue and floor of themouth) were selected for the microarray experiments. Inorder to validate the microarray results, 35 additionalpatients with HNSCC (oral cavity, oropharynx and lar-ynx) were selected. The clinical and pathological profile
of patients is shown in Table 1. The average age of pa-tients was 55.5 years (SD 9.8, range 38–82 years), andthe male/female ratio was 24:1. Most patients weresmokers or former smokers and had a history of chronicalcohol abuse. Tumor and corresponding cancer freesurgical margins containing the corresponding epithe-lium were collected from patients submitted to surgicalresection of primary tumor at Hospital das Clinicas,Hospital Heliopolis and Arnaldo Vieira de CarvalhoCancer Institute, in Sao Paulo, Brazil. All patients pro-vided written informed consent, and the research proto-col was approved by review boards of all institutionsinvolved and by the National Committee of Ethics in Re-search (CONEP 1763/05). Samples corresponding to theoral cavity, base of the tongue and larynx were snap-frozen in liquid nitrogen immediately after surgery andstored in liquid nitrogen until RNA preparation. Frozensamples were sectioned using a cryostat, and tissue sec-tions were stained with RNAse-free reagents. Analysis ofhematoxylin and eosin-stained sections by the study pa-thologists confirmed >75% tumor cells in all HNSCCsamples and that surgical margins were tumor-free. Thediagnosis of HNSCC was confirmed, and tumors werehistologically examined for perineural invasion (tumorcells in the perineural space or epineurium), tumor dif-ferentiation (well, moderated or poorly differentiated, ac-cording to the WHO guidelines), lymphatic-vascularinvasion, surgical margins, and lymph node metastasis.Tumors were staged according to the TNM clinical sta-ging system, as proposed by the International UnionAgainst Cancer.
RNA isolationTotal RNA was prepared from tissue using mirVanamiRNA Isolation Kit (Ambion, Austin, TX) in compli-ance with the manufacturer’s protocol. RNA integrityand concentration were assessed using the RNA 6000Nano Assay kit with Agilent 2100 Bioanalyzer accordingto the manufacturer’s instructions (Agilent Technolo-gies, Palo Alto, CA).
miRNA microarray expression profilingMiRNA expression profiling was performed using theIllumina miRNA arrays version 1.0. Sample preparationand hybridization followed the manufacturer’s instruc-tions. Briefly, 200 ng of total RNA was first polyadeny-lated and converted to biotinylated cDNA, which wasattached to a solid phase and hybridised with a pool ofmiRNA-specific oligonucleotides (MSO). Each singleMSO is used to assay one miRNA on the panel. Univer-sal PCR amplification was then performed, creating fluo-rescently labeled products identifiable by their uniqueMSO sequence. These products were hybridized on theIllumina miRNA array, with the address sequence from
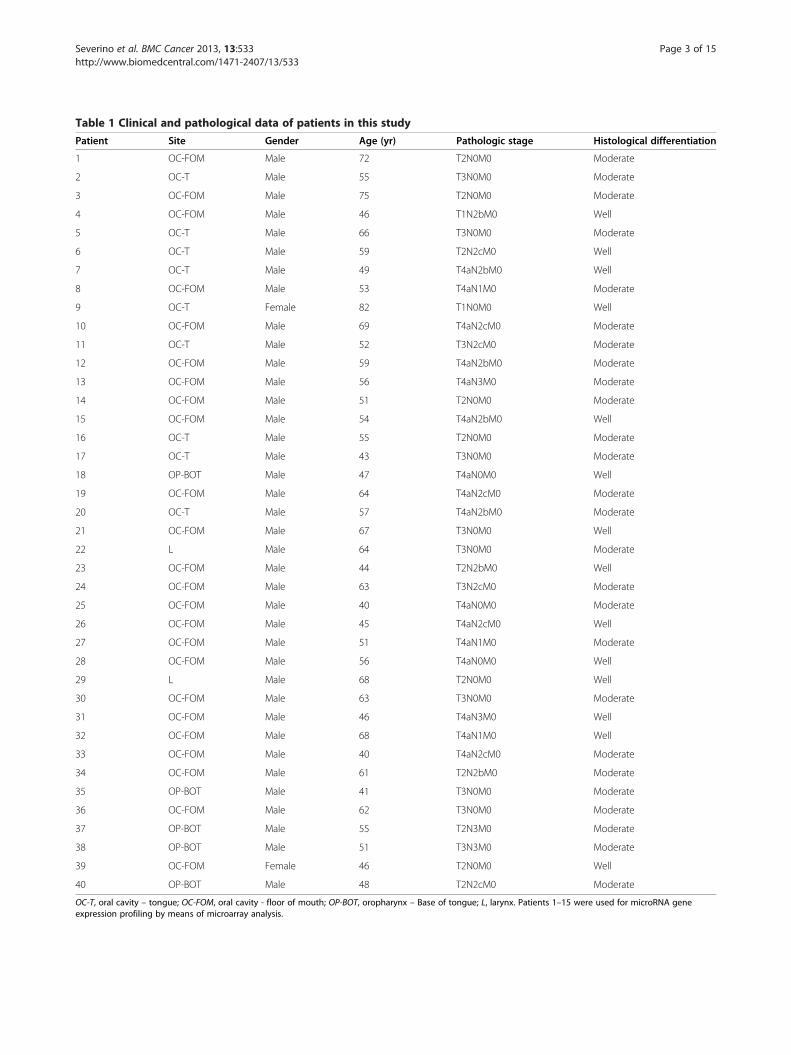
Table 1 Clinical and pathological data of patients in this study
Patient Site Gender Age (yr) Pathologic stage Histological differentiation
1 OC-FOM Male 72 T2N0M0 Moderate
2 OC-T Male 55 T3N0M0 Moderate
3 OC-FOM Male 75 T2N0M0 Moderate
4 OC-FOM Male 46 T1N2bM0 Well
5 OC-T Male 66 T3N0M0 Moderate
6 OC-T Male 59 T2N2cM0 Well
7 OC-T Male 49 T4aN2bM0 Well
8 OC-FOM Male 53 T4aN1M0 Moderate
9 OC-T Female 82 T1N0M0 Well
10 OC-FOM Male 69 T4aN2cM0 Moderate
11 OC-T Male 52 T3N2cM0 Moderate
12 OC-FOM Male 59 T4aN2bM0 Moderate
13 OC-FOM Male 56 T4aN3M0 Moderate
14 OC-FOM Male 51 T2N0M0 Moderate
15 OC-FOM Male 54 T4aN2bM0 Well
16 OC-T Male 55 T2N0M0 Moderate
17 OC-T Male 43 T3N0M0 Moderate
18 OP-BOT Male 47 T4aN0M0 Well
19 OC-FOM Male 64 T4aN2cM0 Moderate
20 OC-T Male 57 T4aN2bM0 Moderate
21 OC-FOM Male 67 T3N0M0 Well
22 L Male 64 T3N0M0 Moderate
23 OC-FOM Male 44 T2N2bM0 Well
24 OC-FOM Male 63 T3N2cM0 Moderate
25 OC-FOM Male 40 T4aN0M0 Moderate
26 OC-FOM Male 45 T4aN2cM0 Well
27 OC-FOM Male 51 T4aN1M0 Moderate
28 OC-FOM Male 56 T4aN0M0 Well
29 L Male 68 T2N0M0 Well
30 OC-FOM Male 63 T3N0M0 Moderate
31 OC-FOM Male 46 T4aN3M0 Well
32 OC-FOM Male 68 T4aN1M0 Well
33 OC-FOM Male 40 T4aN2cM0 Moderate
34 OC-FOM Male 61 T2N2bM0 Moderate
35 OP-BOT Male 41 T3N0M0 Moderate
36 OC-FOM Male 62 T3N0M0 Moderate
37 OP-BOT Male 55 T2N3M0 Moderate
38 OP-BOT Male 51 T3N3M0 Moderate
39 OC-FOM Female 46 T2N0M0 Well
40 OP-BOT Male 48 T2N2cM0 Moderate
OC-T, oral cavity – tongue; OC-FOM, oral cavity - floor of mouth; OP-BOT, oropharynx – Base of tongue; L, larynx. Patients 1–15 were used for microRNA geneexpression profiling by means of microarray analysis.
Severino et al. BMC Cancer 2013, 13:533 Page 3 of 15http://www.biomedcentral.com/1471-2407/13/533

Severino et al. BMC Cancer 2013, 13:533 Page 4 of 15http://www.biomedcentral.com/1471-2407/13/533
each MSO enabling the hybridization of specific miRNAproducts to specific locations on the BeadArray sub-strate. Hybridization signals were detected and quanti-fied using Illumina scanner and BeadStudio version3.2.7. Average signals were quantile normalized and thenfiltered according their detection p-value: only miRNAsfor which the detection p-value was consistently equalor lower than 0.05 across at least one group of samples(marginal and/or tumor samples) were consideredexpressed and further analyzed. All data is MIAMEcompliant and the raw data has been deposited in aMIAME compliant database (Gene Expression Omnibusdatabase) under accession Number GSE31277. Differen-tially expressed miRNAs were determined by using theRank Product, non-parametric statistical method basedon ranks of fold-changes [19]. We used the RankProdpackage on R for this analysis; the percentage of falsepositives was calculated and p-values were accordinglycorrected for multiple comparisons.
Relative quantification of miRNA levels using real time-PCRTo validate the microarray expression data, miRNAs weresubjected to quantitative Real Time-PCR using the TaqManmiRNA assay system (Applied Biosystems, Foster City,CA). Briefly, about 100 ng of total RNA was subjected to areverse transcription reaction using miRNA-specific loopedprimers according to the manufacturer’s protocol to obtainthe cDNA. Subsequent PCRs used miRNA specific forwardand reverse primers along with appropriate cDNA productand TaqMan universal mix. PCR was carried out inAB7500 (Applied Biosystems, Foster City, CA) in a 20 ulvolume reaction following thermal cycling parameters sug-gested by the manufacturer: 50°C for 2 min, 95°C for 10min and 45 cycles of 95°C for 15 s and 60°C for 1 min.The expression data was normalized to the RNU48 ex-
pression. RNU48 was chosen as a suitable endogenouscontrol gene following analysis of gene expression stabil-ity of three candidate genes across our samples. For adetailed description of this step refer to the nextMethods’ section. Expression levels were determinedusing the comparative ΔCt method [20].For miRNAs individually studied in independent sets of
samples by quantitative real-time PCR, the nonparametrictest Wilcoxon Signed Rank Test was used to detect thestatistically significant differences between paired normaltissue (N) and tumor (T) samples obtained from the sameindividual. This test was performed using SPSS for Win-dows® Software. The same software was used to calculatethe mean and standard deviation of all variables.
Identification of suitable endogenous control gene formicroRNA gene expression analysis by real-time PCRThe expression of three snoRNAs (RNU6B, RNU44 andRNU48) was measured by quantitative real-time PCR
with TaqMan miRNA assays (Applied Biosystems, FosterCity, CA), as previously described for all samples assayedby miRNA microarrays. This data was analyzed using theSLqPCR package in R [21] to determine the expressionstability of these snoRNAs across samples. The stabilityfactor M was calculated for each snoRNA (M (forRNU48) = 0.69; M (for RNU44) = 0.78; M (for RNU6B) =0.75). Since high expression stability is associated to lowM values, RNU48 appeared to be the snoRNA with moststable expression across the set of samples analyzed, hencewas chosen as control for normalisation.
Prediction of miRNA targets and their functional analysisPotential miRNA targets were identified using IngenuityPathway Analysis (IPA Ingenuity Systems, www.ingenuity.com). Only experimentally validated targets were selected,using miRecords (http://mirecords.biolead.org/), Tarbase(http://microrna.gr/tarbase) or TargetScan (http://www.targetscan.org/). For fuctional annotation of potential tar-gets we used KEGG pathways term enrichment analysisusing the computational tool Database for Annotation,Visualization and Integrated Discovery (DAVID) v6.7(http://david.abcc.ncifcrf.gov/home.jsp).
HNSCC cell line and keratinocyte cell cultureThe HNSCC cell lines SCC25 and SCC9, derived from aSCC of the tongue, and FaDu, derived from a SCC of thehypopharynx were used in this study. They were obtainedfrom American Type Culture Collection (SCC25 catalognumber CRL-1628, SCC9 catalog number CRL-1629, andFaDu catalog number HTB-43). The cell lines were grownin a Dulbecco’s Modified Eagle’s medium/Nutrient Mix-ture F-12 Ham (DMEM/F12) supplemented with 10% fetalbovine serum in a humidified atmosphere of 5% CO2 and95% air at 37°C. Oral keratinocytes were obtained fromprimary cultures of the buccal mucosa, from voluntarydonor patients undergoing surgery performed in out-patient clinics in the Dentistry School of USP. The pa-tients were informed and signed the required InformedConsent. This study was approved by the Research EthicsCommittee of the Instituto de Pesquisas Energéticas eNucleares (IPEN/CNEN-SP) [Institute of Energy and Nu-clear Research] (approval number 087/CEP-IPEN/SP).Keratinocytes were plated on a support layer, calledfeeder-layer, composed of murine fibroblasts of the type3T3-Swiss albino (ATCC, catalog number CCL-92), whichwere irradiated (60 Gy), and maintained in an incubator at37°C, in a humidified atmosphere containing 5% CO2 andgrown as previously described [22].
Transfection of cultured cells for up-regulation of miRNAsThe siPORT NeoFx reagent (Ambion) was used fortransfection following the manufacturer’s protocol. Forup-regulation, the Ambion Pre-miR™ miRNA Precursor

Table 2 Deregulated miRNAs between 15 OSCC and 15 tumor-free surgical margins
miRNA Fold-change P value miRNA Fold-change P value
hsa-miR-196a 7.94 0 hsa-miR-1 −6.67 0
hsa-miR-33 5.51 0 hsa-miR-30a-3p −3.34 0
hsa-miR-19a 3.29 0 hsa-miR-139 −3.13 0
hsa-miR-33b 2.65 0 hsa-miR-133a −3.79 0
hsa-miR-142-5p 2.81 0 hsa-miR-486 −3.02 0
hsa-miR-503 2.53 0 hsa-miR-135a −3.47 0
hsa-miR-31 2.40 0 hsa-miR-204 −2.68 0
hsa-miR-7 2.33 0 hsa-miR-206 −3.42 0
hsa-miR-19b 2.66 0 hsa-miR-411 −2.67 0
hsa-miR-135b 2.29 0 hsa-miR-499 −2.64 0
hsa-miR-632 2.15 0 hsa-miR-10b −2.39 0
hsa-miR-504 1.99 0 hsa-miR-99a −2.35 0
hsa-miR-187 2.10 0 hsa-miR-299-5p −2.46 0
hsa-miR-339 2.12 1.00E-04 hsa-miR-379 −2.42 0
hsa-miR-302d 1.93 1.00E-04 hsa-miR-100 −2.17 0
hsa-miR-34b 2.06 1.00E-04 hsa-miR-30a-5p −2.13 0
hsa-miR-34c 2.02 2.00E-04 hsa-miR-95 −2.16 1.00E-04
hsa-miR-455 2.06 3.00E-04 hsa-miR-378 −2.08 1.00E-04
hsa-miR-9 1.99 3.00E-04 hsa-miR-218 −1.88 1.00E-04
hsa-miR-296 1.93 3.00E-04 hsa-miR-368 −2.00 2.00E-04
hsa-miR-301 2.02 3.00E-04 hsa-miR-363 −1.83 2.00E-04
hsa-miR-130b 1.97 3.00E-04 hsa-miR-128a −1.90 4.00E-04
hsa-miR-196b 1.93 4.00E-04 hsa-miR-655 −1.94 6.00E-04
hsa-miR-200a 1.96 4.00E-04 hsa-miR-376a −1.83 1.00E-03
hsa-miR-210 1.87 7.00E-04 hsa-miR-628 −1.87 1.00E-03
hsa-miR-17-3p 1.87 9.00E-04 hsa-miR-487b −1.95 1.00E-03
hsa-miR-302b* 1.76 9.00E-04 hsa-miR-410 −1.81 1.00E-03
hsa-miR-224 1.59 9.00E-04 hsa-miR-140 −1.79 2.00E-03
hsa-miR-183 1.78 9.00E-04 hsa-miR-801 −1.34 2.00E-03
hsa-miR-138 1.79 1.00E-03 hsa-miR-376a* −1.80 2.00E-03
hsa-miR-188 1.63 2.00E-03 hsa-miR-154 −1.76 3.00E-03
hsa-miR-92b 1.66 2.00E-03 hsa-miR-432 −1.80 3.00E-03
hsa-miR-182 1.66 2.00E-03 hsa-miR-328 −1.64 3.00E-03
hsa-miR-144 1.42 3.00E-03
hsa-miR-146b 1.42 4.00E-03
hsa-miR-182* 1.61 4.00E-03
hsa-miR-149 1.53 4.00E-03
hsa-miR-141 1.67 4.00E-03
hsa-miR-610 1.34 5.00E-03
Negative Fold-Change indicates over-expression in margins. p-values indicate the significance level for each gene and have been multiple-test-corrected usingRank Products as described in Methods. *: identifies the star strand of a miRNA.
Severino et al. BMC Cancer 2013, 13:533 Page 5 of 15http://www.biomedcentral.com/1471-2407/13/533
Molecule (hsa-miR-10b and hsa-miR-196a) was used,with Ambion’s Pre-miR negative control #1. Successfulup-regulation was achieved with 50 nM of final Pre-miRmiRNA Precursor concentration.
Immunofluorescence assay for proliferation analysisNormal keratinocytes transfected with the miRNA precur-sor and the negative control were cultured in Lab-TekChamber Slides (Nalge Nunc International, Rochester, NY,
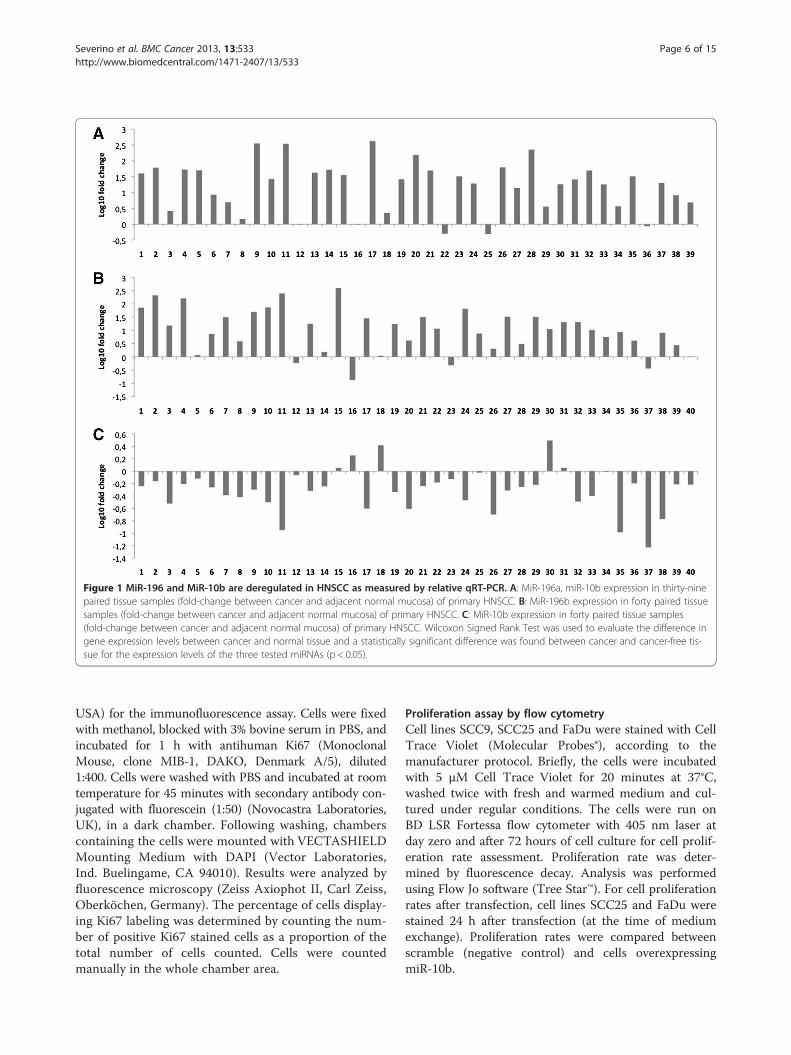
Figure 1 MiR-196 and MiR-10b are deregulated in HNSCC as measured by relative qRT-PCR. A: MiR-196a, miR-10b expression in thirty-ninepaired tissue samples (fold-change between cancer and adjacent normal mucosa) of primary HNSCC. B: MiR-196b expression in forty paired tissuesamples (fold-change between cancer and adjacent normal mucosa) of primary HNSCC. C: MiR-10b expression in forty paired tissue samples(fold-change between cancer and adjacent normal mucosa) of primary HNSCC. Wilcoxon Signed Rank Test was used to evaluate the difference ingene expression levels between cancer and normal tissue and a statistically significant difference was found between cancer and cancer-free tis-sue for the expression levels of the three tested miRNAs (p < 0.05).
Severino et al. BMC Cancer 2013, 13:533 Page 6 of 15http://www.biomedcentral.com/1471-2407/13/533
USA) for the immunofluorescence assay. Cells were fixedwith methanol, blocked with 3% bovine serum in PBS, andincubated for 1 h with antihuman Ki67 (MonoclonalMouse, clone MIB-1, DAKO, Denmark A/5), diluted1:400. Cells were washed with PBS and incubated at roomtemperature for 45 minutes with secondary antibody con-jugated with fluorescein (1:50) (Novocastra Laboratories,UK), in a dark chamber. Following washing, chamberscontaining the cells were mounted with VECTASHIELDMounting Medium with DAPI (Vector Laboratories,Ind. Buelingame, CA 94010). Results were analyzed byfluorescence microscopy (Zeiss Axiophot II, Carl Zeiss,Oberköchen, Germany). The percentage of cells display-ing Ki67 labeling was determined by counting the num-ber of positive Ki67 stained cells as a proportion of thetotal number of cells counted. Cells were countedmanually in the whole chamber area.
Proliferation assay by flow cytometryCell lines SCC9, SCC25 and FaDu were stained with CellTrace Violet (Molecular Probes®), according to themanufacturer protocol. Briefly, the cells were incubatedwith 5 μM Cell Trace Violet for 20 minutes at 37°C,washed twice with fresh and warmed medium and cul-tured under regular conditions. The cells were run onBD LSR Fortessa flow cytometer with 405 nm laser atday zero and after 72 hours of cell culture for cell prolif-eration rate assessment. Proliferation rate was deter-mined by fluorescence decay. Analysis was performedusing Flow Jo software (Tree Star™). For cell proliferationrates after transfection, cell lines SCC25 and FaDu werestained 24 h after transfection (at the time of mediumexchange). Proliferation rates were compared betweenscramble (negative control) and cells overexpressingmiR-10b.

FaDu day 3
FaDu day 0
SCC25 day 3
SCC25 day 0 SCC9 day 0
SCC9 day 3
Cell Trace Violet
SS
C
Figure 2 Proliferation rate of SCC9, SCC25 and FaDu cell lines as determined by flow cytometry. Proliferation rate was determined byfluorescence decay from measures at day 0 to day 3 (72 h). Numerical results are presented in Table 3.
Table 3 Assessment of the number of cell divisions after72h of cell culture
Initial Final MFI Predicted # cell divisions
FaDu 109,219.96 6,826.24 3-4
SCC25 102,353.5 6,397.08 3-4
SCC9 152,640.3 19,080.0 2-3
Prediction of the number of cell divisions according to formula final MFI =initial MFI/2n. MFI, mean fluorescence index; n, number of cell divisions. finalMFI = initial MFI/2n.
Severino et al. BMC Cancer 2013, 13:533 Page 7 of 15http://www.biomedcentral.com/1471-2407/13/533
mRNA microarray expression profiling and analysisFollowing the transfection assays, the global gene expres-sion analysis was conducted using the Agilent HumanWhole Genome Oligonucleotide Microarray (44K; AgilentTechnologies) following the manufacturer’s protocols.Oligonucleotide microarrays were scanned using the Gen-ePix 4000B Microarray Scanner (Molecular Devices) andfeatures were automatically extracted and analyzed forquality control using Agilent Feature Extraction Software.Raw data was deposited in a MIAME compliant database(Gene Expression Omnibus database) under the accessionNumber GSE31277. Partek Genomics Suite 6.6 (Partek In-corporated) was used for normalization of gene expressionlevels and for fold-change in gene expression calculation.To gain insights into the potential mechanisms affected bythe overexpression of the miR-10b and miR-196a in cells,deregulated genes were mapped to regulatory networksusing Ingenuity Pathway Analysis (IPA Ingenuity Systems,www.ingenuity.com).
Western blottingWestern blotting was performed using a specific anti-body against annexin 1 (1:1000 dilution) (Zymed La-boratories - 713400), and β-Actin (1:12.000 dilution)
(Cell Signaling Technology, Danvers, MA, USA). Briefly,72 hours after transfection cells were lysed in RIPAbuffer (150 mM NaCl, 10 mM Tris/HCl, pH 7.4, 0.5%Triton X-100 and protease and phosphatase inhibitors(Biogene). Protein concentration was estimated usingthe BCA Protein Assay Kit (BioAgency, London, UK).20 ug of protein lysate was separated in 15% SDS gel(GE Healthcare, Piscataway, NJ, USA) and subsequentlytransferred to nitrocellulose membrane of 0,45 μm (GEHealthcare, Piscataway, NJ, USA). The membranes wereblocked using 3% non-fat dry milk, and incubated withprimary antibodies overnight at 4°C. The membranes werewashed in 1x TBS eith 0.1% Tween-20 (TBS/T), incubatedfor 1 h with anti-rabbit secondary antibodies conjugated

Figure 3 Expression of miR-10b in the cell lines SCC25, SCC9 and FaDu, and of miR-196a in normal keratinocytes following transfectionwith the specific miRNA precursor molecules. A: Expression of miR-10b in the cell lines SCC25, SCC9 and FaDu following transfection with thespecific miRNA precursor molecule; B: Expression of of miR-196a in normal keratinocytes following transfection with the specific miRNA precursormolecule. Scramble represents cells transfected with a random sequence of precursor miRNA molecules validated by the manufacturer to notproduce identifiable effects on known miRNA function. Fold change compares expression levels in transfected and scramble.
Severino et al. BMC Cancer 2013, 13:533 Page 8 of 15http://www.biomedcentral.com/1471-2407/13/533
to horseradish peroxidase (Abcam - ab102779) and visua-lized with a chemiluminescence reagent (ECL) system(Amersham Biosciences, Arlington Heights, IL).
Results and discussionMiRNA deregulation in OSCC samples: implication intumor progressionHNSCC can involve multiple anatomical sites, each withindividual molecular characteristics, and highly affected bythe drinking and smoking habits of patients [13,23,24]. Inan attempt to limit data variability due to HNSCC subsitesand environmental factors, we assessed miRNA expressionlevels in 15 OSCC samples limited to tongue and floor ofthe mouth, from patients possessing similar demographicand clinico-pathological characteristics (Table 1, detailedin Methods). Samples were paired with tumor-free
Figure 4 Ki67 proliferation marker was detected by immunocytochemcells were observed upon over-expression of the miR-196a (*p < 0.05). Thestatistical analysis.
surgical margins. The expression profiles of tumor sam-ples revealed significant differential expression for 72 miR-NAs compared to their corresponding tumor-free margins(Table 2). Several studies have analysed the miRNA ex-pression profile of OSCC cell lines and tumor samples,with little overlap among results [25,26]. This inconsist-ency in results justifies additional studies.In order to access biological processes possibly targeted
by deregulated miRNAs we performed a functional analysisof validated targets through KEGG term enrichment ana-lysis using the computational tool DAVID. Thirty-eight ofthe 72 deregulated miRNAs possessed mRNA targets thathave been experimentally observed; in total 609 genes arepotentially regulated (Additional file 1). These genes weremapped to KEGG pathways and were shown to be broadlyinvolved in cancer development (Additional file 2).
istry in keratinocytes. A significantly lower number of Ki67-positivebars represent standard deviation and t-test was used for
C
B D
FaDu day 0
Cell Trace Violet
SS
C
SCC25 day 0
Cell Trace Violet
SS
C
A
Figure 5 (See legend on next page.)
Severino et al. BMC Cancer 2013, 13:533 Page 9 of 15http://www.biomedcentral.com/1471-2407/13/533
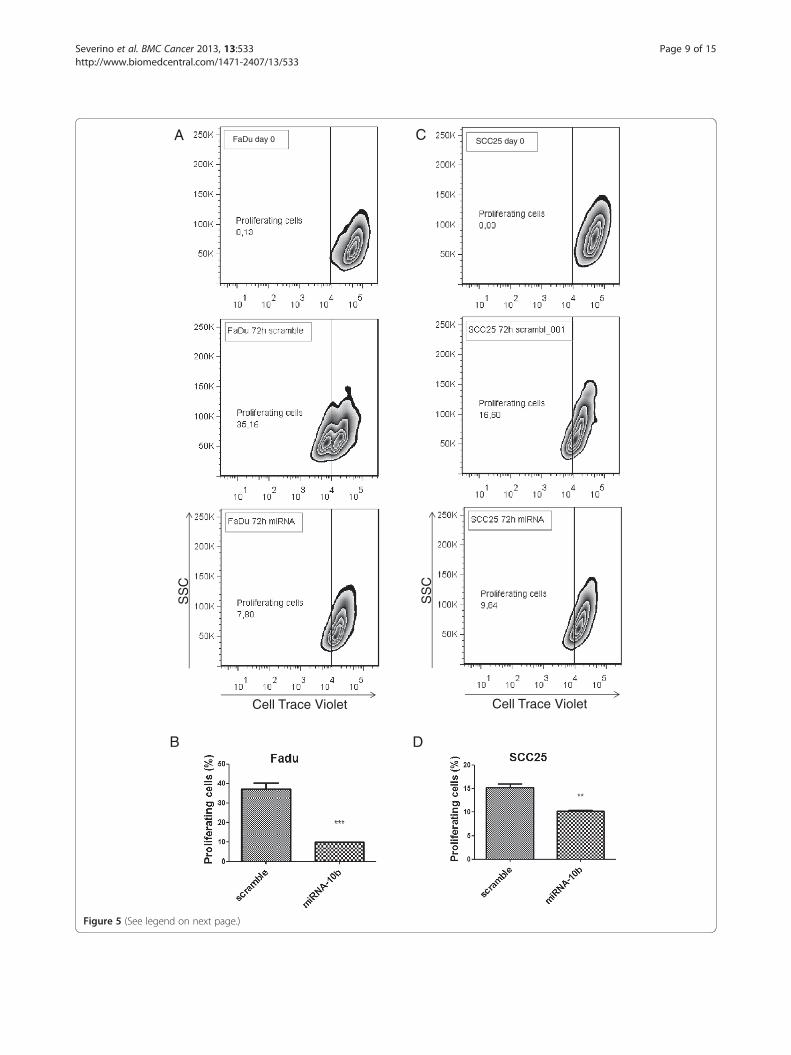
(See figure on previous page.)Figure 5 miRNA-10b over expression decreases proliferation rate of head and neck cancer cells. Fadu and SCC25 cell lines weretransfected with miR-10b precursor and negative control (scramble) and the proliferation rate was measured for 72 hours. A and C: Zebra plotshowing the fluorescence decay after 72 hours post-transfection with miRNA in Fadu and SCC25 cell lines, respectively. B and D: Graph represent-ing the percentage of proliferating cells after 72 hours post-transfection with miRNA. The bars represent standard deviation and t-test was usedfor statistical analysis. **:p < 0.01. **:p < 0.001.
Severino et al. BMC Cancer 2013, 13:533 Page 10 of 15http://www.biomedcentral.com/1471-2407/13/533
Specifically, members of the miR-17-92 cluster werederegulated in our dataset: miR-19a and miR-19b werestrongly up-regulated, in addition to moderate up-regulation of miR-17-3p/miR-17-5p and miR-92b. Theseresults are in line with the observation that the miR-17-92 cluster is up-regulated in many cancer types, includ-ing lung cancer and lymphoma [27,28]. Accordingly,miR-17-92 cluster members have been shown to takepart in feedback loops determining the role of c-MYC astumor suppressor and/or oncogene [29,30]. Specifically,c-MYC apparently possesses a tumorigenic role inHNSCC, constituting a current candidate for anticancerstrategies [31]. Recently, the miR-17-92 cluster has beenalso shown to regulate multiple components of theTGF-β pathway in neuroblastoma [32]. Other cancer-related miRNAs up-regulated in our OSCC samples aremembers of the miR-34 family: miR-34b and miR-34c.To our knowledge this is the first report of their alteredexpression profile in HNSCC, although the deregulationof miR-34a has been recently addressed in HNSCC [33].These results are interesting in light of the finding thatmiR-34 is a direct target of p53, functioning downstreamof the p53 pathway as a tumor suppressor [34,35]. Simi-lar to other types of cancer, inactivation of p53 is an ex-tremely common event in head and neck cancers, withmutant p53 status found in nearly 50% of the cases andcommonly associated with poor prognosis [36]. How-ever, the role of miR-34b/c in the context of p53 regula-tion has not been addressed in HNSCC.In agreement with most miRNA profiles in HNSCC
samples and tumor cell lines, miR-133a was also down-regulated in our cancer set as compared to tumor-freesamples. Its tumor suppressor activity, for instance bycontrolling the target genes actin-related protein 2/3complex subunit 5 (ARPC5) and moesin (MSN), hasbeen already demonstrated in squamous cell carcinomaof the tongue [37-39]. Since this seems to be a robustcharacteristic in HNSCC, its function should be furtherinvestigated as well as its possible use as a biomarker forearly cancer detection.
Deregulation of homeobox cluster-encoded miRNAsmiR-196a/b and miR-10bMiR-196a/b was over-expressed and miR-10b wasdown-regulated in the OSCC samples compared withtumor-free surgical margins (Table 2). Both miRNAsare dysregulated in a variety of cancers [40,41], but
have not been previously associated with OSCC. Wevalidated our microarray results in an additional subsetof OSCC samples as well as in samples belonging toother HNSCC subsites (Figure 1, and Table 1 for sam-ple characteristics). Both miRNAs clearly presented dif-ferential expression between tumor and tumor-freesamples, suggesting a role in HNSCC.MiR-196a/b and miR-10b are embedded within
homeobox (HOX) clusters of developmental regulators[42]. Schimanski and collaborators [43] demonstrated thatHOX genes are targeted by miR-196, and HOX transcriptswere also experimentally validated as miR-10 targets[44,45]. Given that molecular events involved in carcino-genesis interfere in the regulation of cell identity, it hasbeen proposed that HOX proteins could be oncogenicregulators [46]. HOX genes have not been implicated inthe development of HNSCC, as judged from reviewing theavailable literature, including HNSCC gene expressionprofiles. This suggests that the homeobox-cluster embed-ded miRNA could have a different role in HNSCC. Thus,we performed gain-of-function experiments aiming tooutline a possible role for these molecules.
Gain-of-function of miR-10b and miR-196a lead to im-paired cell proliferationPrecursor molecules of miR-10b were transfected intoSCC25 and SCC9 (tongue squamous cell carcinoma-derived cell lines) and FaDu (a cell line derived fromhypopharyngeal squamous cell carcinoma), while miR-196a precursor molecules were transfected into humankeratinocytes derived from normal oral epithelium. Wechose SCC cell lines and oral keratinocytes as modelsfor the investigation of miRNA function in a HNSCCgenetic background, emulating cancer and tumor-freecellular systems, respectively.Two SCC cell lines were initially chosen for the gain-
of-function experiments due to differences in their pro-liferation rates, as reported in Figure 2 and Table 3, acharacteristic that could affect results.As expected, in untreated SCC cell lines, miR-196 was
up-regulated and miR-10b was downregulated when ex-pression levels were compared to untreated keratino-cytes (data not shown).After transfection, we assessed the over-expresssion of
the respective mature miRNAs in each cell line (Figure 3).Despite the successful overexpression of miR-10b inSCC9, these cells were very sensitive to the transfection,

Figure 6 Western blot analysis of ANXA1 expression in keratinocytes upon overexpression of miR-196a. Total protein extracts from cellsoverexpressing miR-196a (miR-196a) and negative controls (scramble) were analyzed by western blot for ANXA1. Results show no differences inprotein levels between the experiments.
Severino et al. BMC Cancer 2013, 13:533 Page 11 of 15http://www.biomedcentral.com/1471-2407/13/533
with intense effects in cell proliferation seen also for thenegative control. Thus this cell line was not used in subse-quent experiments.Since tumor cells evade programmed cell death and sus-
tain proliferative status [47], we tested whether miR-10band/or miR-196a could play a role in this scenario. Assess-ment of Ki-67 antigen expression, a cell proliferationmarker, revealed that keratinocytes over-expressing miR-196a were mostly quiescent, as defined by a lack of Ki-67antigen expression. When compared to transfection con-trols, cell proliferation was reduced approximately 5 foldin keratinocytes over-expressing miR-196a (Figure 4).Despite inhibiting cell proliferation, specific occur-
rences at the cell surface level, such as surface blebbing,considered as a marker for apoptosis, were absent at 72
Figure 7 Pathway analysis of deregulated genes upon miR-196a overinteraction network based on deregulated genes in miR-196a overexpressincation, recombination and repair, cell cycle”. In grey, deregulated genes fro
h after transfection (data not shown). Changes in nuclearmorphology indicating late apoptosis were also absent.Inhibition of cell proliferation upon over-expression of
miR-10b in SCC25 and FaDu was assessed by flow cy-tometry (Figure 5). This is consistent with the miRNAexpression data: miR-10b was detected in low levels inHNSCC in this study, a downregulation that wouldthwart the inhibitory effect of miR-10b on cell prolifera-tion. The effect of the overexpression of miR-10b wasclearly more intense in FaDu as compared to SCC25.Given the fact that miR-196a was found to be overex-
pressed in HNSCC samples, the inhibitory effect of miR-196a overexpression on proliferation of normal keratinocyescannot easily put into context. One hypothesis could bethat miR-196a overexpression in HNSCC could also be the
expression in keratinocytes. Shown is the most significantg keratinocytes, calculated by IPA. The network is termed “DNA repli-m gene expression profiling.
Severino et al. BMC Cancer 2013, 13:533 Page 12 of 15http://www.biomedcentral.com/1471-2407/13/533
consequence of uncontrolled proliferation, as a means tocounteract it, rather than the cause of its perturbation.Efforts to understand the global effects of miR-196a,
which might be cell-type dependent, are essential con-sidering that it has been recently addressed as a poten-tial therapeutic target [41].
Gene expression profiles upon overexpression of miR-10band miR-196a do not show regulation of known targetsThe identification of miRNA target genes is critical inorder to understand their roles. However, this task is chal-lenging. MiRNAs are usually imperfectly complementaryto the 3′UTR region of their mRNA targets in mammaliancells, with target effect hardly detected at the gene expres-sion level. Additionally, the cellular environment is key indetermining miRNA functions, which will vary dependingon the cell type.
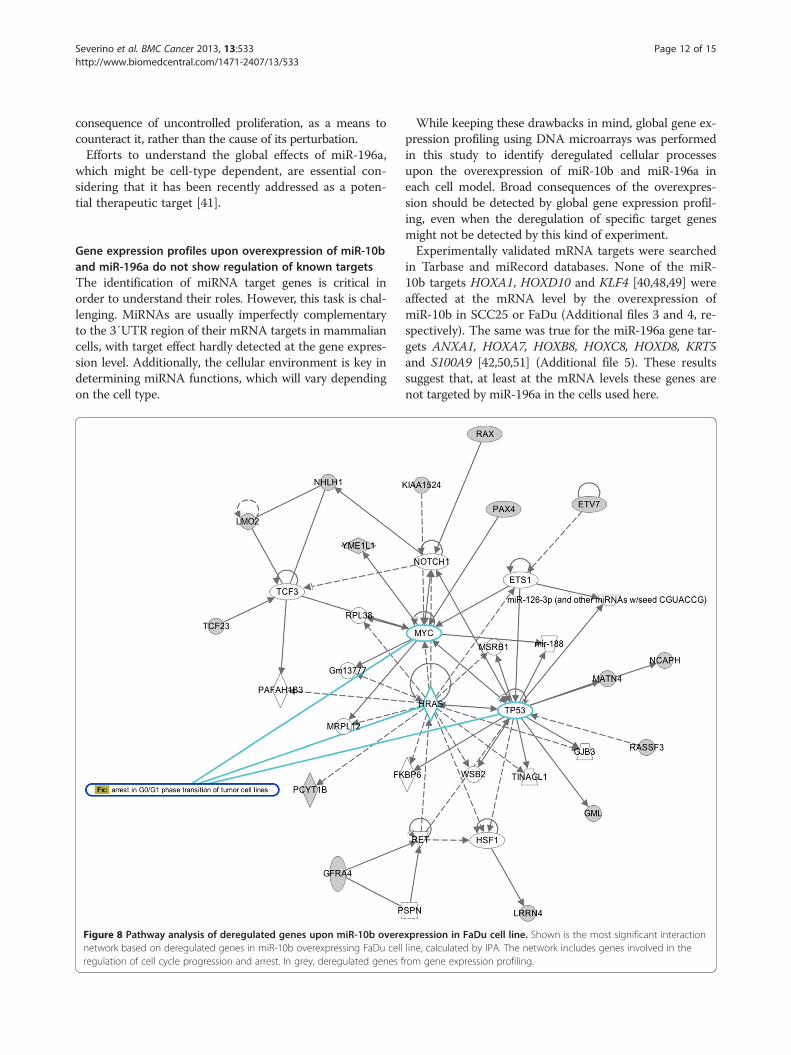
Figure 8 Pathway analysis of deregulated genes upon miR-10b overenetwork based on deregulated genes in miR-10b overexpressing FaDu cellregulation of cell cycle progression and arrest. In grey, deregulated genes f
While keeping these drawbacks in mind, global gene ex-pression profiling using DNA microarrays was performedin this study to identify deregulated cellular processesupon the overexpression of miR-10b and miR-196a ineach cell model. Broad consequences of the overexpres-sion should be detected by global gene expression profil-ing, even when the deregulation of specific target genesmight not be detected by this kind of experiment.Experimentally validated mRNA targets were searched
in Tarbase and miRecord databases. None of the miR-10b targets HOXA1, HOXD10 and KLF4 [40,48,49] wereaffected at the mRNA level by the overexpression ofmiR-10b in SCC25 or FaDu (Additional files 3 and 4, re-spectively). The same was true for the miR-196a gene tar-gets ANXA1, HOXA7, HOXB8, HOXC8, HOXD8, KRT5and S100A9 [42,50,51] (Additional file 5). These resultssuggest that, at least at the mRNA levels these genes arenot targeted by miR-196a in the cells used here.
xpression in FaDu cell line. Shown is the most significant interactionline, calculated by IPA. The network includes genes involved in therom gene expression profiling.

Severino et al. BMC Cancer 2013, 13:533 Page 13 of 15http://www.biomedcentral.com/1471-2407/13/533
Among the above mentioned gene targets, only ANXA1down-regulation has been previously reported in HNSCC[52,53]. For this reason, we checked for alterations of thistarget also at the protein level. Our results demostrate thatANXA1 is not targeted by miR-196a under the conditionsstudied here (Figure 6).
MiR10b and miR196a lead to cell cycle arrest throughdifferent mechanismsWe performed a functional analysis of deregulated genesaiming to pinpoint alterations that could explain im-paired proliferation. A total of 353 annotated genes weredownregulated (at 1.5 fold-change) following miR-196aover-expression in keratinocytes (Additional file 5). Therelationships among these genes were assessed using In-genuity Pathway Analysis (IPA), while considering onlyexperimentally proven connections between genes or pro-teins. The most significant interaction network consistedof genes associated with DNA replication, recombinationand repair, cell cycle and, consequently, cancer. Figure 7depicts this network and genes involved in cell cyclearrest are highlighted. This network contains 8 deregulatedgenes from our dataset: CDK2, SYNM (DMN), TP73,AKT1, NFATC4, HOXA9, HSPB3 and CD40LG. Of par-ticular interest is the downregulation of CDK2 and AKT1and the upregulation of TP73. CDK2 is a subunit of thecyclin-dependent protein kinase complex, expressed inG1-S phase, and essential for cell cycle G1/S phase transi-tion. TP73, up-regulated in cells overexpressing miR-196a,transcriptionally activates target genes leading to apoptosisand growth arrest [54]. The activation of PI3K/AKT path-way in HNSCC is well known; the pathway regulates cellproliferation and has been addressed as a therapeuticaltarget. Thus, the expression patterns of these three genes,following over-expression of miR-196a, would be inagreement with the observed arrest of the cell cycle.However, none of them are direct targets of this miRNAand further studies are needed in order to comprehendthe observed effect.Overexpression of miR-10b in SCC25 and in FaDu
provided relatively similar results. Two hundred and tenannotated genes were downregulated and 169 were up-regulated when SCC25 cells overexpressing miR-10bwere compared to controls (Additional file 3) while 161genes were downregulated and 169 upregulated in FaDuoverexpressing miR-10b (Additional file 4), when at leasta 2-fold difference was considered. Sixteen commongenes were downregulated in both cell lines, but none ofthese genes were miR-10b predicted targets.Regulatory networks provided by IPA did not contain a
significant number of genes directly implicated in cell pro-liferation or cell cycle arrest for SCC25 cell line. This ana-lysis, however, highlighted enrichment of terms belongingto the G-protein-coupled-receptor signaling pathway -
with 9 molecules regulated in our dataset (ADRB3, AVPR2and GRM2, upregulated 2-fold in SCC25 overexpressingmiR-10b; and CNR1 (16-fold), DRD3 (4-fold), HCAR2(2-fold) and OPRK1 (14-fold), downregulated in thesecells). A recent review addresses mechanisms by which G-protein-coupled-receptors participate in the regulation ofcell cycle [55] and, in the context of HNSCC, G-protein-coupled-receptors have been associated with EGFR signal-ing and cell survival [56].A significant regulatory network built with deregulated
genes upon overexpression of miR-10b in FaDu includesgenes involved in the regulation of cell cycle progressionand arrest (Figure 8). Although none of these genes havebeen implicated in HNSCC or heavily studied in thecontext of cancer, it is noteworthy the fact that they re-late to cell cycle regulation through key players inHNSCC: TP53, NOTCH1, MYC and HRAS [57].From this analysis it became clear that the effect of the
overexpression of miR-10b in SCC25 and FaDu, andmiR-196a in keratinocytes do not act upon a large num-ber of cellular processes but may rather target a smallset of genes, some of which directly or indirectly in-volved in the progression of cell cycle.
ConclusionsData on miRNA effects in tumorigenesis and cancerprogression is still controversial and should vary withcell and cancer types. While individual miRNAs mightpossess numerous and distinct targets, they should beable to contribute to the same tumorigenic processesthrough complex, and still mostly unknown, networks.In HNSCC little is known about the contribution ofmiRNA to tumor development and progression, withseveral studies lacking corroboration. Besides presentingdata matching to current knowledge, in this study weshow that two miRNAs, miR-196a and miR-10b, playdistinct roles in the regulation of cell proliferation withina HNSCC background.
Additional files
Additional file 1: Experimentally validated targets for miRNAsderegulated between cancer and cancer-free samples. Targets wereselected using the tool MicroRNA Target Filter from Ingenuity PathwayAnalysis.
Additional file 2: KEGG term enrichment analysis for gene targetsof deregulated miRNAs between cancer and cancer-free samples.KEGG term enrichment analysis were performed using DAVIDBioinformatics Resources (http://david.abcc.ncifcrf.gov/home.jsp).
Additional file 3: Differentially expressed genes between SCC25overexpressing miR-10b and transfection controls.
Additional file 4: Differentially expressed genes between FaDuoverexpressing miR-10b and transfection controls.
Additional file 5: Differentially expressed genes betweenkeratinocytes overexpressing miR-196a and transfection controls.

Severino et al. BMC Cancer 2013, 13:533 Page 14 of 15http://www.biomedcentral.com/1471-2407/13/533
Competing interestsThe authors declare there are no competing interests.
Authors’ contributionsConceived and designed the experiments: PS JR. Performed the experiments:PS CC FMA WOP RMS MFGK. Interpreted experimental data: PS CC HB.Clinical data analysis and sample selection: RM VWF EHT FDN. Wrote thepaper: PS HB. All authors read and approved the final manuscript.
AcknowledgementsFinancial support was provided by Fundaçao de Amparo a Pesquisa doEstado de Sao Paulo - FAPESP (05/51467-0 and 09/04166-5) and AlbertEinstein Research and Education Institute – IIEP (IEP.PE.08-0125). CC and JRwere funded by The Wellcome Trust. The authors acknowledge Dr. FlavioBorges for statistical analysis of miRNA expression and clinical data. The au-thors acknowledge the contribution of the GENCAPO (Brazilian Head andNeck Genome Project) for sample collection, clinical and pathological datacollection and interpretation, and fruitful discussions (complete list of mem-bers and affiliations presented at http://www.gencapo.famerp.br).
Author details1Albert Einstein Research and Education Institute, Hospital Israelita AlbertEinstein, Sao Paulo, Brazil. 2Department of Biomedicine, Aarhus University,Aarhus, Denmark. 3Genomics Group at the Wellcome Trust Centre forHuman Genetics, University of Oxford, Oxford, UK. 4Radiation TechnologyCenter (CTR), Nuclear and Energetic Research Institute IPEN/CNEN, Sao Paulo,Brazil. 5Division of Head and Neck Surgery, Department of Surgery, School ofMedicine, University of Sao Paulo, Sao Paulo, Brazil. 6Department ofEpidemiology, Faculty of Public Health, University of Sao Paulo, Sao Paulo,Brazil. 7Department of Stomatology, Faculty of Dentistry, University of SaoPaulo, Sao Paulo, Brazil. 8Department of Molecular Biology, School ofMedicine, Sao Jose do Rio Preto, Sao Paulo, Brazil.
Received: 25 October 2012 Accepted: 24 October 2013Published: 9 November 2013
References1. Bartel DP: MicroRNAs: genomics, biogenesis, mechanism, and function.
Cell 2004, 116(2):281–297.2. Jopling CL, Yi M, Lancaster AM, Lemon SM, Sarnow P: Modulation of
hepatitis C virus RNA abundance by a liver-specific MicroRNA.Science 2005, 309(5740):1577–1581.
3. Vasudevan S, Tong YC, Steitz JA: Switching from repression to activation:MicroRNAs can up-regulate translation. Science 2007, 318(5858):1931–1934.
4. Lu J, Getz G, Miska EA, Alvarez-Saavedra E, Lamb J, Peck D, Sweet-CorderoA, Ebet BL, Mak RH, Ferrando AA, et al: MicroRNA expression profilesclassify human cancers. Nature 2005, 435(7043):834–838.
5. Michael MZ, O’Connor SM, Pellekaan NGV, Young GP, James RJ: Reducedaccumulation of specific microRNAs in colorectal neoplasia. Mol CancerRes 2003, 1(12):882–891.
6. Bartels CL, Tsongalis GJ: MicroRNAs: novel biomarkers for human cancer.Clin Chem 2009, 55(4):623–631.
7. Forastiere A, Koch W, Trotti A, Sidransky D: Head and neck cancer. N Engl JMed 2001, 345(26):1890–1900.
8. Mao L, Hong WK, Papadimitrakopoulou VA: Focus on head and neckcancer. Cancer Cell 2004, 5(4):311–316.
9. Liu X, Chen Z, Yu J, Xia J, Zhou X: MicroRNA profiling and head and neckcancer. Comp Funct Genet 2009:837514.
10. Babu JM, Prathibha R, Jijith VS, Hariharan R, Pillai MR: A miR-centric view ofhead and neck cancers. Biochim Biophys Acta 2011, 1816(1):67–72.
11. Wua BH, Xiong XP, Jia J, Zhang WF: MicroRNAs: New actors in the oralcancer scene. Oral Oncol 2011, 47(5):314–319.
12. Childs G, Fazzari M, Kung G, Kawachi N, Brandwein-Gensler M, McLemore M,Chen Q, Burk RD, Smith RV, Prystowsky MB, et al: Low-level expression ofmicroRNAs let-7d and miR-205 are prognostic markers of head and necksquamous cell carcinoma. Am J Pathol 2009, 174(3):736–745.
13. Avissar M, McClean MD, Kelsey KT, Marsit CJ: MicroRNA expression in headand neck cancer associates with alcohol consumption and survival.Carcinogenesis 2009, 30(12):2059–2063.
14. Christensen BC, Moyer BJ, Avissar M, Ouellet LG, Plaza SL, McClean MD,Marsit CJ, Kelsey KT: A let-7 microRNA-binding site polymorphism in the
KRAS 3’ UTR is associated with reduced survival in oral cancers.Carcinogenesis 2009, 30(6):1003–1007.
15. Avissar M, Christensen BC, Kelsey KT, Marsit CJ: MicroRNA expression ratiois predictive of head and neck squamous cell carcinoma. Clin Cancer Res2009, 15(8):2850–2855.
16. Fletcher AM, Heaford AC, Trask DK: Detection of metastatic head and necksquamous cell carcinoma using the relative expression of tissue-specificmir-205. Transl Oncol 2008, 1(4):202–208.
17. Tanzer A, Amemiya CT, Kim CB, Stadler PF: Evolution of microRNAs locatedwithin Hox gene clusters. J Exp Zool B Mol Dev Evol 2005, 304B(1):75–85.
18. Yekta S, Tabin CJ, Bartel DP: MicroRNAs in the Hox network: an apparentlink to posterior prevalence. Nat Rev Genet 2008, 9(10):789–796.
19. Breitling R, Armengaud P, Amtmann A, Herzyk P: Rank products: a simple,yet powerful, new method to detect differentially regulated genes inreplicated microarray experiments. FEBS Lett 2004, 573(1–3):83–92.
20. Livak KJ, Schmittgen TD: Analysis of relative gene expression data usingreal-time quantitative PCR and the 2(T)(−Delta Delta C) method.Methods 2001, 25(4):402–408.
21. Vandesompele J, De Preter K, Pattyn F, Poppe B, Van Roy N, De Paepe A,Speleman F: Accurate normalization of real-time quantitative RT-PCR databy geometric averaging of multiple internal control genes. Genome Biol2002, 3(7):@@. Epub 2002 Jun 18.
22. Klingbeil MFG, Herson MR, Cristo EB, Pinto DD, Yoshito D, Mathor MB:Comparison of two cellular harvesting methods for primary human oralculture of keratinocytes. Cell Tissue Bank 2009, 10(3):197–204.
23. Ziober AF, Patel KR, Alawi F, Gimotty P, Weber RS, Feldman MM, Chalian AA,Weinstein GS, Hunt J, Ziober BL: Identification of a gene signature forrapid screening of oral squamous cell carcinoma. Clin Cancer Res 2006,12(20 Pt 1):5960–5971.
24. Severino P, Alvares AM, Michaluart P Jr, Okamoto OK, Nunes FD, Moreira-Filho CA, Tajara EH: Global gene expression profiling of oral cavitycancers suggests molecular heterogeneity within anatomic subsites.BMC Res Notes 2008, 1:113.
25. Wu BH, Xiong XP, Jia J, Zhang WF: MicroRNAs: new actors in the oralcancer scene. Oral Oncol 2011, 47(5):314–319.
26. Tran N, O’Brien CJ, Clark J, Rose B: Potential role of micro-RNAs in headand neck tumorigenesis. Head Neck 2010, 32(8):1099–1111.
27. Hayashita Y, Osada H, Tatematsu Y, Yamada H, Yanagisawa K, Tomida S,Yatabe Y, Kawahara K, Sekido Y, Takahashi T: A polycistronic microRNAcluster, miR-17-92, is overexpressed in human lung cancers and en-hances cell proliferation. Cancer Res 2005, 65(21):9628–9632.
28. Olive V, Jiang I, He L: mir-17-92, a cluster of miRNAs in the midst of thecancer network. Int J Biochem Cell Biol 2010, 42(8):1348–1354.
29. Woods K, Thomson JM, Hammond SM: Direct regulation of an oncogenicmicro-RNA cluster by E2F transcription factors. J Biol Chem 2007,282(4):2130–2134.
30. Aguda BD, Kim Y, Piper-Hunter MG, Friedman A, Marsh CB: MicroRNA regula-tion of a cancer network: consequences of the feedback loops involvingmiR-17-92, E2F, and Myc. Proc Natl Acad Sci U S A 2008, 105(50):19678–19683.
31. Xu B, Liu P, Li J, Lu H: c-MYC depletion potentiates cisplatin-inducedapoptosis in head and neck squamous cell carcinoma: involvement ofTSP-1 up-regulation. Ann Oncol 2010, 21(3):670–672.
32. Mestdagh P, Bostrom AK, Impens F, Fredlund E, Van Peer G, De Antonellis P,von Stedingk K, Ghesquiere B, Schulte S, Dews M, et al: The miR-17-92microRNA cluster regulates multiple components of the TGF-beta path-way in neuroblastoma. Mol Cell 2010, 40(5):762–773.
33. Kumar B, Yadav A, Lang J, Teknos TN, Kumar P: Dysregulation of microRNA-34a expression in head and neck squamous cell carcinoma promotestumor growth and tumor angiogenesis. PLoS One 2012, 7(5):e37601.
34. Corney DC, Flesken-Nikitin A, Godwin AK, Wang W, Nikitin AY: MicroRNA-34b and MicroRNA-34c are targets of p53 and cooperate in control ofcell proliferation and adhesion-independent growth. Cancer Res 2007,67(18):8433–8438.
35. Hermeking H: The miR-34 family in cancer and apoptosis. Cell Death Differ2010, 17(2):193–199.
36. Koch WM, Brennan JA, Zahurak M, Goodman SN, Westra WH, Schwab D,Yoo GH, Lee DJ, Forastiere AA, Sidransky D: p53 mutation and locoregionaltreatment failure in head and neck squamous cell carcinoma. J NatlCancer Inst 1996, 88(21):1580–1586.
37. Wong TS, Liu XB, Ho ACW, Yuen APW, Ng RWM, Wei WI: Identification ofpyruvate kinase type M2 as potential oncoprotein in squamous cell
Severino et al. BMC Cancer 2013, 13:533 Page 15 of 15http://www.biomedcentral.com/1471-2407/13/533
carcinoma of tongue through microRNA profiling. Int J Cancer 2008,123(2):251–257.
38. Kinoshita T, Nohata N, Watanabe-Takano H, Yoshino H, Hidaka H, Fujimura L,Fuse M, Yamasaki T, Enokida H, Nakagawa M, et al: Actin-related protein2/3 complex subunit 5 (ARPC5) contributes to cell migration and invasionand is directly regulated by tumor-suppressive microRNA-133a in headand neck squamous cell carcinoma. Int J Oncol 2012, 40(6):1770–1778.
39. Kinoshita T, Nohata N, Fuse M, Hanazawa T, Kikkawa N, Fujimura L,Watanabe-Takano H, Yamada Y, Yoshino H, Enokida H, et al: Tumor sup-pressive microRNA-133a regulates novel targets: Moesin contributes tocancer cell proliferation and invasion in head and neck squamous cellcarcinoma. Biochem Biophys Res Commun 2012, 418(2):378–383.
40. Lund AH: miR-10 in development and cancer. Cell Death Differ 2010,17(2):209–214.
41. Chen C, Zhang Y, Zhang L, Weakley SM, Yao Q:MicroRNA-196: critical roles andclinical applications in development and cancer. J Cell Mol Med 2011, 15(1):14–23.
42. Yekta S, Shih IH, Bartel DP: MicroRNA-directed cleavage of HOXB8 mRNA.Science 2004, 304(5670):594–596.
43. Schimanski CC, Frerichs K, Rahman F, Berger M, Lang H, Galle PR, MoehlerM, Gockel I: High miR-196a levels promote the oncogenic phenotype ofcolorectal cancer cells. World J Gastroenterol 2009, 15(17):2089–2096.
44. Baffa R, Fassan M, Volinia S, O’Hara B, Liu CG, Palazzo JP, Gardiman M, Rugge M,Gomella LG, Croce CM, et al:MicroRNA expression profiling of humanmetastatic cancers identifies cancer gene targets. J Pathol 2009, 219(2):214–221.
45. Ma L, Teruya-Feldstein J, Weinberg RA: Tumour invasion and metastasis initi-ated by microRNA 10b in breast cancer. Nature 2007, 449(7163):682–U682.
46. Wynter CVA: The dialectics of cancer: a theory of the initiation anddevelopment of cancer through errors in RNAi. Med Hypotheses 2006,66(3):612–635.
47. Oganesian L, Karlseder J: Mammalian 5’ C-rich telomeric overhangs are amark of recombination-dependent telomere maintenance. Mol Cell 2011,42(2):224–236.
48. Garzon R, Pichiorri F, Palumbo T, Iuliano R, Cimmino A, Aqeilan R, Volinia S,Bhatt D, Alder H, Marcucci G, et al: MicroRNA fingerprints during humanmegakaryocytopoiesis. Proc Natl Acad Sci U S A 2006, 103(13):5078–5083.
49. Tian YY, Luo AP, Cai YR, Su Q, Ding F, Chen HY, Liu ZH: MicroRNA-10bpromotes migration and invasion through KLF4 in human esophagealcancer cell lines. J Biol Chem 2010, 285(11):7986–7994.
50. Luthra R, Singh RR, Luthra MG, Li YX, Hannah C, Romans AM, Barkoh BA,Chen SS, Ensor J, Maru DM, et al: MicroRNA-196a targets annexin A1: amicroRNA-mediated mechanism of annexin A1 downregulation in can-cers. Oncogene 2008, 27(52):6667–6678.
51. Maru DM, Singh RR, Hannah C, Albarracin CT, Li YX, Abraham R, Romans AM,Yao H, Luthra MG, Anandasabapathy S, et al: MicroRNA-196a is a potentialmarker of progression during Barrett’s metaplasia-dysplasia-invasive adeno-carcinoma sequence in esophagus. Am J Pathol 2009, 174(5):1940–1948.
52. Pedrero JMG, Fernandez MP, Morgan RO, Zapatero AH, Gonzalez MV, Nieto CS,Rodrigo JP: Annexin A1 down-regulation in head and neck cancer is associ-ated with epithelial differentiation status. Am J Pathol 2004, 164(1):73–79.
53. Alves VA, Nonogaki S, Cury PM, Wunsch-Filho V, de Carvalho MB,Michaluart-Junior P, Moyses RA, Curioni OA, Figueiredo DL, Scapulatempo-Neto C, et al: Annexin A1 subcellular expression in laryngeal squamouscell carcinoma. Histopathology 2008, 53(6):715–727.
54. Melino G, De Laurenzi V, Vousden KH: p73: Friend or foe in tumorigenesis.Nat Rev Cancer 2002, 2(8):605–615.
55. New DC, Wong YH: Molecular mechanisms mediating the G protein-coupled receptor regulation of cell cycle progression. J Mol Signal 2007, 2:2.
56. Cassell A, Grandis JR: Investigational EGFR-targeted therapy in head and necksquamous cell carcinoma. Expert Opin Investig Drugs 2010, 19(6):709–722.
57. Agrawal N, Frederick MJ, Pickering CR, Bettegowda C, Chang K, Li RJ, FakhryC, Xie TX, Zhang J, Wang J, et al: Exome sequencing of head and necksquamous cell carcinoma reveals inactivating mutations in NOTCH1.Science 2011, 333(6046):1154–1157.
doi:10.1186/1471-2407-13-533Cite this article as: Severino et al.: MicroRNA expression profile in headand neck cancer: HOX-cluster embedded microRNA-196a andmicroRNA-10b dysregulation implicated in cell proliferation. BMC Cancer2013 13:533.
Submit your next manuscript to BioMed Centraland take full advantage of:
• Convenient online submission
• Thorough peer review
• No space constraints or color figure charges
• Immediate publication on acceptance
• Inclusion in PubMed, CAS, Scopus and Google Scholar
• Research which is freely available for redistribution
Submit your manuscript at www.biomedcentral.com/submit
Related Documents


![Review Article ...downloads.hindawi.com/journals/jsc/2012/707260.pdfrant expression was higher in metastatic CMM compared to pT1-T3 nonmetastatic tumours [22, 31]. MicroRNA (miRNA)-196a](https://static.cupdf.com/doc/110x72/61152f99d0ea270dce049099/review-article-rant-expression-was-higher-in-metastatic-cmm-compared-to-pt1-t3.jpg)