Microplastic: What Are the Solutions? Marcus Eriksen, Martin Thiel, Matt Prindiville, and Tim Kiessling Abstract The plastic that pollutes our waterways and the ocean gyres is a symp- tom of upstream material mismanagement, resulting in its ubiquity throughout the biosphere in both aquatic and terrestrial environments. While environmental con- tamination is widespread, there are several reasonable intervention points present as the material flows through society and the environment, from initial production to deep-sea microplastic sedimentation. Plastic passes through the hands of many stakeholders, with responsibility for environmental contamination owned, shared, or rejected by plastic producers, product/packaging manufacturers, government, consumers, and waste handlers. The contemporary debate about solutions, in a broad sense, largely contrasts the circular economy with the current linear economic model. While there is a wide agreement that improved waste recovery is essential, how that waste is managed is a different story. The subjective positions of stakeholders illuminate their economic philosophy, whether it is to maintain demand for new plastic by incinerating M. Eriksen (*) 5 Gyres Institute, Los Angeles, CA, USA e-mail: [email protected] M. Thiel Facultad Ciencias del Mar, Universidad Cato ´lica del Norte, Larrondo 1281, Coquimbo, Chile Millennium Nucleus Ecology and Sustainable Management of Oceanic Island (ESMOI), Coquimbo, Chile Centro de Estudios Avanzados en Zonas A ´ ridas (CEAZA), Coquimbo, Chile e-mail: [email protected] M. Prindiville Upstream Policy Project, Damariscotta, ME, USA T. Kiessling Facultad Ciencias del Mar, Universidad Cato ´lica del Norte, Larrondo 1281, Coquimbo, Chile M. Wagner, S. Lambert (eds.), Freshwater Microplastics, Hdb Env Chem 58, DOI 10.1007/978-3-319-61615-5_13, © The Author(s) 2018 273

Welcome message from author
This document is posted to help you gain knowledge. Please leave a comment to let me know what you think about it! Share it to your friends and learn new things together.
Transcript
Microplastic: What Are the Solutions?
Marcus Eriksen, Martin Thiel, Matt Prindiville, and Tim Kiessling
Abstract The plastic that pollutes our waterways and the ocean gyres is a symp-
tom of upstream material mismanagement, resulting in its ubiquity throughout the
biosphere in both aquatic and terrestrial environments. While environmental con-
tamination is widespread, there are several reasonable intervention points present as
the material flows through society and the environment, from initial production to
deep-sea microplastic sedimentation. Plastic passes through the hands of many
stakeholders, with responsibility for environmental contamination owned, shared,
or rejected by plastic producers, product/packaging manufacturers, government,
consumers, and waste handlers.
The contemporary debate about solutions, in a broad sense, largely contrasts the
circular economy with the current linear economic model. While there is a wide
agreement that improved waste recovery is essential, how that waste is managed is a
different story. The subjective positions of stakeholders illuminate their economic
philosophy, whether it is to maintain demand for new plastic by incinerating
M. Eriksen (*)
5 Gyres Institute, Los Angeles, CA, USA
e-mail: [email protected]
M. Thiel
Facultad Ciencias del Mar, Universidad Catolica del Norte, Larrondo 1281, Coquimbo, Chile
Millennium Nucleus Ecology and Sustainable Management of Oceanic Island (ESMOI),
Coquimbo, Chile
Centro de Estudios Avanzados en Zonas Aridas (CEAZA), Coquimbo, Chile
e-mail: [email protected]
M. Prindiville
Upstream Policy Project, Damariscotta, ME, USA
T. Kiessling
Facultad Ciencias del Mar, Universidad Catolica del Norte, Larrondo 1281, Coquimbo, Chile
M. Wagner, S. Lambert (eds.), Freshwater Microplastics,Hdb Env Chem 58, DOI 10.1007/978-3-319-61615-5_13,© The Author(s) 2018
273

postconsumer material or maintain material efficacy through recycling, regulated
design, and producer responsibility; many proposed solutions fall under linear or
circular economic models. Recent efforts to bring often unheard stakeholders to the
table, including waste pickers in developing countries, have shed new light on the
life cycle of plastic in a social justice context, in response to the growing economic
and human health concerns.
In this chapter we discuss the main solutions, stakeholder costs, and benefits. We
emphasize the role of the “honest broker” in science, to present the best analysis
possible to create the most viable solutions to plastic pollution for public and
private leadership to utilize.
Keywords Extended producer responsibility, Marine debris solutions,
Microplastic, Plastic marine pollution, Recycling, Reuse
1 Research Conclusions Guide Solutions
Since 2010 there have been more research publications about plastic marine
pollution than in the previous four decades, bringing the issue mainstream as a
robust field of science and in public discourse. Much of what we know can be
summarized in three conclusions: fragmented plastic is globally distributed, it is
associated with a cocktail of hazardous chemicals and thus is another source of
hazardous chemicals to aquatic habitats and animals, and it entangles and is
ingested by hundreds of species of wildlife at every level of the food chain
including animals we consider seafood [1].
Global Distribution ofMicroplastics The global distribution of plastics is a result
of the fragmentation and transportation by wind and currents to the aquatic envi-
ronment, from inland lakes and rivers to the open ocean and likely deposition to
coastlines or the seafloor [2]. New studies are showing increasing abundances of
microplastic upstream, showing that microplastic formation is not limited to the
sea, though it was discovered there.
The first observations of plastic in the ocean were made in 1972 in the western
North Atlantic consisting of preproduction pellets and degraded fragments found in
plankton tows [3]. Studies in the North Pacific [4, 5], and South Atlantic followed
[6]. Scientists were beginning to understand the global implications of fragmented
plastics traveling long distances. “Data from our oceanic survey suggests that
plastic from both intra- and extra-gyral sources becomes concentrated in the center
of the gyre, in much the same fashion that Sargassum does [7].”
In 2001 Captain Charles Moore published his discovery of an accumulation of
microplastics in the North Pacific Subtropical Gyre [8]. This finding might have
joined the trickle of research that had been published in the previous quarter
century, but sensationalized media stories reported fictional islands of trash con-
verging in the ocean that were forming garbage patches twice the size of Texas.
274 M. Eriksen et al.
This subsequently catalyzed the attention, interest, and concern of the public,
policymakers, industry, and science.
Regional and global estimates of floating debris have come forth [9, 10]. Esti-
mates of environmental concentrations have ranged from 8 million tons of plastic
leaving shorelines globally each year [11], compared to one estimate of a quarter
million tons drifting at sea [12]. This represents a huge disparity suggesting that
plastics sink, wash back ashore, or fragment long before they arrive in the subtrop-
ical gyres. Analysis of the size distribution of plastic in the oceans has found
hundred times less microplastics than expected [10, 12], supporting the suggestion
that fragmented microplastics do not survive at the sea surface indefinitely and
likely invade marine food chains before moving subsurface to be captured by
deeper circulating currents and ultimately deposited as sediment. Recent studies
have unveiled microplastics frozen in sea ice [13] and deposited on shorelines
worldwide [14] and across the sea floor [15, 16], even the precipitation of synthetic
fibers as fallout from the skies [17]. Collectively, these observations suggest
widespread contamination in all environments.
Inherent Toxicity and the Sorption of Pollutants While plastic products enter-
ing the ocean represent a range of varied polymers and plasticizers, many absorb
(taking in) and adsorb (sticking to) other persistent organic pollutants and metals
lost to the environment, resulting in a long list of toxicants associated with plastic
debris [18]. Gas stations will sometimes use giant mesh socks full of polyethylene
pellets draped around storm drains to absorb hazardous chemicals before they reach
the watershed. In the aquatic environment, plastic behaves similarly, mopping up
chemicals in surrounding water. Several persistent organic pollutants (POPs) bind
to plastic as it is transported through the watershed, buried in sediment, or floating
in the ocean [19, 20]. A single pellet may attract up to one million times the
concentration of some pollutants in ambient seawater [21], and these chemicals
may be available to marine life upon ingestion.
The chemistry of plastic in consumer products raises human health as well as
ecological concerns. For example, they include polyfluorinated compounds
(“PFCs”) [22–24] and the pesticide/sanitizer triclosan [25, 26], also used in over-
the-counter drugs, antimicrobial hand soaps and some toothpaste brands, flame
retardants, particularly PBDEs [27, 28], and nonylphenols. Bisphenol A (BPA), the
building block of polycarbonates, and phthalates – the plastic additive that turns
hardened PVC into pliable vinyl � are both known endocrine disruptors [29, 30].
This is not surprising in the case of BPA, which was invented as a synthetic
estrogen [31], yet proved to be a usable form of plastic. Exposure may come from
the lining of metal cans for food storage [32], CDs, DVDs, polycarbonate dishware,
and receipt paper from cash registers. BPA has been linked to many developmental
disruptions, including early puberty, increased prostate size, obesity, insulin inhi-
bition, hyperactivity, and learning disabilities [33]. Phthalates are similarly prob-
lematic as endocrine disruptors [34], with effects including early puberty in
females, feminization in males, and insulin resistance [35]. Different phthalates
Microplastic: What Are the Solutions? 275
are found in paints, toys, cosmetics and food packaging, added for the purpose of
increasing durability, elasticity, and pliability. In medical applications, such as IV
bags and tubes, phthalates are prone to leaching after long storage, exposure to
elevated temperatures, and as a result of the high concentration present – up to 40%
by weight [36]. Although phthalates metabolize quickly, in a week or less, we are
exposed continuously through contact with associated products.
Widespread Effects on Marine Life Of the 557 species documented to ingest or
entangle in our trash, at least 203 [1] of them are also ingesting microplastic in the
wild, of which many are fish [37] and other vertebrates [38, 39]. In addition,
laboratory data suggest a growing list of zooplankton [40], arthropods [41], mol-
lusks [42], and sediment worms [43] is also susceptible, along with phytoplankton
interactions that may affect sedimentation rates [44]. In addition, examples of clams
[45] and fish [46] recovered from fish markets have been found with abundant
microplastics in the gut. A study of mussels in the lab demonstrated that 10 μmmicroplastics were translocated to the circulatory system [47], leading to studies
that now demonstrate evidence that micro- and nanoplastics can bridge trophic
levels into crustaceans and other secondary consumers [48, 49]. Ingested
microplastic laden with polybrominated diphenyls (PBDEs) may transfer to birds
[50, 51] and to lugworms [52]. The evidence is growing that there are impacts on
individual animals including cancers in fish [53] and lower reproductive success
and shorter lifespan in marine worms [43]. Some studies even show impacts to
laboratory populations: one study of oysters concludes that there is “evidence that
micro-PS (polystyrene) cause feeding modifications and reproductive disruption
[. . .] with significant impacts on offspring” [54].
While some research shows that plastic can be a vector, or entry point, for these
toxicants to enter food webs, others do not. Some studies of microplastic ingestion
have shown that complete egestion follows, as in the marine isopod Idoteaemarginata [55], or ingestion of non-buoyant microplastics by the mud snail
Potampoyrgus antipodarum, which showed no deleterious effects in development
during the entire larval stage [56]. A recent review concluded that hydrophobic
chemicals bioaccumulated from natural prey overwhelm the flux from ingested
microplastic for most habitats, implying that microplastic in the environment is not
likely to increase exposure [57].
Section Summary These three themes dominate the literature today, with an
increasing resolution on ecotoxicology and human health. Understanding the fate
of micro- and nanoplastics is necessary for a better understanding of the distribution
and disposition of plastic pollution. These themes collectively imply microplastic is
hazardous to the aquatic environment in the broadest sense. As the literature
expands, these themes become benchmarks, tools for policymakers, to mitigate
foreseen problems of microplastic contamination of all environments and the social
impacts they have on communities worldwide.
276 M. Eriksen et al.

2 Mitigation Where There Is Harm
Demonstrated harm to wildlife from plastic is documented from entanglement and
macrodebris ingestion, and ingestion of microplastics have shown negative impacts
on individual organisms, but demonstrating that microplastics cause harm to the
whole ecosystems is unclear [58]. In a recent meta-analysis of available research
demonstrating impacts on wildlife from marine debris, 82% of 296 demonstrated
impacts were caused by plastic [59]. Interestingly, the vast majority of those (89%)
were impacts at suborganismal levels from micro- and nanoplastics, including
damages to tissues or organ function, with only 11% due to impacts from large
debris, such as entanglement in ropes and netting or death from ingestion of larger
items.
According to Rochman et al. [59] there are many cases of suborganismal level
impacts, like the ingestion of 20 μm microplastic particles by the copepod Calanushelgolandicus affecting survival and fecundity [60], toxic effects on the embryonic
development of the sea urchin Lytechinus variegatus [61], and reduced feeding in
the annelid worm Arenicola marina after ingesting 400 μm particles [43]. What
these studies and others have in common is that they are limited to laboratory
settings, often using PS microspheres only, and use a narrow scale of particle size,
shape, and duration of exposure [62]. This criticism was also pointed out in a recent
study of the freshwater mud snail Potamopyrgus antipodarum, whereby five com-
mon and environmentally relevant non-buoyant polymers were introduced in a
range of sizes and high concentrations in their food, resulting in no observed effects
[56], suggesting that more work in real settings with environmentally relevant
microplastic particle size, shape, and polymer type is needed to better understand
ecological harm.
Can we say ecological harm exists without the weight of evidence in the
literature to say so? One could argue that the volume of research published lately,
especially the proposal from Rochman and others to classify plastic marine debris
as a hazardous substance [63], indicates substantial concern from the scientific
community. That classification would meet criteria for mitigation from
policymakers in terms of shifting the burden of proof that plastic is safe to the
producer [64]. While further studies of ecological impacts are needed, it is reason-
able to employ the precautionary principle considering the risk of widespread and
irreversible harm.
Equally, we must not forget the harm to society from plastic pollution. The flow
of the material from plastic production to waste management and environmental
pollution affects societies in ways that are often difficult to quantify and are often
ignored. For example, plastic waste has been shown to incubate water-borne insects
and act as a vector for dengue fever in the Philippines [65]. The industry of waste-
picking in developing countries is plagued with substantial human health costs from
illness and injury from collecting and handling plastics. Open-pit and low-tech
Microplastic: What Are the Solutions? 277
incineration is correlated with respiratory illness and cancer clusters among the
populations that live near them [66]. While this book aims to understand the
impacts of freshwater microplastics, in this chapter we aim to understand and
include the upstream social costs in our assessment of the sources and true costs
associated with micro- and nanoplastics.
3 Downstream (Ocean Recovery) Versus Upstream
Intervention
Then where do our actions to prevent the potential of irreversible harm begin? The
three research themes (global distribution, toxicity, marine life impacts) guide
mitigation upstream, but it did not begin that way.
The sensationalized mythology of trash islands and garbage patches that had
dominated the public conversation about plastic marine pollution in the mid-2000s
invoked well-intentioned schemes to recover plastic from the ocean gyres, like
giant floating nets to capture debris and plastic-to-fuel pyrolysis machines on
ocean-going barges, to seeding the seas with bacteria that consume PET, polyeth-
ylene, and polypropylene (which, if this could work, would have the unintended
consequence of consuming fishing nets, buoys, docks, and boat hulls). All of these
schemes fail on several fronts: economics of cost-benefit, minimizing ecological
impacts, and design and testing in real ocean conditions [67]. Recent analysis of
debris hot spots and current modeling support the case for nearshore and riverine
collection rather than mid-ocean cleanup [68].
This begs the question, “What should be done about what is out there now?” If
we do nothing, the likely endgame for microplastic is sedimentation on shore [14]
or the seafloor [16], as a dynamic ocean ejects floating debris. Consider the
precedent of how tar balls plagued the open ocean and shorelines until MARPOL
Annex V stopped oil tankers from rinsing their ship hulls of petroleum residue to
the sea in the mid-1980s. A relatively rapid reduction in tar ball observations soon
followed [69]. Though we will live with a defining stratigraphy of micro- and
nanoplastic in sediments worldwide [70], the ocean can recover if we stop doing
more harm.
Still, what can be done about macrodebris? In the 2015 G7 meeting in Germany,
Fishing for Litter was presented as the only viable ocean cleanup program, and
described as “a useful last option in the hierarchy, but can only address certain types
of marine litter” [71]. While Fishing for Litter campaigns can be effective at
capturing large persistent debris, like fishing nets, buoys, buckets, and crates before
they fragment further, like the KIMO International efforts in North Sea and around
Scotland [72], they do not address the source.
278 M. Eriksen et al.
4 Upstream Interventions at the Sources of Freshwater
Microplastic
Doing no more harm requires upstream intervention. The further upstream mitiga-
tion occurs, the greater the opportunity to collect more plastic with less degradation
and fragmentation and identifying sources before environmental impacts occur. For
most scientists and policymakers, ocean cleanup is not economically or logistically
feasible, moving the debate to upstream efforts, like zero waste strategies, improv-
ing waste recovery, and management and mitigating point and nonpoint sources of
microplastic creation and loss to the environment.
Measuring Microplastic Sources There is wide agreement that microplastic at
sea is a case of the tragedy of the commons, whereby its abundance in international
waters and untraceability makes it nearly impossible to source to the company or
country of origin. In terrestrial environments, identification to source is easier due
to less degradation, but capturing and quantifying microplastics in any environment
is difficult and can easily be contaminated or misidentified [73], and in inland
waterways there is the challenge of sorting debris from large amounts of biomass.
In the United States provisions under the Clean Water Act and state TMDLs (Total
Max Daily Loads) direct environmental agencies to regulate plastic waste in
waterways, like California’s TMDLs, though they are often limited to >5 mm
and miss microplastic entirely.
While there are processes in the environment that degrade plastic into smaller
particles (UV degradation, oxidation, embrittlement and breakage, biodegradation),
there are other terrestrial activities and product/packaging designs that create
microplastic (Table 1). These may include the mishandling of preproduction pellets
at production and distribution sites, industrial abrasives, synthetic grass in sports
arenas, torn corners of sauce packets, vehicle tire dust, tooled shavings from plastic
product manufacture, road abrasion of plastic waste on roadsides, unfiltered dryer
exhaust at laundry facilities losing microfibers to the air [17], or combined sewage
overflow that discharges plastics from residential sewer lines, like personal care
products, fibers from textiles, and cosmetics, into the aquatic environment. These
many sources lack specific methods of measurement.
There are examples of observed microplastic abundance in terrestrial and fresh-
water environments leading to mitigations, such as the US Microbead-Free Waters
Act of 2015 [74] and state laws on the best management practices on preproduction
pellet loss [75]. Interestingly, these two examples share three common character-
istics: (a) they are quantified by standard methods using nets to measure discharges
in waterways, (b) they are found in high abundance, and (c) they are primary
microplastics, making it easier to identify responsible sources. Considering the
many terrestrial activities that create small amounts of difficult to quantify micro-
and nanoplastics, often called secondary microplastics, there is a need for new
methods to measure their significance.
Microplastic: What Are the Solutions? 279

Why wait until microplastic reaches water to quantify its existence? The current
methods of storm drain catchment and waste characterization measure macroplastic
only. Microplastics, such as synthetic grass, tooled shavings, road abrasion, etc., are
sources of microplastic with unknown abundances, which could be measured by
sampling surface areas on the ground nearby the activities that create them.
Methodologies might include square meter sweeping of sidewalks and roadsides
to quantify abundances. A recent study of microfiber fallout used containers on
rooftops in Paris to capture airborne particles [17]. These micro- and nanoplastic
fibers can be measured closer to the source. Surveying the surface of foliage near
laundromats (Eriksen, unpublished data) recently discovered abundant microfibers.
Other methods might employ footbaths outside hotels or shops with carpeted floors
to measure the transport of fibers due to foot traffic. The production of household
microplastics could be estimated from dust particles accumulated in the filter bags
of vacuum cleaners. Quantifying the significance of these point and nonpoint
sources might assist efforts to mitigate their contributions.
Table 1 Sources, measurements, and strategies for upstream mitigation of microplastics
Tackling upstream microplastics
Category Source Potential mitigation
Production Microplastics in cosmetics Removing them from products.
Replace with benign alternatives
Mismanaged preproduction pellets Regulate pellet handling. Operation
clean sweep
Commerce Industrial abrasives Improve containment and recovery
and require alternatives
Laundromat exhaust Improved filtration
Agriculture – degraded film, pots, and
pipes
Improve recovery, biodegradable
plastics
Consumer Tire dust Technological advances, road surface
Littering of small plastic items (ciga-
rette filters, torn corners of packaging,
small film wrappers, etc.)
Enforcement of fines for littering,
consumer education, EPR on design
Domestic laundry. Waste water effluent Wash with top-load machines.
Wastewater containment, single-fiber
woven textiles. Textile coatings
Waste
management
Fragmentation by vehicles driving over
unrecovered waste
Improved waste management
UV and chemically degraded terrestrial
plastic waste
Improved waste management
Sewage effluent (synthetic fibers) Laundry filtration, textile industry
innovation
Combined sewage overflow (large
items)
Infrastructure improvement
Mechanical shredding of roadside waste
during regular cutting of vegetation
(mostly grass)
Better legislation and law enforce-
ment; valorization of waste products
280 M. Eriksen et al.
5 Competing Economic Models Impact Microplastic
Generation
The contemporary debate about solutions largely contrasts the circular economy
with the current linear economic model. These competing economic models reveal
subjective stakeholder motives, whether it is a fiduciary responsibility to share-
holders, an environmental or social justice mission, or an entrepreneurial opportunity.
These economic models influence the design and utility of plastic and therefore the
abundance and exposure of plastic waste to the environment, thus influencing the
formation of microplastic.
Material Loss Along the Value Chain in the Linear and Circular Economic
Models Given the many sources of microplastic, the different sectors of economy
and society producing these and the relatively limited knowledge about them
(Table 1), it becomes apparent how difficult it would be trying to “plug” leaks of
microplastics to the environment. Some of the sources could be stopped by effec-
tive legislation (e.g., banning microbeads in cosmetic products), education and
regulation enforcement (litter laws), and technological advancements (effluent
filters, biodegradable polymers).
However, in the end it becomes increasingly difficult to mitigate these leak
points the further from the source intervention begins. The closest point to the
source is the choice of polymer and how it is managed throughout the supply chain
and once it becomes waste. Some efforts have included an upfront tax to fund
cleanup efforts or mitigate environmental impacts, but those appear impractical due
to the diffusion and difficulty in collecting small microplastics. Given the low value
of most postconsumer plastic products and lack of recovery incentives, the chances
of downstream mitigation are extremely low.
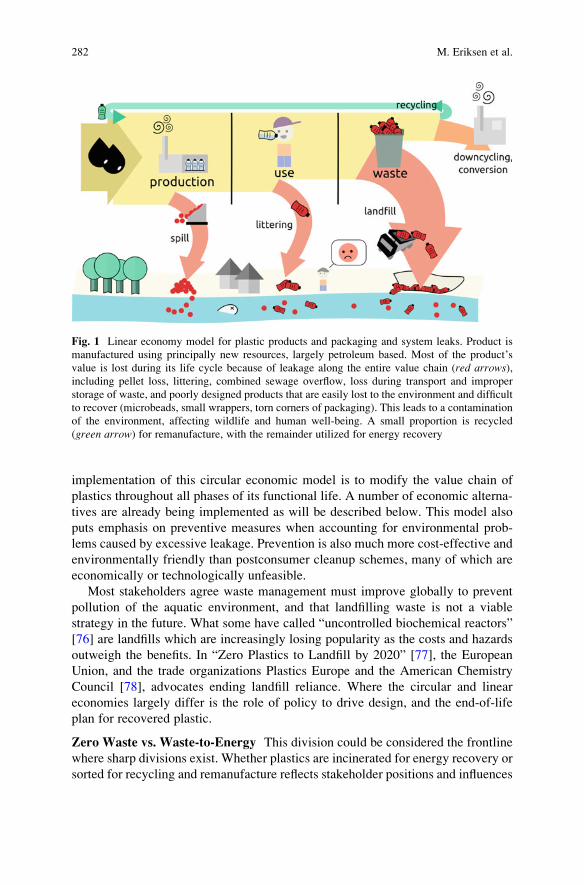
Consequently, leaks of microplastics to the terrestrial and ultimately aquatic
environment (primary or secondary by input in form of large objects which later
degrade into microplastics) occur throughout the supply chain, e.g., in form of loss
of preproduction pellets, littering, or irresponsible waste management (Fig. 1).
Little material remains in the system, and most would not be fit for effective
recycling (i.e., reusing) because of contamination or expensive recuperation
schemes. Deposition in landfills or energy recovery through incineration therefore
appears as the ultimate strategy to remove almost all material from the system,
effectively creating a linear economic model. Energy recovery is not a form of
recycling and does not break this linearity, because it essentially removes used
plastics from the economic system through destruction, converting them into ashes
and atmospheric CO2 (Fig. 1).
A circular economic model on the other hand could address leaks of plastics at
all life cycle stages. The reduction of leakage to the environment requires adapta-
tion and consensus of all stakeholders, e.g., designing for reuse; discouraging
littering, for example, by introducing deposit return schemes; and ensuring a high
recycling quota during the waste stage (Fig. 2). Most likely one key to the
Microplastic: What Are the Solutions? 281
implementation of this circular economic model is to modify the value chain of
plastics throughout all phases of its functional life. A number of economic alterna-
tives are already being implemented as will be described below. This model also
puts emphasis on preventive measures when accounting for environmental prob-
lems caused by excessive leakage. Prevention is also much more cost-effective and
environmentally friendly than postconsumer cleanup schemes, many of which are
economically or technologically unfeasible.
Most stakeholders agree waste management must improve globally to prevent
pollution of the aquatic environment, and that landfilling waste is not a viable
strategy in the future. What some have called “uncontrolled biochemical reactors”
[76] are landfills which are increasingly losing popularity as the costs and hazards
outweigh the benefits. In “Zero Plastics to Landfill by 2020” [77], the European
Union, and the trade organizations Plastics Europe and the American Chemistry
Council [78], advocates ending landfill reliance. Where the circular and linear
economies largely differ is the role of policy to drive design, and the end-of-life
plan for recovered plastic.
Zero Waste vs. Waste-to-Energy This division could be considered the frontline
where sharp divisions exist. Whether plastics are incinerated for energy recovery or
sorted for recycling and remanufacture reflects stakeholder positions and influences
Fig. 1 Linear economy model for plastic products and packaging and system leaks. Product is
manufactured using principally new resources, largely petroleum based. Most of the product’svalue is lost during its life cycle because of leakage along the entire value chain (red arrows),including pellet loss, littering, combined sewage overflow, loss during transport and improper
storage of waste, and poorly designed products that are easily lost to the environment and difficult
to recover (microbeads, small wrappers, torn corners of packaging). This leads to a contamination
of the environment, affecting wildlife and human well-being. A small proportion is recycled
(green arrow) for remanufacture, with the remainder utilized for energy recovery
282 M. Eriksen et al.

decisions about product and packaging design and regulation far upstream. The
end-of-life plan for plastic affects the entire value chain.
A recent document produced by the Ocean Conservancy (2015) titled “Stem-
ming the Tide,” with strong industry support, called for a $5 billion investment in
waste management, with large-scale waste-to-energy incinerator plants targeting
SE Asia, specifically China, Taiwan, Philippines, Indonesia, and Vietnam, based on
a study reporting 4–12 million tons of waste entering the oceans annually, primarily
from that region [11]. It was released 1 week prior to the October 2015 Our Ocean
Conference. Within days, the organization Global Alliance for Incinerator Alter-
natives (GAIA) submitted a letter in response with 218 signatories, mostly envi-
ronmental and social justice NGOs, arguing that incinerators historically exceed
regulatory standards for emissions and subsequently cause harm to the environment
and human health and that the financial cost to build infrastructure, maintenance,
and management are typically underestimated [79]. In many cases, the financial
structure includes long-term waste quotas that lock communities into mandatory
waste generation [66]. For example, the $150 million cost to build the H-Power
Fig. 2 Circular economy model for plastic products and packaging. A high percentage of recycled
content is required as feedstock for new products, and the remainder from sustainable sources
(potentially biopolymers). Poor practices (red arrows) throughout the life cycle are mitigated, for
example, by proper legislative policy, public awareness that leads to proper consumer waste
handling, and incentivized recovery systems (e.g., returnable bottles). Recovery is further
improved by regulating end-of-life design in products and packaging. This leads to reduced
leakage of plastic to the environment from all sectors of society, and significant improvements
are social justice concerns for communities that manage waste. The small amount of residual
plastic is then disposed of responsibly
Microplastic: What Are the Solutions? 283
incinerator in Oahu, Hawaii, also comes with an 800,000 ton per year “put or pay”
trash obligation. If they don’t get their quota of waste, the city pays a portion of therevenue they would have earned burning the trash they didn’t get. The public calls it“feeding the beast” [80], which had undermined recycling, waste diversion, and
composting programs, for fear of fines.
Two earlier documents, “On the Road to Zero Waste” from GAIA [79] and
“Waste and Opportunity,” from As You Sow and the National Resources Defense
Council (NRDC) [81], both lay out a framework for sustainable material manage-
ment from resource extraction to recovery and remanufacture, without the need for
incineration, or the legacy of associated toxicity and human health effects.
In the developing world, circular economic systems are expanding. There are
material recovery facilities, or MRFs, sprouting up everywhere. Waste sorting and
collection happens door to door, with the collector keeping the value of recyclables
after delivering all materials to the local MRF. Organics are composted, recyclables
are cashed in, and the rest is put on public display to show product/packaging
design challenges. According to the Mother Earth Foundation, 279 communities in
the Philippines have MRFs, and waste diversion from landfills and open-pit burning
now exceeds 80%. The template for the community MRF is proving its scalability
across Asia, India, Africa and South America.
Rationale of the Linear Economy In 2014 Plastics Europe released an annual
report titled “Plastics – the facts 2013: An analysis of European latest plastics
production, demand and waste data” [82], outlining the forecast for plastic demand
and challenges in the years ahead. Worldwide, there has been a historical trend of a
4% increase of annual plastic production since the 1950s, with slight dips during the
OPEC embargo in the 1970s and the 2008 economic downturn, but otherwise it’sbeen steady growth from almost no domestic plastic produced post-WWII to
311 million tons of new plastic produced in 2013 alone. If this growth rate
continues as anticipated worldwide, there will be close to 600 million tons produced
annually by 2030 and over a billion tons a year by 2050.
This trajectory is partially based on rising demand from a growing global middle
class and is coupled with the rising population. Yet, these demands will stabilize,
leaving waste-to-energy through incineration a key driver in the security of demand
for new plastic production. Recycled plastic is a direct competitor with new plastic
production, being inversely proportional to the available supply. This has been
largely acknowledged and has kept recycling rates generally very low worldwide.
Consider recycle rates in the United States alone, with the highest recovery per
product in 2013 won by PET bottles (31.3%) seconded by HDPE milk containers
(28.2%), and national average for all plastic combined was 9.2% after 53 years of
keeping score [83].
The industry transition in light of these trends is to advocate energy recovery
after maximizing the utility of plastic, arguing that the cost vs. benefit of plastic
favors unregulated design and improved waste management. A careful look at the
life cycle of alternative materials (paper, metals, glass), from extraction to manu-
facture, transportation, and waste management, must be weighed against the
284 M. Eriksen et al.
benefits of plastic. Plastics make food last longer [84], offer more durable and
lightweight packaging for transportation of goods, maintain clean pipes for drinking
water distribution, and facilitate low-cost sterile supplies for hospitals, each having
degrees of efficiency over alternative materials in terms of waste generation, water
usage, and CO2 emissions, like lightweighting cars with plastic resulting in lower
fuel consumption [85].
For example, an industry analysis comparing the impacts of transportation,
production, waste management, and material/energy recovery on the environment
concluded that the upstream production and transportation phases of the value chain
for plastics accounted for 87% of total costs [78], leaving 13% of the impacts on the
environment caused downstream by how waste is managed. Plastic producers have
suggested that some of these upstream production impacts could be further miti-
gated by sourcing low-carbon electricity that by doubling the current use of
alternate energy for production could cut the plastics sector’s own greenhouse gas
emissions by 15% [78]. Mitigating the problems of microplastics requires under-
standing not only where waste is generated but also where other environmental
harms can be avoided at all points along the value chain.
The Case for Bridge Technologies While large-scale incinerators are criticized
for cost, waste quotas, emissions, and the effect of undermining zero waste strat-
egies, is there a case for the temporary use of small-scale waste to energy until more
efficient systems of material management evolve?
While the H-Power plant in Oahu, Hawaii has been criticized, alternatives have
been proposed. One firm recently proposed gasification (high heat conversion of
waste to a synthetic gas), submitting evidence that the initial cost of infrastructure is
far less than the H-Power plant, pays for itself in 1.4 years with current waste input,
is three times more efficient than incineration in terms of energy conversion, and
has no long-term waste quota, allowing zero waste strategies to alleviate existing
waste streams. The system could then be relocated to other waste hot spots to
manage waste or reduce waste volumes in exposed landfills (Sierra Energy, per-
sonal communication).
Although volumes of waste reduced on land become volume of waste increased
in the air (conservation of mass), any form of combustion (pyrolysis, gasification,
incineration) to create energy results in greenhouse gas (GHG) emissions, a prin-
ciple concern of any form of waste incineration.
A study of waste incineration and greenhouse gas (GHG) emissions found that
once it came to energy recovery, “the content of fossil carbon in the input waste, for
example, as plastic, was found to be critical for the overall level of the GHG
emissions, but also the energy conversion efficiencies were essential”
[86]. Increased plastic in the waste stream meant increased overall GHG emissions.
Reliance on energy recovery from waste in the linear economic model will have a
net balance of more GHG than upstream mitigation strategies in the circular
economic model, though the linear vs. circular economy may not be so black and
white. A combination of multiple end-of-life strategies could collectively manage
the diversity of waste in both efficiency and economy.
Microplastic: What Are the Solutions? 285
Another analysis of GHG emissions compared the current strategy in Los
Angeles of landfilling the vast majority of waste to a combination of three strategies
in a modern MRF, namely, (a) anaerobic digestion of wet waste, (b) thermal
gasification of dry waste, and (c) landfilling residuals [87]. Their analysis did not
consider economic, environmental, or social parameters, only GHG emissions, and
was based on an assumption of 1,000 ton of waste per day entering each scenario for
25 years; then they modeled the GHG emissions for the century that followed. In
each scenario, the GHG emissions from transportation, operation, and avoided
emissions by replacing fossil fuels were factored in. Results showed that continued
landfilling resulted in a net increase of approximately 1.64 million metric tons of
carbon dioxide equivalent (MTCO2E), while the MRF scenario results in a net
avoided GHG emissions of (0.67) million MTCO2E, showing that a shift to a MRF
where multiple waste management strategies are employed resulted in a total GHG
reduction of approximately 2.31 million MTCO2E.
Those residuals that exist after diversion of waste to recycling and anaerobic
digestion could be landfilled, and in some cases waste-to-energy could have a role.
This would be appropriate only after diversion efforts of recyclables and
compostables have been maximized. Also, building incinerator infrastructure
could create tremendous debt or include a demand for large volumes of waste,
also called a “waste quota” that could undermine local efforts to eliminate products
and packaging that generate microplastics. Simultaneously, a market for recycled
materials must be encouraged, while all environmental and worker health concerns
are prioritized. Waste-to-energy could have a role, but long after all other efforts to
manage waste have been employed.
Section Summary In the linear economy contrasted with the circular economy,
we see two world views on how to solve the plastic pollution problem. While the
linear economic system benefits production by eliminating competition from
recycled material, it is more polluting than the circular system because of multiple
points of leakage along the supply chain. Plastic pollution is lost at production as
pellet spills, lost by the consumer as litter with no inherent value, and lost at
collection and disposal as waste is transported. In the circular system these are
mitigated when systems to focus on material control and capture are implemented.
Zero waste is the ideal of the circular economy, where the need for destruction
through energy capture, or landfill, are increasingly unnecessary.
6 Microplastic Mitigation Through a Circular Economy
In the emerging circular economy, the flow of technical materials through society
returns to remanufacture, with products and packaging designed for material
recovery, low toxicity, ease of dismantling, repair and reuse, and where this doesn’twork, a biological material may substitute so circularity in a natural system can
prevail. Shifting to a circular economy has prompted interest in a range of
286 M. Eriksen et al.

interventions, including bioplastics, extended producer responsibility, and novel
business approaches.
Green Chemistry as a Biological Material Bioplastic has been in production
since Henry Ford’s soybean car in the 1930s, made from soy-based phenolic resin,
which he bashed with a sledgehammer to demonstrate its resilience, but the WWII
demand for a cheap, better-performingmaterial induced him to chose petroleum-based
plastic. Today, bioplastics are viewedwith new interest. These plant-based plastics are
considered a means to create a more reliable and consistently valued resource,
decoupled from fossil fuels. The Bioplastic Feedstock Alliance, created with wide
industry alliance and support from theWorldWildlife Fund (WWF), intends to replace
fossil fuels with renewable carbon from plants, representing no net increase in GHG
emissions. Referred to as [the] “bioeconomy,” these companies envision bioplastics as
“reducing the carbon intensity of materials such as those used in packaging, textiles,
automotive, sports equipment, and other industrial and consumer goods” [88].
It is important to distinguish biodegradable from bio-based plastics. Bioplastic is
the loosely defined catch-all phrase that describes plastic from recent biological
materials, which includes true biodegradable materials and nonbiodegradable poly-
mers that are plant based. While the label “biodegradable” has a strict ASTM
standard and strict guidelines for usage in advertising, the terms bioplastic, plant
based, and bio based do not. Despite all of the leafy greenery in labeling for these
bioplastics, it is still the same polymer that would otherwise have come from fossil
fuels.
The biodegradability of bio-based and biodegradable plastics will vary widely
based on the biological environment where degradation may occur. Poly-lactic acid
(PLA) is a compostable consumer bio-based plastic requiring a large industrial
composting facility that’s hot, wet, and full of compost-eating microbes, unlike a
backyard composting bin. Poly-hydroxy-alkanoate (PHA), made from the off-gassing
of bacteria, is a marine-degradable polymer (ASTM 7081), but rates of degradation
vary with temperature, depth, and available microbial communities [89].
PHA and PLA are both recyclable and compostable, but how these materials are
managed depends on available infrastructure. While recycling could be energetically
more favorable than composting, it may not be practical because of sorting and
cleaning requirements. Kale et al. point out the lack of formal agreement between
stakeholders (industry, waste management, government) about the utility of biode-
gradable plastics and their disposal [90], but the compostability of bioplastic packag-
ing materials could become a viable alternative if society as a whole would be willing
to address the challenges of cradle-to-grave life of compostable polymers in food,
manure, or yard waste composting facilities. The industries that make bioplastic
polymers recognize these challenges and therefore their limited applications. PHA
is ideal to be usedwhere you need functional biodegradation, such as some agriculture
and aquaculture applications, where a part has a job to do in the environment but it
would be either impractical or very costly to recover (Metabolix, personal communi-
cation). Also, many single-use throwaway applications may be replaced by PHA,
including straws or the polyethylene lining on paper cups (MangoMaterials, personal
Microplastic: What Are the Solutions? 287
communication).Without the infrastructure widely available to recycle bio-based and
biodegradable plastics, manufacturers are aiming for compostability in compliance
with organic waste diversion initiatives.
Extended Producer Responsibility (EPR) There is a wide agreement that waste
management must be improved, including public access to recycling, composting,
and waste handling facilities. Equally, there is a need to improve the design of
products and packaging to facilitate recovery in the first place. Regulating primary
microplastics has been successful with microbeads and preproduction pellets, yet
there are many characteristics of product and packaging design that could be
improved to minimize the trickle of irrecoverable microplastics from terrestrial to
aquatic environments.
Product and packaging design must move “beyond the baseline engineering
quality and safety specifications to consider the environmental, economic and
social factors,” as explained in “Design through the 12 Principles of Green Engi-
neering” [91]. When designing for the full life cycle of a product, manufactures and
designers talk with recyclers to reduce environmental impacts by improving recov-
ery, which may include avoiding mixed materials or laminates, reduced toxicity,
and ease of repair, reuse, and disassembly, as well as the systems that move
materials between consumer and the end-of-life plan. Reducing microplastic for-
mation by design might also include eliminating tearaway packaging (opening chip/
candy wrappers, individual straw/toothpick covers), small detached components
(bottle caps and safety rings), or small single-use throw-away products (coffee
stirrers, straws, bullets in toy air rifles). These mitigations can be voluntary, but are
often policy-driven through fees or bans [92].
Extended producer responsibility is a public policy tool whereby producers are
made legally and financially responsible for mitigating the environmental impacts
of their products. When adopted through legislation, it codifies the requirement that
the producer’s responsibility for their product extends to postconsumer manage-
ment of that product and its packaging. With EPR, the responsible legal party is
usually the brand owner of the product.
EPR is closely related to the concept of “product stewardship,” whereby pro-
ducers take action to minimize the health, safety, environmental, and social impacts
of a product throughout its life cycle stages. Producers’ being required to take backand recycle electronic equipment through the EU’s Waste of Electrical and Elec-
tronic Equipment (WEEE) Directive is an example of EPR. The Closed Loop
Fund – which accepts corporate money to loan to US municipalities to boost
packaging recycling – is an example of voluntary product stewardship [93]. Differ-
ent schemes of EPR have been implemented [94], and even though some first
success is achieved in recycling of plastics and other packaging products [95],
these systems still require many improvements ranging from economic models [96]
to logistic aspects [97].
While EPR has primarily been applied as a materials management strategy, the
concept can also be applied to plastic pollution prevention and mitigation. In 2013,
the Natural Resources Defense Council helped advance how EPR can more directly
288 M. Eriksen et al.
impact plastic pollution beyond boosting the collection and recycling of packaging
[98]. NRDC developed policy concepts and legislation to make the producers of
products which have a high tendency to end up as plastic pollution, responsible not
just for recycling, but for litter prevention and mitigation as well. Legislation
introduced in California would have (a) had State Agencies identify the major
sources of plastic pollution in the environment and (b) required the producers of
those products to reduce the total amount in the environment by 75% in 6 years and
95% in 11 years. While the legislation did not advance far in California, this was a
significant development and provides an example of how to incorporate litter
prevention and pollution mitigation in future EPR policy.
Section Summary The utility of green chemistry has led to public confusion over
the biodegradability of polymers, stemming from an important differentiation
between biopolymers and biodegradable polymers, as well as the true conditions
where biodegradability occurs. While biopolymers offer a promising divestment
from fossil fuel feedstocks, biodegradable plastics are challenged by the infrastruc-
ture requirements for identification, sorting, and degradability. In a circular econ-
omy, biopolymers and biodegradable polymers must exist in a system, either
manufactured or natural, where the material is recovered and reprocessed. Extended
producer responsibility is the policy mechanism that creates those systems, with the
intention to mitigate the true economic, social, and environmental costs associated
with waste.
7 Business Transformation Through Novel Policy
and Design
The status quo for much of product and packaging manufacture is planned obso-
lescence, which drives cheap-as-possible chemistry and design and has been largely
subsidized by municipalities that agree to manage all that waste at a limited cost to
the manufacture and principal cost to the tax payer. With an abundance in the waste
stream of plastics embedded in difficult-to-recover products and packaging (elec-
tronics, laminates, food-soiled packaging), energy recovery becomes a more attrac-
tive alternative.
The effort to rely on energy recovery through incineration is largely a perpetu-
ation of the “planned obsolescence” strategy of securing demand for new products,
employed historically since post-WWII manufacture. Planned obsolescence
encourages material consumption in several ways: technological (software and
upgrades overwhelming old hardware), psychological (fashion), and conventional
(designed weakness and impractical repair).
The Ellen MacArthur Foundation [99] published in February 2016 “The New
Plastics Economy” proposed business solutions that manage materials through the
consumer, beyond planned obsolescence, where product designers talk to recyclers
to create an end-of-life design, systems of “leasing” products over ownership,
Microplastic: What Are the Solutions? 289

allowing product upgrades over planned obsolescence. By making a business case
for managing the circular flow of technical materials, the status quo of cradle to
grave can be put to rest.
The market dominance of poorly designed products will likely not self-regulate a
transformation, requiring policy tools. EPR in some ways can be facilitated by
novel policy tools. In London in 2015 a 5p fee on plastic bags, rather than a ban,
resulted in an 85% reduction in their consumption. In areas where citizens “pay to
pitch” the waste they generate, consumers commonly strip packaging at the point of
purchase, which in turn is communicated to the distributor of goods to redesign the
delivery of goods. This system of pay to pitch has been applied to some remote
communities, such as islands, to require importers to export postconsumer
materials.
Andrew Winston, author of The Big Pivot, suggests an alternate model of doing
business, the Benefit Corporation, or “B-Corp,” whereby corporations take on a
mission statement of social or environmental justice that is on equal par with the
profit motive. A rapidly changing consumer base that is more connected through
communication is forcing corporations to be transparent, accountable, and behave
ethically. The B-Corp is the bridge across the divide.
8 Reducing and Reusing Plastic Waste
Avoiding the production of new plastics altogether whenever possible is the most
reliable way to avoid the generation of microplastics, whether primary
microplastics (needed for the production of new plastic articles) or secondary
(resulting during breakdown of larger plastic items).
As the market for ethically produced products is growing worldwide (e.g.,
Fairtrade [100], organic food produce [101, 102]), and consumers become aware
of the possible impacts of marine pollution [103], several examples are demon-
strating a successful reduction of plastic waste or the reuse of discarded plastics in
order to create other products (upcycling), thereby saving natural resources and, in
some cases, even removing ocean plastic pollution.
Among popular recent innovations are the production of clothes, shoes, skate-
boards, sun-glasses, and swimming gear from derelict fishing gear [104, 105]. Such
lines of products, making a pro-environmental statement, are likely to be especially
appealing to customers of the Generation Y/Millenials (see references in [106]).
Another example for a consumer-driven desire to combat excessive plastic litter,
this time in the form of packaging waste, is the recent development of zero waste
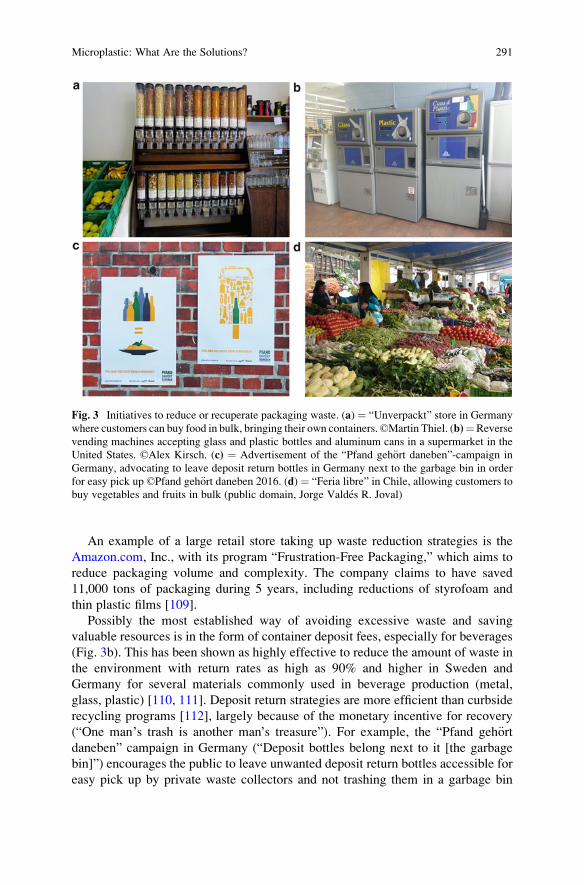
stores, sprouting up in Europe and the United States (Fig. 3a) [107, 108]. Many of
these stores are crowd funded [107] and require customers to bring their own food
container which also avoids food waste by allowing customers to buy the quantities
they consume. Many of those shops do not offer products from large brands to
distance themselves from supermarket chains and emphasize a community-based
economy model.
290 M. Eriksen et al.
An example of a large retail store taking up waste reduction strategies is the
Amazon.com, Inc., with its program “Frustration-Free Packaging,” which aims to
reduce packaging volume and complexity. The company claims to have saved
11,000 tons of packaging during 5 years, including reductions of styrofoam and
thin plastic films [109].
Possibly the most established way of avoiding excessive waste and saving
valuable resources is in the form of container deposit fees, especially for beverages
(Fig. 3b). This has been shown as highly effective to reduce the amount of waste in
the environment with return rates as high as 90% and higher in Sweden and
Germany for several materials commonly used in beverage production (metal,
glass, plastic) [110, 111]. Deposit return strategies are more efficient than curbside
recycling programs [112], largely because of the monetary incentive for recovery
(“One man’s trash is another man’s treasure”). For example, the “Pfand geh€ortdaneben” campaign in Germany (“Deposit bottles belong next to it [the garbage
bin]”) encourages the public to leave unwanted deposit return bottles accessible for
easy pick up by private waste collectors and not trashing them in a garbage bin
Fig. 3 Initiatives to reduce or recuperate packaging waste. (a) ¼ “Unverpackt” store in Germany
where customers can buy food in bulk, bringing their own containers.©Martin Thiel. (b)¼Reverse
vending machines accepting glass and plastic bottles and aluminum cans in a supermarket in the
United States. ©Alex Kirsch. (c) ¼ Advertisement of the “Pfand geh€ort daneben”-campaign in
Germany, advocating to leave deposit return bottles in Germany next to the garbage bin in order
for easy pick up ©Pfand geh€ort daneben 2016. (d) ¼ “Feria libre” in Chile, allowing customers to
buy vegetables and fruits in bulk (public domain, Jorge Valdes R. Joval)
Microplastic: What Are the Solutions? 291
(Fig. 3c). However, a return deposit fee on food containers does not ensure that the
container is reused as the large and growing proportion of returnable but single-use
plastic bottles in Germany illustrate [113]; therefore, further incentives are
necessary.
Another way to reduce plastics is prohibition or taxing of plastic products that
can be easily replaced, such as microbeads in cosmetic and daily care products and
plastic bags for groceries. A survey conducted in Ireland revealed that fees/taxes on
plastic bags seem to be well received among customers [114].
Buying from local farmers’markets is another way for a customer to procure less
packaging (Fig. 3d). While farmers’ markets were replaced in most of Europe and
North America by large supermarket chains, they are celebrating a comeback over
the last two decades [115]. In other countries it is still normal to procure the
majority of fresh foods from farmers’ markets, despite the introduction of large
supermarket chains. This is the case in Chile where “Ferias libres” (neighborhood
outdoor markets) supply the population with 70% of its demand for fruit and
vegetables and 30% of seafood products [116].
Collectively, all these strategies help reduce the leakage of low-value/single-use
plastics into terrestrial and aquatic environments and subsequent formation of
microplastics from their degradation. Regardless of the most modern waste man-
agement systems available, leakage of single-use throwaway products and packag-
ing occurs. Their reduction is the most efficient mitigation effort to reduce
microplastics in the environment.
9 Conclusion
An environmental movement may be defined as a loose, noninstitutionalized
network of organizations of varying degrees of formality, as well as individuals
and groups with no organizational affiliation, who are engaged in collective action
motivated by shared identity or concern about environmental issues [117].
In July of 2016, the American Chemistry Council published “Plastics and
Sustainability: A valuation of environmental benefits, costs and opportunities for
continuous improvement,” largely a comparison of life cycle analyses putting
plastic in a positive light against alternative materials (glass, metal, paper). At the
same time, the Plastic Pollution Policy Project convened 18 organizations focused
on zero waste initiatives to align on policy and campaigns and to create common
messaging to counter industry-dominated narratives. A movement has emerged,
while stakeholder positions have dug in their heels.
Here we have discussed solutions to microplastics in freshwater ecosystems,
which largely form in terrestrial environments from primary or secondary
microplastics. We know that microplastics are global, increasingly toxic over
time, and impacts to wildlife are pervasive, leading to the collective conclusion
that plastic in the environment causes harm. We also know that capturing
microplastic downstream is extremely difficult and requires upstream intervention.
292 M. Eriksen et al.
Once in natural water bodies (rivers, lakes, oceans), recovery of microplastics is
impossible. Therefore, one challenge is to identify and quantify the upstream
sources – a prerequisite to mitigation. In the cases of microbeads and preproduction
pellets, we witnessed the role of science to present observations of microplastic
pollution, followed by a movement to pressure policymakers to regulate industry.
The work of scientists continues to illuminate microplastic impacts, such as recent
reports from the Group of Experts on the Scientific Aspects of Marine Environ-
mental Protection (GESAMP) [118], a working group gathered by UNEP to
synthesize and report on the state of the scientific evidence regarding the plastic
pollution issue and distribute the information to the United Nations Environment
Assembly.
There are four principal solutions that will have high impact on preventing
terrestrial and freshwater microplastics from forming. They are: (1) identify and
quantify terrestrial microplastic sources, (2) scale zero waste strategies, (3) pursue
policy-driven EPR, and (4) develop novel business solutions. These solutions will
bring greater alignment between stakeholders on the utility of plastic in society and
a more equitable end-of-life, where environmental and social justice are integrated
in the full cost of plastic. The bridge between the linear and circular economy is
about material circularity coupled with a sincere investment in common decency
and democracy, and corporate responsibility toward those ends, what Severyn
Bruyn calls a Civil Economy, whereby government, business, nonprofits and
civic groups “can develop an accountable, self-regulating, profitable, humane,
and competitive system of markets” [119] (Bruyn 2000).
This a thoughtful approach that considers the chemistry of materials, the design
of products, the processes required to make things, and finally the systems that
manage how materials flow back into the production chain, all in the context of
causing no harm to people and the environment, benign by design in its totality.
Acknowledgments MT was supported by the Chilean Millennium Initiative (grant NC120030).
References
1. Kühn S et al (2015) Deleterious effects of litter on marine life. In: Bergmann M, Gutow L,
Klages M (eds) Marine anthropogenic litter. Springer, New York, pp 75–116
2. Shimanaga M, Yanagi K (2016) The Ryukyu trench may function as a “depocenter” for
anthropogenic marine litter. J Oceanogr 72(6):895–903. doi:10.1007/s10872-016-0388-7
3. Carpenter EJ, Smith KL (1972) Plastics on the Sargasso sea surface. Science 175:1240–1241
4. Wong CS et al (1974) Quantitative tar and plastic waste distributions in the Pacific Ocean.
Nature 247:30–32
5. Shaw DG, Mapes GA (1979) Surface circulation and the distribution of pelagic tar and
plastic. Mar Pollut Bull 10:160–162
6. Morris RJ (1980) Floating plastic debris in the Mediterranean. Mar Pollut Bull 11:125
7. Wilber R (1987) Plastic in the North Atlantic. Oceanus 30:61–68
8. Moore CJ et al (2001) A comparison of plastic and plankton in the North Pacific central gyre.
Mar Pollut Bull 42:1297–1300
Microplastic: What Are the Solutions? 293

9. van Sebille E et al (2015) A global inventory of small floating plastic debris. Environ Res Lett
10:124006
10. Cozar A et al (2014) Plastic debris in the open ocean. Proc Natl Acad Sci USA
111:10239–10244
11. Jambeck J et al (2015) Plastic waste inputs from land into the ocean. Science 347:768–771
12. Eriksen M et al (2014) Plastic pollution in the world’s oceans: more than 5 trillion plastic
pieces weighing over 250,000 tons afloat at sea. PLoS One 9:e111913
13. Obbard RW et al (2014) Global warming releases microplastic legacy frozen in Arctic Sea
ice. Earth’s Future 2:315–32014. Browne MA et al (2011) Accumulation of microplastic on shorelines worldwide: sources and
sinks. Environ Sci Technol 45:9175–9179
15. Woodall LC et al (2014) The deep sea is a major sink for microplastic debris. R Soc Open Sci
1:140317
16. van Cauwenberghe L et al (2013) Microplastic pollution in deep-sea sediments. Environ
Pollut 182:495–499
17. Dris R et al (2016) Synthetic fibers in atmospheric fallout: a source of microplastics in the
environment? Mar Pollut Bull 104(1–2):290–293. doi:10.1016/j.marpolbul.2016.01.006
18. Gauquie J et al (2015) A qualitative screening and quantitative measurement of organic
contaminants on different types of marine plastic debris. Chemosphere 138:348–356
19. Teuten EL et al (2007) Potential for plastics to transport hydrophobic contaminants. Environ
Sci Technol 41:7759–7764
20. Rios LM et al (2010) Quantitation of persistent organic pollutants adsorbed on plastic debris
from the Northern Pacific Gyre’s “eastern garbage patch”. J Environ Monit 12:2226–2236
21. Mato Y et al (2001) Plastic resin pellets as a transport medium for toxic chemicals in the
marine environment. Environ Sci Technol 35:318–324
22. Fromme H et al (2009) Perfluorinated compounds – exposure assessment for the general
population in western countries. Int J Hyg Environ Health 212:239–270
23. Giesy JP et al (2001) Global biomonitoring of perfluorinated organics. Sci World J 1:627–629
24. Kovarova J, Svobodova Z (2008) Perfluorinated compounds: occurrence and risk profile.
Neuroendocrinol Lett 29:599–608
25. Ahn KC et al (2008) In vitro biologic activities of the antimicrobials triclocarban, its analogs,
and triclosan in bioassay screens: receptor-based bioassay screens. Environ Health Perspect
116:1203–1210
26. Chalew TE, Halden RU (2009) Environmental exposure of aquatic and terrestrial biota to
triclosan and triclocarban. J Am Water Works Assoc 45:4–13
27. Costa LG et al (2008) Polybrominated diphenyl ether (PBDE) flame retardants: environmen-
tal contamination, human body burden and potential adverse health effects. Acta Biomed
79:172–183
28. Yogui GT, Sericano JL (2009) Polybrominated diphenyl ether flame retardants in the US
marine environment: a review. Environ Int 35:655–666
29. Bonefeld-Jørgensen EC et al (2007) Endocrine-disrupting potential of bisphenol A, bisphenol
A dimethacrylate, 4-n-nonylphenol, and 4-n-octylphenol in vitro: new data and a brief
review. Environ Health Perspect 115:69–76
30. U.S. EPA (2016) Bisphenol A (BPA) action plan. https://www.epa.gov/assessing-and-man
aging-chemicals-under-tsca/bisphenol-bpa-action-plan. Accessed 5 Oct 2016
31. Dodds EC, Lawson W (1936) Synthetic estrogenic agents without the phenanthrene nucleus.
Nature 137:996
32. Brotons JA et al (1995) Xenoestrogens released from lacquer coatings in food cans. Environ
Health Perspect 103:608–612
33. vom Saal FS, Hughes C (2005) An extensive new literature concerning low-dose effects of
bisphenol A shows the need for a new risk assessment. Environ Health Perspect 113:926–933
34. Meeker JD et al (2009) Phthalates and other additives in plastics: human exposure and
associated health outcomes. Philos Trans R Soc Lond B Biol Sci 364:2097–2113
294 M. Eriksen et al.

35. Stahlhut RW et al (2007) Concentrations of urinary phthalate metabolites are associated with
increased waist circumference and insulin resistance in adult US males. Environ Health
Perspect 115:876–882
36. Buchta C et al (2005) Transfusion-related exposure to the plasticizer di(2-ethylhexyl)
phthalate in patients receiving plateletpheresis concentrates. Transfusion 45:798–802
37. Lusher A et al (2015) Microplastic interactions with North Atlantic mesopelagic fish. ICES J
Mar Sci 73(4):1214–1225. doi:10.1093/icesjms/fsv241
38. Anastasopoulou A et al (2013) Plastic debris ingested by deep-water fish of the Ionian Sea
(Eastern Mediterranean). Deep-Sea Res I Oceanogr Res Pap 74:11–13
39. de Stephanis R et al (2013) As main meal for sperm whales: plastics debris. Mar Pollut Bull
69:206–214
40. Cole M et al (2013) Microplastic ingestion by zooplankton. Environ Sci Technol
47:6646–6655
41. Ugolini A et al (2013) Microplastic debris in sandhoppers. Estuar Coast Shelf Sci 129:19–22
42. Von Moos N et al (2012) Uptake and effects of microplastics on cells and tissue of the blue
mussel Mytilus edulis L. after an experimental exposure. Environ Sci Technol
46:11327–11335
43. Wright SL et al (2013) Microplastic ingestion decreases energy reserves in marine worms.
Curr Biol 23:1031–1033
44. Long M et al (2015) Interactions between microplastics and phytoplankton aggregates:
impact on their respective fates. Mar Chem 175:39–46
45. Li J et al (2015) Microplastics in commercial bivalves from China. Environ Pollut
207:190–195
46. Seltenrich N (2015) New link in the food chain? Marine plastic pollution and seafood safety.
Environ Health Perspect 123:34–41
47. Browne MA et al (2008) Ingested microscopic plastic translocates to the circulatory system
of the mussel Mytilus edulis (L.) Environ Sci Technol 42:5026–5031
48. Farrell P, Nelson K (2013) Trophic level transfer of microplastic: Mytilus edulis to Carcinusmaenas. Environ Pollut 177:1–3
49. Setala O et al (2014) Ingestion and transfer of microplastics in the planktonic food web.
Environ Pollut 185:77–83
50. Yamashita R et al (2011) Physical and chemical effects of ingested plastic debris on short-
tailed shearwaters, Puffinus tenuirostris, in the North Pacific Ocean. Mar Pollut Bull
62:2845–2849
51. Tanaka K et al (2013) Accumulation of plastic-derived chemicals in tissues of seabirds
ingesting marine plastics. Mar Pollut Bull 69:219–222
52. Besseling E et al (2013) Effects of microplastic on fitness and PCB bioaccumulation by the
lugworm Arenicola marina (L.) Environ Sci Technol 47:593–600
53. Rochman CM et al (2013) Ingested plastic transfers hazardous chemicals to fish and induces
hepatic stress. Sci Rep 3:3263
54. Sussarellu R et al (2015) Oyster reproduction is affected by exposure to polystyrene
microplastics. Proc Natl Acad Sci USA 113:2430–2435
55. Hamer J et al (2014) Fate of microplastics in the marine isopod Idotea emarginata. Environ
Sci Technol 48:13451–13458
56. Imhof HK, Laforsch C (2016) Hazardous or not – are adult and juvenile individuals of
Potamopyrgus antipodarum affected by non-buoyant microplastic particles? Environ Pollut
218:383–391
57. Koelmans AA et al (2016) Microplastic as a vector for chemicals in the aquatic environment:
critical review and model-supported reinterpretation of empirical studies. Environ Sci
Technol 50:3315–3326
58. Syberg K et al (2015) Microplastics: addressing ecological risk through lessons learned.
Environ Toxicol Chem 34:945–953
59. Rochman C et al (2016) The ecological impacts of marine debris: unraveling the demon-
strated evidence from what is perceived. Ecology 97:302–312
Microplastic: What Are the Solutions? 295
60. Cole M et al (2015) The impact of polystyrene microplastics on feeding, function and
fecundity in the marine copepod Calanus helgolandicus. Environ Sci Technol 49:1130–113761. Nobre CR et al (2015) Assessment of microplastic toxicity to embryonic development of the
sea urchin Lytechinus variegatus (Echinodermata: Echinoidea). Mar Pollut Bull 92:99–104
62. Phuong NN et al (2016) Is there any consistency between the microplastics found in the field
and those used in laboratory experiments? Environ Pollut 211:111–123
63. Rochman CM et al (2013) Policy: classify plastic waste as hazardous. Nature 494:169–171
64. Inter-Departmental Liaison Group of Risk Assessment (2002) The precautionary principle:
policy and application. http://www.hse.gov.uk/aboutus/meetings/committees/ilgra/pppa.pdf.
Accessed 5 Oct 2016
65. Gubler D (2012) The economic burden of dengue. Am J Trop Med Hyg 86:743–744
66. Global Alliance for Incinerator Alternatives (2012) On the road to zero waste: successes and
lessons from around the world. http://www.no-burn.org/on-the-road-to-zero-waste-suc
cesses-and-lessons-from-around-the-world. Accessed 5 Oct 2016
67. Deep Sea News (2014) The ocean cleanup, part 2: technical review of the feasibility study.
http://www.deepseanews.com/2014/07/the-ocean-cleanup-part-2-technical-review-of-the-
feasibility-study/. Accessed 5 Oct 2016
68. Sherman P, van Sebille E (2016) Modeling marine surface microplastic transport to assess
optimal removal locations. Environ Res Lett 11:1
69. Peters AJ, Siuda ANS (2014) A review of observations of floating tar in the Sargasso Sea.
Oceanography 27:217–221
70. Corcoran P et al (2014) An anthropogenic marker horizon in the future rock record. GSA
Today 24(6):4–8. doi:10.1130/GSAT-G198A.1
71. Watkins E et al (2015) Marine litter: socio-economic study. Scoping Report, London
72. KIMO (2016) What is fishing for litter?. http://www.fishingforlitter.org.uk/what-is-fishing-
for-litter. Accessed 6 Oct 2016
73. Song YK et al (2015) A comparison of microscopic and spectroscopic identification methods
for analysis of microplastics in environmental samples. Mar Pollut Bull 93:202–209
74. U.S. Congress (2015) H.R. 1321 – Microbead-Free Waters Act of 2015. https://www.con
gress.gov/bill/114th-congress/house-bill/1321. Accessed 6 Oct 2016
75. California Environmental Protection Agency (2014) Preproduction plastic debris program.
State Water Resources Control Board, Sacramento. http://www.waterboards.ca.gov/water_
issues/programs/stormwater/plasticdebris.shtml. Accessed 5 Oct 2016
76. Krohn W, van den Daele W (1998) Science as an agent of change: finalization and experi-
mental implementation. Soc Sci Inf 37:191–222
77. Plastics Europe (2013) Zero plastics to landfill by 2020. http://www.plasticseurope.org/
documents/document/20131017112406-03_zero_plastics_to_landfill_by_2020_sept_2013.pdf.
Accessed 6 Oct 2016
78. Trucost (2016) Plastics and sustainability: a valuation of environmental benefits, costs and
opportunities for continuous improvement. https://plastics.americanchemistry.com/Plastics-
and-Sustainability.pdf. Accessed 5 Oct 2016
79. Global Alliance for Incinerator Alternatives (2015) Open letter to ocean conservancy regard-
ing the report “Stemming the Tide”. http://www.no-burn.org/downloads/Open_Letter_Stem
ming_the_Tide_Report_2_Oct_15.pdf. (Accessed 15th May 2016).
80. Green Magazine Hawaii (2012) Feeding the beast – Hawai’i’s waste-to-energy plant isn’tkilling two birds with one stone – it’s burning the candle on both ends. http://
greenmagazinehawaii.com/feeding-the-beast/. Accessed 6 Oct 2016
81. MacKerron CB, Hoover D (2015) Waste and opportunity 2015: Environmental progress and
challenges in food, beverage and consumer goods packaging. As You Sow. Natural Resource
Defense Council, New York
82. Plastics Europe 2013 Plastics – the facts 2013: an analysis of European latest plastics
production, demand and waste data
296 M. Eriksen et al.
83. U.S. EPA (2015) Advancing sustainable materials management: facts and figures 2013 –
assessing trends in materials generation, recycling and disposal in the United States. https://
www.epa.gov/sites/production/files/2015-09/documents/stanislaus.pdf. Accessed 6 Oct 2016
84. Denkstatt (2015) How packaging contributes to food waste prevention. http://denkstatt.at/
files/How_Packaging_Contributes_to_Food_Waste_Prevention_V1.2.pdf. Accessed 28 Aug
2016
85. Andrady A, Neal M (2009) Applications and societal benefits of plastics. Philos Trans R Soc
Lond B Biol Sci 364:1977–1984
86. Astrup T et al (2009) Incineration and co-combustion of waste: accounting of greenhouse
gases and global warming contributions. Waste Manag Res 27:789–799
87. Los Angeles Department of Public Works 2016 Comparative greenhouse gas emissions
analysis of alternative scenarios for waste treatment and/or disposal. Los Angeles, California
88. Bioplastic Feedstock Alliance (2016) Who we are. http://bioplasticfeedstockalliance.org/
who-we-are/. Accessed 6 Oct 2016
89. Gross RA, Kalra B (2002) Biodegradable polymers for the environment. Science
297:803–807
90. Kale G et al (2007) Compostability of bioplastic packaging materials: an overview.
Macromol Biosci 7:255–277
91. Anastas P, Zimmerman J (2003) Design through the 12 principles of green engineering.
Environ Sci Technol 37:94–101
92. Oosterhuis F et al (2014) Economic instruments and marine litter control. Ocean Coast
Manag 102:47–54
93. Closed Loop Fund (2016) Closed loop fund. http://www.closedloopfund.com/. Accessed
5 Oct 2016
94. Lifset R et al (2013) Extended producer responsibility. J Ind Ecol 17:162–166
95. Niza S et al (2014) Extended producer responsibility policy in Portugal: a strategy towards
improving waste management performance. J Clean Prod 64:277–287
96. Pires A et al (2015) Extended producer responsibility: a differential fee model for promoting
sustainable packaging. J Clean Prod 108:343–353
97. Wagner TP (2013) Examining the concept of convenient collection: an application to
extended producer responsibility and product stewardship frameworks. Waste Manag
33:499–507
98. Monroe L (2013) Tailoring product stewardship and extended producer responsibility to
prevent marine plastic pollution. Tulane Environ Law J 27:219
99. EMF (2016) The new plastics economy: rethinking the future of plastics. https://www.
ellenmacarthurfoundation.org/publications/the-new-plastics-economy-rethinking-the-future-
of-plastics. Accessed 6 Oct 2016
100. Fairtrade (2015) Fairtrade by the numbers. http://www.fairtrade.org.za/uploads/files/Busi
ness/Fairtrade_by_the_Numbers_2015.pdf. Accessed 16 Sep 2016
101. The Co-operative Group (2012) The ethical consumerism report 2012. http://www.coop.co.
uk/PageFiles/416561607/Ethical-Consumer-Markets-Report-2012.pdf. Accessed 16 Sep
2016
102. Organic Trade Association (2016) U.S. organic state of the industry. http://ota.com/sites/
default/files/indexed_files/OTA_StateofIndustry_2016.pdf. Accessed 16 Sep 2016
103. Gelcich S et al (2014) Public awareness, concerns, and priorities about anthropogenic impacts
on marine environments. Proc Natl Acad Sci USA 111:15042–15047
104. Bureo.co (2016) Bureo skateboards, net positiva. http://bureo.co/net-positiva.php. Accessed
16 Sep 2016
105. The Verge (2016) Adidas’ limited edition sneakers are made from recycled ocean
waste. http://www.theverge.com/2016/6/8/11881670/adidas-3d-printed-sneaker-competition.
Accessed 16 Sep 2016
106. Smith K (2010) An examination of marketing techniques that influence Millennials’ percep-tions of whether a product is environmentally friendly. J Strateg Mark 18:437–450
Microplastic: What Are the Solutions? 297
107. Bepakt.com (2016) List of packaging-free shops. http://bepakt.com/packaging-free-shops/.
Accessed 5 Oct 2016
108. NABU (2016) Unverpackt einkaufen. https://www.nabu.de/umwelt-und-ressourcen/
ressourcenschonung/einzelhandel-und-umwelt/nachhaltigkeit/19107.html. Accessed 16 Sep
2016
109. Jeff Bezos (2013) Amazon frustration-free packaging letter to customers. https://www.ama
zon.com/gp/feature.html/ref¼amb_link_84595831_1?ie¼UTF8&docId¼1001920911&pf_
rd_m¼ATVPDKIKX0DER&pf_rd_s¼merchandised-search-5&pf_rd_r¼99H1ZVH9M6C
C8V6HM5YS&pf_rd_t¼101&pf_rd_p¼2104054182&pf_rd_i¼5521637011. Accessed
16 Sep 2016
110. ECOTEC Research & Consulting (2001) Study on the economic and environmental impli-
cations of the use of environmental taxes and charges in the European Union and its member
states. http://ec.europa.eu/environment/enveco/taxation/environmental_taxes.htm. Accessed
16 Sep 2016
111. Schüler K (2015) Aufkommen und Verwertung von Verpackungsabfallen in Deutschland im
Jahr 2012. Umweltbundesamt, Dessau-Roßlau
112. Ashenmiller B (2009) Cash recycling, waste disposal costs, and the incomes of the working
poor: evidence from California. Land Econ 85:539–551
113. BMUB – Bundesministerium für Umwelt (2016) Naturschutz, Bau und Reaktorsicherheit,
Anteile der in Mehrweg-Getrankeverpackungen sowie in €okologisch vorteilhaften Einweg-
Getrankeverpackungen abgefüllten Getranke in den Jahren 2004 bis 2014. http://www.bmub.
bund.de/fileadmin/Daten_BMU/Bilder_Infografiken/verpackungen_mehrweganteile_oeko.png.
Accessed 16 Sep 2016
114. Convey F et al (2007) The most popular tax in Europe? Lessons from the Irish plastic bags
levy. Environ Resour Econ 38:1–11
115. U.S. Department of Agriculture (2016) Number of U.S. farmers’ markets continues to
rise. http://www.ers.usda.gov/data-products/chart-gallery/detail.aspx?chartId¼48561&
ref¼collection&embed¼True. Accessed 16 Sep 2016
116. Observatorio Feria Libre (2013) Caracterısticas economicas y sociales de ferias libres de
Chile – encuesta nacional de ferias libres. Proyecto de Cooperacion Tecnica FAO – ODEPA
– ASOF TCP CHI/3303: fortalecimiento de las ferias libres para la comercializacion
agroalimentaria
117. Rootes C (2004) Environmental movements. In: Snow D, Soule S, Kriesi H (eds)
The Blackwell companion to social movements. Blackwell, Oxford, pp 608–640
118. GESAMP 2016 Sources, fate and effects of microplastics in the marine environment – part
two of a global assessment.
119. Bruyn S (2000) A civil economy: transforming the marketplace in the twenty-first century.
University of Michigan Press, Ann Arbor
Open Access This chapter is licensed under the terms of the Creative Commons Attribution 4.0
International License (http://creativecommons.org/licenses/by/4.0/), which permits use, sharing,
adaptation, distribution and reproduction in any medium or format, as long as you give appropriate
credit to the original author(s) and the source, provide a link to the Creative Commons license and
indicate if changes were made.
The images or other third party material in this chapter are included in the chapter’s Creative
Commons license, unless indicated otherwise in a credit line to the material. If material is not
included in the chapter’s Creative Commons license and your intended use is not permitted by
statutory regulation or exceeds the permitted use, you will need to obtain permission directly from
the copyright holder.
298 M. Eriksen et al.
http://www.bmub.bund.de/fileadmin/Daten_BMU/Bilder_Infografiken/verpackungen_mehrweganteile_oeko.png
Related Documents