175 VOL. 35(2) 2005: 175 - 184 Microphysical evidence of the transition between predominant convective/stratiform rainfall associated with the intraseasonal oscillation in the Southwest Amazon. Rachel Ifanger ALBRECHT 1 ; Maria Assunção Faus da SILVA DIAS 1 ABSTRACT The distinction between convective and stratiform precipitation profiles around various precipitating systems existent in tropical regions is very important to the global atmospheric circulation, which is extremely sensitive to vertical latent heat distribution. In South America, the convective activity responds to the Intraseasonal Oscillation (IOS). This paper analyzes a disdrometer and a radar profiler data, installed in the Ji-Paraná airport, RO, Brazil, for the field experiment WETAMC/LBA & TRMM/LBA, during January and February of 1999. The microphysical analysis of wind regimes associated with IOS showed a large difference in type, size and microphysical processes of hydrometeor growth in each wind regime: easterly regimes had more turbulence and consequently convective precipitation formation, and westerly regimes had a more stratiform precipitation formation. KEYWORDS intraseasonal oscillation, drop size distribution, precipitation, profiler radar, disdrometer. Evidência microfísica da transição entre períodos convectivos e estratiformes associados à oscilação intrasazonal na região sudoeste da Amazônia. RESUMO A diferenciação entre os perfis de precipitação convectiva e estratiforme dentre os diversos sistemas de precipitação existentes na região tropical é muito importante para a circulação atmosférica global, sendo extremamente sensível à distribuição vertical de calor latente. Na América do Sul, a atividade convectiva responde à Oscilação Intrasazonal (IOS). Este trabalho analisa dados de um disdrômetro e um radar de apontamento vertical instalados no aeroporto de Ji-Paraná, RO, Brasil, para o experimento de campo WETAMC/LBA & TRMM/LBA, em Janeiro e Fevereiro de 1999. A breve análise dos regimes de ventos associados à IOS mostrou um grande diferença no tipo, tamanho e processos microfísicos de crescimento de hidrometeoros em cada regime de vento: regimes de leste possuem mais turbulência e conseqüentemente formação de precipitação convectiva, e regimes de oeste possuem formação de precipitação mais estratiforme. PALAVRAS-CHAVE oscilação intrasazonal, distribuição de tamanho de gotas, precipitação, radar de apontamento vertical, disdrômetro. 1 Departamento de Ciências Atmosféricas - Universidade de São Paulo. Rua do Matão, 1226 – São Paulo, SP - CEP 05508-090 INTRODUCTION The global atmospheric circulation is sensitive to the vertical distribution of latent heating, which is associated with different types of precipitation (Kasahara and Silva Dias, 1986; DeMaria, 1985). Therefore, it is important to distinguish between convective and stratiform precipitation profiles around various precipitating systems observed in tropical regions (Garstang et al., 1994; Garreaud e Wallace, 1997; Carvalho et al. 2002). In South America, the high variability of convective activity and intense precipitation is related to some aspects of global atmospheric circulation, in particular to the Intraseasonal Oscillation, IOS (Kousky and Kayano, 1994; Jones and Carvalho, 2002). The IOS is related to a systematic eastward movement

Welcome message from author
This document is posted to help you gain knowledge. Please leave a comment to let me know what you think about it! Share it to your friends and learn new things together.
Transcript

175 VOL. 35(2) 2005: 175 - 184
Microphysical evidence of the transition betweenpredominant convective/stratiform rainfallassociated with the intraseasonal oscillation in theSouthwest Amazon.
Rachel Ifanger ALBRECHT1; Maria Assunção Faus da SILVA DIAS1
ABSTRACTThe distinction between convective and stratiform precipitation profiles around various precipitating systems existent in tropicalregions is very important to the global atmospheric circulation, which is extremely sensitive to vertical latent heat distribution. InSouth America, the convective activity responds to the Intraseasonal Oscillation (IOS). This paper analyzes a disdrometer and a radarprofiler data, installed in the Ji-Paraná airport, RO, Brazil, for the field experiment WETAMC/LBA & TRMM/LBA, during January andFebruary of 1999. The microphysical analysis of wind regimes associated with IOS showed a large difference in type, size andmicrophysical processes of hydrometeor growth in each wind regime: easterly regimes had more turbulence and consequentlyconvective precipitation formation, and westerly regimes had a more stratiform precipitation formation.
KEYWORDSintraseasonal oscillation, drop size distribution, precipitation, profiler radar, disdrometer.
Evidência microfísica da transição entre períodosconvectivos e estratiformes associados à oscilaçãointrasazonal na região sudoeste da Amazônia.
RESUMOA diferenciação entre os perfis de precipitação convectiva e estratiforme dentre os diversos sistemas de precipitação existentes naregião tropical é muito importante para a circulação atmosférica global, sendo extremamente sensível à distribuição verticalde calor latente. Na América do Sul, a atividade convectiva responde à Oscilação Intrasazonal (IOS). Este trabalho analisadados de um disdrômetro e um radar de apontamento vertical instalados no aeroporto de Ji-Paraná, RO, Brasil, para oexperimento de campo WETAMC/LBA & TRMM/LBA, em Janeiro e Fevereiro de 1999. A breve análise dos regimes de ventosassociados à IOS mostrou um grande diferença no tipo, tamanho e processos microfísicos de crescimento de hidrometeoros emcada regime de vento: regimes de leste possuem mais turbulência e conseqüentemente formação de precipitação convectiva, eregimes de oeste possuem formação de precipitação mais estratiforme.
PALAVRAS-CHAVEoscilação intrasazonal, distribuição de tamanho de gotas, precipitação, radar de apontamento vertical, disdrômetro.
1Departamento de Ciências Atmosféricas - Universidade de São Paulo. Rua do Matão, 1226 – São Paulo, SP - CEP 05508-090
INTRODUCTION
The global atmospheric circulation is sensitive to the verticaldistribution of latent heating, which is associated with differenttypes of precipitation (Kasahara and Silva Dias, 1986; DeMaria,1985). Therefore, it is important to distinguish betweenconvective and stratiform precipitation profiles around variousprecipitating systems observed in tropical regions (Garstang et
al., 1994; Garreaud e Wallace, 1997; Carvalho et al. 2002). InSouth America, the high variability of convective activity andintense precipitation is related to some aspects of globalatmospheric circulation, in particular to the IntraseasonalOscillation, IOS (Kousky and Kayano, 1994; Jones and Carvalho,2002). The IOS is related to a systematic eastward movement
176 VOL. 35(2) 2005: 175 - 184 • ALBRECHT & SILVA DIAS
MICROPHYSICAL EVIDENCE OF THE TRANSITION BETWEENPREDOMINANT CONVECTIVE/STRATIFORM RAINFALL ASSOCIATEDWITH THE INTRASEASONAL OSCILLATION IN THE SOUTHWEST AMAZON.
of low-frequency large-scale convection and circulationanomalies along the equatorial belt, for a period of 20 to 60days (Madden e Julian, 1994). The classical definition ofmonsoon is a seasonal reversal of large scale circulation due todifferential heating of continents and oceans (Zhou e Lau,1998). The dominant seasonal feature of the monsoon systemsis the division of the seasons into ‘wet’ and ‘dry’. These referrespectively to periods of high precipitation, when humidoceanic winds blow into the continent, and periods of reversedwinds that drive cold and dry air from the center of wintercontinents. The variability of the South American summermonsoon, associated with the IOS, stimulates changes in lowlevel winds and convective activity for periods of some days toweeks or more (Zhou e Lau, 1998). During the monsoon wetseason, there are several variations in large scale patterns, likea short period of drought associated with the IOS. The droughtperiod is denominated as the inactive phase of the monsoonsystem, or ‘break monsoon’, while the other periods are referredto as the active phase.
During the South American summer, an anticycloniccirculation at the upper troposphere, known as the BolivianHigh, is followed by a trough in the east, which extends overthe western Atlantic Ocean known as the Northeast Braziliantrough (Kousky and Gan, 1981). In low levels, a continentallow pressure center of heat develops over Gran Chaco inArgentina. This low level atmospheric circulation pattern has anorthwesterly flow along the eastern Andes in the tropics andsubtropics, and a predominant east-northeasterly flow overthe Amazon basin, accompanied by intense convective activityand precipitation. Kousky (1979) observed that the slow-moving cold fronts and subtropical upper tropospheric cyclonicvortices play an important role in characterizing theprecipitation over Brazil. These quasi-stationary fronts arerefered to as the South Atlantic Convergence Zone (SACZ,Nobre, 1988), and is recognized as one of the main features ofthe wet season (Silva Dias and Marengo, 1999).
As previous studies suggested thatthe characterization of the low level jetsin South America is due to baroclinicsystems, recent authors have studied theconnection between SACZ (which isassociated to IOS) and convection overthe Amazon, using data collected duringthe WET Atmospheric MesoscaleCampaign (WETAMC) and Tropical RainfallMeasuring Mission (TRMM) fieldexperiments in Rondonia (southwestAmazonia), Brazil, as part of the Large-scaleBiosphere Atmosphere experiment inAmazonia (LBA) (Herdies et al., 2002;Rickenbach et al.,2002; Halverson et al.,2002; Carvalho et al., 2002; Tokay et al.2002; Albrecht and Pereira Filho, 2002;Silva Dias et al. 2002; Pereira Filho et al.2001). This field experiment took placein January and February of 1999 and
collected a unique data base with high temporal and spatialresolutions of synoptic, meso and micro-scales features of theatmosphere and its precipitation characteristics. Theexperiment set up, localization and instrumentation aredescribed in Silva Dias et al. (2002). Rickenbach et al. (2002)observed that, during this experiment, the zonal windalternated its direction from east to west at low and middletroposphere. These periods may be seen in Table 1. They alsocomputed the displacement of cold fronts observed duringthat experiment, and found that the presence of stationarycold fronts for several consecutive days was associated withperiods of more intense westerlies (W1 e W3), suggesting astrong correlation between westerly flow over SouthwestAmazon and SACZ characterization. Therefore, the wind regimeperiods were classified as “non-SACZ” (E1, E2, E3 and W2) and“SACZ” (W1 and W3) periods. Rickenbach et al. (2002) alsoanalyzed precipitation estimatives of a radar placed in Rondoniaand observed that during “non-SACZ” regimes there weresmaller convective systems in horizontal extension with moreconvective fraction of precipitation, while during “SACZ” periodsthere was 27% less precipitation mainly due to the weakintensity of convective systems, but they had approximatelytwice the horizontal extension of “non-SACZ” systems. Thisdifference in precipitation is attributed to the IOS, whichmodulates the SACZ.
Tokay et al. (2002) analyzed data from two disdrometersinstalled in the WETAMC/LBA experiment area and comparedthem with data collected in Darwin, Australia. This region hasthe same Amazonian wind regime characteristics, which is aclassic monsoon (westerlies) and break (easterlies) regimes. Themean drop size distribution based on Darwin and Rondoniawind regimes showed more large drops in easterlies (breakmonsoon) and more small drops during westerlies (monsoon).
This difference in number of drops is associated with theorigin of precipitation in mesoscale convective system (MSC)patterns for each wind regime period: easterlies have more
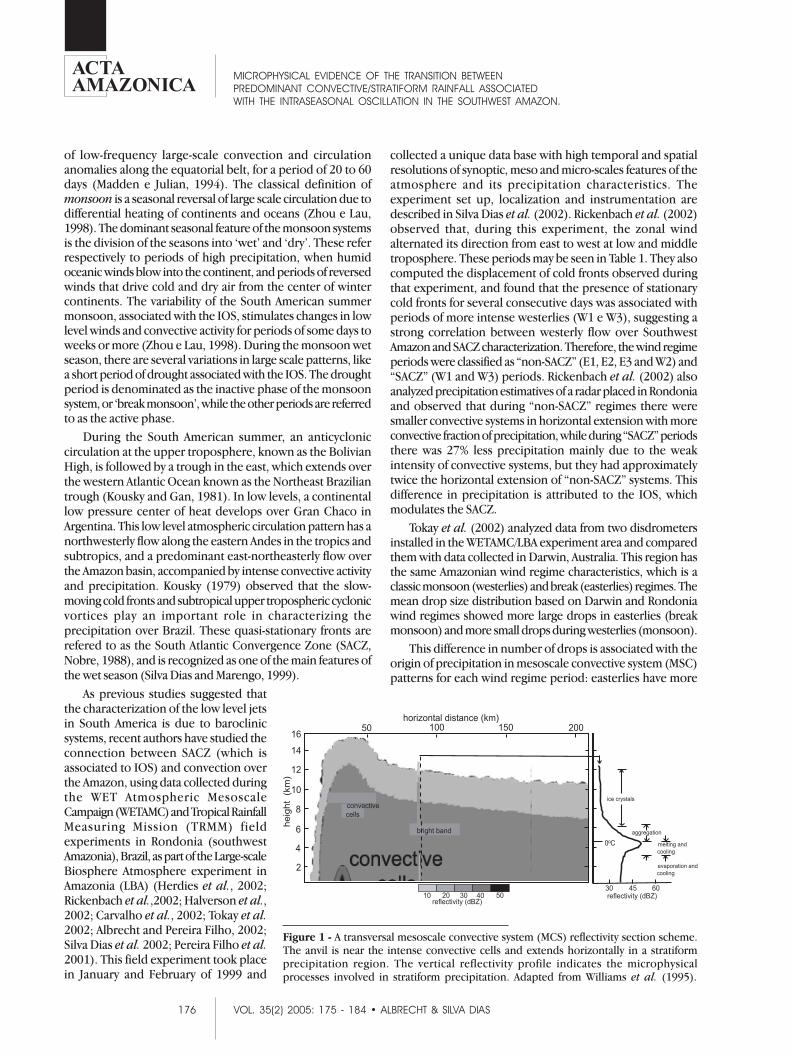
Figure 1 - A transversal mesoscale convective system (MCS) reflectivity section scheme.The anvil is near the intense convective cells and extends horizontally in a stratiformprecipitation region. The vertical reflectivity profile indicates the microphysicalprocesses involved in stratiform precipitation. Adapted from Williams et al. (1995).

177 VOL. 35(2) 2005: 175 - 184 • ALBRECHT & SILVA DIAS
MICROPHYSICAL EVIDENCE OF THE TRANSITION BETWEENPREDOMINANT CONVECTIVE/STRATIFORM RAINFALL ASSOCIATEDWITH THE INTRASEASONAL OSCILLATION IN THE SOUTHWEST AMAZON.
convective precipitation and westerlies have more stratiformprecipitation from the MCSs. The microphysical distinctionbetween stratiform and convective precipitation lies on themagnitude of in cloud vertical motions. Stratiform precipitationoccurs when the vertical velocity in the cloud (w) does notexceed the terminal fall velocity of ice crystals and snow (v
ice 1
- 3 ms-1), or |w| < vice
(Houze, 1993). At upper levels ofstratiform clouds, ice particles grow mainly by vapor deposition,and when they have enough mass to not be sustained byvertical motions, they start to fall slowly, and then, grow byaggregation and rimming around 2.5 km above the 0°C level.Below the height of 0°C isotherm, ice particles melt and thislevel is easily identified by a horizontal bright band radar echowith a thickness of 500 m (Fabry e Zawadzki, 1995; Gage et al.,1996). These processes are illustrated in Figure 1.
Convective processes are quite different from the stratiformones. Vertical motions are about 1 to 10 ms-1 or more, whichequals or exceeds terminal fall velocities of ice crystals andsnow (Houze, 1993). Therefore, particles grow by rimmingand are carried up and down inside the cloud by up anddowndrafts. Because updrafts exist in a limited region of theconvective clouds, radar echoes associated with activeconvection form a vertical region of maximum reflectivity, whichcontrasts with the horizontal orientation of radar bright bandseen in the melting layer of stratiform precipitation (Figure 1).
Several authors suggested that the period when theWETAMC/LBA & TRMM/LBA experiment took place is a perioddriven by IOSs, characterizing a monsoon regime similar tothose found in Asia (Petersen et al., 2001). In this paper wedescribe the relation between the variability of large scale flowpatterns over South America and changes in microphysicalproperties of Southwest Amazon local convection, as a resultof IOSs. Synoptic characteristics of the transition between breakand monsoon regimes can be easily detected by the zonalwind and outgoing long wave radiation data, whilemicrophysical characteristics of this transition need a moredetailed analysis of the precipitation processes involved.Therefore, a brief synoptic description of January and Februaryof 1999 is shown as well as a microphysical description of thewhole period, and two case studies using data from a profilerradar and an impact disdrometer, specially placed in Rondôniafor the WETAMC/LBA & TRMM/LBA experiment.
DATA AND METODOLOGY
The dataset used to describe the synoptic features of theWETAMC/LBA & TRMM/LBA experiment consists of the GPSA(Global Pacific South America) CPTEC (Centro de Previsão deTempo e Clima) grid analysis of zonal and meridional winds.The microphysical features were studied by a 915 MHz (33 cmwavelength) Doppler profiler radar and a Joss-Waldvogel impactdisdrometer, both placed at the Ji-Paraná airport, Rondonia,within a distance of a few meters. The period analyzed is fromJanuary 17th to March 2nd, 1999 and it is divided into 5 subperiods based on Table 1.
The profiler radar measures the three moments of Dopplerspectrum: reflectivity (Z - proportional to the sixth power ofthe drop diameter distribution within the volume sample),Doppler velocity (V) and spectral width (SW - which is a measureof the turbulence within the volume sample). It operates in105 and 210 m of resolution, with a frequency of one profileper minute, and a vertical range of 10 km and 19 km, respectively.The Joss-Waldvogel disdrometer (JWD) measures the numberof drops that are stored into 20 size intervals ranging form 0.36to about 5.4 mm for 1 minute period. This instrument wasoriginally designed to calculate the radar reflectivity factor (Z)and has some limitations: it cannot measure drops smallerthan 0.36 mm and larger than 5.4mm; it underestimates thenumber of small drops in heavy rain; and its calibration assumesthat the drops are falling at terminal velocity in still air.
The daily mean, maximum and standard deviation of thethree Doppler spectral moments, and the daily mean diameterweighted by the number of drops have been calculated to analyzethe general characteristics of the precipitation systems. Onlyvolume samples with Z > 0 dBZ where considered in the analysisof the profiler radar data to avoid, in a simple way, clear air echoes.
The more specific characteristics of the precipitationsystems have been studied by focusing on two MCS thatoccurred on January 26th and February 24th, 1999. These MCSshave been qualitatively analyzed by some infrared GOES-8images, vertical profiles of profiler radar, and JWD data.
JANUARY-FEBRUARY 1999 SYNOPTIC CONTEXT
To better illustrate the synoptic context of the WETAMC/LBA &TRMM/LBA experiment, the patterns of mean wind flowin the lower (850 hPa) and upper (200 hPa) troposphere, forperiods of “SACZ” (predominance of westerlies) and “non-SACZ” (predominance of easterlies) in Table 1, are found inFigure 2 and Figure 3. These figures clearly show that periodsof westerlies had a northeastern flow from the Equatorial AtlanticOcean to the middle latitudes in 850 hPa (characterizing thelow level jet), and there was the presence of the Bolivian Highat 200 hPa and a well defined cyclonic vortex of the NortheastBrazil over the Western Tropical Atlantic. During periods of lowlevel easterlies, it was observed that the easterly wind flow at850 hPa over the Amazon Basin, and the northeastern flowobserved in the other case were restricted to the proximity of
Table 1 - Periods defined by the lower troposphere zonal flow,where “E” indicates east flow, “W” indicates west flow, andSACZ and non-SACZ indicate periods of a well and a non-well,respectively, established South Atlantic Convergence Zone.Adapted from Rickenbach et al. (2002).
doireP etaD"ZCAS-non"-1E naJ/31otnaJ/11
"ZCAS"-1W naJ/81otnaJ/41"ZCAS-non"-2E naJ/82otnaJ/91"ZCAS-non"-2W beF/70otnaJ/92"ZCAS-non"-3E beF/12otbeF/80
"ZCAS"-3W raM/10otbeF/22

178 VOL. 35(2) 2005: 175 - 184 • ALBRECHT & SILVA DIAS
MICROPHYSICAL EVIDENCE OF THE TRANSITION BETWEENPREDOMINANT CONVECTIVE/STRATIFORM RAINFALL ASSOCIATEDWITH THE INTRASEASONAL OSCILLATION IN THE SOUTHWEST AMAZON.
the Andes’ slope, while the Bolivian High was well defined at200 hPa, as well as the upper level trough (Northeast BrazilianTrough). Therefore, the more evident differences were foundat low level flow. Figure 4 reinforce the presence of zonal windsat 850 hPa mainly from the west during “SACZ” periods andfrom the east during “non-SACZ” for the radiosonde siteFazenda Nossa Senhora (11°S, 62°W). It can be noticed that theW2 period did not have strong westerlies, therefore it did notcharacterize a typical westerly regime.
MYCROPHYSICAL CHARACTERISTICS
In a preliminary analysis the daily mean variables of theprofiler radar and JWD were used. Figure 5 shows the mean-weighted daily diameters in respect to the total number ofdrops by each diameter interval measured by the JWD, locatedat Ji-Paraná airport. This figure shows thateasterly periods had drops with largerdiameters since mean weighteddiameter is about 0.5 and 1.5 mm, whilefor the westerly case drops diameter isfrom 0.5 to just 1.0 mm. This is evidenceof a convective feature for easterly regime.
Figure 6 and Figure 7 show the dailymean variables measured by the profilerradar featuring, in a generic way, periodsof westerlies and easterlies. Figures 6aand 6b show that the daily meanreflectivity and its standard deviation hadits highest values over the region of 2 to8 km, that is, the region where liquidwater and ice were present. The highestin situ values of mean reflectivities are at~ 5 km height, where the 0°C isothermis localized and, consequently, the radarbright band associated to the melting offalling ice particles (Section 1, Figure 1).It is noted that the radar bright bandwas present in both wind regimes, butit was more evident in easterly regimes,except for the W3 period. However,westerly regimes had low standarddeviation for profiler radar variables(inclusive W3), while easterly regimes hadthe highest standard deviations, whichis coherent with the fact that there werefewer systems with small horizontalextensions than in westerlies. Thisstandard deviation behavior shows thehomogeneity of westerly regimes. Anotably fact in the reflectivity standarddeviation is the region between 9 and12 km height: high standard deviationsare observed, but the respective mean isvery low. This is explained by themaximum reflectivities observed at this
same region in Figure 6e, which is associated with noise clearlyseen at the instantaneous one minute reflectivity profiles (notshown). This fact hides the maximums associated with theradar bright band.
Analyzing the mixed phase of hydrometeors (3.5 to 6.5km), it is observed that the highest values of mean reflectivity(Figures 6c and 6f) are concentrated around the radar brightband, and in the case of easterlies these values are relatively inhigher positions, up to 6.5 km (Figure 6f).
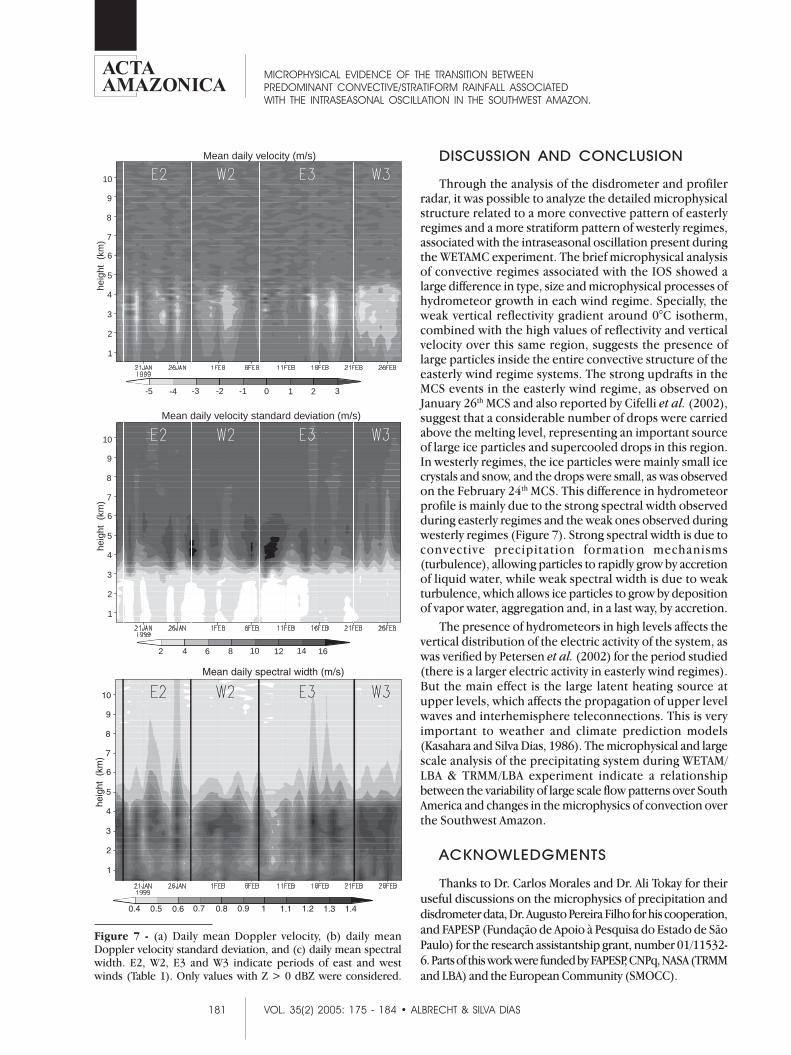
Figure 7 shows daily mean profiles of vertical Dopplervelocity and spectral width (related to the turbulence). It canbe seen that the daily mean velocity was more positive foreasterly regime and its standard deviation was very high,indicating the presence of strong updrafts (Figures 7a and 7b).The turbulence was concentrated below the 0°C isothermduring westerly regimes, but during the easterly regime it
Figure 2 - (a) Low level, 850 hPa, and (b) high level, 200 hPa, mean wind for regimesdefined by SACZ (Table 1). GPSA CPTEC analysis. The area indicated in (a) correspondsto the SACZ.ab
0.5 m/s
Mean upper level winds for periods of SACZ
Figure 3 - (a) Low level, 850 hPa, and (b) high level, 200 hPa, mean wind for regimesdefined by non-SACZ (Table 1). GPSA CPTEC analysis. Easterlies are indicated in (a).
0.5 m/s
Mean lower level winds for periods of non-SACZ
0.5 m/s
Mean upper level winds for periods of non-SACZ

179 VOL. 35(2) 2005: 175 - 184 • ALBRECHT & SILVA DIAS
MICROPHYSICAL EVIDENCE OF THE TRANSITION BETWEENPREDOMINANT CONVECTIVE/STRATIFORM RAINFALL ASSOCIATEDWITH THE INTRASEASONAL OSCILLATION IN THE SOUTHWEST AMAZON.
exceeded this height due to strong convection (Figure 7c),related to the strong up and downdrafts.
January 26th: An easterly case study
The January 26th squall line moved through the experimentarea from northeast to southwest with high rainfall rates at itsleading edge, and moderate stratiform rainfall at its trailingedge. Animation of satellite imagery showed that this squallline probably originated from an organized convection initiatedat the Northeastern Brazilian coast and traveled hundreds ofkilometers reaching the Rondonia state.
This squall line had a slow displacement with a largeconvective area that lasted for more than 2 hours while movingover the experiment area, as can be inferred by the very coldcloud tops in Figure 8. The very convective feature of this
squall line can be verified by Figure 9. There is a great numberof middle to large sized drops in the beginning of the squallline life cycle, when it passed over the disdrometer at 2030UTC. By 2115 UTC the squall line convective leading edgemoved southwest of Ji-Paraná airport and just the stratiformtrailing edge of this system was detected: small drops of ~ 1mm until the end of precipitation.
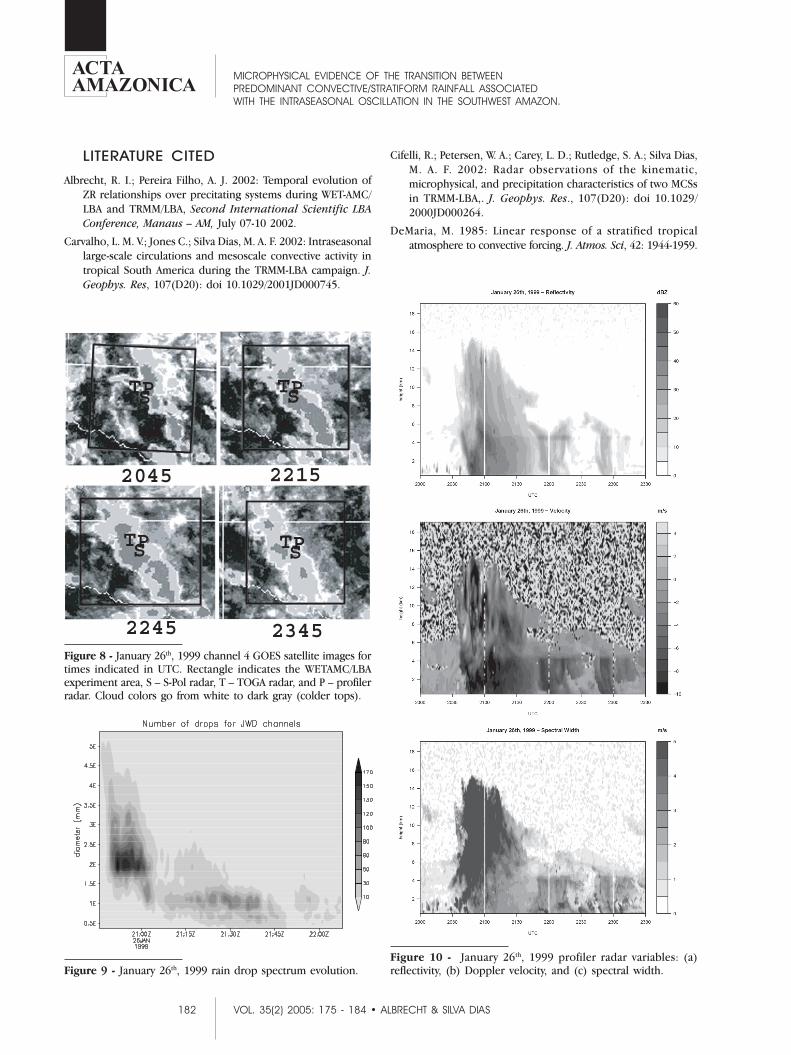
The precipitation processes that originated dropsdetected by the disdrometer can be inferred by profiler datashown in Figure 10. The first hour of heavy precipitationwith a great number of large drops was mainly convective,with high values of reflectivity (Z > 50 dBZ) from the groundto around 7 km height. These high values of reflectivitywere accompanied by strong downdrafts under 6 km inheight, and also a mixture of strong downdrafts and someupdrafts above this height, due to the very strong turbulencecaused by convection. The strong turbulence causes veryhigh values of spectral width in this region. Themicrophysical processes of convective precipitation is theaccretion of liquid water to small size drops as they arecarried to upper and lower levels by the up and downdrafts,since this is the only way fast enough to allow particles todevelop quickly (Houze, 1993). After the first hour ofprecipitation, the drops were small and their verticalreflectivity profiles had a well defined radar bright band,which is due to the melting of ice particles falling over the0°C isotherm. This type of precipitation came from thetrailing edge of the MCS and from its decaying stage. ThisMCS had the same structure as illustrated in Figure 1.
February 24th: A westerly case study
The February 24th system had a long life (~ 5 hours) and avery slow displacement from east to west over the experimentalarea. It had just a few convective cells as shown by the mainlyrelatively warm tops in the infrared satellite images (Figure 11).The disdrometer first detected its precipitation to be around1130 UTC and it was composed just by some small drops. By1330 UTC, the precipitation rate increased by a large numberof small and middle sized drops.
The precipitation processes that originated drops detectedby the disdrometer can be inferred by the profiler data shownin Figure 12. During the first two hours of the MCS, there wasa well defined radar bright band, but disappeared around 1230UTC. Around 1345 UTC hydrometeors were detected above 6km height; it is the formation of ice particles mainly by vapordeposition and rimming. Some time after this, the radar brightband, with Z ~ 35 dBZ, was well defined by the ice particlesfalling through the melting level to the ground at a not so highvelocity, and starting to grow also by aggregation. At this time,around 1415 UTC, middle sized drops were detected by thedisdrometer and reflectivity from this period had a slantedprofile reinforcing the slow decaying particles. This featurelasted for more than two hours. The spectral width profile hadsmall values during the whole period, indicating that therewas no convective activity involved.
Figure 4 - Zonal wind at the pressure level of 850 hPa. over radiosondesite Fazenda Nossa Senhora (11°S, 62°W), during WETAMC/LBAexperiment. Dashed lines separate and indicate beginning/end ofzonal Wind periods from Table 1.
Figure 5 - Daily mean diameter weighted by the total numberof drops. Dashed lines separate and indicate beginning/end ofzonal Wind periods from Table 1ab

180 VOL. 35(2) 2005: 175 - 184 • ALBRECHT & SILVA DIAS
MICROPHYSICAL EVIDENCE OF THE TRANSITION BETWEENPREDOMINANT CONVECTIVE/STRATIFORM RAINFALL ASSOCIATEDWITH THE INTRASEASONAL OSCILLATION IN THE SOUTHWEST AMAZON.
Figure 6 - (a) Daily mean reflectivity, (b) daily mean reflectivity standard deviation, (c) daily mean reflectivity over mixed phaseregion (3.5 to 6.5 km), (d) vertical daily mean reflectivity gradient over mixed phase region, (e) maximum reflectivity observed,and (f) maximum reflectivity observed over mixed phase region. E2, W2, E3 and W3 indicate periods of east and west winds(Table 1). Only values with Z > 0 dBZ were considered.
2
4
6
8
10
12
14
16
18
heig
ht (
km)
3 6 9 12 15 18 21 24 27
Mean daily reflectivity (dBZ)
2
4
6
8
10
12
14
16
18
heig
ht (
km)
0 2 4 6 8 10 12 14 16
Mean daily reflectivity standard deviation (dBZ)
2 4 6 8 10 12 14 16 18 20
3.6
3.9
4.2
4.5
4.8
5.1
5.4
5.7
6.0
6.3
heig
ht (
km)
Mean daily reflectivity (dBZ)
3.6
3.9
4.2
4.5
4.8
5.1
5.4
5.7
6.0
6.3
heig
ht (
km)
-6 -5 -4 -3 -2 0 1-1 2 3 4
Mean daily reflectivity vertical gradient (dBZ/210m)
2
4
6
8
10
12
14
16
18
heig
ht (
km)
Maximum observed reflectivity (dBZ)
0 10 20 30 40 50 60 70
3.6
3.9
4.2
4.5
4.8
5.1
5.4
5.7
6.0
6.3
heig
ht (
km)
5 10 15 20 25 30 35 40 45 5550
Maximum observed reflectivity (dBZ)
181 VOL. 35(2) 2005: 175 - 184 • ALBRECHT & SILVA DIAS
MICROPHYSICAL EVIDENCE OF THE TRANSITION BETWEENPREDOMINANT CONVECTIVE/STRATIFORM RAINFALL ASSOCIATEDWITH THE INTRASEASONAL OSCILLATION IN THE SOUTHWEST AMAZON.
DISCUSSION AND CONCLUSION
Through the analysis of the disdrometer and profilerradar, it was possible to analyze the detailed microphysicalstructure related to a more convective pattern of easterlyregimes and a more stratiform pattern of westerly regimes,associated with the intraseasonal oscillation present duringthe WETAMC experiment. The brief microphysical analysisof convective regimes associated with the IOS showed alarge difference in type, size and microphysical processes ofhydrometeor growth in each wind regime. Specially, theweak vertical reflectivity gradient around 0°C isotherm,combined with the high values of reflectivity and verticalvelocity over this same region, suggests the presence oflarge particles inside the entire convective structure of theeasterly wind regime systems. The strong updrafts in theMCS events in the easterly wind regime, as observed onJanuary 26th MCS and also reported by Cifelli et al. (2002),suggest that a considerable number of drops were carriedabove the melting level, representing an important sourceof large ice particles and supercooled drops in this region.In westerly regimes, the ice particles were mainly small icecrystals and snow, and the drops were small, as was observedon the February 24th MCS. This difference in hydrometeorprofile is mainly due to the strong spectral width observedduring easterly regimes and the weak ones observed duringwesterly regimes (Figure 7). Strong spectral width is due toconvective precipitation formation mechanisms(turbulence), allowing particles to rapidly grow by accretionof liquid water, while weak spectral width is due to weakturbulence, which allows ice particles to grow by depositionof vapor water, aggregation and, in a last way, by accretion.
The presence of hydrometeors in high levels affects thevertical distribution of the electric activity of the system, aswas verified by Petersen et al. (2002) for the period studied(there is a larger electric activity in easterly wind regimes).But the main effect is the large latent heating source atupper levels, which affects the propagation of upper levelwaves and interhemisphere teleconnections. This is veryimportant to weather and climate prediction models(Kasahara and Silva Dias, 1986). The microphysical and largescale analysis of the precipitating system during WETAM/LBA & TRMM/LBA experiment indicate a relationshipbetween the variability of large scale flow patterns over SouthAmerica and changes in the microphysics of convection overthe Southwest Amazon.
ACKNOWLEDGMENTS
Thanks to Dr. Carlos Morales and Dr. Ali Tokay for theiruseful discussions on the microphysics of precipitation anddisdrometer data, Dr. Augusto Pereira Filho for his cooperation,and FAPESP (Fundação de Apoio à Pesquisa do Estado de SãoPaulo) for the research assistantship grant, number 01/11532-6. Parts of this work were funded by FAPESP, CNPq, NASA (TRMMand LBA) and the European Community (SMOCC).
Figure 7 - (a) Daily mean Doppler velocity, (b) daily meanDoppler velocity standard deviation, and (c) daily mean spectralwidth. E2, W2, E3 and W3 indicate periods of east and westwinds (Table 1). Only values with Z > 0 dBZ were considered.
1
2
3
4
5
6
7
8
9
10
heig
ht (
km)
Mean daily velocity (m/s)
-5 -4 -3 -2 -1 0 1 2 3
1
2
3
4
5
6
7
8
9
10
heig
ht (
km)
Mean daily velocity standard deviation (m/s)
2 4 6 8 10 12 14 16
182 VOL. 35(2) 2005: 175 - 184 • ALBRECHT & SILVA DIAS
MICROPHYSICAL EVIDENCE OF THE TRANSITION BETWEENPREDOMINANT CONVECTIVE/STRATIFORM RAINFALL ASSOCIATEDWITH THE INTRASEASONAL OSCILLATION IN THE SOUTHWEST AMAZON.
LITERATURE CITED
Albrecht, R. I.; Pereira Filho, A. J. 2002: Temporal evolution ofZR relationships over precitating systems during WET-AMC/LBA and TRMM/LBA, Second International Scientific LBAConference, Manaus – AM, July 07-10 2002.
Carvalho, L. M. V.; Jones C.; Silva Dias, M. A. F. 2002: Intraseasonallarge-scale circulations and mesoscale convective activity intropical South America during the TRMM-LBA campaign. J.Geophys. Res, 107(D20): doi 10.1029/2001JD000745.
Cifelli, R.; Petersen, W. A.; Carey, L. D.; Rutledge, S. A.; Silva Dias,M. A. F. 2002: Radar observations of the kinematic,microphysical, and precipitation characteristics of two MCSsin TRMM-LBA,. J. Geophys. Res., 107(D20): doi 10.1029/2000JD000264.
DeMaria, M. 1985: Linear response of a stratified tropicalatmosphere to convective forcing. J. Atmos. Sci, 42: 1944-1959.
Figure 8 - January 26th, 1999 channel 4 GOES satellite images fortimes indicated in UTC. Rectangle indicates the WETAMC/LBAexperiment area, S – S-Pol radar, T – TOGA radar, and P – profilerradar. Cloud colors go from white to dark gray (colder tops).
TPS
2045
TPS
2215
TPS
2245
TPS
2345
Figure 9 - January 26th, 1999 rain drop spectrum evolution.Figure 10 - January 26th, 1999 profiler radar variables: (a)reflectivity, (b) Doppler velocity, and (c) spectral width.

183 VOL. 35(2) 2005: 175 - 184 • ALBRECHT & SILVA DIAS
MICROPHYSICAL EVIDENCE OF THE TRANSITION BETWEENPREDOMINANT CONVECTIVE/STRATIFORM RAINFALL ASSOCIATEDWITH THE INTRASEASONAL OSCILLATION IN THE SOUTHWEST AMAZON.
Fabry, F.; Zawadzki, I. 1995: Long-term radar observations ofthe melting layer of precipitation and their interpretation.J. Atmos. Sci., 52: 838-851.
Gage, K. S.; Williams, C. R.; Ecklund, W. L. 1996: Applicationof the 915MHz profiler for diagnosing and classifyingtropical precipitation cloud systems. Meteorol. Atmos.Phys., 59: 141-151.
Gargstang, M.; Massie Jr., L.; Halverson, J.; Greco, S.; Scala, J.1994: Amazon coastal squall lines, Part I, Structure andkinematics. Mon. Weather Rev., 122: 608-622.
Garreaud, R. D.; Wallace, J. M. 1997: The diurnal march ofconvective cloudiness over the Americas, Mon. Weather Rev..125: 3157-3171.
Halverson, J. B.; Rickenbach, T. M.; Roy, B.; Pierce, H; Williams,E. 2002: Environmental characteristics of convective systemsduring TRMM-LBA. Mon. Wea. Rev., 130: 1493-1509.
Figure 13 - February 24th, 1999 profiler radar variables: (a)reflectivity, (b) Doppler velocity, and (c) spectral width.
TPSTPS
TPSTPS
1115 1315
1515 1615Figure 11 - February 24th, 1999 channel 4 GOES satellite images fortimes indicated in UTC. Red rectangle indicates the WETAMC/LBAexperiment area, S – S-Pol radar, T – TOGA radar, and P – profilerradar. Cloud colors go from white to dark gray (colder tops).
Figure 12 - February 24th, 1999 rain drop spectrum evolution.ab

184 VOL. 35(2) 2005: 175 - 184 • ALBRECHT & SILVA DIAS
MICROPHYSICAL EVIDENCE OF THE TRANSITION BETWEENPREDOMINANT CONVECTIVE/STRATIFORM RAINFALL ASSOCIATEDWITH THE INTRASEASONAL OSCILLATION IN THE SOUTHWEST AMAZON.
Herdies, D. L.; da Silva, A.; Silva Dias, M. A. F. 2002: The bi-modalpattern of the summertime circulation over South América.J. Geophys. Res., 107(D20): doi: 10.1029/2001JD000337.
Houze, R. A. 1993: Cloud Dynamics. Academic Press, 573pp..
Jones, C.; Carvalho, L. M. V. 2002: Active and break phases in theSouth American monsoon system. J. Climate, 15: 905-914.
Kasahara A.; Silva Dias, P. L. 1986: Response of planetary waves tostationary tropical heating in a global atmosphere withmeridional and vertical shear. J. Atmos. Sci., 43 (18): 1893-1911
Kousky, V. E. 1979: Frontal influences on northeast Brazil. Mon.Wea. Rev, 107: 1140-1153.
Kousky, V. E.; Gan, M. A. 1981: Upper tropospheric cyclonic vorticesin the tropical South-Atlantic. Tellus, 33 (6): 538-551 1981
Kousky, V. E.; Kayano, M. T. 1994: Principal modes of outgoinglongwave radiation and 250-mb circulation for the SouthAmerican sector. J. Climate, 7: 1131-1143.
Madden, R. A.; Julian, P. R. 1994: Observation of the 40-50 daytropical oscillation - A Review. Mon. Wea. Rev., 122: 814-837.
Nobre, C 1988: Ainda sobre a Zona de Convergência doAtlântico Sul: A importância do Oceano Atlântico.Climanálise, 3(4), 30-33.
Pereira, A. J.; Albrecht, R. I.; Tokay, A. 2001: S-Pol measurementsand DSD estimates of reflectivity during the WET-AMC/LBAand TRMM/LBA experiment in Rondônia, Brazil, 30thInternational Conference on Radar Meteorology, AMS,Munich, Germany, July 2001.
RECEBIDO EM 29/10/2003ACEITO EM 17/05/2005
Petersen, W. A.; Nesbitt, S. W.; Blakeslee, R. J.; Cifelli, R; Hein, P;Rutledge, S. A. 2001: TRMM observations of convectiveregimes in the Amazon. J. Clim., in press.
Rickenbach, T. M.; Nieto Ferreira, R.; Herdies, D. L.; Silva Dias, M.A. F.; Halverson, J. 2002: Modulation of convection in theSouthwestern Amazon Basin by extratropical stationaryfronts, J. Geophys. Res., 107(D20): doi: 10.1029/2001JD000334.
Silva Dias, M. A. F.; Rutledge, S.; Kabat, P.; Silva Dias, P. L.; Nobre,C.; Fisch, G.; Dolman, A. J.; Zipser, E.; Garstang, M.; Manzi,A.; Fuentes, J. D.; Rocha, H.; Marengo, J.; Plana-Fattori, A.;Sá, L.; Alvalá, R.; Andreae, M. O.; Artaxo, P.; Gielow, R.; Gatti,L. 2002: Clouds and rain processes in a biosphere-atmosphere interaction context in the Amazon region, J.Geophys. Res, 107(D20): doi 10.1029/2001JD000335.
Silva Dias, P. L; Marengo, J. 1999: Águas atmosféricas. In: ÁguasDoces do Brasil. Ed. IEA/ABC, p. 65-115.
Tokay, A.; Kruger, A.; Pereira, A. J. 2002: Measurements of dropsize distribuitions in Southwestern Amazon Basin, J.Geophys. Res., 107(D20): doi 10.1029/2001JD000355.
Zhou, Z; Lau, K.-M. 1998: Does a monsoon climate exist overSouth America? J. Climate, 11: 1020-1040.
Related Documents