A Micron Reference Architecture Micron ® 9200 MAX NVMe™ SSDs + Ceph ® Luminous 12.2.8 + BlueStore Reference Architecture

Welcome message from author
This document is posted to help you gain knowledge. Please leave a comment to let me know what you think about it! Share it to your friends and learn new things together.
Transcript
A Micron Reference Architecture
Micron® 9200 MAX NVMe™ SSDs + Ceph® Luminous 12.2.8 + BlueStore
Reference Architecture
2
A Micron Reference Architecture
Contents
Executive Summary ...................................................................................................................................... 3
Why Micron for this Solution ................................................................................................................... 3
Ceph Distributed Architecture Overview ....................................................................................................... 4
Reference Architecture Overview ................................................................................................................. 6
Software .................................................................................................................................................. 6
Ceph Luminous 12.2.8....................................................................................................................... 6
Red Hat Enterprise Linux 7.5 ............................................................................................................ 6
Software by Node Type .......................................................................................................................... 7
Hardware ................................................................................................................................................ 8
Ceph Storage Node ........................................................................................................................... 8
Ceph Monitor Node ............................................................................................................................ 9
Micron 9200 MAX NVMe SSDs ......................................................................................................... 9
Network Switches .............................................................................................................................. 9
Mellanox ConnectX®-5 EN Dual Port NICs ..................................................................................... 10
Planning Considerations ............................................................................................................................. 11
Number of Ceph Storage Nodes .......................................................................................................... 11
Number of Ceph Monitor Nodes ........................................................................................................... 11
Replication Factor ................................................................................................................................. 11
CPU Sizing ........................................................................................................................................... 11
Ceph Configuration Tuning ................................................................................................................... 11
Networking ............................................................................................................................................ 11
Number of OSDs per Drive ................................................................................................................... 12
OS Tuning/NUMA ................................................................................................................................. 13
Measuring Performance .............................................................................................................................. 14
4KB Random Workloads: FIO + RBD .................................................................................................. 14
4MB Object Workloads: RADOS Bench ............................................................................................... 14
Baseline Test Methodology ......................................................................................................................... 15
Storage Baseline Results ..................................................................................................................... 15
Network Baseline Results ..................................................................................................................... 15
Test Results and Analysis ........................................................................................................................... 15
4KB Random Workload Testing ........................................................................................................... 16
4KB Random Write Workload Analysis ........................................................................................... 16
4KB Random Read Workload Analysis ........................................................................................... 18
Random Read Results Summary .................................................................................................... 20
4KB Random 70% Read / 30% Write Workload Analysis ............................................................... 20
Random 70/30 R/W Results Summary ............................................................................................ 22
4MB Object Workloads ......................................................................................................................... 22
Summary ..................................................................................................................................................... 24
Appendix A: Configuration Details .............................................................................................................. 25
About Micron ............................................................................................................................................... 31
Why Community Edition? ............................................................................................................................ 31
About Ceph Storage .................................................................................................................................... 31
3
A Micron Reference Architecture
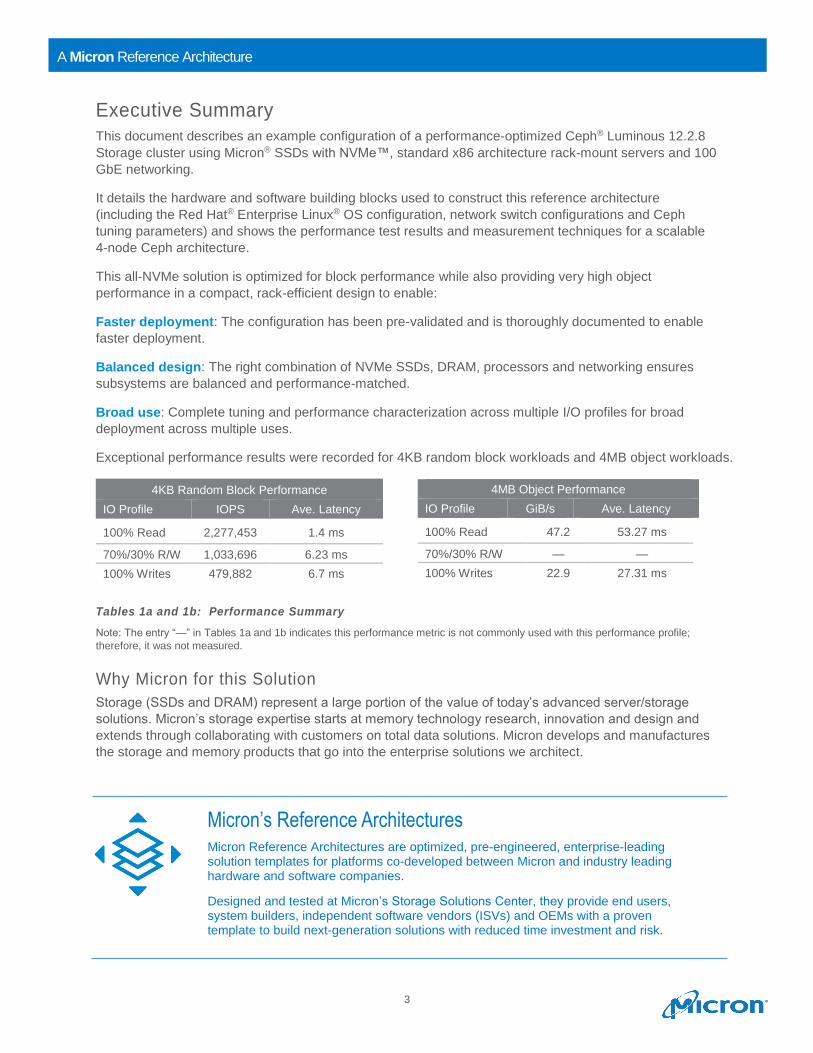
Executive Summary
This document describes an example configuration of a performance-optimized Ceph® Luminous 12.2.8
Storage cluster using Micron® SSDs with NVMe™, standard x86 architecture rack-mount servers and 100
GbE networking.
It details the hardware and software building blocks used to construct this reference architecture
(including the Red Hat® Enterprise Linux® OS configuration, network switch configurations and Ceph
tuning parameters) and shows the performance test results and measurement techniques for a scalable
4-node Ceph architecture.
This all-NVMe solution is optimized for block performance while also providing very high object
performance in a compact, rack-efficient design to enable:
Faster deployment: The configuration has been pre-validated and is thoroughly documented to enable
faster deployment.
Balanced design: The right combination of NVMe SSDs, DRAM, processors and networking ensures
subsystems are balanced and performance-matched.
Broad use: Complete tuning and performance characterization across multiple I/O profiles for broad
deployment across multiple uses.
Exceptional performance results were recorded for 4KB random block workloads and 4MB object workloads.
Tables 1a and 1b: Performance Summary
Note: The entry “—” in Tables 1a and 1b indicates this performance metric is not commonly used with this performance profile;
therefore, it was not measured.
Why Micron for this Solution
Storage (SSDs and DRAM) represent a large portion of the value of today’s advanced server/storage
solutions. Micron’s storage expertise starts at memory technology research, innovation and design and
extends through collaborating with customers on total data solutions. Micron develops and manufactures
the storage and memory products that go into the enterprise solutions we architect.
4KB Random Block Performance
IO Profile IOPS Ave. Latency
100% Read 2,277,453 1.4 ms
70%/30% R/W 1,033,696 6.23 ms
100% Writes 479,882 6.7 ms
4MB Object Performance
IO Profile GiB/s Ave. Latency
100% Read 47.2 53.27 ms
70%/30% R/W — —
100% Writes 22.9 27.31 ms
Micron’s Reference Architectures Micron Reference Architectures are optimized, pre-engineered, enterprise-leading solution templates for platforms co-developed between Micron and industry leading hardware and software companies.
Designed and tested at Micron’s Storage Solutions Center, they provide end users, system builders, independent software vendors (ISVs) and OEMs with a proven template to build next-generation solutions with reduced time investment and risk.
4
A Micron Reference Architecture
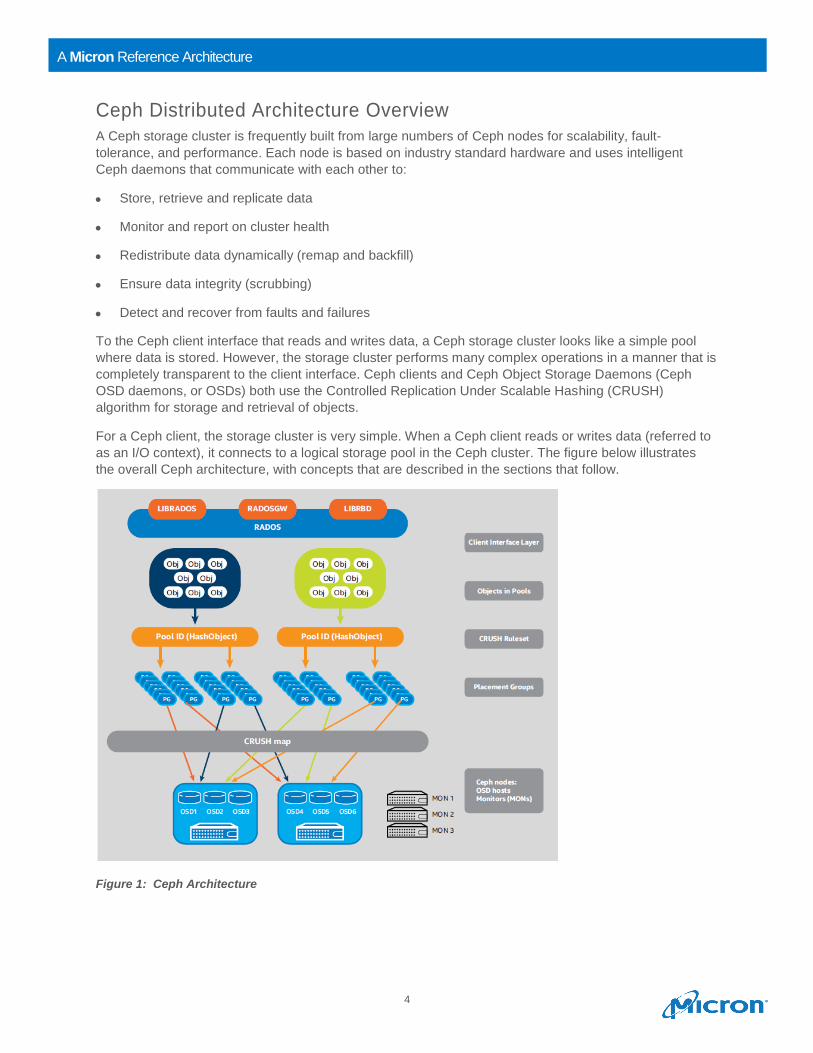
Ceph Distributed Architecture Overview
A Ceph storage cluster is frequently built from large numbers of Ceph nodes for scalability, fault-
tolerance, and performance. Each node is based on industry standard hardware and uses intelligent
Ceph daemons that communicate with each other to:
• Store, retrieve and replicate data
• Monitor and report on cluster health
• Redistribute data dynamically (remap and backfill)
• Ensure data integrity (scrubbing)
• Detect and recover from faults and failures
To the Ceph client interface that reads and writes data, a Ceph storage cluster looks like a simple pool
where data is stored. However, the storage cluster performs many complex operations in a manner that is
completely transparent to the client interface. Ceph clients and Ceph Object Storage Daemons (Ceph
OSD daemons, or OSDs) both use the Controlled Replication Under Scalable Hashing (CRUSH)
algorithm for storage and retrieval of objects.
For a Ceph client, the storage cluster is very simple. When a Ceph client reads or writes data (referred to
as an I/O context), it connects to a logical storage pool in the Ceph cluster. The figure below illustrates
the overall Ceph architecture, with concepts that are described in the sections that follow.
Figure 1: Ceph Architecture
5
A Micron Reference Architecture
Clients write to Ceph storage pools while the CRUSH ruleset determines how placement groups are
distributed across object storage daemons (OSDs).
• Pools: A Ceph storage cluster stores data objects in logical dynamic partitions called pools. Pools
can be created for specific data types, such as for block devices, object gateways or simply to
separate user groups. The Ceph pool configuration dictates the number of object replicas and the
number of placement groups (PGs) in the pool. Ceph storage pools can be either replicated or
erasure coded as appropriate for the application and cost model. Additionally, pools can “take root” at
any position in the CRUSH hierarchy, allowing placement on groups of servers with differing
performance characteristics—allowing storage to be optimized for different workloads.
• Placement groups: Ceph maps objects to placement groups (PGs). PGs are shards or fragments of
a logical object pool that are composed of a group of Ceph OSD daemons that are in a peering
relationship. Placement groups provide a means of creating replication or erasure coding groups of
coarser granularities than on a per object basis. A larger number of placement groups (for example,
200 per OSD or more) leads to better balancing.
• CRUSH ruleset: The CRUSH algorithm provides controlled, scalable, and disparate placement of
replicated or erasure-coded data within Ceph and determines how to store and retrieve data by
computing data storage locations. CRUSH empowers Ceph clients to communicate with OSDs
directly, rather than through a centralized server or broker. By determining a method of storing and
retrieving data by an algorithm, Ceph avoids a single point of failure, a performance bottleneck, and a
physical limit to scalability.
• Ceph monitors (MONs): Before Ceph clients can read or write data, they must contact a Ceph MON
to obtain the current cluster map. A Ceph storage cluster can operate with a single monitor, but this
introduces a single point of failure. For added reliability and fault tolerance, Ceph supports an odd
number of monitors in a quorum (typically three or five for small to mid-sized clusters). Consensus
among various monitor instances ensures consistent knowledge about the state of the cluster.
• Ceph OSD daemons: In a Ceph cluster, Ceph OSD daemons store data and handle data replication,
recovery, backfilling, and rebalancing. They also provide some cluster state information to Ceph
monitors by checking other Ceph OSD daemons with a heartbeat mechanism. A Ceph storage cluster
configured to keep three replicas of every object requires a minimum of three Ceph OSD daemons,
two of which need to be operational to successfully process write requests. Ceph OSD daemons
roughly correspond to a file system on a physical hard disk drive.
6
A Micron Reference Architecture
Reference Architecture Overview
This reference architecture (RA) is based on the Intel® Purley platform with Xeon® 8168 processors. This
combination provides the high CPU performance required for a performance-optimized Ceph cluster and
yields an open, cost-effective software-defined storage (SDS) platform. This platform can be utilized as
an effective building block for implementing a multi-petabyte OpenStack® cloud infrastructure.
The Micron 9200 MAX NVMe SSDs used in this RA offer tremendous performance with low latencies.
Capacity per rack unit is maximized with 10 6.4TB NVMe SSDs per 1U storage node. This entire RA
takes up seven rack units (including three monitor nodes) and can be easily scaled up 1U and 64TB at a
time.
Network throughput is handled by two separate Mellanox® ConnectX®-5 100 GbE network cards per
storage node—one for the client network and another for the internal Ceph replication network. Clients
and monitor nodes are connected to the client network via Mellanox ConnectX-4 50 GbE networking.
Figure 2: Micron NVMe RA Design
Software
Ceph Luminous 12.2.8
Ceph is a free software storage platform that implements object storage on a single distributed computer
cluster and provides interfaces for object, block and file-level storage. Ceph is designed primarily for
completely distributed operation without a single point of failure, scalability to the exabyte level and broad,
open distribution.
Ceph replicates data for fault-tolerance using commodity hardware (requiring no specific hardware
support). Because of its design, the system is both self-healing and self-managing, aiming to minimize
administration time and other costs.
Red Hat Enterprise Linux 7.5
Red Hat® Enterprise Linux® (RHEL) is a high-performing operating system that has been deployed in IT
environments for more than a decade.
7
A Micron Reference Architecture
Red Hat Enterprise Linux 7.5 is noted for its enterprise-level performance, reliability, and security as well
as its broad use (it is certified by leading hardware and software vendors), broad scalability (from
workstations, to servers, to mainframes) and consistent application environment across physical, virtual,
and cloud deployments.
Software by Node Type
Table 2 shows the software and version numbers used in the Ceph Monitor and Storage Nodes.
Table 2: Ceph Storage and Monitor Nodes: Software
Table 3 shows the software and version numbers for the Ceph Load Generation Servers. Note that the
Load Generation server software stack is very similar to the Storage Node software stack.
Table 3: Ceph Load Generation Nodes: Software
Operating System Red Hat Enterprise Linux 7.5
Storage Ceph Luminous 12.2.8
NIC Driver Mellanox OFED Driver 4.4-2.0.7.0
Operating System Red Hat Enterprise Linux 7.5
Storage Ceph Client: Luminous 12.2.8
Benchmark FIO 3.10 w/ librbd enabled
NIC Driver Mellanox OFED Driver 4.4-2.0.7.0
8
A Micron Reference Architecture
Hardware
This RA uses standard 1U, x86 architecture platforms each housing up to 10 NVMe SSDs (U.2 form
factor) with additional storage for local operating systems.
Ceph Storage Node
Platforms: We chose standard x86 servers with 10 NVMe U.2 SSDs in a compact 1U chassis. This x86
platform enables a balance among CPU, DRAM and storage for flexibility and scalability. Using a 1U
chassis ensures the platform is well suited for demanding enterprise workloads.
Performance: 1U x86 dual processor server platform features powerful dual Intel Xeon Platinum 81xx
CPUs (165W/ 28 cores), up to 3TB of memory in 24 DIMMs, and NVMe support for increased storage
bandwidth, with several also offering energy-efficient, titanium-level (96%+) power supplies.
Flexibility: A combination of compact design (1U) coupled with expansive storage enables enterprise IT
professionals to easily use a single server platform that can be configured for a wide variety of workloads,
reducing qualification time and the need for excessive spare inventories to manage.
Scalability: Standard x86 servers with 10x NVMe drives are highly scalable and provide extreme
expansion density for a 1U/2U system. Some also support up to four add-on cards (for example, the
Supermicro SYS-1029U-TNRT).
Figure 3: Supermicro SYS-1029U-TNRT Example x86 Platform
Table 4: Storage Nodes Hardware Details
Server Type x86 (dual-socket) 1U with PCIe Gen 3 (“Purley”)
Model Supermicro SuperServer 1029U-TN10RT (example only)
CPU (x2) Intel Xeon 8168: 24 cores, 48 threads, 2.7 GHz base (3.7 GHz turbo)
DRAM (x12) Micron 32GB DDR4-2666 MT/s, 384GB total per node
NVMe (x10) Micron 9200 MAX NVMe SSDs, 6.4TB each
SATA (OS) Micron 5100 SATA SSD
Network 2x Mellanox ConnectX-5 100 GbE dual-port (MCX516A-CCAT)
9
A Micron Reference Architecture
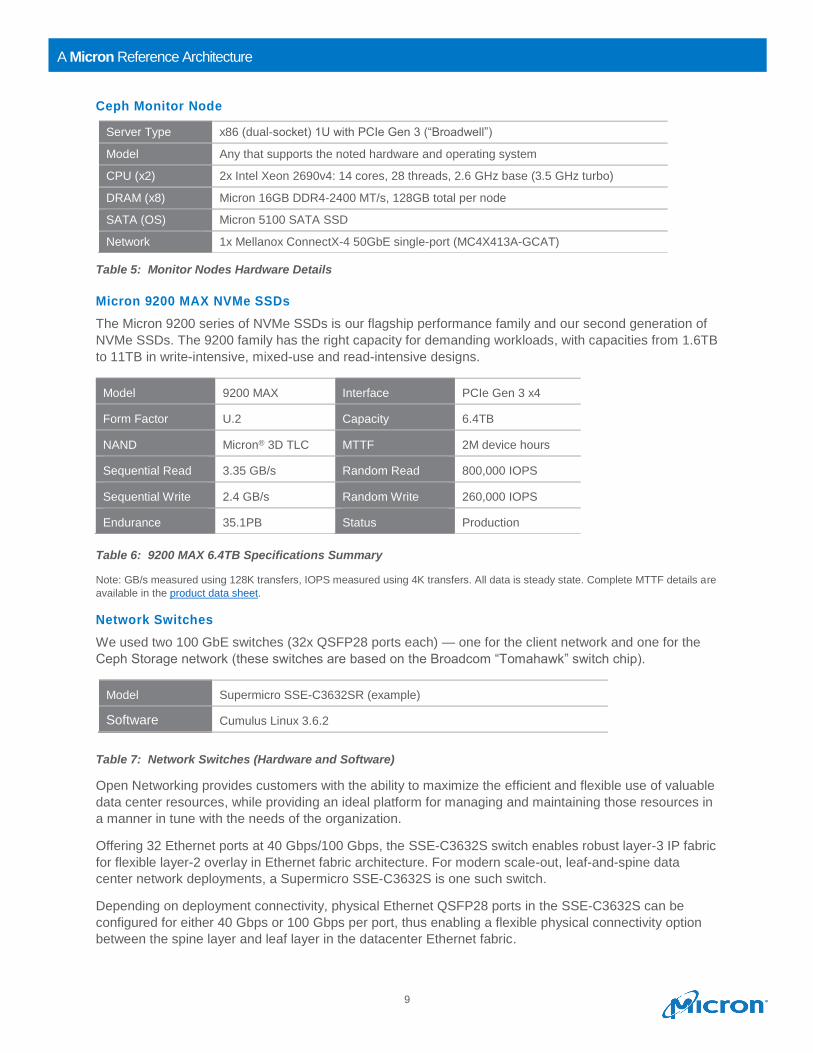
Ceph Monitor Node
Table 5: Monitor Nodes Hardware Details
Micron 9200 MAX NVMe SSDs
The Micron 9200 series of NVMe SSDs is our flagship performance family and our second generation of
NVMe SSDs. The 9200 family has the right capacity for demanding workloads, with capacities from 1.6TB
to 11TB in write-intensive, mixed-use and read-intensive designs.
Table 6: 9200 MAX 6.4TB Specifications Summary
Note: GB/s measured using 128K transfers, IOPS measured using 4K transfers. All data is steady state. Complete MTTF details are
available in the product data sheet.
Network Switches
We used two 100 GbE switches (32x QSFP28 ports each) — one for the client network and one for the
Ceph Storage network (these switches are based on the Broadcom “Tomahawk” switch chip).
Table 7: Network Switches (Hardware and Software)
Open Networking provides customers with the ability to maximize the efficient and flexible use of valuable
data center resources, while providing an ideal platform for managing and maintaining those resources in
a manner in tune with the needs of the organization.
Offering 32 Ethernet ports at 40 Gbps/100 Gbps, the SSE-C3632S switch enables robust layer-3 IP fabric
for flexible layer-2 overlay in Ethernet fabric architecture. For modern scale-out, leaf-and-spine data
center network deployments, a Supermicro SSE-C3632S is one such switch.
Depending on deployment connectivity, physical Ethernet QSFP28 ports in the SSE-C3632S can be
configured for either 40 Gbps or 100 Gbps per port, thus enabling a flexible physical connectivity option
between the spine layer and leaf layer in the datacenter Ethernet fabric.
Server Type x86 (dual-socket) 1U with PCIe Gen 3 (“Broadwell”)
Model Any that supports the noted hardware and operating system
CPU (x2) 2x Intel Xeon 2690v4: 14 cores, 28 threads, 2.6 GHz base (3.5 GHz turbo)
DRAM (x8) Micron 16GB DDR4-2400 MT/s, 128GB total per node
SATA (OS) Micron 5100 SATA SSD
Network 1x Mellanox ConnectX-4 50GbE single-port (MC4X413A-GCAT)
Model 9200 MAX Interface PCIe Gen 3 x4
Form Factor U.2 Capacity 6.4TB
NAND Micron® 3D TLC MTTF 2M device hours
Sequential Read 3.35 GB/s Random Read 800,000 IOPS
Sequential Write 2.4 GB/s Random Write 260,000 IOPS
Endurance 35.1PB Status Production
Model Supermicro SSE-C3632SR (example)
Software Cumulus Linux 3.6.2
10
A Micron Reference Architecture
The compact 1U form factor gives users the ability to optimize deployment in standalone or top-of-rack
environments. A rail kit facilitates rack-mounting installations. These switches are ideal for deployment in
datacenter, cloud and enterprise environments with the capability of handling access for the most
demanding applications.
Mellanox ConnectX®-5 EN Dual Port NICs
The ConnectX-5 EN Network Controller with two ports of 100 Gb/s Ethernet connectivity and advanced
offload capabilities delivers high bandwidth, low latency and high computation efficiency for high-
performance, data-intensive and scalable HPC, cloud, data analytics, database and storage platforms.
11
A Micron Reference Architecture
Planning Considerations
Number of Ceph Storage Nodes
Ten storage nodes are the recommended scale for an enterprise Ceph cluster. Four storage nodes
represent a valid building block to use for scaling up to larger deployments. This RA uses four storage
nodes.
Number of Ceph Monitor Nodes
At least three monitor nodes should be configured on separate hardware. These nodes do not require
high-performance CPUs. They do benefit from having SSDs to store the monitor map data. One monitor
node is the minimum, but three or more monitor nodes are typically used in production deployments.
Replication Factor
NVMe SSDs have high reliability with high MTBR and low bit error rate. 2x replication is recommended in
production when deploying OSDs on NVMe versus the 3x replication common with legacy HDD storage.
CPU Sizing
Ceph OSD processes can consume large amounts of CPU while doing small block operations.
Consequently, a higher CPU core count generally results in higher performance for I/O-intensive
workloads. For throughput-intensive workloads characterized by large sequential I/O, Ceph performance
is more likely to be bound by the maximum network bandwidth of the cluster.
Ceph Configuration Tuning
Tuning Ceph for NVMe devices can be complex. The ceph.conf settings used in this RA are optimized for
small block random performance and are included in Appendix A.
Networking
A 25 GbE network is required to leverage the maximum block performance benefits of a NVMe-based
Ceph cluster. For throughput-intensive workloads, 50 GbE to 100 GbE is recommended
Two OSDs per 9200 MAX SSD greatly reduce tail latency for 4KB random
writes. It also improves 4KB random write IOPS at higher queue depths.
12
A Micron Reference Architecture
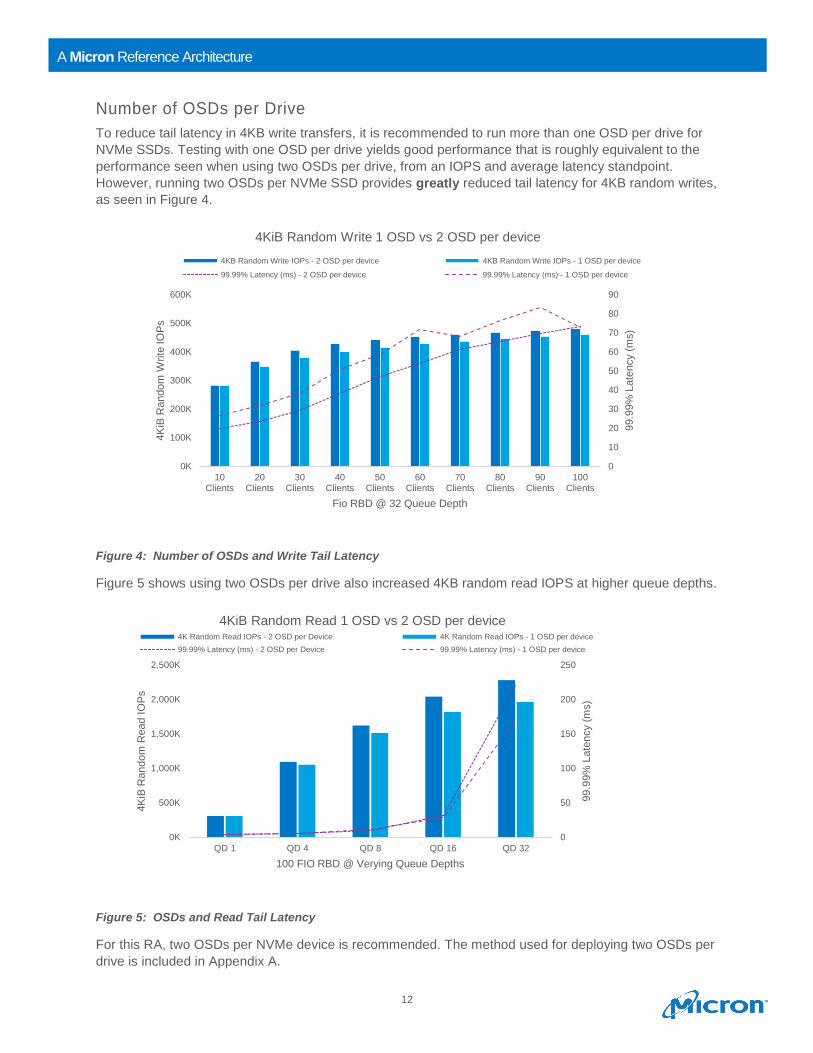
Number of OSDs per Drive
To reduce tail latency in 4KB write transfers, it is recommended to run more than one OSD per drive for
NVMe SSDs. Testing with one OSD per drive yields good performance that is roughly equivalent to the
performance seen when using two OSDs per drive, from an IOPS and average latency standpoint.
However, running two OSDs per NVMe SSD provides greatly reduced tail latency for 4KB random writes,
as seen in Figure 4.
Figure 4: Number of OSDs and Write Tail Latency
Figure 5 shows using two OSDs per drive also increased 4KB random read IOPS at higher queue depths.
Figure 5: OSDs and Read Tail Latency
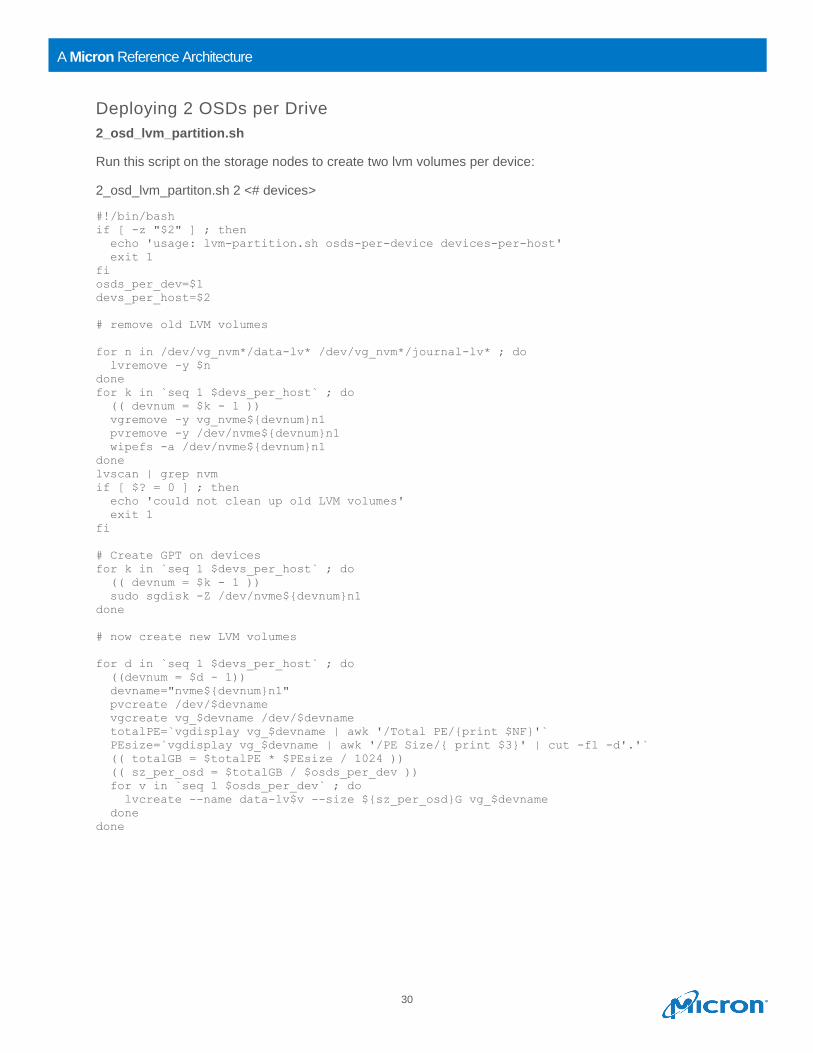
For this RA, two OSDs per NVMe device is recommended. The method used for deploying two OSDs per
drive is included in Appendix A.
0
10
20
30
40
50
60
70
80
90
0K
100K
200K
300K
400K
500K
600K
10Clients
20Clients
30Clients
40Clients
50Clients
60Clients
70Clients
80Clients
90Clients
100Clients
99.9
9%
Late
ncy (
ms)
4K
iB R
andom
Write
IO
Ps
Fio RBD @ 32 Queue Depth
4KiB Random Write 1 OSD vs 2 OSD per device
4KB Random Write IOPs - 2 OSD per device 4KB Random Write IOPs - 1 OSD per device
99.99% Latency (ms) - 2 OSD per device 99.99% Latency (ms) - 1 OSD per device
0
50
100
150
200
250
0K
500K
1,000K
1,500K
2,000K
2,500K
QD 1 QD 4 QD 8 QD 16 QD 32
99.9
9%
Late
ncy (
ms)
4K
iB R
andom
Read I
OP
s
100 FIO RBD @ Verying Queue Depths
4KiB Random Read 1 OSD vs 2 OSD per device4K Random Read IOPs - 2 OSD per Device 4K Random Read IOPs - 1 OSD per device
99.99% Latency (ms) - 2 OSD per Device 99.99% Latency (ms) - 1 OSD per device
13
A Micron Reference Architecture
OS Tuning/NUMA
OS tuning parameters are deployed by Ceph-Ansible. The following OS settings were used:
disable_transparent_hugepage: true
kernel.pid_max, value: 4,194,303
fs.file-max, value: 26,234,859
vm.zone_reclaim_mode, value: 0
vm.swappiness, value: 1
vm.min_free_kbytes, value: 1,000,000
net.core.rmem_max, value: 268,435,456
net.core.wmem_max, value: 268,435,456
net.ipv4.tcp_rmem, value: 4096 87,380 134,217,728
net.ipv4.tcp_wmem, value: 4096 65,536 134,217,728
ceph_tcmalloc_max_total_thread_cache: 134,217,728
NUMA tuning was not used during testing due to the unbalanced nature of the servers used—four NVMe
devices and both NICs go to CPU 1 and the other six NVMe devices are on CPU 2. Irqbalance was active
for all tests and did a reasonable job balancing across CPUs.
14
A Micron Reference Architecture
Measuring Performance
4KB Random Workloads: FIO + RBD
4KB random workloads were tested using the FIO synthetic IO generation tool and the Ceph RADOS
Block Device (RBD) driver.
100 RBD images were created at the start of testing. When testing on a 2x replicated pool, the RBD
images were 75GB each (7.5TB of data); on a 2x replicated pool, that equals 15TB of total data stored.
The four storage nodes have a combined total of 1.5TB of DRAM, which is 10% of the dataset size.
4KB random writes were measured by scaling up the number of FIO clients running load against Ceph at
a fixed queue depth of 32. A client in this case is a single instance of FIO running on a load generation
server. Using a queue depth of 32 simulates a reasonably active RDB image consumer and allows our
tests to scale up to a high client count. The number of clients was scaled from 10 clients up to 100 clients.
10 load generation servers were used in testing with an equal number of FIO instances on each.
4KB random reads and 70/30 read/write tests were measured by using all 100 RBD images, scaling up
the queue depth per FIO client from 1 to 32. It is important to use all 100 clients for reads so that the
entire 15TB dataset is being accessed; otherwise, Linux filesystem caching can skew results higher.
Each test was run three times for 10 minutes with a five-minute ramp-up time. Linux filesystem caches
were cleared and the Ceph service was restarted between each test. The results reported are the
averages across all test runs.
4MB Object Workloads: RADOS Bench
RADOS Bench is a built-in tool for measuring object performance. It represents the best-case object
performance scenario of data coming directly to Ceph from a RADOS Gateway node.
4MB object writes were measured by running RADOS Bench with a “threads” value of 16 on a load
generation server writing directly to a Ceph storage pool. The number of load generation servers scaled
up from 2 to 10.
4MB object reads were measured by first writing 15TB of data into a 2x or 3x replicated pool using 20
RADOS Bench instances (2 per load generation server). Once the data load was complete, all 20
RADOS Bench instances were used to run 4MB object reads against the storage pool. The thread count
of RADOS Bench scaled up from 4 threads to 32 threads.
Object workload tests were run for 10 minutes, three times each. Linux filesystem caches were cleared
and the Ceph service was restarted between each test. The results reported are the averages across all
test runs.
15
A Micron Reference Architecture
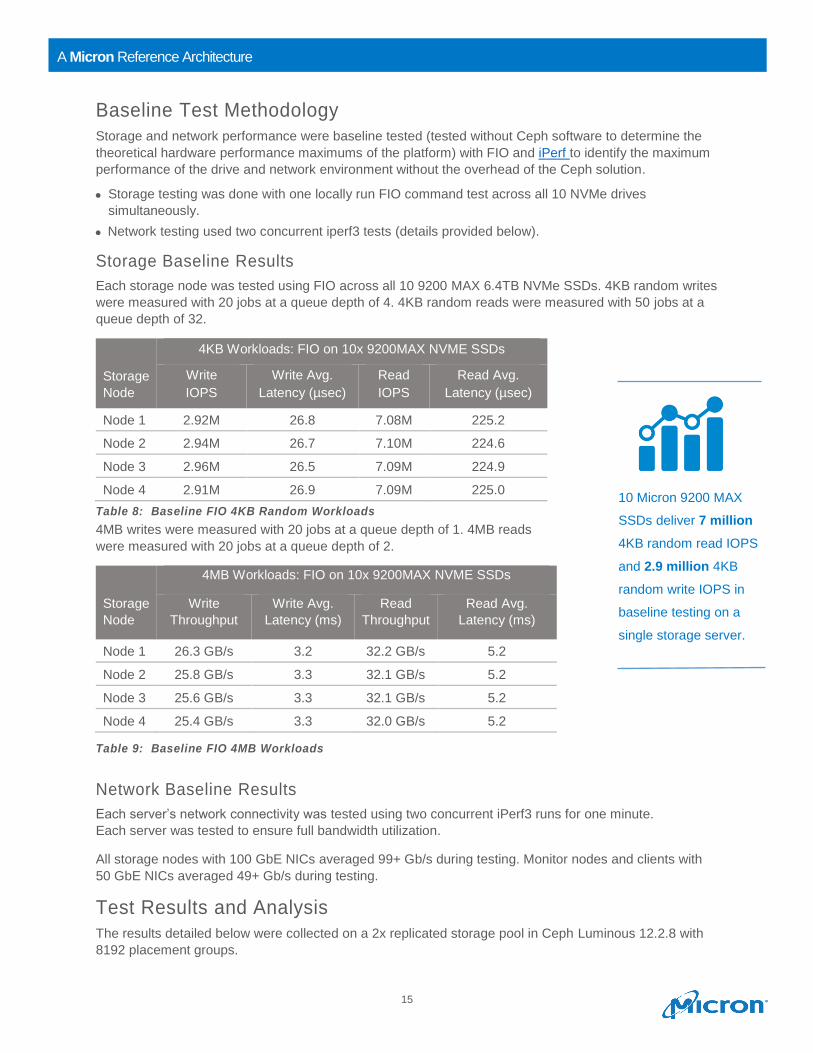
Baseline Test Methodology
Storage and network performance were baseline tested (tested without Ceph software to determine the
theoretical hardware performance maximums of the platform) with FIO and iPerf to identify the maximum
performance of the drive and network environment without the overhead of the Ceph solution.
• Storage testing was done with one locally run FIO command test across all 10 NVMe drives
simultaneously.
• Network testing used two concurrent iperf3 tests (details provided below).
Storage Baseline Results
Each storage node was tested using FIO across all 10 9200 MAX 6.4TB NVMe SSDs. 4KB random writes
were measured with 20 jobs at a queue depth of 4. 4KB random reads were measured with 50 jobs at a
queue depth of 32.
Storage
Node
4KB Workloads: FIO on 10x 9200MAX NVME SSDs
Write
IOPS
Write Avg.
Latency (µsec)
Read
IOPS
Read Avg.
Latency (µsec)
Node 1 2.92M 26.8 7.08M 225.2
Node 2 2.94M 26.7 7.10M 224.6
Node 3 2.96M 26.5 7.09M 224.9
Node 4 2.91M 26.9 7.09M 225.0
Table 8: Baseline FIO 4KB Random Workloads
4MB writes were measured with 20 jobs at a queue depth of 1. 4MB reads
were measured with 20 jobs at a queue depth of 2.
Storage
Node
4MB Workloads: FIO on 10x 9200MAX NVME SSDs
Write
Throughput
Write Avg.
Latency (ms)
Read
Throughput
Read Avg.
Latency (ms)
Node 1 26.3 GB/s 3.2 32.2 GB/s 5.2
Node 2 25.8 GB/s 3.3 32.1 GB/s 5.2
Node 3 25.6 GB/s 3.3 32.1 GB/s 5.2
Node 4 25.4 GB/s 3.3 32.0 GB/s 5.2
Table 9: Baseline FIO 4MB Workloads
Network Baseline Results
Each server’s network connectivity was tested using two concurrent iPerf3 runs for one minute.
Each server was tested to ensure full bandwidth utilization.
All storage nodes with 100 GbE NICs averaged 99+ Gb/s during testing. Monitor nodes and clients with
50 GbE NICs averaged 49+ Gb/s during testing.
Test Results and Analysis
The results detailed below were collected on a 2x replicated storage pool in Ceph Luminous 12.2.8 with
8192 placement groups.
10 Micron 9200 MAX
SSDs deliver 7 million
4KB random read IOPS
and 2.9 million 4KB
random write IOPS in
baseline testing on a
single storage server.
16
A Micron Reference Architecture
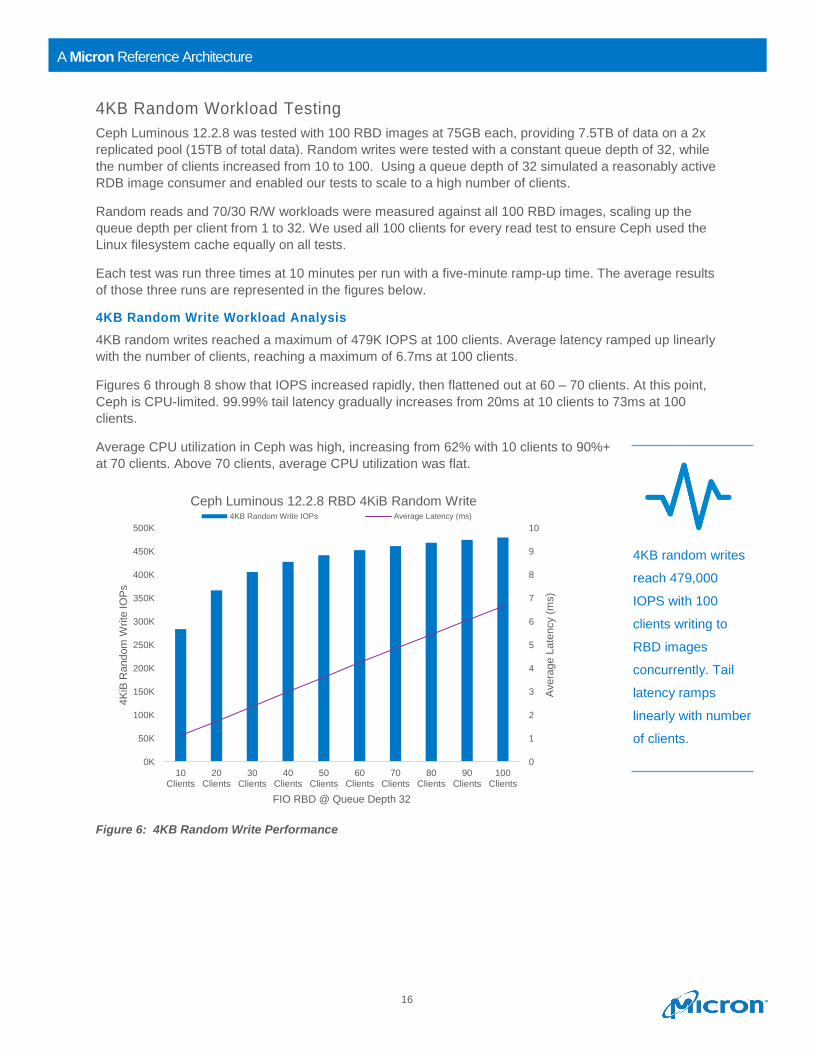
4KB Random Workload Testing
Ceph Luminous 12.2.8 was tested with 100 RBD images at 75GB each, providing 7.5TB of data on a 2x
replicated pool (15TB of total data). Random writes were tested with a constant queue depth of 32, while
the number of clients increased from 10 to 100. Using a queue depth of 32 simulated a reasonably active
RDB image consumer and enabled our tests to scale to a high number of clients.
Random reads and 70/30 R/W workloads were measured against all 100 RBD images, scaling up the
queue depth per client from 1 to 32. We used all 100 clients for every read test to ensure Ceph used the
Linux filesystem cache equally on all tests.
Each test was run three times at 10 minutes per run with a five-minute ramp-up time. The average results
of those three runs are represented in the figures below.
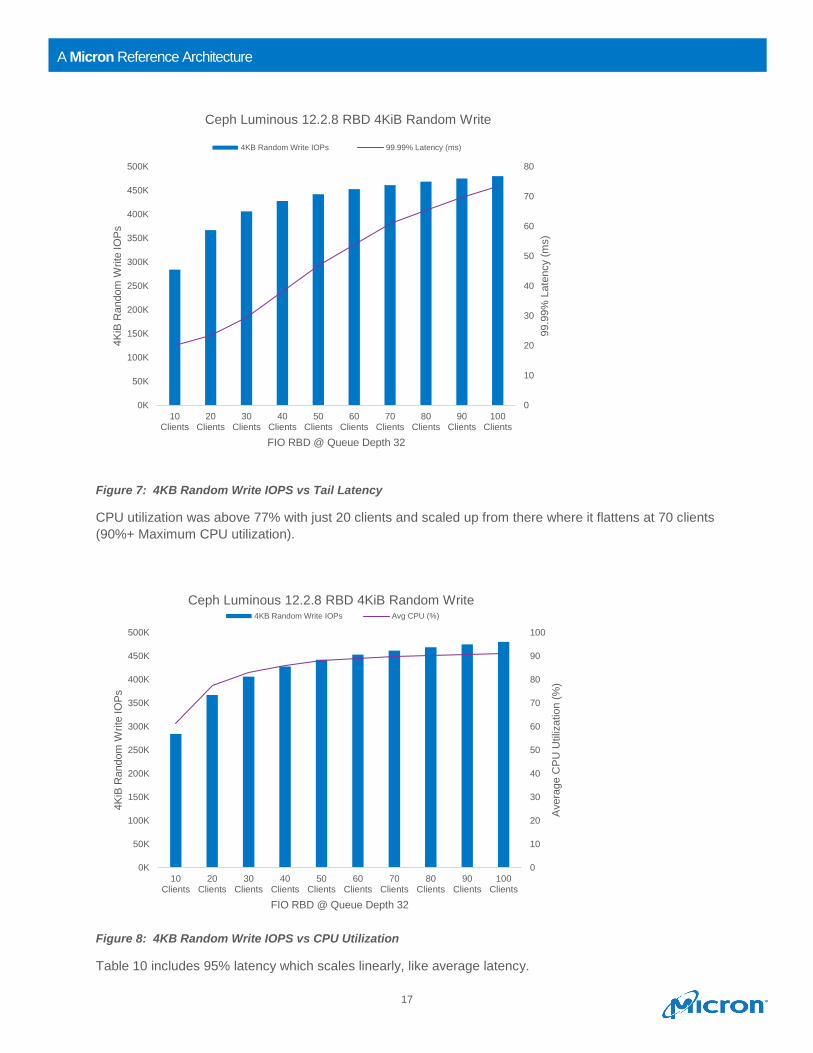
4KB Random Write Workload Analysis
4KB random writes reached a maximum of 479K IOPS at 100 clients. Average latency ramped up linearly
with the number of clients, reaching a maximum of 6.7ms at 100 clients.
Figures 6 through 8 show that IOPS increased rapidly, then flattened out at 60 – 70 clients. At this point,
Ceph is CPU-limited. 99.99% tail latency gradually increases from 20ms at 10 clients to 73ms at 100
clients.
Average CPU utilization in Ceph was high, increasing from 62% with 10 clients to 90%+
at 70 clients. Above 70 clients, average CPU utilization was flat.
Figure 6: 4KB Random Write Performance
0
1
2
3
4
5
6
7
8
9
10
0K
50K
100K
150K
200K
250K
300K
350K
400K
450K
500K
10Clients
20Clients
30Clients
40Clients
50Clients
60Clients
70Clients
80Clients
90Clients
100Clients
Avera
ge L
ate
ncy (
ms)
4K
iB R
andom
Write
IO
Ps
FIO RBD @ Queue Depth 32
Ceph Luminous 12.2.8 RBD 4KiB Random Write4KB Random Write IOPs Average Latency (ms)
4KB random writes
reach 479,000
IOPS with 100
clients writing to
RBD images
concurrently. Tail
latency ramps
linearly with number
of clients.
17
A Micron Reference Architecture
Figure 7: 4KB Random Write IOPS vs Tail Latency
CPU utilization was above 77% with just 20 clients and scaled up from there where it flattens at 70 clients
(90%+ Maximum CPU utilization).
Figure 8: 4KB Random Write IOPS vs CPU Utilization
Table 10 includes 95% latency which scales linearly, like average latency.
0
10
20
30
40
50
60
70
80
0K
50K
100K
150K
200K
250K
300K
350K
400K
450K
500K
10Clients
20Clients
30Clients
40Clients
50Clients
60Clients
70Clients
80Clients
90Clients
100Clients
99.9
9%
Late
ncy (
ms)
4K
iB R
andom
Write
IO
Ps
FIO RBD @ Queue Depth 32
Ceph Luminous 12.2.8 RBD 4KiB Random Write
4KB Random Write IOPs 99.99% Latency (ms)
0
10
20
30
40
50
60
70
80
90
100
0K
50K
100K
150K
200K
250K
300K
350K
400K
450K
500K
10Clients
20Clients
30Clients
40Clients
50Clients
60Clients
70Clients
80Clients
90Clients
100Clients
Avera
ge C
PU
Utiliz
atio
n (
%)
4K
iB R
andom
Write
IO
Ps
FIO RBD @ Queue Depth 32
Ceph Luminous 12.2.8 RBD 4KiB Random Write4KB Random Write IOPs Avg CPU (%)
18
A Micron Reference Architecture
Table 10: 4KB Random Write Results
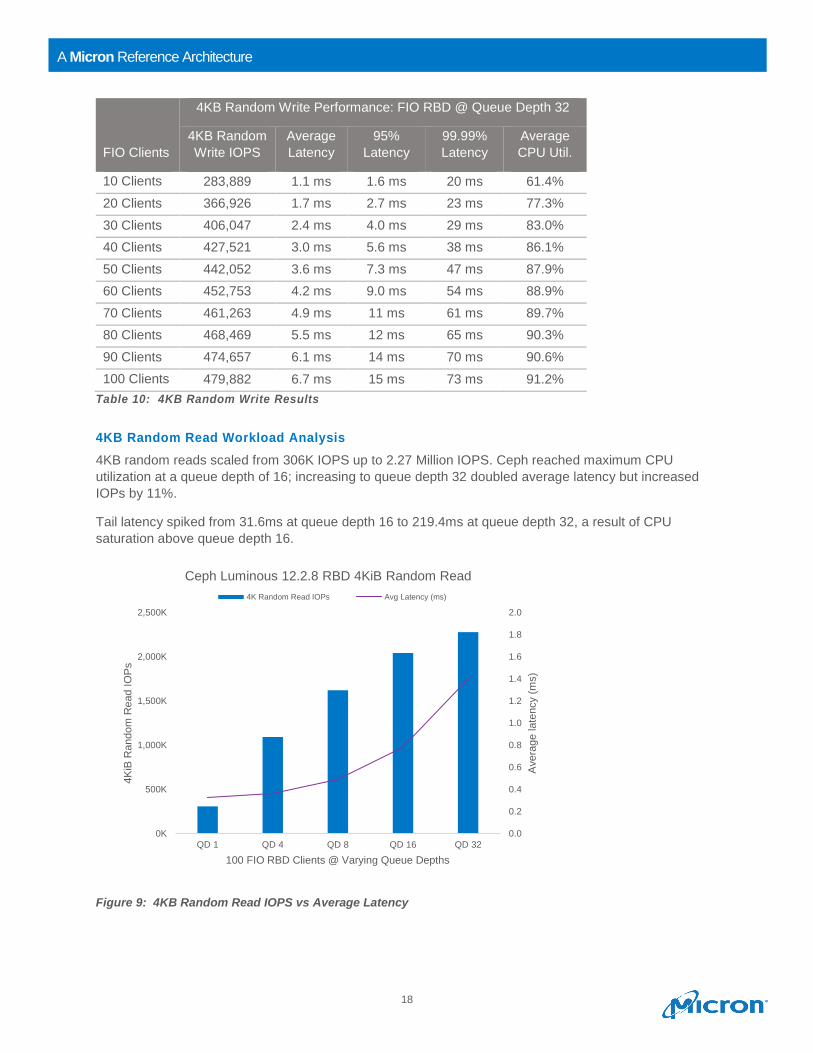
4KB Random Read Workload Analysis
4KB random reads scaled from 306K IOPS up to 2.27 Million IOPS. Ceph reached maximum CPU
utilization at a queue depth of 16; increasing to queue depth 32 doubled average latency but increased
IOPs by 11%.
Tail latency spiked from 31.6ms at queue depth 16 to 219.4ms at queue depth 32, a result of CPU
saturation above queue depth 16.
Figure 9: 4KB Random Read IOPS vs Average Latency
0.0
0.2
0.4
0.6
0.8
1.0
1.2
1.4
1.6
1.8
2.0
0K
500K
1,000K
1,500K
2,000K
2,500K
QD 1 QD 4 QD 8 QD 16 QD 32
Avera
ge la
tency (
ms)
4K
iB R
andom
Read I
OP
s
100 FIO RBD Clients @ Varying Queue Depths
Ceph Luminous 12.2.8 RBD 4KiB Random Read
4K Random Read IOPs Avg Latency (ms)
FIO Clients
4KB Random Write Performance: FIO RBD @ Queue Depth 32
4KB Random
Write IOPS
Average
Latency
95%
Latency
99.99%
Latency
Average
CPU Util.
10 Clients 283,889 1.1 ms 1.6 ms 20 ms 61.4%
20 Clients 366,926 1.7 ms 2.7 ms 23 ms 77.3%
30 Clients 406,047 2.4 ms 4.0 ms 29 ms 83.0%
40 Clients 427,521 3.0 ms 5.6 ms 38 ms 86.1%
50 Clients 442,052 3.6 ms 7.3 ms 47 ms 87.9%
60 Clients 452,753 4.2 ms 9.0 ms 54 ms 88.9%
70 Clients 461,263 4.9 ms 11 ms 61 ms 89.7%
80 Clients 468,469 5.5 ms 12 ms 65 ms 90.3%
90 Clients 474,657 6.1 ms 14 ms 70 ms 90.6%
100 Clients 479,882 6.7 ms 15 ms 73 ms 91.2%
19
A Micron Reference Architecture
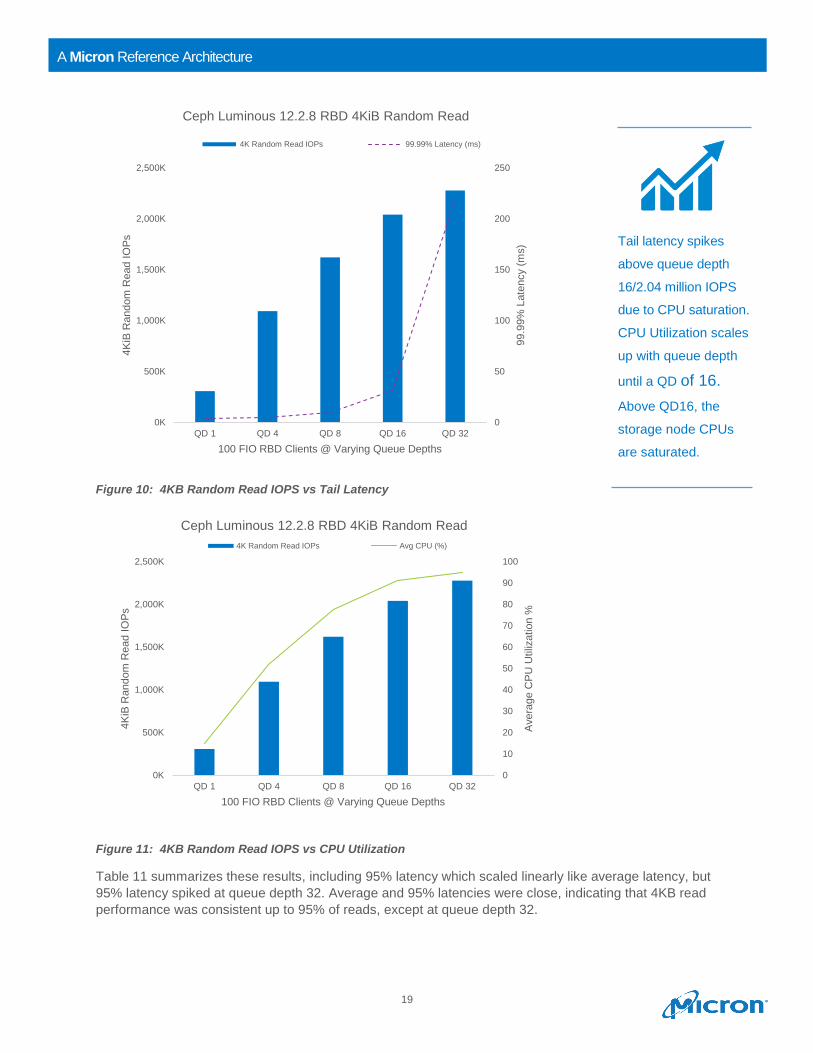
Figure 10: 4KB Random Read IOPS vs Tail Latency
Figure 11: 4KB Random Read IOPS vs CPU Utilization
Table 11 summarizes these results, including 95% latency which scaled linearly like average latency, but
95% latency spiked at queue depth 32. Average and 95% latencies were close, indicating that 4KB read
performance was consistent up to 95% of reads, except at queue depth 32.
0
50
100
150
200
250
0K
500K
1,000K
1,500K
2,000K
2,500K
QD 1 QD 4 QD 8 QD 16 QD 32
99.9
9%
Late
ncy (
ms)
4K
iB R
andom
Read I
OP
s
100 FIO RBD Clients @ Varying Queue Depths
Ceph Luminous 12.2.8 RBD 4KiB Random Read
4K Random Read IOPs 99.99% Latency (ms)
0
10
20
30
40
50
60
70
80
90
100
0K
500K
1,000K
1,500K
2,000K
2,500K
QD 1 QD 4 QD 8 QD 16 QD 32
Avera
ge C
PU
Utiliz
atio
n %
4K
iB R
andom
Read I
OP
s
100 FIO RBD Clients @ Varying Queue Depths
Ceph Luminous 12.2.8 RBD 4KiB Random Read
4K Random Read IOPs Avg CPU (%)
Tail latency spikes
above queue depth
16/2.04 million IOPS
due to CPU saturation.
CPU Utilization scales
up with queue depth
until a QD of 16.
Above QD16, the
storage node CPUs
are saturated.
20
A Micron Reference Architecture
Random Read Results Summary
Queue
Depth
4KB Random Read Performance: 100 FIO RBD Clients at Varied QD
4KB Random
Read IOPS
Average
Latency
95%
Latency
99.99%
Latency
Average
CPU Util
QD 1 306,069 0.32 ms 0.39 ms 3.4 ms 14.9%
QD 4 1,092,264 0.36 ms 0.47 ms 4.7 ms 51.8%
QD 8 1,620,402 0.49 ms 0.72 ms 9.9 ms 77.7%
QD 16 2,040,419 0.78 ms 1.6 ms 32 ms 90.9%
QD 32 2,277,453 1.4 ms 4.2 ms 219 ms 95.1%
Table 11: 4KB Random Read Results
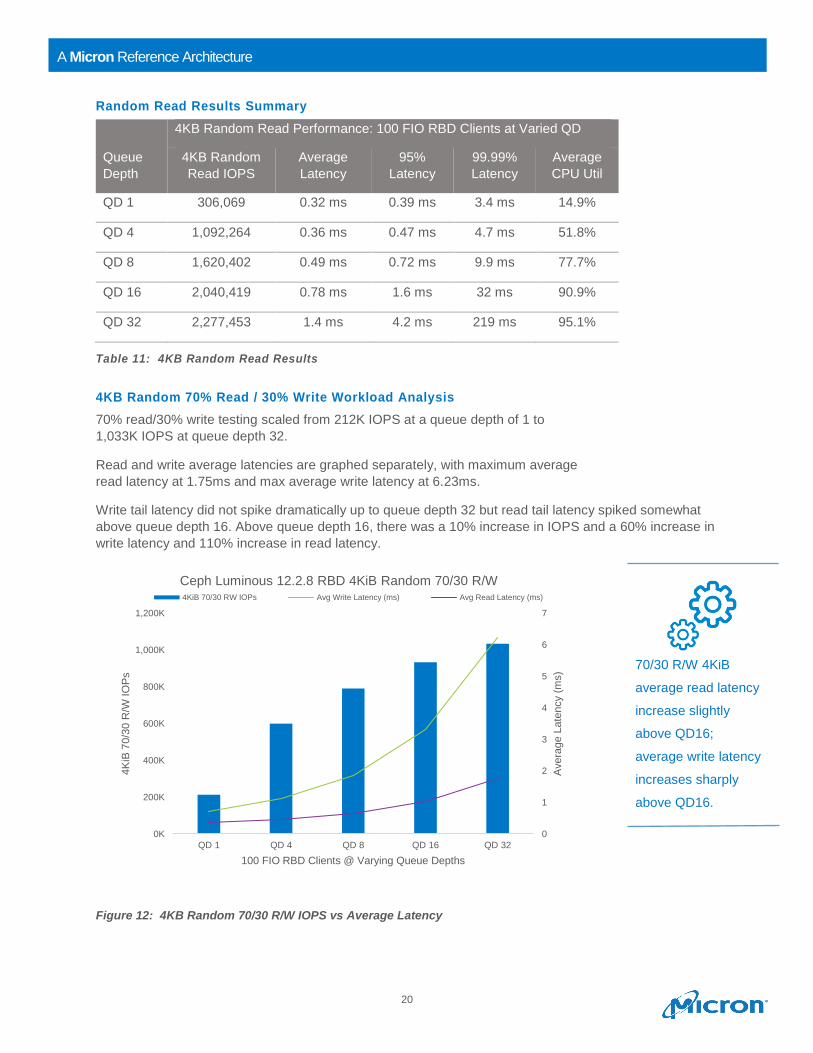
4KB Random 70% Read / 30% Write Workload Analysis
70% read/30% write testing scaled from 212K IOPS at a queue depth of 1 to
1,033K IOPS at queue depth 32.
Read and write average latencies are graphed separately, with maximum average
read latency at 1.75ms and max average write latency at 6.23ms.
Write tail latency did not spike dramatically up to queue depth 32 but read tail latency spiked somewhat
above queue depth 16. Above queue depth 16, there was a 10% increase in IOPS and a 60% increase in
write latency and 110% increase in read latency.
Figure 12: 4KB Random 70/30 R/W IOPS vs Average Latency
0
1
2
3
4
5
6
7
0K
200K
400K
600K
800K
1,000K
1,200K
QD 1 QD 4 QD 8 QD 16 QD 32
Avera
ge L
ate
ncy (
ms)
4K
iB 7
0/3
0 R
/W IO
Ps
100 FIO RBD Clients @ Varying Queue Depths
Ceph Luminous 12.2.8 RBD 4KiB Random 70/30 R/W4KiB 70/30 RW IOPs Avg Write Latency (ms) Avg Read Latency (ms)
70/30 R/W 4KiB
average read latency
increase slightly
above QD16;
average write latency
increases sharply
above QD16.
21
A Micron Reference Architecture
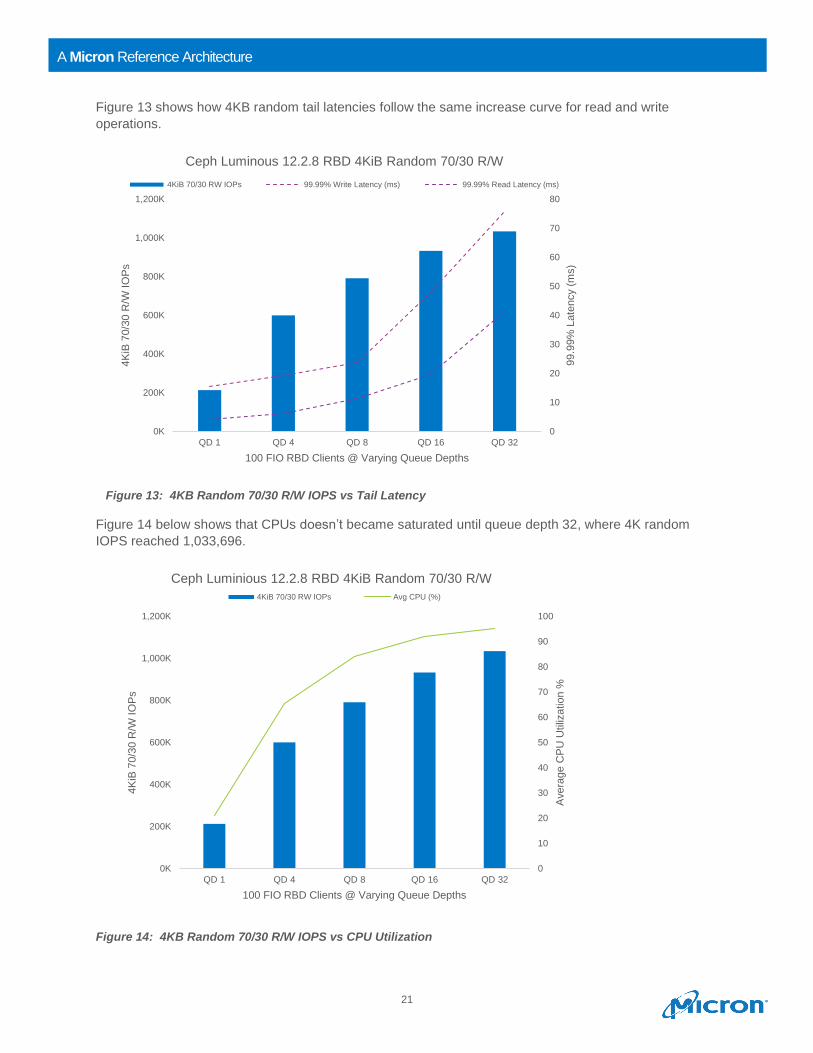
Figure 13 shows how 4KB random tail latencies follow the same increase curve for read and write
operations.
Figure 14 below shows that CPUs doesn’t became saturated until queue depth 32, where 4K random
IOPS reached 1,033,696.
Figure 14: 4KB Random 70/30 R/W IOPS vs CPU Utilization
0
10
20
30
40
50
60
70
80
0K
200K
400K
600K
800K
1,000K
1,200K
QD 1 QD 4 QD 8 QD 16 QD 32
99.9
9%
Late
ncy (
ms)
4K
iB 7
0/3
0 R
/W IO
Ps
100 FIO RBD Clients @ Varying Queue Depths
Ceph Luminous 12.2.8 RBD 4KiB Random 70/30 R/W
4KiB 70/30 RW IOPs 99.99% Write Latency (ms) 99.99% Read Latency (ms)
0
10
20
30
40
50
60
70
80
90
100
0K
200K
400K
600K
800K
1,000K
1,200K
QD 1 QD 4 QD 8 QD 16 QD 32
Avera
ge C
PU
Utiliz
atio
n %
4K
iB 7
0/3
0 R
/W IO
Ps
100 FIO RBD Clients @ Varying Queue Depths
Ceph Luminious 12.2.8 RBD 4KiB Random 70/30 R/W
4KiB 70/30 RW IOPs Avg CPU (%)
Figure 13: 4KB Random 70/30 R/W IOPS vs Tail Latency
22
A Micron Reference Architecture
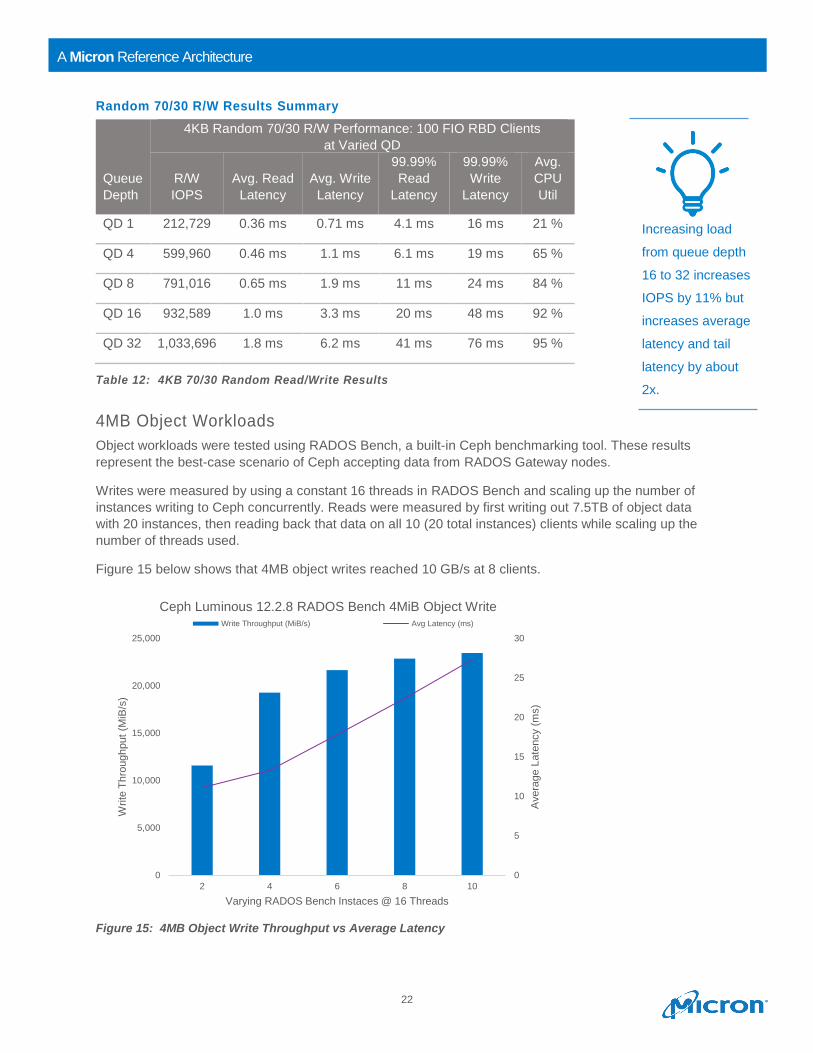
Random 70/30 R/W Results Summary
Queue
Depth
4KB Random 70/30 R/W Performance: 100 FIO RBD Clients
at Varied QD
R/W
IOPS
Avg. Read
Latency
Avg. Write
Latency
99.99%
Read
Latency
99.99%
Write
Latency
Avg.
CPU
Util
QD 1 212,729 0.36 ms 0.71 ms 4.1 ms 16 ms 21 %
QD 4 599,960 0.46 ms 1.1 ms 6.1 ms 19 ms 65 %
QD 8 791,016 0.65 ms 1.9 ms 11 ms 24 ms 84 %
QD 16 932,589 1.0 ms 3.3 ms 20 ms 48 ms 92 %
QD 32 1,033,696 1.8 ms 6.2 ms 41 ms 76 ms 95 %
Table 12: 4KB 70/30 Random Read/Write Results
4MB Object Workloads
Object workloads were tested using RADOS Bench, a built-in Ceph benchmarking tool. These results
represent the best-case scenario of Ceph accepting data from RADOS Gateway nodes.
Writes were measured by using a constant 16 threads in RADOS Bench and scaling up the number of
instances writing to Ceph concurrently. Reads were measured by first writing out 7.5TB of object data
with 20 instances, then reading back that data on all 10 (20 total instances) clients while scaling up the
number of threads used.
Figure 15 below shows that 4MB object writes reached 10 GB/s at 8 clients.
Figure 15: 4MB Object Write Throughput vs Average Latency
0
5
10
15
20
25
30
0
5,000
10,000
15,000
20,000
25,000
2 4 6 8 10
Avera
ge L
ate
ncy (
ms)
Write
Th
roughput
(MiB
/s)
Varying RADOS Bench Instaces @ 16 Threads
Ceph Luminous 12.2.8 RADOS Bench 4MiB Object WriteWrite Throughput (MiB/s) Avg Latency (ms)
Increasing load
from queue depth
16 to 32 increases
IOPS by 11% but
increases average
latency and tail
latency by about
2x.
23
A Micron Reference Architecture
4MB Object writes reached their maximum value of 22.9 GiB/s and 27.3ms average latency with 10
clients. CPU utilization was low for this test and never reached above 20% average CPU%.
4MB Object Write Results Summary
Instances @
16 Threads
4MB Object Write Performance: RADOS Bench
Write Throughput Average Latency
2 Instances 11.3 GiB/s 11.1 ms
4 Instances 18.8 GiB/s 13.3 ms
6 Instances 21.1 GiB/s 17.8 ms
8 Instances 22.3 GiB/s 22.4 ms
10 Instances 22.9 GiB/s 27.3 ms
Table 13: 4MB Object Write Results
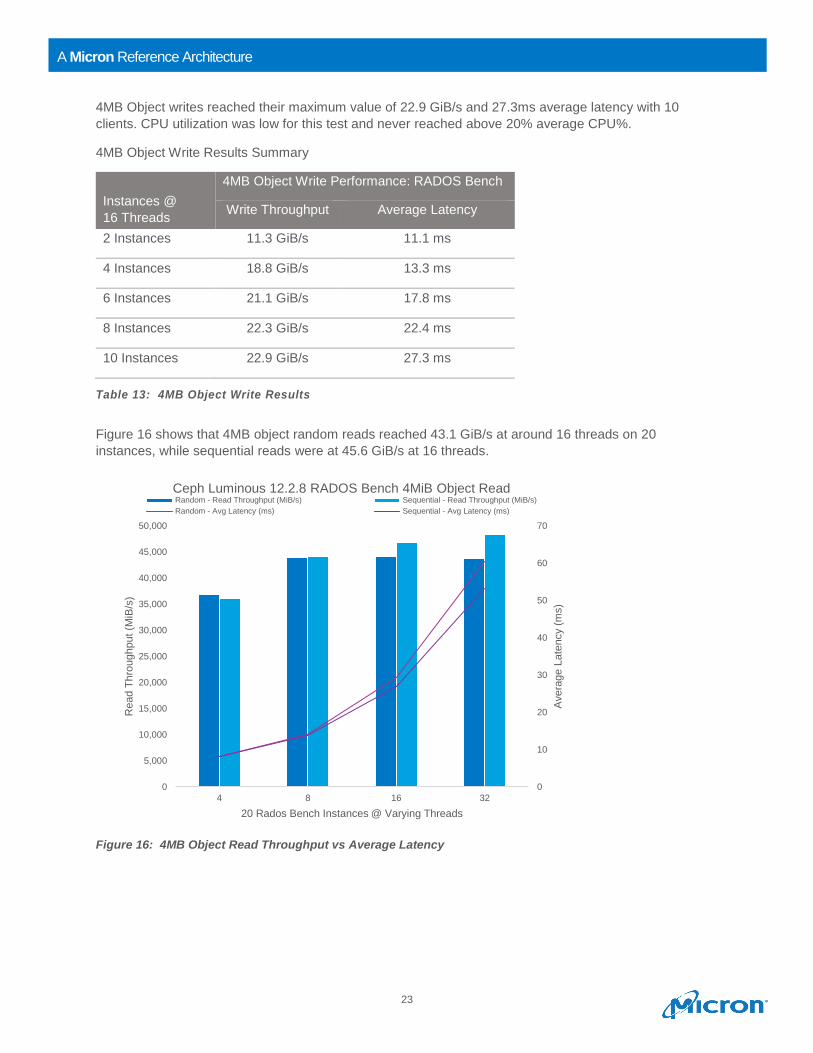
Figure 16 shows that 4MB object random reads reached 43.1 GiB/s at around 16 threads on 20
instances, while sequential reads were at 45.6 GiB/s at 16 threads.
Figure 16: 4MB Object Read Throughput vs Average Latency
0
10
20
30
40
50
60
70
0
5,000
10,000
15,000
20,000
25,000
30,000
35,000
40,000
45,000
50,000
4 8 16 32
Avera
ge L
ate
ncy (
ms)
Read T
hro
ughput (M
iB/s
)
20 Rados Bench Instances @ Varying Threads
Ceph Luminous 12.2.8 RADOS Bench 4MiB Object ReadRandom - Read Throughput (MiB/s) Sequential - Read Throughput (MiB/s)
Random - Avg Latency (ms) Sequential - Avg Latency (ms)
24
A Micron Reference Architecture
4MB object reads reached their maximum of 47.2 GiB/s and 53.3ms average latency at 32 clients.
CPU utilization was low for this test and never reached above 15% average CPU%.
Table 14: 4MB Object Read Results
Summary
With 2.2+ million 4KB random reads in four rack units with 256TB total storage, this RA is designed for
massive amounts of small block random workloads, and is the most performant Ceph architecture we’ve
tested. With 479K random writes in 4U, it also has the highest random write performance we’ve measured
with Ceph Storage to date.
20 Instances @
Varied Threads
4MB Object Read Performance: RADOS Bench
Random
Read
Throughput
Random Read
Average
Latency
Sequential
Read
Throughput
Sequential
Read Average
Latency
4 Threads 36 GiB/s 8.04 ms 35.2 GiB/s 8.22 ms
8 Threads 42.9 GiB/s 13.9 ms 43.0 GiB/s 13.9 ms
16 Threads 43.1 GiB/s 29.2 ms 45.6 GiB/s 26.9 ms
32 Threads 42.7 GiB/s 60.5 ms 47.2 GiB/s 53.3 ms
25
A Micron Reference Architecture
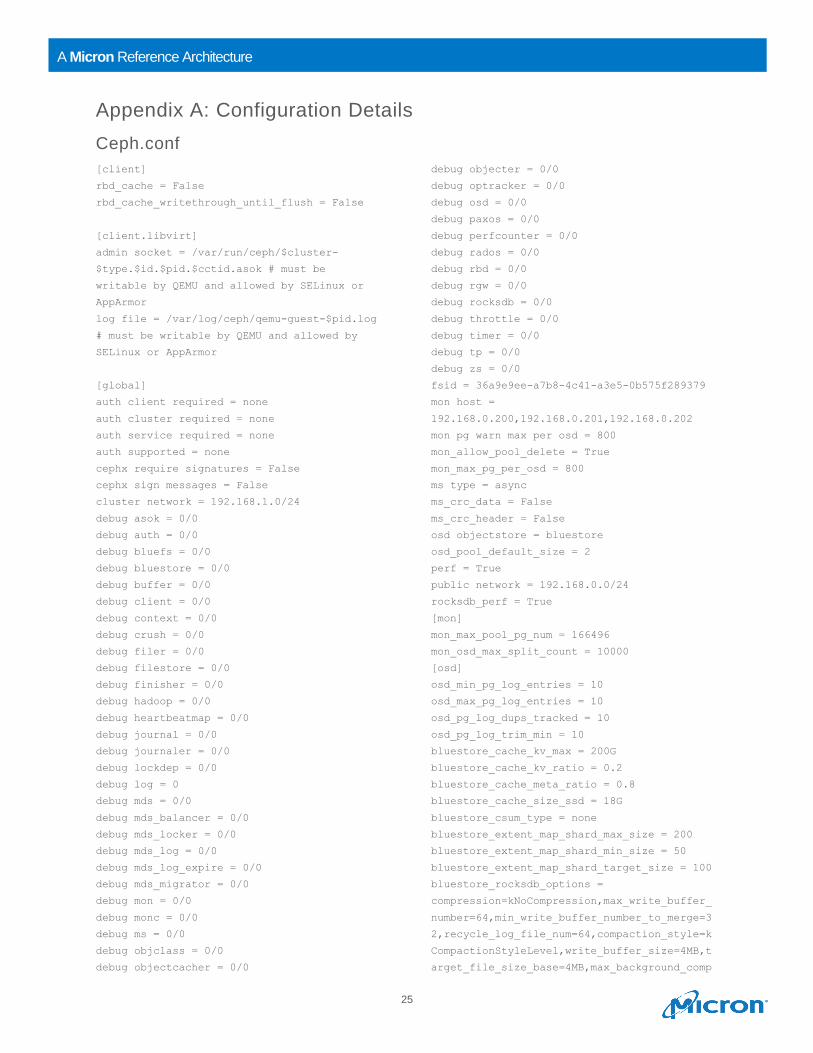
Appendix A: Configuration Details
Ceph.conf
[client]
rbd_cache = False
rbd_cache_writethrough_until_flush = False
[client.libvirt]
admin socket = /var/run/ceph/$cluster-
$type.$id.$pid.$cctid.asok # must be
writable by QEMU and allowed by SELinux or
AppArmor
log file = /var/log/ceph/qemu-guest-$pid.log
# must be writable by QEMU and allowed by
SELinux or AppArmor
[global]
auth client required = none
auth cluster required = none
auth service required = none
auth supported = none
cephx require signatures = False
cephx sign messages = False
cluster network = 192.168.1.0/24
debug asok = 0/0
debug auth = 0/0
debug bluefs = 0/0
debug bluestore = 0/0
debug buffer = 0/0
debug client = 0/0
debug context = 0/0
debug crush = 0/0
debug filer = 0/0
debug filestore = 0/0
debug finisher = 0/0
debug hadoop = 0/0
debug heartbeatmap = 0/0
debug journal = 0/0
debug journaler = 0/0
debug lockdep = 0/0
debug log = 0
debug mds = 0/0
debug mds_balancer = 0/0
debug mds_locker = 0/0
debug mds_log = 0/0
debug mds_log_expire = 0/0
debug mds_migrator = 0/0
debug mon = 0/0
debug monc = 0/0
debug ms = 0/0
debug objclass = 0/0
debug objectcacher = 0/0
debug objecter = 0/0
debug optracker = 0/0
debug osd = 0/0
debug paxos = 0/0
debug perfcounter = 0/0
debug rados = 0/0
debug rbd = 0/0
debug rgw = 0/0
debug rocksdb = 0/0
debug throttle = 0/0
debug timer = 0/0
debug tp = 0/0
debug zs = 0/0
fsid = 36a9e9ee-a7b8-4c41-a3e5-0b575f289379
mon host =
192.168.0.200,192.168.0.201,192.168.0.202
mon pg warn max per osd = 800
mon_allow_pool_delete = True
mon_max_pg_per_osd = 800
ms type = async
ms_crc_data = False
ms_crc_header = False
osd objectstore = bluestore
osd_pool_default_size = 2
perf = True
public network = 192.168.0.0/24
rocksdb_perf = True
[mon]
mon_max_pool_pg_num = 166496
mon_osd_max_split_count = 10000
[osd]
osd_min_pg_log_entries = 10
osd_max_pg_log_entries = 10
osd_pg_log_dups_tracked = 10
osd_pg_log_trim_min = 10
bluestore_cache_kv_max = 200G
bluestore_cache_kv_ratio = 0.2
bluestore_cache_meta_ratio = 0.8
bluestore_cache_size_ssd = 18G
bluestore_csum_type = none
bluestore_extent_map_shard_max_size = 200
bluestore_extent_map_shard_min_size = 50
bluestore_extent_map_shard_target_size = 100
bluestore_rocksdb_options =
compression=kNoCompression,max_write_buffer_
number=64,min_write_buffer_number_to_merge=3
2,recycle_log_file_num=64,compaction_style=k
CompactionStyleLevel,write_buffer_size=4MB,t
arget_file_size_base=4MB,max_background_comp
26
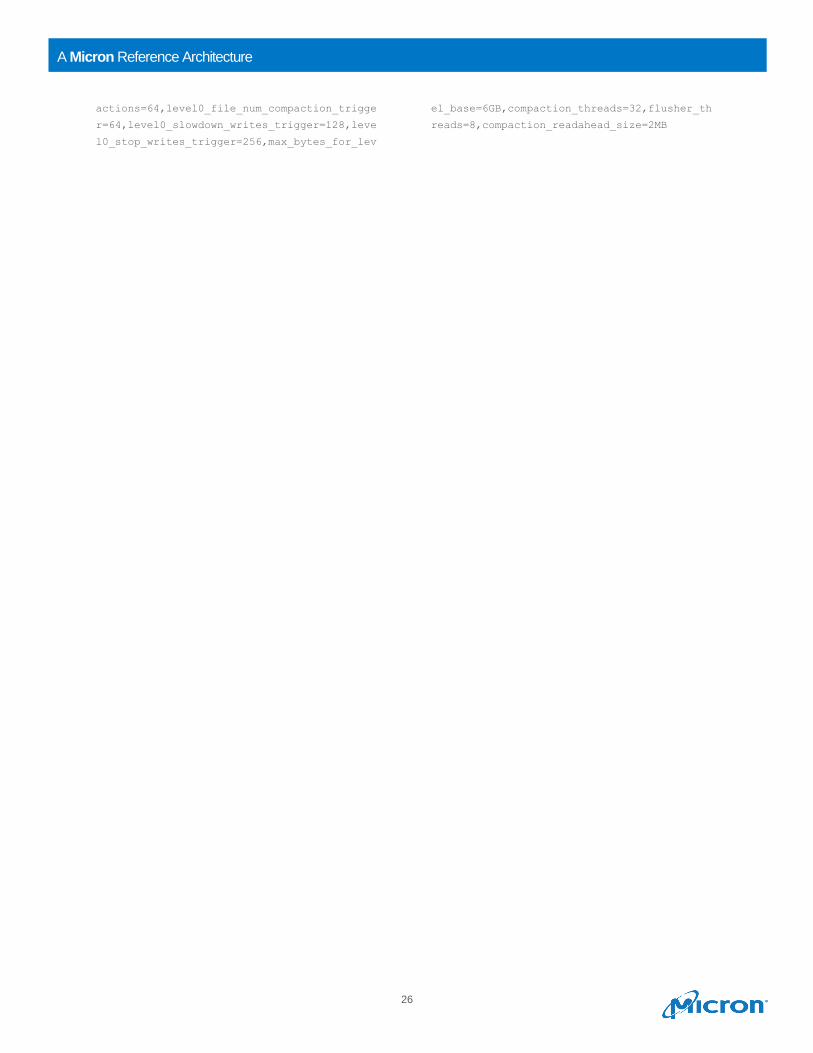
A Micron Reference Architecture
actions=64,level0_file_num_compaction_trigge
r=64,level0_slowdown_writes_trigger=128,leve
l0_stop_writes_trigger=256,max_bytes_for_lev
el_base=6GB,compaction_threads=32,flusher_th
reads=8,compaction_readahead_size=2MB
27
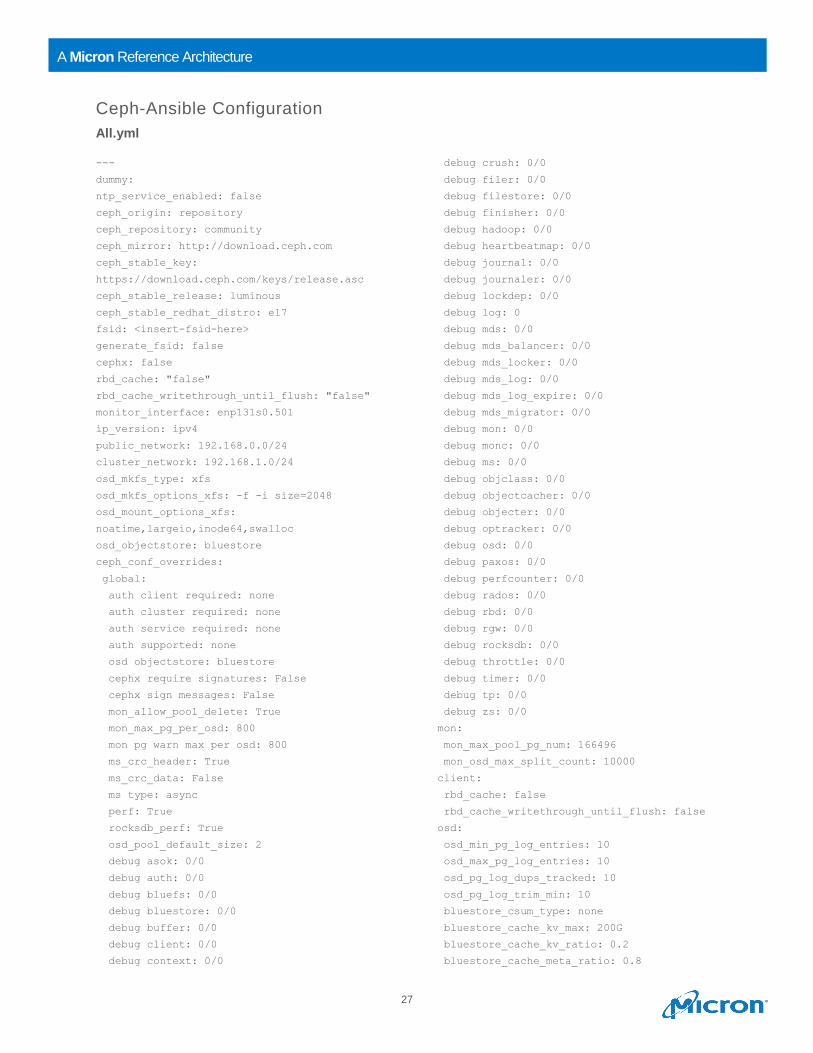
A Micron Reference Architecture
Ceph-Ansible Configuration
All.yml
---
dummy:
ntp_service_enabled: false
ceph_origin: repository
ceph_repository: community
ceph_mirror: http://download.ceph.com
ceph_stable_key:
https://download.ceph.com/keys/release.asc
ceph_stable_release: luminous
ceph_stable_redhat_distro: el7
fsid: <insert-fsid-here>
generate_fsid: false
cephx: false
rbd_cache: "false"
rbd_cache_writethrough_until_flush: "false"
monitor_interface: enp131s0.501
ip_version: ipv4
public_network: 192.168.0.0/24
cluster_network: 192.168.1.0/24
osd_mkfs_type: xfs
osd_mkfs_options_xfs: -f -i size=2048
osd_mount_options_xfs:
noatime,largeio,inode64,swalloc
osd_objectstore: bluestore
ceph_conf_overrides:
global:
auth client required: none
auth cluster required: none
auth service required: none
auth supported: none
osd objectstore: bluestore
cephx require signatures: False
cephx sign messages: False
mon_allow_pool_delete: True
mon_max_pg_per_osd: 800
mon pg warn max per osd: 800
ms_crc_header: True
ms_crc_data: False
ms type: async
perf: True
rocksdb_perf: True
osd_pool_default_size: 2
debug asok: 0/0
debug auth: 0/0
debug bluefs: 0/0
debug bluestore: 0/0
debug buffer: 0/0
debug client: 0/0
debug context: 0/0
debug crush: 0/0
debug filer: 0/0
debug filestore: 0/0
debug finisher: 0/0
debug hadoop: 0/0
debug heartbeatmap: 0/0
debug journal: 0/0
debug journaler: 0/0
debug lockdep: 0/0
debug log: 0
debug mds: 0/0
debug mds_balancer: 0/0
debug mds_locker: 0/0
debug mds_log: 0/0
debug mds_log_expire: 0/0
debug mds_migrator: 0/0
debug mon: 0/0
debug monc: 0/0
debug ms: 0/0
debug objclass: 0/0
debug objectcacher: 0/0
debug objecter: 0/0
debug optracker: 0/0
debug osd: 0/0
debug paxos: 0/0
debug perfcounter: 0/0
debug rados: 0/0
debug rbd: 0/0
debug rgw: 0/0
debug rocksdb: 0/0
debug throttle: 0/0
debug timer: 0/0
debug tp: 0/0
debug zs: 0/0
mon:
mon_max_pool_pg_num: 166496
mon_osd_max_split_count: 10000
client:
rbd_cache: false
rbd_cache_writethrough_until_flush: false
osd:
osd_min_pg_log_entries: 10
osd_max_pg_log_entries: 10
osd_pg_log_dups_tracked: 10
osd_pg_log_trim_min: 10
bluestore_csum_type: none
bluestore_cache_kv_max: 200G
bluestore_cache_kv_ratio: 0.2
bluestore_cache_meta_ratio: 0.8

28
A Micron Reference Architecture
bluestore_cache_size_ssd: 18G
bluestore_extent_map_shard_min_size: 50
bluestore_extent_map_shard_max_size: 200
bluestore_extent_map_shard_target_size:
100
disable_transparent_hugepage: true
os_tuning_params:
- { name: kernel.pid_max, value: 4194303 }
- { name: fs.file-max, value: 26234859 }
- { name: vm.zone_reclaim_mode, value: 0 }
- { name: vm.swappiness, value: 1 }
- { name: vm.min_free_kbytes, value:
1000000 }
- { name: net.core.rmem_max, value:
268435456 }
- { name: net.core.wmem_max, value:
268435456 }
- { name: net.ipv4.tcp_rmem, value: 4096
87380 134217728 }
- { name: net.ipv4.tcp_wmem, value: 4096
65536 134217728 }
ceph_tcmalloc_max_total_thread_cache:
134217728
29
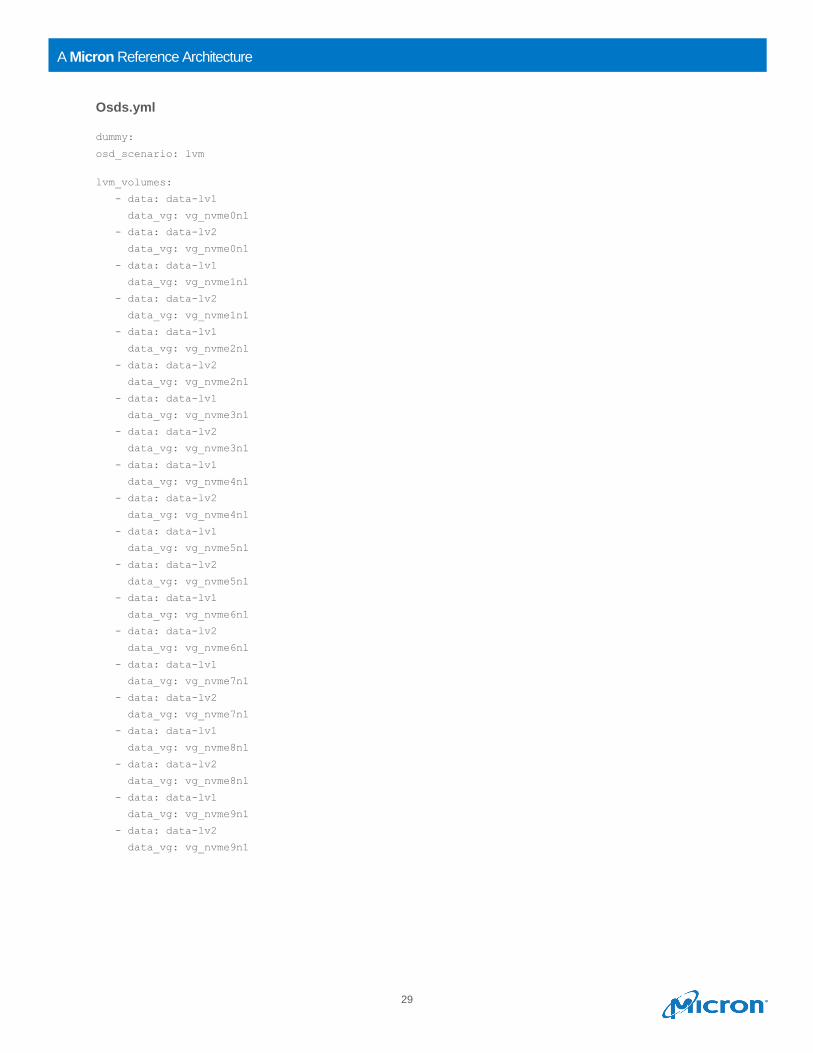
A Micron Reference Architecture
Osds.yml
dummy:
osd_scenario: lvm
lvm_volumes:
- data: data-lv1
data_vg: vg_nvme0n1
- data: data-lv2
data_vg: vg_nvme0n1
- data: data-lv1
data_vg: vg_nvme1n1
- data: data-lv2
data_vg: vg_nvme1n1
- data: data-lv1
data_vg: vg_nvme2n1
- data: data-lv2
data_vg: vg_nvme2n1
- data: data-lv1
data_vg: vg_nvme3n1
- data: data-lv2
data_vg: vg_nvme3n1
- data: data-lv1
data_vg: vg_nvme4n1
- data: data-lv2
data_vg: vg_nvme4n1
- data: data-lv1
data_vg: vg_nvme5n1
- data: data-lv2
data_vg: vg_nvme5n1
- data: data-lv1
data_vg: vg_nvme6n1
- data: data-lv2
data_vg: vg_nvme6n1
- data: data-lv1
data_vg: vg_nvme7n1
- data: data-lv2
data_vg: vg_nvme7n1
- data: data-lv1
data_vg: vg_nvme8n1
- data: data-lv2
data_vg: vg_nvme8n1
- data: data-lv1
data_vg: vg_nvme9n1
- data: data-lv2
data_vg: vg_nvme9n1
30
A Micron Reference Architecture
Deploying 2 OSDs per Drive
2_osd_lvm_partition.sh
Run this script on the storage nodes to create two lvm volumes per device:
2_osd_lvm_partiton.sh 2 <# devices>
#!/bin/bash
if [ -z "$2" ] ; then
echo 'usage: lvm-partition.sh osds-per-device devices-per-host'
exit 1
fi
osds_per_dev=$1
devs_per_host=$2
# remove old LVM volumes
for n in /dev/vg_nvm*/data-lv* /dev/vg_nvm*/journal-lv* ; do
lvremove -y $n
done
for k in `seq 1 $devs_per_host` ; do
(( devnum = $k - 1 ))
vgremove -y vg_nvme${devnum}n1
pvremove -y /dev/nvme${devnum}n1
wipefs -a /dev/nvme${devnum}n1
done
lvscan | grep nvm
if [ $? = 0 ] ; then
echo 'could not clean up old LVM volumes'
exit 1
fi
# Create GPT on devices
for k in `seq 1 $devs_per_host` ; do
(( devnum = $k - 1 ))
sudo sgdisk -Z /dev/nvme${devnum}n1
done
# now create new LVM volumes
for d in `seq 1 $devs_per_host` ; do
((devnum = $d - 1))
devname="nvme${devnum}n1"
pvcreate /dev/$devname
vgcreate vg_$devname /dev/$devname
totalPE=`vgdisplay vg_$devname | awk '/Total PE/{print $NF}'`
PEsize=`vgdisplay vg_$devname | awk '/PE Size/{ print $3}' | cut -f1 -d'.'`
(( totalGB = $totalPE * $PEsize / 1024 ))
(( sz_per_osd = $totalGB / $osds_per_dev ))
for v in `seq 1 $osds_per_dev` ; do
lvcreate --name data-lv$v --size ${sz_per_osd}G vg_$devname
done
done
31
A Micron Reference Architecture
Drive Readahead Settings
For 4KB random tests, the following was run on the storage nodes to set readahead to 0:
for i in {0..9};do sudo echo 0 > /sys/block/nvme${i}n1/queue/read_ahead_kb;done
For 4MB object tests, the following was run on the storage nodes to set readahead to 128:
for i in {0..9};do sudo echo 128 > /sys/block/nvme${i}n1/queue/read_ahead_kb;done
Spectre/Meltdown Patch Settings
Due to the potential performance impact and changing release status of Spectre/Meltdown updates, the
variant #2 (Spectre) and variant #3 (Meltdown) patches were disabled (see the instructions in this article
https://access.redhat.com/articles/3311301).
echo 0 > /sys/kernel/debug/x86/pti_enabled
echo 0 > /sys/kernel/debug/x86/ibrs_enabled
echo 0 > /sys/kernel/debug/x86/retp_enabled
About Micron
We are an industry leader in innovative memory and storage solutions. Through our global brands —
Micron®, Crucial® and Ballistix® — our broad portfolio of high-performance memory and storage
technologies, including DRAM, NAND, NOR Flash and 3D XPoint™ memory, is transforming how the
world uses information to enrich life. Backed by 40 years of technology leadership, our memory and
storage solutions enable disruptive trends, including artificial intelligence, machine learning, and
autonomous vehicles, in key market segments like cloud, data center, networking, mobile and
automotive. Our common stock is traded on the NASDAQ under the MU symbol. To learn more about
Micron Technology, Inc., visit www.micron.com.
Why Community Edition?
Ceph Luminous 12.2.8 was chosen for this testing because, according to the Ceph User Survey 2018,
over 80% of Ceph users are running the community edition.
https://ceph.com/wp-content/uploads/2018/07/Ceph-User-Survey-2018-Slides.pdf
About Ceph Storage
Ceph is a distributed object store and file system designed to provide excellent performance, reliability
and scalability. It can:
• Free you from the expensive lock-in of proprietary, hardware-based storage solutions.
• Consolidate labor and storage costs into one versatile solution.
• Introduce cost-effective scalability on self-healing clusters based on standard servers and disks.
micron.com ©2018 Micron Technology, Inc. All rights reserved. All information herein is provided on as “AS IS” basis without warranties of any kind, including any implied warranties, warranties of merchantability or warranties of fitness for a particular purpose. Micron, the Micron logo, and all other Micron trademarks are the property of Micron Technology, Inc. All other trademarks are the property of their respective owners. No hardware, software or system can provide absolute security and protection of data under all conditions. Micron assumes no liability for lost, stolen or corrupted data arising from the use of any Micron product, including those products that incorporate any of the mentioned security features. Products are warranted only to meet Micron’s production data sheet specifications. Products, programs and specifications are subject to change without notice. Dates are estimates only. All data and statements within this document were developed by Micron with cooperation of the vendors used. All vendors have reviewed the content for accuracy. Rev. D 11/18 CCM004-676576390-11217
Related Documents


![Daemons of Chaos[1]](https://static.cupdf.com/doc/110x72/577c77e31a28abe0548de166/daemons-of-chaos1.jpg)