Micrometeorological modeling to understand the thermal anomaly in the sand dunes across the Israel–Egypt border Zhihao Qin*, Pedro Berlinerw & Arnon Karnieli*z *The Remote Sensing Laboratory, Department of Environmental Physics, J. Blaustein Institute for Desert Research, Ben Gurion University of the Negev, Sede Boker Campus, 84990, Israel wThe Wyler Laboratory for Arid Land Conservation and Development, Department of Dryland Agriculture, J. Blaustein Institute for Desert Research, Ben Gurion University of the Negev, Sede Boker Campus, 84990, Israel (Received 12 April 2000, accepted 23 May 2001) A thermal anomaly was observed on the remote sensing images in the sand dunes across the Israel–Egypt border. The Israeli side with more vegetation cover has higher (421C) land surface temperature (LST) during the day than the Egyptian side where bare sand prevails. This anomaly is very obvious at about noon in the hot dry summer season. A micrometeorological model has been established in terms of surface energy balance for simulating the surface temperature change and heat flux variation of the region. The purpose of this modeling is to understand the mechanism leading to the occurrence of the thermal anomaly and to reveal the key factors controlling the surface temperature change. The characteristic of the model lies in its coupling soil temperature changing simultaneously with soil moisture movement, de- scribed as two differential equations. The methodology for the numerical solution of the model has been developed. The required meteorological data and soil parameters were measured at the study region in the hot summer season for the simulation. Two typical and the most important surface patterns of the region are considered: biogenic crust representing the Israeli side and the bare sand representing the Egyptian side. Results from simulation indicate that surface albedo contributes most to the surface temperature difference between the two typical surfaces, which is followed by sub-soil properties (mainly soil moisture) difference. Biogenic crust has lower surface albedo than bare sand. Consequently, it absorbs much more incident sky radiation. During the hot summer season, the region is very dry and vegetation is in dormancy. The canopy of most shrubs reduces to minimum. Even though the Israeli side has more vegetation, the evapo-transpiration contributed by the vegetation is still very small (o7%) in comparison with the net radiation. This small latent heat flux has little effect on the surface energy balance process in the arid environment. LST change in the desert region is mainly controlled by the amount of incident solar energy absorbed by the ground as soil heat. Therefore, the anomalous LST change and z Correspondence to: E-mail: [email protected] 0140-1963/02/020281 + 38 $35.00/0 # 2002 Elsevier Science Ltd. Journal of Arid Environments (2002) 51: 281–318 doi:10.1006/jare.2001.0867, available online at http://www.idealibrary.com on

Welcome message from author
This document is posted to help you gain knowledge. Please leave a comment to let me know what you think about it! Share it to your friends and learn new things together.
Transcript

Journal of Arid Environments (2002) 51: 281–318doi:10.1006/jare.2001.0867, available online at http://www.idealibrary.com on
Micrometeorological modeling to understand thethermal anomaly in the sand dunes across the
Israel–Egypt border
Zhihao Qin*, Pedro Berlinerw & Arnon Karnieli*z
*The Remote Sensing Laboratory, Department of Environmental Physics,J. Blaustein Institute for Desert Research, Ben Gurion University of the
Negev, Sede Boker Campus, 84990, IsraelwThe Wyler Laboratory for Arid Land Conservation and Development,
Department of Dryland Agriculture, J. Blaustein Institute for DesertResearch, Ben Gurion University of the Negev, Sede Boker Campus, 84990,
Israel
(Received 12 April 2000, accepted 23 May 2001)
A thermal anomaly was observed on the remote sensing images in the sanddunes across the Israel–Egypt border. The Israeli side with more vegetationcover has higher (421C) land surface temperature (LST) during the day thanthe Egyptian side where bare sand prevails. This anomaly is very obvious atabout noon in the hot dry summer season. A micrometeorological model hasbeen established in terms of surface energy balance for simulating the surfacetemperature change and heat flux variation of the region. The purpose of thismodeling is to understand the mechanism leading to the occurrence of thethermal anomaly and to reveal the key factors controlling the surfacetemperature change. The characteristic of the model lies in its coupling soiltemperature changing simultaneously with soil moisture movement, de-scribed as two differential equations. The methodology for the numericalsolution of the model has been developed. The required meteorological dataand soil parameters were measured at the study region in the hot summerseason for the simulation. Two typical and the most important surfacepatterns of the region are considered: biogenic crust representing the Israeliside and the bare sand representing the Egyptian side. Results fromsimulation indicate that surface albedo contributes most to the surfacetemperature difference between the two typical surfaces, which is followed bysub-soil properties (mainly soil moisture) difference. Biogenic crust has lowersurface albedo than bare sand. Consequently, it absorbs much more incidentsky radiation. During the hot summer season, the region is very dry andvegetation is in dormancy. The canopy of most shrubs reduces to minimum.Even though the Israeli side has more vegetation, the evapo-transpirationcontributed by the vegetation is still very small (o7%) in comparison withthe net radiation. This small latent heat flux has little effect on the surfaceenergy balance process in the arid environment. LST change in the desertregion is mainly controlled by the amount of incident solar energy absorbedby the ground as soil heat. Therefore, the anomalous LST change and
zCorrespondence to: E-mail: [email protected]
0140-1963/02/020281 + 38 $35.00/0 # 2002 Elsevier Science Ltd.
282 Z. QIN ET AL.
thermal variation on both sides of the region can still be explained as thedirect result of the obvious albedo difference on both sides. This albedodifference is mainly caused by the sharp contrast of surface compositionespecially different biogenic crust and bare sand cover rates on both sides.The overgrazing and other anthropogenic stresses are the direct reasonsleading to the bare sand (high albedo) prevalent on the Egyptian side whilethe conservation policy helps the development of biogenic crust andvegetation (low albedo) on the Israeli side.
# 2002 Elsevier Science Ltd.
Keywords: micrometeorological modeling; thermal anomaly; biogenic crust;the IsraelFEgypt border
Introduction
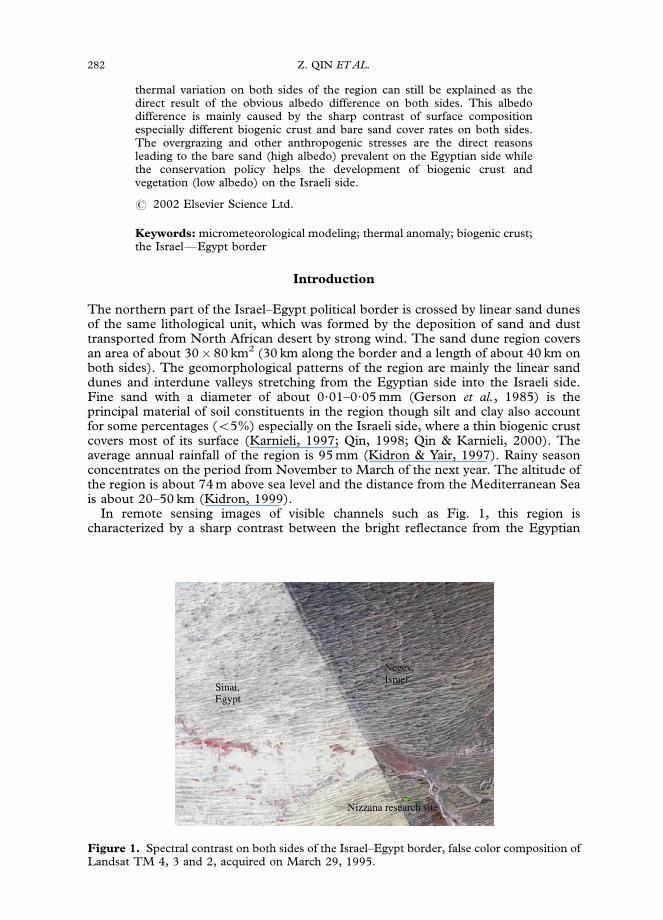
The northern part of the Israel–Egypt political border is crossed by linear sand dunesof the same lithological unit, which was formed by the deposition of sand and dusttransported from North African desert by strong wind. The sand dune region coversan area of about 30� 80 km2 (30 km along the border and a length of about 40 km onboth sides). The geomorphological patterns of the region are mainly the linear sanddunes and interdune valleys stretching from the Egyptian side into the Israeli side.Fine sand with a diameter of about 0?01–0?05 mm (Gerson et al., 1985) is theprincipal material of soil constituents in the region though silt and clay also accountfor some percentages (o5%) especially on the Israeli side, where a thin biogenic crustcovers most of its surface (Karnieli, 1997; Qin, 1998; Qin & Karnieli, 2000). Theaverage annual rainfall of the region is 95 mm (Kidron & Yair, 1997). Rainy seasonconcentrates on the period from November to March of the next year. The altitude ofthe region is about 74 m above sea level and the distance from the Mediterranean Seais about 20–50 km (Kidron, 1999).
In remote sensing images of visible channels such as Fig. 1, this region ischaracterized by a sharp contrast between the bright reflectance from the Egyptian
Figure 1. Spectral contrast on both sides of the Israel–Egypt border, false color composition ofLandsat TM 4, 3 and 2, acquired on March 29, 1995.
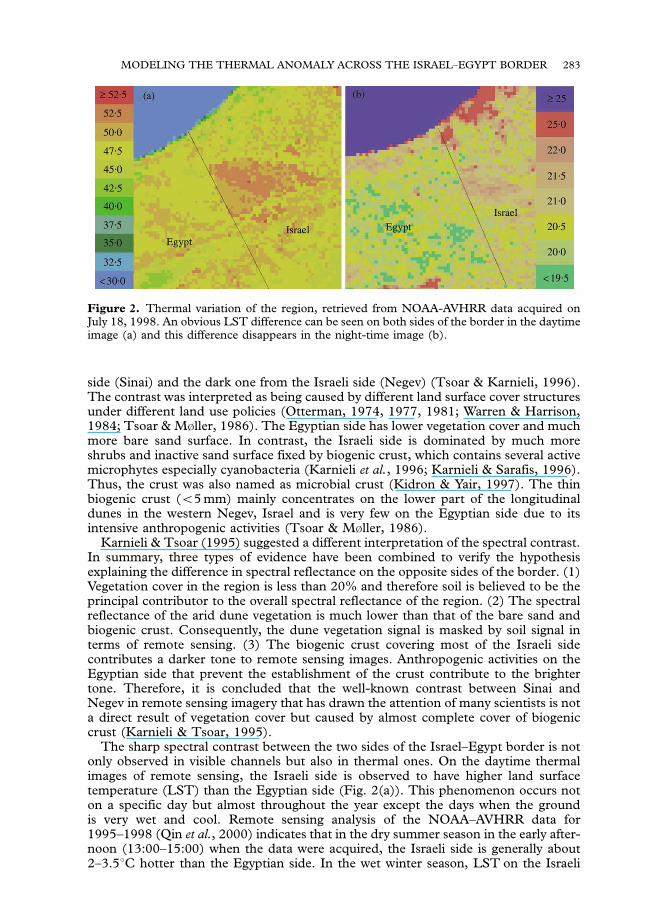
Figure 2. Thermal variation of the region, retrieved from NOAA-AVHRR data acquired onJuly 18, 1998. An obvious LST difference can be seen on both sides of the border in the daytimeimage (a) and this difference disappears in the night-time image (b).
MODELING THE THERMAL ANOMALY ACROSS THE ISRAEL–EGYPT BORDER 283
side (Sinai) and the dark one from the Israeli side (Negev) (Tsoar & Karnieli, 1996).The contrast was interpreted as being caused by different land surface cover structuresunder different land use policies (Otterman, 1974, 1977, 1981; Warren & Harrison,1984; Tsoar & M�ller, 1986). The Egyptian side has lower vegetation cover and muchmore bare sand surface. In contrast, the Israeli side is dominated by much moreshrubs and inactive sand surface fixed by biogenic crust, which contains several activemicrophytes especially cyanobacteria (Karnieli et al., 1996; Karnieli & Sarafis, 1996).Thus, the crust was also named as microbial crust (Kidron & Yair, 1997). The thinbiogenic crust (o5 mm) mainly concentrates on the lower part of the longitudinaldunes in the western Negev, Israel and is very few on the Egyptian side due to itsintensive anthropogenic activities (Tsoar & M�ller, 1986).
Karnieli & Tsoar (1995) suggested a different interpretation of the spectral contrast.In summary, three types of evidence have been combined to verify the hypothesisexplaining the difference in spectral reflectance on the opposite sides of the border. (1)Vegetation cover in the region is less than 20% and therefore soil is believed to be theprincipal contributor to the overall spectral reflectance of the region. (2) The spectralreflectance of the arid dune vegetation is much lower than that of the bare sand andbiogenic crust. Consequently, the dune vegetation signal is masked by soil signal interms of remote sensing. (3) The biogenic crust covering most of the Israeli sidecontributes a darker tone to remote sensing images. Anthropogenic activities on theEgyptian side that prevent the establishment of the crust contribute to the brightertone. Therefore, it is concluded that the well-known contrast between Sinai andNegev in remote sensing imagery that has drawn the attention of many scientists is nota direct result of vegetation cover but caused by almost complete cover of biogeniccrust (Karnieli & Tsoar, 1995).
The sharp spectral contrast between the two sides of the Israel–Egypt border is notonly observed in visible channels but also in thermal ones. On the daytime thermalimages of remote sensing, the Israeli side is observed to have higher land surfacetemperature (LST) than the Egyptian side (Fig. 2(a)). This phenomenon occurs noton a specific day but almost throughout the year except the days when the groundis very wet and cool. Remote sensing analysis of the NOAA–AVHRR data for1995–1998 (Qin et al., 2000) indicates that in the dry summer season in the early after-noon (13:00–15:00) when the data were acquired, the Israeli side is generally about2–3.51C hotter than the Egyptian side. In the wet winter season, LST on the Israeli
284 Z. QIN ET AL.
side is also higher than on the Egyptian side. Usually, the Israeli side has an averageLSTof 0?5–1?51C higher than the Egyptian side in the wet winter season. Only in a fewextreme cases when the surface was very wet after heavy rain did the Egyptian side havea little bit higher LST than the Israeli side. However, the LST difference in theseextreme cases is generally within �0?51C (Qin et al., 2000). Considering morevegetation cover on the Israeli side, this phenomenon of temperature difference in theborder region is really anomalous. The sharp LST contrast on both sides disappears inthe night-time images (Fig. 2(b)), when the LST change of the regionat about midnight is mainly within the range of 18–231C during the summerseason.
Otterman (1974) firstly reported this thermal contrast. Using an infraredthermometer mounted on an airplane flying in the region, he discovered that themaximum temperature difference across the demarcation line was up to 51C at about14:00 in July. He related the contrast to severe overgrazing and other anthropogenicpressures on the Egyptian side. After analysing the impact of these pressures, heconcluded that in an arid climate, under the semi-dormant conditions of vegetation,which prevail at all times except for the short desert blooming period after rains,evapo-transpiration is very low and has apparently a negligible effect on the surfacetemperature. Thus, LST of desert region is controlled by the surface albedo(Otterman, 1974). The importance of albedo in affecting the climatic featuresespecially precipitation, air temperature, etc. under arid environments has beensystematically examined in the studies of Charney and his co-workers (Charney, 1975;Charney et al., 1975, 1977) through a biogeophysical feedback model to relate theeffect of albedo change on drought in Sahel, Sahara and other semi-arid regions of theworld. The premise used in the studies has been appraised as the Charney hypothesis(Williams & Balling, 1996). As to our micro-scale region, the explanation thatOtterman (1974) gave for the cause of LST contrast is reasonable but is not enoughbecause it has no quantitative evidence of ground measurements about the differenceof albedo and evaporation on both sides. Furthermore, the mechanism leading theLST difference still remains unknown. Actually, LST change of ground surface iscontrolled by many factors such as subsoil properties including soil thermalconductivity, soil water content and heat capacity. Micrometeorologically and soil-physically, the mechanism leading to LST change is rather complicated. Moreover,the mechanism governing the LST change has not been revealed. Therefore, a studyfrom the viewpoint of micrometeorological modeling is necessary in order to explainthe occurrence of the LST anomaly in the region and to understand its implication todesertification.
In this paper, we intend to model the LST change and heat flux variation of theregion in terms of surface energy balance. The purpose of this modeling is tounderstand the mechanism leading to the occurrence of the thermal anomaly and toreveal the key factors controlling the surface temperature change through comparisonof surface energy balance dynamics on biogenic crust and bare sand.
Surface energy balance model has been extensively used for various researchpurposes (Hares & Novak, 1992; Dolman, 1993; Friedl, 1995). A simple surfaceenergy mode was adopted in Dolman & Blyth (1997) to study the behavior of theroughness length of heat and water vapor in heterogeneous terrain. A mathematicalmodel for the numerical computation of evaporation from bare saline soils waspresented in Yakirevich et al. (1997). In association with remote sensing data, asurface energy balance model was used in Friedl (1996) to examine the issues of landsurface properties and heat fluxes over a regional scale. Using remote sensing data asinputs, Schmugge & Humes (1995) applied the surface energy balance model tomonitor land surface fluxes. Chen & Coughour (1994) developed a general model forenergy and mass transfer of land surfaces by considering the soil temperature changeand soil moisture movement separately. The existing studies employed different

MODELING THE THERMAL ANOMALY ACROSS THE ISRAEL–EGYPT BORDER 285
methods to simplify the complexity of the model in terms of computation andrarely related soil temperature change to the simultaneous soil moisturemovement.
In the study, we intend to establish a complete surface energy balance model thatcouples soil temperature change simultaneously with soil moisture movement and todevelop a methodology for the numerical approximation to the model. Through thismodel and its numerical solution method, it is possible to estimate surface heat fluxes,surface and soil temperature change, soil water movement and other important micrometeorological parameters that govern surface temperature change without too manyassumptions and simplifications to the parts of the model and its parameters.Comparison of surface energy balance performance on the two typical surfacepatterns of the region will help us to understand the surface temperature difference onboth sides of the region. Modeling with the different parameters on these two surfacepatterns can also reveal the key factors leading to surface temperature differencebetween the two surface patterns. The mechanism governing the surface temperaturedifference on the two surface patterns can then be extended to understand theoccurrence of the LST anomaly in the desert environment.
Micrometeorological model
Surface temperature in the soil–atmosphere system is determined by a number ofmicrometeorological and soil-physical factors through the dynamics of surface energybalance. In order to reveal the mechanism leading to the LST anomaly on both sidesof the region, it is necessary to establish a micrometeorological model to simulatesurface temperature change and heat flux variation of the region from the viewpoint ofsurface energy balance. Because it is impossible to access the Egyptian side for anyfield measurement and observation, all the research work has to be done on the Israeliside. Therefore, the simulation is mainly oriented to the two typical surface patterns ofthe region: biogenic crust representing the Israeli side and the bare sand representingthe Egyptian side. According to Qin (1998) and Qin & Kainieli (2000), biogenic crustcovers above 72% of the Israeli side and bare sand above 80% of the Egyptian side.Thus, it is reasonable to assume that the LST difference between bare sand andbiogenic crust can be extended to represent the general case on both sides of theregion. Application of the micrometeorological model to the two surface patterns forcomparison of their difference in terms of surface energy balance can finally lead touncovering of the key factors controlling the sharp LST difference on both sides of theregion.
More specifically, the hypotheses based on the micrometeorological modeling forthe study can be summarized as follows:
K The difference of surface albedo, which is much higher on the Egyptian side
than on the Israeli side, controls the absorption difference of incident global
radiation on both sides. Under arid environment, evaporation is minimal due
to extremely low soil water content. Thus, the absorption difference of
incident energy makes a significant contribution to the difference of LST on
both sides. The importance of albedo in the climate change of arid region had
been emphasized in several studies (Charney, 1975; Charney et al., 1975,
1977; Cunning & Rowntree, 1986; Williams & Balling, 1996). Our
current study intends to examine the importance of albedo difference in
leading to the occurrence of the surface temperature contrast across the
border.

286 Z. QIN ET AL.
K The difference of emissivity, which is expected to be lower on the Egyptian
side than on the Israeli side, makes a significant contribution to LST
difference on both sides of the region. For the same temperature level,
emissivity difference determines the energy emitted from the surface, which is
observed by remote sensing imagery systems for LST estimation. Higher
emissivity means greater ability of emission. And the difference of surface
emittance may have a great effect on surface energy balance, which finally
shapes the LST difference of the surfaces.
K The difference of subsoil properties especially soil moisture makes a
significant contribution to the LST difference on both sides of the region.
Surface temperature change strongly relates the change of such subsoil
properties as soil heat capacity, thermal conductivity, hydraulic conductivity,
soil moisture movement and so on. Alhough the lithological structure
of the subsoil on both sides can be viewed as identical, the different
process of surface energy balance due to different albedo may also
lead to the difference in subsoil properties, which in turn has an
important impact on the LST difference on both sides. Studies indicated
that soil moisture is very important in shaping regional climate change
under arid environments (Cunning & Rowntree, 1986; Lanicci et al.,
1987; Williams & Balling, 1996). Thus, the possible difference
of soil moisture between the two typical surfaces of the region will also be
examined to test their relative role in producing the LST anomaly in the
region.
Through the micrometeorological simulation, these hypotheses can be tested on thesurfaces of bare sand and biogenic crust. The mechanism leading to the simulationresults on the two typical surface patterns can then be extended to understand thesurface energy balance for an explanation of LST anomaly on both sides of theregion.
The LST change and thermal variation strongly relate to such importantenvironmental factors as sky radiation, wind speed, surface albedo, ground emissivity,soil properties, soil water content, etc. at the interface of land–air system. All of thesefactors have a significant effect on the LST change and thermal variation on theground surface. Actually, surface temperature change is a direct reflection of thedynamic energy balance on the surface. For a bare soil surface where energy storage iszero, surface energy balance at the soil–atmosphere interface can be quantitativelydescribed as
Rn � H � LE � G ¼ 0 ð1Þwhere Rn is the net radiation (W m�2), H is the sensible heat flux (W m�2), LE is thelatent heat flux (W m�2), G is the soil heat flux (W m�2). The terms in Eq in (1) are allrelated to surface temperature, which becomes the key factor for numerical solution ofthe model.
The short-wave radiation from the sun is the only energy source driving thedynamics of the interface when there is no heating source from the interior earth. Atthe ground surface, part of the incident short-wave radiation Rs is reflected by thesurface back into the atmosphere at a density that depends on the albedo of thesurface. At the same time, the Earth’s surface also emits some long-wave radiation intothe atmosphere and the atmosphere also emits some long-wave radiation that reachesthe ground surface. Some of the incoming atmospheric long-wave radiation isreflected by the ground surface back into the atmosphere. Therefore, the net radiation

MODELING THE THERMAL ANOMALY ACROSS THE ISRAEL–EGYPT BORDER 287
can be expressed as (Brutsaent, 1982)
Rn ¼ Rsð1 � �Þ þ "a�T4a � "s�T4
s � ð1 � "sÞ"a�T4a ðEqn: 2Þ
where Rn is the net radiation (W m�2), Rs is the global hemispheric radiation (W m�2),r is the surface albedo, Ts is the surface temperature (K), Ta is the air temperature (K),es and ea are the surface and air emissivities, respectively, s is the Stefan–Boltzmannconstant (s = 5?67� 10�8 W m�2 K�4).
In arid environmental systems, sensible heat flux is the most important termof surface energy balance because it usually accounts for above 3/4 of the netradiation at the interface. There are two key factors that determine the amount ofsensible heat flux: temperature difference between the interface and the air nearthe ground, and the air resistance to heat transfer, which is then strongly relatedto wind speed near the ground. Thus, the sensible heat flux is usuallycalculated by the following formula (Verma & Barfield, 1979; Schmugge & Humes,1995):
H ¼ �acaðTa � TsÞ=ra ð3Þwhere ra is the density of air (ra = 1?205 kg m�3 at 201C), ca is the specific heat of air(ca=1005 J kg�1 K�1), ra is the air resistance coefficient to heat transfer (s m�1), whichis given as (Berliner, 1988)
ra ¼ðlnðz=z0Þ � ’hÞ
kUð4Þ
U ¼ wzk
lnðz=z0Þ � ’mð5Þ
where uz is the wind velocity (m s�1) at standard height z (z=2 m), k is the VonKarman constant (k=0?4), z0 is the roughness length (m) of the surface, jh and jm arethe stability correction parameters for heat and momentum, which can be estimatedthrough the ratio function of standard height to Monin–Obhukov length (Berliner,1988; Courault et al., 1996).
The energy required for evaporation is generally termed as latent heat fluxLE, which can be computed by the following formula (Schmugge & Humes,1995):
LE ¼ 0 �622Lðea � esÞ=ðPaðra þ rsÞÞ ð6Þwhere ea and es are the air and surface vapor pressures (kPa), respectively, Pa is theatmospheric pressure (Pa= 101?325 kPa). L is the latent heat of vaporization(L=2?543� 106 J kg�1), rs is the surface resistance (s m�1). Actually, evaporationfrom the ground surface must be equal to the change of soil water content in theprofile. Thus, we have
LE � LEc¼ 0 ð7Þwhere LEc denotes the energy (W m�2) caused by the change of soil water content intime interval qt. In many cases especially in arid environments, soil water movementover planar directions can be assumed to be negligibly small (Rose, 1979; Brutsaert,1982). Thus, the energy used for driving soil water movement in time interval qt canbe computed as follows:
LEc ¼ L
Zz
0
@�
@tdz ð8Þ
where t is the time (s) and z is the depth (m) of soil profile under consideration, qy/qtdenotes the rate of soil water change. When the planar movement is neglected, thevertical movement of soil water can be described by the following differential equation
288 Z. QIN ET AL.
(Berliner, 1988):
@�=@t ¼ @ðKc@ =@zÞ=@z þ @ðgKcÞ=@z þ @ðhsDv@T=@zÞ=@z þ @ðevDv@h=@zÞ=@z ð9Þwhere Kc is the soil hydraulic conductivity (kg s m�3), h is the relative humidity of thegas filled in the soil pore, c is the soil water potential ( J kg�1 = m2 s�2), g is theacceleration due to gravity( g = 9?8 m s�2), s is the slope of saturated vapor pressure vs.temperature (kPa K�1), ev is the saturated vapor pressure (kPa) and Dv is the apparentvapor diffusivity (kg m�1 s�1 kPa�1). The soil water potential c in J kg�1 is coupledwith soil vapor pressure e in kPa and temperature T in K via the equation
¼ RT lnðe=evÞ ð10Þin which R is the universal gas constant (R = 461?52 J kg�1 K�1). Actually, soil relativehumidity h is calculated as the ratio of soil vapor pressure e and saturated soil vaporpressure ev, i.e. h = e/ev. Thus, the relationship between soil water potential and relativehumidity is given as c= RT ln(h). The first two terms of Eqn (9) describe the soilwater movement in liquid phase due to potential difference and gravitation,respectively. The last two terms describe the movement of soil water in the vaporphase due to temperature and potential gradients, respectively. Therefore, the changeof soil water content with time is described as the function of such important variablesas soil water potential, soil relative humidity and soil temperature.
Soil heat flux can be computed from soil temperature change and soil heat capacityin the profile. Usually, soil heat transfer in planar directions is negligibly small andonly in the vertical direction is practically worthy of consideration. Thus, the term Gin Eqn (1) can be computed as (Kimball & Jackson, 1979)
G ¼Zz
0
Cs@T
@tdz ð11Þ
where qT/qt denotes the rate of soil temperature change and Cs is the volumetric soilheat capacity (J m�3 K�1) which can be expressed as Cs =rscs, in which rs is the soildensity (kg m�3) and cs the specific heat of soil (J kg�1 K�1). However, the specificheat of soil is strongly dependeent on soil properties especially the materialsconstituting the soil. It is also highly variable, depending on the change of soil watercontent. Usually, the soil can be viewed as constituted by soil minerals (mainly sand,silt and clay), organic materials, water and air in different proportions. Generally, thespecific heat of these soil constituents is stable for practical purposes. Thus, it wassuggested that heat capacity of the soil could be computed through the thermalproperties of its constituents by linking to their fractions (Marshall & Holmes, 1979;Brutsaert, 1982).
Cs ¼ �wcwVw þ �qcqVq þ �mcmVm þ �ocoVo þ �acaVa ð12Þwhere r is the density of soil constituents, c is specific heat, V is the volumetricfraction, the subscripts w, q, m, o and a refer to water, quartz, clay mineral, organicmaterials and air, respectively.
Heat transfer in the soil takes place from the more energetic (hotter) region to thosecooler regions where the molecular motion is less energetic (Rose, 1979). At the sametime it also causes the imbalance of energy distribution in the soil, which drives soilwater movement especially in vapor form in the unsaturated state. And soil watermovement also eases the process of soil heat transfer. Thus, a complete description ofsoil heat flux must consider the equilibrium of these two factors. In the time intervalqt, the intensity of soil heat transfer can be described by the following differentialequation (Berliner, 1988):
Cs@T=@t ¼ @ðKs@T=@zÞ=@z þ @ðhsLDv@T=@zÞ=@z þ @ðevLDv@h=@zÞ=@z ð13Þ

MODELING THE THERMAL ANOMALY ACROSS THE ISRAEL–EGYPT BORDER 289
where Ks is the soil thermal conductivity (W m�1 K�1). The first term on the right-hand side of Eqn (13) describes the heat transfer due to temperature gradient. Thesecond term is the energy due to soil water vapor movement under the temperaturegradient. The third term is the energy due to the change of soil water vapordistribution under the gradient of the vapor distribution in the soil.
Numerical solution to the model
The relations in the above surface energy balance model are very complicated. It isimpossible to directly express the key factor (surface temperature Ts) of the model as afunction of other variables. Usually, to solve such a complicated equation as ourmodel involves the application of a numerical approximation method. Among theapproximation methods, the Newton–Raphson iterative technique is a good onebecause it can rapidly reach the solution with the required accuracy. Since all terms ofEqn (1) are a function of surface temperature (Ts), we can rewrite the equation as
f ðTsÞ ¼ Rn � H � LE � G ¼ 0 ð14Þwhich is a successive function within such as interval as TsD(�501C, 1001C).Therefore, to apply the Newton–Raphson iterative method for approximation, westart with the point Ts
0 in the interval Ts0D(�501C, 1001C) for the solution of Ts and
proceed to determine additional approximation by
Tnþ1s ¼ Tn
s � f ðTns Þ
f 0ðTns Þ
ðn ¼ 0; 1; 2; . . .Þ ð15Þ
where f(Tsn) and f 0 (Ts
n) are the values of the function f(Ts) and its derivative at Tsn.
After iterative calculation many times when f ðTns Þ
�� �� ! 0 or is less than the requiredaccuracy, we get Ts
n+1 ¼ Tsn - Ts and stop the iterative calculation. Thus, we can
conclude that Tsn is the solution of surface temperature Ts from the model under the
balance of available inputs (Qin et al., 2000).If dT is taken to be small enough, the derivative f0(Ts
n) can be given as
f 0ðTns Þ ¼
f ðTns þ dTÞ � f ðTn
s ÞdT
ð16Þ
To solve the function f(Ts) for Ts also involves the solution of the differential Eqns (9)and (13) simultaneously. The Crank–Nicholson technique can be used toapproximate the solution of the two differential equations (Qin et al., 2000).
In order to compute latent heat flux LE for the approximation of surfacetemperature Ts, Eqn (7) also has to be solved for vapor pressure es or relative humidityhs of the ground surface. Both LE and LEc can be viewed as the function of hs and Eqn(7) can similarly be solved using the Newton–Raphson iterative approximationmethod. The procedure of the solution is the same as that used for the solution of Ts
from Eqn (14).The use of Newton–Raphson approximation to solve surface temperature and latent
heat flux from Eqns (1) and (7) involves the solution of differential Eqns (9) and (13).Using the relation between water potential and relative humidity, we can rewrite Eqn(9) as
Ch@h=@t ¼ @ðKa@T=@zÞ=@z þ @ðKb@h=@zÞ=@z þ g@Kc=@z ð17Þwhere the parameters are defined as follows:
Ch ¼ ð@�=@hÞ ð18Þ
Ka ¼ RKc lnðhÞ þ hsDv ð19Þ
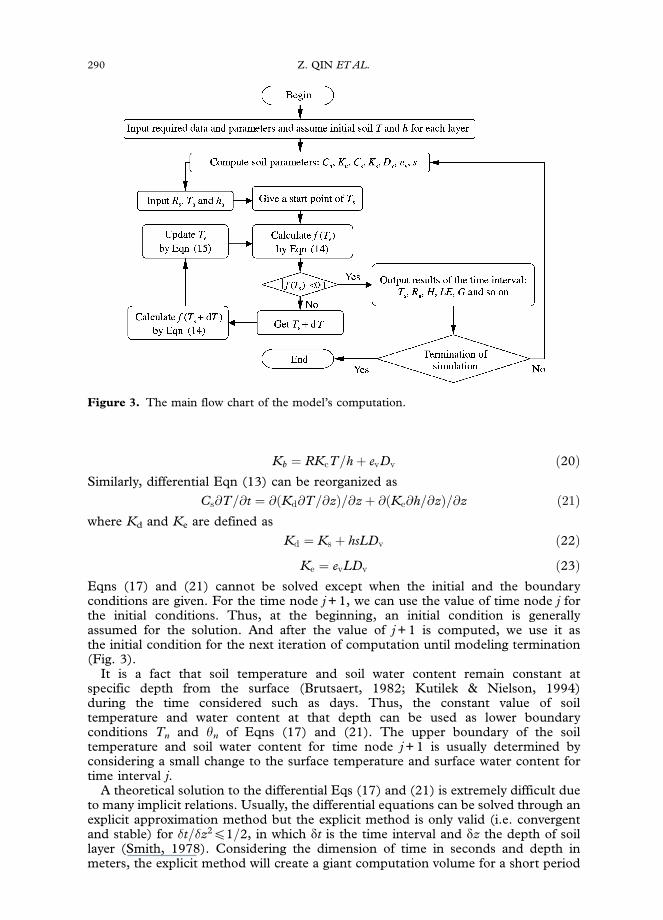
Figure 3. The main flow chart of the model’s computation.
290 Z. QIN ET AL.
Kb ¼ RKcT=h þ evDv ð20ÞSimilarly, differential Eqn (13) can be reorganized as
Cs@T=@t ¼ @ðKd@T=@zÞ=@z þ @ðKe@h=@zÞ=@z ð21Þwhere Kd and Ke are defined as
Kd ¼ Ks þ hsLDv ð22Þ
Ke ¼ evLDv ð23ÞEqns (17) and (21) cannot be solved except when the initial and the boundaryconditions are given. For the time node j + 1, we can use the value of time node j forthe initial conditions. Thus, at the beginning, an initial condition is generallyassumed for the solution. And after the value of j + 1 is computed, we use it asthe initial condition for the next iteration of computation until modeling termination(Fig. 3).
It is a fact that soil temperature and soil water content remain constant atspecific depth from the surface (Brutsaert, 1982; Kutilek & Nielson, 1994)during the time considered such as days. Thus, the constant value of soiltemperature and water content at that depth can be used as lower boundaryconditions Tn and yn of Eqns (17) and (21). The upper boundary of the soiltemperature and soil water content for time node j + 1 is usually determined byconsidering a small change to the surface temperature and surface water content fortime interval j.
A theoretical solution to the differential Eqs (17) and (21) is extremely difficult dueto many implicit relations. Usually, the differential equations can be solved through anexplicit approximation method but the explicit method is only valid (i.e. convergentand stable) for �t=�z2p1=2, in which dt is the time interval and dz the depth of soillayer (Smith, 1978). Considering the dimension of time in seconds and depth inmeters, the explicit method will create a giant computation volume for a short period
MODELING THE THERMAL ANOMALY ACROSS THE ISRAEL–EGYPT BORDER 291
of simulation such as one day. For example, if dz ¼ 0?1 m, the time intervalhas to be dtp0?005 s in order to meet the convergent condition of the method.Consequently, it takes about 200 iterative computations for the simulationof 1 s. Crank & Nicolson (1947) developed a method that reduces the totalvolume of calculation and is valid for all finite values of dt/dz2 such as dt ¼ 60 sand dz ¼ 0?01 m. They approximated the differentials by the mean of itsfinite-difference representations on the ( j + 1)th and the jth time node. Applying thisimplicit method, the differential Eqn (17) can be approximated as follows:
�Kai�1=2; jTi�1; jþ1 þ ðKai�1=2; j þ Kaiþ1=2; jÞTi;jþ1 � Kaiþ1=2; jTiþ1;jþ1 � Kbi�1=2; jhi�1; jþ1
þðKbi�1=2; j þ Kbiþ1=2; j þ 2ZiChiþ1=2; jÞhi; jþ1 � Kbiþ1=2; jhiþ1; jþ1 ¼ gj
ð24Þwhere Zt=dz2/dt and
gj ¼2ZtChiþ1=2;jhi;j þ Kaiþ1=2;jðTiþ1;j � Ti;jÞ
� Kai�1=2;jðTi;j � Ti�1;jÞ þ Kbiþ1=2;jðhiþ1;j � hi;jÞ
� Kbi�1=2;jðhi;j � hi�1;jÞ þ 2dzgðKciþ1;j � Kci;jÞ
ð25Þ
Similarly, approximation of Eqn (21) leads to
�Kdi�1=2;jTi�1;jþ1 þ ðKdi�1=2;j þ Kdiþ1=2;j þ 2ZtCsiþ1=2;jÞTi;jþ1 � Kdiþ1=2;jTiþ1;jþ1
�Kei�1=2;jhi�1;jþ1 þ ðKei�1=2;j þ Keiþ1=2;jÞhi;jþ1 � Keiþ1=2;jhiþ1;jþ1 ¼ Gj
ð26Þ
where Gj is defined as
Gj ¼ 2ZtCsiþ1=2;jTi;j þ Kdiþ1=2;jðTiþ1;j � Ti;jÞ � Kdi�1=2;jðTi;j � Ti�1;jÞ
þKeiþ1=2;jðhiþ1;j � hi;jÞ � Kei�1=2;jðhi;j � hi�1;jÞð27Þ
In Eqns (24) and (26), soil temperature T and relative humidity h for time node j areknown as initial conditions and the coefficients Ka, Kb, Kd and Ke can be computed forj. Thus, gj and Gj are also known. For j+1, the upper boundary T0,j+1 and h0,j+1 andthe bottom boundary Tn+1,j+1 and hn+1,j+1 are also given. Therefore, the expansion ofEqn (24) about soil water movement in terms of relative humidity will result in thefollowing simultaneous equations:
þb1T1 � c1T2 þ e1h1 � f1h2 ¼ g1
�a2T1 þ b2T2 � c2T3 � d2h1 þ e2h2 � f2h3 ¼ g2
. . .
�aiTi�1 þ biTi � ciTiþ1 � dihi�1 þ eihi � fihiþ1 ¼ gi
. . .
�anTn�1 þ bnTn � dnhn�1 þ enhn ¼ gn
ð28Þ
Similarly, Eqn (26) about the soil temperature change can also be expanded as
þB1T1 � C1T2 þ E1h1 � F1h2 ¼ G1
�A2T1 þ B2T2 � C2T3 � D2h1 þ E2h2 � F2h3 ¼ G2
. . .
�AiTi�1 þ BiTi � CiTiþ1 � Dihi�1 þ Eihi � Fihiþ1 ¼ Gi
. . .
�AnTn�1 þ BnTn � Dnhn�1 þ Enhn ¼ Gn
ð29Þ
Totally, there are 2� n unknown variables and 2� n equations in Eqns (28) and (29).

Figure 4. The flow chart for computing f(Ts) and f(Ts+dT).
292 Z. QIN ET AL.
Thus, the unknown variables can be directly solved from the equation system byGauss’s elimination method (Qin et al., 2000).
The numerical approximation to the model involves the re-adjustment of somegiven parameters in the iterative calculation. The computation is actually rathercomplicated. The procedure involves several iterations and the actual computation, aswe can imagine, is very complicated. Using Quick BASIC 4?5, we have programmedthe model for practical application. The main flow chart of the computation of themodel is illustrated in Fig. 3 and the flow chart for computing f(Ts) and f(Ts+dT) inFig. 4.
Data for the modeling
In order to apply the model to simulate LST change and thermal variation on bothsides of the region, we need to prepare the required data sets of the functioning factorsfor its operation and computation. These include global radiation, surface albedo, soilwater content, air temperature, relative humidity of the air and wind speed near thesurface.
Global radiation of the region
The observed LST anomaly on both sides of the border region has the sharpestappearance in the summer season, which is dry and hot. This implies that oursimulation should focus on the season. The global radiation of the region wasmeasured during July 16–20, 1998, when the sky was very clear and the region wasvery dry and the vegetation was dormant. The global radiation was measured with apyranometer operating in the spectrum ranging from ultraviolet through visible tonear-infrared wavelength. Thus, the measurement is a full spectrum measurement ofthe global radiation. The pyranometer was mounted upward on top of a frame 1 m

Figure 5. Global radiation of the region measured on July 16–20, 1998.
MODELING THE THERMAL ANOMALY ACROSS THE ISRAEL–EGYPT BORDER 293
above the ground, which was carefully installed so that it is in the water level status torecord the radiation from the hemispheric direction. A datalog and a storage modulewere used to record the data from the pyranometer at a frequency of every 5 s for onerecord. The raw data were averaged to one record for each minute after download intothe computer for further calculation.
The measuring results are shown in Fig. 5, indicating the global radiation changeduring the measuring period and their average. The global radiations during themeasuring period are very similar to each other. The shape of the radiation curves hasperfect similarity with a sine one. The curves started from a little bit earlier than localtime 6:00 at dawn and ended at 19:45 at dusk, representing the period when theregion receives the incoming radiation for its surface energy balance process. From6:00 in the morning, the radiation rapidly increases with time, due to the increase ofthe sun’s shining angle. At about 13:00 when the sun’s rays are about perpendicular tothe ground, the radiation curves reach their apex and from this point to about 17:45 atdusk, the radiation declines gradually. At the apex hour 13:00, the global radiation ofthe region is about 1130 W m�2 on an average during the measuring period. Anotherfeature of the radiation curves is that the fluctuation in the morning is much less thanthat in the afternoon. During the measuring period, the daily change of the radiation isless than 15W m�2 from 6:00 a.m. to 11:00 a.m. However, the change in the afternoonis above 35W m�2. For a specific day, the fluctuation is much more obvious in thenoon hours than the other ones. After average, the curve is very smooth in themorning and afternoon except for a little bit of fluctuation in the noon hour from12:30 to 13:30. Therefore, we can conclude that our measurement produces a goodresult of global radiation measurement of the region.
Albedo of the surface patterns
Albedo is defined as the ratio of reflected radiation to the incident radiation. In orderto calculate the albedo of ground surface, we need to measure the reflected radiationand the incoming radiation simultaneously. The two pyranometers were mounted at aframe about 1 m from the ground. One pyranometer was placed upward to measure
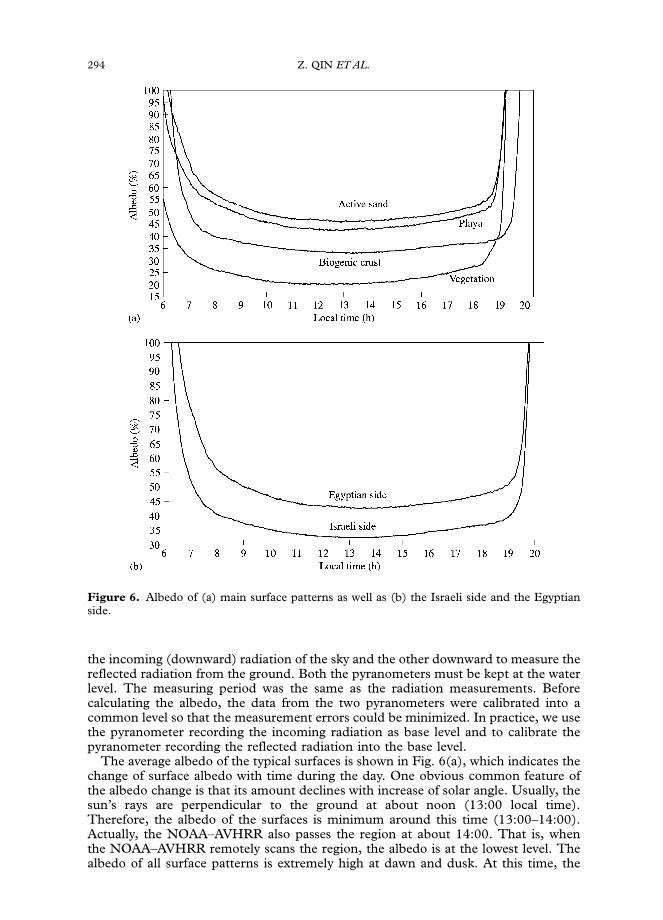
Figure 6. Albedo of (a) main surface patterns as well as (b) the Israeli side and the Egyptianside.
294 Z. QIN ET AL.
the incoming (downward) radiation of the sky and the other downward to measure thereflected radiation from the ground. Both the pyranometers must be kept at the waterlevel. The measuring period was the same as the radiation measurements. Beforecalculating the albedo, the data from the two pyranometers were calibrated into acommon level so that the measurement errors could be minimized. In practice, we usethe pyranometer recording the incoming radiation as base level and to calibrate thepyranometer recording the reflected radiation into the base level.
The average albedo of the typical surfaces is shown in Fig. 6(a), which indicates thechange of surface albedo with time during the day. One obvious common feature ofthe albedo change is that its amount declines with increase of solar angle. Usually, thesun’s rays are perpendicular to the ground at about noon (13:00 local time).Therefore, the albedo of the surfaces is minimum around this time (13:00–14:00).Actually, the NOAA–AVHRR also passes the region at about 14:00. That is, whenthe NOAA–AVHRR remotely scans the region, the albedo is at the lowest level. Thealbedo of all surface patterns is extremely high at dawn and dusk. At this time, the

MODELING THE THERMAL ANOMALY ACROSS THE ISRAEL–EGYPT BORDER 295
azimuth angle of the sun’s rays is very small and the reflected fraction of the incidentradiation is very high, though both the incoming and reflected radiations are verysmall (o50W m�2).
The albedo of the four surface patterns also show great difference. In the hoursaround noon, the sand surface has the highest albedo, followed by playa, then biogeniccrust. Desert shrub has the lowest albedo. The albedo difference between sand andplaya is very small, only about 2–5%. However, the difference is very obvious betweensand and biogenic crust. During the noon hours, biogenic crust has an albedo of about33%, which is 13% lower than that of sand surface and 10% lower than playa. Sandand biogenic crust constitute the overwhelming surface composition on both sides ofthe region (Karnieli et al., 1996; Qin, 1998; Qin & Karnieli, 2000). The greatdifference of albedo between sand and biogenic crust would surely make an extremelyimportant contribution to the difference of surface temperature on both sides.
Using the surface composition given in Qin & Karnieli (2000), we are also able toestimate the average surface albedo for both sides. The result of such an effort isshown in Fig. 6(b). Due to the higher percentage of biogenic crust and vegetation,which have lower albedo, the Israeli side has much lower surface albedo than theEgyptian side. At about noon, the average albedo on the Israeli side is about 32%,which is about 12% lower than that on the Egyptian side. This difference is critical inshaping the dynamics of surface energy balance on both sides.
Soil water content
In arid and semi-arid environments, the importance of soil moisture or soil watercontent in driving the dynamics of climate phenomenon has been well known (Lanicciet al., 1987; Williams & Balling, 1996). Water content of soil profile is needed for thesimulation in two ways: (1) determination of initial and boundary conditions for thesolution of differential equations about soil water movement and temperature change,and (2) validation of simulation result about soil water movement in the region.Generally, soil water content can be determined by several methods (Ghildyal &Tripathi, 1987; Gardner et al., 1991; Kutilek & Nielson, 1994). When suitableinstruments such as neutron moisture meter are available, soil water content can beeasily measured in the field by installing the probe at various depths of soil profile(Marshall & Holmes, 1979). For our study, we lack the instrument for directmeasurement. Thus, we have to use the classic gravimetric method of drying soilsamples for the measurement. Actually, soil water percolation and movement of thesand dunes had been studied in the research of Yair et al. (1997), who used neutronprobes to monitor soil water content change for the analysis in the rainfall years 1991–1992 and 1992–1993. Soil water content data of the region in recent years are notavailable and the comparison of soil water content under sand and biogenic crustsurfaces also still remains not to be done.
In order to obtain soil moisture data of the region, a series of samplings had beenconducted for measuring soil water content under sand and biogenic crust surfaces.The sampling period ranged from the rainy season to the dry hot one in 1998. All soilsamples were taken from the field at the Nizzana Research Site on the Israeli side (seeFig. 1). The results are presented in Fig. 7.
After heavy rain, soil water content is much higher in the profile under biogeniccrust than under sand surface. According to the sampling on January 25, which wasabout 2 weeks after heavy rain (23?9 mm) on January 11–12, soil had about 18%volumetric water content under biogenic crust and 10% under bare sand surface.Water penetration in the soil of the region seems to be very slow. Within 1 week afterheavy rain, the soil below 40 cm was still very dry under sand surface (Fig. 7(a)). After2 weeks, the water finally penetrated into its maximal depth.

Figure 7. Comparison of volumetric soil moisture content under biogenic crust and bare sandsurfaces in (a) wet season and (b) dry season.
296 Z. QIN ET AL.
In the summer season, the region is very dry. Soil water content in the surfacelayer is only about 0?5–0?8%. One interesting phenomenon is that the upper layerhas a little bit higher soil content under biogenic crust than bare sand surfacethough the difference is very weak due to both being extremely low. However,the lower layer of soil profile under sand surface may have higher soil watercontent than that under biogenic crust surface. Soil water content may reach2?31% at 40 cm under sand surface, which is about 0?5% greater than thatunder biogenic crust, according to the sampling on July 16, 1988. This differenceis probably due to different speeds of the soil water attenuation in the two soilprofiles.
It seems that seasonal rain only affects the soil water change of the top 1 mprofile. Soil water content tends change little at the layers below 1 m in the wet seasonand below 0?8 m in dry the season. At this depth, the soil water content is about 6–7%in the wet season (Fig. 7(a)) and 5?0–5?5% in the dry season (Fig. 7(b)). Similarresults had also been reported in Yair et al. (1997).
Soil moisture data of the region need to be carefully set for the simulation. From theabove sampling results, we can see that the surface is extremely dry in the hot summerand the soil profile loses its water content rapidly after the rains. In the dry hot season,the surface contains not more than 1% of volumetric soil water content in both sandand biogenic crust. Under about 80–100 cm, the soil water content may reach up to5?0–5?5% and it seems that the change below this depth is negligibly small. Therefore,this content can be used as the lower boundary soil water content for the solution ofour model. It should be noted that the soil water content under the two surface

MODELING THE THERMAL ANOMALY ACROSS THE ISRAEL–EGYPT BORDER 297
patterns is different. The content under sand surface is slightly higher than that underbiogenic crust. Usually, the former has about 0?5–0?7% volumetric soil water contentat about 40 cm depth than the latter and at 60 cm depth the difference may be up to1%. This difference may have an important impact on the contrast of surfacetemperature change on both patterns.
Air temperature and relative humidity
The meteorological data of air temperature and relative humidity were measured at2 m above the ground at the Nizzana Research Site on the Israeli side (see Fig. 1) inJuly 1998, which represents the hot dry summer season of the region.
The average air temperature change has been plotted in Fig. 8(a). Although thereare fluctuations in the curves, the general trend of the change can be clearly seen. Noobvious differences of average air temperature can be found in all 10 days of July1998. The average air temperature of the region reaches high level of up to about 361Cat early afternoon (14:00–15:00). Minimum air temperature occurs at about 5:00–6:00 when the temperature is in the range of 20–231C (Fig. 8(a)). Thus, daily airtemperature vibration of the region is up to 13–151C. Air temperature increasessharply in the morning and decreases quickly in the afternoon. After midnight, airtemperature undergoes a very slow change. This represents the typical meteorologicalfeature of arid environments. Because air temperature change is relatively identical,the average of the whole month will be used as the input of our modeling.
The average change of air relative humidity is shown in Fig. 8(b). Relative humiditynot only relates to water vapor pressure but also depends on air temperature. Whenthe air temperature is high, relative humidity is low. This explains the fact that thechange in the relative humidity is opposite to the change in air temperature. Duringthe night, air temperature is low but the relative humidity is high while during the daythe air temperature increases which leads to the decrease of relative humidity. Minimalair humidity occurs at about 14:00, when it is only about 30–40%. Maximal humidityexists in the hours 2:00–5:00, when it may reach up to 85–95%.
Wind speed and roughness length
Wind speed is an important factor in micrometeorological modeling (Diak & Whipple,1993; Dolman, 1993). The connection of wind speed to surface temperature change isthat it directly affects the amount of sensible and latent heat fluxes which control thecooling process of the surface. The greater the wind speed, the smaller the airresistance for sensible heat transfer into the air. Wind speed data of July 1988 areavailable for the analysis of its daily change as shown in Fig. 9. Several features can beseen in Fig. 9. First of all, there is a peak in the late afternoon when wind speed isobserved to be maximal. The peak is between 16:00 and 18:00 in July (Fig. 9). Thevalue of wind speed during the hours is about 4?8 m s�1. Second, wind speed isgenerally greater in daytime than at night-time. After reaching the peak in the lateafternoon, wind speed quickly declines in the evening. Figure 9 indicates that thespeed drops to the minimum (about 1 m s�1) at midnight. In summer, the ascent ofwind speed accelerates in the late morning hours during the day till late afternoon atabout 17:00. Third, the difference between daytime maximum and night-timeminimum is about 4?5 m s�1. Fourth, due to the spatial variation of geomorphologicalshapes of the region, a periodical cycle of regularity is clear in the daily wind speedchange under general governance of local meteorological conditions. The averagewind speed will be used as the input data of our modeling.
Due to the importance of roughness length in energy balance models forevaporation estimation, many studies have been carried out for the determination of
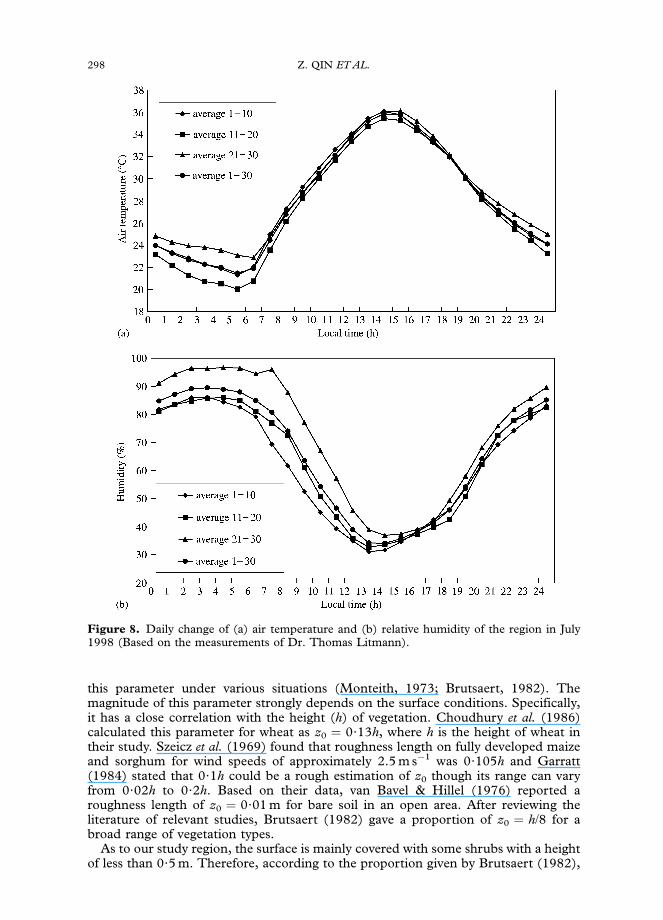
Figure 8. Daily change of (a) air temperature and (b) relative humidity of the region in July1998 (Based on the measurements of Dr. Thomas Litmann).
298 Z. QIN ET AL.
this parameter under various situations (Monteith, 1973; Brutsaert, 1982). Themagnitude of this parameter strongly depends on the surface conditions. Specifically,it has a close correlation with the height (h) of vegetation. Choudhury et al. (1986)calculated this parameter for wheat as z0 ¼ 0?13h, where h is the height of wheat intheir study. Szeicz et al. (1969) found that roughness length on fully developed maizeand sorghum for wind speeds of approximately 2.5 m s�1 was 0?105h and Garratt(1984) stated that 0?1h could be a rough estimation of z0 though its range can varyfrom 0?02h to 0?2h. Based on their data, van Bavel & Hillel (1976) reported aroughness length of z0 ¼ 0?01 m for bare soil in an open area. After reviewing theliterature of relevant studies, Brutsaert (1982) gave a proportion of z0 ¼ h/8 for abroad range of vegetation types.
As to our study region, the surface is mainly covered with some shrubs with a heightof less than 0?5 m. Therefore, according to the proportion given by Brutsaert (1982),
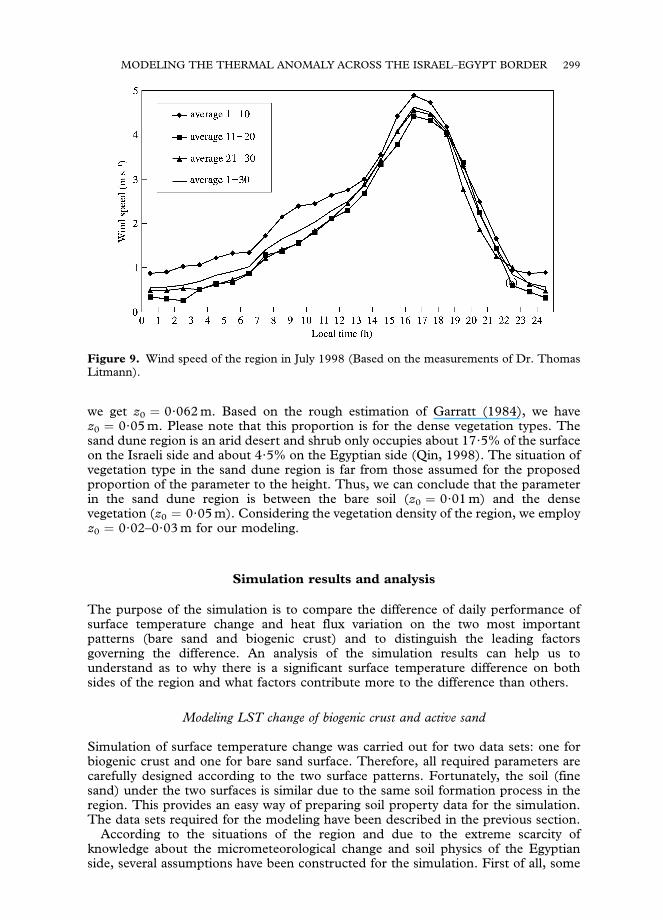
Figure 9. Wind speed of the region in July 1998 (Based on the measurements of Dr. ThomasLitmann).
MODELING THE THERMAL ANOMALY ACROSS THE ISRAEL–EGYPT BORDER 299
we get z0 ¼ 0?062 m. Based on the rough estimation of Garratt (1984), we havez0 ¼ 0?05 m. Please note that this proportion is for the dense vegetation types. Thesand dune region is an arid desert and shrub only occupies about 17?5% of the surfaceon the Israeli side and about 4?5% on the Egyptian side (Qin, 1998). The situation ofvegetation type in the sand dune region is far from those assumed for the proposedproportion of the parameter to the height. Thus, we can conclude that the parameterin the sand dune region is between the bare soil (z0 ¼ 0?01 m) and the densevegetation (z0 ¼ 0?05 m). Considering the vegetation density of the region, we employz0 ¼ 0?02–0?03 m for our modeling.
Simulation results and analysis
The purpose of the simulation is to compare the difference of daily performance ofsurface temperature change and heat flux variation on the two most importantpatterns (bare sand and biogenic crust) and to distinguish the leading factorsgoverning the difference. An analysis of the simulation results can help us tounderstand as to why there is a significant surface temperature difference on bothsides of the region and what factors contribute more to the difference than others.
Modeling LST change of biogenic crust and active sand
Simulation of surface temperature change was carried out for two data sets: one forbiogenic crust and one for bare sand surface. Therefore, all required parameters arecarefully designed according to the two surface patterns. Fortunately, the soil (finesand) under the two surfaces is similar due to the same soil formation process in theregion. This provides an easy way of preparing soil property data for the simulation.The data sets required for the modeling have been described in the previous section.
According to the situations of the region and due to the extreme scarcity ofknowledge about the micrometeorological change and soil physics of the Egyptianside, several assumptions have been constructed for the simulation. First of all, some

300 Z. QIN ET AL.
meteorological indicators such as global radiation, air temperature, air humidity andwind speed near the surface are assumed to have little variation on both sides of theregion due to the spatial adjacency. This may not be true, especially for airtemperature, air humidity and wind speed. Usually, air temperature is strongly relatedto the surface temperature and wind speed is due to the air temperature difference.Since the Israeli side is observed to be hotter, its air temperature should be higher thanthe Egyptian side. However, the assumption of similar air temperature on both sideswill allow us to focus our simulation on the variation of soil properties and surfacefeatures for explaining and understanding the LST anomaly of the region. Actually, aswe will see in the following simulation results, the simulated surface temperaturedifference with identical air temperature is slightly lower than the actually observedone. This means that the differences of air temperature, wind speed and air humidityalso have some effects on the difference of surface temperature. However, theirrelation with surface temperature is mutually dependent. Thus, in order to reveal theactual factors that lead to the occurrence of the thermal anomaly across the border, itis better to isolate the functioning of these mutually dependent factors by assumingthe same values for them in the modeling.
Second, surface temperature change on the Israeli side can be represented by thethermal performance of biogenic crust due to the fact that more than 72% of itsground surface is covered with the surface pattern (Qin & Karnieli, 2000). TheEgyptian side can also be represented by bare sand because of its surface constituents.The surface in the real world is in fact a mixed one composed of several patterns.Simulation through surface energy balance equation requires a specific data set for thesurface under consideration. For a mixed surface, some soil parameters such as soilconstituent fraction are really difficult to properly estimate through surfacecomposition. Therefore, the way to analyse the surface temperature change on bothsides is through comparison of thermal variation of the two typical surface patterns.
Third, the lower boundary conditions of soil profile for solving the soil heat transferequation and soil water movement equation are assumed to be the same for the twotypical surface patterns. No daily change of soil temperature and soil water content isassumed at about 0?5 m from the surface. Actually, daily heat penetration into the soilis within 30–50 cm depth in an arid environment (Hausenbuiller, 1978). According tothe reports of Fania & Zipora (1997) and Zemel & Lomas (1977) who monitored soiltemperature regime in Israel, the assumption of no daily soil temperature change atabout 50 cm depth is reasonable for the south Israeli desert environment.
Performance of daily surface temperature change on the two surfaces
The most important output of the modeling is the LST change of the two surfacesunder consideration. The simulated daily surface temperature change of bare sandand biogenic crust in the dry summer season is shown in Fig. 10(a). In order to have areference for comparison, the real average air temperature change is also plotted in thefigure, from which several features can be clearly identified. First of all, the surfacetemperature of biogenic crust and bare sand surface in the summer season can reachas high as 48–501C at about noon when temperature peak occurs. The range of thechange is quite well corresponded to the observed change through ground truthmeasurements and on remote sensing images (Qin et al., 2000). Note that the dataused for the simulation represent the general situation in the summer season and aremeasured at the Nizzana Research site on the Israeli side, which is adjacent tothe border. Thus, the simulation result based on the data only reveals the general orthe average change of surface temperature of the two surfaces in the area adjacent tothe border. This does not deny the possible higher or lower performance of the surface
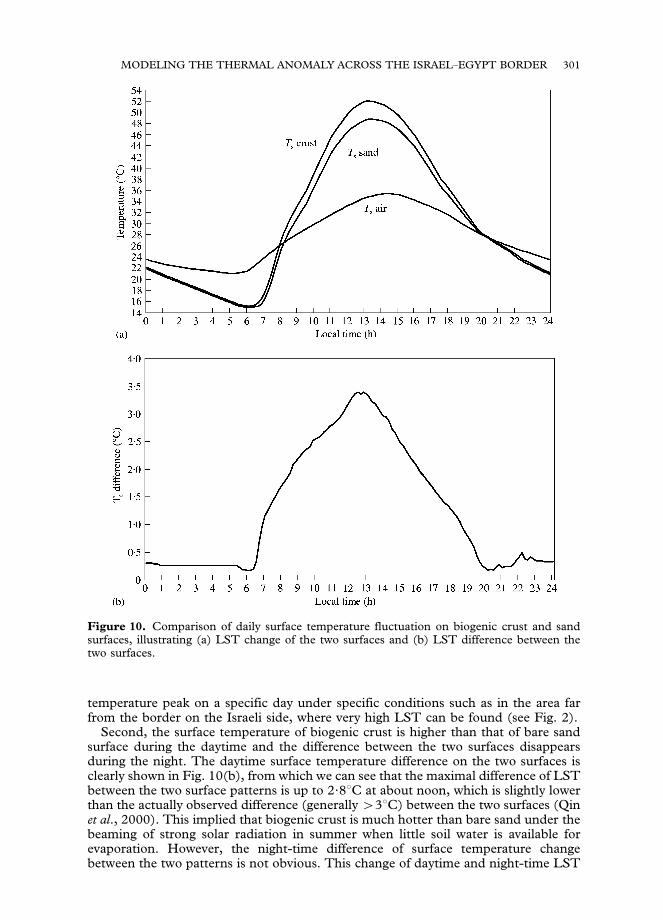
Figure 10. Comparison of daily surface temperature fluctuation on biogenic crust and sandsurfaces, illustrating (a) LST change of the two surfaces and (b) LST difference between thetwo surfaces.
MODELING THE THERMAL ANOMALY ACROSS THE ISRAEL–EGYPT BORDER 301
temperature peak on a specific day under specific conditions such as in the area farfrom the border on the Israeli side, where very high LST can be found (see Fig. 2).
Second, the surface temperature of biogenic crust is higher than that of bare sandsurface during the daytime and the difference between the two surfaces disappearsduring the night. The daytime surface temperature difference on the two surfaces isclearly shown in Fig. 10(b), from which we can see that the maximal difference of LSTbetween the two surface patterns is up to 2?81C at about noon, which is slightly lowerthan the actually observed difference (generally 431C) between the two surfaces (Qinet al., 2000). This implied that biogenic crust is much hotter than bare sand under thebeaming of strong solar radiation in summer when little soil water is available forevaporation. However, the night-time difference of surface temperature changebetween the two patterns is not obvious. This change of daytime and night-time LST
302 Z. QIN ET AL.
difference is extremely important in the explanation of thermal variation on both sidesof the region. The phenomenon of LST difference is observed to be obvious duringthe daytime at about 14:00 in situ satellite pass but this temperature difference is veryobscure on night-time image of remote sensing (Fig. 2(b)). More important is the factthat the simulated surface temperature at about midnight is about 221C (Fig. 10(a))and the sharp LST contrast tends to disappear at this temperature level.
Third, the surface temperature of biogenic crust and bare sand is much higher thanair temperature during the daytime and is much lower than air temperature during thenight-time. This is in accordance with the general situation of temperature change inan arid environment. Generally speaking, daytime in an arid environment is very hotand night-time is cool. Daily variation of air temperature is up to 151C and that ofsurface temperature is even higher (up to 351C).
Fourth, the surface temperature increases rapidly in the early morning and declinesrapidly in the late afternoon. The minimal surface temperature can be seen in the earlymorning at about 5:00 when it is about 151C. The surface temperature starts toascend from 6:30 and its maximal ascendance can be seen in the hours from 7:00 toabout 9:00. During this period, it climbs rapidly from about 161C to 331C. In theafternoon, rapid descent of surface temperature occurs in the hours from 16:00 toabout 19:00. It drops from about 421C to 271C. This change reveals the generalwarming and cooling process of the region in the hot dry summer season.
Sensitivity analysis of the modeling
The parameters for sensitivity analysis are the important ones that govern the surfacetemperature change of the region. Totally, 22 parameters are selected to test thesensitivity of the modeling. These parameters and the result of the sensitivity analysisare listed in Table 1.
What we are concerned with is the modeling of the surface temperature changeunder the governance of these parameters. Thus, the sensitivity analysis of themodeling is to test the change of surface temperature with the small change of theseparameters. The output of the modeling for the data set of biogenic crust surface isused as the reference of comparison for the sensitivity analysis. Because we are moreinterested in the change of surface temperature in the early afternoon when satellitepasses, the average surface temperature at 12:00–14:30 is used as the reference ofsurface temperature for the analysis. As to the small change of the parameters, wedefine it as 1%. Thus, for a specific parameter, the aim of the analysis is to answer thefollowing question: how many percents of surface temperature change would resultfrom the change of 1% in that parameter under consideration?
Table 1 indicates that the largest change in Ts is observed for a small change in airtemperature and global radiation. When air temperature increases by above 1%(about 0?361C), the average surface temperature will increase by about 0?3451C, with0?749%. Since air temperature and surface temperature are mutually dependent, weexpect that the actual higher air temperature exists on the Israeli side, whichconsequently exacerbates the surface temperature difference across the border. Anincrease of 1% in global radiation will result in 0?1281C increase in surfacetemperature, with 0?278%. Actually, air temperature and global radiation are thetwo essential factors of the modeling. Global radiation determines the amount ofenergy available for the micrometeorological and hydrological process in the soil–airinterface system. And air temperature governs the exchange of energy between theground and the air, and is the result of the exchange as well. Their sensitivity to LSTchange in the modeling implies their importance in the simulation.
A 1% increase in surface albedo, roughness length and surface emissivitycorresponds, respectively, to a decrease of 0?0591C, 0?0431C and 0?0221C in surface

Table 1. Sensitivity analysis of the simulation model
Parameters Change of Ts in 1C Change of Ts in %
Roughness length �0?04287 �0?09302Surface emissivity �0?02166 �0?04699Surface albedo �0?05914 �0?12831Soil thermal conductivity: quartz 0?00138 0?00300
Clay minerals 0?00144 0?00313Soil air �0?00272 �0?00589
Soil composition: quartz 0?00294 0?00638Clay minerals 0?00631 0?01371Organic materials �0?00213 �0?00462
Soil density �0?00321 �0?00696Soil specific heat �0?00321 �0?00696Initial soil water content 0?00557 0?01209Lower layer soil water content 0?00818 0?01775Initial soil temperature 0?00097 0?00212Lower layer soil temperature 0?00299 0?00650Air temperature 0?34519 0?74904Air relative humidity 0?00017 0?00038Wind speed �0?05514 �0?11965Global radiation 0?12829 0?27838Soil layer thickness �0?01062 �0?02303Surface layer thickness �0?00098 �0?00214Saturated hydraulic conductivity 0?00625 0?01357
MODELING THE THERMAL ANOMALY ACROSS THE ISRAEL–EGYPT BORDER 303
temperature, which account for 0?128%, 0?093% and 0?047% of the surfacetemperature. An increase of 1% in soil layer thickness would lead to about 0?011Cdecrease of surface temperature, accounting for 0?023%. The model appears to beinsensitive to the change of other parameters, including soil thermal conductivity, soilcomposition structure, initial soil temperature, soil water content and so on. Asindicated in Table 1, a 1% change of these parameters would lead to less than 0?011Cor less than 0?02% change of surface temperature. Their insensitivity implies that themodeling result of LST change will not be obviously shaped by the possible smallerror of these parameters in preparation of the required data sets for the modeling.
Comparison of surface energy balance
Only a part of the global radiation reaching the ground surface is absorbed by theground and hence enters the energy balance process of the land–air interface system.The remainder of the radiation is reflected back toward the atmosphere withoutaffecting the surface temperature of the ground soil. The density of reflection oralbedo largely determines the energy that drives the thermal movement of the groundsoil. This can be clearly shown by the simulation results of the region. The comparisonto the change of the main parts of surface energy balance is shown in Fig. 11. Due tomuch lower albedo of biogenic crust, the amount of net radiation on the crust surfaceis much greater than that on the bare sand during the day (Fig. 11(a)). The averagenet radiation on biogenic crust surface is as high as 585?69 W m�2 in the hours 12:00–15:00, which is about 26?42% greater than that on the bare sand surface. This
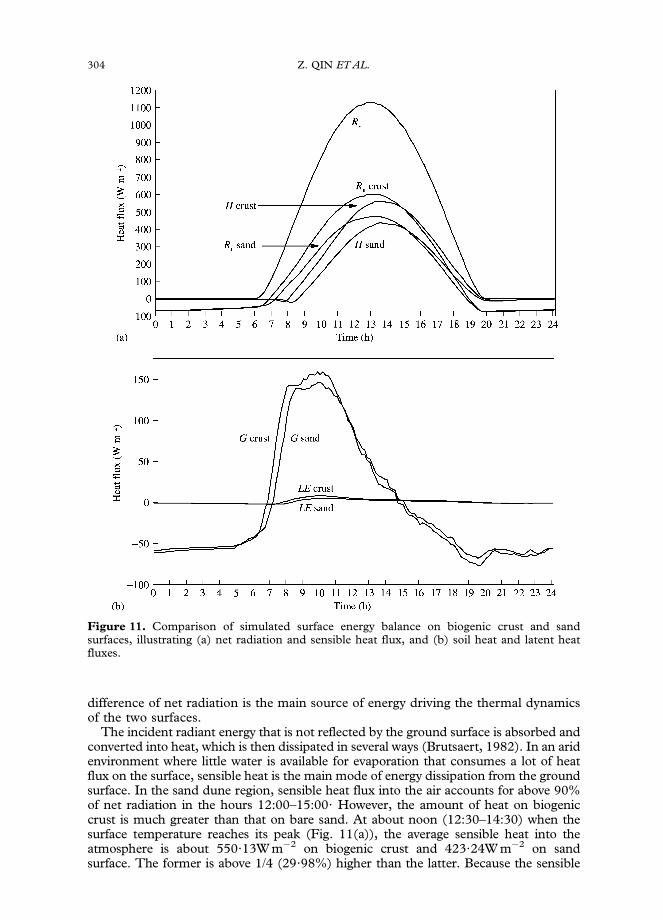
Figure 11. Comparison of simulated surface energy balance on biogenic crust and sandsurfaces, illustrating (a) net radiation and sensible heat flux, and (b) soil heat and latent heatfluxes.
304 Z. QIN ET AL.
difference of net radiation is the main source of energy driving the thermal dynamicsof the two surfaces.
The incident radiant energy that is not reflected by the ground surface is absorbed andconverted into heat, which is then dissipated in several ways (Brutsaert, 1982). In an aridenvironment where little water is available for evaporation that consumes a lot of heatflux on the surface, sensible heat is the main mode of energy dissipation from the groundsurface. In the sand dune region, sensible heat flux into the air accounts for above 90%of net radiation in the hours 12:00–15:00? However, the amount of heat on biogeniccrust is much greater than that on bare sand. At about noon (12:30–14:30) when thesurface temperature reaches its peak (Fig. 11(a)), the average sensible heat into theatmosphere is about 550?13W m�2 on biogenic crust and 423?24W m�2 on sandsurface. The former is above 1/4 (29?98%) higher than the latter. Because the sensible

MODELING THE THERMAL ANOMALY ACROSS THE ISRAEL–EGYPT BORDER 305
heat is proportional to the temperature difference between the surface and the air nearthe surface, the greater the heat the greater is the temperature difference under the sameconditions of wind speed and surface roughness length. Given the same air temperature,this means that the biogenic crust surface is much hotter than the bare sand.
The change of soil heat and latent heat flux is shown in Fig. 11(b), from which wecan see that the two heat fluxes are much less than sensible heat fluxes into the air. Inthe case of biogenic crust surface, the average soil heat is only about 63?14W m�2 atthe noon 12:00–13:00, which only accounts for about 10?68% of the net radiation and5?65% of the global radiation. And at this time, the average latent heat is only about4?36W m�2, accounting for 0?74% of the net radiation. The soil heat flux on bare sandis a little bit greater than that on biogenic crust. At about noon, the average soil heaton bare sand is about 68?12W m�2 and latent heat 3?36W m�2, accounting for14?67% and 0?72% of its net radiation. This implies that heat transfers more stronglyto the soil on sand surface than on biogenic crust, while the evaporation, in spite ofbeing very weak, is relatively stronger from biogenic crust than from sand surface atabout noon. Compared with net radiation and sensible heat flux, the conclusion canbe drawn that the amount of these two parts is too small to have a significant effect onthe surface temperature change.
From the latent heat flux we can estimate the net loss of soil moisture per day in thehot summer season. The total amount of latent heat flux is 270?15W m�2 on thebiogenic crust and 190?33W m�2 on the sand surface. Thus, the total evaporation isabout 0?066kg day�1 m�2 from the biogenic crust and 0?047 kg day�1 m�2 from baresand. The negative latent heat flux during the night also indicates that there is a processof dew formation, which releases some energy for the balance of the system. The totalnegative latent heat flux is about 77?95W m�2 on biogenic crust and 90?52W m�2 onactive sand, corresponding to 0?019 and 0?022 kg of dew formation, respectively. Thissimulation result of dew formation amount is very close to the measurement of Kidron(1999) in the region. The main reason for more dew forming on bare sand surfaceduring the night probably is that it has a relatively lower LST than biogenic crust.Balanced from evaporation and dew absorption, the net soil moisture lost in the aridenvironment is about 0?047 kg day�1m�2 on biogenic crust and 0?025 kg day�1 m�2 onactive sand. The result also indicates that evaporation is slightly stronger from biogeniccrust than from active sand. This explains the difference of soil moisture contentobserved in the hot summer season in the layers under the two typical surfaces.
The change of the above main parts of the surface energy balance experiences adifferent process in the night-time when there is no solar radiation. Figure 11(a)indicates that net radiation and sensible heat into the air are negative on both surfaces.And negative soil heat flux and latent heat flux can also be seen in Fig. 11(b). Thisimplies that during the night the surface energy reaches balance by getting heat fluxfrom both the air and the soil. However, the heat flux released from the soil and the airis quite small and it does not exceed 80W m�2. Another feature is that the heat fluxseems to be stable during the night. The dew forming on the two surfaces during thenight quickly evaporates in the early morning when the sun comes up. Thus, themaximal latent heat appears at about 9:00–10:00 (Figure 11(b)) and it is about7W m�2 for biogenic crust and 5W m�2 for active sand. This evaporation processexplains the rapid ascendance of the surface temperature in the morning.
Change of main parameters in the surface energy balance
Analysis of the change of main parameters in the system can also assist inunderstanding the difference of surface energy balance on the two surface patterns.
As indicated above, sensible heat flux into the atmosphere is the main way ofdissipating the energy absorbed by the ground. According to Eqn (3), sensible heat

Figure 12. Comparison of (a) air heat resistance and (b) surface resistance to evaporation onbiogenic crust and bare sand surfaces.
306 Z. QIN ET AL.
flux into the air is proportional to the land–air temperature difference and inverselyproportional to air heat transfer resistance. Given that the air density and heat capacityshow little variation in the temperature range, sensible heat into the air is mainlycontributed by the land–air temperature difference. On the other hand, air heatresistance also plays an important role in governing sensible heat flux (Lhomme et al.,1994). Figure 9.3(a) compares the air heat resistance of the two surface patterns.Generally speaking, the change of air heat resistance is similar for the two surfacepatterns, especially in the daytime. This is mainly because air heat resistance isdetermined by wind speed and we assume the same wind velocity for the two surfaces.Although the air heat resistances between the two surfaces are very close, a slightdifference can still be seen (Fig. 12(a)), being greater on bare sand than on biogeniccrust. During the day, land–air temperature difference is big and wind speed is high.Thus, heat is easily transferred into the air. From 8:30 to 19:30, air heat resistance ofthe two surfaces is rather small. Minimal air heat resistance occurs in the lateafternoon at about 16:00–17:00 when the wind is the strongest. Maximal resistance
MODELING THE THERMAL ANOMALY ACROSS THE ISRAEL–EGYPT BORDER 307
occurs at about midnight when wind speed declines to the lowest. During the night airresistance is much higher than during the day. Very big air heat resistance during thenight makes the sensible heat flux quite small.
Surface resistance to evaporation is also a very important factor in determining theevaporation rate and hence the latent heat flux (Van Bavel et al., 1976; Brutsaert,1982; Garratt, 1984). In an arid environment, soil water content is extremely low,surface resistance to evaporation is very high. As indicated in Fig. 12(b), surfaceresistance to evaporation is generally greater on sand than on biogenic crust. This isbecause biogenic crust has a little bit higher surface soil moisture content than baresand (Fig. 13(a)). Maximal resistance occurs in the early afternoon when surfacewater content is the lowest due to consecutive evaporation in the previous hours.Surface resistance to evaporation is as high as 13,000 s m�1 on bare sand and12,000 s m�1 on biogenic crust in the early afternoon. Minimal surface resistance toevaporation can be seen at dawn when the surfaces have the highest moisture contentdue to their absorption of dew during the night. Actually, the change of surfaceresistance to evaporation is in accordance with the fluctuation of soil moisture contentin the surface layer.
Availability of soil moisture is one of the three critical conditions for evaporation.The amount of water in the soil directly affects the amount of energy consumed toevaporate water (Williams & Balling, 1996). In the border region, the soil moisture isvery low during the hot dry summer. The small evaporation in the border region (Fig.11(b)) is mainly due to its extremely low level of soil water content. Figure 13(a)compares the change of volumetric water content of the two surface patterns. Thesurface moisture change shown in Fig. 13(a) is in accordance with our measurementsof soil water change given in the previous section. The surface moisture of biogeniccrust is obviously higher than that of bare sand, even though their absolute differenceis only about 0?6 kg m�3 during the day. In the daytime, surface moisture tends todecline because of evaporation. The moisture content reaches minimum in the earlyafternoon at about 13:00–15:00 when LST is very high. In the night-time the surfaceabsorbs some moisture from the air, which makes its moisture content graduallyincrease till dawn at about 6:00 (Fig. 13(a)).
Comparison of soil moisture content at 10 and 20 cm depth is also plotted in Fig.13(a). Due to little heat flux penetrating into the lower layers of the profile, soilmoisture content showed less fluctuation with the depth of 20 cm. At a depth of10 cm, soil moisture shows very small daily change and at 20 cm the change is little.Another important feature is that soil moisture content at 10 cm depth is greaterunder biogenic crust surface than under bare sand surface. However, the situation at20 cm is the opposite. Soil moisture content under biogenic crust is less than thatunder sand surface. This is in accordance with what we observed in the measurementsof soil water content.
Under unsaturation, soil relative humidity is mainly dependent on soil watercontent though temperature is also an important determinant. Figure 13(b) shows thechange of soil relative humidity on the two surfaces. The change is similar to that ofthe surface moisture content. During the night, biogenic crust has a little bit highersurface relative humidity than active sand. In the morning, the relative humidity ofsand surface is higher than that of biogenic crust. However, in the afternoon, biogeniccrust has a little bit higher relative humidity than bare sand. This may be because thesoil under biogenic crust has higher hydraulic conductivity and the biogenic crust hasa greater evaporation rate than bare sand (Fig. 11(b)).
Comparison of surface vapor pressure on the two surfaces is illustrated in Fig.13(c), which also plots air vapor pressure as a reference. According to Eqn (6),evaporation from the surface occurs when vapor pressure of the surface is greater thanthe air and dew formation occurs when the air vapor pressure is greater than thesurface. From Fig. 13(c) we can see that the vapor pressure of the two surfaces is

Figure 13. Comparison of (a) soil moisture content, (b) surface relative humidity and (c)surface vapor pressure on biogenic crust and sand surfaces.
308 Z. QIN ET AL.

MODELING THE THERMAL ANOMALY ACROSS THE ISRAEL–EGYPT BORDER 309
greater than air vapor pressure in the daytime from about 8:00 to about 20:00. Thismeans that evaporation from both surfaces occurs during this period even though it israther weak. Dew formation also occurs in the arid environment during the nightbecause air vapor pressure is greater than surface vapor pressure. However, acomparison of the area between surface vapor pressure and air vapor pressure revealsthat evaporation is greater than vapor absorption, as described above. Figure 13(c)also indicates that biogenic crust has a higher surface vapor pressure than bare sandsurface. This implies that evaporation from biogenic crust is relatively stronger thanthat from active sand. The lower vapor pressure of sand surface during the night alsoindicates more dew formation on bare sand surface than on biogenic crust, asmentioned above.
Contribution of leading factors to surface temperature difference
Based on the above modeling results, we try to isolate the contribution of the leadingfactors to the surface temperature difference on the two surfaces. Assuming the sameeffects in terms of such meteorological factors as global radiation, wind speed and airtemperature, the leading factors of the model that may lead to the difference of surfacetemperature between the two surface patterns can be distinguished as albedo, surfaceemissivity and soil properties especially soil moisture.
The difference of surface albedo between biogenic crust and bare sand has animportant effect on the LST difference of the two surface patterns. As we have seen inthe previous section, biogenic crust has an albedo of about 13% lower than bare sand.Thus, under the same global radiation, biogenic crust absorbs much more energyfrom the incident radiation than bare sand. The simulation indicates that thedifference of albedo accounts for more than 86% of net radiation difference betweenthe two surfaces. As shown in Fig. 11(b), the average difference of surface temperaturebetween the two patterns is 2?631C in the hours 12:00–15:00. Using the albedo ofbiogenic crust and the sand soil properties for simulation, we obtain the averagesurface temperature of 49?251C in the same period, which is about 2?311C higher thanLST of bare sand and 0?321C lower than LST of biogenic crust. Therefore, we canconclude that about 87?83% of the surface temperature difference between the twosurfaces is contributed by its albedo difference.
The simulation indicates that surface emissivity difference has little effect on theLST difference between the two surface patterns. We also test the contribution ofsurface emissivity difference to the LST difference of the two surface patterns. Usingthe emissivity of biogenic crust and soil properties of bare sand for simulation, we findthat the surface emissivity difference can only lead to about 0?051C of LST changefrom the LST of biogenic crust. This implies that the difference of surface emissivitycan only explain about 1?90% of the LST difference between the two surfaces.
The difference of soil properties especially soil moisture also has an important effecton the LST difference between the two surface patterns. As mentioned above, soilproperties are different under the two surfaces. The soil under biogenic crust hashigher water content in the upper layers and lower soil moisture content in the lowerlayers. Consequently, evaporation from biogenic crust surface is greater than that frombare sand. Due to the different soil constituents, the surface layer of bare sand hasmuch higher thermal conductivity than biogenic crust. Higher thermal conductivity ofbare sand makes its heat transfer a little bit faster into the subsoil than it is in biogeniccrust. Moreover, higher heat capacity in the subsoil of bare sand due to its higher soilmoisture content also makes it more difficult to be heated than the subsoil under thebiogenic crust. Soil heating process has proportional correlation to the change ofsurface temperature and evaporation. The combined functioning of these two aspectsmakes the soil temperature increase slightly easier under biogenic crust than under

310 Z. QIN ET AL.
bare sand. And this finally shapes the different change of their surface temperatureregime and energy balance on the two surfaces.
It is really difficult to separate the effect of all soil properties on LST changebecause they are interrelated to each other. Therefore, we roughly count their effect asthe remainder of the total minus the effect of albedo and ground emissivity. In thisway, the difference of soil properties especially, soil moisture, accounts for about10?27% of the total LST difference between the two surface patterns.
Given the strong solar radiation in the summer season, the thin surface layer (1–5 mm) of biogenic crust can be easily heated in spite of its relatively higher moisturecontent. In the arid environment, soil water content is extremely low and evaporationcan only consume a very small part of the total energy absorbed by the surface. Asindicated in Fig. 11(b), at 12:00–15:00 evaporation only accounts for about 0?61% ofnet radiation in the case of bare sand and for 0?65% in the case of biogenic crust. Thissmall percentage of latent heat flux has little effect on the cooling down of the groundsurface. As a result, the surfaces experience different warming processes due to thedifferences in absorbed incident sky radiation. Obviously, the surface energyabsorption accumulates more in the upper biogenic crust layer than the bare sandsurface layer. And this makes the surface of biogenic crust hotter than that of baresand. Even though the involved process is rather complicated, the mechanism is veryclear, i.e. the greater amount of main surface flux components on biogenic crustmakes its surface temperature more difficult to reach its surface energy balance at ahigher level than it is on bare sand surface.
Understanding thermal variation on both sides of the region
The above analysis and explanation of surface temperature difference on the twotypical surface patterns can be extended to the understanding of surface temperaturedifference and thermal variation on both sides of the Israel–Egypt border region. TheIsraeli side has above 72% of biogenic crust cover and the Egyptian side above 80% ofbare sand surface (Qin & Karnieli, 2000). Their surface albedo difference is also veryobvious, as indicated in the previous section. The lower surface albedo on the Israeliside makes it absorb much more incident solar energy and atmospheric emittance.Although most of the net radiation returns into the atmosphere as sensible heat, theremainder is still obviously greater on the Israeli side than on the Egyptian side andthis remainder is very strongly related to the surface and soil temperature change andsoil moisture movement. During the hot summer season, the region is very dry. Mostvegetation is in dormancy (Otterman & Tucker, 1985; Karnieli & Tsoar, 1995).Leaves of shrubs reduce to minimum and more than two-third of canopy is deadaccording to our field observation. The dead canopy is not only out of functioningevaporation but also forms the debris that absorbs more incident radiation due to itsdarker tone and hence lower albedo. Even though the Israeli side has more vegetation,the evaporation contributed by the vegetation is still very small in comparison with thenet radiation. Together with the transpiration contribution of vegetation, the averageevapo-transpiration at 12:00–15:00 on the Israeli side is estimated to be about41W m�2, accounting for 7% of the net radiation. This small latent heat flux has littleeffect on the surface energy balance process in the arid environment. LST change inthe arid environment is then mainly controlled by the amount of incident solar energyabsorbed by the ground as soil heat. Therefore, the anomalous LST change andthermal variation on both sides of the region can still be explained as the direct resultof the obvious albedo difference on both sides, as Otterman (1974) did. This albedodifference is mainly caused by the sharp contrast of surface composition on both sides.As mentioned above, the Israeli side has much more biogenic crust while the Egyptianside is mainly dominated by bare soil and active sand as a result of overgrazing.

MODELING THE THERMAL ANOMALY ACROSS THE ISRAEL–EGYPT BORDER 311
Considering this sharp contrast, the LST anomaly observed on remote sensing imagescan be understood as the result of spectral functioning difference of biogenic crust andbare sand on both sides of the region.
Soil properties on the Israeli side can be viewed as similar to those of biogenic crustand on the Egyptian side similar to those of bare sand. This similarity can be used tounderstand soil heat transfer on both sides of the region. As mentioned above, the heataccumulating on the surface of biogenic crust is greater than that on bare sand, due tothe difference of soil properties especially soil thermal conductivity. This functioningprocess also exists on both sides of the region because of their surface compositiondifference. Most of the surface on the Israeli side is covered with biogenic crust whichhas lower thermal conductivity while the surface of the Egyptian side is dominated bybare sand having relatively higher thermal conductivity. Therefore, we can expect thatthe Israeli side has more heat accumulation on its surface due to its relatively lowerthermal conductivity than the Egyptian side. Finally, the ground on the Israeli side hashigher surface temperature. Therefore, except for the main contribution of spectralfunctioning difference of biogenic crust and active sand, subsoil properties as a wholeare the second main factor leading to the anomalous LST change and thermalvariation observed in the border region.
Comparison with Charney’s classic studies and other related studies
In the mid-1970s, Charney and his co-workers conducted a series of studies on theinteraction between desertification and climate in Sahel and other dryland regions(Charney, 1975; Charney et al., 1975, 1977). They proposed a biogeophysicalfeedback model, also dubbed albedo model (Williams & Balling, 1996). On the basisof their investigation of Sahel and Sahara drought, Charney and his co-workers arguedthat overgrazing due to settlement and over-population in arid and semi-arid regionswill lead to the reduction of vegetation cover and hence to an increase in surfacealbedo. Consequently, the increased albedo will decrease surface net radiation, resultin surface cooling and lower ground surface temperature, promote subsidence of airaloft, reduce convection and cloud formation, thereby reducing regional rainfall in thearid and semi-arid regions. Additional drying in the Sahel region leads to regionalclimatic desertification which positively feeds back to the overgrazing and follows thecircling procedures. Using a general circulation model developed for meso-scaleregional atmospheric and climate simulation, they demonstrated the important effectof albedo on regional climate, especially rainfall in Sahel, Sahara and other drylandregions. The propositions and assumptions underpinning the studies became knownas Charney hypothesis (Williams & Balling, 1996). Based on the simulation with twodifferent surface albedos (low albedo 14% represents low human stress and highalbedo 35% the high stress due to overgrazing), Charney et al. (1975) found that themean rainfall over Sahara during the calendar month of July decrease by about 43%from low-albedo to high-albedo experiments. And the results from the high-albedoexperiment are quite close to the observed distribution of rain in Sahara summer.Thus, they concluded that surface albedo can have a sustantial effect on climate inSahara and very local changes in albedo may be sufficient to produce droughts.
It seems that the higher surface albedo leading to higher surface temperature in theborder region of our study supports the Charney hypothesis about the function ofalbedo in climate change. Close comparison still finds some differences between ourstudy and that of Charney. In Charney’s studies, it is assumed that overgrazing leadsto the reduction of vegetation cover, which in turn leads to the increase in surfacealbedo. Thus, the importance of albedo in Charney’s biogeophysical feedback modelis based on the direct relationship between vegetation and surface albedo. In theborder region, the obvious difference of surface albedo across the border is not only

312 Z. QIN ET AL.
due to the vegetation difference, but also due to the biogenic crust difference (Karnieli& Tsoar, 1995). Overgrazing on the Egyptian side not only causes the reduction ofvegetation, but also prevents the establishment of biogenic crust on the surface.Actually, it is the biogenic crust difference that leads to the substantial difference inalbedo across the border. Desert plants, which still have much higher evapo-transpiration, contribute much less to the albedo difference across the border. Despitethe support from a variety of modeling studies, the Charney hypothesis was vigorouslychallenged on theoretical and empirical grounds (Williams & Balling, 1996). SinceCharney’s model is based on the direct contribution of vegetation to albedo, itsassumption about the higher surface albedo leading to higher surface temperature hasnot been seen in other arid regions. This is mainly because the lower albedocontributed by more vegetation cover still has higher evapo-transpiration that preventsthe increase of surface temperature. On the other hand, since the bare surface as aresult of vegetation removal is easy to be dried and hence has very low top-soilmoisture that prevents soil heat transfer into lower layers, the surface with high albedocontributed by low vegetation still has relatively higher surface temperature. This hasbeen observed across the US–Mexico boder (Balling, 1989). Only in the region wherelower surface albedo is not prevalently contributed by vegetation and where soilmoisture is very low such as our region, the phenomenon of higher surface albedoleading to lower surface temperature is possible.
Another important condition for the occurrence of surface temperature anomalyacross the border is the very low soil moisture in the region. Many numerical modelingstudies showed that soil moisture is also very important in affecting climate change inthe arid and semi-arid regions (Williams & Balling, 1996). Cunning & Rowntree(1986) demonstrated that Sahara climate is related not only to surface albedo changebut also to soil moisture changes and the importance of soil moisture could overridethe changes to the albedo. Combining the local energy balance model with a globalclimate model, Lanicci et al. (1987) found that soil moisture changes in the drylandsof the American Great Plains could have an important impact on the location andintensity of convective storms. Franchito & Rao (1992) developed a global model thatincludes detailed biogeophysical feedbacks to simulate the effects of desertificationand found that desertification causes a reduction in local net radiation, soil moisture,evaporation and precipitation which consequently results in an increase in localsurface and near-surface temperature. In our region, the soil moisture is extremely lowduring the hot dry summer. Our field sampling found an insignificant difference in soilmoisture of the top layer under bare sand and biogenic crust. The insignificantdifference in soil moisture between the two main surface patterns which, respectively,represents the surface on both sides makes it easy to understand its relatively lessimportance than albedo in leading to the occurrence of the surface temperatureanomaly across the border.
Conclusion
An anomalous thermal phenomenon was observed in the daytime remote sensingimages in the sand dunes across the Israel–Egypt border. This interestingphenomenon has not been thoroughly studied for understanding its occurrence,especially from the viewpoint of micrometeorological modeling. A complete surfaceenergy balance model that couples soil temperature change simultaneously with soilmoisture dynamics has been established in the paper in order to simulate the surfacetemperature change and heat flux variation of the region. Various measurements havebeen conducted at the Nizzana Research site on the Israeli side of the region for therequired simulation data. Using the data and the numerical solution methodology of

MODELING THE THERMAL ANOMALY ACROSS THE ISRAEL–EGYPT BORDER 313
the model, the surface temperature and heat flux change has been simulated on thetwo most important surface patterns of the region: biogenic crust representing theIsraeli side and bare sand representing the Egyptian side.
Simulation results indicate that the surface temperature of biogenic crust and baresand in summer can reach as high as about 48–501C. According to the model,biogenic crust does have a surface temperature of about 2?5–2?81C higher than baresand in the hours 12:00–15:00. During the night, the difference of surfacetemperature between biogenic crust and bare sand is not obvious. A sensitive analysisof the model indicates that the largest change in Ts is observed in a small change of airtemperature and global radiation, which is followed by surface albedo, roughnesslength and surface emissivity. A 1% increase of air temperature and global radiationwill lead to 0?75% and 0?28% increase of LST. And the same amount of surfacealbedo, roughness length and emissivity increase will result in 0?13%, 0?09% and0?05% decrease of surface temperature. Comparison of surface energy balance revealsthat the average net radiation of biogenic crust can reach up to 585?69W m�2 in thehours 12:00–15:00, which is about 26?42% higher than that of active sand. More than85% of net radiation returns into the air as sensible heat flux. The average soil heatflux of biogenic crust is about 63?14W m�2 in the noon hour 12:00–13:00, accountingfor 10?68% of net radiation. The amount of soil heat flux is a little bit greater on sandsurface than on biogenic crust. Due to little soil moisture available for evaporation,latent heat flux of biogenic crust is only 4?14W m�2 at noon, accounting for 0?74% ofnet radiation. For the bare sand, latent heat is only 3?36W m�2 and accounts for0?72% of its net radiation. Daily evaporation of the region is very small under the aridenvironment. Net soil water loss due to evaporation is estimated to be about0?047 kg day�1 on biogenic crust and about 0?025 kg day�1 on bare sand. Negativelatent heat flux during the night also indicates the formation of some dews on bothsurfaces. But bare sand surface, due to its relatively lower LST at night, seems toobtain more moisture from the air than biogenic crust. This difference in surfaceenergy balance also produces different change of subsoil properties especially soilmoisture content at various depths and the surface vapor pressure and relativehumidity. The mutual connection of these changes finally determines LST differenceand thermal variation on the two typical surface patterns of the region.
The LST anomaly on both sides of the border region can be understood in severalways. First of all, surface composition difference between the two sides is the directreason for the LST anomaly. The Israeli side is mainly composed of biogenic crust,which covers about 72% of the surface. Bare sand only accounts for about 7% of itssurface. However, the Egyptian side is mainly covered with bare sand, which accountsfor above 80% of the total area. Biogenic crust and vegetation only account for about12% and 4?5% of the total surface area. With the assumption of similar atmosphereand similar subsoil composition and formation on both sides, this difference of surfacecomposition directly explains the occurrence of the LST anomaly on both sides eventhough the functioning mechanics of the process is rather complicated.
Second, the surface composition difference on both sides leads to the difference ofsurface and subsoil properties. The combined functioning of this surface and subsoilproperty difference makes the LST change on both sides appear to be of difference inits expression. The coherent mechanics can be understood through the simulationresults of surface energy balance model. According to their surface composition, theIsraeli side can be represented with biogenic crust and the Egyptian side with baresand. Simulation results indicate that biogenic crust and bare sand do have an obviousLST difference under the assumption of the same global radiation, wind speed, airtemperature and relative humidity. The LST difference between the two surfacepatterns can reach up to about 2?5–2?81C in the early afternoon when satellite passedand observed the LST of the region. The most important factor leading to the LSTdifference of the two surface patterns is surface albedo, which accounts for
314 Z. QIN ET AL.
about 87?83% of the LST difference between the two surfaces. Subsoil properties alsohave a significant effect on the LST difference of the two surface patterns. It canexplain about 10?27% of the LST difference. Although surface emissivity hassignificant difference on the two typical surface patterns and hence on both sides, itcan only account for about 1?90% of the LST difference between the two surfaces.
Third, the mechanism of the LST difference on the two typical surface patterns canbe summarized as follows. The biogenic crust surface has much lower surface albedo.Thus, it absorbs much more incident sky radiation than bare sand surface. Eventhough most of the absorbed energy is dissipated as sensible heat into the air, theremainder of the absorbed energy is also much more on the biogenic crust than on thebare sand. This remainder energy is dissipated mainly in two ways: heat into the soiland evaporation. Because soil water content is extremely low in the arid environment,evaporation only accounts for about 0?5–1% of the total net radiation. Therefore, theslightly higher evaporation on biogenic crust is not enough to cool down the muchhigher surface temperature due to greater absorption of the incident radiation in thearid environment.
The difference of soil composition in the surface layer plays an important role inshaping LST change on the two surfaces. Due to higher quartz content, thermalconductivity of surface layer on bare sand is greater than that on biogenic crust eventhough the latter has a little bit more soil moisture content. At a depth of about10–15 cm onward, the subsoil under bare sand has more moisture content than thesubsoil under biogenic crust. Consequently, this changes the soil properties under thetwo typical surfaces. Higher soil thermal conductivity of surface layer on bare sandmakes its soil heat transfer a little bit easier than it is on biogenic crust. In other words,heat is more difficult to go down into the lower layers under biogenic crust and easierto accumulate in the upper thin layer of biogenic crust. This makes its surfacetemperature even easier to ascend.
Finally, this mechanism of heating process difference on the two typical surfacepatterns can be extended to understand the LST anomaly on both sides of the region.During the hot summer season, the region is very dry and vegetation is in dormancy.Leaves of most shrubs reduce to minimum. Even though the Israeli side has morevegetation, the evapo-transpiration contributed by the vegetation is still very small incomparison with the net radiation. This small latent heat flux has little effect on thesurface energy balance process in the arid environment. LST change in the desertregion is mainly controlled by the amount of incident solar energy absorbed by theground as soil heat. Therefore, the anomalous LST change and thermal variation onboth sides of the region can still be explained as the direct result of the obvious albedodifference on both sides. This albedo difference is mainly caused by the sharp contrastof surface composition on both sides as a result of spectral functioning differencebetween biogenic crust and bare sand. On the other hand, the Israeli side has astronger evaporation rate than the Egyptian side. This means that the soil watercontent may be easier to lose on the Israeli side than on the Egyptian side where baresand prevails. After a long time of consecutive evaporation in the hot summer, thesubsoil of Israeli side on average may have less soil moisture than that of the Egyptianside. And this property together with the low thermal conductivity of the crust mayfinally exacerbate soil heat accumulation on its surface layer (the thin biogenic crust).As a result, this makes its surface temperature easily increased. On the Egyptian side,relatively higher subsoil moisture content combined with the relatively greater thermalconductivity of the sand will speed up its soil heat transfer from the surface into thelower layers. This can also intensify the existing LST anomaly on both sides.
The authors would like to thank Dr Heike Schmid, their colleague at the RemoteSensing Laboratory, for helping to access the study region for various measurements,
MODELING THE THERMAL ANOMALY ACROSS THE ISRAEL–EGYPT BORDER 315
Dr Simon Berkowics, the administrator of The Arid Ecosystems Research Center,Inst. of Earth Sciences, The Hebrew University of Jerusalem, for offering thepermission to conduct the required measurements in the Nizzana Research site andproviding the rainfall data about the region, and Dr Thomas Litmann, Institute ofGeography, Martin Luther University, Germany for providing one-month data of hismeasurements on air temperature, air relative humidity and wind speed of the region.
References
Balling Jr, R.C. (1989). The impact of summer rainfall on the temperature gradient along theUnited States–Mexico border. Journal of Applied Climatology, 28: 304–308.
Berliner, P. (1988). Contribution of heat dissapated at the soil surface to the energy balance of acitrus orchard. Ph.D. thesis, Hebrew University, Jerusalem, Israel.
Blad, B.L. (1983). Energy exchange among leaf, canopy and environment. In: Teare, I.D. &Peat, M.M. (Eds), Crop-Water Relations, pp. 1–39, New York, U.S.A.: John Wiley and Sons,547pp.
Bristow, K.L., Campbell, G.S., Papendick, R.I. & Elliott, L.F. (1986). Simulation of heat andmoisture transfer through a surface residue-soil system. Agricultural and Forest Meteorology, 36:193–214.
Brutsaert, W. (1982). Evaporation into the Atmosphere: Theory, History and Application. Dordrecht,The Netherlands: D. Reidel Publishing Company, 299 pp.
Charney, J.G. (1975). Dynamics of deserts and drought in the Sahel. Quarterly Journal of theRoyal Meteorological Society, 101: 193–202.
Charney, J.G., Stone, P.H. & Quirk, W.J. (1975). Drought in the Sahara: a biogeophysicalfeedback mechanism. Science, 187: 434–435.
Charney, J.G., Quirk, W.J., Chow, S. & Kornfield, J. (1977). A comparative study of the effects ofalbedo change on drought in semi-arid regions. Journal of Atmospheric Sciences, 34: 1366–1385.
Chen, D.X. & Coughenour, M.B. (1994). GEMTM: a general model for energy and masstransfer of land surfaces and its application at the FIFE sites. Agricultural and ForestryMeteorology, 68: 145–171.
Choudhury, G.J., Reginato, R.J. & S.B. (1986). An analysis of infrared temperature observationsover wheat and calculation of latent heat flux. Agricultural and Forest Meteorology, 37: 75–88.
Courault, D., Lagouarde, J.P. & Aloui, B. (1996). Evaporation for maritime catchmentcombining a meteorological model with vegetation information and airborne surfacetemperatures. Agricultural and Forestry Meteorology, 82: 93–117.
Crank, J. & Nicolson, P. (1947). A practical method for numerical evaluation of solutions ofpartial differential equations of the heat conduction types. Proceeding of Cambridge PhilosophySociety, 43: 50–67.
Cunning, W.M. & Rowntree, P.R. (1986). Simulations of the Saharan atmosphereFdependenceon moisture and albedo. Quarterly Journal of the Royal Meteorological Society, 112: 971–999.
Diak, G. R. & Whipple, M.S. (1993). Improvements to models and methods for evaluating theland surface energy balance and ‘effective’ roughness using radiasonde reports and satellite-measured ‘skin’ temperature data. Agricultural and Forest Meteorology, 63: 189–218.
Dolman, A.J. (1993). A multiple-source land surface energy balance model for use in generalcirculation models. Agricultural and Forest Meteorology, 65: 21–45.
Dolman, A.J. & Blyth, E.M. (1997). Patch scale aggregation of heterogeneous land surface coverfor mesoscale meteorological models. Journal of Hydrology, 190: 252–268.
Franchito, S.H. & Rao, V.B. (1992). Climate change due to land surface alterations. ClimaticChange, 22: 1–34.
Friedl, M.A. (1996). Relationships among remotely sensed data, surface energy balance, andarea-averaged fluxes over partially vegetated land surfaces. Journal of Applied Meteorology, 35:2091–2103.
Friedl, M.A. (1995). Modeling land surface fluxes using a sparse canopy model and radiometricsurface temperature measurements. Journal of Geophysical Research, 100: 25,435–25,446.
Gardner, C.M.K., Bell, J.D., Cooper, J.D., Dean, T.J. & Hodnett, M.G. (1991). Soil watercontent. In: Smith, K.A. & Mullins, C.E. (Eds), Soil Analysis, pp. 1–74. New York, USA.:Marcel Dekker Inc., 620 pp.
316 Z. QIN ET AL.
Garratt, J.R. (1984). The measurement of evaporation by meteorological methods. AgriculturalWater Management, 8: 99–117.
Gerson, R., Amit, R. & Grossman, S. (1985). Dust Availability in Desert Terrain: a Study in theDeserts of Israel and the Sinai. Israel: The Hebrew University of Jerusalem.
Ghildyal, B.P. & Tripathi, P. (1987). Soil Physics. New York, U.S.A.: John Wiley & SonsLtd. 656 pp.
Hares, M.A. & Novak, M.D. (1992). Simulation of surface energy balance and soil temperatureunder strip tillage: I Model description. Soil Science Society of America Journal, 56: 22–29.
Karnieli, A. (1997). Development and implementation of spectral crust index over dune sands.International Journal of Remote Sensing, 18: 1207–1220.
Karnieli, A. & Sarafis, V. (1996). Reflectance spectrophotometry of cyanobacteria within soilcrustsFa diagnostic tool. International Journal of Remote Sensing, 17: 1609–1615.
Karnieli, A., Shachack, M., Tsoar, H., Zaady, E., Kaufman, Y. & Porter, W. (1996). The effect ofmicrophytes on the spectral reflectance of vegetation in semi-arid regions. Remote Sensing ofEnvironment, 57: 88–96.
Karnieli, A. & Tsoar, H. (1995). Spectral reflectance of biogenic crust developed on desert dunesand along the Israel–Egypt border. International Journal of Remote Sensing, 16:369–374.
Kidron, G.J. (1999). Altitude dependent dew and fog in the Negev Desert, Israel. Agriculturaland Forest Meteorology, 96: 1–8.
Kidron, G.J. & Yair, A. (1997). Rainfall–runoff relationship over encrusted dune surfaces,Nizzana, Western Negev, Israel. Earth Surface Processes and Landforms, 22: 1169–1184.
Kimball, B.A. & Jackson, R.D. (1979). Soil heat flux. In: Barfield, B.J. & Gerber, J.F. (Eds),Modification of the Aerial Environment of Plants, pp. 211–229. St. Joseph, MI, U.S.A.: AmericanSociety of Agricultural Engineers. 538 pp.
Kutilek, M. & Nielson, D.R. (1994). Soil Hydrology. Destedt, Germany: Catena Verlag Ltd. 370 pp.Lanicci, J.M., Carlson, T.N. & Warner, T.T. (1987). Sensitivity of the Great Plains severe-storm
environment to soil moisture distribution. Monthly Weather Review, 115: 2660–2673.Lhomme, J.P., Monteny, B. & Amadou, M. (1994). Estimating sensible heat flux
from radiometric temperature over sparse millet. Agricultural and Forestry Meteorology, 68:77–91.
Marshall, T.J. & Holmes, J.W. (1979). Soil Physics. Cambridge, UK.: Cambridge UniversityPress. 345 pp.
McInnes, K.J. (1981). Thermal conductivity of soils from dryland wheat regions of EasternWashington. M.S. thesis, Washington State University, Pullman, U.S.A.
Monteith, J.L. (1973). Principles of Environmental Physics. London, UK.: Edward Arnold Ltd.241 pp.
Otterman, J. (1974). Baring high-albedo soils by overgrazing: a hypothesized desertificationmechanism. Science, 186: 531–533.
Otterman, J. (1977). Anthropogenic impact on the surface at the Earth. Climatic Change, 1: 137–155.
Otterman, J. (1981). Satellite and field studies of man’s impact on the surface in arid regions.Tellus, 33, 68–77.
Otterman, J. & Fraser, R.S. (1976). Earth–atmosphere system and surface reflectivity in aridregions from Landsat multi-spectral scanner measurements. Remote Sensing of Environment, 5:247–266.
Otterman, J. & Robinove, C.J. (1982). Landsat monitoring of desert vegetation growth in 1972–1979 using a plant shadowing model. Advance of Space Researches, 2: 45–50.
Otterman, J. & Tucker, C.J. (1985). Satellite measurements of surface albedo in semi desert.Journal of Climate and Applied Meteorology, 24: 228–235.
Qin, Z. (1998). Surface composition structures on both sides of Israel–Egypt border region.Paper presented in The 1st Academic Symposium of Chinese Students and Scholars in Israel.Chinese Students and Scholars Association in Israel, Weizmann Institute of Science, Rehovot,Israel, December 17, 1998.
Qin, Z., Berliner, P. & Karnieli, A. (2002). Numerical solution of a complete surface energybalance model for simulation of heat fluxes and surface temperature under bare soilenvironment. Applied Mathematics and Computation 130: 171–200.
Qin, Z., Karnieli, A. & Berliner, P. (2000). Remote sensing analysis of the land surfacetemperature anomaly in the sand dune region across the Israel–Egypt border. InternationalJournal of Remote Sensing (accepted).

MODELING THE THERMAL ANOMALY ACROSS THE ISRAEL–EGYPT BORDER 317
Qin, Z. & Karnieli, A. (2000). Quantitative estimation of land cover structure in the desert sanddunes across Israel–Egypt border using remote sensing data. Remote Sensing of Envionment(submitted).
Rose, C.W. (1979). Agricultural Physics. Oxford, UK.: Pergamon Press Ltd. 230pp.Szeicz, G., Endrodi, G. & Tachman, S. (1969). Aerodynamic and surface factors in evaporation.
Water Resources Research, 5: 380–394.Schmugge, T. & Humes, K. (1995). ASTER observations for the monitoring of land surface
fluxes. Journal of Japanese Remote Sensing Society, 15: 83–89.Smith, G.D. (1978). Numerical Solution of Partial Differential Equations: Finite Difference Methods.
Oxford, UK.: Oxford University Press. 304 pp.Tsoar, H. & Karnieli, A. (1996). What determines the spectral reflectance of the Negev–Sinai
sand dunes. International Journal of Remote Sensing, 17: 3513–3525.Tsoar, H. & M�ller, J.T. (1986). The role of vegetation in the formation of linear sand dunes. In
Nickling, W.P. (Ed.), Aeolian Geomorphology, Proceedings of the 17th Annual BinghamtonGeomorphology symposium, September 1986, pp. 75–95. Boston, U.S.A.: Allen & UnwinInc. 311 pp.
Van Bavel, C.H.M. & Hillel, D.I. (1976). Calculating potential and actual evaporation from abare soil surface by simulation of concurrent flow of water and heat. Agricultural and ForestMeteorology, 17: 453–476.
Verma, S.B. & Barfield, B.J. (1979). Aerial and crop resistance affecting energy transport. In:Barfield, B.J. & Gerber, J.F. (Eds), Modification of the Aerial Environment of Plants, pp. 230–248. St. Joseph, MI, U.S.A.: American Society of Agricultural Engineers. 538 pp.
Warren, A. & Harrison, C.M. (1984). People and the ecosystem: biogeography as a study ofecology and culture. Geoforum, 15: 365–381.
Williams, M. A. J. & Balling, Jr, R.C. (1996). Interactions of Desertification and Climate. Preparedfor World Meteorological Organisation, United Nations Environment Programme. London,U.K.: Arnold, 270 pp.
Yair, A., Lavee, H. & Greitser, N. (1997). Spatial and temporal variability of water percolation andmovement in a sytem of longitudinal dunes, western Negev, Israel. Hydrological Processes, 11: 43–58.
Yakirevich, A., Berliner, P. & Sorek, S. (1997). A model for numerical simulating of evaporationfrom bare saline soil. Water Resources Research, 33: 1021–1033.
Zemel, Z. & Lomas, J. (1997). Soil Temperature Regime in Israel as a Basis for Agricultural Planningand Activity. Bet Dagon, Israel: Israel Meteorogical Service.
Appendix: Nomenclature
ai, bi, ci Coefficients in Eqn (28)Ai, Bi, Ci Coefficients in Eqn (29)AVHRR Advanced Very High Resolution Radiometerca, cm Specific heat of air and clay, J kg�1 K�1
cq, cw Specific heat of quartz and water, J kg�1 K�1
cs Specific heat of soil, J kg�1 K�1
Ch Change of soil water vs. relative humidity, kg m�3
Cs Volumetric soil heat capacity, J m�3 K�1
di, ei, fi Coefficient in Eqn (28)Di, Ei, Fi Coefficient in Eqn (29)dT Small change in temperature, KDv Apparent vapor diffusivity, kg m�1 s�1 kPa�1
e Soil vapor pressure, kPaea, es Air and surface vapor pressures, kPaev Saturated soil vapor pressure, kPag Acceleration due to gravity, g ¼ 9?8 m s�2
gj Parameter in Eqn (24)G Soil heat flux, W m�2
Gj Parameter in Eqn (26)h Soil relative humidityhi Soil relative humidity at the layer iH Sensible heat flux, W m�2

318 Z. QIN ET AL.
i, j The ith and jth soil layersk Von Karman constant, k ¼ 0?4Ka, Kb Parameters in Eqns (17) and (21)Kc Soil hydraulic conductivity, kg s m�3
Ks Soil thermal conductivity, W m�1 K�1
L Latent heat vaporization, L ¼ 2?543� 106 J kg�1
LE Latent heat flux, W m�2
LEc Energy driving soil water change, W m�2
LST Land surface temperaturen Number of soil layersNOAA The National Oceanic and Atmospheric AdministrationPa Atmospheric pressure, kPara Air resistance coefficient to heat transfer, s m�1
rs Surface resistance, s m�1
R Universal gas constant, R=461?52 J kg�1 K�1
Rn Net radiation, W m�2
Rs Global hemispheric radiation, W m�2
s Slope of saturated vapor pressure vs. temperature, kPa K�1
T Temperature, KTi, Soil temperature at layer i, KTa, Ts Air and surface temperatures, KTM Thematic Mapperuz Wind velocity, m s�1
Va, Vm Volumetric fraction of air and clay in soilVq, Vw Volumetric fraction of quartz and water in soilz Standard height, z ¼ 2 mz0 Roughness length, mZt Parameter in Eqns (24) and (26)ea, es Air and surface emissivitiesjh, jm Stability correction parameters for heat and momentumr Surface albedora, rm Density of air and clay, kg m�3
rq, rw Density of quartz and water, kg m�3
rs Soil density, kg m�3
s Stefan–Boltzmann constant, s ¼ 5?67� 10�8 W m�2 K�4
c Soil water potential, J kg�1
qh/qt Rate of soil relative humidity change, s�1
qt Time interval, sqT/qt Rate of soil temperature change, K s�1
qz Depth of soil layer, mqy/qt Rate of soil water change, kg m�3 s�1
Related Documents


