Postharvest Biology and Technology 37 (2005) 163–173 Micromechanical behaviour of onion epidermal tissue E. Vanstreels a,∗ , M.C. Alamar a , B.E. Verlinden a , A. Enninghorst c , J.K.A. Loodts b , E. Tijskens b , H. Ramon b , B.M. Nicola¨ ı a a Flanders Centre/Laboratory of Postharvest Technology, K.U. Leuven, W. De Croylaan 42, B-3001 Heverlee, Belgium b Laboratory for Agricultural Machinery and Processing, K.U. Leuven, Kasteelpark Arenberg 20, B-3001 Heverlee, Belgium c Institut f ¨ ur Obstbau und Gem ¨ usebau der Rheinischen Friedrich-Wilhems-Universit¨ at, Auf dem H¨ ugel 6, D-53121 Bonn, Germany Received 18 November 2004; accepted 4 April 2005 Abstract Onion epidermal peels were used as a model system to study the micromechanical behaviour of plant tissue in relationship to the structural parameters of the cells in the tissue. Mechanical properties of onion epidermal tissue were measured using a miniature tensile stage mounted under a microscope. Epidermis peels were subjected to tensile tests in longitudinal and transverse direction, while the deformation of the individual cells in the tissue was monitored. Onion epidermal peels were found to produce in both directions a biphasic stress–strain curve consisting of two clearly distinguishable linear parts of different slope with a transition zone in between. Cell area was found to exert a significant negative influence on stiffness and strength of the samples, but also aspect of the cells in the tissue had a significant influence on stiffness. Samples with smaller, less elongated cells have a broader transition zone and a lower strain at maximum stress than samples with long and big cells. Analysis of the images acquired at subsequent times in the test allowed the measurement of the cell deformations. Deformations of cells were found to be larger in transverse samples as compared to longitudinal samples. The information gained provided insight into factors determining the mechanical properties of vegetative tissues and will serve as input for the development of models to describe and to predict mechanical behaviour of plant tissues. © 2005 Elsevier B.V. All rights reserved. Keywords: Allium cepa L.; Tensile test; Elasticity modulus; Strength; Cell structural parameters 1. Introduction Consumers nowadays expect fruit of premium qual- ity, and to provide high quality fruit is an important challenge for producers, cool store operators and retail ∗ Corresponding author. Tel.: +32 16 322732; fax: +32 16 322955. E-mail address: [email protected] (E. Vanstreels). organisations. Texture is an important quality attribute of many fruit—consumers prefer firm, crispy and juicy fruit above soft and mealy fruit. Also, mechanical damage in the chain from producer to consumer affects the quality of the fruit to a large extent and inevitably leads to a considerable loss of its commercial value. Damage can be caused by impacts, vibrations, static loads and friction. It is mandatory to be able to 0925-5214/$ – see front matter © 2005 Elsevier B.V. All rights reserved. doi:10.1016/j.postharvbio.2005.04.004

Welcome message from author
This document is posted to help you gain knowledge. Please leave a comment to let me know what you think about it! Share it to your friends and learn new things together.
Transcript
Postharvest Biology and Technology 37 (2005) 163–173
Micromechanical behaviour of onion epidermal tissue
E. Vanstreelsa,∗, M.C. Alamara, B.E. Verlindena, A. Enninghorstc,J.K.A. Loodtsb, E. Tijskensb, H. Ramonb, B.M. Nicolaı a
a Flanders Centre/Laboratory of Postharvest Technology, K.U. Leuven, W. De Croylaan 42, B-3001 Heverlee, Belgiumb Laboratory for Agricultural Machinery and Processing, K.U. Leuven, Kasteelpark Arenberg 20, B-3001 Heverlee, Belgium
c Institut fur Obstbau und Gem¨usebau der Rheinischen Friedrich-Wilhems-Universit¨at, Auf dem H¨ugel 6, D-53121 Bonn, Germany
Received 18 November 2004; accepted 4 April 2005
Abstract
Onion epidermal peels were used as a model system to study the micromechanical behaviour of plant tissue in relationshipto the structural parameters of the cells in the tissue. Mechanical properties of onion epidermal tissue were measured using aminiature tensile stage mounted under a microscope. Epidermis peels were subjected to tensile tests in longitudinal and transversedirection, while the deformation of the individual cells in the tissue was monitored. Onion epidermal peels were found to producein both directions a biphasic stress–strain curve consisting of two clearly distinguishable linear parts of different slope with atransition zone in between. Cell area was found to exert a significant negative influence on stiffness and strength of the samples,but also aspect of the cells in the tissue had a significant influence on stiffness. Samples with smaller, less elongated cells havea broader transition zone and a lower strain at maximum stress than samples with long and big cells. Analysis of the imagesa ere foundt to factorsd o describea©
K
1
ic
uteicycalfectsblylue.taticto
0
cquired at subsequent times in the test allowed the measurement of the cell deformations. Deformations of cells wo be larger in transverse samples as compared to longitudinal samples. The information gained provided insight inetermining the mechanical properties of vegetative tissues and will serve as input for the development of models tnd to predict mechanical behaviour of plant tissues.2005 Elsevier B.V. All rights reserved.
eywords: Allium cepaL.; Tensile test; Elasticity modulus; Strength; Cell structural parameters
. Introduction
Consumers nowadays expect fruit of premium qual-ty, and to provide high quality fruit is an importanthallenge for producers, cool store operators and retail
∗ Corresponding author. Tel.: +32 16 322732; fax: +32 16 322955.E-mail address:[email protected] (E. Vanstreels).
organisations. Texture is an important quality attribof many fruit—consumers prefer firm, crispy and jufruit above soft and mealy fruit. Also, mechanidamage in the chain from producer to consumer afthe quality of the fruit to a large extent and inevitaleads to a considerable loss of its commercial vaDamage can be caused by impacts, vibrations, sloads and friction. It is mandatory to be able
925-5214/$ – see front matter © 2005 Elsevier B.V. All rights reserved.doi:10.1016/j.postharvbio.2005.04.004
164 E. Vanstreels et al. / Postharvest Biology and Technology 37 (2005) 163–173
identify the relevant mechanical loads and predict thedamage they induce in order to be able to optimisestacking patterns, handling procedures and packagingmaterials. Both texture and damage susceptibility aredetermined by the mechanical properties. Classicalapproaches to study mechanical properties of vegeta-tive tissues regarded the loaded object as a (non)linear,(visco)elastic continuum. However, fruit tissue isin reality a complex conglomerate of cells, and itsintegrity depends on the presence of an adhesive mid-dle lamella between individual cells, the cellular turgorpressure, the mechanical properties of the cell walland the presence of intercellular spaces. Therefore, amicromechanical approach is best suited to understandthe relative importance of these cellular and histologi-cal attributes on the overall mechanical behaviour of thefruit.
As a first step towards the investigation of microme-chanical properties of vegetative tissues, we selectedonion epidermal peels as a study object. Onion epi-dermis consists of only one cell layer and is easyto isolate and manipulate. Micromechanical experi-ments on onion epidermal peels have been reportedin the literature (Ng et al., 2000; Wilson et al.,2000; Wei et al., 2001). Ng et al. (2000)examinedthe chemical composition of the cell walls of differentonion tissues, including the upper epidermis of fleshyscales, in relation to their tensile strength and notch sen-sitivity. Wilson et al. (2000)used a mechanical creepapparatus and Fourier-transform infrared spectroscopyt at-i nta-te one
am-e e-c ork,a s isp esep er-e uralp am-p end isto-l lureo andi
2. Materials and methods
2.1. Plant material
Strips of onion (Allium cepaL.) upper epidermiswere isolated from the equatorial region of the bulbin a direction parallel with the vascular bundles. Thefirst outer scale of the onion bulb was removed anddiscarded and only fleshy, non-dried scales were used.In total, five onions, five different scales (starting fromthe outside) of each onion and two samples per scalewere analysed. Epidermis strips (2 mm wide, approx-imately 20 mm long) were cut with razor blades andcarefully removed with forceps. After isolation, theywere immersed in distilled water for at least 12 min toallow the cells to reach full turgor and to allow anyinduced stress from the removal step to relax.
In a second experiment, epidermal strips were cut intwo different orientations: one direction parallel withvascular bundles (longitudinal samples) and anotherdirection perpendicular to vascular bundles (transversesamples). Longitudinal and transverse samples wereisolated directly adjacent to one another. After iso-lation, the strips were treated as mentioned above.Twenty-six samples originating from three onions wereanalysed.
2.2. Mechanical tests
Epidermis strips were clamped in the grips ofa olk,U tedb eo neda was1 th oft gain
F nedb cope.
o study cell wall polymer orientation, demonstrng that cellulose and pectin show distinct reorieion as cells were elongated.Wei et al. (2001)studiedlasticity and load bearing ability of strips of onipidermis.
Simultaneous observations of the structural parters of the cells in the tissue in relation to micromhanical properties have not been made. In this wdetailed analysis of micromechanical propertie
resented. Moreover, we study the variation in throperties of epidermal peels originating from diffnt onion scales, showing differences in cell structarameters, and for different orientations of the sles. The insights gained will prove valuable wheveloping mathematical models based upon the h
ogical properties of tissues to predict strain and faif fruit tissue as a consequence of static loading
mpact.
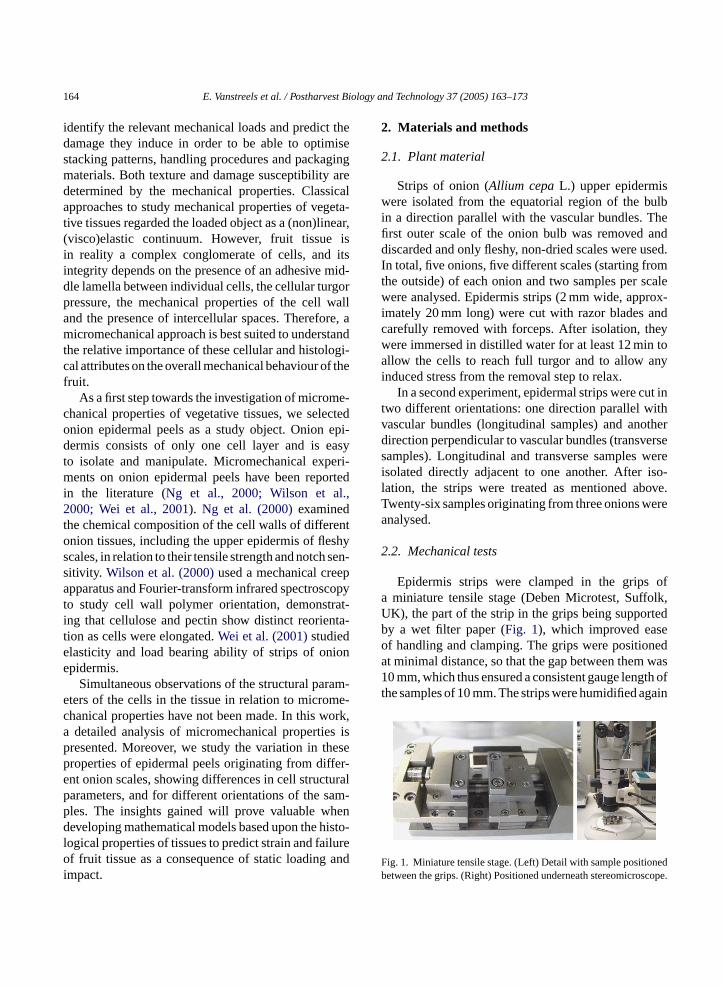
miniature tensile stage (Deben Microtest, SuffK), the part of the strip in the grips being suppory a wet filter paper (Fig. 1), which improved easf handling and clamping. The grips were positiot minimal distance, so that the gap between them0 mm, which thus ensured a consistent gauge leng
he samples of 10 mm. The strips were humidified a
ig. 1. Miniature tensile stage. (Left) Detail with sample positioetween the grips. (Right) Positioned underneath stereomicros
E. Vanstreels et al. / Postharvest Biology and Technology 37 (2005) 163–173 165
by adding a few drops of water on their surface. In addi-tion, a miniature climatised chamber was positionedaround the sample and humidified air (∼90% RH) wasblown over the strips. All together, these measurestaken ensured that the epidermis strips stayed humidi-fied during the time course of the test (on average some300 s), as was confirmed in preliminary experiments. Auniaxial tensile test was then performed with a testingspeed of 1 mm/min and the force and elongation wererecorded. After a certain travel, a cyclic test of threecycles was performed and then the strips were furtherelongated until rupture. All measurements were carriedout at room temperature.
2.3. Image analysis
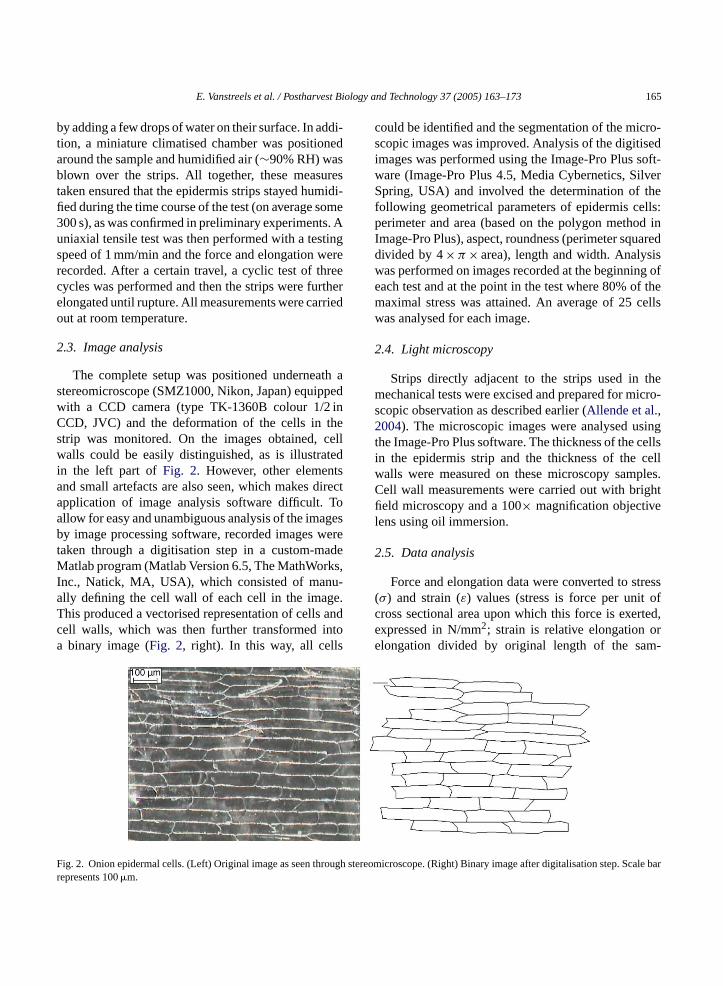
The complete setup was positioned underneath astereomicroscope (SMZ1000, Nikon, Japan) equippedwith a CCD camera (type TK-1360B colour 1/2 inCCD, JVC) and the deformation of the cells in thestrip was monitored. On the images obtained, cellwalls could be easily distinguished, as is illustratedin the left part ofFig. 2. However, other elementsand small artefacts are also seen, which makes directapplication of image analysis software difficult. Toallow for easy and unambiguous analysis of the imagesby image processing software, recorded images weretaken through a digitisation step in a custom-madeMatlab program (Matlab Version 6.5, The MathWorks,Inc., Natick, MA, USA), which consisted of manu-a e.T andc ntoa s
could be identified and the segmentation of the micro-scopic images was improved. Analysis of the digitisedimages was performed using the Image-Pro Plus soft-ware (Image-Pro Plus 4.5, Media Cybernetics, SilverSpring, USA) and involved the determination of thefollowing geometrical parameters of epidermis cells:perimeter and area (based on the polygon method inImage-Pro Plus), aspect, roundness (perimeter squareddivided by 4× π × area), length and width. Analysiswas performed on images recorded at the beginning ofeach test and at the point in the test where 80% of themaximal stress was attained. An average of 25 cellswas analysed for each image.
2.4. Light microscopy
Strips directly adjacent to the strips used in themechanical tests were excised and prepared for micro-scopic observation as described earlier (Allende et al.,2004). The microscopic images were analysed usingthe Image-Pro Plus software. The thickness of the cellsin the epidermis strip and the thickness of the cellwalls were measured on these microscopy samples.Cell wall measurements were carried out with brightfield microscopy and a 100× magnification objectivelens using oil immersion.
2.5. Data analysis
Force and elongation data were converted to stress( ofc rted,e ore m-
F ough s . Scale barr
lly defining the cell wall of each cell in the imaghis produced a vectorised representation of cellsell walls, which was then further transformed ibinary image (Fig. 2, right). In this way, all cell
ig. 2. Onion epidermal cells. (Left) Original image as seen threpresents 100�m.
σ) and strain (ε) values (stress is force per unitross sectional area upon which this force is exexpressed in N/mm2; strain is relative elongationlongation divided by original length of the sa
tereomicroscope. (Right) Binary image after digitalisation step
166 E. Vanstreels et al. / Postharvest Biology and Technology 37 (2005) 163–173
ple). For stress calculations, the cross sectional areawas calculated as width× thickness of the strip. Thestress–strain curves were biphasic (see later). The mod-ulus of elasticity or Young’s modulus was calculatedin different parts of the stress–strain curve, namely inthe first part of the curve before the transition zone(E1), in the second part of the curve after the transitionzone (E2) and in the cyclic part of the curve (Ecycle).The position of the transition zone was noted in strainas well as in stress values. Additionally, the maximalstress and the corresponding strain could be derivedfrom the stress–strain curves.
The increase in length and the decrease in width ofcells at two points in the test (described earlier) werecalculated. From these data, the apparent Poisson ratioof individual cells in the tissue specimen was calculatedas the ratio of transverse contraction strain to longitudi-nal extension strain in the direction of stretching force.The definition of Poisson’s ratio contains a minus signso that normal materials have a positive ratio. We haveassumed that the transverse contraction strain in thetissue plane was equal to that perpendicular to the tis-sue plane, as there were no means to measure the latterduring the tensile test.
Statistical analysis was carried out using the generallinear model procedure in SAS (SAS Version 8, SASInstitute Inc., Cary, NC, USA).
3. Results
3
leso rder
Table 1Overview of results of measurements of cell structural parameters infive onions and throughout five scales
Variable Mean Stdev Minimum Maximum
Length (�m) 446.7 160.7 150.7 1475.4Width (�m) 90.3 26.8 33.7 191.5Aspect 5.4 1.9 1.5 12.5Area (�m2) 32373.8 18713.3 7050.0 183601.1Perimeter (�m) 971.1 324.1 374.0 3006.3Roundness 2.5 0.7 1.1 5.1
Stdev: standard deviation.
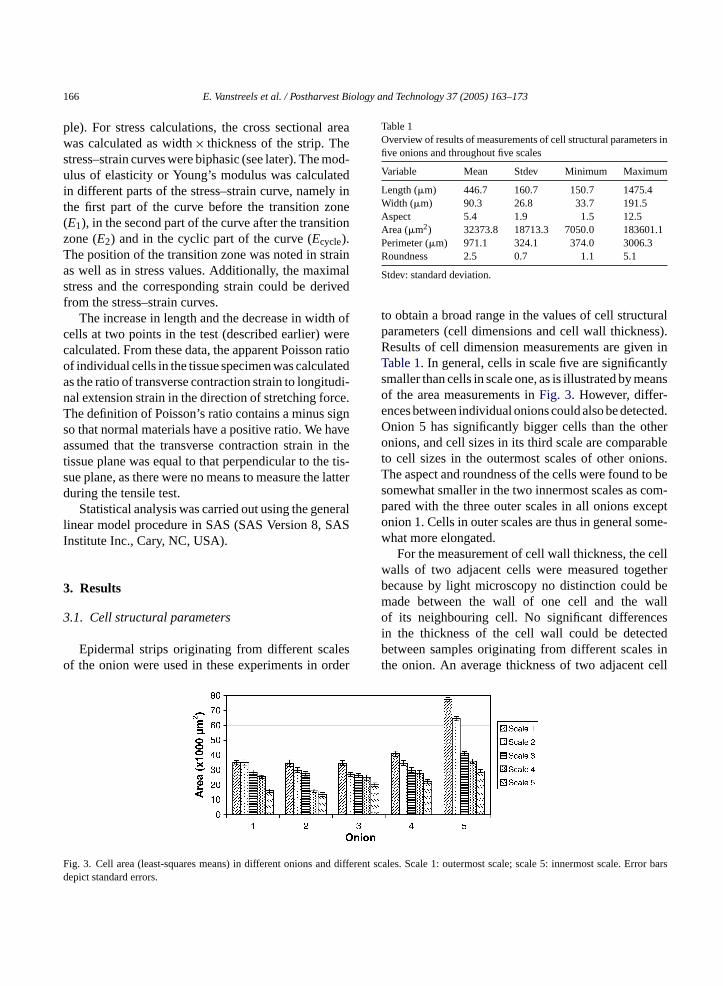
to obtain a broad range in the values of cell structuralparameters (cell dimensions and cell wall thickness).Results of cell dimension measurements are given inTable 1. In general, cells in scale five are significantlysmaller than cells in scale one, as is illustrated by meansof the area measurements inFig. 3. However, differ-ences between individual onions could also be detected.Onion 5 has significantly bigger cells than the otheronions, and cell sizes in its third scale are comparableto cell sizes in the outermost scales of other onions.The aspect and roundness of the cells were found to besomewhat smaller in the two innermost scales as com-pared with the three outer scales in all onions exceptonion 1. Cells in outer scales are thus in general some-what more elongated.
For the measurement of cell wall thickness, the cellwalls of two adjacent cells were measured togetherbecause by light microscopy no distinction could bemade between the wall of one cell and the wallof its neighbouring cell. No significant differencesin the thickness of the cell wall could be detectedbetween samples originating from different scales inthe onion. An average thickness of two adjacent cell
F d differ le. Error barsd
.1. Cell structural parameters
Epidermal strips originating from different scaf the onion were used in these experiments in o
ig. 3. Cell area (least-squares means) in different onions anepict standard errors.
ent scales. Scale 1: outermost scale; scale 5: innermost sca
E. Vanstreels et al. / Postharvest Biology and Technology 37 (2005) 163–173 167
walls of around 3.3�m and a standard deviation of 0.41was found. These results correspond well with thoseobtained by transmission electron microscopy in pre-liminary experiments performed to test the sufficiencyof the resolution of the light microscopy measurementtechnique.
3.2. Micromechanical properties
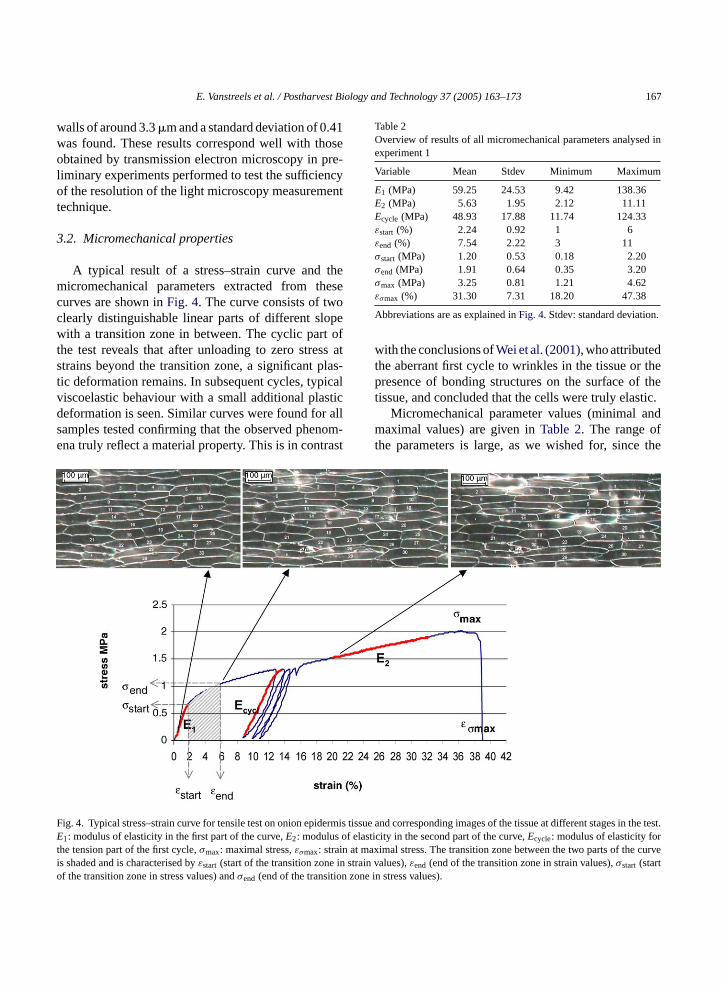
A typical result of a stress–strain curve and themicromechanical parameters extracted from thesecurves are shown inFig. 4. The curve consists of twoclearly distinguishable linear parts of different slopewith a transition zone in between. The cyclic part ofthe test reveals that after unloading to zero stress atstrains beyond the transition zone, a significant plas-tic deformation remains. In subsequent cycles, typicalviscoelastic behaviour with a small additional plasticdeformation is seen. Similar curves were found for allsamples tested confirming that the observed phenom-ena truly reflect a material property. This is in contrast
Table 2Overview of results of all micromechanical parameters analysed inexperiment 1
Variable Mean Stdev Minimum Maximum
E1 (MPa) 59.25 24.53 9.42 138.36E2 (MPa) 5.63 1.95 2.12 11.11Ecycle (MPa) 48.93 17.88 11.74 124.33εstart (%) 2.24 0.92 1 6εend (%) 7.54 2.22 3 11σstart (MPa) 1.20 0.53 0.18 2.20σend (MPa) 1.91 0.64 0.35 3.20σmax (MPa) 3.25 0.81 1.21 4.62εσmax (%) 31.30 7.31 18.20 47.38
Abbreviations are as explained inFig. 4. Stdev: standard deviation.
with the conclusions ofWei et al. (2001), who attributedthe aberrant first cycle to wrinkles in the tissue or thepresence of bonding structures on the surface of thetissue, and concluded that the cells were truly elastic.
Micromechanical parameter values (minimal andmaximal values) are given inTable 2. The range ofthe parameters is large, as we wished for, since the
F ermis t s in the test.E of elas rt n at ma curvei in strao n zone
ig. 4. Typical stress–strain curve for tensile test on onion epid
1: modulus of elasticity in the first part of the curve,E2: modulushe tension part of the first cycle,σmax: maximal stress,εσmax: strais shaded and is characterised byεstart (start of the transition zonef the transition zone in stress values) andσend (end of the transitio
issue and corresponding images of the tissue at different stageticity in the second part of the curve,Ecycle: modulus of elasticity foximal stress. The transition zone between the two parts of the
in values),εend (end of the transition zone in strain values),σstart (startin stress values).
168 E. Vanstreels et al. / Postharvest Biology and Technology 37 (2005) 163–173
Table 3Correlation matrix for micromechanical parameters
E1 E2 Ecycle σmax εσmax εstart εend σstart σend
E1 1 0.23298 0.84212 0.49174 −0.26691 −0.42712 −0.16114 0.52717 0.54090.0999 <0.0001 0.0002 0.0583 0.0018 0.258S6 <0.0001 <0.0001
E2 0.23298 1 0.46857 0.52767 0.52767 0.52767 0.52767 0.52767 0.527670.0999 0.0006 <0.0001 0.0049 0.3364 0.012 0.0491 0.1067
Ecycle 0.84212 0.46857 1 0.56248 −0.36901 −0.19014 −0.24909 0.52048 0.51669<0.0001 0.0006 <0.0001 0.0084 0.186 0.0811 0.0001 0.0001
σmax 0.49174 0.52767 0.56248 1 0.16488 0.17281 0.25813 0.74757 0.85140.0002 <0.0001 <0.0001 0.2476 0.2253 0.0674 <0.0001 <0.0001
εσmax −0.26691 −38838 −36901 0.16488 1 0.07551 0.55171 −0.1269 0.16950.0583 0.0049 0.0084 0.2476 0.5985 <0.0001 0.3749 0.906
εstart −0.42712 0.13736 −0.19014 0.17281 0.07551 1 0.30936 0.25921 0.22530.0018 0.3364 0.186 0.2253 0.5985 0.0272 0.0662 0.1165
εend −0.16114 −0.34912 −0.24909 0.25813 0.55171 0.30936 1 0.10908 0.437760.2586 0.012 0.0811 0.0674 <0.0001 0.0272 0.4461 0.0013
σstart 0.52717 0.27696 0.52048 0.74757 −0.1269 0.25921 0.10908 1 0.87399<0.0001 0.0491 0.0001 <0.0001 0.3749 0.0662 0.4461 <0.0001
σend 0.5409 0.22855 0.51669 0.8514 0.01695 0.22253 0.43776 0.87399 1<0.0001 0.1067 0.0001 <0.0001 0.906 0.1165 <0.0013 <0.0001
Pearson correlation coefficientsρ and associated probabilities are given. Strong correlations (ρ ≥ 70) are indicated in bold. Abbreviations are asexplained inFig. 4.
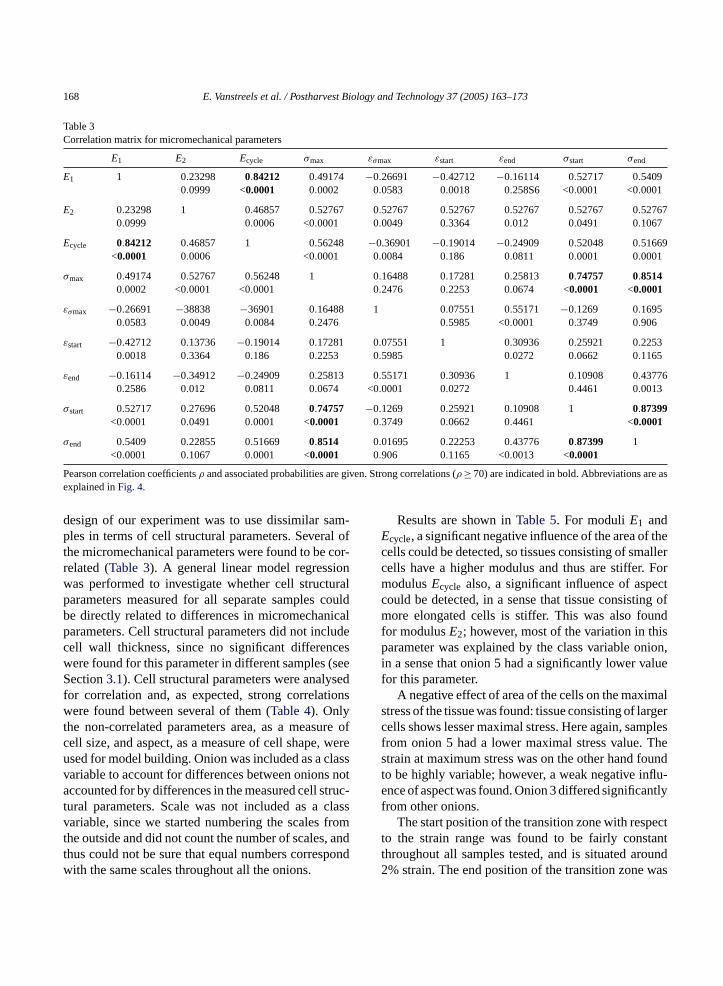
design of our experiment was to use dissimilar sam-ples in terms of cell structural parameters. Several ofthe micromechanical parameters were found to be cor-related (Table 3). A general linear model regressionwas performed to investigate whether cell structuralparameters measured for all separate samples couldbe directly related to differences in micromechanicalparameters. Cell structural parameters did not includecell wall thickness, since no significant differenceswere found for this parameter in different samples (seeSection3.1). Cell structural parameters were analysedfor correlation and, as expected, strong correlationswere found between several of them (Table 4). Onlythe non-correlated parameters area, as a measure ofcell size, and aspect, as a measure of cell shape, wereused for model building. Onion was included as a classvariable to account for differences between onions notaccounted for by differences in the measured cell struc-tural parameters. Scale was not included as a classvariable, since we started numbering the scales fromthe outside and did not count the number of scales, andthus could not be sure that equal numbers correspondwith the same scales throughout all the onions.
Results are shown inTable 5. For moduliE1 andEcycle, a significant negative influence of the area of thecells could be detected, so tissues consisting of smallercells have a higher modulus and thus are stiffer. FormodulusEcycle also, a significant influence of aspectcould be detected, in a sense that tissue consisting ofmore elongated cells is stiffer. This was also foundfor modulusE2; however, most of the variation in thisparameter was explained by the class variable onion,in a sense that onion 5 had a significantly lower valuefor this parameter.
A negative effect of area of the cells on the maximalstress of the tissue was found: tissue consisting of largercells shows lesser maximal stress. Here again, samplesfrom onion 5 had a lower maximal stress value. Thestrain at maximum stress was on the other hand foundto be highly variable; however, a weak negative influ-ence of aspect was found. Onion 3 differed significantlyfrom other onions.
The start position of the transition zone with respectto the strain range was found to be fairly constantthroughout all samples tested, and is situated around2% strain. The end position of the transition zone was
E. Vanstreels et al. / Postharvest Biology and Technology 37 (2005) 163–173 169
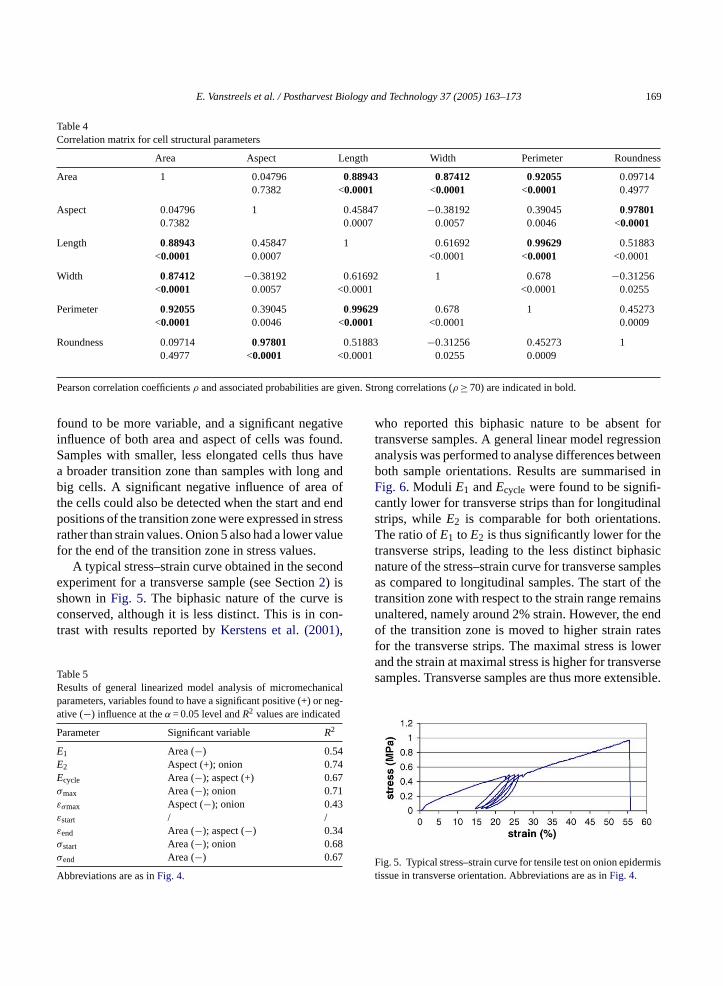
Table 4Correlation matrix for cell structural parameters
Area Aspect Length Width Perimeter Roundness
Area 1 0.04796 0.88943 0.87412 0.92055 0.097140.7382 <0.0001 <0.0001 <0.0001 0.4977
Aspect 0.04796 1 0.45847 −0.38192 0.39045 0.978010.7382 0.0007 0.0057 0.0046 <0.0001
Length 0.88943 0.45847 1 0.61692 0.99629 0.51883<0.0001 0.0007 <0.0001 <0.0001 <0.0001
Width 0.87412 −0.38192 0.61692 1 0.678 −0.31256<0.0001 0.0057 <0.0001 <0.0001 0.0255
Perimeter 0.92055 0.39045 0.99629 0.678 1 0.45273<0.0001 0.0046 <0.0001 <0.0001 0.0009
Roundness 0.09714 0.97801 0.51883 −0.31256 0.45273 10.4977 <0.0001 <0.0001 0.0255 0.0009
Pearson correlation coefficientsρ and associated probabilities are given. Strong correlations (ρ ≥ 70) are indicated in bold.
found to be more variable, and a significant negativeinfluence of both area and aspect of cells was found.Samples with smaller, less elongated cells thus havea broader transition zone than samples with long andbig cells. A significant negative influence of area ofthe cells could also be detected when the start and endpositions of the transition zone were expressed in stressrather than strain values. Onion 5 also had a lower valuefor the end of the transition zone in stress values.
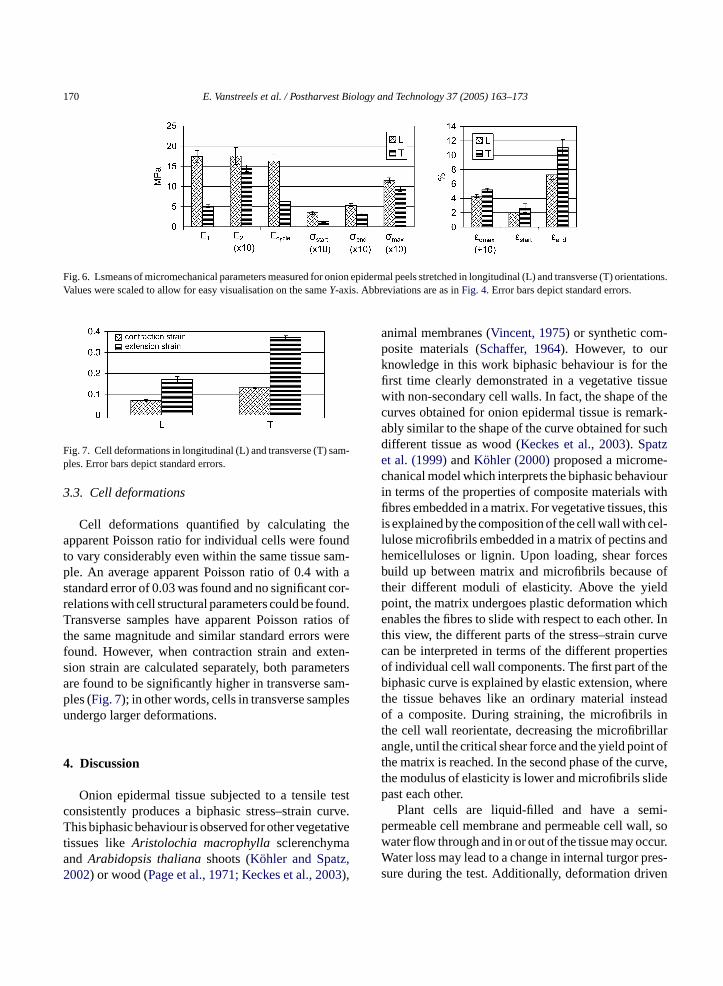
A typical stress–strain curve obtained in the secondexperiment for a transverse sample (see Section2) isshown inFig. 5. The biphasic nature of the curve isconserved, although it is less distinct. This is in con-trast with results reported byKerstens et al. (2001),
Table 5Results of general linearized model analysis of micromechanicalparameters, variables found to have a significant positive (+) or neg-ative (−) influence at theα = 0.05 level andR2 values are indicated
Parameter Significant variable R2
E1 Area (−) 0.54E2 Aspect (+); onion 0.74Ecycle Area (−); aspect (+) 0.67σmax Area (−); onion 0.71εσmax Aspect (−); onion 0.43εstart / /εend Area (−); aspect (−) 0.34σstart Area (−); onion 0.68σend Area (−) 0.67
Abbreviations are as inFig. 4.
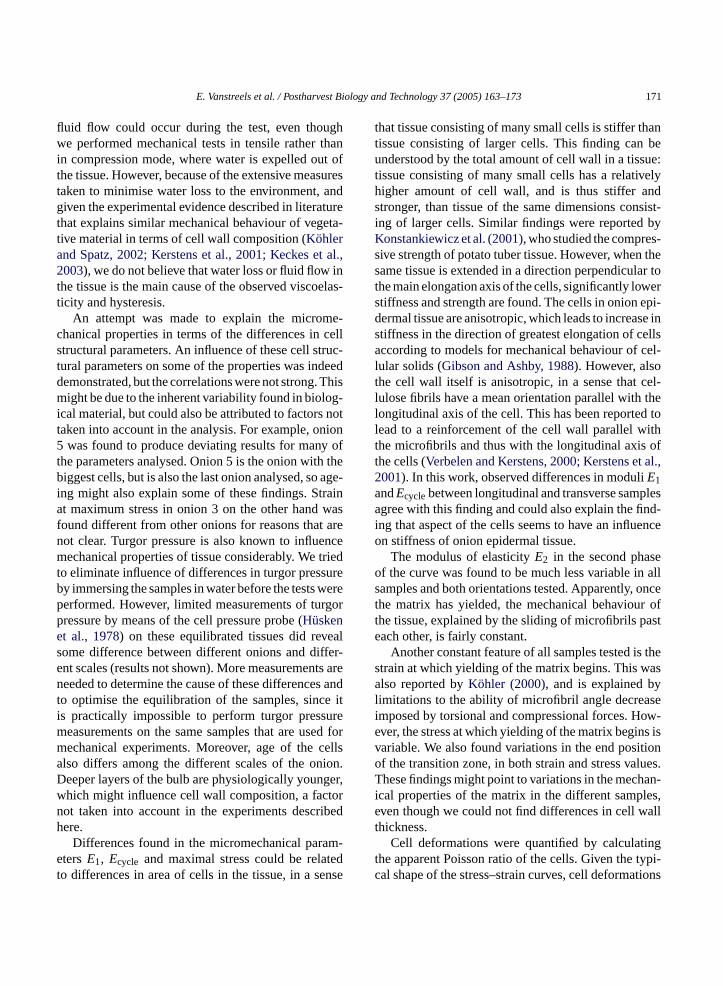
who reported this biphasic nature to be absent fortransverse samples. A general linear model regressionanalysis was performed to analyse differences betweenboth sample orientations. Results are summarised inFig. 6. Moduli E1 andEcycle were found to be signifi-cantly lower for transverse strips than for longitudinalstrips, whileE2 is comparable for both orientations.The ratio ofE1 toE2 is thus significantly lower for thetransverse strips, leading to the less distinct biphasicnature of the stress–strain curve for transverse samplesas compared to longitudinal samples. The start of thetransition zone with respect to the strain range remainsunaltered, namely around 2% strain. However, the endof the transition zone is moved to higher strain ratesfor the transverse strips. The maximal stress is lowerand the strain at maximal stress is higher for transversesamples. Transverse samples are thus more extensible.
Fig. 5. Typical stress–strain curve for tensile test on onion epidermistissue in transverse orientation. Abbreviations are as inFig. 4.
170 E. Vanstreels et al. / Postharvest Biology and Technology 37 (2005) 163–173
Fig. 6. Lsmeans of micromechanical parameters measured for onion epidermal peels stretched in longitudinal (L) and transverse (T) orientations.Values were scaled to allow for easy visualisation on the sameY-axis. Abbreviations are as inFig. 4. Error bars depict standard errors.
Fig. 7. Cell deformations in longitudinal (L) and transverse (T) sam-ples. Error bars depict standard errors.
3.3. Cell deformations
Cell deformations quantified by calculating theapparent Poisson ratio for individual cells were foundto vary considerably even within the same tissue sam-ple. An average apparent Poisson ratio of 0.4 with astandard error of 0.03 was found and no significant cor-relations with cell structural parameters could be found.Transverse samples have apparent Poisson ratios ofthe same magnitude and similar standard errors werefound. However, when contraction strain and exten-sion strain are calculated separately, both parametersare found to be significantly higher in transverse sam-ples (Fig. 7); in other words, cells in transverse samplesundergo larger deformations.
4. Discussion
Onion epidermal tissue subjected to a tensile testconsistently produces a biphasic stress–strain curve.This biphasic behaviour is observed for other vegetativetissues likeAristolochia macrophyllasclerenchymaandArabidopsis thalianashoots (Kohler and Spatz,2002) or wood (Page et al., 1971; Keckes et al., 2003),
animal membranes (Vincent, 1975) or synthetic com-posite materials (Schaffer, 1964). However, to ourknowledge in this work biphasic behaviour is for thefirst time clearly demonstrated in a vegetative tissuewith non-secondary cell walls. In fact, the shape of thecurves obtained for onion epidermal tissue is remark-ably similar to the shape of the curve obtained for suchdifferent tissue as wood (Keckes et al., 2003). Spatzet al. (1999)andKohler (2000)proposed a microme-chanical model which interprets the biphasic behaviourin terms of the properties of composite materials withfibres embedded in a matrix. For vegetative tissues, thisis explained by the composition of the cell wall with cel-lulose microfibrils embedded in a matrix of pectins andhemicelluloses or lignin. Upon loading, shear forcesbuild up between matrix and microfibrils because oftheir different moduli of elasticity. Above the yieldpoint, the matrix undergoes plastic deformation whichenables the fibres to slide with respect to each other. Inthis view, the different parts of the stress–strain curvecan be interpreted in terms of the different propertiesof individual cell wall components. The first part of thebiphasic curve is explained by elastic extension, wherethe tissue behaves like an ordinary material insteadof a composite. During straining, the microfibrils inthe cell wall reorientate, decreasing the microfibrillarangle, until the critical shear force and the yield point ofthe matrix is reached. In the second phase of the curve,the modulus of elasticity is lower and microfibrils slidepast each other.
mi-p ll, sow cur.W res-s en
Plant cells are liquid-filled and have a seermeable cell membrane and permeable cell waater flow through and in or out of the tissue may ocater loss may lead to a change in internal turgor p
ure during the test. Additionally, deformation driv
E. Vanstreels et al. / Postharvest Biology and Technology 37 (2005) 163–173 171
fluid flow could occur during the test, even thoughwe performed mechanical tests in tensile rather thanin compression mode, where water is expelled out ofthe tissue. However, because of the extensive measurestaken to minimise water loss to the environment, andgiven the experimental evidence described in literaturethat explains similar mechanical behaviour of vegeta-tive material in terms of cell wall composition (Kohlerand Spatz, 2002; Kerstens et al., 2001; Keckes et al.,2003), we do not believe that water loss or fluid flow inthe tissue is the main cause of the observed viscoelas-ticity and hysteresis.
An attempt was made to explain the microme-chanical properties in terms of the differences in cellstructural parameters. An influence of these cell struc-tural parameters on some of the properties was indeeddemonstrated, but the correlations were not strong. Thismight be due to the inherent variability found in biolog-ical material, but could also be attributed to factors nottaken into account in the analysis. For example, onion5 was found to produce deviating results for many ofthe parameters analysed. Onion 5 is the onion with thebiggest cells, but is also the last onion analysed, so age-ing might also explain some of these findings. Strainat maximum stress in onion 3 on the other hand wasfound different from other onions for reasons that arenot clear. Turgor pressure is also known to influencemechanical properties of tissue considerably. We triedto eliminate influence of differences in turgor pressureby immersing the samples in water before the tests werep rgorpe eals ffer-e ts aren s andt e iti urem ed fom ellsa ion.D ger,w torn ibedh
m-e tedt nse
that tissue consisting of many small cells is stiffer thantissue consisting of larger cells. This finding can beunderstood by the total amount of cell wall in a tissue:tissue consisting of many small cells has a relativelyhigher amount of cell wall, and is thus stiffer andstronger, than tissue of the same dimensions consist-ing of larger cells. Similar findings were reported byKonstankiewicz et al. (2001), who studied the compres-sive strength of potato tuber tissue. However, when thesame tissue is extended in a direction perpendicular tothe main elongation axis of the cells, significantly lowerstiffness and strength are found. The cells in onion epi-dermal tissue are anisotropic, which leads to increase instiffness in the direction of greatest elongation of cellsaccording to models for mechanical behaviour of cel-lular solids (Gibson and Ashby, 1988). However, alsothe cell wall itself is anisotropic, in a sense that cel-lulose fibrils have a mean orientation parallel with thelongitudinal axis of the cell. This has been reported tolead to a reinforcement of the cell wall parallel withthe microfibrils and thus with the longitudinal axis ofthe cells (Verbelen and Kerstens, 2000; Kerstens et al.,2001). In this work, observed differences in moduliE1andEcyclebetween longitudinal and transverse samplesagree with this finding and could also explain the find-ing that aspect of the cells seems to have an influenceon stiffness of onion epidermal tissue.
The modulus of elasticityE2 in the second phaseof the curve was found to be much less variable in allsamples and both orientations tested. Apparently, oncet r oft aste
s thes asa yl sei ow-e s isv tiono lues.T an-i les,e allt
ingt typi-c tions
erformed. However, limited measurements of turessure by means of the cell pressure probe (Huskent al., 1978) on these equilibrated tissues did revome difference between different onions and dint scales (results not shown). More measuremeneeded to determine the cause of these difference
o optimise the equilibration of the samples, sincs practically impossible to perform turgor press
easurements on the same samples that are usechanical experiments. Moreover, age of the clso differs among the different scales of the oneeper layers of the bulb are physiologically younhich might influence cell wall composition, a facot taken into account in the experiments descrere.
Differences found in the micromechanical paratersE1, Ecycle and maximal stress could be rela
o differences in area of cells in the tissue, in a se
r
he matrix has yielded, the mechanical behaviouhe tissue, explained by the sliding of microfibrils pach other, is fairly constant.
Another constant feature of all samples tested itrain at which yielding of the matrix begins. This wlso reported byKohler (2000), and is explained b
imitations to the ability of microfibril angle decreamposed by torsional and compressional forces. Hver, the stress at which yielding of the matrix beginariable. We also found variations in the end posif the transition zone, in both strain and stress vahese findings might point to variations in the mech
cal properties of the matrix in the different sampven though we could not find differences in cell whickness.
Cell deformations were quantified by calculathe apparent Poisson ratio of the cells. Given theal shape of the stress–strain curves, cell deforma
172 E. Vanstreels et al. / Postharvest Biology and Technology 37 (2005) 163–173
and apparent Poisson ratios are probably not constantover the range of the test. We choose to calculate celldeformations of images acquired at points in the testsufficiently apart from each other (0 and 80% of max-imum stress), which allowed for reliable calculations.This Poisson ratio is thus an overall value for a spec-imen that is extended considerably, namely to a pointwell behind the transition zone. An overall average ofaround 0.4 was found. The Poisson ratio of a cell withconstant volume is 0.5, so a smaller ratio indicates a rel-ative higher increase in length compared to the decreasein width. In terms of the micromechanical model ofSpatz et al. (1999)andKohler (2000), this means thatbeyond this point, the increase in length due to strain-ing is provided by slippage of the microfibrils past eachother and yield of the matrix. It is emphasised, however,that possible strain in the third direction perpendicu-lar to the strip might affect the values of the Poissonratio. Work is in progress to measure cell deformationsin three dimensions by means of confocal microscopytechniques. For transverse samples, the Poisson ratiowas comparable, but deformations of the cells werefound to be larger, agreeing with the fact that transversesamples are more extensible than longitudinal samples.
5. Conclusion
In this work, we developed a methodology whichallows for the simultaneous observation of changes ini ngp icalp ione theo pi-d curvew inedi ells outt onsb andt . Ani omeo ould,h Toq derm odeli such
models is in progress in our laboratory. The developedmethodology and the insights gained in this work willprove valuable when developing these models.
Acknowledgements
The authors wish to thank the Fund for Scien-tific Research Flanders (F.W.O. Vlaanderen, projectG.0200.02) and the European Union (Training SiteMarie Curie Grant to M.C. Alamar, contract numberHPMT-CT-2001-00308).
References
Allende, A., Desmet, M., Vanstreels, E., Verlinden, B.E., Nicolaı,B.M., 2004. Micromechanical and geometrical properties oftomato skin related to differences in puncture injury suscepti-bility. Postharvest Biol. Technol. 34, 131–141.
Gibson, L.J., Ashby, M.F. (Eds.), 1988. Cellular Solids. Structureand Properties. Pergamon Press, Oxford.
Husken, D., Steudle, E., Zimmerman, U., 1978. Pressure probe tech-nique for measuring water relations of cells in higher plants. PlantPhysiol. 61, 158–163.
Keckes, J., Burgert, I., Fruhmann, K., Muller, M., Kolln, K., Hamil-ton, M., Burghammer, M., Roth, S.V., Stanzl-Tschegg, S., Fratzl,P., 2003. Cell-wall recovery after irreversible deformation ofwood. Nat. Mater. 2, 810–814.
Kerstens, S., Decraemer, W.F., Verbelen, J.-P., 2001. Cell walls at theplant surface behave mechanically like fiber-reinforced compos-ite materials. Plant Physiol. 127, 381–385.
Kohler, L., 2000. Biphasic mechanical behaviour of plant tissues.
K ues
K ofnical
N al-nion2–
P sin-52–
S l and
S our. Bot.
V scopydeter-osc.
ndividual cells during the mechanical testing of livilant tissue. We studied the variation in mechanroperties and quantified cell deformations for onpidermal peels originating from different scales innion and isolated in different orientations. Onion eermal tissue produces a biphasic stress–strainhen submitted to a tensile test, which can be expla
n terms of the composition of plant cell walls. Ctructural parameters differ significantly throughhe different scales of the onion and correlatietween the observed micromechanical properties
hese cell structural parameters were investigatednfluence of the cell structural parameters on sf the properties was indeed demonstrated, but cowever, not explain all the measured variation.uantitatively describe the behaviour of tissue unechanical stress, a detailed micromechanical m
s needed. Research aimed at the development of
Mat. Sci. Eng. C 11, 51–56.ohler, L., Spatz, H.-C., 2002. Micromechanics of plant tiss
beyond the linear-elastic range. Planta 215, 33–40.onstankiewicz, K., Pawlak, K., Zdunek, K., 2001. Influence
structural parameters of potato tuber cells on their mechaproperties. Int. Agrophys. 15, 243–246.
g, A., Parker, M.L., Parr, A.J., Saunders, P.K., Smith, A.C., Wdron, K.W., 2000. Physicochemical characteristics of o(Allium cepa L.) tissues. J. Agric. Food Chem. 48, 5615617.
age, D.H., El-Hosseiny, F., Winkler, K., 1971. Behaviour ofgle wood fibers under axial tensile strain. Nature 229, 2253.
chaffer, B.W., 1964. Stress–strain of reinforced plastics parallenormal to their internal filaments. AIAA J. 2, 348–352.
patz, H.-C., Kohler, L., Niklas, K.J., 1999. Mechanical behaviof plant tissues: composite materials or structures. J. Exp202, 3269–3272.
erbelen, J.-P., Kerstens, S., 2000. Polarization confocal microand Congo Red fluorescence: a simple and rapid method tomine the mean cellulose fibril orientation in plants. J. Micr198, 101–107.
E. Vanstreels et al. / Postharvest Biology and Technology 37 (2005) 163–173 173
Vincent, J.F.V., 1975. Locust ovipositin: stress softening of the exten-sible intersegmental membranes. Proc. R. Soc. Lond. Ser. B 188,189–201.
Wei, C., Lintilhac, P.M., Tanguay, J.J., 2001. An insight into cell elas-ticity and load-bearing ability. Measurement and theory. PlantPhysiol. 126, 1129–1138.
Wilson, R.H., Smith, A.C., Kacurakova, M., Saunders, P.K., Well-ner, N., Waldron, K.W., 2000. The mechanical properties andmolecular dynamics of plant cell wall polysaccharides studiedby Fourier-transform infrared spectroscopy. Plant Physiol. 124,397–405.
Related Documents