Microfluidics to Liquid Phase Non-Catalytic Naphthenic-Aromatic Hydrocarbon Oxidation By Yucheng Wu A thesis submitted in partial fulfillment of the requirements for the degree of Master of Science In Chemical Engineering Department of Chemical and Materials Engineering University of Alberta © Yucheng Wu, 2020

Welcome message from author
This document is posted to help you gain knowledge. Please leave a comment to let me know what you think about it! Share it to your friends and learn new things together.
Transcript
Microfluidics to Liquid Phase Non-Catalytic Naphthenic-Aromatic Hydrocarbon Oxidation
By
Yucheng Wu
A thesis submitted in partial fulfillment of the requirements for the degree of
Master of Science
In
Chemical Engineering
Department of Chemical and Materials Engineering
University of Alberta
© Yucheng Wu, 2020
ii
Abstract
Liquid phase oxidation is industrially important to produce valuable petrochemicals and
pharmaceuticals. However, due to the complex nature of free-radical reactions in a non-catalytic
oxidation process, it is a challenge to achieve desired selectivity at a high conversion. This study
investigates liquid phase non-catalytic oxidation of naphthenic-aromatic hydrocarbon in
microfluidic reactors. The interest of the study is to exploit the potential of using microfluidic
reactors to manipulate conversion rate and product selectivity. The research consists of two studies.
The first study shows using microfluidics reactor, one can achieve order of magnitude of increase
from 1:1 to 10:1 in product selectivity compared to that in batch reactor due to increasing gas-
liquid interfacial area. Regardless of the reactor type, semi-batch or microfluidics reactor, gas-
liquid interfacial area is the most important parameter influencing the oxidation conversion and
selectivity. The second study investigated the effect of reactor configuration (size and shape) on
liquid phase oxidation of naphthenic aromatic hydrocarbon in two microfluidic reactors with
different dimension and flow path geometry. It was observed that reactor dimensions and volume
changed the reactor hydrodynamics and influenced the oxygen availability in different ways and
affected the conversion and product selectivity differently. The reactor with smaller size had higher
oxidation conversion and suppressed the addition product selectivity, whereas large reactor had
moderate conversion and enhanced ketone-to-alcohol product selectivity. The contributor to get
higher oxygen availability could either be smaller reactor dimension and volume or increased
length of the liquid film surrounding the gas bubble. The findings from the thesis could be used to
improve design and operation of liquid phase non-catalytic hydrocarbon oxidation in microfluidic
reactors to produce desired petrochemicals and pharmaceuticals.
iii
Preface (Mandatory due to collaborative work)
Chapter 3 of this thesis was accepted to be published in Journal of Flow Chemistry as “Siddiquee
M. N., Wu Y., De Klerk. A. and Nazemifard N. The impact of microfluidic reactor configuration
on hydrodynamics, conversion and selectivity during indan oxidation”. I was responsible for
concept formation, performing experiments, data collection, data interpretation and manuscript
writing. Muhammad Siddiquee was responsible for concept formation, data interpretation and
manuscript writing. Arno de Klerk and Neda Nazemifard acted as the supervisory authors and
were involved with concept formation, data analysis and manuscript composition.
Chapter 4 of this thesis was published partly as “Siddiquee M. N., Sivaramakrishnan K., Wu Y.,
De Klerk. A. and Nazemifard N. A statistical approach dealing with multicollinearity among
predictors in microfluidic reactor operation to control liquid-phase oxidation selectivity. React.
Chem. Eng., 2018, 3, 972-990.”. I was responsible for performing experiments, data collection and
data analytics for this paper. Muhammad Siddiquee and Kaushik Sivaramakrishnan were
responsible for concept formation, data interpretation and manuscript writing. Arno de Klerk and
Neda Nazemifard acted as the supervisory authors and were involved with concept formation, data
analysis and manuscript composition.

iv
Acknowledgement
I would like to take the chance to express my greatest gratitude to all people who have
supported me during the memorable journey.
In particular, I would like to thank Professor Neda Nazemifard and Dr. Muhammad
Siddiquee, who is always willing to provide me guidance when I encounter setbacks and
challenges during the research. I am very proud and glad to have the opportunity to work with
them.
I would like to extend my thank to:
Kiarash Keshmiri and Amin Karkooti for their insightful advice on my research and career.
Hanrui Zheng for his help on coding which opens the door for me to explore the magic of
automation and data analytics.
All my friends for their kindly support and advice.
My family in Shanghai for supporting me during the journey and encouraging me to
achieve greatness.
Finally, I would like to give my sincere thank and gratitude to my dear fiancée, Shenglei
Huang for her companion and support.
v
Contents
Abstract .......................................................................................................................................... ii
Preface ........................................................................................................................................... iii
Acknowledgement ........................................................................................................................ iv
List of Figures ............................................................................................................................. viii
List of Tables ................................................................................................................................. x
Chapter 1: Introduction ............................................................................................................... 1
1.1 Background ...................................................................................................................... 1
1.2 Objectives ......................................................................................................................... 1
1.3 Scope of Work .................................................................................................................. 2
1.4 Literature Cited ................................................................................................................ 2
Chapter 2: Literature Review ...................................................................................................... 5
2.1 Oxidation Chemistry ............................................................................................................. 5
2.1.1 Liquid Phase Oxidation.............................................................................................. 5
2.1.2 Catalytic and Non-Catalytic Aromatic Hydrocarbon Oxidation ............................... 5
2.1.3 Operating Parameters That Affect Oxidation Rate and Selectivity ........................... 7
2.2 Reaction Engineering ............................................................................................................ 7
2.2.1 Mass transfer & kinetics ............................................................................................ 7
2.3 Microfluidics ......................................................................................................................... 8
2.3.1 Microfluidic Reactor .................................................................................................. 8
2.3.2 Fluid Dynamics in Microchannels ............................................................................. 9
2.3.3 Oxidation in Microfluidic Reactor ........................................................................... 11
2.4 Literature Cited ................................................................................................................... 12
Chapter 3: The impact of microfluidic reactor configuration on hydrodynamics,
conversion, and selectivity during indan oxidation ................................................................. 14
3.1 Introduction ......................................................................................................................... 15
3.2 Experimental ....................................................................................................................... 17
3.2.1 Materials .................................................................................................................. 17
3.2.2 Equipment ................................................................................................................ 19
3.2.3 Procedure ................................................................................................................. 20
3.2.4 Analyses ................................................................................................................... 21
3.2.5 Calculations.............................................................................................................. 22
vi
3.2.5.1 Size of liquid slug and gas bubble and Velocity Calculations .............................. 23
3.2.5.2 Hydrodynamic Properties ..................................................................................... 24
3.2.5.3 Conversion and Selectivity Calculation ................................................................ 27
3.2.5.4 Flame Ionization Detector (FID) Response Factor ............................................... 28
3.2.5.5 Diffusion Coefficient Calculation ......................................................................... 28
3.2.5.6 Mass Transfer Coefficient Calculation ................................................................. 29
3.3 Results ................................................................................................................................. 29
3.3.1 Constant Temperature Oxidation ............................................................................. 29
3.3.1.1 Measured Reactor Hydrodynamics ....................................................................... 30
3.3.1.2 Calculated Reactor Hydrodynamics ..................................................................... 31
3.3.1.3 Conversion and Selectivity ................................................................................... 33
3.3.2 Variable Temperature Oxidation ............................................................................. 34
3.3.2.1 Change of Hydrodynamic Parameters with Temperature ..................................... 34
3.3.2.2 Change of Calculated Reactor Hydrodynamics with Temperature ...................... 36
3.3.2.3 Change of Conversion and Selectivity with Temperature .................................... 37
3.4 Discussion ........................................................................................................................... 38
3.4.1 Impact of Reactor Configuration on Hydrodynamics .............................................. 38
3.4.1.1 Role of Reactor Size on Reactor Hydrodynamics ................................................ 38
3.4.1.2 Role of Reactor Shape on Reactor Hydrodynamics ............................................. 39
3.4.2 Role of Oxygen Availability on Conversion and Product Selectivity ..................... 40
3.4.2.1 Role of oxygen availability on Addition Product Selectivity ............................... 43
3.4.2.2 Role of oxygen availability on Ketone-to-Alcohol Selectivity............................. 44
3.4.3 Role of Reactor Hydrodynamics on Oxygen Consumption and Oxygen
Replenishment................................................................................................................... 47
3.4.4 Effect of Temperatures on Oxygen Availability, Conversion and Product Selectivity
........................................................................................................................................... 49
3.4.5 Implications of Current Research ............................................................................ 50
3.5 Conclusions ......................................................................................................................... 51
3.6 Acknowledgements ............................................................................................................. 52
3.7 Nomenclatures .................................................................................................................... 52
3.8 Literature Cited ................................................................................................................... 54
Chapter 4: Comparative Study of Tetralin Oxidation in Microfluidic and Batch Reactor 57
4.1 Introduction ......................................................................................................................... 57
vii
4.2 Experimental ....................................................................................................................... 59
4.2.1 Materials .................................................................................................................. 59
4.2.2 Equipment and Procedure ........................................................................................ 60
4.2.2.1 Oxidation in a Microfluidic Reactor ..................................................................... 60
4.2.2.2 Oxidation in a Batch Reactor ................................................................................ 62
4.2.2.3 GC Analyses ......................................................................................................... 63
4.2.3 Calculations.............................................................................................................. 64
4.4 Results and Discussion ....................................................................................................... 67
4.4.1 Analyzing Data to validate the results obtained from previous study ..................... 67
4.4.2 Analyzing Batch Reactor Data to Understand the Effect of Interfacial area ........... 69
4.5 Conclusions ......................................................................................................................... 70
4.6 Nomenclatures .................................................................................................................... 71
4.7 Literature Cited ................................................................................................................... 72
Chapter 5: Conclusion ................................................................................................................ 74
5.1 Introduction ......................................................................................................................... 74
5.2 Significance, Major Conclusions and Key Insights ............................................................ 74
5.3 Future Work ........................................................................................................................ 75
5.4 Publications and Presentations ............................................................................................ 76
Bibliography ................................................................................................................................ 78
Appendix A .................................................................................................................................. 85
Appendix B .................................................................................................................................. 86
viii
List of Figures
Figure 2.1: Oxidation Routes of Aromatic Hydrocarbons
Figure 2.2a: Flow pattern mapped by Triplett et al. and marked by Gupta et al.
Figure 2.2b: Typical flow patterns in microchannels observed by Triplett et al.
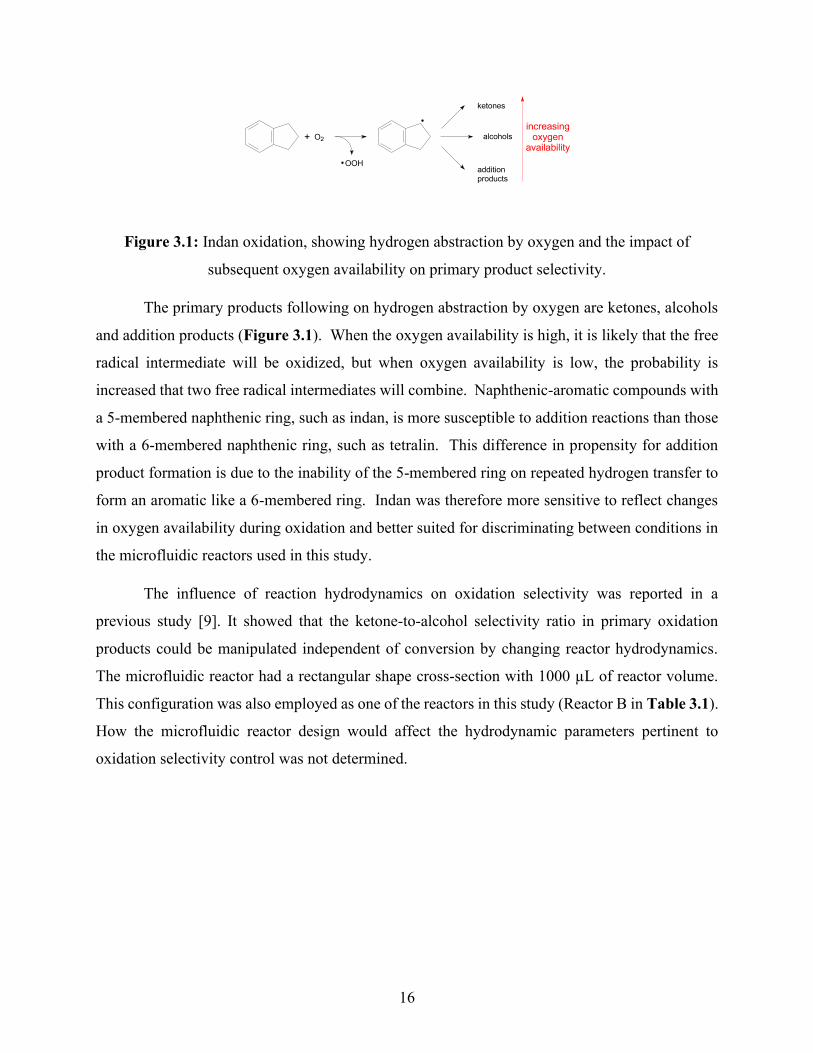
Figure 3.1: Indan oxidation, showing hydrogen abstraction by oxygen and the impact of
subsequent oxygen availability on primary product selectivity
Figure 3.2: Schematic of microfluidic experiment Setup
Figure 3.3: Sketch of a typical Taylor (slug) flow in which liquid can circulate within liquid slug
Figure 3.4: A typical GC-FID chromatogram of Indan and its oxidized products
Figure 3.5: Ruler calibration of size measurement using MATLAB version 2018b
Figure 3.6: (a) Measurement of gas bubble length 𝐿𝐺 (b) Measurement of liquid slug length 𝐿𝑆
Figure 3.7: Measurement of position change of liquid slugs over a specific period ∆𝐿
Figure 3.8: Illustration of liquid present in the edges at slug flow conditions: (i) irregular (half-
elliptical) shape Reactor A and (ii) rectangular shape Reactor B.
Figure 3.9: Role of oxygen availability during indan oxidation in slug flow condition in a
Reactor A (62.5 µL) microfluidic reactor at 150 °C and 300 kPa absolute.
Figure 3.10: Role of oxygen availability during indan oxidation in slug flow condition in a
Reactor B (1000 µL) microfluidic reactor at 150 °C and 300 kPa absolute.
Figure 3.11: Illustration of typical addition product formation during indan oxidation.
Figure 3.12: Effect of temperature on indan oxidized in slug flow condition in a Reactor A (62.5
µL) microfluidic reactor at 300 kPa absolute and indan injection rate of 7 µL/min.
Figure 3.13: Effect of temperature on indan oxidized in slug flow condition in a Reactor B
Figure 4.1: Schematic of microfluidic experiment Setup
ix
Figure 4.2: Batch reactor setup used in oxidation experiments
Figure 4.3: Typical GC-FID chromatogram of tetralin oxidized at 150 °C in a microfluidic
reactor at gas-liquid interfacial area
Figure 4.4: Typical Taylor flow (slug flow) in a microfluidic reactor representing to represent
length of gas (oxygen) bubble (LG), length of liquid (tetralin) slug (LS), unit cell length (LUC),
liquid film and liquid cap. Liquid can circulate within the liquid slug (Marangoni effect)
x
List of Tables
Table 2.1: Free radical mechanism of tetralin oxidation
Table 2.2: Important dimensionless number for multiphase flow characterization in
microchannels
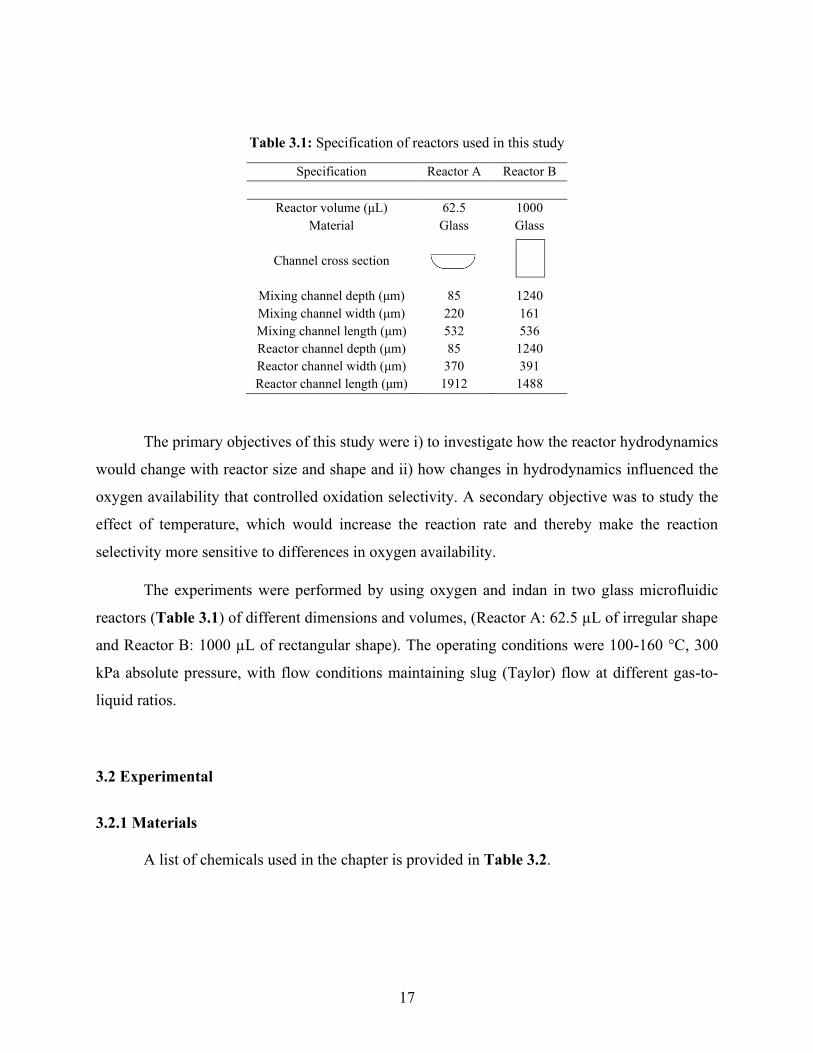
Table 3.1: Specification of reactors used in this study
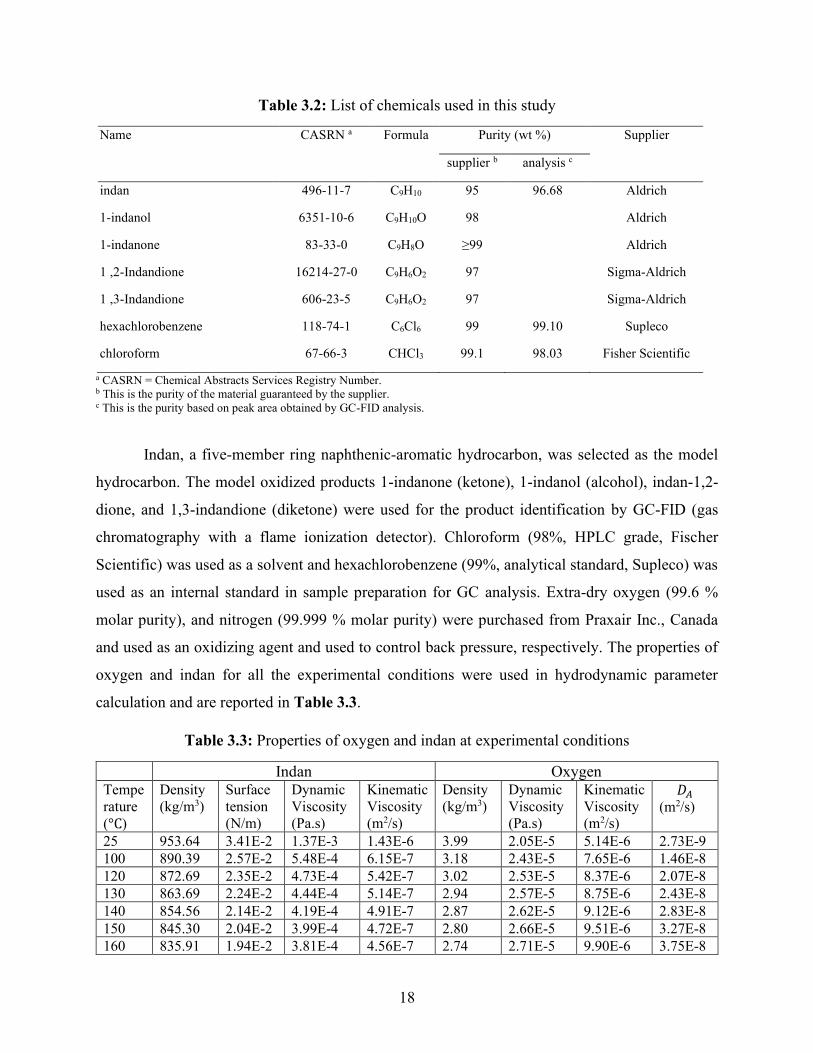
Table 3.2: List of chemicals used in this study
Table 3.3: Properties of oxygen and indan at experimental conditions
Table 3.4. Response factors of the studied chemicals
Table 3.5: Hydrodynamic properties and oxygen availability during indan oxidation in
microfluidic reactors at 300 kPa pressure absolute and 150 ℃ at different indan injection rates
using oxygen as oxidizing agent
Table 3.6: Calculated hydrodynamic properties and mass transfer coefficients during indan
oxidation using oxygen as oxidizing agent in microfluidic reactors at 300 kPa pressure absolute
and 150 ℃ at different indan injection rates
Table 3.7: Conversions and product selectivity of indan oxidized in microfluidic reactors at 300
kPa pressure absolute and 150 ℃ at different indan injection rates using oxygen as oxidizing
agent
Table 3.8: Hydrodynamic properties and oxygen availability during indan oxidation in
microfluidic reactors at 300 kPa pressure absolute and different temperatures at 7 µL/min indan
injection rate using oxygen as oxidizing agent
Table 3.9: Calculated hydrodynamic properties and mass transfer coefficients during indan
oxidation using oxygen as oxidizing agent in microfluidic reactors at 300 kPa pressure and
different temperatures at 7 µL/min indan injection rate
xi
Table 3.10: Conversions and product selectivity of indan oxidation using oxygen as oxidizing
agent in microfluidic reactors at 300 kPa pressure and different temperatures at 7 µL/min indan
injection rate
Table 3.11: Rate of oxygen consumption and oxygen replenishment during indan oxidation in
microfluidic reactors at 300 kPa pressure absolute and 150 ℃ at different indan injection rates
using oxygen as oxidizing agent
Table 3.12: Rate of oxygen consumption and oxygen replenishment during indan oxidation in
microfluidic reactors at 300 kPa pressure absolute and different temperatures at 7 µL/min indan
injection rate using oxygen as oxidizing agent
Table 4.1: Physicochemical properties of tetralin and oxygen at different experimental
conditions
Table 4.3: Conversion data for oxidation of tetralin with air at 130 °C conducted in a semi-batch
reactor
Table 4.4: Experimental data for tetralin oxidation in a microfluidic reactor
Table 4.5: Experimental data of the tetralin oxidation in a microfluidic reactor at 150°C and 191
kPa
Table 4.6: Conversion and selectivity for the tetralin oxidation in a batch reactor at 150 °C and
191 kPa with different gas-liquid volume and residence time
1
Chapter 1: Introduction
1.1 Background
The development of microfluidic reactor has gained popularity for chemical synthesis, such
as oxidation [1–4], hydrogenation [5, 6], halogenation [7] and bioprocessing [8] in the past two
decades. A microfluidic reactor usually has a high surface-to-volume ratio, which brings
advantages in mass and heat transfer. In addition, with a small radial diffusion length, the
microfluidic reactor can achieve proper mixing between two phases. Furthermore, performing
experiments using microfluidic reactor can be considered as a cost-saving and safe approach with
expensive and toxic materials because it requires only small amount of chemicals. [4, 9-12]. These
characteristics make the microfluidic reactors useful for the study of liquid phase oxidation.
Oxidation, incorporation of oxygen functional group, is one of the key steps to many
petrochemicals [13-16] and pharmaceutical products [17-18]. Most of the steps are catalytic that
generate huge waste [16, 19-20]. There is some non-catalytic process, but it faces problem to
control the product selectivity. Industrially the non-catalytic liquid phase oxidation is performed
at low conversion to control the product selectivity [21].
To limit the scope, this study focuses mainly on using microfluidic reactor to investigate
non-catalytic liquid phase oxidation which follow a complex free radical process and how reactor
design and operation affect the performance.
1.2 Objectives
The objective of the study was to investigate liquid phase oxidation of naphthenic-aromatic
hydrocarbon. The specific objectives of the research were as follows:
1. To study the role of oxygen availability on liquid phase oxidation of naphthenic-aromatic
hydrocarbon.
2. To compare the microfluidic reactor performance with batch and semi-batch reactor.
3. To study the effect of reactor configuration (size and shape) on liquid phase oxidation of
naphthenic aromatic hydrocarbon.
2
4. To study the effect of temperature on liquid phase oxidation of naphthenic-aromatic
hydrocarbon.
1.3 Scope of Work
Two naphthenic-aromatic compounds namely, tetralin and indan, were oxidized pure
oxygen in batch reactor, semi-batch reactor, and two microfluidic reactors of different
configuration at different operating conditions. The following chapters have been included in the
thesis to achieve the listed objectives:
Chapter 2: Literature review. The chapter provides an overview of hydrocarbon oxidation
chemistry, microfluidics, and oxidation in microfluidic reactors.
Chapter 3: The impact of microfluidic reactor configuration on hydrodynamics, conversion,
and selectivity during indan oxidation. The chapter discusses the liquid phase indan oxidation in
two microfluidic reactors of different configuration. The effect of reactor size, reactor shape, and
temperature on reactor hydrodynamics, product selectivity and conversion are discussed.
Chapter 4: Tetralin oxidation in microfluidic and batch reactor. The chapter compares the
liquid phase tetralin oxidation in batch and microfluidic reactors.
Chapter 5: Conclusions. The chapter provides the main conclusions derived from the
research and direction of future works that can be applied to petrochemical and pharmaceutical
industry.
1.4 Literature Cited
1. Gemoets HPL, Su Y, Shang M, Hessel V, Luque R, Noël T (2016) Liquid phase oxidation
chemistry in continuous flow microreactor. Chem Soc Rev 45:83–117.
2. Hone CA, Kappe CO (2019) The Use of Molecular Oxygen for Liquid Phase Aerobic
Oxidations in Continuous Flow. Top Curr Chem 2: 377.
3. Vanoye L, Aloui A, Pablos M, Philippe R, Percheron A, Favre-Réguillon A, de Bellefon C
(2013) A safe and efficient flow oxidation of aldehydes with O2. Org Lett 15:5978–5981.
3
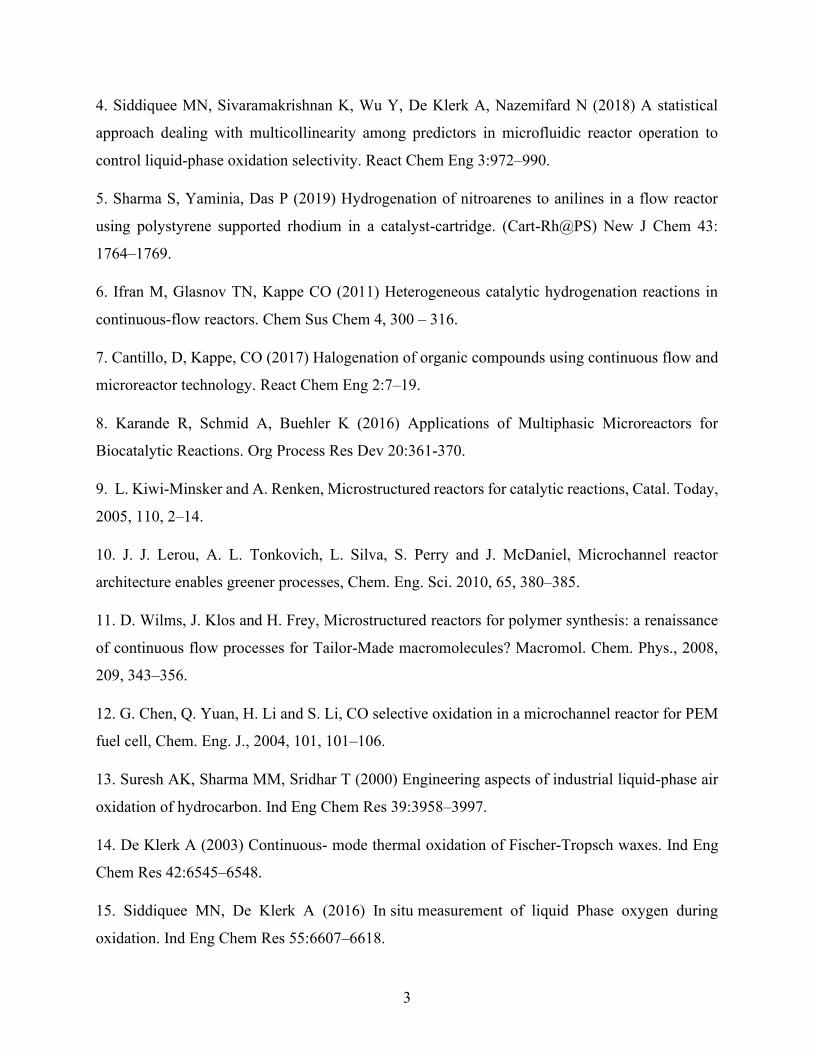
4. Siddiquee MN, Sivaramakrishnan K, Wu Y, De Klerk A, Nazemifard N (2018) A statistical
approach dealing with multicollinearity among predictors in microfluidic reactor operation to
control liquid-phase oxidation selectivity. React Chem Eng 3:972–990.
5. Sharma S, Yaminia, Das P (2019) Hydrogenation of nitroarenes to anilines in a flow reactor
using polystyrene supported rhodium in a catalyst-cartridge. (Cart-Rh@PS) New J Chem 43:
1764–1769.
6. Ifran M, Glasnov TN, Kappe CO (2011) Heterogeneous catalytic hydrogenation reactions in
continuous-flow reactors. Chem Sus Chem 4, 300 – 316.
7. Cantillo, D, Kappe, CO (2017) Halogenation of organic compounds using continuous flow and
microreactor technology. React Chem Eng 2:7–19.
8. Karande R, Schmid A, Buehler K (2016) Applications of Multiphasic Microreactors for
Biocatalytic Reactions. Org Process Res Dev 20:361-370.
9. L. Kiwi-Minsker and A. Renken, Microstructured reactors for catalytic reactions, Catal. Today,
2005, 110, 2–14.
10. J. J. Lerou, A. L. Tonkovich, L. Silva, S. Perry and J. McDaniel, Microchannel reactor
architecture enables greener processes, Chem. Eng. Sci. 2010, 65, 380–385.
11. D. Wilms, J. Klos and H. Frey, Microstructured reactors for polymer synthesis: a renaissance
of continuous flow processes for Tailor-Made macromolecules? Macromol. Chem. Phys., 2008,
209, 343–356.
12. G. Chen, Q. Yuan, H. Li and S. Li, CO selective oxidation in a microchannel reactor for PEM
fuel cell, Chem. Eng. J., 2004, 101, 101–106.
13. Suresh AK, Sharma MM, Sridhar T (2000) Engineering aspects of industrial liquid-phase air
oxidation of hydrocarbon. Ind Eng Chem Res 39:3958–3997.
14. De Klerk A (2003) Continuous- mode thermal oxidation of Fischer-Tropsch waxes. Ind Eng
Chem Res 42:6545–6548.
15. Siddiquee MN, De Klerk A (2016) In situ measurement of liquid Phase oxygen during
oxidation. Ind Eng Chem Res 55:6607–6618.
4
16. Dimitratos N, Lopez-Sanchez JA, Hutchings GJ (2014) Supported metal nanoparticles in
liquid-phase oxidation reactions. In: Duprez D, Cavani F (Eds) Handbook of Advanced Methods
and Processes in Oxidation Catalysis: From Laboratory to Industry, Imperial College Press,
London 631–678.
17. Snead DR, Jamison TF (2015) A three-minute synthesis and purification of ibuprofen: pushing
the limits of continuous-flow processing. Angew Chem Int Ed 54:1521–3773.
18. Gutmann B, Cantillo D, Kappe CO (2015) Continuous-flow technology—A tool for the safe
manufacturing of active pharmaceutical ingredients Angew Chem Int Ed 54:6688–6729.
19. C. D. Pina, E. Falletta and M. Rossi, Liquid phase oxidation of organic compounds by
supported metal-based catalysts with a focus on gold. In Liquid Phase Oxidation via
Heterogeneous Catalysis: Organic Synthesis and Industrial Applications, First Edition; M. G.
Clerici and O. A. Kholdeeva, Eds.; Wiley: Hoboken, 2013, 221–262.
20. G. Centi and S. Perathoner, Selective oxidation— industrial. In Encyclopedia of Catalysis;
Wiley, 2002.
21. Hermans, J. Peeters and P. A. Jacobs, Autoxidation of Hydrocarbons: From Chemistry to
Catalysis, Top Catal. 2008, 50, 124–132.
5
Chapter 2: Literature Review
2.1 Oxidation Chemistry
2.1.1 Liquid Phase Oxidation
Liquid phase oxidation studies the kinetics and mechanism of the oxidation of
hydrocarbons in the liquid phase. Due to the scope limitation, literature focuses on liquid phase
oxidation of aromatic hydrocarbon.
2.1.2 Catalytic and Non-Catalytic Aromatic Hydrocarbon Oxidation
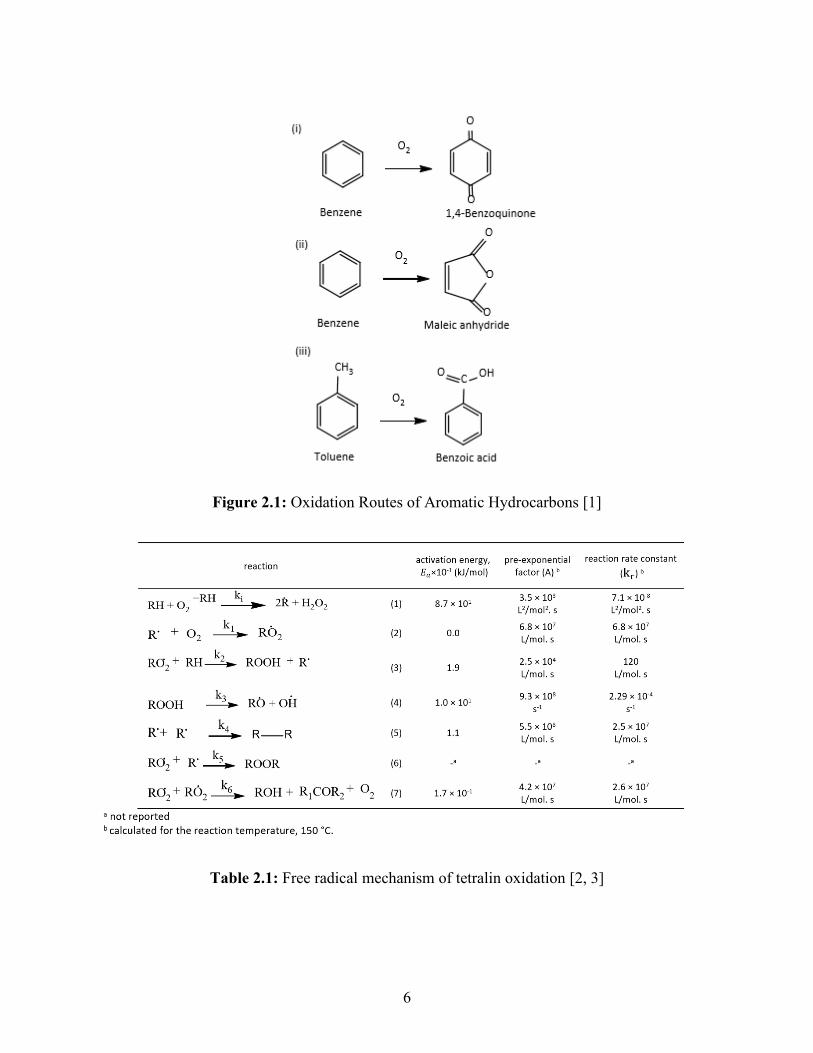
As illustrated in Figure 2.1, liquid phase aromatic hydrocarbon oxidation could be
separated into following 3 groups: (i) non-cleavage of aromatic ring such as formation of 1,4 –
benzoquinone through benzene oxidation, (ii) cleavage of aromatic ring such as maleic anhydride
formation through benzene oxidation and (iii) formation of oxygenates through hydrogen
abstraction from side chain at aromatic ring such as benzoic acid formation through toluene
oxidation [1]. Reaction (i) and (ii) require catalyses such as MoO3, V2O5 or catalyst promoter
such as oxides or salts of P, Ag, W, Bi, Sn, Cu, Na, B, Ti and Ni.
Reaction (iii) is a non-catalytic oxidation process following free radical oxidation
mechanism involving initiation, propagation, and termination [2, 3-5]. A variety of intermediate
products, for instance peroxides, alcohols, ketones, acids, esters, and bi-functional compounds [3,
5] are formed during a non-catalytic free radical oxidation. As shown in Table 2.1, reaction rate
is low during initiation and high during propagation and termination [2, 3].
6
Figure 2.1: Oxidation Routes of Aromatic Hydrocarbons [1]
Table 2.1: Free radical mechanism of tetralin oxidation [2, 3]
7
2.1.3 Operating Parameters That Affect Oxidation Rate and Selectivity
Oxidation rate and selectivity are affected by operating parameters such as temperature,
pressure, mass transport between phases, local oxygen availability, free radical availability etc. At
stage of initiation, free radicals are generated during the reactions between oxygen molecules and
hydrocarbons. Oxygen molecules abstract hydrogen from hydrocarbons to form free radicals such
as hydroperoxyl radicals and alkyl radicals [3,5]. The oxidation rate is slow due to the breakage of
C-H bond. Once the hydrocarbon is activated, the reaction rate increases drastically due to the
existence of free radicals, which are prone to forming new bonds because they contain unpaired
electrons [2-5]. Therefore, the challenge is to control these operating parameters to achieve desired
product selectivity. Both reaction rate and product selectivity are influenced by operating
temperature. Local oxygen and free radical availability also play important roles in product
selectivity. [2-5]
2.2 Reaction Engineering
2.2.1 Mass transfer & kinetics
In a liquid phase hydrocarbon oxidation with gas phase air or oxygen, mass transfer plays
an essential role in reactor design and operation, which is well explained throughout literature.
Different models such as penetration, surface renewal and film model [6-9], have been built to
describe gas-liquid mass transfer as well as chemical reactions. Film theory is widely applied for
describing mass transfer in microfluidic reactors, which assumes a stagnant film with uniform
thickness across gas-liquid interface. The mass transfer rate can be described as: [2, 6, 6-10]
in which, 𝐽A is mass transfer rate across gas-liquid interface per unit volume(mol/m3.s), 𝑘L is the
liquid mass transfer coefficient (m/s), 𝐷A is diffusivity of gas in liquid (m2/s) , 𝛿 is the thin film
thickness (m), 𝑎 is gas-liquid interfacial area (m2/ m3), 𝐶Ai is the concentration of gas at the
interface, (mol/ m3), and Cb is the concentration of gas in bulk liquid (mol/ m3).
8
Based on experimental observation as reported in literatures [2, 11], gas-liquid interfacial
area is the most important parameter to determine the mass transfer rate. In the case of liquid phase
hydrocarbon oxidation with gaseous oxygen, a larger gas-liquid interfacial area increases oxygen
mass transfer rate between gas phase and bulk liquid, which ensures higher local oxygen
availability in the liquid phase hydrocarbon.
2.3 Microfluidics
There is a rising trend of applying microfluidics in both academia and industry. The current
study on hydrocarbon oxidation is mainly investigated using microfluidic reactors. A reduction in
the channel size into microscale leads to an increase importance of some properties which is
negligible in a macro scale. This section provides an overview of its characteristics, flow regime,
advantages, and state-of-art research.
2.3.1 Microfluidic Reactor
A microfluidic device is typically used for controlling fluids which are constrained within
channels with internal dimensions or hydrodynamic diameters in the sub-millimetre range [12].
The microfluidic reactor chip is commonly fabricated using materials including polymer, glass,
silicon, stainless steel, and ceramics depending on operating temperature, pressure, chemical
compatibility and ease of fabrication and integration [13]. For instance, polydimethylsiloxane, also
known as PDMS, has been widely applied in biological and chemical microfluidics at mild
operating conditions due to its rapid, convenient, inexpensive and fabrication process [14]. There
are also tremendous applications using glass and silicon-based microfluidic systems because of
their excellent performance in mechanical strength-to-density ratio, temperature characteristics,
low cost, and chemical compatibility. In addition, those devices provide convenience for
developing catalytic coatings and integration of silicon micro-sensor for temperature, pressure,
and flow monitoring [13]. In the current study, glass microfluidic reactors are employed to conduct
the hydrocarbon oxidation.
9
2.3.2 Fluid Dynamics in Microchannels
The flow in a microfluidic device can be single phase (gas or liquid) or multiple phase (gas-
liquid, or liquid-liquid). As for the single-phase flow, the fluid dynamics in the microchannel is
close to that in a channel with a large diameter. However, for a multiphase flow in the
microchannel, the fluid dynamics is different [15].
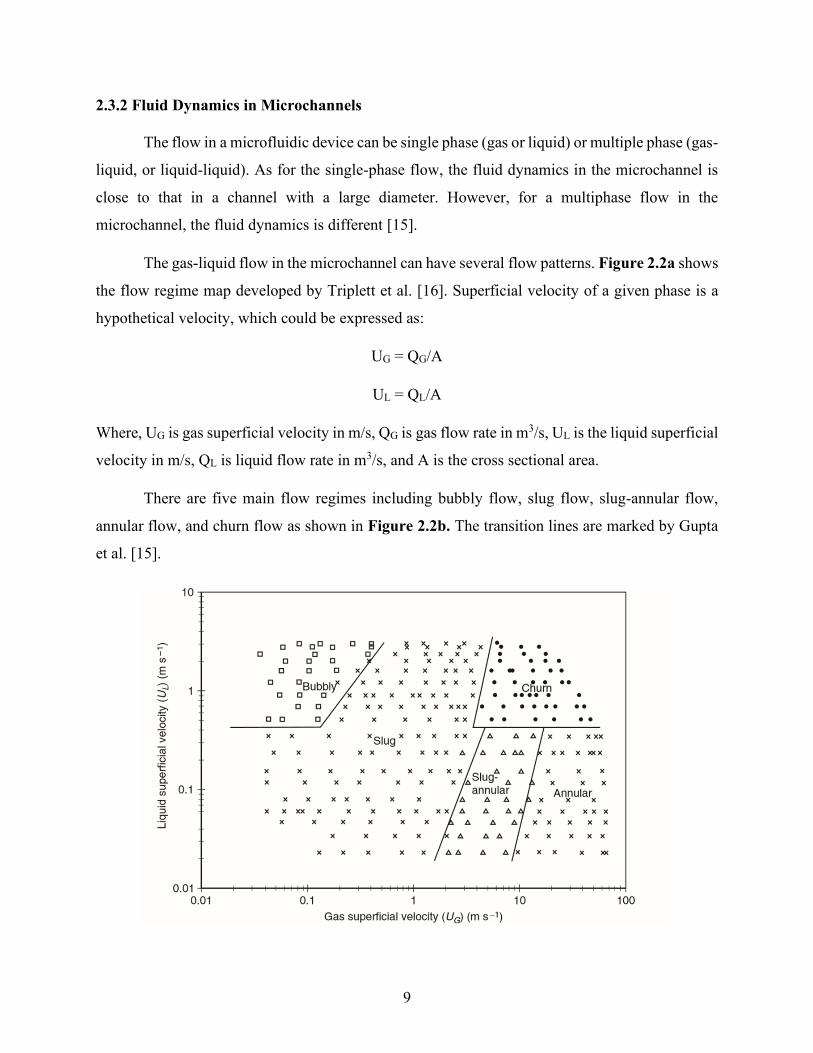
The gas-liquid flow in the microchannel can have several flow patterns. Figure 2.2a shows
the flow regime map developed by Triplett et al. [16]. Superficial velocity of a given phase is a
hypothetical velocity, which could be expressed as:
UG = QG/A
UL = QL/A
Where, UG is gas superficial velocity in m/s, QG is gas flow rate in m3/s, UL is the liquid superficial
velocity in m/s, QL is liquid flow rate in m3/s, and A is the cross sectional area.
There are five main flow regimes including bubbly flow, slug flow, slug-annular flow,
annular flow, and churn flow as shown in Figure 2.2b. The transition lines are marked by Gupta
et al. [15].

10
Figure 2.2a: Flow pattern mapped by Triplett et al. and marked by Gupta et al. [15]
Figure 2.2b: Typical flow patterns in microchannels observed by Triplett et al. [16]
Gupta et al. has listed five important dimensionless numbers for multiphase flow
characterization in microchannels as listed in Table 2.2 [15].
Table 2.2: Important dimensionless number for multiphase flow characterization in
microchannels [15]
11
Typically, a laminar flow is observed in the microfluidic reactor because it has a low
Reynolds number from 0.01 to 100 [17].
2.3.3 Oxidation in Microfluidic Reactor
There is an increasing trend to explore the potential of using microfluidic reactor to conduct
non-catalytic liquid phase hydrocarbon oxidation. Advantages of the microfluidic reactors are: (i)
improved heat and mass transfer due to the higher surface area-to-volume ratio, (ii) better mixing
because of small radial diffusion and internal circulation in liquid slug in case of Taylor flow, (iii)
well-defined flow properties, (iv) exact control of gas-liquid ratio, and (v) enhanced safety for
using pure oxygen.
Jevtic et al. (2010) has investigated using a capillary reactor on the production of Nylon
6,6 through a non-catalytic liquid phase oxidation of cyclohexane. The results show a conversion
of 12% and selectivity of 80%. As a comparison, in industry, a low conversion of 4-5% is
maintained to achieve a product selectivity of 80% [18].
Siddiquee et al. (2016) has performed an experimental research using a microfluidic reactor
on liquid phase oxidation of tetralin, a naphthenic-aromatic hydrocarbon, at Taylor flow conditions
[2]. The study shows a promising 13 times increase in ketone to alcohol selectivity by increasing
oxygen availability at a constant conversion compared to the selectivity reported in tetralin
oxidation in a batch or semi-batch reactor.
Neuenschwander and Jensen (2014) has performed experiments on non-catalytic liquid
phase oxidation of olefin (β-pinene) in a microfluidic reactor. The results show order of magnitude
increase in oxyfunctionalization of olefins [19] as compared with that in a batch reactor.
Despite all the above promising advancements in liquid phase oxidation in the microfluidic
reactors, the impact of microfluidic reactor configuration and operating temperature on
hydrodynamics, conversion, and selectivity during a non-catalytic liquid phase oxidation is not
well studied. This void in knowledge suggests further research is required to achieve future
commercial applications.
12
2.4 Literature Cited
1. N. M. Sánchez and A. de Klerk, Autoxidation of aromatics, App. Petro. Res., 2018, 8, 55–78.
2. M. N. Siddiquee, A. de Klerk and N. Nazemifard, Application of microfluidics to enhance gas-
liquid mass transfer during selective oxidation of hydrocarbons. React. Chem. Eng., 2016, 1, 418–
435.
3. N. M. Emanuel, E. T. Denisov, and Z. K. Maizus, Liquidphase oxidation of hydrocarbons;
Plenum Press: New York, 1967.
4. A. K. Suresh, M. M. Sharma and T. Sridhar, Engineering aspects of industrial liquid-phase air
oxidation of hydrocarbon, Ind. Eng. Chem. Res., 2000, 39, 3958–3997.
5. A. de Klerk, Continuous- mode thermal oxidation of Fischer-Tropsch waxes, Ind. Eng. Chem.
Res., 2003, 42, 6545–6548.
6. P. V. Danckwerts, Gas-Liquid Reactions; McGraw-Hill: New York, 1970.
7. F. Kaštánek, J. Zaharadnǐk, J. Kratochvǐl and J. Čermák, Chemical Reactors for Gas-Liquid
Systems, 1st ed.; Ellis Horwood: West Sussex, 1993.
8. E. L. Cussler. Diffusion: Mass Transfer in Fluid Systems, 3rd ed.; Cambridge University Press:
Cambridge, 2009.
9. L. K. Doraiswamy and D. Üner, Chemical Reaction Engineering, Beyond the Fundamentals;
CRC Press: Boca Raton, 2014.
10. A. K. Suresh, T. Sridhar and O. E. Potter, Autocatalytic oxidation of cyclohexane− mass
transfer and chemical reaction. AIChE J., 1988, 34(1), 81–93.
11. M. N. Siddiquee, K. Sivaramakrishnan, Y. Wu, A. de Klerk and N. Nazemifard, A statistical
approach dealing with multicollinearity among predictors in microfluidic reactor operation to
control liquid-phase oxidation selectivity. React. Chem. Eng., 2018, 3,972–990.
12. P. Tabeling, Introduction to Microfluidics. Oxford, U.K., OUP Oxford, 2005.
13. K. F. Jensen, "Silicon-based microchemical systems: Characteristics and applications." Mrs
Bulletin 31(2): 101-107, 2006.
13
14. G. M. Whitesides, E. Ostuni, S. Takayama, X. Jiang and D. E. Ingber. "Soft Lithography in
Biology and Biochemistry." Annual Review of Biomedical Engineering 3(1): 335-373, 2001.
15. R. Gupta, D. F. Fletcher and B. S. Haynes, "Taylor Flow in Microchannels: A Review of
Experimental and Computational Work." The Journal of Computational Multiphase Flows 2(1):
1-31, 2010.
16. K. A. Triplett, S. M. Ghiaasiaan, S. I. Abdel-Khalik and D. L. Sadowski, "Gas-liquid two-
phase flow in microchannels part I: Two-phase flow patterns." International Journal of Multiphase
Flow 25(3): 377-394, 1999.
17. H. Song, J. D. Tice and R. F. Ismagilov, "A Microfluidic System for Controlling Reaction
Networks in Time." Angewandte Chemie International Edition 42(7): 768-772, 2003.
18. R. Jevtic, P. A. Ramachandran and M. P. Dudukovic. Capillary reactor for cyclohexane
oxidation with oxygen, Chem. Eng. Res. Des., 2010, 88, 255–62.
19. U. Neuenschwander and K. F. Jensen, Olefin autoxidation in flow, Ind. Eng. Chem. Res., 2014,
53(2), 601–608.
14
Chapter 3: The impact of microfluidic reactor configuration on
hydrodynamics, conversion, and selectivity during indan oxidation
In this chapter we discuss the effect of reactor configuration (size and shape) and
temperature on liquid phase oxidation of indan, a naphthenic-aromatic hydrocarbon. The work has
been accepted to be published as a paper on Journal of Flow Chemistry.
Abstract
Conversion and product selectivity of liquid phase autoxidation of hydrocarbons are
affected by numbers of operating conditions, but foremost oxygen availability and temperature.
The objective of this study was to understand the impact of reactor configuration on
hydrodynamics, conversion, and selectivity. The experiments were performed by using oxygen
and indan (a highly reactive naphthenic-aromatic hydrocarbon) in two microfluidic reactors of
different dimensions and cross-section geometries, (Reactor A: 62.5 µL of irregular shape and
Reactor B: 1000 µL of rectangular shape) at 100˗160 °C temperatures and 300 kPa absolute
pressures maintaining slug (Taylor) flow. It was found that reactor configuration influenced the
hydrodynamics and oxygen availability that consequently changed the conversion and product
selectivity in different ways. At constant temperature, pressure and near constant conversion of 12
wt/wt %, Reactor A showed mostly primary products, in contrast, Reactor B showed secondary
products, addition products, and primary product having higher ketone-to-alcohol ratio (13:1) than
the Reactor A (4.5:1). Overall, Reactor A showed higher indan conversion and suppressed addition
product selectivity, whereas Reactor B showed moderate indan conversion and enhanced ketone-
to-alcohol ratio (13:1) from the typical ketone-to-alcohol ratio of 1:1.The main contributor in
Reactor A to get higher local oxygen availability (gas-liquid interfacial area) was the smaller
reactor dimension and liquid slug size whereas the length of the liquid film surrounding the gas
bubble was the main contributor for Reactor B to obtain the higher oxygen availability.
Comparison of the rate of oxygen consumption and the rate of oxygen transformation ensured the
presence of adequate oxygen within the liquid slug and also validated the assumption of using
Fick’s law to describe the oxygen transport from the gas phase to liquid phase. The understanding
15
from the study can be applied in design and operation of industrial units to control the conversion
and product selectivity of a complex free radical system.
3.1 Introduction
The study of chemistry in miniaturized flow reactors became very popular for a wide range
of chemical synthesis processes, such as oxidation [1–4], hydrogenation [5, 6], halogenation [7]
and bioprocessing [8]. Advantages of the miniaturized reactors are: (i) improved heat and mass
transfer due to the higher surface area-to-volume ratio, (ii) better mixing because of small radial
diffusion and internal circulation in liquid slug in case of Taylor flow, (iii) well-defined flow
properties, (iv) exact control of gas-liquid ratio, and (v) enhanced safety for using pure oxygen [1,
9 – 11]. All these characteristics make the microfluidic reactors useful for the study of liquid phase
oxidation.
Liquid phase oxidation is an industrially important process to produce many
petrochemicals [12 –15] and pharmaceutical products [16–17]. The key challenge of this free
radical process involving initiation, propagation, and termination reactions is to control the product
selectivity. A few operating conditions affect the product selectivity during liquid phase
autoxidation of hydrocarbons, but foremost temperature in combination with oxygen availability
[9, 12–14]. Selectivity in the propagation step is influenced by oxygen availability in relation to
the free radical concentration and the oxidation reaction can easily become oxygen transfer limited,
because the reaction between alkyl radical and oxygen is very fast [9, 12, 18]. Operation at low
conversion is commonly practiced in industry to control the product selectivity.
Indan oxidation, as shown in Figure 3.1, was selected for this study. Naphthenic-aromatic
compounds are important classes of hydrocarbon available in coal, oilsands bitumen and
conventional petroleum. The naphthenic-aromatic compounds are susceptible to oxidation,
because hydrogen abstraction from the benzylic carbon results in a free radical that is resonance
stabilized [19–20].
16
Figure 3.1: Indan oxidation, showing hydrogen abstraction by oxygen and the impact of
subsequent oxygen availability on primary product selectivity.
The primary products following on hydrogen abstraction by oxygen are ketones, alcohols
and addition products (Figure 3.1). When the oxygen availability is high, it is likely that the free
radical intermediate will be oxidized, but when oxygen availability is low, the probability is
increased that two free radical intermediates will combine. Naphthenic-aromatic compounds with
a 5-membered naphthenic ring, such as indan, is more susceptible to addition reactions than those
with a 6-membered naphthenic ring, such as tetralin. This difference in propensity for addition
product formation is due to the inability of the 5-membered ring on repeated hydrogen transfer to
form an aromatic like a 6-membered ring. Indan was therefore more sensitive to reflect changes
in oxygen availability during oxidation and better suited for discriminating between conditions in
the microfluidic reactors used in this study.
The influence of reaction hydrodynamics on oxidation selectivity was reported in a
previous study [9]. It showed that the ketone-to-alcohol selectivity ratio in primary oxidation
products could be manipulated independent of conversion by changing reactor hydrodynamics.
The microfluidic reactor had a rectangular shape cross-section with 1000 µL of reactor volume.
This configuration was also employed as one of the reactors in this study (Reactor B in Table 3.1).
How the microfluidic reactor design would affect the hydrodynamic parameters pertinent to
oxidation selectivity control was not determined.
+ O2
OOH
ketones
alcohols
additionproducts
increasingoxygen
availability
17
Table 3.1: Specification of reactors used in this study
Specification Reactor A Reactor B
Reactor volume (μL) 62.5 1000
Material Glass Glass
Channel cross section
Mixing channel depth (μm) 85 1240
Mixing channel width (μm) 220 161
Mixing channel length (μm) 532 536
Reactor channel depth (μm) 85 1240
Reactor channel width (μm) 370 391
Reactor channel length (μm) 1912 1488
The primary objectives of this study were i) to investigate how the reactor hydrodynamics
would change with reactor size and shape and ii) how changes in hydrodynamics influenced the
oxygen availability that controlled oxidation selectivity. A secondary objective was to study the
effect of temperature, which would increase the reaction rate and thereby make the reaction
selectivity more sensitive to differences in oxygen availability.
The experiments were performed by using oxygen and indan in two glass microfluidic
reactors (Table 3.1) of different dimensions and volumes, (Reactor A: 62.5 µL of irregular shape
and Reactor B: 1000 µL of rectangular shape). The operating conditions were 100-160 °C, 300
kPa absolute pressure, with flow conditions maintaining slug (Taylor) flow at different gas-to-
liquid ratios.
3.2 Experimental
3.2.1 Materials
A list of chemicals used in the chapter is provided in Table 3.2.
18
Table 3.2: List of chemicals used in this study
Name CASRN a Formula Purity (wt %) Supplier
supplier b analysis c
indan 496-11-7 C9H10 95 96.68 Aldrich
1-indanol 6351-10-6 C9H10O 98 Aldrich
1-indanone 83-33-0 C9H8O ≥99 Aldrich
1 ,2Indandione 16214270 C9H6O2 97 Sigma-Aldrich
1 ,3Indandione 606235 C9H6O2 97 Sigma-Aldrich
hexachlorobenzene 118-74-1 C6Cl6 99 99.10 Supleco
chloroform 67-66-3 CHCl3 99.1 98.03 Fisher Scientific
a CASRN = Chemical Abstracts Services Registry Number. b This is the purity of the material guaranteed by the supplier. c This is the purity based on peak area obtained by GC-FID analysis.
Indan, a five-member ring naphthenic-aromatic hydrocarbon, was selected as the model
hydrocarbon. The model oxidized products 1-indanone (ketone), 1-indanol (alcohol), indan-1,2-
dione, and 1,3-indandione (diketone) were used for the product identification by GC-FID (gas
chromatography with a flame ionization detector). Chloroform (98%, HPLC grade, Fischer
Scientific) was used as a solvent and hexachlorobenzene (99%, analytical standard, Supleco) was
used as an internal standard in sample preparation for GC analysis. Extra-dry oxygen (99.6 %
molar purity), and nitrogen (99.999 % molar purity) were purchased from Praxair Inc., Canada
and used as an oxidizing agent and used to control back pressure, respectively. The properties of
oxygen and indan for all the experimental conditions were used in hydrodynamic parameter
calculation and are reported in Table 3.3.
Table 3.3: Properties of oxygen and indan at experimental conditions
Indan Oxygen Tempe
rature
(°C)
Density
(kg/m3)
Surface
tension
(N/m)
Dynamic
Viscosity
(Pa.s)
Kinematic
Viscosity
(m2/s)
Density
(kg/m3)
Dynamic
Viscosity
(Pa.s)
Kinematic
Viscosity
(m2/s)
𝐷𝐴
(m2/s)
25 953.64 3.41E-2 1.37E-3 1.43E-6 3.99 2.05E-5 5.14E-6 2.73E-9
100 890.39 2.57E-2 5.48E-4 6.15E-7 3.18 2.43E-5 7.65E-6 1.46E-8
120 872.69 2.35E-2 4.73E-4 5.42E-7 3.02 2.53E-5 8.37E-6 2.07E-8
130 863.69 2.24E-2 4.44E-4 5.14E-7 2.94 2.57E-5 8.75E-6 2.43E-8
140 854.56 2.14E-2 4.19E-4 4.91E-7 2.87 2.62E-5 9.12E-6 2.83E-8
150 845.30 2.04E-2 3.99E-4 4.72E-7 2.80 2.66E-5 9.51E-6 3.27E-8
160 835.91 1.94E-2 3.81E-4 4.56E-7 2.74 2.71E-5 9.90E-6 3.75E-8
19
3.2.2 Equipment
Two glass microfluidic reactors (Reactor A and Reactor B) of different dimensions and
volumes were used to perform experiments and were purchased from Dolomite (Dolomite
Microfluidics, Charlestown, MA, USA). The dimensions and channel cross-section of the reactors
are summarized in Table 3.1 and the more details of reactors are provided in Supplemental
Information. Irregular shape Reactor A (62.5μl) had a mixing channel of depth=85 μm, width=
220 μm, length= 532 mm and a reaction channel of depth=85 μm, width= 370 μm, length= 1912
mm. The hydraulic diameter of the reaction channel of the Reactor A was dH =1.4×10⁻⁴ m.
Rectangular reactor (Reactor B) had a mixing channel of depth = 1240 μm, width = 161 μm, length
= 536 mm and reaction channel of depth = 1240 μm, width = 391 μm, length = 1844 mm. The
hydraulic diameter of the reaction channel of the Reactor B was dH =6.0×10⁻⁴ m.
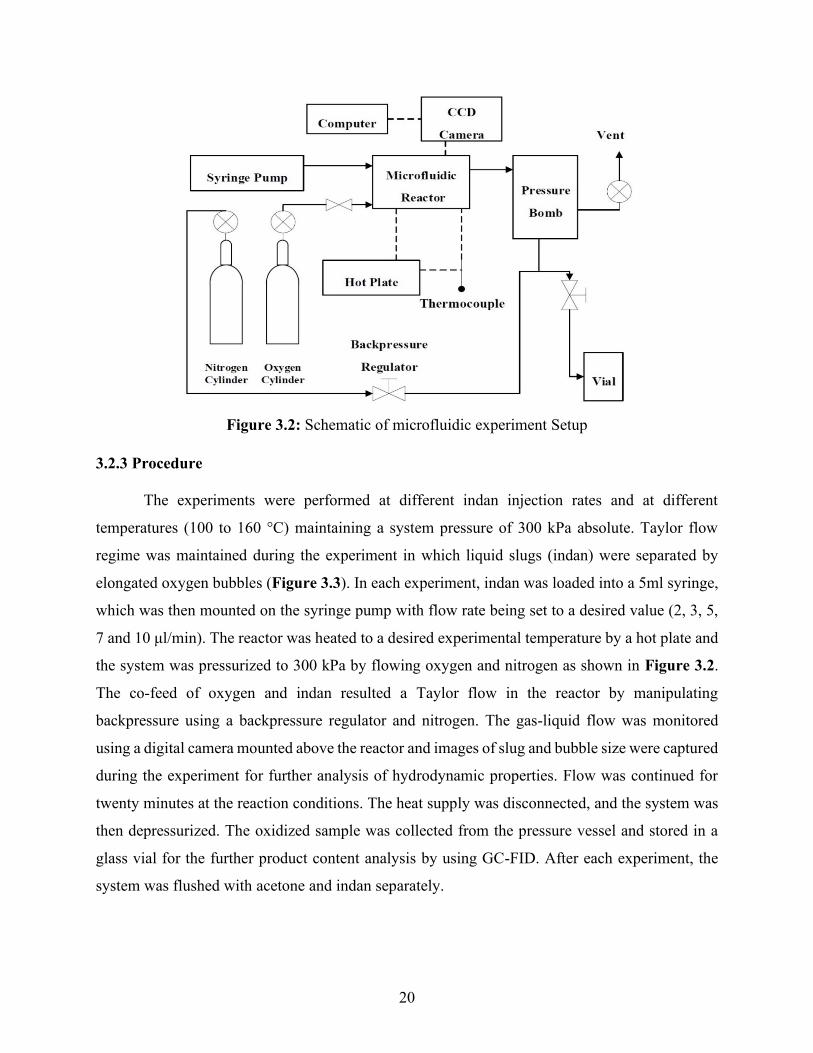
The experimental setup (Figure 3.2) consisted of a microfluidic reactor, a syringe pump
(Harvard Apparatus, USA), gas cylinders (O2 and N2), gas flow meter (Swagelok, Canada),
pressure bomb (Swagelok, Canada), and backpressure regulator (Swagelok, Canada). Indan was
injected into the microfluidic reactor at the desired flowrates by using a syringe pump equipped
with a 5 mL syringe (Model: 1005TLL, Hamilton Co., USA). A Heidolph MR Hei-Standard hot
plate (Model: 505-20000-01-2, Heldolph Instruments, Germany) and a surface mounted
thermocouple (Model: CO 1, Cement-on Thermocouple, Omega Engineering, Inc., USA) were
used to control the system temperature in the microfluidic reactor. The reactor was mounted on an
aluminum block (built at University of Alberta Machine Shop) with thermal adhesive (Dow
Corning Corporation, Midland, MI, USA) to ensure better heat transfer between the hot plate and
the reactor. A Flea3FL3-U3-13E4M camera (Point Grey Research Inc., Canada) was placed above
the reactor to capture the images of gas bubbles and liquid slugs during the experiment. A Fiber–
Lite lamp (Model: 3100, Dolan-Jenner Industries, Inc., USA) was used to improve lighting. PTFE
tubing, 1/16″ OD × 0.8 mm ID (Dolomite Microfluidics, Charlestown, MA, USA) were used to
connect the reactor with the syringe pump, gas flow meter, and pressure bomb.
20
Figure 3.2: Schematic of microfluidic experiment Setup
3.2.3 Procedure
The experiments were performed at different indan injection rates and at different
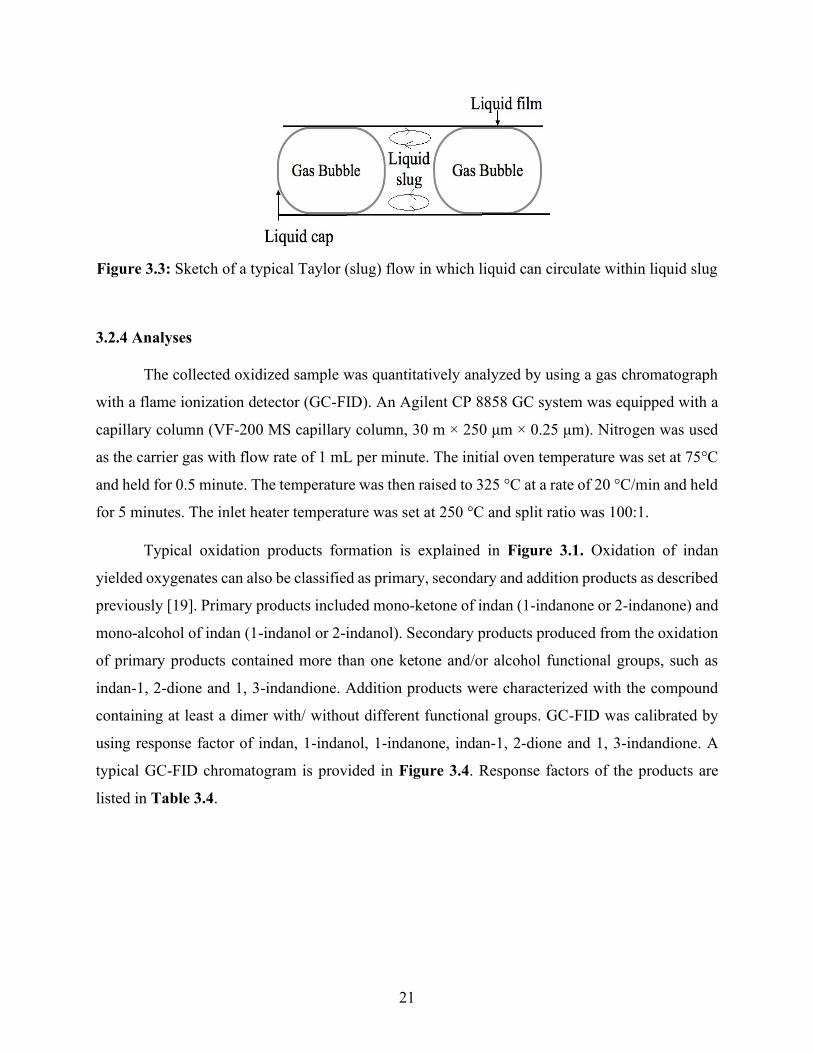
temperatures (100 to 160 °C) maintaining a system pressure of 300 kPa absolute. Taylor flow
regime was maintained during the experiment in which liquid slugs (indan) were separated by
elongated oxygen bubbles (Figure 3.3). In each experiment, indan was loaded into a 5ml syringe,
which was then mounted on the syringe pump with flow rate being set to a desired value (2, 3, 5,
7 and 10 μl/min). The reactor was heated to a desired experimental temperature by a hot plate and
the system was pressurized to 300 kPa by flowing oxygen and nitrogen as shown in Figure 3.2.
The co-feed of oxygen and indan resulted a Taylor flow in the reactor by manipulating
backpressure using a backpressure regulator and nitrogen. The gas-liquid flow was monitored
using a digital camera mounted above the reactor and images of slug and bubble size were captured
during the experiment for further analysis of hydrodynamic properties. Flow was continued for
twenty minutes at the reaction conditions. The heat supply was disconnected, and the system was
then depressurized. The oxidized sample was collected from the pressure vessel and stored in a
glass vial for the further product content analysis by using GC-FID. After each experiment, the
system was flushed with acetone and indan separately.
21
Figure 3.3: Sketch of a typical Taylor (slug) flow in which liquid can circulate within liquid slug
3.2.4 Analyses
The collected oxidized sample was quantitatively analyzed by using a gas chromatograph
with a flame ionization detector (GC-FID). An Agilent CP 8858 GC system was equipped with a
capillary column (VF-200 MS capillary column, 30 m × 250 μm × 0.25 μm). Nitrogen was used
as the carrier gas with flow rate of 1 mL per minute. The initial oven temperature was set at 75°C
and held for 0.5 minute. The temperature was then raised to 325 °C at a rate of 20 °C/min and held
for 5 minutes. The inlet heater temperature was set at 250 °C and split ratio was 100:1.
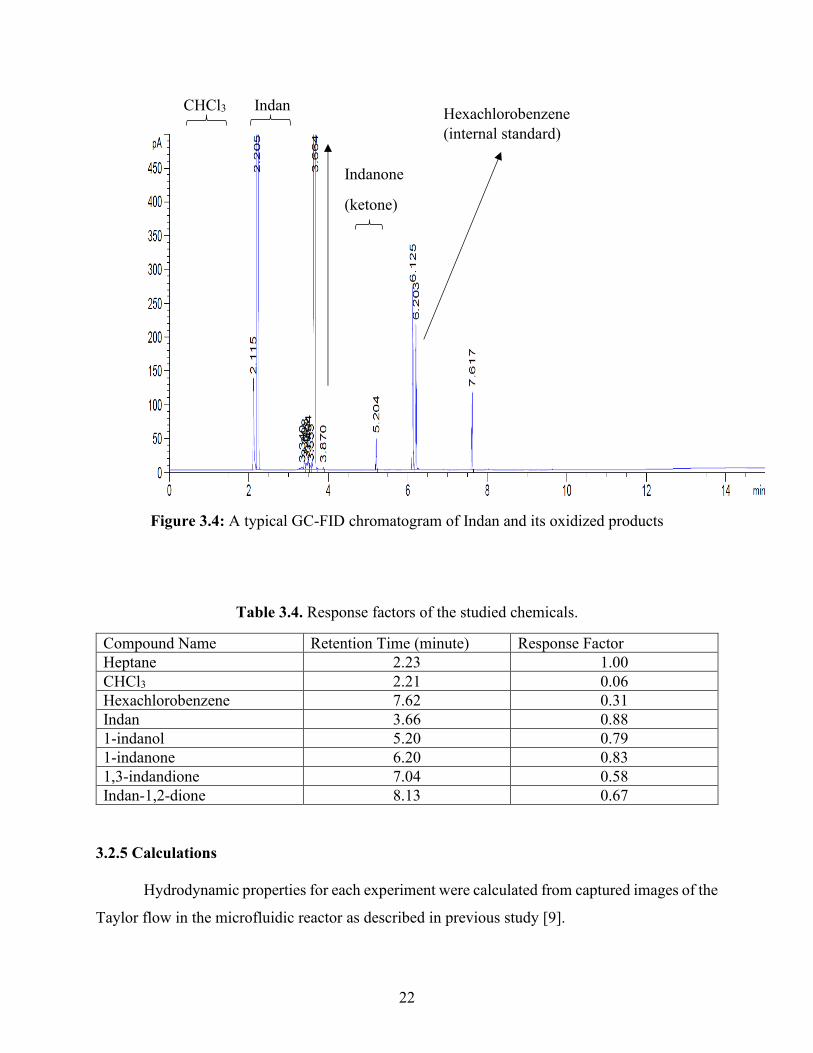
Typical oxidation products formation is explained in Figure 3.1. Oxidation of indan
yielded oxygenates can also be classified as primary, secondary and addition products as described
previously [19]. Primary products included mono-ketone of indan (1-indanone or 2-indanone) and
mono-alcohol of indan (1-indanol or 2-indanol). Secondary products produced from the oxidation
of primary products contained more than one ketone and/or alcohol functional groups, such as
indan-1, 2-dione and 1, 3-indandione. Addition products were characterized with the compound
containing at least a dimer with/ without different functional groups. GC-FID was calibrated by
using response factor of indan, 1-indanol, 1-indanone, indan-1, 2-dione and 1, 3-indandione. A
typical GC-FID chromatogram is provided in Figure 3.4. Response factors of the products are
listed in Table 3.4.
22
CHCl3 Indan
Figure 3.4: A typical GC-FID chromatogram of Indan and its oxidized products
Table 3.4. Response factors of the studied chemicals.
Compound Name Retention Time (minute) Response Factor
Heptane 2.23 1.00
CHCl3 2.21 0.06
Hexachlorobenzene 7.62 0.31
Indan 3.66 0.88
1-indanol 5.20 0.79
1-indanone 6.20 0.83
1,3-indandione 7.04 0.58
Indan-1,2-dione 8.13 0.67
3.2.5 Calculations
Hydrodynamic properties for each experiment were calculated from captured images of the
Taylor flow in the microfluidic reactor as described in previous study [9].
Indanone
(ketone)
Hexachlorobenzene
(internal standard)
23
3.2.5.1 Size of liquid slug and gas bubble and Velocity Calculations
The length of liquid slugs 𝐿𝑆 and gas bubble 𝐿𝐺 were calculated from captured images using
MATLAB (version 2018b). The code is included in Appendix A.
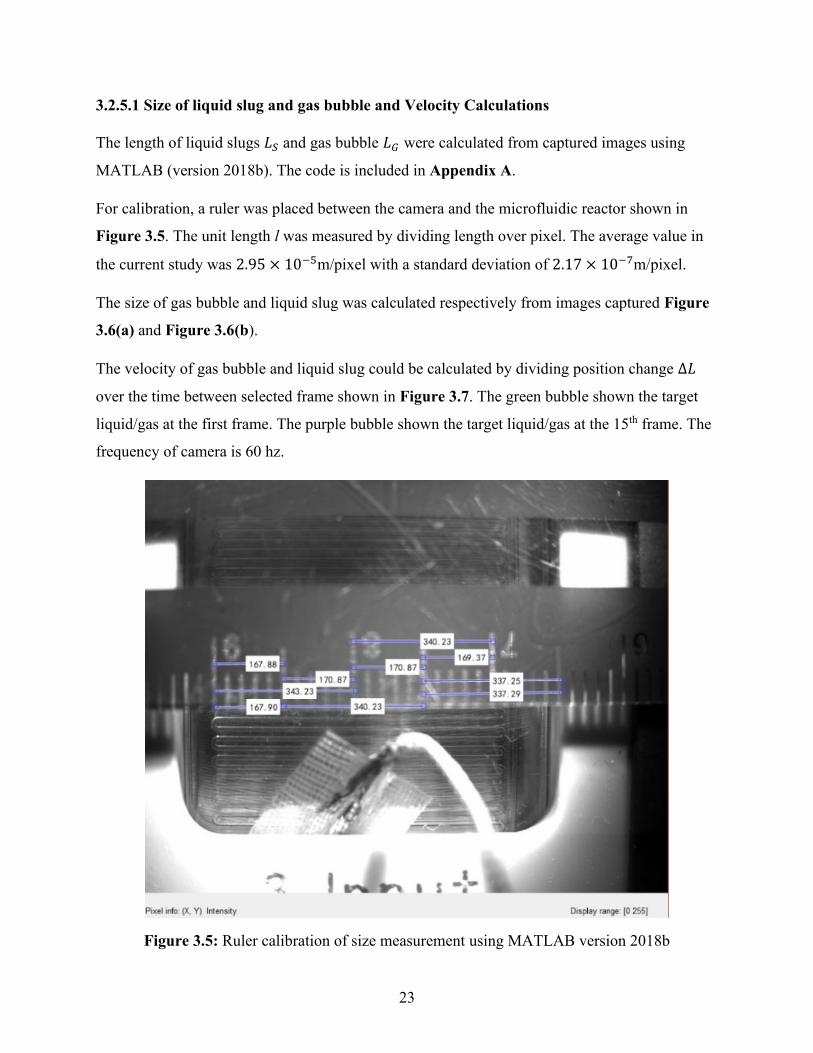
For calibration, a ruler was placed between the camera and the microfluidic reactor shown in
Figure 3.5. The unit length l was measured by dividing length over pixel. The average value in
the current study was 2.95 × 10⁻⁵m/pixel with a standard deviation of 2.17 × 10⁻⁷m/pixel.
The size of gas bubble and liquid slug was calculated respectively from images captured Figure
3.6(a) and Figure 3.6(b).
The velocity of gas bubble and liquid slug could be calculated by dividing position change ∆𝐿
over the time between selected frame shown in Figure 3.7. The green bubble shown the target
liquid/gas at the first frame. The purple bubble shown the target liquid/gas at the 15th frame. The
frequency of camera is 60 hz.
Figure 3.5: Ruler calibration of size measurement using MATLAB version 2018b
24
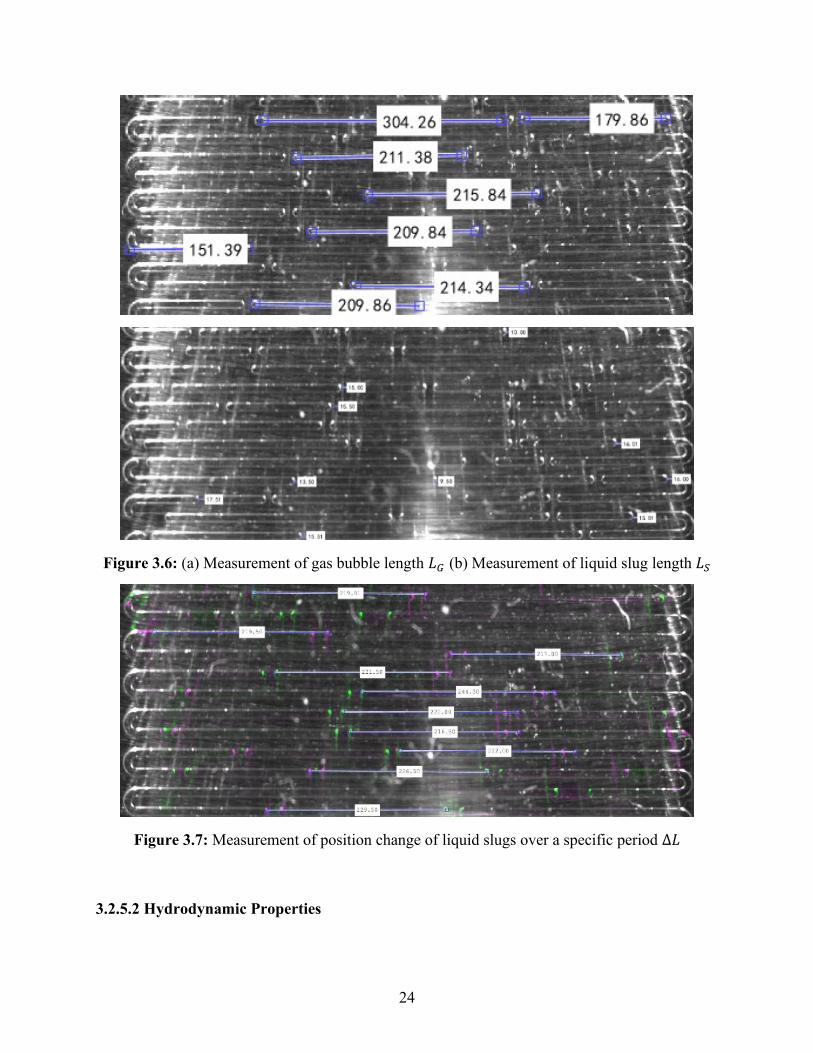
Figure 3.6: (a) Measurement of gas bubble length 𝐿𝐺 (b) Measurement of liquid slug length 𝐿𝑆
Figure 3.7: Measurement of position change of liquid slugs over a specific period ∆𝐿
3.2.5.2 Hydrodynamic Properties
25
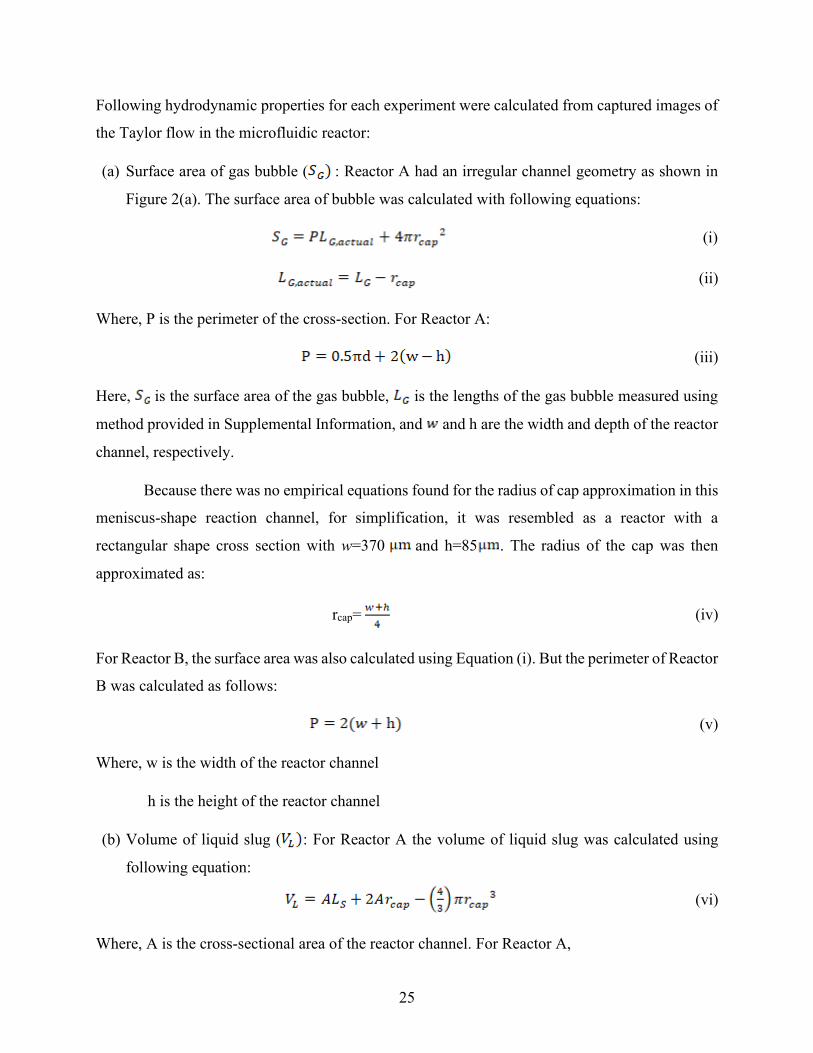
Following hydrodynamic properties for each experiment were calculated from captured images of
the Taylor flow in the microfluidic reactor:
(a) Surface area of gas bubble ( : Reactor A had an irregular channel geometry as shown in
Figure 2(a). The surface area of bubble was calculated with following equations:
(i)
(ii)
Where, P is the perimeter of the cross-section. For Reactor A:
(iii)
Here, is the surface area of the gas bubble, is the lengths of the gas bubble measured using
method provided in Supplemental Information, and and h are the width and depth of the reactor
channel, respectively.
Because there was no empirical equations found for the radius of cap approximation in this
meniscus-shape reaction channel, for simplification, it was resembled as a reactor with a
rectangular shape cross section with w=370 and h=85 . The radius of the cap was then
approximated as:
rcap= (iv)
For Reactor B, the surface area was also calculated using Equation (i). But the perimeter of Reactor
B was calculated as follows:
(v)
Where, w is the width of the reactor channel
h is the height of the reactor channel
(b) Volume of liquid slug ( : For Reactor A the volume of liquid slug was calculated using
following equation:
(vi)
Where, A is the cross-sectional area of the reactor channel. For Reactor A,
26
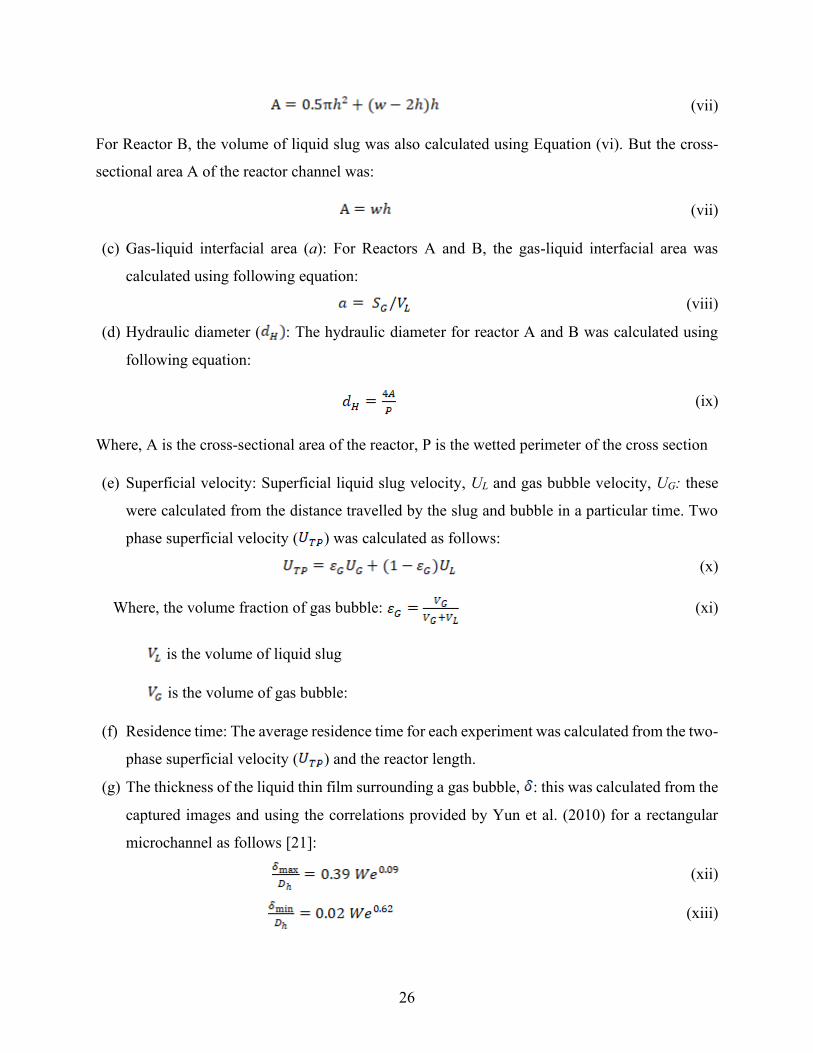
(vii)
For Reactor B, the volume of liquid slug was also calculated using Equation (vi). But the cross-
sectional area A of the reactor channel was:
(vii)
(c) Gas-liquid interfacial area (a): For Reactors A and B, the gas-liquid interfacial area was
calculated using following equation:
(viii)
(d) Hydraulic diameter ( : The hydraulic diameter for reactor A and B was calculated using
following equation:
(ix)
Where, A is the cross-sectional area of the reactor, P is the wetted perimeter of the cross section
(e) Superficial velocity: Superficial liquid slug velocity, UL and gas bubble velocity, UG: these
were calculated from the distance travelled by the slug and bubble in a particular time. Two
phase superficial velocity ( ) was calculated as follows:
(x)
Where, the volume fraction of gas bubble: (xi)
is the volume of liquid slug
is the volume of gas bubble:
(f) Residence time: The average residence time for each experiment was calculated from the two-
phase superficial velocity ( ) and the reactor length.
(g) The thickness of the liquid thin film surrounding a gas bubble, : this was calculated from the
captured images and using the correlations provided by Yun et al. (2010) for a rectangular
microchannel as follows [21]:
(xii)
(xiii)
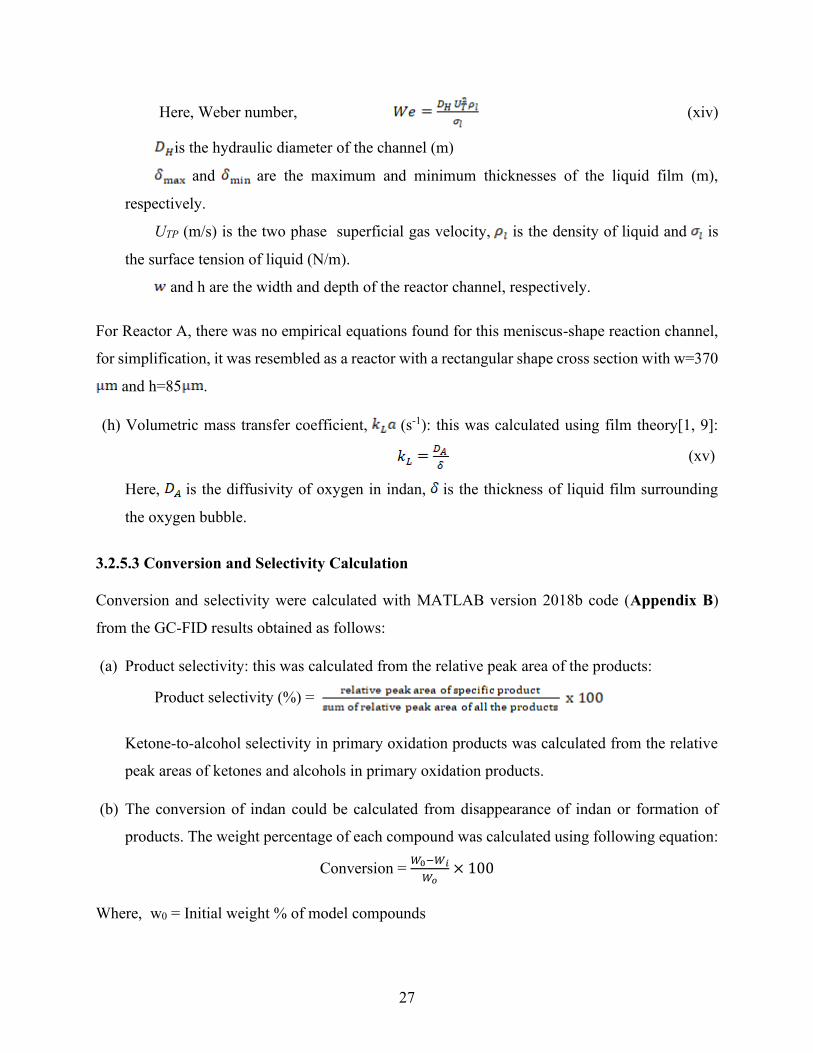
27
Here, Weber number, (xiv)
is the hydraulic diameter of the channel (m)
and are the maximum and minimum thicknesses of the liquid film (m),
respectively.
UTP (m/s) is the two phase superficial gas velocity, is the density of liquid and is
the surface tension of liquid (N/m).
and h are the width and depth of the reactor channel, respectively.
For Reactor A, there was no empirical equations found for this meniscus-shape reaction channel,
for simplification, it was resembled as a reactor with a rectangular shape cross section with w=370
and h=85 .
(h) Volumetric mass transfer coefficient, (s-1): this was calculated using film theory[1, 9]:
(xv)
Here, is the diffusivity of oxygen in indan, is the thickness of liquid film surrounding
the oxygen bubble.
3.2.5.3 Conversion and Selectivity Calculation
Conversion and selectivity were calculated with MATLAB version 2018b code (Appendix B)
from the GC-FID results obtained as follows:
(a) Product selectivity: this was calculated from the relative peak area of the products:
Product selectivity (%) =
Ketone-to-alcohol selectivity in primary oxidation products was calculated from the relative
peak areas of ketones and alcohols in primary oxidation products.
(b) The conversion of indan could be calculated from disappearance of indan or formation of
products. The weight percentage of each compound was calculated using following equation:
Conversion = 𝑊0−𝑊𝑖
𝑊𝑜× 100
Where, w0 = Initial weight % of model compounds
28
𝑤𝑖 =weight percentage of model compounds
𝑊𝑖 =𝐴𝑖𝑊𝐻𝐶𝐵𝑅𝐹𝐻𝐶𝐵
𝐴𝐻𝐶𝐵𝑅𝐹𝑖
𝑤𝐻𝐶𝐵= weight percentage of Hexachlorobenzene
𝐴𝑖= peak area of compound
𝐴𝐻𝐶𝐵= peak area of Hexachlorobenzene
𝑅𝐹𝑖= response factor of compound with respect to Heptane
` 𝑅𝐹𝐻𝐶𝐵= response factor of hexachlorobenzene with respect to Heptane
(c) Conversion Rate Calculation
Conversion rate (mol/s) was calculated as follows:
𝐶𝑜𝑛𝑣𝑒𝑟𝑠𝑖𝑜𝑛 𝑅𝑎𝑡𝑒 = 𝐶𝑜𝑛𝑣𝑒𝑟𝑠𝑖𝑜𝑛 ×𝑉𝑠 × 𝐴 × 𝜌𝑠
𝑀𝑊𝑠
Where, 𝑉𝑠 = velocity of the liquid slug
𝐴 = cross-sectional area of the reactor (m2)
𝜌𝑠 = density of the liquid slug at experimental condition (kg/m3)
𝑀𝑊𝑠 = molecular weight of liquid slug (kg/mol)
3.2.5.4 Flame Ionization Detector (FID) Response Factor
A flame ionization detector is used to conduct quantitative analysis of organic compounds whose
response factor vary. Therefore, it is essential to determine the response factor for each
compound in the oxidation. The response factor was calculated based on the Dietz-method [27]:
Response Factor (RF) =(𝑎𝑟𝑒𝑎 𝑜𝑓 𝑐𝑜𝑚𝑝𝑜𝑢𝑛𝑑)(𝑚𝑎𝑠𝑠 𝑜𝑓 𝑠𝑡𝑎𝑛𝑑𝑎𝑟𝑑)
(𝑚𝑎𝑠𝑠 𝑜𝑓 𝑐𝑜𝑚𝑝𝑜𝑢𝑛𝑑)(𝑎𝑟𝑒𝑎 𝑜𝑓 𝑠𝑡𝑎𝑛𝑑𝑎𝑟𝑑)
3.2.5.5 Diffusion Coefficient Calculation
The oxygen diffusivity in indan was calculated using Diaz et al. (1987) Correlation [28].
29
(𝐷𝐴)T = 4.996 × 10³ × (𝐷𝐴𝐵)T=25 °C × 𝑒‒ 2539 /T
Where, (𝐷𝐴𝐵)T=25 °C = 6.02 × 10⁻⁵ ×𝑣𝐵
0.36
𝜇𝐵0.61𝑣𝐴
0.64
(𝐷𝐴)T = diffusion coefficient of oxygen in indan at specific temperature (cm2/s)
(𝐷𝐴𝐵)T=25 °C = diffusion coefficient of oxygen in indan at 25 °C (cm2/s)
T = experiment temperature (K)
𝜇𝐵 = viscosity of indan (cp)
𝑣𝐴 = molar volume of oxygen at normal boiling point temperature cm2/gmol
𝑣𝐵 = molar volume of indan at normal boiling point temperature cm2/gmol
3.2.5.6 Mass Transfer Coefficient Calculation
Volumetric mass transfer coefficient was calculated using Vandu et al. (2005) method as
following [29]:
𝑘𝐿𝑎 = 𝑘𝐿,𝑐𝑎𝑝𝑎𝑐𝑎𝑝 + 𝑘𝐿,𝑓𝑖𝑙𝑚𝑎𝐿,𝑓𝑖𝑙𝑚
Where, 𝑘𝐿,𝑐𝑎𝑝 = 2√2𝐷𝑉𝑏
𝜋2𝑑𝑐
𝑘𝐿,𝑓𝑖𝑙𝑚 = 2√𝐷
𝜋𝑡𝑓𝑖𝑙𝑚
𝐷 = liquid phase diffusivity
𝑑𝑐 = capillary inner diameter
𝑡𝑓𝑖𝑙𝑚 = contact time of gas bubble and liquid thin film
𝑉𝑏= bubble velocity
3.3 Results
3.3.1 Constant Temperature Oxidation
30
Reactor hydrodynamics changed the local oxygen availability that influenced the
conversion and product selectivity during liquid phase oxidation. It was previously found that the
most important variable in microfluidic reactors affecting oxygen availability was gas–liquid
interfacial area [4]. If this holds true for all microfluidic reactor configurations, then at constant
temperature and pressure, the local oxygen availability could be manipulated by the gas–liquid
interfacial area and is related to the hydrodynamic behavior of the microfluidic reactor.
3.3.1.1 Measured Reactor Hydrodynamics
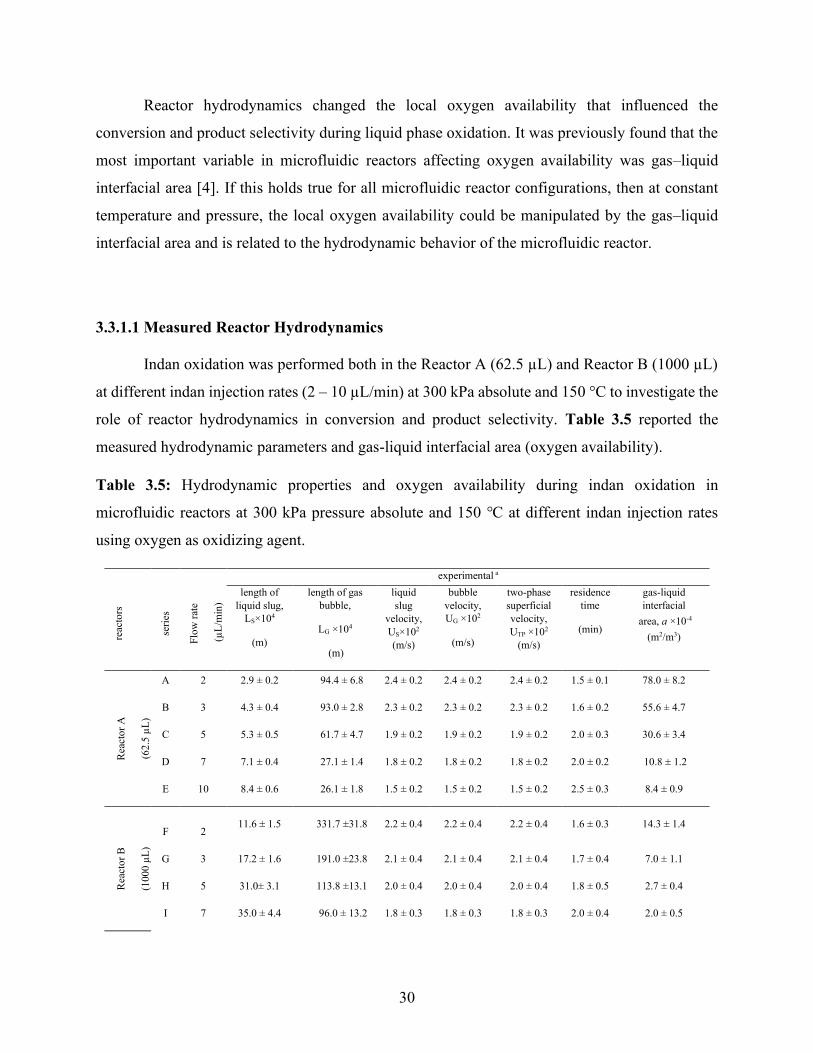
Indan oxidation was performed both in the Reactor A (62.5 µL) and Reactor B (1000 µL)
at different indan injection rates (2 – 10 µL/min) at 300 kPa absolute and 150 °C to investigate the
role of reactor hydrodynamics in conversion and product selectivity. Table 3.5 reported the
measured hydrodynamic parameters and gas-liquid interfacial area (oxygen availability).
Table 3.5: Hydrodynamic properties and oxygen availability during indan oxidation in
microfluidic reactors at 300 kPa pressure absolute and 150 ℃ at different indan injection rates
using oxygen as oxidizing agent.
reac
tors
seri
es
Flo
w r
ate
(µ
L/m
in)
experimental a
length of
liquid slug,
LS×104
(m)
length of gas
bubble,
LG ×104
(m)
liquid
slug
velocity,
US×102
(m/s)
bubble
velocity,
UG ×102
(m/s)
two-phase
superficial
velocity,
UTP ×102
(m/s)
residence
time
(min)
gas-liquid
interfacial
area, a ×10-4
(m2/m3)
Rea
cto
r A
(62
.5 µ
L)
A 2 2.9 ± 0.2 94.4 ± 6.8 2.4 ± 0.2 2.4 ± 0.2 2.4 ± 0.2 1.5 ± 0.1 78.0 ± 8.2
B 3 4.3 ± 0.4 93.0 ± 2.8 2.3 ± 0.2 2.3 ± 0.2 2.3 ± 0.2 1.6 ± 0.2 55.6 ± 4.7
C 5 5.3 ± 0.5 61.7 ± 4.7 1.9 ± 0.2 1.9 ± 0.2 1.9 ± 0.2 2.0 ± 0.3 30.6 ± 3.4
D 7 7.1 ± 0.4 27.1 ± 1.4 1.8 ± 0.2 1.8 ± 0.2 1.8 ± 0.2 2.0 ± 0.2 10.8 ± 1.2
E 10 8.4 ± 0.6 26.1 ± 1.8 1.5 ± 0.2 1.5 ± 0.2 1.5 ± 0.2 2.5 ± 0.3 8.4 ± 0.9
Rea
cto
r B
(100
0 µ
L)
F
2 11.6 ± 1.5 331.7 ±31.8 2.2 ± 0.4 2.2 ± 0.4 2.2 ± 0.4 1.6 ± 0.3 14.3 ± 1.4
G 3 17.2 ± 1.6 191.0 ±23.8 2.1 ± 0.4 2.1 ± 0.4 2.1 ± 0.4 1.7 ± 0.4 7.0 ± 1.1
H 5 31.0± 3.1 113.8 ±13.1 2.0 ± 0.4 2.0 ± 0.4 2.0 ± 0.4 1.8 ± 0.5 2.7 ± 0.4
I 7 35.0 ± 4.4 96.0 ± 13.2 1.8 ± 0.3 1.8 ± 0.3 1.8 ± 0.3 2.0 ± 0.4 2.0 ± 0.5
31
J 10 36.6 ± 0.1 88.2 ± 9.2 1.7 ± 0.3 1.7 ± 0.3 1.7 ± 0.3 2.1 ± 0.4 1.8 ± 0.2
a Based on 60 different slugs and gas bubbles of each series of experiments
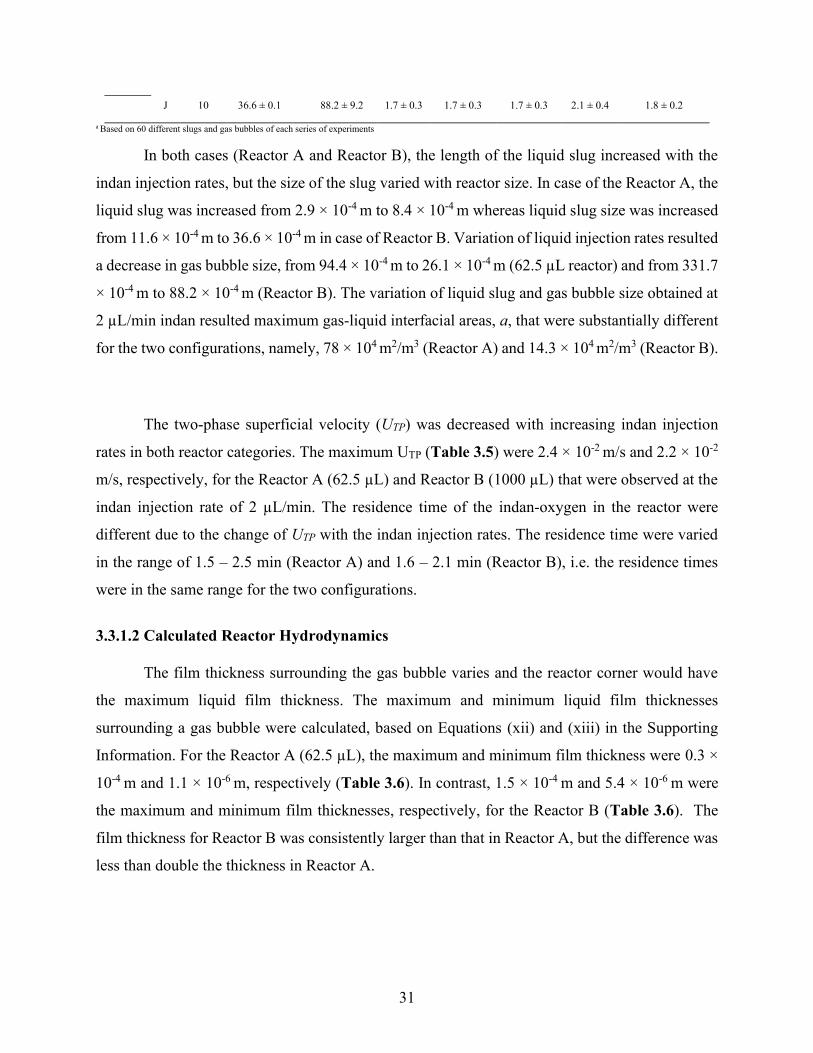
In both cases (Reactor A and Reactor B), the length of the liquid slug increased with the
indan injection rates, but the size of the slug varied with reactor size. In case of the Reactor A, the
liquid slug was increased from 2.9 × 10⁻⁴ m to 8.4 × 10⁻⁴ m whereas liquid slug size was increased
from 11.6 × 10⁻⁴ m to 36.6 × 10⁻⁴ m in case of Reactor B. Variation of liquid injection rates resulted
a decrease in gas bubble size, from 94.4 × 10⁻⁴ m to 26.1 × 10⁻⁴ m (62.5 µL reactor) and from 331.7
× 10-4 m to 88.2 × 10⁻⁴ m (Reactor B). The variation of liquid slug and gas bubble size obtained at
2 µL/min indan resulted maximum gas-liquid interfacial areas, a, that were substantially different
for the two configurations, namely, 78 × 104 m2/m3 (Reactor A) and 14.3 × 10⁴ m2/m3 (Reactor B).
The two-phase superficial velocity (UTP) was decreased with increasing indan injection
rates in both reactor categories. The maximum UTP (Table 3.5) were 2.4 × 10⁻² m/s and 2.2 × 10⁻²
m/s, respectively, for the Reactor A (62.5 µL) and Reactor B (1000 µL) that were observed at the
indan injection rate of 2 µL/min. The residence time of the indan-oxygen in the reactor were
different due to the change of UTP with the indan injection rates. The residence time were varied
in the range of 1.5 – 2.5 min (Reactor A) and 1.6 – 2.1 min (Reactor B), i.e. the residence times
were in the same range for the two configurations.
3.3.1.2 Calculated Reactor Hydrodynamics
The film thickness surrounding the gas bubble varies and the reactor corner would have
the maximum liquid film thickness. The maximum and minimum liquid film thicknesses
surrounding a gas bubble were calculated, based on Equations (xii) and (xiii) in the Supporting
Information. For the Reactor A (62.5 µL), the maximum and minimum film thickness were 0.3 ×
10-4 m and 1.1 × 10⁻⁶ m, respectively (Table 3.6). In contrast, 1.5 × 10⁻⁴ m and 5.4 × 10⁻⁶ m were
the maximum and minimum film thicknesses, respectively, for the Reactor B (Table 3.6). The
film thickness for Reactor B was consistently larger than that in Reactor A, but the difference was
less than double the thickness in Reactor A.
32
Table 3.6: Calculated hydrodynamic properties and mass transfer coefficients during indan
oxidation using oxygen as oxidizing agent in microfluidic reactors at 300 kPa pressure absolute
and 150 ℃ at different indan injection rates.
reac
tors
seri
es
flo
w r
ate
(µ
L/m
in)
calculated a calculated a
film
thickness,
δmin×106
(m)b
mass transfer
coefficient,
kL ×102 (m/s) c
liquid side
volumetric mass
transfer
coefficient,
kLa ×10-3 (s-1)
film
thickness,
δmax×104
(m)d
mass transfer
coefficient,
kL ×104
(m/s) c
liquid side
volumetric mass
transfer
coefficient,
kLa ×10-1 (s-1)
Rea
cto
r A
(62
.5 µ
L)
A 2 1.1 ± 1.1×10⁻³ 3.2 ± 3.3×10⁻³ 24.8 ± 2.5 0.3 ± 3.6×10⁻³ 10.8 ±1.2×10⁻¹ 84.6 ± 8.5
B 3 1.1 ± 1.8×10⁻³ 3.2 ± 5.3×10⁻³ 17.7 ± 1.4 0.3 ± 5.7×10⁻³ 11.0 ±2.0×10⁻¹ 61.0 ± 4.8
C 5 1.1 ± 2.1×10⁻³ 3.2 ± 6.2×10⁻³ 9.7 ± 1.0 0.3 ± 6.5×10⁻³ 11.4 ±2.5×10⁻¹ 34.7 ± 3.2
D 7 1.1 ± 1.7×10⁻³ 3.2 ± 5.2×10⁻³ 3.5 ± 0.4 0.3 ± 5.4×10⁻³ 11.4 ±2.1×10⁻¹ 12.3 ± 1.3
E 10 1.1 ± 1.7×10⁻³ 3.0 ± 5.3×10⁻³ 2.7 ± 0.3 0.3 ± 5.3×10⁻³ 11.8 ±2.2×10⁻¹ 10.0 ± 1.0
Rea
cto
r B
(100
0 µ
L)
F 2 5.4 ± 1.5×10⁻² 0.7 ± 2.0×10⁻³ 1.0 ± 0.09 1.5 ± 4.7×10⁻² 2.5 ± 7.8×10⁻² 3.6 ± 0.4
G 3 5.4 ± 1.9×10⁻² 0.7 ± 2.6×10⁻³ 0.5 ± 0.08 1.5 ± 5.9×10⁻² 2.5 ± 1.0×10⁻¹ 1.8 ± 0.3
H 5 5.4 ± 2.0×10⁻² 0.7 ± 2.7×10⁻³ 0.1 ± 0.02 1.5 ± 6.0×10⁻² 2.6 ± 1.1×10⁻¹ 0.5 ± 0.1
I 7 5.4 ± 1.5×10⁻² 0.7 ± 2.0×10⁻³ 0.2 ± 0.03 1.5 ± 4.6×10⁻² 2.6 ± 8.2×10⁻² 0.5 ± 0.1
J 10 5.4 ± 1.5×10⁻² 0.7 ± 2.0×10⁻³ 0.1 ± 0.02 1.5 ± 4.4×10⁻² 2.6 ± 8.2×10⁻¹ 0.5 ± 0.1
a Based on 60 different slugs and gas bubbles of each series of experiments
b Minimum film thicknesses were calculated based on the correlation provided for Taylor flow in a rectangular channel [9]
c Based on film theory and kL = DA/δ [1, 9]
d Maximum film thicknesses were calculated based on the correlation provided for Taylor flow in a rectangular channel [9]
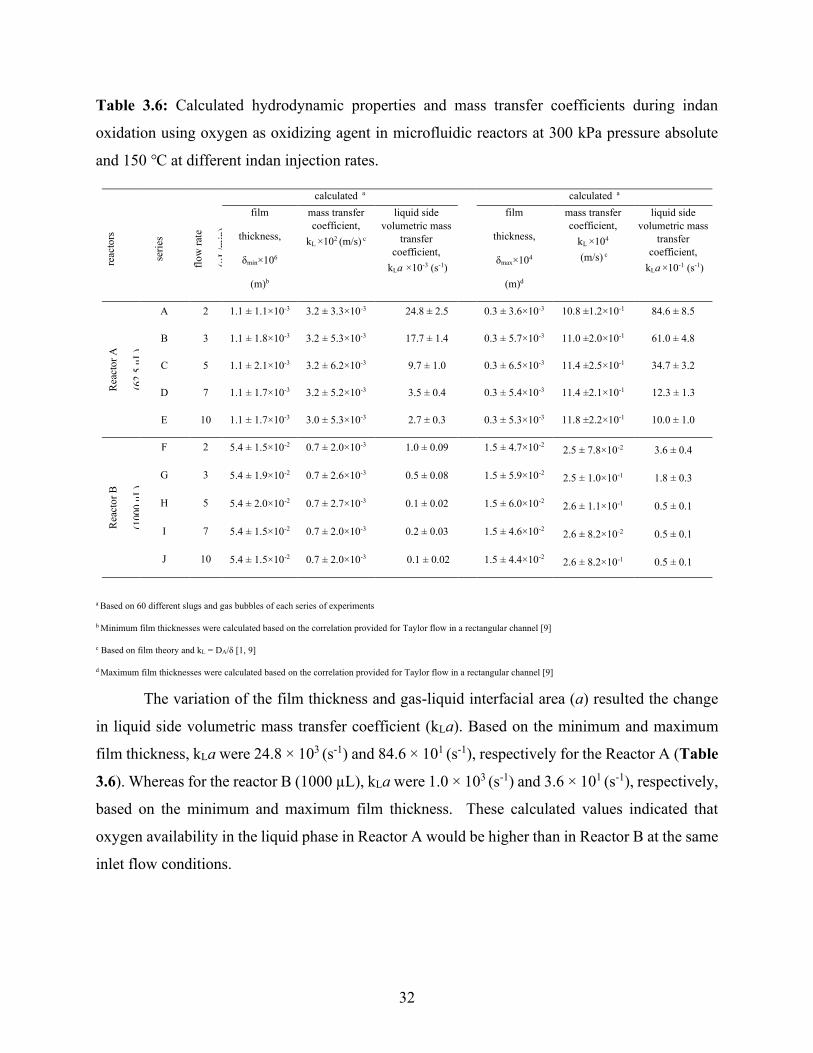
The variation of the film thickness and gas-liquid interfacial area (a) resulted the change
in liquid side volumetric mass transfer coefficient (kLa). Based on the minimum and maximum
film thickness, kLa were 24.8 × 10³ (s-1) and 84.6 × 101 (s-1), respectively for the Reactor A (Table
3.6). Whereas for the reactor B (1000 µL), kLa were 1.0 × 10³ (s-1) and 3.6 × 101 (s-1), respectively,
based on the minimum and maximum film thickness. These calculated values indicated that
oxygen availability in the liquid phase in Reactor A would be higher than in Reactor B at the same
inlet flow conditions.
33
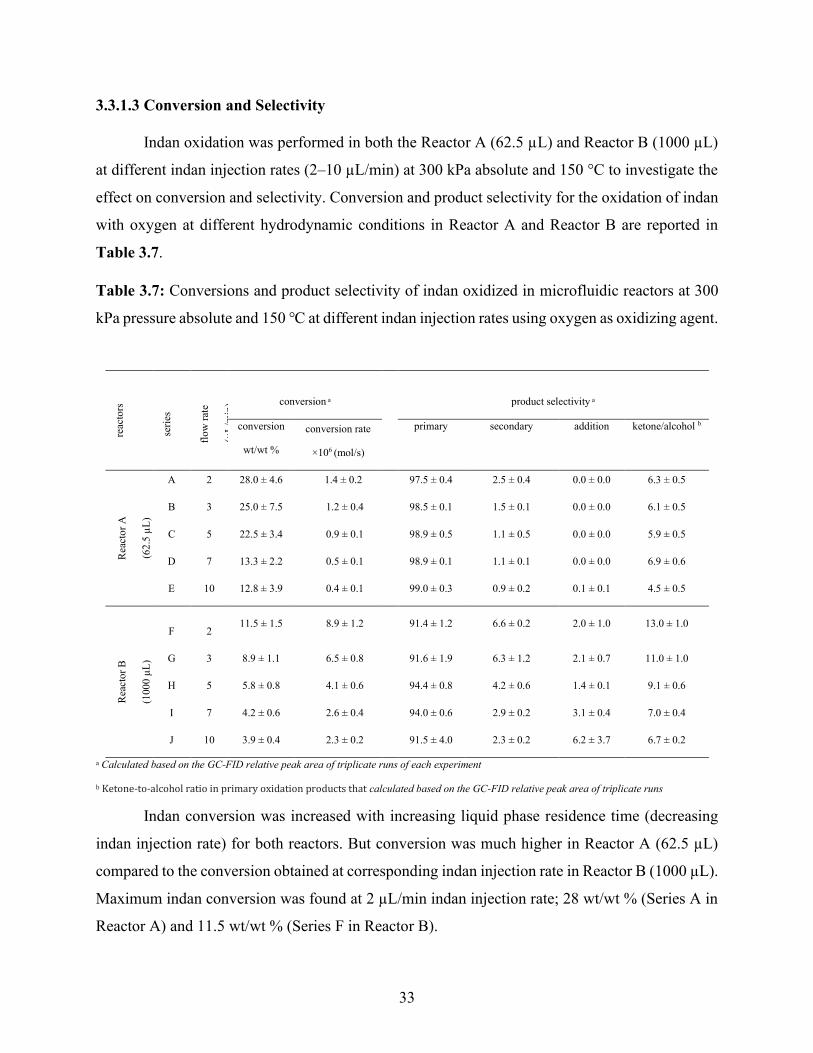
3.3.1.3 Conversion and Selectivity
Indan oxidation was performed in both the Reactor A (62.5 µL) and Reactor B (1000 µL)
at different indan injection rates (2–10 µL/min) at 300 kPa absolute and 150 °C to investigate the
effect on conversion and selectivity. Conversion and product selectivity for the oxidation of indan
with oxygen at different hydrodynamic conditions in Reactor A and Reactor B are reported in
Table 3.7.
Table 3.7: Conversions and product selectivity of indan oxidized in microfluidic reactors at 300
kPa pressure absolute and 150 ℃ at different indan injection rates using oxygen as oxidizing agent.
reac
tors
seri
es
flo
w r
ate
(µ
L/m
in)
conversion a
product selectivity a
conversion
wt/wt %
conversion rate
×106 (mol/s)
primary
secondary addition ketone/alcohol b
Rea
cto
r A
(62
.5 µ
L)
A 2 28.0 ± 4.6 1.4 ± 0.2
97.5 ± 0.4 2.5 ± 0.4 0.0 ± 0.0 6.3 ± 0.5
B 3 25.0 ± 7.5 1.2 ± 0.4 98.5 ± 0.1 1.5 ± 0.1 0.0 ± 0.0 6.1 ± 0.5
C 5 22.5 ± 3.4 0.9 ± 0.1 98.9 ± 0.5 1.1 ± 0.5 0.0 ± 0.0 5.9 ± 0.5
D 7 13.3 ± 2.2 0.5 ± 0.1 98.9 ± 0.1 1.1 ± 0.1 0.0 ± 0.0 6.9 ± 0.6
E 10 12.8 ± 3.9 0.4 ± 0.1 99.0 ± 0.3 0.9 ± 0.2 0.1 ± 0.1 4.5 ± 0.5
Rea
cto
r B
(100
0 µ
L)
F
2 11.5 ± 1.5 8.9 ± 1.2
91.4 ± 1.2 6.6 ± 0.2 2.0 ± 1.0 13.0 ± 1.0
G 3 8.9 ± 1.1 6.5 ± 0.8 91.6 ± 1.9 6.3 ± 1.2 2.1 ± 0.7 11.0 ± 1.0
H 5 5.8 ± 0.8 4.1 ± 0.6 94.4 ± 0.8 4.2 ± 0.6 1.4 ± 0.1 9.1 ± 0.6
I 7 4.2 ± 0.6 2.6 ± 0.4 94.0 ± 0.6 2.9 ± 0.2 3.1 ± 0.4 7.0 ± 0.4
J 10 3.9 ± 0.4 2.3 ± 0.2 91.5 ± 4.0 2.3 ± 0.2 6.2 ± 3.7 6.7 ± 0.2
a Calculated based on the GC-FID relative peak area of triplicate runs of each experiment
b Ketone-to-alcohol ratio in primary oxidation products that calculated based on the GC-FID relative peak area of triplicate runs
Indan conversion was increased with increasing liquid phase residence time (decreasing
indan injection rate) for both reactors. But conversion was much higher in Reactor A (62.5 µL)
compared to the conversion obtained at corresponding indan injection rate in Reactor B (1000 µL).
Maximum indan conversion was found at 2 µL/min indan injection rate; 28 wt/wt % (Series A in
Reactor A) and 11.5 wt/wt % (Series F in Reactor B).
34
The product selectivity was noticeably different for the two configurations. No addition
products were noticed at the maximum oxygen availability in Reactor A (62.5 µL reactor) even at
very high conversion. Whereas some addition products were noticed in case of Reactor B (1000
µL reactor). The ketone-to-alcohol selectivity in case of Reactor A was about constant in spite of
changing conversion, but in contrast, the ketone-to-alcohol selectivity changed with conversion in
case of reactor B.
3.3.2 Variable Temperature Oxidation
Temperature affects oxidation rate and thereby conversion and selectivity during liquid
phase oxidation, which is why it was kept constant in Section 3.1. When temperature is increased
at otherwise similar conditions, the oxidation rate will be increased if oxygen remains available in
the liquid phase. As the oxidation rate increases, mass transport of oxygen from the gas phase to
the liquid phase becomes increasingly important, because the rate of oxygen consumption in the
liquid phase is also higher. Varying temperature, while keeping other parameters constant, is a
way to explore the impact of the microfluidic reactor configuration on gas–liquid mass transport,
using not only conversion, but also selectivity as indirect measures of how reactor configuration
affects oxygen availability in the liquid phase. Even at constant flow rate, hydrodynamic properties
changed somewhat with temperature as physical properties of the reactants changed with
temperature, such as density, viscosity, and surface tension.
3.3.2.1 Change of Hydrodynamic Parameters with Temperature
In order to investigate the role of temperature on reactor hydrodynamic parameters, indan
oxidation was performed in both the 62.5 µL (Reactor A) and 1000 µL microfluidic reactors
(Reactor B) at different temperatures (100–160 °C) and 300 kPa absolute at the indan injection
rate of 7 µL/min. Table 3.8 lists the measured hydrodynamic parameters and gas–liquid interfacial-area.
Table 3.8: Hydrodynamic properties and oxygen availability during indan oxidation in
microfluidic reactors at 300 kPa pressure absolute and different temperatures at 7 µL/min indan
injection rate using oxygen as oxidizing agent.
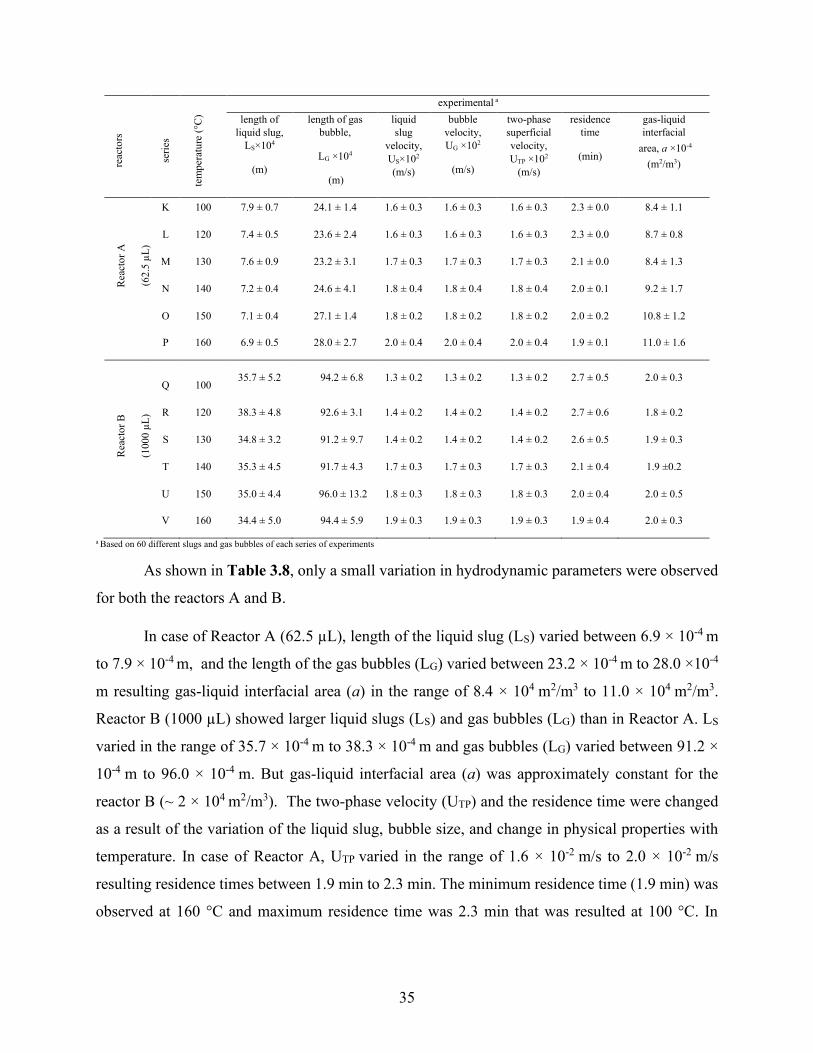
35
reac
tors
seri
es
tem
per
atu
re (
°C)
experimental a
length of
liquid slug,
LS×104
(m)
length of gas
bubble,
LG ×104
(m)
liquid
slug
velocity,
US×102
(m/s)
bubble
velocity,
UG ×102
(m/s)
two-phase
superficial
velocity,
UTP ×102
(m/s)
residence
time
(min)
gas-liquid
interfacial
area, a ×10-4
(m2/m3)
Rea
cto
r A
(62
.5 µ
L)
K 100 7.9 ± 0.7 24.1 ± 1.4 1.6 ± 0.3 1.6 ± 0.3 1.6 ± 0.3 2.3 ± 0.0 8.4 ± 1.1
L 120 7.4 ± 0.5 23.6 ± 2.4 1.6 ± 0.3 1.6 ± 0.3 1.6 ± 0.3 2.3 ± 0.0 8.7 ± 0.8
M 130 7.6 ± 0.9 23.2 ± 3.1 1.7 ± 0.3 1.7 ± 0.3 1.7 ± 0.3 2.1 ± 0.0 8.4 ± 1.3
N 140 7.2 ± 0.4 24.6 ± 4.1 1.8 ± 0.4 1.8 ± 0.4 1.8 ± 0.4 2.0 ± 0.1 9.2 ± 1.7
O 150 7.1 ± 0.4 27.1 ± 1.4 1.8 ± 0.2 1.8 ± 0.2 1.8 ± 0.2 2.0 ± 0.2 10.8 ± 1.2
P 160 6.9 ± 0.5 28.0 ± 2.7 2.0 ± 0.4 2.0 ± 0.4 2.0 ± 0.4 1.9 ± 0.1 11.0 ± 1.6
Rea
cto
r B
(100
0 µ
L)
Q
100 35.7 ± 5.2 94.2 ± 6.8 1.3 ± 0.2 1.3 ± 0.2 1.3 ± 0.2 2.7 ± 0.5 2.0 ± 0.3
R 120 38.3 ± 4.8 92.6 ± 3.1 1.4 ± 0.2 1.4 ± 0.2 1.4 ± 0.2 2.7 ± 0.6 1.8 ± 0.2
S 130 34.8 ± 3.2 91.2 ± 9.7 1.4 ± 0.2 1.4 ± 0.2 1.4 ± 0.2 2.6 ± 0.5 1.9 ± 0.3
T 140 35.3 ± 4.5 91.7 ± 4.3 1.7 ± 0.3 1.7 ± 0.3 1.7 ± 0.3 2.1 ± 0.4 1.9 ±0.2
U 150 35.0 ± 4.4 96.0 ± 13.2 1.8 ± 0.3 1.8 ± 0.3 1.8 ± 0.3 2.0 ± 0.4 2.0 ± 0.5
V 160 34.4 ± 5.0 94.4 ± 5.9 1.9 ± 0.3 1.9 ± 0.3 1.9 ± 0.3 1.9 ± 0.4 2.0 ± 0.3
a Based on 60 different slugs and gas bubbles of each series of experiments
As shown in Table 3.8, only a small variation in hydrodynamic parameters were observed
for both the reactors A and B.
In case of Reactor A (62.5 µL), length of the liquid slug (LS) varied between 6.9 × 10⁻⁴ m
to 7.9 × 10⁻⁴ m, and the length of the gas bubbles (LG) varied between 23.2 × 10⁻⁴ m to 28.0 ×10⁻⁴
m resulting gas-liquid interfacial area (a) in the range of 8.4 × 10⁴ m2/m3 to 11.0 × 10⁴ m2/m3.
Reactor B (1000 µL) showed larger liquid slugs (LS) and gas bubbles (LG) than in Reactor A. LS
varied in the range of 35.7 × 10⁻⁴ m to 38.3 × 10⁻⁴ m and gas bubbles (LG) varied between 91.2 ×
10-4 m to 96.0 × 10⁻⁴ m. But gas-liquid interfacial area (a) was approximately constant for the
reactor B (~ 2 × 10⁴ m2/m3). The two-phase velocity (UTP) and the residence time were changed
as a result of the variation of the liquid slug, bubble size, and change in physical properties with
temperature. In case of Reactor A, UTP varied in the range of 1.6 × 10⁻² m/s to 2.0 × 10⁻² m/s
resulting residence times between 1.9 min to 2.3 min. The minimum residence time (1.9 min) was
observed at 160 °C and maximum residence time was 2.3 min that was resulted at 100 °C. In
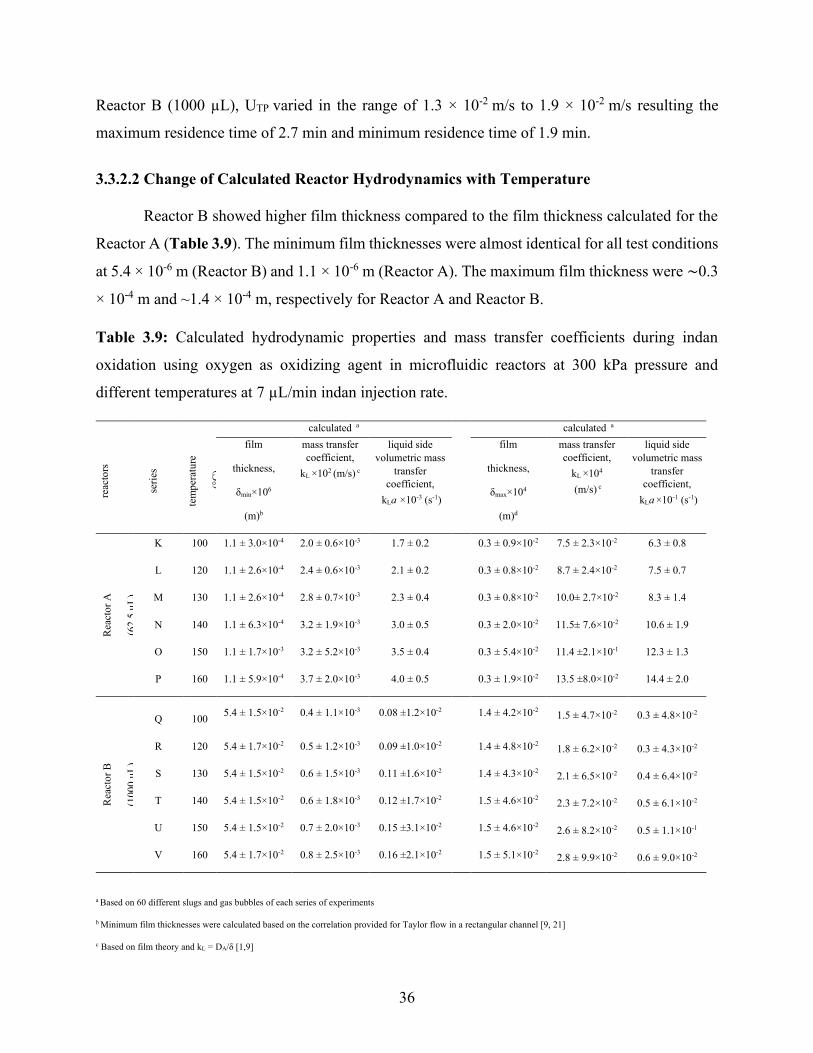
36
Reactor B (1000 µL), UTP varied in the range of 1.3 × 10⁻² m/s to 1.9 × 10⁻² m/s resulting the
maximum residence time of 2.7 min and minimum residence time of 1.9 min.
3.3.2.2 Change of Calculated Reactor Hydrodynamics with Temperature
Reactor B showed higher film thickness compared to the film thickness calculated for the
Reactor A (Table 3.9). The minimum film thicknesses were almost identical for all test conditions
at 5.4 × 10⁻⁶ m (Reactor B) and 1.1 × 10⁻⁶ m (Reactor A). The maximum film thickness were ~0.3
× 10-4 m and ~1.4 × 10⁻⁴ m, respectively for Reactor A and Reactor B.
Table 3.9: Calculated hydrodynamic properties and mass transfer coefficients during indan
oxidation using oxygen as oxidizing agent in microfluidic reactors at 300 kPa pressure and
different temperatures at 7 µL/min indan injection rate.
reac
tors
seri
es
tem
per
atu
re
(°C
)
calculated a calculated a
film
thickness,
δmin×106
(m)b
mass transfer
coefficient,
kL ×102 (m/s) c
liquid side
volumetric mass
transfer
coefficient,
kLa ×10-3 (s-1)
film
thickness,
δmax×104
(m)d
mass transfer
coefficient,
kL ×104
(m/s) c
liquid side
volumetric mass
transfer
coefficient,
kLa ×10-1 (s-1)
Rea
cto
r A
(62
.5 µ
L)
K 100 1.1 ± 3.0×10⁻⁴ 2.0 ± 0.6×10⁻³ 1.7 ± 0.2 0.3 ± 0.9×10⁻² 7.5 ± 2.3×10⁻² 6.3 ± 0.8
L 120 1.1 ± 2.6×10⁻⁴ 2.4 ± 0.6×10⁻³ 2.1 ± 0.2 0.3 ± 0.8×10⁻² 8.7 ± 2.4×10⁻² 7.5 ± 0.7
M 130 1.1 ± 2.6×10⁻⁴ 2.8 ± 0.7×10⁻³ 2.3 ± 0.4 0.3 ± 0.8×10⁻² 10.0± 2.7×10⁻² 8.3 ± 1.4
N 140 1.1 ± 6.3×10⁻⁴ 3.2 ± 1.9×10⁻³ 3.0 ± 0.5 0.3 ± 2.0×10⁻² 11.5± 7.6×10⁻² 10.6 ± 1.9
O 150 1.1 ± 1.7×10⁻³ 3.2 ± 5.2×10⁻³ 3.5 ± 0.4 0.3 ± 5.4×10⁻² 11.4 ±2.1×10⁻¹ 12.3 ± 1.3
P 160 1.1 ± 5.9×10⁻⁴ 3.7 ± 2.0×10⁻³ 4.0 ± 0.5 0.3 ± 1.9×10⁻² 13.5 ±8.0×10⁻² 14.4 ± 2.0
Rea
cto
r B
(100
0 µ
L)
Q
100 5.4 ± 1.5×10⁻² 0.4 ± 1.1×10⁻³ 0.08 ±1.2×10⁻²
1.4 ± 4.2×10⁻² 1.5 ± 4.7×10⁻² 0.3 ± 4.8×10⁻²
R 120 5.4 ± 1.7×10⁻² 0.5 ± 1.2×10⁻³ 0.09 ±1.0×10⁻² 1.4 ± 4.8×10⁻² 1.8 ± 6.2×10⁻² 0.3 ± 4.3×10⁻²
S 130 5.4 ± 1.5×10⁻² 0.6 ± 1.5×10⁻³ 0.11 ±1.6×10⁻² 1.4 ± 4.3×10⁻² 2.1 ± 6.5×10⁻² 0.4 ± 6.4×10⁻²
T 140 5.4 ± 1.5×10⁻² 0.6 ± 1.8×10⁻³ 0.12 ±1.7×10⁻² 1.5 ± 4.6×10⁻² 2.3 ± 7.2×10⁻² 0.5 ± 6.1×10⁻²
U 150 5.4 ± 1.5×10⁻² 0.7 ± 2.0×10⁻³ 0.15 ±3.1×10⁻² 1.5 ± 4.6×10⁻² 2.6 ± 8.2×10⁻² 0.5 ± 1.1×10⁻¹
V 160 5.4 ± 1.7×10⁻² 0.8 ± 2.5×10⁻³ 0.16 ±2.1×10⁻² 1.5 ± 5.1×10⁻² 2.8 ± 9.9×10⁻² 0.6 ± 9.0×10⁻²
a Based on 60 different slugs and gas bubbles of each series of experiments
b Minimum film thicknesses were calculated based on the correlation provided for Taylor flow in a rectangular channel [9, 21]
c Based on film theory and kL = DA/δ [1,9]
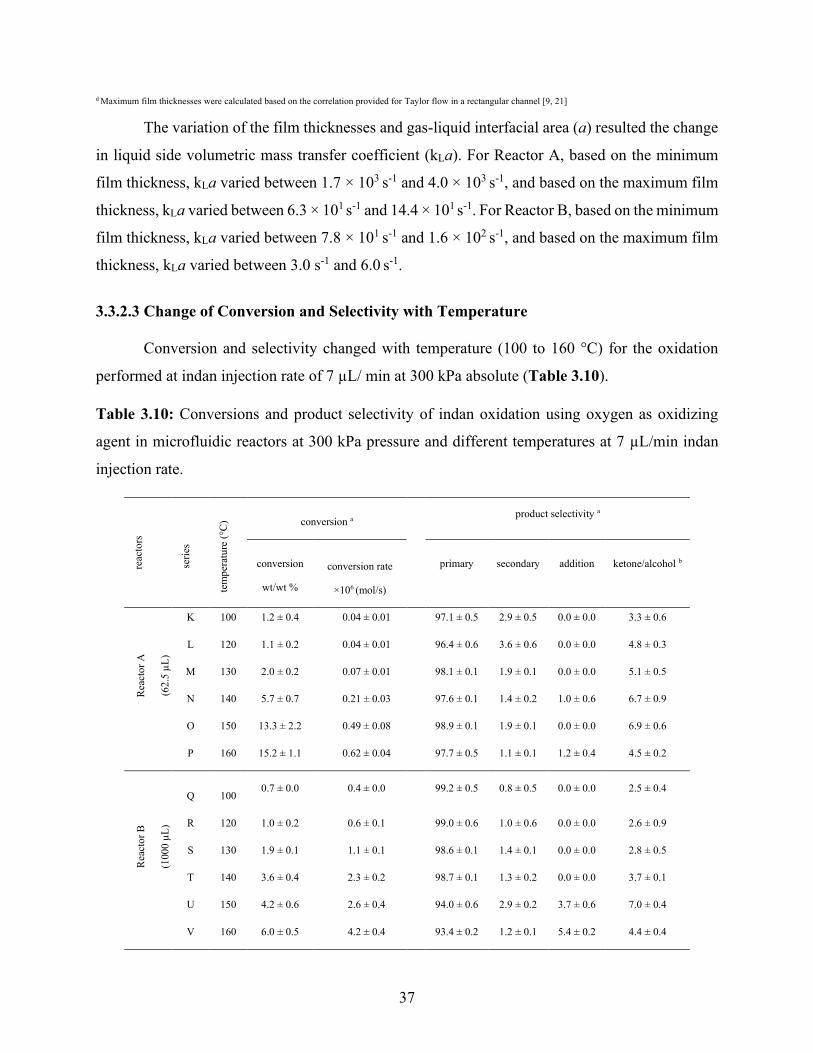
37
d Maximum film thicknesses were calculated based on the correlation provided for Taylor flow in a rectangular channel [9, 21]
The variation of the film thicknesses and gas-liquid interfacial area (a) resulted the change
in liquid side volumetric mass transfer coefficient (kLa). For Reactor A, based on the minimum
film thickness, kLa varied between 1.7 × 10³ s-1 and 4.0 × 10³ s-1, and based on the maximum film
thickness, kLa varied between 6.3 × 101 s-1 and 14.4 × 101 s-1. For Reactor B, based on the minimum
film thickness, kLa varied between 7.8 × 101 s-1 and 1.6 × 10² s-1, and based on the maximum film
thickness, kLa varied between 3.0 s-1 and 6.0 s-1.
3.3.2.3 Change of Conversion and Selectivity with Temperature
Conversion and selectivity changed with temperature (100 to 160 °C) for the oxidation
performed at indan injection rate of 7 µL/ min at 300 kPa absolute (Table 3.10).
Table 3.10: Conversions and product selectivity of indan oxidation using oxygen as oxidizing
agent in microfluidic reactors at 300 kPa pressure and different temperatures at 7 µL/min indan
injection rate.
reac
tors
seri
es
tem
per
atu
re (
°C)
conversion a
product selectivity a
conversion
wt/wt %
conversion rate
×106 (mol/s)
primary
secondary
addition
ketone/alcohol b
Rea
cto
r A
(62
.5 µ
L)
K 100 1.2 ± 0.4 0.04 ± 0.01
97.1 ± 0.5 2.9 ± 0.5 0.0 ± 0.0 3.3 ± 0.6
L 120 1.1 ± 0.2 0.04 ± 0.01 96.4 ± 0.6 3.6 ± 0.6 0.0 ± 0.0 4.8 ± 0.3
M 130 2.0 ± 0.2 0.07 ± 0.01 98.1 ± 0.1 1.9 ± 0.1 0.0 ± 0.0 5.1 ± 0.5
N 140 5.7 ± 0.7 0.21 ± 0.03 97.6 ± 0.1 1.4 ± 0.2 1.0 ± 0.6 6.7 ± 0.9
O 150 13.3 ± 2.2 0.49 ± 0.08 98.9 ± 0.1 1.9 ± 0.1 0.0 ± 0.0 6.9 ± 0.6
P 160 15.2 ± 1.1 0.62 ± 0.04 97.7 ± 0.5 1.1 ± 0.1 1.2 ± 0.4 4.5 ± 0.2
Rea
cto
r B
(100
0 µ
L)
Q
100 0.7 ± 0.0 0.4 ± 0.0
99.2 ± 0.5 0.8 ± 0.5 0.0 ± 0.0 2.5 ± 0.4
R 120 1.0 ± 0.2 0.6 ± 0.1 99.0 ± 0.6 1.0 ± 0.6 0.0 ± 0.0 2.6 ± 0.9
S 130 1.9 ± 0.1 1.1 ± 0.1 98.6 ± 0.1 1.4 ± 0.1 0.0 ± 0.0 2.8 ± 0.5
T 140 3.6 ± 0.4 2.3 ± 0.2 98.7 ± 0.1 1.3 ± 0.2 0.0 ± 0.0 3.7 ± 0.1
U 150 4.2 ± 0.6 2.6 ± 0.4 94.0 ± 0.6 2.9 ± 0.2 3.7 ± 0.6 7.0 ± 0.4
V 160 6.0 ± 0.5 4.2 ± 0.4 93.4 ± 0.2 1.2 ± 0.1 5.4 ± 0.2 4.4 ± 0.4
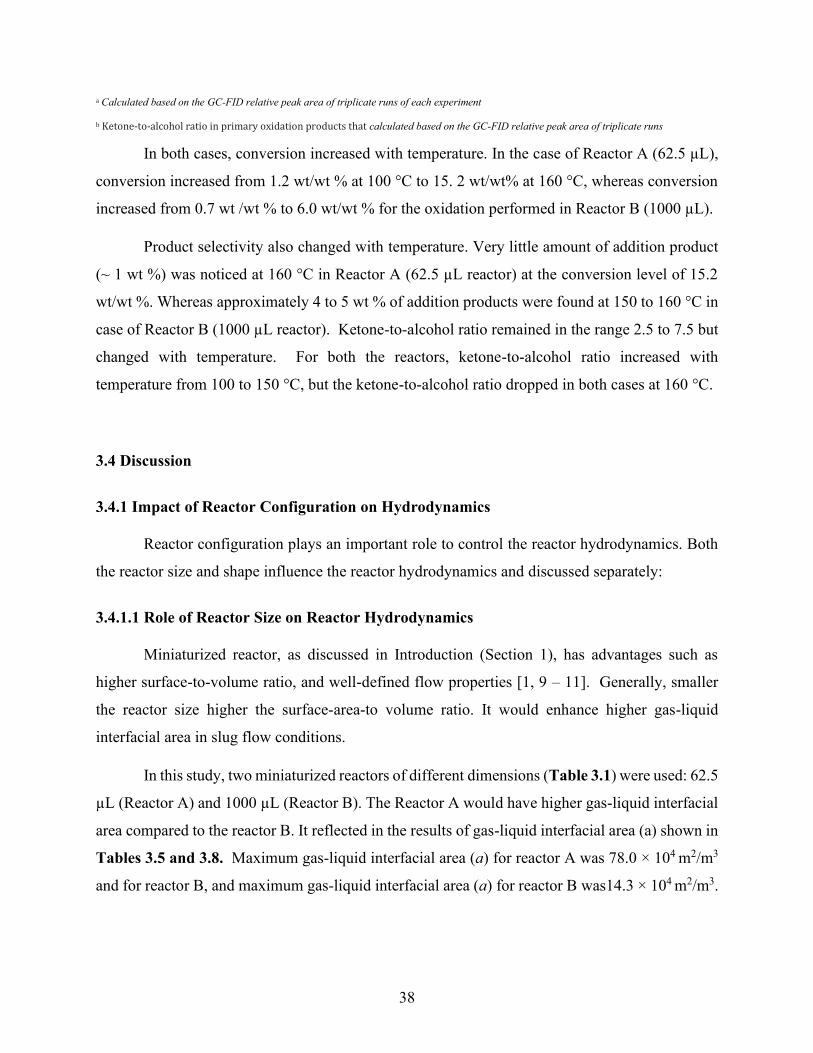
38
a Calculated based on the GC-FID relative peak area of triplicate runs of each experiment
b Ketone-to-alcohol ratio in primary oxidation products that calculated based on the GC-FID relative peak area of triplicate runs
In both cases, conversion increased with temperature. In the case of Reactor A (62.5 µL),
conversion increased from 1.2 wt/wt % at 100 °C to 15. 2 wt/wt% at 160 °C, whereas conversion
increased from 0.7 wt /wt % to 6.0 wt/wt % for the oxidation performed in Reactor B (1000 µL).
Product selectivity also changed with temperature. Very little amount of addition product
(~ 1 wt %) was noticed at 160 °C in Reactor A (62.5 µL reactor) at the conversion level of 15.2
wt/wt %. Whereas approximately 4 to 5 wt % of addition products were found at 150 to 160 °C in
case of Reactor B (1000 µL reactor). Ketone-to-alcohol ratio remained in the range 2.5 to 7.5 but
changed with temperature. For both the reactors, ketone-to-alcohol ratio increased with
temperature from 100 to 150 °C, but the ketone-to-alcohol ratio dropped in both cases at 160 °C.
3.4 Discussion
3.4.1 Impact of Reactor Configuration on Hydrodynamics
Reactor configuration plays an important role to control the reactor hydrodynamics. Both
the reactor size and shape influence the reactor hydrodynamics and discussed separately:
3.4.1.1 Role of Reactor Size on Reactor Hydrodynamics
Miniaturized reactor, as discussed in Introduction (Section 1), has advantages such as
higher surface-to-volume ratio, and well-defined flow properties [1, 9 – 11]. Generally, smaller
the reactor size higher the surface-area-to volume ratio. It would enhance higher gas-liquid
interfacial area in slug flow conditions.
In this study, two miniaturized reactors of different dimensions (Table 3.1) were used: 62.5
µL (Reactor A) and 1000 µL (Reactor B). The Reactor A would have higher gas-liquid interfacial
area compared to the reactor B. It reflected in the results of gas-liquid interfacial area (a) shown in
Tables 3.5 and 3.8. Maximum gas-liquid interfacial area (a) for reactor A was 78.0 × 10⁴ m2/m3
and for reactor B, and maximum gas-liquid interfacial area (a) for reactor B was14.3 × 104 m2/m3.
39
Moreover, smaller reactor sizes ensure better operational control over gas-liquid slug flow.
It was also reflected on the formation of liquid slugs and gas bubbles (Tables 3.5 and 3.8). Reactor
A ensured smaller liquid slugs of 2.9 × 10⁻⁴ m (Table 3.5, Series A), whereas in case of Reactor B
the length of the liquid slug for the same conditions was 11.6 × 10⁻⁴ m (Table 3.5, Series F). Better
operational control also ensured shorter gas bubbles (94.4 × 10⁻⁴ m) in smaller reactor (Reactor A)
compared to gas-bubble length (331.7 × 10⁻⁴ m) obtained in Reactor B (Table 3.5). As the length
of the gas bubble enhance the liquid film formation surrounding the gas bubbles, length of the
liquid film in case of Reactor B would be higher compared to Reactor A. Liquid film formation
would also increase with depth of the reactor and Reactor A (depth = 1240 µm) would have higher
liquid film compared to the reactor A (depth = 85 µm). Variation in the formation of liquid slug,
liquid film, and gas bubbles also resulted the variation in two-phase superficial velocity, and
residence time.
Hence, the change in reactor size changed the formation of liquid slug, liquid film, and gas
bubbles which resulted the variation in gas-liquid interfacial area, two-phase superficial velocity,
and residence time. Reactors A and B contributed to the most important parameter, gas-liquid
interfacial area (a) differently. For the Reactor A, reactor size was the more dominant to obtain the
higher gas-liquid interfacial area (a). In contrast, the liquid film surrounding the gas-bubble played
a significant role to obtain the gas-liquid interfacial area for Reactor B. It would have some impacts
on oxygen availability and hence on oxidative conversion and product selectivity that have
discussed in Section 3.3.
3.4.1.2 Role of Reactor Shape on Reactor Hydrodynamics
Reactor shape would also influence the reactor hydrodynamics. The reactor shape could
change the shape of the liquid slug, gas bubble and more importantly mixing of oxygen within the
liquid.
Two microfluidic reactors of different shapes (Table 3.1) were used in this study: irregular
(half-elliptical) shape (Reactor A: 62.5 µL) and rectangular shape (Reactor B: 1000 µL). Reactor
A has smoother bottom and two edges on top side, but rectangular shape Reactor B has four edges.
Each edge would have more liquid compared to the liquid film as sketched in Figure 3.8. Moreover,
reactor dimensions would also affect the amount of liquid within each edge. Higher dimension
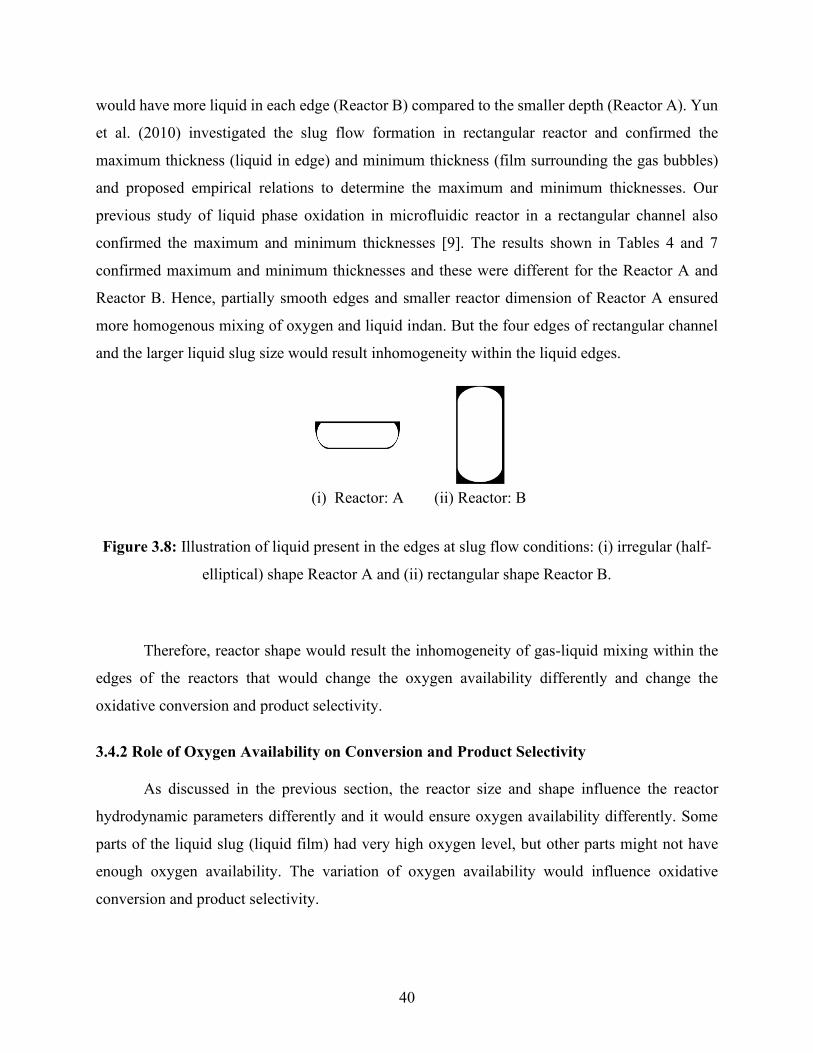
40
would have more liquid in each edge (Reactor B) compared to the smaller depth (Reactor A). Yun
et al. (2010) investigated the slug flow formation in rectangular reactor and confirmed the
maximum thickness (liquid in edge) and minimum thickness (film surrounding the gas bubbles)
and proposed empirical relations to determine the maximum and minimum thicknesses. Our
previous study of liquid phase oxidation in microfluidic reactor in a rectangular channel also
confirmed the maximum and minimum thicknesses [9]. The results shown in Tables 4 and 7
confirmed maximum and minimum thicknesses and these were different for the Reactor A and
Reactor B. Hence, partially smooth edges and smaller reactor dimension of Reactor A ensured
more homogenous mixing of oxygen and liquid indan. But the four edges of rectangular channel
and the larger liquid slug size would result inhomogeneity within the liquid edges.
(i) Reactor: A (ii) Reactor: B
Figure 3.8: Illustration of liquid present in the edges at slug flow conditions: (i) irregular (half-
elliptical) shape Reactor A and (ii) rectangular shape Reactor B.
Therefore, reactor shape would result the inhomogeneity of gas-liquid mixing within the
edges of the reactors that would change the oxygen availability differently and change the
oxidative conversion and product selectivity.
3.4.2 Role of Oxygen Availability on Conversion and Product Selectivity
As discussed in the previous section, the reactor size and shape influence the reactor
hydrodynamic parameters differently and it would ensure oxygen availability differently. Some
parts of the liquid slug (liquid film) had very high oxygen level, but other parts might not have
enough oxygen availability. The variation of oxygen availability would influence oxidative
conversion and product selectivity.
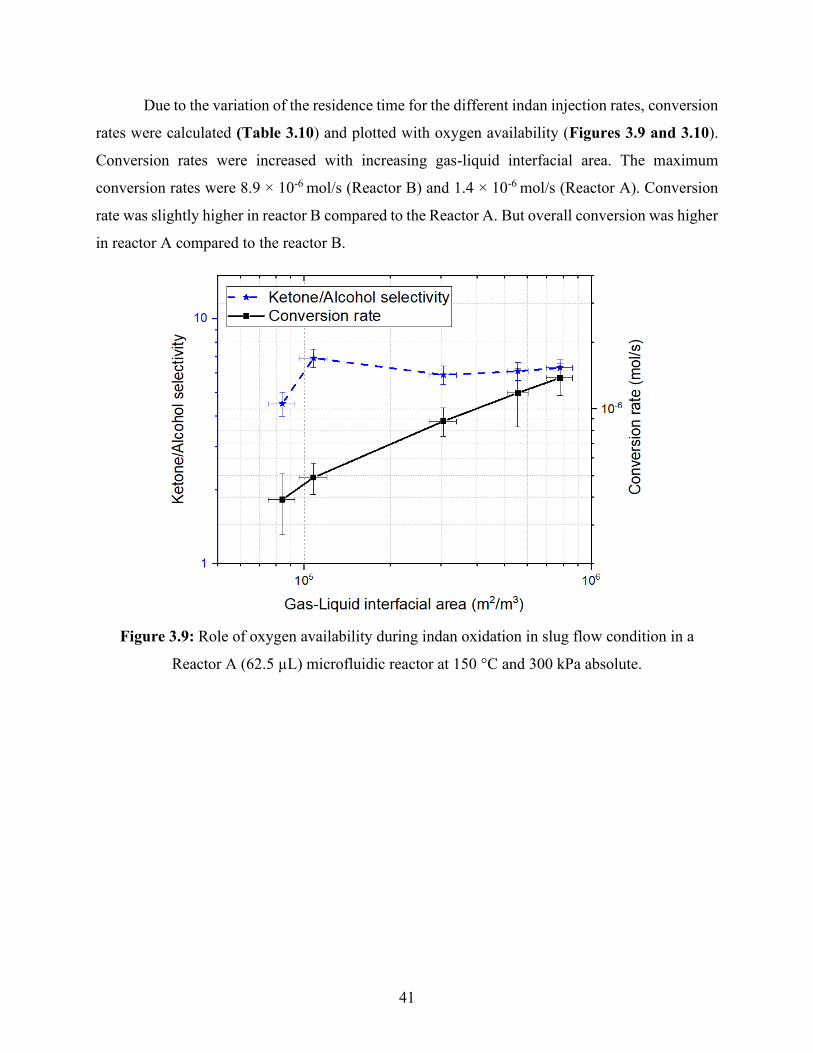
41
Due to the variation of the residence time for the different indan injection rates, conversion
rates were calculated (Table 3.10) and plotted with oxygen availability (Figures 3.9 and 3.10).
Conversion rates were increased with increasing gas-liquid interfacial area. The maximum
conversion rates were 8.9 × 10⁻⁶ mol/s (Reactor B) and 1.4 × 10⁻⁶ mol/s (Reactor A). Conversion
rate was slightly higher in reactor B compared to the Reactor A. But overall conversion was higher
in reactor A compared to the reactor B.
Figure 3.9: Role of oxygen availability during indan oxidation in slug flow condition in a
Reactor A (62.5 µL) microfluidic reactor at 150 °C and 300 kPa absolute.
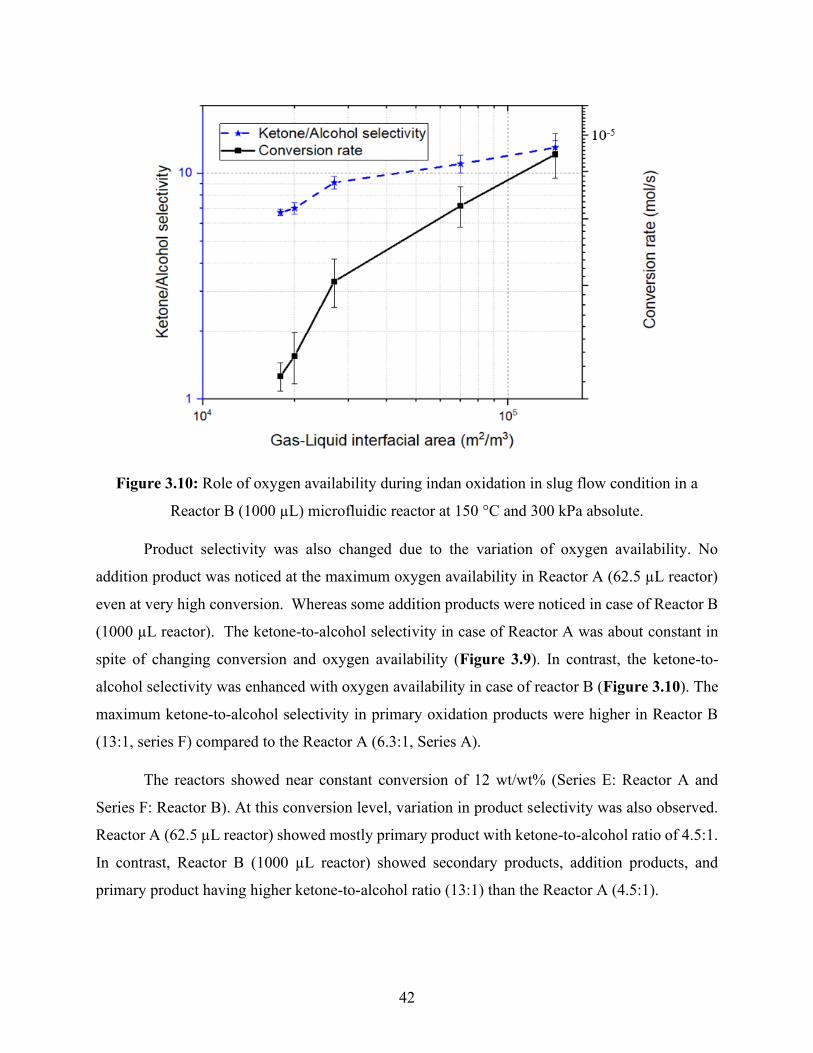
42
Figure 3.10: Role of oxygen availability during indan oxidation in slug flow condition in a
Reactor B (1000 µL) microfluidic reactor at 150 °C and 300 kPa absolute.
Product selectivity was also changed due to the variation of oxygen availability. No
addition product was noticed at the maximum oxygen availability in Reactor A (62.5 µL reactor)
even at very high conversion. Whereas some addition products were noticed in case of Reactor B
(1000 µL reactor). The ketone-to-alcohol selectivity in case of Reactor A was about constant in
spite of changing conversion and oxygen availability (Figure 3.9). In contrast, the ketone-to-
alcohol selectivity was enhanced with oxygen availability in case of reactor B (Figure 3.10). The
maximum ketone-to-alcohol selectivity in primary oxidation products were higher in Reactor B
(13:1, series F) compared to the Reactor A (6.3:1, Series A).
The reactors showed near constant conversion of 12 wt/wt% (Series E: Reactor A and
Series F: Reactor B). At this conversion level, variation in product selectivity was also observed.
Reactor A (62.5 µL reactor) showed mostly primary product with ketone-to-alcohol ratio of 4.5:1.
In contrast, Reactor B (1000 µL reactor) showed secondary products, addition products, and
primary product having higher ketone-to-alcohol ratio (13:1) than the Reactor A (4.5:1).
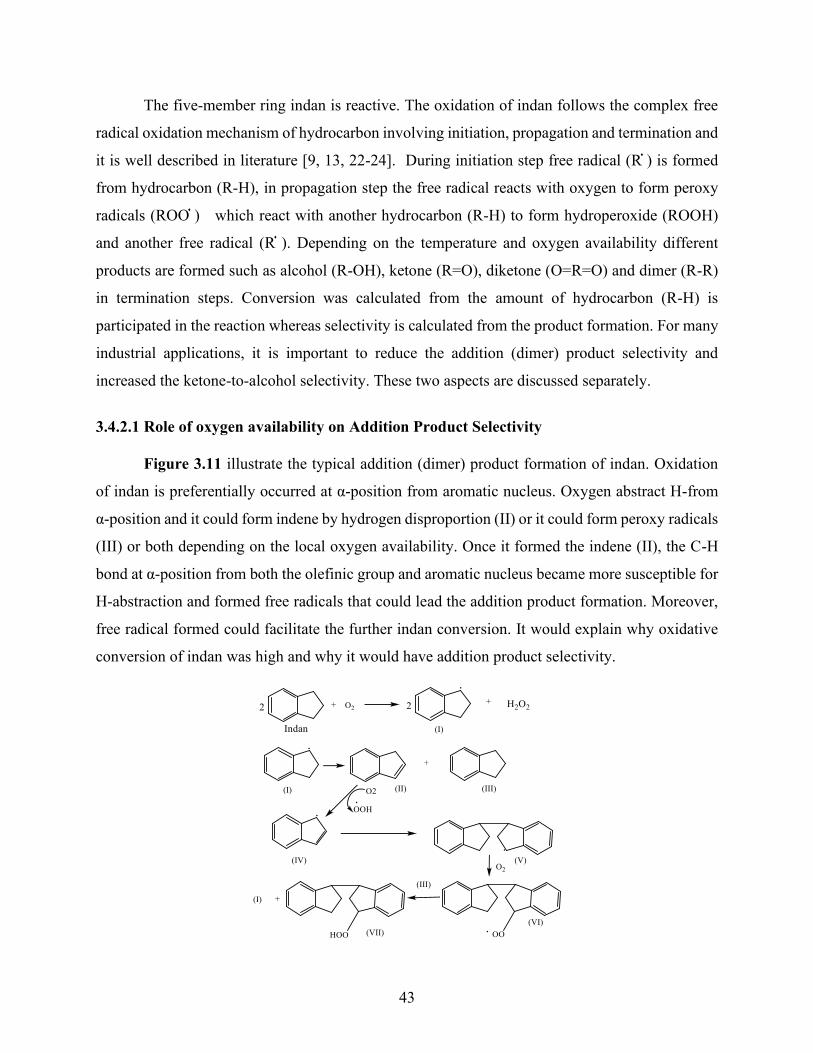
43
The five-member ring indan is reactive. The oxidation of indan follows the complex free
radical oxidation mechanism of hydrocarbon involving initiation, propagation and termination and
it is well described in literature [9, 13, 22-24]. During initiation step free radical (R֗ ) is formed
from hydrocarbon (R-H), in propagation step the free radical reacts with oxygen to form peroxy
radicals (ROO֗ ) which react with another hydrocarbon (R-H) to form hydroperoxide (ROOH)
and another free radical (R֗ ). Depending on the temperature and oxygen availability different
products are formed such as alcohol (R-OH), ketone (R=O), diketone (O=R=O) and dimer (R-R)
in termination steps. Conversion was calculated from the amount of hydrocarbon (R-H) is
participated in the reaction whereas selectivity is calculated from the product formation. For many
industrial applications, it is important to reduce the addition (dimer) product selectivity and
increased the ketone-to-alcohol selectivity. These two aspects are discussed separately.
3.4.2.1 Role of oxygen availability on Addition Product Selectivity
Figure 3.11 illustrate the typical addition (dimer) product formation of indan. Oxidation
of indan is preferentially occurred at α-position from aromatic nucleus. Oxygen abstract H-from
α-position and it could form indene by hydrogen disproportion (II) or it could form peroxy radicals
(III) or both depending on the local oxygen availability. Once it formed the indene (II), the C-H
bond at α-position from both the olefinic group and aromatic nucleus became more susceptible for
H-abstraction and formed free radicals that could lead the addition product formation. Moreover,
free radical formed could facilitate the further indan conversion. It would explain why oxidative
conversion of indan was high and why it would have addition product selectivity.
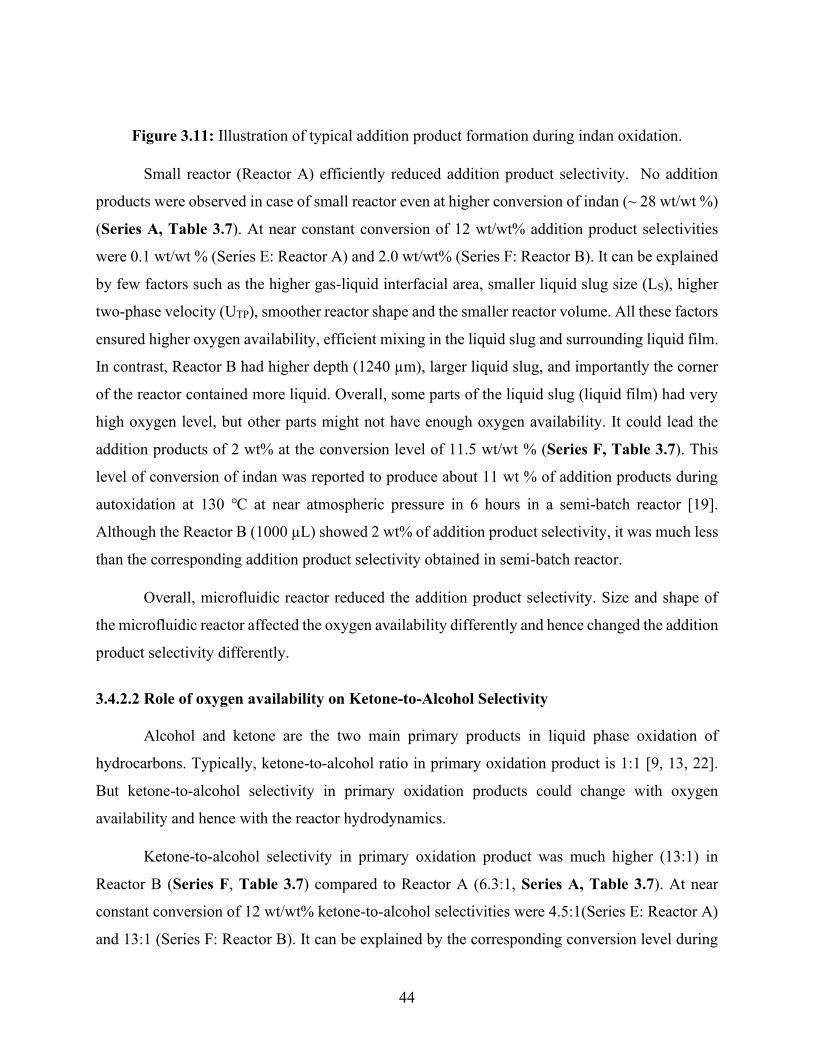
44
Figure 3.11: Illustration of typical addition product formation during indan oxidation.
Small reactor (Reactor A) efficiently reduced addition product selectivity. No addition
products were observed in case of small reactor even at higher conversion of indan (~ 28 wt/wt %)
(Series A, Table 3.7). At near constant conversion of 12 wt/wt% addition product selectivities
were 0.1 wt/wt % (Series E: Reactor A) and 2.0 wt/wt% (Series F: Reactor B). It can be explained
by few factors such as the higher gas-liquid interfacial area, smaller liquid slug size (LS), higher
two-phase velocity (UTP), smoother reactor shape and the smaller reactor volume. All these factors
ensured higher oxygen availability, efficient mixing in the liquid slug and surrounding liquid film.
In contrast, Reactor B had higher depth (1240 µm), larger liquid slug, and importantly the corner
of the reactor contained more liquid. Overall, some parts of the liquid slug (liquid film) had very
high oxygen level, but other parts might not have enough oxygen availability. It could lead the
addition products of 2 wt% at the conversion level of 11.5 wt/wt % (Series F, Table 3.7). This
level of conversion of indan was reported to produce about 11 wt % of addition products during
autoxidation at 130 ℃ at near atmospheric pressure in 6 hours in a semi-batch reactor [19].
Although the Reactor B (1000 µL) showed 2 wt% of addition product selectivity, it was much less
than the corresponding addition product selectivity obtained in semi-batch reactor.
Overall, microfluidic reactor reduced the addition product selectivity. Size and shape of
the microfluidic reactor affected the oxygen availability differently and hence changed the addition
product selectivity differently.
3.4.2.2 Role of oxygen availability on Ketone-to-Alcohol Selectivity
Alcohol and ketone are the two main primary products in liquid phase oxidation of
hydrocarbons. Typically, ketone-to-alcohol ratio in primary oxidation product is 1:1 [9, 13, 22].
But ketone-to-alcohol selectivity in primary oxidation products could change with oxygen
availability and hence with the reactor hydrodynamics.
Ketone-to-alcohol selectivity in primary oxidation product was much higher (13:1) in
Reactor B (Series F, Table 3.7) compared to Reactor A (6.3:1, Series A, Table 3.7). At near
constant conversion of 12 wt/wt% ketone-to-alcohol selectivities were 4.5:1(Series E: Reactor A)
and 13:1 (Series F: Reactor B). It can be explained by the corresponding conversion level during
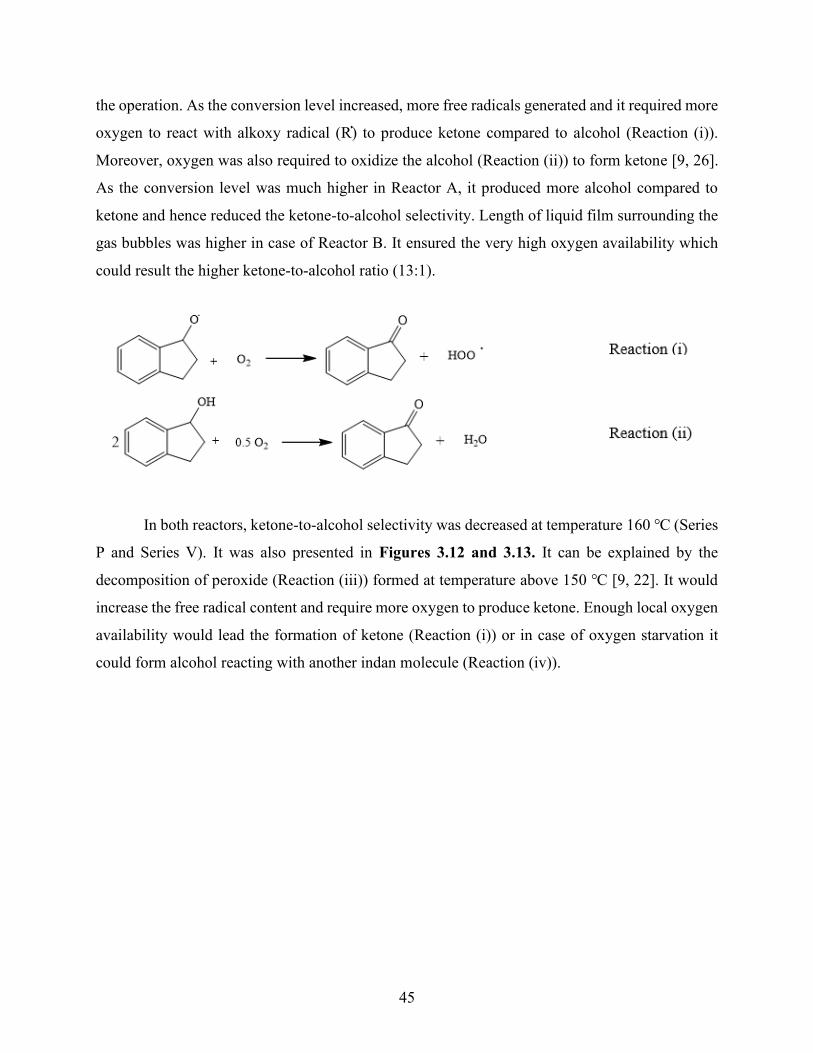
45
the operation. As the conversion level increased, more free radicals generated and it required more
oxygen to react with alkoxy radical (R֗) to produce ketone compared to alcohol (Reaction (i)).
Moreover, oxygen was also required to oxidize the alcohol (Reaction (ii)) to form ketone [9, 26].
As the conversion level was much higher in Reactor A, it produced more alcohol compared to
ketone and hence reduced the ketone-to-alcohol selectivity. Length of liquid film surrounding the
gas bubbles was higher in case of Reactor B. It ensured the very high oxygen availability which
could result the higher ketone-to-alcohol ratio (13:1).
In both reactors, ketone-to-alcohol selectivity was decreased at temperature 160 ℃ (Series
P and Series V). It was also presented in Figures 3.12 and 3.13. It can be explained by the
decomposition of peroxide (Reaction (iii)) formed at temperature above 150 ℃ [9, 22]. It would
increase the free radical content and require more oxygen to produce ketone. Enough local oxygen
availability would lead the formation of ketone (Reaction (i)) or in case of oxygen starvation it
could form alcohol reacting with another indan molecule (Reaction (iv)).
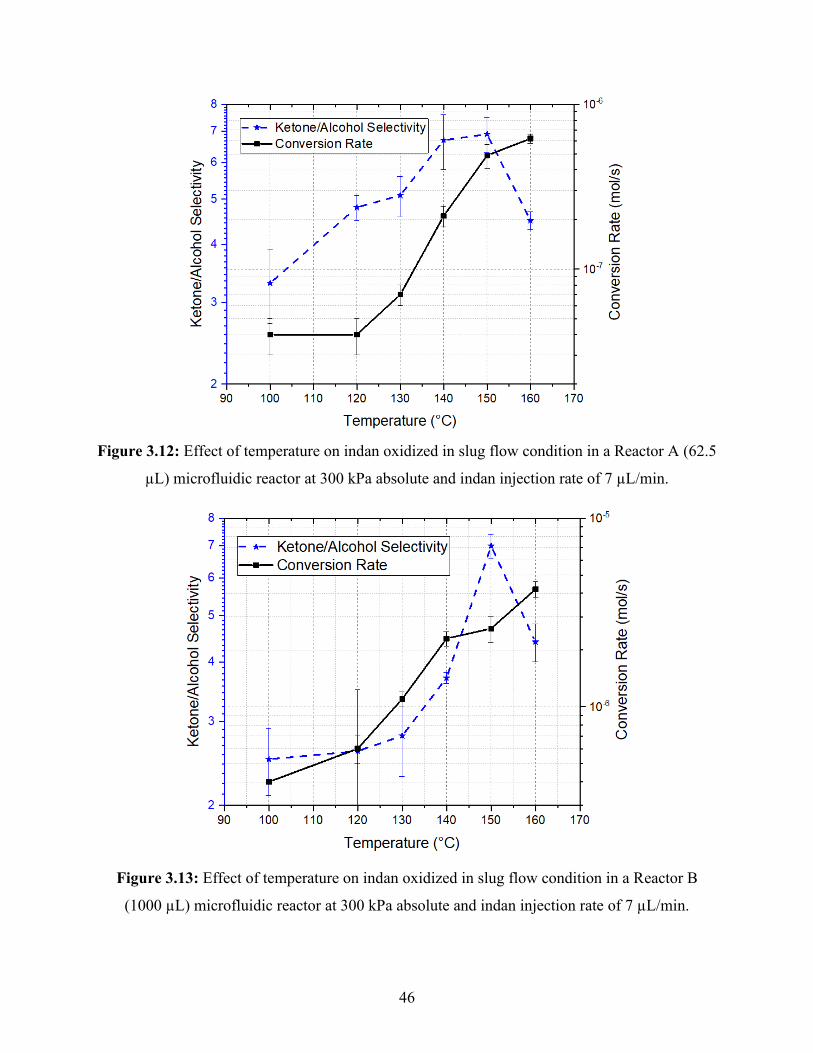
46
Figure 3.12: Effect of temperature on indan oxidized in slug flow condition in a Reactor A (62.5
µL) microfluidic reactor at 300 kPa absolute and indan injection rate of 7 µL/min.
Figure 3.13: Effect of temperature on indan oxidized in slug flow condition in a Reactor B
(1000 µL) microfluidic reactor at 300 kPa absolute and indan injection rate of 7 µL/min.
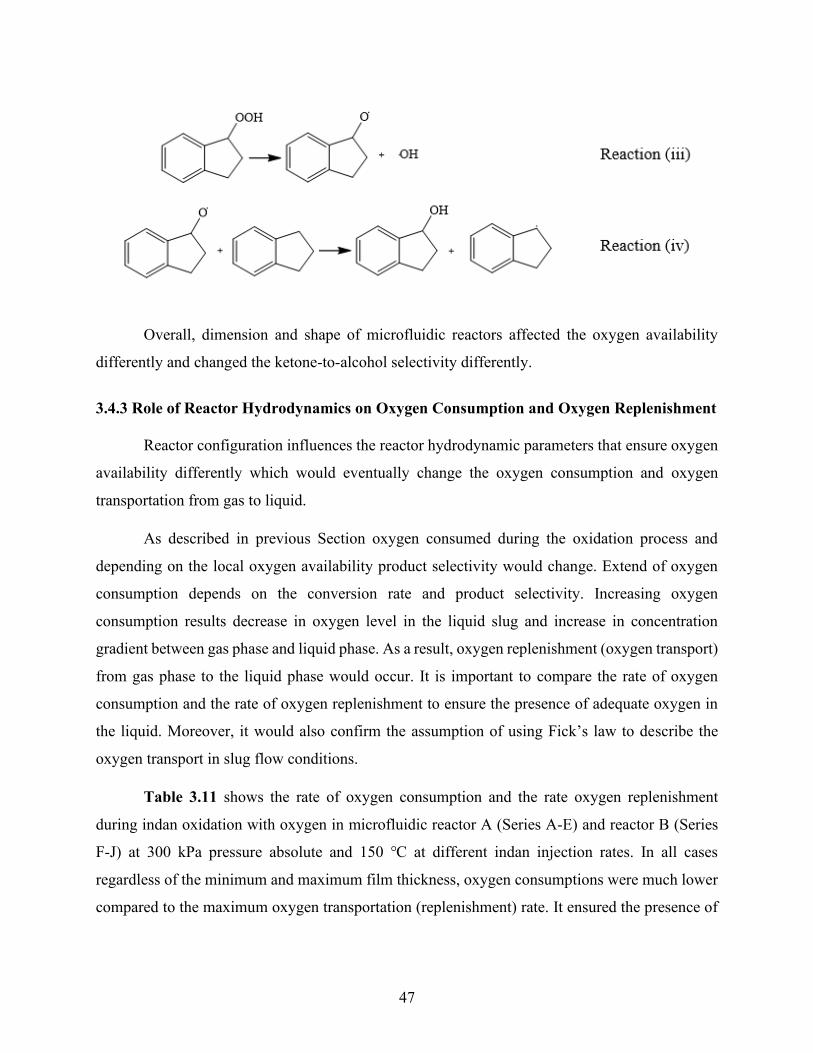
47
Overall, dimension and shape of microfluidic reactors affected the oxygen availability
differently and changed the ketone-to-alcohol selectivity differently.
3.4.3 Role of Reactor Hydrodynamics on Oxygen Consumption and Oxygen Replenishment
Reactor configuration influences the reactor hydrodynamic parameters that ensure oxygen
availability differently which would eventually change the oxygen consumption and oxygen
transportation from gas to liquid.
As described in previous Section oxygen consumed during the oxidation process and
depending on the local oxygen availability product selectivity would change. Extend of oxygen
consumption depends on the conversion rate and product selectivity. Increasing oxygen
consumption results decrease in oxygen level in the liquid slug and increase in concentration
gradient between gas phase and liquid phase. As a result, oxygen replenishment (oxygen transport)
from gas phase to the liquid phase would occur. It is important to compare the rate of oxygen
consumption and the rate of oxygen replenishment to ensure the presence of adequate oxygen in
the liquid. Moreover, it would also confirm the assumption of using Fick’s law to describe the
oxygen transport in slug flow conditions.
Table 3.11 shows the rate of oxygen consumption and the rate oxygen replenishment
during indan oxidation with oxygen in microfluidic reactor A (Series A-E) and reactor B (Series
F-J) at 300 kPa pressure absolute and 150 ℃ at different indan injection rates. In all cases
regardless of the minimum and maximum film thickness, oxygen consumptions were much lower
compared to the maximum oxygen transportation (replenishment) rate. It ensured the presence of
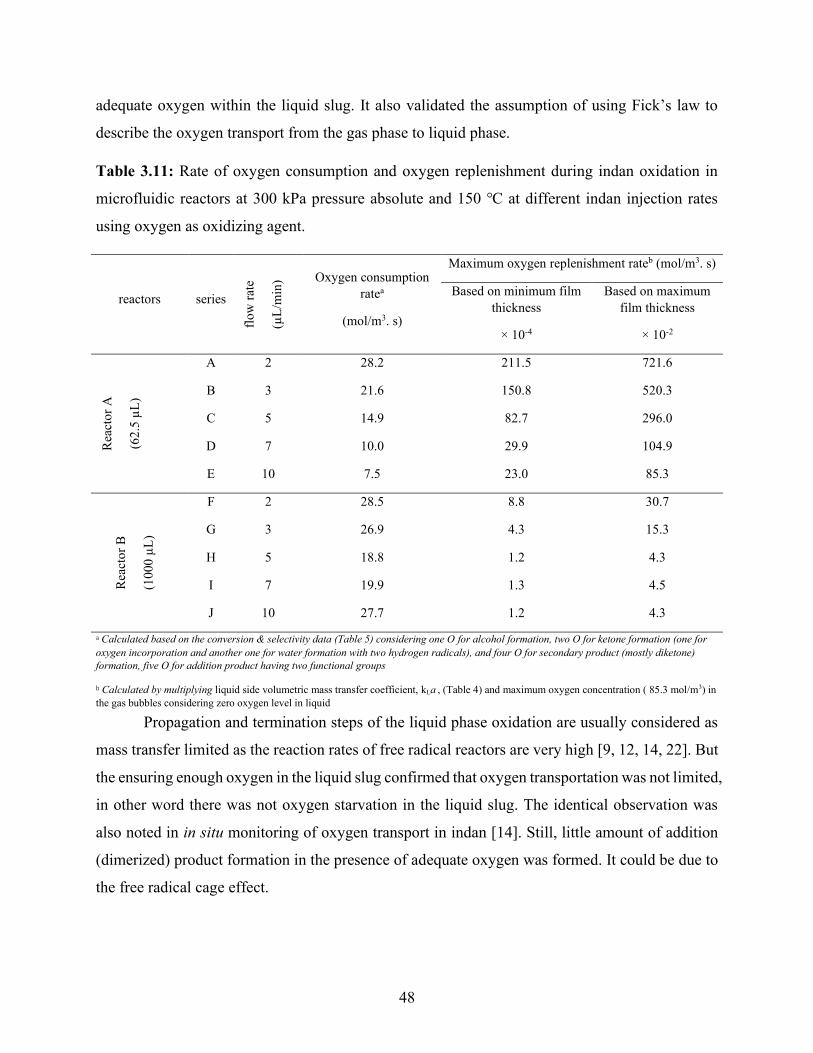
48
adequate oxygen within the liquid slug. It also validated the assumption of using Fick’s law to
describe the oxygen transport from the gas phase to liquid phase.
Table 3.11: Rate of oxygen consumption and oxygen replenishment during indan oxidation in
microfluidic reactors at 300 kPa pressure absolute and 150 ℃ at different indan injection rates
using oxygen as oxidizing agent.
reactors series
flo
w r
ate
(µL
/min
) Oxygen consumption
ratea
(mol/m3. s)
Maximum oxygen replenishment rateb (mol/m3. s)
Based on minimum film
thickness
× 10-4
Based on maximum
film thickness
× 10-2
Rea
cto
r A
(62
.5 µ
L)
A 2 28.2 211.5 721.6
B 3 21.6 150.8 520.3
C 5 14.9 82.7 296.0
D 7 10.0 29.9 104.9
E 10 7.5 23.0 85.3
Rea
cto
r B
(10
00
µL
)
F 2 28.5 8.8 30.7
G 3 26.9 4.3 15.3
H 5 18.8 1.2 4.3
I 7 19.9 1.3 4.5
J 10 27.7 1.2 4.3
a Calculated based on the conversion & selectivity data (Table 5) considering one O for alcohol formation, two O for ketone formation (one for
oxygen incorporation and another one for water formation with two hydrogen radicals), and four O for secondary product (mostly diketone)
formation, five O for addition product having two functional groups
b Calculated by multiplying liquid side volumetric mass transfer coefficient, kLa , (Table 4) and maximum oxygen concentration ( 85.3 mol/m3) in
the gas bubbles considering zero oxygen level in liquid
Propagation and termination steps of the liquid phase oxidation are usually considered as
mass transfer limited as the reaction rates of free radical reactors are very high [9, 12, 14, 22]. But
the ensuring enough oxygen in the liquid slug confirmed that oxygen transportation was not limited,
in other word there was not oxygen starvation in the liquid slug. The identical observation was
also noted in in situ monitoring of oxygen transport in indan [14]. Still, little amount of addition
(dimerized) product formation in the presence of adequate oxygen was formed. It could be due to
the free radical cage effect.
49
3.4.4 Effect of Temperatures on Oxygen Availability, Conversion and Product Selectivity
The effect of temperature study was the secondary goal which would increase the reaction
rate and thereby make the reaction selectivity more sensitive to differences in oxygen availability.
As anticipated, conversion rate was also increased with temperature for both the reactors
(Figures 3.12 and 3.13). Maximum indan conversion rate were 4.2 × 10⁻⁶ mol/s (Reactor B) and
0.62 × 10⁻⁶ mol/s (Reactor A). Addition product selectivity was also varied with reactor size and
temperature. For example, Series P (Reactor A at 160 ℃) and Series V (Reactor B at 160 ℃)
showed the 1.2 wt% and 5.4 wt% of addition product selectivity, respectively. At temperature
above 150 ℃, the free radical content in the system increased due to break down of some peroxides
formed during the oxidation [9, 19]. In addition to the explanation of the variation of oxygen
availability in both reactors, the enhancement of free radical contents would also facilitate the
addition product formation. However, as mentioned in last paragraph, oxygen availability ensured
in microfluidic reactors suppressed addition product formation (dimerization) despite the high
conversion.
The rate of oxygen consumption and the rate oxygen replenishment were also tabulated
(Table 3.12) for the indan oxidation with oxygen in microfluidic reactor A (Series K-P) and reactor
B (Series Q-V) at 300 kPa pressure absolute and different temperatures at 7 µL/min indan injection
rate. As like previous case, regardless of the minimum and maximum film thickness, oxygen
consumptions were much lower compared to the maximum oxygen transportation (replenishment)
rate. It also ensured the presence of adequate oxygen within the liquid slug even at higher
conversion rates. Moreover, assumption of using Fick’s law to describe the oxygen transport from
the gas phase to liquid phase was also valid for the higher conversion rates.
Table 3.12: Rate of oxygen consumption and oxygen replenishment during indan oxidation in
microfluidic reactors at 300 kPa pressure absolute and different temperatures at 7 µL/min indan
injection rate using oxygen as oxidizing agent.
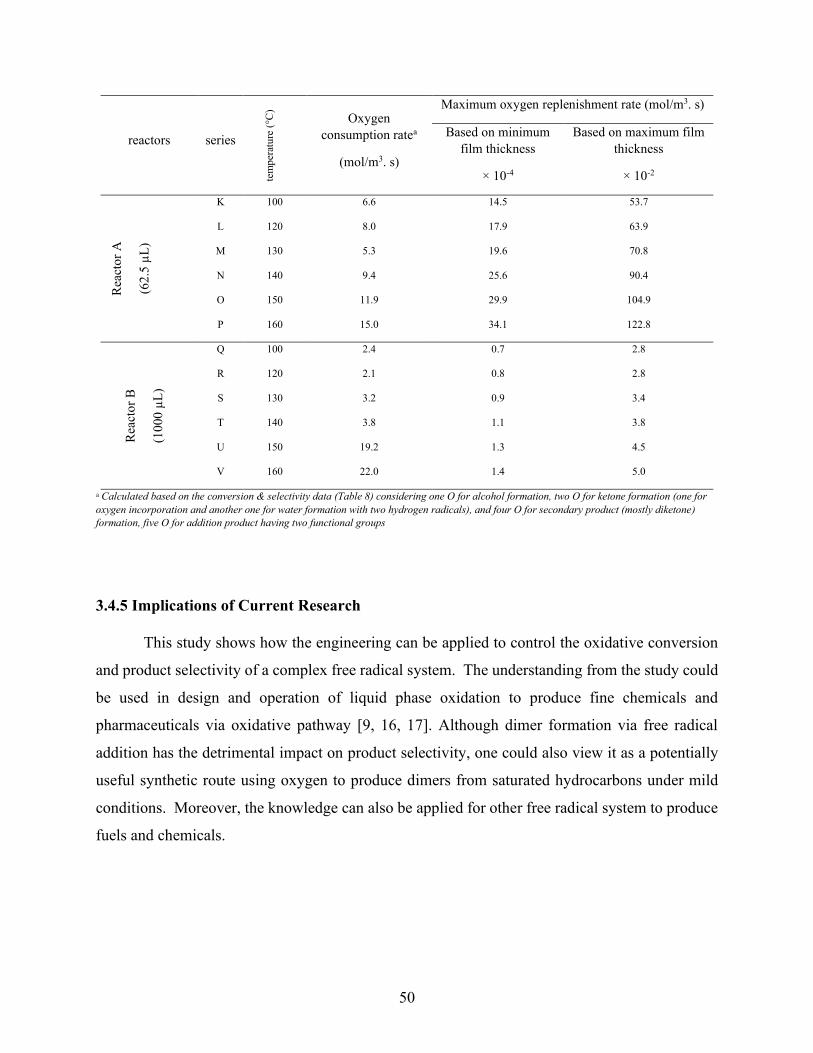
50
reactors series
tem
per
atu
re (
°C)
Oxygen
consumption ratea
(mol/m3. s)
Maximum oxygen replenishment rate (mol/m3. s)
Based on minimum
film thickness
× 10-4
Based on maximum film
thickness
× 10-2
Rea
cto
r A
(62
.5 µ
L)
K 100 6.6 14.5 53.7
L 120 8.0 17.9 63.9
M 130 5.3 19.6 70.8
N 140 9.4 25.6 90.4
O 150 11.9 29.9 104.9
P 160 15.0 34.1 122.8
Rea
cto
r B
(10
00
µL
)
Q 100 2.4 0.7 2.8
R 120 2.1 0.8 2.8
S 130 3.2 0.9 3.4
T 140 3.8 1.1 3.8
U 150 19.2 1.3 4.5
V 160 22.0 1.4 5.0
a Calculated based on the conversion & selectivity data (Table 8) considering one O for alcohol formation, two O for ketone formation (one for
oxygen incorporation and another one for water formation with two hydrogen radicals), and four O for secondary product (mostly diketone)
formation, five O for addition product having two functional groups
3.4.5 Implications of Current Research
This study shows how the engineering can be applied to control the oxidative conversion
and product selectivity of a complex free radical system. The understanding from the study could
be used in design and operation of liquid phase oxidation to produce fine chemicals and
pharmaceuticals via oxidative pathway [9, 16, 17]. Although dimer formation via free radical
addition has the detrimental impact on product selectivity, one could also view it as a potentially
useful synthetic route using oxygen to produce dimers from saturated hydrocarbons under mild
conditions. Moreover, the knowledge can also be applied for other free radical system to produce
fuels and chemicals.
51
3.5 Conclusions
Liquid phase autoxidation of indan, a five-member ring naphthenic-aromatic hydrocarbon, was
investigated in two microfluidic reactors to understand the impact of reactor configuration on
hydrodynamics, conversion, and selectivity. The key observations and conclusions are as follows:
(a) Reactor configuration (dimensions and shape) changed the reactor hydrodynamics and
influenced the oxygen availability in different ways and affected the conversion and
product selectivity differently. Reactor A (62.5 µL, irregular shape) showed higher indan
conversion and suppressed the addition product selectivity very well, whereas Reactor B
(1000 µL, rectangular shape) showed moderate indan conversion and enhanced the ketone-
to-alcohol ratio (13:1) from the typical ketone-to-alcohol ratio of 1:1.
(b) At constant temperature, pressure and near constant conversion of 12 wt/wt %, Reactor A
(62.5 µL reactor) showed almost no addition products (0.1 wt/wt %), very little secondary
products (0.9 wt/wt %) and mostly primary products (99 wt/wt %) with ketone-to-alcohol
ratio of 4.5:1. In contrast, Reactor B (1000 µL reactor) showed secondary products (6.6
wt/wt %), addition products (2 wt/wt %), and primary product (91.4 wt/wt %) having
higher ketone-to-alcohol ratio (13:1) than the Reactor A (4.5:1).
(c) The most important parameter that ensured oxygen availability was the gas-liquid
interfacial area (a) and it manifested itself differently in reactors A and B. In case of
Reactor A, the main contributor to get higher oxygen availability was the smaller reactor
dimension and volume whereas the length of the liquid film surrounding the gas bubble
was the main contributor to obtain the higher oxygen availability in Reactor B.
(d) Smaller liquid slug size, higher two-phase velocity (UTP), smoother reactor shape and the
smaller reactor volume ensured higher oxygen availability in the liquid slug and in the
surrounding liquid film in case of reactor A.
(e) Comparison of the rate oxygen consumption and the rate of oxygen transformation ensured
that oxygen consumption was much lower compared to the maximum oxygen
transportation (replenishment) rate. It confirmed the presence of adequate oxygen within
the liquid slug. It also validated the assumption of using Fick’s law to describe the oxygen
transport from the gas phase to liquid phase. Change in temperatures also showed similar
results.
52
(f) The oxygen availability increased the concentration of oxygen centered free radical (RO֗
or ROO֗) and produced more oxygen containing functional groups and decreased the
concentration of stable carbon centered free radical (R֗) of naphthenic-aromatic compounds.
It reduced the risk of addition product formation via hydrogen disproportion. The higher
ketone formation over alcohol was due to the reaction of oxygen with oxygen center free
radicals (RO֗ or ROO֗) and/or with alcohol (R-OH) formed during the oxidation.
(g) The study demonstrated how engineering could be used to control the chemistry. The
understanding from the study could be used in design and operation of liquid phase
oxidation to produce fine chemicals and pharmaceuticals.
3.6 Acknowledgements
This work was supported by the Natural Sciences and Engineering Research Council of
Canada (NSERC).
3.7 Nomenclatures
a gas-liquid interfacial area, (m2/m3)
diffusivity of oxygen in tetralin (m2/s)
hydraulic diameter
FID flame ionization detector
GC gas chromatography
depth of the reactor, (m)
mass transfer coefficient; (m/s)
kLa overall mass transfer coefficient, (s-1)
length of gas bubble, (m)
Ls length of liquid slug, (m)
53
PTFE Poly tetra fluoro ethylene
RTD residence time distribution
SG surface area of gas bubble, (m2)
UG superficial gas bubble velocity, (m/s)
UL superficial liquid slug velocity, (m/s)
UTP two phase superficial velocity, (m/s)
Vg volume of gas bubble, (m3)
VL volume of liquid slug, (m3)
w width of the reactor, (m)
Greek letters
thickness of liquid film, (m)
ℇG volume fraction of gas bubble
𝜌𝐺 density of gas, (kg/m3)
𝜌𝑠 density of liquid, (kg/m3)
Subscripts
b bulk
G gas
L liquid
TP two-phase
54
3.8 Literature Cited
1. Gemoets HPL, Su Y, Shang M, Hessel V, Luque R, Noël T (2016) Liquid phase oxidation
chemistry in continuous flow microreactor. Chem Soc Rev 45:83–117.
2. Hone CA, Kappe CO (2019) The Use of Molecular Oxygen for Liquid Phase Aerobic
Oxidations in Continuous Flow. Top Curr Chem 2: 377.
3. Vanoye L, Aloui A, Pablos M, Philippe R, Percheron A, Favre-Réguillon A, de Bellefon
C (2013) A safe and efficient flow oxidation of aldehydes with O2. Org Lett 15:5978–5981.
4. Siddiquee MN, Sivaramakrishnan K, Wu Y, De Klerk A, Nazemifard N (2018) A statistical
approach dealing with multicollinearity among predictors in microfluidic reactor operation
to control liquid-phase oxidation selectivity. React Chem Eng 3:972–990.
5. Sharma S, Yaminia, Das P (2019) Hydrogenation of nitroarenes to anilines in a flow reactor
using polystyrene supported rhodium in a catalyst-cartridge. (Cart-Rh@PS) New J Chem
43: 1764–1769.
6. Ifran M, Glasnov TN, Kappe CO (2011) Heterogeneous catalytic hydrogenation reactions
in continuous-flow reactors. Chem Sus Chem 4, 300 – 316.
7. Cantillo, D, Kappe, CO (2017) Halogenation of organic compounds using continuous flow
and microreactor technology. React Chem Eng 2:7–19.
8. Karande R, Schmid A, Buehler K (2016) Applications of Multiphasic Microreactors for
Biocatalytic Reactions. Org Process Res Dev 20:361-370.
9. Siddiquee MN, De Klerk A, Nazemifard N (2016) Application of microfluidics to enhance
gas-liquid mass transfer during selective oxidation of hydrocarbons. React Chem Eng
1:418–435.
10. Hartman RL, McMullen JP, Jensen KF (2011) Deciding whether to go with the flow –
evaluating the merits of flow reactors for synthesis. Angew Chemie Int Ed 50:7502–7519.
11. Leclerc A, Alame M, Schweich D, Pouteau P, Delattreb C, de Bellefon C (2008) Gas–
liquid selective oxidations with oxygen under explosive conditions in a micro-structured
reactor. Lab Chip 8:814–817.
12. Suresh AK, Sharma MM, Sridhar T (2000) Engineering aspects of industrial liquid-phase
air oxidation of hydrocarbon. Ind Eng Chem Res 39:3958–3997.
55
13. De Klerk A (2003) Continuous- mode thermal oxidation of Fischer-Tropsch waxes. Ind
Eng Chem Res 42:6545–6548.
14. Siddiquee MN, De Klerk A (2016) In situ measurement of liquid Phase oxygen during
oxidation. Ind Eng Chem Res 55:6607–6618.
15. Dimitratos N, Lopez-Sanchez JA, Hutchings GJ (2014) Supported metal nanoparticles in
liquid-phase oxidation reactions. In: Duprez D, Cavani F (Eds) Handbook of Advanced
Methods and Processes in Oxidation Catalysis: From Laboratory to Industry, Imperial
College Press, London 631–678.
16. Snead DR, Jamison TF (2015) A three-minute synthesis and purification of ibuprofen:
pushing the limits of continuous-flow processing. Angew Chem Int Ed 54:1521–3773.
17. Gutmann B, Cantillo D, Kappe CO (2015) Continuous-flow technology—A tool for the
safe manufacturing of active pharmaceutical ingredients Angew Chem Int Ed 54:6688–
6729.
18. Hobbs CC, Drew EH, Van’t Hof HA, Mesich FG, Onore MJ (1972) Mass transfer rate-
limitation effects in liquid-phase oxidation. Ind Eng Chem Prod Res Develop 11:220–225.
19. Siddiquee MN, De Klerk A (2014) Hydrocarbon addition reactions during low temperature
autoxidation of oilsands bitumen. Energy Fuels 28:6848–6859.
20. Siddiquee MN, De Klerk A (2015) Heterocyclic addition reactions during low temperature
autoxidation. Energy Fuels 29:4236–4244.
21. Yun J, Lei Q, Zhang S, Shen S, Yao K (2010) Slug flow characteristics of gas-miscible
liquids in a rectangular microchannel with cross and T-shaped junctions. Chem Eng Sci
65:5256–5263.
22. Emanuel MN, Denisov ET, Maizus ZK (1967) Liquid-phase oxidation of hydrocarbons.
Plenum Press, New York.
23. Sheldon RA, Kochi JK (1981) Metal-Catalyzed Oxidations of Organic Compounds.
Academic Press, New York.
24. Twigg GH (1954) The mechanism of liquid-phase oxidation. Chem Eng Sci Suppl 8:5–16.
25. Jiayu L, Wanghua C, Liping C, Yingtao T, Xin S (2012) Thermal decomposition analysis
and safety study on di-tert-butyl peroxide. Procedia Eng 43:312–317.
56
26. Tolman CA, Druliner JD, Nappa MJ, Herron N (1989) Alkane oxidation studies in du
Pont’s central research department. In: Hill CL (ed) Activation and Functionalization of
Alkanes, Wiley, New York.
27. Dietz WA (1967) Response factors for gas chromatographic analyses. J Chromatogr Sci 5:
68-71.
28. Diaz M, Vega A, Coca J (1987) Correlation for the estimation of gas-liquid diffusivity.
Chem Eng Com 52: 271-281.
29. Vandu CO, Liu H, Krishna R (2005) Mass transfer from Taylor bubbles rising in single
capillaries. Chem Eng Sci 60: 6430-6437.
57
Chapter 4: Comparative Study of Tetralin Oxidation in Microfluidic
and Batch Reactor
In this chapter, we discuss the comparison of liquid phase oxidation of Tetralin, a
naphthenic-aromatic hydrocarbon in microfluidic and batch reactor. The work is part of a
published paper “A statistical approach dealing with multicollinearity among predictors in
microfluidic reactor operation to control liquid-phase oxidation selectivity” on Reaction Chemistry
and Engineering.
Abstract
Liquid phase oxidation in a microfluidic reactor is advantageous to manipulate conversion
rate and product selectivity. At constant temperature and pressure, the parameters that affect the
outputs are gas-liquid interfacial area (a), length of oxygen gas bubble (LG), length of liquid slug
(LS), two-phase superficial velocity (UTP) and liquid flowrate to the reactor (Q). The objective of
this study was to compare the oxidation conversion rate and product selectivity obtained in tetralin
oxidation in microfluidic and batch reactor. The study shows using microfluidics reactor, one can
achieve order of magnitude of increase in product selectivity compared to that in batch reactor due
to increasing gas-liquid interfacial area.
4.1 Introduction
Liquid phase oxidation of hydrocarbons is industrially important to produce
petrochemicals [1–3]. The main challenge of the non-catalytic free radical oxidation is to achieve
good product selectivity. Industrially the non-catalytic liquid phase oxidation is performed at low
conversion to control the product selectivity, for example, oxidation of cyclohexane [4]. Oxidation
product selectivity depends on conversion, temperature, and oxygen availability in the liquid phase
[5–8]. Liquid phase oxidation follows initiation, propagation, and termination steps. Once the free
radical (R·) is formed during the initiation step, it reacts with local oxygen or other free radicals
very fast following zero order kinetics [5,9]. Oxygen transfer to the liquid phase and oxygen
58
availability in the liquid phase are critically important to control the product selectivity.
Microfluidic reactor, also known as microreactor, is advantageous to ensure higher local oxygen
availability. The main advantages of such a miniaturized reactor are: (i) the higher surface-area-to
volume ratio that facilitate the improved mass and heat transfer in the liquid phase; (ii) the exact
control of the gas to liquid ratio in the reactor that facilitate the manipulation of gas-liquid
interfacial area; and (iii) the well-defined flow properties in the microstructure reactor [5,10,11].
These advantages caused the microfluidic reactor to receive attention in the study of liquid phase
oxidation. The flow regime in a microchannel depends on the relative gas and liquid properties,
flow rates and channel geometry. The five main flow regimes are: bubble, slug, churn, slug annular
and annular [5,12,13]. Slug flow, also known as Taylor flow, has its unique hydrodynamic
characteristics, where two adjacent liquid slugs are separated by the gas bubbles and are connected
only via a thin liquid film [5,10–13]. This thin liquid film contributes to create a higher gas-liquid
interfacial area and hence improves oxygen availability. Taylor flow also has a Marangoni effect
within the liquid slug, which is the mass transfer along the gas-liquid interface driven by gradient
of the surface tension. The convection caused by Marangoni effect is beneficial not only to ensure
local oxygen availability by proper mixing but also to bring the surface active oxygenates to the
liquid phase to prevent over oxidation at the gas-liquid interface [5,10,11]. Of the parameters that
influence oxygen availability, it was not clear which ones affect it the most, in a hydro-dynamically
complex Taylor flow system. Oxygen availability at a constant pressure depended on several
parameters such as gas-liquid interfacial area (𝑎) based on unit cell volume (volume of gas bubble
and liquid slug), the film attached to the wall, length of liquid slug (𝐿𝑆), length of gas bubble (𝐿𝐺),
two-phase superficial velocity (𝑈𝑇𝑃), and liquid flowrate to the reactor (𝑄) [5]. Small changes in
the design of the microfluidic reactor and its operation could dramatically affect the relationship
between these different parameters. Mass transfer in Taylor flow can be explained well by the Film
Theory [5,10]. The gaseous component, oxygen in our case, is transferred to the liquid phase where
it is consumed during the reaction. Works on mass transport at Taylor flow conditions have been
well documented in literature, but the most cases focused on simulation and/or experiments
considering water as the liquid at ideal conditions (no gas consumption) [11–17]. Few liquid phase
oxidation studies at Taylor flow conditions are reported which dealt mainly with conversion
enhancement, but mass transfer characteristics were not discussed [18–22]. In our previous
oxidation study, a qualitative description of the mass transport effects on oxidative conversion and
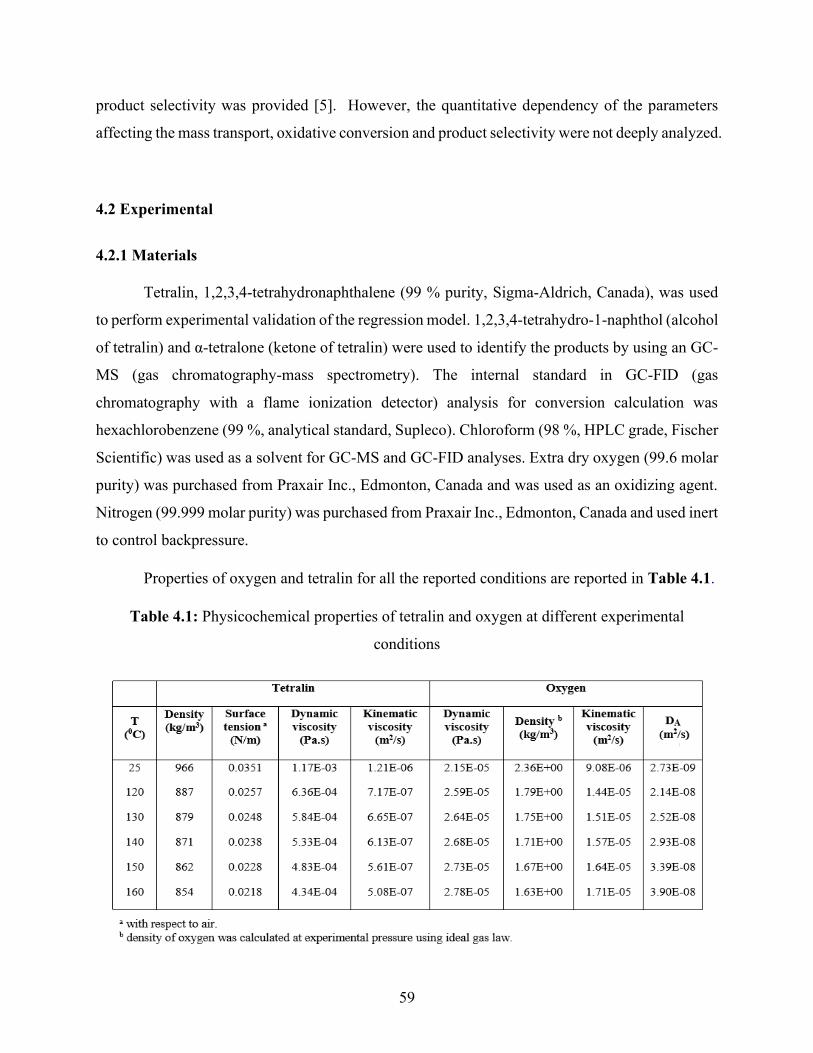
59
product selectivity was provided [5]. However, the quantitative dependency of the parameters
affecting the mass transport, oxidative conversion and product selectivity were not deeply analyzed.
4.2 Experimental
4.2.1 Materials
Tetralin, 1,2,3,4-tetrahydronaphthalene (99 % purity, Sigma-Aldrich, Canada), was used
to perform experimental validation of the regression model. 1,2,3,4-tetrahydro-1-naphthol (alcohol
of tetralin) and α-tetralone (ketone of tetralin) were used to identify the products by using an GC-
MS (gas chromatography-mass spectrometry). The internal standard in GC-FID (gas
chromatography with a flame ionization detector) analysis for conversion calculation was
hexachlorobenzene (99 %, analytical standard, Supleco). Chloroform (98 %, HPLC grade, Fischer
Scientific) was used as a solvent for GC-MS and GC-FID analyses. Extra dry oxygen (99.6 molar
purity) was purchased from Praxair Inc., Edmonton, Canada and was used as an oxidizing agent.
Nitrogen (99.999 molar purity) was purchased from Praxair Inc., Edmonton, Canada and used inert
to control backpressure.
Properties of oxygen and tetralin for all the reported conditions are reported in Table 4.1.
Table 4.1: Physicochemical properties of tetralin and oxygen at different experimental
conditions
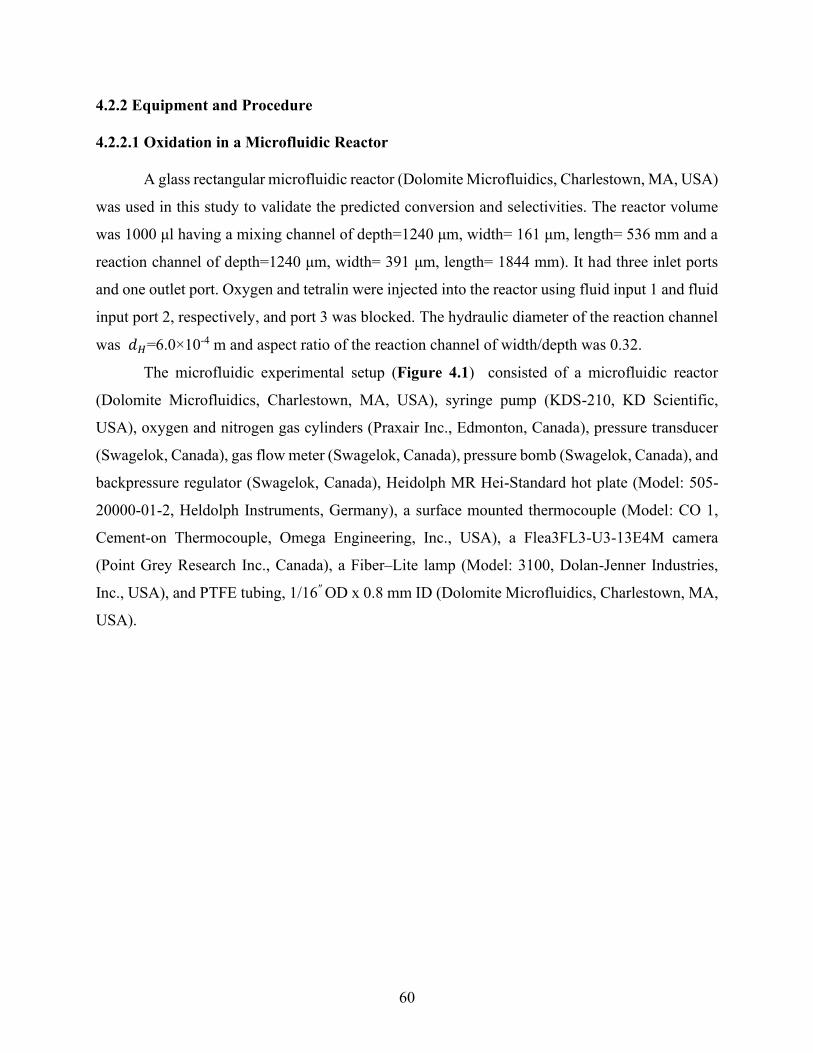
60
4.2.2 Equipment and Procedure
4.2.2.1 Oxidation in a Microfluidic Reactor
A glass rectangular microfluidic reactor (Dolomite Microfluidics, Charlestown, MA, USA)
was used in this study to validate the predicted conversion and selectivities. The reactor volume
was 1000 μl having a mixing channel of depth=1240 μm, width= 161 μm, length= 536 mm and a
reaction channel of depth=1240 μm, width= 391 μm, length= 1844 mm). It had three inlet ports
and one outlet port. Oxygen and tetralin were injected into the reactor using fluid input 1 and fluid
input port 2, respectively, and port 3 was blocked. The hydraulic diameter of the reaction channel
was 𝑑𝐻=6.0×10⁻⁴ m and aspect ratio of the reaction channel of width/depth was 0.32.
The microfluidic experimental setup (Figure 4.1) consisted of a microfluidic reactor
(Dolomite Microfluidics, Charlestown, MA, USA), syringe pump (KDS-210, KD Scientific,
USA), oxygen and nitrogen gas cylinders (Praxair Inc., Edmonton, Canada), pressure transducer
(Swagelok, Canada), gas flow meter (Swagelok, Canada), pressure bomb (Swagelok, Canada), and
backpressure regulator (Swagelok, Canada), Heidolph MR Hei-Standard hot plate (Model: 505-
20000-01-2, Heldolph Instruments, Germany), a surface mounted thermocouple (Model: CO 1,
Cement-on Thermocouple, Omega Engineering, Inc., USA), a Flea3FL3-U3-13E4M camera
(Point Grey Research Inc., Canada), a Fiber‒Lite lamp (Model: 3100, Dolan-Jenner Industries,
Inc., USA), and PTFE tubing, 1/16″ OD x 0.8 mm ID (Dolomite Microfluidics, Charlestown, MA,
USA).
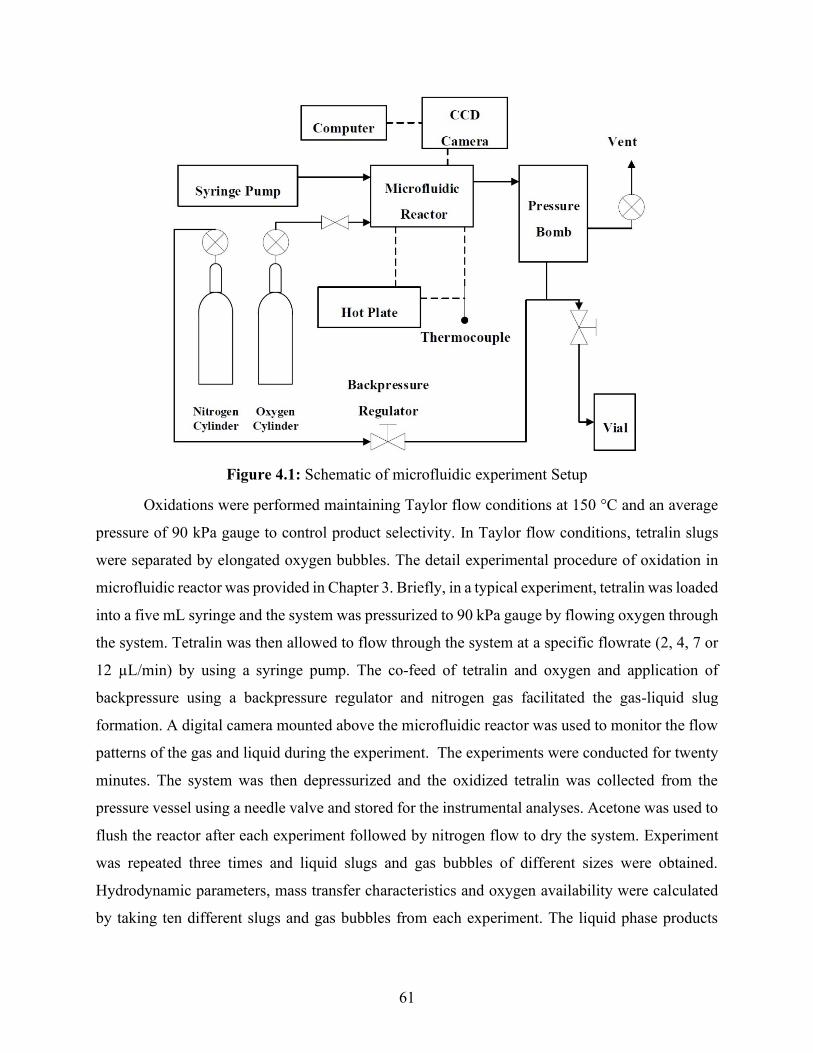
61
Figure 4.1: Schematic of microfluidic experiment Setup
Oxidations were performed maintaining Taylor flow conditions at 150 °C and an average
pressure of 90 kPa gauge to control product selectivity. In Taylor flow conditions, tetralin slugs
were separated by elongated oxygen bubbles. The detail experimental procedure of oxidation in
microfluidic reactor was provided in Chapter 3. Briefly, in a typical experiment, tetralin was loaded
into a five mL syringe and the system was pressurized to 90 kPa gauge by flowing oxygen through
the system. Tetralin was then allowed to flow through the system at a specific flowrate (2, 4, 7 or
12 µL/min) by using a syringe pump. The co-feed of tetralin and oxygen and application of
backpressure using a backpressure regulator and nitrogen gas facilitated the gas-liquid slug
formation. A digital camera mounted above the microfluidic reactor was used to monitor the flow
patterns of the gas and liquid during the experiment. The experiments were conducted for twenty
minutes. The system was then depressurized and the oxidized tetralin was collected from the
pressure vessel using a needle valve and stored for the instrumental analyses. Acetone was used to
flush the reactor after each experiment followed by nitrogen flow to dry the system. Experiment
was repeated three times and liquid slugs and gas bubbles of different sizes were obtained.
Hydrodynamic parameters, mass transfer characteristics and oxygen availability were calculated
by taking ten different slugs and gas bubbles from each experiment. The liquid phase products
62
from each experiment was analyzed by a gas chromatograph and oxidative conversion and product
selectivity were calculated from the triplicate gas chromatographic analyses.
4.2.2.2 Oxidation in a Batch Reactor
The oxidation was performed in a batch reactor at different gas-liquid interfacial area (a)
to understand the effect of gas-liquid interfacial area (a) without two-phase velocity (UTP). A 25-
ml batch reactor (Figure 4.2) was used to conduct the experiments. The reactor, manufactured
from 316 standard stainless steel and Swagelok fittings and tubing, was equipped with a
thermocouple and a pressure gauge to monitor the operating temperature and pressure, respectively.
Four different amounts of tetralin (2, 5, 10 and 15 ml) were first charged into the batch reactor,
and then oxygen was introduced into the reactor to obtain four different gas-liquid interfacial areas
(a). The operating temperature and the operating pressure were at 150 °C and 191 kPa respectively.
The reactor was then submerged into a temperature controlled preheated sand-bath heater (Model:
FSB-3, Omega Engineering, Inc., USA) to control the oxidation temperature. Residence times
were 75 s, 100s and 135 s after reaching internal temperature within 1 °C of the heater temperature.
The heat-up time required to reach an internal temperature within 1 °C of the heater temperature
was six minutes. At the end of oxidation, the reactor was removed from sand bath heater and
allowed to cool for 10 minutes. The reactor surface was cleaned to remove the sand. The reactor
was then depressurized, and liquid oxidation products were collected for chromatographic analyses
to calculate oxidative conversion and product selectivity.
63
Figure 4.2: Batch reactor setup used in oxidation experiments
4.2.2.3 GC Analyses
An Agilent GC-FID (Agilent 7890A GC system) equipped with DB-5 MS column 30 m ×
0.25 mm × 0.25 µm column was used for quantitative analysis. The injector temperature of GC
was 250 °C and the split ratio was 10:1. Helium was used as a carrier gas which flowed through
column at a constant flowrate of 2 mL/min during the experiments. Oven temperature was varied
throughout the experiments. Initially, the oven temperature was 75 °C which was kept constant for
0.5 minutes and then temperature was raised from 75 °C to 325 °C at a rate of 20 °C/min, and
finally, the temperature was kept constant at 325 °C for 5 minutes. HPLC grade chloroform was
used for sample preparation and hexachlorobenzene was used as an internal standard.
Oxidation products were classified as primary (alcohol and ketones of tetralin), secondary
(products contain more than one ketone and/or alcohol functional groups) and addition products
(products contain at least a dimer having different functional groups).
PI
NV
Vent line
Thermocouple tip
TIC
Thermocouple tip
Reactor
Temperature controlled
fluidized sand bath heater
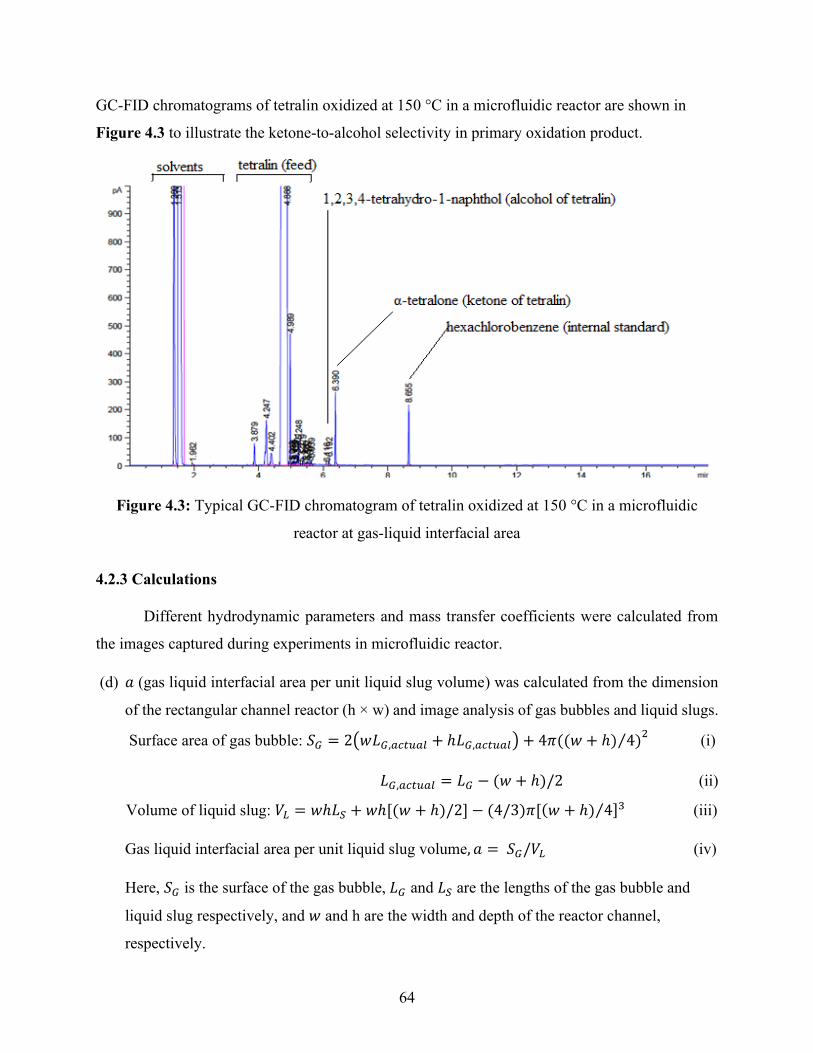
64
GC-FID chromatograms of tetralin oxidized at 150 °C in a microfluidic reactor are shown in
Figure 4.3 to illustrate the ketone-to-alcohol selectivity in primary oxidation product.
Figure 4.3: Typical GC-FID chromatogram of tetralin oxidized at 150 °C in a microfluidic
reactor at gas-liquid interfacial area
4.2.3 Calculations
Different hydrodynamic parameters and mass transfer coefficients were calculated from
the images captured during experiments in microfluidic reactor.
(d) 𝑎 (gas liquid interfacial area per unit liquid slug volume) was calculated from the dimension
of the rectangular channel reactor (h × w) and image analysis of gas bubbles and liquid slugs.
Surface area of gas bubble: 𝑆𝐺 = 2(𝑤𝐿𝐺,𝑎𝑐𝑡𝑢𝑎𝑙 + ℎ𝐿𝐺,𝑎𝑐𝑡𝑢𝑎𝑙) + 4𝜋((𝑤 + ℎ) 4)⁄ 2 (i)
𝐿𝐺,𝑎𝑐𝑡𝑢𝑎𝑙 = 𝐿𝐺 − (𝑤 + ℎ)/2 (ii)
Volume of liquid slug: 𝑉𝐿 = 𝑤ℎ𝐿𝑆 + 𝑤ℎ[(𝑤 + ℎ)/2] − (4/3)𝜋[(𝑤 + ℎ) 4⁄ ]3 (iii)
Gas liquid interfacial area per unit liquid slug volume, 𝑎 = 𝑆𝐺/𝑉𝐿 (iv)
Here, 𝑆𝐺 is the surface of the gas bubble, 𝐿𝐺 and 𝐿𝑆 are the lengths of the gas bubble and
liquid slug respectively, and 𝑤 and h are the width and depth of the reactor channel,
respectively.
65
Approximated radius of the cap of liquid slug, rcap= (𝑤 + ℎ)/4 (v)
Since geometry formed by the two liquid caps is not a complete sphere the approximation
was made.
(e) UL (superficial liquid slug velocity) and UG (gas bubble velocity) were calculated from the
distance travelled by the slug and bubble in a particular time. Two phase superficial velocity
(𝑈𝑇𝑃) was calculated as follows:
𝑈𝑇𝑃 = 휀𝐺𝑈𝐺 + (1 − 휀𝐺)𝑈𝐿 (vi)
Here, the volume fraction of gas bubble: 휀𝐺 =𝑉𝐺
𝑉𝐺+𝑉𝐿 (vii)
𝑉𝐿 is the volume of liquid slug was calculated according to equation (v).
𝑉𝐺 is the volume of gas bubble:
𝑉𝐺 = 𝑤ℎ𝐿𝐺,𝑎𝑐𝑡𝑢𝑎𝑙 + (4/3)𝜋((𝑤 + ℎ) 4)⁄ 2 (viii)
(f) Average residence time: The two-phase superficial velocity (𝑈𝑇𝑃) was divided by the reactor
length to calculate the average residence time.
(g) 𝛿 (liquid film thickness surrounding a gas bubble) by using the correlations provided by Yun
et al. (2010) for a rectangular microchannel reactor as follows [17]:
𝛿max
𝐷ℎ= 0.39 𝑊𝑒0.09 (ix)
𝛿min
𝐷ℎ= 0.02 𝑊𝑒0.62 (x)
Here, Weber number, 𝑊𝑒 =𝐷ℎ𝑈𝑇
2𝜌𝑙
𝜎𝑙 (xi)
Hydraulic diameter of the channel (m), 𝐷ℎ = 2[𝑤ℎ/(𝑤 + ℎ)] (xii)
𝛿max and 𝛿min are the maximum and minimum thicknesses of the liquid film (m),
respectively.
UTP (m/s) is the two-phase superficial gas velocity, 𝜌𝑙 is the density of liquid and 𝜎𝑙 is the
surface tension of liquid (N/m).
𝑤 and h are the width and depth of the reactor channel, respectively.
(h) 𝑘𝐿𝑎 (volumetric mass transfer coefficient, s-1) was calculated from 𝑘𝐿 and a. Film theory was
applied to calculate 𝑘𝐿 [5, 23] as follows:
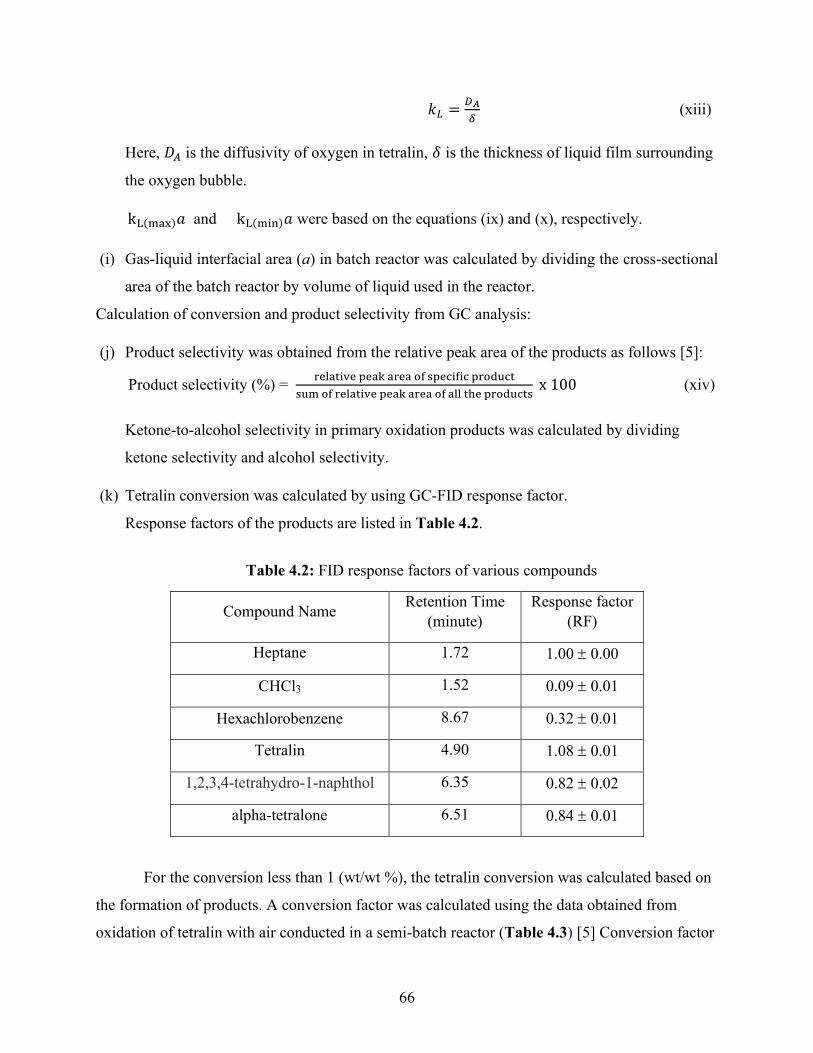
66
𝑘𝐿 =𝐷𝐴
𝛿 (xiii)
Here, 𝐷𝐴 is the diffusivity of oxygen in tetralin, 𝛿 is the thickness of liquid film surrounding
the oxygen bubble.
kL(max)𝑎 and kL(min)𝑎 were based on the equations (ix) and (x), respectively.
(i) Gas-liquid interfacial area (a) in batch reactor was calculated by dividing the cross-sectional
area of the batch reactor by volume of liquid used in the reactor.
Calculation of conversion and product selectivity from GC analysis:
(j) Product selectivity was obtained from the relative peak area of the products as follows [5]:
Product selectivity (%) = relative peak area of specific product
sum of relative peak area of all the products x 100 (xiv)
Ketone-to-alcohol selectivity in primary oxidation products was calculated by dividing
ketone selectivity and alcohol selectivity.
(k) Tetralin conversion was calculated by using GC-FID response factor.
Response factors of the products are listed in Table 4.2.
Table 4.2: FID response factors of various compounds
Compound Name Retention Time
(minute)
Response factor
(RF)
Heptane 1.72 1.00 0.00
CHCl3 1.52 0.09 0.01
Hexachlorobenzene 8.67 0.32 0.01
Tetralin 4.90 1.08 0.01
1,2,3,4-tetrahydro-1-naphthol 6.35 0.82 0.02
alpha-tetralone 6.51 0.84 0.01
For the conversion less than 1 (wt/wt %), the tetralin conversion was calculated based on
the formation of products. A conversion factor was calculated using the data obtained from
oxidation of tetralin with air conducted in a semi-batch reactor (Table 4.3) [5] Conversion factor
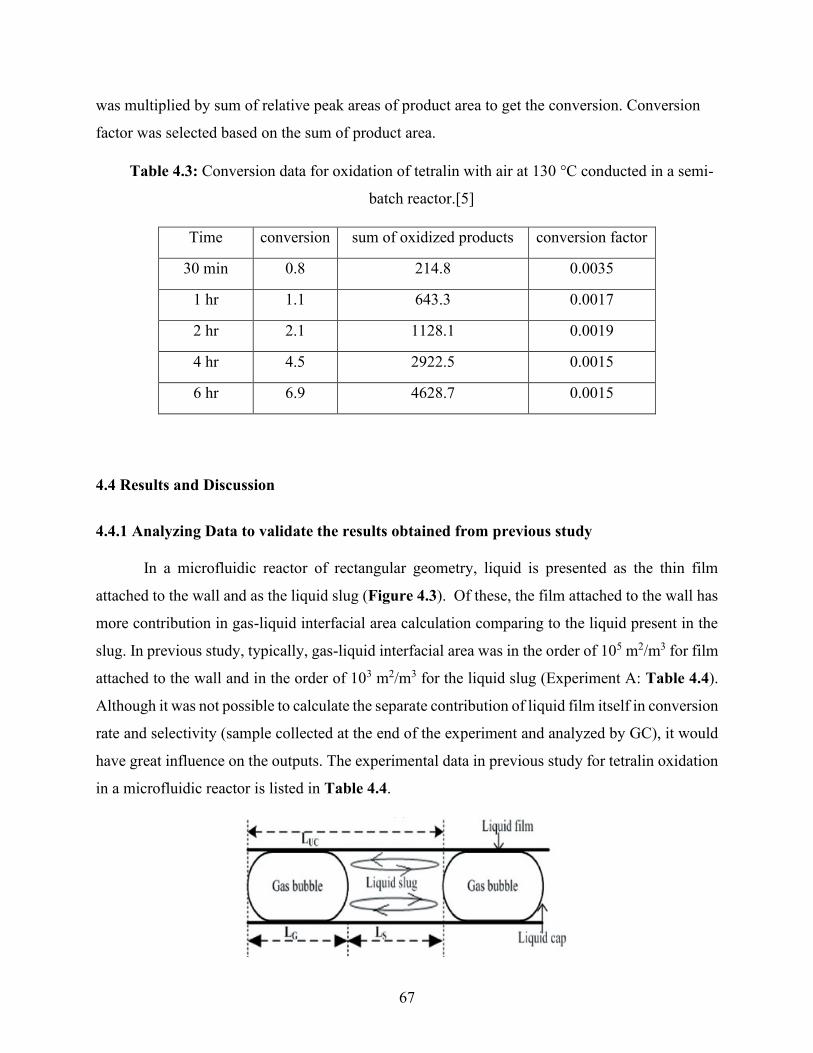
67
was multiplied by sum of relative peak areas of product area to get the conversion. Conversion
factor was selected based on the sum of product area.
Table 4.3: Conversion data for oxidation of tetralin with air at 130 °C conducted in a semi-
batch reactor.[5]
Time conversion sum of oxidized products conversion factor
30 min 0.8 214.8 0.0035
1 hr 1.1 643.3 0.0017
2 hr 2.1 1128.1 0.0019
4 hr 4.5 2922.5 0.0015
6 hr 6.9 4628.7 0.0015
4.4 Results and Discussion
4.4.1 Analyzing Data to validate the results obtained from previous study
In a microfluidic reactor of rectangular geometry, liquid is presented as the thin film
attached to the wall and as the liquid slug (Figure 4.3). Of these, the film attached to the wall has
more contribution in gas-liquid interfacial area calculation comparing to the liquid present in the
slug. In previous study, typically, gas-liquid interfacial area was in the order of 105 m2/m3 for film
attached to the wall and in the order of 103 m2/m3 for the liquid slug (Experiment A: Table 4.4).
Although it was not possible to calculate the separate contribution of liquid film itself in conversion
rate and selectivity (sample collected at the end of the experiment and analyzed by GC), it would
have great influence on the outputs. The experimental data in previous study for tetralin oxidation
in a microfluidic reactor is listed in Table 4.4.
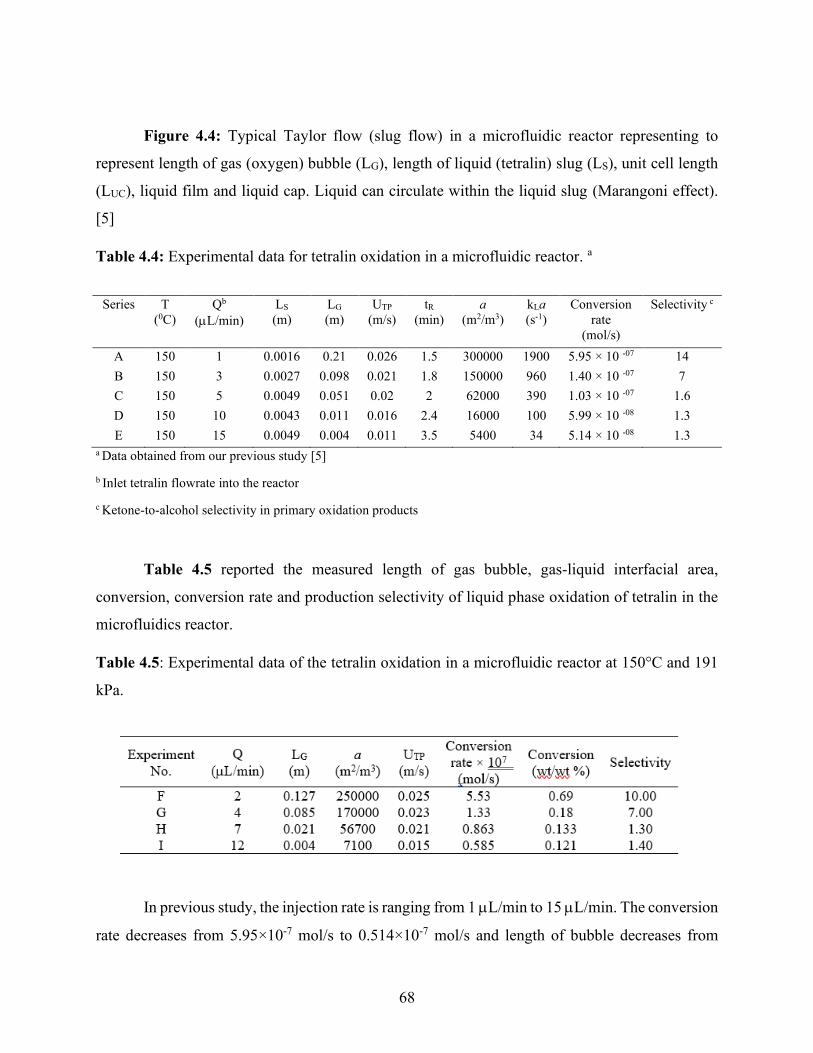
68
Figure 4.4: Typical Taylor flow (slug flow) in a microfluidic reactor representing to
represent length of gas (oxygen) bubble (LG), length of liquid (tetralin) slug (LS), unit cell length
(LUC), liquid film and liquid cap. Liquid can circulate within the liquid slug (Marangoni effect).
[5]
Table 4.4: Experimental data for tetralin oxidation in a microfluidic reactor. a
Series T
(0C)
Qb
(L/min)
LS
(m)
LG
(m)
UTP
(m/s)
tR
(min)
a
(m2/m3)
kLa
(s-1)
Conversion
rate
(mol/s)
Selectivity c
A 150 1 0.0016 0.21 0.026 1.5 300000 1900 5.95 × 10 -07 14
B 150 3 0.0027 0.098 0.021 1.8 150000 960 1.40 × 10 -07 7
C 150 5 0.0049 0.051 0.02 2 62000 390 1.03 × 10 -07 1.6
D 150 10 0.0043 0.011 0.016 2.4 16000 100 5.99 × 10 -08 1.3
E 150 15 0.0049 0.004 0.011 3.5 5400 34 5.14 × 10 -08 1.3
a Data obtained from our previous study [5]
b Inlet tetralin flowrate into the reactor
c Ketone-to-alcohol selectivity in primary oxidation products
Table 4.5 reported the measured length of gas bubble, gas-liquid interfacial area,
conversion, conversion rate and production selectivity of liquid phase oxidation of tetralin in the
microfluidics reactor.
Table 4.5: Experimental data of the tetralin oxidation in a microfluidic reactor at 150°C and 191
kPa.
In previous study, the injection rate is ranging from 1 L/min to 15 L/min. The conversion
rate decreases from 5.95×10⁻⁷ mol/s to 0.514×10⁻⁷ mol/s and length of bubble decreases from
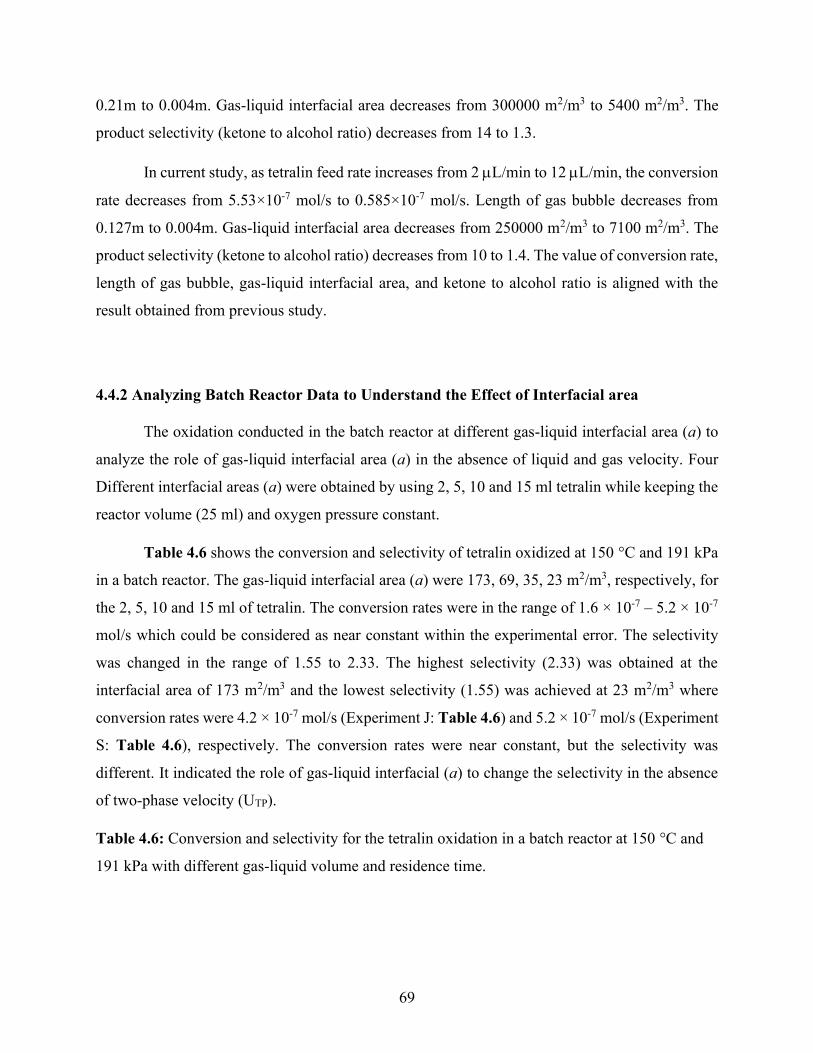
69
0.21m to 0.004m. Gas-liquid interfacial area decreases from 300000 m2/m3 to 5400 m2/m3. The
product selectivity (ketone to alcohol ratio) decreases from 14 to 1.3.
In current study, as tetralin feed rate increases from 2 L/min to 12 L/min, the conversion
rate decreases from 5.53×10⁻⁷ mol/s to 0.585×10⁻⁷ mol/s. Length of gas bubble decreases from
0.127m to 0.004m. Gas-liquid interfacial area decreases from 250000 m2/m3 to 7100 m2/m3. The
product selectivity (ketone to alcohol ratio) decreases from 10 to 1.4. The value of conversion rate,
length of gas bubble, gas-liquid interfacial area, and ketone to alcohol ratio is aligned with the
result obtained from previous study.
4.4.2 Analyzing Batch Reactor Data to Understand the Effect of Interfacial area
The oxidation conducted in the batch reactor at different gas-liquid interfacial area (a) to
analyze the role of gas-liquid interfacial area (a) in the absence of liquid and gas velocity. Four
Different interfacial areas (a) were obtained by using 2, 5, 10 and 15 ml tetralin while keeping the
reactor volume (25 ml) and oxygen pressure constant.
Table 4.6 shows the conversion and selectivity of tetralin oxidized at 150 °C and 191 kPa
in a batch reactor. The gas-liquid interfacial area (a) were 173, 69, 35, 23 m2/m3, respectively, for
the 2, 5, 10 and 15 ml of tetralin. The conversion rates were in the range of 1.6 × 10⁻⁷ ‒ 5.2 × 10⁻⁷
mol/s which could be considered as near constant within the experimental error. The selectivity
was changed in the range of 1.55 to 2.33. The highest selectivity (2.33) was obtained at the
interfacial area of 173 m2/m3 and the lowest selectivity (1.55) was achieved at 23 m2/m3 where
conversion rates were 4.2 × 10⁻⁷ mol/s (Experiment J: Table 4.6) and 5.2 × 10⁻⁷ mol/s (Experiment
S: Table 4.6), respectively. The conversion rates were near constant, but the selectivity was
different. It indicated the role of gas-liquid interfacial (a) to change the selectivity in the absence
of two-phase velocity (UTP).
Table 4.6: Conversion and selectivity for the tetralin oxidation in a batch reactor at 150 °C and
191 kPa with different gas-liquid volume and residence time.
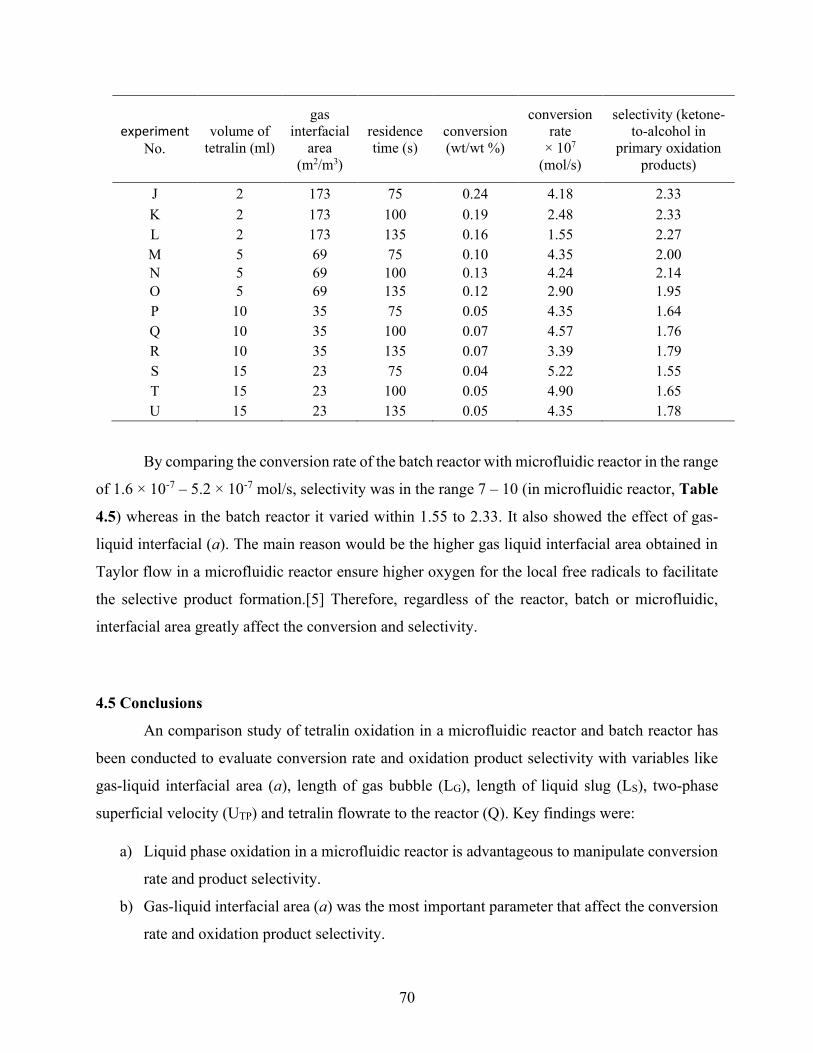
70
experiment No.
volume of
tetralin (ml)
gas
interfacial
area
(m2/m3)
residence
time (s)
conversion
(wt/wt %)
conversion
rate
× 107
(mol/s)
selectivity (ketone-
to-alcohol in
primary oxidation
products)
J 2 173 75 0.24 4.18 2.33
K 2 173 100 0.19 2.48 2.33
L 2 173 135 0.16 1.55 2.27
M 5 69 75 0.10 4.35 2.00
N 5 69 100 0.13 4.24 2.14
O 5 69 135 0.12 2.90 1.95
P 10 35 75 0.05 4.35 1.64
Q 10 35 100 0.07 4.57 1.76
R 10 35 135 0.07 3.39 1.79
S 15 23 75 0.04 5.22 1.55
T 15 23 100 0.05 4.90 1.65
U 15 23 135 0.05 4.35 1.78
By comparing the conversion rate of the batch reactor with microfluidic reactor in the range
of 1.6 × 10⁻⁷ ‒ 5.2 × 10⁻⁷ mol/s, selectivity was in the range 7 ‒ 10 (in microfluidic reactor, Table
4.5) whereas in the batch reactor it varied within 1.55 to 2.33. It also showed the effect of gas-
liquid interfacial (a). The main reason would be the higher gas liquid interfacial area obtained in
Taylor flow in a microfluidic reactor ensure higher oxygen for the local free radicals to facilitate
the selective product formation.[5] Therefore, regardless of the reactor, batch or microfluidic,
interfacial area greatly affect the conversion and selectivity.
4.5 Conclusions
An comparison study of tetralin oxidation in a microfluidic reactor and batch reactor has
been conducted to evaluate conversion rate and oxidation product selectivity with variables like
gas-liquid interfacial area (a), length of gas bubble (LG), length of liquid slug (LS), two-phase
superficial velocity (UTP) and tetralin flowrate to the reactor (Q). Key findings were:
a) Liquid phase oxidation in a microfluidic reactor is advantageous to manipulate conversion
rate and product selectivity.
b) Gas-liquid interfacial area (a) was the most important parameter that affect the conversion
rate and oxidation product selectivity.
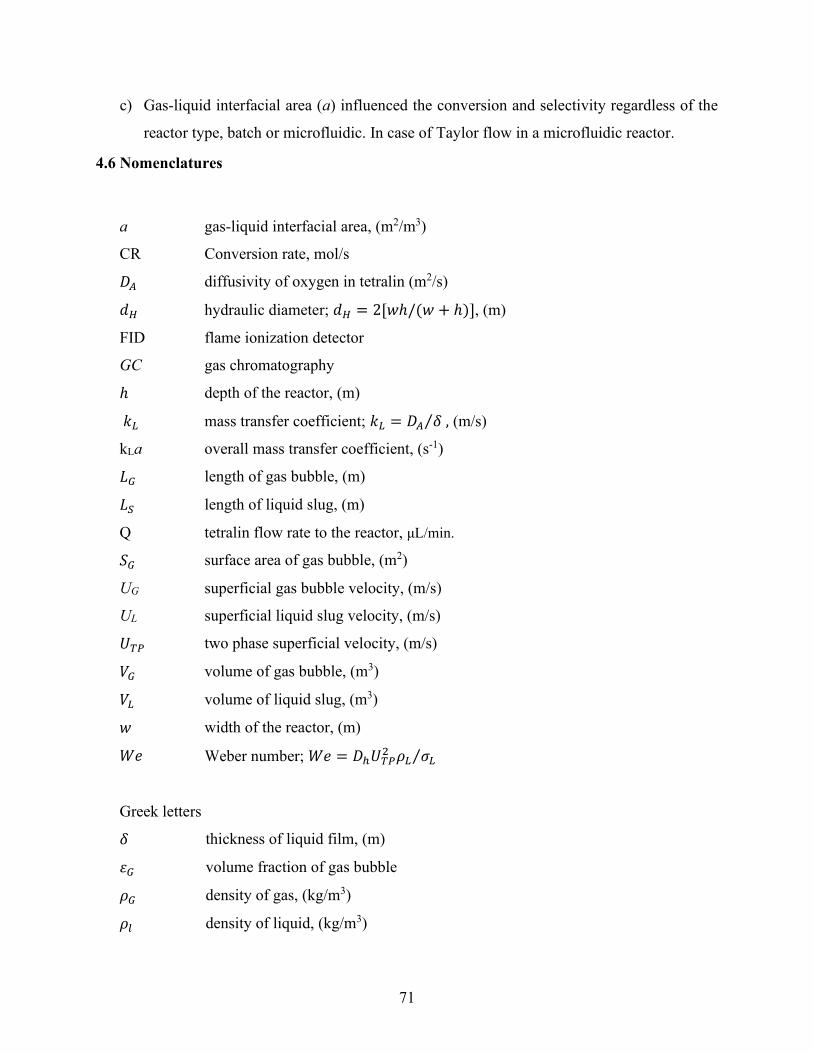
71
c) Gas-liquid interfacial area (a) influenced the conversion and selectivity regardless of the
reactor type, batch or microfluidic. In case of Taylor flow in a microfluidic reactor.
4.6 Nomenclatures
a gas-liquid interfacial area, (m2/m3)
CR Conversion rate, mol/s
𝐷𝐴 diffusivity of oxygen in tetralin (m2/s)
𝑑𝐻 hydraulic diameter; 𝑑𝐻 = 2[𝑤ℎ/(𝑤 + ℎ)], (m)
FID flame ionization detector
GC gas chromatography
ℎ depth of the reactor, (m)
𝑘𝐿 mass transfer coefficient; 𝑘𝐿 = 𝐷𝐴 𝛿 ,⁄ (m/s)
kLa overall mass transfer coefficient, (s-1)
𝐿𝐺 length of gas bubble, (m)
𝐿𝑆 length of liquid slug, (m)
Q tetralin flow rate to the reactor, μL/min.
𝑆𝐺 surface area of gas bubble, (m2)
UG superficial gas bubble velocity, (m/s)
UL superficial liquid slug velocity, (m/s)
𝑈𝑇𝑃 two phase superficial velocity, (m/s)
𝑉𝐺 volume of gas bubble, (m3)
𝑉𝐿 volume of liquid slug, (m3)
𝑤 width of the reactor, (m)
𝑊𝑒 Weber number; 𝑊𝑒 = 𝐷ℎ𝑈𝑇𝑃2 𝜌𝐿 𝜎𝐿⁄
Greek letters
𝛿 thickness of liquid film, (m)
휀𝐺 volume fraction of gas bubble
𝜌𝐺 density of gas, (kg/m3)
𝜌𝑙 density of liquid, (kg/m3)
72
G gas
L liquid
TP two-phase
4.7 Literature Cited
1. G. Centi, F. Cavani, F. Trifiro, Selective Oxidation by Heterogenous Catalysis, Kluwer/Plenum,
New York, 2001. doi:10.1007/s13398-014-0173-7.2.
2. A.K. Suresh, M.M. Sharma, T. Sridhar, Engineering aspects of industrial liquid-phase air
oxidation of hydrocarbons, Ind. Eng. Chem. Res. 39 (2000) 3958–3997. doi:10.1021/ie0002733.
3. M.G. Clerici, O.A. Kholdeeva, Liquid Phase Oxidation via Heterogeneous Catalysis, John
Wiley & Sons, Inc., Hoboken, New Jersey, 2013. doi:10.1002/9781118356760.
4. I. Hermans, J. Peeters, P.A. Jacobs, Autoxidation of hydrocarbons: From chemistry to catalysis,
Top. Catal. 50 (2008) 124–132. doi:10.1007/s11244-008-9099-7.
5. M.N. Siddiquee, A. de Klerk, N. Nazemifard, Application of microfluidics to control product
selectivity during non-catalytic oxidation of naphthenic-aromatic hydrocarbons, React. Chem. Eng.
1 (2016) 418–435. doi:10.1039/C6RE00010J.
6. A. De Klerk, Continuous-Mode Thermal Oxidation of Fischer-Tropsch Waxes, Ind. Eng. Chem.
Res. 42 (2003) 6545–6548. doi:10.1021/ie030293f.
7. V. Govindan, A.K. Suresh, Modeling liquid-phase cyclohexane oxidation, Ind. Eng. Chem. Res.
46 (2007) 6891–6898. doi:10.1021/ie070365t.
8. M.N. Siddiquee, A. de Klerk, In Situ Measurement of Liquid Phase Oxygen during Oxidation,
Ind. Eng. Chem. Res. 55 (2016) 6607–6618. doi:10.1021/acs.iecr.6b00949.
9. N.M. Emanuel, E. Denisov, Z.K. Maizus, Liquid-Phase Oxidation of Hydrocarbons, Plenum
Press, New York, 1967.
10. H.P.L. Gemoets, Y. Su, M. Shang, V. Hessel, R. Luque, T. Noël, Liquid phase oxidation 30
chemistry in continuous-flow microreactors, Chem. Soc. Rev. 45 (2016) 83–117.
doi:10.1039/C5CS00447K.
11. P. Sobieszuk, J. Aubin, R. Pohorecki, Hydrodynamics and mass transfer in gas-liquid flows in
microreactors, Chem. Eng. Technol. 35 (2012) 1346–1358. doi:10.1002/ceat.201100643.
12. A. Günther, S.A. Khan, M. Thalmann, F. Trachsel, K.F. Jensen, Transport and reaction in
microscale segmented gas–liquid flow, Lab Chip. 4 (2004) 278–286. doi:10.1039/B403982C.
73
13. K.A. Triplett, S.M. Ghiaasiaan, S.I. Abdel-Khalik, D.L. Sadowski, Gas–liquid two-phase flow
in microchannels Part I: two-phase flow patterns, Int. J. Multiph. Flow. 25 (1999) 377–394.
doi:10.1016/S0301-9322(98)00054-8.
14. C. Yao, Z. Dong, Y. Zhao, G. Chen, An online method to measure mass transfer of slug fl ow
in a microchannel, Chem. Eng. Sci. 112 (2014) 15–24. doi:10.1016/j.ces.2014.03.016.
15. J. Yue, L. Luo, Y. Gonthier, G. Chen, Q. Yuan, An experimental study of air – water Taylor
flow and mass transfer inside square microchannels, Chem. Eng. Sci. 64 (2009) 3697–3708.
doi:10.1016/j.ces.2009.05.026.
16. D.M. Fries, F. Trachsel, P.R. Von Rohr, International Journal of Multiphase Flow Segmented
gas – liquid flow characterization in rectangular microchannels, Int. J. Multiph. Flow. 34 (2008)
1108– 1118. doi:10.1016/j.ijmultiphaseflow.2008.07.002.
17. J. Yun, Q. Lei, S. Zhang, S. Shen, K. Yao, Slug flow characteristics of gas-miscible liquids in
a rectangular microchannel with cross and T-shaped junctions, Chem. Eng. Sci. 65 (2010) 5256–
5263. doi:10.1016/j.ces.2010.06.031.
18. R. Jevtic, P.A. Ramachandran, M.P. Dudukovic, Capillary reactor for cyclohexane oxidation
with oxygen, Chem. Eng. Res. Des. 88 (2010) 255–262. doi:10.1016/i.cherd.2009.12.008.
19. A. Leclerc, M. Alam, D. Schweich, P. Pouteau, C. De Bellefon, Gas – liquid selective
oxidations with oxygen under explosive conditions in a micro-structured reactor, Lab Chip. 8
(2008) 814– 817. doi:10.1039/b717985e.
20. J. Fischer, T. Lange, R. Boehling, A. Rehfinger, E. Klemm, Uncatalyzed selective oxidation
of liquid cyclohexane with air in a microcapillary reactor, Chem. Eng. Sci. 65 (2010) 4866–4872.
doi:10.1016/j.ces.2010.05.028.
21. L. Vanoye, A. Aloui, M. Pablos, R. Philippe, A. Percheron, A. Favre-Reguillon, C. De Bellefon,
A Safe and Efficient Flow Oxidation of Aldehydes with O 2, Org. Lett. 15 (2013) 5978–5981.
doi:10.1021/ol401273k.
22. M. Hamano, K.D. Nagy, K.F. Jensen, Continuous flow metal-free oxidation of picolines using
air, Chem. Commun. 48 (2012) 2086–2088. doi:10.1039/c2cc17123f. [23] X. Yan, S. Xiaogang,
Simple Linear Regression, in: Linear Regres. Anal. Theory Comput., World Scientific, 2009: pp.
9–39.
23. Gemoets HPL, Su Y, Shang M, Hessel V, Luque R, Noël T (2016) Liquid phase oxidation
chemistry in continuous flow microreactor. Chem Soc Rev 45:83–117.
74
Chapter 5: Conclusion
5.1 Introduction
Liquid phase oxidation is an industrially important process to produce many chemicals, for
instance, petrochemicals and pharmaceuticals. However, the key challenge of this free radical
oxidation process involving initiation, propagation, and termination is to control the product
selectivity. Currently, the industry follows a low-conversion process to control the selectivity.
Microfluidic reactors have the advantage of improved heat and mass transfer due to the higher
surface area-to-volume ratio, better mixing because of small radial diffusion and internal
circulation in liquid slug in case of Taylor flow, well-defined flow properties, exact control of gas-
liquid ratio and enhanced safety for using pure oxygen. All these characteristics make the
microfluidic reactors suitable for the study of liquid phase oxidation. The focus of the thesis is to
study the role of oxygen availability, to compare the microfluidic reactor performance with semi-
batch reactor, to study the effect of microfluidic reactor configuration (size and shape) and to study
the effect of temperature on liquid phase oxidation of naphthenic-aromatic hydrocarbon. The
understanding from the study can be applied in design and operation of industrial units to control
the conversion and product selectivity of a complex free radical system.
5.2 Significance, Major Conclusions and Key Insights
The important conclusions derived from the research in the thesis are provided as following.
(a) Liquid phase oxidation in a microfluidic reactor is advantageous to manipulate conversion
rate and product selectivity.
(b) Reactor dimensions and volume changed the reactor hydrodynamics and influenced the
oxygen availability in different ways and affected the conversion and product selectivity
differently. It was observed that reactor with smaller size had higher oxidation conversion
and suppressed the addition product selectivity, whereas large reactor had moderate
conversion and enhanced ketone-to-alcohol product selectivity.
75
(c) The most important parameter that ensured oxygen availability was the gas-liquid
interfacial area. The contributor to get higher oxygen availability could either be smaller
reactor dimension and volume or increased length of the liquid film surrounding the gas
bubble.
(d) The oxygen availability increased the concentration of oxygen centered free radical (RO ֗
or ROO֗) and produced more oxygen containing functional groups, and decreased the
concentration of stable carbon centered free radical (R ֗ ) of naphthenic-aromatic
compounds. It reduced the risk of addition product formation via hydrogen disproportion.
The higher ketone formation over alcohol was due to the reaction of oxygen with oxygen
center free radicals (RO֗ or ROO֗ ) and/or with alcohol (R-OH) formed during the oxidation.
(e) Gas-liquid interfacial area influenced the oxidation conversion and selectivity regardless
of the reactor type, semi-batch or microfluidic.
(f) The study demonstrated how engineering could be used to control the chemistry. The
understanding from the study could be used in design and operation of liquid phase
oxidation to produce fine chemicals and pharmaceuticals.
5.3 Future Work
A list of suggestions of future work are provided here for further research in the field.
• Direct measurement of hydrodynamic properties during liquid phase oxidation in a
microfluidic reactor. Current research, as observed in Chapter 3 and Chapter 4, shows a
significant impact of gas-liquid interfacial on oxidation product conversion and selectivity.
However, the correlation used to calculate the hydrodynamic properties such as thin film
thickness and gas-liquid interfacial area introduce large error bars. Therefore, it is
suggested to achieve direct measurement of those properties using high-resolution
microscope or in-channel sensor to improve measurement accuracy.
• Effect of oxygenate on liquid phase naphthenic-aromatic hydrocarbon oxidation.
Oxygenate such as ketone and alcohol could be produced as intermediate or final products
according to specific reaction path. This work would help understand how different
concentrations of oxygenate could impact the reaction path, oxidation product conversion,
and selectivity.
76
• Effect of changing surface wettability of reactor channel from hydrophilic to hydrophobic.
Current research uses glass microfluidic reactors to conduct liquid phase hydrocarbon
oxidation. Liquid hydrocarbon flows near the channel wall surrounding the oxygen bubble.
Changing the surface wettability would change the gas-liquid interfacial and thus impact
the product conversion and selectivity. Polydimethylsiloxane (PDMS) reactor could be
used to understand the wettability effect on liquid phase hydrocarbon oxidation.
• Investigation on oxidation of diluted bitumen using microfluidic reactor. In the study of
indan oxidation in a microfluidic reactor, it shows that microfluidic reactor has the potential
to control product selectivity while surpassing formation of addition product. Due to the
complex nature of bitumen, oxidation product of bitumen is usually composed of wide
range of products. The additional work would provide understanding of how microfluidic
reactor could help improve oxidation product selectivity of bitumen while minimizing
unwanted addition product. The high viscosity bitumen should be diluted with toluene or
benzene to allow flows in a microfluidic reactor.
5.4 Publications and Presentations
A list of publications and presentations provided in the following is related to the work
done in the current research.
1. Siddiquee M. N., Sivaramakrishnan K., Wu Y., De Klerk. A and Nazemifard N. A statistical
approach dealing with multicollinearity among predictors in microfluidic reactor operation to
control liquid-phase oxidation selectivity. React. Chem. Eng., 2018, 3, 972-990.
2. Wu Y., Siddiquee M. N., De Klerk. A and Nazemifard N. Microfluidics to investigate
temperature effect on liquid phase oxidation of naphthenic-aromatic hydrocarbons. [Presented at
the 68th Canadian Chemical Engineering Conference (CSChE), 2018, Toronto, ON, Canada]
3. Siddiquee M. N., Wu Y., and Nazemifard N. Comparative study of liquid-phase autoxidation
of indan in microfluidic reactors. The 23rd International Conference on Miniaturized Systems for
Chemistry and Life Sciences (MicroTAS), 2019, Basel, Switzerland. (Poster)

77
4. Siddiquee M. N., Wu Y., De Klerk. A and Nazemifard N. The impact of microfluidic reactor
configuration on hydrodynamics, conversion, and selectivity during indan oxidation. (Accepted by
Journal of Flow Chemistry)
78
Bibliography
• Gemoets HPL, Su Y, Shang M, Hessel V, Luque R, Noël T (2016) Liquid phase oxidation
chemistry in continuous flow microreactor. Chem Soc Rev 45:83–117.
• Hone CA, Kappe CO (2019) The Use of Molecular Oxygen for Liquid Phase Aerobic
Oxidations in Continuous Flow. Top Curr Chem 2: 377.
• Vanoye L, Aloui A, Pablos M, Philippe R, Percheron A, Favre-Réguillon A, de Bellefon C
(2013) A safe and efficient flow oxidation of aldehydes with O2. Org Lett 15:5978–5981.
• Siddiquee MN, Sivaramakrishnan K, Wu Y, De Klerk A, Nazemifard N (2018) A statistical
approach dealing with multicollinearity among predictors in microfluidic reactor operation to
control liquid-phase oxidation selectivity. React Chem Eng 3:972–990.
• Sharma S, Yaminia, Das P (2019) Hydrogenation of nitroarenes to anilines in a flow reactor
using polystyrene supported rhodium in a catalyst-cartridge. (Cart-Rh@PS) New J Chem 43:
1764–1769.
• Ifran M, Glasnov TN, Kappe CO (2011) Heterogeneous catalytic hydrogenation reactions in
continuous-flow reactors. Chem Sus Chem 4, 300 – 316.
• Cantillo, D, Kappe, CO (2017) Halogenation of organic compounds using continuous flow and
microreactor technology. React Chem Eng 2:7–19.
• Karande R, Schmid A, Buehler K (2016) Applications of Multiphasic Microreactors for
Biocatalytic Reactions. Org Process Res Dev 20:361-370.
• L. Kiwi-Minsker and A. Renken, Microstructured reactors for catalytic reactions, Catal. Today,
2005, 110, 2–14.
• J. J. Lerou, A. L. Tonkovich, L. Silva, S. Perry and J. McDaniel, Microchannel reactor
architecture enables greener processes, Chem. Eng. Sci. 2010, 65, 380–385.
• D. Wilms, J. Klos and H. Frey, Microstructured reactors for polymer synthesis: a renaissance
of continuous flow processes for Tailor-Made macromolecules? Macromol. Chem. Phys., 2008,
209, 343–356.
• G. Chen, Q. Yuan, H. Li and S. Li, CO selective oxidation in a microchannel reactor for PEM
fuel cell, Chem. Eng. J., 2004, 101, 101–106.
• Suresh AK, Sharma MM, Sridhar T (2000) Engineering aspects of industrial liquid-phase air
oxidation of hydrocarbon. Ind Eng Chem Res 39:3958–3997.
79
• De Klerk A (2003) Continuous- mode thermal oxidation of Fischer-Tropsch waxes. Ind Eng
Chem Res 42:6545–6548.
• Siddiquee MN, De Klerk A (2016) In situ measurement of liquid Phase oxygen during
oxidation. Ind Eng Chem Res 55:6607–6618.
• Dimitratos N, Lopez-Sanchez JA, Hutchings GJ (2014) Supported metal nanoparticles in
liquid-phase oxidation reactions. In: Duprez D, Cavani F (Eds) Handbook of Advanced
Methods and Processes in Oxidation Catalysis: From Laboratory to Industry, Imperial College
Press, London 631–678.
• Snead DR, Jamison TF (2015) A three-minute synthesis and purification of ibuprofen: pushing
the limits of continuous-flow processing. Angew Chem Int Ed 54:1521–3773.
• Gutmann B, Cantillo D, Kappe CO (2015) Continuous-flow technology—A tool for the safe
manufacturing of active pharmaceutical ingredients Angew Chem Int Ed 54:6688–6729.
• C. D. Pina, E. Falletta and M. Rossi, Liquid phase oxidation of organic compounds by
supported metal-based catalysts with a focus on gold. In Liquid Phase Oxidation via
Heterogeneous Catalysis: Organic Synthesis and Industrial Applications, First Edition; M. G.
Clerici and O. A. Kholdeeva, Eds.; Wiley: Hoboken, 2013, 221–262.
• G. Centi and S. Perathoner, Selective oxidation— industrial. In Encyclopedia of Catalysis;
Wiley, 2002.
• Hermans, J. Peeters and P. A. Jacobs, Autoxidation of Hydrocarbons: From Chemistry to
Catalysis, Top Catal. 2008, 50, 124–132.
• N. M. Sánchez and A. de Klerk, Autoxidation of aromatics, App. Petro. Res., 2018, 8, 55–78.
• M. N. Siddiquee, A. de Klerk and N. Nazemifard, Application of microfluidics to enhance
gas-liquid mass transfer during selective oxidation of hydrocarbons. React. Chem. Eng., 2016,
1, 418–435.
• N. M. Emanuel, E. T. Denisov, and Z. K. Maizus, Liquidphase oxidation of hydrocarbons;
Plenum Press: New York, 1967.
• de Klerk, Continuous- mode thermal oxidation of Fischer-Tropsch waxes, Ind. Eng. Chem.
Res., 2003, 42, 6545–6548.
• P. V. Danckwerts, Gas-Liquid Reactions; McGraw-Hill: New York, 1970.
80
• F. Kaštánek, J. Zaharadnǐk, J. Kratochvǐl and J. Čermák, Chemical Reactors for Gas-Liquid
Systems, 1st ed.; Ellis Horwood: West Sussex, 1993.
• E. L. Cussler. Diffusion: Mass Transfer in Fluid Systems, 3rd ed.; Cambridge University Press:
Cambridge, 2009.
• L. K. Doraiswamy and D. Üner, Chemical Reaction Engineering, Beyond the Fundamentals;
CRC Press: Boca Raton, 2014.
• K. Suresh, T. Sridhar and O. E. Potter, Autocatalytic oxidation of cyclohexane− mass transfer
and chemical reaction. AIChE J., 1988, 34(1), 81–93.
• M. N. Siddiquee, K. Sivaramakrishnan, Y. Wu, A. de Klerk and N. Nazemifard, A statistical
approach dealing with multicollinearity among predictors in microfluidic reactor operation to
control liquid-phase oxidation selectivity. React. Chem. Eng., 2018, 3,972–990.
• P. Tabeling, Introduction to Microfluidics. Oxford, U.K., OUP Oxford, 2005.
• K. F. Jensen, "Silicon-based microchemical systems: Characteristics and applications." Mrs
Bulletin 31(2): 101-107, 2006.
• G. M. Whitesides, E. Ostuni, S. Takayama, X. Jiang and D. E. Ingber. "Soft Lithography in
Biology and Biochemistry." Annual Review of Biomedical Engineering 3(1): 335-373, 2001.
• R. Gupta, D. F. Fletcher and B. S. Haynes, "Taylor Flow in Microchannels: A Review of
Experimental and Computational Work." The Journal of Computational Multiphase Flows 2(1):
1-31, 2010.
• K. A. Triplett, S. M. Ghiaasiaan, S. I. Abdel-Khalik and D. L. Sadowski, "Gas-liquid two-
phase flow in microchannels part I: Two-phase flow patterns." International Journal of
Multiphase Flow 25(3): 377-394, 1999.
• H. Song, J. D. Tice and R. F. Ismagilov, "A Microfluidic System for Controlling Reaction
Networks in Time." Angewandte Chemie International Edition 42(7): 768-772, 2003.
• R. Jevtic, P. A. Ramachandran and M. P. Dudukovic. Capillary reactor for cyclohexane
oxidation with oxygen, Chem. Eng. Res. Des., 2010, 88, 255–62.
• U. Neuenschwander and K. F. Jensen, Olefin autoxidation in flow, Ind. Eng. Chem. Res., 2014,
53(2), 601–608.
• Gemoets HPL, Su Y, Shang M, Hessel V, Luque R, Noël T (2016) Liquid phase oxidation
chemistry in continuous flow microreactor. Chem Soc Rev 45:83–117.
81
• Hone CA, Kappe CO (2019) The Use of Molecular Oxygen for Liquid Phase Aerobic
Oxidations in Continuous Flow. Top Curr Chem 2: 377.
• Vanoye L, Aloui A, Pablos M, Philippe R, Percheron A, Favre-Réguillon A, de Bellefon C
(2013) A safe and efficient flow oxidation of aldehydes with O2. Org Lett 15:5978–5981.
• Siddiquee MN, Sivaramakrishnan K, Wu Y, De Klerk A, Nazemifard N (2018) A statistical
approach dealing with multicollinearity among predictors in microfluidic reactor operation to
control liquid-phase oxidation selectivity. React Chem Eng 3:972–990.
• Sharma S, Yaminia, Das P (2019) Hydrogenation of nitroarenes to anilines in a flow reactor
using polystyrene supported rhodium in a catalyst-cartridge. (Cart-Rh@PS) New J Chem 43:
1764–1769.
• Ifran M, Glasnov TN, Kappe CO (2011) Heterogeneous catalytic hydrogenation reactions in
continuous-flow reactors. Chem Sus Chem 4, 300 – 316.
• Cantillo, D, Kappe, CO (2017) Halogenation of organic compounds using continuous flow and
microreactor technology. React Chem Eng 2:7–19.
• Karande R, Schmid A, Buehler K (2016) Applications of Multiphasic Microreactors for
Biocatalytic Reactions. Org Process Res Dev 20:361-370.
• Siddiquee MN, De Klerk A, Nazemifard N (2016) Application of microfluidics to enhance
gas-liquid mass transfer during selective oxidation of hydrocarbons. React Chem Eng 1:418–
435.
• Hartman RL, McMullen JP, Jensen KF (2011) Deciding whether to go with the flow –
evaluating the merits of flow reactors for synthesis. Angew Chemie Int Ed 50:7502–7519.
• Leclerc A, Alame M, Schweich D, Pouteau P, Delattreb C, de Bellefon C (2008) Gas–liquid
selective oxidations with oxygen under explosive conditions in a micro-structured reactor. Lab
Chip 8:814–817.
• Suresh AK, Sharma MM, Sridhar T (2000) Engineering aspects of industrial liquid-phase air
oxidation of hydrocarbon. Ind Eng Chem Res 39:3958–3997.
• De Klerk A (2003) Continuous- mode thermal oxidation of Fischer-Tropsch waxes. Ind Eng
Chem Res 42:6545–6548.
• Siddiquee MN, De Klerk A (2016) In situ measurement of liquid Phase oxygen during
oxidation. Ind Eng Chem Res 55:6607–6618.
82
• Dimitratos N, Lopez-Sanchez JA, Hutchings GJ (2014) Supported metal nanoparticles in
liquid-phase oxidation reactions. In: Duprez D, Cavani F (Eds) Handbook of Advanced
Methods and Processes in Oxidation Catalysis: From Laboratory to Industry, Imperial College
Press, London 631–678.
• Snead DR, Jamison TF (2015) A three-minute synthesis and purification of ibuprofen: pushing
the limits of continuous-flow processing. Angew Chem Int Ed 54:1521–3773.
• Gutmann B, Cantillo D, Kappe CO (2015) Continuous-flow technology—A tool for the safe
manufacturing of active pharmaceutical ingredients Angew Chem Int Ed 54:6688–6729.
• Hobbs CC, Drew EH, Van’t Hof HA, Mesich FG, Onore MJ (1972) Mass transfer rate-
limitation effects in liquid-phase oxidation. Ind Eng Chem Prod Res Develop 11:220–225.
• Siddiquee MN, De Klerk A (2014) Hydrocarbon addition reactions during low temperature
autoxidation of oilsands bitumen. Energy Fuels 28:6848–6859.
• Siddiquee MN, De Klerk A (2015) Heterocyclic addition reactions during low temperature
autoxidation. Energy Fuels 29:4236–4244.
• Yun J, Lei Q, Zhang S, Shen S, Yao K (2010) Slug flow characteristics of gas-miscible
liquids in a rectangular microchannel with cross and T-shaped junctions. Chem Eng Sci
65:5256–5263.
• Emanuel MN, Denisov ET, Maizus ZK (1967) Liquid-phase oxidation of hydrocarbons.
Plenum Press, New York.
• Sheldon RA, Kochi JK (1981) Metal-Catalyzed Oxidations of Organic Compounds. Academic
Press, New York.
• Twigg GH (1954) The mechanism of liquid-phase oxidation. Chem Eng Sci Suppl 8:5–16.
• Jiayu L, Wanghua C, Liping C, Yingtao T, Xin S (2012) Thermal decomposition analysis and
safety study on di-tert-butyl peroxide. Procedia Eng 43:312–317.
• Tolman CA, Druliner JD, Nappa MJ, Herron N (1989) Alkane oxidation studies in du Pont’s
central research department. In: Hill CL (ed) Activation and Functionalization of Alkanes,
Wiley, New York.
• Dietz WA (1967) Response factors for gas chromatographic analyses. J Chromatogr Sci 5: 68-
71.
• Diaz M, Vega A, Coca J (1987) Correlation for the estimation of gas-liquid diffusivity. Chem
Eng Com 52: 271-281.
83
• Vandu CO, Liu H, Krishna R (2005) Mass transfer from Taylor bubbles rising in single
capillaries. Chem Eng Sci 60: 6430-6437.
• G. Centi, F. Cavani, F. Trifiro, Selective Oxidation by Heterogenous Catalysis,
Kluwer/Plenum, New York, 2001. doi:10.1007/s13398-014-0173-7.2.
• A.K. Suresh, M.M. Sharma, T. Sridhar, Engineering aspects of industrial liquid-phase air
oxidation of hydrocarbons, Ind. Eng. Chem. Res. 39 (2000) 3958–3997.
doi:10.1021/ie0002733.
• M.G. Clerici, O.A. Kholdeeva, Liquid Phase Oxidation via Heterogeneous Catalysis, John
Wiley & Sons, Inc., Hoboken, New Jersey, 2013. doi:10.1002/9781118356760.
• Hermans, J. Peeters, P.A. Jacobs, Autoxidation of hydrocarbons: From chemistry to catalysis,
Top. Catal. 50 (2008) 124–132. doi:10.1007/s11244-008-9099-7.
• M.N. Siddiquee, A. de Klerk, N. Nazemifard, Application of microfluidics to control product
selectivity during non-catalytic oxidation of naphthenic-aromatic hydrocarbons, React. Chem.
Eng. 1 (2016) 418–435. doi:10.1039/C6RE00010J.
• De Klerk, Continuous-Mode Thermal Oxidation of Fischer-Tropsch Waxes, Ind. Eng. Chem.
Res. 42 (2003) 6545–6548. doi:10.1021/ie030293f.
• V. Govindan, A.K. Suresh, Modeling liquid-phase cyclohexane oxidation, Ind. Eng. Chem.
Res. 46 (2007) 6891–6898. doi:10.1021/ie070365t.
• M.N. Siddiquee, A. de Klerk, In Situ Measurement of Liquid Phase Oxygen during Oxidation,
Ind. Eng. Chem. Res. 55 (2016) 6607–6618. doi:10.1021/acs.iecr.6b00949.
• N.M. Emanuel, E. Denisov, Z.K. Maizus, Liquid-Phase Oxidation of Hydrocarbons, Plenum
Press, New York, 1967.
• H.P.L. Gemoets, Y. Su, M. Shang, V. Hessel, R. Luque, T. Noël, Liquid phase oxidation 30
chemistry in continuous-flow microreactors, Chem. Soc. Rev. 45 (2016) 83–117.
doi:10.1039/C5CS00447K.
• P. Sobieszuk, J. Aubin, R. Pohorecki, Hydrodynamics and mass transfer in gas-liquid flows in
microreactors, Chem. Eng. Technol. 35 (2012) 1346–1358. doi:10.1002/ceat.201100643.
• Günther, S.A. Khan, M. Thalmann, F. Trachsel, K.F. Jensen, Transport and reaction in
microscale segmented gas–liquid flow, Lab Chip. 4 (2004) 278–286. doi:10.1039/B403982C.
84
• K.A. Triplett, S.M. Ghiaasiaan, S.I. Abdel-Khalik, D.L. Sadowski, Gas–liquid two-phase flow
in microchannels Part I: two-phase flow patterns, Int. J. Multiph. Flow. 25 (1999) 377–394.
doi:10.1016/S0301-9322(98)00054-8.
• Yao, Z. Dong, Y. Zhao, G. Chen, An online method to measure mass transfer of slug fl ow in
a microchannel, Chem. Eng. Sci. 112 (2014) 15–24. doi:10.1016/j.ces.2014.03.016.
• J. Yue, L. Luo, Y. Gonthier, G. Chen, Q. Yuan, An experimental study of air – water Taylor
flow and mass transfer inside square microchannels, Chem. Eng. Sci. 64 (2009) 3697–3708.
doi:10.1016/j.ces.2009.05.026.
• D.M. Fries, F. Trachsel, P.R. Von Rohr, International Journal of Multiphase Flow Segmented
gas – liquid flow characterization in rectangular microchannels, Int. J. Multiph. Flow. 34 (2008)
1108– 1118. doi:10.1016/j.ijmultiphaseflow.2008.07.002.
• J. Yun, Q. Lei, S. Zhang, S. Shen, K. Yao, Slug flow characteristics of gas-miscible liquids in
a rectangular microchannel with cross and T-shaped junctions, Chem. Eng. Sci. 65 (2010)
5256– 5263. doi:10.1016/j.ces.2010.06.031.
• R. Jevtic, P.A. Ramachandran, M.P. Dudukovic, Capillary reactor for cyclohexane oxidation
with oxygen, Chem. Eng. Res. Des. 88 (2010) 255–262. doi:10.1016/i.cherd.2009.12.008.
• Leclerc, M. Alam, D. Schweich, P. Pouteau, C. De Bellefon, Gas – liquid selective oxidations
with oxygen under explosive conditions in a micro-structured reactor, Lab Chip. 8 (2008) 814–
817. doi:10.1039/b717985e.
• J. Fischer, T. Lange, R. Boehling, A. Rehfinger, E. Klemm, Uncatalyzed selective oxidation
of liquid cyclohexane with air in a microcapillary reactor, Chem. Eng. Sci. 65 (2010) 4866–
4872. doi:10.1016/j.ces.2010.05.028.
• L. Vanoye, A. Aloui, M. Pablos, R. Philippe, A. Percheron, A. Favre-Reguillon, C. De Bellefon,
A Safe and Efficient Flow Oxidation of Aldehydes with O 2, Org. Lett. 15 (2013) 5978–5981.
doi:10.1021/ol401273k.
• M. Hamano, K.D. Nagy, K.F. Jensen, Continuous flow metal-free oxidation of picolines using
air, Chem. Commun. 48 (2012) 2086–2088. doi:10.1039/c2cc17123f. [23] X. Yan, S.
Xiaogang, Simple Linear Regression, in: Linear Regres. Anal. Theory Comput., World
Scientific, 2009: pp. 9–39.
• Gemoets HPL, Su Y, Shang M, Hessel V, Luque R, Noël T (2016) Liquid phase oxidation
chemistry in continuous flow microreactor. Chem Soc Rev 45:83–117.
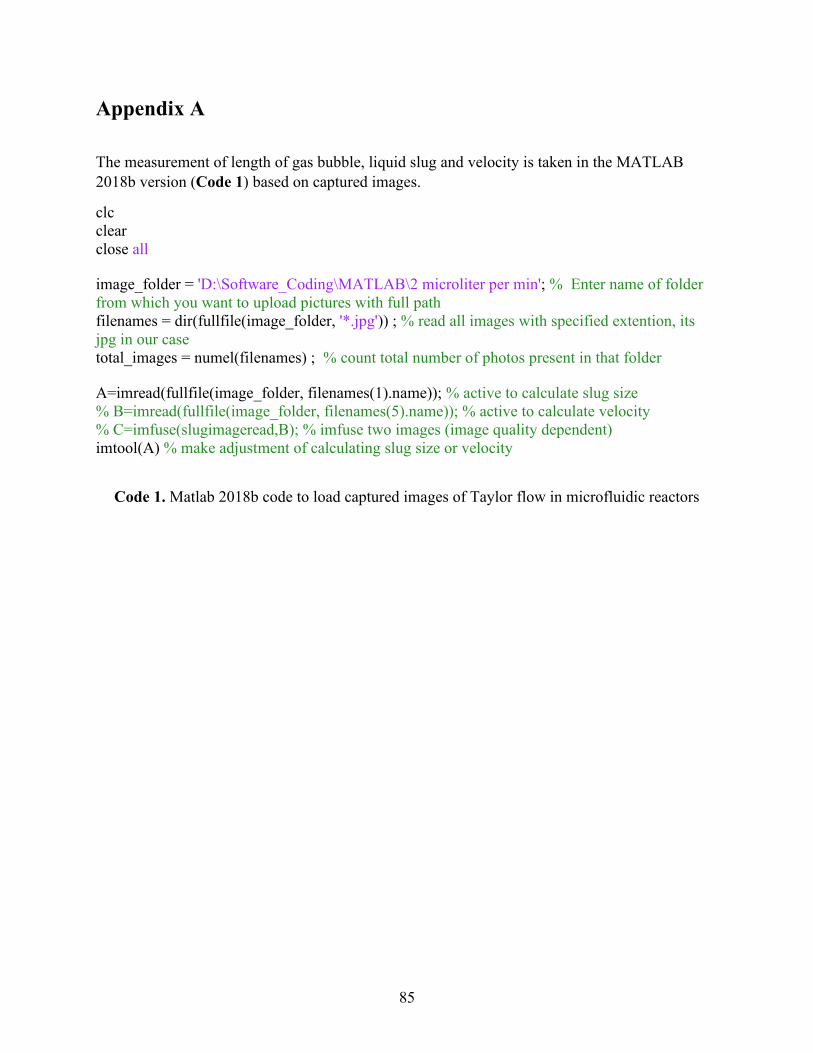
85
Appendix A
The measurement of length of gas bubble, liquid slug and velocity is taken in the MATLAB
2018b version (Code 1) based on captured images.
clc
clear
close all image_folder = 'D:\Software_Coding\MATLAB\2 microliter per min'; % Enter name of folder
from which you want to upload pictures with full path
filenames = dir(fullfile(image_folder, '*.jpg')) ; % read all images with specified extention, its
jpg in our case
total_images = numel(filenames) ; % count total number of photos present in that folder
A=imread(fullfile(image_folder, filenames(1).name)); % active to calculate slug size
% B=imread(fullfile(image_folder, filenames(5).name)); % active to calculate velocity
% C=imfuse(slugimageread,B); % imfuse two images (image quality dependent)
imtool(A) % make adjustment of calculating slug size or velocity
Code 1. Matlab 2018b code to load captured images of Taylor flow in microfluidic reactors
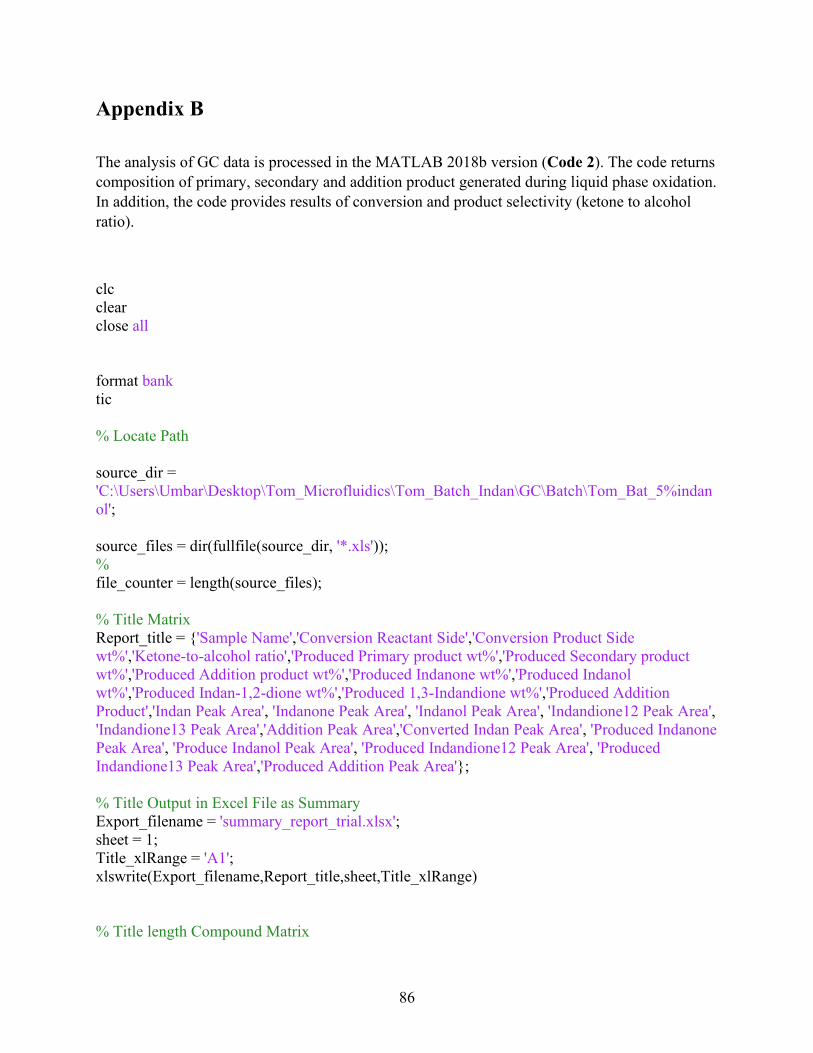
86
Appendix B
The analysis of GC data is processed in the MATLAB 2018b version (Code 2). The code returns
composition of primary, secondary and addition product generated during liquid phase oxidation.
In addition, the code provides results of conversion and product selectivity (ketone to alcohol
ratio).
clc
clear
close all
format bank
tic
% Locate Path
source_dir =
'C:\Users\Umbar\Desktop\Tom_Microfluidics\Tom_Batch_Indan\GC\Batch\Tom_Bat_5%indan
ol';
source_files = dir(fullfile(source_dir, '*.xls'));
%
file_counter = length(source_files);
% Title Matrix
Report_title = {'Sample Name','Conversion Reactant Side','Conversion Product Side
wt%','Ketone-to-alcohol ratio','Produced Primary product wt%','Produced Secondary product
wt%','Produced Addition product wt%','Produced Indanone wt%','Produced Indanol
wt%','Produced Indan-1,2-dione wt%','Produced 1,3-Indandione wt%','Produced Addition
Product','Indan Peak Area', 'Indanone Peak Area', 'Indanol Peak Area', 'Indandione12 Peak Area',
'Indandione13 Peak Area','Addition Peak Area','Converted Indan Peak Area', 'Produced Indanone
Peak Area', 'Produce Indanol Peak Area', 'Produced Indandione12 Peak Area', 'Produced
Indandione13 Peak Area','Produced Addition Peak Area'};
% Title Output in Excel File as Summary
Export_filename = 'summary_report_trial.xlsx';
sheet = 1;
Title_xlRange = 'A1';
xlswrite(Export_filename,Report_title,sheet,Title_xlRange)
% Title length Compound Matrix
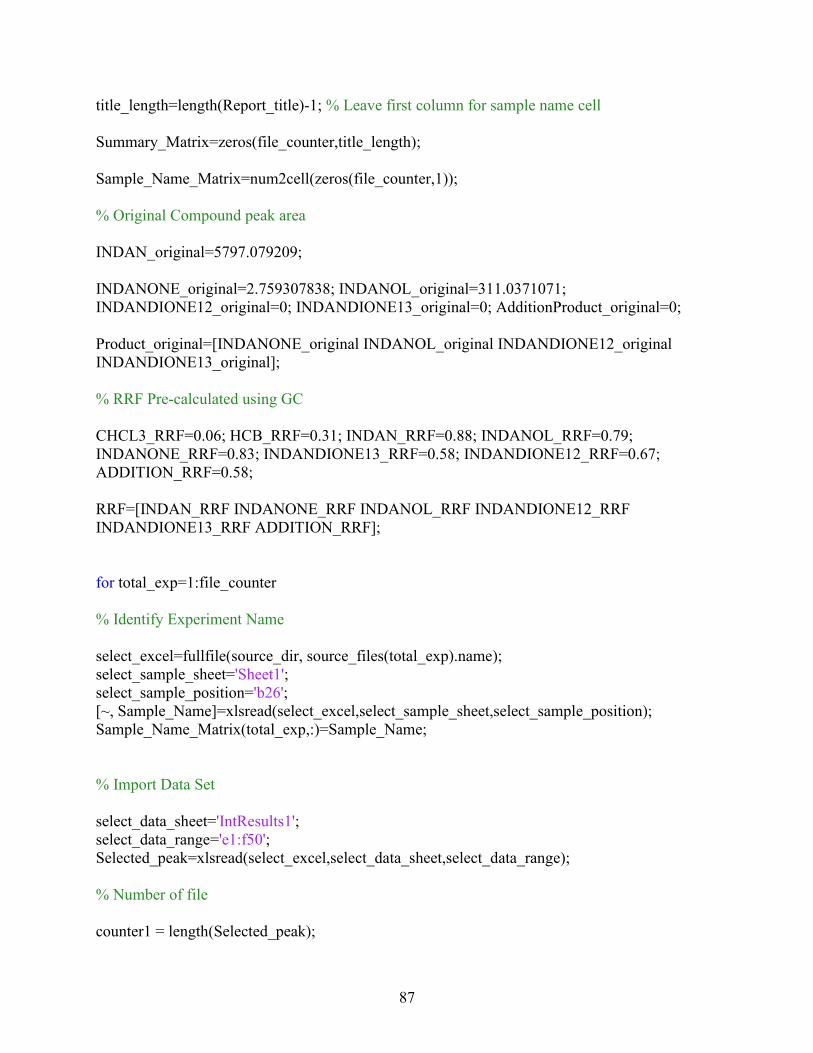
87
title_length=length(Report_title)-1; % Leave first column for sample name cell
Summary_Matrix=zeros(file_counter,title_length);
Sample_Name_Matrix=num2cell(zeros(file_counter,1));
% Original Compound peak area
INDAN_original=5797.079209;
INDANONE_original=2.759307838; INDANOL_original=311.0371071;
INDANDIONE12_original=0; INDANDIONE13_original=0; AdditionProduct_original=0;
Product_original=[INDANONE_original INDANOL_original INDANDIONE12_original
INDANDIONE13_original];
% RRF Pre-calculated using GC
CHCL3_RRF=0.06; HCB_RRF=0.31; INDAN_RRF=0.88; INDANOL_RRF=0.79;
INDANONE_RRF=0.83; INDANDIONE13_RRF=0.58; INDANDIONE12_RRF=0.67;
ADDITION_RRF=0.58;
RRF=[INDAN_RRF INDANONE_RRF INDANOL_RRF INDANDIONE12_RRF
INDANDIONE13_RRF ADDITION_RRF];
for total_exp=1:file_counter
% Identify Experiment Name
select_excel=fullfile(source_dir, source_files(total_exp).name);
select_sample_sheet='Sheet1';
select_sample_position='b26';
[~, Sample_Name]=xlsread(select_excel,select_sample_sheet,select_sample_position);
Sample_Name_Matrix(total_exp,:)=Sample_Name;
% Import Data Set
select_data_sheet='IntResults1';
select_data_range='e1:f50';
Selected_peak=xlsread(select_excel,select_data_sheet,select_data_range);
% Number of file
counter1 = length(Selected_peak);
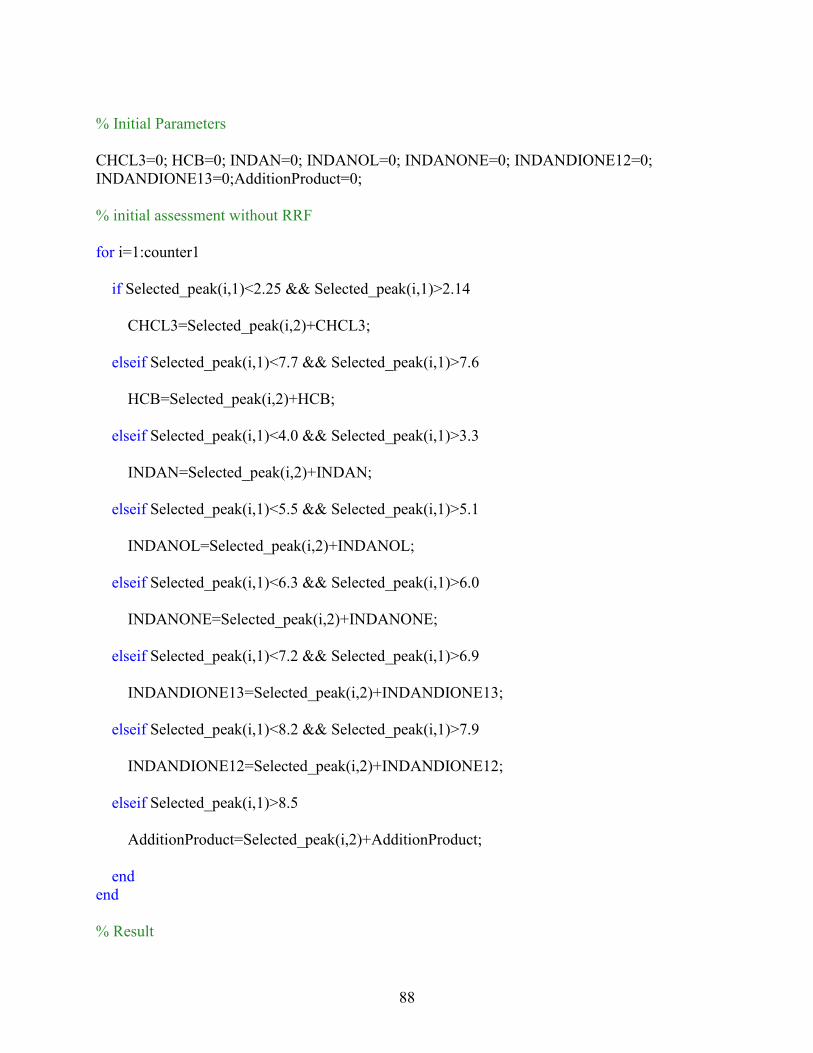
88
% Initial Parameters
CHCL3=0; HCB=0; INDAN=0; INDANOL=0; INDANONE=0; INDANDIONE12=0;
INDANDIONE13=0;AdditionProduct=0;
% initial assessment without RRF
for i=1:counter1
if Selected_peak(i,1)<2.25 && Selected_peak(i,1)>2.14
CHCL3=Selected_peak(i,2)+CHCL3;
elseif Selected_peak(i,1)<7.7 && Selected_peak(i,1)>7.6
HCB=Selected_peak(i,2)+HCB;
elseif Selected_peak(i,1)<4.0 && Selected_peak(i,1)>3.3
INDAN=Selected_peak(i,2)+INDAN;
elseif Selected_peak(i,1)<5.5 && Selected_peak(i,1)>5.1
INDANOL=Selected_peak(i,2)+INDANOL;
elseif Selected_peak(i,1)<6.3 && Selected_peak(i,1)>6.0
INDANONE=Selected_peak(i,2)+INDANONE;
elseif Selected_peak(i,1)<7.2 && Selected_peak(i,1)>6.9
INDANDIONE13=Selected_peak(i,2)+INDANDIONE13;
elseif Selected_peak(i,1)<8.2 && Selected_peak(i,1)>7.9
INDANDIONE12=Selected_peak(i,2)+INDANDIONE12;
elseif Selected_peak(i,1)>8.5
AdditionProduct=Selected_peak(i,2)+AdditionProduct;
end
end
% Result
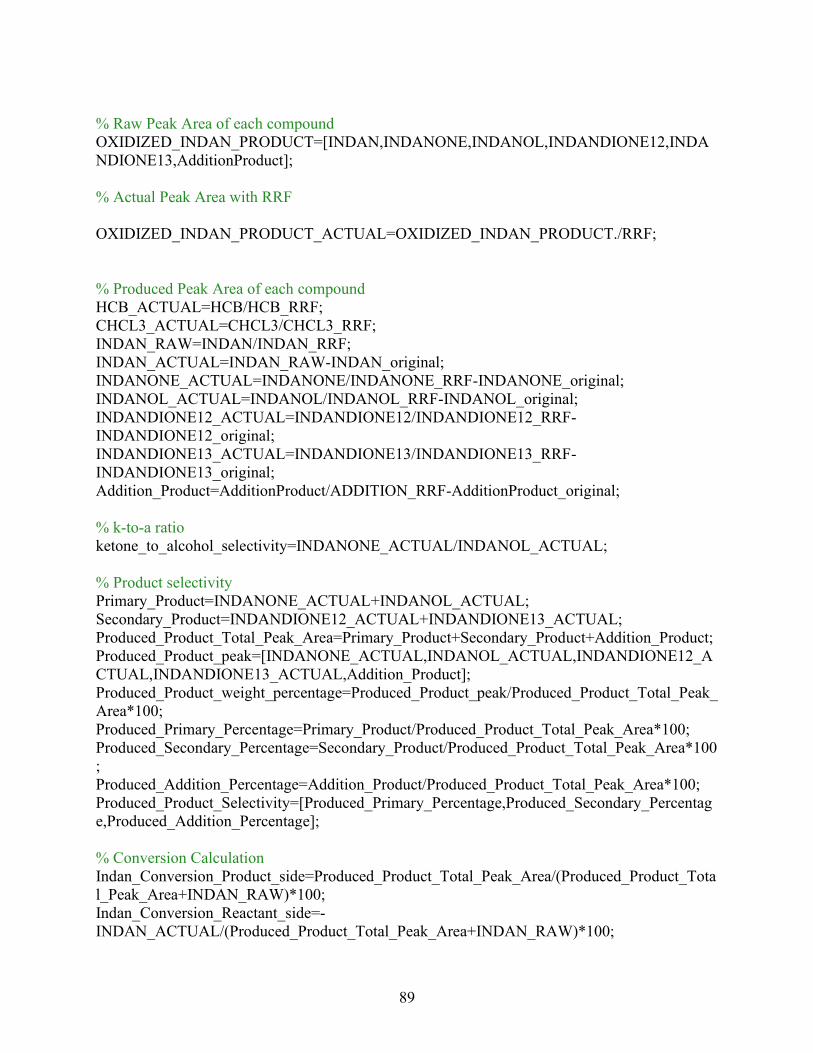
89
% Raw Peak Area of each compound
OXIDIZED_INDAN_PRODUCT=[INDAN,INDANONE,INDANOL,INDANDIONE12,INDA
NDIONE13,AdditionProduct];
% Actual Peak Area with RRF
OXIDIZED_INDAN_PRODUCT_ACTUAL=OXIDIZED_INDAN_PRODUCT./RRF;
% Produced Peak Area of each compound
HCB_ACTUAL=HCB/HCB_RRF;
CHCL3_ACTUAL=CHCL3/CHCL3_RRF;
INDAN_RAW=INDAN/INDAN_RRF;
INDAN_ACTUAL=INDAN_RAW-INDAN_original;
INDANONE_ACTUAL=INDANONE/INDANONE_RRF-INDANONE_original;
INDANOL_ACTUAL=INDANOL/INDANOL_RRF-INDANOL_original;
INDANDIONE12_ACTUAL=INDANDIONE12/INDANDIONE12_RRF-
INDANDIONE12_original;
INDANDIONE13_ACTUAL=INDANDIONE13/INDANDIONE13_RRF-
INDANDIONE13_original;
Addition_Product=AdditionProduct/ADDITION_RRF-AdditionProduct_original;
% k-to-a ratio
ketone_to_alcohol_selectivity=INDANONE_ACTUAL/INDANOL_ACTUAL;
% Product selectivity
Primary_Product=INDANONE_ACTUAL+INDANOL_ACTUAL;
Secondary_Product=INDANDIONE12_ACTUAL+INDANDIONE13_ACTUAL;
Produced_Product_Total_Peak_Area=Primary_Product+Secondary_Product+Addition_Product;
Produced_Product_peak=[INDANONE_ACTUAL,INDANOL_ACTUAL,INDANDIONE12_A
CTUAL,INDANDIONE13_ACTUAL,Addition_Product];
Produced_Product_weight_percentage=Produced_Product_peak/Produced_Product_Total_Peak_
Area*100;
Produced_Primary_Percentage=Primary_Product/Produced_Product_Total_Peak_Area*100;
Produced_Secondary_Percentage=Secondary_Product/Produced_Product_Total_Peak_Area*100
;
Produced_Addition_Percentage=Addition_Product/Produced_Product_Total_Peak_Area*100;
Produced_Product_Selectivity=[Produced_Primary_Percentage,Produced_Secondary_Percentag
e,Produced_Addition_Percentage];
% Conversion Calculation
Indan_Conversion_Product_side=Produced_Product_Total_Peak_Area/(Produced_Product_Tota
l_Peak_Area+INDAN_RAW)*100;
Indan_Conversion_Reactant_side=-
INDAN_ACTUAL/(Produced_Product_Total_Peak_Area+INDAN_RAW)*100;
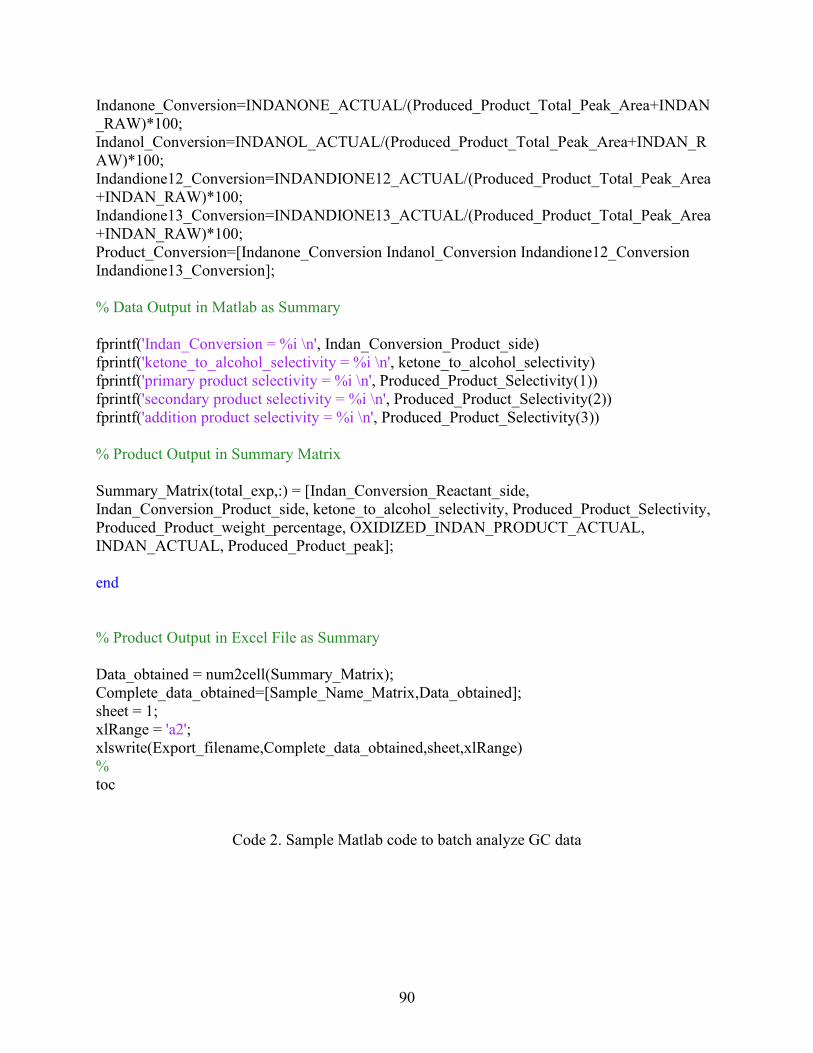
90
Indanone_Conversion=INDANONE_ACTUAL/(Produced_Product_Total_Peak_Area+INDAN
_RAW)*100;
Indanol_Conversion=INDANOL_ACTUAL/(Produced_Product_Total_Peak_Area+INDAN_R
AW)*100;
Indandione12_Conversion=INDANDIONE12_ACTUAL/(Produced_Product_Total_Peak_Area
+INDAN_RAW)*100;
Indandione13_Conversion=INDANDIONE13_ACTUAL/(Produced_Product_Total_Peak_Area
+INDAN_RAW)*100;
Product_Conversion=[Indanone_Conversion Indanol_Conversion Indandione12_Conversion
Indandione13_Conversion];
% Data Output in Matlab as Summary
fprintf('Indan_Conversion = %i \n', Indan_Conversion_Product_side)
fprintf('ketone_to_alcohol_selectivity = %i \n', ketone_to_alcohol_selectivity)
fprintf('primary product selectivity = %i \n', Produced_Product_Selectivity(1))
fprintf('secondary product selectivity = %i \n', Produced_Product_Selectivity(2))
fprintf('addition product selectivity = %i \n', Produced_Product_Selectivity(3))
% Product Output in Summary Matrix
Summary_Matrix(total_exp,:) = [Indan_Conversion_Reactant_side,
Indan_Conversion_Product_side, ketone_to_alcohol_selectivity, Produced_Product_Selectivity,
Produced_Product_weight_percentage, OXIDIZED_INDAN_PRODUCT_ACTUAL,
INDAN_ACTUAL, Produced_Product_peak];
end
% Product Output in Excel File as Summary
Data_obtained = num2cell(Summary_Matrix);
Complete_data_obtained=[Sample_Name_Matrix,Data_obtained];
sheet = 1;
xlRange = 'a2';
xlswrite(Export_filename,Complete_data_obtained,sheet,xlRange)
%
toc
Code 2. Sample Matlab code to batch analyze GC data
Related Documents