Electrophoresis 2013, 34, 1493–1509 1493 Petr Smejkal 1 Danny Bottenus 2 Michael C. Breadmore 1 Rosanne M. Guijt 3 Cornelius F. Ivory 2 Franti ˇ sek Foret 4 Mirek Macka 1 1 ACROSS and School of Chemistry, University of Tasmania, Hobart, Australia 2 Voiland School of Chemical Engineering and Bioengineering, Washington State University, Pullman, WA, USA 3 ACROSS and School of Pharmacy, University of Tasmania, Hobart, Australia 4 Institute of Analytical Chemistry of the Academy of Sciences of the Czech Republic, v.v.i., Brno, Czech Republic Received January 16, 2013 Revised March 6, 2013 Accepted March 7, 2013 Review Microfluidic isotachophoresis: A review Electromigration methods including CE and ITP are attractive for incorporation in mi- crofluidic devices because they are relatively easily adaptable to miniaturization. After its popularity in the 1970s, ITP has made a comeback in microfluidic format (-ITP, micro- ITP) driven by the advantages of the steady-state boundary, the self-focusing effect, and the ability to aid in preconcentrating analytes in the sample while removing matrix com- ponents. In this review, we provide an overview of the developments in the area of -ITP in a context of the historic developments with a focus on recent developments in experi- mental and computational ITP and discuss possible future trends. The chip–ITP areas and topics discussed in this review and the corresponding sections include: PC simulations and modeling, analytical -ITP, preconcentration ITP, transient ITP, peak mode ITP, gra- dient elution ITP, and free-flow ITP, while the conclusions provide a critical summary and outlook. The review also contains experimental conditions for -ITP applications to real-world samples from over 50 original journal publications. Keywords: Chip / Isotachophoresis / Microfluidics / Miniaturization DOI 10.1002/elps.201300021 Additional supporting information may be found in the online version of this article at the publisher’s web-site 1 Introduction Ninety years ago, Kendall and Crittenden introduced the “Ionic Migration Method,” separating rare earth metals and some simple acids [1]. The “Ionic Migration Method,” is fun- damentally identical to the method known as ITP, the name introduced in the 1970s. In the early stages of development of electromigration methods, other separation methods based on ITP principles were introduced before the term ITP was established, such as the “Steady-State-Stacking” step in Disc Electrophoresis in the early 1960s [2]. The period of the greatest popularity of ITP was the 1970s, when this method gained fame in NASA’s third Skylab mis- sion (http://history.nasa.gov/SP-401/ch12.htm; February 18, 2013). ITP could be performed in large bore capillaries (id hundreds of micrometers), which were not suitable for CZE due to excessive Joule heating. The self-sharpening effect be- tween the boundaries of adjacent analyte zones counteracts diffusion and makes ITP resistant to band broadening due to Correspondence: Professor Mirek Macka, School of Chemistry, University of Tasmania, Private Bag 75, Hobart 7001, Australia E-mail: [email protected] Fax: +61-3-62262858 Abbreviations: FEKS, floating electrokinetic supercharging; FFITP, free-flow ITP; GEITP, gradient elution ITP; LE, lead- ing electrolyte; -ITP, micro-ITP; TAS, micro-total analytical systems; TE, terminating electrolyte; t-ITP, transient ITP Joule heating in large bore capillaries. The popularity of ITP decreased with the introduction of narrow-bore fused silica capillaries with an inner diameter of tens of micrometers, enabling Jorgenson to introduce CZE in 1981 [3, 4]. The resurgence of ITP in the 1990s was initiated by the need for a powerful preconcentration technique to in- crease the sensitivity in CZE, which was achieved by cou- pling ITP and CZE [5], later followed by the instrumentally less complicated transient ITP-CZE [6]. Microfluidic devices for CZE and MEKC separations appeared in the early 1990s with the introduction of the micro-total analytical systems (TAS) and Lab-on-a-Chip concepts [7], with first formal re- port of ITP on a chip was published in 1998 by Walker et al. [8]. However, the first ITP on a chip–concept-based sepa- ration was actually reported in 1975 by Bocek et al. who demonstrated the ITP separation of six carboxylic acids of Krebs cycle in a Perspex device [9] (a schematic overview of the ITP device is shown in Supporting Information Fig. 1). While the methods for fabrication of planar microflu- idic chips were strongly limited at that time, the rationale of the advantages of a planar platform is identical to that behind the Lab-on-a-Chip concept introduced 23 years later. Advances in ITP over last two decades have been well monitored and are included in reviews by a number of groups Colour Online: See the article online to view Figs. 1, 3, 4 and 6–8 in colour. C 2013 WILEY-VCH Verlag GmbH & Co. KGaA, Weinheim www.electrophoresis-journal.com

Welcome message from author
This document is posted to help you gain knowledge. Please leave a comment to let me know what you think about it! Share it to your friends and learn new things together.
Transcript
Electrophoresis 2013, 34, 1493–1509 1493
Petr Smejkal1Danny Bottenus2
Michael C. Breadmore1
Rosanne M. Guijt3
Cornelius F. Ivory2
Frantisek Foret4
Mirek Macka1
1ACROSS and School ofChemistry, University ofTasmania, Hobart, Australia
2Voiland School of ChemicalEngineering andBioengineering, WashingtonState University, Pullman, WA,USA
3ACROSS and School ofPharmacy, University ofTasmania, Hobart, Australia
4Institute of Analytical Chemistryof the Academy of Sciences ofthe Czech Republic, v.v.i., Brno,Czech Republic
Received January 16, 2013Revised March 6, 2013Accepted March 7, 2013
Review
Microfluidic isotachophoresis: A review
Electromigration methods including CE and ITP are attractive for incorporation in mi-crofluidic devices because they are relatively easily adaptable to miniaturization. After itspopularity in the 1970s, ITP has made a comeback in microfluidic format (�-ITP, micro-ITP) driven by the advantages of the steady-state boundary, the self-focusing effect, andthe ability to aid in preconcentrating analytes in the sample while removing matrix com-ponents. In this review, we provide an overview of the developments in the area of �-ITPin a context of the historic developments with a focus on recent developments in experi-mental and computational ITP and discuss possible future trends. The chip–ITP areas andtopics discussed in this review and the corresponding sections include: PC simulationsand modeling, analytical �-ITP, preconcentration ITP, transient ITP, peak mode ITP, gra-dient elution ITP, and free-flow ITP, while the conclusions provide a critical summaryand outlook. The review also contains experimental conditions for �-ITP applications toreal-world samples from over 50 original journal publications.
Keywords:
Chip / Isotachophoresis / Microfluidics / MiniaturizationDOI 10.1002/elps.201300021
� Additional supporting information may be found in the online version of thisarticle at the publisher’s web-site
1 Introduction
Ninety years ago, Kendall and Crittenden introduced the“Ionic Migration Method,” separating rare earth metals andsome simple acids [1]. The “Ionic Migration Method,” is fun-damentally identical to the method known as ITP, the nameintroduced in the 1970s. In the early stages of developmentof electromigration methods, other separation methods basedon ITP principles were introduced before the term ITP wasestablished, such as the “Steady-State-Stacking” step in DiscElectrophoresis in the early 1960s [2].
The period of the greatest popularity of ITP was the 1970s,when this method gained fame in NASA’s third Skylab mis-sion (http://history.nasa.gov/SP-401/ch12.htm; February 18,2013). ITP could be performed in large bore capillaries (idhundreds of micrometers), which were not suitable for CZEdue to excessive Joule heating. The self-sharpening effect be-tween the boundaries of adjacent analyte zones counteractsdiffusion and makes ITP resistant to band broadening due to
Correspondence: Professor Mirek Macka, School of Chemistry,University of Tasmania, Private Bag 75, Hobart 7001, AustraliaE-mail: [email protected]: +61-3-62262858
Abbreviations: FEKS, floating electrokinetic supercharging;FFITP, free-flow ITP; GEITP, gradient elution ITP; LE, lead-ing electrolyte; �-ITP, micro-ITP; �TAS, micro-total analyticalsystems; TE, terminating electrolyte; t-ITP, transient ITP
Joule heating in large bore capillaries. The popularity of ITPdecreased with the introduction of narrow-bore fused silicacapillaries with an inner diameter of tens of micrometers,enabling Jorgenson to introduce CZE in 1981 [3, 4].
The resurgence of ITP in the 1990s was initiated bythe need for a powerful preconcentration technique to in-crease the sensitivity in CZE, which was achieved by cou-pling ITP and CZE [5], later followed by the instrumentallyless complicated transient ITP-CZE [6]. Microfluidic devicesfor CZE and MEKC separations appeared in the early 1990swith the introduction of the micro-total analytical systems(�TAS) and Lab-on-a-Chip concepts [7], with first formal re-port of ITP on a chip was published in 1998 by Walker et al.[8]. However, the first ITP on a chip–concept-based sepa-ration was actually reported in 1975 by Bocek et al. whodemonstrated the ITP separation of six carboxylic acids ofKrebs cycle in a Perspex device [9] (a schematic overviewof the ITP device is shown in Supporting InformationFig. 1). While the methods for fabrication of planar microflu-idic chips were strongly limited at that time, the rationale ofthe advantages of a planar platform is identical to that behindthe Lab-on-a-Chip concept introduced 23 years later.
Advances in ITP over last two decades have been wellmonitored and are included in reviews by a number of groups
Colour Online: See the article online to view Figs. 1, 3, 4 and 6–8 incolour.
C© 2013 WILEY-VCH Verlag GmbH & Co. KGaA, Weinheim www.electrophoresis-journal.com
1494 P. Smejkal et al. Electrophoresis 2013, 34, 1493–1509
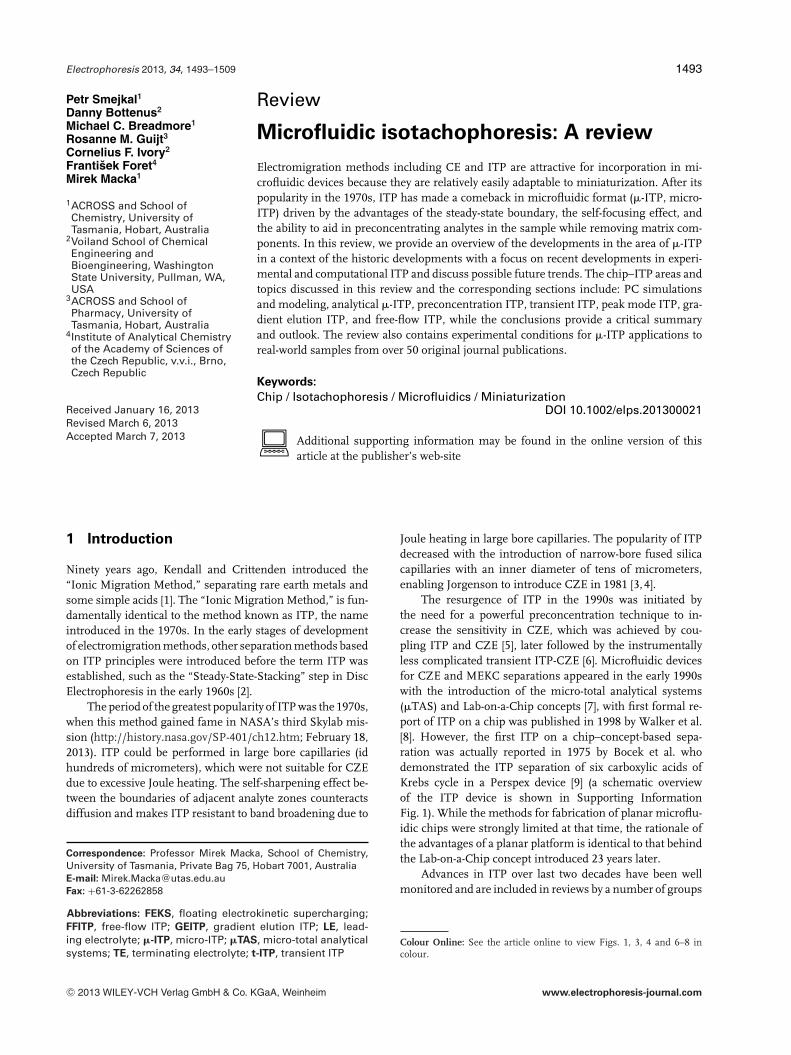
Table 1. Reviews and monographs offering some coverage of �-ITP. The coverage is aimed to be exhaustive for the last 3 years(2010–2012) and also capturing primarily significant contributions through the last decade
Year Authors Title Pages Refs Figs Tabs Ref.# Comments (primary focus)
2013 Petr Smejkal, DannyBottenus, Michael C.Breadmore, Rosanne M.Guijt, Cornelius F. Ivory,Frantisek Foret, MirekMacka
Microfluidic isotachophoresis: areview
17 150 14 4 Thisreview
Chip ITP areas discussed,sections: PC simulations andmodeling, analytical ITP,preconcentration ITP, transientITP, peak mode ITP, gradientelution ITP, and free-flow ITP
2012 Supreet S. Bahga, Juan G.Santiago
Coupling isotachophoresis andcapillary electrophoresis: areview and comparison ofmethods
24 74 11 0 [10] Physical principles underlyingITP and the two standardmodes of operation: “peak”and “plateau” modes includingthree movies
2013 Michael C. Breadmore, Alia I.,Shallan, Heide R. Rabanes,Daniel Gstoettenmayr,Aemi S. Abdul Keyon,Andras Gaspar, MohamedDawod, Joselito P. Quirino
Recent advances in enhancingthe sensitivity ofelectrophoresis andelectrochromatography incapillaries and microchips(2010–2012)
26 235 11 0 [11] Developments in the field ofstacking, covering all methodsfrom field-amplified samplestacking and large volumesample stacking, through ITP,dynamic pH junction, andsweeping
2012 Zdena Mala, Petr Gebauer,Petr Bocek
Recent progress in analyticalcapillary isotachophoresis
10 89 5 0 [12] Continuation of a series ofregularly published reviews onthe topic
2012 G. Garcia-Schwarz , A.Rogacs, S. S. Bahga, J. G.Santiago
On-chip isotachophoresis forseparation of ions andpurification of nucleic acids
8 18 5 2 [13] Physical principles underlyingITP and the two standardmodes of operation: “peak”and “plateau” modes includingthree movies
2012 Alexander Stoyanov IEF-based multidimensionalapplications in proteomics:toward higher resolution
10 160 1 0 [14] Alternative isoelectrofocusingmethods and IEF-relatedtechniques in protein analysisand characterization
2012 Yingying Wen, Jinhua Li,Jiping Ma, Lingxin Chen
Recent advances in enrichmenttechniques for trace analysis incapillary electrophoresis
20 183 12 3 [15] Enrichment techniquescontaining sample off-line andon-line preconcentration toenhancing sensitivity in CE fortrace analysis
2012 Tomas Krizek, AnnaKubickova
Microscale separation methodsfor enzyme kinetics assays
11 100 3 2 [16] Applications of separations incapillary or chip formats:MEKC, LC, GE, IEF, and ITP
2012 Fumihiko Kitagawa, TakayukiKawai, Kenji Sueyoshi, KojiOtsuka
Recent progress of on-linesample preconcentrationtechniques in microchipelectrophoresis
9 56 8 0 [17] On-line sample preconcentrationtechniques to enhance thedetection sensitivity in MCE
2012 Vaclav Kasicka Recent developments in CE andCEC of peptides (2009–2011)
26 294 10 0 [18] High-performanceelectroseparation methods incapillary and microchipformats: ZE, ITP, IEF, AE, EKC,and EC
2011 Stacy M. Kenyon, Michelle M.Meighan, Mark A. Hayes
Recent developments inelectrophoretic separations onmicrofluidic devices
12 88 6 0 [19] Electrophoretic concentration,samplepreparation/conditioning, andseparation on-chip
2011 Petr Gebauer, Zdena Mala,Petr Bocek
Recent progress in analyticalcapillary isotachophoresis
7 84 0 0 [20] Continuation of a series ofregularly published reviewscovering 2009–2010
C© 2013 WILEY-VCH Verlag GmbH & Co. KGaA, Weinheim www.electrophoresis-journal.com
Electrophoresis 2013, 34, 1493–1509 Microfluidics and Miniaturization 1495
Table 1. Continued
Year Authors Title Pages Refs Figs Tabs Ref.# Comments (primary focus)
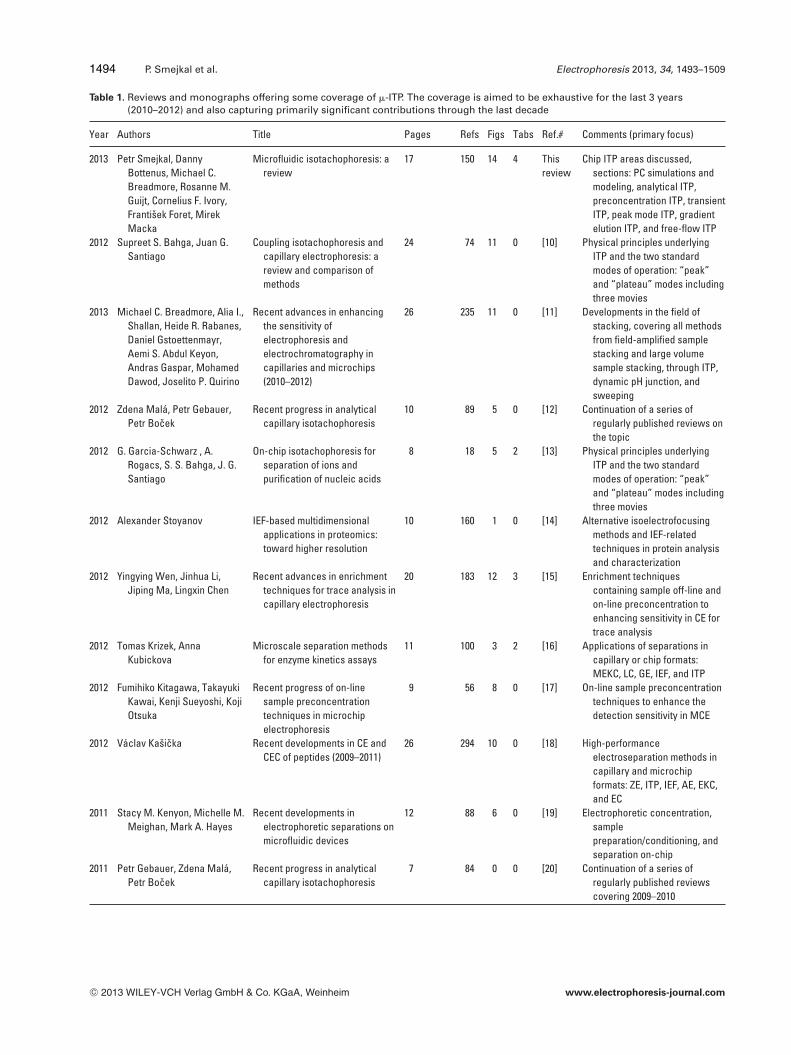
2011 Michael C. Breadmore, MohamedDawod, Joselito P. Quirino
Recent advances in enhancingthe sensitivity ofelectrophoresis andelectrochromatography incapillaries and microchips(2008–2010)
22 269 12 0 [21] Stacking, covering all methodsfrom field-amplified samplestacking and large volumesample stacking, through ITP,dynamic pH junction, andsweeping
2011 Angela I. Lopez-Lorente,Bartolome M. Simonet, MiguelValcarcel
Electrophoretic methods for theanalysis of nanoparticles
14 75 6 0 [22] Main progress in electrophoresistechniques in order to achieveseparation of NPs: CZE, GE, orITP
2010 Nicholas W. Frost, Meng Jing,Michael T. Bowser
Capillary electrophoresis 17 227 0 0 [23] Anal. Chem. reviews series
2010 Wolfgang Thormann, Michael C.Breadmore, Jitka Caslavska,Richard A. Mosher
Dynamic computer simulations ofelectrophoresis: a versatileresearch and teaching tool
29 215 19 0 [24] Software is available, whichsimulates all systems,including moving boundaryelectrophoresis, ZE, ITP, IEF,and EKC, and theircombinations
2009 Alexandre Persat, Robert D.Chambers, Juan G. Santiago
Basic principles of electrolytechemistry for microfluidicelectrokinetics. Part I:acid-base equilibria and pHbuffers
17 81 7 3 [25] Fundamental and appliedacid–base equilibriumchemistry useful tomicrofluidic electrokinetics—atutorial review
2009 Alexandre Persat, Robert D.Chambers, Juan G.
Basic principles of electrolytechemistry for microfluidicelectrokinetics. Part II:coupling between ion mobility,electrolysis, and acid-baseequilibria
16 72 6 4 [26] The importance of the couplingbetween electromigration andelectrophoresis, acid–baseequilibria, and electrochemicalreactions—a tutorial review
2009 Ryan T. Turgeon, Michael T.Bowser
Micro free-flow electrophoresis:theory and applications
12 57 11 0 [27] Separations using various modessuch as zone electrophoresis,IEF, ITP, and field-stepelectrophoresis have beendemonstrated
2008 James P. Landers (Ed) Handbook of Capillary andMicrochip Electrophoresis andAssociated Microtechniques,3rd edn., CRC Press, BocaRaton 2008
1592 – – – [28] Several chapters relevant to ITP,especially 5, 10, 11, and 13:“Online SamplePreconcentration for CapillaryElectrophoresis” by Dean S.Burgi and Braden C. Giordano
2007 Petr Gebauer, Zdena Mala, PetrBocek
Recent progress in capillary ITP 7 96 0 0 [29] Summarizes the progress since2002
2006 Lin Chen, Jeff E. Prest, Peter R.Fielden, Nicholas J. Goddard,Andreas Manz, Philip J. R. Day
Miniaturised isotachophoresisanalysis
14 61 7 3 [30] The basic features ofmicrochip-based ITP and itsapplications to the analysisand pretreatment of ioniccompounds and biomolecules
2004 Christopher J. Evenhuis, RosanneM. Guijt, Miroslav Macka, PaulR. Haddad
Determination of inorganic ionsusing microfluidic devices
23 96 7 11 [31] Inorganic analysis usingmicrofluidic devices using ITP,CE, and hyphenated ITP-CE,together with a brief accountof flow injection analysis
2003 Dusan Kaniansky, Marian Masar,Robert Bodor, Maria Zuborova,Eva Olvecka, Matthias Johnck,Bernd Stanislawski
Electrophoretic separations onchips with hydrodynamicallyclosed separation systems
20 131 17 0 [32] ITP-ZE combination in traceanalysis applications of theminiaturized systems isdiscussed in a broader extent
Refs = no. of references, Figs = no. of figures, Tabs = no. of tables, Ref.# = reference number in this review. GE: gel electrophoresis.
C© 2013 WILEY-VCH Verlag GmbH & Co. KGaA, Weinheim www.electrophoresis-journal.com
1496 P. Smejkal et al. Electrophoresis 2013, 34, 1493–1509
as summarized in Table 1 [10–32]. This paper presents adetailed review of micro-ITP (�-ITP). The following text con-tains a comprehensive overview of ITP techniques with afocus on the underlying principles. Computer simulations ofITP processes are reviewed in Section 2, followed by sectionson analytical �-ITP, preconcentration �-ITP, transient ITP(t-ITP) on-a-chip, peak mode ITP [33], gradient elution�-ITP, and free-flow �-ITP [34, 35]. This review concludeswith tables listing conditions to analyze or concentrate a va-riety of analytes and samples with a summary of the keyexperimental conditions extracted from original publications[36–72] provided in Supporting Information Tables 1–3.
2 PC Simulations and modeling
Microfluidics and, specifically, Lab-on-a-Chip devices haveshown themselves to be particularly amenable to simula-tion, often providing exquisitely accurate predictions of mass,momentum, and energy transport in both linear and non-linear electrophoretic processes. This section will focus onsimulations of �-ITP, including those aimed at improvingmicrofluidic applications by optimizing injection methods,minimizing sample loss, controlling fluid flow throughoutthe microchannel structure, and elucidating the impact ofchannel geometry and design on electrophoresis applications.In particular, various several dynamic simulators that modelITP will be discussed.
Modern electrophoretic simulations were established in1983 with the work of Bier et al. [73] who postulated a com-mon basis for the four cardinal electrophoretic techniques:MBE, zone electrophoresis (ZE), IEF, and ITP. A numberof recent reviews cover dynamic electrophoretic simulatorsincluding Thormann et al. [74], who gave a comprehensiveoverview of both public and commercial simulators developedover the past 30 years detailing applications, achievements,milestones, and capabilities, including moving boundaryelectrophoresis, IEF, ITP, ZE, and EKC, describing the im-portant features of each package in table format. The follow-ing year, Thormann et al. [24] reviewed case studies, mostlythose performed using the dynamic 1D solver, GENTRANS[73,75–77], including an extensive list of electrophoretic phe-nomena such as the system peaks that occur in ZE, the gra-dient stabilization and destabilization processes that occurat the electrodes during IEF, the dynamics of interfaces be-tween adjacent ITP zones, and the electrokinetic migration ofneutral analytes with different binding constant that rangedfrom 0 to 100 000 L/mol with a charged buffer additive duringEKC.
This review covers simulation software specificallygeared toward ITP in simple, linear channels. ITP is the sepa-ration and concentration of charged components in an electricfield. ITP requires a leading electrolyte (LE) and a terminat-ing electrolyte (TE) that have a higher effective electrophoreticmobility and a slower effective electrophoretic mobility thanthe sample components, respectively so that the sample com-ponents form focused/concentrated zones in order of elec-
trophoretic mobility behind the LE and ahead of the TE. ITPcan be difficult to simulate because of the mathematical stiff-ness that accompanies steep concentration gradients, for ex-ample, 10–100 mM over micron distances with high kilovoltper cm electric field strengths (kV/cm). In addition to ITP,we will also review general microfluidic protocols such asinjection techniques to minimize sample loss, control of an-alyte migration through a microchip, preconcentration, andthe influence of chip design on electrokinetic phenomenon.
The simulation software packages most often usedto model microfluidic ITP systems include the 1Dsolver GENTRANS [73, 75–77] available upon author re-quest ([email protected]), PeakMaster (onlyapplicable to ZE) and SIMUL [78] both available athttp://web.natur.cuni.cz/gas/, the 1D freeware SPRESSO[79] available at http://stanfordspresso.blogspot.com/, as wellas commercially available multidimensional software such asCFD-ACE+ (ESI, Huntsville, AL, USA) and COMSOL Mul-tiphysics (COMSOL, Inc., Burlington, MA, USA). Each pro-gram uses a different numerical solver; and the evolution of avariety of numerical solvers was recently assessed by Bercoviciet al. [79]. In 2011, Mosher et al. [80] compared the dynamic1D simulators GENTRANS, SIMUL, and SPRESSO basedon their performance. Each simulator had its advantages anddisadvantages, depending on the simulation problem, so theauthors direct you to the aforementioned research article inchoosing a 1D simulator for your particular project.
The 1D electrophoresis simulation packages have pro-gressed over the years to handle the various electrokineticphenomena that occur during ITP. For instance, Bercovici etal. [79] included an adaptive grid mechanism in SPRESSOwhich limited the spatial geometry to regions that includedhigh concentration gradients. This allowed grid points to ac-cumulate in a small zone that moved with the LE interface,producing accurate solutions to ITP simulations while us-ing less computational resources, that is, a 75-fold decreasein computation time compared to the same simulation us-ing a dense, uniform grid. Since the mesh accumulated nearthe narrow analyte focused zone while dissipating from thebroader shallow gradients in the LE and TE, the target zonescould be analyzed in a moving reference frame which allowedfor smaller working domains, sparser meshing overall, fastersolution times, and more accurate solutions. The downside ofthe adaptive gird is when having multiple boundaries becausethe grid cannot adapt to all of them in an ideal fashion, thusreducing the performance benefit. The best result in terms ofcomputation time is with a simple ITP boundary system withone step or one spike/peak (depending on the terminologybeing used).
The mathematical equations, which assume that theacid–base reactions are instantaneous, pay particular atten-tion to calculating total concentrations of species rather thanindividual ionic states; and boundary conditions that allow so-lution in a moving frame of reference were described in a laterpaper [81]. SPRESSO now includes an extended Onsager–Fuoss correction to determine effective electrophoretic mobil-ities, and an extended Debye–Huckel formula to calculate and
C© 2013 WILEY-VCH Verlag GmbH & Co. KGaA, Weinheim www.electrophoresis-journal.com
Electrophoresis 2013, 34, 1493–1509 Microfluidics and Miniaturization 1497
correct ionic activities [82] as well as modifying the governingequations to take into account variable cross-sectional areageometries in the context of a 1D geometry [83]. GENTRANShas been modified to handle ITP separations with a com-plexing agent [84] and a version of SIMUL (SIMUL 5 Com-plex) can simulate affinity ZE with a complexing agent [78].SIMUL and SPRESSO can both calculate the pH of solutionsmade from multiple, general amphoteric compounds, includ-ing ionic strength corrections [25]. Persat et al. [25, 26] havealso described basic principles of electrolyte chemistry formicrofluidic devices including pH calculation, buffer prepa-ration, ionic strength corrections, ion mobility corrections,acid–base equilibria, effects of atmospheric carbon dioxide,and electrode reactions which can be important parameterswhen simulating ITP systems. These 1D dynamic simulatorsand their modifications that have been made can provide in-sight into unexpected electrokinetic phenomena but, by their1D nature, they do have limitations.
1D dynamic simulators cannot rigorously describe in-jection methods, sample loss and dispersion during elec-trokinetic migration past T-junctions, peak spreading due tononuniform flows, effects, and/or concentration effects dueto geometric nonuniformities. 2D and 3D numerical simu-lations, which are currently available in several commercialpackages, offer the advantage of exploring all of these differ-ent phenomena and their application in these areas will beaddressed in the remainder of this section.
2.1 Injection methods and sample leakage/loss at
T-junctions
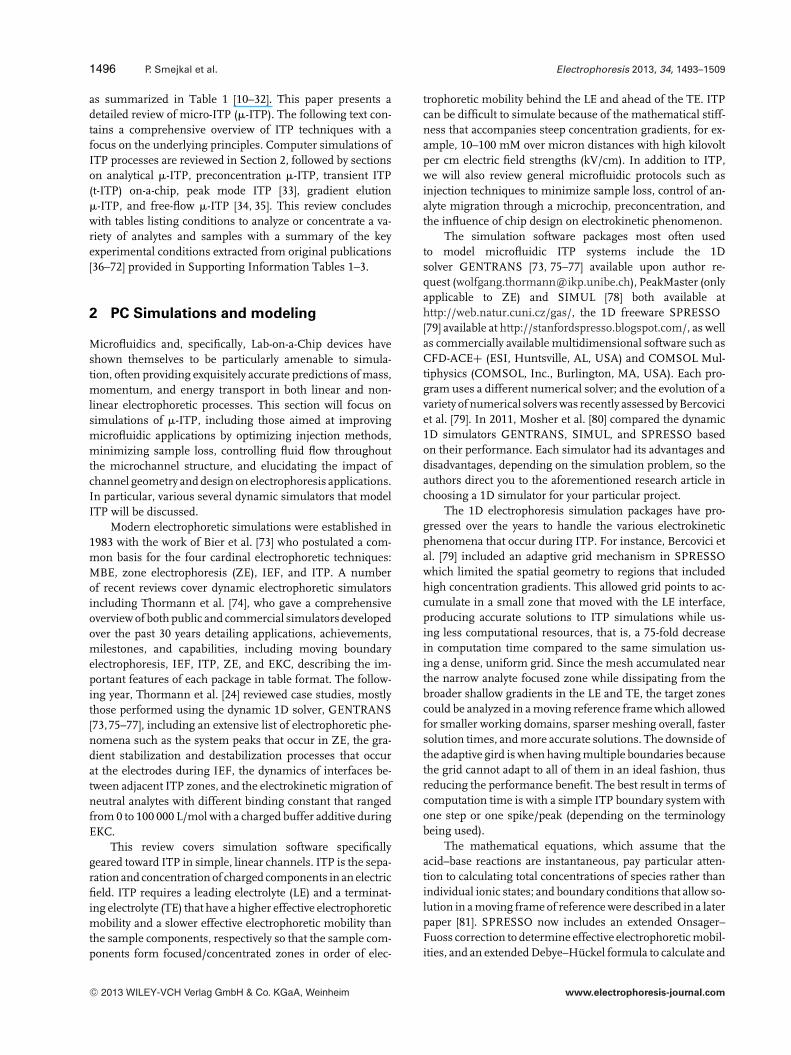
The quantitative analysis of final concentrations relies onthe ability to reproducibly inject a precise volume of sampleinto a microfluidic channel. This is typically accomplished byelectrokinetic pumping or pressure-driven flow in a double-T or dog-leg channel which includes four reservoirs, oneseparation channel, and two branched channels perpendic-ular to the separation channel (see Fig. 1). Jacobson et al.[85] described two injection strategies to introduce sampleinto a glass microfluidic chip which were termed (i) pinchedsample loading and (ii) floating sample loading (see Fig. 1Aand B). Experimental results indicated that pinched sampleloading was superior to floating sample loading in both pluglength and temporal stability. However, during pinched in-jection, sample loss can occur during voltage switching assample gets pulled back into the side channels resulting in re-duced sensitivities. Kurnik et al. [86] used simulation softwarefrom CFD Research (Huntsville, AL, USA), consisting of theACE+, GEOM, and VIEW packages to demonstrate that back-t-ITP, where the sample conductivity is much higher thanthe conductivity of a single background separation buffer, ina T-channel configuration that used “simplest injection” (seeFig. 1C) yielded a fivefold increase in concentration relativeto “pinched injection.”
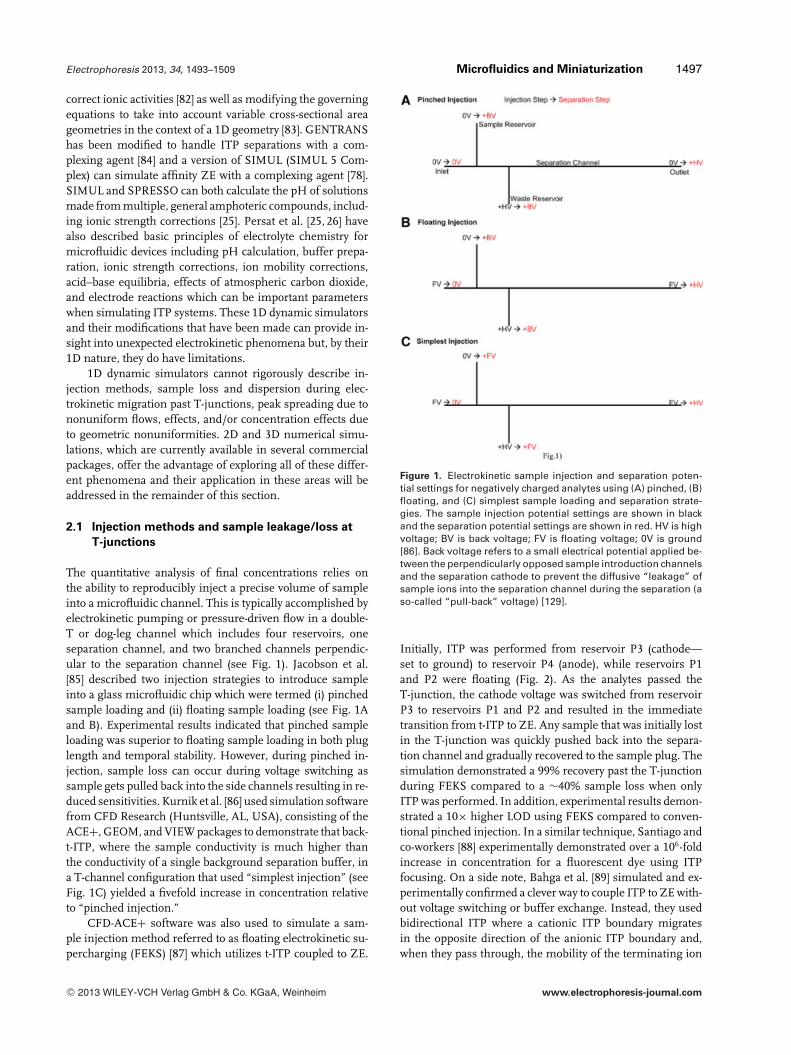
CFD-ACE+ software was also used to simulate a sam-ple injection method referred to as floating electrokinetic su-percharging (FEKS) [87] which utilizes t-ITP coupled to ZE.
Figure 1. Electrokinetic sample injection and separation poten-tial settings for negatively charged analytes using (A) pinched, (B)floating, and (C) simplest sample loading and separation strate-gies. The sample injection potential settings are shown in blackand the separation potential settings are shown in red. HV is highvoltage; BV is back voltage; FV is floating voltage; 0V is ground[86]. Back voltage refers to a small electrical potential applied be-tween the perpendicularly opposed sample introduction channelsand the separation cathode to prevent the diffusive “leakage” ofsample ions into the separation channel during the separation (aso-called “pull-back” voltage) [129].
Initially, ITP was performed from reservoir P3 (cathode—set to ground) to reservoir P4 (anode), while reservoirs P1and P2 were floating (Fig. 2). As the analytes passed theT-junction, the cathode voltage was switched from reservoirP3 to reservoirs P1 and P2 and resulted in the immediatetransition from t-ITP to ZE. Any sample that was initially lostin the T-junction was quickly pushed back into the separa-tion channel and gradually recovered to the sample plug. Thesimulation demonstrated a 99% recovery past the T-junctionduring FEKS compared to a ∼40% sample loss when onlyITP was performed. In addition, experimental results demon-strated a 10× higher LOD using FEKS compared to conven-tional pinched injection. In a similar technique, Santiago andco-workers [88] experimentally demonstrated over a 106-foldincrease in concentration for a fluorescent dye using ITPfocusing. On a side note, Bahga et al. [89] simulated and ex-perimentally confirmed a clever way to couple ITP to ZE with-out voltage switching or buffer exchange. Instead, they usedbidirectional ITP where a cationic ITP boundary migratesin the opposite direction of the anionic ITP boundary and,when they pass through, the mobility of the terminating ion
C© 2013 WILEY-VCH Verlag GmbH & Co. KGaA, Weinheim www.electrophoresis-journal.com
1498 P. Smejkal et al. Electrophoresis 2013, 34, 1493–1509
Figure 2. Protocol of performing the floating electrokinetic super-charging (FEKS) which combines electrokinetic injection and ITPpreconcentration of samples on the cross-microchip. Reproducedwith permission from [87].
is changed thereby disrupting the ITP and ZE commences.This results in a much faster transition and less dispersionof the ITP zones as they evolve into ZE than other methodsof transitioning from ITP to ZE.
Cui and et al. [90] used COMSOL Multiphysics to sim-ulate dispersion and sample loss as proteins migrated pasta T-junction during ITP and ZE. Unlike in ZE where pro-tein zones fail to recover due to dispersion at the T-junction,protein/sample zones during ITP do recover due to ITP’s self-sharpening effect. However, this did not address the problemof sample loss. To address sample loss, automated microelec-trodes (changing voltages based on the total current passingthrough the microchannel) during ITP were inserted into theside channels to act as a valve to reduce dispersion and elimi-nate sample loss of proteins migrating past a T-junction [91].This automated microelectrode system was numerically sim-ulated in COMSOL Multiphysics and subsequently validatedby experimental results.
Instead of relying on microelectrodes that can be diffi-cult to fabricate, the geometry of the microchip, in particular,the angle of the branched side channels can also be adjustedto minimize sample loss near T-junctions. Most microchipsinclude side channels that are perpendicular, that is, at 90�
angles to the main channel, as is the case for conventionalT-chips, which, as previously mentioned, can have signifi-cant sample loss. Tsai et al. [92] simulated sample loss dur-ing injection by electrokinetic pumping at different angledside channels. They found that for the classical perpendicularT-channel, sample losses of ∼25% occur, whereas only ∼4%sample losses occur at side channels with an angle of 30� due
to the inertial forces produced by the inclined injection chan-nel geometry. Although the authors did not explicitly reportthis, it appeared that dispersion after the T-junction was alsoreduced.
2.2 Dispersion during ITP due to flow effects—EOF
and hydrodynamic flow
ITP consists of a discontinuous buffer system where the LEis different than from the TE. As such, the EOF will be differ-ent in each region. Mismatched EOF can have a detrimentaleffect on ITP and can result in zone curvature and disper-sion. Schonfeld et al. [93] used COMSOL Multiphysics todescribe EOF-induced dispersion between both the LE inter-face and TE interface. When LE occupies most of the channel,zone dispersion forms a ⊃-shape at the interface; and whenTE occupies most of the channel, zone dispersion forms a⊂-shape at the interface. Schonfeld et al. [93] determined thatthe dispersion vanishes if the mismatch in electroosmoticmobilities of the LE and the TE is exactly balanced by theirelectrophoretic mobilities such that:
�EOFTE �el
l
�EOFLE �el
t
= 1 (1)
where �elt , �el
l , �EOFTE , and �EOF
LE are the electrophoretic mo-bilities of the terminating ion and the leading ion, and theelectroosmotic mobilities of the terminator and leader, re-spectively. In addition, hydrodynamic flows can have a detri-mental effect on ITP zones.
Hydrodynamic flows are often necessary when attempt-ing stationary counterflow ITP. Liu and Ivory [94] used COM-SOL Multiphysics to describe stationary counterflow ITP in a2D axially symmetric capillary and determined that moleculeswith a lower diffusivity had more severe dispersion thanmolecules with a higher diffusivity. Furthermore, dispersiondue to flow effects could be reduced by the addition of a mono-lith or stationary phase to the capillary. In unobstructed capil-laries, the flow is parabolic and leads to dispersion in combi-nation with an oppositely migrating ITP zone (see SupportingInformation Fig. 2), whereas in capillaries with a stationaryphase, the flow is more plug-like and results in less dispersionand higher concentration (Liu, B. and Ivory, C. F., 2013, per-sonal communication). Using this approach they were able toconcentrate fluorescein by 34 000-fold over 8 h of continuousoperation.
2.3 Preconcentration
ITP inherently preconcentrates sample components by or-ders of magnitude into focused pure zones in decreasingorder of electrophoretic mobility behind an LE and in frontof a TE. Several techniques have been attempted to increaseconcentration factors further with ITP, such as longer chan-nels/capillaries, using a hydrodynamic counterflow [95], andcross-sectional area reductions [96]. Increased concentrationfactors are necessary when trying to detect trace components
C© 2013 WILEY-VCH Verlag GmbH & Co. KGaA, Weinheim www.electrophoresis-journal.com
Electrophoresis 2013, 34, 1493–1509 Microfluidics and Miniaturization 1499
in the presence of high abundant species as is often the case inbiological fluids such as urine, serum, saliva, etc., where thedifference in analyte concentrations can span several ordersof magnitude.
Serpentine channels have been used to increase the chan-nel length on a microfluidic platform without increasing theoverall microchip dimension. Paschkewitz et al. [97] used thecommercially available 2D finite volume method solver, CFD-ACE, to simulate ITP through a serpentine channel to showthat, because of ITP’s self-sharpening effect, the dispersionthat destroys ZE experiments in a curved channel [98] canrecover after a distance that is dependent on the curve radiusand sample mass in a straight section of channel [99].
An opposing hydrodynamic flow, hydraulic or electroos-motic, to electromigration during ITP is another way toincrease the effective channel length and thus to increaseanalyte concentrations. However, as mentioned previously,parabolic flow patterns can lead to significant dispersion [94].Breadmore [100] used GENTRANS to simulate the use of anelectroosmosis counterflow for stationary ITP and found sig-nificant improvements in sensitivity. In addition, using elec-troosmosis as the counterflow can reduce dispersion seenwith parabolic counterflows but can be difficult to control insitu (Liu, B. and Ivory, C. F., 2013, personal communication).
A more elegant, alternative approach to preconcentra-tion during ITP may be to incorporate cross-sectional areareductions along the axial length of the channel. As long asthe ITP zone is in peak mode, a reduction in cross-sectionalarea will result in a proportional increase in concentration.This preconcentration strategy has been simulated both ina full 3D model using COMSOL Multiphysics [101] and ina diffusion-free 1D model using SPRESSO [83]. Both simu-lations revealed that decreases in cross-sectional area alongthe axial length of the channel resulted in increased sensitiv-ities. However, only the 3D case simulation gave an accuratedepiction of the sample shape, dispersion, and migration assample zones moved into and through these cross-sectionalarea reductions. On the negative side, the 3D simulation didtake weeks to complete.
Simulating these ITP systems in more than one dimen-sion requires significantly more computer memory and run-time. Using COMSOL Multiphysics for the 2D numericalsimulations described in this section can take hours to days,while 3D simulations may require days to weeks or evenlonger, depending on the speed, memory, and power. Un-fortunately, the computational time and resources neededfor the reported simulations were not always provided in thecited papers.
3 Analytical ITP
In 1998, Walker et al. revisited the early work by Bocek etal. and presented a constant voltage ITP separation of herbi-cides (paraquat and diquat) on a single-channel chip usingNormal Raman Spectroscopy (2 W, 532 nm NdYVO4 excita-tion laser) for detection [8]. The curved, 40-�m wide, 75-�m
deep, and 210-mm long channel was fabricated on a glassmicroscope slide, and then sealed with a 120-�m thick glasscover slip. The sample was electrokinetically injected into thechip channel prefilled with LE (sulfuric acid) by applying con-stant voltage 4 kV for 1–2 min. After rinsing and refilling thesample reservoir with TE (Tris), the separation was run underHV (high voltage) (at 8 kV).
In 1999, the team of Prest and Baldock reported the sepa-ration of a mixture of sodium and potassium by ITP (constantvoltage) on a PDMS chip [102, 103]. The chip was used as asingle-channel device despite the double-T injection geome-try design. A platinum–iridium wire was integrated betweenthe PDMS layers for single electrode conductivity detection.Sample was mixed with TE in the TE reservoir and the sep-aration was carried out by applying a constant voltage of1 kV between the reservoirs. The same approach was usedfor ITP separation of four metal cations (lithium, lanthanum,dysprosium, and ytterbium) in half the time required in a cap-illary system [104]. In 2002, a new design was introduced forbidirectional ITP [105]. The sample was hydrodynamicallyinjected from the middle of the cross-geometry separationchannel in the PMMA chip with detection electrodes of a dualconductivity detector positioned at each end. A hydrodynamicsystem using pressure and valves was used to introduce allelectrolytes into the chip before a constant voltage of 1000 V,was applied to drive the ITP separation. From the injectioncross in the center of the channels, anions (Cl−, NO3
−, SO42−,
F−) migrated toward the anode and cations (Cs+, NH4+, Na+,
Li+) migrated toward the cathode.In 2003, Baldock et al. presented the first fully poly-
meric microfluidic chips [106]. Injection-molded electrodeswere made from conductive polymers (8% carbon black-filledpolystyrene, 40% carbon fiber-filled nylon, and 40% carbonfiber-filled polystyrene) for voltage application and detectionin a Zeonor/polystyrene device. The chips used simple cross-geometry structure fitted with four reservoirs, connected withvalves for fluidic control. After filling the separation channelwith LE and TE upstream and downstream from the injectioncross, respectively, sample was injected between LE and TEby opening valves at sample and waste reservoirs. During ITPanalysis, all valves were closed and constant voltage/currentwas applied between the polymer separation electrodes.
In 2003, Prest et al. fabricated a new PMMA microflu-idic chip for ITP with hydrodynamic injection controlled bypressure and valves and with conductivity detection (shownin Supporting Information Fig. 3) [42]. Similar to previousreports, the method was faster than capillary ITP, but notsensitive enough for the analysis of industrial waste streamsamples. This chip design was used repeatedly [36–41,68,69],and the applications ranging from inorganic ions toamino and organic acids are summarized in SupportingInformation Table 1.
In 2004, Baldock et al. introduced a pressure-driven sys-tem for the injection of variable amounts of sample betweenLE and TE [107]. The separation channel was connected toa U–shaped sample-waste channel by a 1-mm long chan-nel at a 45� angle. The separation channel was filled with
C© 2013 WILEY-VCH Verlag GmbH & Co. KGaA, Weinheim www.electrophoresis-journal.com
1500 P. Smejkal et al. Electrophoresis 2013, 34, 1493–1509
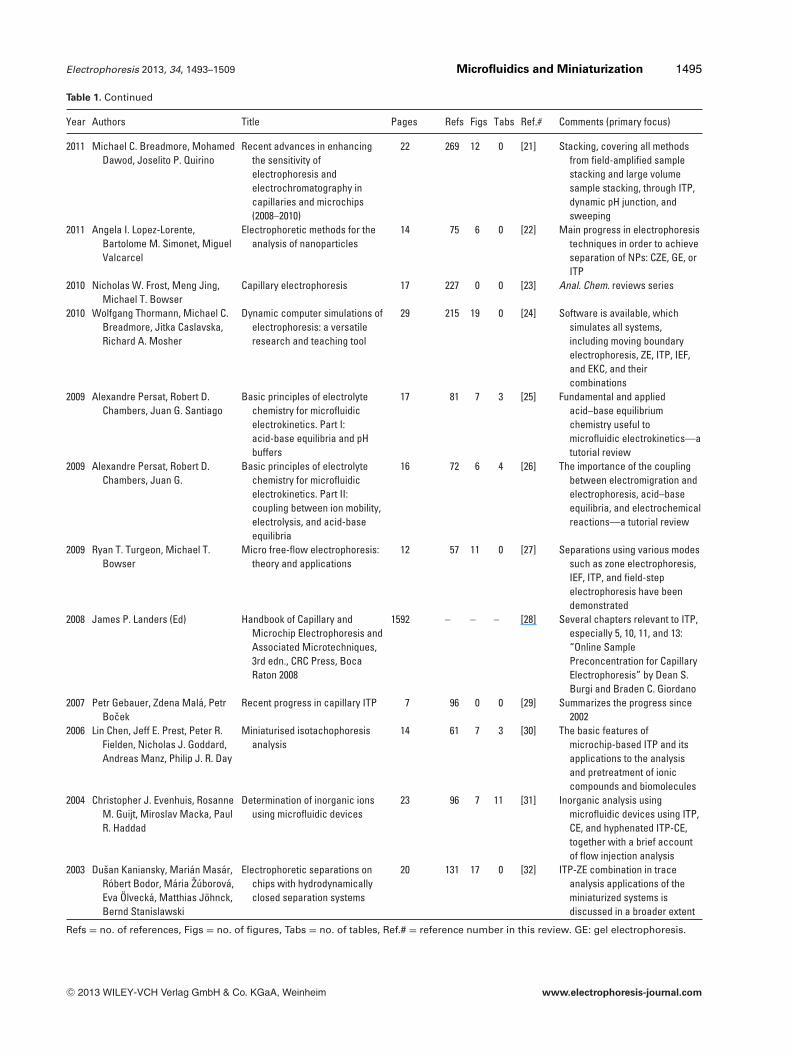
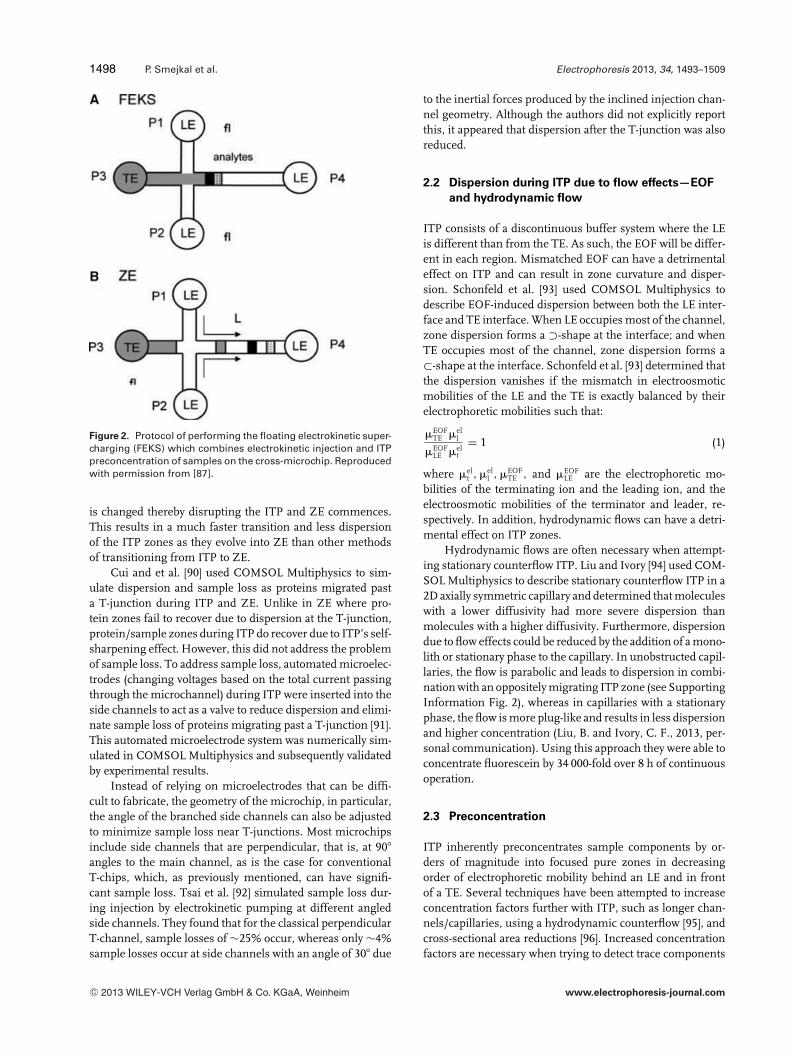
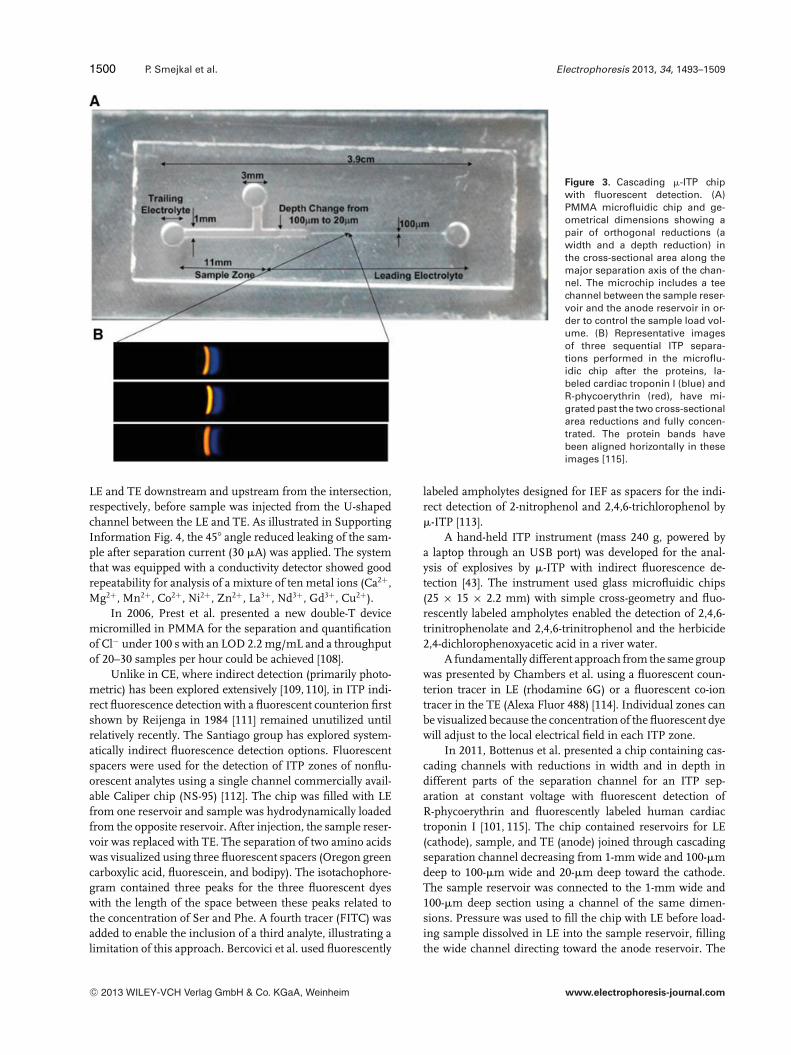
Figure 3. Cascading �-ITP chipwith fluorescent detection. (A)PMMA microfluidic chip and ge-ometrical dimensions showing apair of orthogonal reductions (awidth and a depth reduction) inthe cross-sectional area along themajor separation axis of the chan-nel. The microchip includes a teechannel between the sample reser-voir and the anode reservoir in or-der to control the sample load vol-ume. (B) Representative imagesof three sequential ITP separa-tions performed in the microflu-idic chip after the proteins, la-beled cardiac troponin I (blue) andR-phycoerythrin (red), have mi-grated past the two cross-sectionalarea reductions and fully concen-trated. The protein bands havebeen aligned horizontally in theseimages [115].
LE and TE downstream and upstream from the intersection,respectively, before sample was injected from the U-shapedchannel between the LE and TE. As illustrated in SupportingInformation Fig. 4, the 45� angle reduced leaking of the sam-ple after separation current (30 �A) was applied. The systemthat was equipped with a conductivity detector showed goodrepeatability for analysis of a mixture of ten metal ions (Ca2+,Mg2+, Mn2+, Co2+, Ni2+, Zn2+, La3+, Nd3+, Gd3+, Cu2+).
In 2006, Prest et al. presented a new double-T devicemicromilled in PMMA for the separation and quantificationof Cl− under 100 s with an LOD 2.2 mg/mL and a throughputof 20–30 samples per hour could be achieved [108].
Unlike in CE, where indirect detection (primarily photo-metric) has been explored extensively [109, 110], in ITP indi-rect fluorescence detection with a fluorescent counterion firstshown by Reijenga in 1984 [111] remained unutilized untilrelatively recently. The Santiago group has explored system-atically indirect fluorescence detection options. Fluorescentspacers were used for the detection of ITP zones of nonflu-orescent analytes using a single channel commercially avail-able Caliper chip (NS-95) [112]. The chip was filled with LEfrom one reservoir and sample was hydrodynamically loadedfrom the opposite reservoir. After injection, the sample reser-voir was replaced with TE. The separation of two amino acidswas visualized using three fluorescent spacers (Oregon greencarboxylic acid, fluorescein, and bodipy). The isotachophore-gram contained three peaks for the three fluorescent dyeswith the length of the space between these peaks related tothe concentration of Ser and Phe. A fourth tracer (FITC) wasadded to enable the inclusion of a third analyte, illustrating alimitation of this approach. Bercovici et al. used fluorescently
labeled ampholytes designed for IEF as spacers for the indi-rect detection of 2-nitrophenol and 2,4,6-trichlorophenol by�-ITP [113].
A hand-held ITP instrument (mass 240 g, powered bya laptop through an USB port) was developed for the anal-ysis of explosives by �-ITP with indirect fluorescence de-tection [43]. The instrument used glass microfluidic chips(25 × 15 × 2.2 mm) with simple cross-geometry and fluo-rescently labeled ampholytes enabled the detection of 2,4,6-trinitrophenolate and 2,4,6-trinitrophenol and the herbicide2,4-dichlorophenoxyacetic acid in a river water.
A fundamentally different approach from the same groupwas presented by Chambers et al. using a fluorescent coun-terion tracer in LE (rhodamine 6G) or a fluorescent co-iontracer in the TE (Alexa Fluor 488) [114]. Individual zones canbe visualized because the concentration of the fluorescent dyewill adjust to the local electrical field in each ITP zone.
In 2011, Bottenus et al. presented a chip containing cas-cading channels with reductions in width and in depth indifferent parts of the separation channel for an ITP sep-aration at constant voltage with fluorescent detection ofR-phycoerythrin and fluorescently labeled human cardiactroponin I [101, 115]. The chip contained reservoirs for LE(cathode), sample, and TE (anode) joined through cascadingseparation channel decreasing from 1-mm wide and 100-�mdeep to 100-�m wide and 20-�m deep toward the cathode.The sample reservoir was connected to the 1-mm wide and100-�m deep section using a channel of the same dimen-sions. Pressure was used to fill the chip with LE before load-ing sample dissolved in LE into the sample reservoir, fillingthe wide channel directing toward the anode reservoir. The
C© 2013 WILEY-VCH Verlag GmbH & Co. KGaA, Weinheim www.electrophoresis-journal.com
Electrophoresis 2013, 34, 1493–1509 Microfluidics and Miniaturization 1501
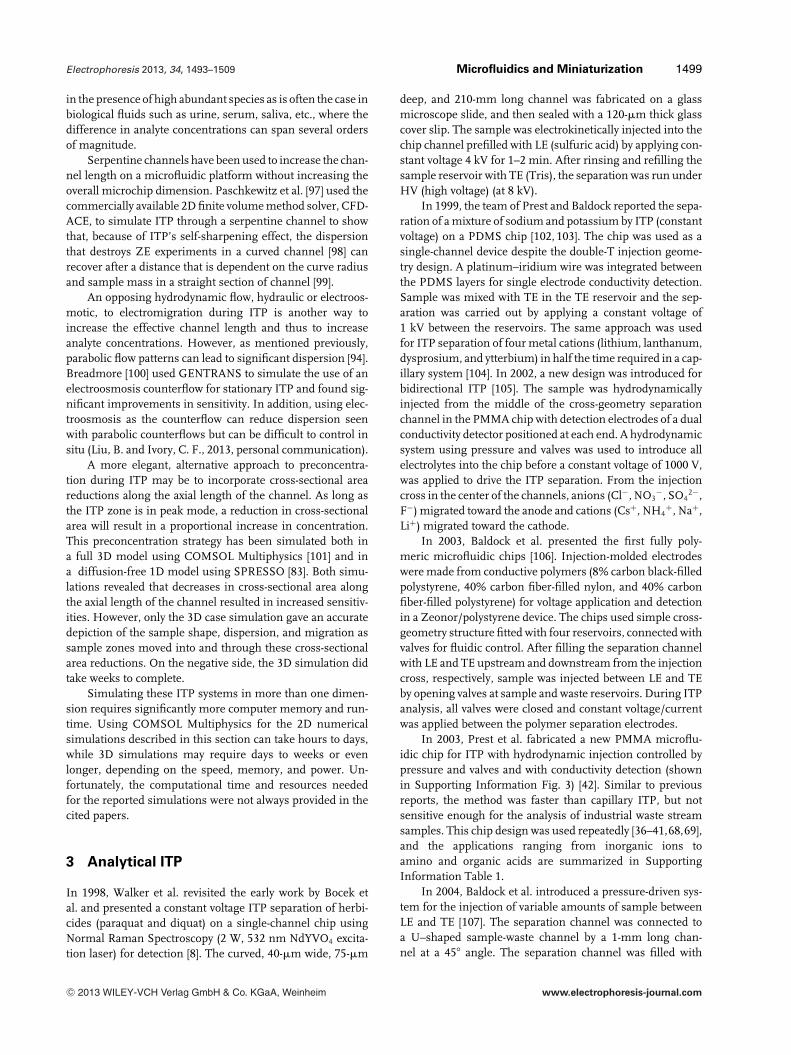
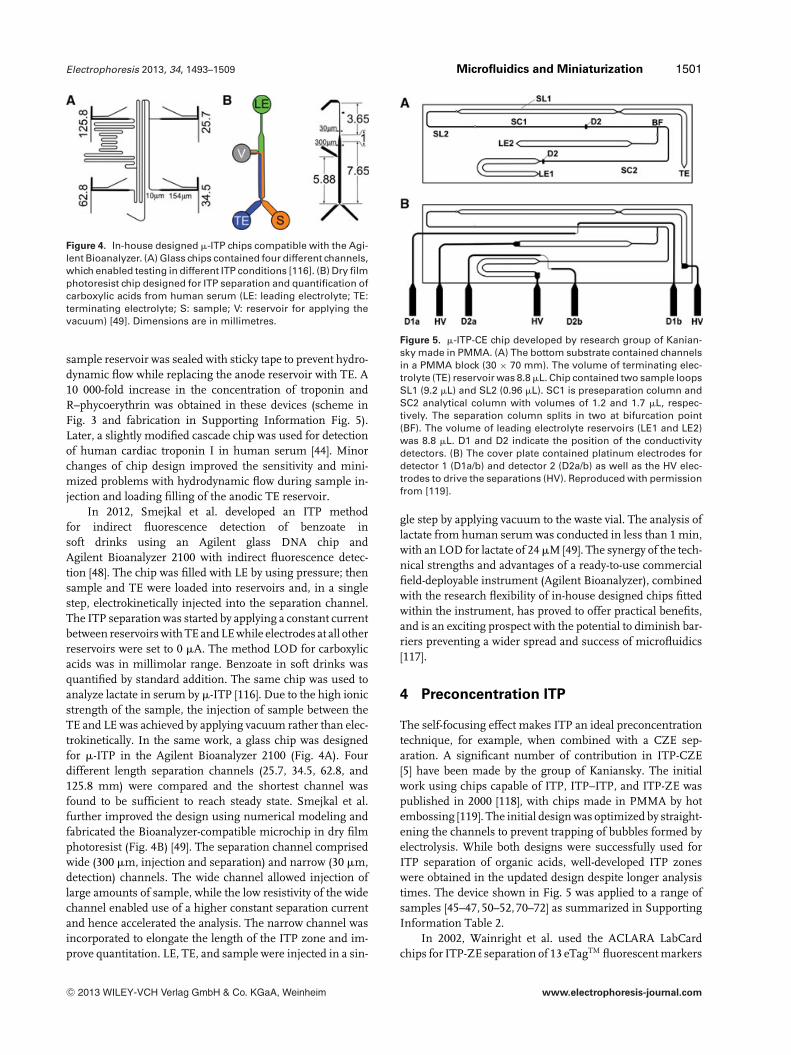
Figure 4. In-house designed �-ITP chips compatible with the Agi-lent Bioanalyzer. (A) Glass chips contained four different channels,which enabled testing in different ITP conditions [116]. (B) Dry filmphotoresist chip designed for ITP separation and quantification ofcarboxylic acids from human serum (LE: leading electrolyte; TE:terminating electrolyte; S: sample; V: reservoir for applying thevacuum) [49]. Dimensions are in millimetres.
sample reservoir was sealed with sticky tape to prevent hydro-dynamic flow while replacing the anode reservoir with TE. A10 000-fold increase in the concentration of troponin andR–phycoerythrin was obtained in these devices (scheme inFig. 3 and fabrication in Supporting Information Fig. 5).Later, a slightly modified cascade chip was used for detectionof human cardiac troponin I in human serum [44]. Minorchanges of chip design improved the sensitivity and mini-mized problems with hydrodynamic flow during sample in-jection and loading filling of the anodic TE reservoir.
In 2012, Smejkal et al. developed an ITP methodfor indirect fluorescence detection of benzoate insoft drinks using an Agilent glass DNA chip andAgilent Bioanalyzer 2100 with indirect fluorescence detec-tion [48]. The chip was filled with LE by using pressure; thensample and TE were loaded into reservoirs and, in a singlestep, electrokinetically injected into the separation channel.The ITP separation was started by applying a constant currentbetween reservoirs with TE and LE while electrodes at all otherreservoirs were set to 0 �A. The method LOD for carboxylicacids was in millimolar range. Benzoate in soft drinks wasquantified by standard addition. The same chip was used toanalyze lactate in serum by �-ITP [116]. Due to the high ionicstrength of the sample, the injection of sample between theTE and LE was achieved by applying vacuum rather than elec-trokinetically. In the same work, a glass chip was designedfor �-ITP in the Agilent Bioanalyzer 2100 (Fig. 4A). Fourdifferent length separation channels (25.7, 34.5, 62.8, and125.8 mm) were compared and the shortest channel wasfound to be sufficient to reach steady state. Smejkal et al.further improved the design using numerical modeling andfabricated the Bioanalyzer-compatible microchip in dry filmphotoresist (Fig. 4B) [49]. The separation channel comprisedwide (300 �m, injection and separation) and narrow (30 �m,detection) channels. The wide channel allowed injection oflarge amounts of sample, while the low resistivity of the widechannel enabled use of a higher constant separation currentand hence accelerated the analysis. The narrow channel wasincorporated to elongate the length of the ITP zone and im-prove quantitation. LE, TE, and sample were injected in a sin-
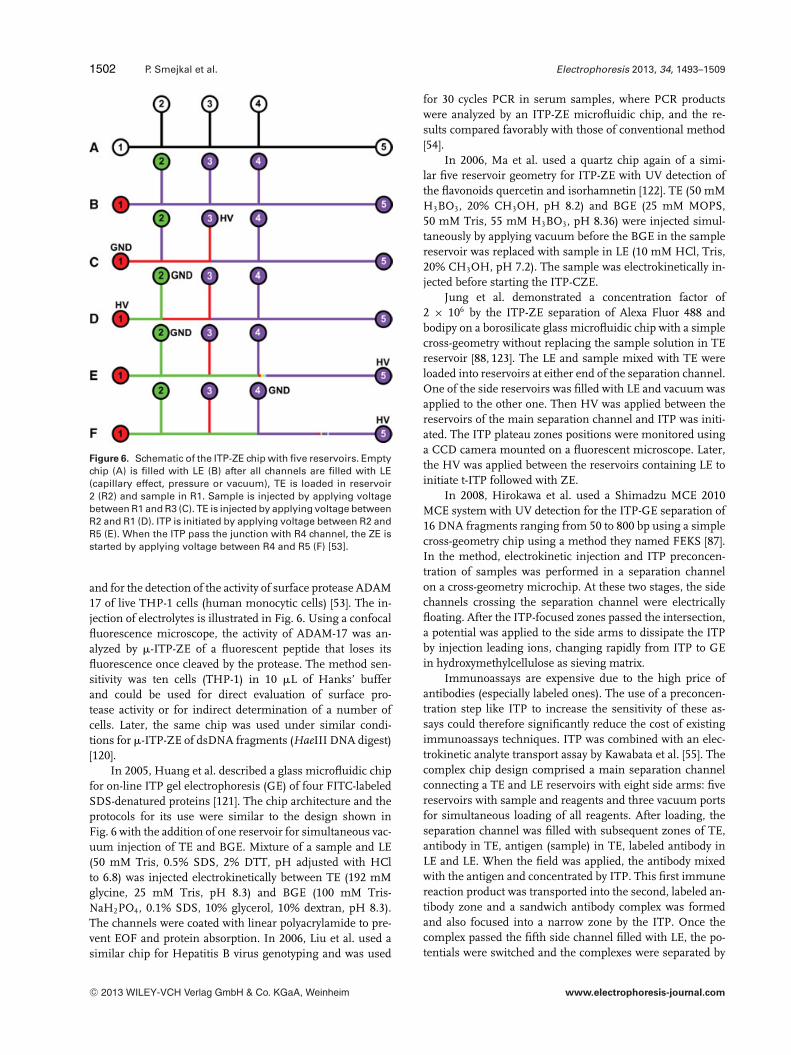
Figure 5. �-ITP-CE chip developed by research group of Kanian-sky made in PMMA. (A) The bottom substrate contained channelsin a PMMA block (30 × 70 mm). The volume of terminating elec-trolyte (TE) reservoir was 8.8 �L. Chip contained two sample loopsSL1 (9.2 �L) and SL2 (0.96 �L). SC1 is preseparation column andSC2 analytical column with volumes of 1.2 and 1.7 �L, respec-tively. The separation column splits in two at bifurcation point(BF). The volume of leading electrolyte reservoirs (LE1 and LE2)was 8.8 �L. D1 and D2 indicate the position of the conductivitydetectors. (B) The cover plate contained platinum electrodes fordetector 1 (D1a/b) and detector 2 (D2a/b) as well as the HV elec-trodes to drive the separations (HV). Reproduced with permissionfrom [119].
gle step by applying vacuum to the waste vial. The analysis oflactate from human serum was conducted in less than 1 min,with an LOD for lactate of 24 �M [49]. The synergy of the tech-nical strengths and advantages of a ready-to-use commercialfield-deployable instrument (Agilent Bioanalyzer), combinedwith the research flexibility of in-house designed chips fittedwithin the instrument, has proved to offer practical benefits,and is an exciting prospect with the potential to diminish bar-riers preventing a wider spread and success of microfluidics[117].
4 Preconcentration ITP
The self-focusing effect makes ITP an ideal preconcentrationtechnique, for example, when combined with a CZE sep-aration. A significant number of contribution in ITP-CZE[5] have been made by the group of Kaniansky. The initialwork using chips capable of ITP, ITP–ITP, and ITP-ZE waspublished in 2000 [118], with chips made in PMMA by hotembossing [119]. The initial design was optimized by straight-ening the channels to prevent trapping of bubbles formed byelectrolysis. While both designs were successfully used forITP separation of organic acids, well-developed ITP zoneswere obtained in the updated design despite longer analysistimes. The device shown in Fig. 5 was applied to a range ofsamples [45–47, 50–52, 70–72] as summarized in SupportingInformation Table 2.
In 2002, Wainright et al. used the ACLARA LabCardchips for ITP-ZE separation of 13 eTagTM fluorescent markers
C© 2013 WILEY-VCH Verlag GmbH & Co. KGaA, Weinheim www.electrophoresis-journal.com
1502 P. Smejkal et al. Electrophoresis 2013, 34, 1493–1509
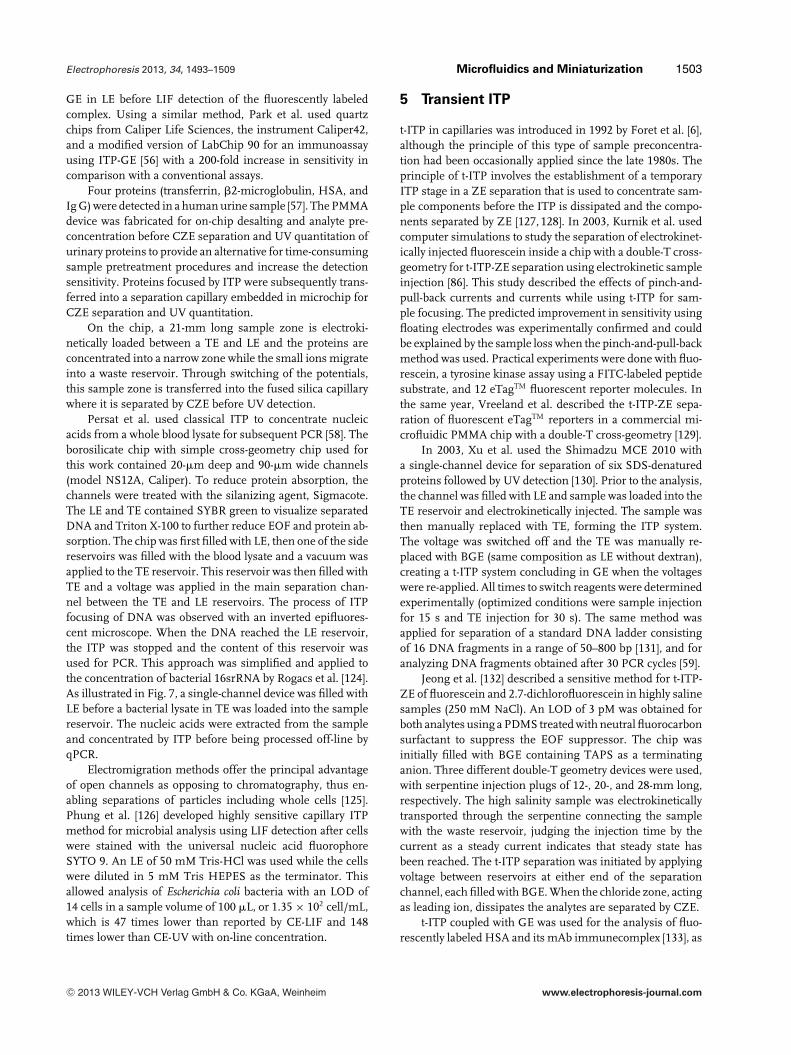
Figure 6. Schematic of the ITP-ZE chip with five reservoirs. Emptychip (A) is filled with LE (B) after all channels are filled with LE(capillary effect, pressure or vacuum), TE is loaded in reservoir2 (R2) and sample in R1. Sample is injected by applying voltagebetween R1 and R3 (C). TE is injected by applying voltage betweenR2 and R1 (D). ITP is initiated by applying voltage between R2 andR5 (E). When the ITP pass the junction with R4 channel, the ZE isstarted by applying voltage between R4 and R5 (F) [53].
and for the detection of the activity of surface protease ADAM17 of live THP-1 cells (human monocytic cells) [53]. The in-jection of electrolytes is illustrated in Fig. 6. Using a confocalfluorescence microscope, the activity of ADAM-17 was an-alyzed by �-ITP-ZE of a fluorescent peptide that loses itsfluorescence once cleaved by the protease. The method sen-sitivity was ten cells (THP-1) in 10 �L of Hanks’ bufferand could be used for direct evaluation of surface pro-tease activity or for indirect determination of a number ofcells. Later, the same chip was used under similar condi-tions for �-ITP-ZE of dsDNA fragments (HaeIII DNA digest)[120].
In 2005, Huang et al. described a glass microfluidic chipfor on-line ITP gel electrophoresis (GE) of four FITC-labeledSDS-denatured proteins [121]. The chip architecture and theprotocols for its use were similar to the design shown inFig. 6 with the addition of one reservoir for simultaneous vac-uum injection of TE and BGE. Mixture of a sample and LE(50 mM Tris, 0.5% SDS, 2% DTT, pH adjusted with HClto 6.8) was injected electrokinetically between TE (192 mMglycine, 25 mM Tris, pH 8.3) and BGE (100 mM Tris-NaH2PO4, 0.1% SDS, 10% glycerol, 10% dextran, pH 8.3).The channels were coated with linear polyacrylamide to pre-vent EOF and protein absorption. In 2006, Liu et al. used asimilar chip for Hepatitis B virus genotyping and was used
for 30 cycles PCR in serum samples, where PCR productswere analyzed by an ITP-ZE microfluidic chip, and the re-sults compared favorably with those of conventional method[54].
In 2006, Ma et al. used a quartz chip again of a simi-lar five reservoir geometry for ITP-ZE with UV detection ofthe flavonoids quercetin and isorhamnetin [122]. TE (50 mMH3BO3, 20% CH3OH, pH 8.2) and BGE (25 mM MOPS,50 mM Tris, 55 mM H3BO3, pH 8.36) were injected simul-taneously by applying vacuum before the BGE in the samplereservoir was replaced with sample in LE (10 mM HCl, Tris,20% CH3OH, pH 7.2). The sample was electrokinetically in-jected before starting the ITP-CZE.
Jung et al. demonstrated a concentration factor of2 × 106 by the ITP-ZE separation of Alexa Fluor 488 andbodipy on a borosilicate glass microfluidic chip with a simplecross-geometry without replacing the sample solution in TEreservoir [88, 123]. The LE and sample mixed with TE wereloaded into reservoirs at either end of the separation channel.One of the side reservoirs was filled with LE and vacuum wasapplied to the other one. Then HV was applied between thereservoirs of the main separation channel and ITP was initi-ated. The ITP plateau zones positions were monitored usinga CCD camera mounted on a fluorescent microscope. Later,the HV was applied between the reservoirs containing LE toinitiate t-ITP followed with ZE.
In 2008, Hirokawa et al. used a Shimadzu MCE 2010MCE system with UV detection for the ITP-GE separation of16 DNA fragments ranging from 50 to 800 bp using a simplecross-geometry chip using a method they named FEKS [87].In the method, electrokinetic injection and ITP preconcen-tration of samples was performed in a separation channelon a cross-geometry microchip. At these two stages, the sidechannels crossing the separation channel were electricallyfloating. After the ITP-focused zones passed the intersection,a potential was applied to the side arms to dissipate the ITPby injection leading ions, changing rapidly from ITP to GEin hydroxymethylcellulose as sieving matrix.
Immunoassays are expensive due to the high price ofantibodies (especially labeled ones). The use of a preconcen-tration step like ITP to increase the sensitivity of these as-says could therefore significantly reduce the cost of existingimmunoassays techniques. ITP was combined with an elec-trokinetic analyte transport assay by Kawabata et al. [55]. Thecomplex chip design comprised a main separation channelconnecting a TE and LE reservoirs with eight side arms: fivereservoirs with sample and reagents and three vacuum portsfor simultaneous loading of all reagents. After loading, theseparation channel was filled with subsequent zones of TE,antibody in TE, antigen (sample) in TE, labeled antibody inLE and LE. When the field was applied, the antibody mixedwith the antigen and concentrated by ITP. This first immunereaction product was transported into the second, labeled an-tibody zone and a sandwich antibody complex was formedand also focused into a narrow zone by the ITP. Once thecomplex passed the fifth side channel filled with LE, the po-tentials were switched and the complexes were separated by
C© 2013 WILEY-VCH Verlag GmbH & Co. KGaA, Weinheim www.electrophoresis-journal.com
Electrophoresis 2013, 34, 1493–1509 Microfluidics and Miniaturization 1503
GE in LE before LIF detection of the fluorescently labeledcomplex. Using a similar method, Park et al. used quartzchips from Caliper Life Sciences, the instrument Caliper42,and a modified version of LabChip 90 for an immunoassayusing ITP-GE [56] with a 200-fold increase in sensitivity incomparison with a conventional assays.
Four proteins (transferrin, �2-microglobulin, HSA, andIg G) were detected in a human urine sample [57]. The PMMAdevice was fabricated for on-chip desalting and analyte pre-concentration before CZE separation and UV quantitation ofurinary proteins to provide an alternative for time-consumingsample pretreatment procedures and increase the detectionsensitivity. Proteins focused by ITP were subsequently trans-ferred into a separation capillary embedded in microchip forCZE separation and UV quantitation.
On the chip, a 21-mm long sample zone is electroki-netically loaded between a TE and LE and the proteins areconcentrated into a narrow zone while the small ions migrateinto a waste reservoir. Through switching of the potentials,this sample zone is transferred into the fused silica capillarywhere it is separated by CZE before UV detection.
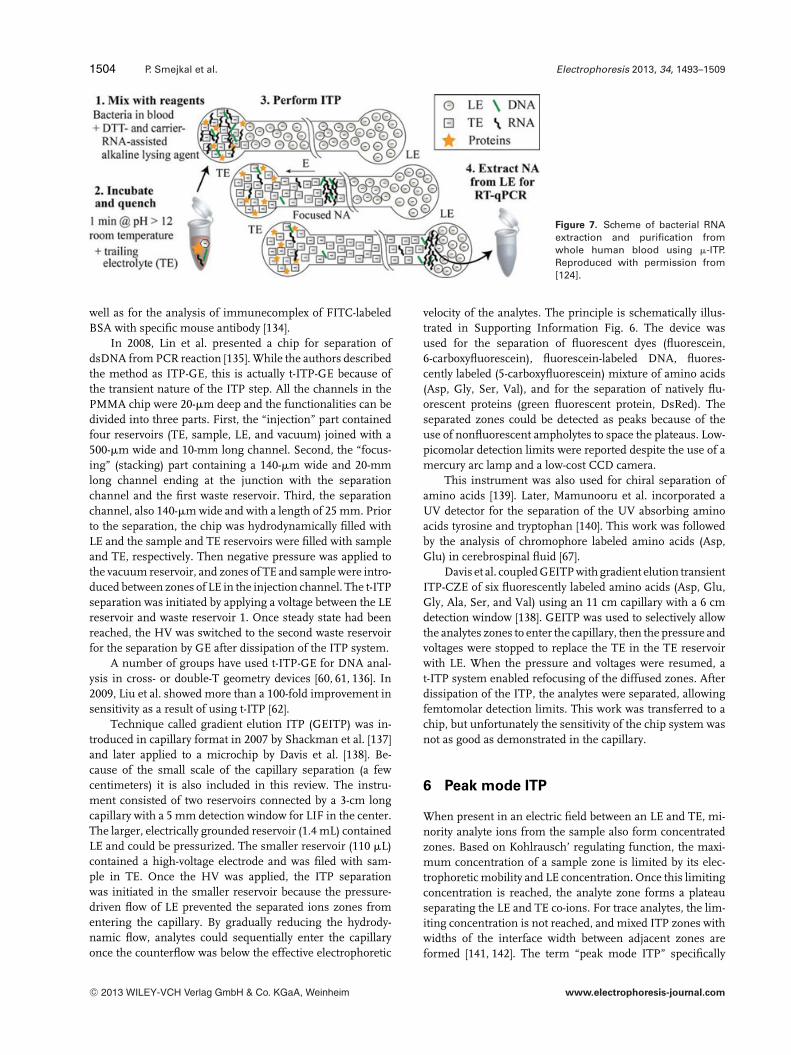
Persat et al. used classical ITP to concentrate nucleicacids from a whole blood lysate for subsequent PCR [58]. Theborosilicate chip with simple cross-geometry chip used forthis work contained 20-�m deep and 90-�m wide channels(model NS12A, Caliper). To reduce protein absorption, thechannels were treated with the silanizing agent, Sigmacote.The LE and TE contained SYBR green to visualize separatedDNA and Triton X-100 to further reduce EOF and protein ab-sorption. The chip was first filled with LE, then one of the sidereservoirs was filled with the blood lysate and a vacuum wasapplied to the TE reservoir. This reservoir was then filled withTE and a voltage was applied in the main separation chan-nel between the TE and LE reservoirs. The process of ITPfocusing of DNA was observed with an inverted epifluores-cent microscope. When the DNA reached the LE reservoir,the ITP was stopped and the content of this reservoir wasused for PCR. This approach was simplified and applied tothe concentration of bacterial 16srRNA by Rogacs et al. [124].As illustrated in Fig. 7, a single-channel device was filled withLE before a bacterial lysate in TE was loaded into the samplereservoir. The nucleic acids were extracted from the sampleand concentrated by ITP before being processed off-line byqPCR.
Electromigration methods offer the principal advantageof open channels as opposing to chromatography, thus en-abling separations of particles including whole cells [125].Phung et al. [126] developed highly sensitive capillary ITPmethod for microbial analysis using LIF detection after cellswere stained with the universal nucleic acid fluorophoreSYTO 9. An LE of 50 mM Tris-HCl was used while the cellswere diluted in 5 mM Tris HEPES as the terminator. Thisallowed analysis of Escherichia coli bacteria with an LOD of14 cells in a sample volume of 100 �L, or 1.35 × 10² cell/mL,which is 47 times lower than reported by CE-LIF and 148times lower than CE-UV with on-line concentration.
5 Transient ITP
t-ITP in capillaries was introduced in 1992 by Foret et al. [6],although the principle of this type of sample preconcentra-tion had been occasionally applied since the late 1980s. Theprinciple of t-ITP involves the establishment of a temporaryITP stage in a ZE separation that is used to concentrate sam-ple components before the ITP is dissipated and the compo-nents separated by ZE [127, 128]. In 2003, Kurnik et al. usedcomputer simulations to study the separation of electrokinet-ically injected fluorescein inside a chip with a double-T cross-geometry for t-ITP-ZE separation using electrokinetic sampleinjection [86]. This study described the effects of pinch-and-pull-back currents and currents while using t-ITP for sam-ple focusing. The predicted improvement in sensitivity usingfloating electrodes was experimentally confirmed and couldbe explained by the sample loss when the pinch-and-pull-backmethod was used. Practical experiments were done with fluo-rescein, a tyrosine kinase assay using a FITC-labeled peptidesubstrate, and 12 eTagTM fluorescent reporter molecules. Inthe same year, Vreeland et al. described the t-ITP-ZE sepa-ration of fluorescent eTagTM reporters in a commercial mi-crofluidic PMMA chip with a double-T cross-geometry [129].
In 2003, Xu et al. used the Shimadzu MCE 2010 witha single-channel device for separation of six SDS-denaturedproteins followed by UV detection [130]. Prior to the analysis,the channel was filled with LE and sample was loaded into theTE reservoir and electrokinetically injected. The sample wasthen manually replaced with TE, forming the ITP system.The voltage was switched off and the TE was manually re-placed with BGE (same composition as LE without dextran),creating a t-ITP system concluding in GE when the voltageswere re-applied. All times to switch reagents were determinedexperimentally (optimized conditions were sample injectionfor 15 s and TE injection for 30 s). The same method wasapplied for separation of a standard DNA ladder consistingof 16 DNA fragments in a range of 50–800 bp [131], and foranalyzing DNA fragments obtained after 30 PCR cycles [59].
Jeong et al. [132] described a sensitive method for t-ITP-ZE of fluorescein and 2.7-dichlorofluorescein in highly salinesamples (250 mM NaCl). An LOD of 3 pM was obtained forboth analytes using a PDMS treated with neutral fluorocarbonsurfactant to suppress the EOF suppressor. The chip wasinitially filled with BGE containing TAPS as a terminatinganion. Three different double-T geometry devices were used,with serpentine injection plugs of 12-, 20-, and 28-mm long,respectively. The high salinity sample was electrokineticallytransported through the serpentine connecting the samplewith the waste reservoir, judging the injection time by thecurrent as a steady current indicates that steady state hasbeen reached. The t-ITP separation was initiated by applyingvoltage between reservoirs at either end of the separationchannel, each filled with BGE. When the chloride zone, actingas leading ion, dissipates the analytes are separated by CZE.
t-ITP coupled with GE was used for the analysis of fluo-rescently labeled HSA and its mAb immunecomplex [133], as
C© 2013 WILEY-VCH Verlag GmbH & Co. KGaA, Weinheim www.electrophoresis-journal.com
1504 P. Smejkal et al. Electrophoresis 2013, 34, 1493–1509
Figure 7. Scheme of bacterial RNAextraction and purification fromwhole human blood using �-ITP.Reproduced with permission from[124].
well as for the analysis of immunecomplex of FITC-labeledBSA with specific mouse antibody [134].
In 2008, Lin et al. presented a chip for separation ofdsDNA from PCR reaction [135]. While the authors describedthe method as ITP-GE, this is actually t-ITP-GE because ofthe transient nature of the ITP step. All the channels in thePMMA chip were 20-�m deep and the functionalities can bedivided into three parts. First, the “injection” part containedfour reservoirs (TE, sample, LE, and vacuum) joined with a500-�m wide and 10-mm long channel. Second, the “focus-ing” (stacking) part containing a 140-�m wide and 20-mmlong channel ending at the junction with the separationchannel and the first waste reservoir. Third, the separationchannel, also 140-�m wide and with a length of 25 mm. Priorto the separation, the chip was hydrodynamically filled withLE and the sample and TE reservoirs were filled with sampleand TE, respectively. Then negative pressure was applied tothe vacuum reservoir, and zones of TE and sample were intro-duced between zones of LE in the injection channel. The t-ITPseparation was initiated by applying a voltage between the LEreservoir and waste reservoir 1. Once steady state had beenreached, the HV was switched to the second waste reservoirfor the separation by GE after dissipation of the ITP system.
A number of groups have used t-ITP-GE for DNA anal-ysis in cross- or double-T geometry devices [60, 61, 136]. In2009, Liu et al. showed more than a 100-fold improvement insensitivity as a result of using t-ITP [62].
Technique called gradient elution ITP (GEITP) was in-troduced in capillary format in 2007 by Shackman et al. [137]and later applied to a microchip by Davis et al. [138]. Be-cause of the small scale of the capillary separation (a fewcentimeters) it is also included in this review. The instru-ment consisted of two reservoirs connected by a 3-cm longcapillary with a 5 mm detection window for LIF in the center.The larger, electrically grounded reservoir (1.4 mL) containedLE and could be pressurized. The smaller reservoir (110 �L)contained a high-voltage electrode and was filed with sam-ple in TE. Once the HV was applied, the ITP separationwas initiated in the smaller reservoir because the pressure-driven flow of LE prevented the separated ions zones fromentering the capillary. By gradually reducing the hydrody-namic flow, analytes could sequentially enter the capillaryonce the counterflow was below the effective electrophoretic
velocity of the analytes. The principle is schematically illus-trated in Supporting Information Fig. 6. The device wasused for the separation of fluorescent dyes (fluorescein,6-carboxyfluorescein), fluorescein-labeled DNA, fluores-cently labeled (5-carboxyfluorescein) mixture of amino acids(Asp, Gly, Ser, Val), and for the separation of natively flu-orescent proteins (green fluorescent protein, DsRed). Theseparated zones could be detected as peaks because of theuse of nonfluorescent ampholytes to space the plateaus. Low-picomolar detection limits were reported despite the use of amercury arc lamp and a low-cost CCD camera.
This instrument was also used for chiral separation ofamino acids [139]. Later, Mamunooru et al. incorporated aUV detector for the separation of the UV absorbing aminoacids tyrosine and tryptophan [140]. This work was followedby the analysis of chromophore labeled amino acids (Asp,Glu) in cerebrospinal fluid [67].
Davis et al. coupled GEITP with gradient elution transientITP-CZE of six fluorescently labeled amino acids (Asp, Glu,Gly, Ala, Ser, and Val) using an 11 cm capillary with a 6 cmdetection window [138]. GEITP was used to selectively allowthe analytes zones to enter the capillary, then the pressure andvoltages were stopped to replace the TE in the TE reservoirwith LE. When the pressure and voltages were resumed, at-ITP system enabled refocusing of the diffused zones. Afterdissipation of the ITP, the analytes were separated, allowingfemtomolar detection limits. This work was transferred to achip, but unfortunately the sensitivity of the chip system wasnot as good as demonstrated in the capillary.
6 Peak mode ITP
When present in an electric field between an LE and TE, mi-nority analyte ions from the sample also form concentratedzones. Based on Kohlrausch’ regulating function, the maxi-mum concentration of a sample zone is limited by its elec-trophoretic mobility and LE concentration. Once this limitingconcentration is reached, the analyte zone forms a plateauseparating the LE and TE co-ions. For trace analytes, the lim-iting concentration is not reached, and mixed ITP zones withwidths of the interface width between adjacent zones areformed [141, 142]. The term “peak mode ITP” specifically
C© 2013 WILEY-VCH Verlag GmbH & Co. KGaA, Weinheim www.electrophoresis-journal.com

Electrophoresis 2013, 34, 1493–1509 Microfluidics and Miniaturization 1505
describes the ITP technique where analytes are concentratedbetween two zones to a maximum concentration below theirsteady state limit. The Santiago group exploited peak modeITP to concentrate trace amounts of analytes [33]. The twomost important differences between peak mode ITP and clas-sical, plateau mode ITP are in detection and quantificationof the analytes. In plateau mode ITP, a universal detector isused to detect the stepwise changes between zones, using thestep length as a measure of analyte concentration in the ini-tial sample. In peak mode ITP, an analyte-specific detectiontechnique is used to selectively measure a specific analyte.Because the limiting concentration is not reached, the sig-nal will be a peak, not a step, where the peak intensity is ameasure of the analyte concentration.
In 2009, Khurana et al. presented peak mode �-ITP withcontinuous sample injection (sample present mixed with TE)for the analysis of fluorescently labeled DNA and nativelyfluorescent proteins (green fluorescent protein and allophy-cocyanin) [143]. Peaks formed according to the analyte mo-bilities between nonfluorescent plateau zones of LE, carbon-ate, carbamate, and TE; the carbonate and carbamate werepresent as impurities in the TE. A simple, cross-geometry,glass Caliper NS-95A chip was used as a single-channel de-vice. While demonstrating the potential of peak mode ITP,the method was not really applicable for quantification due tothe limited separation capacity and the contamination withcarbonate and carbamate.
Schoch et al. described peak mode �-ITP with fluores-cence detection for the extraction, isolation, preconcentration,and quantification of micro-RNAs (miRNAs) [63]. miRNA isan 18–24 nucleotide long noncoding oligonucleotide whichregulates gene expression via sequence-specific interactionswith mediator RNA. Again a Caliper NS-95 chip was used assingle-channel device. In preparation for the analysis, the chipwas filled with LE (100 mM HCl, 140 mM 6-aminocaproicacid, pH 4) and placed for 10 min at 4�C. Subsequently, TEreservoir was filled with LE containing 30% Pluronic F-127and the separation channel was filled with LE by applying thenegative pressure to LE reservoir. After 10 min at ambienttemperature, the viscosity of Pluronic increased to form thesieving matrix and a mixture of the RNA sample in TE wasloaded in TE reservoir. The separation was started by apply-ing the HV between TE and LE reservoirs and miRNA couldbe quantified from ∼900 cells in ∼5 �L.
Persat et al. continued Schoch’s research into quantifica-tion of miRNA and introduced selective ITP using three LEsin a more complex Caliper NS260 chip (eight reservoirs) [64].The sample of miRNA was mixed with TE. Using the chan-nel geometry and negative pressure, the separation channelwas filled with subsequent zones of the three different Les.This multielectrolyte system improved specificity and selec-tivity of the peak mode ITP method for miRNA sequencesshorter than 40 nucleotides and was used for quantificationof miRNA in cell cultures (HeLa and Hepa1–6). A similarmethod was used to visualize the separation of miRNA us-ing specific molecular beacons [65]. The molecular beaconswere mixed with the three LEs and because the mobility of
Figure 8. Scheme depicting acceleration of nucleic acid hybridiza-tion reactions using ITP. Two single-stranded DNA species A (an-alyte) and B (probe) are focused at a narrow interface betweenTE and LE in a microchannel. TE and LE are chosen such thattheir mobility bound all of the nucleic acid mobility. In this modelsystem, species A is mixed with TE, and species B is mixed withLE, thus reaction occurs only at the interface where both speciesfocus. The high concentrations of reactants at the interface leadto a corresponding increase in hybridization reaction rate. Thearrow lengths at the top, respectively, denote the relative speedof species A in TE, of the ITP interface, and of species B in LE (LEand TE ions migrate at velocities equal to that of ITP interface).We consider a control volume moving with the interface at a ve-locity VITP. The control volume extends over a length L, which issignificantly larger than the characteristic interface width, �, asshown. Reproduced with permission from [144].
miRNA and molecular beacons was slower than the LE butfaster than the mobility of TE, the miRNAs and the molecularbeacons migrated in a mixed peak zone. Hybridization andthrerefore visualization only occurred in LE3 because of thelower urea concentration. This method enabled the specificdetection and quantification of miR-122 in liver tissue.
In 2011, Bercovici et al. described the use of speciallydesigned molecular beacons for quantification of 16S rRNAfrom E. coli in human urine samples using a cross-geometryCaliper NS-95 device [66]. Urine samples were centrifuged,cells from sediment were lysed, mixed with a solution ofmolecular beacon and subsequently with TE (50 mM tricine,100 mM bis-tris). The sample was loaded onto the chip thatwas prefilled with LE and E. coli could be detected in bacterialcultures as well as in urine samples in the clinically relevantrange (1 × 10⁶–1 × 10⁸/mL).
A very exciting prospect is in-line hybridization utiliz-ing the focusing properties of ITP. Bercovici et al. [144] used�-ITP to control and increase the rate of nucleic acid hy-bridization reactions in free solution with four orders ofmagnitude decreased reaction time. The formation of mixedconcentrated zones concentrating two different reactants inthe same spot facilitates this and this makes it a very uniquefeature of this approach. The scheme is illustrated in Fig. 8.
7 Free-flow ITP
Most electrophoretic methods are applied to discrete sam-ples, but in the free-flow format where an electric field
C© 2013 WILEY-VCH Verlag GmbH & Co. KGaA, Weinheim www.electrophoresis-journal.com

1506 P. Smejkal et al. Electrophoresis 2013, 34, 1493–1509
for the separation is applied perpendicular to the flow ofsample and buffer, sample can be introduced continuously[145–147]. Free-flow electrophoretic methods are suitable forminiaturization and a reviews on miniaturized free-flow elec-trophoretic techniques were published in 2007 [148] and 2009[27,149]. In free-flow ITP (FFITP), a discontinuous buffer sys-tem is pumped through the separation chamber and was firstperformed on a PDMS chip in 2006 [150]. Collapsing of theseparation chamber was prevented using 30 �m square sup-porting posts in the chamber, leaving only 10 �m spaces be-tween the posts for FFITP. A schematic drawing of the FFITPdevice (without supporting posts) is shown in Supporting In-formation Fig. 7. The three reservoirs at the north side of thechip were filled with TE, sample, and LE. The west and eastreservoirs along the separation chamber contained electrodesand were filled with TE and LE, respectively. The end of theseparation chamber was connected to the outlet channels forcollection of the separated fractions. In this study, however,the outlet channels were joined to apply a vacuum to drivethe hydrodynamic flow in the chamber. The separation of flu-orescein, eosin G, and acetylsalicylic acid and the separationof myoglobin-FITC, serine, and FITC were documented byusing a CCD color camera.
Later, Janasek et al. introduced electrostatic inductionFFITP of fluorescein in a glass chip [151]. The mask de-sign of the chip was similar to the chip described previously,but the west and east reservoirs containing electrodes wereseparated from the main chamber by a 146-�m thick glasswall. In the mask, the supporting poles were 40 �m, but thewet etching reduced the posts to 20 �m high bumps in the30 �m high chamber; it is unclear if the posts played any rolein preventing sagging of the glass. The technical advance,however, was that by separating the electrodes from the sepa-ration chamber, the potential applied to the electrodes couldbe transferred to the glass walls but the current was zero. ITPzones were formed in the electric field in the separation cham-ber but in this no current scenario, there was no movementof the zones toward the electrodes. This phenomenon wascalled electrostatic induction FFITP and was demonstratedfor concentrating fluorescein.
Prest et al. [152] introduced a design of miniaturized free-flow electrophoresis device formed of polystyrene with carbonfiber loaded polystyrene drive electrodes and produced usinginjection molding, containing a separation chamber 45-mmlong by 31.7-mm wide with a depth of 50 �m with nine in-let and nine outlet holes to allow for fraction collection. Theoperation of the devices was demonstrated by performingseparations of dyes and bacterial samples containing the bac-terium Erwinia herbicola, a biological pathogen, and showedthat fractionation of the output was achieved.
8 Concluding remarks
The first report of microfabricated devices for ITP predatingthe introduction of the �TAS concept by 23 years illustratesthe significant advantages of miniaturization and microfabri-
cation for ITP and ITP-coupled methods. After the popularityof ITP sharply declined in the 1990s with the rise of CEfollowing the introduction of fused silica capillaries, the flex-ibility in design offered by microfluidic chips combined witha need for a robust sample concentration/clean-up techniquecompatible with miniaturization led to renewed interest inanalytical ITP in microfluidic chip format (�-ITP).
Developments in these areas have been underpinnedby the use of 1D dynamic simulators such as GENTRANS,SPRESSO, and SIMUL, which have provided researcherswith a deep insight into the physics underlying variouselectrophoretic separations in a relatively short period oftime. However, multidimensional software will be neededto explore the multifaceted dynamics of microfluidic proto-cols that occur in networked and 2D microchips, particu-larly as the ability to exploit changes in microchannel ge-ometry presents significant possibilities to improve the ITPperformance.
The review also highlights that the strength of �-ITP is inthe area of sample preparation/concentration because of itsability to concentrate trace components while reducing matrixcomponents. In this area in particularly, it has been shownto be useful for the analysis of small molecules, includinginorganic ions, organic acids, and fluorescent dyes as wellas large biomolecules including proteins. Significantly, whencombined with the use of cascading channels with decreasingwidth and depth, concentration factors of up to 10 000 havebeen demonstrated using this powerful approach. The use ofpeak mode ITP for both purification of DNA as well as RNAdirectly from lysed biological samples and to increase rapidhybridization kinetics is very significant development towardthe creation of simple, functional, and usable �TAS devices.
It is abundantly clear from the literature covered here thatthere are many applications of �-ITP in a range of disciplinesand areas. Its greatest strength is the ability to reduce samplecomplexity by both increasing the concentration of trace com-ponents and decreasing matrix ions—in effect it is the greatequalizer. It is this unique capability that can be performed inopen channels that are technically simple to fabricate that canbe used at low voltages because the steady-state boundariescounteract diffusion that ensure �-ITP will play a significantrole in the development of many true sample-in/answer-out�TAS approaches.
For the analysis of small molecules using plateau modeITP, one of the principal developments was the introductionof indirect fluorescence detection, enabling the detection andvisualization of nonfluorescent analytes. Peak mode ITP is apowerful way to concentrate trace analytes, and has changedthe perspectives on detection in ITP by advocating a role forselective detection.
Open channels in electromigration separations as op-posed to chromatography offer a principal advantage for sep-arations of whole cells. The role of ITP for their preconcen-tration, focusing, and sorting is likely to be one of very exitingareas of research in the area of �-ITP. In this regard also rapidin-line hybridization has a future potential as it can provide�-ITP an edge over competing methods.
C© 2013 WILEY-VCH Verlag GmbH & Co. KGaA, Weinheim www.electrophoresis-journal.com
Electrophoresis 2013, 34, 1493–1509 Microfluidics and Miniaturization 1507
This work was supported by the Grant Agency of the CzechRepublic (P301/11/2055 and P206/12/G014) and the institu-tional research plan (UIACH 68081715). MCB would like tothank the Australian Research Council for funding and provi-sion of a QEII Fellowship (DP0984745), and MM would liketo acknowledge the Australian Research Council for funding andprovision of a Future Fellowship (FT120100559).
The authors have declared no conflict of interest.
9 References
[1] Kendall, J., Crittenden, E. D., Proc. Natl. Acad. Sci. USA1923, 9, 75–78.
[2] Ornstein, L., Ann New York Acad. Sci. 1964, 121,321–349.
[3] Jorgenson, J. W., Lukacs, K. D., Anal. Chem. 1981, 53,1298–1302.
[4] Jorgenson, J. W., Lukacs, K. D., Science 1983, 222,266–272.
[5] Kaniansky, D., Marak, J., J. Chromatogr. 1990, 498,191–204.
[6] Foret, F., Szoko, E., Karger, B. L., J. Chromatogr. 1992,608, 3–12.
[7] Manz, A., Graber, N., Widmer, H. M., Sensor. Actuat.B-Chem. 1990, 1, 244–248.
[8] Walker, P. A., Morris, M. D., Burns, M. A., Johnson, B.N., Anal. Chem. 1998, 70, 3766–3769.
[9] Bocek, P., Deml, M., Janak, J., J. Chromatogr. 1975, 106,283–290.
[10] Bahga, S. S., Santiago, J. G., Analyst 2013, 138,735–754.
[11] Breadmore, M. C., Shallan, A. I., Rabanes, H. R., Gstoet-tenmayr, D., Abdul Keyon, A. S., Gaspar, A., Dawod, M.,Quirino, J. P., Electrophoresis 2013, 34, 29–54.
[12] Mala, Z., Gebauer, P., Bocek, P., Electrophoresis 2013,34, 19–28.
[13] Garcia-Schwarz, G., Rogacs, A., Bahga, S. S., Santiago,J. G., J. Vis. Exp. 2012, 61, 3890–3897.
[14] Stoyanov, A., Electrophoresis 2012, 33, 3281–3290.
[15] Wen, Y. Y., Li, J. H., Ma, J. P., Chen, L. X., Electrophoresis2012, 33, 2933–2952.
[16] Krizek, T., Kubickova, A., Anal. Bioanal. Chem. 2012, 403,2185–2195.
[17] Kitagawa, F., Kawai, T., Sueyoshi, K., Otsuka, K., Anal.Sci. 2012, 28, 85–93.
[18] Kasicka, V., Electrophoresis 2012, 33, 48–73.
[19] Kenyon, S. M., Meighan, M. M., Hayes, M. A., Elec-trophoresis 2011, 32, 482–493.
[20] Gebauer, P., Mala, Z., Bocek, P., Electrophoresis 2011,32, 83–89.
[21] Breadmore, M. C., Dawod, M., Quirino, J. P., Elec-trophoresis 2011, 32, 127–148.
[22] Lopez-Lorente, A. I., Simonet, B. M., Valcarcel, M., Trac-Trend. Anal. Chem. 2011, 30, 58–71.
[23] Frost, N. W., Jing, M., Bowser, M. T., Anal. Chem. 2010,82, 4682–4698.
[24] Thormann, W., Breadmore, M. C., Caslavska, J.,Mosher, R. A., Electrophoresis 2010, 31, 726–754.
[25] Persat, A., Chambers, R. D., Santiago, J. G., Lab. Chip.2009, 9, 2437–2453.
[26] Persat, A., Suss, M. E., Santiago, J. G., Lab. Chip. 2009,9, 2454–2469.
[27] Turgeon, R. T., Bowser, M. T., Anal. Bioanal. Chem. 2009,394, 187–198.
[28] Landers, J. P., Handbook of Capillary and MicrochipElectrophoresis and Associated Microtechniques, CRC,Boca Raton, FL 2008.
[29] Gebauer, P., Mala, Z., Bocek, P., Electrophoresis 2007,28, 26–32.
[30] Chen, L., Prest, J. E., Fielden, P. R., Goddard, N. J., Manz,A., Day, P. J. R., Lab. Chip. 2006, 6, 474–487.
[31] Evenhuis, C. J., Guijt, R. M., Macka, M., Haddad, P. R.,Electrophoresis 2004, 25, 3602–3624.
[32] Kaniansky, D., Masar, M., Bodor, R., Zuborova, M.,Olvecka, E., Johnck, M., Stanislawski, B., Electrophore-sis 2003, 24, 2208–2227.
[33] Khurana, T. K., Santiago, J. G., Anal. Chem. 2008, 80,6300–6307.
[34] Prusık, Z., J. Chromatogr. A 1974, 91, 867–872.
[35] Kasicka, V., Prusık, Z., J. Chromatogr. A 1987, 390,27–37.
[36] Prest, J. E., Baldock, S. J., Fielden, P. R., Goddard, N. J.,Brown, B. J. T., Analyst 2003, 128, 1131–1136.
[37] Prest, J. E., Baldock, S. J., Fielden, P. R., Goddard,N. J., Brown, B. J. T., J. Chromatogr. A 2004, 1051,221–226.
[38] Prest, J. E., Baldock, S. J., Fielden, P. R., Goddard, N.J., Kalimeri, K., Brown, B. J. T., Zgraggen, M., J. Chro-matogr. A 2004, 1047, 289–298.
[39] Prest, J. E., Baldock, S. J., Fielden, P. R., Goddard, N. J.,Brown, B. J. T., Microchim. Acta 2005, 151, 223–230.
[40] Prest, J. E., Beardah, M. S., Baldock, S. J., Doyle, S. P.,Fielden, P. R., Goddard, N. J., Brown, B. J. T., J. Chro-matogr. A 2008, 1195, 157–163.
[41] Prest, J. E., Baldock, S. J., Fielden, P. R., Goddard, N.J., Brown, B. J. T., Anal. Bioanal. Chem. 2009, 394,1299–1305.
[42] Prest, J. E., Baldock, S. J., Fielden, P. R., Goddard, N. J.,Brown, B. J. T., J. Chromatogr. A 2003, 990, 325–334.
[43] Kaigala, G. V., Bercovici, M., Behnam, M., Elliott, D.,Santiago, J. G., Backhouse, C. J., Lab. Chip. 2010, 10,2242–2250.
[44] Bottenus, D., Hossan, M. R., Ouyang, Y. X., Dong, W. J.,Dutta, P., Ivory, C. F., Lab. Chip. 2011, 11, 3793–3801.
[45] Masar, M., Kaniansky, D., Bodor, R., Johnck, M., Stanis-lawski, B., J. Chromatogr. A 2001, 916, 167–174.
[46] Bodor, R., Madajova, V., Kaniansky, D., Masar, M.,Johnck, M., Stanislawski, B., J. Chromatogr. A 2001,916, 155–165.
[47] Bodor, R., Zuborova, M., Olvecka, E., Madajova, V.,Masar, M., Kaniansky, D., Stanislawski, B., J. Sep. Sci.2001, 24, 802–809.
[48] Smejkal, P., Breadmore, M. C., Guijt, R. M., Foret, F., Bek,F., Macka, M., Electrophoresis 2012, 33, 3166–3172.
C© 2013 WILEY-VCH Verlag GmbH & Co. KGaA, Weinheim www.electrophoresis-journal.com
1508 P. Smejkal et al. Electrophoresis 2013, 34, 1493–1509
[49] Smejkal, P., Breadmore, M. C., Guijt, R. M., Foret, F.,Bek, F., Macka, M., Anal. Chim. Acta 2013, in press, DOI:10.1016/j.aca.2013.01.046.
[50] Bodor, P., Kaniansky, D., Masar, M., Silleova, K., Stanis-lawski, B., Electrophoresis 2002, 23, 3630–3637.
[51] Masar, M., Dankova, M., Olvecka, E., Stachurova, A.,Kaniansky, D., Stanislawski, B., J. Chromatogr. A 2004,1026, 31–39.
[52] Masar, M., Dankova, M., Olvecka, E., Stachurova, A.,Kaniansky, D., Stanislawski, B., J. Chromatogr. A 2005,1084, 101–107.
[53] Wainright, A., Williams, S. J., Ciambrone, G., Xue, Q. F.,Wei, J., Harris, D., J. Chromatogr. A 2002, 979, 69–80.
[54] Liu, D. Y., Shi, M., Huang, H. Q., Long, Z. C., Zhou, X. M.,Qin, J. H., Lin, B. C., J. Chromatogr. B Analyt. Technol.Biomed. Life Sci. 2006, 844, 32–38.
[55] Kawabata, T., Wada, H. G., Watanabe, M., Satomura, S.,Electrophoresis 2008, 29, 1399–1406.
[56] Park, C. C., Kazakova, I., Kawabata, T., Spaid, M., Chien,R. L., Wada, H. G., Satomura, S., Anal. Chem. 2008, 80,808–814.
[57] Wu, R. G., Yeung, W. S. B., Fung, Y. S., Electrophoresis2011, 32, 3406–3414.
[58] Persat, A., Marshall, L. A., Santiago, J. G., Anal. Chem.2009, 81, 9507–9511.
[59] Xu, Z. Q., Nishine, T., Arai, A., Hirokawa, T., Elec-trophoresis 2004, 25, 3875–3881.
[60] Wang, L. H., Liu, D. Y., Chen, H., Zhou, X. M., Elec-trophoresis 2008, 29, 4976–4983.
[61] Liu, D. Y., Ou, Z. Y., Xu, M. F., Wang, L. H., J. Chromatogr.A 2008, 1214, 165–170.
[62] Liu, D. Y., Chen, B., Wang, L. H., Zhou, X. M., Elec-trophoresis 2009, 30, 4300–4305.
[63] Schoch, R. B., Ronaghi, M., Santiago, J. G., Lab. Chip.2009, 9, 2145–2152.
[64] Persat, A., Chivukula, R. R., Mendell, J. T., Santiago, J.G., Anal. Chem. 2010, 82, 9631–9635.
[65] Persat, A., Santiago, J. G., Anal. Chem. 2011, 83,2310–2316.
[66] Bercovici, M., Kaigala, G. V., Mach, K. E., Han, C. M.,Liao, J. C., Santiago, J. G., Anal. Chem. 2011, 83,4110–4117.
[67] Vyas, C. A., Mamunooru, M., Shackman, J. G., Chro-matographia 2009, 70, 151–156.
[68] Prest, J. E., Baldock, S. J., Fielden, P. R., Goddard, N. J.,Brown, B. J. T., Analyst 2005, 130, 1375–1382.
[69] Prest, J. E., Fielden, P. R., Anal. Bioanal. Chem. 2005,382, 1339–1342.
[70] Olvecka, E., Masar, M., Kaniansky, D., Johnck, M.,Stanislawski, B., Electrophoresis 2001, 22, 3347–3353.
[71] Grass, B., Hergenroder, R., Neyer, A., Siepe, D., J.Separ. Sci. 2002, 25, 135–140.
[72] Olvecka, E., Kaniansky, D., Pollak, B., Stanislawski, B.,Electrophoresis 2004, 25, 3865–3874.
[73] Bier, M., Palusinski, O. A., Mosher, R. A., Saville, D. A.,Science 1983, 219, 1281–1287.
[74] Thormann, W., Caslavska, J., Breadmore, M. C.,Mosher, R. A., Electrophoresis 2009, 30, S16–S26.
[75] Palusinski, O. A., Graham, A., Mosher, R. A., Bier, M.,Saville, D. A., Aiche J. 1986, 32, 215–223.
[76] Saville, D. A., Palusinski, O. A., Aiche J. 1986, 32,207–214.
[77] Mosher, R. A., Saville, D. A., The Dynamics of Elec-trophoresis, VCH, Weinheim, New York 1992.
[78] Hruska, V., Jaros, M., Gas, B., Electrophoresis 2006, 27,984–991.
[79] Bercovici, M., Lele, S. K., Santiago, J. G., J. Chromatogr.A 2009, 1216, 1008–1018.
[80] Mosher, R. A., Breadmore, M. C., Thormann, W., Elec-trophoresis 2011, 32, 532–541.
[81] Bercovici, M., Lele, S. K., Santiago, J. G., J. Chromatogr.A 2010, 1217, 588–599.
[82] Bahga, S. S., Bercovici, M., Santiago, J. G., Elec-trophoresis 2010, 31, 910–919.
[83] Bahga, S. S., Kaigala, G. V., Bercovici, M., Santiago, J.G., Electrophoresis 2011, 32, 563–572.
[84] Breadmore, M. C., Kwan, H. Y., Caslavska, J., Thormann,W., Electrophoresis 2012, 33, 958–969.
[85] Jacobson, S. C., Hergenroder, R., Koutny, L. B., War-mack, R. J., Ramsey, J. M., Anal. Chem. 1994, 66,1107–1113.
[86] Kurnik, R. T., Boone, T. D., Nguyen, U., Ricco, A. J.,Williams, S. J., Lab. Chip. 2003, 3, 86–92.
[87] Hirokawa, T., Takayama, Y., Arai, A., Xu, Z. Q., Elec-trophoresis 2008, 29, 1829–1835.
[88] Jung, B., Bharadwaj, R., Santiago, J. G., Anal. Chem.2006, 78, 2319–2327.
[89] Bahga, S. S., Chambers, R. D., Santiago, J. G., Anal.Chem. 2011, 83, 6154–6162.
[90] Cui, H. C., Dutta, P., Ivory, C. F., Electrophoresis 2007,28, 1138–1145.
[91] Cui, H. C., Huang, Z., Dutta, P., Ivory, C. F., Anal. Chem.2007, 79, 1456–1465.
[92] Tsai, C. H., Wang, Y. N., Lin, C. F., Yang, R. J., Fu, L. M.,Electrophoresis 2006, 27, 4991–4998.
[93] Schonfeld, F., Goet, G., Baier, T., Hardt, S., Phys. Fluids2009, 21, 092002, DOI: 10.1063/1.3222866.
[94] Liu, B., Ivory, C. F., J. Sep. Sci. 2013, in press, DOI:10.1002/jssc.201300066.
[95] Everaerts, F. M., Vacik, J., J. Chromatogr. A 1970, 49,262–268.
[96] Dolnik, V., Deml, M., Bocek, P., J. Chromatogr. 1985, 320,89–97.
[97] Paschkewitz, J. S., Molho, J. I., Xu, H., Bharadwaj, R.,Park, C. C., Electrophoresis 2007, 28, 4561–4571.
[98] Kasicka, V., Prusik, Z., Gas, B., Stedry, M., Electrophore-sis 1995, 16, 2034–2038.
[99] Harrison, S. L. M., Chemical Engineering, WashingtonState University, Pullman 2007, p. 69.
[100] Breadmore, M. C., Electrophoresis 2008, 29, 1082–1091.
[101] Bottenus, D., Jubery, T. Z., Dutta, P., Ivory, C. F., Elec-trophoresis 2011, 32, 550–562.
[102] Prest, J. E., Baldock, S. J., Bektas, N., Fielden,P. R., Brown, B. J. T., J. Chromatogr. A 1999, 836,59–65.
C© 2013 WILEY-VCH Verlag GmbH & Co. KGaA, Weinheim www.electrophoresis-journal.com
Electrophoresis 2013, 34, 1493–1509 Microfluidics and Miniaturization 1509
[103] Baldock, S. J., Bektas, N., Fielden, P. R., Goddard, N. J.,Pickering, L. W., Prest, J. E., Snook, R. D., Brown,B. J. T., Vaireanu, D. I., Isotachophoresis on PlanarPolymeric Substrates, Springer, Dordrecht 2000.
[104] Prest, J. E., Baldock, S. J., Fielden, P. R., Brown, B. J. T.,Analyst 2001, 126, 433–437.
[105] Prest, J. E., Baldock, S. J., Fielden, P. R., Goddard, N. J.,Brown, B. J. T., Analyst 2002, 127, 1413–1419.
[106] Baldock, S. J., Fielden, P. R., Goddard, N. J., Prest, J. E.,Brown, B. J. T., J. Chromatogr. A 2003, 990, 11–22.
[107] Baldock, S. J., Fielden, P. R., Goddard, N. J., Kretschmer,H. R., Prest, J. E., Brown, B. J. T., J. Chromatogr. A 2004,1042, 181–188.
[108] Prest, J. E., Baldock, S. J., Fielden, P. R., Goddard, N. J.,Mohr, S., Brown, B. J. T., J. Chromatogr. A 2006, 1119,183–187.
[109] Macka, M., Johns, C., Doble, P., Haddad, P. R., LC-GCNorth America 2001, 19, 38–47.
[110] Macka, M., Johns, C., Doble, P., Haddad, P. R., LC-GCNorth America 2001, 19, 178–188.
[111] Reijenga, J. C., Verheggen, T. P. E. M., Everaerts, F. M.,J. Chromatogr. A 1984, 283, 99–111.
[112] Khurana, T. K., Santiago, J. G., Anal. Chem. 2008, 80,279–286.
[113] Bercovici, M., Kaigala, G. V., Santiago, J. G., Anal.Chem. 2010, 82, 2134–2138.
[114] Chambers, R. D., Santiago, J. G., Anal. Chem. 2009, 81,3022–3028.
[115] Bottenus, D., Jubery, T. Z., Ouyang, Y. X., Dong, W. J.,Dutta, P., Ivory, C. F., Lab. Chip. 2011, 11, 890–898.
[116] Smejkal, P., Breadmore, M. C., Guijt, R. M., Grym, J.,Foret, F., Bek, F., Macka, M., Anal. Chim. Acta 2012, 755,115–120.
[117] Mark, D., von Stetten, F., Zengerle, R., Lab. Chip. 2012,12, 2464–2468.
[118] Kaniansky, D., Masar, M., Bielcikova, J., Ivanyi, F., Eisen-beiss, F., Stanislawski, B., Grass, B., Neyer, A., Johnck,M., Anal. Chem. 2000, 72, 3596–3604.
[119] Grass, B., Neyer, A., Johnck, M., Siepe, D., Eisenbeiss,F., Weber, G., Hergenroder, R., Sensor. Actuat. B-Chem.2001, 72, 249–258.
[120] Wainright, A., Nguyen, U. T., Bjornson, T., Boone, T. D.,Electrophoresis 2003, 24, 3784–3792.
[121] Huang, H. Q., Xu, F., Dai, Z. P., Lin, B. C., Electrophoresis2005, 26, 2254–2260.
[122] Ma, B., Zhou, X. M., Wang, G., Huang, H. Q., Dai,Z. P., Qin, J. H., Lin, B. C., Electrophoresis 2006, 27,4904–4909.
[123] Jung, B. G., Zhu, Y. G., Santiago, J. G., Anal. Chem.2007, 79, 345–349.
[124] Rogacs, A., Qu, Y., Santiago, J. G., Anal. Chem. 2012,84, 5858–5863.
[125] Petr, J., Maier, V., TrAC-Trend. Anal. Chem. 2012, 31,9–22.
[126] Phung, S. C., Nai, Y. H., Powell, S. M., Macka,M., Breadmore, M. C., Electrophoresis 2013, 34,1657–1662.
[127] Krivankova, L., Gebauer, P., Bocek, P., J. Chromatogr. A1995, 716, 35–48.
[128] Krivankova, L., Pantuckova, P., Bocek, P., J. Chromatogr.A 1999, 838, 55–70.
[129] Vreeland, W. N., Williams, S. J., Barron, A. E., Sassi,A. P., Anal. Chem. 2003, 75, 3059–3065.
[130] Xu, Z. Q., Ando, T., Nishine, T., Arai, A., Hirokawa, T.,Electrophoresis 2003, 24, 3821–3827.
[131] Xu, Z. Q., Hirokawa, T., Nishine, T., Arai, A., J. Chro-matogr. A 2003, 990, 53–61.
[132] Jeong, Y. W., Choi, K. W., Kang, M. K., Chun, K. J.,Chung, D. S., Sensor. Actuat. B-Chem. 2005, 104,269–275.
[133] Mohamadi, M. R., Kaji, N., Tokeshi, M., Baba, Y., Anal.Chem. 2007, 79, 3667–3672.
[134] Wang, J., Zhang, Y., Mohamadi, M. R., Kaji, N.,Tokeshi, M., Baba, Y., Electrophoresis 2009, 30,3250–3256.
[135] Lin, C. C., Hsu, B. K., Chen, S. H., Electrophoresis 2008,29, 1228–1236.
[136] Nagata, H., Ishikawa, M., Yoshida, Y., Tanaka, Y., Hirano,K., Electrophoresis 2008, 29, 3744–3751.
[137] Shackman, J. G., Ross, D., Anal. Chem. 2007, 79,6641–6649.
[138] Davis, N. I., Mamunooru, M., Vyas, C. A., Shackman, J.G., Anal. Chem. 2009, 81, 5452–5459.
[139] Danger, G., Ross, D., Electrophoresis 2008, 29,4036–4044.
[140] Mamunooru, M., Jenkins, R. J., Davis, N. I., Shackman,J. G., J. Chromatogr. A 2008, 1202, 203–211.
[141] Svoboda, M., Vacik, J., J. Chromatogr. 1976, 119,539–547.
[142] Gebauer, P., Bocek, P., Electrophoresis 1995, 16,1999–2007.
[143] Khurana, T. K., Santiago, J. G., Lab. Chip. 2009, 9,1377–1384.
[144] Bercovici, M., Han, C. M., Liao, J. C., Santiago, J. G.,Proc. Natl. Acad. Sci. USA 2012, 109, 11127–11132.
[145] Canut, H., Bauer, J., Weber, G., J. Chromatogr. B 1999,722, 121–139.
[146] Hannig, K., Fresenius’ Zeitschrift fur AnalytischeChemie 1961, 181, 244–254.
[147] Roman, M. C., Brown, P. R., Anal. Chem. 1994, 66,86A–94A.
[148] Kohlheyer, D., Eijkel, J. C. T., van den Berg, A.,Schasfoort, R. B. M., Electrophoresis 2008, 29,977–993.
[149] Kasicka, V., Electrophoresis 2009, 30, S40–S52.
[150] Janasek, D., Schilling, M., Franzke, J., Manz, A., Anal.Chem. 2006, 78, 3815–3819.
[151] Janasek, D., Schilling, M., Manz, A., Franzke, J., Lab.Chip. 2006, 6, 710–713.
[152] Prest, J. E., Baldock, S. J., Fielden, P. R., Goddard, N. J.,Goodacre, R., O’Connor, R., Brown, B. J. T., J. Chro-matogr. B Analyt. Technol. Biomed. Life Sci. 2012, 903,53–59.
C© 2013 WILEY-VCH Verlag GmbH & Co. KGaA, Weinheim www.electrophoresis-journal.com
Related Documents