Microfluidic and micro-core methods for enhanced oil recovery and carbon storage applications by Phong Nguyen A thesis submitted in conformity with the requirements for the degree of Doctor of Philosophy Mechanical & Industrial Engineering University of Toronto © Copyright by Phong Nguyen 2016

Welcome message from author
This document is posted to help you gain knowledge. Please leave a comment to let me know what you think about it! Share it to your friends and learn new things together.
Transcript

Microfluidic and micro-core methods for enhanced oil recovery and carbon storage applications
by
Phong Nguyen
A thesis submitted in conformity with the requirements for the degree of Doctor of Philosophy Mechanical & Industrial Engineering
University of Toronto
© Copyright by Phong Nguyen 2016

Microfluidic and micro-core methods for enhanced oil recovery
and carbon storage applications
Phong Nguyen
Doctor of Philosophy
Mechanical & Industrial Engineering University of Toronto
2016
Abstract
Injection of CO2 into the subsurface, for both storage and oil recovery, is an emerging strategy
to mitigate atmospheric CO2 emissions and associated climate change. In this thesis
microfluidic and micro-core methods were developed to inform combined CO2-storage and oil
recovery operations and determine relevant fluid properties.
Pore scale studies of nanoparticle stabilized CO2-in-water foam and its application in oil
recovery to show significant improvement in oil recovery rate with different oils from around
the world (light, medium, and heavy). The CO2 nanoparticle-stabilized CO2 foams generate a
three-fold increase in oil recovery (an additional 15% of initial oil in place) as compared to an
otherwise similar CO2 gas flood. Nanoparticle-stabilized CO2 foam flooding also results in
significantly smaller oil-in-water emulsion sizes. All three oils show substantial additional oil
recovery and a positive reservoir homogenization effect.
A supporting microfluidic approach is developed to quantify the minimum miscibility pressure
(MMP) – a critical parameter for combined CO2 storage and enhanced oil recovery. The
method leverages the inherent fluorescence of crude oils, is faster than conventional
ii

technologies, and provides quantitative, operator-independent measurements. In terms of
speed, a pressure scan for a single minimum miscibility pressure measurement required less
than 30 min, in stark contrast to days or weeks with existing rising bubble and slimtube
methods.
In practice, subsurface geology also interacts with injected CO2. Commonly carbonate
dissolution results in pore structure, porosity, and permeability changes. These changes are
measured by x-ray microtomography (micro-CT), liquid permeability measurements, and
chemical analysis. Chemical composition of the produced liquid analyzed by inductively
coupled plasma-atomic emission spectrometer (ICP-AES) shows concentrations of magnesium
and calcium. This work leverages established advantages of microfluidics in the new context of
core-sample analysis, providing a simple core sealing method, small sample size, small
volumes of injection fluids, fast characterization times, and pore scale resolution.
Lastly, a microfluidic approach is developed to analyze the complex, multiphase fluid
interactions in CO2 enhanced oil recovery at relevant reservoir temperature and pressure.
Fluorescence imaging is applied to visualize and measure the effect of CO2 pressure on contact
angles changes at the pore scale.
iii

Acknowledgments I would like to thank my supervisor, Professor David Sinton, for his guidance, support, and
encouragement during the PhD program. I’ve learned a lot of research skills from him from
organizing experiments to writing good journal papers. I would like to thank my lab members
for working together throughout the program, especially the post docs Jason Riordon, Hossein
Fadaei, Huawei Li, Hadi Zandavi, Ali Abedini, and the carbon team.
I would like to thank my examination committee: Professor Amy Bazylak, Professor Axel
Guenther, Professor Grasselli Giovanni and my external Examiner Professor Farshid Torabi for
taking valuable time from your busy schedule to examine my thesis.
I would like to thank all great supports from MIE department graduate studies unit Brenda
Fung, Jho Nazal and TNFC staffs Edward Xu and Harlan Kuntz.
iv

Table of Contents Acknowledgments .......................................................................................................................... iv
Table of Contents ............................................................................................................................. v
List of Figures .............................................................................................................................. viii
List of Appendices ....................................................................................................................... xiii
1 Thesis Overview ......................................................................................................................... 1
1.1 Research motivation ............................................................................................................ 1
1.2 Thesis organization .............................................................................................................. 2
2 Introduction ................................................................................................................................. 3
2.1 Enhanced oil recovery (EOR) .............................................................................................. 3
2.2 Nanoparticle stabilized CO2 in water foam for mobility control in enhanced oil recovery ............................................................................................................................... 5
2.3 Carbon Sequestration ........................................................................................................... 8
2.3.1 CO2 storage mechanisms and global capacity ......................................................... 8
2.3.2 CO2 chemistry at reservoir conditions .................................................................. 11
2.4 Microfluidic and micromodel methods to study EOR and carbon sequestration .............. 12
2.5 Micro core method to study EOR ...................................................................................... 15
2.6 Summary ............................................................................................................................ 17
3 Pore-scale Assessment of Nanoparticle Stabilized CO2 Foam for Enhanced Oil Recovery ................................................................................................................................... 18
3.1 Introduction........................................................................................................................ 18
3.2 Experimental Section ......................................................................................................... 21
3.2.1 Experimental Setup ................................................................................................ 21
3.2.2 Materials and Procedure ........................................................................................ 22
3.3 Results and Discussion ...................................................................................................... 23
v

3.3.1 Effect of Nanoparticle Coating .............................................................................. 23
3.3.2 Foam Stability Analysis ......................................................................................... 24
3.3.3 Enhanced Oil Recovery with CO2 vs. Nanoparticle-Stabilized CO2 Foam. ......... 26
3.4 Conclusions ....................................................................................................................... 32
4 Fast fluorescence-based microfluidic method for measuring minimum miscibility pressure of CO2 in crude oils .................................................................................................... 34
4.1 Introduction........................................................................................................................ 34
4.2 Experimental method ......................................................................................................... 38
4.3 Results and discussion ....................................................................................................... 39
4.4 CONCLUSION ................................................................................................................. 45
5 Microfluidics Underground: A Micro-Core Method for Pore Scale Analysis of Supercritical CO2 Reactive Transport in Saline Aquifers ........................................................ 46
5.1 Introduction........................................................................................................................ 47
5.2 Experimental Setup ............................................................................................................ 49
5.3 Experimental Procedure..................................................................................................... 50
5.3.1 Experimental conditions ........................................................................................ 50
5.3.2 Core flooding with pure CO2 and CO2 saturated brine ......................................... 52
5.3.3 Permeability measurements ................................................................................... 52
5.3.4 Scanning electron microscope, x-ray micro-CT, and image analysis ................... 53
5.3.5 Atomic emission spectroscopy analysis of produced liquid .................................. 53
5.4 Results and Analysis .......................................................................................................... 54
5.4.1 Initial characterization of limestone core samples................................................. 54
5.4.2 Pore structure and porosity changes due to carbonate dissolution ........................ 55
5.4.3 Permeability change due to carbonate dissolution................................................. 58
5.5 Calcium and magnesium ion concentrations in produced solution ................................... 59
5.6 Conclusions ....................................................................................................................... 62
vi

6 Multiphase fluorescence imaging of CO2, brine, nanoparticles, and oil in microchannels ...... 63
6.1 Introduction........................................................................................................................ 63
6.2 Experimental setup ............................................................................................................ 64
6.3 Results and Discussions ..................................................................................................... 64
6.4 Conclusions ....................................................................................................................... 71
7 Conclusions ............................................................................................................................... 72
7.1 Nanoparticle stabilized CO2 foam EOR ............................................................................ 72
7.2 Microfluidic method for measuring CO2 and oil MMP .................................................... 73
7.3 Micro-core method for examining porosity and permeability changes due to CO2 injection in carbonate reservoir ......................................................................................... 73
7.4 Contact angle measurements and wettability modifications of pores due to reservoir fluids .................................................................................................................................. 74
References...................................................................................................................................... 75
Appendix 1: Chapter 4 Supporting Information ............................................................................ 91
Appendix 2: Silicon Chip Fabrication ........................................................................................... 94
Appendix: 3 Microbial enhanced oil recovery using sandstone rock pattern micromodel ........... 97
Appendix: 4 High pressure chip manifold ..................................................................................... 99
vii

List of Figures Figure 2-1 CO2 EOR recovery gas fingering mobility challenge and nanoparticle foam
mobility control method ............................................................................................................... 4
Figure 2-2 a) Silica nanoparticle coating with dichlorodimethylsilane (DCDMS) b)
Nanoparticle stabilized CO2 in water foam structures. ................................................................ 6
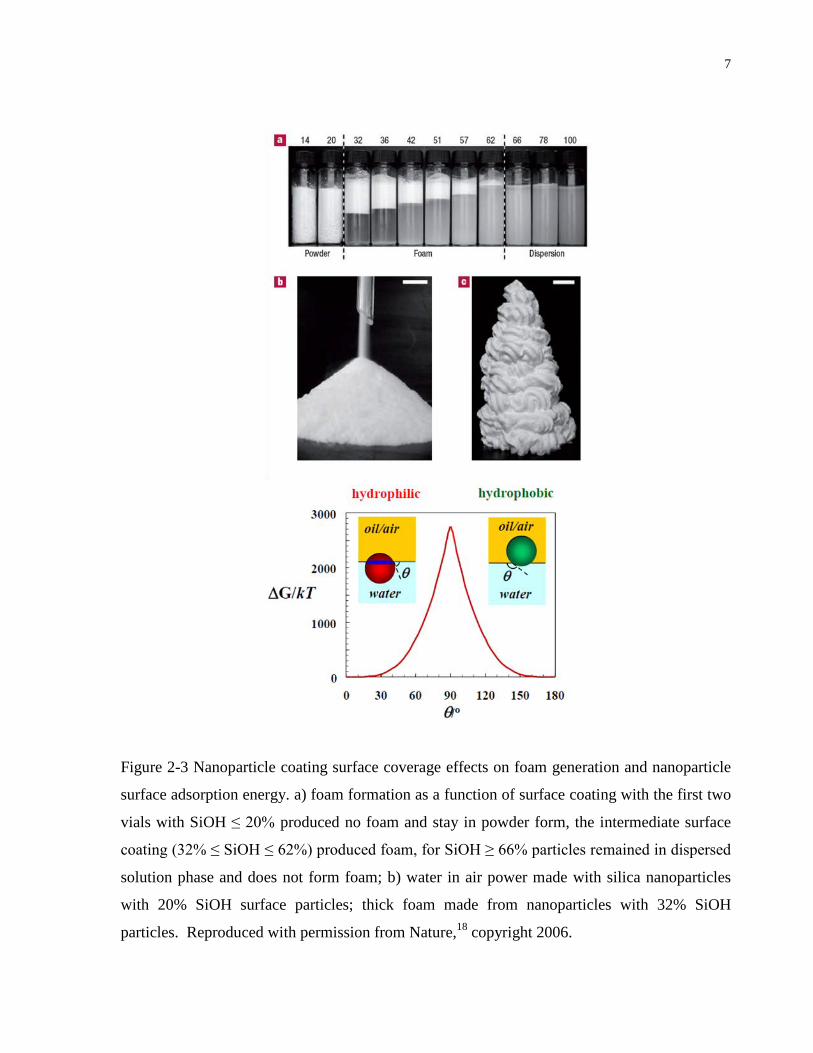
Figure 2-3 Nanoparticle coating surface coverage effects on foam generation and nanoparticle
surface adsorption energy. a) foam formation as a function of surface coating with the first two
vials with SiOH ≤ 20% produced no foam and stay in powder form, the intermediate surface
coating (32% ≤ SiOH ≤ 62%) produced foam, for SiOH ≥ 66% particles remained in dispersed
solution phase and does not form foam; b) water in air power made with silica nanoparticles
with 20% SiOH surface particles; thick foam made from nanoparticles with 32% SiOH
particles. Reproduced with permission from Nature,18 copyright 2006. ..................................... 7
Figure 2-4 a) CO2 storage in geological formations b) Global capacity for CO2 storage, blue
bars represent minimum estimate and red bars represent maximum estimate. Reproduced with
permission from Annual Review of Environment and Resources,4 copyright 2014. ................. 10
Figure 2-5 a) CO2 phase diagram b) CO2 density changes with temperature and pressure c)
CO2 storage mechanisms in saline aquifers. Reproduced with permission from Annual Review
of Environment and Resources,4 copyright 2014. ...................................................................... 11
Figure 2-6 a) Glass chip with round post patterns.29 b) rock on chip made form rock imaging
with FIB-SEM. Reproduced with permission from Royal Society of Chemisty,82 copyright
2011. c) Micromodel development using SEM image pattern from sandstone. Reproduced
with permission from Springer,78 copyright 2012. ..................................................................... 13
Figure 2-7 Application of microfluidic methods to study pore scale transport in oil reservoirs
and fluid properties analysis. Reproduced with permission from Royal Society of Chemistry,83
copyright 2014. ........................................................................................................................... 14
viii

Figure 2-8 a) High pressure, high temperature micro-core holder developed in this work108 with
Swagelok connection ports for confining pressure injection and fluids injections b) High P and
T Micro-CT core holder for in-situ measurement of fluid rock interactions. Reproduced with
permission from American Geophysical Union,91 copyright 2011. ........................................... 17
Figure 3-1 Experimental setup for nanoparticle stabilized CO2 foam injection (and pure CO2
injection) into the micromodel. After initial water injection (water flood), CO2 foam (or pure
CO2) is injected into the microfluidic network as shown. .......................................................... 23
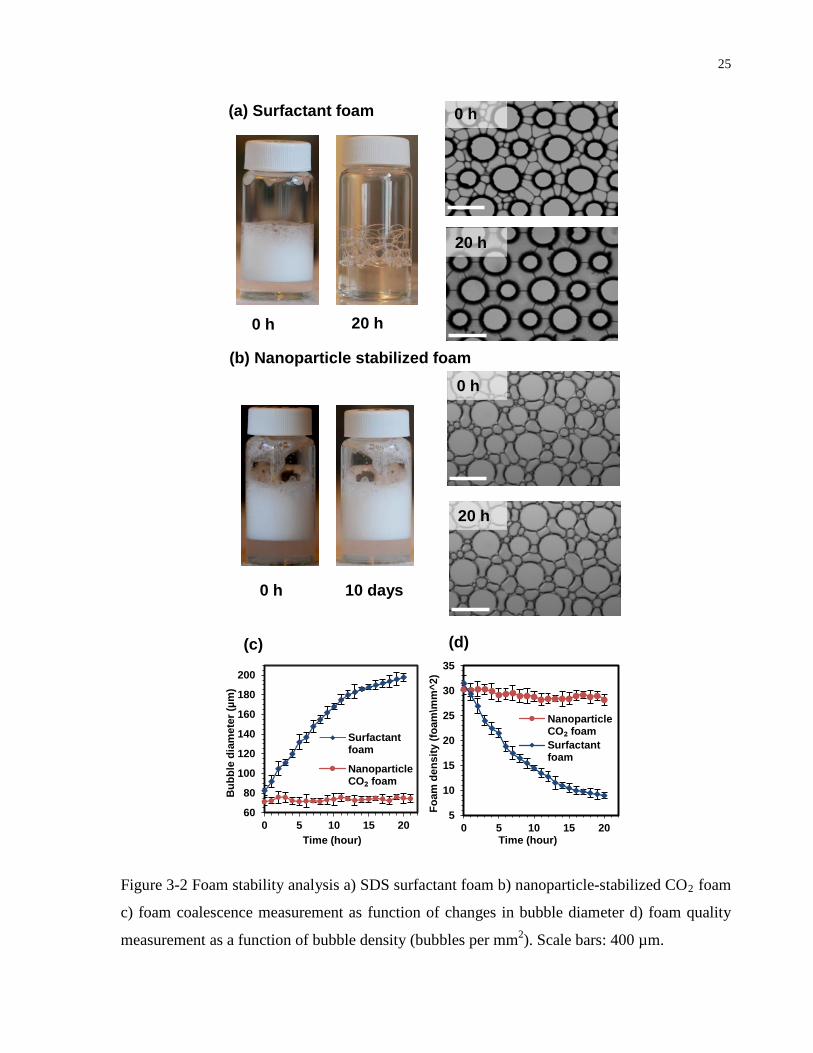
Figure 3-2 Foam stability analysis a) SDS surfactant foam b) nanoparticle-stabilized CO2 foam
c) foam coalescence measurement as function of changes in bubble diameter d) foam quality
measurement as a function of bubble density (bubbles per mm2). Scale bars: 400 µm. ............ 25
Figure 3-3. Comparison of oil recovery following a water flood with CO2 vs. nanoparticle-
stabilized CO2 foams. Images of initial oil in place (IOIP), following the water flood, and the
CO2 (a) or nanoparticle-stabilized CO2 foam (b) floods. Cumulative oil recovery as
percentage of IOIP for both cases (c), with enlarged plot of the recovery following water flood
(d). ............................................................................................................................................... 27
Figure 3-4. Pore-scale images of CO2 gas flooding and nanoparticle-stabilized CO2 foam
flooding. (a) CO2 gas flooding resulting in a long sinuous oil phase (imaged through native oil
fluorescence) and connected gas channels (black) fingering through the network; (b)
Nanoparticle-stabilized CO2 foam bubbles visible through bright field microscopy, trapping
and transporting interstitial oil. Scale bars: 250µm. ................................................................... 29
Figure 3-5. Micrometer-scale quantification of emulsion sizes using the native fluorescence of
the oil phase. a) Images of oil-in-water and water-in-oil emulsions produced by a CO2 flood
and a nanoparticle-stabilized CO2 foam flood (bright phase is the oil). b) size distribution of
oil-in-water emulsions (n = 3840). c) size distribution of water-in-oil emulsions (n = 4080).
Scale bars: 50 µm. ...................................................................................................................... 30
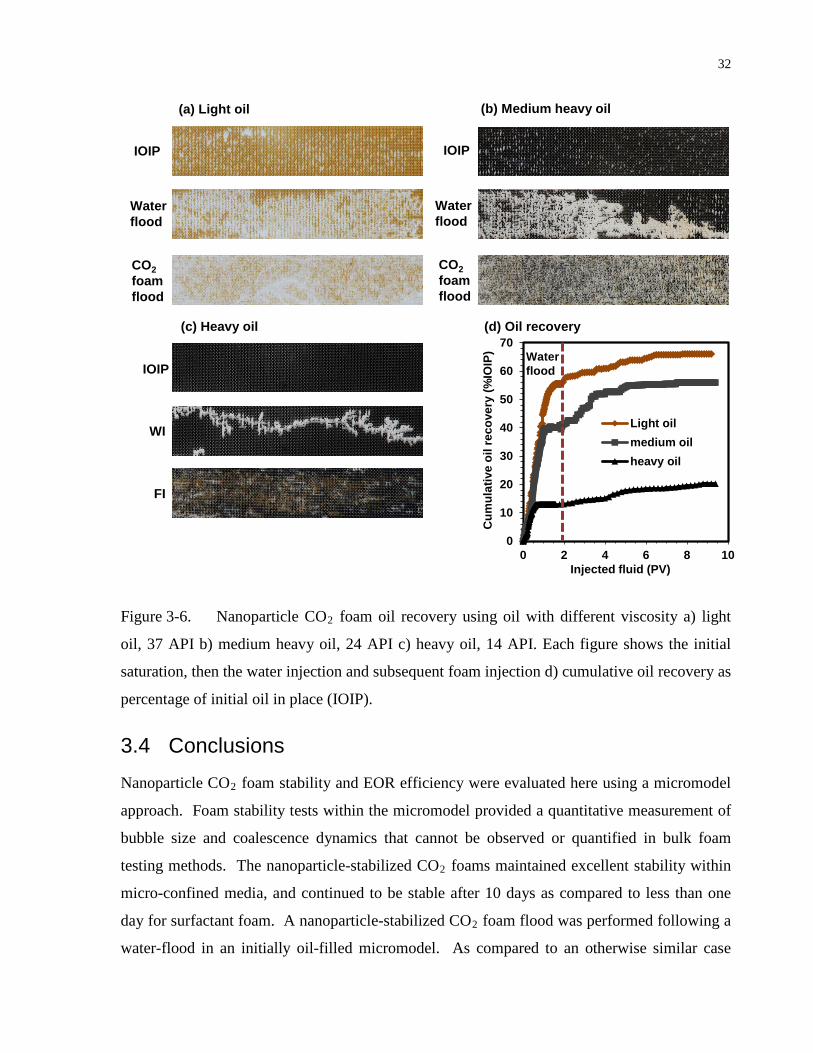
Figure 3-6. Nanoparticle CO2 foam oil recovery using oil with different viscosity a) light
oil, 37 API b) medium heavy oil, 24 API c) heavy oil, 14 API. Each figure shows the initial
ix

saturation, then the water injection and subsequent foam injection d) cumulative oil recovery as
percentage of initial oil in place (IOIP). ..................................................................................... 32
Figure 4-1(a) Schematic of CO2 storage and enhanced oil recovery, CO2 EOR. (b) Schematic
of ternary diagram of CO2 and model synthetic crude oil components (pentane and
hexadecane). Schematics illustrating molecular behavior at the oil/CO2 interface are presented
at pressures (c) below MMP and (d) at MMP. The conventional rising bubble apparatus (RBA)
method (e) is compared to the microfluidic MMP method (f), each inset with corresponding
bubble behaviors at pressures below and at MMP ..................................................................... 37
Figure 4-2 (a) Demonstration of high-contrast fluorescence imaging of CO2 bubbles flowing
through synthetic oil at pressures below, at, and above MMP. (b) Cross plot comparing
microfluidic MMP measurements to literature MMP values from the RBA method. The 45°
dashed line represents the ideal perfect correlation case. (c) Demonstration of the linear
dependence of MMP on temperature for various synthetic oil mixtures (63 API, 68 API, 71
API, and 79 API). MMP increases with oil density from light to heavy oil. ............................. 41
Figure 4-3 Microfluidic fluorescent visualization of West Texas and Pennsylvania crude oil at
MMP, at 25°C and 40°C, as indicated. Each crude exhibiting a characteristic mixing pattern
due to differences in oil compositions. ....................................................................................... 42
Figure 4-4 Operator-independent fluorescence-based measurement of MMP: fluctuations in
fluorescence intensity at pressures of (a) 4.83 MPa and (b) 6.07 MPa measured over time. Data
points highlighted with red circles are shown with corresponding images. (c) Variation in
average intensity within the detection region over time at different pressures. The variance of
the derivative of these data sets is plotted in log format in (d). The derivative of this curve is
plotted to highlight the point of greatest slope, which corresponds to MMP – in this case, 6.14
MPa. ............................................................................................................................................ 45
Figure 5-1 Schematic of the experimental setup for the micro-core flooding experiments with
pure CO2 and CO2 saturated brine. The system uses a microfluidic chip style holder and
connections which simplify the apparatus as compared to conventional core-study methods.
x

The parts inside the dotted line were kept at constant temperature of 40 oC in a water bath. An
image of the micro-core is shown inset ...................................................................................... 51
Figure 5-2 SEM images of Indiana limestone core samples used in this study: (a) intergranular
pores (b) intragranular pores of the dotted red line region in part (a). For both cases, the black
areas are pores and grey areas are grains. Scale bars indicate 500 µm in (a) and 10 µm in (b).
.................................................................................................................................................... 55
Figure 5-3 Pore structure changes due to CO2-saturated brine injection for 3 hours: a) before
CO2 injection; b) after CO2 injection; c) Binary image conversion from gray image and
histogram. Coronal plane is the horizontal plane, sagittal plane is the vertical plane, and
transaxial plane is the axial plane. The image resolution is 4.9 µm per pixel. Black areas are
pores and grey areas are grains. The degree of dissolution is significant, with a porosity
increase from 18.1% to 26.8% and an observable increase in pore connectivity. ...................... 56
Figure 5-4 Pore structure changes due to pure CO2 injection through the core for 3 hours: a)
before CO2 injection; b) after CO2 injection. Coronal plane is the horizontal plane, sagittal
plane is the vertical plane, and transaxial plane is the axial plane. The image resolution is 4.9
µm per pixel. Black areas are pores and grey areas are grain. In comparison with CO2-
saturated brine flooding (Fig. 5-3), very little dissolution occurs in this case. Porosity increase
is minor, from 17.5% – 19.5%. ................................................................................................... 57
Figure 5-5 Pressure drop across the core at each flow rate for permeability calculations before
and after core flooding for 3 hours at reservoir conditions of 8.4 MPa and 40 oC. (a) CO2-
saturated brine core flooding. The linear fit of the flow rate versus pressure drop correlation R2
value is 0.999 for before and 0.996 for after core flooding. (b) ScCO2 core flooding. The linear
fit of the flow rate versus pressure drop correlation R2 value is 0.993 for before and 0.966 for
after core flooding....................................................................................................................... 59
Figure 5-6 Chemical analysis of the produced liquid showing both the Ca2+ and Mg2+ ion
concentrations over time. (a) Ca2+ ion concentrations in the produced liquid measured with
ICP-AES over the 3 hours core flooding experiments with CO2-saturated brine and pure
xi

scCO2. (b) Mg2+ ion concentrations in the produced liquid measured with ICP-AES over the 3
hours core flooding experiments with CO2-saturated brine and pure scCO2. ............................ 61
Figure 6-1 CO2 and water phases in closed-end microfluidic channels at various pressures. ... 66
Figure 6-2 Contact angles changes with CO2 pressure increases. CO2/brine (blue) and
CO2/nanoparticles (green) were measured in this study using microfluidic channels, the red
dotted line was measured using capillary tube from literature data. .......................................... 67
Figure 6-3 CO2 and nanofluid phases in closed-end microfluidic channels at various pressures.
.................................................................................................................................................... 68
Figure 6-4 a) CO2 brine and oil interactions b) CO2 nanofluid oil interactions ........................ 70
Figure 6-5 Oil swelling due to CO2 injection pressure increases, initial swelling rate is fast then
it stabilize. ................................................................................................................................... 71
xii

List of Appendices
Appendix 1: Chapter 4 supplementary information
Appendix 2: Silicon Chip Fabrication
Appendix 3: Microbial Enhanced oil recovery using sandstone rock pattern micromodel
Appendix 4: High pressure chip manifold
xiii
1
1 Thesis Overview
1.1 Research motivation Global CO2 emission has continued to increase from rising fossil fuel consumptions
worldwide. The projected fossil fuel consumption for next 50 year will continue to increase.
The CO2 emission rate is 32 Giga tonnes in 2011 and projected to be doubled by 2050.1,2 CO2
enhanced oil recovery (EOR) and sequestrations are currently the most technically feasible
methods to reduce the CO2 emission on large scale. Saline aquifers and oil reservoirs have
storage capacity of 25,000 Giga tonnes of CO2.3,4
CO2 EOR often has low recovery rates due to viscous fingering and gravity override as a result
of low viscosity and density of CO2 compared to oil. CO2 foam is used to increase the apparent
viscosity of gas injection and improve the sweep efficiency of the CO2 injection process which
results in higher recovery efficiency.
Nanoparticle stabilized foam has much higher stability than surfactant foam. Stabilizing CO2
foams using nanoparticles is a classical approach, termed a Pickering emulsion.5–10
Nanoparticle stabilized CO2 foams have recently shown potential for application to enhanced
oil recovery applications.11–13 These studies have shown nanoparticles foams are significantly
more stable than surfactant foam due to the high adsorption energy of the nanoparticles at the
gas-liquid interface. The second approach is the used of miscible CO2 displacement where
CO2 is injected at pressure above minimum miscibility pressure (MMP) pressure.
Reservoir scale processes are affected by pore scale transport. In which microfluidic is great
method for studying oil recovery at pore scale. Microfluidic method is very capable of studying
pore scale mechanisms of oil recovery including oil recovery studies using micromodels and
fluid properties in micro-channels.
Micro-core method was developed to study CO2-brine-rock interactions at pore scale and
changes in rock porosity and permeability.

2
1.2 Thesis organization The application of microfluidic and micro-core method was used to study oil recovery using
CO2, foam and CO2 injections measuring CO2 and oil MMP. The thesis is organized into
chapters with Chapter 1 presents a thesis motivation and overview, Chapter 2 is a review of
backgrounds for research topics studied, Chapters 3-5 are based on published journal papers of
the various microscale methods developed in this work, Chapter 6 work in progress, Chapter 7
conclusions. The brief highlights of these chapters are listed below:
Chapter 2 provides the introduction for the thesis which include the backgrounds on EOR,
energy consumptions, CO2 emissions and the need for CO2 EOR and sequestrations. It
explains the role of microfluidic technology in oil and gas applications. It also provides the
needs for using nanoparticles foams to improve oil recovery.
Chapter 3 presents the assessment of nanoparticle foam using microfluidic method to improve
oil recovery for three different type of crude oil ranging from light, medium, to heavy. This
paper was published in Energy & Fuels.
Chapter 4 presents the development of a high pressure microfluidic system to measure CO2
and oil MMP. This represents a much faster method than conventional RBA MMP
measurements. This work was published in Analytical Chemistry.
Chapter 5 presents the development of a micro-core method to study rock structure changes at
pore scale due to CO2 injection in saline aquifers. This work was published in Journal of Fluids
Engineering.
Chapter 6 is work in progress of using multiphase fluorescence imaging to study effect of CO2
pressures on contact angle at pore scale.
Chapter 7 provides the conclusion and future work.

3
2 Introduction
2.1 Enhanced oil recovery (EOR) Canada is the world leader in CO2 EOR, with a long history of injection of CO2 into the
Weyburn field in Saskatchewan, this is the largest CO2 project in the world with the
production of 200 million barrels of oil produced and (2.4 MMt per year of CO2 injected, total
of 13 MMt to date), this is equivalent to sequestering the emissions from 500,000 cars per year,
followed by the (higher profile) Sliepner project in the North Sea that has been in operation
since 1996 (~ 1 MMt tons of CO2 per year). Historically, the CO2 was sourced and purchased
from coal gasification plants in North Dakota. In many fields CO2 is so useful that a common
refrain among EOR oil representatives is “we agree there is a CO2 problem, we can’t get
enough of it”.14
From an environmental perspective CO2-EOR has mixed appeal, particularly, since it is
ultimately a hydrocarbon recovery mechanism. This superficial view, however, is not entirely
accurate or fair, because: (i) CO2 EOR is the only currently economic use for large quantities
of CO2 that would otherwise be vented (i.e. EOR is the only buyer), (ii) the reservoirs take up a
great deal of CO2 that is effectively stored (e.g. 1 ton of CO2 injected for every 2.5 barrels of
oil recovered). (iii) CO2 that does come back to surface with produced oil is separated, and as a
commodity, readily re-used by the oil industry (re-injected) (iv) CO2 EOR projects are
financing large CO2 capture efforts and corresponding networks of high pressure CO2
pipelines which would not be affordable otherwise. These pipelines could be employed later
for any number of CO2 downstream uses.
Oil recovery consists of primary, secondary and tertiary recovery or enhanced oil recovery
(EOR). Primary recovery is using the reservoirs original pressures to recover ~ 10% of
original oil in place (OOIP), follows by secondary recovery with water flooding which
recovers another ~ 30%. The remaining oil can be recovered by EOR methods such as gas
injection with CO2, chemical flood, steam flood, surfactant flood (schematic of these
methods).15 The challenges of CO2 EOR is viscous fingering and gravity override can be
reduced with the use of nanoparticle stabilized CO2 in water foam as shown in Figure 2-1.

4
In this work, both CO2 EOR and CO2 sequestration are investigated.
Figure 2-1 CO2 EOR recovery gas fingering mobility challenge and nanoparticle foam
mobility control method
Coal power plant
CHALLENGE: Viscous fingering of CO2,
poor storage, poor oil recovery
APPROACH: Mobility control with
nanoparticle-stabilized CO2 foam
CO2
Oil
Oil e-
Grain Oil CO2 Foam
Brine Nanoparticle
1
µm
CO2

5
2.2 Nanoparticle stabilized CO2 in water foam for mobility control in enhanced oil recovery A review of surfactant stabilized foam and nanoparticle stabilized foam including foam
generation mechanisms and foam stability mechanisms are provided in this section. Surfactant
foams are generated by mixing aqueous surfactant solutions with gas phase or by injecting a
surfactant or nanoparticle solution through a porous media at high flow rate. Nanoparticle foam
can be generated in a similar way with high shear forces required. Nanoparticles stabilized
foam and emulsions have been studied extensively. Originally, in 1907 Pickering, studied
particles stabilized emulsions, hence Pickering emulsions.5 The remarkable stability of
Pickering foam and emulsions have motivated many studies and research for applications in
food and pharmaceutical by Binks,6,9,10,16–19 and others for fundamental foam stabilization
method.8,20–25 Recently nanoparticles stabilized foam and emulsions have been used for EOR
applications as its stability is much higher than surfactant foam.11,12,23,25–31

6
Figure 2-2 a) Silica nanoparticle coating with dichlorodimethylsilane (DCDMS) b)
Nanoparticle stabilized CO2 in water foam structures.
It has been found that the contact angles of nanoparticles at the water and gas interface is
critical for determining the foam stability and the contact angles depend on the nanoparticle
coating.7,9,16 Coating particle with a hydrophobic chemical compound such as
dichlorodimethylsilane (DCDMS) change its surface properties from hydrophilic to
hydrophobic as shown in Figure 2-2. The intermediate surface coating coverage with
remaining SiOH between 32% to 62%produces the best foam results with denser foam
characteristics for higher surface coverage.10–12,18,19,26–28,31–33 The high adsorption energy of
particles to the CO2-water interfaces makes the process irreversible and hence the particle
stabilized bubbles structures.11,12,26,34–36 Foam textures with different coating coverage are
shown in Figure 2-3.
7
Figure 2-3 Nanoparticle coating surface coverage effects on foam generation and nanoparticle
surface adsorption energy. a) foam formation as a function of surface coating with the first two
vials with SiOH ≤ 20% produced no foam and stay in powder form, the intermediate surface
coating (32% ≤ SiOH ≤ 62%) produced foam, for SiOH ≥ 66% particles remained in dispersed
solution phase and does not form foam; b) water in air power made with silica nanoparticles
with 20% SiOH surface particles; thick foam made from nanoparticles with 32% SiOH
particles. Reproduced with permission from Nature,18 copyright 2006.

8
Foam EOR as mobility control method of gas injection to increase oil recovery rate has been
extensively studied at both lab scale and pilot tests. Mobility control is required in gas injection
to increase sweep efficiency, as low sweep efficiency leads to early breakthrough and low
recovery rates.
Foam flooding is an effective EOR method to control the mobility of the injected gas in porous
media.37,38 Foam flows through porous media as bubble trains of gas in liquid phases which
provide higher resistance to flow than the gas phase viscosity.39–45 The mobility reduction
strongly depends on foam texture. The apparent viscosity of foam and mobility reduction
factor are given below.38,46–51
QLPkA
app
∆=µ (1)
Where k is permeability of the core in Darcy, A is cross sectional area of the core in cm2, Q is
flow rate in cm3/s, L is core length in cm, P∆ is pressure drop across the core in atm.12
Core mobility reduction factor (MRF) is the ratio of the apparent viscosity of the foam at a
given total flow rate to the apparent viscosity of the baseline case at the same total flow rate:
µµ
baselineapp
foamappMRF,
,= (2)
2.3 Carbon Sequestration
2.3.1 CO2 storage mechanisms and global capacity
Carbon sequestration involves injecting CO2 into geological formations including saline
aquifers, oil reservoirs and coal bed methane. The total amount of CO2 stored in these
formations is very large with a capacity for 25,000 gigatonnes of storage (Figure 2-4).14,52–54
Geological storage of CO2 consists of injecting supercritical CO2 into carbonate or sandstone
formations in oil and gas reservoirs or saline aquifers. The storage reservoir must have the
following characteristics: capacity to accept the intended volume of CO2, injectivity to take in

9
the CO2 at the intended injection rates, confinement to prevent leakage of the buoyant and
mobile CO2 to shallow subsurface or surface. Four mechanisms of CO2 trapping in reservoirs
have been identified as structural and hydrodynamic trapping as shown in Figure 2-5:
buoyancy trapping within the anticline, fold, fault block, and below the cap rock; residual
trapping: residual CO2 saturation in the pore space which makes the CO2 immobile because of
interfacial tension between CO2 and formation water; dissolution trapping: CO2 migrates
through the reservoir beneath the seal and eventually dissolves in formation brine; iv) mineral
trapping: dissolved CO2 reacts with reservoir rocks to form new minerals. Structural and
residual trapping mechanisms are dominant at the early phase of CO2 migration in the
reservoir and solubility and mineral trapping are more dominant at the later phase.
Particularly with the recent Boundary Dam project in Saskatchewan, Canada has become a
leader in carbon sequestration development. This project sequesters 1 million tonnes of CO2
per year (equivalent to emissions from ~ 200,000 cars) from a ~ 4,000 MW coal power station.
In general the challenges with CO2 sequestration in saline aquifers are multifold including high
costs, lack of pipeline infrastructure. The CO2 EOR will provide the economic benefits for
building the CO2 economy.

10
Figure 2-4 a) CO2 storage in geological formations b) Global capacity for CO2 storage, blue
bars represent minimum estimate and red bars represent maximum estimate. Reproduced with
permission from Annual Review of Environment and Resources,4 copyright 2014.

11
Figure 2-5 a) CO2 phase diagram b) CO2 density changes with temperature and pressure c)
CO2 storage mechanisms in saline aquifers. Reproduced with permission from Annual Review
of Environment and Resources,4 copyright 2014.
2.3.2 CO2 chemistry at reservoir conditions CO2 reaches critical temperature and pressure at 31.1°C and 7.38 MPa respectively. CO2
reaches supercritical state at temperatures and pressures above the critical point. In
supercritical state, CO2 behaves still like a gas by filling all the available volume, but has a
liquid-like density that ranges from 200 to 900 kg/m3. The higher the density of CO2 the more
efficiently the pore space can be used to store CO2. Higher density also decreases the upward
movement of CO2 due to lower buoyancy forces. In general, a depth of about 800m is
necessary for achieving supercritical CO2 state. Figure 2-5(b) shows the variation of CO2
a) CO2 phase diagram b) CO2 density
c) CO2 sequestration trapping mechanisms

12
density with pressures at various temperatures with increasing density with higher pressures,
and lower density with higher temperatures. The solubility of CO2 in water and brine increases
with pressure and temperature and decreases with brine salinity.55 In general, CO2 solubility
increases from 1% at 1MPa to ~7% at 30 MPa for a reservoir temperature of 50 °C.
2.4 Microfluidic and micromodel methods to study EOR and carbon sequestration The application of microfluidic technology to oil and gas research is gaining traction in many
areas of oil gas recovery and fluid properties analysis. The applicability of microfluidics to
study reservoir processes are illustrated in Figure 2-7. Some recent publications include CO2
and toluene diffusivity in bitumen measurements,56,57 phase diagram measurements of gas
liquid systems,58 CO2 and oil minimum miscibility pressure measurements.59 Microfluidics
have been used extensively in other fields of research including chemistry for chemical
synthesis in micro-reactor,45,60–69 biology and medicine for disease screening and cell
studies.70,71
Micromodels have been a long-established method in geological sciences and reservoir
engineering,72 that are finding renewed interest and applications with microfluidic technology
and modern high-resolution microscopy imaging methods. Recent advances in chip fabrication
techniques including silicon/glass chips, glass/glass chips, and improved imaging methods
including high resolution microscopy, fluorescence imaging, confocal imaging methods, and
nanoparticle tracking PIV allow for advanced studies of EOR technique at pore scale
level.29,73,74
Micromodels are 2D pore network representation of the reservoir rock structures etched onto a
substrate of glass, silicon, and polymer with the top surface sealed with a blank substrate.
Methods of making the pore network photomask pattern include round posts, Delaunay
triangles, and SEM images from actual rock core samples.29,73,75–81 Illustrations of micromodel
development techniques are summarized in Figure 2-6.

13
Figure 2-6 a) Glass chip with round post patterns.29 b) rock on chip made form rock imaging
with FIB-SEM. Reproduced with permission from Royal Society of Chemisty,82 copyright
2011. c) Micromodel development using SEM image pattern from sandstone. Reproduced
with permission from Springer,78 copyright 2012.
b) Rock on chip
c) Repeating unit
a) Glass chip with post pattern
400 µm

14
Figure 2-7 Application of microfluidic methods to study pore scale transport in oil reservoirs
and fluid properties analysis. Reproduced with permission from Royal Society of Chemistry,83
copyright 2014.
Micromodels used in EOR and carbon sequestrations include reservoir on chips studies of oil
displacement by non-wetting fluids,81 visualization of salt precipitation dynamics during CO2
injection.84

15
Like all methods, micromodels have advantages and disadvantages. The most important
advantages are (i) real-time dynamics, pore-scale resolution, fluorescence capability, data
gathered in the two-dimensional format is straightforward to image, analyze, and plot. The key
disadvantages are not 3D, not the real material/geology, small scale compare to large reservoir
scale. A notable exception to the material/geology point is a recent study in our group, chip-
off-the-old-rock whereby the dissolution of carbonate limestone was observed using a calcite
microfluidic chip.85
2.5 Micro core method to study EOR An alternative to micromodel testing is core-based testing. ‘Micro’ cores are considered to be
core studies. Due to the opacity of rock, Micro Computed Tomograph (Micro-CT) must be
employed to resolve the fluid motion within the rock.86–94 Figure 2-8 shows the Micro-CT core
holder method developed in this work and other groups. Micro-CT have been widely used in
other field of research including materials engineering and fuel cells to medical diagnostics.95–
99 Typically lab scale core flood studies use reservoir rock cores (diameters in 10 cm and
lengths ~ 1 m long) and core plugs (diameter ~ few centimeters and length ~ 10 cm).46,100–103
Most core studies only monitor injection parameters and oil recovery without direct
visualization. Visualization of core studies have been performed using medical Computed
Tomography Scan (CT scan) where course scale oil recovery fluid visualization can be
observed with resolution in the range of millimeters.87,104–107 By using smaller core in this
study, Micro-CT was able to provide pore scale resolution of rock carbonate core samples. In
this thesis, micro-core methods are applied in Chapter 5 to better understand the carbon
sequestration process in carbonates. Notably, the micro-core method enables the study of
changes in the carbonate core structures (pore sizes, flow routes) due to CO2 injection not
possible with microfluidic or micromodel methods.
Like all methods, micro-core visualization has advantages and disadvantages. The most
important advantages are that (i) the real material is used (not a silicon or glass chip) and (ii)
the full three-dimensional nature of the real sample is represented (unlike two-dimensional
micromodels). The disadvantages are requiring more complex imaging technique using Micro-

16
CT scanning, which has lower temporal resolution and spatial resolution than optical
microscopes, size of the core limits the degree of heterogeneity that can be include ultimately
reservoirs are heterogeneous over length scales much larger than cores)
a) Micro-core
b) Micro-CT micro-core holder

17
Figure 2-8 a) High pressure, high temperature micro-core holder developed in this work108 with
Swagelok connection ports for confining pressure injection and fluids injections b) High P and
T Micro-CT core holder for in-situ measurement of fluid rock interactions. Reproduced with
permission from American Geophysical Union,91 copyright 2011.
2.6 Summary This chapter provides an overview of the topics covered in this thesis with the main theme on
the development and application of microfluidic and micro-core methods to study pore scale
processes in enhanced oil recovery and carbon sequestration. High temperature, high pressure,
and chemical resistant microfluidic chips such glass or silicon are very suitable for oil recovery
method evaluation with the injection of different chemicals including water flooding, gas
flooding, steam flooding, and other chemical flooding. Besides micromodel of pore network
pattern chips, microchannels type chips which have been commonly used in other fields of
research are also gaining more acceptance in oil and gas applications. In addition to chip based
methods, core based method allows for investigation of pore structure changes in conjunction
with Micro-CT. Nanoparticle foam based on Pickering emulsion can stabilize foams and
improve sweep efficiency of gas injection.

18
3 Pore-scale Assessment of Nanoparticle Stabilized CO2 Foam for Enhanced Oil Recovery
In this thesis, we evaluate nanoparticle-stabilized CO2 foam stability and effectiveness in
enhanced oil recovery at the pore scale and the micromodel scale. The nanoparticle stabilized
CO2 gas-in-brine foams maintain excellent stability within micro-confined media, and continue
to be stable after 10 days as compared to less than one day for surfactant foam. The CO2
nanoparticle-stabilized CO2 foams are shown to generate a three-fold increase in oil recovery
(an additional 15% of initial oil in place) as compared to an otherwise similar CO2 gas flood.
Fluorescence imaging is applied to quantify emulsion size distribution (down to 1µm) in both
CO2 and nanoparticle-stabilized CO2 foam flood cases. Nanoparticle-stabilized CO2 foam
flooding results in significantly smaller oil-in-water emulsion sizes with an average size of 1.7
µm (~ 80 % smaller than a CO2 gas flood), with negligible impact on water-in-oil emulsions.
The effectiveness of nanoparticle-stabilized CO2 foam is compared for representative light,
medium and heavy oils. All three oils show substantial additional oil recovery and a
potentially valuable reservoir-homogenization effect. Collectively, these results highlight the
pore-scale dynamics, effectiveness and potential for nanoparticle stabilized foams in enhanced
oil recovery.
Nguyen P, Fadaei H, Sinton D. Pore-Scale Assessment of Nanoparticle-Stabilized CO2 Foam
for Enhanced Oil Recovery. Energy & Fuels. 2014;28(10):6221-6227. Reproduced with
permission from American Chemical Society.
Link to publication online: http://pubs.acs.org/doi/abs/10.1021/ef5011995
3.1 Introduction Carbon dioxide flooding is a common method of Enhanced Oil Recovery (EOR).109 The
carbon dioxide phase can be either miscible or immiscible with the oil phase, depending on
reservoir depth and type of oil. Miscible CO2 flooding is preferred and generally possible for
light oil (API > 30), with viscosity less than 10 cP, and at reservoir depths deeper than 3000 ft.
The depth must be sufficient such that the reservoir pressure surpasses the Minimum
Miscibility Pressure (MMP) for the CO2 and oil in question.38 There has been additional

19
interest in using CO2 for heavier oil recovery where miscible operation is not possible (e.g. a
shallow thin pay zone heavy oil reservoirs that are not economical for thermal
operations).110,111 The primary mechanisms in immiscible CO2 injection process in heavy oil
are viscosity reduction and oil swelling. A challenge in this approach is the extreme viscosity
contrast between heavy oil and the CO2 (e.g. 200:1 light oil, 4000:1 medium heavy oil,
20,000:1 heavy oil) which causes viscous fingering of the CO2 within the oil, poor
conformance, and poor sweep efficiency. Sweep efficiency can be improved by viscosity
reduction of the oil phase or viscosity enhancement of the CO2 phase. Approaches to increase
the viscosity (or effective viscosity) of the CO2 phase include addition of polymer
thickeners,112 and foaming the CO2.48 Polymer thickeners are often prohibitively expensive,
however, and current surfactant foams suffer from coalescence and destabilization when in
contact with oil.38,113
Stabilizing CO2 foams using nanoparticles is a classical approach, termed a Pickering
emulsion.5–10 Nanoparticle stabilized CO2 foams have recently shown potential for application
to enhanced oil recovery applications.11–13 These studies have shown nanoparticles foams are
significantly more stable than surfactant foam due to the high adsorption energy of the
nanoparticles at the gas-liquid interface.10 Furthermore, Worthen et. al.11 demonstrated
nanoparticle foams stabilized with methyl-coated silica nanoparticles to be significantly more
stable than those with Polyethylene Glycol (PEG) coated silica nanoparticles. In addition to
stabilization benefits, the strong attraction between nanoparticles and the gas-liquid interface is
thought to minimize nanoparticle loss to the rock surface, and solid silica nanoparticles are
expected to endure the high temperature reservoir conditions better than surfactants.12
The current methods applied to assessing CO2 foams for EOR include bulk foam stability
analysis and the generation of foam in a core and analysis in a downstream visualization cell.
The simplest approach for initial screening of surfactants is to produce foam in a vial and
monitor the total foam height over time. Selected surfactants can then be applied to a core test
where foam is generated by co-injecting surfactants and CO2 into a porous core sample to
create the foam, and transferred to a downstream visualization cell where foam stability is
again measured as changes in height over time. These methods report characteristics of bulk
foams which can be very different from those of micro-confined foam. Recently, a microscope

20
cell made up of two plates spaced at 25 µm, was employed to better visualize CO2 foam upon
exiting a core sample. These recent studies have demonstrated the potential of coated
nanoparticle CO2 foams, and their characterization at the core scale and stability in one-
dimension of micro-confinement.
Micromodels providing two-dimensional micro-confinement have long been applied to study
pore-scale EOR processes, the most relevant examples include CO2 gas injection at high
pressure (600 psi) and supercritical CO2 injection,79 gas CO2 surfactant foam injection,114 and
air surfactant foam injection at low pressure.80 In general, low pressure foam micromodel
tests80,115 show the effect of foam as a physical structure within the porous media. To
additionally include representative chemical interactions with the oil phase requires all phases
to be at reservoir pressure. Other recent examples of related micromodel and microfluidic
approaches include: CO2 diffusion in oil and brine;56 an oil reservoir-on-a-chip;81,115 phase
diagrams of gas-liquid systems;58 coalescence kinetics of water in oil emulsions;116
determination of asphaltene content in crude oil;117 carboxylic acid content in heavy oil;118 and
recently a method for steam-on-a-chip quantify the effect of alkaline additives in bitumen
recovery via steam assisted gravity drainage (SAGD).74 In addition, Ma et.al.115 used a
micromodel model to investigate the sweep efficiency of surfactant CO2 foam in
heterogeneous network without oil at ambient conditions. Sun et.al.119 studied the influence of
supplementing a surfactant N2 foam with nanoparticles showing a significant improvement in
stability and temperature tolerance. Collectively these studies demonstrate the relevance and
potential for microfluidic/micromodel-based investigations of CO2 foams for subsurface
applications.
In this thesis, we employ a micromodel approach to quantify nanoparticle CO2 foam stability
and EOR efficiency. Foam stability within the pore space is evaluated for the cases of
surfactant foam and nanoparticle-stabilized foam using gas CO2 phase. With oil-loaded
micromodels, the sweep efficiency for a direct CO2 flood is compared to that of a nanoparticle-
CO2 flood (both following a standard water flood). The nanoparticle-stabilized CO2 foam
strategy is then applied to oil recovery tests with light, medium and heavy oil. Pore-scale
imaging of the flooding process reveals the mechanisms of gas fingering versus foam sweep
efficiency that contribute to the overall residual oil distribution and oil recovery results. In
21
addition to pore-scale imaging, fluorescence imaging is applied to quantify emulsion size
distribution (down to 1µm) in both CO2 and nanoparticle-CO2 cases.
3.2 Experimental Section
3.2.1 Experimental Setup
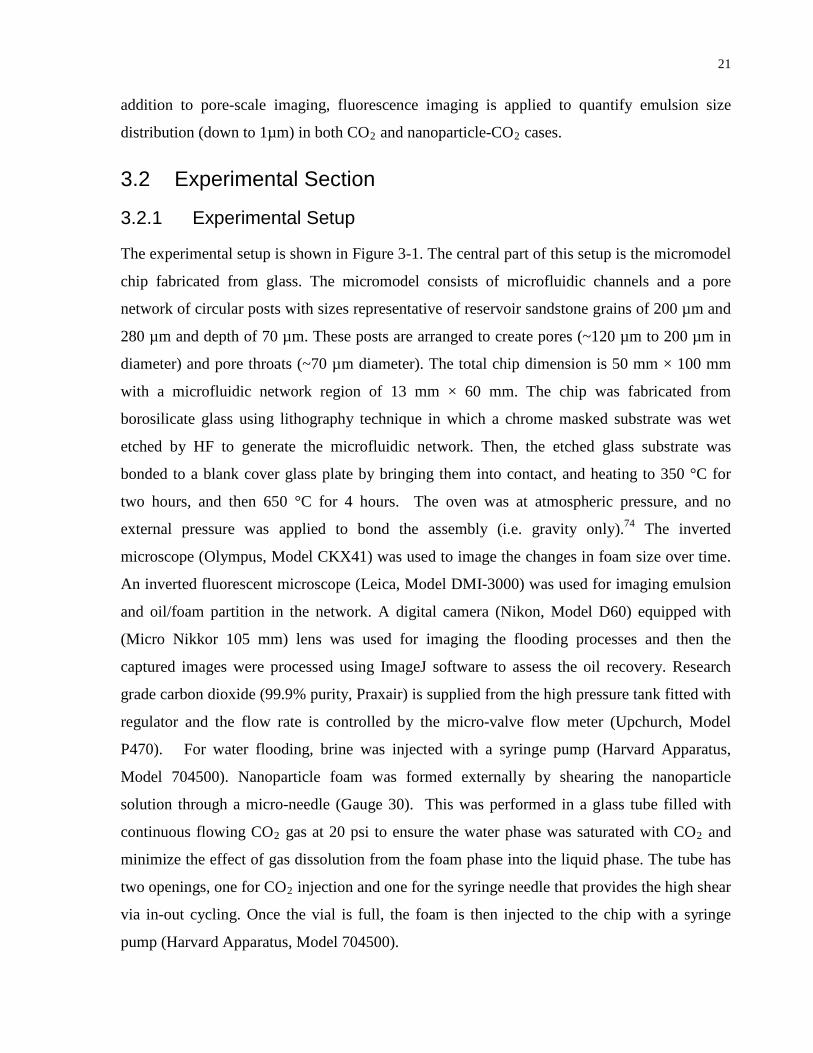
The experimental setup is shown in Figure 3-1. The central part of this setup is the micromodel
chip fabricated from glass. The micromodel consists of microfluidic channels and a pore
network of circular posts with sizes representative of reservoir sandstone grains of 200 µm and
280 µm and depth of 70 µm. These posts are arranged to create pores (~120 µm to 200 µm in
diameter) and pore throats (~70 µm diameter). The total chip dimension is 50 mm × 100 mm
with a microfluidic network region of 13 mm × 60 mm. The chip was fabricated from
borosilicate glass using lithography technique in which a chrome masked substrate was wet
etched by HF to generate the microfluidic network. Then, the etched glass substrate was
bonded to a blank cover glass plate by bringing them into contact, and heating to 350 °C for
two hours, and then 650 °C for 4 hours. The oven was at atmospheric pressure, and no
external pressure was applied to bond the assembly (i.e. gravity only).74 The inverted
microscope (Olympus, Model CKX41) was used to image the changes in foam size over time.
An inverted fluorescent microscope (Leica, Model DMI-3000) was used for imaging emulsion
and oil/foam partition in the network. A digital camera (Nikon, Model D60) equipped with
(Micro Nikkor 105 mm) lens was used for imaging the flooding processes and then the
captured images were processed using ImageJ software to assess the oil recovery. Research
grade carbon dioxide (99.9% purity, Praxair) is supplied from the high pressure tank fitted with
regulator and the flow rate is controlled by the micro-valve flow meter (Upchurch, Model
P470). For water flooding, brine was injected with a syringe pump (Harvard Apparatus,
Model 704500). Nanoparticle foam was formed externally by shearing the nanoparticle
solution through a micro-needle (Gauge 30). This was performed in a glass tube filled with
continuous flowing CO2 gas at 20 psi to ensure the water phase was saturated with CO2 and
minimize the effect of gas dissolution from the foam phase into the liquid phase. The tube has
two openings, one for CO2 injection and one for the syringe needle that provides the high shear
via in-out cycling. Once the vial is full, the foam is then injected to the chip with a syringe
pump (Harvard Apparatus, Model 704500).

22
3.2.2 Materials and Procedure
Several commercially available coated silica nanoparticles were employed in initial testing.
Bare silica with 7 nm diameter was obtained from Sigma Aldrich. Methyl coated silica
nanoparticle (12 nm) was obtained from Wacker Chemie with two different coatings of 50%
(HDK H20) and 75% (HDK H18) dichlorodimethyl silane coverage. The silane surface
coverage calculation is based on the percentage of conversion of silanol group (Si-OH) to
methyl silyl group (Si-CH3) as per manufacturer’s specification. These particles were
employed directly as purchased, without further surface modification. The surface properties of
such particles have been characterized extensively elsewhere.8,18 Nanoparticle solutions were
prepared by initially dispersing the nanoparticles in ethanol and sonicating for 1 hour followed
by centrifugation to remove the ethanol.11 The collected nanoparticles were then re-dispersed
by sonication for 2 hours in de-ionized (DI) water to make a 1% w/v solution.
CCD Camera
Microscope objective
Data recording
Syringe pump
Produced oil
Micro-valve Pressure
regulator
Pore network
pattern
3-Way valve
Microfluidic chip
assembly
Oil filling port
CO2 Tank
Large grain
Small grain
Pore Pore throat
400 µm

23
Figure 3-1 Experimental setup for nanoparticle stabilized CO2 foam injection (and pure CO2
injection) into the micromodel. After initial water injection (water flood), CO2 foam (or pure
CO2) is injected into the microfluidic network as shown.
The micromodel surfaces were borosilicate glass (Schott Borofloat 33) throughout, as
fabricated, and were natively water-wet (contact angle ~ 30°).120 The cleaning procedure
ensured a similar water-wet surface condition at the start of each experimental run. Before each
test, the chip is cleaned with toluene to remove all residual oil, followed by purging with IPA,
then DI water to remove all traces of toluene and IPA. Once clean, the chip was vacuum
injected with brine solution of 1% w/v NaCl to simulate connate water. Oil was injected into
the brine filled chip to achieve a reservoir-relevant velocity of 1 m/day (11.6 µm/s) in the
pores. Three different crude oils were employed: light oil (37 API), medium oil (24 API), and
heavy oil (14 API). The oil recovery experiment began with water flooding where the brine
was injected at reservoir pore velocity to displace the oil. For pure CO2 enhanced oil recovery,
CO2 gas was injected following the water flood. For nanoparticle stabilized CO2 foam
enhanced oil recovery, nanoparticle stabilized CO2 in water foam was injected following the
water flood. The evolution of each flooding process was imaged with the camera every 30
seconds. Pore-scale measurements of foam and emulsion sizes were imaged via the inverted
fluorescence microscope. All experiments were performed at ~ 22 °C.
3.3 Results and Discussion
3.3.1 Effect of Nanoparticle Coating
Nanoparticle surface properties are critical to foam function, and generally a balance between
hydrophilic behavior and hydrophobic behavior is desired (that is, nanoparticles sufficiently
hydrophilic to disperse in water, and sufficiently hydrophobic to accumulate at the interfaces).
Here, three coating conditions for silica nanoparticles were tested: uncoated (0%); 50%
methylsilyl; and 75% methylsilyl. The uncoated nanoparticles did not form CO2 foams while
both the 50% and 75% particles formed very stable foams. The 75% methylsilyl particles,
however, aggregated significantly in water, and the 50% methylsilyl particles were employed
for all subsequent tests.

24
3.3.2 Foam Stability Analysis
The stability of nanoparticle stabilized CO2 in brine foam and surfactant stabilized CO2 in
brine foam were measured in the micromodel chip. Bulk foam tests served as a reference, and
all results are plotted in Figure 3-2. The chip was filled with foam and imaged under the
microscope over 20 hours to monitor the changes in bubble size and bubble density. Bubble
density is calculated using image analysis software (Image J). It is based on the total bubble
count in the imaged regions of the chip divided by the total area of the imaged regions in units
of (bubbles/mm2). The average total number of bubbles used in each calculation is ~ 500.”
Foam coalescence was measured as the increase in average bubble size and decrease in bubble
density and plotted in Figure 3-2c, and d. For SDS surfactant foam the bubble diameter
increases from 83 µm to 198 µm during the course of the experiment and the corresponding
foam density decreases from 31 bubbles per mm2 to 9 bubbles per mm2. These changes show
that SDS foam has low stability due to coalescence. Similarly rapid changes were observed for
bulk SDS foam in the vial tests conducted here and elsewhere.8 In contrast to surfactant foam,
nanoparticle foam was much more stable. The bubble diameter and foam density remain
almost unchanged at 72 µm and an average of 29 bubbles per mm2 respectively over the
duration of the experiment (20+ hours). The bulk foam test in the vial was extended over
10 days, and showed negligible change over this period. The excellent stability of these foams,
measured here agree with bulk measurements reported previously,8,11 and motivate the
application of nanoparticle-stabilized foams in the subsurface. On-chip foam analyses
presented here (i) provide a quantitative measurement of bubble size and coalescence dynamics
that cannot be observed or quantified in bulk foam testing methods, and (ii) indicate that the
excellent stability characteristics of nanoparticle-stabilized foams are maintained in micro-
confined media.
25
0 h 10 days
(a) Surfactant foam
(b) Nanoparticle stabilized foam
0 h 20 h
0 h
20 h
(c) (d)
0 h
20 h
60
80
100
120
140
160
180
200
0 5 10 15 20
Bubb
le d
iam
eter
(µm
)
Time (hour)
Surfactantfoam
Nanoparticle CO₂ foam
5
10
15
20
25
30
35
0 5 10 15 20
Foam
den
sity
(foa
m\m
m^2
)
Time (hour)
Nanoparticle CO₂ foamSurfactantfoam
Figure 3-2 Foam stability analysis a) SDS surfactant foam b) nanoparticle-stabilized CO2 foam
c) foam coalescence measurement as function of changes in bubble diameter d) foam quality
measurement as a function of bubble density (bubbles per mm2). Scale bars: 400 µm.

26
3.3.3 Enhanced Oil Recovery with CO2 vs. Nanoparticle-Stabilized CO2 Foam.
Figure 3 shows the oil recovery results obtained with CO2 injection are compared to
nanoparticle-stabilized CO2 foam injection with medium heavy oil (24 API). The dynamics of
oil production were observed at the chip-scale with a field of view ~ 100 mm, at the pore-scale
with field of view ~ 2 mm, and the micro-scale ~ 100 µm. Oil recovery is calculated from
images taken at chip scale as shown in Figure 3-3. The images were processed in ImageJ to
analyze the residual oil saturation based on the clear light intensity difference between
foam/gas filled pores and oil filled pores. The cumulative oil recovery as a percentage of initial
oil in place (IOIP) is calculated for both the water flooding and the subsequent CO2 or CO2-
foam flooding. Water flooding results viscous fingering patterns due to the low viscosity of
water compared to oil which result in a recovery of ~ 41 % of IOIP. The end of the water
flood is indicated in Figure 3-3c by the dashed line. As with reservoir processes, the recovery
rate is high until water break-through, after which additional water injection flows mostly
through the water filled pores resulting in low recovery between 1 and 2 pore-volumes (PV) in
Figure 3-3c. For the case in Figure 3-3a, pure CO2 was injected following the water flood,
giving an additional 5% recovery (IOIP). This low recovery from CO2 injection is due to
transport of gas through the preferential path developed from the water flood, bypassing most
of the oil-filled areas, as shown in Figure 3-3a. For the case in Figure 3-3b, nanoparticle-
stabilized CO2 foam injection significantly improved the oil recovery following the water
flood. In contrast to CO2 gas flooding, nanoparticle-stabilized CO2 foam flooding open up new
paths through the micromodel and comprehensively sweep through the micromodel (Figure 3-
3b). Notably, the preferential path formed during the water flood is not visible after the foam
flood – a ‘homogenization’ of the reservoir. The high sweep efficiency results in a large
increase in oil recovery with an additional of 15% IOIP after water flooding, representing a
three-fold improvement over the otherwise similar CO2 gas flooding case.

27
Figure 3-3. Comparison of oil recovery following a water flood with CO2 vs. nanoparticle-
stabilized CO2 foams. Images of initial oil in place (IOIP), following the water flood, and the
CO2 (a) or nanoparticle-stabilized CO2 foam (b) floods. Cumulative oil recovery as
percentage of IOIP for both cases (c), with enlarged plot of the recovery following water flood
(d).
Pore-scale and Micro-scale Assessments of Foam Dynamics. Pore-scale images of the
CO2 flooding and foam flooding reveal the mechanisms of high foam sweeping efficiency as
shown in Figure 3-4. Areal sweep efficiency in micromodel is defined as the ratio of the area
40
45
50
55
60
1 3 5 7 9
Cum
ulat
ive
oil r
ecov
ery
(%IO
IP)
Fluid injected (PV)
CO2 flood
NP foam flood
0
10
20
30
40
50
60
0 2 4 6 8 10
Cum
ulat
ive
Oil
Reco
very
(%IO
IP)
Injected fluid (PV)
CO₂ floodCO₂ foam flood
(b) Water and CO2 foam floods
IOIP
Water
flood
CO2
flood
IOIP
(c) (d)
(a) Water and CO2 floods
Water flood
Water
flood
CO2
foam
flood

28
contacted by the displacement fluid over the total area of the oil filled area. The viscous
fingering pattern of CO2 gas flooding is observed at the pore scale as continuous gas phase
channels extended through many pores in the flow direction (left to right) with a narrow spread
in the transverse direction. The connected, sinuous nature of the oil phase is illustrated by the
fluorescence image in Figure 3-4a, employing the natural fluorescence of the oil phase (excited
at 450-500 nm and collected at 510-560 nm). In contrast, the nanoparticle-stabilized CO2 foam
flood was observed to spread stable nanoparticle-stabilized CO2 foam bubbles during the entire
flooding process. A representative example obtained with bright field microscopy is shown in
Figure 3-4b.The foam is well-distributed throughout the network, trapping and transporting
interstitial oil.
CO2 gas
Foam Oil
Oil
(a)
(b)

29
Figure 3-4. Pore-scale images of CO2 gas flooding and nanoparticle-stabilized CO2 foam
flooding. (a) CO2 gas flooding resulting in a long sinuous oil phase (imaged through native oil
fluorescence) and connected gas channels (black) fingering through the network; (b)
Nanoparticle-stabilized CO2 foam bubbles visible through bright field microscopy, trapping
and transporting interstitial oil. Scale bars: 250µm.
Fluorescence imaging at the micro-scale enables quantification of the oil-in-water and water-
in-oil emulsion size distributions, as shown in Figure 3-5. Images of both types of emulsions
are shown for both the CO2 flood case and the nanoparticle-stabilized CO2 foam case, in
Figure 3-5a. Oil-in-water emulsions from the CO2 flooding case range from 1 µm to 40 µm,
with an average size of 7.8 µm. Nanoparticle foam flooding results in significantly smaller oil-
in-water emulsion sizes ranging from 1µm to 6 µm, with an average size of 1.7 µm (~ 80 %
smaller). Likewise, the oil-in-water emulsion density in the nanoparticle foam flooding case
(2067 emulsions per mm2) is much higher than CO2 gas flooding case (459 emulsions per
mm2). This effect is attributed here to the interfacially-active nanoparticles being active at the
oil-water interface with high adsorption energy. That is, the same physics that aids in the
formation and stabilization of CO2-in-water foams/emulsions, aids in formation and
stabilization of oil-in-water emulsions. The latter is an unreported mechanism that likely
contributes to increased oil recovery observed with nanoparticle-stabilized CO2 floods. As
with other enhanced oil recovery methods, smaller oil-in-water emulsion sizes improve
recovery rates74 (though, admittedly, complicating surface-separation operations). Notably, a
reduction in emulsion size is not observed for water-in-oil emulsions in the CO2 foam case.
Water-in-oil emulsions for CO2 and foam flooding show similar distribution and average size
of 2.5 µm in CO2 flooding and 3.4 µm in foam flooding. These results also point to the
specific emulsion formation dynamics of the nanoparticles (50%-coated silica), preferring to
stabilize emulsions of non-polar fluids within water (and not vice versa). A lack of an effect
on water-in-oil emulsions is also likely a positive for operators, particularly in the context of
downstream water/oil separation processes.

30
Figure 3-5. Micrometer-scale quantification of emulsion sizes using the native fluorescence of
the oil phase. a) Images of oil-in-water and water-in-oil emulsions produced by a CO2 flood
and a nanoparticle-stabilized CO2 foam flood (bright phase is the oil). b) size distribution of
oil-in-water emulsions (n = 3840). c) size distribution of water-in-oil emulsions (n = 4080).
Scale bars: 50 µm.

31
Effect of Oil Viscosity on Foam-based Enhanced Oil Recovery. As oil viscosity increases
from light oil to heavy oil, the efficiency of water flooding decreases dramatically due to
viscous fingering. Figure 3-6 shows the results of nanoparticle-stabilized CO2 foam floods
(following water floods) for typical light, medium and heavy oils (37, 24, and 14 API,
respectively). As expected, the water flooding is most effective in light oil recovery with a
recovery of ~ 55%. In contrast, water flooding in medium and heavy oils provided 41% and
12% IOIP, respectively. Very pronounced water fingering is observed in the heavy oil case, in
Figure 3-6c. With injection of nanoparticle-stabilized CO2 foam, all three oils show
substantial additional oil recovery (11% IOIP for light oil, 15% IOIP for medium heavy oil,
and 8% IOIP for heavy oil). The absolute recovery resulting from CO2 foam injection is
maximum for the medium oil case. Specifically, the foam was particularly effective in the
middle-viscosity case where the water flood left significant oil in place (unlike the light oil
case), and yet the viscosity of the oil was not prohibitively high (unlike the heavy oil case). It
is noteworthy that in all cases that the foam injection had a homogenization effect on the
reservoir. That is, the foam smoothed the distribution of oil throughout the pore space
considerably, improving the reservoir characteristics significantly over that resulting from the
water flood. In summary these results indicate significantly improved oil recovery, particularly
for medium oil, and a reservoir- homogenization (continuous oil is partially displaced by foam)
effect for all oils.
32
0
10
20
30
40
50
60
70
0 2 4 6 8 10
Cum
ulat
ive
oil r
ecov
ery
(%IO
IP)
Injected fluid (PV)
Light oilmedium oilheavy oil
(a) Light oil
(c) Heavy oil
IOIP
IOIP
Waterflood
CO2foamflood
WI
FI
IOIP
(b) Medium heavy oil
(d) Oil recovery
Waterflood
CO2foamflood
Water flood
Figure 3-6. Nanoparticle CO2 foam oil recovery using oil with different viscosity a) light
oil, 37 API b) medium heavy oil, 24 API c) heavy oil, 14 API. Each figure shows the initial
saturation, then the water injection and subsequent foam injection d) cumulative oil recovery as
percentage of initial oil in place (IOIP).
3.4 Conclusions Nanoparticle CO2 foam stability and EOR efficiency were evaluated here using a micromodel
approach. Foam stability tests within the micromodel provided a quantitative measurement of
bubble size and coalescence dynamics that cannot be observed or quantified in bulk foam
testing methods. The nanoparticle-stabilized CO2 foams maintained excellent stability within
micro-confined media, and continued to be stable after 10 days as compared to less than one
day for surfactant foam. A nanoparticle-stabilized CO2 foam flood was performed following a
water-flood in an initially oil-filled micromodel. As compared to an otherwise similar case

33
with CO2 gas, the nanoparticle-stabilized CO2 foam showed a three-fold increase in oil
recovery (an additional 15% of IOIP) comprehensively sweeping the reservoir. With other
factors controlled, the higher sweep efficiency obtained with CO2 nanoparticle foams is
predominantly attributed to the role of the physical pore-scale bubble structures which are
rendered very stable by the presence of nanoparticles. Secondary effects, such as nanoparticle-
influenced wetting characteristics may also play a role. Fluorescence imaging was applied to
quantify emulsion size distribution (down to 1µm) in both CO2 and nanoparticle-stabilized
CO2 foam flood cases. Nanoparticle-stabilized CO2 foam flooding resulted in significantly
smaller oil-in-water emulsion sizes with an average size of 1.7 µm (~ 80 % smaller than a CO2
gas flood), and negligible impact on water-in-oil emulsions. Lastly the nanoparticle-stabilized
CO2 foam strategy was applied to oil recovery tests (post water-flood) with light, medium and
heavy oil. All three oils show substantial additional oil recovery (11% IOIP for light oil, 15%
IOIP for medium heavy oil, and 8% IOIP for heavy oil). These results indicate significantly
improved oil recovery, particularly for medium oil, and a potentially valuable reservoir-
homogenization effect for all oils tested.

34
4 Fast fluorescence-based microfluidic method for measuring minimum miscibility pressure of CO2 in crude oils
Carbon capture, storage and utilization has emerged as an essential technology for near-term
CO2 emission control. The largest CO2 projects globally combine storage and oil recovery.
The efficiency of this process relies critically on the miscibility of CO2 in crude oils at
reservoir conditions. We present a microfluidic approach to quantify the minimum miscibility
pressure (MMP) that leverages the inherent fluorescence of crude oils, is faster than
conventional technologies, and provides quantitative, operator-independent measurements of
CO2 and oil MMP. To validate the approach, synthetic oil mixtures of known composition
(pentane, hexadecane) are tested and MMP values are compared to reported values. Results
differ by less than 0.5 MPa on average, in contrast to comparison between conventional
methods with variations on the order of 1-2 MPa. In terms of speed, a pressure scan for a single
MMP measurement required less than 30 min (with potential to be less than 10 min), in stark
contrast to days or weeks with existing approaches. The method is applied to determine the
MMP for Pennsylvania, West Texas, and Saudi crudes. Importantly, our fluorescence-based
approach enables rapid, automated, operator-independent measurement of MMP as needed to
inform the world’s largest CO2 projects.
Nguyen P, Mohaddes D, Riordon J, Fadaei H, Lele P, Sinton D. Fast fluorescence-based
microfluidic method for measuring minimum miscibility pressure of CO2 in crude oils. Anal
Chem. 2015; 87(6):3160-4. Reproduced with permission from American Chemical Society.
Link to publication online: http://pubs.acs.org/doi/abs/10.1021/ac5047856
4.1 Introduction Global energy consumption has led to an increase in CO2 emissions with climate implications.2
Carbon capture, utilization, and storage technologies target the reduction of CO2 emissions and
sustainable global economic development.121–123 Recent research has focused on developing
effective methods of carbon capture,124–126 CO2 conversion to fuels,127,128 sequestration in
underground saline aquifers and combined storage/utilization of CO2 in enhanced oil recovery
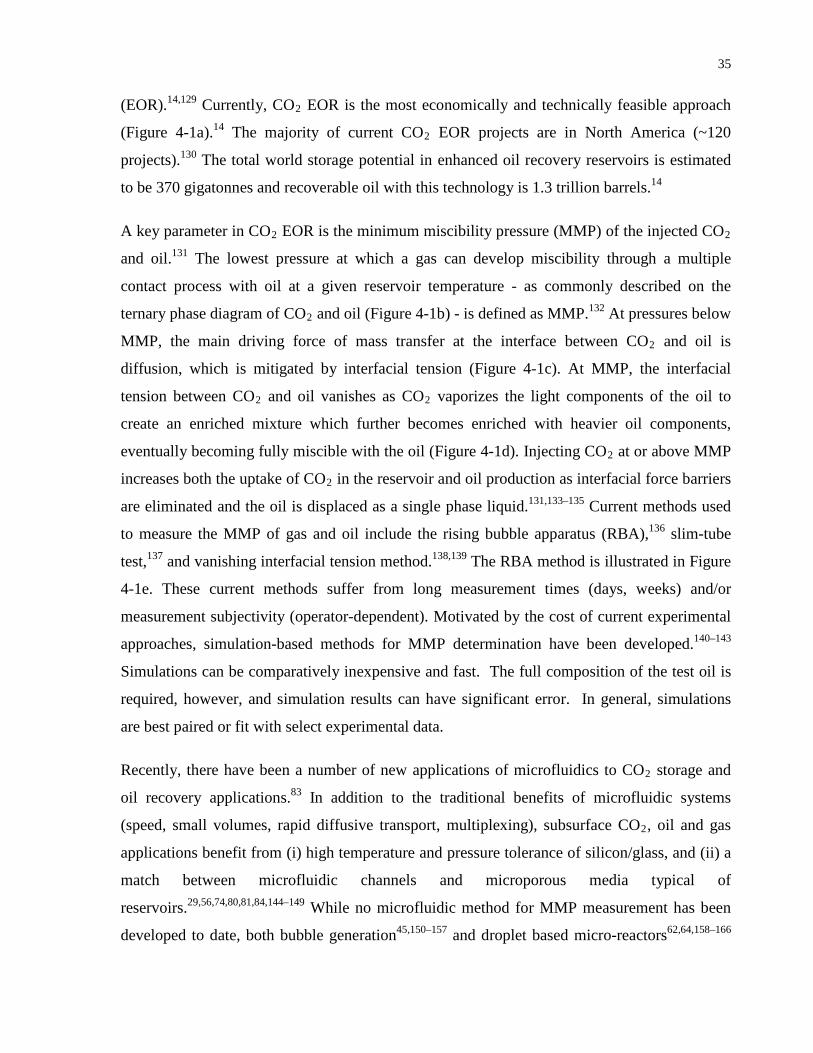
35
(EOR).14,129 Currently, CO2 EOR is the most economically and technically feasible approach
(Figure 4-1a).14 The majority of current CO2 EOR projects are in North America (~120
projects).130 The total world storage potential in enhanced oil recovery reservoirs is estimated
to be 370 gigatonnes and recoverable oil with this technology is 1.3 trillion barrels.14
A key parameter in CO2 EOR is the minimum miscibility pressure (MMP) of the injected CO2
and oil.131 The lowest pressure at which a gas can develop miscibility through a multiple
contact process with oil at a given reservoir temperature - as commonly described on the
ternary phase diagram of CO2 and oil (Figure 4-1b) - is defined as MMP.132 At pressures below
MMP, the main driving force of mass transfer at the interface between CO2 and oil is
diffusion, which is mitigated by interfacial tension (Figure 4-1c). At MMP, the interfacial
tension between CO2 and oil vanishes as CO2 vaporizes the light components of the oil to
create an enriched mixture which further becomes enriched with heavier oil components,
eventually becoming fully miscible with the oil (Figure 4-1d). Injecting CO2 at or above MMP
increases both the uptake of CO2 in the reservoir and oil production as interfacial force barriers
are eliminated and the oil is displaced as a single phase liquid.131,133–135 Current methods used
to measure the MMP of gas and oil include the rising bubble apparatus (RBA),136 slim-tube
test,137 and vanishing interfacial tension method.138,139 The RBA method is illustrated in Figure
4-1e. These current methods suffer from long measurement times (days, weeks) and/or
measurement subjectivity (operator-dependent). Motivated by the cost of current experimental
approaches, simulation-based methods for MMP determination have been developed.140–143
Simulations can be comparatively inexpensive and fast. The full composition of the test oil is
required, however, and simulation results can have significant error. In general, simulations
are best paired or fit with select experimental data.
Recently, there have been a number of new applications of microfluidics to CO2 storage and
oil recovery applications.83 In addition to the traditional benefits of microfluidic systems
(speed, small volumes, rapid diffusive transport, multiplexing), subsurface CO2, oil and gas
applications benefit from (i) high temperature and pressure tolerance of silicon/glass, and (ii) a
match between microfluidic channels and microporous media typical of
reservoirs.29,56,74,80,81,84,144–149 While no microfluidic method for MMP measurement has been
developed to date, both bubble generation45,150–157 and droplet based micro-reactors62,64,158–166
36
are relevant to this approach. These microfluidic platforms have been extensively applied in
lab-on-chip technology, chemical synthesis, and phase behaviour studies.
Herein, we report a rapid, user-independent method for measuring CO2-in-oil MMP at
reservoir-relevant temperatures and pressures. The mixing of continuously-generated CO2
bubbles within a microchannel embedded in silicon are observed quantitatively, leveraging the
inherent fluorescence of crude oil sample (Figure 4-1f). To validate and benchmark the
method, a set of synthetic oil mixtures with known compositions of pentane and hexadecane
are tested with results compared to those from the RBA method. The dependence of MMP on
temperature and density (API gravity) is also demonstrated. To demonstrate wide applicability,
the method is applied to measure the MMP of relevant crude oils: Pennsylvania, West Texas,
and Saudi crudes.

37
Figure 4-1(a) Schematic of CO2 storage and enhanced oil recovery, CO2 EOR. (b) Schematic
of ternary diagram of CO2 and model synthetic crude oil components (pentane and
hexadecane). Schematics illustrating molecular behavior at the oil/CO2 interface are presented
at pressures (c) below MMP and (d) at MMP. The conventional rising bubble apparatus (RBA)

38
method (e) is compared to the microfluidic MMP method (f), each inset with corresponding
bubble behaviors at pressures below and at MMP
4.2 Experimental method The microfluidic chip was fabricated through deep reactive ion etching of silicon, and
subsequent anodic bonding to glass. Hybrid silicon-glass chips can withstand a high range of
pressures and temperatures (P ≤ 40 MPa, T ≤ 200 °C),65 sufficient for all practical CO2 EOR
applications. The chip design consists of a T-junction with a main channel width of 250 µm
and a CO2 nozzle width of 50 µm. Both the CO2 and oil channels have resistors upstream of
the T-junction to dampen pressure fluctuations, and all channels have a depth of 100 µm. The
chip was installed on a stainless steel manifold with high pressure compression fittings
(Swagelok) to provide high pressure connections to the fluid lines as shown in Appendix 1:
Figure S1. High pressure pumps (Teledyne Incommode 260D) were used to pump CO2 into the
chip and to set the reference pressure on the backpressure regulator (Equilibar Model
EB1ULF1-SS316). A third high pressure pump (Eldex, Optos Series 1SMP) was used to flow
oil into the chip, and the backpressure regulator was used to set the system pressure. A 60W
tape heater was attached to the back of the chip to provide a set temperature on the chip. The
heating tape was controlled by a temperature controller (Omega Model CNi3222) within ±1⁰C.
A fluorescent microscope (Leica DMLM) was used to image the bubble formation and CO2/oil
phases in the chip with a 10X objective and a Semrock BrightLine filter cube (Ex 375-400, Em
LP405). The images were captured with a high speed camera (Model PCO 1200s) at a frame
rate of 100 frame per second. The recorded images were processed in ImageJ to perform image
calibration and intensity analysis. Image calibration for background removal was performed
using dark and bright image based on an shading correction method given by Wilkinson
et.al.167 Materials used in this work are presented in Appendix 1: Table S1.
For each data set, the main channel was filled with oil to the pressure set by the backpressure
regulator. Subsequently, CO2 was injected into the oil channel from the smaller T-junction side
channel (Figure 4-1f). The pressure was then incrementally increased, and the fluid mixing
properties at the T-junction and downstream were monitored via fluorescence microscopy. In
the case of synthetic oil tests, fluorescent dye (Dye-Lite, Tracerline) was added to the oil

39
mixture at a concentration of 50 ppm to enable fluorescent imaging. In the case of crude oils,
no dye was added as the inherent fluorescence was used. Between experiments, the chip was
cleaned with successive flushing of toluene and acetone. In this work, we performed a
vaporizing gas drive by introducing pure CO2 into fresh oil. Although not the focus here, our
microfluidic technique could in principle be expanded to measure the MMP of alternate gases,
such as enriched CO2 mixtures which are used in condensing gas drives.
4.3 Results and discussion Figure 4-2a shows the changes in bubble shape with pressures below, at, and above MMP, as
observed in the microfluidic chip. Below MMP, the interfacial tension between the CO2 and
oil is high, which allowed the bubbles to retain their shape with sharp channel-blocking
interfaces as shown for the case of P = 5.9 MPa. In this regime, the mass transfer between the
CO2 phase to the oil phase is through diffusion across the interface. As a result, the CO2
bubbles shrink as they flow downstream, as is familiar in gas-liquid droplet reactors. As the
pressure was increased to MMP (P = 6.1 MPa), the interfacial tension decreased and the
injected CO2 bubbles deformed readily in response to flow-induced stresses. Specifically,
round nose shaped bubbles were formed with trailing boundaries that were rapidly eroded as
they mixed with the continuous oil phase, unimpeded by interfacial tension. Likewise, the
bubble shape shown (P = 6.1 MPa) is reminiscent of miscible band broadening in Poiseuille
flow, and also characteristic of the shape observed in RBA at MMP.136 Above MMP
(P = 6.2 MPa), mixing is rapid, and the two phases are largely indistinguishable at the
downstream location shown in Figure 4-2a. At the injector distinct phases are observed at
pressures moderately above MMP, and progressively less so as interfacial tension vanishes
with increasing pressure.
The microfluidic method was validated by comparing measured MMP values to those
measured with the RBA method.136 These validation tests were conducted with various
synthetic oil mixtures (hexadecane/pentane, 63 to 79 API) at different temperatures (25 °C to
60 °C). As shown in Figure 4-2b, MMP measurements demonstrated strong agreement with
reported RBA measurements, with an average difference of 0.5 MPa. This degree of agreement
is significant in the context of comparisons among MMP methods: previously reported MMP
measurements using RBA and slim tube methods differ on average by 0.86 MPa,130,136,137 and

40
MMP measurements with vanishing interfacial tension and slim tube methods differ by 2.2
MPa.168 Figure 4-2c plots the temperature dependence for MMP measurements for synthetic
oils of different density. The linear fit for 68 API has a slope of 0.168 MPa/°C which compares
well to the 0.188 MPa/°C as measured by the RBA method for this synthetic oil mixture.137
The method was applied to other synthetic oil mixtures (63 API, 71 API, and 79 API), each
providing a distinct MMP, increasing with temperature.

41
Figure 4-2 (a) Demonstration of high-contrast fluorescence imaging of CO2 bubbles flowing
through synthetic oil at pressures below, at, and above MMP. (b) Cross plot comparing
microfluidic MMP measurements to literature MMP values from the RBA method. The 45°
dashed line represents the ideal perfect correlation case. (c) Demonstration of the linear
dependence of MMP on temperature for various synthetic oil mixtures (63 API, 68 API, 71
API, and 79 API). MMP increases with oil density from light to heavy oil.
The method was applied to measure MMP of crude oils from large EOR candidate reservoirs
worldwide. The MMP measured for Pennsylvania crude (8.34 ± 0.07 MPa) and West Texas
crude (10.0 ± 0.3 MPa) at 40 °C compare well to literature data of 7.3 MPa (estimated based on
Cronquist correlation) and 9.7 MPa (measured with slim tube)169 respectively (Table 4-1).
Figure 3 illustrates how the fluidic mixing behavior varies between the three different crude
oils. This variation can be attributed mainly to differences in crude oil compositions.170 Despite
the natural variability in these oils, all three exhibit recognizable shifts in flow condition
signaling MMP.
Oil type Density
(°API) Temperature (°C)
Microfluidic MMP
(MPa)
Pennsylvania 48.8 25 5.52 ± 0.07
40 8.34 ± 0.07
West Texas 38.9 25 7.4 ± 0.2
40 10.0 ± 0.3
Saudi Berri 37.0 25 8.3 ± 0.7
40 10.7 ± 0.3
Table 4-1 Crude oil MMP measurements.

42
Figure 4-3 Microfluidic fluorescent visualization of West Texas and Pennsylvania crude oil at
MMP, at 25°C and 40°C, as indicated. Each crude exhibiting a characteristic mixing pattern
due to differences in oil compositions.
In contrast to all existing methods, a fluorescence-based microfluidic approach presents the
opportunity for direct, user-independent, measurement of MMP. To demonstrate, fluorescence
image sequences (1.45 s) were analysed using ImageJ software, each corresponding to a given
inlet pressure in the range of MMP. The average intensity over a 35 µm x 185 µm detection
region within the channel was sampled in each frame and plotted over time (Figure 4-4a,b). At
sub-MMP values, oil and CO2 plugs traversed the detection region in sequence, which
generated a strong periodic oscillation between intensity plateaus. At higher pressures (6.07
MPa) fluid plugs quickly interweaved and mixed. On occasion, shrunken CO2 plugs traversed
the detection region, which caused a detectable dip in fluorescence signal. Figure 4-4c shows
how this intensity changed over time at various pressure settings, each normalized to unity. As
the MMP region was approached, sharp changes in fluorescence became infrequent and
eventually ceased to occur. At a pressure above MMP, the intensity signal fully stabilized. To
quantify MMP directly from this data, the intensity profiles were differentiated with respect to

43
time as shown in Appendix 1: Figure S3. The variance of each of these data sets was
calculated for each video segment, and plotted in log format in Figure 4-4d. The data points
were fit to the Boltzman sigmoidal equation:
(3)
Fit parameters: A1 = 1.44 ± 0.2, A2 = -1.9 ± 0.2, x0 = 6.14 ± 0.02 and dx = 0.05 ± 0.02. A MMP
value of 6.14 MPa was determined by the inflection point, that is, the minimum of the
derivative of the sigmoidal curve. This measured value compares well to the 6.1 MPa MMP
value obtained by direct visualization method.

44

45
Figure 4-4 Operator-independent fluorescence-based measurement of MMP: fluctuations in
fluorescence intensity at pressures of (a) 4.83 MPa and (b) 6.07 MPa measured over time. Data
points highlighted with red circles are shown with corresponding images. (c) Variation in
average intensity within the detection region over time at different pressures. The variance of
the derivative of these data sets is plotted in log format in (d). The derivative of this curve is
plotted to highlight the point of greatest slope, which corresponds to MMP – in this case, 6.14
MPa.
4.4 CONCLUSION In summary, we demonstrate a microfluidic method for measuring CO2 and oil MMP which
provides two distinct advantages over conventional methods: fast measurement speed and
quantitative analysis. In terms of speed, MMP can be obtained within 30 min using our
microfluidic technique, compared to days or weeks using traditional methods such as RBA,
slim tube or vanishing interface methods. Further, in leveraging the inherent fluorescence of
crude oils, we achieved heightened contrast between CO2 and oil, and pro-vided the means of
quantitative, user-independent, MMP measurement. Microfluidic MMP measurements were
validated with the established RBA method data, showing a strong agreement with expected
values under CO2 reservoir-relevant conditions. Collectively these results demonstrate the
potential to inform and improve the largest current CO2 operations worldwide.
46
5 Microfluidics Underground: A Micro-Core Method for Pore Scale Analysis of Supercritical CO2 Reactive Transport in Saline Aquifers
Carbon sequestration in microporous geological formations is an emerging strategy for
mitigating CO2 emissions from fossil fuel consumption. Injection of CO2 in carbonate
reservoirs can change the porosity and permeability of the reservoir regions, along the CO2
plume migration path, due to CO2-brine-rock interactions. Carbon sequestration is effectively a
microfluidic process over large scales, and can readily benefit from microfluidic tools and
analysis methods. In this study, a micro-core method was developed to investigate the effect of
CO2 saturated brine and supercritical CO2 injection, under reservoir temperature and pressure
conditions of 8.4MPa and 40 °C, on the microstructure of limestone core samples. Specifically,
carbonate dissolution results in pore structure, porosity, and permeability changes. These
changes were measured by x-ray microtomography (micro-CT), liquid permeability
measurements, and chemical analysis. Chemical composition of the produced liquid analyzed
by inductively coupled plasma-atomic emission spectrometer (ICP-AES) shows concentrations
of magnesium and calcium in the produced liquid. Chemical analysis results are consistent
with the micro-CT imaging and permeability measurements which all show high dissolution
for CO2 saturated brine injection and very minor dissolution under supercritical CO2 injection.
This work leverages established advantages of microfluidics in the new context of core-sample
analysis, providing a simple core sealing method, small sample size, small volumes of injection
fluids, fast characterization times, and pore scale resolution.
Nguyen P, Fadaei H, Sinton D. Microfluidics Underground: A Micro-Core Method for Pore
Scale Analysis of Supercritical CO2 Reactive Transport in Saline Aquifers. J Fluids Eng. 2013;
135(2):021203. doi:10.1115/1.4023644. Reproduced with permission from The American
Society of Mechanical Engineers.
Link to publication online:
http://fluidsengineering.asmedigitalcollection.asme.org/article.aspx?articleid=1671766&result
Click=1

47
5.1 Introduction Microfluidics has been widely used in many areas of science and engineering to study
biological, medical, and chemical applications.69,171 Recent applications of microfluidics to
study fluid transport phenomena in oil reservoirs and saline aquifers has sparked a new interest
in leveraging some attributes of microfluidics such as small sample size, fast reaction time,
rapid transport, and real time micro scale visualization in the study of multiphase fluid
interactions underground.81,172–174 Reservoirs are made up of porous media that consists of a
network of channels and voids with length scales on the order of 0.1µm to 100 µm.175,176 These
length scales match those of traditional microfluidics applications.
Carbon sequestration in geological formations is one potential solution for mitigating carbon
dioxide emissions from fossil fuel consumption.177 Deep saline aquifers can sequester carbon
dioxide by four main mechanisms: structural and hydrodynamic trapping in which CO2 moves
upward towards the cap rock since it is lighter than brine, residual trapping of CO2 in the pore
spaces of the reservoir rock formation, solubility trapping through the dissolution of CO2 in
formation water, and mineral trapping where dissolved CO2 reacts with mineral cations to
form stable carbonate minerals.178 Deep saline aquifers have capacity for large scale storage of
CO2 on the order of 1000 of Gigatons. Injecting CO2 in saline aquifers causes the pH to
decrease due to the formation of carbonic acid which leads to carbonate mineral dissolution in
limestone or dolomite formations. The chemical reactions governing carbonate dissolution are
presented in Eqn. (4) - Eqn. (6).55,179–181 The microstructure porosity and permeability of the
porous media change as the result of this dissolution. Understanding local mass transfer
between CO2-brine-rock interactions is critical for designing, assessing and monitoring CO2
sequestration processes.
(4)
(5)
(6)

48
Most previous studies of calcite dissolution were performed at low pressure up to 55 atm and
using cores with dimensions in the range of 0.1 m diameter and 0.3 m- 1 m in length. The
spatial resolution for x-ray imaging for these core sizes is larger than the pore sizes of reservoir
rocks, and thus pore-scale dynamics are obscured. Izgec et al.182 and Perrin et al.183 use core
plugs of a few centimeters in diameter to study bulk saturation and porosity of the core plugs in
CO2 injection processes. A few studies visualized the CO2-fluid-rock interactions in the core
sample at the pore scale level under supercritical CO2 conditions. Luquot et al.184 and Gouze et
al.185 characterized porosity and permeability changes due to CO2 injection at pore scale level
using x-ray micro-CT. Iglauer et al.186 calculated residual CO2 saturation, CO2 cluster size and
distributions at reservoir conditions in sandstone core samples using micro-CT. All of these
works employed X-ray and associated microscopic image analysis methods to calculate
porosity and permeability in dry cores and in the case of core flooding experiments, to measure
the saturations of injected and displaced fluids. These previous studies measured the
macroscopic properties of CO2 brine rock interactions and bulk core saturations using core
plugs, with the exception of Luquot et al. who demonstrated the potential for using smaller
core sizes for pore scale analysis of supercritical CO2 transport and reactivity in porous media.
The core size used in that study, however, was still too large to image the whole core with pore
scale resolution and their experiments employed a standard core experimental setup.
In this study, a micro-core method is used to analyze reactive transport during supercritical
CO2 transport through brine-saturated limestone. This method allows for high resolution
imaging of the pore scale changes due to injection of supercritical CO2 using X-ray
microtomography and SEM, and employs a microfluidic experimental setup which is simpler
than traditional core flooding methods. The pore structure changes due to dissolution of
calcium carbonate are imaged and the related porosity changes are obtained from image
processing. This micro-core method takes advantage of microfluidics fabrication in core
sealing and supporting infrastructure. The result is a faster analysis method, readily applicable
to microfluidics laboratories, that provides high resolution imaging compared to conventional
core flooding and is a suitable technique for studying the porosity and permeability changes
under supercritical CO2 conditions. In addition to pore scale imaging of carbonate dissolution,
chemical analysis of the produced liquid was also performed over the core flooding period to
monitor the concentrations of calcium and magnesium ions in the produced liquids. This thesis

49
presents a proof of concept of the micro-core method that can be used to characterize pore
scale changes in carbonate core samples due to CO2 injection.
5.2 Experimental Setup The experimental setup is shown in Figure 5-1. The system uses a microfluidic chip style
holder and connections which simplify the apparatus as compared to conventional core-study
methods. Carbonate core samples, Indiana Limestone obtained from Kocurek Industries were
used in this study. The micro-cores were 6.35mm in diameter and 10mm long with an average
pore volume of 57 µL. Prior to each experiment, the cores were cleaned by injecting ~ 100
pore volumes of deionized water through the core. The cores were then dried in the vacuum
oven at 110 °C for 10 hours to remove any trapped water, and subsequently imaged by micro-
CT to measure initial pore structures. The cores were wrapped in polyvinylidiene fluoride
(PVDF) heat shrink tube and the formed tube ends were sealed with epoxy and attached to 1/16
stainless steel tubing. Small scale tubing provides easy connection to inlet and outlet
instruments using high pressure fittings from Upchurch Ltd. In addition, the small size of the
micro-core holder makes it simple to fit both the core holder and the CO2/brine reservoir in the
water bath for very precise temperature control. The smaller setup reaches equilibrium
conditions quickly, reduced fluid volumes, and reduced characterization times. Brine with
concentration of 1.81 M NaCl similar to the Alberta Redwater Leduc formation was initially
injected into the core by vacuum injection to displace all air in the pore space. The brine-
saturated core was then placed in the stainless steel micro-core holder which was then
connected to the high pressure CO2 system as shown in Figure 5-1. Stainless steel micro-core
holder was used to withstand the high confining pressure required for supercritical CO2
injection through the core. Confining pressure was provided by the high pressure hydraulic
hand pump. The confining pressure was kept at 2 MPa above the injection pressure to ensure
there was no flow along the core surface between the core and the heat shrink tubing. The
pressure drop across the core was measured by a pressure differential transducer (Honeywell
model TJE ultra precision) with accuracy of 0.1% full scale. The experimental temperature was
kept constant by using a heating water bath (Fischer Scientific, Isotemp 2340) to within ± 0.1
°C.
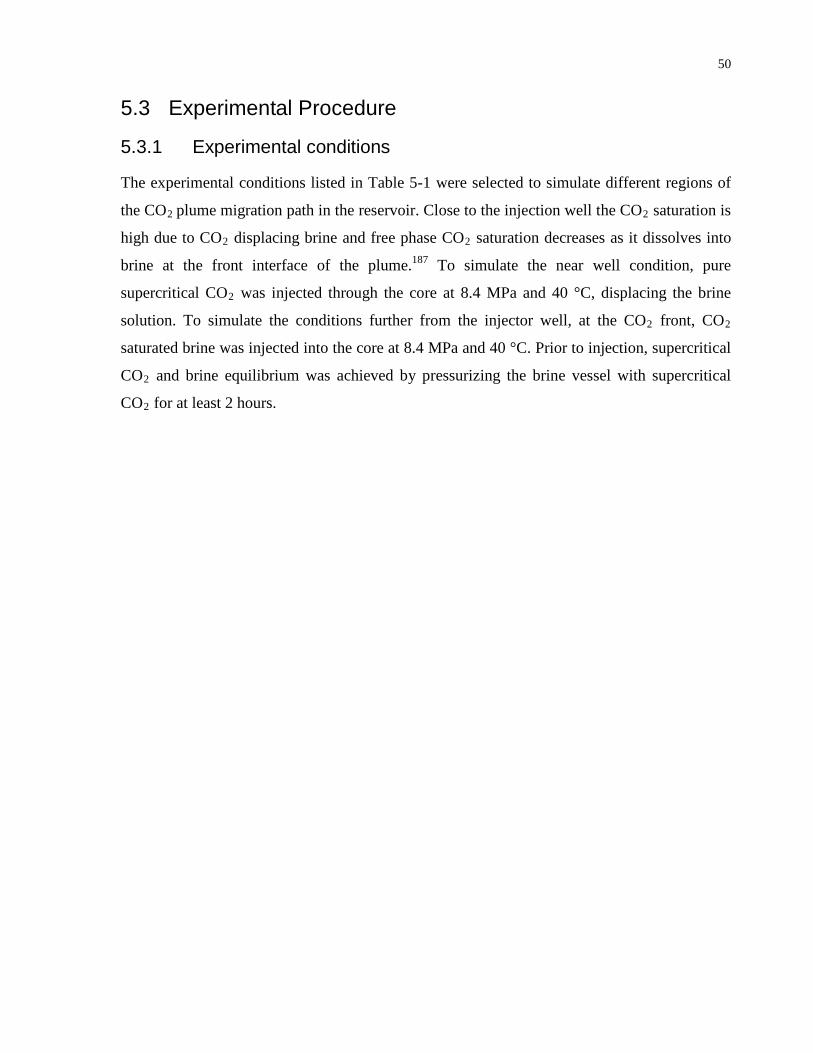
50
5.3 Experimental Procedure
5.3.1 Experimental conditions
The experimental conditions listed in Table 5-1 were selected to simulate different regions of
the CO2 plume migration path in the reservoir. Close to the injection well the CO2 saturation is
high due to CO2 displacing brine and free phase CO2 saturation decreases as it dissolves into
brine at the front interface of the plume.187 To simulate the near well condition, pure
supercritical CO2 was injected through the core at 8.4 MPa and 40 °C, displacing the brine
solution. To simulate the conditions further from the injector well, at the CO2 front, CO2
saturated brine was injected into the core at 8.4 MPa and 40 °C. Prior to injection, supercritical
CO2 and brine equilibrium was achieved by pressurizing the brine vessel with supercritical
CO2 for at least 2 hours.
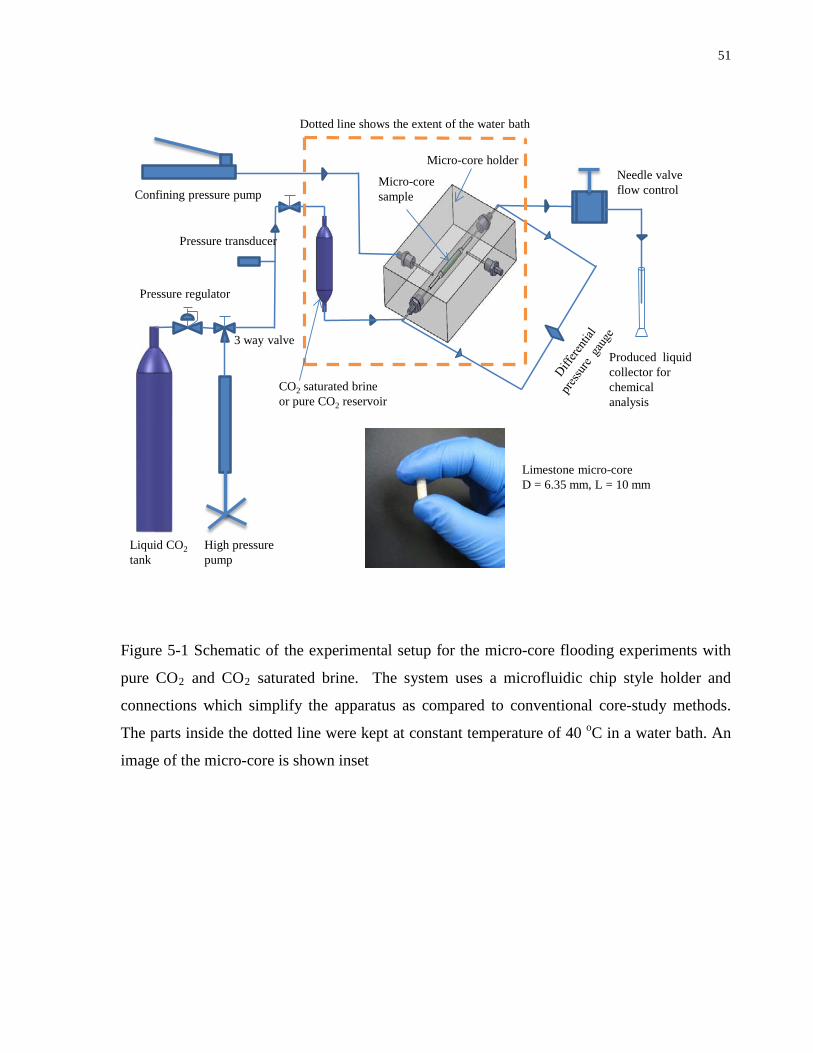
51
Liquid CO2tank
Pressure regulator
Produced liquid collector for chemical analysis
Micro-core sample
Micro-core holder
Pressure transducer
Confining pressure pump
CO2 saturated brineor pure CO2 reservoir
Dotted line shows the extent of the water bath
Needle valveflow control
High pressure pump
3 way valve
Limestone micro-core D = 6.35 mm, L = 10 mm
Figure 5-1 Schematic of the experimental setup for the micro-core flooding experiments with
pure CO2 and CO2 saturated brine. The system uses a microfluidic chip style holder and
connections which simplify the apparatus as compared to conventional core-study methods.
The parts inside the dotted line were kept at constant temperature of 40 oC in a water bath. An
image of the micro-core is shown inset

52
Table 5-1. Experimental conditions for CO2 core flooding experiments to simulate different
regions of the CO2 plume in saline aquifer
Test condition Case 1 Case 2 Injection fluid CO2
Pure CO2 Temperature 40 °C 40 °C Injection pressure 8.4 MPa 8.4 MPa Brine concentration 1.81 M NaCl 1.81 M NaCl Confining pressure 10.4 MPa 10.4MPa
5.3.2 Core flooding with pure CO2 and CO2 saturated brine
Supercritical CO2 was generated by compressing liquid CO2 at 5.4 MPa with the high pressure
screw pump to 8.4 MPa. The liquid CO2 was then transferred to the brine reservoir vessel
submerged in the water bath at 40 oC to reach supercritical state. The brine was saturated with
CO2 before core flooding. The temperature and pressure conditions were chosen to simulate
the Alberta Redwater Leduc limestone reservoir conditions. Supercritical CO2 saturated brine
was then injected through the core at a flow rate of 80µL/min. This flow rate was chosen based
on typical reservoir pore velocity in the range of a few feet per day [24]. The flow rate was
controlled by a micro control needle valve (HiP Model 15-11AF1-V). The injection duration
was 3 hours (253 pore volumes) for each case. Produced liquid samples were collected every
10 minutes for chemical analysis. At the end of the core flooding period, the cores were taken
out of the micro-core holder and placed in the vacuum oven to remove all CO2 and water in
preparation for post injection permeability measurements.
5.3.3 Permeability measurements
The core permeability was measured before and after core flooding for each case. Permeability
was measured using deionized water injection. Deionized water was used to prevent the
possibility of salt blockage of the pores upon drying of the core sample (prior to imaging).
Water was injected at constant flow rates and pressure drops across the core sample were
measured with the pressure differential transducer. Permeability was then calculated based on
Darcy’s law:

53
Q=kA/μL ∆P (7)
Where Q is flow rate in cm3/s, ΔP is pressure drop across the core in atm, k is permeability in
Darcy, and µ is viscosity in cP, A is cross-section area of the core in cm2, L is core length in
cm.
5.3.4 Scanning electron microscope, x-ray micro-CT, and image analysis
X-ray micro-CT images of the samples were taken before and after each core flooding
experiment to characterize the original pore structure and the pore structure after each core
flooding experiment. The x-ray micro-CT scanner used in this work was SkyScan 1172. The
micro-CT images were scanned with a setting of a voltage of 100k V, a current of 100µA, and
a resolution of 4.9 µm per pixel. An aluminum filter was used to reduce the beam hardening
effects on the images since limestone has large variation in attenuation coefficient between
grains and pores. The raw micro-CT projection images were first reconstructed into cross-
section images using the NRecon Software (Skyscan Ltd.). This software uses the Feldkamp
algorithm to reconstruct the images, and also has a number of built in functions to enhance the
reconstructed image such as beam hardening correction, ring artifacts reduction, and image
smoothing. The reconstructed cross-section images were analyzed in CTAn (Skyscan Ltd.),
and the Otsu algorithm (internal feature of CTAn) was used to threshold the gray images to
binary images. Figure 5-3(c) shows the conversion of a gray image to a binary image and the
corresponding histogram of the pixel intensities. The binary image conversion was performed
on the selected region of interest, which is the diameter of the micro-core, for each image
cross-section. The average porosity of the entire image stack was then calculated for each
micro-core. In addition to micro-CT imaging, scanning electron microscope (SEM) equipped
with energy dispersive spectrometry (EDS) was used to characterize the initial pore and grain
matrix as well as its material composition. The SEM used in this experiment was JEOL
JSM6610-Lv model with maximum resolution of 3.0 nm, and EDS was Oxford Aztec model.
5.3.5 Atomic emission spectroscopy analysis of produced liquid
Produced liquid was collected and analyzed for concentrations of dissolved Ca2+ and Mg2+ ions
with Inductively Coupled Plasma Atomic Emission Spectrometer (ICP-AES). The instrument

54
model used (PerkinElmer Optima 7300) was capable of detecting Ca2+ and Mg2+ ion
concentration as low as 20 parts per billion (ppb).
5.4 Results and Analysis
5.4.1 Initial characterization of limestone core samples
The pore structures of a thin piece (3mm x 6.35mm in diameter) cut from the same micro-core
stock were examined with SEM as shown in Figure 5-2. The intergranular pore size (Fig. 5-
2(a)) is on the order of a few hundred microns, whereas the intragranular pores (Fig. 5-2(b))
are on the order of a few microns. The limestone samples used in this study have larger pore
sizes than the typical carbonates. In addition, carbonates typically have a pore size distribution
down to the nanoscale as well. While the net effect of chemistry acting on these pores may be
apparent at the scales imaged here, pore dynamics below 5 µm are not resolvable with the
imaging methods applied herein. Energy dispersive spectrometer analysis showed that the
limestone samples were 99% calcium carbonate and ~1% magnesium carbonate.

55
Figure 5-2 SEM images of Indiana limestone core samples used in this study: (a) intergranular
pores (b) intragranular pores of the dotted red line region in part (a). For both cases, the black
areas are pores and grey areas are grains. Scale bars indicate 500 µm in (a) and 10 µm in (b).
5.4.2 Pore structure and porosity changes due to carbonate dissolution
The micro-cores were imaged using Micro-CT, sealed, placed in the chip holder, and vacuum-
injected with brine solution (experimental details in the Section 2). Two types of core flooding
experiments were performed, scCO2-saturated brine and pure scCO2 injection. Micro-CT
images of the core taken before and after each flooding test are presented in Figure 5-3 and
Figure 5-4 for the scCO2 and CO2-saturated brine flood cases, respectively. A marker was
placed along the length of the core to landmark the approximate location of recognizable grains
and pores used to match the before and after images. As shown in Fig. 5-3, core flooding with
CO2 saturated brine solution caused major calcite dissolution. This is indicated by the increase
of the black regions in the after-flooding images compared to the before images. The
dissolution is due to the reaction between the carbonic acid in the brine phase and calcium
carbonate grains.
For the CO2 saturated brine injection case (Fig. 5-3), the carbonate dissolution results in a
porosity increase from 18.1% to 26.8%. Although the pore connectivity was not explicitly
quantified here through image analysis, a notable increase in pore connectivity is apparent
from the images. The sagittal plane (horizontal along the axis of the core) in Fig. 5-3 shows the
pore width increases to 674 µm and the longest connected path of 3.98 mm (these dimensions
were measured based on the image resolution of 4.9 microns per pixel). In stark contrast, pure
CO2 core flooding results in much less calcite dissolution as shown in. The calcite dissolution
in this case was caused only by the dissolution of injected CO2 into the initial water saturation
present in the pore spaces. The amount of this acidified water is comparatively small and
results in very little carbonate dissolution. This effect can be clearly seen in Fig. 5-4 where the
before and after images are almost identical. Image analysis shows that the porosity increase
was minor, from 17.5% to 19.5%.
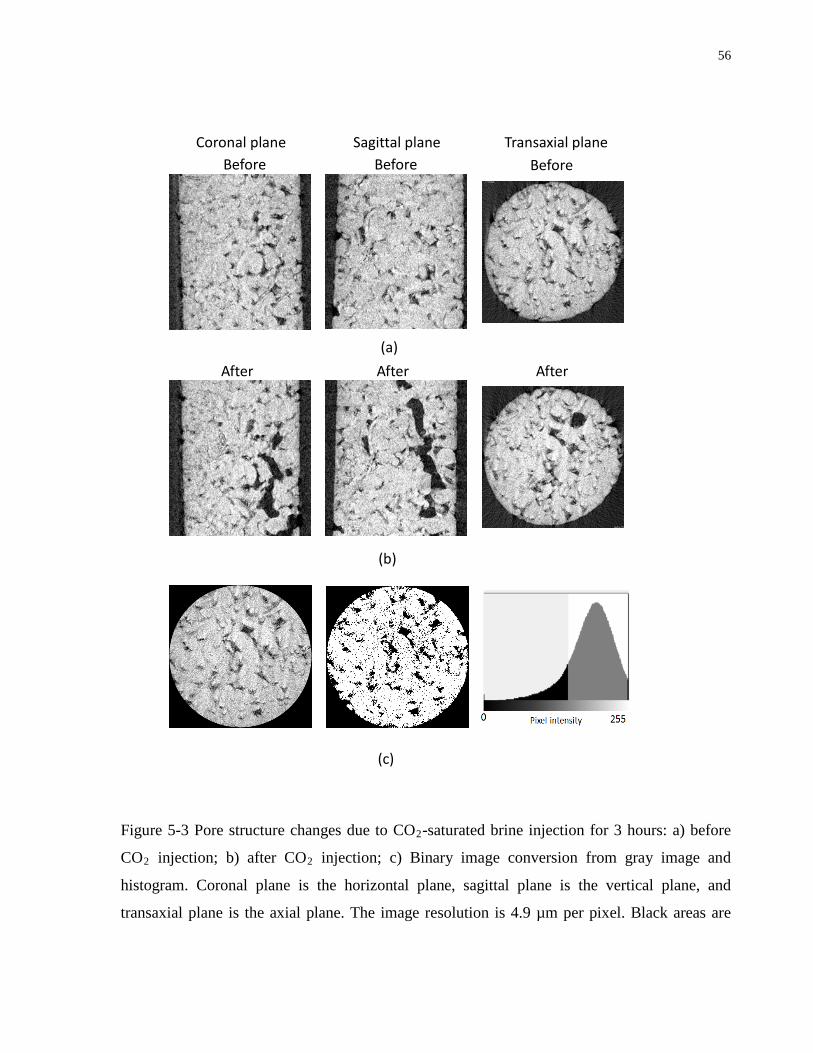
56
Figure 5-3 Pore structure changes due to CO2-saturated brine injection for 3 hours: a) before
CO2 injection; b) after CO2 injection; c) Binary image conversion from gray image and
histogram. Coronal plane is the horizontal plane, sagittal plane is the vertical plane, and
transaxial plane is the axial plane. The image resolution is 4.9 µm per pixel. Black areas are
Coronal plane Sagittal plane Before Before
Transaxial plane Before
After After After (a)
(b)
(c)

57
pores and grey areas are grains. The degree of dissolution is significant, with a porosity
increase from 18.1% to 26.8% and an observable increase in pore connectivity.
Figure 5-4 Pore structure changes due to pure CO2 injection through the core for 3 hours: a)
before CO2 injection; b) after CO2 injection. Coronal plane is the horizontal plane, sagittal
plane is the vertical plane, and transaxial plane is the axial plane. The image resolution is 4.9
µm per pixel. Black areas are pores and grey areas are grain. In comparison with CO2-
saturated brine flooding (Fig. 5-3), very little dissolution occurs in this case. Porosity increase
is minor, from 17.5% – 19.5%.
Coronal plane Sagittal plane Before Before
Transaxial plane Before
After After After
(a)
(b)

58
5.4.3 Permeability change due to carbonate dissolution
For each core sample, permeability was calculated using Darcy’s law in Eqn. 4 with the slope
of the linear fit through the measured flow rate versus pressure drop relationship. Figure 5-5(a)
shows the plot of flow rate versus pressure drop for the CO2 saturated brine injection case. The
permeability increases from 5.3 mD before core flooding to 2480 mD after core flooding. This
large permeability increase is in agreement with the observations in micro-CT images (Fig. 5-
3) showing a major pore size increase and extensive pore connectivity increase. Large increase
in permeability is in keeping with previous core studies on CO2-brine-limestone interaction.
Specifically, this high permeability is similar to that measured by Grigg et al.106 ~2000 mD,
based on the inlet 17 cm of a 56 cm long core with a diameter of 5 cm (Indiana limestone). For
the pure CO2 case, the plot of flow rate versus pressure drop is shown in Figure 5-5(b). The
permeability increase is much less in this case due to very minor porosity increase and low
pore connectivity enhancement as observed in the micro-CT images. The permeability
increases from 4.1 mD to 10.5 mD.

59
0 10 20 30 40 50 60 700
0.2
0.4
0.6
0.8
1
1.2
1.4
Pressure drop (kPa)
Flow
rate
( µL/
s)
Data before corefloodingData after coreflooding
0 10 20 30 40 50 60 700
1
2
3
4
5
Pressure drop (kPa)
Flow
rate
( µL/
s)
Data before corefloodingData after coreflooding
(a)
(b)
Figure 5-5 Pressure drop across the core at each flow rate for permeability calculations before
and after core flooding for 3 hours at reservoir conditions of 8.4 MPa and 40 oC. (a) CO2-
saturated brine core flooding. The linear fit of the flow rate versus pressure drop correlation R2
value is 0.999 for before and 0.996 for after core flooding. (b) ScCO2 core flooding. The linear
fit of the flow rate versus pressure drop correlation R2 value is 0.993 for before and 0.966 for
after core flooding.
5.5 Calcium and magnesium ion concentrations in produced solution The produced liquid samples were collected every 10 minutes during the core flooding
experiments, and analyzed by the ICP-AES instrument to measure the calcium and magnesium
ion concentrations. The results are plotted in Fig. 5-6. For CO2 saturated brine case, the
average calcium ion concentration produced in the first 20 minutes is 1423 mg/L. This
concentration increases to 1811 mg/L then gradually decreases over time to about 600 mg/L.

60
The high dissolution rate in the first hour of core flooding can be related to the large initial
reactive surface roughness area of the carbonate grains. The graduate decrease as the test
proceeds is attributed to several changes including the smoothing and net reduction of reactive
surface area, as well as changes in local chemistry, reaction rates, and concentration gradients
throughout the core. This result is in keeping with previous study where they also reported a
decrease in calcium concentration produced with CO2-saturated brine (approximately 60%
after 1 hour of core flooding).
The magnesium ion concentration production also shows a similar trend to that of the calcium
ions. The initial magnesium concentration produced is about 13.5 mg/L and it gradually
decreases to ~ 6.5 mg/L. The magnesium ion produced is about two orders of magnitude less
than calcium ion which is in agreement with the material composition of these limestone core
samples as analyzed by EDS in Section 3.1. Pure CO2 core flooding results in much less
calcium and magnesium production. The initial Ca2+ ion concentration produced is about 24
mg/L and it decreases to 3.8 mg/L after 30 minutes. The concentrations of calcium and
magnesium ions produced give insight into the CO2-brine-rock interaction with respect to the
rate of carbonate dissolution which should be accounted for in the reservoir simulation models
of CO2 injection.

61
0 20 40 60 80 100 120 140 160 1800
500
1000
1500
2000
Core injection time (min)
Ca
Con
cent
ratio
n(m
g/L)
CO2 saturated brinePure CO2
0 20 40 60 80 100 120 140 160 1800
5
10
15
20
Core injection time (min)
Mg
Con
cent
ratio
n (m
g/L)
CO2 saturated brinePure CO2
(a)
(b)
Figure 5-6 Chemical analysis of the produced liquid showing both the Ca2+ and Mg2+ ion
concentrations over time. (a) Ca2+ ion concentrations in the produced liquid measured with
ICP-AES over the 3 hours core flooding experiments with CO2-saturated brine and pure
scCO2. (b) Mg2+ ion concentrations in the produced liquid measured with ICP-AES over the 3
hours core flooding experiments with CO2-saturated brine and pure scCO2.

62
5.6 Conclusions A micro-core method was developed to study the porosity and permeability changes in
limestone due to supercritical CO2 and CO2-saturated brine core flooding at reservoir
temperature and pressure conditions of 8.4MPa and 40 °C. Encasing a small scale core sample
within a microfluidics-type infrastructure enabled excellent experimental control and rapid
testing as compared to traditional core-study methods. Pore scale imaging of the carbonate
dissolution in the case of CO2-saturated brine injection reveals large pore size increase and
extensive increase in pores connectivity, and a resulting increase in permeability. For the case
of pure CO2 injection, very minor changes in pore structures were observed which results in a
small increase in permeability. The results from chemical analysis are also consistent with the
pore scale visualization of carbonate dissolution and the permeability measurements. The
concentration of the produced calcium and magnesium ions are much higher for the CO2-
saturated brine injection than the pure CO2 injection. The carbonate dissolution rate is higher
during the first hour and then reduces to an almost constant rate for the last 2 hours in the CO2-
saturated brine injection case. This thesis demonstrates the efficacy of the micro-core method
for rapid pore scale characterization of CO2-brine-rock interactions. This work leverages
established advantages of microfluidics in the new context of core-sample analysis, specifically
providing a simple core sealing method, small sample size, small volumes of injection fluids,
fast characterization time, and pore scale visualization.

63
6 Multiphase fluorescence imaging of CO2, brine, nanoparticles, and oil in microchannels
6.1 Introduction Nanoparticles are used in the oil industry to reduce the interfacial tension between oil/water
and CO2/water, and modify the surface wettability of reservoir rocks.188 The contact angle,
which depends on wettability and interfacial tension, is a critical measurement. Current
methods used to measure contact angles are pendant drops and capillary tube methods.139,189–
192 A pore scale measurement of this contact angles is important in EOR applications. In
addition, the particles distribution at fluid/fluid interfaces and fluid/rock interfaces provide
insight into the particle retention characteristics in reservoir media.
Wettability is a very important parameter in oil recovery mechanisms. Wettability modification
of reservoir rock methods and interfacial tension changes using surfactants,193,194 low salinity
water,193,195–197 microbial method,198 ionic liquids,124,199–202 and recently nanofluids,203,204
Microfluidics offers a great opportunity to investigate pore scale wettability modifications of
reservoir fluids applicable for oil and gas recovery processes.
In this chapter, multiphase fluorescence imaging is used to visualize and measure the effect of
CO2 pressure on contact angles changes at the pore scale. Four types of experiments were
carried out to investigate the interactions between various phases of oil/water/nanofluid/rock
within a high pressure, high temperature microfluidic system. Multiphase fluorescence
visualization of CO2 enhanced oil recovery processes is performed with focus on improving
fundamental understanding of CO2, water, nanoparticle, and oil interactions. Specifically we
examine the fluid interface contact angles, rock surface wettability modification, nanoparticle
distribution and retention, and effects of nanoparticle coating on its interfacial characteristics in
four different cases: i) CO2 and oil, ii) CO2 water and oil, iii) CO2 nanoparticle and oil, iv)
CO2 surfactant and oil. Multiphase fluorescence visualization allows for the examination of the
phase partitioning of CO2, water, nanoparticle, and oil at pressures below MMP and above
MMP. We also examine the swelling mechanism of oil due to CO2 absorption in the oil phase.

64
6.2 Experimental setup Four types of experiments were carried out to investigate the interactions between various
phases of oil, water, nanofluid, rock. For each case, contact angle measurements in
microchannels were performed at different injection pressures using the following
combinations: CO2 and oil, CO2 and water, CO2 and nanofluids, CO2/nanofluid/oil. The
experimental setup is shown in Appendix 1: Figure S1. The chip was fabricated from silicon
and glass anodic bonding to produce high pressure bond. The chip was fabricated with etched
channels using deep reactive ion etching (DRIE), with channel dimensions in the main channel
of (100µm x 100µm) cross sectional area and channel dimension of the side channels are also
(100µm x 100µm). The connections on the chip were made with a stainless steel manifold with
Viton ring seals, enabling high pressures.
In each experiment, the chip is filled with oil then displaced by CO2, brine, or nanofluid. Then
the system is pressurized with CO2. For each step of CO2 pressurization a video image
sequence is taken to record the contact angles, volumetric shape changes of the phases.
Multiphase imaging was obtained using a series of dyes and matching filter sets which have
been selected based on excitation and emission wavelengths of fluorophores. The fluorophores
used range from blue to red with match filter sets with wave lengths from 400 to 700 nm. The
fluorophore used for water phase is cascade blue which excite and emit the blue region.
Fluorescent nanoparticles have absorption and emission in the green region. The dye for oil
phase is Nile Blue with absorption/emission in the red wavelength region.
6.3 Results and Discussions Contact angle measurements in microchannels were performed for four cases: CO2 and oil,
CO2 and water, CO2 and nanofluids, CO2/nanofluid/oil. The interaction of CO2 and brine
results in changes to the contact angle of the water phase from 108° to 151° as the pressure
increases from 7 bars to 104 bars. There are three distinct regions of contact angle changes
with pressure as shown in Figure 6-2. At pressure below 50 bar the contact angle increases
slowly to ~ 120°, a sharp increase in contact angle is then observed (120° to 150°) at pressures
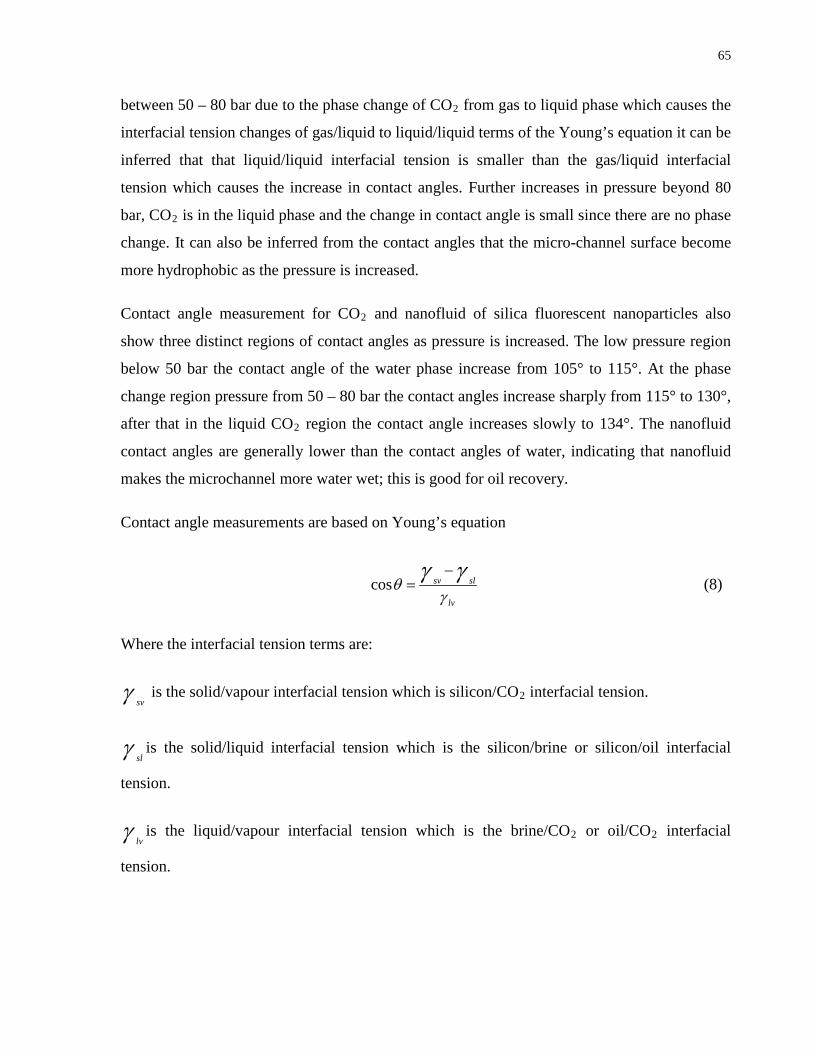
65
between 50 – 80 bar due to the phase change of CO2 from gas to liquid phase which causes the
interfacial tension changes of gas/liquid to liquid/liquid terms of the Young’s equation it can be
inferred that that liquid/liquid interfacial tension is smaller than the gas/liquid interfacial
tension which causes the increase in contact angles. Further increases in pressure beyond 80
bar, CO2 is in the liquid phase and the change in contact angle is small since there are no phase
change. It can also be inferred from the contact angles that the micro-channel surface become
more hydrophobic as the pressure is increased.
Contact angle measurement for CO2 and nanofluid of silica fluorescent nanoparticles also
show three distinct regions of contact angles as pressure is increased. The low pressure region
below 50 bar the contact angle of the water phase increase from 105° to 115°. At the phase
change region pressure from 50 – 80 bar the contact angles increase sharply from 115° to 130°,
after that in the liquid CO2 region the contact angle increases slowly to 134°. The nanofluid
contact angles are generally lower than the contact angles of water, indicating that nanofluid
makes the microchannel more water wet; this is good for oil recovery.
Contact angle measurements are based on Young’s equation
lv
slsv
γθ
γγ −=cos (8)
Where the interfacial tension terms are:
γ sv is the solid/vapour interfacial tension which is silicon/CO2 interfacial tension.
γ slis the solid/liquid interfacial tension which is the silicon/brine or silicon/oil interfacial
tension.
γ lvis the liquid/vapour interfacial tension which is the brine/CO2 or oil/CO2 interfacial
tension.

66
Figure 6-1 CO2 and water phases in closed-end microfluidic channels at various pressures.
13.8 bar 20.7 bar 6.89 bar
27.6 bar 34.5 bar 41.4 bar
48.3 bar 55.2 bar 62.1 bar
68.9 bar 75.9 bar 82.7 bar

67
Figure 6-2 Contact angles changes with CO2 pressure increases. CO2/brine (blue) and
CO2/nanoparticles (green) were measured in this study using microfluidic channels, the red
dotted line was measured using capillary tube from literature data.

68
Figure 6-3 CO2 and nanofluid phases in closed-end microfluidic channels at various pressures.
13.8 bar 20.7 bar 6.89 bar
27.6 bar 34.5 bar 41.4 bar
48.3 bar 55.2 bar 62.1 bar
68.9 bar 89.7 bar 110 bar
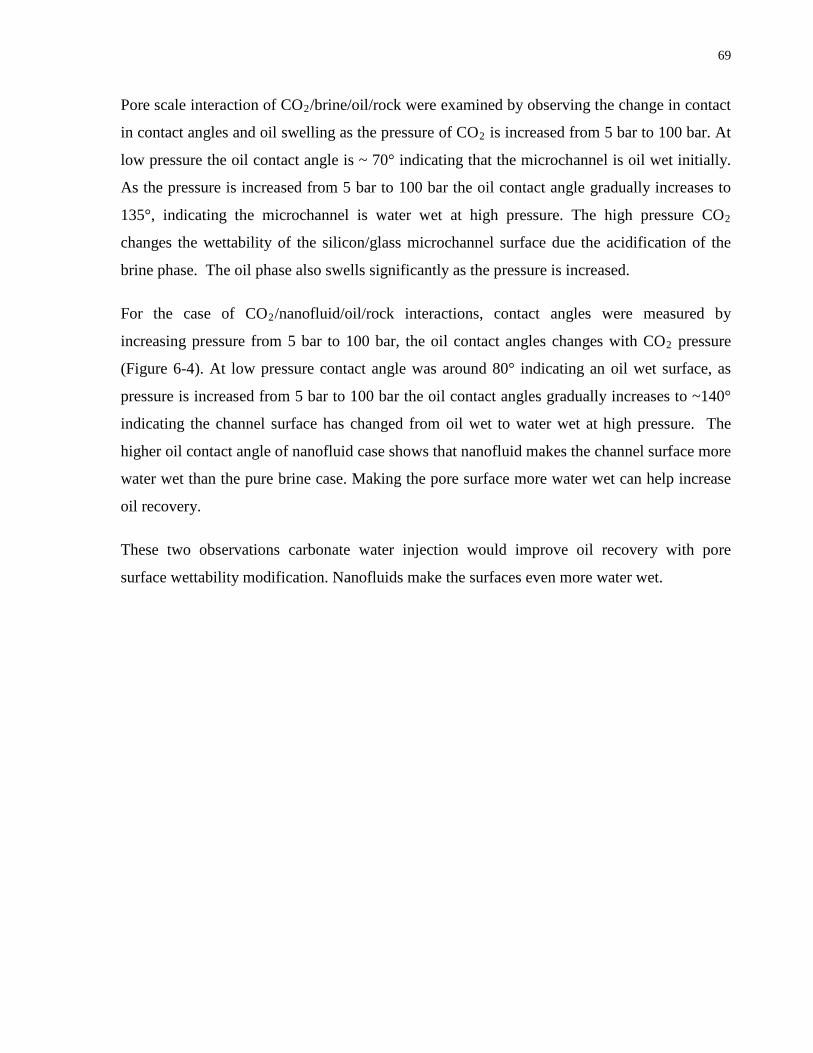
69
Pore scale interaction of CO2/brine/oil/rock were examined by observing the change in contact
in contact angles and oil swelling as the pressure of CO2 is increased from 5 bar to 100 bar. At
low pressure the oil contact angle is ~ 70° indicating that the microchannel is oil wet initially.
As the pressure is increased from 5 bar to 100 bar the oil contact angle gradually increases to
135°, indicating the microchannel is water wet at high pressure. The high pressure CO2
changes the wettability of the silicon/glass microchannel surface due the acidification of the
brine phase. The oil phase also swells significantly as the pressure is increased.
For the case of CO2/nanofluid/oil/rock interactions, contact angles were measured by
increasing pressure from 5 bar to 100 bar, the oil contact angles changes with CO2 pressure
(Figure 6-4). At low pressure contact angle was around 80° indicating an oil wet surface, as
pressure is increased from 5 bar to 100 bar the oil contact angles gradually increases to ~140°
indicating the channel surface has changed from oil wet to water wet at high pressure. The
higher oil contact angle of nanofluid case shows that nanofluid makes the channel surface more
water wet than the pure brine case. Making the pore surface more water wet can help increase
oil recovery.
These two observations carbonate water injection would improve oil recovery with pore
surface wettability modification. Nanofluids make the surfaces even more water wet.

70
Figure 6-4 a) CO2 brine and oil interactions b) CO2 nanofluid oil interactions
As the pressure of CO2 increases, the oil swells with high initial CO2 absorption rate as can be
seen from the rising oil volume as shown in Figure 6-5. At saturation pressure, further increase
in CO2 pressure results in small increases in oil volume. The oil volume stays almost constant
until reaches close to MMP pressure then CO2 starts to displace oil from the side channels.
These processes have been observed using high pressure cell method to measured CO2 and oil
MMP based on the vaporization and extraction oil components from the tube volume.
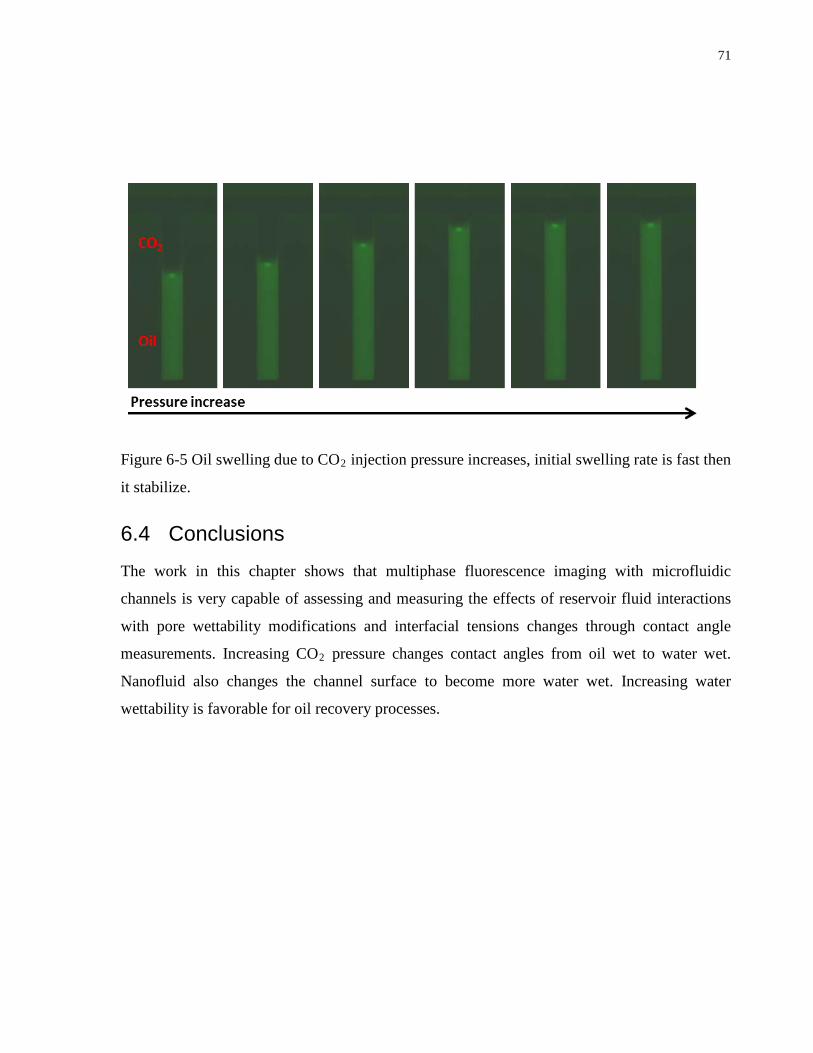
71
Figure 6-5 Oil swelling due to CO2 injection pressure increases, initial swelling rate is fast then
it stabilize.
6.4 Conclusions The work in this chapter shows that multiphase fluorescence imaging with microfluidic
channels is very capable of assessing and measuring the effects of reservoir fluid interactions
with pore wettability modifications and interfacial tensions changes through contact angle
measurements. Increasing CO2 pressure changes contact angles from oil wet to water wet.
Nanofluid also changes the channel surface to become more water wet. Increasing water
wettability is favorable for oil recovery processes.

72
7 Conclusions This thesis describes the microfluidic and micro-core methods used to study CO2 enhanced oil
recovery and carbon storage with several projects summarized below:
7.1 Nanoparticle stabilized CO2 foam EOR Nanoparticle CO2 foam stability and EOR efficiency were evaluated here using a micromodel
approach. Foam stability tests within the micromodel provided a quantitative measurement of
bubble size and coalescence dynamics that cannot be observed or quantified in bulk foam
testing methods. The nanoparticle-stabilized CO2 foams maintained excellent stability within
micro-confined media, and continued to be stable after 10 days as compared to less than one
day for surfactant foam. A nanoparticle-stabilized CO2 foam flood was performed following a
water-flood in an initially oil-filled micromodel. As compared to an otherwise similar case
with CO2 gas, the nanoparticle-stabilized CO2 foam showed a three-fold increase in oil
recovery (an additional 15% of IOIP) comprehensively sweeping the reservoir. With other
factors controlled, the higher sweep efficiency obtained with CO2 nanoparticle foams is
predominantly attributed to the role of the physical pore-scale bubble structures which are
rendered very stable by the presence of nanoparticles. Secondary effects, such as nanoparticle-
influenced wetting characteristics may also play a role. Fluorescence imaging was applied to
quantify emulsion size distribution (down to 1µm) in both CO2 and nanoparticle-stabilized
CO2 foam flood cases. Nanoparticle-stabilized CO2 foam flooding resulted in significantly
smaller oil-in-water emulsion sizes with an average size of 1.7 µm (~ 80 % smaller than a CO2
gas flood), and negligible impact on water-in-oil emulsions. Lastly the nanoparticle-stabilized
CO2 foam strategy was applied to oil recovery tests (post water-flood) with light, medium and
heavy oil. All three oils show substantial additional oil recovery (11% IOIP for light oil, 15%
IOIP for medium heavy oil, and 8% IOIP for heavy oil). These results indicate significantly
improved oil recovery, particularly for medium oil, and a potentially valuable reservoir-
homogenization effect for all oils tested.
73
7.2 Microfluidic method for measuring CO2 and oil MMP In summary, we demonstrate a microfluidic method for measuring CO2 and oil MMP which
provides two distinct advantages over conventional methods: fast measurement speed and
quantitative analysis. In terms of speed, MMP can be obtained within 30 min using our
microfluidic technique, compared to days or weeks using traditional methods such as RBA,
slim tube or vanishing interface methods. Further, in leveraging the inherent fluorescence of
crude oils, we achieved heightened contrast between CO2 and oil, and provided the means of
quantitative, user-independent, MMP measurement. Microfluidic MMP measurements were
validated with the established RBA method data, showing a strong agreement with expected
values under CO2 reservoir-relevant conditions. Collectively these results demonstrate the
potential to inform and improve the largest current CO2 operations worldwide.
7.3 Micro-core method for examining porosity and permeability changes due to CO2 injection in carbonate reservoir A micro-core method was developed to study the porosity and permeability changes in
limestone due to supercritical CO2 and CO2-saturated brine core flooding at reservoir
temperature and pressure conditions of 8.4MPa and 40 °C. Encasing a small scale core sample
within a microfluidics-type infrastructure enabled excellent experimental control and rapid
testing as compared to traditional core-study methods. Pore scale imaging of the carbonate
dissolution in the case of CO2-saturated brine injection reveals large pore size increase and
extensive increase in pores connectivity, and a resulting increase in permeability. For the case
of pure CO2 injection, very minor changes in pore structures were observed which results in a
small increase in permeability. The results from chemical analysis are also consistent with the
pore scale visualization of carbonate dissolution and the permeability measurements. The
concentration of the produced calcium and magnesium ions are much higher for the CO2-
saturated brine injection than the pure CO2 injection. The carbonate dissolution rate is higher
during the first hour and then reduces to an almost constant rate for the last 2 hours in the CO2-
saturated brine injection case. This thesis demonstrates the efficacy of the micro-core method
for rapid pore scale characterization of CO2-brine-rock interactions. This work leverages
established advantages of microfluidics in the new context of core-sample analysis, specifically

74
providing a simple core sealing method, small sample size, small volumes of injection fluids,
fast characterization time, and pore scale visualization.
7.4 Contact angle measurements and wettability modifications of pores due to reservoir fluids Four cases of experiments were carried out to investigate the interactions between various
phases of oil/water/nanofluid/rock interactions. For each case contact angle measurements in
microchannels were performed at different injection pressures: CO2 and oil, CO2 and water,
CO2 and nanofluids, CO2/nanofluid/oil. The interaction of CO2 and brine results in changes of
contact angle of the water phase from 108° to 151° as the pressure increases from 7 bars to 104
bars. There are three distinct regions of contact angle changes: at pressure below 50 bar the
contact angle increases slowly to ~ 120°, a sharp increase in contact angles from 120° to 150°
occurs at pressures between 50 – 80 bar due to the phase change of CO2 from gas to liquid
phase which causes the interfacial tension changes of gas/liquid to liquid/liquid terms of the
Young’s equation it can be inferred that that liquid/liquid interfacial tension is smaller than the
gas/liquid interfacial tension which causes the increase in contact angles. Further increases in
pressure beyond 80 bar, CO2 is in the liquid phase and the change in contact angle is small
since there are no phase change. It can also be inferred from the contact angles that the micro-
channel surface become more hydrophobic as the pressure is increased.
Contact angle measurement for CO2 and nanofluid of silica fluorescent nanoparticles also
show three distinct regions of contact angles as pressure is increased. The low pressure region
below 50 bar the contact angle of the water phase increase from 105° to 115°. At the phase
change region pressure from 50 – 80 bar the contact angles increase sharply from 115° to 130°,
after that in the liquid CO2 region the contact angle increases slowly to 134°. The nanofluid
contact angles are generally lower than the contact angles of water, indicating that nanofluid
makes the microchannel more water wet; this is good for oil recovery.

75
References 1. Nejat, P., Jomehzadeh, F., Taheri, M. M., Gohari, M. & Abd. Majid, M. Z. A global
review of energy consumption, CO2 emissions and policy in the residential sector (with an overview of the top ten CO2 emitting countries). Renew. Sustain. Energy Rev. 43, 843–862 (2015).
2. Chu, S. & Majumdar, A. Opportunities and challenges for a sustainable energy future. Nature 488, 294–303 (2012).
3. International Energy Agency (IEA) Technology Roadmap for carbon capture and storage. (2013).
4. de Coninck, H. & Benson, S. M. Carbon Dioxide Capture and Storage: Issues and Prospects. Annu. Rev. Environ. Resour. 39, 243–270 (2014).
5. Pickering, S. U. 72, 156),. 2001–2021 (1907).
6. Binks, B. P. Particles as surfactants similarities and differences. Current Opinion in Colloid & Interface Science. 7, 21-41 (2002).
7. Dickson, J. L., Binks, B. P. & Johnston, K. P. Stabilization of carbon dioxide-in-water emulsions with silica nanoparticles. Langmuir 20, 7976–83 (2004).
8. Stocco, a., Rio, E., Binks, B. P. & Langevin, D. Aqueous foams stabilized solely by particles. Soft Matter 7, 1260 (2011).
9. Binks, B. P. & Horozov, T. S. Aqueous foams stabilized solely by silica nanoparticles. Angew. Chem. Int. Ed. Engl. 44, 3722–5 (2005).
10. Binks, B. P., Kirkland, M. & Rodrigues, J. a. Origin of stabilisation of aqueous foams in nanoparticle–surfactant mixtures. Soft Matter 4, 2373 (2008).
11. Worthen, A. J. et al. Nanoparticle-stabilized carbon dioxide-in-water foams with fine texture. J. Colloid Interface Sci. 391, 142–51 (2013).
12. Aroonsri, A. et al. Conditions for Generating Nanoparticle-Stabilized CO2 Foams in Fracture and Matrix Flow. Society of Petroleum Engineers. SPE 166319 (2013).
13. Yu, J., Mo, D., Liu, N., Lee, R. & Recovery, P. The Application of Nanoparticle-Stabilized CO2 Foam for Oil Recovery. 8–10 (2013).
14. Godec, M. L., Kuuskraa, V. A. & Dipietro, P. Opportunities for Using Anthropogenic CO2 for Enhanced Oil Recovery and CO2 Storage. Energy & Fuels 27, 4183–4189 (2013).

76
15. Alvarado, V. & Manrique, E. Enhanced Oil Recovery: An Update Review. Energies 3, 1529–1575 (2010).
16. Binks, B. P. & Tyowua, A. T. Influence of the degree of fluorination on the behaviour of silica particles at air–oil surfaces. Soft Matter 9, 834 (2013).
17. Safouane, M., Langevin, D. & Binks, B. P. Effect of particle hydrophobicity on the properties of silica particle layers at the air-water interface. Langmuir 23, 11546–53 (2007).
18. Binks, B. P. & Murakami, R. Phase inversion of particle-stabilized materials from foams to dry water. Nat. Mater. 5, 865–9 (2006).
19. Binks, B. P., Rocher, A. & Kirkland, M. Oil foams stabilised solely by particles. Soft Matter 7, 1800 (2011).
20. Larson-Smith, K. & Pozzo, D. C. Pickering emulsions stabilized by nanoparticle surfactants. Langmuir 28, 11725–32 (2012).
21. Lee, M. H., Prasad, V. & Lee, D. Microfluidic fabrication of stable nanoparticle-shelled bubbles. Langmuir 26, 2227–30 (2010).
22. Johnston, K. P. & Rocha, S. R. P. Da. Colloids in supercritical fluids over the last 20 years and future directions. J. Supercrit. Fluids 47, 523–530 (2009).
23. Stocco, A., Drenckhan, W., Rio, E., Langevin, D. & Binks, B. P. Particle-stabilised foams: an interfacial study. Soft Matter 5, 2215 (2009).
24. Garbin, V., Crocker, J. C. & Stebe, K. J. Nanoparticles at fluid interfaces: exploiting capping ligands to control adsorption, stability and dynamics. J. Colloid Interface Sci. 387, 1–11 (2012).
25. Arriaga, L. R. et al. On the long-term stability of foams stabilised by mixtures of nano-particles and oppositely charged short chain surfactants. Soft Matter 8, 11085 (2012).
26. Worthen, A. J., Bryant, S. L., Huh, C. & Johnston, K. P. Carbon dioxide-in-water foams stabilized with nanoparticles and surfactant acting in synergy. AIChE J. 59, 3490–3501 (2013).
27. Zhu, Y. et al. Recent progress and effects analysis of foam flooding field tests in china. Society of Petroleum Engineers. SPE 165211 (2013).
28. Solbakken, J. S., Skauge, A., Aarra, M.G. Supercritical CO2 foam - the importance of CO2 density on foams performance. Society of Petroleum Engineers. SPE 165296 (2013).
29. Nguyen, P., Fadaei, H. & Sinton, D. Pore-Scale Assessment of Nanoparticle-Stabilized CO2 Foam for Enhanced Oil Recovery. Energy & Fuels 28, 6221–6227 (2014).

77
30. Yu, J., An, C., Mo, D., Liu, N. & Lee, R. Foam Mobility Control for Nanoparticle-Stabilized CO2 Foam. Society of Petroleum Engineers. SPE 153336 (2012).
31. DiCarlo, D. a. et al. Mobility control through spontaneous formation of nanoparticle stabilized emulsions. Geophys. Res. Lett. 38, L24404 (2011).
32. Zhang, T. Modeling of nanoparticle transport in porous media. PhD Thesis (2012).
33. Drexler, S., Faria, J., Ruiz, M. P., Harwell, J. H. & Resasco, D. E. Amphiphilic Nanohybrid Catalysts for Reactions at the Water/Oil Interface in Subsurface Reservoirs. Energy & Fuels 26, 2231–2241 (2012).
34. Adkins, S. S. et al. Morphology and stability of CO2-in-water foams with nonionic hydrocarbon surfactants. Langmuir 26, 5335–48 (2010).
35. Worthen, A. J., Bagaria, H. G., Yunshen, C., Bryant, S. L. Nanopartticle stabilized carbon dioxide in water foams for enhanced oil recovery. Society of Petroleum Engineers. SPE 1542 (2012).
36. Xue, Z. et al. Viscosity and stability of ultra-high internal phase CO2-in-water foams stabilized with surfactants and nanoparticles with or without polyelectrolytes. J. Colloid Interface Sci. 461, 383–95 (2016).
37. Hirasaki, G. J. & Miller, C. A. Surfactant Based Enhanced Oil Recovery and Foam Mobility Control. Technical Report (2006).
38. Enick, R.M., Olsen, D. Mobility and Conformance Control for CO2 EOR via Thickeners , Foams , and Gels - A Literature Review of 40 Years of Research and Pilot Tests. Society of Petroleum Engineers. SPE 154122 (2012).
39. Kovscek, A R. Patzek, T. W., Radke, C. J. Mechanistic foam flow simulation in heterogeneous and multidimensional porous media. Soc. Pet. Eng. J. 2, 511–526 (1997).
40. Kovscek, a. R., Tang, G.-Q. & Radke, C. J. Verification of Roof snap off as a foam-generation mechanism in porous media at steady state. Colloids Surfaces A Physicochem. Eng. Asp. 302, 251–260 (2007).
41. Radke, C. J., Kovscek, A. R., Wong, H. & California, U. A Pore-Level Scenario for the Development of Mixed Wettability in Oil Reservoirs. Society of Petroleum Engineers. SPE 24880 (1992).
42. Kovscek, a. R., Patzek, T. W. & Radke, C. J. Simulation of Foam Transport in Porous Media. Proc. SPE Annu. Tech. Conf. Exhib. (1993).
43. Kovscek, a. R. & Radke, C. J. Pressure-driven capillary snap-off of gas bubbles at low wetting-liquid content. Colloids Surfaces A Physicochem. Eng. Asp. 212, 99–108 (2003).

78
44. Patzek, T. W. Verification of a Complete Pore Network Simulator of Drainage and Imbibition. Society of Petroleum Engineers. SPE-71310-PA (2001).
45. Choi, W. et al. Bubbles navigating through networks of microchannels. Lab Chip 11, 3970–8 (2011).
46. Andrianov, a., Farajzadeh, R., Mahmoodi Nick, M., Talanana, M. & Zitha, P. L. J. Immiscible Foam for Enhancing Oil Recovery: Bulk and Porous Media Experiments. Ind. Eng. Chem. Res. 51, 2214–2226 (2012).
47. Farajzadeh, R., Muruganathan, R. M., Rossen, W. R. & Krastev, R. Effect of gas type on foam film permeability and its implications for foam flow in porous media. Adv. Colloid Interface Sci. 168, 71–8 (2011).
48. Farajzadeh, R., Andrianov, a. & Zitha, P. L. J. Investigation of Immiscible and Miscible Foam for Enhancing Oil Recovery. Ind. Eng. Chem. Res. 49, 1910–1919 (2010).
49. Schramm, L. L., Isaacs, E. E. Foam engineering: fundamental and applications. Chapter 13, (2012).
50. Emadi, A., Sohrabi, M. Mechanistic Study of Improved Heavy Oil Recovery by CO2-Foam Injection. Society of Petroleum Engineers. SPE 143013 (2011).
51. Kantzas, A. Evolution of Foamed Gel Confined in Pore Network Models. Journal of Canadian Petroleum Technology. 45, 51–62 (2006).
52. Lackner, K. S. Guide to Sequestration. Science. 300, 1677–1678 (2011).
53. Bachu, S., Gunter, W. D., Perkins, E. H. Aquifer Disposal of CO2: Hydrodynamic and Mineral Trapping. Energy Convers. Manag. 35, 269–279 (1994).
54. Bachu, S. CO2 storage in geological media: Role, means, status and barriers to deployment. Prog. Energy Combust. Sci. 34, 254–273 (2008).
55. Duan, Z., Sun, R. An improved model calculating CO2 solubility in pure water and aqueous NaCl solutions from 273 to 5333 K and from 0 to 2000 bar. Chem. Geol. 193, 257–271 (2003).
56. Fadaei, H., Scarff, B., Sinton, D. Rapid Microfluidics-Based Measurement of CO2 Diffusivity in Bitumen. Energy & Fuels 25, 4829–4835 (2011).
57. Fadaei, H., Shaw, J. M. & Sinton, D. Bitumen–Toluene Mutual Diffusion Coefficients Using Microfluidics. Energy & Fuels 27, 2042–2048 (2013).
58. Mostowfi, F., Molla, S., Tabeling, P. Determining phase diagrams of gas-liquid systems using a microfluidic PVT. Lab Chip (2012).

79
59. Nguyen, P. et al. Fast fluorescence-based microfluidic method for measuring minimum miscibility pressure of CO2 in crude oils. Anal. Chem. 87, 3160–4 (2015).
60. Günther, A., Khan, S. a, Thalmann, M., Trachsel, F. & Jensen, K. F. Transport and reaction in microscale segmented gas-liquid flow. Lab Chip 4, 278–86 (2004).
61. Muradoglu, M., Günther, A. & Stone, H. a. A computational study of axial dispersion in segmented gas-liquid flow. Phys. Fluids 19, 072109 (2007).
62. Wang, C., Bains, A., Sinton, D. & Moffitt, M. G. Flow-directed loading of block copolymer micelles with hydrophobic probes in a gas-liquid microreactor. Langmuir 29, 8385–94 (2013).
63. Baret, J.-C., Kleinschmidt, F., El Harrak, A. & Griffiths, A. D. Kinetic aspects of emulsion stabilization by surfactants: a microfluidic analysis. Langmuir 25, 6088–93 (2009).
64. Voicu, D. et al. Microfluidic studies of CO2 sequestration by frustrated Lewis pairs. J. Am. Chem. Soc. 136, 3875–80 (2014).
65. Marre, S., Adamo, A., Basak, S., Aymonier, C. & Jensen, K. F. Design and Packaging of Microreactors for High Pressure and High Temperature Applications. Ind. Eng. Chem. Res. 49, 11310–11320 (2010).
66. Marre, S., Baek, J., Park, J., Bawendi, M. G. & Jensen, K. F. High-Pressure/High-Temperature Microreactors for Nanostructure Synthesis. JALA - J. Assoc. Lab. Autom. 14, 367–373 (2009).
67. Kreutzer, M., Günther, A., Jensen, K. Sample dispersion for segmented flow in microchannels with rectangular cross section. Anal. Chem. 80 (5), 1558–1567 (2008).
68. Oh, K. W., Lee, K., Ahn, B. & Furlani, E. P. Design of pressure-driven microfluidic networks using electric circuit analogy. Lab Chip 12, 515–45 (2012).
69. Luther, S. K. & Braeuer, A. High-pressure microfluidics for the investigation into multi-phase systems using the supercritical fluid extraction of emulsions (SFEE). J. Supercrit. Fluids 65, 78–86 (2012).
70. Young, E. W. K. & Beebe, D. J. Fundamentals of microfluidic cell culture in controlled microenvironments. Chem. Soc. Rev. 39, 1036 (2010).
71. WEIBEL, D. & WHITESIDES, G. Applications of microfluidics in chemical biology. Curr. Opin. Chem. Biol. 10, 584–591 (2006).
72. Lenormand, R., Zarcone, C. & Sarr, a. Mechanisms of the displacement of one fluid by another in a network of capillary ducts. J. Fluid Mech. 135, 337 (2006).

80
73. Grate, J. W., Kelly, R. T., Suter, J. & Anheier, N. C. Silicon-on-glass pore network micromodels with oxygen-sensing fluorophore films for chemical imaging and defined spatial structure. Lab Chip 12, 4796–801 (2012).
74. de Haas, T. W., Fadaei, H., Guerrero, U. & Sinton, D. Steam-on-a-chip for oil recovery: the role of alkaline additives in steam assisted gravity drainage. Lab Chip 13, 3832–9 (2013).
75. Robin, M., Behot, J. & Sygouni, V. CO2 Injection in Porous Media : Observations in Glass Micromodels Under Reservoir Conditions. Society of Petroleum Engineers. SPE 154165 (2012).
76. Sayegh, S. G. Enhanced Oil Recovery by CO2 Flooding in Homogeneous and Heterogeneous 2D Micromodels. Journal of Canadian Petroleum Technology. (2009).
77. Karadimitriou, N. K., Hassanizadeh, S. M. A. Review of Micromodels and Their Use in Two-Phase Flow Studies. Vadose Zo. J. 11, (2012).
78. Buchgraber, M., Kovscek, A. R., Castanier, L. M. A Study of Microscale Gas Trapping Using Etched Silicon Micromodels. Transp. Porous Media. 95(3) 647-668 (2012).
79. Sohrabi, M. & Emadi, A. Novel Insights into the Pore-Scale Mechanisms of Enhanced Oil Recovery by CO2 Injection. Society of Petroleum Engineers. SPE 154529 (2012).
80. Conn, C. A., Ma, K., Hirasaki, G. J. & Biswal, S. L. Visualizing oil displacement with foam in a microfluidic device with permeability contrast. Lab Chip 14, 3968–77 (2014).
81. Gunda, N. S. K., Bera, B., Karadimitriou, N. K., Mitra, S. K. & Hassanizadeh, S. M. Reservoir-on-a-chip (ROC): a new paradigm in reservoir engineering. Lab Chip 11, 3785–92 (2011).
82. Kumar Gunda, N. S., Bera, B., Karadimitriou, N. K., Mitra, S. K. & Hassanizadeh, S. M. Reservoir-on-a-Chip (ROC): A new paradigm in reservoir engineering. Lab Chip 11, 3785 (2011).
83. Sinton, D. Energy: the microfluidic frontier. Lab Chip 14, 3127–34 (2014).
84. Kim, M., Sell, A., Sinton, D. Aquifer-on-a-Chip: understanding pore-scale salt precipitation dynamics during CO2 sequestration. Lab Chip 13, 2508 (2013).
85. Song, W., de Haas, T. W., Fadaei, H., Sinton, D. Chip-off-the-old-rock: the study of reservoir-relevant geological processes with real-rock micromodels. Lab Chip 14, 4382–90 (2014).
86. Al-Kharusi, A. S. & Blunt, M. J. Multiphase flow predictions from carbonate pore space images using extracted network models. Water Resour. Res. 44, (2008).

81
87. Blunt, M. J. Pore-scale imaging and modelling. Adv. Water Resour. 51, 197–216 (2013).
88. Iglauer, S., Favretto, S., Spinelli, G., Schena, G., Blunt, M. X-ray tomography measurements of power-law cluster size distributions for the nonwetting phase in sandstones. Phys. Rev. E 82, 056315 (2010).
89. Ott, H., Andrew, M., Snippe, J., Blunt, M. J. Microscale solute transport and precipitation in complex rock during drying. Geophys. Res. Lett. 41, 8369–8376 (2014).
90. Andrew, M., Bijeljic, B. & Blunt, M. J. Pore-scale imaging of geological carbon dioxide storage under in situ conditions. Geophys. Res. Lett. 40, 3915–3918 (2013).
91. Iglauer, S., Paluszny, A., Pentland, C. H. & Blunt, M. J. Residual CO2 imaged with X-ray micro-tomography. Geophys. Res. Lett. 38, (2011).
92. Feali, M. Qualitative and Quantitative Analysis of Three-Phase Distributions of Oil , Water and Gas in Bentheimer Sandstone Using Micro-CT Imaging. Society of Petroleum Engineers. SPE 151609 (2012).
93. Freire-Gormaly, M., Ellis, J. S., MacLean, H. L., Bazylak, A. Pore Structure Characterization of Indiana Limestone and Pink Dolomite from Pore Network Reconstructions. Oil Gas Sci. Technol. – Rev. d’IFP Energies Nouv. (2015).
94. Freire-Gormaly, M., Ellis, J. S., Bazylak, A., MacLean, H. L. Comparing thresholding techniques for quantifying the dual porosity of Indiana Limestone and Pink Dolomite. Microporous Mesoporous Mater. 207, 84–89 (2015).
95. Al-Raoush, R. I., Willson, C. S. Extraction of physically realistic pore network properties from three-dimensional synchrotron X-ray microtomography images of unconsolidated porous media systems. J. Hydrol. 300, 44–64 (2005).
96. Hinebaugh, J. & Bazylak, a. Condensation in PEM Fuel Cell Gas Diffusion Layers: A Pore Network Modeling Approach. J. Electrochem. Soc. 157, (2010).
97. Yip, R., Bazylak, A. Investigation of Liquid Water Content of a Compressed PEMFC GDL Using Micro-Computed Tomography. in ASME 2012 10th International Conference on Fuel Cell Science, Engineering and Technology 473 ( 2012).
98. Zhou, M. A. Chelator-Free Multifunctional CuS Nanoparticle Platform for Simultaneous Micro-PET/CT Imaging and Photothermal Ablation Therapy. J. Am. Chem. Soc. 132, 15351–15358 (2010).
99. de Crespigny, A. 3D micro-CT imaging of the postmortem brain. J. Neurosci. Methods 171, 207–213 (2008).
100. Culligan, K. a., Wildenschild, D., Christensen, B. S. B., Gray, W. G.. Rivers, M. L. Pore-scale characteristics of multiphase flow in porous media: A comparison of air–water and oil–water experiments. Adv. Water Resour. 29, 227–238 (2006).

82
101. Izgec, O., Demiral, B., Bertin, H., Trefle, L., Akin, S. CO2 Injection in Carbonates. Society of Petroleum Engineers. SPE 93773 (1963).
102. Izgec, O., Demiral, B., Bertin, H., Trefle, L.. Akin, S. Experimental and Numerical Investigation of Carbon Sequestration in Saline Aquifers. Society of Petroleum Engineers . SPE-94697 (2005)
103. Heidaryan, E., Enayati, M., Mokhtari, B. Laboratory Investigations into the Reactive Transport Module of Carbon Dioxide Sequestration and Geochemical Simulation. Proc. Can. Int. Pet. Conf. (2008).
104. Silin, D., Tomutsa, L., Benson, S. M. & Patzek, T. W. Microtomography and Pore-Scale Modeling of Two-Phase Fluid Distribution. Transp. Porous Media 86, 495–515 (2010).
105. Ashoori, E., Marchesin, D. & Rossen, W. R. Stability Analysis of Uniform Equilibrium Foam States for EOR Processes. Transp. Porous Media 92, 573–595 (2011).
106. Grigg, R., Svec, R. CO2 Transport Mechanisms in CO2/Brine Coreflooding. Proc. SPE Annu. Tech. Conf. Exhib. (2006).
107. Spirov, P., Rudyk, S. N., Khan, A. A. Foam Assisted WAG , Snorre Revisit with New Foam Screening Model. Society of Petroleum Engineers. SPE 150829 (2012).
108. Nguyen, P., Fadaei, H., Sinton, D. Microfluidics Underground: A Micro-Core Method for Pore Scale Analysis of Supercritical CO2 Reactive Transport in Saline Aquifers. J. Fluids Eng. 135, 021203 (2013).
109. Lake, L. W. Enhanced oil recovery. (Prentice Hall, 1988).
110. Zhang, Y.P. Luo, P. H. Improved Heavy Oil Recovery by CO2 Injection Augmented with Chemicals. in International Oil and Gas Conference and Exhibition (Society of Petroleum Engineers, 2010).
111. Luo, P., Zhang, Y., Wang, X., Huang, S. Propane-Enriched CO2 Immiscible Flooding For Improved Heavy Oil Recovery. Energy Fuels. 26 (4), 2124–2135 (2012).
112. Zhang, S., She, Y., Gu, Y. Evaluation of Polymers as Direct Thickeners for CO2 Enhanced Oil Recovery. J. Chem. Eng. Data. 56 (4). 1069–1079 (2011).
113. Farajzadeh, R., Andrianov, A., Krastev, R., Hirasaki, G., Rossen, W. Foam-Oil Interaction in Porous Media: Implications for Foam Assisted Enhanced Oil Recovery. Proc. SPE EOR Conf. Oil Gas West Asia (2012). SPE 154197-MS
114. Emadi, A., Sohrabi, M., Jamiolahmady, M., Ireland, S. Visualization of Oil Recovery by CO2-Foam Injection ; Effect of Oil Viscosity and Gas Type. Society of Petroleum Engineers. SPE 152996 (2012).

83
115. Ma, K., Liontas, R., Conn, C. a., Hirasaki, G. J., Biswal, S. L. Visualization of improved sweep with foam in heterogeneous porous media using microfluidics. Soft Matter. 8, 10669-10675 (2012).
116. Krebs, T., Schroen, K., Boom, R. A microfluidic method to study demulsification kinetics. Lab Chip 12, 1060–70 (2012).
117. Schneider, M. H., Sieben, V. J., Kharrat, A. M., Mostowfi, F. Measurement of asphaltenes using optical spectroscopy on a microfluidic platform. Anal. Chem. 85, 5153–60 (2013).
118. Bowden, S., Wilson, R., Parnell, J., Cooper, J. M. Determination of the asphaltene and carboxylic acid content of a heavy oil using a microfluidic device. Lab Chip 9, 828–32 (2009).
119. Sun, Q. Utilization of Surfactant-Stabilized Foam for Enhanced Oil Recovery by Adding Nanoparticles. Energy & Fuels 28, 2384–2394 (2014).
120. Takeda, S., Yamamoto, K., Hayasaka, Y., Matsumoto, K. Surface OH group governing wettability of commercial glasses. Journal of Non-Crystalline Solids. 249, 41–46 (1999).
121. Haszeldine, R. S. Carbon capture and storage: how green can black be? Science 325, 1647–52 (2009).
122. Lackner, K. S. Climate change. A guide to CO2 sequestration. Science 300, 1677–8 (2003).
123. Scott, V., Gilfillan, S., Markusson, N., Chalmers, H., Haszeldine, R. S. Last chance for carbon capture and storage. Nat. Clim. Chang. 3, 105–111 (2012).
124. Niedermaier, I. Carbon dioxide capture by an amine functionalized ionic liquid: fundamental differences of surface and bulk behavior. J. Am. Chem. Soc. 136, 436–41 (2014).
125. Woodward, R. T. Swellable water and acid tolerant polymer sponges for chemoselective carbon dioxide capture. J. Am. Chem. Soc. 136, 9028–35 (2014).
126. Meng, L., Burris, S., Bui, H., Pan, W. Development of an analytical method for distinguishing ammonium bicarbonate from the products of an aqueous ammonia CO2 scrubber. Anal. Chem. 77, 5947–52 (2005).
127. Kozak, J. Bromine-catalyzed conversion of CO2 and epoxides to cyclic carbonates under continuous flow conditions. J. Am. Chem. Soc. 135, 18497–501 (2013).
128. Mistry, H. Exceptional Size-Dependent Activity Enhancement in the Electroreduction of CO2 over Au Nanoparticles. J. Am. Chem. Soc. 136, 16473–6 (2014).

84
129. Geldern, R. Field-based stable isotope analysis of carbon dioxide by mid-infrared laser spectroscopy for carbon capture and storage monitoring. Anal. Chem. 86, 12191–8 (2014).
130. Dong, M., Huang, S., Dyer, S. B., Mourits, F. M. A comparison of CO2 minimum miscibility pressure determinations for Weyburn crude oil. J. Pet. Sci. Eng. 31, 13–22 (2001).
131. Amao, A. M., Siddiqui, S., Menouar, H. A New Look at the Minimum Miscibility Pressure (MMP) Determination from Slimtube Measurements. in SPE Improved Oil Recovery Symposium, Society of Petroleum Engineers. (2013).
132. Wang, Y., Orr, F. M. Calculation of minimum miscibility pressure. J. Pet. Sci. Eng. 27, 151–164 (2000).
133. Nobakht, M., Moghadam, S., Gu, Y. Determination of CO2 Minimum Miscibility Pressure from Measured and Predicted Equilibrium Interfacial Tensions. Ind. Eng. Chem. Res. 47, 8918–8925 (2008).
134. Abedini, A., Mosavat, N., Torabi, F. Determination of Minimum Miscibility Pressure of Crude Oil-CO2 System by Oil Swelling/Extraction Test. Energy Technol. 2, 431–439 (2014).
135. Abedini, A., Torabi, F. Oil Recovery Performance of Immiscible and Miscible CO2 Huff-and-Puff Processes. Energy & Fuels 28, 774–784 (2014).
136. Christiansen, Richard L; Haines, H. Rapid Measurement of MMP. SPE Rerservoir Eng. 523–527 (1987).
137. Elsharkawy, A. M., Poettmann, F. H., Christiansen, R. L. Measuring CO2 Minimum Miscibility Pressures: Slim-Tube or Rising-Bubble Method. Energy & Fuels 10, 443–449 (1996).
138. Rao, D. N., Lee, J. I. Determination of gas-oil miscibility conditions by interfacial tension measurements. J. Colloid Interface Sci. 262, 474–82 (2003).
139. Saini, D., Rao, D. N. Experimental Determination of Minimum Miscibility Pressure (MMP) by Gas/Oil IFT Measurements for a Gas Injection EOR Project. SPE Western Regional Meeting, Society of Petroleum Engineers. (2013).
140. Avaullee, L., Trassy, L., Neau, E., Jaubert, J. N. Thermodynamic modeling for petroleum fluids I. Equation of state and group contribution for the estimation of thermodynamic parameters of heavy hydrocarbons. Fluid Phase Equilib. 139, 155–170 (1997).
141. Jessen, K., Michelsen, M. L., Stenby, E. H. Global approach for calculation of minimum miscibility pressure. Fluid Phase Equilib. 153, 251–263 (1998).

85
142. Jaubert, J.-N., Wolff, L., Neau, E. & Avaullee, L. A Very Simple Multiple Mixing Cell Calculation To Compute the Minimum Miscibility Pressure Whatever the Displacement Mechanism. Ind. Eng. Chem. Res. 37, 4854–4859 (1998).
143. Jaubert, J.-N., Avaullee, L. & Souvay, J.-F. A crude oil data bank containing more than 5000 PVT and gas injection data. J. Pet. Sci. Eng. 34, 65–107 (2002).
144. Schneider, M. H., Sieben, V. J., Kharrat, A. M. & Mostowfi, F. Measurement of Asphaltenes Using Optical Spectroscopy on a Microfluidic Platform. Anal. Chem. 85, 5153–5160 (2013).
145. Fadaei, H., Shaw, J. M. & Sinton, D. Bitumen–Toluene Mutual Diffusion Coefficients Using Microfluidics. Energy & Fuels 27, 2042–2048 (2013).
146. Song, W., Fadaei, H. & Sinton, D. Determination of dew point conditions for CO2 with impurities using microfluidics. Environ. Sci. Technol. 48, 3567–74 (2014).
147. Kharrat, A. M., Indo, K. & Mostowfi, F. Asphaltene Content Measurement Using an Optical Spectroscopy Technique. Energy & Fuels 27, 2452–2457 (2013).
148. Mostowfi, F., Molla, S. & Tabeling, P. Determining phase diagrams of gas-liquid systems using a microfluidic PVT. Lab Chip 12, 4381–7 (2012).
149. Pinho, B. A microfluidic approach for investigating multicomponent system thermodynamics at high pressures and temperatures. Lab Chip 14, 3843–9 (2014).
150. Garstecki, P. Formation of monodisperse bubbles in a microfluidic flow-focusing device. Appl. Phys. Lett. 85, 2649 (2004).
151. Hashimoto, M. & Whitesides, G. M. Formation of bubbles in a multisection flow-focusing junction. Small 6, 1051–9 (2010).
152. Vuong, S. M. & Anna, S. L. Tuning bubbly structures in microchannels. Biomicrofluidics 6, 22004–2200418 (2012).
153. Stoffel, M. et al. Bubble Production Mechanism in a Microfluidic Foam Generator. Phys. Rev. Lett. 108, 1–5 (2012).
154. Garstecki, P., Fuerstman, M. J., Stone, H. a & Whitesides, G. M. Formation of droplets and bubbles in a microfluidic T-junction-scaling and mechanism of break-up. Lab Chip 6, 437–46 (2006).
155. Anna, S. L., Bontoux, N. & Stone, H. a. Formation of dispersions using ‘flow focusing’ in microchannels. Appl. Phys. Lett. 82, 364 (2003).
156. Ahmadi, A., Devlin, K. D., Najjaran, H., Holzman, J. F. & Hoorfar, M. In situ characterization of microdroplet interfacial properties in digital microfluidic systems. Lab Chip 10, 1429–35 (2010).

86
157. Baret, J.-C. Surfactants in droplet-based microfluidics. Lab Chip 12, 422–33 (2012).
158. Cho, S. Droplet-based microfluidic platform for high-throughput, multi-parameter screening of photosensitizer activity. Anal. Chem. 85, 8866–72 (2013).
159. Egawa, T., Durand, J. L., Hayden, E. Y., Rousseau, D. L. & Yeh, S.-R. Design and evaluation of a passive alcove-based microfluidic mixer. Anal. Chem. 81, 1622–7 (2009).
160. Najah, M. New glycosidase substrates for droplet-based microfluidic screening. Anal. Chem. 85, 9807–14 (2013).
161. Hellman, A. N. Laser-induced mixing in microfluidic channels. Anal. Chem. 79, 4484–92 (2007).
162. Venancio-Marques, A., Barbaud, F. & Baigl, D. Microfluidic mixing triggered by an external LED illumination. J. Am. Chem. Soc. 135, 3218–23 (2013).
163. Shim, J.-U. Control and measurement of the phase behavior of aqueous solutions using microfluidics. J. Am. Chem. Soc. 129, 8825–35 (2007).
164. Zhao, Y. Microfluidic generation of multifunctional quantum dot barcode particles. J. Am. Chem. Soc. 133, 8790–3 (2011).
165. Silvera-Batista, C. A., Weinberg, P., Butler, J. E. & Ziegler, K. J. Long-term improvements to photoluminescence and dispersion stability by flowing SDS-SWNT suspensions through microfluidic channels. J. Am. Chem. Soc. 131, 12721–8 (2009).
166. Hashimoto, M. Infochemistry: encoding information as optical pulses using droplets in a microfluidic device. J. Am. Chem. Soc. 131, 12420–9 (2009).
167. Wilkinson, M. H. F. Shading correction and calibration in bacterial fluorescence measurement by image processing system. Comput. Methods Programs Biomed. 44, 61–67 (1994).
168. Rao, D. N. A new technique of vanishing interfacial tension for miscibility determination. Fluid Phase Equilib. 139, 311–324 (1997).
169. Shyeh-Yung, J.-G. J. Mechanisms of Miscible Oil Recovery: Effects of Pressure on Miscible and Near-Miscible Displacements of Oil by Carbon Dioxide. SPE Annual Technical Conference and Exhibition, Society of Petroleum Engineers. (2013).
170. Lansangan, R. M. & Smith, J. L. Viscosity, Density, and Composition Measurements of CO2/West Texas Oil Systems. SPE Reserv. Eng. 8, 175–182 (2013).
171. Weibel, D. B. & Whitesides, G. M. Applications of microfluidics in chemical biology. Curr. Opin. Chem. Biol. 10, 584–91 (2006).

87
172. Berejnov, V., Djilali, N. & Sinton, D. Lab-on-chip methodologies for the study of transport in porous media: energy applications. Lab Chip 8, 689–93 (2008).
173. Fadaei, H., Scarff, B. & Sinton, D. Rapid microfluidics-based measurement of CO2 diffusivity in bitumen. Energy and Fuels 25, 4829–4835 (2011).
174. Riazi, M., Sohrabi, M., Bernstone, C., Jamiolahmady, M. & Ireland, S. Visualisation of mechanisms involved in CO2 injection and storage in hydrocarbon reservoirsand water-bearing aquifers. Chem. Eng. Res. Des. 89, 1827–1840 (2011).
175. Sok, R. M. Pore Scale Characterization of Carbonates at Multiple Scales: Integration of Micro-CT, BSEM, and FIBSEM. Petrophysics 51, 379–387 (2010).
176. Dong, H. & Blunt, M. Pore-network extraction from micro-computerized-tomography images. Phys. Rev. E 80, 036307 (2009).
177. Bachu, S. & Adams, J. J. Sequestration of CO2 in geological media in response to climate change: Capacity of deep saline aquifers to sequester CO2 in solution. Energy Convers. Manag. 44, 3151–3175 (2003).
178. Bradshaw, J. CO2 storage capacity estimation: Issues and development of standards. Int. J. Greenh. Gas Control 1, 62–68 (2007).
179. Diamond, L. W. & Akinfiev, N. N. Solubility of CO2 in water from -1.5 to 100°C and from 0.1 to 100 MPa: Evaluation of literature data and thermodynamic modelling. Fluid Phase Equilib. 208, 265–290 (2003).
180. Plummer, L. N., Wigley, T. M. L. & Parkhurst, D. L. The kinetics of calcite dissolution in CO2-water systems at 5C to 60C and 0.0 to 1.0 atm CO2. American Journal of Science 278, 179–216 (1978).
181. Pokrovsky, O. S., Golubev, S. V., Schott, J. & Castillo, A. Calcite, dolomite and magnesite dissolution kinetics in aqueous solutions at acid to circumneutral pH, 25 to 150 °C and 1 to 55 atm pCO2: New constraints on CO2 sequestration in sedimentary basins. Chem. Geol. 260, 317–329 (2009).
182. Izgec, O., Demiral, B., Bertin, H. & Akin, S. CO2 injection into saline carbonate aquifer formations II: Comparison of numerical simulations to experiments. Transp. Porous Media 73, 57–74 (2008).
183. Perrin, J., Krause, M., Kuo, C., Miljkovic, L. & Benson, S. M. Core- and pore-scale experimental study of relative permeability properties of CO 2 and brine in reservoir rocks. Energy (2008).
184. Luquot, L., Andreani, M., Gouze, P. & Camps, P. CO2 percolation experiment through chlorite/zeolite-rich sandstone (Pretty Hill Formation - Otway Basin-Australia). Chem. Geol. 294-295, 75–88 (2012).

88
185. Gouze, P. & Luquot, L. X-ray microtomography characterization of porosity, permeability and reactive surface changes during dissolution. J. Contam. Hydrol. 120-121, 45–55 (2011).
186. Iglauer, S., Salamah, A., Sarmadivaleh, M., Liu, K. & Phan, C. Contamination of silica surfaces: Impact on water-CO2-quartz and glass contact angle measurements. Int. J. Greenh. Gas Control 22, 325–328 (2014).
187. Pruess, K. & Nordbotten, J. Numerical Simulation Studies of the Long-term Evolution of a CO2 Plume in a Saline Aquifer with a Sloping Caprock. Transp. Porous Media 90, 135–151 (2011).
188. Ameri, A. Investigation on Interfacial Interactions among Crude Oil–Brine–Sandstone Rock–CO2 by Contact Angle Measurements. Energy & Fuels 27, 1015–1025 (2013).
189. Shariat, A. et al. Laboratory Measurements of CO2-H2O Interfacial Tension at HP/HT Conditions: Implications for CO2 Sequestration in Deep Aquifers. Carbon Manag. Technol. Conf. 7–9 (2012).
190. Bachu, S. & Bennion, D. B. Interfacial tension between CO2, freshwater, and brine in the range of pressure from (2 to 27) MPa, temperature from (20 to 125) C, and water salinity from (0 to 334 000) mg . J. Chem. Eng. Data 54, 765–775 (2009).
191. Bikkina, P. K., Shoham, O. & Uppaluri, R. Equilibrated interfacial tension data of the CO2-water system at high pressures and moderate temperatures. J. Chem. Eng. Data 56, 3725–3733 (2011).
192. Chalbaud, C. Interfacial tension measurements and wettability evaluation for geological CO2 storage. Adv. Water Resour. 32, 98–109 (2009).
193. Mahani, H. Insights into the Mechanism of Wettability Alteration by Low-Salinity Flooding (LSF) in Carbonates. Energy & Fuels 29, 1352–1367 (2015).
194. Mohammed, M. & Babadagli, T. Wettability alteration: A comprehensive review of materials/methods and testing the selected ones on heavy-oil containing oil-wet systems. Adv. Colloid Interface Sci. 220, 54–77 (2015).
195. Alkan, H., Cinar, Y. & Ülker, E. B. Impact of Capillary Pressure, Salinity and In situ Conditions on CO2 Injection into Saline Aquifers. Transp. Porous Media 84, 799–819 (2010).
196. Shao, H., Ray, J. R. & Jun, Y.-S. Effects of salinity and the extent of water on supercritical CO2-induced phlogopite dissolution and secondary mineral formation. Environ. Sci. Technol. 45, 1737–43 (2011).
197. Agbalaka, C. C., Dandekar, A. Y., Patil, S. L., Khataniar, S. & Hemsath, J. R. Coreflooding studies to evaluate the impact of salinity and wettability on oil recovery efficiency. Transp. Porous Media 76, 77–94 (2009).
89
198. Armstrong, R. T. & Wildenschild, D. Microbial Enhanced Oil Recovery in Fractional-Wet Systems: A Pore-Scale Investigation. Transp. Porous Media 92, 819–835 (2012).
199. Frost, D. S. & Dai, L. L. Molecular dynamics simulations of charged nanoparticle self-assembly at ionic liquid-water and ionic liquid-oil interfaces. J. Chem. Phys. 136, 084706 (2012).
200. Rodríguez-Escontrela, I., Rodríguez-Palmeiro, I., Rodríguez, O., Arce, A. & Soto, A. Phase behavior of the surfactant ionic liquid trihexyltetradecylphosphonium bis(2,4,4-trimethylpentyl)phosphinate with water and dodecane. Colloids Surfaces A Physicochem. Eng. Asp. 480, 50–59 (2015).
201. Lago, S., Francisco, M., Arce, A. & Soto, A. Enhanced Oil Recovery with the Ionic Liquid Trihexyl(tetradecyl)phosphonium Chloride: A Phase Equilibria Study at 75 °C. Energy & Fuels 27, 5806–5810 (2013).
202. Lago, S., Francisco, M., Arce, A. & Soto, A. Enhanced Oil Recovery with the Ionic Liquid Trihexyl(tetradecyl)phosphonium Chloride: A Phase Equilibria Study at 75 °C. Energy & Fuels 27, 5806–5810 (2013).
203. Wasan, D. T. & Nikolov, A. D. Spreading of nanofluids on solids. Nature 423, 156–159 (2003).
204. Zhang, H., Nikolov, A. & Wasan, D. Dewetting Film Dynamics Inside a Capillary Using a Micellar Nano fl uid. Langmuir 30, 9430–9435 (2014).
205. Li, G. Microbial Abundance and Community Composition Influence Production Performance in a Low-Temperature Petroleum Reservoir. Environ. Sci. Technol. 48, 5336–5344 (2014).
206. Rashedi, H., Yazdian, F. & Naghizadeh, S. Microbial Enhanced Oil Recovery. Introd. to Enhanc. Oil Recover. Process. Bioremediation Oil-Contaminated Sites (ed. Romero-Zerón L) 71–88 (2012).
207. Sen, R. Biotechnology in petroleum recovery: The microbial EOR. Prog. Energy Combust. Sci. 34, 714–724 (2008).
208. Rouse, B., Hiebert, F. & Lake, L. W. Laboratory Testing of a Microbial Enhanced Oil Recovery Process Under Anaerobic Conditions. Society of Petroleum Engineers. SPE 24819-MS (1992).
209. Kowalewski, E., Rueslåtten, I., Steen, K. H., Bødtker, G. & Torsæter, O. Microbial improved oil recovery—bacterial induced wettability and interfacial tension effects on oil production. J. Pet. Sci. Eng. 52, 275–286 (2006).
210. Suthar, H., Hingurao, K., Desai, A. & Nerurkar, A. Selective plugging strategy-based microbial-enhanced oil recovery using Bacillus licheniformis TT33. J. Microbiol. Biotechnol. 19, 1230–1237 (2009).
90
211. Cunningham, A. B., Characklis, W. G., Abedeen, F. & Crawford, D. Influence of biofilm accumulation on porous media hydrodynamics. Environ. Sci. Technol. 25, 1305–1311 (1991).
212. Kaster, K. M. et al. Mechanisms Involved in Microbially Enhanced Oil Recovery. Transp. Porous Media 91, 59–79 (2012).
213. Zhu, H., Carlson, H. K. & Coates, J. D. Applicability of Anaerobic Nitrate-Dependent Fe(II) Oxidation to Microbial Enhanced Oil Recovery (MEOR). Environ. Sci. Technol. 130722120101002 (2013). doi:10.1021/es401838b
214. Nemati, M., Greene, E. A. & Voordouw, G. Permeability profile modification using bacterially formed calcium carbonate: comparison with enzymic option. Process Biochem. 40, 925–933 (2005).
215. Gao, C. H. & Zekri, A. Applications of Microbial-Enhanced Oil Recovery Technology in the Past Decade. Energy Sources, Part A Recover. Util. Environ. Eff. 33, 972–989 (2011).
216. Lazar, I., Petrisor, I. G. & Yen, T. F. Microbial Enhanced Oil Recovery (MEOR). Pet. Sci. Technol. 25, 1353–1366 (2007).
217. Abramoff, M. D., Magalhães, P. J. & Ram, S. J. Image processing with ImageJ. Biophotonics Int. 11, 36–42 (2004).
218. Preibisch, S., Saalfeld, S. & Tomancak, P. Globally optimal stitching of tiled 3D microscopic image acquisitions. Bioinformatics 25, 1463–1465 (2009).

91
Appendix 1: Chapter 4 Supporting Information S1. MMP experimental setup
Figure S1. Schematic of the microfluidic MMP measurement experimental setup.
S2. Materials
Synthetic oil mixtures were prepared with various compositions of pentane and hexadecane
(99.9% purity, Sigma Aldrich). Carbon dioxide was of 99% purity (Praxair). Synthetic oil
mixtures and crude oils studied in this work are listed in Table S1. A ternary diagram (Figure
S2) was prepared using CMG Winprop reservoir fluids simulation software showing multiple
contact miscibility between CO2 and synthetic oil .

92
Table S1. Synthetic oil and crude oil compositions and densities
Oil Density (API)
67.5% pentane + 32.5% hexadecane 79
50% pentane + 50% hexadecane 72
43% pentane + 57% hexadecane 68
30% pentane + 70% hexadecane 63
Pennsylvania crude 48.8
Saudi crude 37
West Texas Intermediate crude 38.9
Figure S2. Ternary phase diagram of synthetic oil (pentane and hexadecane) multiple contact
miscibility with CO2.

93
S3. Fluorescence intensity analysis
Figure S3. Differentiated intensity plots at various pressures in a range spanning MMP.

94
Appendix 2: Silicon Chip Fabrication
Fabrication process layout:
Silicon wafer
Photoresist coating
Exposed and developed
DRIE etching
Photoresist removal
Anodic bonding to glass

95
Silicon chip fabrication materials and process procedures:
Materials:
- Silicon wafer
- Photoresist: S1818
- Primer: HMDS
- Developer: MF312
Lithography
1. Coat the wafer with HMDS cycle 90sec at 3000rpm with medium accel.
2. Coat the wafer with S1818 at 3000rpm for 90sec
3. Soft bake at 100C for 5 to 10 min
4. Expose on MA4 for 90sec
5. Develop in 1:1 MF312:1DI water for about 2min.
DRIE Etching
1. Use general Bosch process (~10 um/min)
2. Etch 252 cycles for 12 minutes (etch depth ~100um)
3. Or Fast etch process (~20 um/min)
4. Etch 5 min (50 cycles)

96
Anodic Bonding
1. Apply heat to 400 C
2. Apply force 100N
3. Apply voltage 600V
4. Set current limit 4 mA
5. Bond 10 minutes

97
Appendix: 3 Microbial enhanced oil recovery using sandstone rock pattern micromodel
Microbial enhanced oil recovery (MEOR) is a tertiary oil recovery process, where either
indigenous reservoir microorganisms are stimulated205 or a specific, customized blend of
microbes are injected deep into an oil well.206 Nutrients are pumped down as well, and
generally consist of a low cost fermentable carbohydrate (e.g. molasses), along with
phosphates and nitrates, the latter which act as electron donors during anaerobic cell
growth.207,208 Over the course of several months, these micro-organisms liberate pore-confined
oil through a variety of mechanisms, including interfacial tension (IFT) reduction and
wettability alteration,209 bioclogging or selective plugging,210 biofilm formation,210,211 biogenic
gas production212, mineral biogenesis213,214 and acid production.207 MEOR has gained
momentum of late, both in laboratory trials and in the field,215 particularly in the context of
mature, high water cut reservoirs. Part of the draw of MEOR is that the technique is low-cost
and simple to implement, requiring very few modifications to existing infrastructure.216

98
The microfluidic pore network was modelled after the grain structure of a Berea sandstone
core. First, a 9 x 9 array of images was taken of a core sample using a scanning electron
microscope (SEM), covering an area just under 1 cm2 (Fig.1a). Images were converted to
binary by manually thresholding individual images, and stitched together using ImageJ image
processing software.217,218 After performing image processing detailed in supplementary
material, a 5mm x 7.5mm section of the image was copied, and folded over itself 6 times to
form the 5 mm wide, 45 mm long microchannel shown in Fig.1b. Two inlet channels lead into
the pore network, labelled “main” and “bypass”. A single outlet channel extrudes from the
network, and passes through a resistive element before exiting the device. This configuration
was designed to allow inlet fluids to be rapidly and easily replaced, without perturbing the pore
network

99
Appendix: 4 High pressure chip manifold
Photo of the high pressure manifold assembly
CAD model of the high pressure manifold assembly
Related Documents