MICROFABRICATED SENSORS FOR WATER QUALITY MONITORING

Welcome message from author
This document is posted to help you gain knowledge. Please leave a comment to let me know what you think about it! Share it to your friends and learn new things together.
Transcript

MICROFABRICATED SENSORS FOR WATER QUALITY
MONITORING

i
MICROFABRICATED PH, TEMPERATURE, AND FREE
CHLORINE SENSORS FOR INTEGRATED DRINKING
WATER QUALITY MONITORING SYSTEMS
By
YIHENG QIN
B. ENG. SOUTHWEST JIAOTONG UNIVERSITY, 2009
M. SC. CHALMERS UNIVERSITY OF TECHNOLOGY, 2011
A Thesis Submitted to the School of Graduate Studies in Partial Fulfilment of the
Requirements for the Degree of Doctor of Philosophy
McMaster University © Copyright by Yiheng Qin, April 2017

ii
McMaster University Doctor of Philosophy (2017)
Hamilton, Ontario (Electrical and Computer Engineering)
TITLE: Microfabricated pH, temperature, and free chlorine sensors
for integrated drinking water quality monitoring systems
AUTHOR: Yiheng Qin,
B. Eng. Southwest Jiaotong University, Chengdu, China
M. Sc. Chalmers University of Technology, Göteborg,
Sweden
SUPERVISOR: Dr. Matiar M. R. Howlader
Dr. M. Jamal Deen (Co-supervisor)
Dr. Yaser M. Haddara (Co-supervisor)
NUMBER OF PAGES: xxx, 224

iii
Lay Abstract
Sensitive, easy-to-use, and low-cost pH and free chlorine monitoring systems are important
for drinking water safety and public health. In this thesis, we develop an inkjet printing
technology to deposit palladium/palladium oxide films for potentiometric pH sensors and
resistive temperature sensors. The different electrical and electrochemical properties of the
palladium/palladium oxide films are realized by creating different film morphologies using
different ink thermolysis atmospheres. The developed pH and temperature sensors are
highly sensitive, fast in response, and stable. For free chlorine sensors, a hand drawing
process is used to deposit poly(3,4-ethylenedioxythiophene):poly(styrenesulfonate), which
is an indicator for the free chlorine concentration over a wide range. We also developed a
calibration-free free chlorine sensors based on modified pencil leads. Such a free chlorine
sensor is integrated with the pH and temperature sensors, and an electronic readout system
for accurate on-site drinking water quality monitoring at low cost is demonstrated.

iv
Abstract
The monitoring of pH and free chlorine concentration in drinking water is important for
water safety and public health. However, existing laboratory-based analytical methods are
laborious, inefficient, and costly. This thesis focuses on the development of an easy-to-use,
sensitive, and low-cost drinking water quality monitoring system for pH and free chlorine.
An inkjet printing technology with a two-step thermolysis process in air is developed to
deposit palladium/palladium oxide (Pd/PdO) films as potentiometric pH sensing electrodes.
The redox reaction between PdO and hydronium ions generates the sensor output voltage.
A large PdO percentage in the film provides a high sensitivity of ~60 mV/pH. A defect-
free Pd/PdO film with small roughness contributes to a fast response and a high stability.
When the Pd ink is thermalized in low vacuum, the deposited Pd/PdO film shows a bilayer
structure. The residual oxygen in the low vacuum environment assists the decomposition
of organic ligands for Pd to form a thin and continuous layer beneath submicron Pd
aggregates. The oxidized bilayer film behaves as a temperature sensor with a sensitivity of
0.19% resistance change per °C, which can be used to compensate the sensed pH signals.
Poly(3,4-ethylenedioxythiophene):poly(styrenesulfonate) (PEDOT:PSS) is drawn by hand
to form a free chlorine sensor. Free chlorine oxidises PEDOT:PSS, whose resistivity
increment indicates the free chlorine concentration in the range of 0.5-500 ppm. Also, we
simplified an amperometric free chlorine sensor based on amine-modified pencil leads. The
simplified sensor is calibration-free, potentiostat-free, and easy-to-use.
The pH, temperature, and free chlorine sensors are fabricated on a common substrate and
connected to a field-programmable gate array board for data processing and display. The
sensing system is user-friendly, cheap, and can accurately monitor real water samples.

v
Acknowledgements
I would like to express my gratitude to Dr. Matiar M. R. Howlader for providing me this
opportunity to study as a Ph.D. student at McMaster University. As my supervisor, he built
a good research team for me with talented researchers such as Arif U. Alam, Fangfang
Zhang, and Rishad Arfin. I really appreciate his efforts in maintaining the equipment in the
unique and advanced Micro and Nano Systems Laboratory, where my research work is
carried out. Also, his door is always open for me for technical supports and valuable
discussions. I am grateful for his continuous guidance and support on my research.
I would like to express my deep appreciation and thanks to my co-supervisor Dr. M. Jamal
Deen for giving me this exciting and challenging project to work on, and also for his help,
encouragement, guidance and insightful discussions throughout this research work. I would
like to express my special appreciation to Dr. Deen for his efforts in arranging me to work
at Xerox Research Centre of Canada (XRCC) as a visiting scientist, and maintaining the
collaboration with XRCC. I would like to thank Dr. Deen for the training he provided to
me in all aspects of research, including critical thinking, experiment planning, problem
solving, data analysis, technical writing, and presentation to people with different education
levels and backgrounds. In addition, I truly appreciate the extra opportunities Dr. Deen
gave me to communicate and interact with top water researchers from Canada and India
under the umbrella of RES’EAU WaterNET and IC-IMPACTS projects. It is also a great
pleasure to work in Dr. Deen’s water research team with Dr. Hyuck-Jin Kwon, Si Pan, and
Pankaj Saini.
I would like to express my thanks to my cosupervisor, Dr. Yaser M. Haddara, for his
valuable comments on my research over the past four years. I would also like to thank my
other committee members Dr. Ravi Selvaganapathy and Dr. Aleksandar Jeremic for their
advice on my research and for taking the time to review my thesis.

vi
I would like to sincerely thank Dr. Yiliang Wu and Dr. Nan-Xing Hu from XRCC for their
continuous interests in my project, for the helpful discussions, and for the valuable
assistance offered during my research. Their experience and knowledge in chemistry and
materials have greatly helped me. I am also thankful to Michelle Chrétien, Carolyn Moorlag,
Biby Abraham, Chad Smithson, Darko Ljubic, Gail Song, Ping Liu, Sandra Gardner,
Jonathan Lee, and Geoff Allen from XRCC for their assistance in my experiments.
It is also a memorable experience working with Dr. Zeng Cheng, Xiaoqing Zheng, Dr.
Darek Palubiak, Dr. Zhiyun Li, Dr. Tianyi Guo, Hytham Afifi, Hani Alhemsi, Mrwan
Alayed, Sumit Majumder, Mozhgan Parsa, Javad Monshi Zadeh, Sasan Naseh in our group
for their valuable suggestions and feedback on my research.
Last but not least, I am grateful for the support and help that I have received from my
friends Rui Xu, Yifang Chen, Kuan Lin, and Xiaowei Deng. I sincerely thank my parents
for their unconditional support and encouragement over all these years, and my dear wife,
Lei Qin, for her endless love and for always being there for me and putting me first. This
thesis is dedicated to them.

vii
Table of Contents
Lay Abstract ..................................................................................................................... iii
Abstract .............................................................................................................................. iv
Acknowledgements ............................................................................................................ v
Table of Contents ............................................................................................................ vii
Lists of Figures .................................................................................................................. xi
List of Tables ................................................................................................................... xix
List of Appendices ........................................................................................................... xxi
List of Abbreviations .................................................................................................... xxii
List of Symbols .............................................................................................................. xxvi
Declaration of Academic Achievement ........................................................................ xxx
Chapter 1 Introduction ...................................................................................................... 1
1.1. Research background ...................................................................................... 2
1.1.1. pH and free chlorine sensing for drinking water quality monitoring ....... 2
1.1.2. Conventional ways of pH sensing ............................................................ 3
1.1.3. Conventional ways of free chlorine sensing ............................................ 4
1.1.4. Conventional ways of temperature sensing ............................................. 5
1.1.5. Future pH and free chlorine sensors ........................................................ 7
1.2. Microfabricated electrochemical pH sensors .................................................. 8
1.2.1. Potentiometric sensor ............................................................................... 9
1.2.2. ISFET ..................................................................................................... 13
1.2.3. Chemoresistor and chemotransistor ....................................................... 19
1.2.4. Research challenges ............................................................................... 26
1.3. Microfabricated electrochemical free chlorine sensors ................................ 30
1.3.1. Amperometric sensor configuration and sensing mechanism ............... 30
1.3.2. Applicable materials and sensor performance ....................................... 32
1.3.3. Research challenges ............................................................................... 33

viii
1.4. Research motivation ...................................................................................... 35
1.5. Research contributions .................................................................................. 37
1.6. Thesis organization ....................................................................................... 40
Chapter 2 Solution-processed Pd/PdO: pH sensing mechanisms and properties ...... 43
2.1. Background ................................................................................................... 44
2.2. Experimental set-up ...................................................................................... 45
2.2.1. Chemicals and reagents .......................................................................... 45
2.2.2. Methods for characterizing solutions and thin films .............................. 46
2.2.3. Solution processing of Pd/PdO pH sensing electrodes .......................... 50
2.2.4. Set-up for pH sensing tests .................................................................... 51
2.3. Characterization of Pd/PdO thin films .......................................................... 52
2.3.1. Chemical composition ........................................................................... 52
2.3.2. Surface morphology ............................................................................... 54
2.3.3. pH sensing mechanism .......................................................................... 56
2.3.4. pH sensitivity ......................................................................................... 61
2.3.5. Response time ........................................................................................ 64
2.3.6. Reversibility and drift ............................................................................ 66
2.3.7. Stability .................................................................................................. 67
2.3.8. Reproducibility ...................................................................................... 69
2.4. Conclusions ................................................................................................... 70
Chapter 3 Inkjet-printed Pd/PdO for integrated pH sensors ...................................... 71
3.1. Background ................................................................................................... 71
3.2. Inkjet printing of Pd/PdO pH sensing electrodes .......................................... 73
3.2.1. Pd Ink formulation and properties ......................................................... 73
3.2.2. Formation of Pd thin films ..................................................................... 75
3.2.3. Electrical resistivity of inkjet-printed Pd thin films ............................... 80
3.2.4. Adhesion of inkjet-printed Pd thin films ............................................... 82
3.2.5. Modeling the response of the pH sensing electrodes ............................. 84
3.2.6. Design of Pd/PdO pH sensing electrodes .............................................. 89

ix
3.3. Integrated pH sensors .................................................................................... 94
3.3.1. Fabrication process ................................................................................ 94
3.3.2. Evaluation of pH sensing performance .................................................. 96
3.3.3. Test of real water samples .................................................................... 103
3.4. Conclusions ................................................................................................. 104
Chapter 4 Inkjet-printed Pd/PdO for temperature sensors ...................................... 105
4.1. Background ................................................................................................. 106
4.2. Thin film formation in air, low vacuum, and nitrogen ............................... 108
4.2.1. Film morphologies ............................................................................... 109
4.2.2. Chemical compositions ........................................................................ 111
4.2.3. Thermogravimetric analysis ................................................................. 112
4.2.4. Film formation mechanisms ................................................................ 115
4.3. Electrical properties of inkjet-printed Pd/PdO films................................... 116
4.3.1. Effect of temperature ........................................................................... 117
4.3.2. Effect of relative humidity ................................................................... 119
4.3.3. Electrical conduction mechanisms ....................................................... 123
4.4. Conclusions ................................................................................................. 125
Chapter 5 Paper-based, hand-drawn free chlorine sensor ........................................ 127
5.1. Background ................................................................................................. 127
5.2. Sensor design and operation ....................................................................... 129
5.3. Sensor fabrication and usage....................................................................... 132
5.4. Sensor characterization ............................................................................... 134
5.4.1. Test in DI water ................................................................................... 134
5.4.2. Mechanical stability ............................................................................. 134
5.4.3. Reusability ........................................................................................... 135
5.4.4. Sensitivity ............................................................................................ 137
5.4.5. Stability ................................................................................................ 139
5.4.6. Selectivity ............................................................................................ 140
5.4.7. Test of real water samples .................................................................... 140

x
5.5. Advantages of the hand-drawn free chlorine sensor ................................... 141
5.6. Conclusions ................................................................................................. 142
Chapter 6 FPGA-based, integrated drinking water quality monitoring system ..... 143
6.1. Background ................................................................................................. 143
6.2. Fabrication of integrated sensors ................................................................ 146
6.3. System design ............................................................................................. 148
6.4. Characterization of pH sensor ..................................................................... 153
6.5. Characterization of free chlorine sensor ..................................................... 154
6.5.1. Sensitivity and response time ............................................................... 155
6.5.2. Reversibility and drift .......................................................................... 158
6.5.3. Selectivity ............................................................................................ 158
6.5.4. Stability ................................................................................................ 159
6.6. Characterization of temperature sensor....................................................... 159
6.6.1. Sensitivity ............................................................................................ 160
6.6.2. Reversibility and drift .......................................................................... 162
6.7. Measurement of real water samples ............................................................ 162
6.8. Conclusions ................................................................................................. 163
Chapter 7 Conclusions and recommendations ............................................................ 164
7.1. Conclusions ................................................................................................. 164
7.2. Recommendations ....................................................................................... 168
References ....................................................................................................................... 173
Appendix A Comparison table of microfabricated electrochemical pH sensors ..... 194
Appendix B Comparison table of microfabricated electrochemical free chlorine
sensors ............................................................................................................................. 200
Appendix C Digital masks for integrated pH, free chlorine, and temperature sensors
.......................................................................................................................................... 201
Appendix D Verilog/VHDL code for FPGA programming ....................................... 203
Appendix E Copyright permissions ............................................................................. 214

xi
Lists of Figures
Figure 1-1. Distribution of hypochlorous acid and hypochlorite ion in water at different pH
values at 25 °C. .................................................................................................................... 5
Figure 1-2. Schematic of a potentiometric pH sensor and its possible sensing mechanisms.
............................................................................................................................................ 10
Figure 1-3. Schematic of an ISFET-based pH sensor and its sensing mechanism. .......... 14
Figure 1-4. Schematic of an ExGFET-based pH sensor and its sensing mechanism. ...... 17
Figure 1-5. Schematic of a pH sensor in chemoresistor structure and its possible sensing
mechanisms. ....................................................................................................................... 20
Figure 1-6. Schematic of an ECT-based pH sensor and its sensing mechanism. ............. 22
Figure 1-7. Schematic of an EGFET-based pH sensor and its sensing mechanism. ........ 24
Figure 1-8. Schematic of a pH sensor in FET structure and its possible sensing mechanisms.
............................................................................................................................................ 25
Figure 1-9. Schematic of an amperometric free chlorine sensor and its sensing mechanism.
............................................................................................................................................ 31
Figure 2-1. (a)-(c) Fabrication process of Pd/PdO-based pH sensing electrodes. (a) Glass
substrate cleaning by rising with IPA and DI water. (b) Spin coating of Pd precursor
solution. (c) Pd precursor conversion by baking and sample annealing at different
conditions. (d) Characterization set-up for pH sensing behavior of fabricated electrodes.
............................................................................................................................................ 50
Figure 2-2. (a-d) Pd 3d XPS spectra of the surface and bulk of sensing electrodes annealed
at different temperatures for 4 min (solid lines), 24 h (dot-dash lines), and 48 h (dashed
lines). (a) Surface, 200 °C. (b) Bulk, 200 °C. (c) Surface, 250 °C. (d) Bulk, 250 °C. (e) and
(f) Curve fitting of XPS spectra for calculating atomic ratio between Pd0 and Pd2+; square
boxes are original data, solid lines are fitted curves, dotted lines are fitted peaks for Pd0 and
Pd2+, and dashed lines are background lines. (e) Surface of a sample annealed at 200 °C for

xii
48 h (the intensity of 2 Pd0 peaks is too low to be seen). (f) Bulk of the same sample
annealed at 200 °C for 48 h. ............................................................................................... 53
Figure 2-3. (a-b) AFM images over a 20 μm × 20 μm area of surfaces of pH sensing
electrodes annealed at (a) 200 °C; (b) 250 °C for 48 h. (c) AFM image over a 1 μm × 1 μm
area of surfaces of a pH sensing electrode annealed at 200 °C for 48 h. ........................... 55
Figure 2-4. SEM images of surfaces of sensing electrodes annealed at (a) 200 °C for 4 min.
(b) 200 °C for 24 h. (c) 200 °C for 48 h. (d) 250 °C for 4 min. (e) 250 °C for 24 h. (f) 250 °C
for 48 h. .............................................................................................................................. 56
Figure 2-5. Dissociative adsorption of water at the surface of PdO. (a) Pristine surface of
PdO. (b) Water adsorption. (c) Proton displacement at the PdO surface. .......................... 57
Figure 2-6. Open circuit potential versus pH values for an electrode annealed at (a) 200 °C
for 4 min. (b) 200 °C for 24 h. (c) 200 °C for 48 h. (d) 250 °C for 4 min. (e) 250 °C for 24
h. (f) 250 °C for 48 h. ......................................................................................................... 62
Figure 2-7. (a) Real-time response of an electrode annealed at 200 °C for 48 h between pH
of 2 and 12; full-scale view. (b) Enlarged view of the voltage transition between pH = 2
and 4, indicating how the response time was determined. (c-g) Real-time response of an
electrode annealed at (c) 200 °C for 4 min. (d) 200 °C for 24 h. (e) 250 °C for 4 min. (f)
250 °C for 24 h. (g) 250 °C for 48 h. ................................................................................. 65
Figure 2-8. Response time at different pH values for electrodes annealed at different
conditions. .......................................................................................................................... 66
Figure 2-9. Hysteresis at different pH values for electrodes annealed at different conditions.
............................................................................................................................................ 67
Figure 2-10. Operation stability of Pd/PdO pH sensing electrodes over a 60-day period.
............................................................................................................................................ 68
Figure 3-1. TGA test results of as-received Pd precursor solution, Pd-PhMe, and Pd-IBB
using 1-step and 2-step thermolysis methods (inset: temperature profiles of 1-step and 2-
step thermolysis). ............................................................................................................... 75
Figure 3-2. Voltage waveforms of the printhead for jetting different inks. ...................... 76

xiii
Figure 3-3. Photographs showing wetting behaviors of inkjet-printed Pd-PhMe ink on
different substrates. (a) On glass, 547 μm-wide lines. (b) On PI treated by air plasma for 2
min, 547 μm-wide lines. (Droplet pitch = 30 μm, designed line width = 520 μm in both
cases.) ................................................................................................................................. 76
Figure 3-4. (a-e) SEM images of surface morphologies of Pd films printed using Pd-PhMe
ink. (a) 30 μm droplet pitch, glass substrate, 1-step thermolysis; (b) 30 μm droplet pitch,
glass substrate, 2-step thermolysis; (c) 40 μm droplet pitch, glass substrate, 2-step
thermolysis; (d) 20 μm droplet pitch, glass substrate, 2-step thermolysis; (e) 30 μm droplet
pitch, PI substrate, 2-step thermolysis; (f) Optical microscopy image of 2-step thermalized
Pd lines printed using Pd-PhMe ink with 20 μm droplet pitch on a glass substrate. (g)
Thickness profiles of printed Pd lines shown in (f). (h) Thickness dependence of the
resistivity of printed Pd. ..................................................................................................... 78
Figure 3-5. SEM images of surface morphologies of a printed Pd layer using Pd-IBB as
ink and 2-step thermolysis. (a) A typical inhomogeneous surface morphology. (b)
Magnified view of (a). ....................................................................................................... 79
Figure 3-6. Schematic of the physical dimensions of a printed Pd/PdO film. .................. 80
Figure 3-7. (a) Depth-dependent chemical compositions of printed Pd films thermalizes at
200 ºC for 4 min and 48 h obtained by XPS depth profiling. (b) Pd 3d XPS spectra and
curve fitting of the surface and bulk of printed Pd thermalizes at 200 ºC for 4 min. (c) Pd
3d XPS spectra and curve fitting of the surface and bulk of printed Pd annealed at 200 ºC
for 48h. ............................................................................................................................... 81
Figure 3-8. AFM images of different substrates. (a) PI treated by air plasma for 2 min. (b)
Glass. .................................................................................................................................. 84
Figure 3-9. Equivalent circuit model for determining the pH response at the Pd/PdO-
electrolyte interface. ........................................................................................................... 85
Figure 3-10. Comparison between experimental data and modeling results (two time
constant model) of the sensor response towards a pH step change. (a) Linear time scale. (b)
Logarithm time scale. ......................................................................................................... 87

xiv
Figure 3-11. The linear approximation of the sensor response for the calculation of
response time using the time constant extracted from the two time constant model. ........ 88
Figure 3-12. Comparison between the sensor response time and hysteresis obtained by
experimental measurements and theoretical calculation using the two time constant model.
............................................................................................................................................ 89
Figure 3-13. Effect of Pd/PdO electrode size on the pH sensitivity, response time, and
hysteresis. ........................................................................................................................... 91
Figure 3-14. Effect of Pd/PdO electrode thickness on the pH sensitivity, response time,
and hysteresis. .................................................................................................................... 93
Figure 3-15. Integration process of a pH sensor using printing techniques. (a1) Substrate
cleaning. (a2) Air plasma treatment of PI substrate. (b) Inkjet printing of Pd ink. (c)
Thermolysis and annealing of printed Pd to form Pd/PdO sensing electrode. (d) Inkjet
printing of SU-8 ink as adhesion between Ag and the substrate. (e) Inkjet printing of AgNP
ink for the reference electrode. (f) Pipette printing of NaOCl ink for the chlorination of the
surface of Ag. (g) Pipette printing of PVC/KCl/AgCl ink to form the solid electrolyte of
the reference electrode, and painting of Ag paste for electrical contacts. ......................... 94
Figure 3-16. (a) SEM image of the surface morphology of a printed Ag layer. (b) SEM
image of the surface morphology of a printed AgCl layer. (c) XPS analysis of the surfaces
of printed Ag and AgCl layers. .......................................................................................... 96
Figure 3-17. (a) Temporal response of an integrated sensor on glass when the pH of buffer
solutions cycles between 4 and 10; inset: photograph of an integrated sensor on glass. (b)
Temporal response of an integrated sensor on PI when the pH of buffer solutions cycles
between 4 and 10; inset: photograph of an integrated sensor on PI. (c) Open circuit potential
versus pH values for an integrated sensor on glass. (d) Open circuit potential versus pH
values for an integrated sensor on PI. (e) Drift behavior an integrated sensor on glass. (f)
Drift behavior an integrated sensor on PI. ......................................................................... 97
Figure 3-18. The measured sensitivity of the pH sensor as a function of temperature. .... 98
Figure 3-19. Stability of integrated sensors on glass and PI. .......................................... 100

xv
Figure 3-20. The electrical potential stability of a PRE in solutions with: (a) Different
concentrations of Cl- ions. (b) Different pH values. ........................................................ 101
Figure 3-21. The response of a printed pH sensor in interfering solutions with different
concentrations. ................................................................................................................. 102
Figure 3-22. pH measurement results of real water samples using the integrated sensors on
glass and on PI. ................................................................................................................ 103
Figure 4-1. (a)-(c) Top-view optical images of Pd/PdO films for the thermolysis
atmosphere of: (a) Air (ANOX). (b) Low vacuum (VNOX). (c) N2 (N2NOX). (d)-(f) Top-
view SEM images of Pd/PdO films for the thermolysis atmosphere of: (d) Air (ANOX). (e)
Low vacuum (VNOX). (f) N2 (N2NOX). (g)-(i) Cross-sectional SEM images of Pd/PdO
films for the thermolysis atmosphere of: (g) Air (ANOX). (h) Low vacuum (VNOX). (i)
N2 (N2NOX). ................................................................................................................... 110
Figure 4-2. XRD patterns of the Pd/PdO films with different precursor thermolysis
atmospheres. ..................................................................................................................... 111
Figure 4-3. Raman spectra of Pd/PdO films with different precursor thermolysis
atmospheres. ..................................................................................................................... 112
Figure 4-4. TG analysis of Pd/PdO mixture with different precursor thermolysis
atmospheres. ..................................................................................................................... 113
Figure 4-5. TGA curves of Pd precursor and Pd/PdO mixture. ...................................... 113
Figure 4-6. Proposed Pd/PdO film formation mechanisms in different precursor
thermolysis atmospheres: (a) air, (b) low vacuum, and (c) N2. ....................................... 115
Figure 4-7. Resistance drift in vacuum for the Pd/PdO films prepared: (a) In air before
oxidation (ANOX). (b) In air after oxidation (AOX). (c) In low vacuum before oxidation
(VNOX). (d) In low vacuum after oxidation (VOX). (e) Temperature dependence of
resistance for the 4 samples for TCR calculations. .......................................................... 118
Figure 4-8. Resistance drift in humid air for the Pd/PdO films prepared: (a) In air before
oxidation (ANOX). (b) In air after oxidation (AOX). (c) In low vacuum before oxidation
(VNOX). (d) In low vacuum after oxidation (VOX). (e) RH dependence of resistance for
the 4 samples. ................................................................................................................... 120
xvi
Figure 4-9. FTIR spectra of Pd/PdO films with different precursor thermolysis
atmospheres before and after testing in humid air. .......................................................... 121
Figure 4-10. Resistance change during temperature cycling tests of Pd/PdO films prepared:
(a) In air before oxidation (ANOX). (b) In air after oxidation (AOX). (c) In low vacuum
before oxidation (VNOX). (d) In low vacuum after oxidation (VOX). (e) Temperature
dependence of resistance in humid air for the 4 samples for TCR calculation. ............... 122
Figure 4-11. Proposed electrical conduction mechanisms of Pd/PdO films with different
morphologies prepared: (a) In air before oxidation (ANOX). (b) In air after oxidation
(AOX). (c) In low vacuum before oxidation (VNOX). (d) In low vacuum after oxidation
(VOX). (e) In N2 before oxidation (N2NOX). (f) Schematic illustrating the inter-grain
charge transport mechanism. ........................................................................................... 124
Figure 5-1. (a) Oxidation of PEDOT in a free chlorine solution (adopted from reference
23). (b) Top view schematic and equivalent circuit of the drawn sensor. (c) Image of a
drawn sensor after fabrication; (d-f) SEM images (scale bars represent 100 μm) of the
surface of: (d) Paper substrate. (e) Drawn PEDOT:PSS film. (f) Drawn PEDOT:PSS after
testing in 100 ppm NaOCl solution for 15 s. (g) Resistance variation of a 4 cm long drawn
PEDOT:PSS chemoresistor during bending tests. ........................................................... 130
Figure 5-2. Fabrication process of a paper-based free chlorine sensor. (a) Drawing a
PEDOT:PSS film as a chemoresistor. (b) Drawing Ag films for electrical contacts. (c)
Coating waterproof Vaseline® Jelly. (d) Sensor conditioning in a NaOCl solution. ....... 132
Figure 5-3. Resistance change during the drying period of the PEDOT:PSS film after free
chlorine sensing. .............................................................................................................. 133
Figure 5-4. Reusability of paper-based drawn PEDOT:PSS sensor stripes in solutions with
different free chlorine (NaOCl) concentrations. (a) 0 ppm (DI water). (b) 0.5 ppm. (c) 1
ppm. (d) 2 ppm. (e) 5 ppm. (f) 10 ppm. (g) 20 ppm. (h) 50 ppm. (i) 100 ppm. (j) 200 ppm.
(k) 500 ppm. Legend in each figure: time of each test. X axis: accumulated testing time.
.......................................................................................................................................... 136
Figure 5-5. Reusability of the free chlorine sensor after conditioning in a 10 ppm NaOCl
solution for 5 min ............................................................................................................. 137

xvii
Figure 5-6. Sensor responses in different free chlorine solutions using different testing
durations. .......................................................................................................................... 138
Figure 5-7. Flow chart of the procedures to use the drawn sensor for practical free chlorine
measurement. ................................................................................................................... 139
Figure 5-8. Storage stability of the drawn free chlorine sensor. ..................................... 139
Figure 5-9. Sensor responses in free chlorine solutions and 1000 ppm interference solutions
(1: 100 ppm NaOCl (15 s); 2: 10 ppm NaOCl; 3: 1 ppm NaOCl; 4: DIW; 5: NaCl, 6: CaCl2;
7: MgCl2; 8: ZnCl2; 9: K2SO4; 10: CuSO4; 11: (NH4)2SO4; 12: NaHCO3; 13: Na2CO3;
14: CH3COONa; 15: Na2HPO4; 16: KNO3; 17: Urea; 18: Ethylene glycol). Inset: sensor
responses in logarithm scale. ........................................................................................... 140
Figure 6-1. Fabrication process of an integrated pH, free chlorine and temperature sensor.
.......................................................................................................................................... 148
Figure 6-2. (a) A portable integrated water quality monitoring system measuring the pH
value of tap water. (b) An integrated water quality sensing probe with pH, temperature and
free chlorine sensors. (c) A schematic diagram of the water quality monitoring system
including signal conditioning (amplification and filtering for free chlorine sensor), data
analysis (on the FPGA board), and results display (on the FPGA board). “T” represents
“temperature” in the schematic diagram. ......................................................................... 149
Figure 6-3. (a) Circuit diagram of a transimpedance amplifier with a low-pass filter for the
signal conditioning for the free chlorine sensor. (b) Photo of the fabricated transimpedance
amplifier with a low-pass filter. (c) Transfer characteristic curve of the transimpedance
amplifier with a low-pass filter circuit. ............................................................................ 151
Figure 6-4. Wheatstone bridge circuit of an inkjet-printed temperature sensor with 4
thermistors. ....................................................................................................................... 152
Figure 6-5. Calibration curves for three inkjet-printed pH sensors. ............................... 154
Figure 6-6. (a) Temporal response of a free chlorine sensor for free chlorine concentrations
between 0.2 and 8 ppm. (b) Calibration curves for five free chlorine sensors. (c) Drift
behavior of a free chlorine sensor in 2 ppm NaOCl solution in dark. (d) The response of a
free chlorine sensor to NaOCl solutions and 400 ppm interfering solutions. Each green
xviii
arrow indicates the addition of 0.2 mL of 5% interfering solution to 25 mL NaOCl solution
(1, KNO3; 2, K2SO4; 3, Na2CO3; 4, NaHCO3; 5, NaCl; 6, (NH4)2SO4; 7, NaHPO4; 8,
NaOAc). ........................................................................................................................... 156
Figure 6-7. (a) The measured sensitivity of the free chlorine sensor as a function of
temperature (without considering the temperature dependence of the dissociation constant
of HOCl). (b) Corrected sensitivity of the free chlorine sensor as a function of temperature
(considering the temperature dependence of the dissociation constant of HOCl). .......... 156
Figure 6-8. Stability of the pencil-lead-based free chlorine sensor. ............................... 159
Figure 6-9. (a) Temporal response of a thermistor fabricated by an inkjet-printed Ag film
when the temperature cycles between 0 °C and 50 °C. (b) Calibration curve of the inkjet-
printed Ag thermistor. (c) Temporal response of a thermistor fabricated by an inkjet-printed
Pd/PdO film when the temperature cycles between 0 °C and 50 °C. (d) Calibration curve
of the inkjet-printed Pd/PdO thermistor. .......................................................................... 160
Figure 6-10. (a) Temporal response of the temperature sensor for temperatures between 0
and 50 °C. (b) Calibration curve of the temperature sensor. (c) Drift of the temperature
sensor at 25 °C in water in dark. ...................................................................................... 161
Figure 7-1. Proposed future water quality monitoring system. ....................................... 169
Figure A-1. Digital mask for the inkjet printing pattern of rough Pd/PdO films for
temperature sensors (2 cm in figure = 1 cm in real device). ............................................ 201
Figure A-2. Digital mask for the inkjet printing pattern of smooth Pd/PdO films for pH
sensors (2 cm in figure = 1 cm in real device). ................................................................ 201
Figure A-3. Digital mask for the inkjet printing pattern of SU-8 films (2 cm in figure = 1
cm in real device). ............................................................................................................ 202
Figure A-4. Digital mask for the inkjet printing pattern of Ag films (2 cm in figure = 1 cm
in real device). .................................................................................................................. 202
xix
List of Tables
Table 1-1. Comparison of glass pH electrodes and different types of microfabricated
electrochemical pH sensors. ............................................................................................... 29
Table 1-2. Comparison of conventional and microfabricated electrochemical free chlorine
sensors. ............................................................................................................................... 34
Table 1-3. Proposed specifications for pH, free chlorine, and temperature sensors. ........ 36
Table 2-1. Summary of preparation conditions, thickness, chemical composition, and
performance parameters of pH sensing electrodes. ........................................................... 51
Table 2-2. Response time at different pH values for electrodes annealed at different
conditions (unit: s). ............................................................................................................ 65
Table 2-3. Hysteresis at different pH values for electrodes annealed at different conditions.
............................................................................................................................................ 66
Table 3-1. Physical properties, key jetting parameters, and thermolysis parameters for the
functional inks. ................................................................................................................... 74
Table 3-2. Adhesion test results of inkjet-printed thin films. ............................................ 83
Table 3-3. Extracted parameters for a two time constant model for the modeling of the pH
step response. ..................................................................................................................... 88
Table 3-4. Extracted parameters for a two time constant model for the modeling of the pH
step response of electrodes with different thicknesses....................................................... 93
Table 4-1. Summary of the morphologies and electrical properties of the inkjet-printed
Pd/PdO films. ................................................................................................................... 108
Table 5-1. Comparison of 6 types of paper substrates and their adhesion to PEDOT:PSS
films. ................................................................................................................................ 132
Table 5-2. Free chlorine measurement of real water samples (average results from n
measurements). ................................................................................................................ 141
Table 6-1. Monitoring of pH, free chlorine concentration and temperature of real water
samples (average results from 5 measurements). ............................................................ 163

xx
Table A-1. Summary of microfabricated electrochemical pH sensors. .......................... 194
Table A-2. Summary of microfabricated electrochemical free chlorine sensors. ........... 200
xxi
List of Appendices
Appendix A Comparison table of microfabricated electrochemical pH sensors ..... 194
Appendix B Comparison table of microfabricated electrochemical free chlorine
sensors ............................................................................................................................. 200
Appendix C Digital masks for integrated pH, free chlorine, and temperature sensors
.......................................................................................................................................... 201
Appendix D Verilog/VHDL code for FPGA programming ....................................... 203
Appendix E Copyright permissions ............................................................................. 214
xxii
List of Abbreviations
APTES 3-triethoxysilylpropylamine
DDFTTF 5,5-bis-(7-dodecyl-9H-fluoren-2-yl)-2,2-bithiophene
HOAc Acetic acid
AC Alternating current
Al2O3 Aluminum oxide
AlGaN Aluminum-gallium-nitride
(NH4)2IrCl6 Ammonium chloriridate
(NH4)2SO4 Ammonium sulfate
ADC Analogue-to-digital converter
Sb Antimony
Ar Argon
AFM Atomic force microscopy
ALD Atomic layer deposition
BJT Bipolar junction transistor
BP Boiling point
H3BO3 Boric acid
CaCl2 Calcium chloride
CNT Carbon nanotube
-COOH Carboxyl group
CVD Chemical vapor deposition
Cl- Chloride ion
Co3O4 Cobalt oxide
CRE Commercial reference electrode
CMOS Complementary metal-oxide-semiconductor
CP Conductive polymer
CuS Copper monosulfide
CuO Copper oxide
CuSO4·5H2O Copper(II) sulfate pentahydrate
DRIE Deep reactive-ion etching
DI Deionized
EDL Electrical double layer
ECT Electrochemical transistor
EGFET Electrolyte-gated field-effect transistor
EIS Electrolyte-insulator-semiconductor

xxiii
E-beam Electron-beam
ExGFET Extended-gate field-effect transistor
FET Field-effect transistor
FPGA Field-programmable gate array
FTIR Fourier transform infrared
Gd2O3 Gadolinium oxide
GaN Gallium nitride
Au Gold
HfO2 Hafnium oxide
HL Helmholtz layer
H3O+ Hydronium ion
OH- Hydroxide ion
-OH Hydroxyl group
OCl- Hypochlorite ion
HOCl Hypochlorous acid
InAs Indium arsenide
In2O3 Indium(III) oxide
ISFET Ion-sensitive field-effect transistor
Ir Iridium
IrO2 Iridium(IV) oxide
Fe2O3 Iron(III) oxide
IBB Isobutylbenzene
IPA Isopropanol
LPCVD Low-pressure chemical vapor deposition
MgCl2 Magnesium chloride
MOCVD Metal-organic chemical vapor deposition
MOS Metal-oxide-semiconductor
MWCNT Multi-walled carbon nanotube
DPD N,N-diethyl-p-phenylenediamine
NP Nanoparticle
Ni Nickel
Nb2O5 Niobium pentoxide
N2 Nitrogen
R-NH2 Organoamine
GaxOy Oxides of gallium
IrOx Oxides of iridium
PbOx Oxides of lead
PdOx Oxides of palladium
O2 Oxygen

xxiv
Pd Palladium
PdO Palladium(II) oxide
ppm Parts per million
Pd-X Pd salt
PBS Phosphate buffered saline
H3PO4 Phosphoric acid
PECVD Plasma-enhanced chemical vapor deposition
Pt Platinum
PAA Poly(1-aminoanthracene)
PEDOT:PSS Poly(3,4-ethylenedioxythiophene) doped with poly(styrenesulfonate)
P3HT Poly(3-hexylthiophene)
PMMA Poly(methyl methacrylate)
PPI Poly(propylenimine)
PVC Poly(vinyl chloride)
PANI Polyaniline
PEI Polyethylenimine
PI Polyimide
PPY Polypyrrole
PTAA Polytriarylamine
KCl Potassium chloride
K+ Potassium ion
KNO3 Potassium nitrate
K2SO4 Potassium sulfate
PRE Printed reference electrode
PSE Printed sensing electrode
PGMEA Propylene glycol monomethyl ether acetate
RF Radio frequency
RTA Rapid thermal annealing
RH Relative humidity
RTD Resistance temperature detector
RMS Root-mean-square
RuO2 Ruthenium oxide
SEM Scanning electron microscopy
Si Silicon
SiO2 Silicon dioxide
Si3N4 Silicon nitride
Ag Silver
AgCl Silver chloride
SWCNT Single-walled carbon nanotube
xxv
NaOAc Sodium acetate
NaHCO3 Sodium bicarbonate
Na2CO3 Sodium carbonate
NaCl Sodium chloride
NaOH Sodium hydroxide
NaOCl Sodium hypochlorite
Na2HPO4 Sodium phosphate dibasic
SD Standard deviation
Ta2O5 Tantalum pentoxide
TCR Temperature coefficient of resistance
TEOS Tetraethyl orthosilicate
CF4 Tetrafluoromethane
TG Thermogravimetric
TGA Thermogravimetric analysis
SnO2 Tin dioxide
Ti Titanium
TiN Titanium nitride
TiO2 Titanium oxide
PhMe Toluene
WO3 Tungsten oxide
UV Ultraviolet
V2O5 Vanadium(V) oxide
WHO World Health Organization
XRD X-ray diffraction
XPS X-ray photoelectron spectroscopy
Yb2O3 Ytterbium(III) oxide
ZnCl2 Zinc chloride
ZnO Zinc oxide
α6T α-sexithiophene

xxvi
List of Symbols
ΔV90 90% change of voltage from initial to final values
T Absolute temperature
QSS Accumulated charge per unit area at the dielectric-semiconductor interface
QOX Accumulated charge per unit area in the dielectric
β Acidic and basic equilibrium constants of surface reactions
Ea Activation energy
γI Activity coefficient for species I
aI Activity of species I
Iout Amplitude of the output current of the free chlorine sensor
k Boltzmann’s constant
ϕb Boundary potential
Re Bulk electrode resistance
CDL Capacitance of the electrical double layer
E Cell potential
μ Charge carrier mobility
zI Charge number of species I
RF Charge transfer resistance
μI Chemical potential of species I
μI0 Chemical potential of species I in a standard state
I Chemical species I
CI Concentration of a species I
COCl- Concentration of hypochlorite ion
CHOCl Concentration of hypochlorous acid
CNaOCl Concentration of NaOCl in a water sample
CIele Concentration of species I in the electrode phase
CIsol Concentration of species I in the solution phase
Cfree chlorine Concentration of the free chlorine in water
Lcrystallite Crystallite size
ρPdO Density of palladium oxide
QB Depletion charge per unit area in the semiconductor
ΔG Difference in Gibbs free energy
CD Diffusion layer capacitance
Zc Dimensionless cracking parameter
Ka Dissociation constant of acid
xxvii
Kb Dissociation constant of base
CDL Double-layer capacitance
ID Drain current
ϕ Electrical potential
ϕHD Electrical potential at the Helmholtz layer-diffusion layer interface
ϕele Electrical potential of the electrode phase
ϕsol Electrical potential of the solution phase
Rele Electrical resistance
R0B Electrical resistance of the film without energy barriers
ρ Electrical resistivity
μ Electrochemical potential
μI
ele Electrochemical potential of species I in the electrode phase
μI
sol Electrochemical potential of species I in the solution phase
ϕAg/AgCl/KCl Electrode potential of a commercial reference electrode
ϕPd/PdO Electrode potential of a Pd/PdO electrode
q Elementary charge
S0 Entropy of a system in a standard state
F Faraday’s constant
ϕf Fermi voltage
R Gas constant
COX Gate dielectric capacitance per unit area
G Gibbs free energy
G0 Gibbs free energy in a standard state
Whyst Hysteresis of a pH sensor
Cc Input capacitance of a readout circuit
Rc Input resistance of a readout circuit
U0 Internal energy of a system in a standard state
α Ion concentration in the bulk solution
L Length of a film
pKa Logarithmic dissociation constant of hypochlorous acid
Cm Lumped capacitance of an electrode
Rm Lumped resistance of an electrode
me Mass of the pH sensing electrode
R0 Measured initial resistance
Emeas Measured output voltage of a pH sensor
ΔR Measured resistance difference
Tmeas Measured temperature of a water sample
Ef Modulus of elasticity
nI Number of moles of species I

xxviii
εi Normalized amplitude for the time constant of the exponential term i
O(t) Normalized sensor output as a function of time
V Output voltage of the signal conditioning circuit for a free chlorine sensor
Vout Output voltage of the temperature sensor
Ce Parasitic capacitance of electrical connection of pH sensing electrode
GI Partial Gibbs free energy of species I
GI0 Partial Gibbs free energy of species I in a standard state
pI Partial pressure of species I
θ Peak position in a X-ray diffraction pattern
B(2θ) Peak width in a X-ray diffraction pattern
ε Permittivity of the Helmholtz layer
pHpzc pH value for which the dielectric surface is electrically neutral
pr Porosity factor of an inkjet-printed pH sensing electrode
VGS Potential difference between gate and source
Eref Potential of reference electrode
p Pressure
CF Pseudocapacitance
C0 Pseudocapacitance of the pH sensing material per unit area
ri Ratio between the time constant and the pH measurement time at a pH value
Ecal Recorded voltage when the sensor is in a pH = 7 calibration solution
RREF Reference resistance at 25 °C
TREF Reference temperature
ΔRsen Resistance change of a sensing film before and after testing
RAg1,2 Resistance of inkjet-printed Ag films
RPdO1,2 Resistance of inkjet-printed Pd/PdO films
RP1,2 Resistance of the drawn PEDOT:PSS film covered by waterproof layer
Rsen Resistance of the exposed PEDOT:PSS film before test
RA1,2 Resistance of the silver contacts
K Scherrer’s constant
Cspec Specific pseudocapacitance of the pH sensing material
E0 Standard cell potential
ϕ0 Standard electrode potential
CS Stern layer capacitance
Gs Strain energy release rate
σf Stress in a film
χsol Surface dipole potential of the solution
Ψ Surface potential at the dielectric
γ Surface tension
αTCR Temperature coefficient of resistance

xxix
t90 The time needed for 90% change of voltage from initial to final values
ΔEsen Theoretical pH sensitivity of the sensor
h Thickness of a film
hsurf Thickness of the electrode surface that participate in the redox reaction
xHL Thickness of the Helmholtz layer
VTH Threshold voltage
t Time
τi Time constant of the exponential term i
ts Time used for the measurement at a pH value
NS Total number of surface binding sites per unit area
Lc Transistor’s channel length
Wc Transistor’s channel width
z Valence of the ion
η Viscosity
Vvol Volume of a system
λ Wavelength
W Width of a film
ϕM Work function of metal
ϕSC Work function of semiconductor

xxx
Declaration of Academic Achievement
This thesis was written by Yiheng Qin under the supervision of Dr. Matiar M. R. Howlader,
Dr. M. Jamal Deen, and Dr. Yaser M. Haddara from McMaster University. The research
described in Chapter 2 to 4, and 6 (pH and temperature sensor part) was carried out in
collaboration with Xerox Research Centre of Canada (XRCC). The research presented in
Chapter 5 and 6 (free chlorine sensor part) was carried out in collaboration with Department
of Chemical Engineering, McMaster University.
Chapter 1: I conducted the literature review, and summarized the research results.
Chapter 2: I designed the devices and experiments. Sandra Gardner (XRCC) recorded
the scanning electron microscopy images. I conducted all other experiments. Dr.
Yiliang Wu (XRCC, now at TE connectivity) assisted in data analysis.
Chapter 3: I designed the devices and experiments. Jonathan Lee and Geoff Allen
(XRCC) assisted in the viscosity and surface tension measurements. Arif U. Alam
(McMaster) helped in the atomic force microscopy imaging. I conducted all other
experiments. Dr. Nan-Xing Hu (XRCC) supported the data analysis.
Chapter 4: I designed the devices and experiments. Sandra Gardner (XRCC) recorded
the scanning electron microscopy images. Arif U. Alam (McMaster) carried out the
Fourier transform infrared spectroscopy measurements. I conducted all other
experiments. Dr. Nan-Xing Hu (XRCC) supported the data analysis.
Chapter 5: I designed the devices and experiments, and did all experiments and analysis.
Chapter 6: I designed the devices and experiments. Si Pan (McMaster) assisted in the
fabrication of free chlorine sensors. Zeng Cheng (McMaster, now at AMD) provided
help in programming the field-programmable gate array. I did all other experiments
and data analysis.

Ph.D. Thesis - Y. Qin McMaster University - Electrical and Computer Engineering
1
Chapter 1
Introduction*
Continuous, real-time monitoring of the level of pH and free chlorine concentration in
drinking, recreational, and food processing water is of great importance to public health.
However, it is challenging when conventional analytical instruments, such as bulky pH
electrodes and expensive free chlorine meters, are used. These instruments have slow
response, are difficult-to-use, prone to interference from operators, and require frequent
maintenance. In contrast, microfabricated electrochemical sensors are cheaper, smaller in
size, and highly sensitive. Therefore, these sensors are desirable for online and on-demand
monitoring of pH and free chlorine in drinking water.
In this chapter, we introduce the importance and conventional approaches of pH and free
chlorine sensing for drinking water quality monitoring. Next, we discuss different physical
configurations of microfabricated sensors. These configurations include potentiometric
electrodes, ion-sensitive field-effect transistors, and chemoresistors/chemotransistors for
electrochemical pH sensing. Also, we identified that micro-amperometric sensors are the
dominant ones used for free chlorine sensing. We summarized and compared the structures,
operation/sensing mechanisms, applicable materials, and performance parameters in terms
of sensitivity, sensing range, response time and stability of each type of sensor. Then, the
motivation of this research is described, with the specifications of the proposed system and
each sensor utilized in the system. Finally, the research contribution and thesis organization
is presented.
* Adapted from Y. Qin, H.-J. Kwon, M. M. R. Howlader, and M. J. Deen, “Microfabricated electrochemical
pH and free chlorine sensors for water quality monitoring: Recent advances and research challenges,” RSC
Adv., vol. 5, no. 85, pp. 69086–69109, 2015, with permission from The Royal Society of Chemistry
(Appendix E).

Ph.D. Thesis - Y. Qin McMaster University - Electrical and Computer Engineering
2
1.1. Research background
1.1.1. pH and free chlorine sensing for drinking water quality monitoring
The quality of drinking water is determined by bio-physico-chemical parameters including,
but are not limited to pH, free chlorine concentration, turbidity, dissolved oxygen (O2),
conductivity, organic carbon, and some types of microorganisms [1]. Among them, the pH
value and free chlorine concentration is critical to the natural environment and our health.
The pH of an aqueous solution is defined as the negative common logarithm of the molar
concentration of hydronium ions (H3O+), given by:
+
3pH log H O . (1.1)
The usual range of pH is 0 to 14, where pH = 7 is the neutral value, pH < 7 indicates an
acidic solution, and pH > 7 denotes a basic solution [2].
According to the World Health Organization (WHO), the recommended optimum level of
pH for drinking water is in the range of 6.5 to 9.5 [3]. The Canadian government has a
narrower range of 6.5 to 8.5 [4]. If the pH of water in the distribution system is outside the
recommended range, it may indicate some problems in water treatment and could
eventually affect our health. For example, the leaching and nitrification of water is indicated
by lower pH values [5]; the presence of microorganisms in water changes the pH by
producing acidic or basic metabolic species [6]; accidental spills of disinfecting chemicals
and breakdown of treatment system can even result in extreme pH values (pH outside the
range of 4 to 10) [7]. Water with unusual pH values may have abnormal odor and taste. It
may cause gastrointestinal irritation [8], corrosion of metal pipes [9], and indicate
inefficient disinfection [10]. Therefore, pH has to be regularly monitored at all stages of
water treatment [11].
On the other hand, chlorine is introduced into the water treatment system for disinfection
due to its capability to bond with and destroy the outer surfaces of bacteria and viruses [12],
such as Escherichia coli O157:H7, Salmonella, Salmonella typhi, Shigella, Campylobacter,

Ph.D. Thesis - Y. Qin McMaster University - Electrical and Computer Engineering
3
Vibrio cholera and Pseudomonas, which could cause water-borne diseases. However,
chlorine should be used in a controlled manner to safely and effectively disinfect drinking
water. The WHO states that 2 to 3 parts per million (ppm) chlorine should be added into
water to get an effective disinfection and acceptable residual concentration [13]. In U.S.
standards, the maximum concentration of residual chlorine in drinking water is 2 ppm [14].
Also, the suggested concentration for free chlorine in a well-maintained swimming pool is
1.5 to 2 ppm [15], [16]. For food processing, the water should contain 50 to 200 ppm free
chlorine [17].
Underfeeding of chlorine may result in incomplete disinfection that threatens public health.
Overfeeding may generate objectionable order and increase the level of trihalomethanes
(suspected carcinogens) in the treated water [18]. Moreover, chlorine is a costly chemical
whose production requires a large amount of energy (around 3,000 kWh electricity is
needed for producing 1 ton chlorine from brine) [19]. As a result, the free chlorine level in
drinking water is a critical parameter that should be monitored routinely and frequently.
1.1.2. Conventional ways of pH sensing
Conventional technologies for pH measurement for water quality monitoring are mainly
depending on glass electrode-based pH meters, which were invented by Arnold Beckman
in 1934 and commercialized in 1936 [20]. The first pH meter included a glass-indicating
electrode that was developed by F. Haber and Z. Klemensiewicz in 1909 and integrated
with a vacuum tube amplifier [21]. In the next several decades, different types of pH sensors
emerged, and they could be mainly categorized into chemo-mechanical sensors,
electrochemical sensors, and optical sensors [11]. Even today, the most commonly used pH
sensors are still the glass-membrane-based electrochemical electrodes.
A typical glass electrode consists of a bulb made from a specific glass (for example, a glass
containing lithium or sodium ions), internal solution (usually 0.1 M hydrochloride acid or
buffered chloride solution), internal electrode (usually silver/silver chloride, Ag/AgCl, or

Ph.D. Thesis - Y. Qin McMaster University - Electrical and Computer Engineering
4
calomel electrode), and glass or plastic electrode body [22]. During pH measurement, the
outer surface of the bulb is hydrated by forming a silicate skeleton layer, which is designed
to be selectively permeable to H3O+. Similarly, a hydrated layer is created on the inner side
of the bulb. The amount of charges at the inner side is proportional to the amount of
permeated H3O+ at the outer side (relating to the concentration of H3O+ in the external
solution). The potential difference across the glass bulb membrane (E) is given by Nernst
equation [23]:
0
3
2.303log[H O ],
RTE E
zF
(1.2)
where E0 is the standard cell potential, which is a function of the standard potential of the
internal reference electrode (relative to standard hydrogen electrode) and the resistivity of
the internal solution. R is the gas constant (8.314 J/K∙mol), T is the absolute temperature, z
is the valence of the ion (1 for H3O+), F is Faraday’s constant (9.649 × 10⁴ C/mol), and
[H3O+] is the ion activity (relating to the molar concentration of H3O+). At 25 °C, the
electrode potential as a function of solution pH is:
0 0.05916pH,E E (1.3)
which shows the ideal pH sensitivity of the glass electrode is 59.16 mV/pH. This value is
known as the Nernstian slope in the pH-voltage plot and has been treated as the reference
value in the development of novel pH sensors.
1.1.3. Conventional ways of free chlorine sensing
Free chlorine in water consists of hypochlorous acid (HOCl) and hypochlorite ion (OCl-).
When chlorine gas is introduced into water for disinfection, HOCl is produced [24]:
2 2Cl +H O HOCl+HCl, (1.4)
where HOCl is a weak acid and can be partially dissociated into H+ and OCl- in water:
+ -HOCl H +OCl . (1.5)
Thus, at a certain temperature, the percentage distribution of HOCl and OCl- is a function
of the concentration of H+ (H3O+), which is the pH of the solution (Figure 1-1). This relation
can be generally expressed by:

Ph.D. Thesis - Y. Qin McMaster University - Electrical and Computer Engineering
5
-[OCl ]
log log pH,[HOCl]
aK (1.6)
where [OCl-] and [HOCl] are the equilibrium concentrations of OCl- and HOCl,
respectively, and Ka is the dissociation constant of HOCl (around 10-7.53 at 25 °C) [25]. One
can measure the solution pH together with the concentration of either HOCl or OCl- to
obtain the level of free chlorine concentration. Two commonly used analytical methods for
free chlorine monitoring are colorimetric and electrochemical analysis, including:
absorptiometry methods using N,N-diethyl-p-phenylenediamine (DPD) [26], o-tolidine [27]
or other chemicals [28]–[30]; iodometric titration [31]; chromatography [32];
chemiluminescence [33]; and amperometric methods [34], [35].
Figure 1-1. Distribution of hypochlorous acid and hypochlorite ion in water at different pH values at 25 °C.
The DPD-based absorptiometry method has been extensively used owing to its high
sensitivity. When the solution pH is around 7, free chlorine oxidizes DPD to form a colored
magenta compound [26]. The color can be photometrically read out to determine the
amount/concentration of chlorine. This method usually can detect free chlorine in the
concentration range of 0 to 5 ppm with an accuracy of 0.04 ppm. It has been considered as
a standard analytical approach and approved by the United States Environmental Protection
Agency for online monitoring of free chlorine [36].
1.1.4. Conventional ways of temperature sensing
The temperature of a water sample may not directly tell the water quality, however, the
temperature affects most of the bio-physico-chemical parameters in water. To monitor the
0%
20%
40%
60%
80%
100%
4 5 6 7 8 9 10 11
% o
f H
OC
lo
r O
Cl-
pH
HOCl OCl-

Ph.D. Thesis - Y. Qin McMaster University - Electrical and Computer Engineering
6
drinking water quality with a high accuracy, the water sample temperature should be
measured. For example, according to the Nernst equation (equation (1.2)), the sensitivity
of a glass-electrode-based pH sensor is a function of the water temperature. Also, in free
chlorine monitoring, the dissociation constant of HOCl varies with the water temperature
[25].
Electronic temperature sensor can be categorized as resistance temperature detectors (RTD,
including thermistors), thermocouples, and junction semiconductor sensors. A RTD uses a
pure metal (such as platinum, Pt), whose resistance changes is linearly proportional to
temperature (a positive temperature coefficient of resistance, TCR) [37]. The Pt-based RTD
typically has a wide sensing range of -270 °C to +850 °C with a sensitivity of 0.00385 Ω/°C
and an accuracy of ~0.25 °C (between 0 °C and 100 °C). A RTD can also use a
semiconductor material (such as silicon, Si) that exhibits large changes in resistance for a
small change in temperature (thermistor) [38]. This device has a negative TCR, meaning
that the resistance decreases as the temperature increases. The accuracy of such device is
0.1 °C to 0.2 °C in the range of 0 °C to 100 °C. One of the advantages of RTDs is their
small dimensions and low cost.
In a thermocouple, two dissimilar metals are connected at their two ends. If the two metal-
metal junctions are exposed to two different temperatures, a thermoelectric potential will
be produced in the circuit (Seebeck effect) [39]. The magnitude of the thermoelectric
potential depends on the nature of the two metals and the temperature difference between
the junctions. The sensing range of a thermocouple can be up to 2000 °C [40], depending
on the metals used. However, the accuracy of thermocouples is lower (~1 °C) than RTDs.
A p-n junction diode and bipolar junction transistor (BJT) have strong temperature
dependence in their electrical characteristics. If a diode or a BJT is biased by a constant
current, the forward biased voltage will change depending on the temperature change [41].

Ph.D. Thesis - Y. Qin McMaster University - Electrical and Computer Engineering
7
The junction semiconductor sensors have a sensing range up to ~500 °C, and their sensitive
can be greater than 1 mV/°C.
1.1.5. Future pH and free chlorine sensors
Traditional analytical approach for drinking water quality monitoring consists of multiple
steps: water sampling, sample transportation to laboratories, and laboratory analysis [42].
This approach is time-consuming, expensive and laboratory-dependent. Also, the results
are easily affected by anthropogenic interference as well as long-term storage of the water
samples [43], [44]. For example, the operation of inexpensive multi-parameter water
quality test kits (85 CAD for a 15-parameter test kit) are based on the colorimetric method.
The colors of different reagents change when they react with the analytes. These test kits
are qualitative, have a low measurement accuracy, and can only be used for a limited
number of times (2 to 5 times). Glass pH electrodes are brittle, large in dimensions, slow
in response, costly, and they need regular maintenance such as calibration and refilling of
the reference buffer solution [45]. For free chlorine monitoring, the commonly used DPD
analyzers have high sensitivity and can provide accurate results in a limited detection range
if they are calibrated frequently. However, such analyzers rely on expensive optical
instruments, generate environmentally harmful chemicals, are prone to the interference of
certain iron and manganese species, and are difficult to miniaturize [36], [46]. Therefore,
alternative sensing technologies need to be developed to address these challenges.
The utilization of accurate, easy-to-use, small-footprint and inexpensive sensors is an
attractive alternative approach. Recent developments in microfabrication technologies
enable the realization of such sensors. The advantages of the microfabrication technologies
include the precise control of material surface morphologies (such as roughness), the ability
to tailor material properties (such as conductivity), and the reduction of the amount of
materials used. Also, micro-scale sensors can be integrated with other sample processing,
signal processing and transmission components to create high-functionality integrated
systems for automatic operation [47], [48].

Ph.D. Thesis - Y. Qin McMaster University - Electrical and Computer Engineering
8
There are reports of several hydrogel-based sensors using micro chemical-mechanical
transducers for the measurement of pH [49]–[52]. However, these sensors are more difficult
to implement due to their brittle structures and long response time (hundreds of minutes).
In contrast, micro-optical sensors are highly accurate and sensitive, but their sensing range
is limited and linearity is poor. Also, the components for optical sensors such as lasers and
detectors are expensive [53]–[56], and usually, the sensors require chemical reagents for
the measurement [57]. Therefore, chemo-mechanical and optical sensors are challenging
to implement for continuous, low-cost and easy-to-use water quality monitoring. The
advantages of the microfabricated electrochemical sensors over other types of sensors and
analytical methods include:
Wider sensing range and faster response with comparable sensitivity.
Easier integration with microelectronic components for automatic operation.
Smaller dimensions and higher structural compatibility with existing water distribution
systems.
Better compatibility with additive fabrication technologies.
Lower cost so that they can be deployed more widely.
1.2. Microfabricated electrochemical pH sensors
In the literature, more than seven mechanisms were described to explain the working
principles of solid-state electrochemical pH sensors [58]–[60]. These mechanisms include:
H3O+ ion exchange in a membrane rich in hydroxyl groups (-OH). It is the mechanism
for conventional glass electrodes.
Redox equilibrium involving H3O+ ions between a metal and its oxides, such as an
antimony electrode.
Redox equilibrium involving H3O+ ions between metal oxides with different metal
valences, such as iridium oxide (IrOx) electrodes.

Ph.D. Thesis - Y. Qin McMaster University - Electrical and Computer Engineering
9
Redox equilibrium involving a solid-phase material and H3O+ ions, whose hydrogen
content can be changed by applying an electrical current, such as conductive polymer-
based electrodes.
Steady-state corrosion of the electrode material by H3O+ ions, but this is not suitable
for practical uses.
Change of surface potential of a solid-state material due to the pH change of the
contacting solution, based on the site-dissociation and double-layer models at the solid-
liquid interface. Such theory was applied in transistor-based pH sensors.
Variation of electrical properties (such as resistivity) of a material with changes in the
pH of the solution.
Based on these transduction mechanisms, different configurations of pH sensors were
developed. In addition to these methods, other mechanisms and sensor structures, such as
voltammetric [61], [62], impedimetric [63], and diode-based sensors [64], were reported.
In subsection 1.2.1 to 1.2.3, we focus on the more widely reported pH sensors structured
as potentiometric electrodes, ion-sensitive field-effect transistors (ISFETs), and
chemoresistors/chemotransistors.
1.2.1. Potentiometric sensor
1.2.1.1. Sensor configuration and sensing mechanism
A typical potentiometric sensor has a two-electrode structure, one electrode being the
sensing electrode and the other, the reference electrode with Ag/AgCl being the most
commonly used reference electrode in micro-scale pH sensors [65]–[67]. When both
electrodes contact the solution, the electrical potential difference between them is measured
to determine the H3O+ concentration in the solution. Figure 1-2 shows a schematic of a
potentiometric pH sensor and its possible sensing mechanisms.

Ph.D. Thesis - Y. Qin McMaster University - Electrical and Computer Engineering
10
Figure 1-2. Schematic of a potentiometric pH sensor and its possible sensing mechanisms.
For potentiometric sensors, two possible mechanisms for pH sensing were observed: redox
reactions and ion-selective permeation. First, if the material on the sensing electrode has
redox reactions with H3O+, then a potential difference is generated by the free energy
change as reversible chemical reactions approaching their equilibrium conditions [67].
Second, if the sensing material acts as an ion-selective membrane, the concentration
gradient of ions across the membrane also generates a potential difference. For both cases,
the potential can be quantitatively determined by the Nernst equation, as discussed
previously in section 1.1.2. Ideally from equation (1.3), the change of 1 pH unit at 25 °C
will result in a 59.16 mV change in the potential difference between the sensing and
reference electrodes.
The potentiometric configuration is simple when compared to other sensor structures. It
only requires two electrodes and no power supply is needed for its operation. Thus, the
dimensions of potentiometric sensors can be reduced. The potential difference between the
sensing and reference electrodes is normally hundreds of millivolts, which can be easily
read out by inexpensive, commercial voltmeters. Therefore, potentiometric sensors are
widely used in laboratories for the characterization of newly developed pH sensitive
materials.
V
OR
pH-sensitive film
Electrically conductive film
Substrate for sensing electrode
Electrolyte
Reference
electrode
e-
A+H3O+↔B±e-(+H2O)
e-
H3O+
H3O+
Redox
responsive
material A/B
e- H2O
H3O+
H3O+
H3O+
H3O+
H3O+
H3O+ H3O
+
H3O+-selective
membrane
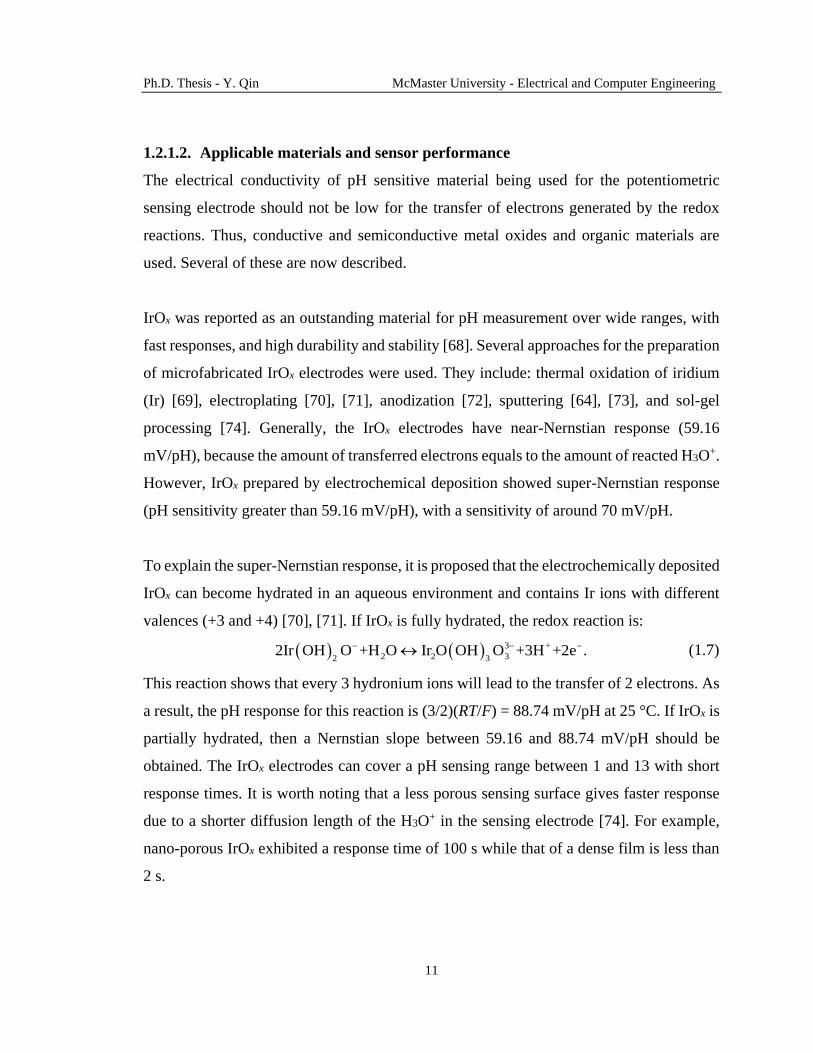
Ph.D. Thesis - Y. Qin McMaster University - Electrical and Computer Engineering
11
1.2.1.2. Applicable materials and sensor performance
The electrical conductivity of pH sensitive material being used for the potentiometric
sensing electrode should not be low for the transfer of electrons generated by the redox
reactions. Thus, conductive and semiconductive metal oxides and organic materials are
used. Several of these are now described.
IrOx was reported as an outstanding material for pH measurement over wide ranges, with
fast responses, and high durability and stability [68]. Several approaches for the preparation
of microfabricated IrOx electrodes were used. They include: thermal oxidation of iridium
(Ir) [69], electroplating [70], [71], anodization [72], sputtering [64], [73], and sol-gel
processing [74]. Generally, the IrOx electrodes have near-Nernstian response (59.16
mV/pH), because the amount of transferred electrons equals to the amount of reacted H3O+.
However, IrOx prepared by electrochemical deposition showed super-Nernstian response
(pH sensitivity greater than 59.16 mV/pH), with a sensitivity of around 70 mV/pH.
To explain the super-Nernstian response, it is proposed that the electrochemically deposited
IrOx can become hydrated in an aqueous environment and contains Ir ions with different
valences (+3 and +4) [70], [71]. If IrOx is fully hydrated, the redox reaction is:
3 +
2 2 32 32Ir OH O +H O Ir O OH O +3H 2 .+ e (1.7)
This reaction shows that every 3 hydronium ions will lead to the transfer of 2 electrons. As
a result, the pH response for this reaction is (3/2)(RT/F) = 88.74 mV/pH at 25 °C. If IrOx is
partially hydrated, then a Nernstian slope between 59.16 and 88.74 mV/pH should be
obtained. The IrOx electrodes can cover a pH sensing range between 1 and 13 with short
response times. It is worth noting that a less porous sensing surface gives faster response
due to a shorter diffusion length of the H3O+ in the sensing electrode [74]. For example,
nano-porous IrOx exhibited a response time of 100 s while that of a dense film is less than
2 s.

Ph.D. Thesis - Y. Qin McMaster University - Electrical and Computer Engineering
12
Other metal oxides have also been studied, but their pH sensitivities were not as high as
IrOx. Nano-copper oxide (CuO) [75], cobalt oxide (Co3O4) [76], tungsten oxide (WO3) [77]
were synthesized by hydro-thermal growth and their pH sensitivities were 28, 58.5, and
56.7 mV/pH, respectively. Sputtered ruthenium oxide (RuO2) sensors were reported with a
sensitivity of about 69 mV/pH [78]. However, the explanation for this phenomenon of
super-Nernstian response was not given.
A super-Nernstian response of 84 mV/pH was achieved with β-phase lead dioxide
nanoparticles (NPs) deposited electrochemically [79]. The pH sensing range of this sensor
was from 0.12 to 13, which is the widest in recent publications. The superior response was
attributed to the multiple oxidation states of lead oxide (PbOx), which was similar to the
electrochemically deposited IrOx. In addition, palladium(II) oxide (PdO) generated from
solution-processed palladium (Pd) precursor was tested and a pH sensitivity around 65
mV/pH was obtained [80]. Also, because this sensor was prepared at a low temperature
(200 °C), it could potentially be integrated with polymeric substrates to reduce the cost of
the pH sensors [81].
In addition to metal oxides, many conductive polymers (CPs) were also used as
potentiometric electrodes. Their pH sensitivity is attributed to their acidic and/or basic
functional groups, which can be protonated or deprotonated at different pH levels [82].
Deprotonation of CPs results in a decrease of charge carrier density along the polymer
chains, which alters the materials’ redox, electrical and optical properties. Two widely
studied CPs are polyaniline (PANI) and polypyrrole (PPY). The amino groups in their
polymer chains have affinity towards H3O+. Hence, PANI and PPY thin films can be
considered as H3O+ permeable membrane and a Nernstian response was observed in pH
buffers [83]–[85]. Another contributor to the Nernstian response of CP-based pH sensors
is the redox equilibrium, similar to metal oxide-based sensors.

Ph.D. Thesis - Y. Qin McMaster University - Electrical and Computer Engineering
13
PANI electrodes prepared by electropolymerization showed a slight super-Nernstian
response (62.4 mV/pH) in the pH range of 2 to 9 [84]. Due to the reliable near-Nernstian
performance and fast response time <25 s in the physiological pH range (3 to 8), PANI-
based wearable sensors were used to measure the pH values of bio-fluids [86], [87].
Compared to PANI-based sensors, PPY was tested in a wider pH range of 2 to 12, but a
lower sensitivity (~50 mV/pH) was measured [83], [85], [88]. Such sensors were shown to
be stable over 30 days.
Considering other organic materials, parylene-C normally used as an insulating material,
also displayed a pH sensitivity of 16.3 mV/pH between pH of 4 and 10 [89]. Although the
sensitivity of parylene-C was low, its process compatibility with existing microelectronics
fabrication technologies makes it suitable for low-cost applications. Carbon nanotubes
(CNTs) were also evaluated as a pH sensitive material with a Nernstian response [90]. H3O+
and hydroxide ion (OH-) can dope CNT walls by behaving as electron acceptors and donors
[91]. Thus, the Fermi level of CNTs changes with the pH value, leading to a change in the
measured open-circuit potential.
1.2.2. ISFET
1.2.2.1. Sensor configuration and sensing mechanism: ISFET
The ISFET was described by Bergveld in 1970. Its configuration was a metal-oxide-
semiconductor field-effect transistor (MOSFET) with the gate separated from the chip by
the solution to be monitored. The gate metal was replaced by a reference electrode and the
dielectric layer is normally critical to the sensing performance (Figure 1-3) [59], [92], [93].
Based on the simple theory of MOSFET, the drain current (ID) of the ISFET in the linear
regime is given by [59], [94]:
21
2
cD OX GS TH DS DS
c
WI C V V V V
L
, (1.8)

Ph.D. Thesis - Y. Qin McMaster University - Electrical and Computer Engineering
14
where COX is the gate dielectric capacitance per unit area; μ is the charge carrier mobility;
Wc and Lc are the transistor’s channel width and length, respectively; VGS is the potential
difference between gate and source electrode; and VTH is the threshold voltage of the
transistor. The threshold voltage can be further expressed as [59], [94]:
2sol SC OX SS BTH ref f
OX
Q Q QV E
q C
, (1.9)
where Eref is the potential of reference electrode; Ψ is the surface potential at the dielectric-
electrolyte interface, which results from a chemical reaction (usually governed by the
dissociation of oxide surface groups) and is a function of pH; χsol is the surface dipole
potential of the solution; ϕSC is the work function of semiconductor; q is the elementary
charge; QOX is the accumulated charge per unit area in the dielectric; QSS is the accumulated
charge per unit area at the dielectric-semiconductor interface; QB is the depletion charge
per unit area in the semiconductor; and ϕf is the Fermi voltage.
Figure 1-3. Schematic of an ISFET-based pH sensor and its sensing mechanism.
From equation (1.8) and (1.9), one can see that the electrolyte-insulator-semiconductor
(EIS) structure determines the threshold voltage and consequently the current-voltage
behavior of the ISFET. A theory from site-dissociation and double-layer models was
developed to express the surface potential (Ψ) [59], [94]:
pH-sensitive dielectric
Electrolyte
Reference
electrode
(gate)
P-type Si
Passivation
layer
Surface
binding site
Source Drain
VDS
VGSH3O
+
H3O+
H3O+
H3O+
pH-sensitive dielectric

Ph.D. Thesis - Y. Qin McMaster University - Electrical and Computer Engineering
15
2.3 pH -pH1
pzc
kT
q
, (1.10)
where k is the Boltzmann’s constant; T is the absolute temperature; β is the acidic and basic
equilibrium constants of the related surface reactions; pHpzc is the pH value for which the
dielectric surface is electrically neutral. Among these parameters, β represents the
capability of chemical sensing of the oxide or dielectric. If β is large enough, we can assume
β/(β+1) = 1. In this case, at 25 °C, the change of 1 pH unit will result in the change of
surface potential of 59.16 mV (also known as Nernstian-response). In terms of pH sensors,
β is related to the surface binding sites for H3O+ (such as -OH groups) and is defined as
[95]:
1/222 /S b a
DL
q N K K
kTC , (1.11)
where NS is the total number of surface binding sites per unit area; Ka and Kb are the
equilibrium constants of acid and base points, respectively; CDL is the double-layer
capacitance at the dielectric-electrolyte interface derived from the Gouy-Chapman-Stern
model. As a result, if a gate dielectric has a significant amount of surface binding sites for
H3O+, then the surface potential of the dielectric can be shifted by a measurable amplitude.
For ISFETs, the variation of threshold voltage or drain current can be recorded to determine
the pH variation. Furthermore, the thin-film-transistor-based ISFET follows the same
relation between surface potential and solution pH.
1.2.2.2. Applicable materials and sensor performance: ISFET
The sensing material in an ISFET should have extensive surface binding sites for H3O+.
Most ISFETs, or EIS devices, were fabricated on doped Si substrates. The insulation
materials functioning as the pH-sensitive layer include metal oxides and semiconductor-
based ceramics. Titanium oxide (TiO2) has been used in both EIS structures and ISFETs.
The pH sensitivity of sputtered TiO2 film was ~57 mV/pH [96], [97], while the sensitivity
was ~63 mV/pH for the TiO2 film prepared by metal-organic chemical vapor deposition
(MOCVD) [98]. The sensitivity of TiO2 is attributed to the hydrogen bonds formed at the

Ph.D. Thesis - Y. Qin McMaster University - Electrical and Computer Engineering
16
oxide surface acting as binding sites. However, the formation of titanium hydroxide
introduces large hysteresis during measurements. In addition, to get a densely-packed TiO2
layer, high-temperature annealing is required (normally above 500 °C).
Another attractive material for pH sensing is tantalum pentoxide (Ta2O5). A near-Nernstian
response of about 57 mV/pH was obtained for this material prepared by MOCVD [99] or
thermal oxidation [100]. The challenge of using Ta2O5 is to avoid exposure to light. This is
because light can generate charge carriers in Ta2O5 and result in drift of the output signals.
Other materials such as zinc oxide (ZnO) [101], hafnium oxide (HfO2) [102], gadolinium
oxide (Gd2O3) [103], titanium (Ti)-based binary oxides [104], aluminum-gallium-
nitride/gallium nitride (AlGaN/GaN) [105], and semiconductor nanowires [106], [107]
were used and they demonstrated a sub-Nernstian or near-Nernstian pH responses.
Low-temperature (normally below 300 °C) deposition of the pH sensing layer is attractive
for sensor development on a polymeric substrate due to their low glass transition
temperatures. Solution-processed aluminum oxide (Al2O3) was spin coated onto graphene
and annealed at 250 °C, offering a pH sensitivity of 36.8 mV/pH in the pH range of 3 to 10
[108]. Ta2O5 layer was deposited onto graphene using atomic layer deposition (ALD) at
low temperatures [109]. The pH sensing range of the graphene-based sensor is between 3
and 8 with a sensitivity of 55 mV/pH.
Besides inorganic materials, organic semiconductors were also used for the channel in an
ISFET. Poly(3-hexylthiophene) (P3HT) and pentacene were also used in ISFET-based pH
sensors [110]–[113]. They can be integrated not only with metal oxide sensing layers, but
also with organic thin films having hydrogen ionophores or H3O+ binding sites.
Polytriarylamine (PTAA) has superior electrical stability to other organic semiconductors.
It was coated with the insulating material Al2O3 and polyisobutylmethacrylate-Teflon as a
bilayer [114], [115]. Depending on the insulating material, the pH sensitivity varied from
33 mV/pH (Al2O3) to over 60 mV/pH (polyisobutylmethacrylate-Teflon). Importantly,
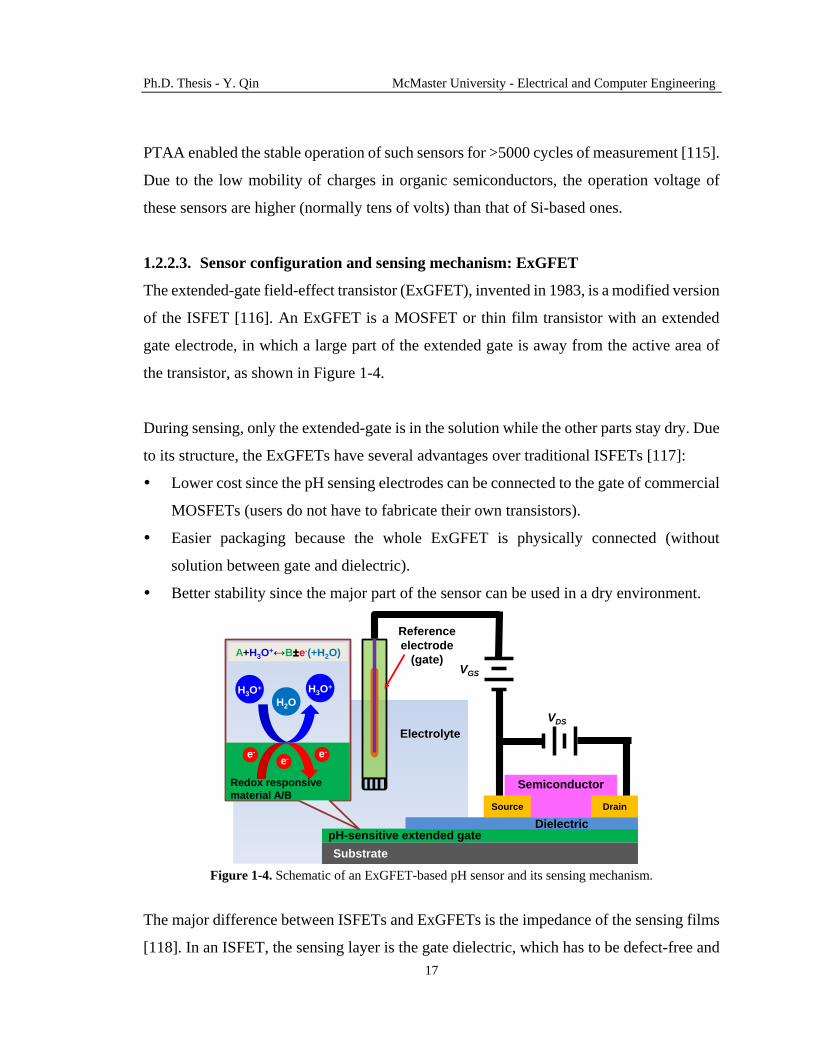
Ph.D. Thesis - Y. Qin McMaster University - Electrical and Computer Engineering
17
PTAA enabled the stable operation of such sensors for >5000 cycles of measurement [115].
Due to the low mobility of charges in organic semiconductors, the operation voltage of
these sensors are higher (normally tens of volts) than that of Si-based ones.
1.2.2.3. Sensor configuration and sensing mechanism: ExGFET
The extended-gate field-effect transistor (ExGFET), invented in 1983, is a modified version
of the ISFET [116]. An ExGFET is a MOSFET or thin film transistor with an extended
gate electrode, in which a large part of the extended gate is away from the active area of
the transistor, as shown in Figure 1-4.
During sensing, only the extended-gate is in the solution while the other parts stay dry. Due
to its structure, the ExGFETs have several advantages over traditional ISFETs [117]:
Lower cost since the pH sensing electrodes can be connected to the gate of commercial
MOSFETs (users do not have to fabricate their own transistors).
Easier packaging because the whole ExGFET is physically connected (without
solution between gate and dielectric).
Better stability since the major part of the sensor can be used in a dry environment.
Figure 1-4. Schematic of an ExGFET-based pH sensor and its sensing mechanism.
The major difference between ISFETs and ExGFETs is the impedance of the sensing films
[118]. In an ISFET, the sensing layer is the gate dielectric, which has to be defect-free and
Electrolyte
Reference
electrode
(gate)
Substrate
Semiconductor
Source Drain
VDS
VGS
e-e-
H3O+ H3O
+
e-
A+H3O+↔B±e-(+H2O)
Redox responsive
material A/B
DielectricpH-sensitive extended gate
H2O
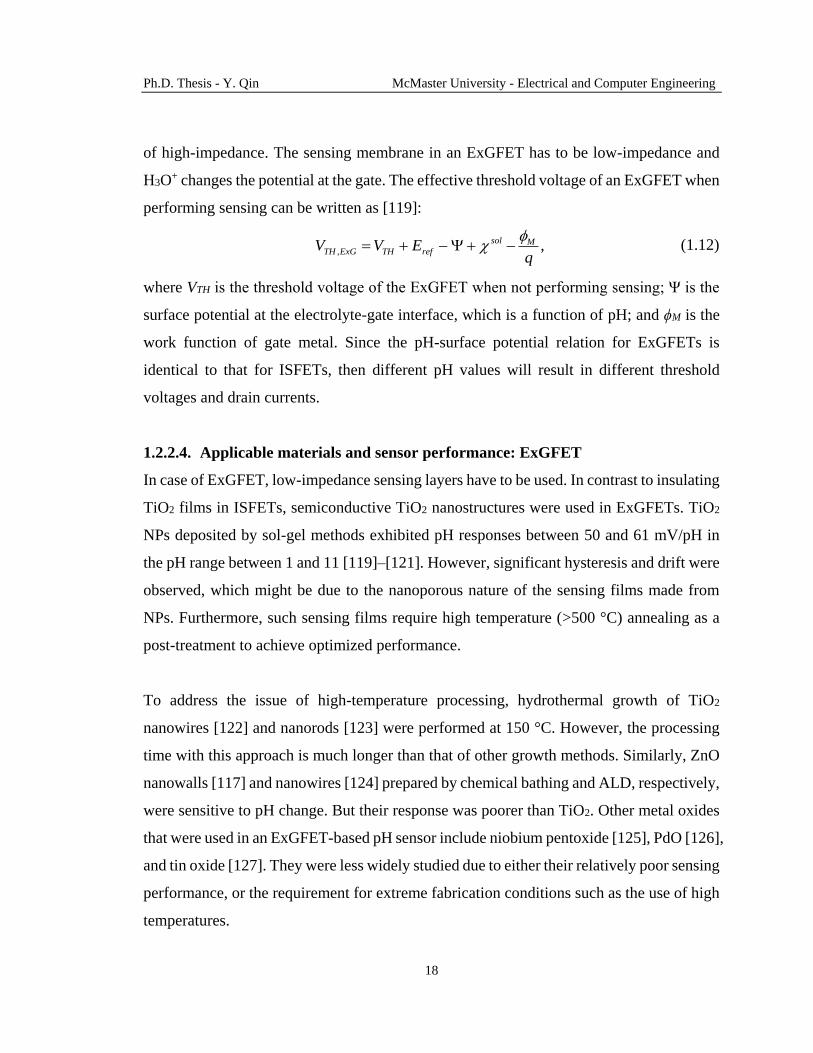
Ph.D. Thesis - Y. Qin McMaster University - Electrical and Computer Engineering
18
of high-impedance. The sensing membrane in an ExGFET has to be low-impedance and
H3O+ changes the potential at the gate. The effective threshold voltage of an ExGFET when
performing sensing can be written as [119]:
, ,sol M
TH ExG TH refV V Eq
(1.12)
where VTH is the threshold voltage of the ExGFET when not performing sensing; Ψ is the
surface potential at the electrolyte-gate interface, which is a function of pH; and ϕM is the
work function of gate metal. Since the pH-surface potential relation for ExGFETs is
identical to that for ISFETs, then different pH values will result in different threshold
voltages and drain currents.
1.2.2.4. Applicable materials and sensor performance: ExGFET
In case of ExGFET, low-impedance sensing layers have to be used. In contrast to insulating
TiO2 films in ISFETs, semiconductive TiO2 nanostructures were used in ExGFETs. TiO2
NPs deposited by sol-gel methods exhibited pH responses between 50 and 61 mV/pH in
the pH range between 1 and 11 [119]–[121]. However, significant hysteresis and drift were
observed, which might be due to the nanoporous nature of the sensing films made from
NPs. Furthermore, such sensing films require high temperature (>500 °C) annealing as a
post-treatment to achieve optimized performance.
To address the issue of high-temperature processing, hydrothermal growth of TiO2
nanowires [122] and nanorods [123] were performed at 150 °C. However, the processing
time with this approach is much longer than that of other growth methods. Similarly, ZnO
nanowalls [117] and nanowires [124] prepared by chemical bathing and ALD, respectively,
were sensitive to pH change. But their response was poorer than TiO2. Other metal oxides
that were used in an ExGFET-based pH sensor include niobium pentoxide [125], PdO [126],
and tin oxide [127]. They were less widely studied due to either their relatively poor sensing
performance, or the requirement for extreme fabrication conditions such as the use of high
temperatures.

Ph.D. Thesis - Y. Qin McMaster University - Electrical and Computer Engineering
19
Organic-inorganic hybrid materials were studied to utilize the benefits from both types of
materials. For instance, CNTs were used with indium oxide in a bilayer and core-shell
configurations [128], [129]. CNTs and nickel have been plated together to form CNT-
nickel oxide composite structure [130]. The metal oxides normally behave as the H3O+
binder and CNTs are employed to regulate the conductivity of the film. Although these
composite materials did not perform as well as metal oxides, the ease in adjusting material
properties by varying processing steps and parameters are important advantages.
Pure organic materials are less frequently reported as the sensing component in an ExGFET.
Parylene-C, one of the few examples, was treated with O2 plasma to generate surface
functional groups for H3O+ binding [131]. The resulting pH sensitivity of 23 mV/pH in the
pH range of 4 to 10 was relatively low. This poor performance left room for more research
work in this area.
1.2.3. Chemoresistor and chemotransistor
1.2.3.1. Sensor configuration and sensing mechanism: Chemoresistor
A chemoresistor-based pH sensor is a two-terminal device with the pH sensitive material
deposited between two electrodes (Figure 1-5). The sensing material has an intrinsic
electrical resistance/conductance, which will change accordingly upon exposure to
solutions with different pH values. The mechanisms for the change in
resistance/conductance are the following [132]:
The chemical reactions between H3O+ or OH- with the sensing material that generates
new materials with different electrical properties.
The H3O+-induced changes in the charge depletion/accumulation layer in the
semiconductive sensing material.

Ph.D. Thesis - Y. Qin McMaster University - Electrical and Computer Engineering
20
Figure 1-5. Schematic of a pH sensor in chemoresistor structure and its possible sensing mechanisms.
The chemoresistor has a simple physical structure and it does not require a reference
electrode. These two features are preferred for miniaturization of the sensor.
1.2.3.2. Applicable materials and sensor performance: Chemoresistor
For chemoresistors, TiO2 nanowires have been synthesized at the surface of Ti/Carbon
nanofibers by electrospinning and hydrothermal growth [133]. The high-concentration
H3O+ in the solution reduces the depletion layer at the surface of n-type TiO2 nanowires,
thus increasing the electrical conductivity of the material. In the pH range between 2 and
12, such a sensor showed a response of 5.7 nS/pH. On the other hand, Pd is known as a
hydrogen storage material owing to the formation of hydride of Pd, which possesses an
electrical resistivity 1.3 to 2 times higher than Pd [134]. Based on the resistivity change,
Lee et al. used standard photolithography processes were used to fabricate Pd resistors and
gold (Au) electrodes [134]. Hydrogen gas generated during electrolysis was sensed by the
Pd resistor and its resistance was proportional to the concentration of H3O+ in the solution
(higher concentration generated more hydrogen gas). A change of 1 unit pH caused the Pd
resistance to vary 5% from its initial value.
Electrolyte
Substrate
Semiconductor
A
H3O+
H3O+
A+H3O+↔B(+C)
Reactive material A
H3O+
H3O+
H3O+
e- e-
H3O+ H3O
+
e-
Semiconductive
material
OR
e- e-e-
H3O+
H3O+
H3O+
ElectrodepH-sensitive film
Passivation
layer
Product material B
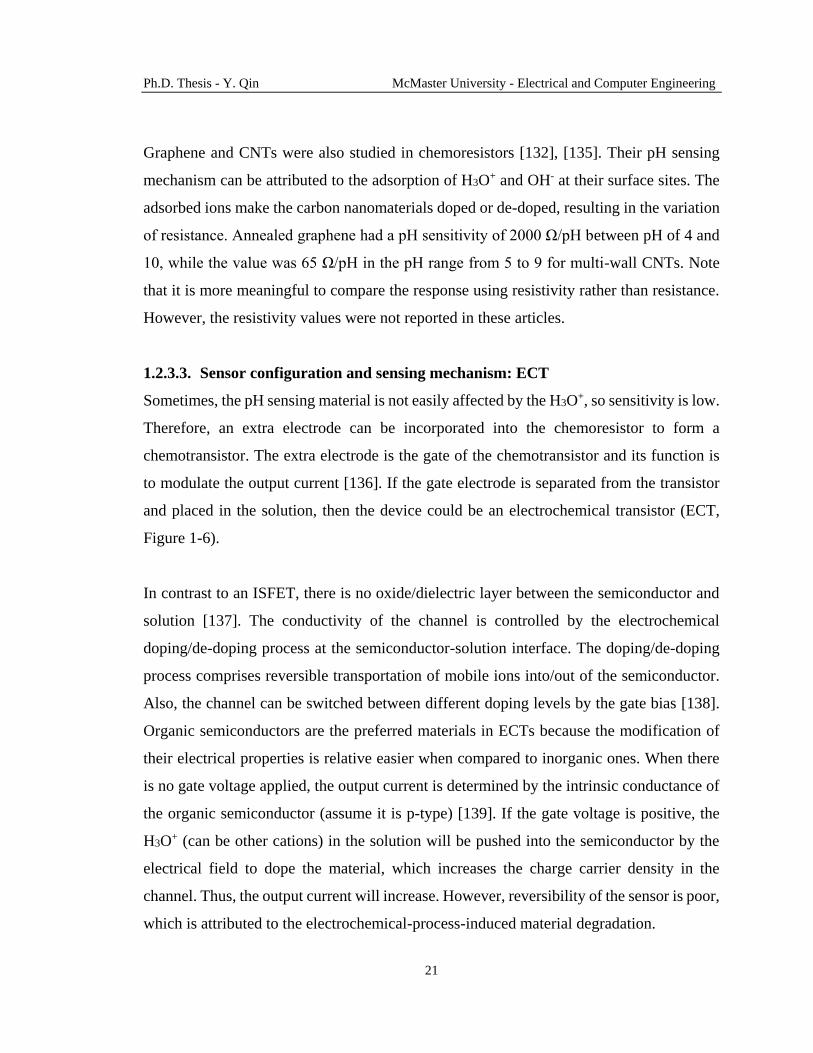
Ph.D. Thesis - Y. Qin McMaster University - Electrical and Computer Engineering
21
Graphene and CNTs were also studied in chemoresistors [132], [135]. Their pH sensing
mechanism can be attributed to the adsorption of H3O+ and OH- at their surface sites. The
adsorbed ions make the carbon nanomaterials doped or de-doped, resulting in the variation
of resistance. Annealed graphene had a pH sensitivity of 2000 Ω/pH between pH of 4 and
10, while the value was 65 Ω/pH in the pH range from 5 to 9 for multi-wall CNTs. Note
that it is more meaningful to compare the response using resistivity rather than resistance.
However, the resistivity values were not reported in these articles.
1.2.3.3. Sensor configuration and sensing mechanism: ECT
Sometimes, the pH sensing material is not easily affected by the H3O+, so sensitivity is low.
Therefore, an extra electrode can be incorporated into the chemoresistor to form a
chemotransistor. The extra electrode is the gate of the chemotransistor and its function is
to modulate the output current [136]. If the gate electrode is separated from the transistor
and placed in the solution, then the device could be an electrochemical transistor (ECT,
Figure 1-6).
In contrast to an ISFET, there is no oxide/dielectric layer between the semiconductor and
solution [137]. The conductivity of the channel is controlled by the electrochemical
doping/de-doping process at the semiconductor-solution interface. The doping/de-doping
process comprises reversible transportation of mobile ions into/out of the semiconductor.
Also, the channel can be switched between different doping levels by the gate bias [138].
Organic semiconductors are the preferred materials in ECTs because the modification of
their electrical properties is relative easier when compared to inorganic ones. When there
is no gate voltage applied, the output current is determined by the intrinsic conductance of
the organic semiconductor (assume it is p-type) [139]. If the gate voltage is positive, the
H3O+ (can be other cations) in the solution will be pushed into the semiconductor by the
electrical field to dope the material, which increases the charge carrier density in the
channel. Thus, the output current will increase. However, reversibility of the sensor is poor,
which is attributed to the electrochemical-process-induced material degradation.

Ph.D. Thesis - Y. Qin McMaster University - Electrical and Computer Engineering
22
Figure 1-6. Schematic of an ECT-based pH sensor and its sensing mechanism.
1.2.3.4. Applicable materials and sensor performance: ECT
ECT-based pH sensors generally use organic materials as the channel and sensing layer.
The influence of H3O+ on charge transport in the P3HT channel in an ECT was observed.
The output current had a 10 nA/pH response when the pH was varied between 4 and 10
[140]. However, due to the electrochemical reaction of the sensing material, the lifetime of
this ECT-based sensor was short, around 12 hours. To improve the lifetime of the sensor
by reducing material degradation and delamination, AC measurement can be used.
Poly(3,4-ethylenedioxythiophene) doped with poly(styrenesulfonate) (PEDOT:PSS) is a
conductive polymer whose conductivity can be tuned by the extra doping of H3O+ [141].
The injection of H3O+ could turn highly conductive PEDOT+ into less conductive PEDOT0.
Thus, in order to get the identical output current, the effective gate voltage had to be
increased. A pH sensitivity of 64.2 mV/pH was realized. Since reliability is of great concern
for ECT-based sensors, Single-walled CNTs were oxidized and functionalized with poly(1-
aminoanthracene) (PAA) to prepare the pH sensing material [58]. The response of the
sensor was 73 mS/pH and demonstrated a wide pH sensing range between pH of 2 and 12.
Also, very importantly, this sensor had a long lifetime of over 120 days.
Electrolyte
Reference
electrode
(gate)
Substrate
Passivation
layer
VDS
VGS
pH-sensitive
semiconductor
Source Drain
H3O+
H3O+
H3O+
H3O+
H3O+
H3O+H3O
+H3O
+
h+
h+
h+h+
h+
h+
h+
h+
h+
Hole
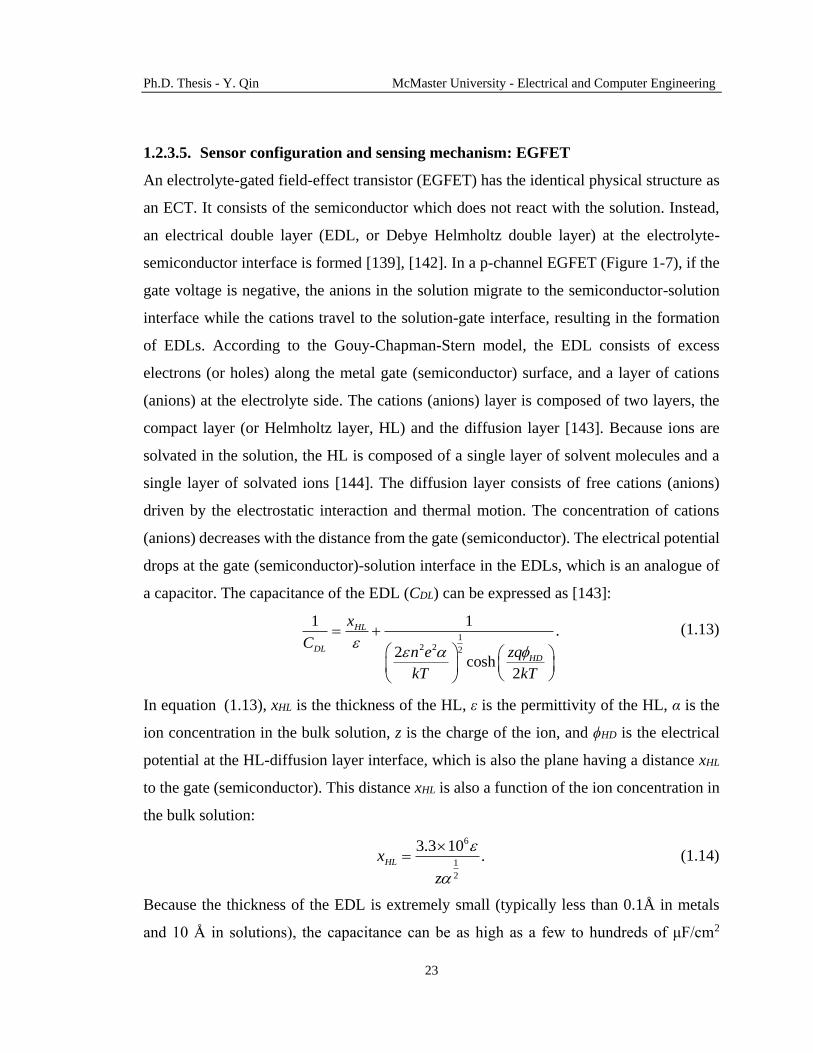
Ph.D. Thesis - Y. Qin McMaster University - Electrical and Computer Engineering
23
1.2.3.5. Sensor configuration and sensing mechanism: EGFET
An electrolyte-gated field-effect transistor (EGFET) has the identical physical structure as
an ECT. It consists of the semiconductor which does not react with the solution. Instead,
an electrical double layer (EDL, or Debye Helmholtz double layer) at the electrolyte-
semiconductor interface is formed [139], [142]. In a p-channel EGFET (Figure 1-7), if the
gate voltage is negative, the anions in the solution migrate to the semiconductor-solution
interface while the cations travel to the solution-gate interface, resulting in the formation
of EDLs. According to the Gouy-Chapman-Stern model, the EDL consists of excess
electrons (or holes) along the metal gate (semiconductor) surface, and a layer of cations
(anions) at the electrolyte side. The cations (anions) layer is composed of two layers, the
compact layer (or Helmholtz layer, HL) and the diffusion layer [143]. Because ions are
solvated in the solution, the HL is composed of a single layer of solvent molecules and a
single layer of solvated ions [144]. The diffusion layer consists of free cations (anions)
driven by the electrostatic interaction and thermal motion. The concentration of cations
(anions) decreases with the distance from the gate (semiconductor). The electrical potential
drops at the gate (semiconductor)-solution interface in the EDLs, which is an analogue of
a capacitor. The capacitance of the EDL (CDL) can be expressed as [143]:
1
2 2 2
1 1.
2cosh
2
HL
DLHD
x
Cn e zq
kT kT
(1.13)
In equation (1.13), xHL is the thickness of the HL, ε is the permittivity of the HL, α is the
ion concentration in the bulk solution, z is the charge of the ion, and ϕHD is the electrical
potential at the HL-diffusion layer interface, which is also the plane having a distance xHL
to the gate (semiconductor). This distance xHL is also a function of the ion concentration in
the bulk solution:
6
1
2
3.3 10.HLx
z
(1.14)
Because the thickness of the EDL is extremely small (typically less than 0.1Å in metals
and 10 Å in solutions), the capacitance can be as high as a few to hundreds of μF/cm2

Ph.D. Thesis - Y. Qin McMaster University - Electrical and Computer Engineering
24
(typical values are between 10 μF/cm2 and 500 μF/cm2, compared to 10 nF/cm2 for 300 nm
thick silicon dioxide) [139], which enables low operation voltage of the transistor. The pH
sensitivity is determined by the gate capacitance as a function of H3O+ concentration. When
pH increases, α decreases, x increases, Cd decreases, and the output current decreases. The
disadvantages of EGFET-based sensors include their long response time due to the
construction of the EDL, the difficulty in sensing highly acidic solutions (such as pH = 1),
as well as the poor selectivity of ions.
Figure 1-7. Schematic of an EGFET-based pH sensor and its sensing mechanism.
1.2.3.6. Applicable materials and sensor performance: EGFET
Using an EGFET, a pH response was observed in the output current when the solution pH
is between 7 and 9 [145]. In such a device, ZnO nanowires were decorated by Pd or Au
NPs, which induced quasi-spherical charge depletion regions in the 1D (nanowire)
transport channel. However, important performance parameters such as sensitivity were not
reported. Graphene, CNTs, and P3HT, deposited by low-temperature technologies were
characterized in EGFET-based pH sensors [146]–[148]. They displayed low sensitivities
around 28 mV/pH, which may be due to the instability of the materials in an aqueous
environment. However, a few-layer graphene film was grown at 1100 °C and mounted to
an EGFET as the sensing layer [149]. A sensitivity of about 100 mV/pH was achieved in
Electrolyte
Reference
electrode
(gate)
Substrate
Passivation
layer
VDS
VGS
semiconductor
Source Drain
H3O+ H3O
+H3O+ H3O
+ H3O+ H3O
+
H3O+
H3O+H3O
+
e-e- e- e-e- e- e-e- e- e- e-
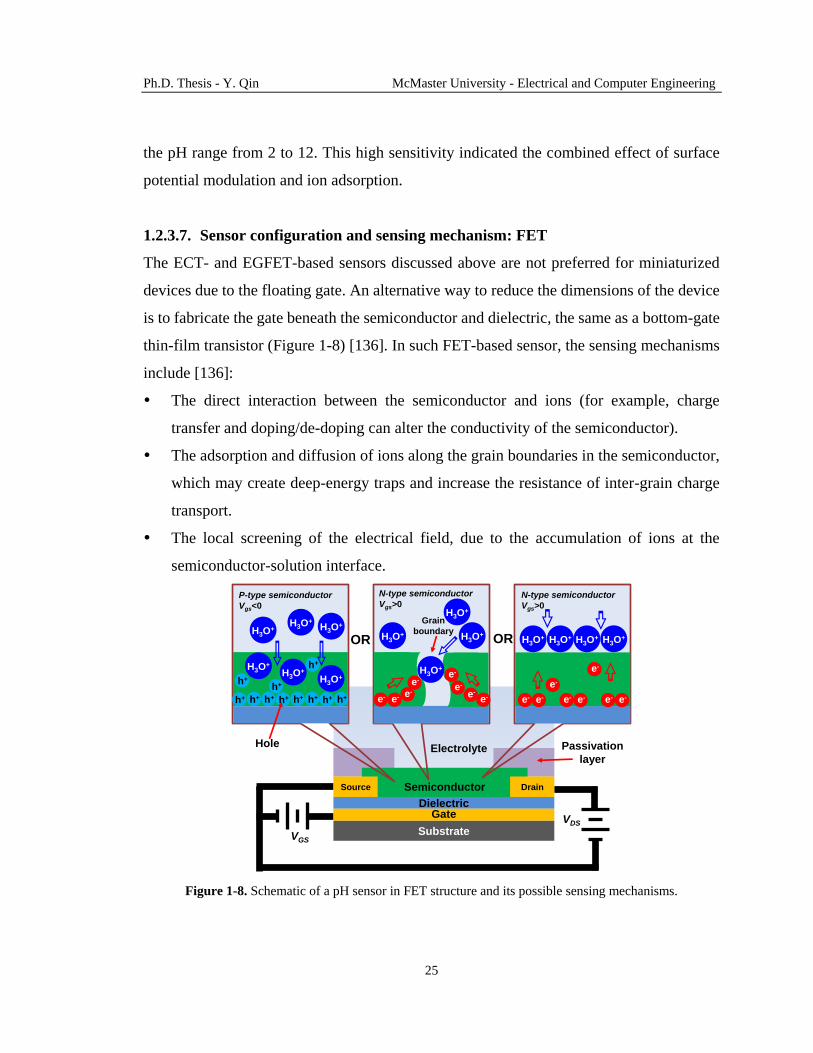
Ph.D. Thesis - Y. Qin McMaster University - Electrical and Computer Engineering
25
the pH range from 2 to 12. This high sensitivity indicated the combined effect of surface
potential modulation and ion adsorption.
1.2.3.7. Sensor configuration and sensing mechanism: FET
The ECT- and EGFET-based sensors discussed above are not preferred for miniaturized
devices due to the floating gate. An alternative way to reduce the dimensions of the device
is to fabricate the gate beneath the semiconductor and dielectric, the same as a bottom-gate
thin-film transistor (Figure 1-8) [136]. In such FET-based sensor, the sensing mechanisms
include [136]:
The direct interaction between the semiconductor and ions (for example, charge
transfer and doping/de-doping can alter the conductivity of the semiconductor).
The adsorption and diffusion of ions along the grain boundaries in the semiconductor,
which may create deep-energy traps and increase the resistance of inter-grain charge
transport.
The local screening of the electrical field, due to the accumulation of ions at the
semiconductor-solution interface.
Figure 1-8. Schematic of a pH sensor in FET structure and its possible sensing mechanisms.
Electrolyte
SubstrateVDS
VGS
DielectricGate
SemiconductorSource Drain
Passivation
layer
OR OR
H3O+
H3O+
H3O+
H3O+
H3O+
H3O+
h+
h+
h+h+ h+ h+h+ h+h+
h+
h+
P-type semiconductor
Vgs<0H3O
+
H3O+H3O
+
H3O+
e-
e- e-
e-e-e-
e-
e-
Grain
boundary
N-type semiconductor
Vgs>0N-type semiconductor
Vgs>0
H3O+ H3O
+H3O+ H3O
+
e-
e- e-
e-
e- e- e- e-
Hole

Ph.D. Thesis - Y. Qin McMaster University - Electrical and Computer Engineering
26
During operation, the gate bias and the source-drain bias are set to generate a current flow
through the channel [150]. The presence of H3O+ adsorption or interaction is subsequently
transduced to a change in the source-drain current. To make the sensing process reversible,
an opposite polarity bias can be applied to the gate to desorb the weakly bonded ions [151].
The challenges for FET-based sensors are the high operating voltage, the drift of output
current induced by gate-bias stress, and the stability of the sensing material in an aqueous
environment [152]–[154].
1.2.3.8. Applicable materials and sensor performance: FET
For FET-based sensors, a dual-gate transistor with Si nanowires as the channel on a silicon-
on-insulator platform was introduced [155]. These sensors had a sensitivity of 68 mV/pH,
but the drift rate of 27 mV/h made it unsuitable for long-term monitoring. Instead, some
organic materials with a high stability in water were developed [153], [156]. For example,
5,5-bis-(7-dodecyl-9H-fluoren-2-yl)-2,2-bithiophene was synthesized as a p-type
semiconductor that could trap diffused H3O+ in the grain boundaries [156]. The output
current of the FET responded to the change of pH value at 50 nA/pH over 104 measurement
cycles.
1.2.4. Research challenges
Although many microfabricated electrochemical pH sensors have been reported, several
challenges remain. One challenge is related to the performance of the sensors. For sensors
with sub-Nernstian response, studies should focus on improving sensitivity. Many sensors
exhibited near-Nernstian or super-Nernstian response. For these sensors, their stability and
repeatability were the major concern. The instability and poor repeatability in long-term
use most likely originate from the following phenomena:
Degradation of sensing materials.
The degradation can be either physical or chemical. Physical degradation indicates that the
sensing material at the sensor surface mechanically leaves the substrate and enters the

Ph.D. Thesis - Y. Qin McMaster University - Electrical and Computer Engineering
27
solution. This is likely to happen in a pH sensor in an online water quality monitoring
system since the flow rate of water is typically fast and it can physically impact the sensor
surface. This physical process influences the sensitivity by exposing the underlying
material which may not be as sensitive as the surface material. Also, the surface of the
sensing area may become rougher and result in a longer response time. Moreover, voids
and pinholes may be generated in the sensing film, reducing the mechanical stability and
reliability of the sensor.
Chemical degradation happens when irreversible reactions happen between the sensing
material and H3O+, or when the redox reaction is not fully reversible. In water quality
monitoring systems, treated water contains residual chlorine, which is a strong oxidizing
reagent for many organic materials. These reactions alter the chemical composition of the
sensing material which affects sensitivity, and also may introduce slow-reaction sites which
results in increased hysteresis. Both physical and chemical degradation can result in
increases in the drift rate of the sensor since the properties of the sensor surface keep
changing with time. Thus, new sensing materials with better physical and chemical stability
(except for the reversible reactions with H3O+) have to be developed.
Interference from the test solution
The interference can originate from the adsorption of other ions or from bio-fouling. pH
sensors based on ISFETs, ECTs, EGFETs, and FETs are more prone to alkaline ions since
they can be adsorbed on pH sensing surfaces. The interfering ions introduce an electrical
field to the channel of the transistor, thus affecting its output electrical characteristics. Bio-
fouling commonly happens in water quality monitoring devices. The fouling layer may
deteriorate the functionality of sensors by blocking the redox reaction between the sensing
material and H3O+, or by preventing the adsorption of H3O+ onto the sensor surface. To
reduce interference from the solution, an ion-selective membrane and an anti-fouling
coating should be applied to the surface of the sensors.

Ph.D. Thesis - Y. Qin McMaster University - Electrical and Computer Engineering
28
Instability of the electronic components
This mostly happens in pH sensors using transistor configurations with organic
semiconductors. The electrical properties of organic semiconductors change with time,
which is less stable than conventionally used silicon. As a consequence of the non-
predicable behavior of the organic semiconductor, the repeatability of the pH sensor will
be poor. Therefore, more research in the area of organic electronics is needed to obtain
stable and reliable device performance using improved organic materials.
Another challenge is related to the microfabrication technologies. The cost of the sensors
for drinking water quality monitoring should not be high. This requires the fabrication to
be cheap and use small amount of materials. Also, process conditions at high temperatures
and in vacuum environment should be avoided. Solution-based low-cost and large-area
processing is potentially promising, but the quality of deposited materials is problematic
(usually high-temperature treatment should be done after solution processing for a high-
performance sensor). Therefore, there is a trade-off between performance and cost of
sensors. High-quality sensing materials that can be deposited using cost-effective ways are
desired.
Microfabricated pH sensors based on potentiometric electrodes, ISFETs, and
chemoresistors/chemotransistors have been reviewed in terms of their physical
configurations and sensing mechanisms. The physical structures of the pH sensors are
determined by the electrical properties (such as conductivity) and chemical features (such
as solubility in water and chemical reactivity) of the sensing materials. The widely studied
sensing materials include metal oxides, ceramics, polymers, and carbon nanomaterials. The
sensing performance of microfabricated electrochemical pH sensors varies a lot (for
example, from sub-Nernstian response to super-Nernstian response). This variation could
be attributed to the intrinsic properties of the materials and their properties after processing.
Therefore, the physical design, material selection, and microfabrication conditions are three
key factors in the quest for low-cost, highly sensitive, efficient, and easy-to-use pH sensors.

Ph.D. Thesis - Y. Qin McMaster University - Electrical and Computer Engineering
29
Table 1-1. Comparison of glass pH electrodes and different types of microfabricated electrochemical pH
sensors. Advantages Disadvantages
Glass electrode 1. Wide application temperature (from
<0 °C to >100 °C)
2. Ideal Nernstian response
independent of redox interferences
3. High accuracy and resolution
(0.001 pH unit)
4. High stability and long lifetime
(several years)
1. Unstable in strong alkaline and
hydrofluoric acid solutions
2. Large in size
3. Brittle
4. Require frequent maintenance and
calibration
5. Expensive
Microfabricated
electrochemical
pH sensor
General 1. Small size
2. Easy for integration
3. Can be stored in dry condition
4. Low cost
5. Less frequent maintenance
1. Low accuracy and resolution
2. Large hysteresis and drift
3. Poor ion selectivity
4. Sometimes sensitive to light
5. Limited application temperature
6. Require water-stable sensing materials
Potentiometric
electrode
1. Simple structure
2. Power supply not needed
1. Require reference electrode
2. No internal signal amplification
ISFET 1. Semiconductor protected by
dielectric
2. Compatible with complementary
metal-oxide-semiconductor (CMOS)
fabrication process
3. Internal signal amplification
1. Require reference electrode
2. Dielectric surface difficult to be
functionalized for higher selectivity
ExGFET 1. Transistor can be used in dry
condition
2. Compatible with CMOS fabrication
process
3. Internal signal amplification
1. Require reference electrode
2. Larger size due to extended gate
Chemoresistor 1. Simple structure
2. Reference electrode not needed
1. Low reversibility
2. Poor selectivity
3. Lower sensitivity comparing to ECT
4. No internal signal amplification
ECT 1. Dielectric not needed
2. Low operation voltage
3. Higher sensitivity comparing to
chemoresistor
4. Internal signal amplification
1. Require reference electrode
2. Low reversibility
3. Poor selectivity
4. Difficult in integration
EGFET 1. Dielectric not needed
2. Low operation voltage
3. Internal signal amplification
1. Require reference electrode
2. Sensing is difficult in high-
concentration electrolyte
3. Low switching speed
4. Poor selectivity
FET 1. Compact structure
2. Easy for integration
3. Reference electrode not needed
4. Internal signal amplification
1. Require water-stable semiconductors
2. High operation voltage
3. Large hysteresis
4. Low reversibility
The conventional glass pH electrode is compared with different types of microfabricated
electrochemical pH sensors (Table 1-1). In Table A-1 (Appendix A), a listing of recent
microfabricated electrochemical pH sensors is provided. The list includes sensor structures,
Ph.D. Thesis - Y. Qin McMaster University - Electrical and Computer Engineering
30
sensing materials, key performance parameters, and corresponding fabrication processes.
It has been observed that the size and cost disadvantages of the glass electrodes stimulated
research in microfabrication of different kinds of electrochemical pH sensors. However,
further research is needed to develop new materials and microfabrication processes, as well
as to optimize their compatibility for low-cost and high-performance pH sensors.
1.3. Microfabricated electrochemical free chlorine sensors
As discussed in subsection 1.1.3, two most commonly used approaches for free chlorine
detection are DPD-based colorimetric and amperometric-based electrochemical methods.
However, their large footprint limits their applications in drinking water quality monitoring.
A briefly review of the miniaturized free chlorine sensors was given in reference [11]. It
focused on microwire-based amperometric sensors and interferometry sensors. In this
subsection, electrochemical free chlorine sensors having planar structures are reviewed due
to their potential of miniaturization and integration with microelectronic devices.
1.3.1. Amperometric sensor configuration and sensing mechanism
Amperometric sensing is based on the voltammetric sensing method, which requires three
electrodes: working, counter, and reference, for precise measurement [67]. A time-
dependent electrical potential is applied to the working electrode, while the current flowing
between the working and counter electrodes is measured (Figure 1-9). The reference
electrode is used to provide a fixed potential of the electrolyte. The potential sweep from a
small to a large value can generate a current peak if the analyte is oxidized in that potential
range. The creation of the peak is due to the oxidation of the analyte while the decline of
the peak is because of the depletion of the analyte at the electrode surface. Conversely,
when the potential sweeps from high to low, a reduction peak will be generated.

Ph.D. Thesis - Y. Qin McMaster University - Electrical and Computer Engineering
31
Figure 1-9. Schematic of an amperometric free chlorine sensor and its sensing mechanism.
In amperometric sensing, a constant potential is applied between the working and reference
electrodes and the current is monitored between the working and counter electrodes [67].
The constant potential is determined based on the position of redox peaks in the
corresponding voltammetric waveform. At the selected potential, the redox reaction of the
analyte should take place, and the interference of other ions should be avoided. The
amplitude of measured current is proportional to the analyte concentration in the solution.
In an amperometric free chlorine sensor, the working electrode is normally made of noble
metals such as Au and Pt, and is sometimes coated with a selective membrane for
hypochlorite ions. At the working electrode, free chlorine is electrochemically reduced by
applying a constant potential versus the reference electrode [157]. For example, at pH =
5.5, the reduction peak of HOCl and/or OCl- was observed at +0.4 V on a Au electrode
with respect to a Ag/AgCl reference electrode. The electrochemical reactions at the
working electrode can be written as the following equations:
- - -HOCl + 2e Cl +OH , (1.15)
- - - -
2OCl + H O+2e Cl +2OH . (1.16)
The transfer of electrons generates a current which is proportional to the free chlorine
concentration. Note that the pH, temperature, flow rate and pressure of the solution must
be carefully controlled for an accurate measurement.
Free chlorine-
sensitive film
Electrically
conductive film
Substrate for
sensing electrode
Electrolyte
Reference
electrode
Counter
electrode
A
Ve-
HOCl+2e-→Cl-+OH-
e-
HOCl
OCl-
e-
OCl-+H2O+2e-→Cl-+2OH-
e-
6H2O→O2+4H3O++4e-
e-
e-
H2O
H2O e-

Ph.D. Thesis - Y. Qin McMaster University - Electrical and Computer Engineering
32
1.3.2. Applicable materials and sensor performance
A limited range of electrode materials has been demonstrated to create miniaturized free
chlorine sensors using microfabrication technologies. For example, Au working and
counter electrodes were deposited by electron-beam evaporation on cyclic olefin
copolymer, where the Ag/AgCl reference electrode was electrochemically deposited [158].
Both electrodes were capped by microfluidic channels through which the analyte flowed.
This low-cost and disposable sensor was operated under 0.1 V bias, and had a linear
detection range of OCl- from 1.5 to 8 ppm. The current density in the counter electrode
showed a sensitivity of about 69 μA/cm2/ppm. The lifetime of this sensor was about 100 s,
which was longer than the signal stabilization time of 20 s. A stable free chlorine sensor
using a similar structure and fabrication process was developed in another study [159]. The
resulting sensitivity of 0.23 μA/ppm in the concentration range of 0.2 to 5 ppm makes this
sensor suitable for monitoring the free chlorine levels in swimming pools (lifetime >10
days, applied potential = 0.35 V). Moreover, a lower detection limit of 0.08 ppm were
realized using 0.15 V applied potential on Au electrode [35]. The sensor maintained a stable
sensitivity of 68.8 nA/ppm for over 7 days.
Pt electrodes were also used to detect free chlorine concentration and they showed similar
performance to those with Au electrodes [34], [160]. The operation voltage of a Pt electrode
is higher than that of a Au electrode because the reduction of free chlorine at a Pt electrode
happens at a higher potential. Another reason for the higher potential is to minimize the
overlap of O2 and hypochlorite reduction peaks, which is required for precise measurements
[35].
For electrodes made of materials other than noble metals, carbon has been studied due to
its chemical stability. Screen printed carbon electrode coated with potassium iodide
exhibited a sensing range up to 20 ppm for free chlorine, with a sensitivity of 0.2 μA/ppm
[161]. The sensing mechanism was based on the reaction between chlorine and iodide ions,
which produced tri-iodide ions that could be titrated using sodium thiosulphate.

Ph.D. Thesis - Y. Qin McMaster University - Electrical and Computer Engineering
33
Polymelamine has been electropolymerized onto carbon electrode to detect from 5.5 μM to
7 mM free chlorine (sensitivity of 58 μA/mM) [16]. Such an electrode exhibited an
enhanced reduction peak current, which was attributed to the reduction of the azo group (-
N=N-) and then oxidized by free chlorine in a cyclic manner. Free chlorine concentration
in swimming pool water and tap water was measured using the polymelamine/carbon-based
sensors.
In another study, a boron-doped diamond electrode showed reduced fouling rates compared
to carbon electrodes [162]. The free chlorine electrodes made of this material exhibited a
lifetime over 3 months. Recently, benzethonium chloride was used in electrochemical
deposition of Prussian Blue for a higher surface coverage on glassy carbon electrodes [163].
Free chlorine concentration between 9 ppb and 10 ppm could be detected in a short time
(<5 s) with a sensitivity of 12 μA/cm2/ppm. This is believed to be the first publication
reporting free chlorine measurement results for real water samples (tap water) using
laboratory-fabricated sensors. This sensor demonstrated a measurement accuracy over 93%.
Finally, ferrocene compounds were also electrochemically deposited on glassy carbon
electrodes to measure the concentration of ClO- [164]. However, their responses were not
linear, making it difficult to be used in real sensing applications. Recently, CuO NPs were
mixed with multi-wall CNTs in an epoxy matrix as an amperometric electrode for free
chlorine measurement [165]. CuO NPs and CNTs increased the electrocatalytic active areas
of the working electrode so that the electron transfer in the reduction of hypochlorite was
promoted. In this study, a low detection limit of ~0.6 ppb and high sensitivity of 446
nA/ppm was realized.
1.3.3. Research challenges
It can be noted that microfabricated electrochemical free chlorine sensors are not as well
developed as pH sensors. The major challenge is the lack of reversible sensing materials
for HOCl or OCl-. A promising electrochemical sensing material should either react with
free chlorine in a reversible manner, or selectively transport HOCl or OCl- to the target

Ph.D. Thesis - Y. Qin McMaster University - Electrical and Computer Engineering
34
substrate. The chemical reagents used in optical detection techniques (such as DPD) can
react with free chlorine, but the process is irreversible. While ion-selective transport
membrane exists for many ions, very few were found for HOCl or OCl- due to their
oxidizing nature. Therefore, developing advanced materials for free chlorine sensing is
urgently needed.
The limitation in sensing material forces the utilization of amperometric electrodes for
electrochemical sensing of free chlorine. Normally, cyclic voltammetry measurement has
to be done first to determine the optimized voltage bias for amperometric measurement,
which increases the difficulty in using the sensors. Moreover, dissolved O2 is electroactive
in the usual voltage range between +1 and -1 V for amperometric sensing of free chlorine.
The interference from dissolved O2 decreases the sensing accuracy. Finally, the
requirement of a potentiostat for an amperometric sensor increases the complexity as well
as the cost of the sensor. Hence, alternative sensor configurations are needed when a
suitable sensing material is available. Once the above challenges are properly addressed,
the concern for free chlorine sensors would become similar to those for pH sensors. Such
concerns include the improvement of reliability and the reduction of fabrication costs.
The literature on electrochemical free chlorine sensors is limited. Within the limited scope,
the amperometric sensors have been identified as the widely used structure for the
electrochemical detection of free chlorine. The comparison between conventional
electrochemical free chlorine sensor and microfabricated ones is given in Table 1-2.
Table 1-2. Comparison of conventional and microfabricated electrochemical free chlorine sensors.
Advantages Disadvantages
Conventional electrochemical free
chlorine sensors
1. Accurate
2. Fast response
1. Interference from pH, pressure,
flow rate, and temperature
2. Large size and difficult in
integration
Microfabricated electrochemical
free chlorine sensors
1. Eliminate electrolyte replenishment
2. Small
3. Low-cost
4. Easy integration with other sensors
1. Limited lifetime of coated
membrane
2. Low accuracy

Ph.D. Thesis - Y. Qin McMaster University - Electrical and Computer Engineering
35
A list of microfabricated electrochemical free chlorine sensors are provided in Table A-2
(Appendix B) with their structures, electrode/sensing materials, key performance
parameters, and corresponding fabrication processes. The comparison shows that more
works were focused on the optimization of working electrodes than the development of
active sensing materials. Although microfabricated free chlorine sensors can be developed
for cost-effective applications, their sensitivity varies widely and they are less accurate and
reliable than the conventional sensors. This indicates that the microfabricated
electrochemical free chlorine sensor is a challenging area of research that requires further
intensive investigations.
1.4. Research motivation
Although numerous research activities has been carried out to develop advanced pH and
free chlorine sensors (subsection 1.2 and 1.3), very few of them were ready for field
applications. This research is devoted to developing an integrated drinking water quality
monitoring system that is capable for the on-demand measurement of the pH, free chlorine
concentration, and temperature of water samples accurately and regularly. Such a drinking
water quality monitoring system should be:
Highly accurate. The system should consist of sensors that have high sensitivity,
reversibility, stability, and selectivity.
Responding in real-time. The sensors in the system should response fast towards
target analyte so that the users can obtain the results on-site.
Easy-to-use. The system should be designed for users who do not possess
comprehensive technical training. Also, the output of the system should be easily
understandable by the public.
Low-cost. A low-cost system can be distributed over a wide geographical areas, and is
affordable by individuals in underdeveloped regions.
To obtain the abovementioned goals, this research focuses on the development of
microfabricated pH, free chlorine, and temperature sensors. The proposed specifications of

Ph.D. Thesis - Y. Qin McMaster University - Electrical and Computer Engineering
36
these sensors are listed in Table 1-3. For the pH sensor, we are targeting the sensitivity
close to a commercial pH meter (59 mV/pH), which is required for a resolution of 0.1 pH.
The sensor should be usable in the pH range for common water samples (e.g. drinking,
recreation, and food processing water). The accuracy of ±0.1 pH guarantees the
distinguishing between qualified and unqualified water. For the free chlorine sensor, the
sensing range should be wide enough for different water samples. When the sensor is used
to monitor drinking water, its accuracy should be better than ±0.1 ppm. Regarding the
temperature sensor (used to compensate the pH and free chlorine sensing signals), the
accuracy of ±2.5 °C is required to ensure an accurate readout for the pH and free chlorine
sensors. Besides, all three sensors should have a short response time, a small footprint, a
stability around 1 month, a low cost, an application temperature between 0 to 40 °C, a
simple storage condition, and a low maintenance frequency.
Table 1-3. Proposed specifications for pH, free chlorine, and temperature sensors. Parameters pH Free chlorine Temperature
Sensitivity 59 mV/pH 0.1 μA/cm2/ppm 1 mV/°C
Resolution 0.1 0.1 ppm 1 °C
Sensing range 6 - 10 0 - 6 ppm 0 - 40 °C
Accuracy ±0.1 pH ±0.1 ppm ±2.5 °C
Response time <1 min
Stability ~1 month
Size <1 cm3
Cost a <$100 <$100 <$50
Storage condition Dry or water
Application temperature 0 to 40 °C
Maintenance frequency Once a month
Easy-to-use? Yes a Material and fabrication cost.
The design goals for the pH sensor are realized by using a simple two-electrode
potentiometric configuration. The sensing electrode uses metal/metal oxide due to its wide
sensing range, high sensitivity, and high stability. The reference electrode is a Ag/AgCl
electrode that provides a stable reference voltage (insensitive to pH and other common
ions). To fabricate the potentiometric sensor at a low cost, we aim to develop low-
temperature, solution-based processes that do not rely on cleanroom environment and high-
vacuum equipment. The sensors’ temporal response, sensitivity, hysteresis, drift,
temperature dependence, and selectivity are characterized.
Ph.D. Thesis - Y. Qin McMaster University - Electrical and Computer Engineering
37
The free chlorine sensor is implemented using either a chemoresistor configuration or an
amperometric configuration. The chemoresistor-based free chlorine sensor uses a
conductive polymer as the sensing material, attributed to its instability in a solution
containing free chlorine. An easy-to-implement and cost-effective process is developed to
fabricate the free chlorine sensor. The reusability, sensitivity, stability, and selectivity of
the sensor is studied for its practical applications. In this research, we also explore the
feasibility to simplify an amperometric free chlorine sensor developed by our group. The
performance of the simplified sensor in the integrated drinking water quality monitoring
system is studied.
The temperature sensor uses a Wheatstone bridge circuit to realize a high sensitivity. The
thermistors in the circuit are fabricated using the same material combinations and similar
fabrication technologies as the pH sensor. We focus on studying the effect of processing
parameters on the electrical properties of the deposited materials. Physical, thermal,
chemical, and electrical characterizations are carried out to study the electrical conduction
mechanisms in the deposited films.
Finally, this research aims to demonstrate a fully integrated drinking water quality
monitoring system using the three types of sensors. The integration process is developed to
fabricate the sensors on a common substrate. An electronic system is designed and
programmed to sample and process the sensor signals, followed by displaying the water
quality parameters.
1.5. Research contributions
The research work conducted in this thesis aims at developing an integrated, easy-to-use,
accurate, and low-cost sensing system for drinking water quality monitoring. The major
contributions of this work are summarized as follows:

Ph.D. Thesis - Y. Qin McMaster University - Electrical and Computer Engineering
38
The development of pH sensing electrodes using Pd/PdO. A spin coating process
and a low-temperature annealing process were developed and optimized to deposit
Pd/PdO thin films. The chemical composition, film morphology, surface roughness of
the films were characterized and correlated with their pH sensing properties. A linear
pH response with sensitivity of ~64.71 mV/pH was obtained for pH between 2 and 12.
Inkjet printing technologies were developed to deposit Pd, Ag, epoxy, sodium
hypochlorite (NaOCl), poly(vinyl chloride) (PVC) inks for integrated pH sensors.
A two-step thermolysis process was developed to convert the printed Pd ink to
continuous and uniform Pd films with good adhesion to different substrates. Using
only one printing pass, a low electrical resistivity of 2.6 μΩ·m of the Pd film was
obtained. Accurate pH values of real water samples were obtained by using the printed
sensors with a low-cost multimeter.
Temperature-sensitive Pd/PdO films were prepared by inkjet printing and
thermolysis in a low-vacuum environment. The film formation mechanism was
studied via morphological, chemical, and thermogravimetric characterization. The
TCR of the films can be adjusted from 0.067% /°C to -0.189% /°C by tuning the
amount of semiconductive PdO in the conduction path. Also, the humidity dependence
of the printed films was studied.
A paper-based, hand-drawn, chemoresistor-type free chlorine sensor was
developed using poly(3,4-ethylenedioxythiophene):poly(styrenesulfonate)
(PEDOT:PSS). The resistivity of PEDOT:PSS increased when it was exposed to free
chlorine in water due to oxidation reactions. The fabrication steps were all at room
temperature, required no instrumentation or equipment, and could be carried out by
untrained personnel. The fabricated sensor was mechanically stable, reusable, had a
wide sensing range, and could accurately measure free chlorine concentrations in real
water samples.
A field-programmable gate array (FPGA)-based drinking water quality
monitoring system was developed to sample, process, and display the signals from
an integrated sensor. The integrated sensor consisted of an inkjet-printed pH sensor,

Ph.D. Thesis - Y. Qin McMaster University - Electrical and Computer Engineering
39
an inkjet-printed temperature sensor, and a pencil-lead-based amperometric sensor on
a common substrate. The temperature sensor was a Wheatstone bridge circuit including
two PdO thermistors and two Ag thermistors. The sensitivity of the temperature sensor
was ~3.5 mV/°C. The amperometric free chlorine sensor was simplified to a two-
electrode configuration that eliminates the use of a potentiostat. The sensitivity of ~1
μA/cm2/ppm ensured accurate monitoring of real water samples.
Publications:
Y. Qin, S. Pan, M. M. R. Howlader, R. Ghosh, N.-X. Hu, M. J. Deen, “Portable water
quality monitoring system with integrated pH, free chlorine and temperature sensors,”
(in preparation)
Y. Qin, A. U. Alam, M. M. R. Howlader, N.-X. Hu, and M. J. Deen, “Morphology and
electrical properties of inkjet-printed palladium/palladium oxide,” J. Mater. Chem. C,
vol. 5, no. 8, pp. 1893–1902, 2017.
Y. Qin, S. Pan, M. M. R. Howlader, R. Ghosh, N.-X. Hu, and M. J. Deen, “Paper-
based, hand-drawn free chlorine sensor with poly(3,4-
ethylenedioxythiophene):poly(styrenesulfonate),” Anal. Chem., vol. 88, no. 21, pp.
10384–10389, Nov. 2016.
Y. Qin, A. U. Alam, M. M. R. Howlader, N.-X. Hu, and M. J. Deen, “Inkjet printing
of a highly loaded palladium ink for integrated, low-cost pH sensors,” Adv. Funct.
Mater., vol. 26, no. 27, pp. 4923–4933, Jul. 2016.
Y. Qin, H.-J. Kwon, A. Subrahmanyam, M. M. R. Howlader, P. R. Selvaganapathy, A.
Adronov, and M. J. Deen, “Inkjet-printed bifunctional carbon nanotubes for pH
sensing,” Mater. Lett., vol. 176, pp. 68–70, Apr. 2016.
Y. Qin, A. U. Alam, S. Pan, M. M. R. Howlader, R. Ghosh, P. R. Selvaganapathy, Y.
Wu, and M. J. Deen, “Low-temperature solution processing of palladium/palladium
oxide films and their pH sensing performance,” Talanta, vol. 146, pp. 517–524, 2016.
Y. Qin, M. M. R. Howlader, and M. Deen, “Low-temperature bonding for silicon-
based micro-optical systems,” Photonics, vol. 2, no. 4, pp. 1164–1201, Dec. 2015.

Ph.D. Thesis - Y. Qin McMaster University - Electrical and Computer Engineering
40
Y. Qin, H.-J. Kwon, M. M. R. Howlader, and M. J. Deen, “Microfabricated
electrochemical pH and free chlorine sensors for water quality monitoring: Recent
advances and research challenges,” RSC Adv., vol. 5, no. 85, pp. 69086–69109, 2015.
Y. Qin, M. M. R. Howlader, M. J. Deen, Y. M. Haddara, and P. R. Selvaganapathy,
“Polymer integration for packaging of implantable sensors,” Sensor. Actuat. B Chem.,
vol. 202, pp. 758–778, Oct. 2014.
A. U. Alam, Y. Qin, M. M. R. Howlader, and M. J. Deen, “Direct bonding of liquid
crystal polymer to glass,” RSC Adv., vol. 6, no. 109, pp. 107200–107207, 2016.
1.6. Thesis organization
In Chapter 1, an introduction to the significance of drinking water quality monitoring is
presented. The recent research activities in microfabricated electrochemical pH and free
chlorine sensors are discussed and compared with conventional pH and free chlorine meters.
Then, the motivation of developing accurate, easy-to-use, and low-cost drinking water
quality monitoring systems is presented. Finally, a brief summary of the main contributions
of this research and the structure of this thesis are given.
In Chapter 2, a solution-processed Pd/PdO-based pH sensing electrode is presented. Details
of fabrication approaches, material characterization methods, and sensor characterization
set-ups used in this research are given. In particular, efforts are devoted to studying the
sensing mechanisms, and to optimizing the sensor performance in terms of sensitivity,
response time, hysteresis, and stability. The optimal sensor performance is obtained by
tuning the fabrication parameters such as the thermolysis temperature of the precursor
solution and the annealing time of the deposited Pd film. We find that the chemical
composition of the sensing electrode determines the sensitivity, the surface roughness
affects the response time, and the nano-morphology decides the stability of the electrode.
In Chapter 3, an inkjet printing process for a highly loaded Pd ink is developed to deposit
and pattern Pd thin films for an integrated pH sensor. The formulation of the Pd ink is

Ph.D. Thesis - Y. Qin McMaster University - Electrical and Computer Engineering
41
described, and a two-step thermolysis step is used to convert the printed ink to continuous,
uniform, and highly conductive Pd films with good adhesion to different substrates. Also,
solid-state reference electrodes are inkjet-printed with the use of Ag, epoxy, NaOCl, and
PVC inks. Accurate pH values of real water samples are obtained by using the printed
sensors with a low-cost multimeter
In Chapter 4, the effect of thermolysis atmosphere for the inkjet-printed Pd ink on the film
morphology and electrical properties is studied. The morphology, chemical composition,
crystal structure, and thermogravimetric property of the deposited films is analyzed. A thin
film formation mechanism is also proposed. The TCR of the films can be adjusted from
0.067% /°C to -0.189% /°C by tuning the amount of semiconductive PdO in the conduction
path, so that the films can be used as temperature sensors. For the application of water
quality monitoring, the electrical stability of the films is studied under different humidity
levels. The surface-adsorbed hydroxyl groups and/or molecular water increases the
resistance drift of the films.
In Chapter 5, a free chlorine sensor is drawn by hand on a paper substrate. The sensor
design, sensing mechanism, and operation method is discussed with a focus on the practical
use of the sensor. The mechanical stability, sensing range, reusability, sensitivity,
selectivity, and stability of the sensor is characterized. Also, the measurement results for
real water samples are presented. We show that the sensor is of great significance for
drinking water quality monitoring in less developed areas where fabrication facilities,
analytical equipment, and trained personnel are limited, but the need for analytical devices
is critical.
In Chapter 6, an integrated drinking water quality monitoring system is presented. Such a
system includes an inkjet-printed pH sensor discussed in Chapter 3, a Wheatstone-bridge-
based temperature sensor fabricated by the inkjet printing Pd/PdO and Ag, and a free
chlorine sensor. The free chlorine sensor is a simplified version of an amperometric sensor

Ph.D. Thesis - Y. Qin McMaster University - Electrical and Computer Engineering
42
with an amine-modified pencil lead as the sensing electrode. The three sensors are
fabricated on a common substrate and their sensing performance is characterized. A
programmed FPGA board is used as the user interface to sample, process, and display the
sensor signals.
In Chapter 7, this thesis is concluded with a summary of the research and several
recommendations for future improvements for pH, free chlorine, temperature sensors, and
the integrated sensing system for drinking water quality monitoring.

Ph.D. Thesis - Y. Qin McMaster University - Electrical and Computer Engineering
43
Chapter 2
Solution-processed Pd/PdO: pH sensing
mechanisms and properties*
Highly sensitive, easy-to-fabricate, and low-cost pH sensors with small dimensions are
required for drinking water quality monitoring. In this chapter, a low-temperature, solution-
based process is developed to prepare Pd/PdO thin films for pH sensing. A precursor
solution for Pd is spin coated onto pre-cleaned glass substrates and annealed at low
temperature to generate Pd and PdO. The percentages of PdO at the surface and in the bulk
of the electrodes are correlated to their sensing performance, which is studied using X-ray
photoelectron spectroscopy. Large amounts of PdO introduced by prolonged annealing
improve the electrode’s sensitivity and long-term stability. Atomic force microscopy study
showed that the low-temperature annealing results in a smooth electrode surface, which
contributed to a fast response. Nano-voids at the electrode surfaces are observed by
scanning electron microscopy, indicating a reason for the long-term degradation of the pH
sensitivity. Using the optimized annealing parameters of 200 °C for 48 h, a linear pH
response with sensitivity of 64.71 ± 0.56 mV/pH is obtained for pH between 2 and 12.
These electrodes showed a response time shorter than 18 s, hysteresis less than 8 mV and
stable operation for more than 60 days.
* Adapted with permission from Y. Qin, A. U. Alam, S. Pan, M. M. R. Howlader, R. Ghosh, P. R.
Selvaganapathy, Y. Wu, and M. J. Deen, “Low-temperature solution processing of palladium/palladium oxide
films and their pH sensing performance,” Talanta, vol. 146, pp. 517–524, 2016. Copyright (2016) Elsevier
(Appendix E).

Ph.D. Thesis - Y. Qin McMaster University - Electrical and Computer Engineering
44
2.1. Background
pH sensors are of significant importance for regular/continued monitoring of drinking water
quality [11]. Since conventional glass pH electrodes are fragile, large in dimensions
(typically in the centimeter range), difficult to handle, and require frequent calibration and
maintenance [11], [22], it is challenging to apply them in confined spaces for continuous
use in many environmental monitoring applications. Therefore, small-size, easy-to-use, and
low-cost pH sensors with sensitive and reliable performance are needed. Among the various
types of pH sensors that include chemical-mechanical sensors, optical sensors, ion-
sensitive field-effect transistor-based sensors, and resistor-based sensors [57]–[59], [166],
the potentiometric sensor is one of the most commonly studied configurations owing to its
straightforward and compact structure, potential for miniaturization, ease in fabrication and
integration, low power consumption, as well as compatibility with both organic and
inorganic materials.
The pH sensing behavior of a number of metal oxides were studied for potentiometric
sensors. For example, CuO [75], IrOx [70]–[72], Co3O4 [76], WO3 [77], [167], RuO2 [78],
TiO2 [168], ZnO [169], PdO [126], and PbOx [79] were used in pH sensors. Among these
materials, PdO is promising due to its demonstrated higher (super-Nernstian) sensitivity
than that of many materials. Also, it has fast response (<10 s) in a wide sensing range of
pH between 2 and 12, and long lifetime (up to several years) [126], [170]–[172]. However,
the fabrication of high-quality PdO films at low temperature and low cost is challenging.
Currently, thermal oxidation [171], [173], physical vapor deposition [126], [174], [175]
and electrochemical deposition [170], [176], [177] are being used to fabricate Pd/PdO films.
In these processes, the challenges are the requirements of high temperatures (above 400 °C),
vacuum environment and high electrical energy. Moreover, it is challenging to pattern
electrodes on electrochemically deposited films because of the requirements of masks and
additional lithographic steps [71], [72], [178], [179]. These process conditions are
incompatible with the development of cost-effective pH sensors on inexpensive polymeric

Ph.D. Thesis - Y. Qin McMaster University - Electrical and Computer Engineering
45
substrates [180], as well as their integration with electronics for sensing systems [181].
Thus, alternative approaches for material deposition such as low-temperature solution
processing have to be employed. Earlier, screen-printed Pd was investigated for
electrochemical sensing [182]. The fabricated electrodes were porous and contained PdO,
but they were not pH sensitive. On the other hand, while solution-processed IrOx [72], TiO2
[119] and ZnO [95] were reported for pH sensors, so far, PdO-based pH sensing electrodes
have not yet been prepared from solution.
In the following subsections, details of fabrication approaches, material characterization
methods, and sensor characterization set-ups used in this research are given. The Pd/PdO
pH sensing electrodes were fabricated using a simple, low-temperature, and low-cost
solution-based process. Pd precursor solution was spin coated onto glass substrates,
followed by annealing in ambient air at low temperatures. The annealing process converted
organic Pd complex to metallic Pd and further oxidized Pd to PdO. We optimized the
processing parameters and characterized the fabricated Pd/PdO films to achieve high
quality of sensing electrodes. Potentiometric measurements were used to characterize the
pH sensing performance of the electrodes. Also, we investigated their reproducibility and
long-term stability.
2.2. Experimental set-up
2.2.1. Chemicals and reagents
Isopropanol (IPA, 8600-1), acetic acid (HOAc, 1000-1), potassium sulfate (K2SO4, 6760-
1-70), zinc chloride (ZnCl2, 9120-1), and toluene (PhMe, 9200-1) were purchased from
Caledon Laboratory Chemicals. Isobutylbenzene (IBB, 113166), sodium hypochlorite
(NaOCl) solution (239305), a poly(3,4-ethylenedioxythiophene):poly(styrenesulfonate)
(PEDOT:PSS) solution (483095), silver chloride (AgCl, 227927), poly(vinyl chloride)
(PVC, 389293), cyclohexanone (C102180), phosphoric acid (H3PO4, 695017), boric acid
(H3BO3, 339067), phosphate buffered saline (PBS) tablet (P4417), sodium chloride (NaCl,

Ph.D. Thesis - Y. Qin McMaster University - Electrical and Computer Engineering
46
793566), sodium acetate (NaOAc, S2889), sodium phosphate dibasic (Na2HPO4, S0876),
potassium sulfate (K2SO4, 221325), ammonium carbamate (292834), propylene glycol
monomethyl ether acetate (PGMEA, 484431), Triton™ X-100 (X-100), and sodium
hydroxide (NaOH) pellets (S5881) were from Sigma-Aldrich. Pd precursor solution (Pd-
25c) and silver nanoparticle (Ag NP) ink (xcm-nsIJ) were obtained from Xerox Research
Centre of Canada. Urea (URE001.1) was from BioShop. Potassium chloride (KCl,
PX1405), sodium carbonate (Na2CO3, SX0395-1), sodium bicarbonate (NaHCO3, SX0320-
1), ammonium sulfate ((NH4)2SO4, AX1385-3), and magnesium chloride (MgCl2,
MX0045-2) were from EMD Millipore. Potassium nitrate (KNO3, 74336-300) was from
Anachemia. Calcium chloride (CaCl2, C77-500), copper(II) sulfate pentahydrate
(CuSO4·5H2O, C493-500), and ethylene glycol (E178-500) were from Fisher Scientific.
SU-8 3035 photoresist was purchased from MicroChem. Conductive Ag paste (product No.
CI-1001) was purchased from Engineered Materials Systems Inc.
Britton-Robinson pH buffer solutions (pH = 2, 4, 5, 6, 7, 8, 9, 10, and 12) were prepared
by mixing an acid solution comprising 0.04 M H3PO4, 0.04 M HOAc, 0.04 M H3BO3 with
an appropriate amount of 0.2 M NaOH solution. The pH levels of the buffer solutions were
monitored by a commercial pH meter (PHB-600R, OMEGA) with a glass electrode
(PHE1311, OMEGA) during preparation.
Free chlorine solutions with different concentrations were prepared by diluting the as-
received NaOCl solution using a PBS solution (0.01 M, pH = 7.4). The free chlorine
concentrations of the prepared solutions were calibrated using a DPD-based colorimetric
test kit (CN-70, Hach).
2.2.2. Methods for characterizing solutions and thin films
2.2.2.1. Characterization of solution properties
The surface tension of different solutions was measured using a tensiometer (K100, Krüss)
at 22 °C in ambient conditions. About 15 mL of the solution equilibrated to 22 °C was

Ph.D. Thesis - Y. Qin McMaster University - Electrical and Computer Engineering
47
transferred to a pre-cleaned and dust-free crystallizing dish (diameter = 48 mm, height =
30 mm) and placed in the tensiometer equipped with a Wilhelmy plate. The surface tension
data was averaged from 30 to 60 s after the immersion of the Wilhelmy plate. The viscosity
of different solutions was measured using a rheometer (RFS3, TA Instruments).
To obtain the solution viscosity, a shear rate sweep run was carried out both clockwise and
counter clockwise at 25 °C, and the average viscosity was calculated. The rate sweep was
from 1 /s to 400 /s in the low-to-high sweep, and 400 /s to 1 /s in high-to-low sweep. Before
the initial low-to-high rate sweep, the sample was equilibrated for 300 s. The high-to-low
rate sweep has an equilibration time of 120 s right after the low-to-high rate sweep.
The solid content of different solutions was measured using a thermogravimetric (TG)
analyzer (Q5000 IR, TA Instruments) with Pt pans as solution carriers. Two temperature
profiles were used. For the 1-step profile, the temperature was increased from room
temperature to 200 °C at 80 °C/min, followed by an isothermal step at 200 °C for 4 min.
Then, the temperature was increased to 250 °C at 80 °C/min. For the 2-step profile, the
temperature was increased from room temperature to 120 °C at 80 °C/min, followed by an
isothermal step at 120 °C for 1 min. Next, the temperature was increased to 200 °C at
80 °C/min, followed by an isothermal step at 200 °C for 4 min. Then, the temperature was
increased to 250 °C at 80 °C/min. All measurements were done under nitrogen (N2) purge
(25 mL/min).
2.2.2.2. Physical characterization of deposited thin films
The thickness of the deposited thin films was measured by using a stylus profiler (Dektak
XT, Bruker). A pair of stainless steel tweezers was used to gently scratch the deposited thin
film to expose the substrate. The stylus was scanned at a speed of 50 μm/s between the
exposed substrate and the thin film with 3 mg applied force.

Ph.D. Thesis - Y. Qin McMaster University - Electrical and Computer Engineering
48
The pattern of the deposited thin films was observed using a stereo microscope (AZ100,
Nikon). The surface morphology of the thin films was observed using field-emission
scanning electron microscopy (SEM, SU-8000, Hitachi) with a landing voltage of 700 V
and 200 V for Pd/PdO on glass and PEDOT:PSS on paper, respectively. The surface
morphology of the Pd/PdO thin films was also observed using field-emission SEM (JSM-
7001F, JEOL) with an acceleration voltage of 10 kV and emission current of ~80 μA. Thin-
film X-ray diffraction (XRD) patterns were obtained on a Rigaku MiniFlex diffractometer
using copper Kα (λ = 0.15418 nm) radiation. The XRD patterns were used to calculate the
size of the crystallites in the deposited thin films.
Atomic force microscopy (AFM, Dimension Icon, Bruker) was used to measure the surface
roughness of the thin films. The AFM measurements were based on tapping mode with 20
μm × 20 μm and 1 μm × 1 μm scanning areas using a 1 Hz scanning rate. The surface
roughness was calculated using NanoScope Analysis software.
To check the adhesion between deposited thin films and substrates, water rinse tests were
performed by rinsing the thin films under tap water (flow rate ~3 m/s) for 60 s. Scotch tape
test was performed manually by pressing transparent scotch tapes (S-9782, 3M) onto the
thin films firmly and pulling off slowly. The delamination of printed films in both cases
was visually observed.
2.2.2.3. Chemical characterization of deposited thin films
X-ray photoelectron spectroscopy (XPS, JPS-9200, JEOL) was used to analyze the
chemical composition of sensing electrodes. Narrow-scan spectra (resolution of 0.1 eV)
were obtained using a magnesium X-ray source (10 keV and 15 mA). Depth profiling
spectra were acquired after every 40 s of argon (Ar) ion etching (3 keV and 20 mA) at a
pressure of 0.08 Pa. Four etching steps were carried out at one analysis location. XPSPEAK
4.1 software was used for curve fitting and to calculate the area under peaks to determine
the films’ chemical composition.

Ph.D. Thesis - Y. Qin McMaster University - Electrical and Computer Engineering
49
Raman spectra were recorded on Renishaw inVia Raman spectrometer with an excitation
wavelength of 633 nm. The obtained spectra were an accumulation of 10 measurements.
Fourier transform infrared (FTIR) spectra of the thin film surfaces were recorded using a
spectrometer (Vertex 70, Bruker) coupled to a microscope (Hyperion 3000, Bruker) with
an attenuated total reflection objective.
The PdO content in the printed Pd/PdO thin films were measured using a Q5000 IR (TA
Instruments) thermogravimetric (TG) analyzer with Pt pans as powder carriers. About 15
mg Pd/PdO powder was obtained by scraping thin films off from glass substrates. The TG
analysis was performed from room temperature to 950 °C at a temperature ramp rate of
20 °C/min with a N2 purge (20 mL/min).
2.2.2.4. Electrical characterization of deposited thin films
The resistance of deposited thin films was measured by a semiconductor analyzer (4200-
SCS, Keithley) equipped with a probe station (S-1160, Signatone) using the 4 point probe
method. The measurement bias current was 1 mA to minimize self-heating. The resistance
of deposited thin films was also measured in vacuum (~10-6 mbar) at varying temperatures
using a probe station (ST-500, Janis Research) equipped with a temperature control unit
(Model 9700, Scientific Instruments). A reliability test chamber (ESL-2CA, ESPEC) was
used to provide an ambient measurement environment with varying temperatures and
relative humidity (RH) levels.
Bending tests were carried out using a tensile pulling tester (AG-X, Shimadzu) by
compressing the deposited thin films (2 cm 4 cm, on a flexible substrate) by 1 cm
(bending radius ~1.6 cm) at a speed of 1 mm/s. The bending tests were performed cyclically
at a frequency of 0.05 Hz (once every 20 seconds). The electrical resistance of the thin film
during bending was measured simultaneously using a semiconductor parameter analyzer
(4200-SCS, Keithley).

Ph.D. Thesis - Y. Qin McMaster University - Electrical and Computer Engineering
50
2.2.3. Solution processing of Pd/PdO pH sensing electrodes
The glass substrates (7525M, J. Melvin Freed Brand microscope slides) were manually cut
into 2.5 cm × 3.8 cm pieces using a diamond scriber, followed by rinsing with IPA and
deionized (DI) water, and then dried under compressed dry air (Figure 2-1(a)). About 0.5
mL of the Pd precursor solution (used without further purification) was dispensed onto
glass substrates using a pipette and left settling for 2 min before spin coating. The coating
was performed at 500 rpm for 10 s with 800 rpm/s acceleration and subsequently 3000 rpm
for 60 s with 800 rpm/s acceleration (Figure 2-1(b)). Then, the samples were baked on a
hotplate, in ambient air, at different temperatures (200 °C and 250 °C) and for different
durations (4 min, 24 h, and 48 h) (Figure 2-1(c)). The area of the sensing electrode was
~9.5 cm2. After annealing, the electrodes were characterized (Figure 2-1(d)).
Figure 2-1. (a)-(c) Fabrication process of Pd/PdO-based pH sensing electrodes. (a) Glass substrate cleaning
by rising with IPA and DI water. (b) Spin coating of Pd precursor solution. (c) Pd precursor conversion by
baking and sample annealing at different conditions. (d) Characterization set-up for pH sensing behavior of
fabricated electrodes.
The fabrication of pH sensing electrodes was straightforward, including spin coating and
annealing in ambient air. The annealing temperature of 200 °C was decided based on two
reasons. First, such temperature should be higher than the decomposition temperature of
IPA DI water
Glass substrate Pd precursor Pd/PdO
(a) (b) (c)
0
100
200
300
400
500
600
700
800
900
0 5 10 15 20 25
Pote
ntia
l V
s. A
g/A
gC
l (m
V)
Time (min)
pH buffer
Reference
electrode
Sensing
electrode
(d)
Substrate cleaning Precursor
spin coating
Annealing
Potentiometric testing
Sensing
electrode

Ph.D. Thesis - Y. Qin McMaster University - Electrical and Computer Engineering
51
the Pd precursor (~190 °C). Second, a low annealing temperature is preferred to allow the
precursor being processed on a wide range of substrates (e.g. low-cost polymeric
substrates). The annealing included 2 steps: a short-term conversion step and a long-term
oxidation step. In the conversion step, the clear light-yellow precursor solution turned to
black color within 1 min upon heating, indicating the precursor decomposition and the
formation of Pd NPs. After annealing for another 1 to 2 min, metallic silver color appeared
because of the fusing of Pd NPs to a thin film. Since the conversion was performed in air,
a certain amount of PdO was produced in this step. In addition, good adhesion between the
deposited Pd/PdO films and the glass substrate were confirmed by scotch tape tests.
To study the effect of PdO percentage on the pH sensing behavior, the samples were
annealed in air for 4 min, 24 h, and 48 h at 200 °C. Another conversion and annealing
temperature (250 °C) was used to accelerate the generation of PdO for 4 min, 24 h, and 48
h. In total, 6 groups of samples (A to F) were prepared and are listed in Table 2-1. The
average thickness (taken over 5 locations) of a sample annealed at 200 °C for 4 min was
85.7 nm. The Pd/PdO thin films became thicker if a higher annealing temperature or a
longer annealing time was used. The increased thickness was attributed to the volume
expansion induced by the generation of PdO.
Table 2-1. Summary of preparation conditions, thickness, chemical composition, and performance
parameters of pH sensing electrodes. Sample
ID
Annealing
temperature, °C
Annealing
time Thickness, nm
PdO% at
the surface
PdO% in
the bulk
pH sensitivity,
mV/pH Linearity a
A 200 4 min 85.7 ± 4.9 51% 18% 54.53 ± 1.70 0.9988
B 200 24 h 121.3 ± 7.2 82% 47% 68.93 ± 1.74 0.9995
C 200 48 h 125.1 ± 5.9 98% 49% 64.71 ± 0.56 0.9991
D 250 4 min 93.6 ± 5.3 89% 26% 65.64 ± 1.46 0.9996
E 250 24 h 125.0 ± 6.2 97% 49% 64.62 ± 1.65 0.9993
F 250 48 h 125.3 ± 4.0 99% 53% 63.19 ± 1.47 0.9994 a Linearity is compared using the correlation coefficient R2.
2.2.4. Set-up for pH sensing tests
The pH sensing performance of the fabricated electrodes/sensors was characterized based
on a potentiometric configuration against a Ag/AgCl reference electrode with 1 M KCl

Ph.D. Thesis - Y. Qin McMaster University - Electrical and Computer Engineering
52
filling solution (CHI111, CH Instruments). The bottom half of the sensing electrode and
reference electrode (~2 cm distance between them) was immersed in static pH buffer
solutions at the same time and connected to a Keithley 4200-SCS semiconductor analyzer
using alligator clamps. The semiconductor analyzer was set for measuring the open circuit
voltage by forcing the current flowing through the sensing and reference electrodes to be 0
A with a “Best Fixed” source range. This voltage sampling interval was defined to be 2 or
6 s. The deposited Pd/PdO was used for the dual purpose of sensing as well as electrical
contact because it was electrically conductive. The open circuit potential between the
sensing and reference electrode was recorded as a function of time at room temperature (27
± 2 °C). The sensing electrodes were tested in each pH buffer for ~80 s and immediately
transferred into the next pH buffer without rinsing with DI water or drying.
2.3. Characterization of Pd/PdO thin films
2.3.1. Chemical composition
The chemical composition at the surface and in the bulk of deposited Pd/PdO electrodes
was characterized by XPS. XPS spectra for the surface were obtained without Ar ion
etching while those for the bulk were measured after 160 s of etching (etch rate ~0.44 nm/s,
XPS spectra after 40 s of etching are identical at each location for analysis). Figure 2-2(a-
d) show XPS spectra of Pd 3d region for the surface and bulk of sensing electrodes annealed
at 6 different conditions.
For the surface of the electrode prepared at 200 °C for 4 min (sample A), peaks for Pd 3d5/2
and Pd 3d3/2 doublet were at binding energies around 334.90 eV and 340.22 eV,
respectively (Figure 2-2(a), solid line). These peak positions indicate the presence of
metallic Pd (Pd0) [183], [184]. Noteworthy, shoulders could be observed on the left side
(high-energy side) of Pd peaks, which suggests the existence of Pd2+ because PdO has been
considered as a stable oxide form of Pd [37]. In the bulk of the same sample (Figure 2-2(b),

Ph.D. Thesis - Y. Qin McMaster University - Electrical and Computer Engineering
53
solid line), peaks for Pd 3d5/2 and Pd 3d3/2 do not shift, but the shoulders are less obvious,
designating a smaller amount of Pd2+.
Figure 2-2. (a-d) Pd 3d XPS spectra of the surface and bulk of sensing electrodes annealed at different
temperatures for 4 min (solid lines), 24 h (dot-dash lines), and 48 h (dashed lines). (a) Surface, 200 °C. (b)
Bulk, 200 °C. (c) Surface, 250 °C. (d) Bulk, 250 °C. (e) and (f) Curve fitting of XPS spectra for calculating
atomic ratio between Pd0 and Pd2+; square boxes are original data, solid lines are fitted curves, dotted lines
are fitted peaks for Pd0 and Pd2+, and dashed lines are background lines. (e) Surface of a sample annealed at
200 °C for 48 h (the intensity of 2 Pd0 peaks is too low to be seen). (f) Bulk of the same sample annealed at
200 °C for 48 h.
330335340345350
Inte
ns
ity (
a.u
.)
Binding Energy (eV)
330335340345350
Inte
ns
ity (
a.u
.)
Binding Energy (eV)
330335340345350
Inte
ns
ity (
a.u
.)
Binding Energy (eV)
330335340345350
Inte
nsit
y (
a.u
.)
Binding Energy (eV)
332334336338340342344346
Inte
ns
ity (
a.u
.)
Binding Energy (eV)332334336338340342344346
Inte
nsity (
a.u
.)
Binding Energy (eV)
250
C200
Csurface bulk
(a)
(c)
(b)
(d)
4 min
24 h
48 h
Pd 3d3/2 Pd 3d5/2 Pd 3d3/2 Pd 3d5/2
200
C a
nn
eale
d f
or
48 h (e) (f)Pd 3d3/2 Pd 3d5/2
4 min
24 h
48 h
4 min
24 h
48 h
4 min
24 h
48 h
Pd 3d3/2 Pd 3d5/2
Pd2+ Pd0 Pd2+ Pd0
Pd2+ Pd0 Pd2+ Pd0
Pd2+ Pd0 Pd2+ Pd0
Pd2+ Pd0 Pd2+ Pd0

Ph.D. Thesis - Y. Qin McMaster University - Electrical and Computer Engineering
54
Next, we studied the effects of annealing on the film properties. With increasing annealing
times, peaks for Pd 3d5/2 and Pd 3d3/2 shift to higher binding energies for both surface and
bulk spectra. This shift can be explained by the increased amount of Pd2+. For the sample
annealed at 250 °C for 4 min (sample D, Figure 2-2(c), solid line), Pd2+ is the major surface
composition because peaks for Pd 3d5/2 and Pd 3d3/2 have higher binding energies than the
sample annealed at 200 °C for 4 min. In its bulk spectrum (Figure 2-2(d), solid line), we
can also observe a significant amount of Pd2+. Longer annealing time at 250 °C resulted in
slightly shifted peaks to the high-energy side (sample E and F, Figure 2-2(c) and (d), dot-
dash and dashed lines), which means that the amount of Pd2+ gradually reaches saturation.
To quantitatively find the atomic percentage of Pd2+, the XPS spectra of Pd 3d doublet were
fitted using 4 peaks (each of Pd 3d3/2 and Pd 3d5/2 was fitted by one Pd0 and one Pd2+ peak).
Figure 2-2(e) and (f) shows the curve fitting of the surface and bulk spectra of the sample
annealed at 200 °C for 48 h (sample C). The atomic percentage of Pd2+ (PdO) for all types
of electrodes were calculated and are listed in Table 2-1. At the beginning of annealing, the
amount of PdO at the surface and in the bulk increased quickly (compare sample A and D
with B and E), since O2 in air diffused into the film and reacted with metallic Pd. Later, it
was more difficult for O2 to diffuse into the film because the surface became denser.
Therefore, the difference in PdO% between the 48h-annealed and 24h-annealed samples
was not significant (compare sample B and E with C and F). Besides, the time for PdO
formation can be shortened by using higher annealing temperature, or annealing in an
oxidation atmosphere, such as in O2.
2.3.2. Surface morphology
Figure 2-3 shows AFM images that illustrate the surface roughness of the sensing
electrodes prepared at different temperatures. Similar roughness values were obtained on
samples annealed at the same temperature for different durations. When the precursor was
converted to Pd at 200 °C, the nucleation and coalescence of generated Pd/PdO
nanoparticles, together with the decomposition of organic compounds, introduced peaks

Ph.D. Thesis - Y. Qin McMaster University - Electrical and Computer Engineering
55
and valleys in the deposited film [185]. The resulting surface roughness for the electrodes
annealed at 200 °C had a root-mean-square (RMS) value of 8.1 ± 1.1 nm over a 20 μm ×
20 μm area (3 measurements were done on each sample). Figure 2-3(a) shows an example
of an electrode annealed at 200 °C for 48 h. Its RMS roughness was 8.2 nm. Elevating the
conversion temperature to 250 °C resulted in a faster solvent evaporation. Thus,
agglomerates with smaller sizes were formed, and more peaks/valleys with larger
amplitudes were created. The formation of such rough surfaces was due to the fast solvent
evaporation, which shortened the time for self-leveling and smoothening of the film [186].
Hence, a higher surface roughness (RMS value of 17.9 ± 3.0 nm) was observed for the
electrode annealed at 250 °C. The AFM image of an electrode annealed at 250 °C for 48 h
(sample F) is shown in Figure 2-3(b). The RMS roughness of the sample was 18.0 nm.
The surface morphology was analyzed in more detail by shrinking the scanning area to 1
μm × 1 μm (Figure 2-3(c)). Similar AFM images were obtained for the electrodes annealed
at all 6 different conditions (RMS roughness was 1.7 ± 0.4 nm). As one example,
nanoparticles with diameters around 10 nm were densely packed at the surface of the
electrode annealed at 200 °C for 48 h. The RMS value of the surface roughness in this case
is 1.30 nm.
Figure 2-3. (a-b) AFM images over a 20 μm × 20 μm area of surfaces of pH sensing electrodes annealed at
(a) 200 °C; (b) 250 °C for 48 h. (c) AFM image over a 1 μm × 1 μm area of surfaces of a pH sensing electrode
annealed at 200 °C for 48 h.
SEM observations were done in addition to AFM measurements. Voids of nanoscale
dimensions are observed among crystal domains in all samples. These voids were probably
generated by the decomposition of organic compounds in the precursor. Inside the crystal
domains, Pd/PdO nanoparticles are closely fused, which agrees with the results from AFM
(a)
0 μm
20 μm20 μm
130 nm
RRMS = 8.2 nm
0 nm
(b)
0 μm
20 μm20 μm
RRMS = 18.0 nm
130 nm
0 nm
(c)
0 μm
1 μm1 μm
RRMS = 1.30 nm
9.37 nm
0 nm

Ph.D. Thesis - Y. Qin McMaster University - Electrical and Computer Engineering
56
analysis. With an increase of the annealing time from 4 min to 48 h, a less porous film was
obtained. Also, the size and amount of nano-voids were reduced (compare Figure 2-4(a)
with Figure 2-4(c)). With an increase of the annealing temperature from 200 °C to 250 °C,
a denser film could be obtained as well. Figure 2-4(d) is the surface of an electrode annealed
at 250 °C for 4 min, which appears to be similar to the surface of the electrode annealed at
200 °C for 48 h. Moreover, the annealing time does not affect the surface morphology when
annealed at 250 °C (Figure 2-4(e-f)). Thus, a dense electrode surface with few nano-voids
can be produced by increasing the annealing time or by elevating the annealing temperature.
Figure 2-4. SEM images of surfaces of sensing electrodes annealed at (a) 200 °C for 4 min. (b) 200 °C for
24 h. (c) 200 °C for 48 h. (d) 250 °C for 4 min. (e) 250 °C for 24 h. (f) 250 °C for 48 h.
2.3.3. pH sensing mechanism
Even though the pH sensing behavior of Pd/PdO electrodes was studied for many years,
the sensing mechanism is still not fully understood [187]. According to a previous study
(c) (d)
(a)
500 nm
500 nm500 nm
(e) (f)
(b)
500 nm
500 nm500 nm
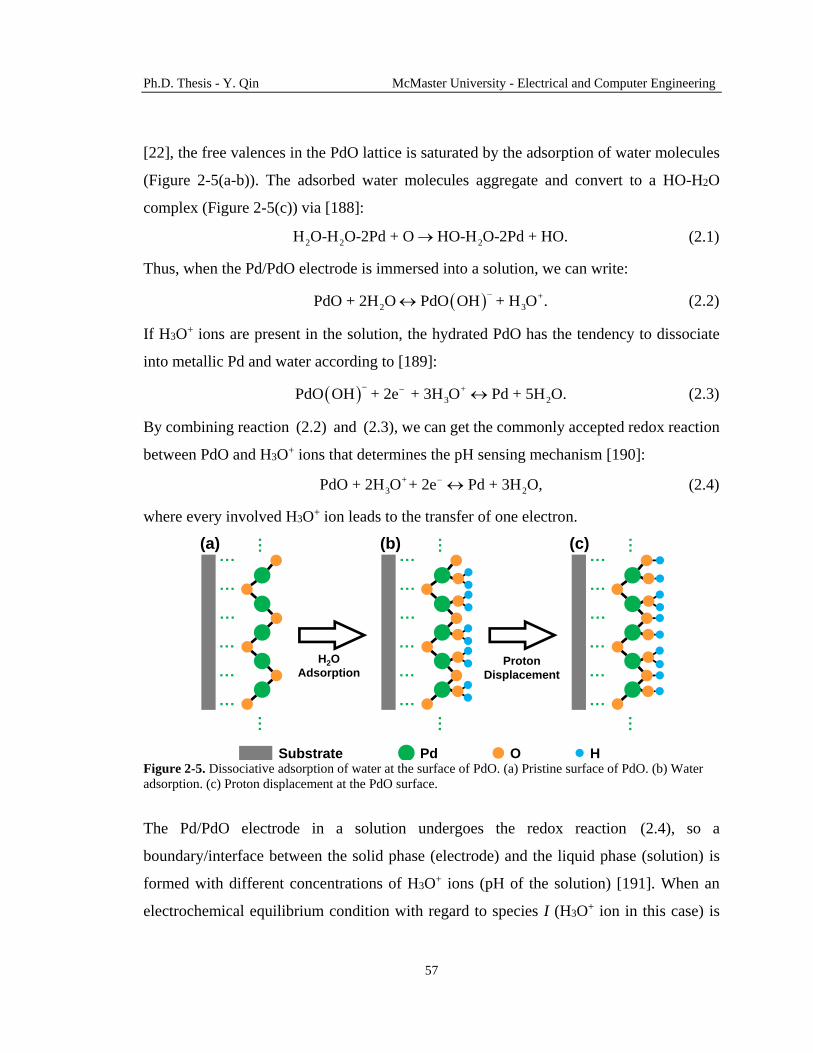
Ph.D. Thesis - Y. Qin McMaster University - Electrical and Computer Engineering
57
[22], the free valences in the PdO lattice is saturated by the adsorption of water molecules
(Figure 2-5(a-b)). The adsorbed water molecules aggregate and convert to a HO-H2O
complex (Figure 2-5(c)) via [188]:
2 2 2H O-H O-2Pd + O HO-H O-2Pd + HO. (2.1)
Thus, when the Pd/PdO electrode is immersed into a solution, we can write:
+
2 3PdO + 2H O PdO OH + H O .
(2.2)
If H3O+ ions are present in the solution, the hydrated PdO has the tendency to dissociate
into metallic Pd and water according to [189]:
+
3 2PdO OH + 2e + 3H O Pd + 5H O. (2.3)
By combining reaction (2.2) and (2.3), we can get the commonly accepted redox reaction
between PdO and H3O+ ions that determines the pH sensing mechanism [190]:
+
3 2PdO + 2H O + 2e Pd + 3H O, (2.4)
where every involved H3O+ ion leads to the transfer of one electron.
Figure 2-5. Dissociative adsorption of water at the surface of PdO. (a) Pristine surface of PdO. (b) Water
adsorption. (c) Proton displacement at the PdO surface.
The Pd/PdO electrode in a solution undergoes the redox reaction (2.4), so a
boundary/interface between the solid phase (electrode) and the liquid phase (solution) is
formed with different concentrations of H3O+ ions (pH of the solution) [191]. When an
electrochemical equilibrium condition with regard to species I (H3O+ ion in this case) is
…
…
…
…
…
…
……
…
…
…
…
…
…
……
…
…
…
…
…
…
……
H2O
AdsorptionProton
Displacement
Pd O HSubstrate
(a) (b) (c)

Ph.D. Thesis - Y. Qin McMaster University - Electrical and Computer Engineering
58
reached at the boundary, the value of the electrochemical potential μ of this species is the
same in the solution phase (μI
sol) and in the electrode phase (μI
ele) [192]:
.sol ele
I I (2.5)
The electrochemical potential of a species located in a certain part within the phase relates
to the chemical potential (μI) of this species and the electrical potential (ϕ) in this part of
the phase [192]:
,I I Iz F (2.6)
where zI is the charge number of the species, and F is Faraday’s constant. Combining
equation (2.5) and (2.6), we obtain the boundary potential (ϕb) at equilibrium:
,ele sol
ele sol I Ib
Iz F
(2.7)
where ϕele and ϕsol is the electrical potential of the electrode phase and the solution phase,
respectively. On the other hand, the chemical potential of a charged species in a system is
defined as the partial Gibbs free energy (G) of the system related to species I [193]:
, ,
,
J I
I
I p T n
dG
dn
(2.8)
where p, T, and nI denotes the pressure, the absolute temperature, and the number of moles,
respectively. Thus, the chemical potential of I is the partial derivative of the Gibbs free
energy over the number of moles of I at a constant pressure, temperature, and numbers of
moles of all other species in the system. Note that the Gibbs free energy can only be
determined by the difference in G (ΔG) between the current state and some standard state
G0:
0 ,G G G (2.9)
where G0 = U0 – TS0, with U0 and S0 is the internal energy and the entropy of the system at
the standard state, respectively. Because U0 and S0 are extensive values that are proportional
to the mass of the system, then:
0
0
, ,
0.
J I
I
I p T n
dG
dn
(2.10)
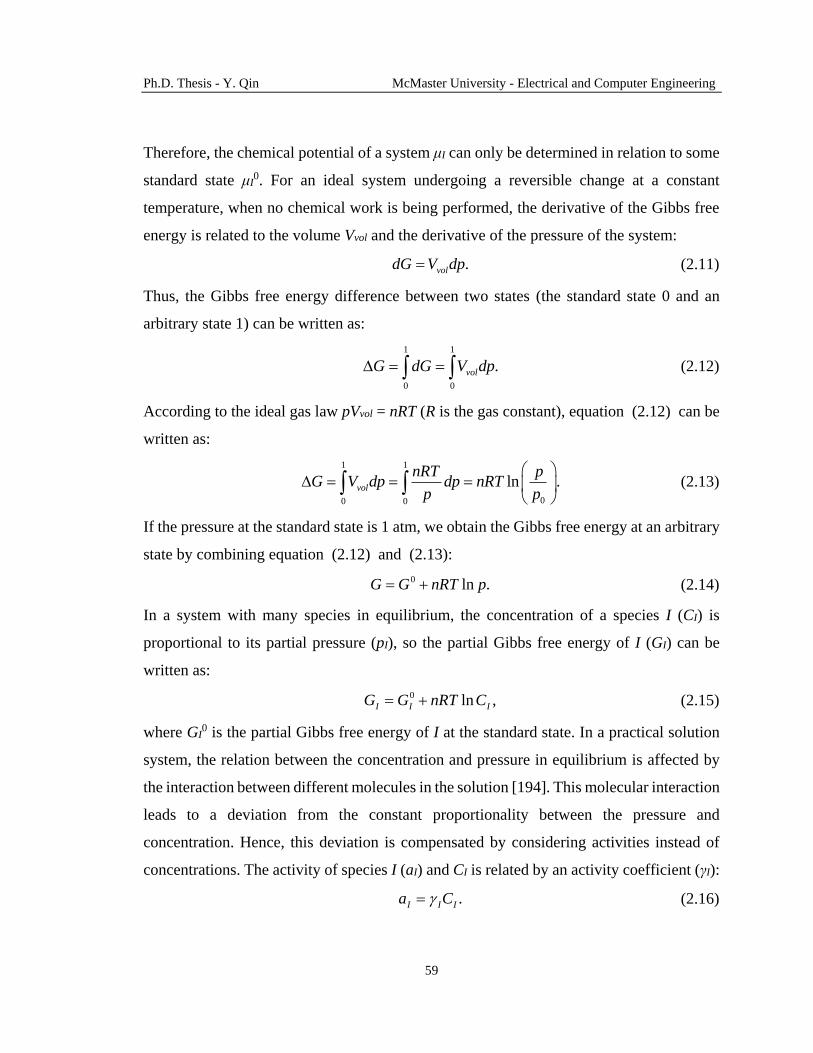
Ph.D. Thesis - Y. Qin McMaster University - Electrical and Computer Engineering
59
Therefore, the chemical potential of a system μI can only be determined in relation to some
standard state μI0. For an ideal system undergoing a reversible change at a constant
temperature, when no chemical work is being performed, the derivative of the Gibbs free
energy is related to the volume Vvol and the derivative of the pressure of the system:
.voldG V dp (2.11)
Thus, the Gibbs free energy difference between two states (the standard state 0 and an
arbitrary state 1) can be written as:
1 1
0 0
.volG dG V dp (2.12)
According to the ideal gas law pVvol = nRT (R is the gas constant), equation (2.12) can be
written as:
1 1
00 0
ln .vol
nRT pG V dp dp nRT
p p
(2.13)
If the pressure at the standard state is 1 atm, we obtain the Gibbs free energy at an arbitrary
state by combining equation (2.12) and (2.13):
0 ln .G G nRT p (2.14)
In a system with many species in equilibrium, the concentration of a species I (CI) is
proportional to its partial pressure (pI), so the partial Gibbs free energy of I (GI) can be
written as:
0 ln ,I I IG G nRT C (2.15)
where GI0 is the partial Gibbs free energy of I at the standard state. In a practical solution
system, the relation between the concentration and pressure in equilibrium is affected by
the interaction between different molecules in the solution [194]. This molecular interaction
leads to a deviation from the constant proportionality between the pressure and
concentration. Hence, this deviation is compensated by considering activities instead of
concentrations. The activity of species I (aI) and CI is related by an activity coefficient (γI):
.I I Ia C (2.16)

Ph.D. Thesis - Y. Qin McMaster University - Electrical and Computer Engineering
60
In water quality monitoring applications, the water samples in most cases are diluted
solutions. The activity coefficient (γI) approaches unity so that equation (2.15) still can be
used. Thus, the chemical potential can be determined by combining equation (2.8), (2.10),
and (2.15):
0 ln .I I IRT C (2.17)
Then, the electric potential difference between the electrode and solution (the boundary
potential) can be calculated by using equation (2.7) and (2.17):
0, 0,
0ln ln ,ele sol ele ele
ele sol I I I Ib sol sol
I I I I I
RT C RT C
z F z F C z F C
(2.18)
which is known as the Nernst equation. CIele and CI
sol is the concentration of species I in
the electrode phase and the solution phase, respectively. ϕ0 = -(μI0,ele - μI
0,sol)/zIF represents
the standard electrode potential, and is used to simplify the equation. For a solid-state
Pd/PdO pH sensing electrode without a liquid junction, the diffusion potential can be
neglected, and the electrode potential is approximately the boundary potential. Referring to
the sensing mechanism shown in reaction (2.4), we can consider the concentrations for the
Pd (solid phase), PdO (solid phase), and water as unity [195]. Because the H3O+ ion in the
solution is the target analyte to be monitored, the Pd/PdO electrode potential can be
expressed by:
0 +
/ 3ln H O .Pd PdO
RT
F (2.19)
According to the definition of pH in equation (1.1), equation (2.19) can be rewritten as:
0
/
2.303pH.Pd PdO
RT
F (2.20)
In a potentiometric sensing set-up shown in Figure 2-1(d), the open-circuit potential
between the Pd/PdO sensing electrode and the Ag/AgCl/KCl reference electrode is the
output sensing signal, which can be calculated by:
0
/ / / / /
2.303pH ,Pd PdO Ag AgCl KCl Ag AgCl KCl
RTE
F (2.21)
Ph.D. Thesis - Y. Qin McMaster University - Electrical and Computer Engineering
61
where ϕAg/AgCl/KCl is the electrode potential of a commercial reference electrode (CRE,
CHI111, CH Instruments, with 1 M KCl filling solution) used in this study, which is a fixed
value of ~0.235 V. Therefore, the expression for the sensor output is:
0 02.303 2.303
pH 0.235 pH,RT RT
E EF F
(2.22)
where E0 = ϕ0 - 0.235 (V) is the standard potential for the sensing electrode with respect to
the reference electrode. At 25 °C, the slope of the E-pH plot is 2.303RT/F = 59.16 mV/pH,
which defines the theoretical pH sensitivity.
2.3.4. pH sensitivity
pH sensing electrodes prepared under 6 different conditions (A to F in Table 2-1) were
characterized potentiometrically by recording the open circuit potential in Briton-Robinson
buffer solutions with pH values of 2, 4, 6, 7, 8, 10, and 12. Four consecutive measurement
cycles (2 to 12 to 2 to 12 to 2) were performed and the average potential values were plotted
versus pH. The plots in Figure 2-6 were used to determine the pH sensitivity of fabricated
electrodes. Sensitivity values calculated from these plots are summarized in Table 2-1. For
the sample annealed at 200 °C for 4 min, a relatively lower sensitivity and linearity was
obtained. Such sensing behavior can be attributed to the relatively small fraction of PdO at
the electrode surface, where the redox reaction takes place, compared to the samples
annealed for longer times or higher temperatures. Although metallic Pd is also sensitive to
pH, its sensing mechanism is believed to be different from that of PdO [196]. Metallic Pd
exhibited poorer sensitivity in basic solutions than in acid solutions, which lowered its
sensitivity and linearity over the pH range of 2 to 12 (Figure 2-6(a)).
If the samples were annealed at a higher temperature or for a longer time, the electrode
surfaces consisted of >80% PdO and super-Nernstian response (sensitivity higher than
59.16 mV/pH) could be observed, as shown in Table 2-1. The super-Nernstian behavior of
Pd/PdO sensing electrodes was reported previously [126], [170], but a detailed explanation
for this phenomenon was lacking.

Ph.D. Thesis - Y. Qin McMaster University - Electrical and Computer Engineering
62
Figure 2-6. Open circuit potential versus pH values for an electrode annealed at (a) 200 °C for 4 min. (b)
200 °C for 24 h. (c) 200 °C for 48 h. (d) 250 °C for 4 min. (e) 250 °C for 24 h. (f) 250 °C for 48 h.
We believe that this super-Nernstian behavior of Pd/PdO is similar to that observed in
solution-processed IrOx pH sensing electrodes. The origin of such super-Nernstian response
in IrOx electrodes was described in detail in reference [71]. We believe that oxides of Pd
(PdOx) and IrOx may possess similar behavior. It was found that PdOx can be hydrous [197]
and Pd may have higher valence in its oxides (for example, PdO2) [198]. Hence, the super-
Nernstian response of Pd/PdO electrodes may be attributed to the uptake/release of H3O+
of hydrous PdOx without transferring electrons. The most common hydroxides of palladium
(Pd(OH)2 and Pd(OH)4) can convert between each other according to [190]:
Sensitivity = 64.71±0.56 mV/pH
R2 = 0.99910
100
200
300
400
500
600
700
800
900
0 2 4 6 8 10 12 14
Po
ten
tial V
s. A
g/A
gC
l,
mV
pH
Sensitivity in acid= 58.14 5.35 mV/pHR²= 0.9999
Sensitivity in base=52.055 2.21 mV/pHR²= 0.9989
0
100
200
300
400
500
600
700
800
900
0 2 4 6 8 10 12 14
Po
ten
tial V
s. A
g/A
gC
l,
mV
pH
Sensitivity = 68.93 1.74 mV/pHR2 = 0.9995
0
100
200
300
400
500
600
700
800
900
0 2 4 6 8 10 12 14
Po
ten
tial V
s. A
g/A
gC
l,
mV
pH
Sensitivity = 65.64 1.46 mV/pHR2 = 0.9996
0
100
200
300
400
500
600
700
800
900
0 2 4 6 8 10 12 14
Po
ten
tial V
s. A
g/A
gC
l,
mV
pH
Sensitivity = 64.62 1.65 mV/pHR2 = 0.9993
0
100
200
300
400
500
600
700
800
900
0 2 4 6 8 10 12 14
Po
ten
tial V
s. A
g/A
gC
l,
mV
pH
Sensitivity = 63.1 1.47 mV/pHR2 = 0.9994
0
100
200
300
400
500
600
700
800
900
0 2 4 6 8 10 12 14
Po
ten
tial V
s. A
g/A
gC
l,
mV
pH
±±
(a) (b)
(c) (d)
(e) (f)
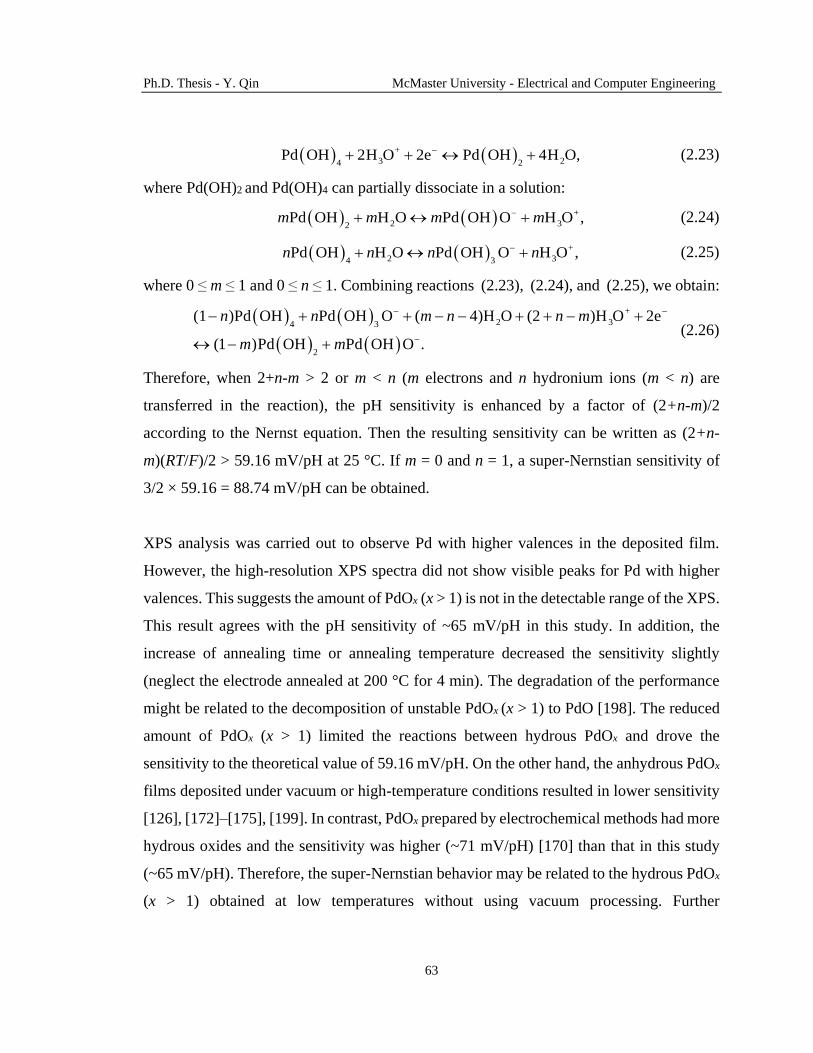
Ph.D. Thesis - Y. Qin McMaster University - Electrical and Computer Engineering
63
+
3 24 2Pd OH 2H O 2e Pd OH 4H O, (2.23)
where Pd(OH)2 and Pd(OH)4 can partially dissociate in a solution:
+
2 32Pd OH H O Pd OH O H O ,m m m m (2.24)
+
2 34 3Pd OH H O Pd OH O H O ,n n n n (2.25)
where 0 ≤ m ≤ 1 and 0 ≤ n ≤ 1. Combining reactions (2.23), (2.24), and (2.25), we obtain:
+
2 34 3
2
(1 )Pd OH Pd OH O ( 4)H O (2 )H O 2e
(1 )Pd OH Pd OH O .
n n m n n m
m m
(2.26)
Therefore, when 2+n-m > 2 or m < n (m electrons and n hydronium ions (m < n) are
transferred in the reaction), the pH sensitivity is enhanced by a factor of (2+n-m)/2
according to the Nernst equation. Then the resulting sensitivity can be written as (2+n-
m)(RT/F)/2 > 59.16 mV/pH at 25 °C. If m = 0 and n = 1, a super-Nernstian sensitivity of
3/2 × 59.16 = 88.74 mV/pH can be obtained.
XPS analysis was carried out to observe Pd with higher valences in the deposited film.
However, the high-resolution XPS spectra did not show visible peaks for Pd with higher
valences. This suggests the amount of PdOx (x > 1) is not in the detectable range of the XPS.
This result agrees with the pH sensitivity of ~65 mV/pH in this study. In addition, the
increase of annealing time or annealing temperature decreased the sensitivity slightly
(neglect the electrode annealed at 200 °C for 4 min). The degradation of the performance
might be related to the decomposition of unstable PdOx (x > 1) to PdO [198]. The reduced
amount of PdOx (x > 1) limited the reactions between hydrous PdOx and drove the
sensitivity to the theoretical value of 59.16 mV/pH. On the other hand, the anhydrous PdOx
films deposited under vacuum or high-temperature conditions resulted in lower sensitivity
[126], [172]–[175], [199]. In contrast, PdOx prepared by electrochemical methods had more
hydrous oxides and the sensitivity was higher (~71 mV/pH) [170] than that in this study
(~65 mV/pH). Therefore, the super-Nernstian behavior may be related to the hydrous PdOx
(x > 1) obtained at low temperatures without using vacuum processing. Further

Ph.D. Thesis - Y. Qin McMaster University - Electrical and Computer Engineering
64
investigation is required to understand the detailed mechanism of the super-Nernstian
behavior of the Pd/PdO pH sensing electrodes.
2.3.5. Response time
Response time and reversibility of Pd/PdO sensing electrodes were studied by continuous
testing. The electrodes were tested in each pH buffer for about 80 s and immediately
transferred into the next pH buffer without rinsing with DI water or blow drying. The open
circuit potential as a function of time for the electrode annealed at 200 °C for 48 h is plotted
in Figure 2-7(a) with an enlarged view in Figure 2-7(b). Smooth transition of the potential
signals could be observed. The response time (t90 in Figure 2-7(b)), which is defined as the
time required for 90% change of measured voltage from initial values to final values (ΔV90
in Figure 2-7(b)), can be extracted from Figure 2-7(a).
For our sensing electrodes, the response time was less than 18 s for all pH values, but this
response time is longer than the values reported in other studies (less than 2 s) [70], [74].
The faster response achieved in these studies relied on a smoother and denser electrode
surface, which was prepared by high-temperature or high-pressure treatment. These process
conditions are not compatible with low-cost, flexible substrates. In our case, this response
time of <18 s is fast enough for practical use in applications such as drinking water quality
monitoring. Also, such relatively slower response may be due to the diffusion of H3O+ ions
into the nano-voids among Pd/PdO crystal domains (shown in Figure 2-4) [68], [74], [75].
Further, the response was slightly faster in the acid region than in the basic region. This
difference was explained in reference [173] as due to some minor reaction (such as the
reaction between Pd and hydroxide ions) that happens at the electrode surface. Comparing
the electrodes annealed at different temperatures, the response time is shorter when
electrodes were annealed at 200 °C (<18 s) than at 250 °C (<30 s) (see Table 2-2 and Figure
2-8 for the detailed values of response time of different electrodes at various pH levels).
This faster response may be related to the smoother electrode surface, which allows faster
redox equilibrium between Pd/PdO and H3O+ ions at surface and buried sites [200].
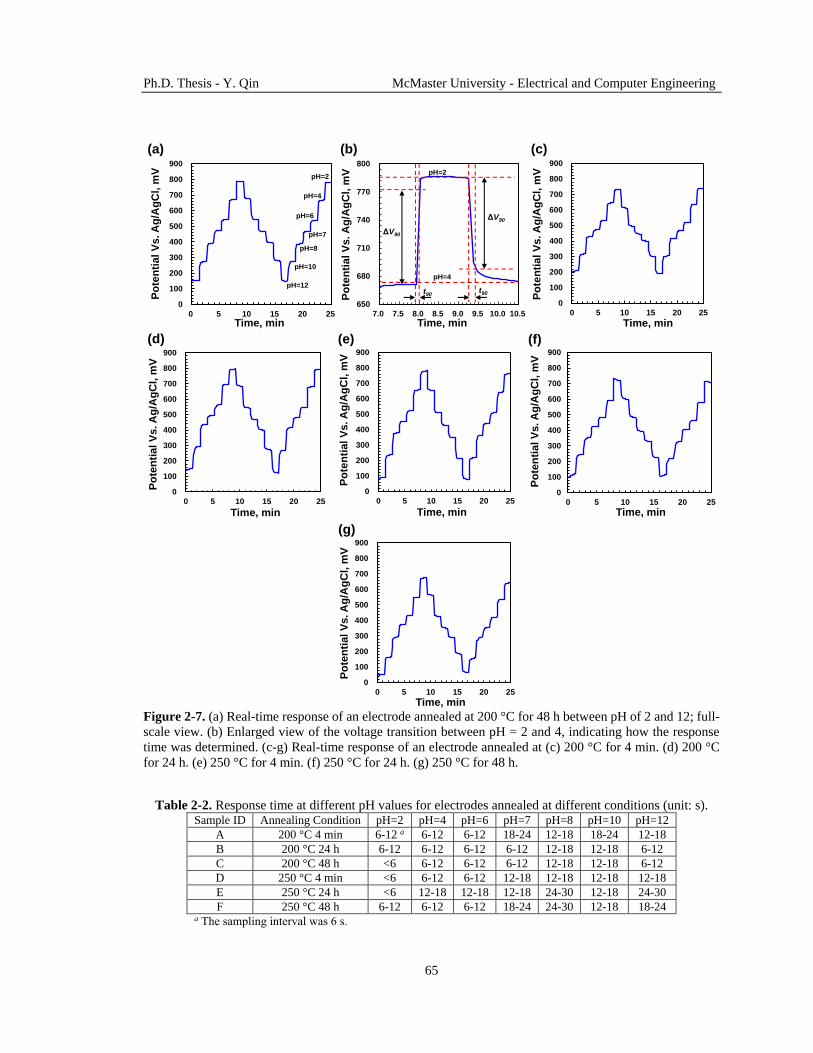
Ph.D. Thesis - Y. Qin McMaster University - Electrical and Computer Engineering
65
Figure 2-7. (a) Real-time response of an electrode annealed at 200 °C for 48 h between pH of 2 and 12; full-
scale view. (b) Enlarged view of the voltage transition between pH = 2 and 4, indicating how the response
time was determined. (c-g) Real-time response of an electrode annealed at (c) 200 °C for 4 min. (d) 200 °C
for 24 h. (e) 250 °C for 4 min. (f) 250 °C for 24 h. (g) 250 °C for 48 h.
Table 2-2. Response time at different pH values for electrodes annealed at different conditions (unit: s). Sample ID Annealing Condition pH=2 pH=4 pH=6 pH=7 pH=8 pH=10 pH=12
A 200 °C 4 min 6-12 a 6-12 6-12 18-24 12-18 18-24 12-18
B 200 °C 24 h 6-12 6-12 6-12 6-12 12-18 12-18 6-12
C 200 °C 48 h <6 6-12 6-12 6-12 12-18 12-18 6-12
D 250 °C 4 min <6 6-12 6-12 12-18 12-18 12-18 12-18
E 250 °C 24 h <6 12-18 12-18 12-18 24-30 12-18 24-30
F 250 °C 48 h 6-12 6-12 6-12 18-24 24-30 12-18 18-24 a The sampling interval was 6 s.
0
100
200
300
400
500
600
700
800
900
0 5 10 15 20 25
Po
ten
tial V
s. A
g/A
gC
l, m
V
Time, min
pH=2
pH=4
pH=6
pH=7
pH=8
pH=10
pH=12
(a)
650
680
710
740
770
800
7.0 7.5 8.0 8.5 9.0 9.5 10.0 10.5
Po
ten
tial V
s. A
g/A
gC
l, m
V
Time, min
pH=2
pH=4
ΔV90
ΔV90
t90t90
(b)
0
100
200
300
400
500
600
700
800
900
0 5 10 15 20 25
Po
ten
tial V
s. A
g/A
gC
l, m
V
Time, min
0
100
200
300
400
500
600
700
800
900
0 5 10 15 20 25
Po
ten
tial V
s. A
g/A
gC
l, m
V
Time, min
0
100
200
300
400
500
600
700
800
900
0 5 10 15 20 25
Po
ten
tial V
s. A
g/A
gC
l, m
V
Time, min
0
100
200
300
400
500
600
700
800
900
0 5 10 15 20 25
Po
ten
tial V
s. A
g/A
gC
l, m
V
Time, min
0
100
200
300
400
500
600
700
800
900
0 5 10 15 20 25
Po
ten
tial V
s. A
g/A
gC
l, m
V
Time, min
(c)
(d) (e) (f)
(g)

Ph.D. Thesis - Y. Qin McMaster University - Electrical and Computer Engineering
66
Figure 2-8. Response time at different pH values for electrodes annealed at different conditions.
2.3.6. Reversibility and drift
The hysteresis at each pH level was calculated to examine the reversibility behavior of the
sensing electrode. For the electrode annealed at 200 °C for 48 h, hysteresis less than 7.81
mV (1.24% as the normalized value over the testing pH range) at all pH levels was obtained,
indicating that the redox reaction between PdO and H3O+ ion was highly reversible.
Furthermore, no apparent correlation was found between annealing conditions and
hysteresis characteristics (see Table 2-3 and Figure 2-9 for detailed values of hysteresis of
different electrodes at various pH levels).
Table 2-3. Hysteresis at different pH values for electrodes annealed at different conditions. Sample
ID
Annealing
condition pH=2 pH=4 pH=6 pH=7 pH=8 pH=10 pH=12
A 200 °C
4 min
Absolute value, mV 6.93 8.40 7.41 6.57 10.88 13.56 24.35
Normalized value 1.29% 1.56% 1.38% 1.22% 2.03% 2.52% 4.53%
B 200 °C
24 h
Absolute value, mV 16.70 9.94 2.02 14.56 16.34 9.75 15.28
Normalized value 2.43% 1.45% 0.29% 2.12% 2.38% 1.42% 2.22%
C 200 °C
48 h
Absolute value, mV 4.12 5.22 5.21 7.81 6.00 4.63 3.58
Normalized value 0.65% 0.83% 0.83% 1.24% 0.95% 0.73% 0.57%
D 250 °C
4 min
Absolute value, mV 3.05 2.45 5.86 14.12 16.74 0.76 32.04
Normalized value 0.46% 0.37% 0.89% 2.15% 2.55% 0.12% 4.88%
E 250 °C
24 h
Absolute value, mV 9.24 10.29 13.66 13.69 4.04 2.71 2.33
Normalized value 1.56% 1.74% 2.31% 2.31% 0.68% 0.46% 0.39%
F 250 °C
48 h
Absolute value, mV 3.11 12.03 3.21 9.88 7.61 5.00 10.50
Normalized value 5.17% 2.00% 0.53% 1.65% 1.27% 0.83% 1.75%
0
5
10
15
20
25
30
pH=2 pH=4 pH=6 pH=7 pH=8 pH=10 pH=12
Re
sp
on
se t
ime, s
Test conditions
200 °C 4 min 200 °C 24 h
200 °C 48 h 250 °C 4 min
250 °C 24 h 250 °C 48 h

Ph.D. Thesis - Y. Qin McMaster University - Electrical and Computer Engineering
67
Figure 2-9. Hysteresis at different pH values for electrodes annealed at different conditions.
In addition, the electrode annealed at 200 °C for 48 h was continuously monitored in the
pH = 7 buffer solution for ~18 h. The drift rate of ~3.25 mV/h of this electrode was
comparable with Pd/PdO pH sensing electrodes prepared from thermal oxidation [126],
[172]. As a consequence, we suggest the optimized process condition for the Pd/PdO pH
sensing electrode was annealing at 200 °C for 48 h.
2.3.7. Stability
The stability of pH sensing electrodes is essential for their long-term usage, and can be
categorized into operation stability and storage stability. The operation stability was studied
by carrying out pH measurements every few days over a 60-day period. Each pH
measurement involved 4 pH cycles (2 to 12 to 2 to 12 to 2) with a measurement time of 80
s at each pH level, after which, the average sensitivity was recorded. The electrodes were
stored in ambient air at room temperature without any maintenance or special precaution.
The evolution of the sensitivity values for electrodes (annealed at 200 °C for 48 h, 250 °C
for 4 min, and 250 °C for 48 h) up to 60 days is plotted in Figure 2-10.
0
5
10
15
20
25
30
pH=2 pH=4 pH=6 pH=7 pH=8 pH=10 pH=12
Hyste
resis
, m
V
Test conditions
200 °C 4 min 200 °C 24 h
200 °C 48 h 250 °C 4 min
250 °C 24 h 250 °C 48 h

Ph.D. Thesis - Y. Qin McMaster University - Electrical and Computer Engineering
68
Figure 2-10. Operation stability of Pd/PdO pH sensing electrodes over a 60-day period.
For all monitored electrodes, a decrease in sensitivity values was observed. The sensitivity
of the electrode annealed at 250 °C for 4 min showed a fast decrease, while the sensitivity
degradation of the other 2 electrodes was much slower. Linear fitting of the scattered data
was used to calculate the degradation rate of sensitivity, which was -0.36 mV/pH/day for
the electrode annealed at 250 °C for 4 min. Electrodes annealed at 200 °C and 250 °C for
48 h exhibited a slow degradation rate (-0.13, and -0.08 mV/pH/day, respectively). In
addition, both electrodes still maintained near-Nernstian performance (57.66, and 58.04
mV/pH, respectively) after 60 days.
By comparing the characteristics (chemical composition and surface morphology) of the 3
types of electrodes, it can be inferred that the different operation stability may be caused
by the presence of surface nano-voids and the dissimilar percentage of PdO in the bulk.
First, acid solutions containing chloride ions (Cl-, from the filling solution of the reference
electrode) may enter the nano-voids and react with the Pd in the bulk. The formation of
chlorides of Pd gradually degrades the electrodes [201], hence reducing the amount of
surface PdO and decreasing the sensitivity. XPS analysis was performed after the operation
stability test for the electrode annealed at 250 °C for 48 h. The percentage of surface PdO
reduced to ~46%, indicating the degradation of the electrode surface. Second, the reactions
between Cl- ions and Pd are accompanied by the transferring of electrons. In the overall
reaction, more electrons (x) than H3O+ ions (y) are transferred (i.e. x > y). Therefore, the
sensitivity (y/x)(RT/F) becomes lower than 59.16 mV/pH at 25 °C. As a result, if a larger
-70
-60
-50
-40
-30
0 10 20 30 40 50 60
Sen
sit
ivit
y,
mV
/pH
Time, day
200 °C 48 h 250 °C 48 h 250 °C 4 min

Ph.D. Thesis - Y. Qin McMaster University - Electrical and Computer Engineering
69
amount of metallic Pd is presented in the bulk of the electrode, then the electrode’s surface
degrades faster and more electrons are transferred in the overall redox reaction. Both
phenomena lead to a faster decrease of sensitivity, which agrees with our observation.
Moreover, other studies also found that the electrode aging may include dissolution and
reaction of surface Pd when exposed to pH buffer solutions [77], [126]. Thus, the operation
stability could be improved by coating the electrode with a H3O+-permeable passivation
material such as Nafion latex [170]. However, the transport of H3O+ from the solution to
the electrode surface through the coating would result in an increased response time. On
the other hand, because of the similar chemical composition but different surface roughness
of electrodes annealed at 200 °C and 250 °C for 48 h, it could be inferred that the surface
roughness is not an important factor for the operation stability.
Storage stability is a measure of sensitivity degradation during storage before the first
measurement. Since the electrode annealed at 200 °C for 48 h showed optimized
performance in terms of sensitivity, response time, and operation stability, it was selected
to study the storage stability. The electrode was kept in ambient air at room temperature for
60 days before the first pH test. The resulting pH sensitivity after storage was 64.15 ± 1.85
mV/pH (5 measurement cycles), which was comparable with the sensitivity value of newly
fabricated electrodes. This result demonstrated that the Pd/PdO sensing film has a minimum
shelf-life of 60 days without any special care.
2.3.8. Reproducibility
To study the reproducibility of the fabrication process and sensitivity of Pd/PdO electrodes,
7 electrodes were fabricated with annealing at 200 °C for 48 h. The sensitivity values of
these electrodes were: 64.13, 64.92, 64.16, 63.85, 65.08, 63.61, and 64.71 mV/pH, with the
average value of 64.35 mV/pH and standard deviation (SD) of 0.56 mV/pH. These
consistent results demonstrated that the fabrication process was reliable and repeatable, and
the performance of fabricated sensors was reproducible.
Ph.D. Thesis - Y. Qin McMaster University - Electrical and Computer Engineering
70
2.4. Conclusions
Solution-processed Pd/PdO thin films were shown to be a promising pH-sensitive material.
XPS, SEM, and AFM studies were used to determine the chemical composition and surface
morphology of deposited Pd/PdO films. High sensitivity can be realized by forming more
PdO at the electrode surface and in the bulk. Dense and flat surface morphology of the
electrode can lead to a fast response. The presence of both metallic Pd and surface nano-
voids in the electrodes causes the decreasing of long-term sensitivity. pH sensing electrodes
prepared by annealing Pd precursor solution at 200 °C for 48 h exhibited a linear super-
Nernstian pH sensitivity of 64.71 ± 0.56 mV/pH in the pH range of 2 to 12 with a short
response time less than 18 s, small hysteresis less than 7.81 mV, and high reproducibility
with a SD of 0.56 mV/pH in sensitivity. The super-Nernstian behavior may be related to
the hydrous PdOx (x > 1) produced from the solution-based process at low temperatures.
Our proposed fabrication process uses solution-based material and does not require high
temperature or vacuum equipment, which is compatible with large-area and low-cost
manufacturing of high-performance pH sensors on flexible substrates.
Ph.D. Thesis - Y. Qin McMaster University - Electrical and Computer Engineering
71
Chapter 3
Inkjet-printed Pd/PdO for integrated pH
sensors*
An inkjet printing process for depositing Pd thin films from a highly loaded ink (>14 wt%)
is reported in this chapter. The viscosity and surface tension of a Pd-organic precursor
solution is adjusted using toluene to form a printable and stable ink. A two-step thermolysis
process is developed to convert the printed ink to continuous and uniform Pd films with
good adhesion to different substrates. Using only one printing pass, a low electrical
resistivity of 2.6 μΩ·m of the Pd film is obtained. To demonstrate the electrochemical pH
sensing application, the surfaces of the printed Pd films are oxidized for ion-to-electron
transduction and the underlying layer is left for electron conduction. Then, solid-state
reference electrodes are integrated beside the bifunctional Pd electrodes by inkjet printing.
These potentiometric sensors have sensitivities of 60.6 ± 0.1 mV/pH and 57 ± 0.6 mV/pH
on glass and polyimide substrates, and short response times of 11 s and 6 s, respectively.
Also, accurate pH values of real water samples are obtained by using the printed sensors
with a low-cost multimeter.
3.1. Background
Inkjet printing is an easy-to-use and low-cost approach to simultaneously deposit and
pattern thin film materials from solutions. This technology can produce structures with fine
patterns, consumes a small amount of materials, does not need complicated equipment, and
* Adapted with permission from Y. Qin, A. U. Alam, M. M. R. Howlader, N.-X. Hu, and M. J. Deen, “Inkjet
printing of a highly loaded palladium ink for integrated, low-cost pH sensors,” Adv. Funct. Mater., vol. 26,
no. 27, pp. 4923–4933, Jul. 2016. Copyright (2016) John Wiley and Sons (Appendix E).

Ph.D. Thesis - Y. Qin McMaster University - Electrical and Computer Engineering
72
is compatible with large-area processing lines for flexible and non-planar substrates [202].
Numerous applications, for example, high-resolution electrodes [203], field-effect
transistors [178], solar cells [204], light-emitting devices [205], bio/chemical sensors [206],
and bio-printed tissues [207], were enabled by using inkjet printing technology. In these
applications, metal nanoparticles, oxides, polymers, and many other materials were inkjet-
printed [202]. However, the inkjet printing of an essential material for electrochemistry
applications, Pd, is less commonly reported. The lack of printability of Pd and Pd-based
materials limited their applications in low-cost electrochemical systems.
Pd and Pd-based materials can be deposited via hydrothermal growth, electrochemical
deposition, thermal oxidation, and physical vapor deposition [126], [208], [209]. These
processing techniques require a large amount of chemicals, high-pressure chambers, high
temperatures, and vacuum equipment. We have demonstrated that spin-coated Pd/PdO thin
films can be used as pH sensing electrodes in Chapter 2 [80]. However, the spin coating
process consumes a large amount of materials. Also, additional patterning steps are needed
to integrate the deposited materials into functional systems. These processing and
patterning steps result in costly manufacturing. Therefore, the less complicated and more
cost-efficient inkjet printing technique for Pd deposition should be developed.
To the best of my knowledge, inkjet printing of Pd was used to deposit and pattern seed
layers for electroless deposition [210]–[212], and also as the contact electrodes for thin-
film resistors [213]. The Pd inks used in these studies had low metal content (normally <5
wt%), which resulted in very thin, discontinuous, and high-resistance Pd films. Such Pd
films are undesirable for electrochemical sensing because the inefficient electron transfer
in the high-resistance films results in a poor sensing performance [166]. One method to
reduce the resistance is to print the lightly loaded ink using multiple passes, but this is time-
consuming [213]. Alternatively, highly loaded Pd inks and their inkjet printing processes
can be developed to deposit continuous, homogenous, and conductive Pd films using a
single print pass, thus making it a fast film deposition technique.

Ph.D. Thesis - Y. Qin McMaster University - Electrical and Computer Engineering
73
In this chapter, we developed an ink loaded with >14 wt% Pd for inkjet printing. The inkjet
printing process for such ink is optimized for the deposition of continuous, uniform and
low-resistivity thin films with good adhesion to the underlying substrates. Utilizing this ink
and printing process, we demonstrate the practical and cost-effective fabrication of an
integrated pH sensing platform on both rigid and flexible substrates. Bifunctional sensing
electrodes are fabricated by oxidizing the printed Pd. The PdO-rich surfaces function as pH
sensing layers and the conductive portion beneath the surfaces are electron conduction
paths. Solid-state reference electrodes are inkjet-printed besides the sensing electrodes to
form potentiometric sensors. The integrated sensors exhibited high sensitivity, fast
response, good stability, and were highly accurate in measuring real water samples.
3.2. Inkjet printing of Pd/PdO pH sensing electrodes
3.2.1. Pd Ink formulation and properties
The as-received Pd precursor solution contains a Pd-organoamine complex. Since the
specific amine ligand significantly increases the solubility of the Pd complex in toluene,
the metal load for this precursor solution can be as high as ~18.5 wt% (Table 3-1). In
addition, the organoamine ligand helps to prevent crystallization of the precursor upon
solvent evaporation. Therefore, it is possible to use this Pd precursor solution for thin film
deposition.
Two important parameters, viscosity and surface tension, must be considered when
developing inks for inkjet printing. For the printhead used in this study, the ink’s viscosity
(η) <9 cP and surface tensions (γ) of ~30 mN/m is preferred. Regarding the as-received Pd
precursor solution, its viscosity was 31.54 cP and its surface tension was 33 mN/m, as listed
in Table 3-1. Although the surface tension was in the suitable range, its high viscosity made
jetting difficult even at the maximum firing voltage (40 V) and a printhead temperature of

Ph.D. Thesis - Y. Qin McMaster University - Electrical and Computer Engineering
74
50 ºC (higher temperature was not desired due to fast solvent evaporation). Thus, the
viscosity of the Pd precursor solution was reduced by dilution.
Six criteria should be considered when formulating low-viscosity Pd inks:
1. The dilution solvent should be miscible with the precursor solution.
2. The Pd content should stay high to attain a thick and conductive layer after one printing
pass.
3. The dilution solvent should have a surface tension of ~30 mN/m and a viscosity <9 cP.
4. Low jetting voltages should be applied to avoid the formation of satellite droplets.
5. Printhead temperatures <50 ºC should be used to prevent nozzle clogging caused by
fast solvent evaporation.
6. The dilution solvent should have a boiling point (BP) >100 ºC to avoid rapid ink drying
during storage.
Table 3-1. Physical properties, key jetting parameters, and thermolysis parameters for the functional inks.
Ink Functionality Solvent
Major ink properties
Key jetting
parameters b
Thermolysis
parameters
Solvent
BP, ºC
Solid
content,
wt%
η a
(25 ºC),
cP
γ
(22 ºC),
mN/m T, ºC
Peak
voltage,
V T, ºC t, min
Pd
precursor
pH sensing
electrode
Toluene 110 18.5 31.54 33.0 Not jettable
Pd-PhMe pH sensing
electrode
Toluene 110 14.8 12.99 30.5 40 26 120 &
200
2 & 4
Pd-IBB pH sensing
electrode
Isobutylbenzene 170 14.1 12.44 29.9 40 26 170 &
200
2 & 4
SU-8 Adhesion layer
for Ag
PGMEA 145 7.4 1.96 27.5 25 17 90 &
200
2 & 60
Ag NP Reference
electrode
Hydrocarbon 110 50 4.5 29.0 30 22 120 10
NaOCl Chlorinate Ag
to AgCl
DI water + 2 vol%
Triton X-100
100 0.4 0.92 31.1 25 26 - -
PVC/KCl/
AgCl
Electrolyte for
reference
electrode
Cyclohexanone 155 2.0 8.18 34.5 40 26 160 10
a η, viscosity; γ, surface tension; T, temperature; t, time. b Substrate temperature = 25 ºC in all cases.
Based on the 6 criteria, Pd-IBB and Pd-PhMe, as low-viscosity Pd inks, were prepared by
mixing 80 wt% precursor solution with 20 wt% isobutylbenzene (IBB) and 20 wt% toluene
(PhMe), respectively. TG analysis (TGA) test results in Figure 3-1 showed that the Pd

Ph.D. Thesis - Y. Qin McMaster University - Electrical and Computer Engineering
75
contents of both Pd-IBB and Pd-PhMe were greater than 14 wt%, ~3 times higher than
other Pd precursor solutions [214]. After dilution, the viscosities of Pd inks reduced to 12-
13 cP at 25 ºC while their surface tensions were kept ~30 mN/m (Table 3-1). At 40 ºC, the
viscosity of Pd-IBB and Pd-PhMe was 8.50 cP and 8.93 cP, respectively. Consequently,
using a peak firing voltage of 26 V at 40 ºC nozzle temperature, both inks could be jetted
stably at a droplet velocity of ~10 m/s without forming satellite droplets. Also, cleaning
cycles for unclogging nozzles were not required for a 1-hour printing job. To study storage
stability, newly prepared Pd inks were kept in capped cartridges at 27 ± 2 °C in ambient
air. After 2 weeks, both inks could be jetted using the same parameters shown in Table 3-1.
Figure 3-1. TGA test results of as-received Pd precursor solution, Pd-PhMe, and Pd-IBB using 1-step and
2-step thermolysis methods (inset: temperature profiles of 1-step and 2-step thermolysis).
3.2.2. Formation of Pd thin films
The inkjet printer used in this study was a Dimatix DMP-2831 materials printer (Fujifilm),
equipped with DMC-11610 Dimatix materials cartridges (Fujifilm). The cartridge was
accompanied with a 16-nozzle piezoelectric printhead, which could jet ~10 μL ink per
droplet. All inks (~1.5 mL each) were filtered through Whatman GD/X syringe filters
(polytetrafluoroethylene membrane, pore size 0.2 μm, WHA68741302, Sigma-Aldrich)
before loading to the cartridges. The jetting waveforms for Pd is shown in Figure 3-2. Other
parameters include the firing frequency of 2 kHz and the meniscus vacuum of 0.18 psi.
0%
10%
20%
30%
40%
50%
60%
70%
80%
90%
100%
0 50 100 150 200 250
Weig
ht%
Temperature, ºC
Pd precursor (1-step annealing)
Pd-IBB (1-step annealing)
Pd-PhMe (1-step annealing)
Pd precursor (2-step annealing)
Pd-IBB (2-step annealing)
Pd-PhMe (2-step annealing)
0
50
100
150
200
250
0 2 4 6 8Tem
np
era
ture
, ºC
Time, min
TGA temperature profile
1-step annealing2-step annealing

Ph.D. Thesis - Y. Qin McMaster University - Electrical and Computer Engineering
76
Figure 3-2. Voltage waveforms of the printhead for jetting different inks.
Figure 3-3. Photographs showing wetting behaviors of inkjet-printed Pd-PhMe ink on different substrates.
(a) On glass, 547 μm-wide lines. (b) On PI treated by air plasma for 2 min, 547 μm-wide lines. (Droplet pitch
= 30 μm, designed line width = 520 μm in both cases.)
The wetting behaviors of as-received Pd precursor, Pd-IBB, and Pd-PhMe were studied on
glass and polyimide (PI, Kapton® 200HN, DuPont) surfaces. Before inkjet printing, all
glass and PI substrates were cleaned by rinsing with IPA and DI water, followed by drying
under compressed dry air. On glass substrates, all 3 types of inks showed good wetting.
Figure 3-3(a) display the printed Pd-PhMe on a glass substrate. As shown, a continuous
and uniform ink layer was obtained. The measured line width of a printed Pd-PhMe layer
was 547 μm, close to the designed values of 520 μm. The surfaces of some glass substrates
were also treated using air plasma for 2 min using a plasma cleaner (PDC-32G, Harrick
Plasma) with a background pressure of 200 mTorr and an RF power of 18W. However, the
Pd inks printed on plasma-treated glass substrates showed poor wettability. Therefore, we
focused on using the glass substrates cleaned by IPA and DI water here. More investigation
is needed to study the mechanism for the dewetting of the Pd inks, but this is out of the
scope of the current study. On the as-received PI substrates, the Pd inks showed a poor
0%
20%
40%
60%
80%
100%
0 10 20 30 40P
erc
en
tag
e o
f p
ea
k v
olt
ag
e
Time, μs
Pd and SU-8 ink
Other inks
100 μm 100 μm
(a) (b)
Ph.D. Thesis - Y. Qin McMaster University - Electrical and Computer Engineering
77
wetting behavior due to the low surface energy of PI. Thus, the surface of PI was treated
using air plasma for 2 min to increase its surface energy for better pattern definition
(treatment for longer times had no significant effect). Figure 3-3(b) shows a printed Pd-
PhMe layer on a treated PI substrate with a well-defined line of 547 μm wide (close to the
designed value of 520 μm).
Printed Pd-PhMe were converted to metallic Pd using thermolysis. Two thermolysis
temperature profiles (Figure 3-1) were compared to optimize the morphology of the printed
Pd films. On the one hand, Pd inks were heated up to 200 ºC on a hotplate in air for 4 min
(1-step thermolysis). During this period, the solvent of the ink evaporated, the precursor
decomposed to Pd NPs, and metallic Pd films formed. Figure 3-4(a) is a SEM image
showing the morphology of a Pd film prepared by 1-step thermolysis of printed Pd-PhMe
(30 μm droplet pitch) on a glass substrate. Pinholes with diameters <100 nm and a non-
uniform film can be observed. Such surface morphology was caused by the decomposition
of organic compounds in the Pd precursor and the unevenly distributed agglomeration of
Pd NPs. When the ink was heated up to 200 ºC in 1 step, the solvent evaporation and the
generation of Pd NPs happened simultaneously. When the ink was not fully dried, Pd NPs
were surrounded by residual solvent. Pd NPs in the liquid phase could move and aggregate
with nucleation centers more easily than in the solid phase. Since the Pd NPs were
transported unevenly, thicker and thinner regions were formed once the solvent evaporation
and precursor thermolysis were completed. The thicker regions were denser while the
thinner regions consisted of pinholes or cracks.
Based on the 1-step thermolysis discussed above, a 2-step thermolysis was used to improve
the film morphology. In the first step, the printed Pd ink was heated up to 120 ºC in air for
1 min to evaporate most of the solvent. Then, the temperature was increased to 200 ºC to
decompose the precursor and produce a uniform Pd layer ~100 nm in thickness. In the
second step, Pd NPs were generated in solid phase and immobilized on the substrate to
coalesce into a uniform film. Figure 3-4(b) is the SEM image of a homogeneous Pd film

Ph.D. Thesis - Y. Qin McMaster University - Electrical and Computer Engineering
78
prepared by the 2-step thermolysis of printed Pd-PhMe on a glass substrate. Pd printed on
PI (2 min plasma treatment, 2-step thermolysis) exhibited a dense morphology with few
pinholes (Figure 3-4(e)). During plasma treatment, nitrogen moieties (such as –N=C<)
were generated on the surface of PI and served as bonding sites for Pd atoms [215]. The
bonded Pd atoms behaved as nucleation centers and were uniformly distributed, resulting
in a homogeneous Pd film of ~80 nm thick.
Figure 3-4. (a-e) SEM images of surface morphologies of Pd films printed using Pd-PhMe ink. (a) 30 μm
droplet pitch, glass substrate, 1-step thermolysis; (b) 30 μm droplet pitch, glass substrate, 2-step thermolysis;
(c) 40 μm droplet pitch, glass substrate, 2-step thermolysis; (d) 20 μm droplet pitch, glass substrate, 2-step
thermolysis; (e) 30 μm droplet pitch, PI substrate, 2-step thermolysis; (f) Optical microscopy image of 2-step
thermalized Pd lines printed using Pd-PhMe ink with 20 μm droplet pitch on a glass substrate. (g) Thickness
profiles of printed Pd lines shown in (f). (h) Thickness dependence of the resistivity of printed Pd.
Regarding Pd-IBB, a 2-step thermolysis was also performed. However, a rough film was
obtained after thermolysis at 170 ºC (170 ºC was selected due to the higher BP of IBB) for
100 μm
0
100
200
300
400
-200 -100 0 100 200
Heig
ht,
nm
Distance, μm
40 μm-wide lines 80 μm-wide lines
160 μm-wide lines 240 μm-wide lines
(d) (e)
100 nm
1 μm 1 μm
0
20
40
60
80
0 100 200 300
Resis
tivit
y, μΩ·m
Electrode thickness, nm
100 nm
1 μm
1 μm
100 nm
(f)
100 nm
1 μm
100 nm
(g) (h)
(a) (b) (c)

Ph.D. Thesis - Y. Qin McMaster University - Electrical and Computer Engineering
79
1 min and 200 ºC for 4 min (Figure 3-5). The rough surface indicated that a large amount
of residual solvent (IBB) existed on the substrate when Pd NPs were generated. IBB
evaporated slowly because of its low vapor pressure (~1.8 hPa, comparing to ~29 hPa of
PhMe and ~23 hPa of water at 20 ºC). Since a 15-min evaporation step was needed to
remove the IBB in the ink, the process was inefficient and not used in following studies.
Figure 3-5. SEM images of surface morphologies of a printed Pd layer using Pd-IBB as ink and 2-step
thermolysis. (a) A typical inhomogeneous surface morphology. (b) Magnified view of (a).
The surface morphology of printed Pd was also a function of film thickness. Pd films of 50
nm (Figure 3-4(c)), 100 nm (Figure 3-4(b)), and 200 nm (Figure 3-4(d)) thick was obtained
by printing Pd-PhMe on a glass substrate with a droplet pitch of 40 μm, 30 μm, and 20 μm,
respectively. In the 50 nm thick film, pinholes were larger (comparing to the 100 nm thick
film) and multiple pinholes connected to form cracks. In the 200 nm thick film, the pinholes
were smaller. These results indicated the importance of having a large amount of metal in
deposited the ink to attain a thick Pd film free of pinholes and cracks.
The “coffee-stain” effect also reduces the uniformity of inkjet-printed films and is not
desired for many applications [216]. To reduce this effect, increasing the solid content in
the inks, adding cosolvents with high BPs to the inks, and increasing the substrate
temperature were shown to be effective [216]. In our study, Figure 3-4(f) shows the optical
microscopy image of printed Pd lines using Pd-PhMe with 20 μm droplet pitch on a glass
substrate. The thickness profiles of these lines are shown in Figure 3-4(g). As the designed
line width increased from 40 μm to 240 μm, the thickness of Pd film increased from ~100
nm to ~260 nm. Due to the high metal content (~14 wt%) of the ink, the “coffee-stain”
1 μm 250 nm
(a) (b)
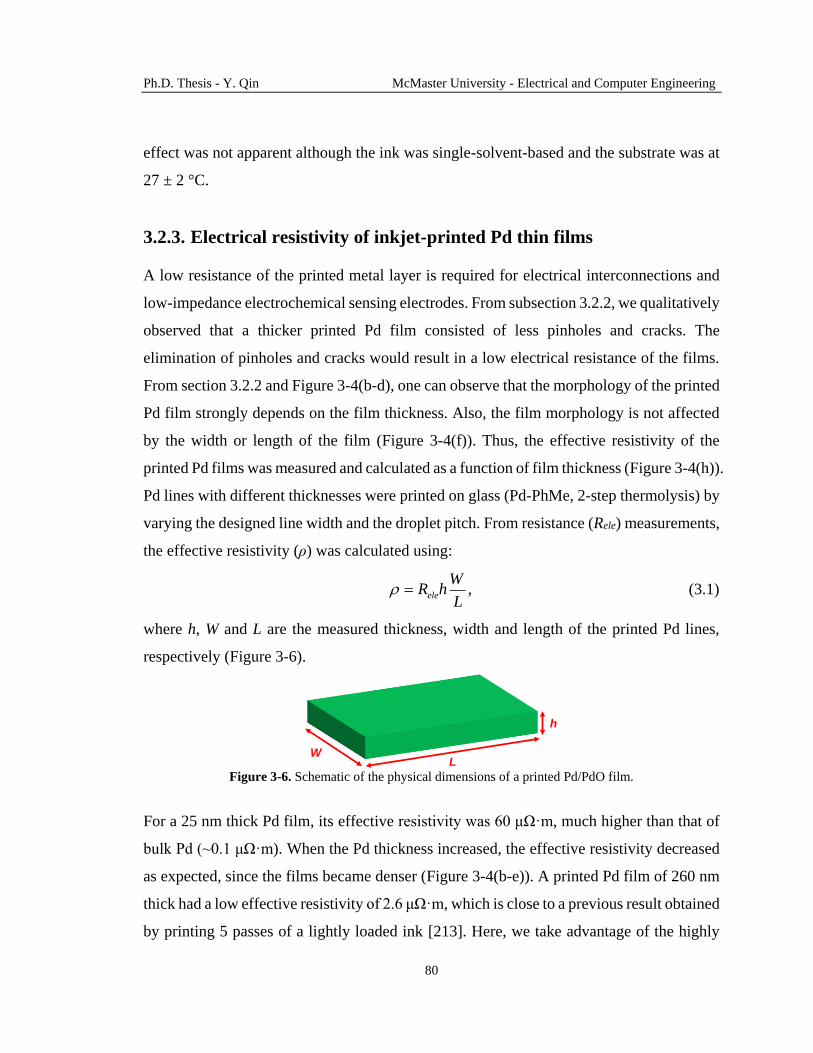
Ph.D. Thesis - Y. Qin McMaster University - Electrical and Computer Engineering
80
effect was not apparent although the ink was single-solvent-based and the substrate was at
27 ± 2 °C.
3.2.3. Electrical resistivity of inkjet-printed Pd thin films
A low resistance of the printed metal layer is required for electrical interconnections and
low-impedance electrochemical sensing electrodes. From subsection 3.2.2, we qualitatively
observed that a thicker printed Pd film consisted of less pinholes and cracks. The
elimination of pinholes and cracks would result in a low electrical resistance of the films.
From section 3.2.2 and Figure 3-4(b-d), one can observe that the morphology of the printed
Pd film strongly depends on the film thickness. Also, the film morphology is not affected
by the width or length of the film (Figure 3-4(f)). Thus, the effective resistivity of the
printed Pd films was measured and calculated as a function of film thickness (Figure 3-4(h)).
Pd lines with different thicknesses were printed on glass (Pd-PhMe, 2-step thermolysis) by
varying the designed line width and the droplet pitch. From resistance (Rele) measurements,
the effective resistivity (ρ) was calculated using:
,ele
WR h
L (3.1)
where h, W and L are the measured thickness, width and length of the printed Pd lines,
respectively (Figure 3-6).
Figure 3-6. Schematic of the physical dimensions of a printed Pd/PdO film.
For a 25 nm thick Pd film, its effective resistivity was 60 μΩ·m, much higher than that of
bulk Pd (~0.1 μΩ·m). When the Pd thickness increased, the effective resistivity decreased
as expected, since the films became denser (Figure 3-4(b-e)). A printed Pd film of 260 nm
thick had a low effective resistivity of 2.6 μΩ·m, which is close to a previous result obtained
by printing 5 passes of a lightly loaded ink [213]. Here, we take advantage of the highly
h
LW

Ph.D. Thesis - Y. Qin McMaster University - Electrical and Computer Engineering
81
loaded Pd ink to get a low-resistance film using only 1 printing pass. However, this
effective resistivity is still higher than that of metallic Pd. This higher effective resistivity
suggested a dependence on factors other than the film morphology. Therefore, the chemical
composition of the printed Pd films was investigated.
Figure 3-7. (a) Depth-dependent chemical compositions of printed Pd films thermalizes at 200 ºC for 4 min
and 48 h obtained by XPS depth profiling. (b) Pd 3d XPS spectra and curve fitting of the surface and bulk of
printed Pd thermalizes at 200 ºC for 4 min. (c) Pd 3d XPS spectra and curve fitting of the surface and bulk of
printed Pd annealed at 200 ºC for 48h.
Figure 3-7(a) shows the depth profiles of PdO percentage for 100 nm thick Pd films based
on XPS analyses. For the film obtained right after thermolysis (200 ºC, 4 min), its surface
contained ~56% PdO (curve fitting is shown in Figure 3-7(b)) while its bulk contained
~17% PdO. The PdO was formed by the oxidation of Pd by O2 in air during the thermolysis
at 200 ºC [209]. Therefore, the presence of PdO resulted in the effective resistivity of the
printed film being higher than metallic Pd. When the film thickness decreased, the effect
of surface PdO and pinholes were more pronounced. As a result, the effective resistivity of
thinner films was higher than that of thicker films. In summary, the effective electrical
resistivity of a printed Pd film was dominated by two factors: film morphology and
0%
20%
40%
60%
80%
100%
0 200 400 600 800 1000 1200 1400
Pd
O%
Etching time, s
200 ºC 4 min 200 ºC 48 h
331333335337339341343345
Binding energy, eV331333335337339341343345
Binding energy, eV
5000 counts
Pd2+Pd0
Pd2+Pd0
Pd2+ Pd0Pd2+
Pd0
200 ºC 4 min 200 ºC 48 h
Su
rfa
ce
Bu
lk
Su
rfa
ce
Bu
lk
(a)
(b) (c)

Ph.D. Thesis - Y. Qin McMaster University - Electrical and Computer Engineering
82
chemical composition. Moreover, the distribution of PdO in the XPS depth profiling results
showed a diffusion-limited profile. This profile was formed because the oxidation of Pd
during thermolysis is primarily supported by O2 in air. Thus, a bilayer structure with higher
PdO concentration close to the surface and a more conductive layer underneath. In order to
obtain a highly conductive Pd film, the concentration of PdO should be low.
3.2.4. Adhesion of inkjet-printed Pd thin films
In printed flexible devices, adhesion between the printed structures and the underlying
substrates is critical for the devices’ stability and reliability. Film adhesion is especially
important when it is used in a severe environment such as in a liquid [217]. The adhesion
test results of printed Pd films on glass and PI substrates are listed in Table 3-2. On glass
substrates, thin Pd films could pass the water rinse and scotch tape tests, but thick Pd films
could be peeled off with the tape. The better adhesion of the thinner Pd films may be
attributed to two reasons: the larger amount of pinholes/cracks in the films and the smaller
film thickness. First, in thin Pd films, pinholes and cracks (Figure 3-4(b-d)) created many
inter-domain boundaries. The Pd atoms at the boundaries had a less ordered structure, hence
a higher surface energy [218]. A thin film with a higher surface energy has a stronger
tendency to be attracted to another surface, which results in a stronger adhesion between
deposited films and substrates [219], [220]. Thus, the adhesion between thin Pd films and
the substrates were better. Second, the stress in thin films promotes their delamination [221].
The adhesion between a thin film and a substrate can be quantitated by strain energy release
rate (Gs), which is proportional to the film thickness (h) according to [222]:
2
,c f
s
f
Z hG
E
(3.2)
where Zc is a dimensionless cracking parameter, σf is the stress in the film, and Ef is the
modulus of elasticity. A thicker film has a larger strain energy release rate, indicating the
film delaminates from the substrate more easily for stress release. In addition to this
theoretical explanation, our observation also agrees well with previous experimental results
[219], [223], [224].

Ph.D. Thesis - Y. Qin McMaster University - Electrical and Computer Engineering
83
Table 3-2. Adhesion test results of inkjet-printed thin films. Printed material Substrate Film thickness, nm Water rinse test Scotch tape test
Pd Glass 35 Pass Pass
Pd Glass 70 Pass Pass
Pd Glass 100 Pass Fail
Pd Glass 150 Pass Fail
Pd Glass 200 Pass Fail
Pd PI 100 Pass Pass
Pd PI 200 Pass Pass
Ag Glass 300 Pass Fail
Ag Glass 650 Fail Fail
Ag PI 300 Fail Fail
Ag PI 650 Fail Fail
Ag SU-8 300 Pass Pass
Ag SU-8 650 Pass Pass
SU-8 Glass 200 Pass Pass
SU-8 PI 200 Pass Pass
PVC/KCl/AgCl Glass 100 Pass Fail
PVC/KCl/AgCl Glass 100000 a Fail Fail
PVC/KCl/AgCl PI 100 Pass Pass
PVC/KCl/AgCl PI 100000 a Pass Fail
PVC/KCl/AgCl SU-8 100 Pass Pass
PVC/KCl/AgCl SU-8 100000 a Pass Pass a Manually printed.
In contrast, on the PI substrates treated by air plasma for 2 min, thick Pd films exhibited
good adhesion. Although the plasma-introduced oxygen-containing groups are reactive to
the deposited Pd, we believe the improved adhesion was mainly attributed to the generation
of nitrogen-containing groups at the surface of PI during the plasma treatment [215]. The
presence of the nitrogen-containing groups was proven in previous studies by using XPS
and FTIR spectroscopy [215], [225]. The nitrogen atoms in the nitrogen-containing groups
have unbonded electron pairs, which can serve as ligands for Pd [215], [226]. Therefore,
the improved adhesion of Pd on PI was due to the higher affinity of nitrogen towards Pd
than that of oxygen towards Pd. Figure 3-8 shows the AFM images of glass and PI surfaces.
After the 2-min plasma treatment, the PI surface had a RMS roughness of 0.83 nm, which
was about a half of the roughness of the glass substrate. The smooth PI surface indicated
insignificant mechanical interlocking between Pd and PI. Thus, chemical bonding was the
major factor for a strong adhesion between the printed Pd and PI substrates.

Ph.D. Thesis - Y. Qin McMaster University - Electrical and Computer Engineering
84
Figure 3-8. AFM images of different substrates. (a) PI treated by air plasma for 2 min. (b) Glass.
3.2.5. Modeling the response of the pH sensing electrodes
According to Chapter 1 and Chapter 2, in a Pd/PdO electrochemical pH sensor, the sensing
electrode should possess the following characteristics.
An oxide-rich surface for the ion-to-electron transduction based on the redox reaction
(see reaction (2.4)).
A low-resistance bottom layer for electron conduction.
A good adhesion with the substrate for stable operation in the aqueous environment.
To demonstrate the usability of the printed Pd films, Pd/PdO printed sensing electrodes
(PSEs) were fabricated by annealing the printed Pd at 200 ºC for 48 h. After annealing, the
PdO-rich surfaces (Figure 3-7(a) and (c)) functioned as the pH sensitive layers. The bulk
of the electrodes had less PdO and a higher conductivity, functioning as the electron
conducting layers. Thus, even though the PSEs were deposited using only one material,
they played a dual role. This makes our fabrication process simpler than that in other studies
where the sensing and electron conduction layers were deposited separately [166].
When the Pd/PdO PSE is immersed into an electrolyte solution, the fast and reversible
redox reaction (2.4) occurs at or near the electrode-electrolyte interface for charge transfer
[227]. Such a redox reaction involves electron exchange, hence, a pseudocapacitor (CF) and
a charge transfer resistance (RF, in series with CF) can be used to model this electrochemical
reaction (Figure 3-9). In addition, a double layer capacitor (CDL, in parallel with CF and RF)
200 nm 200 nm
7.0 nm
-7.0 nm
(a) (b)RRMS = 0.83 nm RRMS = 1.70 nm

Ph.D. Thesis - Y. Qin McMaster University - Electrical and Computer Engineering
85
consisting of a diffusion layer capacitor (CD) and a Stern layer capacitor (CS, in series with
CD) can be used to represent the formation of the electrical double layer at the electrode-
electrolyte interface. The specific capacitance of the pseudocapacitor at a transition metal
oxide surface (can be >1000 F/g) is much larger than that of the double layer capacitor
(normally <100 F/g) [227]. Therefore, the charge exchange behaviors or the pH sensing
properties at the PSE surface is mainly determined by the pseudocapacitor and the charge
transfer resistance. Considering the electrode resistance (Re), the PSE immersed in a
solution can be modeled as a lumped resistor (Rm) with a lumped capacitor (Cm ≈ CF). The
charge transfer resistance is usually small (<1 kΩ) and has a negligible effect on the signal
readout [228], [229], so Rm is mainly determined by the electrode resistance (Rm ≈ Re, tens
of kΩ). In addition, the same Pd/PdO film is used as the electrical connection that is not
immersed in the electrolyte, so charges generated in the PSE can be stored in the dry part
of the Pd/PdO film, so a parasitic capacitor (Ce) is used to represent this charge storage
effect. Moreover, the electronic set-up (Figure 2-1(d), including cables, clamps, and the
semiconductor parameter analyzer) has a small lumped capacitance Cc (<10 nF), and a large
input resistance Rc (Rc > 1 TΩ for the set-up in this study).
Figure 3-9. Equivalent circuit model for determining the pH response at the Pd/PdO-electrolyte interface.
Substrate
Pd/PdO
Electrolyte
PdO + 2H3O+ + 2e- ↔ Pd + 3H2O
H3O+ H3O
+
e- e-
RF
CFCS
CDCm
Rm
Eref
CDL
+ -
Cc Rc>>Rm
-
+
Emeas
Re
+
-
Esen
Ce
h
LW
Electrical
connection
To semiconductor
parameter analyzerElectrolyte
Pd/PdO

Ph.D. Thesis - Y. Qin McMaster University - Electrical and Computer Engineering
86
When the pH value of a solution undergoes a step change, the sensor output cannot response
to this pH change immediately. Instead, a certain amount of time is needed for the sensor
output to vary from the initial value to another stable value [230]–[232]. This delayed
response is believed to consist of a series of responses with different speed, which can be
expressed by different time constants. Thus, the normalized sensor output (O(t)) can be
written using a multiple time constant model [230]–[232]:
1
pH 1 exp 0 ,n
sen i
i i
tO t E t
(3.3)
where t is time, ΔEsen is the theoretical pH sensitivity of the sensor (~65 mV/pH, according
to section 2.3.4), εi and τi are the normalized amplitude and time constant of the
corresponding exponential term i, respectively. The time constant τ with a smaller value
indicates a faster response. In our Pd/PdO-based pH sensors, several factors affect the
delayed response:
The fast response is determined by the reaction of surface sites, which forms the
pseudocapacitor (CF). This process can be modeled using the equivalent circuit in
Figure 3-9, and the time constant is a resistor-capacitor constant with a small value
(within several seconds) [230]–[232].
In addition to the fast response, a dispersive transport model can be used to illustrate
the reaction between the H3O+ ions in the solution and the buried sites in the sensing
electrode [233], [234]. This dispersive transport process also exhibits an exponential
relation with time, which is considered to be the cause of the long-term drift of the
sensor. The time constant of this process is in the order of minutes to tens of hours,
depending on the density of reaction sites, the physical/chemical defects, and many
other electrical properties of the sensing material. Due to the lack of the study on these
properties of Pd/PdO, the theoretical calculation of the time constant of the dispersive
transport process is extremely difficult.
Moreover, the delayed sensor response also depends on other factors, such as the
leaching of the electrolyte in the reference electrode and the mechanical delamination
of the sensing material from the substrate. These processes may not show a significant
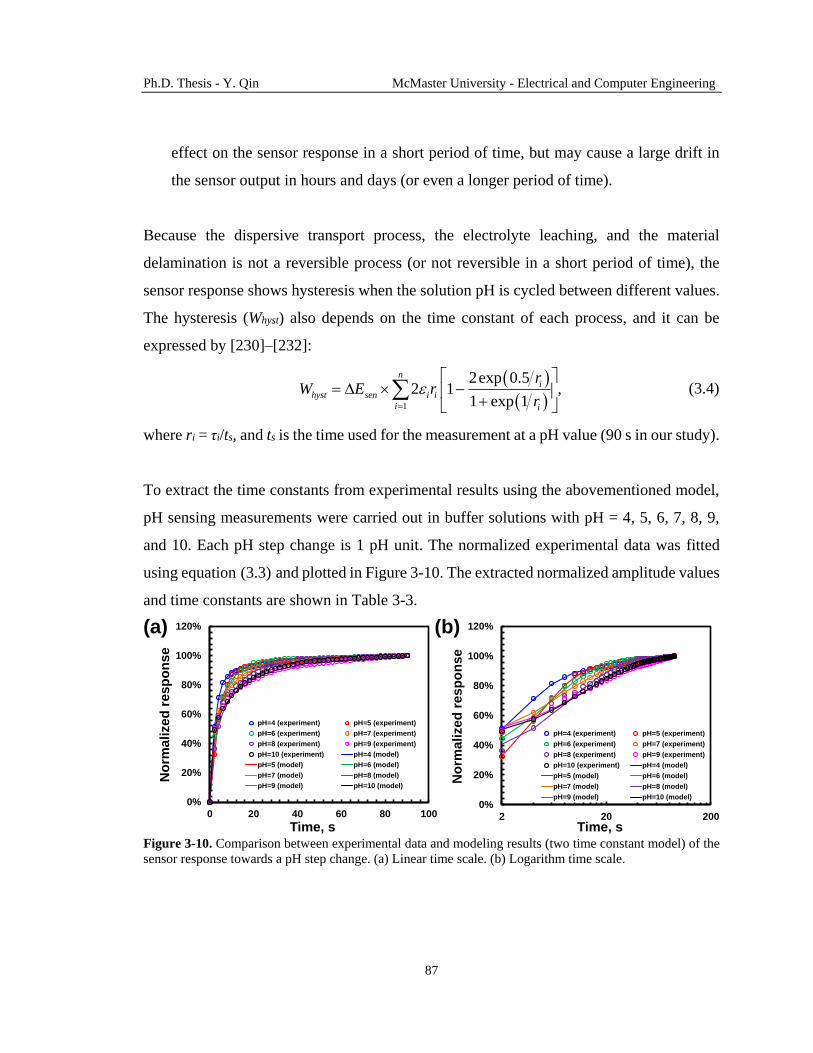
Ph.D. Thesis - Y. Qin McMaster University - Electrical and Computer Engineering
87
effect on the sensor response in a short period of time, but may cause a large drift in
the sensor output in hours and days (or even a longer period of time).
Because the dispersive transport process, the electrolyte leaching, and the material
delamination is not a reversible process (or not reversible in a short period of time), the
sensor response shows hysteresis when the solution pH is cycled between different values.
The hysteresis (Whyst) also depends on the time constant of each process, and it can be
expressed by [230]–[232]:
1
2exp 0.52 1 ,
1 exp 1
ni
hyst sen i i
i i
rW E r
r
(3.4)
where ri = τi/ts, and ts is the time used for the measurement at a pH value (90 s in our study).
To extract the time constants from experimental results using the abovementioned model,
pH sensing measurements were carried out in buffer solutions with pH = 4, 5, 6, 7, 8, 9,
and 10. Each pH step change is 1 pH unit. The normalized experimental data was fitted
using equation (3.3) and plotted in Figure 3-10. The extracted normalized amplitude values
and time constants are shown in Table 3-3.
Figure 3-10. Comparison between experimental data and modeling results (two time constant model) of the
sensor response towards a pH step change. (a) Linear time scale. (b) Logarithm time scale.
0%
20%
40%
60%
80%
100%
120%
0 20 40 60 80 100
No
rma
lize
d r
es
po
ns
e
Time, s
pH=4 (experiment) pH=5 (experiment)
pH=6 (experiment) pH=7 (experiment)
pH=8 (experiment) pH=9 (experiment)
pH=10 (experiment) pH=4 (model)
pH=5 (model) pH=6 (model)
pH=7 (model) pH=8 (model)
pH=9 (model) pH=10 (model)
0%
20%
40%
60%
80%
100%
120%
2 20 200
No
rmali
zed
resp
on
se
Time, s
pH=4 (experiment) pH=5 (experiment)
pH=6 (experiment) pH=7 (experiment)
pH=8 (experiment) pH=9 (experiment)
pH=10 (experiment) pH=4 (model)
pH=5 (model) pH=6 (model)
pH=7 (model) pH=8 (model)
pH=9 (model) pH=10 (model)
(a) (b)
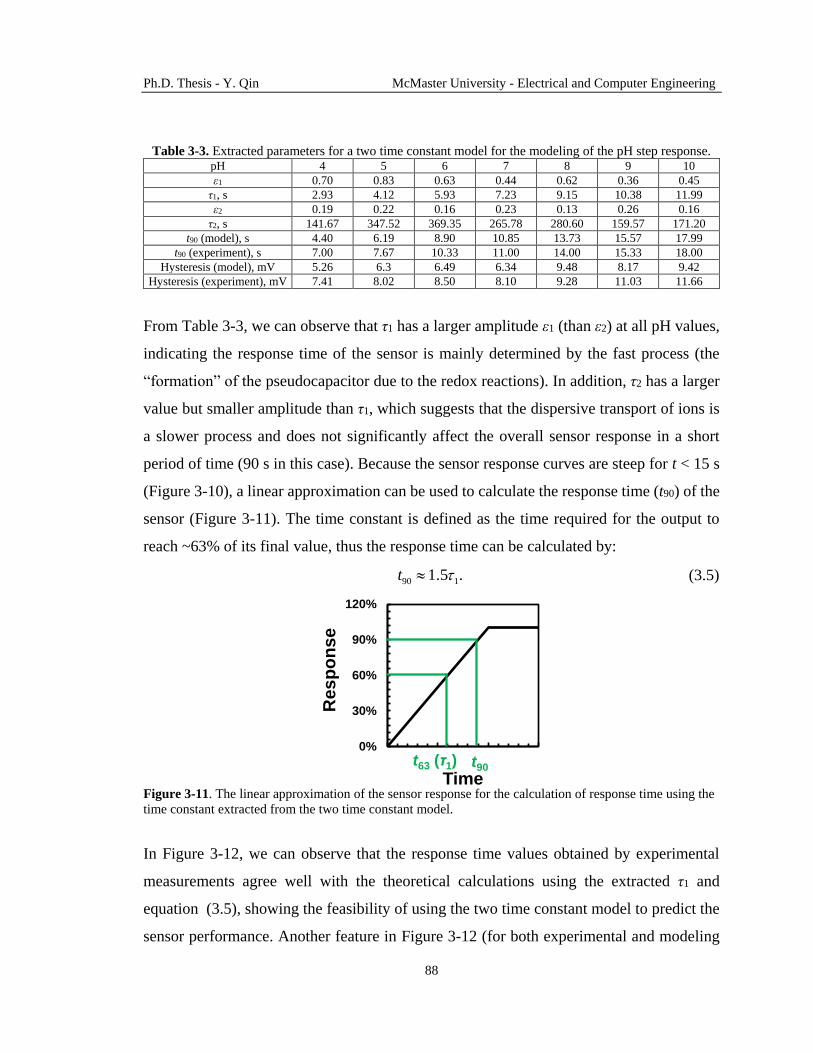
Ph.D. Thesis - Y. Qin McMaster University - Electrical and Computer Engineering
88
Table 3-3. Extracted parameters for a two time constant model for the modeling of the pH step response. pH 4 5 6 7 8 9 10
ε1 0.70 0.83 0.63 0.44 0.62 0.36 0.45
τ1, s 2.93 4.12 5.93 7.23 9.15 10.38 11.99
ε2 0.19 0.22 0.16 0.23 0.13 0.26 0.16
τ2, s 141.67 347.52 369.35 265.78 280.60 159.57 171.20
t90 (model), s 4.40 6.19 8.90 10.85 13.73 15.57 17.99
t90 (experiment), s 7.00 7.67 10.33 11.00 14.00 15.33 18.00
Hysteresis (model), mV 5.26 6.3 6.49 6.34 9.48 8.17 9.42
Hysteresis (experiment), mV 7.41 8.02 8.50 8.10 9.28 11.03 11.66
From Table 3-3, we can observe that τ1 has a larger amplitude ε1 (than ε2) at all pH values,
indicating the response time of the sensor is mainly determined by the fast process (the
“formation” of the pseudocapacitor due to the redox reactions). In addition, τ2 has a larger
value but smaller amplitude than τ1, which suggests that the dispersive transport of ions is
a slower process and does not significantly affect the overall sensor response in a short
period of time (90 s in this case). Because the sensor response curves are steep for t < 15 s
(Figure 3-10), a linear approximation can be used to calculate the response time (t90) of the
sensor (Figure 3-11). The time constant is defined as the time required for the output to
reach ~63% of its final value, thus the response time can be calculated by:
90 11.5 .t (3.5)
Figure 3-11. The linear approximation of the sensor response for the calculation of response time using the
time constant extracted from the two time constant model.
In Figure 3-12, we can observe that the response time values obtained by experimental
measurements agree well with the theoretical calculations using the extracted τ1 and
equation (3.5), showing the feasibility of using the two time constant model to predict the
sensor performance. Another feature in Figure 3-12 (for both experimental and modeling
0%
30%
60%
90%
120%
0 1 2 3
Re
sp
on
se
Timet90
t63 (τ1)
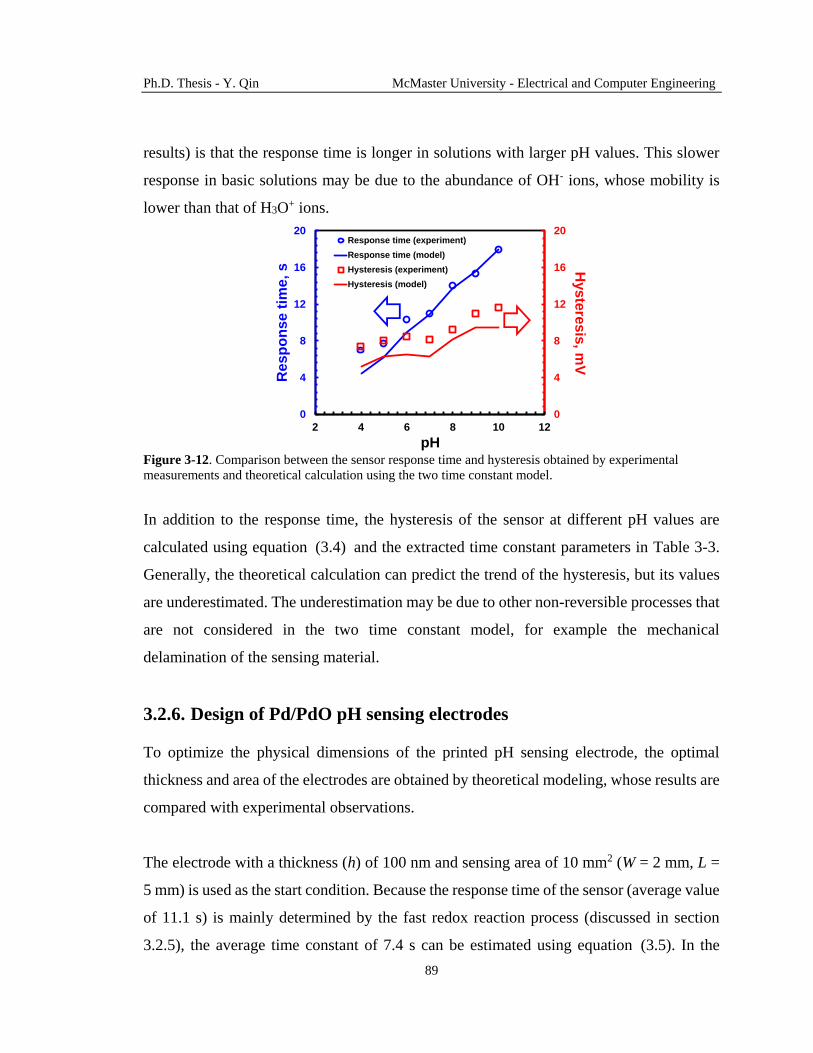
Ph.D. Thesis - Y. Qin McMaster University - Electrical and Computer Engineering
89
results) is that the response time is longer in solutions with larger pH values. This slower
response in basic solutions may be due to the abundance of OH- ions, whose mobility is
lower than that of H3O+ ions.
Figure 3-12. Comparison between the sensor response time and hysteresis obtained by experimental
measurements and theoretical calculation using the two time constant model.
In addition to the response time, the hysteresis of the sensor at different pH values are
calculated using equation (3.4) and the extracted time constant parameters in Table 3-3.
Generally, the theoretical calculation can predict the trend of the hysteresis, but its values
are underestimated. The underestimation may be due to other non-reversible processes that
are not considered in the two time constant model, for example the mechanical
delamination of the sensing material.
3.2.6. Design of Pd/PdO pH sensing electrodes
To optimize the physical dimensions of the printed pH sensing electrode, the optimal
thickness and area of the electrodes are obtained by theoretical modeling, whose results are
compared with experimental observations.
The electrode with a thickness (h) of 100 nm and sensing area of 10 mm2 (W = 2 mm, L =
5 mm) is used as the start condition. Because the response time of the sensor (average value
of 11.1 s) is mainly determined by the fast redox reaction process (discussed in section
3.2.5), the average time constant of 7.4 s can be estimated using equation (3.5). In the
0
4
8
12
16
20
0
4
8
12
16
20
2 4 6 8 10 12
Hyste
resis
, mV
Resp
on
se t
ime,
s
pH
Response time (experiment)
Response time (model)
Hysteresis (experiment)
Hysteresis (model)

Ph.D. Thesis - Y. Qin McMaster University - Electrical and Computer Engineering
90
equivalent circuit in Figure 3-9, the time constant of this redox reaction process is
determined by the lumped electrode capacitance and resistance. Thus, we can write:
1 7.4 s,m m e F e spec e e spec PdO surfR C R C R C m R C WLh (3.6)
or
1 0 7.4 s,eR C WL (3.7)
where Re ≈ 40 kΩ is the measured electrode resistance, Cspec is the specific
pseudocapacitance of the Pd/PdO sensing material, me is the mass of the electrode surface
layer, and ρPdO is the density of PdO, hsurf ≈ 10 nm is the thickness of the surface Pd/PdO
which participate in the redox reaction [235], C0 = ρPdOhsurfCspec is the pseudocapacitance
of the Pd/PdO sensing material per unit area. Note that the parasitic capacitance Ce can be
neglected here because its value is much smaller than the pseudocapacitance CF. Therefore,
we can find:
2
0223 F g or 1850 μF cm ,specC C (3.8)
which agrees with previously reported values for transition metal oxide electrodes [227].
First, we study the size effect on the sensing performance of the PSEs on glass substrates
by keeping the electrode thickness constant (100 nm). In total 5 sizes are studied with
different electrode widths and lengths (W × L = 0.5 mm × 2 mm, 2 mm × 5 mm, 3 mm × 8
mm, 4 mm × 10 mm, 5 mm × 10 mm). According to a previous study [236], if the pH of a
solution changes by 1 and assume the potential at the reference electrode (Eref) is constant,
the measured output voltage of the pH sensor (ΔEmeas) will change by (Figure 3-9):
,mmeas sen
m e c
CE E
C C C
(3.9)
where ΔEsen = 65 mV/pH is the intrinsic pH sensitivity of the electrode (section 2.3.4),
Because Cm is a function of the electrode geometry while Cc and Ce are independent of the
electrode geometry, the measured pH sensitivity can be written as:
0
0
.meas sen
e c
C WLE E
C WL C C
(3.10)

Ph.D. Thesis - Y. Qin McMaster University - Electrical and Computer Engineering
91
When the electrode with W = 2 mm, L = 5 mm, h = 100 nm, and ΔEmeas = 65 mV/pH, is
used as the reference condition, the parasitic capacitance of the PSE (Ce) is found to be ~15
μF using equation (3.10). This large parasitic capacitance may be caused by the large
surface area of the NP-fused Pd/PdO electrical connection (Figure 2-1(d) and Figure 3-9).
More study is needed to find the exact value of the specific capacitance of the inkjet-printed
Pd/PdO film. Using equation (3.10) with the extracted values for C0 and Ce, the size effect
on the sensitivity of the PSEs can be studied and plotted in Figure 3-13. We find that the
theoretical calculation results agree well with the experimental data. Also, near-Nernstian
sensitivities were obtained when the PSEs were larger than 10 mm2. If the PSEs were
smaller than 10 mm2, a sensitivity drop could be observed. This observation suggests that
a larger sensing area is preferred for a highly sensitive sensor. Importantly, this calculation
also indicates that, for further miniaturization of the sensor, the sensitivity can be improved
by using a dense and highly conductive material (such as Au and Pt used in other studies)
as the electrical connection and the underlayer of the sensing electrode.
Figure 3-13. Effect of Pd/PdO electrode size on the pH sensitivity, response time, and hysteresis.
The response time of the sensor can be estimated using equations (3.5) and (3.6):
2
090 1 0 01.5 1.5 1.5 1.5 ,e
L L Ct R C WL C WL
Wd d
(3.11)
where the response time only depends on the length and thickness of the electrode, not the
electrode width. Therefore, in Figure 3-13, we can observe similar response time values for
0
5
10
15
20
25
30
35
40
0
10
20
30
40
50
60
70
0 10 20 30 40 50
Re
sp
on
se
time, s
or
Hy
este
resis
, mV
Sen
sit
ivit
y, m
V/p
H
Electrode size, mm2
Sensitivity (experiment)
Sensitivity (model)
Response time (experiment)
Response time (model)
Hysteresis (experiment)
Hysteresis (model)

Ph.D. Thesis - Y. Qin McMaster University - Electrical and Computer Engineering
92
the electrodes with an area of 40 mm2 and 50 mm2 (because both their lengths are 10 mm).
Note that the deviation between the calculated and the experimental response time is large
for the electrode of 1 mm2. This large difference may be caused by the relatively significant
effect of τ2, because τ1 for such a small electrode is tiny (~0.5 s). However, the dispersive
transport process is difficult to be modeled for Pd/PdO due to the lack of parameters such
as the density of reaction sites, the amount physical-chemical defects, the relaxation time
for traps, and many other properties of the sensing material.
The hysteresis of the sensors can be calculated by equation (3.4), where the values of τ1
are calculated based on equation (3.11). In addition, ε1 ≈ 0.5, τ2 ≈ 200, and ε2 ≈ 0.1 are
extracted from the fitted response curves (similar to Figure 3-10). The agreement between
the modeling and experimental results is shown in Figure 3-13. Similar to the response time,
the experimentally observed hysteresis is much larger than the modeling result for the
electrode of 1 mm2. This deviation is caused by the inaccurate estimation of τ2 for an
electrode with a small sensing area.
Next, we study the thickness effect on the sensing performance of the PSEs by keeping the
electrode area constant (2 mm × 5 mm). According to section 3.2.2 and 3.2.3, we can
observe that the Pd/PdO film contains more defects and pores as its thickness reduces. Thus,
we introduce a porosity factor (pr) for the correction of the length of the Pd/PdO film. So
equation (3.10) is modified for calculating the pH sensitivity as a function of electrode
thickness (Cc is negeleted due to its small value comparing with Ce):
0
0
,rmeas sen
r e
C WLpE E
C WLp C
(3.12)
where pr is an empirical parameter and its values for different electrode thicknesses are
listed in Table 3-4. Figure 3-14 shows that a thicker PSE had a higher sensitivity, which
saturates at the Nernst limit for PSEs over 100 nm thick. The low sensitivity of thin PSEs
was caused by both the poor morphologies and the large electrical resistance of the Pd/PdO
films. On the one hand, pinholes and cracks exposed the substrates and reduced the
effective surface area (Figure 3-4(b-d)), resulting in a reduced sensitivity. On the other hand,

Ph.D. Thesis - Y. Qin McMaster University - Electrical and Computer Engineering
93
the redox reactions between PdO and H3O+ ions generated electrons, which had to be
transferred to external circuits for potentiometric sensing. The pinholes and cracks in the
PSEs increased the electrode resistance (Figure 3-4(h)) and hindered the conduction of
electrons, thus lowering the pH sensitivity.
Table 3-4. Extracted parameters for a two time constant model for the modeling of the pH step response of
electrodes with different thicknesses. Electrode thickness, nm 25 35 70 80 100 150 170
ε1 0.70 0.73 0.77 0.71 0.75 0.79 0.76
τ1, s 25.0 16.2 5.1 4.6 3.4 4.0 4.8
ε2 0.39 0.36 0.33 0.35 0.29 0.30 0.24
τ2, s 998 911 532 445 254 223 220
pr 0.50 0.60 0.80 0.85 1.00 1.10 1.15
t90 (model), s 37.5 24.3 7.7 6.9 5.1 6.0 7.1
t90 (experiment), s 24.5 13.7 5.6 5.1 7.9 8.2 9.5
Hysteresis (model), mV 18.8 15.9 6.4 6.1 5.8 6.5 7.3
Hysteresis (experiment), mV 23.4 21.0 7.6 10.8 7.0 4.0 5.4
Figure 3-14. Effect of Pd/PdO electrode thickness on the pH sensitivity, response time, and hysteresis.
In terms of response time, equation (3.11) is modified using the porosity factor:
2 2
090 1.5 .rL p C
td
(3.13)
Fast responses (~8 s) were found for the PSEs thicker than 80 nm. Below this thickness,
the response time increased significantly. The slow response for thin PSEs was attributed
to the loosely-packed films that increased the migration path for H3O+ [237]. PSEs thicker
than 170 nm were not studied here because of their poor adhesion to the glass substrate
0
5
10
15
20
25
30
35
40
0
10
20
30
40
50
60
70
0 50 100 150 200
Re
sp
on
se
time
, so
rH
ys
tere
sis
, mV
Se
ns
itiv
ity,
mV
/pH
Electrode thickness, nm
Sensitivity (experiment)
Sensitivity (model)
Response time (experiment)
Response time (model)
Hysteresis (experiment)
Hysteresis (model)

Ph.D. Thesis - Y. Qin McMaster University - Electrical and Computer Engineering
94
when immersed in solutions. Using equation (3.4), the hysteresis values are calculated,
which are close to the experimental results. Finally, we conclude that an optimal PSE had
a size of 10 mm2 and a thickness of 100 nm.
3.3. Integrated pH sensors
3.3.1. Fabrication process
To prove the potential application of the PSEs in future compact, low-cost electrochemical
monitoring systems, potentiometric pH sensors were integrated on glass and PI substrates
using Pd/PdO PSEs and Ag/AgCl/KCl printed reference electrodes (PREs). The integration
process is shown in Figure 3-15.
Figure 3-15. Integration process of a pH sensor using printing techniques. (a1) Substrate cleaning. (a2) Air
plasma treatment of PI substrate. (b) Inkjet printing of Pd ink. (c) Thermolysis and annealing of printed Pd to
form Pd/PdO sensing electrode. (d) Inkjet printing of SU-8 ink as adhesion between Ag and the substrate. (e)
Inkjet printing of AgNP ink for the reference electrode. (f) Pipette printing of NaOCl ink for the chlorination
of the surface of Ag. (g) Pipette printing of PVC/KCl/AgCl ink to form the solid electrolyte of the reference
electrode, and painting of Ag paste for electrical contacts.
First, glass and PI substrates were cleaned by rinsing with IPA and DI water and dried
under compressed dry air (Figure 3-15(a1)). For PI substrates, a 2-min air plasma treatment
was performed before the printing processes (Figure 3-15(a2)). Next, one layer of Pd-PhMe
ink was inkjet-printed onto the substrates (Figure 3-15(b)). The printed Pd-PhMe was
converted to a PSE (100 nm thick and 10 mm2 large) using 2-step thermolysis and annealed
IPADI
H2O
Glass or PI substrate
(a1)
PI substrate
air plasma
(a2)
Pd/PdO
(c)
SU-8 ink
(d)
Ag ink
(e)
NaOCl
ink
DI
H2O
Ag/AgCl
(f)
PVC/KCl/AgCl
ink
Ag paste
(g)
Pd ink
printhead(b) 200 ºC, 48 h

Ph.D. Thesis - Y. Qin McMaster University - Electrical and Computer Engineering
95
at 200 ºC for 48 h (Figure 3-15(c)). Afterwards, an SU-8 ink was prepared by diluting the
as-received SU-8 3035 photoresist to 7.4 wt% using PGMEA (Table 3-1). The SU-8 ink
was inkjet-printed beside the PSE and cured to form an 8 mm 25 mm block with a
thickness of ~100 nm (Figure 3-15(d)). The printed SU-8 layer adhered to glass and PI
substrates well, and could be used as an interfacial layer between Ag (to be printed in the
next step) and the substrates (Table 3-2). Then, the PRE was fabricated based on previous
reports [238], [239] with modifications, as explained below.
Figure 3-15(e) shows a Ag NP ink (Table 3-1) that was inkjet-printed on the SU-8 layer
and annealed at 120 ºC for 10 min to form a 300 nm thick Ag layer (5 mm 10 mm).
Subsequently, a NaOCl ink was prepared by diluting the as-received NaOCl solution to 0.4
wt% using DI water. The high surface tension (~72 cP) of the aqueous solution was reduced
to ~31 cP by adding 2 vol% Triton™ X-100 surfactant so that the ink was printable (Table
3-1). To chlorinate the top part of the printed Ag, ~0.1 mL NaOCl ink was required. This
amount of ink could not be deposited within 100 layers of printing because the jetting
capability of the printhead was ~10 pL per droplet. Therefore, to improve the process
efficiency, ~0.1 mL NaOCl ink was printed from a pipette to the Ag surface and allowed
to chlorinate the Ag for ~30 s before rinsing with DI water (Figure 3-15(f)). The SEM
images of the printed Ag layer before and after chlorination is shown in Figure 3-16(a) and
(b). XPS analyses shown in Figure 3-16(c) confirmed the formation of AgCl on top of Ag.
A printable ink for the solid electrolyte was formulated by dissolving 2 wt% PVC in KCl-
and AgCl-saturated cyclohexanone (Table 3-1). Also due to the limited jetting capability
of the printhead, ~0.2 mL PVC/KCl/AgCl ink was printed from a pipette on top of Ag/AgCl
(Figure 3-15(g)) to form a thick (~1 μm) solid electrolyte layer. Finally, Ag paste was
manually painted and annealed at 160 ºC for 10 min as electrical connections. The sensors
with integrated PSE and PRE were conditioned in 1 M KCl solution for 12 h before testing.

Ph.D. Thesis - Y. Qin McMaster University - Electrical and Computer Engineering
96
Figure 3-16. (a) SEM image of the surface morphology of a printed Ag layer. (b) SEM image of the surface
morphology of a printed AgCl layer. (c) XPS analysis of the surfaces of printed Ag and AgCl layers.
3.3.2. Evaluation of pH sensing performance
3.3.2.1. pH sensitivity
Figure 3-17(c) displays the sensitivity of an integrated sensor on a glass substrate. Due to
the constant PRE potential (SD = 1.5 mV), the sensitivity of the integrated sensor (60.6 ±
0.1 mV/pH) was almost identical to that of a PSE (60.6 mV/pH, referenced to a CRE). On
PI (Figure 3-17(d)), the SD of the PRE potential was 2.4 mV and the sensitivity of the
integrated sensor was 57 ± 0.6 mV/pH. Because the thermal conductivity of PI (0.12
W/m·K) was lower than that of glass (0.8 W/m·K) [180], it took a longer time for the Pd
ink on PI to reach its decomposition temperature. A longer time before precursor
decomposition resulted in more spreading and a thinner ink layer. Hence, the thinner PSE
on PI (~80 nm comparing to ~100 nm on glass) may be the reason for this lower sensitivity.
02004006008001000
Binding energy, eV
Ag Ag/AgCl
Ag 3p
Ag 3d
Cl 2s Cl 2p
Ag 3p Ag 3d
O 1s
O 1s
1 μm 1 μm
10000 counts
(a) (b)
(c)

Ph.D. Thesis - Y. Qin McMaster University - Electrical and Computer Engineering
97
Figure 3-17. (a) Temporal response of an integrated sensor on glass when the pH of buffer solutions cycles
between 4 and 10; inset: photograph of an integrated sensor on glass. (b) Temporal response of an integrated
sensor on PI when the pH of buffer solutions cycles between 4 and 10; inset: photograph of an integrated
sensor on PI. (c) Open circuit potential versus pH values for an integrated sensor on glass. (d) Open circuit
potential versus pH values for an integrated sensor on PI. (e) Drift behavior an integrated sensor on glass. (f)
Drift behavior an integrated sensor on PI.
According to the Nernst equation (2.22), the pH sensitivity is a function of temperature.
To verify this dependence, the sensitivity of the pH sensor was measured at 3 °C, 15 °C,
27 °C and 40 °C. The pH sensitivity showed a linear temperature dependence of ~0.23
mV/pH/°C, which was close to the theoretical value of 0.2 mV/pH/°C (Figure 3-18).
100
200
300
400
500
0 4 8 12 16
Po
ten
tia
l, m
V
Time, h
PSE vs. CRE PRE vs. CRE
PSE vs. PRE
Drift: -0.3 mV/h
Drift: 0.3 mV/h
Drift: 0.6 mV/h
100
200
300
400
500
0 4 8 12 16
Po
ten
tia
l, m
V
Time, h
PSE vs. CRE PRE vs. CRE
PSE vs. PRE
Drift: 1.0 mV/h
Drift: 1.6 mV/h
Drift: -0.6 mV/h
0
100
200
300
400
500
600
700
4 5 6 7 8 9 10
Po
ten
tia
l, m
V
pH
PSE vs. CRE
PRE vs. CRE
PSE vs. PRE
SD: 1.5 mV
60.6 mV/pH
60.6 mV/pH
(c)
(e)
0
100
200
300
400
500
600
700
4 5 6 7 8 9 10
Po
ten
tial, m
V
pH
PSE vs. CRE
PRE vs. CRE
PSE vs. PRE
SD: 2.4 mV
57.5 mV/pH
57.0 mV/pH
(d)
(f)
0
100
200
300
400
500
600
700
0 500 1000 1500
Po
ten
tia
l, m
V
Time, s
4
5
6
7
8
9
10
0
100
200
300
400
500
600
700
0 300 600 900 1200
Po
ten
tial,
mV
Time, s
PSE vs. CRE
PRE vs. CRE
PSE vs. PRE
(a)
0
100
200
300
400
500
600
700
0 500 1000 1500
Po
ten
tial,
mV
Time, s
PSE vs. CRE
PRE vs. CRE
PSE vs. PRE
4
5
6
7
8
9
10
(b)
0
100
200
300
400
500
600
700
0 500 1000 1500
Po
ten
tia
l, m
V
Time, s

Ph.D. Thesis - Y. Qin McMaster University - Electrical and Computer Engineering
98
Figure 3-18. The measured sensitivity of the pH sensor as a function of temperature.
3.3.2.2. Response time
The temporal pH response of the printed sensors on glass and PI were measured after 12-h
conditioning in 1 M KCl. The results are shown in Figure 3-17(a) and (b). The PREs
exhibited negligible response between pH = 4 and 10 (referenced to a CRE), suggesting
that the PREs could replace CREs in integrated sensors. Also, fast responses of the PSE
were observed upon pH variations, which is important for real-time measurements. The
response time is determined by the transportation speed of H3O+ ions from the bulk solution
to the PSE surface, as well as the rate of reactions between H3O+ ions and the surface sites
of the PSE. The integrated sensor displayed a response time of 11 s and 6 s on a glass and
on a PI substrate, respectively. The difference in response time was mainly due to the
different film morphologies on the two types of substrates. The 100 nm thick Pd films on
glass contained pinholes and cracks (Figure 3-4(b)), which increased the migration path for
H3O+ ions and slowed the response [237]. On PI substrates, the redox reaction (2.4) was
limited at the surface of the closely-packed films, which resulted in a fast response.
3.3.2.3. Reversibility and drift
Another important factor limiting the sensors’ accuracy is hysteresis, which is difficult to
avoid. It is a combined effect of buried and slow-reaction sites in the PSEs, and is also
affected by the mechanical stability of the sensing material [166]. In our study, the
hysteresis was 8.9 mV for the sensor on glass, and was 5.3 mV for the sensor on PI. These
response time and hysteresis values are comparable with other studies [80], [126], [166].
We believe that the hysteresis is caused by the presence of Pd in the PSE, because Pd can
y = 0.2347x + 54.776R² = 0.9907
50
55
60
65
70
0 10 20 30 40
Sen
sit
ivit
y, m
V/p
HTemperature, ⁰C
Ph.D. Thesis - Y. Qin McMaster University - Electrical and Computer Engineering
99
have irreversible redox reactions with H3O+ in the solution, especially at low pH values
[196].
The drift behavior of the integrated sensors was studied in 1 M KCl solution at 27 ± 2 °C
in the dark for 16 h. On glass (Figure 3-17(e)), the drift of the PSE was 1 mV/h, and for the
PRE, -0.6 mV/h. The drift of both electrodes resulted in the integrated sensor’s drift of 1.6
mV/h, which is similar to previous studies [166]. The printed Pd/PdO film delaminated at
a slower rate on PI than on glass, due to the surface nitrogen atoms induced better adhesion
of Pd to PI. Thus, a lower drift rate of 0.6 mV/h was obtained for the integrated sensor
(Figure 3-17(f)).
3.3.2.4. Stability
A very important parameter for practical sensors is stability which specifies how the
sensor’s characteristics change with time. Therefore, we studied the stability of the
integrated sensors stored in 1 M KCl solution at 27 ± 2 °C and in dark over a period of 70
days. Figure 3-19 shows the change of sensitivity with storage time. After sensor
fabrication (day 0, before being stored in 1 M KCl), the sensitivities of the PSEs were
measured against a CRE because the PREs must be conditioned before use (triangles at day
0). The PSEs on glass and PI had a high sensitivity of 63.6 mV/pH (blue triangle at day 0)
and 60.2 mV/pH (red triangle at day 0), respectively. The difference in sensitivity may be
due to the different PSE thicknesses, as discussed above. After storage in 1 M KCl, the
sensor on PI had a slightly lower but stable sensitivity of ~57 mV/pH (red squares between
day 1 and 31). The sensitivity drop was due to the rearrangement of surface Pd and oxygen
atoms, the formation of surface -OH groups, and the relief of stress in the Pd/PdO film
[240]. After 35 days of storage, the PRE delaminated from the substrate. The sensitivity of
the PSE between day 38 and 70 was then assessed using a CRE, and was found to be stable
during this period (red triangle between day 38 and 70). In contrast, the sensitivity of the
sensor on glass kept decreasing (blue circles between day 1 and 20) until the PSE

Ph.D. Thesis - Y. Qin McMaster University - Electrical and Computer Engineering
100
delaminated after 23 days of storage. The low stability of such sensors was primarily due
to the poor adhesion between the printed Pd film and glass.
Figure 3-19. Stability of integrated sensors on glass and PI.
3.3.2.5. Selectivity
In addition, the selectivity was studied by immersing the sensor into solutions containing
different concentrations of interfering ions. The solid electrolyte layer on top of the
Ag/AgCl electrode is very critical for maintaining a stable electrical potential at the
reference electrode. Without such a layer, the PRE showed a sub-Nernstian response (~50
mV/decade of Cl- ion concentration) towards Cl- ions (Figure 3-20(a)) in the solution due
to the reaction [238]:
Ag Cl AgCl e . (3.14)
If the solid electrolyte layer is used, the electrical potential at the PRE was stable in
solutions with 10 μM to 1 M of Cl- ions (SD of potential = 1.83 mV). This was because the
relatively constant Cl- ion concentration in the electrolyte layer kept reaction (3.14) in
equilibrium.
Although reaction (3.14) only indicates the dependence of Cl- ion concentration of the
PRE, the un-protected AgCl layer exhibited an unstable potential in solutions with different
pH values. At high pH levels (pH > 9), the solubility of AgCl increases so the amount of
AgCl on the PRE reduces [241], and the equilibrium of reaction (3.14) is deteriorated. In
the acid solution (pH < 4), the amount of H3PO4 (in the pH buffer solution) increased. The
53
55
57
59
61
63
65
0 20 40 60 80
Sen
sit
ivit
y,
mV
/pH
Time, days
PSE vs. PRE (on glass)
PSE (on glass) vs. CRE
PSE vs. PRE (on PI)
PSE (on PI) vs. CRE

Ph.D. Thesis - Y. Qin McMaster University - Electrical and Computer Engineering
101
potential at the PRE was also affected by phosphate ions (in addition to reaction (3.14))
[242]:
3
4 3 4Ag PO Ag PO 3e . (3.15)
Therefore, the bare Ag/AgCl could only show a stable potential between pH = 4 and 9,
while the SD of the potential of the solid-electrolyte-coated PRE was 1.65 mV in a wider
pH range of 3 to 10 (Figure 3-20(b)).
Figure 3-20. The electrical potential stability of a PRE in solutions with: (a) Different concentrations of Cl-
ions. (b) Different pH values.
Once the PRE provides a stable potential, the sensor revealed negligible response to
common anions and cations (Figure 3-21) due to the specific redox reaction (2.4). We
believe the only minor voltage variations shown in Figure 3-21 were attributed to the
exchange of potassium ions (K+) or Cl- ions between the solutions and the solid electrolyte
layer on the PRE.
0
100
200
300
400
500
3 4 5 6 7 8 9 10
Po
ten
tia
l V
s.
CR
E,
mV
pH
Ag/AgCl
Ag/AgCl-PVC/KCl/AgCl
0
100
200
300
400
500
1E-6 1E-5 1E-4 1E-3 1E-2 1E-1 1E+0
Po
ten
tia
l V
s.
CR
E,
mV
[Cl-], M
Ag/AgCl
Ag/AgCl-PVC/KCl/AgCl
(a) (b)
SD = 1.83 mV SD = 1.65 mV
SD = 3.56 mV
Slope ~50 mV/dec.
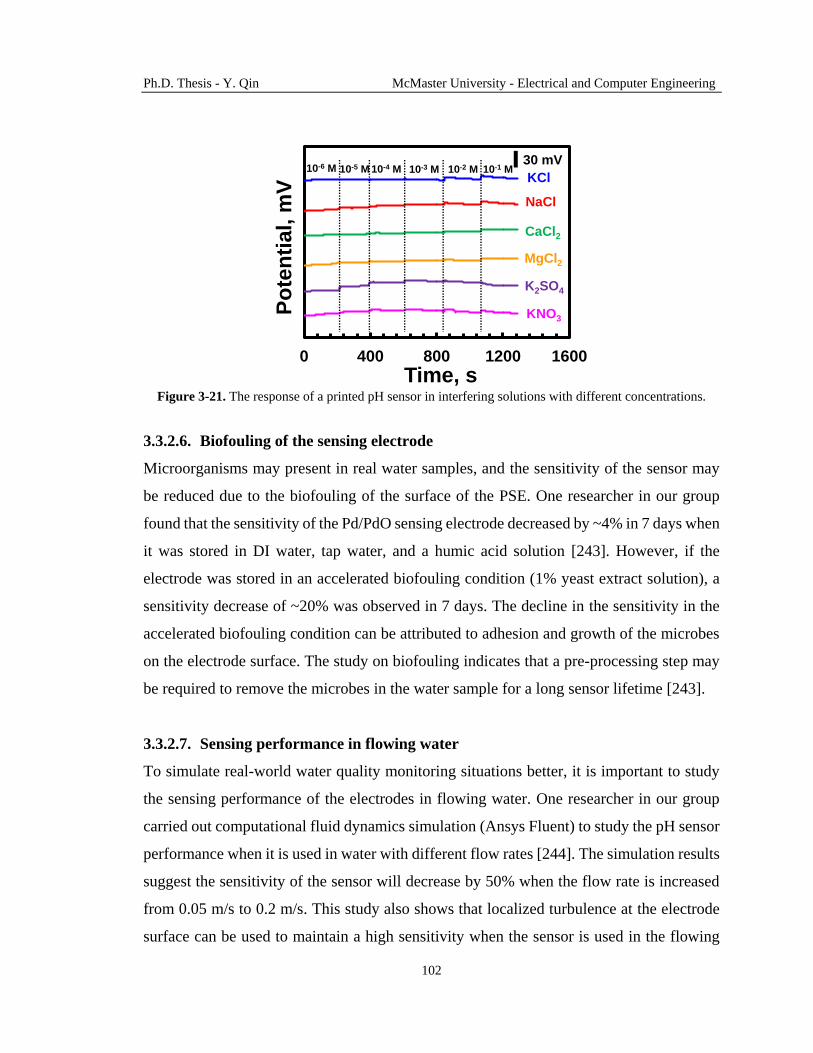
Ph.D. Thesis - Y. Qin McMaster University - Electrical and Computer Engineering
102
Figure 3-21. The response of a printed pH sensor in interfering solutions with different concentrations.
3.3.2.6. Biofouling of the sensing electrode
Microorganisms may present in real water samples, and the sensitivity of the sensor may
be reduced due to the biofouling of the surface of the PSE. One researcher in our group
found that the sensitivity of the Pd/PdO sensing electrode decreased by ~4% in 7 days when
it was stored in DI water, tap water, and a humic acid solution [243]. However, if the
electrode was stored in an accelerated biofouling condition (1% yeast extract solution), a
sensitivity decrease of ~20% was observed in 7 days. The decline in the sensitivity in the
accelerated biofouling condition can be attributed to adhesion and growth of the microbes
on the electrode surface. The study on biofouling indicates that a pre-processing step may
be required to remove the microbes in the water sample for a long sensor lifetime [243].
3.3.2.7. Sensing performance in flowing water
To simulate real-world water quality monitoring situations better, it is important to study
the sensing performance of the electrodes in flowing water. One researcher in our group
carried out computational fluid dynamics simulation (Ansys Fluent) to study the pH sensor
performance when it is used in water with different flow rates [244]. The simulation results
suggest the sensitivity of the sensor will decrease by 50% when the flow rate is increased
from 0.05 m/s to 0.2 m/s. This study also shows that localized turbulence at the electrode
surface can be used to maintain a high sensitivity when the sensor is used in the flowing
0 400 800 1200 1600
Po
ten
tial, m
V
Time, s
KCl
NaCl
CaCl2
MgCl2
K2SO4
KNO3
30 mV10-6 M 10-5 M 10-4 M 10-3 M 10-2 M 10-1 M

Ph.D. Thesis - Y. Qin McMaster University - Electrical and Computer Engineering
103
water. The localized turbulence can be created by introducing groove structures on top of
the electrodes in the water flowing channel [244].
3.3.3. Test of real water samples
To prove the practical usability of the integrated sensors, the PSE and PRE (stored in 1 M
KCl for 12 h) were connected to a commercial multimeter (72-7730, TENMA) for
recording the open-circuit potential. The output potential was converted to the pH value of
real water samples using the calibration curves shown in Figure 3-17(c) and (d). A single-
point calibration using the pH = 7 buffer solution was done prior to the measurements for
an accurate result. Figure 3-22 is the summary of the test results for 9 types of water samples.
In all cases, the differences between the calculated pH values (using measured potential)
for the printed sensors and the pH readings for a commercial pH meter were less than 2%.
In addition, these accurate results were obtained using a simple test setup without using
complicated instruments. This indicated the possibility of building highly accurate, easy-
to-use, low-cost pH sensing systems that incorporate the printed sensors developed in this
study.
Figure 3-22. pH measurement results of real water samples using the integrated sensors on glass and on PI.
6.6
6.8
7.0
7.2
7.4
7.6
7.8
8.0
8.2
8.4
6.6 6.8 7.0 7.2 7.4 7.6 7.8 8.0 8.2 8.4
Calc
ula
ted
pH
valu
es f
rom
p
rin
ted
pH
se
ns
ors
pH readings from a commercial pH meter
Printed sensor on glass
Printed sensor on PI
PSE PRE
Water
sample

Ph.D. Thesis - Y. Qin McMaster University - Electrical and Computer Engineering
104
3.4. Conclusions
We have developed an inkjet printing process for a highly loaded Pd ink to deposit Pd thin
films. The viscosity and surface tension of as-received Pd precursor solution was adjusted
by 20 wt% toluene to form a printable ink. The printed ink was converted to continuous,
homogenous, low-resistivity Pd films using a 2-step thermolysis. The printed Pd films
exhibited good adhesion to air-plasma-treated PI substrates. To demonstrate the
electrochemical application of the printed Pd films, an annealing step was carried out at
200 °C in air. The resulted PdO-rich surface served as a pH sensing layer while the
underlying conductive layer provided a path for electrons. The bifunctional Pd/PdO PSEs
were designed with a size of 10 mm2 and a thickness of 100 nm for an optimal sensitivity
and response time. These PSEs were then integrated with solid-state PREs to form
potentiometric sensors. The integrated sensors on glass and PI showed a fast and repeatable
pH response with a sensitivity of 60.6 ± 0.1 mV/pH and 57 ± 0.6 mV/pH, respectively.
Also, accurate pH values of real water samples were obtained with the printed sensors.
Because the drop-on-demand inkjet printing process consumes a small amount of
functional materials and can be easily scaled up, these printed sensors can be very cost-
effective for large-scale manufacturing. Finally, since the developed sensors are of high
sensitivity and with a fast response, and are stable, low-cost, and easy-to-use, then an
electrochemical sensing platform based on such sensors can be built for monitoring
drinking water quality.

Ph.D. Thesis - Y. Qin McMaster University - Electrical and Computer Engineering
105
Chapter 4
Inkjet-printed Pd/PdO for temperature
sensors*
In this chapter, inkjet-printed Pd films with different morphologies are prepared using
different precursor thermolysis atmospheres. The temperature dependence of the electrical
properties of the Pd films are characterized for the development of inkjet-printed
temperature sensors. First, the Pd precursor is reductively decomposed into amine-
stabilized Pd clusters. In air, O2 assists the decomposition of the organoamine ligands for
the Pd clusters. Small NPs are formed and fused into smooth films. In N2, the residual
ligands facilitate the formation of sub-micron spherical aggregates. In low vacuum, a
bilayer film containing a bottom layer with fused NPs and a top layer with spherical
aggregates is formed. Such morphology is caused by the competition between the film
formation processes in air and in N2. The electrical properties of the films are determined
by the whole film for the smooth film and by the bottom layer for the bilayer film. The
TCR value of the films can be adjusted from 0.067% /°C to -0.189% /°C by tuning the
amount of semiconductive PdO in the conduction path. In addition, humid air increases the
resistance drift of the films by forming surface-adsorbed -OH groups and/or molecular
water. This study suggests that printed temperature sensors can be fabricated by adjusting
the atmosphere for the thermolysis of the Pd precursor.
* Adapted from Y. Qin, A. U. Alam, M. M. R. Howlader, N.-X. Hu, and M. J. Deen, “Morphology and
electrical properties of inkjet-printed palladium/palladium oxide,” J. Mater. Chem. C, vol. 5, no. 8, pp. 1893–
1902, 2017, with permission from The Royal Society of Chemistry (Appendix E).

Ph.D. Thesis - Y. Qin McMaster University - Electrical and Computer Engineering
106
4.1. Background
In Chapter 2 and Chapter 3, we showed that the sensitivity of a pH sensor is a function of
temperature. Thus, a temperature sensor needs to be integrated with the pH sensor for
accurate monitoring of the pH of a drinking water sample. One of the commonly used
temperature sensor is a RTD, whose resistivity changes with temperature. The TCR of a
metallic material is positive [37], while that of a semiconductor is negative [38]. In Chapter
3, we have demonstrated inkjet-printed metallic Pd and semiconductive PdO films, whose
electrical resistivity should depend on temperature. Therefore, sensitive temperature
sensors can be prepared using the printed Pd and PdO if they show large absolute TCR
values (can be either positive or negative).
The electrical properties of vacuum-processed Pd/PdO films were reported [245]–[247].
For example, the TCR was 3.3% /°C for a sputtered Pd film and -3.6% /°C for a thermally
oxidized PdO film. However, these values could not be used for the inkjet-printed films
due to the organic additives in the Pd ink and the different deposition atmospheres [248].
One important factor affecting the electrical properties (including TCR) of an inkjet-printed
Pd/PdO film is its morphology. For example, small (sub-10 nm) and dispersed Pd/PdO NPs
in power sources ensure a high catalytic activity, fuel efficiency, and power density [208],
[249]. Nano/micro-textured Pd/PdO films used in hydrogen sensors are responsible for a
high sensitivity and a fast response [250]–[252]. Dense and smooth Pd films are required
for highly conductive electrical interconnections and highly sensitive electrochemical
sensors [81], [166], [253]. To obtain these Pd/PdO films with different morphologies,
lithographical steps or structural templates are needed [250]–[252], which increases the
complexity and cost of the fabrication processes. Although our developed inkjet printing
process can simplify the deposition of Pd/PdO films, its capability to produce films with
different morphologies was not studied.
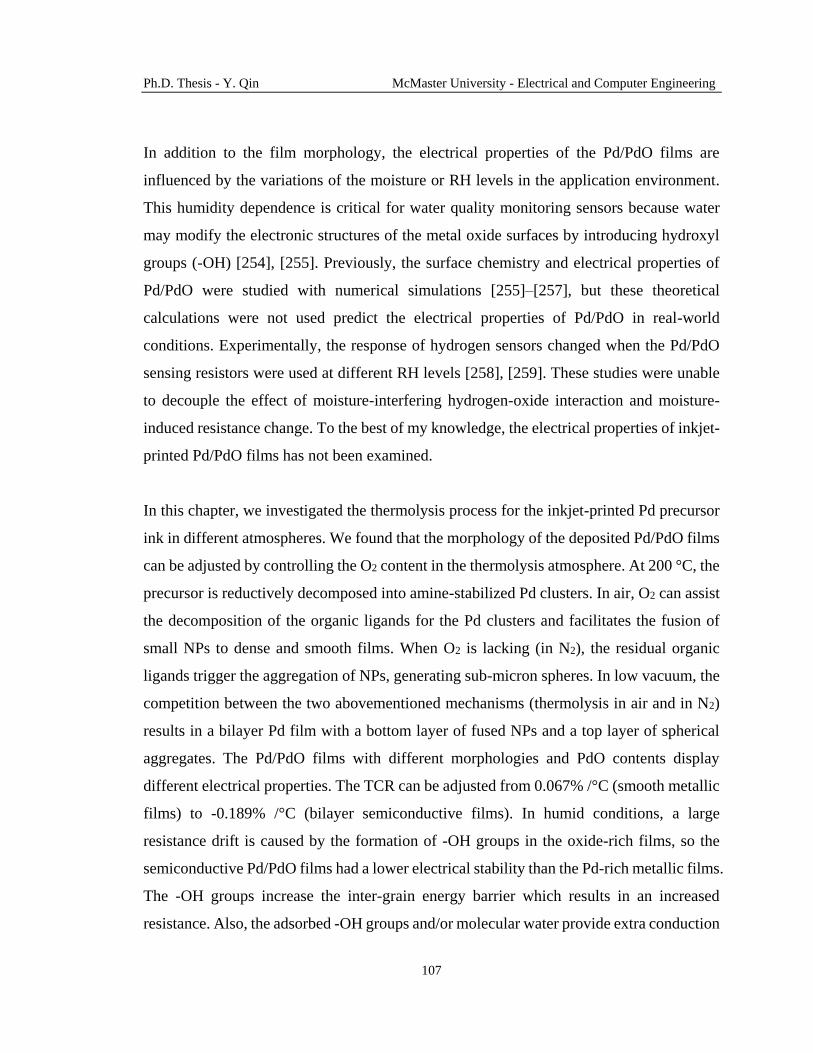
Ph.D. Thesis - Y. Qin McMaster University - Electrical and Computer Engineering
107
In addition to the film morphology, the electrical properties of the Pd/PdO films are
influenced by the variations of the moisture or RH levels in the application environment.
This humidity dependence is critical for water quality monitoring sensors because water
may modify the electronic structures of the metal oxide surfaces by introducing hydroxyl
groups (-OH) [254], [255]. Previously, the surface chemistry and electrical properties of
Pd/PdO were studied with numerical simulations [255]–[257], but these theoretical
calculations were not used predict the electrical properties of Pd/PdO in real-world
conditions. Experimentally, the response of hydrogen sensors changed when the Pd/PdO
sensing resistors were used at different RH levels [258], [259]. These studies were unable
to decouple the effect of moisture-interfering hydrogen-oxide interaction and moisture-
induced resistance change. To the best of my knowledge, the electrical properties of inkjet-
printed Pd/PdO films has not been examined.
In this chapter, we investigated the thermolysis process for the inkjet-printed Pd precursor
ink in different atmospheres. We found that the morphology of the deposited Pd/PdO films
can be adjusted by controlling the O2 content in the thermolysis atmosphere. At 200 °C, the
precursor is reductively decomposed into amine-stabilized Pd clusters. In air, O2 can assist
the decomposition of the organic ligands for the Pd clusters and facilitates the fusion of
small NPs to dense and smooth films. When O2 is lacking (in N2), the residual organic
ligands trigger the aggregation of NPs, generating sub-micron spheres. In low vacuum, the
competition between the two abovementioned mechanisms (thermolysis in air and in N2)
results in a bilayer Pd film with a bottom layer of fused NPs and a top layer of spherical
aggregates. The Pd/PdO films with different morphologies and PdO contents display
different electrical properties. The TCR can be adjusted from 0.067% /°C (smooth metallic
films) to -0.189% /°C (bilayer semiconductive films). In humid conditions, a large
resistance drift is caused by the formation of -OH groups in the oxide-rich films, so the
semiconductive Pd/PdO films had a lower electrical stability than the Pd-rich metallic films.
The -OH groups increase the inter-grain energy barrier which results in an increased
resistance. Also, the adsorbed -OH groups and/or molecular water provide extra conduction

Ph.D. Thesis - Y. Qin McMaster University - Electrical and Computer Engineering
108
paths for the oxidized bilayer films. These results suggest that the inkjet-printed Pd/PdO
films can be used as RTD-based temperature sensors. However, importantly, the effect of
moisture on the resistance drift of the films must be minimized for real-world applications.
4.2. Thin film formation in air, low vacuum, and nitrogen
The Pd ink used in this study was the same as the one formulated in Chapter 3 (Pd-PhMe).
The thermolysis of the Pd ink was done in two steps. The first step was the preheating of
the printed ink on a hotplate in air at 120 °C for 4 min to evaporate the solvent. The second
step was carried out in a chamber (Isotemp 280A, Fisher Scientific) at 200 °C for 20 min
with three different atmospheres:
1. Air, short for ANOX.
2. Low vacuum (~2.7 mbar), short for VNOX.
3. N2 (after purging for 10 min), short for N2NOX.
For oxidized samples, a thermal treatment step at 200 °C for 48 h in air was carried out
after the precursor thermolysis step. The oxidized samples corresponding to the three
thermolysis atmospheres are named as AOX, VOX, and N2OX (Table 4-1).
Table 4-1. Summary of the morphologies and electrical properties of the inkjet-printed Pd/PdO films.
Sample Description Morphology
NP
size,
nm Organic% PdO%
Resistivity
(25 °C),
μΩ m
TCR
(vacuum),
/°C
R drift
(vacuum),
/h
TCR
(humid
air), /°C
R drift
(humid
air), /h
ANOX Thermolysis in
air, not
oxidized
Dense and
smooth
7 1.3% 21.8% 2.3 0.067% -0.015% 0.058% 0.003%
VNOX Thermolysis in
low vacuum,
not oxidized
Thin bottom
layer with
spheres on top
12 8.3% 28.1% 31.2 0.041% -0.023% 0.022% 0.035%
N2NOX Thermolysis in
N2, not
oxidized
Discontinuous,
spherical
aggregates
- 7.0% 19.7% - - - - -
AOX Thermolysis in
air, oxidized
Dense and
smooth
7 0% 77.5% 67.5 -0.091% 0.046% -0.100% 0.222%
VOX Thermolysis in
low vacuum,
oxidized
Thin bottom
layer with
spheres on top
12 0% 59.1% 277.5 -0.189% -0.016% -0.247% -0.330%
N2OX Thermolysis in
N2, oxidized
Discontinuous,
spherical
aggregates
- 0% 62.8% - - - - -

Ph.D. Thesis - Y. Qin McMaster University - Electrical and Computer Engineering
109
4.2.1. Film morphologies
The morphologies of the Pd/PdO films can be changed by using different thermolysis
atmospheres for the inkjet-printed Pd precursor. When the thermolysis atmosphere was air
(ANOX), a dense, smooth, and continuous film of ~200 nm thickness was formed (Figure
4-1(a), (d), and (g)). Such a film consisted of fused Pd NPs with a particle size of ~7 nm
(inset of Figure 4-1(d)). From the SEM images in Figure 4-1(d) and (g), clear grain
boundaries can be observed among the domains of fused Pd NPs. These grain boundaries
were caused by inter-domain voids, which might be attributed to the removal of organic
ligands in the film. Despite these nanoscale voids, the film prepared in air was dense in the
microscale with a close-to-zero porosity.
When the Pd precursor was thermally decomposed in low vacuum (VNOX), the deposited
film displayed a bilayer morphology (Figure 4-1(b), (e), and (h)). The bottom layer was
thin (~100 nm thick) and contained nanocracks. These nanocracks might be generated by
the stress induced by the uneven film thickness. The top layer in VNOX contained spherical
aggregates with a diameter of ~600 nm. The high magnification SEM image (inset of Figure
4-1(e)) revealed that the spherical aggregates were formed by aggregated Pd NPs (~12 nm
in diameter), in contrast to the fused NPs in ANOX. In VNOX, the grain boundaries were
not as obvious as those in ANOX, because the inter-domain voids were filled by the residual
organic ligands. In the microscale, the film (VNOX) also had a low porosity.
If N2 was the thermolysis atmosphere (N2NOX), the generated film was semitransparent
(due to the exposure of the glass substrate to ambient), and only contained large spheres
(~900 nm in diameter) without a continuous bottom layer (Figure 4-1(c), (f), and (i)). The
spheres were loosely-packed, with small interconnecting areas. Microscale voids could be
observed among the spheres, indicating a very porous film. A clear SEM image with high
magnification was difficult to obtain due to the charging effect of the exposed glass
substrate. Because the spheres were loosely-packed and adhered poorly to the substrate, a
cross section of the spheres was difficult to make.
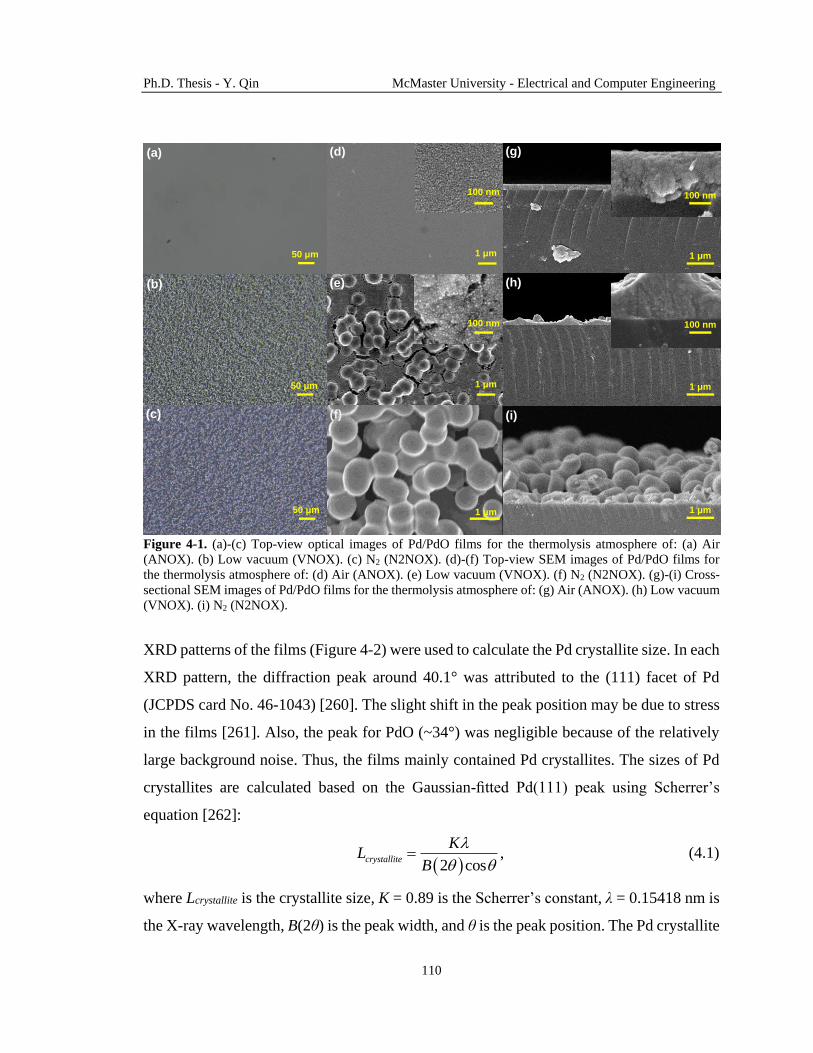
Ph.D. Thesis - Y. Qin McMaster University - Electrical and Computer Engineering
110
Figure 4-1. (a)-(c) Top-view optical images of Pd/PdO films for the thermolysis atmosphere of: (a) Air
(ANOX). (b) Low vacuum (VNOX). (c) N2 (N2NOX). (d)-(f) Top-view SEM images of Pd/PdO films for
the thermolysis atmosphere of: (d) Air (ANOX). (e) Low vacuum (VNOX). (f) N2 (N2NOX). (g)-(i) Cross-
sectional SEM images of Pd/PdO films for the thermolysis atmosphere of: (g) Air (ANOX). (h) Low vacuum
(VNOX). (i) N2 (N2NOX).
XRD patterns of the films (Figure 4-2) were used to calculate the Pd crystallite size. In each
XRD pattern, the diffraction peak around 40.1° was attributed to the (111) facet of Pd
(JCPDS card No. 46-1043) [260]. The slight shift in the peak position may be due to stress
in the films [261]. Also, the peak for PdO (~34°) was negligible because of the relatively
large background noise. Thus, the films mainly contained Pd crystallites. The sizes of Pd
crystallites are calculated based on the Gaussian-fitted Pd(111) peak using Scherrer’s
equation [262]:
,2 cos
crystallite
KL
B
(4.1)
where Lcrystallite is the crystallite size, K = 0.89 is the Scherrer’s constant, λ = 0.15418 nm is
the X-ray wavelength, B(2θ) is the peak width, and θ is the peak position. The Pd crystallite
1 μm
100 nm
1 μm
100 nm
(d)
(e)
(f)
1 μm
50 μm
50 μm
50 μm
(a)
(b)
(c)
1 μm
1 μm
1 μm
100 nm
100 nm
(g)
(h)
(i)

Ph.D. Thesis - Y. Qin McMaster University - Electrical and Computer Engineering
111
size is 5.4 nm, 4.7 nm, and 3.5 nm, respectively, for the thermolysis atmosphere of air, low
vacuum, and N2. The smaller crystallite size indicates a shorter crystal growth time.
Figure 4-2. XRD patterns of the Pd/PdO films with different precursor thermolysis atmospheres.
4.2.2. Chemical compositions
In addition to the physical characterization of the inkjet-printed Pd/PdO films, Raman
analysis (Figure 4-3) was used to determine the chemical compositions of these films. For
the thermolysis atmosphere of N2 (N2NOX), a tilted baseline and two weak peaks at ~553
cm-1 and ~1100 cm-1 can be observed, which was caused by the exposed glass substrate.
For the thermolysis atmosphere of air (ANOX), the glass background had negligible effect
on the spectrum, which confirmed the dense morphology of such films. A broad peak with
low intensity between 1100 cm-1 and 1700 cm-1 can be found in the spectrum for ANOX.
Because the Pd precursor contains organoamines ligands, this broad peak was attributed to
the residual organic species after thermolysis (e.g., N-H deformation vibrations at ~1615
cm-1, C-N stretching vibrations at 1130 cm-1, C-H deformation vibrations at 1460 cm-1, and
C-C skeletal vibrations at 1300 cm-1) [263]. For the thermal decomposition in low vacuum
(VNOX), the peak representing the organic species became more prominent, which
indicated a larger content of residual organic species in the film. Besides, the peak for PdO
at ~650 cm-1 was difficult to be observed for the non-oxidized samples. These observations
are in agreement with the XRD results and implies a metallic behavior of the films.
-50
0
50
100
150
200
250
300
350
400
30 35 40 45 50
Inte
ns
ity,
a.u
.
2θ, degree
ANOX
VNOX
N2NOX

Ph.D. Thesis - Y. Qin McMaster University - Electrical and Computer Engineering
112
Figure 4-3. Raman spectra of Pd/PdO films with different precursor thermolysis atmospheres.
4.2.3. Thermogravimetric analysis
TG analysis was used to quantify the content of the residual organic species and PdO in the
films. Figure 4-4 illustrates the weight change of the Pd/PdO mixture from room
temperature to 950 °C. In this study, a typical TG curve (no matter what atmosphere was
used for the thermolysis) included four weight loss steps and one weight gain step. At
~100 °C, the weight loss was due to the removal of molecular water [264]. At 200-400 °C,
the decomposition of the residual organic species caused the weight loss [81]. At 300-
500 °C, -OH groups on the PdO surface dissociated and the weight was reduced [264].
From 300 °C to above 600 °C, the Pd metal in the mixture reacted with chemically adsorbed
O2 (when the samples were transferred from the thermolysis oven to the TG analyzer in air)
and resulted in a weight gain [255], [265]. Note that the temperature range for the loss of -
OH groups and the uptake of O2 overlapped. Between 600 °C and 800 °C, the TG curve
showed a significant weight loss, which originated from the decomposition of PdO to Pd
[264], [265]. Therefore, the weight difference between ~150 °C and ~300 °C can be used
to calculate the content of residual organic species. The weight difference between the
~400 °C and ~900 °C can be used to estimate the PdO content. The calculated weight
contents for the residual organic species and PdO are shown in Table 4-1.
0
500
1000
1500
2000
2500
3000
3500
4000
4500
5000
5500
6000
400 600 800 1000 1200 1400 1600 1800
Inte
ns
ity,
a.u
.
Raman shift, cm-1
Glass
N2NOX
ANOX
AOXVNOX
VOX
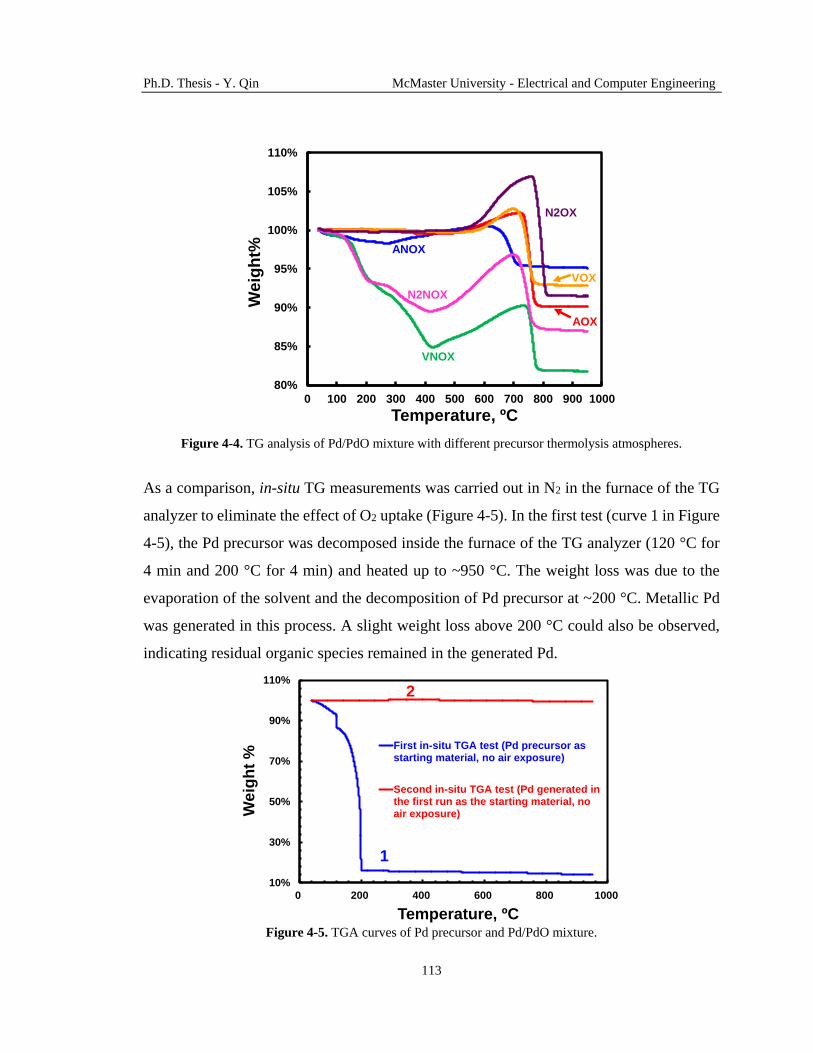
Ph.D. Thesis - Y. Qin McMaster University - Electrical and Computer Engineering
113
Figure 4-4. TG analysis of Pd/PdO mixture with different precursor thermolysis atmospheres.
As a comparison, in-situ TG measurements was carried out in N2 in the furnace of the TG
analyzer to eliminate the effect of O2 uptake (Figure 4-5). In the first test (curve 1 in Figure
4-5), the Pd precursor was decomposed inside the furnace of the TG analyzer (120 °C for
4 min and 200 °C for 4 min) and heated up to ~950 °C. The weight loss was due to the
evaporation of the solvent and the decomposition of Pd precursor at ~200 °C. Metallic Pd
was generated in this process. A slight weight loss above 200 °C could also be observed,
indicating residual organic species remained in the generated Pd.
Figure 4-5. TGA curves of Pd precursor and Pd/PdO mixture.
80%
85%
90%
95%
100%
105%
110%
0 100 200 300 400 500 600 700 800 900 1000
We
igh
t%
Temperature, ºC
VNOX
N2NOX
ANOX
N2OX
VOX
AOX
10%
30%
50%
70%
90%
110%
0 200 400 600 800 1000
Weig
ht
%
Temperature, ºC
First in-situ TGA test (Pd precursor asstarting material, no air exposure)
Second in-situ TGA test (Pd generated inthe first run as the starting material, noair exposure)
1
2

Ph.D. Thesis - Y. Qin McMaster University - Electrical and Computer Engineering
114
In the second test (curve 2 in Figure 4-5), the Pd generated in the first test was cooled down
to ~30 °C inside the furnace of the TG analyzer with N2 purge. Then, the furnace was heated
up to ~950 °C again. In this process, the weight gain between 300 °C and 600 °C was
negligible and almost no weight change could be observed in the whole temperature range,
suggesting that PdO was not generated under N2.
For the sample prepared in air (ANOX), O2 assisted the precursor thermolysis so that little
residual organic species remained in the film after the thermolysis process [266]. However,
in low vacuum (VNOX) and N2 (N2NOX), the thermal decomposition of the organoamines
was slow due to the lack of O2. Thus, ~8% residual organic species was found in the films
(VNOX and N2NOX). On the other hand, PdO was formed in all non-oxidized samples
(ANOX, VNOX, and N2NOX).
The presence of PdO could not be determined from the XRD and Raman analyses due to
the large background noise (small film thickness). Based on the SEM images in Figure 4-1,
sub-micron spherical aggregates were formed in N2 (N2NOX), and the Pd at the surface
was easily oxidized to PdO after exposure to air. In low vacuum (VNOX), the spherical
aggregates were smaller, and a thin bottom layer existed. This morphology had a larger
surface area than that formed in N2 (N2NOX). Thus, more PdO was obtained after the
thermolysis step in low vacuum (VNOX). The film prepared in air (ANOX) was dense and
smooth, and the oxidation was caused by the penetration of O2 into the film. If a Pd NP has
a Pd core-PdO shell structure with a NP diameter of 7 nm (Figure 4-1(a)) and a native oxide
thickness of 0.8 nm [267], then this NP contains ~27% PdO. Because the TGA-measured
PdO content in the film prepared in air was ~22%, the Pd NPs were partially covered by
PdO. The PdO contents calculated by the TG tests and by the core-shell model are in
agreement with our previous studies using XPS (~20%) [80], [81].
After the oxidation step, the PdO content of all samples (AOX, VOX, and N2OX) increased
(Table 4-1). For the sample prepared in air (AOX), ~77.5 wt% PdO presented in the film,

Ph.D. Thesis - Y. Qin McMaster University - Electrical and Computer Engineering
115
which was more than that in VOX and N2OX (both ~60 wt%). The lower PdO contents in
VOX and N2OX could also be attributed to the spherical aggregates in the films. In the
spherical aggregates (in VNOX/VOX and N2NOX/N2OX), the penetration depth for O2
was the radius of the spheres (~300 to ~450 nm), while the O2 penetration depth in the
smooth film (ANOX/AOX) was ~200 nm. Therefore, the oxidation of ANOX is easier than
that of VNOX and N2NOX.
4.2.4. Film formation mechanisms
Based on the characterization results above, film formation mechanisms are proposed for
the inkjet-printed Pd precursor in different thermolysis atmospheres, as shown in Figure
4-6. The printed Pd precursor solution contained an organometallic complex formed by a
Pd salt (Pd-X) as the Pd source and an organoamine (R-NH2) as the ligand [268].
Regardless of the thermolysis atmosphere, the Pd precursor was first subjected to reductive
decomposition into amine-stabilized Pd clusters at ~200 °C [248].
Figure 4-6. Proposed Pd/PdO film formation mechanisms in different precursor thermolysis atmospheres: (a)
air, (b) low vacuum, and (c) N2.
Pd
Pd
Pd
Pd
PdO
O2
O2
PdO
O2
O2
PdOO2
O2
Pd
In air In low vacuum In N2
(a1)
(a2)
(a3)
(b1)
(b2)
(b3)
(c1)
(c2)
(c3)
O2
O2O2O2O2
O2
Thermolysis
~200 ⁰C
PdPd
Pd NP
Pd cluster

Ph.D. Thesis - Y. Qin McMaster University - Electrical and Computer Engineering
116
In air, O2 reacted with the organic ligands and quickly exposed the surface of the Pd clusters.
The clusters could grow and merge together to form NPs (Figure 4-6(a1)). These clean NPs
were small in size (sub-10 nm) and had a low melting point [269]. When the process
temperature was kept at 200 °C, the surfaces of these Pd NPs melted, fused together, and
eventually a smooth and dense film was formed (Figure 4-6(a2) and Figure 4-1(a)). The
absence of residual organic ligands was confirmed by Raman and TG analysis.
In contrast to air, when in N2, the decomposition of the organic ligands was inhibited due
to the lack of O2. The residual ligands remained on the surface of the Pd clusters and
prevented their growth. Therefore, the size of the Pd clusters was smaller than those
generated in air (confirmed by XRD analysis). Also, the slow decomposition of the ligands
indicated a low reduction rate of Pd2+ in the precursor, which resulted in larger Pd NPs
(confirmed by SEM imaging) [270]. Because the NPs were large in size and were covered
with residual organic species, they were difficult to fuse into a homogenous film at ~200 °C
(Figure 4-6(c1). Instead, these NPs formed spherical aggregates with residual organic
species embedded (Figure 4-6(c2) and Figure 4-1(c)). The inset of Figure 4-1(b) confirmed
that the NPs were aggregated rather than fused together.
In low vacuum, due to the low concentration of O2, the film was deposited as a result of the
competition between the two mechanisms (thermolysis in air and in N2) discussed above.
The melted and fused NPs were at the bottom, and the large aggregates were at the top of
the film (Figure 4-6(b1) and (b2)). As a result, a bilayer morphology was formed in low
vacuum (Figure 4-1(b)).
4.3. Electrical properties of inkjet-printed Pd/PdO films
A study of the electrical properties of inkjet-printed Pd/PdO films at different temperatures
and RH levels is important for their applications as temperature sensors for water quality
monitoring. Because the films prepared in N2 (N2NOX) were discontinuous (not
conductive), only the films prepared in air and low vacuum (ANOX and VNOX) are studied

Ph.D. Thesis - Y. Qin McMaster University - Electrical and Computer Engineering
117
here. An oxidation step can be carried out at 200 °C for 48 h in air to increase the content
of PdO (Figure 4-6(a3) and (b3)) and adjust the electrical properties of the printed films.
Note that the film morphologies were not altered by the oxidation step and/or the tests in
humid air.
4.3.1. Effect of temperature
The electrical properties of the inkjet-printed films were studied by measuring their
electrical resistance at different temperatures in vacuum. At 25 °C, the calculated electrical
resistivity values of the samples are listed in Table 4-1. The sample prepared in air before
oxidation (ANOX) showed a dense and smooth morphology and a low resistivity of 2.3
μΩ·m, which agreed with our previous results [81]. When the film was oxidized (AOX),
the resistivity increased to 67.5 μΩ·m. This increased resistivity was attributed to the
increase in the amount of semiconductive PdO in the film. From the Raman spectrum in
Figure 4-3(a), a PdO peak at ~650 cm-1 could be observed after oxidation. Also, the
calculation based on the TG curves in Figure 4-4 showed that the PdO content increased
from ~22% to ~78%.
For the sample prepared in low vacuum (VNOX), it showed a resistivity of 31.2 μΩ·m at
25 °C. Compared to ANOX, VNOX had a higher measured resistivity, which was caused
by their different morphologies. For VNOX, the electrical conduction was in the thin
bottom layer, which was thinner than the film thickness (200 nm, measured from ANOX)
used in Ohm’s law for the calculation of equivalent resistivity. In other words, the top
spherical spheres did not participate in the electrical conduction. When the film was
oxidized (VOX), the resistivity of 277.5 μΩ·m was a consequence of the high PdO
percentage in the thin conduction path.
When the measurement temperature changed, all samples showed stable resistance values
with a drift rate less than 0.05% /h (Figure 4-7(a-d)). The low drift rates indicated that the

Ph.D. Thesis - Y. Qin McMaster University - Electrical and Computer Engineering
118
printed Pd/PdO films were stable in dry conditions. The TCR values (αTCR) of the samples
can be calculated using:
1
,eleTCR
REF
dR
R dT (4.2)
where RREF is the resistance at 25 °C, and dRele/dT is the slope of the resistance-temperature
curve in Figure 4-7(e).
Figure 4-7. Resistance drift in vacuum for the Pd/PdO films prepared: (a) In air before oxidation (ANOX). (b) In air
after oxidation (AOX). (c) In low vacuum before oxidation (VNOX). (d) In low vacuum after oxidation (VOX). (e)
Temperature dependence of resistance for the 4 samples for TCR calculations.
The non-oxidized samples showed positive TCR values (Table 4-1 and Figure 4-7(e)),
indicating a metallic behavior. However, the TCR values (0.067% /°C for ANOX and 0.041%
/°C for VNOX) were smaller than that of vacuum-deposited Pd films (~0.3% /°C) [246].
Such small TCR values may be due to two reasons: (1) the printed films contained
semiconductive PdO with a negative TCR, which reduced the overall TCR value. The film
4.40
4.45
4.50
4.55
4.60
4.65
4.70
0.0 0.5 1.0 1.5 2.0
Resis
tan
ce, Ω
Time, h
61.9
62.3
62.7
63.1
63.5
63.9
64.3
0.0 0.5 1.0 1.5 2.0
Resis
tan
ce, Ω
Time, h
127
129
131
133
135
137
0.0 0.5 1.0 1.5 2.0R
es
ista
nc
e, Ω
Time, h
460
480
500
520
540
560
580
0.0 0.5 1.0 1.5 2.0
Res
ista
nc
e, Ω
Time, h
87%
90%
93%
96%
99%
102%
105%
20 30 40 50 60 70 80 90
No
rma
lize
d
res
ista
nc
e
Temperature, ⁰C
ANOX, TCR = 0.067% /⁰C
VNOX, TCR = 0.041% /⁰C
AOX, TCR = -0.091% /⁰C
VOX, TCR = -0.189% /⁰C
(a) (b)
(c) (d)
(e)
25 ºC
35 ºC
45 ºC
55 ºC
65 ºC
75 ºC
85 ºC
25 ºC
35 ºC
45 ºC
55 ºC
65 ºC
75 ºC
85 ºC
25 ºC
35 ºC
45 ºC
55 ºC
65 ºC
75 ºC
85 ºC
25 ºC35 ºC45 ºC55 ºC65 ºC75 ºC85 ºC

Ph.D. Thesis - Y. Qin McMaster University - Electrical and Computer Engineering
119
prepared in vacuum (VNOX) had a thin bottom conductive layer, where the effect of PdO
was more prominent than in the films prepared in air (ANOX). Therefore, the TCR of
VNOX was smaller than that of ANOX. (2) The inter-grain charge transport in the NP-
constructed films is a thermally activated process, which has a negative TCR [271]. In other
words, the charge transport was more efficient (resistance was lower) at higher
temperatures. Thus, the overall TCR values were reduced.
For the oxidized samples, semiconductive properties were obtained with negative TCR
values. Although the film prepared in air after oxidation (AOX) contained more PdO (~75%)
than the film prepared in low vacuum after oxidation (VOX, ~57% PdO), its TCR value
was closer to zero. In AOX, the conduction path was the entire film which consisted of
both Pd and PdO. The presence of Pd increased the TCR value. In VOX, the conduction
path was the thin bottom layer. Such a thin layer was fully oxidized to PdO easily, making
it highly semiconductive, and hence a smaller TCR value. In other words, the ~43% Pd in
VOX was mainly in the spherical aggregates, which did not affect the electrical conduction.
By choosing a proper thermolysis atmosphere and an oxidation step, the TCR value of an
inkjet-printed Pd/PdO film can be tuned between a small positive value and a relatively
large negative value. A Pd/PdO film with a large negative TCR can be integrated with a
resistor having a large positive TCR [272] to form a highly sensitive bridge-type
temperature sensor.
4.3.2. Effect of relative humidity
Figure 4-8 shows the drift behavior and RH dependence of the resistance of Pd/PdO films
in humid air at 30 °C. The resistance values of the non-oxidized films (ANOX and VNOX)
showed small positive drifts and their RH dependence was weak (Table 4-1 and Figure
4-8(e)). The small positive drift may be due to the formation of -OH groups at the surface
of PdO [255], [259]. Because PdO is a p-type semiconductor, its resistivity is increased
(positive drift) when the adsorbed -OH groups donate electrons to the PdO conduction band.

Ph.D. Thesis - Y. Qin McMaster University - Electrical and Computer Engineering
120
In other words, the presence of -OH groups at the PdO surface increased the energy barriers
for the inter-grain hole transport. In the non-oxidized films, the amount of PdO was small,
so that the drift was insignificant.
Figure 4-8. Resistance drift in humid air for the Pd/PdO films prepared: (a) In air before oxidation (ANOX).
(b) In air after oxidation (AOX). (c) In low vacuum before oxidation (VNOX). (d) In low vacuum after
oxidation (VOX). (e) RH dependence of resistance for the 4 samples.
For the oxidized films, the drift rates were ~10 times larger than those of the non-oxidized
films (Table 4-1). Also, the oxidized films exhibited a strong dependence on RH (Figure
4-8(e)). The oxidized film prepared in air (AOX) had a positive resistance drift of 0.222%
/h. The larger amount PdO in the film resulted in the adsorption of more -OH groups, hence
a larger positive drift in resistance. However, the oxidized film prepared in low vacuum
(VOX) exhibited a negative resistance drift of -0.330% /h. Therefore, we proposed that the
main contribution of the adsorbed -OH groups and/or molecular water was to create more
87%
92%
97%
102%
107%
112%
0% 20% 40% 60% 80%
No
rmali
zed
re
sis
tan
ce
Relative humidity
57.2
57.4
57.6
57.8
58.0
58.2
0 1 2 3 4 5 6
Resis
tan
ce, Ω
Time, h
4.46
4.47
4.48
4.49
4.50
4.51
0 1 2 3 4 5 6
Resis
tan
ce, Ω
Time, h
135
140
145
150
155
0 1 2 3 4 5 6
Resis
tan
ce, Ω
Time, h
480
500
520
540
560
0 1 2 3 4 5 6
Resis
tan
ce, Ω
Time, h
(a) (b)
(c) (d)
(e)
0% RH
30% RH
50% RH
70% RH
0% RH
30% RH
50% RH
70% RH
0% RH
30% RH
50% RH
70% RH 0% RH
30% RH
50% RH
70% RH
VOX, RH dependence = -0.16% /%RH
ANOX, RH dependence = 0.01% /%RH
VNOX, RH dependence = 0.02% /%RH
AOX, RH dependence = 0.13% /%RH

Ph.D. Thesis - Y. Qin McMaster University - Electrical and Computer Engineering
121
conduction bridges in this defective film, while the effect of increasing inter-grain barriers
was less important. More electrical conduction paths decreased the resistance of the film
and resulted in a negative resistance drift. In the non-oxidized film (VNOX), this bridging
effect may also exist. These conduction bridges were formed by -OH groups or adsorbed
molecular water, which were more resistive than the metallic Pd. In such a case, even if
more conduction paths were formed, charge carriers would still be transported in the
original paths which were more conductive. Therefore, the overall resistance drift was
positive in the non-oxidized film.
FTIR spectroscopy analyses (Figure 4-9) were carried out to confirm the effect of moisture
on the resistance drift of the Pd/PdO films. The intensity increase of the O-H stretching
peak (~3400 cm-1) [263] indicated that the adsorption of -OH groups during the test in
humid air. Also, the oxidized samples showed more -OH groups than the non-oxidized
samples, which meant a faster reaction with moisture. The faster adsorption of -OH groups
caused a larger drift. Besides, at ~1600 cm-1, the peaks for H-O-H bending became more
intense after the test in humid air [263]. Such observations indicated the adsorption of
molecular water on the films. Therefore, we confirmed the origin of the resistance drift of
the printed films was the moisture in air.
Figure 4-9. FTIR spectra of Pd/PdO films with different precursor thermolysis atmospheres before and after
testing in humid air.
0.07
0.08
0.08
0.09
0.09
0.10
0.10
1300 1600 1900 2200 2500 2800 3100 3400 3700 4000
Ab
so
rban
ce, a.u
.
Wavenumber, cm-1
ANOXVNOX AOX
VOXVNOXRH
ANOXRH
VOXRH AOXRH
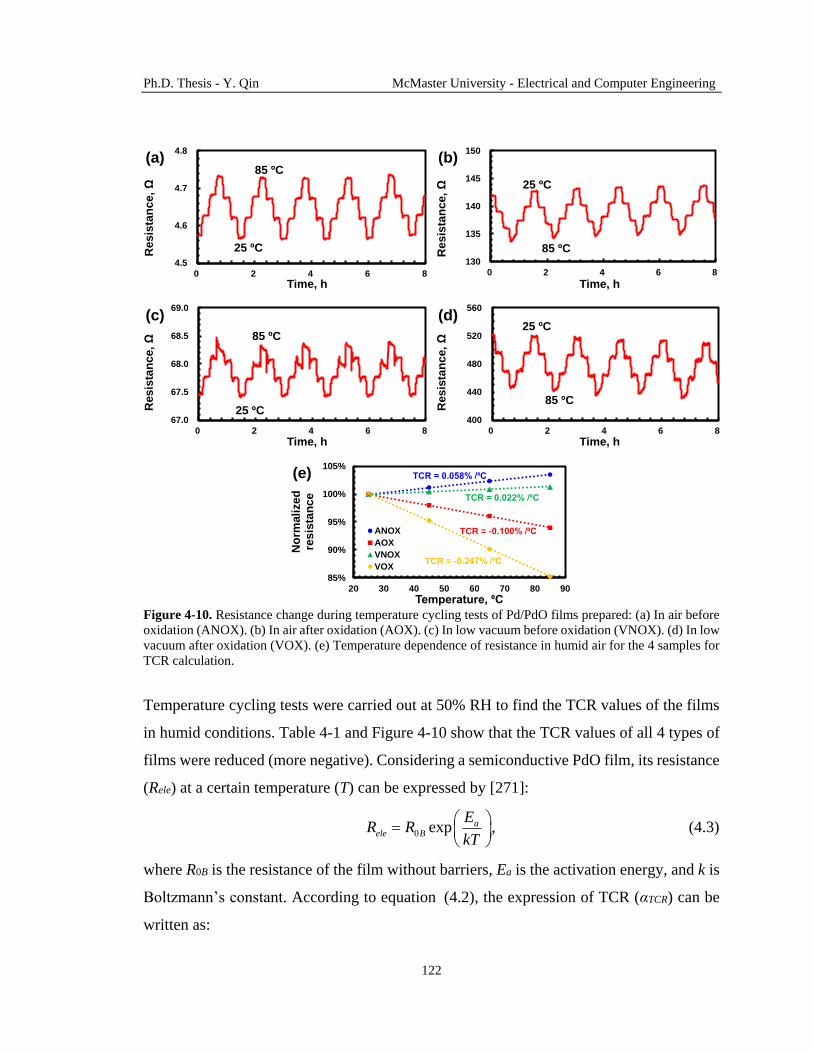
Ph.D. Thesis - Y. Qin McMaster University - Electrical and Computer Engineering
122
Figure 4-10. Resistance change during temperature cycling tests of Pd/PdO films prepared: (a) In air before
oxidation (ANOX). (b) In air after oxidation (AOX). (c) In low vacuum before oxidation (VNOX). (d) In low
vacuum after oxidation (VOX). (e) Temperature dependence of resistance in humid air for the 4 samples for
TCR calculation.
Temperature cycling tests were carried out at 50% RH to find the TCR values of the films
in humid conditions. Table 4-1 and Figure 4-10 show that the TCR values of all 4 types of
films were reduced (more negative). Considering a semiconductive PdO film, its resistance
(Rele) at a certain temperature (T) can be expressed by [271]:
0 exp ,aele B
ER R
kT
(4.3)
where R0B is the resistance of the film without barriers, Ea is the activation energy, and k is
Boltzmann’s constant. According to equation (4.2), the expression of TCR (αTCR) can be
written as:
85%
90%
95%
100%
105%
20 30 40 50 60 70 80 90
No
rmali
zed
re
sis
tan
ce
Temperature, ⁰C
ANOX
AOX
VNOX
VOX
TCR = 0.058% /⁰C
TCR = 0.022% /⁰C
TCR = -0.100% /⁰C
TCR = -0.247% /⁰C
4.5
4.6
4.7
4.8
0 2 4 6 8
Res
ista
nc
e, Ω
Time, h
25 ºC
85 ºC
130
135
140
145
150
0 2 4 6 8
Res
ista
nc
e, Ω
Time, h
25 ºC
85 ºC
67.0
67.5
68.0
68.5
69.0
0 2 4 6 8
Res
ista
nc
e, Ω
Time, h
25 ºC
85 ºC
400
440
480
520
560
0 2 4 6 8
Res
ista
nc
e, Ω
Time, h
25 ºC
85 ºC
(a) (b)
(c) (d)
(e)

Ph.D. Thesis - Y. Qin McMaster University - Electrical and Computer Engineering
123
1
,
ele
REFTCR
REF
R
R
T T
(4.4)
where RREF is the resistance at the reference temperature TREF (25 °C in this study). By
combining equation (4.3) and (4.4), the TCR can be calculated using:
1 1exp 1
.
a
REF
TCR
REF
E
k T T
T T
(4.5)
Because -OH groups are electron donors and trap holes in a p-type semiconductor, the inter-
grain energy barriers (activation energies, Ea) in the Pd/PdO films were increased when the
films were exposed to moisture. According to equation (4.5), a higher activation energy
(Ea) will result in a larger (more negative) TCR value. This theory explained our
experimental observations shown in Figure 4-10. Since the electrical resistance of the
oxide-rich films showed a large RH dependence, the films should be encapsulated with
materials with a high thermal conductivity and a low moisture adsorption rate [180], [273]
for the application as temperature sensors.
4.3.3. Electrical conduction mechanisms
Based on the electrical measurement and characterization results above, electrical
conduction mechanisms are proposed for the Pd/PdO films with different morphologies
shown in Figure 4-11.
Precursor thermolysis in air, non-oxidized film (ANOX, Figure 4-11(a)). The
electrical conduction path was the whole film, and its resistivity was mainly
determined by the PdO content in the film. The film exhibited a metallic property due
to its major composition of Pd. When the film was exposed to moisture, the surface of
PdO became hydrated. The adsorbed -OH groups at the oxide surface increased the
inter-grain barrier (Figure 4-11(f)), which resulted in an increased film resistance and
a reduced TCR.
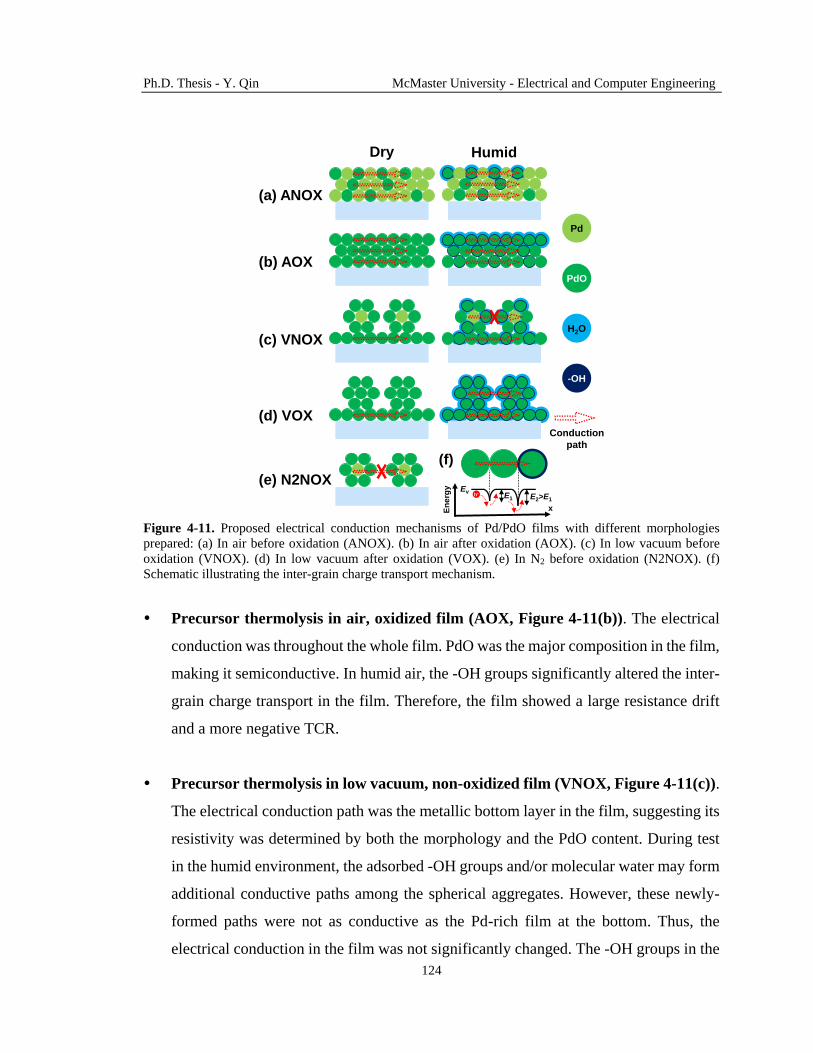
Ph.D. Thesis - Y. Qin McMaster University - Electrical and Computer Engineering
124
Figure 4-11. Proposed electrical conduction mechanisms of Pd/PdO films with different morphologies
prepared: (a) In air before oxidation (ANOX). (b) In air after oxidation (AOX). (c) In low vacuum before
oxidation (VNOX). (d) In low vacuum after oxidation (VOX). (e) In N2 before oxidation (N2NOX). (f)
Schematic illustrating the inter-grain charge transport mechanism.
Precursor thermolysis in air, oxidized film (AOX, Figure 4-11(b)). The electrical
conduction was throughout the whole film. PdO was the major composition in the film,
making it semiconductive. In humid air, the -OH groups significantly altered the inter-
grain charge transport in the film. Therefore, the film showed a large resistance drift
and a more negative TCR.
Precursor thermolysis in low vacuum, non-oxidized film (VNOX, Figure 4-11(c)).
The electrical conduction path was the metallic bottom layer in the film, suggesting its
resistivity was determined by both the morphology and the PdO content. During test
in the humid environment, the adsorbed -OH groups and/or molecular water may form
additional conductive paths among the spherical aggregates. However, these newly-
formed paths were not as conductive as the Pd-rich film at the bottom. Thus, the
electrical conduction in the film was not significantly changed. The -OH groups in the
(a) ANOX
(b) AOX
(c) VNOX
(d) VOX
(e) N2NOX
Pd
PdO
H2O
-OH
Conduction
path
E1 E2>E1h+
En
erg
y Ev
(f)
x
Dry Humid
Ph.D. Thesis - Y. Qin McMaster University - Electrical and Computer Engineering
125
bottom layer slightly increased the film’s resistance and reduced its TCR, similar to
the case of ANOX.
Precursor thermolysis in low vacuum, oxidized film (VOX, Figure 4-11(d)). The
electrical conduction path was the semiconductive bottom layer in the film. The film
resistance was greatly influenced by the amount of semiconductive grains (conduction
paths) participating in the conduction. When the RH was high, additional conduction
paths were formed by adsorbed -OH groups and/or molecular water. These newly-
formed paths were effective because the initial conduction path was not highly
conductive. Consequently, such film showed a negative resistance drift in the humid
environment.
Precursor thermolysis in N2, non-oxidized film (N2NOX, Figure 4-11(e)). Because
the film consisted of discontinuous spherical aggregates, it was not conductive.
4.4. Conclusions
The thermolysis process of an inkjet-printed Pd precursor ink was investigated. It was
found that the morphology of the Pd/PdO films could be tuned by using different
thermolysis atmospheres and that the precursor was reductively decomposed into amine-
stabilized Pd clusters at 200 °C. The O2 in air facilitated the decomposition of the ligands
for the Pd clusters and clean Pd NPs were formed. The fusion of the small NPs with a low
melting point resulted in a smooth and dense film. In N2, the generated NPs were larger
and were embedded with organic species. Such NPs form sub-micron spherical aggregates.
In low vacuum, a bilayer morphology was formed due to the competition between the film
formation processes in air and in N2. The electrical properties of the films with different
morphologies were different. The smooth film had a lower resistivity since the electrical
conduction was throughout the film. For the bilayer film, only the bottom layer participated
in the conduction and a higher resistivity was observed. The TCR value of the films can be
tuned from 0.067% /°C to -0.189% /°C due to the different amounts of PdO in the

Ph.D. Thesis - Y. Qin McMaster University - Electrical and Computer Engineering
126
conduction paths. When the Pd/PdO films were studied in humid air, the adsorbed -OH
groups raise the inter-grain barrier for the charge carrier transport and caused a positive
resistance drift. In the oxidized bilayer film, additional conductive paths were created by
the adsorbed -OH groups and/or molecular water, resulting in a negative resistance drift.
This chapter showed that the inkjet-printed Pd/PdO films with different electrical properties
can be easily prepared for applications such as temperature sensors. However, the devices
should be encapsulated in order to obtain a stable performance.

Ph.D. Thesis - Y. Qin McMaster University - Electrical and Computer Engineering
127
Chapter 5
Paper-based, hand-drawn free chlorine
sensor*
The concentration of free chlorine used for disinfecting drinking water, recreational water,
and food processing water is critical for environmental and human health safety, and should
be controlled within stipulated ranges. This chapter describes a paper-based
electrochemical free chlorine sensor fabricated by hand-drawing. The electrical resistivity
of a PEDOT:PSS chemoresistor increases when it is exposed to free chlorine in water due
to oxidation reactions. Because the relative change of the electrical resistance represents
the sensor’s response, the sensor can be fabricated by hand-drawing with different shapes
and dimensions. The fabrication steps are all at room temperature, require no
instrumentation or equipment, and can be carried out by untrained personnel. The
fabricated sensor is mechanically stable, reusable, has a wide sensing range, and can
accurately measure free chlorine concentrations in real water samples. Therefore, the low-
cost, hand-drawn free chlorine sensor is of great significance for drinking water quality
monitoring in less developed areas where fabrication facilities, analytical equipment, and
trained personnel are limited, but the need for analytical devices is critical.
5.1. Background
Free chlorine sensors are important for monitoring the quality of water for drinking,
recreation, and food processing [166]. In U.S. standards, the maximum concentration of
* Adapted with permission from Y. Qin, S. Pan, M. M. R. Howlader, R. Ghosh, N.-X. Hu, and M. J. Deen,
“Paper-based, hand-drawn free chlorine sensor with poly(3,4-ethylenedioxythiophene):
poly(styrenesulfonate),” Anal. Chem., vol. 88, no. 21, pp. 10384–10389, Nov. 2016. Copyright (2016)
American Chemical Society (Appendix E).

Ph.D. Thesis - Y. Qin McMaster University - Electrical and Computer Engineering
128
residual chlorine in drinking water is 2 ppm [166]. The recommended free chlorine
concentration in a swimming pool is 1.5 to 2 ppm [166]. The food processing water should
contain 50 to 200 ppm free chlorine [166]. Free chlorine concentrations outside these
ranges either cause inefficient disinfection or adversely affect human health. However,
conventional free chlorine sensors are expensive, difficult-to-use, have narrow sensing
ranges, and require maintenance by trained personnel. Thus, alternative sensors and sensing
methods need to be developed for accurate free chlorine monitoring in different types of
water samples at low cost.
Paper-based analytical devices are emerging for various applications including
environmental monitoring, biochemical sensing, food processing, and point-of-care clinical
diagnostics [274]–[276]. Paper also has the advantages of light weight, mechanical
flexibility, intrinsic hydrophilicity, porous structures with a high surface-to-volume ratio,
ease of surface functionalization, biocompatibility and biodegradability, abundancy, cost-
effectiveness, and high accessibility [275], [276]. Capitalizing on these unique properties,
paper-based low-cost voltammetric cells [277], ion-selective electrodes [278], colorimetric
sensors [279], fluorescent probes [280], microfluidic assays [281] and other types of
devices [282], [283] were developed for analytical purposes. However, free chlorine
sensors have not been demonstrated on paper substrates.
For the fabrication of these analytical devices, functional materials are deposited and
patterned on papers utilizing different techniques. Photolithography was employed to
pattern high-resolution structures, but its process complexity and expensive photomasks
limited its application for low-cost devices [283]. On the other hand, wax printing [282],
inkjet printing [91], screen printing [284], flexographic printing [285] and laser printing
[286] provide simpler fabrication methods by combining material deposition and patterning
steps. However, such printing processes rely on customized equipment and trained
personnel. These requirements are difficult to be satisfied in resource-limited areas, remote
or rural communities, and the underdeveloped world, where the need for analytical devices
Ph.D. Thesis - Y. Qin McMaster University - Electrical and Computer Engineering
129
is pronounced [281]. Therefore, easy-to-implement, highly accessible, and cost-effective
fabrication methods are needed.
For such critical requirements, hand-drawing processes have emerged for fabricating
electronic devices. The hand-drawing process is instrument-free, fast, and compatible with
paper substrates [287]. These features offer the possibility to fabricate low-cost paper-based
devices on demand for specific on-site applications by untrained personnel. Conductive
patterns [288], transistors [289], physical sensors [290], and electrochemical sensors [291]
drawn on various substrates have been reported. However, the potential of the hand-
drawing process has not been widely demonstrated for analytical devices.
In this chapter, we describe a hand-drawn free chlorine sensor consisting of a drawn
PEDOT:PSS chemoresistor as the sensing element on a paper strip. All fabrication steps
are at room temperature and require no instrumentation or equipment. The sensing of free
chlorine depends on the oxidation-induced electrical resistivity increment of the
PEDOT:PSS film. Comparing to commercial colorimetric free chlorine strips, the
developed drawn sensor can provide a quantitative reading over a wide concentration range
(0.5-500 ppm), which covers the range for monitoring of drinking, recreation, and food
processing water. Also, the sensor has a high bending stability, and is reusable, which
further reduces the cost of each measurement. The inexpensive draw-on-demand sensor is
especially important for less industrialized or resource-limited areas where fabrication
facilities, analytical equipment, and trained personnel are limited.
5.2. Sensor design and operation
PEDOT:PSS was chosen for free chlorine sensing due to its solution processability, tunable
electrical conductivity, and reactivity with free chlorine [292]. In a free chlorine solution,
PEDOT is oxidized (Figure 5-1(a)) and its electrical resistivity increases due to the
disruption of π-π conjugation in its chemical structures [292]. The resistance change of a
PEDOT:PSS film is determined by the free chlorine concentration and reaction time. Based

Ph.D. Thesis - Y. Qin McMaster University - Electrical and Computer Engineering
130
on this mechanism, a PEDOT:PSS chemoresistor was designed. Its layout design and
equivalent circuit is shown in Figure 5-1(b).
Figure 5-1. (a) Oxidation of PEDOT in a free chlorine solution (adopted from reference 23). (b) Top view
schematic and equivalent circuit of the drawn sensor. (c) Image of a drawn sensor after fabrication; (d-f) SEM
images (scale bars represent 100 μm) of the surface of: (d) Paper substrate. (e) Drawn PEDOT:PSS film. (f)
Drawn PEDOT:PSS after testing in 100 ppm NaOCl solution for 15 s. (g) Resistance variation of a 4 cm long
drawn PEDOT:PSS chemoresistor during bending tests.
The response of the free chlorine sensor is quantified using the relative resistance change
(ΔR/R0) of the chemoresistor as:
Paper substrate
Ag contact
Vaseline® Jelly
PEDOT:PSS
Rsen
RP2RP1
RA1 RA2
(a)
(b)
2 cm
(c)
(i) (ii) (iii) (iv)
NaOCl
H2O
NaOCl
H2O
NaOCl
H2O
+ Na2SO4
* * * * * * * *
(d) (e) (f)
(g)
0.992
0.994
0.996
0.998
1.000
1.002
0 100 200 300 400 500 600 700 800
No
rma
lize
d r
es
ista
nc
e
Bending cycles
4 cm
3 cm

Ph.D. Thesis - Y. Qin McMaster University - Electrical and Computer Engineering
131
0 1 2 1 2
,sen
A A P P sen
R R
R R R R R R
(5.1)
where ΔR is the measured resistance difference at the Ag contacts before and after oxidation,
R0 is the measured resistance before oxidation, RA1, RA2 are the resistance of the contacts,
RP1, RP2 are the resistance of the drawn PEDOT:PSS film covered by the waterproof layer,
Rsen is the resistance of the exposed PEDOT:PSS film before testing, and ΔRsen is the
resistance difference of the exposed PEDOT:PSS film before and after testing. Since the
resistance of the Ag contacts (<1 Ω) is much lower than that of the drawn PEDOT:PSS (5-
100 kΩ) film (Figure 5-1(c)), equation (1) is simplified to:
0 1 2
.sen
P P sen
R R
R R R R
(5.2)
Therefore, to maximize the response of the sensor, the values of RP1, RP2 should be
minimized by reducing the overlapped area between the PEDOT:PSS film and the
waterproof layer. To reduce the sensor-to-sensor variation of the overlapped area, a stencil
can be used to cover the PEDOT:PSS film when depositing the waterproof layer. In this
study, the overlapped area is ~10 mm2, and the exposed sensing area is ~150 mm2. The
advantages of using the relative resistance change (ΔR/R0) to express the sensor response
include:
The sensing element (chemoresistor) can be fabricated with different shapes and
dimensions, which eliminate the need for precision equipment and enables hand-
drawing as the fabrication technique. Also, the fabrication process has a high tolerance
for the variation in the sensor geometry.
The relative change of resistance of a chemoresistor can be calculated for multiple tests
as long as the resistance is within the range of the measuring instrument (e.g.,
multimeter). Thus, the sensor is reusable.
The effect of the degradation of the sensing material (PEDOT:PSS) during storage can
be reduced because the resistance is measured before each test. This step sets the
baseline of each test, which is similar to a calibration step.

Ph.D. Thesis - Y. Qin McMaster University - Electrical and Computer Engineering
132
5.3. Sensor fabrication and usage
Figure 5-2 shows the fabrication process of a paper-based free chlorine sensor strip. The
as-received PEDOT:PSS solution was filled in the ink cartridge of a fountain pen, manually
drawn onto a filter paper (type 542, Whatman) and dried naturally in air (Figure 5-2(a)).
The drawn PEDOT:PSS film formed a chemoresistor as the sensing element. The paper
substrate we selected was based on its strength in water and its adhesion to PEDOT:PSS.
Table 5-1 shows the comparison of different paper substrates.
Figure 5-2. Fabrication process of a paper-based free chlorine sensor. (a) Drawing a PEDOT:PSS film as a
chemoresistor. (b) Drawing Ag films for electrical contacts. (c) Coating waterproof Vaseline® Jelly. (d)
Sensor conditioning in a NaOCl solution.
Table 5-1. Comparison of 6 types of paper substrates and their adhesion to PEDOT:PSS films.
Substrates Pore size, μm Porosity, % Strength
Adhesion to
PEDOT:PSS
Whatman filter paper #542 2.5 - Good Good
Whatman filter paper #1 11 - Poor Good
Polycarbonate membrane filter
(TTTP04700, EMD Millipore)
2 5.9 Poor Poor
Nitrocellulose membrane filter
(SMWP04700, EMD Millipore)
5 84 Poor Poor
PVDF membrane filter
(GVHP04700, EMD Millipore)
0.22 75 Good Poor
Normal writing paper - - Poor Good
Then, a Ag paste was drawn onto the PEDOT:PSS film using a painting brush and dried
naturally in air to form the contacts (Figure 5-2(b)). Finally, a petroleum jelly (Vaseline®
Jelly Original) was manually applied on both sides of the paper (Figure 5-2(c)) to protect
the Ag contacts from water. To accurately monitor free chlorine concentrations of <5 ppm,
(b)Ag paste
(d)
10 ppm
NaOCl
(c)Vaseline®
Jelly
PEDOT:PSS
(a)
Paper

Ph.D. Thesis - Y. Qin McMaster University - Electrical and Computer Engineering
133
the sensor should be conditioned in 10 ppm NaOCl solution for 5 min and dried before use
(Figure 5-2(d)).
All free chlorine sensing tests were performed at 27 ± 2 ºC in freshly prepared free chlorine
solutions. To obtain the sensor response, the sensor strips were dipped into free chlorine
solutions for different durations, then rinsed with tap water for 2 s and dried in air. The
drying time is about 10 min and it can be shortened by reducing the exposed area of the
paper substrate and the PEDOT:PSS film. The resistance of the drawn PEDOT:PSS
chemoresistor before and after testing was measured using a commercial multimeter (72-
7730, TENMA). Figure 5-3 shows the real-time resistance change during the drying period
of a PEDOT:PSS chemoresistor after free chlorine testing (10 ppm, 5 min). The sensor strip
was left in ambient air at room temperature for drying. The measured electrical resistance
of the sensing chemoresistor is affected by two factors:
The oxidation of PEDOT by the free chlorine in the residual solution. This effect
causes the increase of the resistance.
The evaporation of water, which was absorbed by the paper during free chlorine testing.
Water absorption increases the distance between cellulous fibers in the paper, loosens
the PEDOT conductive network, and increases the resistance of the sensing
chemoresistor. Thus, water evaporation causes the decrease of the resistance.
Figure 5-3. Resistance change during the drying period of the PEDOT:PSS film after free chlorine sensing.
0.90
0.95
1.00
1.05
1.10
1.15
0 6 12 18
No
rmalized
resis
tan
ce
Time, min
PEDOT oxidation +
water evaporation
Water evaporation
wet dry

Ph.D. Thesis - Y. Qin McMaster University - Electrical and Computer Engineering
134
In the first stage (yellow background), the oxidation reaction dominates so the resistance
increases. In the second stage (green background), the residual free chlorine depletes and
the effect of water evaporation dominates. Therefore, a decrease of the resistance is
observed. At the drying time of ~10 min, the resistance reaches a relative stable value.
Hence, the resistance of the chemoresistor after free chlorine sensing is measured after 10
min of drying.
5.4. Sensor characterization
5.4.1. Test in DI water
For the practical use of the drawn sensor, the adhesion between PEDOT:PSS and the
substrate is important. Delamination of the sensing material increases the resistance of the
chemoresistor which increases the error of the test. Due to the porous nature of paper
(Figure 5-1(d)), PEDOT:PSS adheres well to the substrate and forms conductive networks
(Figure 5-1(e)). After rinsing the PEDOT:PSS film with DI water or dipping the sensor in
a 100 ppm free chlorine solution for 15 s, the film morphologies did not show much
difference (Figure 5-1(f)). The consistency in the morphologies before and after free
chlorine sensing indicates that the electrical resistance change is due to the oxidation
reactions of the PEDOT (not physical delamination).
5.4.2. Mechanical stability
Another important factor for the practical use of the sensor strip is its bending stability. A
PEDOT:PSS chemoresistor of 2 cm 4 cm was bent for >750 times in air and its resistance
changes were repeatable (Figure 5-1(g)). The average relative resistance change was -0.51%
(negative sign means the resistance decreases upon bending), indicating that bending had a
minor effect on the resistance change. This high bending stability is attributed to the
mechanical flexibility of the paper and the good adhesion of PEDOT:PSS to it. To further
reduce the effect of mechanical bending, a stress/strain sensor can be integrated on the
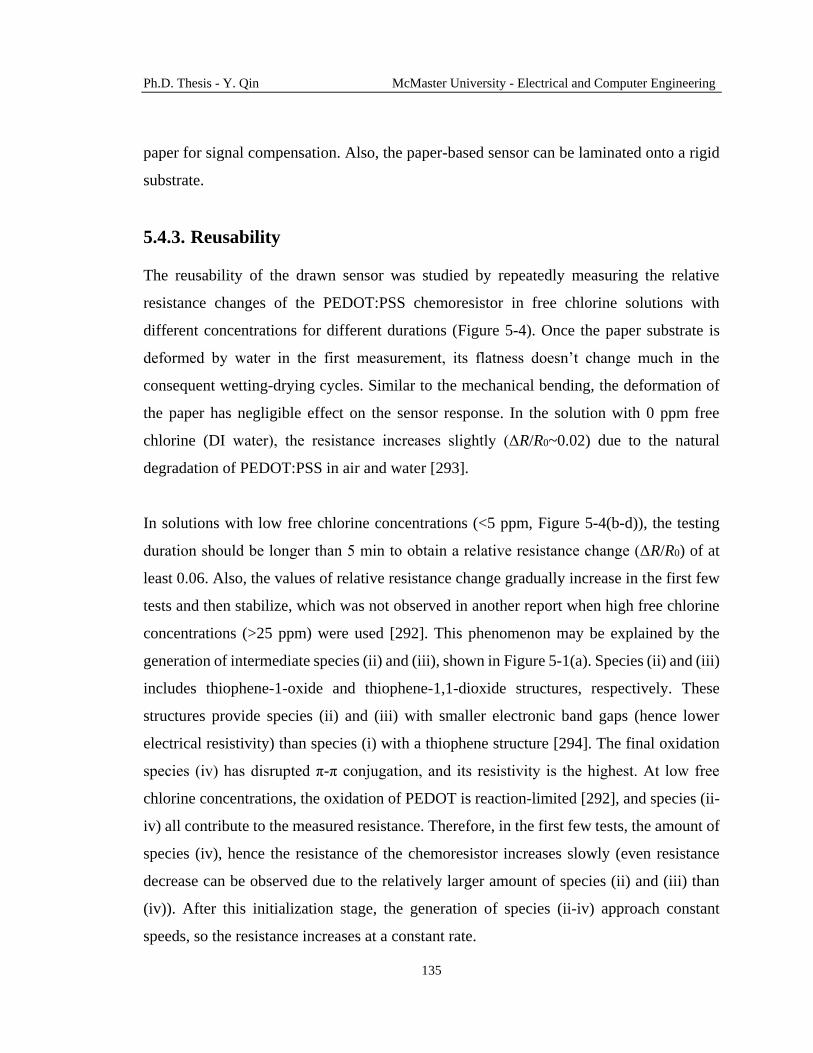
Ph.D. Thesis - Y. Qin McMaster University - Electrical and Computer Engineering
135
paper for signal compensation. Also, the paper-based sensor can be laminated onto a rigid
substrate.
5.4.3. Reusability
The reusability of the drawn sensor was studied by repeatedly measuring the relative
resistance changes of the PEDOT:PSS chemoresistor in free chlorine solutions with
different concentrations for different durations (Figure 5-4). Once the paper substrate is
deformed by water in the first measurement, its flatness doesn’t change much in the
consequent wetting-drying cycles. Similar to the mechanical bending, the deformation of
the paper has negligible effect on the sensor response. In the solution with 0 ppm free
chlorine (DI water), the resistance increases slightly (ΔR/R0~0.02) due to the natural
degradation of PEDOT:PSS in air and water [293].
In solutions with low free chlorine concentrations (<5 ppm, Figure 5-4(b-d)), the testing
duration should be longer than 5 min to obtain a relative resistance change (ΔR/R0) of at
least 0.06. Also, the values of relative resistance change gradually increase in the first few
tests and then stabilize, which was not observed in another report when high free chlorine
concentrations (>25 ppm) were used [292]. This phenomenon may be explained by the
generation of intermediate species (ii) and (iii), shown in Figure 5-1(a). Species (ii) and (iii)
includes thiophene-1-oxide and thiophene-1,1-dioxide structures, respectively. These
structures provide species (ii) and (iii) with smaller electronic band gaps (hence lower
electrical resistivity) than species (i) with a thiophene structure [294]. The final oxidation
species (iv) has disrupted π-π conjugation, and its resistivity is the highest. At low free
chlorine concentrations, the oxidation of PEDOT is reaction-limited [292], and species (ii-
iv) all contribute to the measured resistance. Therefore, in the first few tests, the amount of
species (iv), hence the resistance of the chemoresistor increases slowly (even resistance
decrease can be observed due to the relatively larger amount of species (ii) and (iii) than
(iv)). After this initialization stage, the generation of species (ii-iv) approach constant
speeds, so the resistance increases at a constant rate.

Ph.D. Thesis - Y. Qin McMaster University - Electrical and Computer Engineering
136
Figure 5-4. Reusability of paper-based drawn PEDOT:PSS sensor stripes in solutions with different free
chlorine (NaOCl) concentrations. (a) 0 ppm (DI water). (b) 0.5 ppm. (c) 1 ppm. (d) 2 ppm. (e) 5 ppm. (f) 10
ppm. (g) 20 ppm. (h) 50 ppm. (i) 100 ppm. (j) 200 ppm. (k) 500 ppm. Legend in each figure: time of each
test. X axis: accumulated testing time.
In solutions with medium free chlorine concentrations (5-50 ppm, Figure 5-4(e-g)),
response peaks can be observed after the second test if short testing duration (<2 min) is
used. This observation can be explained by the same mechanism discussed above. Both
species (ii) and (iii) are accumulated in the first test due to the reaction-limited process. In
the second test, low-resistance species (ii) and (iii) are oxidized to the high-resistance
species (iv) so that the response is large. Longer reaction time reduces the effect of species
(ii) and (iii), and the response peak in Figure 5-4(e-g) is less pronounced.
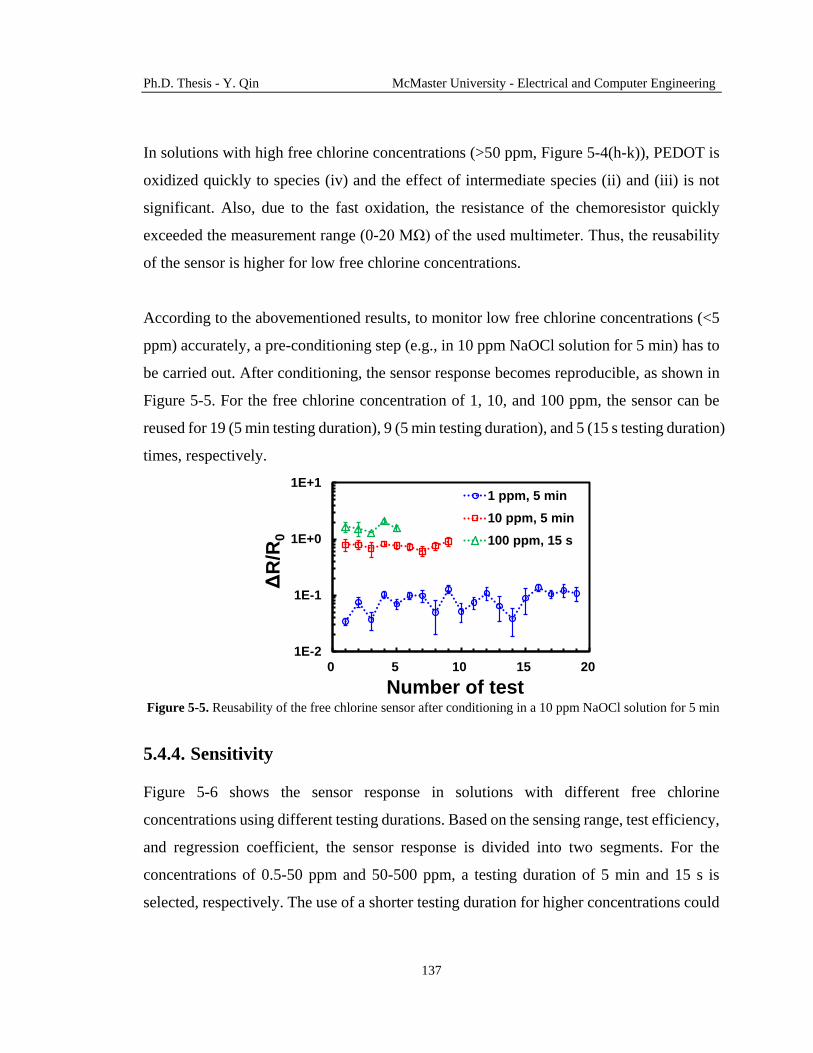
Ph.D. Thesis - Y. Qin McMaster University - Electrical and Computer Engineering
137
In solutions with high free chlorine concentrations (>50 ppm, Figure 5-4(h-k)), PEDOT is
oxidized quickly to species (iv) and the effect of intermediate species (ii) and (iii) is not
significant. Also, due to the fast oxidation, the resistance of the chemoresistor quickly
exceeded the measurement range (0-20 MΩ) of the used multimeter. Thus, the reusability
of the sensor is higher for low free chlorine concentrations.
According to the abovementioned results, to monitor low free chlorine concentrations (<5
ppm) accurately, a pre-conditioning step (e.g., in 10 ppm NaOCl solution for 5 min) has to
be carried out. After conditioning, the sensor response becomes reproducible, as shown in
Figure 5-5. For the free chlorine concentration of 1, 10, and 100 ppm, the sensor can be
reused for 19 (5 min testing duration), 9 (5 min testing duration), and 5 (15 s testing duration)
times, respectively.
Figure 5-5. Reusability of the free chlorine sensor after conditioning in a 10 ppm NaOCl solution for 5 min
5.4.4. Sensitivity
Figure 5-6 shows the sensor response in solutions with different free chlorine
concentrations using different testing durations. Based on the sensing range, test efficiency,
and regression coefficient, the sensor response is divided into two segments. For the
concentrations of 0.5-50 ppm and 50-500 ppm, a testing duration of 5 min and 15 s is
selected, respectively. The use of a shorter testing duration for higher concentrations could
1E-2
1E-1
1E+0
1E+1
0 5 10 15 20
ΔR
/R0
Number of test
1 ppm, 5 min
10 ppm, 5 min
100 ppm, 15 s

Ph.D. Thesis - Y. Qin McMaster University - Electrical and Computer Engineering
138
offer the sensor a longer lifetime (more tests can be done before resistance exceeds the
measurement range). The sensor response can be expressed as:
10
0
0.091exp 2.428 log NaOCl , 0.5ppm NaOCl 50ppm;R
R
(5.3)
10
0
0.0016exp 3.425 log NaOCl ,50ppm NaOCl 500ppm.R
R
(5.4)
The detection limit of the sensor is defined as 3 times of the sensor response in a blank
solution (ΔR/R0 ~ 0.02). Here, the detection limit is 0.5 ppm free chlorine (ΔR/R0 ~ 0.06).
Extending the testing duration can improve the detection limit, but the test efficiency and
reusability of the sensor will be reduced. In addition, the sensor response towards 0.5 ppm
free chlorine is >10 times larger than its response to mechanical bending (ΔR/R0 ~ -0.0051).
Figure 5-6. Sensor responses in different free chlorine solutions using different testing durations.
For practical use, a drawn sensor strip is first dipped into the test solution for 15 s, and the
relative resistance change is measured. If the response is larger than 0.6 (the sensor response
in a 50 ppm free chlorine solution for 15 s), equation (5.4) is used to calculate the free
chlorine concentration. On the other hand, if the response is less than 0.6, it is dipped into
the test solution again for 5 min. The sensor response from the 5-min test is used to calculate
the free chlorine concentration according to equation (5.3). The flow chart of this
procedure is shown in Figure 5-7.
1E-2
1E-1
1E+0
1E+1
1E+2
1E+3
-1 0 1 2 3
ΔR
/R0
log10([NaOCl]), log10(ppm)
5 s 15 s 30 s
60 s 120 s 300 s
600 s 1200 s
0 ppm, ΔR/R0=0.02

Ph.D. Thesis - Y. Qin McMaster University - Electrical and Computer Engineering
139
Figure 5-7. Flow chart of the procedures to use the drawn sensor for practical free chlorine measurement.
5.4.5. Stability
Because the free chlorine sensor developed in this study is reusable, its stability during the
storage period between two tests should be studied. The sensor was stored in ambient air
in dark at room temperature and tested every a few days. Figure 5-8 shows the variation of
the sensor response is less than 15% in 30 days, indicating a high storage stability. Although
the sensing material (PEDOT:PSS) may undergo degradation during storage [293], the
expression of the sensor response using relative resistance change eliminates this effect.
Figure 5-8. Storage stability of the drawn free chlorine sensor.
Fabricated and
conditioned
sensor
Dip into test
solution for 15 s
Response
(ΔR/R0)
>0.6?
Calculate free chlorine concentration using
10
0
0.0016exp 3.425 log NaOClR
R
Dip into test
solution for 5 min
Calculate free chlorine concentration using
10
0
0.091exp 2.428 log NaOClR
R
Y
N
1E-2
1E-1
1E+0
1E+1
0 10 20 30
ΔR
/R0
Time, days
1 ppm, 5 min 10 ppm, 5 min
100 ppm, 15 s

Ph.D. Thesis - Y. Qin McMaster University - Electrical and Computer Engineering
140
5.4.6. Selectivity
The selectivity of the drawn sensor should also be studied for practical considerations.
Previous studies have shown that the resistivity of PEDOT:PSS films could be reduced by
treating the films with acid, alkali, salt solutions or organic solvents [295]. However, high-
concentration solutions (>104 ppm for salt solutions) and high treatment temperatures
(>100 ºC) were needed. These conditions are not common in practical drinking water
quality monitoring applications. Here, interference solutions with a concentration of 1000
ppm (higher than the concentrations of common ions in natural water) were prepared (see
list in Figure 5-9 caption). The sensor was tested in these solutions for 5 min at room
temperature. The sensor responses were less than 0.025 (Figure 5-9), suggesting a high
selectivity towards free chlorine due to the specific oxidation reaction. In real water
samples, the concentrations of interference ions are less than 1000 ppm, so their effect on
the sensor response will be less.
Figure 5-9. Sensor responses in free chlorine solutions and 1000 ppm interference solutions (1: 100 ppm
NaOCl (15 s); 2: 10 ppm NaOCl; 3: 1 ppm NaOCl; 4: DIW; 5: NaCl, 6: CaCl2; 7: MgCl2; 8: ZnCl2; 9:
K2SO4; 10: CuSO4; 11: (NH4)2SO4; 12: NaHCO3; 13: Na2CO3; 14: CH3COONa; 15: Na2HPO4; 16:
KNO3; 17: Urea; 18: Ethylene glycol). Inset: sensor responses in logarithm scale.
5.4.7. Test of real water samples
To prove the practical usability of the drawn sensor, free chlorine concentrations in real
water samples were measured. Table 5-2 lists the measurement results of free chlorine
1 2 3 4 5 6 7 8 9 101112131415161718
ΔR
/R0
Test solutions
2.00
1.80
1.60
1.40
1.20
1.00
0.80
0.60
0.10
0.05
0.00
1E-3
1E-2
1E-1
1E+0
1E+1
1 2 3 4 5 6 7 8 9 101112131415161718
ΔR
/R0
Test solutions

Ph.D. Thesis - Y. Qin McMaster University - Electrical and Computer Engineering
141
concentrations in tap water and swimming pool water. The measured free chlorine
concentrations using the drawn sensor were close to the reference values obtained from
conventional colorimetric and amperometric sensors, with a difference less than 15%.
Table 5-2. Free chlorine measurement of real water samples (average results from n measurements).
Water sample
Measured by a drawn
sensor, ppm
Measured by the reference
method, ppm Reference method
Tap water
(McMaster)
0.8 ± 0.3 (n = 20) 0.7 ± 0.2 (n = 7) DPD-based colorimetric sensor
(CN-70, Hach)
Swimming pool
water (McMaster)
1.8 ± 0.4 (n = 20) 2.00 ± 0.00
(continuous monitoring)
Amperometric sensor
(PC DYNAMICS, Dinotec)
5.5. Advantages of the hand-drawn free chlorine sensor
The sensitivity of our sensor is based on their relative resistance change. In contrast, most
previously reported electrochemical free chlorine sensors used current change to determine
their sensitivities (Table A-2, Appendix B), thus making a direct comparison difficult.
However, for other key sensor features such as substrate material, fabrication, detection
range, response time, stability and reusability, the sensor developed in this study have the
following advantages:
The fabrication is simple and cost-effective. All steps are at room temperature, are
compatible with low-cost paper substrates, require no instrumentation, allow simple
layout design, and can be performed by untrained personnel. Multiple sensors can be
fabricated on the same substrate, and their response can be averaged to reduce the inter-
sensor variation.
The use of the sensor is straightforward. A commercial multimeter is sufficient to
provide quantitative results (in contrast to potentiostat in amperometric sensors and
optical detectors in colorimetric sensors).
A wide sensing range (0.5-500 ppm) is obtained. The wide sensing range allows the
sensor to be used in different applications (low-concentration end for monitoring
drinking and recreational water, and high-concentration end for food processing water).
The sensor is reusable (comparing to commercial colorimetric strips that are
disposable). The reusability further reduces the cost for each free chlorine test.

Ph.D. Thesis - Y. Qin McMaster University - Electrical and Computer Engineering
142
5.6. Conclusions
We have developed a simple, cost-efficient, instrument-free, hand-drawing process to
fabricate free chlorine sensors on paper substrates at room temperature. The sensing
mechanism was based on the oxidation of PEDOT:PSS chemoresistor by free chlorine
solutions. The final oxidation product had a higher electrical resistivity than PEDOT:PSS
so that the relative resistance change of a chemoresistor could be used to express the sensor
response. The sensor had a high mechanical stability, reusability, and wide sensing range.
Also, the sensor was easy-to-use so that untrained personnel could accurately measure free
chlorine concentrations in real water samples. The outcomes of this study was very
important for the monitoring of drinking water quality in resource-limited areas.

Ph.D. Thesis - Y. Qin McMaster University - Electrical and Computer Engineering
143
Chapter 6FPGA-based, integrated drinking
water quality monitoring system*
This chapter describes an integrated sensing system with microfabricated pH, free chlorine
and temperature sensors on a common glass substrate. Such a sensing system must be
accurate, efficient, user friendly, and inexpensive in the monitoring of multiple drinking
water quality parameters, which is critical for continued water safety in varied geographical
locations including developed regions and resource-limited areas. The potentiometric pH
sensor and the Wheatstone bridge temperature sensors are fabricated by inkjet printing of
Pd/PdO and Ag. These sensors are highly sensitive, fast in response, and they do not require
signal conditioning for data analysis. The free chlorine sensor is based on an
electrochemically modified pencil lead, which is highly stable and reproducible. Such a
free chlorine sensor is potentiostat-free and calibration-free, so it is easy-to-use. The three
sensors are connected to a FPGA board for data analysis and display, with real-time pH
and temperature compensation for free chlorine sensing. The developed sensing platform
enables drinking water quality monitoring by nonprofessionals in a simple manner.
6.1. Background
The monitoring of water quality is extremely important for maintaining the safety of water
resources used for various purposes such as drinking, recreation and food processing [11],
[13], [166], [296]–[298]. Water quality is determined by interdependent chemical,
microbial and physical factors including but are not limited to pH, free chlorine
concentration, turbidity, dissolved oxygen, conductivity, organic carbon, microorganisms,
* Part of this work will be submitted for consideration for publication as: Y. Qin, A. U. Alam, S. Pan, M. M.
R. Howlader, R. Ghosh, N.-X. Hu, M. J. Deen, Portable water quality monitoring system with integrated pH,
free chlorine and temperature sensors, April 2017.

Ph.D. Thesis - Y. Qin McMaster University - Electrical and Computer Engineering
144
and temperature [1]. Many conventional drinking water quality monitoring technologies
lack integration, are labor-intensive, time-consuming, and expensive. Typically in many
systems, only one parameter such as free chlorine [299] or pH [300] is measured at a time
[42]. These technical limitations raise imminent challenges in maintaining high quality
drinking water in heavily-populated cities (large water consumption and fast water quality
degradation) and also in remote areas (resource-limited) [281]. Therefore, low-cost, highly
sensitive, accurate, reliable, easy-to-use, and integrated sensing systems are needed for the
on-demand/real-time monitoring of multiple water quality parameters in multiple locations
to ensure continued drinking water safety.
Free chlorine is widely used for water disinfection, and the free chlorine concentration
should be accurately monitored for the water safety, especially for drinking, recreational,
and food processing water [12]. The WHO recommends the usage of 2 to 3 ppm free
chlorine in the drinking water [13]. The free chlorine concentration in a swimming pool
should be maintained between 1.5 to 2 ppm [16]. For food processing, the water should
contain 50 to 200 ppm free chlorine [17]. The accurate measuring of free chlorine
concentration is challenging because it is correlated with the temperature and pH of the
water sample [25]. The dissociation constant of HOCl in water is a function of temperature.
The pH of the water sample determines the concentration ratio between HOCl and OCl- at
a certain temperature. In addition, the response of a pH sensor is usually affected by
temperature [166]. Thus, pH and temperature sensors are required and should be integrated
into a free chlorine sensing system.
The standard method to measure the free chlorine concentration is to use a DPD-based
absorptiometry method [26]. However, this optical method is difficult to use, high-cost,
difficult to perform continuous monitoring, and DPD free chlorine reagent contains
chemicals that are harmful to humans, such as N,N-diethyl-p-phenylendiamine-compound
and ethylenedinitrilotetraacetic acid disodium salt dihydrate. Amperometric electrodes are
utilized for the online monitoring of free chlorine [163], [301]. One of the difficulties in

Ph.D. Thesis - Y. Qin McMaster University - Electrical and Computer Engineering
145
using the existing amperometric sensors is the requirement of frequent calibration due to
the poor stability of the sensors. Chemoresistor-based free chlorine sensors are not suitable
for continuous monitoring because the sensing materials need to be activated or dried after
each/several measurement(s) [17], [302]. For both optical and electrochemical free chlorine
sensing systems, pH sensors and temperature sensors are usually not integrated on a
common platform (at most connecting a discrete pH/temperature sensor using a cable).
For pH sensing, conventional glass electrodes are bulky, fragile and costly. These
electrodes are also difficult-to-use due to the need for frequent calibration and the
requirement of complicated electronic circuits for signal conditioning (amplification,
filtering, etc.) [166]. To improve conventional pH meters, many studies focused on
developing microfabricated pH sensors with smaller dimensions, higher stability, simpler
operation, and lower cost [11], [57], [81], [166], [303]. Besides, studies on micro-scale
temperature sensors are extensive. One of the most commonly used temperature sensors is
a thermistor made from metals [272], polymers [304], ceramics [305], carbon
nanomaterials [306], or their composites [307]. However, the technologies to fabricate low-
cost, integrated pH and temperature sensors that are compatible with other water quality
sensors are still to be explored.
Recently developed integrated sensing systems have already shown advantages in human
perspiration analysis [308], [309] and diabetes monitoring/therapy [306]. For example, the
integrated sensor arrays in such systems had a high spatial and temporal sensing resolution.
The integrated electronics could perform simultaneous on-site signal processing. Thus, the
integrated systems were compatible with multiplexed analysis. For water quality
monitoring, integrated sensors were developed for measuring dissolved oxygen,
conductivity, temperature, pH, bacteria (Escherichia coli), and cell nutrients/metabolites
[49], [310]–[312]. However, an integrated free chlorine monitoring system is not yet
developed.

Ph.D. Thesis - Y. Qin McMaster University - Electrical and Computer Engineering
146
In this chapter, we report on an integrated sensing system which could simultaneously
measure the pH, free chlorine concentration, and temperature of a water sample. The
potentiometric pH sensor was fabricated by inkjet printing of Pd/PdO as the sensing
electrode and Ag/AgCl/KCl as the reference electrode (developed in Chapter 3). Such a pH
sensor had a high sensitivity and did not require signal conditioning for data analysis. A
Wheatstone bridge temperature sensor was inkjet-printed together with the pH sensor using
the same Pd and Ag ink. The temperature sensor showed a higher sensitivity compared with
a thermistor. The free chlorine sensor is a potentiostat-free amperometric sensor, consisting
of an electrochemically modified pencil lead and an inkjet-printed Ag electrode. Such a
free chlorine sensor measured the HOCl concentration, and was calibration-free due to its
high reproducibility and stability. The three microfabricated sensors were on a common
glass substrate, and they were connected to a FPGA board for on-site monitoring of real
water samples. A high measurement accuracy was obtained. This indicated that the
integrated sensing system has the potential to be used as a rapid, user-friendly, cost-
effective, and widely applicable method for drinking water quality monitoring.
6.2. Fabrication of integrated sensors
The integrated pH, free chlorine, and temperature sensors were fabricated on glass
substrates (7525M, J. Melvin Freed Brand) cleaned by IPA and DI water (Figure 6-1(a)).
The pH and temperature sensors were inkjet-printed onto the glass substrates while the free
chlorine sensors were fabricated separately by the electrochemical modification of pencil
leads. The layout designs of the inkjet-printed structures are shown in Appendix C.
The Pd ink was prepared by diluting the as-received Pd precursor solution using 20 wt%
toluene. The inkjet printing process (Figure 6-1(b)) followed our previous report (reference
[81] and Chapter 3) using a Dimatix DMP-2831 materials printer (Fujifilm) equipped with
DMC-11610 Dimatix materials cartridges (Fujifilm). The thermolysis of the printed Pd ink
was carried out on a hotplate in air at 200 °C for 4 min to form a smooth Pd film for the pH
sensor (Figure 6-1(c)). Then, the Pd ink was printed again, and the thermolysis was

Ph.D. Thesis - Y. Qin McMaster University - Electrical and Computer Engineering
147
performed in a low-vacuum chamber (Isotemp 280A, Fisher Scientific) at 200 °C for 20
min to form rough Pd films (Figure 6-1(d-e)) ([305] and Chapter 4).The rough films are
used as two thermistors with a negative TCR in the Wheatstone-bridge-based temperature
sensor. The printed Pd films (both smooth and rough) were oxidized in air at 200 °C for 48
h to form PdO-rich films (Figure 6-1(f)).
Next, the SU-8 photoresist was diluted by 10 times using PGMEA and inkjet-printed onto
the substrate (Figure 6-1(g)) to improve the adhesion between the substrate and the Ag
films (printed in the next step). The SU-8 ink was cured in air at 200 °C for 1 h (Figure
6-1(h)). The as-received Ag NP ink was then inkjet-printed to form two thermistors with
positive TCR values in the temperature sensor, the Ag layer of the reference electrode in
the pH sensor, and the Ag electrode in the free chlorine sensor (Figure 6-1(i)). The sintering
condition for the Ag NP ink was 120 °C for 10 min in air (Figure 6-1(j)). The AgCl layer
in the Ag/AgCl reference electrode was obtained by drop casting 0.4 wt% NaOCl solution
onto the printed Ag for 30 s before rinsing with DI water (Figure 6-1(k)). A solution of the
solid electrolyte of the reference electrode was formulated by dissolving 2 wt% PVC in
KCl- and AgCl-saturated cyclohexanone. The solution was drop casted on top of the
Ag/AgCl film and heated at 140 °C for 5 min to form a solid electrolyte layer (Figure 6-1(l)).
The sensing electrode of the free chlorine sensor was fabricated by the electrochemical
modification of the pencil lead surface [313]. A voltage of 1 V was applied between the
pencil lead and a Ag/AgCl reference electrode (CHI111, CH Instruments). The electrolyte
solution contained 0.1 M PBS (pH 7.0) and an appropriate amount of ammonium carbamate
(0.1 M) to adjust the pH to 8.9. The middle part of the modified pencil lead was mounted
onto the glass substrate by using a 2 wt% PVC solution in cyclohexanone as adhesive
(Figure 6-1(m-n)). The PVC solution also covered the entire temperature sensor and the
printed electrical connections of the pH and free chlorine sensors as a water-resistant layer
(Figure 6-1(n)). After drying the PVC solution in air at 80 °C for 30 min, conductive copper
tapes (Tapes Master) were used to make electrical contacts. The integrated sensor was

Ph.D. Thesis - Y. Qin McMaster University - Electrical and Computer Engineering
148
conditioned in 1 M KCl solution for 12 h before use. An image of the fabricated integrated
sensor is shown in Figure 6-2(b).
The fabricated sensors were connected to a FPGA board (Basys 3, Artix-7, Digilent) for
data analysis and display. The FPGA was programmed using the Verilog language with the
Vivado Design Suite (2015.4, Xilinx). The Verilog code is shown in Appendix D.
Figure 6-1. Fabrication process of an integrated pH, free chlorine and temperature sensor.
6.3. System design
Monitoring the drinking water quality using the developed integrated sensing system has
the following advantages over using discrete sensors and conventional analytical method:
As illustrated in Figure 6-2(a), the integrated sensing system includes an integrated
sensor probe, a signal conditioning circuit board for free chlorine sensing, a FPGA
board, and a portable power supply. The integrated system allows simultaneous on-site
monitoring of three important water quality parameters: pH, free chlorine
concentration, and temperature. The integrated system also allows the real-time
compensation for the sensor readings for high measurement accuracy. For example,
the pH reading is compensated using the measured temperature. The free chlorine
concentration is compensated using both pH and temperature.

Ph.D. Thesis - Y. Qin McMaster University - Electrical and Computer Engineering
149
By fabricating the pH, free chlorine and temperature sensors on a common substrate
with a small footprint (Figure 6-2(b)), water quality monitoring with a high spatial
resolution can be realized. In addition, the sensing signals can be accurately
compensated due to the three sensors being closely located to each other.
Since the main technology used to fabricate the sensors is inkjet printing, the integrated
sensor is low-cost due to the small amount of consumed materials and the elimination
of cleanroom environment, high-temperature equipment, and high-vacuum chambers.
Figure 6-2. (a) A portable integrated water quality monitoring system measuring the pH value of tap water.
(b) An integrated water quality sensing probe with pH, temperature and free chlorine sensors. (c) A schematic
diagram of the water quality monitoring system including signal conditioning (amplification and filtering for
free chlorine sensor), data analysis (on the FPGA board), and results display (on the FPGA board). “T”
represents “temperature” in the schematic diagram.
The output signals of different sensors should be within the input range of the electronic
system (FPGA board in this study) to realize an integrated system. Here, the sensor signal
was digitized using a 12-bit analogue-to-digital converter (ADC, on the FPGA board),
whose input voltage range was 0 - 1 V with a resolution of 0.305 mV. The data sampling
frequency was set to be 1 Hz to realize real-time monitoring.
pH calibration
pH
measurement
Display mV for pH
Display pH
12-bit
ADC
pH calculation
Transimpedance
amplifier
T
sensor
Free
chlorine
sensor
T measurement
Free chlorine
measurement
T calculation
Free chlorine
concentration
calculation
Display mV for T
Display T
Display mV for HOCl
concentration
Display HOCl
concentration
pH
sensor
Display HOCl + OCl-
concentration
Low-
pass
filter
Power supply
FPGA board
(c)
5 mm
(a) (b)
Temperature
sensor
pH sensor
Free chlorine
sensor
Portable
power supply
Transimpedance
amplifier + low-
pass filter
FPGA
board
Integrated
sensors

Ph.D. Thesis - Y. Qin McMaster University - Electrical and Computer Engineering
150
For the pH sensor, we have developed a Pd/PdO-based potentiometric pH sensor having an
output voltage range of 0 - 500 mV (within the input range of the ADC) for the pH range
between 4 and 10. The voltage resolution of 0.305 mV of the ADC results in a pH resolution
of ~0.005 (a pH sensitivity of 60 mV/pH is used here), which is better than the requirement
of most water quality monitoring applications. In other words, the resolution of the pH
output is not determined by the voltage resolution of the ADC, but the resolution of the pH
sensor. Therefore, the pH sensor can be directly connected to the ADC without the need
for data conditioning circuits.
For the free chlorine sensor, the papper-based, hand-drawn sensor developed in Chapter 5
is not suitable for real-time monitoring because of the drying step in using the sensor. Thus,
an amperometric free chlorine sensor for measuring HOCl concentration developed in our
group was employed in the integrated system [313]. The amperometric sensor consisted of
a sensing electrode of an amine-modified pencil lead. The first challenge of integrating
such a free chlorine sensor is the requirement of three electrodes and a potentiostat, which
increases the system complexity. In our previous study [313], the reduction potential for
HOCl was found to be 0.1 V, which is close to 0 V. Thus, we simplified the three-electrode
configuration to a two-electrode configuration: the modified pencil lead as the working
electrode and a Ag film as the reference/counter electrode. In the simplified configuration,
0 V was used as the reduction potential so that an external power supply (potentiostat) for
activating the sensor can be eliminated [309]. The second challenge of implementing the
free chlorine sensor is to convert its output current signals to voltage signals that are
readable by the ADC on the FPGA board. To address this challenge, a transimpedance
amplifier (Figure 6-3(a-b)) converted and amplified the output signal to 0 to 1 V for a free
chlorine concentration of 0 to 8 ppm (common range for drinking and recreational water).
Before the output voltage was read by the ADC, a low-pass filter circuit was applied to
reduce the noise introduced by the transimpedance amplifier.

Ph.D. Thesis - Y. Qin McMaster University - Electrical and Computer Engineering
151
Figure 6-3. (a) Circuit diagram of a transimpedance amplifier with a low-pass filter for the signal
conditioning for the free chlorine sensor. (b) Photo of the fabricated transimpedance amplifier with a low-
pass filter. (c) Transfer characteristic curve of the transimpedance amplifier with a low-pass filter circuit.
For the temperature sensor, a Wheatstone bridge circuit (Figure 6-4) was used. In this
circuit, RPdO1,2 were inkjet-printed Pd/PdO films with a bilayer morphology (see Chapter 4
for details) that have a negative TCR value. RAg1,2 were inkjet-printed Ag films that have a
positive TCR value. The resistance values of the four thermistors in the Wheatstone bridge
circuit should be chosen to satisfy the following conditions:
The output voltage is in the range of 0-1 V to be read by the ADC for a temperature
between 0 °C and 50 °C (for most water quality monitoring applications).
The sensitivity of the temperature sensor is maximized for a highly accurate
measurement.
The resistance between the power supply and ground should be large so that the self-
heating of the resistors is kept low to reduce drift of the sensor output.
The size of the sensor is kept small to obtain a high spatial resolution.
-
+-
+
LT1462
LT1462
0.5MΩ
0.5MΩ
2MΩ
1MΩ
2MΩ
0.1μF 10μF
0.1μF 10μF
0.1μF 10μF
0.1μF 10μFVSS VSS
VDD VDD
Ifree chlorine
Vout0.5MΩ
0.5MΩ 10μF
(a)
(b) (c)
y = 196.04x + 35.4R² = 0.9999
0
200
400
600
800
1000
0 1 2 3 4
Ou
tpu
t v
olt
ag
e,
mV
Current from chlorine sensor, μA

Ph.D. Thesis - Y. Qin McMaster University - Electrical and Computer Engineering
152
Taking the four considerations into account, we designed the Wheatstone bridge circuit
with RAg1 = 150 Ω, RAg2 = 525 Ω, RPdO1 = 675 Ω, and RPdO2 = 150 Ω (Figure 6-4).
Figure 6-4. Wheatstone bridge circuit of an inkjet-printed temperature sensor with 4 thermistors.
For data analyses and results display, the three sensors (Figure 6-2(b)) and the conditioning
circuit were connected to the FPGA board. The digitized signal was sent to the
microprocessor programmed with the following functions (Figure 6-2(c)):
Temperature measurement. The output voltage of the temperature sensor is recorded
in real-time. The temperature is calculated using a built-in equation (see details in
subsection 6.6).
pH calibration. The stabilized output voltage of the pH sensor is stored as the
calibration voltage when the sensor is immersed in a standard calibration solution of
pH = 7.
pH measurement. The output voltage of the pH sensor is recorded in real-time. The
pH value is calculated using the sensitivity of the sensor and the calibration voltage.
The pH sensitivity is compensated using the measured temperature (see details in
section 6.4).
Free chlorine measurement. The output voltage of the free chlorine sensor is recorded
in real-time. The concentration of HOCl is calculated using an equation programmed
in the FPGA. The free chlorine sensitivity is compensated using the measured
temperature. Also, to calculate the free chlorine concentration (both HOCl and OCl-),
another built-in equation is used based on the measured pH and temperature of the water
sample (see details in subsection 6.5).
RPdO1
+3.3 V
Vout
RPdO2RAg1
RAg2
V- V+

Ph.D. Thesis - Y. Qin McMaster University - Electrical and Computer Engineering
153
6.4. Characterization of pH sensor
The pH sensor used in the integrated system was identical to that developed in Chapter 3.
Therefore, detailed characterization of the sensor performance is not presented here.
Briefly, when the pH of the water sample varied between 4 and 10, the sensor exhibited a
large and low-noise output voltage in the range of 0 - 500 mV (Figure 3-17(a)). The output
of such a sensor was within the ADC voltage range in the electronic system so that a power
supply, amplifier or low-pass filter was not required for driving the sensor or signal
conditioning. Also, the sensor showed a short response time of ~15 s (Figure 3-17(a)). This
fast response allowed the implementation of the sensor for real-time monitoring.
The sensor-to-sensor variation of the pH sensitivity was as small as ±0.11 mV/pH (~0.36%
of the sensitivity of 60.6 mV/pH). However, the standard electrode potential (E0 in equation
(2.22), or the output voltage for a certain pH value) of different sensors exhibited a
difference of ~30 mV (Figure 6-5). This output voltage difference limited the accuracy of
the sensors to be 0.5 pH. Thus, single-point calibration (normally at pH = 7 at 25 °C) should
be carried out for each sensor to find its standard electrode potential (E0) for improved
sensing accuracy. Moreover, in subsection 3.3.2.1, we showed that the pH sensitivity is a
function of temperature. The pH sensitivity showed a linear temperature dependence of
~0.23 mV/pH/°C (Figure 3-18). Thus, temperature compensation for the pH sensitivity is
required to improve the accuracy of a pH measurement. The equation for calculating the
pH value can be written as:
pH=7+ ,60.6 25 0.23
cal meas
meas
E E
T
(6.1)
and this equation was programmed into the microprocessor on the FPGA board. In equation
(6.1), Ecal (in mV) is the recorded voltage when the sensor is immersed into the calibration
solution (pH = 7), Emeas (in mV) is voltage reading during pH monitoring, Tmeas (in °C) is
the measured temperature of the water sample.

Ph.D. Thesis - Y. Qin McMaster University - Electrical and Computer Engineering
154
Figure 6-5. Calibration curves for three inkjet-printed pH sensors.
The hysteresis of the sensor (~8.9 mV, shown in Figure 3-17(a)) determined its resolution,
which was ~0.15 pH. The drift behavior of the sensor in 1 M KCl solution (to reduce the
drift of the Ag/AgCl/KCl reference electrode) at room temperature in dark was ~1.6 mV/h
(Figure 3-17(e)), which was equivalent to 0.03 pH/h. The drift-induced inaccuracy was 5
times lower than the resolution of the sensor, so time compensation is not needed for most
on-demand drinking water quality monitoring applications using this fast-response sensor.
In summary, the developed pH sensor has the following advantages comparing to
conventional glass electrodes and other microfabricated pH sensors:
An external power supply, amplifier, or filter is not needed, which simplifies the
integration and signal processing.
The sensor can be calibrated at a single pH value due to its reproducible sensitivity and
linear response.
The sensor fabricated by inkjet printing technology is low-cost.
6.5. Characterization of free chlorine sensor
The free chlorine concentration was monitored by a simplified amperometric configuration
with an amine-modified pencil lead as the working electrode. The reference and counter
electrodes in a conventional amperometric sensor were combined as an inkjet-printed Ag
film. This 2-electrode system also did not require an external power supply to activate the
0
100
200
300
400
500
4 5 6 7 8 9 10
Po
ten
tial, m
VpH
Sensitivity:
60.6 0.11 mV/pH

Ph.D. Thesis - Y. Qin McMaster University - Electrical and Computer Engineering
155
sensor [309]. This sensor measures the concentration of HOCl in the water sample [313],
and the result can be used to calculate the free chlorine concentration (both HOCl and OCl-).
Free chlorine solutions with different concentrations were prepared by diluting the as-
received NaOCl solution using a PBS solution (0.01 M, pH = 7.4). The free chlorine
concentrations of the prepared solutions were calibrated using a DPD-based colorimetric
test kit (CN-70, Hach). The current flowing through the working and the reference/counter
electrodes was recorded using a semiconductor analyzer (4200-SCS, Keithley) every 2 s
for 60 s when the electrodes were immersed in free chlorine solutions (without stirring).
The electrodes were transferred into the next free chlorine solution without cleaning or
drying. All free chlorine sensing tests were performed at 27 ± 2 °C.
When the free chlorine concentration of the water sample varied between 0.2 and 8 ppm,
the amplitude of the output current of the sensor was between 0 and 3000 nA (Figure 6-6(a)).
A transimpedance amplifier with a gain of 196 kΩ was designed to convert the current
signal to a voltage signal between 0 and 1 V (Figure 6-3(c)). To suppress the noise
introduced by the transimpedance amplifier, a resistor-capacitor low-pass filter with a
cutoff frequency of 0.06 Hz was used for signal conditioning.
6.5.1. Sensitivity and response time
The sensitivities of 5 free chlorine sensors (fabricated in the same batch) were measured
(Figure 6-6(b)). The average sensitivity was ~342 nA/ppm (10.36 nA/mm2/ppm for the
sensors with an electrode area of ~33 mm2) and the sensitivity variation was only ±12
nA/ppm (0.36 nA/mm2/ppm, ~7% of the sensitivity). Although the sensitivity was not as
high as that of other reported free chlorine sensors [17], [166], our sensor had a high
reproducibility with a negligible sensor-to-sensor variation of the output current at a certain
free chlorine concentration. This high reproducibility was appealing for an easy-to-use
sensor because calibration is not needed before each measurement once the calibration
equation was stored in the electronic system.
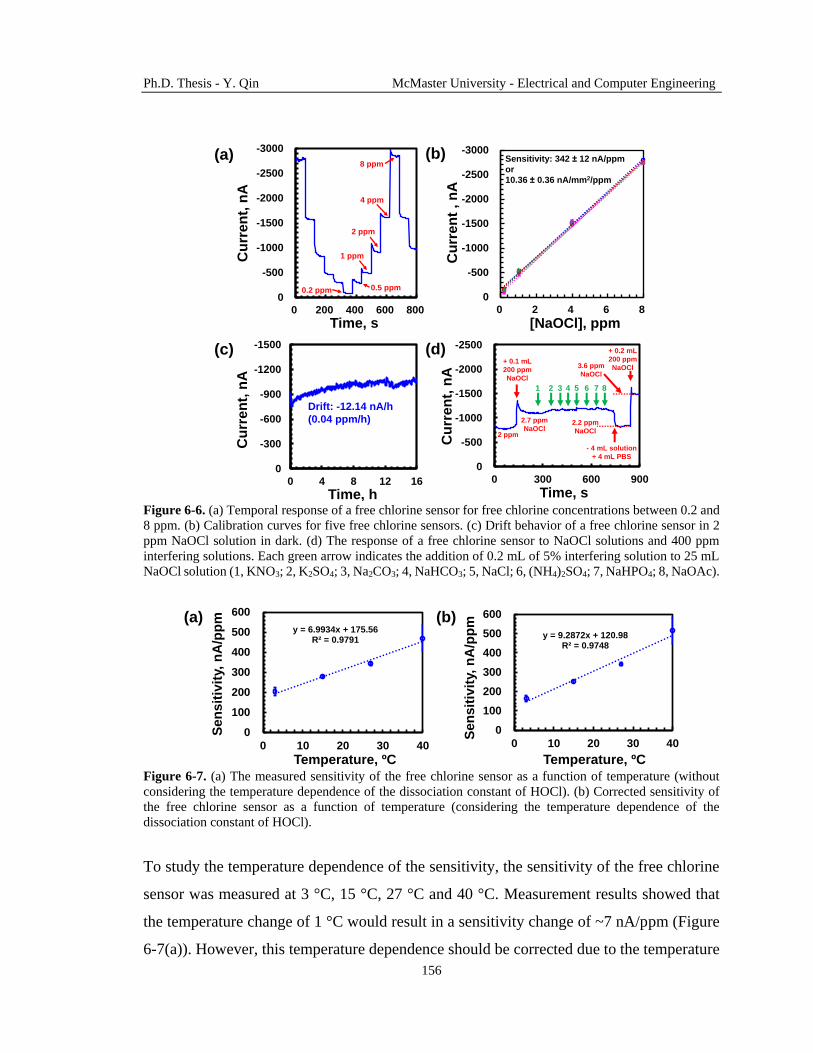
Ph.D. Thesis - Y. Qin McMaster University - Electrical and Computer Engineering
156
Figure 6-6. (a) Temporal response of a free chlorine sensor for free chlorine concentrations between 0.2 and
8 ppm. (b) Calibration curves for five free chlorine sensors. (c) Drift behavior of a free chlorine sensor in 2
ppm NaOCl solution in dark. (d) The response of a free chlorine sensor to NaOCl solutions and 400 ppm
interfering solutions. Each green arrow indicates the addition of 0.2 mL of 5% interfering solution to 25 mL
NaOCl solution (1, KNO3; 2, K2SO4; 3, Na2CO3; 4, NaHCO3; 5, NaCl; 6, (NH4)2SO4; 7, NaHPO4; 8, NaOAc).
Figure 6-7. (a) The measured sensitivity of the free chlorine sensor as a function of temperature (without
considering the temperature dependence of the dissociation constant of HOCl). (b) Corrected sensitivity of
the free chlorine sensor as a function of temperature (considering the temperature dependence of the
dissociation constant of HOCl).
To study the temperature dependence of the sensitivity, the sensitivity of the free chlorine
sensor was measured at 3 °C, 15 °C, 27 °C and 40 °C. Measurement results showed that
the temperature change of 1 °C would result in a sensitivity change of ~7 nA/ppm (Figure
6-7(a)). However, this temperature dependence should be corrected due to the temperature
-3000
-2500
-2000
-1500
-1000
-500
0
0 2 4 6 8
Cu
rren
t , n
A
[NaOCl], ppm
Sensitivity: 342 12 nA/ppm
or
10.36 0.36 nA/mm2/ppm
(b)
(c)
(a)
(d)
-3000
-2500
-2000
-1500
-1000
-500
0
0 200 400 600 800
Cu
rre
nt,
nA
Time, s
8 ppm
4 ppm
2 ppm
1 ppm
0.2 ppm 0.5 ppm
-2500
-2000
-1500
-1000
-500
0
0 300 600 900
Cu
rre
nt,
nA
Time, s
2 ppm
+ 0.1 mL
200 ppm
NaOCl
2.7 ppm
NaOCl
- 4 mL solution
+ 4 mL PBS
2.2 ppm
NaOCl
+ 0.2 mL
200 ppm
NaOCl3.6 ppm
NaOCl
1 2 3 4 5 6 7 8
Drift: -12.14 nA/h
(0.04 ppm/h)
-1500
-1200
-900
-600
-300
0
0 4 8 12 16
Cu
rre
nt,
nA
Time, h
(a)y = 6.9934x + 175.56
R² = 0.9791
0
100
200
300
400
500
600
0 10 20 30 40
Sen
sit
ivit
y, n
A/p
pm
Temperature, ºC
y = 9.2872x + 120.98R² = 0.9748
0
100
200
300
400
500
600
0 10 20 30 40
Sen
sit
ivit
y, n
A/p
pm
Temperature, ºC
(b)

Ph.D. Thesis - Y. Qin McMaster University - Electrical and Computer Engineering
157
dependence of the dissociation constant of HOCl. In other words, the amount of HOCl
(which caused the sensor response) and the sensor response both change with temperature.
The dissociation constant of HOCl as a function of temperature is [25]:
3000
p 10.0686 0.0253 273 .273
a meas
meas
K TT
(6.2)
At pH = 7.4, the percentage of HOCl in a water sample is 70.77%, 63.15%, 56.92%, and
52.01% at 3 °C, 15 °C, 27 °C, and 40 °C, respectively. Therefore, the temperature
dependence of the sensitivity of the free chlorine sensor can be corrected by equation (6.2)
and the measured data shown in Figure 6-7(a). After correction, the sensitivity of the sensor
showed a temperature dependence of ~9.3 nA/ppm/°C (Figure 6-7(c)). The calibration
equation of the free chlorine sensor is:
342 27 9.3 109.6,out meas NaOClI T C (6.3)
where Iout (in nA) is the amplitude of the output current of the free chlorine sensor (input
current of the signal conditioning circuit), Tmeas (in °C) is the measured temperature of the
water sample, and CNaOCl (in ppm) is the concentration of NaOCl in the water sample for
sensor characterization. The transfer function of the signal conditioning circuit
(transimpedance amplifier and low-pass filter) can be described by (Figure 6-3(c)):
0.196 35.4,outV I (6.4)
where V (in mV) is the output voltage of the signal conditioning circuit. Therefore, using
equations (6.3) and (6.4), the NaOCl concentration can be calculated using:
35.4109.6
0.196 .342 27 9.3
NaOCl
meas
V
CT
(6.5)
Because the sensor response is caused by HOCl in the water sample [313] and ~57% of the
free chlorine is HOCl at pH = 7.4 (condition for the sensor characterization) [166], the
concentration of HOCl (CHOCl) at any solution pH value is:
35.4109.6
0.1960.57 .342 27 9.3
HOCl
meas
V
CT
(6.6)

Ph.D. Thesis - Y. Qin McMaster University - Electrical and Computer Engineering
158
In a solution, the percentage distribution of HOCl and OCl- is pH-dependent [166]:
-
log p pH,OCla
HOCl
CK
C (6.7)
where COCl- is the concentration of OCl- ion. Based on equations (6.2), (6.6) and (6.7),
the concentration of the free chlorine (Cfree chlorine) can be calculated using:
pH p
3000pH 10.0686 0.0253 273
273
1 10
35.4109.6
0.1960.57 1 10 .342 27 9.3
a
measmeas
K
free chlorine HOCl
TT
meas
C C
V
T
(6.8)
Therefore, equation (6.8) was programmed into the microprocessor to calculate the free
chlorine concentration based on the output voltage of the free chlorine sensor, the pH, and
the temperature of the water sample. In Figure 6-6(a), we can find the response time of the
free chlorine sensor was ~30 s, which is suitable for real-time monitoring.
6.5.2. Reversibility and drift
The resolution of the free chlorine sensor is determined by its hysteresis. When the free
chlorine concentration was cycled between 0.2 and 8 ppm (Figure 6-6(a)), the average
hysteresis of 53.5 nA resulted in a resolution of 0.16 ppm. The drift behavior was studied
by keeping the free chlorine sensor in 2 ppm NaOCl solution at 4 °C (to reduce the
decomposition of free chlorine) in dark for 16 h. The drift rate was ~12.14 nA/h (Figure
6-6(c)), which was equivalent to 0.04 ppm/h (4 times lower than the sensor resolution).
6.5.3. Selectivity
The selectivity was studied by recording the sensor response when 0.2 mL of 5% interfering
solutions were added into 25 mL of 2 ppm NaOCl solution (Figure 6-6(d)). The added
interfering solutions had an equivalent concentration of ~400 ppm. The sensor revealed
negligible response to KNO3, K2SO4, Na2CO3, NaHCO3, NaCl, (NH4)2SO4, NaHPO4 and

Ph.D. Thesis - Y. Qin McMaster University - Electrical and Computer Engineering
159
NaOAc. After the selectivity test, the sensor was still able to show a stable response to the
change of free chlorine concentration.
6.5.4. Stability
The free chlorine sensor was stored in 1 M KCl solution at room temperature for studying
its stability. Figure 6-8 shows the change of the sensor sensitivity with storage time. The
sensitivity right after sensor fabrication was 342 ± 12 nA/ppm, and the sensitivity after
storing for 7, 21, and 50 days was 360 ± 13, 343 ± 18, and 331 ± 21 nA/ppm, respectively
(4 measurement cycles for each test). The sensitivity variation in the 50-day duration was
28 nA/ppm, which was only ~8% of the initial sensitivity. This small variation indicates a
high stability of the pencil-lead-based free chlorine sensor.
Figure 6-8. Stability of the pencil-lead-based free chlorine sensor.
In summary, the developed free chlorine sensor has the following advantages compared to
conventional amperometric sensors and other microfabricated free chlorine sensors:
A potentiostat is not needed for activating the sensor, which simplifies the integration.
The sensor is highly reproducible, and calibration is only required for one sensor before
the first use (calibration-free for other sensors fabricated in the same batch).
The sensor is cost-effective due to the use of pencil lead and inkjet-printed Ag film.
6.6. Characterization of temperature sensor
The performance the Wheatstone-bridge-based temperature sensors were characterized in
a reliability test chamber (ESL-2CA, ESPEC) in water with the temperature varying
0
100
200
300
400
0 10 20 30 40 50
Sen
sit
ivit
y,
nA
/pp
m
Time, day
Ph.D. Thesis - Y. Qin McMaster University - Electrical and Computer Engineering
160
between 0 °C and 50 °C. The bias voltage for the sensors was 3.3 V and the output voltage
was recorded using a semiconductor parameter analyzer (4200-SCS, Keithley).
Figure 6-9. (a) Temporal response of a thermistor fabricated by an inkjet-printed Ag film when the
temperature cycles between 0 °C and 50 °C. (b) Calibration curve of the inkjet-printed Ag thermistor. (c)
Temporal response of a thermistor fabricated by an inkjet-printed Pd/PdO film when the temperature cycles
between 0 °C and 50 °C. (d) Calibration curve of the inkjet-printed Pd/PdO thermistor.
In the Wheatstone bridge circuit (Figure 6-4), two thermistors were inkjet-printed Ag films
with a positive TCR of 0.197% /°C (Figure 6-9(a-b)). The other two thermistors were
inkjet-printed PdO films with a negative TCR of -0.256% /°C (Figure 6-9(c-d)). The
selected thermistor materials of Ag and PdO were the same for the fabrication of the pH
sensor. Hence, the temperature sensor could be simultaneously fabricated with the pH
sensor, thus simplify the integration process.
6.6.1. Sensitivity
When the temperature increases, the resistance of RAg1 in the Wheatstone bridge circuit
increases and the resistance of RPdO1 decreases. Thus, the voltage of V- (in Figure 6-4)
increases. Similarly, the voltage of V+ decreases (Vout = V+ - V- also decreases) as the
temperature increases. Using this differential sensing concept, the temperature sensitivity,
dVout/dT, of the Wheatstone bridge is increased compared with a single thermistor. In
240
245
250
255
260
265
270
0 2 4 6 8 10 12 14 16 18 20
Re
sis
tan
ce
, Ω
Time, h
40 ºC
0 ºC
30 ºC
20 ºC
10 ºC
50 ºC(a) (b)y = 0.4816x + 243.57
R² = 0.9999
240
245
250
255
260
265
270
0 10 20 30 40 50
Re
sis
tan
ce
, Ω
Temperature, ºC
TCR = +0.197% /ºC
(c) (d)
26
27
28
29
30
31
32
0 2 4 6 8 10 12 14 16
Re
sis
tan
ce
, kΩ
Time, h
40 ºC
0 ºC
30 ºC
20 ºC
10 ºC
50 ºC
y = -0.0771x + 30.736R² = 0.9991
26
27
28
29
30
31
32
0 10 20 30 40 50
Re
sis
tan
ce
, kΩ
Temperature, ºC
TCR = -0.256% /ºC

Ph.D. Thesis - Y. Qin McMaster University - Electrical and Computer Engineering
161
addition, the output voltage showed a fast (almost immediate) and linear response with the
temperature change (Figure 6-10(a)), so the sensor is capable for real-time compensation
of the pH and free chlorine sensors.
Figure 6-10. (a) Temporal response of the temperature sensor for temperatures between 0 and 50 °C. (b)
Calibration curve of the temperature sensor. (c) Drift of the temperature sensor at 25 °C in water in dark.
From the temporal response, the sensitivity of the temperature sensor was calculated to be
~3.35 mV/°C (Figure 6-10(b)), which was lower than the theoretical value (~4.3 mV/°C).
This reduced sensitivity might be caused by the PVC coating on the 4 thermistors. Because
PVC (52 ppm/°C) has a different thermal expansion coefficient than Ag (19 ppm/°C) and
PdO (12 ppm/°C), the temperature variation induced stress could cause resistance increases
of the 4 thermistors, resulted in a reduced sensitivity. The equation to be programmed into
the microprocessor for temperature calculation can be written as:
206.7
,3.35
outmeas
VT
(6.9)
where Tmeas (in °C) is the measured temperature of the water sample and Vout (in mV) is the
output voltage of the temperature sensor.
(b)
(a)
0
50
100
150
200
250
0 2 4 6 8 10 12 14 16
Vo
ut, m
V
Time, h
50 ºC
0 ºC
10 ºC
20 ºC
30 ºC
40 ºC
0
50
100
150
200
250
0 10 20 30 40 50
Vo
ut, m
V
Temperature, ºC
(c)
0
50
100
150
200
0 5 10 15 20
Vo
ut, m
V
Time, h
Drift = 1.24 mV/h (0.37 ºC/h)
Sensitivity:
3.35 0.01 mV/ºC
Ph.D. Thesis - Y. Qin McMaster University - Electrical and Computer Engineering
162
6.6.2. Reversibility and drift
The temperature sensor exhibited a hysteresis of ~0.93 mV (Figure 6-10(a)), so the
resolution of the sensor was ~0.28 °C. The drift behavior of the sensor was studied by
storing the sensor at 25 °C in water in dark. Over the total test time of ~18 h, the drift rate
was 1.24 mV/h (0.37 °C/h). In Figure 6-10(c), the drift behavior can be divided into two
segments. The drift rate of ~2.07 mV/h (~0.62 °C/h) was relatively large for the first 10
hours, which might be due to the water absorption of the PVC film. The swelling of the
PVC film resulted in stress on the underlying thermistors so that their resistance drifted.
After 10 hours of the test, the drift rate decreased to ~0.23 mV/h (~0.09 °C/h). This slow
drift suggested that an equilibrium condition was reached for the swelling of PVC in water.
To reduce the drift, the temperature sensor can be encapsulated by a polymer with a lower
water absorption rate such as parylene-C or liquid crystal polymer [180].
In summary, the developed temperature sensor has the following advantages:
The Wheatstone-bridge-based temperature sensor has a higher sensitivity than a
thermistor.
The sensor is fabricated by inkjet printing using the same materials as fabricating the
pH sensor, so the sensor is inexpensive and easy-to-integrate.
6.7. Measurement of real water samples
The integrated sensors were connected to the programmed FPGA board for the monitoring
of tap water, lake water, and swimming pool water. The pH, free chlorine, temperature
readings from our developed system were compared with results from reference methods
(Table 6-1). For pH sensing, a commercial pH meter (PHB-600R, OMEGA) with a glass
electrode (PHE1311, OMEGA) was used as the reference. For free chlorine sensing, a
DPD-based colorimetric test kit (CN-70, Hach) was used as the reference. For temperature
sensing, a thermometer (HI98509 Checktemp 1, HANNA) was used as the reference. The
results obtained using our system were close to those measured from reference methods,

Ph.D. Thesis - Y. Qin McMaster University - Electrical and Computer Engineering
163
with a difference less than 7%, 18%, and 15% for pH, free chlorine, and temperature,
respectively.
Table 6-1. Monitoring of pH, free chlorine concentration and temperature of real water samples (average
results from 5 measurements).
Tap water
(Toronto)
Lake water
(Ontario lake)
Swimming pool water
(McMaster University)
Our system Reference Our system Reference Our system Reference
pH 8.30 ± 0.29 8.11 ± 0.07 7.49 ± 0.10 7.88 ± 0.03 6.88 ± 0.10 7.36 ± 0.10
Free chlorine, ppm 0.95 ± 0.13 0.86 ± 0.13 0.01 ± 0.01 0.00 ± 0.00 2.62 ± 0.32 2.22 ± 0.22
Temperature, °C 14.70 ± 0.52 15.04 ± 0.11 0.20 ± 0.08 0.24 ± 0.05 26.34 ± 0.53 27.72 ± 0.08
6.8. Conclusions
We have developed an integrated sensing system for the simultaneous monitoring of
drinking water quality parameters including pH, free chlorine concentration, and
temperature. The system consisted of an integrated sensing probe with inkjet-printed pH
and temperature sensors, and an electrochemically modified free chlorine sensor. These
sensors were compact in size (total size ~25 mm × 30 mm), highly sensitive, fast-in-
response, user-friendly, and cost-effective. A high accuracy of ~85% was obtained for the
monitoring of real water samples using the sensing probe with a programmed FPGA board.
This study signifies the practical application of the integrated sensing system as a
simplification of the conventional laboratory-based analytical methods for on-site drinking
water quality monitoring. The developed platform can also be exploited for the monitoring
of other water quality parameters such as conductivity, heavy metal ions, and dissolved
oxygen.

Ph.D. Thesis - Y. Qin McMaster University - Electrical and Computer Engineering
164
Chapter 7
Conclusions and recommendations
7.1. Conclusions
Existing laboratory-based analytical approaches to monitor drinking water quality
parameters are highly accurate and reliable. However, these analytical techniques are time-
consuming, labor-intensive, and costly, which are not suitable for realizing continued
drinking water safety in resource limited and heavily populated areas. Although recent
research activities demonstrated individual microfabricated sensors for affordable and
efficient water quality monitoring, these microfabricated sensors were still expensive and
difficult to be integrated into a functioning system. Therefore, the purpose of this research
was to develop a compact, low-cost, easy-to-use, and accurate pH, temperature, and free
chlorine sensing system for real-time, multi-parameter drinking water quality monitoring.
The research in this thesis focused on the design, fabrication, and characterization of
microfabricated pH, temperature, and free chlorine sensors. An integrated demonstration
system using the three sensors is also presented. For pH sensing, Pd/PdO thin films were
used as the potentiometric sensing electrode due to the material’s high pH sensitivity, short
response time, and high stability. For temperature sensing, a Wheatstone bridge consisting
of two Pd/PdO thermistors with negative TCR, and two Ag thermistors with positive TCR
were employed to increase the sensitivity. The materials used for temperature sensing were
the same as the pH sensing materials, which enabled a simple fabrication for the integrated
sensors. For free chlorine measurement, two types of sensors were developed. One type
was a PEDOT:PSS-based chemoresistor drawn on a paper. The relative resistance change
of the chemoresistor was used to indicate the free chlorine concentration in water. Such a
paper sensor was low-cost, easy-to-use, but not suitable for real-time monitoring. Thus,

Ph.D. Thesis - Y. Qin McMaster University - Electrical and Computer Engineering
165
another amperometric sensor was developed for continuous monitoring. The amperometric
sensor had a simplified three-electrode configuration (using only 2 electrodes). The sensing
was based on the redox reaction between the amine groups on a pencil lead and HOCl in
water, which provided a repeatable and stable output current. The simplified amperometric
sensor was potentiostat-free and calibration-free, which was very promising for an
integrated system. The highly sensitive and efficient measurement was attributed to the
abovementioned sensing materials and sensor configurations.
To improve the cost efficiency of the system, the sensors were fabricated on a common
glass substrate using solution-based processes: inkjet printing and electrochemical
modification. These fabrication techniques consumed a small amount of materials and did
not require cleanroom environment, high-temperature/pressure conditions, or high-vacuum
equipment.
The integrated sensor was connected to a signal conditioning circuit and a programmed
FPGA board for signal processing and display. The integrated and portable water quality
monitoring system was able to accurately measure the pH value, temperature, and free
chlorine concentration in tap water and lake water. Next we present short summaries of
each chapter in this thesis.
In Chapter 1, the background of drinking water quality (pH and free chlorine) monitoring
was introduced, followed by a comprehensive review of microfabricated electrochemical
pH and free chlorine sensors. By comparing different types of sensors and sensing materials,
we choose to use metal/metal oxide-based potentiometric sensor for pH monitoring, and
functionalized carbon materials for free chlorine sensing.
In Chapter 2, we studied the pH sensing mechanism and property of solution-processed
Pd/PdO thin films. XPS, SEM, and AFM studies were used to determine the chemical
composition and surface morphology of deposited Pd/PdO films. High sensitivity can be

Ph.D. Thesis - Y. Qin McMaster University - Electrical and Computer Engineering
166
realized by forming more PdO at the electrode surface and in the bulk. Dense and flat
surface morphology of the electrode can lead to a fast response. The presence of both
metallic Pd and surface nano-voids in the electrodes resulted in a decreased long-term
sensitivity. pH sensing electrodes prepared by annealing Pd precursor solution at 200 °C
for 48 h exhibited a linear super-Nernstian pH sensitivity of 64.71 ± 0.56 mV/pH in the pH
range of 2 to 12 with a short response time less than 18 s, small hysteresis less than 7.81
mV, and high reproducibility with a SD of 0.56 mV/pH of sensitivity. The super-Nernstian
behavior may be related to the hydrous PdOx (x > 1) produced from the solution-based
process at low temperatures.
In Chapter 3, we developed a drop-on-demand inkjet printing process for a highly loaded
Pd ink to deposit Pd/PdO thin films. The viscosity and surface tension of as-received Pd
precursor solution were adjusted by toluene to form a printable ink. The printed ink was
converted to continuous, homogenous, low-resistivity Pd films using a 2-step thermolysis.
The printed Pd films exhibited good adhesion to air-plasma-treated PI substrates. After
thermal oxidation at 200 °C, the film surface was PdO-rich and it served as a pH sensing
layer. The underlying layer in the film was Pd-rich, and was the conductive path for
electrons. The optimal sensitivity and response time were obtained with an electrode size
of 10 mm2 and a thickness of 100 nm. This pH sensing electrode was then integrated with
a solid-state reference electrode to form a potentiometric sensor. The integrated sensors on
glass and PI showed a fast and repeatable pH response with a sensitivity of 60.6 ± 0.1
mV/pH and 57 ± 0.6 mV/pH, respectively. Also, accurate pH values of real water samples
were obtained with the printed sensors.
In Chapter 4, the thermolysis process of the inkjet-printed Pd ink was investigated. The
morphology of the Pd/PdO films could be tuned by using different thermolysis atmospheres.
The precursor was reductively decomposed into amine-stabilized Pd clusters at 200 °C.
The O2 in air facilitated the decomposition of the ligands for the Pd clusters and clean Pd
NPs were formed. The fusion of the small NPs resulted in a smooth and dense film. In N2,
Ph.D. Thesis - Y. Qin McMaster University - Electrical and Computer Engineering
167
the generated NPs were larger and were embedded with organic species. Such NPs form
sub-micron spherical aggregates. In low vacuum, a bilayer morphology was formed due to
the competition between the film formation processes in air and in N2. The smooth film
had a low resistivity since the electrical conduction was throughout the film. For the bilayer
film, only the bottom layer participated in the conduction and a higher resistivity was
observed. The TCR value of the films can be tuned from 0.067% /°C to -0.189% /°C due
to the different amounts of PdO in the conduction paths. When the Pd/PdO films were
studied in humid air, the adsorbed -OH groups raise the inter-grain barrier for the charge
carrier transport and caused a positive resistance drift. This chapter showed that the inkjet-
printed Pd/PdO films can be used for temperature sensing.
In Chapter 5, we developed a simple, cost-efficient, instrument-free, hand-drawing process
to fabricate free chlorine sensors on paper substrates at room temperature. The sensing
mechanism was based on the oxidation of PEDOT:PSS chemoresistor by free chlorine
solutions. The final oxidation product had a higher electrical resistivity than PEDOT:PSS
so that the relative resistance change of a chemoresistor could be used to express the sensor
response. The sensor had a high mechanical stability, reusability, and wide sensing range.
Also, the sensor was easy-to-use so that untrained personnel could accurately measure free
chlorine concentrations in real water samples.
In Chapter 6, we developed an integrated sensing system for the simultaneous monitoring
of drinking water quality parameters including pH, free chlorine concentration, and
temperature. The system consisted of an integrated sensing probe with inkjet-printed pH
and temperature sensors, and an electrochemically modified free chlorine sensor. These
sensors were compact in sizes, highly sensitive, fast-in-response, user-friendly, and cost-
effective. A high accuracy was obtained for the monitoring of real water samples using the
sensing probe with a programmed FPGA board. This study signifies the practical
application of the integrated sensing system as a simplification of the conventional
laboratory-based analytical methods for on-site drinking water quality monitoring.

Ph.D. Thesis - Y. Qin McMaster University - Electrical and Computer Engineering
168
7.2. Recommendations
This research work resulted in several advances towards the development of an integrated,
easy-to-use, accurate, and low-cost sensing system for drinking water quality monitoring.
However, there are some features of the sensors and integrated sensing systems that need
to be improved:
The main difficulty in using the pH sensor is the requirement of the calibration step.
Calibration is needed due to the variation in the sensor sensitivity, and/or the drift of
the sensor output voltage. Thus, the stability of the Pd/PdO sensing electrode needs to
be improved for a calibration-free sensor.
In Chapter 2, we observed that the Pd/PdO pH sensing electrode had a super-
Nernstian sensitivity due to the presence of PdOx (x > 1) in the film. Due to the
slow decomposition of PdO2, the super-Nernstian sensitivity gradually decreased
to a near-Nernstian sensitivity. Thus, a stable near-Nernstian sensitivity may be
realized by converting PdOx (x > 1) to PdO, by thermal treatment, high-vacuum
treatment, or preconditioning in an aqueous environment such as in DI water.
In Chapter 3, we found that the sensitivity of the pH sensing electrode was affected
by the electrode’s surface area. A small surface area (<10 mm2) resulted in a sub-
Nernstian sensitivity. When the sensing electrode was used in water for over 7
days, mechanical delamination of the Pd/PdO film on the glass substrate was
observed. The delamination reduced the electrode’s area, resulting in a lower
sensitivity. Therefore, the mechanical adhesion between the Pd/PdO film and glass
can be improved, for example, by applying a PI layer between them.
The drift and hysteresis of the pH sensor was due to the buried sites in the Pd/PdO
film. These buried sites may be physical defects such as sub-surface grain
boundaries, and/or chemical defects such as residual amines in the film. The buried
sites had a slow reaction (adsorption/desorption of H3O+) rate than the surface
active sites that caused the delayed sensor response or the so-called “memory

Ph.D. Thesis - Y. Qin McMaster University - Electrical and Computer Engineering
169
effect”. To eliminate the buried sites and improve the film quality, high
temperature (>600 °C), high pressure, and/or vacuum-based post processing steps
may be used. These post-processing steps use external energies to remove
chemical contaminants, reconstruct the crystal structures, and reduce the amount
of defects in the film.
To make the sensor and sensing system easier to use, we can prepare a cap for the
storage of the sensor (Figure 7-1). The cap will contain a gel saturated with the pH
= 7 buffer solution, and the pH sensor surface will be in contact with the gel during
storage. Before using the sensor, we can calibrate the sensor with the cap on
(similar to putting the sensor into a pH = 7 buffer solution), and the calibration
voltage is recorded. Then we can remove the cap and use the sensor with the
calibration voltage already stored in the memory of the electronic system.
Figure 7-1. Proposed future water quality monitoring system.
The stability of the pH sensor was also determined by the Ag/AgCl/KCl reference
electrode, mainly by its drift. Therefore, the stability of the reference electrode needs
to be improved. The potential drift of the reference electrode was caused by the
leaching of KCl in the solid electrolyte layer when the electrode was immersed in water.
Theoretically, a stable reference electrode potential is generated by a constant and very
slow leaching of KCl. However, the practical realization of this KCl leaching condition
is very challenging. Hence, alternative structures/materials of the reference electrode
Sensor probe
Storage cap
Gel with calibration solution

Ph.D. Thesis - Y. Qin McMaster University - Electrical and Computer Engineering
170
should be employed. One promising configuration for future microscale solid-state
reference electrodes consists of a nano-textured hydrophobic polymer matrix (e.g.
PVC) with embedded ionic liquid (e.g. [C8min+][C1C1N-]) and redox couples (e.g. Co2+
and Co3+) on a conductive electrode. Such a reference electrode utilizes the
environment-independent redox reaction (e.g. between Co2+ and Co3+) to provide a
constant electrode potential. The huge double layer capacitance provided by the nano-
textured hydrophobic polymer ensures a small potential variation with time. The ionic
liquid is responsible for the efficient ion-to-electron transferring.
The size of the pH sensor can be reduced by creating 3-dimensional nano structures at
the electrode surface. As long as the effective sensing area is >10 mm2, a near-
Nernstian response can be obtained. Three-dimensional nano structures provide
surface areas in the vertical direction so the horizontal area of the electrode can be
shrunk. The miniaturized pH sensor can be applied for measurements requiring high
spatial resolution such as in implantable applications.
If high temperature, high pressure, and/or vacuum processing is not preferred to
improve the film quality, the pH sensor should be operated in a smart way to improve
its stability. For example, the concept of differential sensing can be deployed. One
sensor is kept in a standard solution, and the other identical sensor is used to monitor
the water quality parameters. If the drift behaviors of the two sensors are the same, the
output voltage difference of the two sensors should be a drift-free signal.
The size of the temperature sensor needs to be reduced. In Chapter 6, the temperature
had a size of ~10 mm × 20 mm, which was limited by the size of the thermistors with
large resistance values. The resistance of the thermistor, hence the sensor size, can be
reduced by using a lower bias voltage, and/or by printing thinner Pd/PdO and Ag films.
Ph.D. Thesis - Y. Qin McMaster University - Electrical and Computer Engineering
171
The fabrication of the free chlorine sensor based on amine modification of pencil leads
needs to be improved. To make the integrated sensor more compact, the free chlorine
sensor should be a planar configuration. One possible approach is to inkjet print amine-
modified carbon-based materials (e.g. CNTs, graphene/graphene oxide, and carbon
dots) on to the substrate. One expected challenge of this approach is the poor adhesion
of the carbon materials on glass. Proper surface treatment and/or functionalization of
the carbon materials has to be conducted to address this adhesion issue.
The sensing range of the amine-modified free chlorine sensor needs to be increased.
Although the free chlorine sensor was able to monitor low free chlorine concentrations
(0-8 ppm) accurately, the sensing range was too narrow for the monitoring of food
processing water (50-200 ppm). To obtain a wide sensing range, the amount of amine
groups attached to the pencil lead should be increased.
The developed Pd inkjet printing technology can be used as a low-cost fabrication
approach for other applications. For example, Pd-based hydrogen gas sensor and
ammonia sensor can be developed because Pd has a high affinity for these gases. Pd-
based resistive stress/strain sensor can be fabricated for wearable applications. Inkjet-
printed Pd can also be used as electrical interconnects for carbon nanomaterials due to
the high work function of Pd.
For the electronics part of the integrated drinking water quality monitoring system, a
PCB board including conditioning circuits, data acquisition component, signal
processing module, and result display unit needs to be developed in the future. Such a
PCB board will replace the separated conditioning circuit and FPGA board for a lower
cost and a smaller size.
The monitoring of the amount of Escherichia coli in drinking water is also important
for water safety. Other students in our group developed infrared sensors for the

Ph.D. Thesis - Y. Qin McMaster University - Electrical and Computer Engineering
172
identification of different types of bacteria [314], and a micro-flow cytometer for
counting the amount of Escherichia coli in water [315]. In addition, a micro-Raman
spectroscopy was developed for the monitoring of more types of chemical and
biological species in water [316]–[318]. Regarding the electrochemical sensing of
Escherichia coli, an Escherichia coli-sensitive electrode/device (e.g. FET-based
biosensor) [93], [238] can be integrated into the platform developed in this study. Its
output voltage/current can be readout using the same system developed in Chapter 6.
The work presented in this thesis was a pilot research and development project, targeting
an integrated, easy-to-use, accurate, and low-cost sensing system for drinking water quality
monitoring. It is demonstrated that solution-based processing could be a viable candidate
to fabricate and integrate multiple types of micro-scale sensors with high performance
features. This research demonstrated the feasibility, challenges, and potential solutions for
developing drinking water quality monitoring systems for real-world applications.

Ph.D. Thesis - Y. Qin McMaster University - Electrical and Computer Engineering
173
References
[1] USEPA, “WaterSentinel online water quality monitoring as an indicator of drinking water
contamination, EPA 817-D-05-002,” Washington, D.C., U.S. Environmental Protection Agency,
Water Security Division, 2005.
[2] W. F. Boron and E. L. Boulpaep, Medical physiology: A cellular and molecular approach.
Philadelphia, PA, USA: Saunders/Elsevier, 2003.
[3] WHO, “Guidelines for drinking-water quality, 2nd edition, Volume 2, Health criteria and other
supporting information,” Geneva, Switzerland, 1996.
[4] Health Canada, “Guidelines for Canadian drinking water quality: Chlorine,” Authority of the
Minister of Health, Ottawa, Canada, 2009.
[5] USEPA, “Nitrification,” Office of Water, Washington, D.C., USA, 2002.
[6] L. M. Prescott, J. P. Harley, and D. A. Klein, Microbiology (5th edition). New York, NY, USA:
McGraw-Hill Companies, Inc., 2002.
[7] WHO Working Group, “Health impact of acidic deposition,” Sci. Total Environ., vol. 52, no. 3, pp.
157–187, Jul. 1986.
[8] E. I. Gill, A. Arshak, K. Arshak, and O. Korostynska, “Investigation of thick-film polyaniline-based
conductimetric pH sensors for medical applications,” IEEE Sens. J., vol. 9, no. 5, pp. 555–562, May
2009.
[9] R. Sadiq, S. Imran, and V. Kleiner, “Examining the impact of water quality on the integrity of
distribution infrastructure,” in American Water Works Association Research Foundation, 2007.
[10] P. Payment, M. Waite, and A. Durfour, “Assessing microbial safety of drinking water improving
approaches and methods: Improving approaches and methods,” OECD Publishing, Organisation for
Economic Cooperation and Development and World Health Organization, 2003.
[11] M. H. Banna, S. Imran, A. Francisque, H. Najjaran, R. Sadiq, M. Rodriguez, and M. Hoorfar,
“Online drinking water quality monitoring: Review on available and emerging technologies,” Crit.
Rev. Environ. Sci. Technol., vol. 44, no. 12, pp. 1370–1421, Jun. 2014.
[12] G. Connell, Water disinfection series: The chlorination/chloramination handbook. Denver, CO,
USA: American Water Works Association, 1996.
[13] WHO, “Guidelines for drinking-water quality, 3rd edition,” Geneva, Switzerland, 2008.
[14] USEPA, “National primary drinking water regulations,” Washington, D.C., USA, 2009.
[15] USEPA, “Edition of the drinking water standards and health advisories,” Office of Water,
Washington, D.C., USA, 2012.
[16] K. Senthilkumar and J.-M. Zen, “Free chlorine detection based on EC’ mechanism at an
electroactive polymelamine-modified electrode,” Electrochem. commun., vol. 46, pp. 87–90, Sep.
2014.
[17] Y. Qin, S. Pan, M. M. R. Howlader, R. Ghosh, N.-X. Hu, and M. J. Deen, “Paper-based, hand-
drawn free chlorine sensor with poly(3,4-ethylenedioxythiophene):poly(styrenesulfonate),” Anal.
Chem., vol. 88, no. 21, pp. 10384–10389, Nov. 2016.
[18] J. P. Guyer, Engineering SoundBite: Water treatment. Guyer Partners, 2010.
[19] “Chlorine measurement by amperometric sensor, Application Data Sheet, ADS 43-6063/rev.B,”
Emerson Process Management, 2009.
[20] D. S. Tarbell and A. T. Tarbell, “The development of the pH meter,” J. Chem. Educ., vol. 57, no. 2,
p. 133, Feb. 1980.

Ph.D. Thesis - Y. Qin McMaster University - Electrical and Computer Engineering
174
[21] F. Haber and Z. Klemensiewicz, “Über elektrische phasengrenzkräfte,” Z. phys. Chem, vol. 67, pp.
385–431, 1909.
[22] P. Kurzweil, “Metal oxides and ion-exchanging surfaces as pH sensors in liquids: State-of-the-art
and outlook,” Sensors, vol. 9, no. 6, pp. 4955–4985, Jun. 2009.
[23] R. P. Buck, S. Rondinini, A. K. Covington, F. G. K. Baucke, C. M. A. Brett, M. F. Camoes, M. J.
T. Milton, T. Mussini, R. Naumann, K. W. Pratt, P. Spitzer, and G. S. Wilson, “Measurement of
pH. Definition, standards, and procedures (IUPAC Recommendations 2002),” Pure Appl. Chem.,
vol. 74, no. 11, Jan. 2002.
[24] J. C. Morris, “Health perspective in the oxidative treatment of water for potable supply. Part 2.
Health assessment of current oxidant-disinfectants,” National Institute for Water Supply,
Leidschendam, the Netherlands, 1982.
[25] J. C. Morris, “The acid ionization constant of HOCl from 5 to 35°,” J. Phys. Chem., vol. 70, no. 12,
pp. 3798–3805, Dec. 1966.
[26] G. Gordon, D. L. Sweetin, K. Smith, and G. E. Pacey, “Improvements in the N,N-diethyl-p-
phenylenediamine method for the determination of free and combined residual chlorine through the
use of FIA,” Talanta, vol. 38, no. 2, pp. 145–149, Feb. 1991.
[27] J. D. Johnson and R. Overby, “Stabilized neutral o-tolidine, SNORT, colorimetric method for
chlorine,” Anal. Chem., vol. 41, no. 13, pp. 1744–1750, Nov. 1969.
[28] M. Zenki, H. Komatsubara, and K. Tôei, “Determination of residual chlorine in tap water by flow-
injection spectrophotometry,” Anal. Chim. Acta, vol. 208, pp. 317–320, 1988.
[29] K. K. Verma, A. Jain, and A. Townshend, “Determination of free and combined residual chlorine
by flow-injection spectrophotometry,” Anal. Chim. Acta, vol. 261, no. 1–2, pp. 233–240, May 1992.
[30] S. G. Dmitrienko, O. A. Sviridova, L. N. Pyatkova, V. A. Zhukova, and Y. A. Zolotov, “Rapid
determination of free active chlorine in water by diffuse reflectance spectroscopy after reaction with
polyurethane foams,” Anal. Chim. Acta, vol. 405, no. 1–2, pp. 231–237, Jan. 2000.
[31] G. C. White, Handbook of chlorination. New York, NY, USA: Van Nostrand Reinhold Company,
1986.
[32] J. Ellis and P. L. Brown, “Determination of residual chlorine by derivatisation with 2,6-
dimethylphenol and gas chromatographic separation,” Anal. Chim. Acta, vol. 124, no. 2, pp. 431–
436, Mar. 1981.
[33] T. Nakagama, M. Yamada, and T. Hobo, “Chemiluminescence sensor with uranine immobilized on
an anion-exchange resin for monitoring free chlorine in tap water,” Anal. Chim. Acta, vol. 231, pp.
7–12, 1990.
[34] F. Kodera, M. Umeda, and A. Yamada, “Determination of free chlorine based on anodic
voltammetry using platinum, gold, and glassy carbon electrodes,” Anal. Chim. Acta, vol. 537, no.
1–2, pp. 293–298, Apr. 2005.
[35] F. J. Del Campo, O. Ordeig, and F. J. Muñoz, “Improved free chlorine amperometric sensor chip
for drinking water applications,” Anal. Chim. Acta, vol. 554, no. 1–2, pp. 98–104, Dec. 2005.
[36] V. B. Malkov, B. Zachman, and T. Scribner, “Comparison of online chlorine analysis methods and
instrumentation built on amperometric and colorimetric technologies,” in Water Quality Technology
Conference and Exposition, 2009.
[37] Y. Moser and M. A. M. Gijs, “Miniaturized flexible temperature sensor,” J.
Microelectromechanical Syst., vol. 16, no. 6, pp. 1349–1354, Dec. 2007.
[38] J. P. Bentley, “Temperature sensor characteristics and measurement system design,” J. Phys. E.,
vol. 17, no. 6, pp. 430–439, Jun. 1984.
[39] A. W. Van Herwaarden and P. M. Sarro, “Thermal sensors based on the seebeck effect,” Sensor.
Actuat., vol. 10, no. 3–4, pp. 321–346, Nov. 1986.
[40] W. F. Roeser and S. T. Lonberger, Methods of testing thermocouples and thermocouple materials.
US Department of Commerce, National Bureau of Standards, 1958.

Ph.D. Thesis - Y. Qin McMaster University - Electrical and Computer Engineering
175
[41] M. Kimura and K. Toshima, “Thermistor-like pn junction temperature-sensor with variable
sensitivity and its combination with a micro-air-bridge heater,” Sensors Actuators A Phys., vol. 108,
no. 1–3, pp. 239–243, Nov. 2003.
[42] M. Badihi-Mossberg, V. Buchner, and J. Rishpon, “Electrochemical biosensors for pollutants in the
environment,” Electroanalysis, vol. 19, no. 19–20, pp. 2015–2028, Oct. 2007.
[43] G. Hanrahan, D. G. Patil, and J. Wang, “Electrochemical sensors for environmental monitoring:
Design, development and applications,” J. Environ. Monit., vol. 6, no. 8, pp. 657–664, 2004.
[44] N. Jaffrezic-Renault and S. V. Dzyadevych, “Conductometric microbiosensors for environmental
monitoring,” Sensors, vol. 8, no. 4, pp. 2569–2588, Apr. 2008.
[45] M. Yuqing, C. Jianrong, and F. Keming, “New technology for the detection of pH,” J. Biochem.
Biophys. Methods, vol. 63, no. 1, pp. 1–9, Apr. 2005.
[46] Y. Qin, M. M. R. Howlader, and M. Deen, “Low-temperature bonding for silicon-based micro-
optical systems,” Photonics, vol. 2, no. 4, pp. 1164–1201, Dec. 2015.
[47] M. M. R. Howlader, M. J. Deen, and T. Suga, “Nanobonding: A key technology for emerging
applications in health and environmental sciences,” Jpn. J. Appl. Phys., vol. 54, no. 3, p. 30201,
Mar. 2015.
[48] M. M. R. Howlader, P. R. Selvaganapathy, M. J. Deen, and T. Suga, “Nanobonding technology
toward electronic, fluidic, and photonic systems integration,” IEEE J. Sel. Top. Quantum Electron.,
vol. 17, no. 3, pp. 689–703, May 2011.
[49] M. H. Banna, H. Najjaran, R. Sadiq, S. A. Imran, M. J. Rodriguez, and M. Hoorfar, “Miniaturized
water quality monitoring pH and conductivity sensors,” Sensor. Actuat. B Chem., vol. 193, pp. 434–
441, Mar. 2014.
[50] G. Gerlach, M. Guenther, J. Sorber, G. Suchaneck, K.-F. Arndt, and A. Richter, “Chemical and pH
sensors based on the swelling behavior of hydrogels,” Sensor. Actuat. B Chem., vol. 111–112, pp.
555–561, Nov. 2005.
[51] Q. Thong Trinh, G. Gerlach, J. Sorber, and K.-F. Arndt, “Hydrogel-based piezoresistive pH
sensors: Design, simulation and output characteristics,” Sensor. Actuat. B Chem., vol. 117, no. 1,
pp. 17–26, Sep. 2006.
[52] Y. Zhang, H. Ji, D. Snow, R. Sterling, and G. M. Brown, “A pH sensor based on a microcantilever
coated with intelligent hydrogel,” Instrum. Sci. Technol., vol. 32, no. 4, pp. 361–369, Dec. 2004.
[53] Z. Cheng, M. J. Deen, and H. Peng, “A low-power gateable vernier ring oscillator time-to-digital
converter for biomedical imaging applications,” IEEE Trans. Biomed. Circuits Syst., vol. 10, no. 2,
pp. 445–454, Apr. 2016.
[54] M. J. Deen and F. Pascal, “Electrical characterization of semiconductor materials and devices—
review,” J. Mater. Sci. Mater. Electron., vol. 17, no. 8, pp. 549–575, Aug. 2006.
[55] M. Jamal Deen, B. Iñiguez, O. Marinov, and F. Lime, “Electrical studies of semiconductor–
dielectric interfaces,” J. Mater. Sci. Mater. Electron., vol. 17, no. 9, pp. 663–683, Sep. 2006.
[56] M. J. Deen and P. K. Basu, Silicon photonics: Fundamentals and devices. Chichester, UK: John
Wiley & Sons, 2012.
[57] D. Wencel, T. Abel, and C. McDonagh, “Optical chemical pH sensors,” Anal. Chem., vol. 86, no. 1,
pp. 15–29, Jan. 2014.
[58] P. Gou, N. D. Kraut, I. M. Feigel, H. Bai, G. J. Morgan, Y. Chen, Y. Tang, K. Bocan, J. Stachel, L.
Berger, M. Mickle, E. Sejdić, and A. Star, “Carbon nanotube chemiresistor for wireless pH
sensing,” Sci. Rep., vol. 4, p. 4468, Mar. 2014.
[59] P. Bergveld, “Thirty years of ISFETOLOGY,” Sensor. Actuat. B Chem., vol. 88, no. 1, pp. 1–20,
Jan. 2003.
[60] A. Fog and R. P. Buck, “Electronic semiconducting oxides as pH sensors,” Sensor. Actuat., vol. 5,
no. 2, pp. 137–146, Feb. 1984.

Ph.D. Thesis - Y. Qin McMaster University - Electrical and Computer Engineering
176
[61] D. K. Kampouris, R. O. Kadara, N. Jenkinson, and C. E. Banks, “Screen printed electrochemical
platforms for pH sensing,” Anal. Methods, vol. 1, no. 1, pp. 25–28, 2009.
[62] P. Gupta, S. K. Yadav, B. Agrawal, and R. N. Goyal, “A novel graphene and conductive polymer
modified pyrolytic graphite sensor for determination of propranolol in biological fluids,” Sensor.
Actuat. B Chem., vol. 204, pp. 791–798, Dec. 2014.
[63] N. Mzoughi, A. Abdellah, Q. Gong, H. Grothe, P. Lugli, B. Wolf, and G. Scarpa, “Characterization
of novel impedimetric pH-sensors based on solution-processable biocompatible thin-film
semiconducting organic coatings,” Sensor. Actuat. B Chem., vol. 171–172, pp. 537–543, Aug. 2012.
[64] L.-M. Kuo, K.-N. Chen, Y.-L. Chuang, and S. Chao, “A flexible pH-sensing structure using
WO3/IrO2 junction with Al2O3 encapsulation layer,” ECS Solid State Lett., vol. 2, no. 3, pp. P28–
P30, Dec. 2012.
[65] S. Safari, P. R. Selvaganapathy, A. Derardja, and M. J. Deen, “Electrochemical growth of high-
aspect ratio nanostructured silver chloride on silver and its application to miniaturized reference
electrodes,” Nanotechnology, vol. 22, no. 31, p. 315601, Aug. 2011.
[66] S. Safari, P. R. Selvaganapathy, and M. J. Deen, “Microfluidic reference electrode with free-
diffusion liquid junction,” J. Electrochem. Soc., vol. 160, no. 10, pp. B177–B183, Jul. 2013.
[67] M. A. Rahman, P. Kumar, D.-S. Park, and Y.-B. Shim, “Electrochemical sensors based on organic
conjugated polymers,” Sensors, vol. 8, no. 1, pp. 118–141, Jan. 2008.
[68] W.-D. Huang, H. Cao, S. Deb, M. Chiao, and J. C. Chiao, “A flexible pH sensor based on the
iridium oxide sensing film,” Sensors Actuators A Phys., vol. 169, no. 1, pp. 1–11, Sep. 2011.
[69] S. Yao, M. Wang, and M. Madou, “A pH electrode based on melt-oxidized iridium oxide,” J.
Electrochem. Soc., vol. 148, no. 4, pp. H29–H36, 2001.
[70] T. Y. Kim and S. Yang, “Fabrication method and characterization of electrodeposited and heat-
treated iridium oxide films for pH sensing,” Sensor. Actuat. B Chem., vol. 196, pp. 31–38, Jun.
2014.
[71] H.-J. Chung, M. S. Sulkin, J.-S. Kim, C. Goudeseune, H.-Y. Chao, J. W. Song, S. Y. Yang, Y.-Y.
Hsu, R. Ghaffari, I. R. Efimov, and J. A. Rogers, “Stretchable, multiplexed pH sensors with
demonstrations on rabbit and human hearts undergoing ischemia,” Adv. Healthc. Mater., vol. 3, no.
1, pp. 59–68, Jan. 2014.
[72] C. M. Nguyen, S. Rao, Y.-S. Seo, K. Schadt, Y. Hao, and J.-C. Chiao, “Micro pH sensors based on
iridium oxide nanotubes,” IEEE Trans. Nanotechnol., vol. 13, no. 5, pp. 945–953, Sep. 2014.
[73] L.-M. Kuo, Y.-C. Chou, K.-N. Chen, C.-C. Lu, and S. Chao, “A precise pH microsensor using RF-
sputtering IrO2 and Ta2O5 films on Pt-electrode,” Sensor. Actuat. B Chem., vol. 193, pp. 687–691,
Mar. 2014.
[74] J. Park, M. Kim, and S. Kim, “Surface renewable nano-iridium oxide polymeric composite pH
electrodes,” Sensor. Actuat. B Chem., vol. 204, pp. 197–202, Dec. 2014.
[75] S. Zaman, M. H. Asif, A. Zainelabdin, G. Amin, O. Nur, and M. Willander, “CuO nanoflowers as
an electrochemical pH sensor and the effect of pH on the growth,” J. Electroanal. Chem., vol. 662,
no. 2, pp. 421–425, Nov. 2011.
[76] M. Hussain, Z. H. Ibupoto, M. A. Abbasi, O. Nur, and M. Willander, “Effect of anions on the
morphology of Co3O4 nanostructures grown by hydrothermal method and their pH sensing
application,” J. Electroanal. Chem., vol. 717–718, pp. 78–82, Mar. 2014.
[77] L. Santos, J. P. Neto, A. Crespo, D. Nunes, N. Costa, I. M. Fonseca, P. Barquinha, L. Pereira, J.
Silva, R. Martins, and E. Fortunato, “WO3 nanoparticle-based conformable pH sensor,” ACS Appl.
Mater. Interfaces, vol. 6, no. 15, pp. 12226–12234, Aug. 2014.
[78] A. Sardarinejad, D. K. Maurya, and K. Alameh, “The effects of sensing electrode thickness on
ruthenium oxide thin-film pH sensor,” Sensors Actuators A Phys., vol. 214, pp. 15–19, Aug. 2014.
[79] H. Arida, “Novel pH microsensor based on a thin film gold electrode modified with lead dioxide
nanoparticles,” Microchim. Acta, vol. 182, no. 1–2, pp. 149–156, Jan. 2015.
Ph.D. Thesis - Y. Qin McMaster University - Electrical and Computer Engineering
177
[80] Y. Qin, A. U. Alam, S. Pan, M. M. R. Howlader, R. Ghosh, P. R. Selvaganapathy, Y. Wu, and M. J.
Deen, “Low-temperature solution processing of palladium/palladium oxide films and their pH
sensing performance,” Talanta, vol. 146, pp. 517–524, 2016.
[81] Y. Qin, A. U. Alam, M. M. R. Howlader, N.-X. Hu, and M. J. Deen, “Inkjet printing of a highly
loaded palladium ink for integrated, low-cost pH sensors,” Adv. Funct. Mater., vol. 26, no. 27, pp.
4923–4933, Jul. 2016.
[82] U. Lange, N. V. Roznyatovskaya, and V. M. Mirsky, “Conducting polymers in chemical sensors
and arrays,” Anal. Chim. Acta, vol. 614, no. 1, pp. 1–26, Apr. 2008.
[83] B. Lakard, O. Segut, S. Lakard, G. Herlem, and T. Gharbi, “Potentiometric miniaturized pH sensors
based on polypyrrole films,” Sensor. Actuat. B Chem., vol. 122, no. 1, pp. 101–108, Mar. 2007.
[84] T. Lindfors and A. Ivaska, “pH sensitivity of polyaniline and its substituted derivatives,” J.
Electroanal. Chem., vol. 531, no. 1, pp. 43–52, Aug. 2002.
[85] B. Lakard, G. Herlem, S. Lakard, R. Guyetant, and B. Fahys, “Potentiometric pH sensors based on
electrodeposited polymers,” Polymer (Guildf)., vol. 46, no. 26, pp. 12233–12239, Dec. 2005.
[86] T. Guinovart, G. Valdés-Ramírez, J. R. Windmiller, F. J. Andrade, and J. Wang, “Bandage-based
wearable potentiometric sensor for monitoring wound pH,” Electroanalysis, vol. 26, no. 6, pp.
1345–1353, Jun. 2014.
[87] A. J. Bandodkar, V. W. S. Hung, W. Jia, G. Valdés-Ramírez, J. R. Windmiller, A. G. Martinez, J.
Ramírez, G. Chan, K. Kerman, and J. Wang, “Tattoo-based potentiometric ion-selective sensors for
epidermal pH monitoring,” Analyst, vol. 138, no. 1, pp. 123–128, 2013.
[88] W. Prissanaroon-Ouajai, P. J. Pigram, R. Jones, and A. Sirivat, “A novel pH sensor based on
hydroquinone monosulfonate-doped conducting polypyrrole,” Sensor. Actuat. B Chem., vol. 135,
no. 1, pp. 366–374, Dec. 2008.
[89] T. Trantidou, D. J. Payne, V. Tsiligkiridis, Y.-C. Chang, C. Toumazou, and T. Prodromakis, “The
dual role of Parylene C in chemical sensing: Acting as an encapsulant and as a sensing membrane
for pH monitoring applications,” Sensor. Actuat. B Chem., vol. 186, pp. 1–8, Sep. 2013.
[90] C. A. Li, K. N. Han, X.-H. Pham, and G. H. Seong, “A single-walled carbon nanotube thin film-
based pH-sensing microfluidic chip,” Analyst, vol. 139, no. 8, pp. 2011–2015, 2014.
[91] Y. Qin, H.-J. Kwon, A. Subrahmanyam, M. M. R. Howlader, P. R. Selvaganapathy, A. Adronov,
and M. J. Deen, “Inkjet-printed bifunctional carbon nanotubes for pH sensing,” Mater. Lett., vol.
176, pp. 68–70, Apr. 2016.
[92] C. Bartic and G. Borghs, “Organic thin-film transistors as transducers for (bio) analytical
applications,” Anal. Bioanal. Chem., vol. 384, no. 2, pp. 354–365, Dec. 2005.
[93] M. W. Shinwari and M. J. Deen, “Impedance modelling of FET-based biosensors,” J. Electrochem.
Soc., vol. 158, no. 6, pp. J189–J194, 2011.
[94] M. Waleed Shinwari, M. Jamal Deen, and D. Landheer, “Study of the electrolyte-insulator-
semiconductor field-effect transistor (EISFET) with applications in biosensor design,”
Microelectron. Reliab., vol. 47, no. 12, pp. 2025–2057, Dec. 2007.
[95] P. D. Batista and M. Mulato, “ZnO extended-gate field-effect transistors as pH sensors,” Appl.
Phys. Lett., vol. 87, no. 14, p. 143508, 2005.
[96] J.-C. Chou and L. P. Liao, “Study on pH at the point of zero charge of TiO2 pH ion-sensitive field
effect transistor made by the sputtering method,” Thin Solid Films, vol. 476, no. 1, pp. 157–161,
Apr. 2005.
[97] J. C. Chou and L. P. Liao, “Study of TiO2 thin films for ion sensitive field effect transistor
application with RF sputtering deposition,” Jpn. J. Appl. Phys., vol. 43, no. 1, pp. 61–65, Jan. 2004.
[98] P.-K. Shin, “The pH-sensing and light-induced drift properties of titanium dioxide thin films
deposited by MOCVD,” Appl. Surf. Sci., vol. 214, no. 1–4, pp. 214–221, May 2003.
[99] T. Mikolajick, R. Kühnhold, and H. Ryssel, “The pH-sensing properties of tantalum pentoxide films
fabricated by metal organic low pressure chemical vapor deposition,” Sensor. Actuat. B Chem., vol.
44, no. 1–3, pp. 262–267, Oct. 1997.

Ph.D. Thesis - Y. Qin McMaster University - Electrical and Computer Engineering
178
[100] M. Chen, Y. Jin, X. Qu, Q. Jin, and J. Zhao, “Electrochemical impedance spectroscopy study of
Ta2O5 based EIOS pH sensors in acid environment,” Sensor. Actuat. B Chem., vol. 192, pp. 399–
405, Mar. 2014.
[101] C. Haur Kao, H. Chen, M. Ling Lee, C. Chun Liu, H.-Y. Ueng, Y. Cheng Chu, Y. Jie Chen, and K.
Ming Chang, “Multianalyte biosensor based on pH-sensitive ZnO electrolyte–insulator–
semiconductor structures,” J. Appl. Phys., vol. 115, no. 18, p. 184701, May 2014.
[102] C.-S. Lai, T.-F. Lu, C.-M. Yang, Y.-C. Lin, D. G. Pijanowska, and B. Jaroszewicz, “Body effect
minimization using single layer structure for pH-ISFET applications,” Sensor. Actuat. B Chem., vol.
143, no. 2, pp. 494–499, Jan. 2010.
[103] C.-M. Yang, C.-Y. Wang, and C.-S. Lai, “Characterization on pH sensing performance and
structural properties of gadolinium oxide post-treated by nitrogen rapid thermal annealing,” J. Vac.
Sci. Technol. B Microelectron. Nanom. Struct., vol. 32, no. 3, p. 03D113, May 2014.
[104] T.-M. Pan, P.-Y. Liao, K.-Y. Chang, and L. Chi, “Structural and sensing characteristics of
Gd2Ti2O7, Er2TiO5 and Lu2Ti2O7 sensing membrane electrolyte–insulator–semiconductor for
bio-sensing applications,” Electrochim. Acta, vol. 89, pp. 798–806, Feb. 2013.
[105] K. Niigata, K. Narano, Y. Maeda, and J.-P. Ao, “Temperature dependence of sensing characteristics
of a pH sensor fabricated on AlGaN/GaN heterostructure,” Jpn. J. Appl. Phys., vol. 53, no. 11S, p.
11RD01, Nov. 2014.
[106] S. Upadhyay, R. Frederiksen, N. Lloret, L. De Vico, P. Krogstrup, J. H. Jensen, K. L. Martinez, and
J. Nygård, “Indium arsenide nanowire field-effect transistors for pH and biological sensing,” Appl.
Phys. Lett., vol. 104, no. 20, p. 203504, May 2014.
[107] K. Kim, T. Rim, C. Park, D. Kim, M. Meyyappan, and J.-S. Lee, “Suspended honeycomb nanowire
ISFETs for improved stiction-free performance,” Nanotechnology, vol. 25, no. 34, p. 345501, Aug.
2014.
[108] T.-E. Bae, H. Kim, J. Jung, and W.-J. Cho, “Fabrication of high-performance graphene field-effect
transistor with solution-processed Al2O3 sensing membrane,” Appl. Phys. Lett., vol. 104, no. 15, p.
153506, Apr. 2014.
[109] I. Fakih, S. Sabri, F. Mahvash, M. Nannini, M. Siaj, and T. Szkopek, “Large area graphene ion
sensitive field effect transistors with tantalum pentoxide sensing layers for pH measurement at the
Nernstian limit,” Appl. Phys. Lett., vol. 105, no. 8, p. 83101, Aug. 2014.
[110] A. Loi, I. Manunza, and A. Bonfiglio, “Flexible, organic, ion-sensitive field-effect transistor,” Appl.
Phys. Lett., vol. 86, no. 10, p. 103512, 2005.
[111] J. Kofler, K. Schmoltner, A. Klug, and E. J. W. List-Kratochvil, “Hydrogen ion-selective
electrolyte-gated organic field-effect transistor for pH sensing,” Appl. Phys. Lett., vol. 104, no. 19,
p. 193305, May 2014.
[112] S. Ritjareonwattu, Y. Yun, C. Pearson, and M. C. Petty, “Enhanced sensitivity of an organic field-
effect transistor pH sensor using a fatty acid Langmuir–Blodgett film,” Org. Electron., vol. 11, no.
11, pp. 1792–1795, Nov. 2010.
[113] S. Ritjareonwattu, Y. Yun, C. Pearson, and M. C. Petty, “An ion sensitive organic field-effect
transistor incorporating the ionophore valinomycin,” IEEE Sens. J., vol. 12, no. 5, pp. 1181–1186,
May 2012.
[114] M.-J. Spijkman, J. J. Brondijk, T. C. T. Geuns, E. C. P. Smits, T. Cramer, F. Zerbetto, P. Stoliar, F.
Biscarini, P. W. M. Blom, and D. M. de Leeuw, “Dual-gate organic field-effect transistors as
potentiometric sensors in aqueous solution,” Adv. Funct. Mater., vol. 20, no. 6, pp. 898–905, Mar.
2010.
[115] M. Yun, A. Sharma, C. Fuentes-Hernandez, D. K. Hwang, A. Dindar, S. Singh, S. Choi, and B.
Kippelen, “Stable organic field-effect transistors for continuous and nondestructive sensing of
chemical and biologically relevant molecules in aqueous environment,” ACS Appl. Mater.
Interfaces, vol. 6, no. 3, pp. 1616–1622, Feb. 2014.
Ph.D. Thesis - Y. Qin McMaster University - Electrical and Computer Engineering
179
[116] J. van der spiegel, I. Lauks, P. Chan, and D. Babic, “The extended gate chemically sensitive field
effect transistor as multi-species microprobe,” Sensor. Actuat., vol. 4, pp. 291–298, Jan. 1983.
[117] L. Maiolo, S. Mirabella, F. Maita, A. Alberti, A. Minotti, V. Strano, A. Pecora, Y. Shacham-
Diamand, and G. Fortunato, “Flexible pH sensors based on polysilicon thin film transistors and
ZnO nanowalls,” Appl. Phys. Lett., vol. 105, no. 9, p. 93501, Sep. 2014.
[118] Jung-Chuan Chou and Cheng-Wei Chen, “Fabrication and application of ruthenium-doped titanium
dioxide films as electrode material for ion-sensitive extended-gate FETs,” IEEE Sens. J., vol. 9, no.
3, pp. 277–284, Mar. 2009.
[119] P.-C. Yao, J.-L. Chiang, and M.-C. Lee, “Application of sol–gel TiO2 film for an extended-gate H+
ion-sensitive field-effect transistor,” Solid State Sci., vol. 28, pp. 47–54, Feb. 2014.
[120] Y.-H. Liao and J.-C. Chou, “Preparation and characterization of the titanium dioxide thin films used
for pH electrode and procaine drug sensor by sol–gel method,” Mater. Chem. Phys., vol. 114, no.
2–3, pp. 542–548, Apr. 2009.
[121] N. C. S. Vieira, A. Figueiredo, A. D. Faceto, A. A. A. de Queiroz, V. Zucolotto, and F. E. G.
Guimarães, “Dendrimers/TiO2 nanoparticles layer-by-layer films as extended gate FET for pH
detection,” Sensor. Actuat. B Chem., vol. 169, pp. 397–400, Jul. 2012.
[122] Y.-C. Huang, F.-S. Tsai, and S.-J. Wang, “Preparation of TiO2 nanowire arrays through
hydrothermal growth method and their pH sensing characteristics,” Jpn. J. Appl. Phys., vol. 53, no.
6S, p. 06JG02, Jun. 2014.
[123] E. M. Guerra and M. Mulato, “Titanium oxide nanorods pH sensors: Comparison between
voltammetry and extended gate field effect transistor measurements,” Mater. Sci. Appl., vol. 5, no.
7, p. 46458, 2014.
[124] H.-H. Li, C.-E. Yang, C.-C. Kei, C.-Y. Su, W.-S. Dai, J.-K. Tseng, P.-Y. Yang, J.-C. Chou, and H.-
C. Cheng, “Coaxial-structured ZnO/silicon nanowires extended-gate field-effect transistor as pH
sensor,” Thin Solid Films, vol. 529, pp. 173–176, Feb. 2013.
[125] C.-H. Kao, H. Chen, L.-T. Kuo, J.-C. Wang, Y.-T. Chen, Y.-C. Chu, C.-Y. Chen, C.-S. Lai, S. W.
Chang, and C. W. Chang, “Multi-analyte biosensors on a CF4 plasma treated Nb2O5-based
membrane with an extended gate field effect transistor structure,” Sensor. Actuat. B Chem., vol.
194, pp. 419–426, Apr. 2014.
[126] A. Das, D. H. Ko, C.-H. Chen, L.-B. Chang, C.-S. Lai, F.-C. Chu, L. Chow, and R.-M. Lin, “Highly
sensitive palladium oxide thin film extended gate FETs as pH sensor,” Sensor. Actuat. B Chem.,
vol. 205, pp. 199–205, Dec. 2014.
[127] P. D. Batista and M. Mulato, “Polycrystalline fluorine-doped tin oxide as sensoring thin film in
EGFET pH sensor,” J. Mater. Sci., vol. 45, no. 20, pp. 5478–5481, Oct. 2010.
[128] B.-R. Huang, S.-C. Hung, and Y.-P. Lo, “Effects of In2O3 modification of sprayed multiwalled
carbon nanotubes for pH-sensing applications,” Mater. Sci. Semicond. Process., vol. 26, pp. 710–
715, Oct. 2014.
[129] S.-C. Hung, N.-J. Cheng, C.-F. Yang, and Y.-P. Lo, “Investigation of extended-gate field-effect
transistor pH sensors based on different-temperature-annealed bi-layer MWCNTs-In2O3 films,”
Nanoscale Res. Lett., vol. 9, no. 1, p. 502, 2014.
[130] B.-R. Huang and T.-C. Lin, “Leaf-like carbon nanotube/nickel composite membrane extended-gate
field-effect transistors as pH sensor,” Appl. Phys. Lett., vol. 99, no. 2, p. 23108, 2011.
[131] T. Trantidou, M. Tariq, C. Terracciano, C. Toumazou, and T. Prodromakis, “Parylene C-based
flexible electronics for pH monitoring applications,” Sensors, vol. 14, no. 7, pp. 11629–11639, Jul.
2014.
[132] N. Lei, P. Li, W. Xue, and J. Xu, “Simple graphene chemiresistors as pH sensors: fabrication and
characterization,” Meas. Sci. Technol., vol. 22, no. 10, p. 107002, Oct. 2011.
[133] W. S. Lee, Y.-S. Park, and Y.-K. Cho, “Hierarchically structured suspended TiO2 nanofibers for
use in UV and pH sensor devices,” ACS Appl. Mater. Interfaces, vol. 6, no. 15, pp. 12189–12195,
Aug. 2014.

Ph.D. Thesis - Y. Qin McMaster University - Electrical and Computer Engineering
180
[134] Y. T. Lee, E. Lee, J. M. Lee, and W. Lee, “Micro-sized pH sensors based on patterned Pd structures
using an electrolysis method,” Curr. Appl. Phys., vol. 9, no. 4, pp. e218–e221, Jul. 2009.
[135] K. F. Lei, K.-F. Lee, and S.-I. Yang, “Fabrication of carbon nanotube-based pH sensor for paper-
based microfluidics,” Microelectron. Eng., vol. 100, pp. 1–5, Dec. 2012.
[136] P. Lin and F. Yan, “Organic thin-film transistors for chemical and biological sensing,” Adv. Mater.,
vol. 24, no. 1, pp. 34–51, Jan. 2012.
[137] C. Liao and F. Yan, “Organic semiconductors in organic thin-film transistor-based chemical and
biological sensors,” Polym. Rev., vol. 53, no. 3, pp. 352–406, Jul. 2013.
[138] J. T. Mabeck and G. G. Malliaras, “Chemical and biological sensors based on organic thin-film
transistors,” Anal. Bioanal. Chem., vol. 384, no. 2, pp. 343–353, Dec. 2005.
[139] G. Tarabella, F. Mahvash Mohammadi, N. Coppedè, F. Barbero, S. Iannotta, C. Santato, and F.
Cicoira, “New opportunities for organic electronics and bioelectronics: Ions in action,” Chem. Sci.,
vol. 4, no. 4, pp. 1395–1409, 2013.
[140] G. Scarpa, A.-L. Idzko, A. Yadav, and S. Thalhammer, “Organic ISFET based on poly(3-
hexylthiophene),” Sensors, vol. 10, no. 3, pp. 2262–2273, Mar. 2010.
[141] P. Lin, F. Yan, and H. L. W. Chan, “Ion-sensitive properties of organic electrochemical transistors,”
ACS Appl. Mater. Interfaces, vol. 2, no. 6, pp. 1637–1641, Jun. 2010.
[142] M. J. Panzer and C. D. Frisbie, “Exploiting ionic coupling in electronic devices: Electrolyte-gated
organic field-effect transistors,” Adv. Mater., vol. 20, no. 16, pp. 3177–3180, Aug. 2008.
[143] A. J. Bard and L. R. Faulkner, Electrochemical methods: Fundamentals and applications, 2nd
edition. New York, NY, USA: John Wiley & Sons, 2001.
[144] L. Kergoat, B. Piro, M. Berggren, G. Horowitz, and M.-C. Pham, “Advances in organic transistor-
based biosensors: from organic electrochemical transistors to electrolyte-gated organic field-effect
transistors,” Anal. Bioanal. Chem., vol. 402, no. 5, pp. 1813–1826, Feb. 2012.
[145] V. Pachauri, K. Kern, and K. Balasubramanian, “Field-effect-based chemical sensing using
nanowire-nanoparticle hybrids: The ion-sensitive metal-semiconductor field-effect transistor,” Appl.
Phys. Lett., vol. 102, no. 2, p. 23501, 2013.
[146] I.-Y. Sohn, D.-J. Kim, J.-H. Jung, O. J. Yoon, T. Nguyen Thanh, T. Tran Quang, and N.-E. Lee,
“pH sensing characteristics and biosensing application of solution-gated reduced graphene oxide
field-effect transistors,” Biosens. Bioelectron., vol. 45, pp. 70–76, Jul. 2013.
[147] B. Mailly-Giacchetti, A. Hsu, H. Wang, V. Vinciguerra, F. Pappalardo, L. Occhipinti, E. Guidetti,
S. Coffa, J. Kong, and T. Palacios, “pH sensing properties of graphene solution-gated field-effect
transistors,” J. Appl. Phys., vol. 114, no. 8, p. 84505, 2013.
[148] A. M. Münzer, K. Melzer, M. Heimgreiter, and G. Scarpa, “Random CNT network and regioregular
poly(3-hexylthiophen) FETs for pH sensing applications: A comparison,” Biochim. Biophys. Acta,
vol. 1830, no. 9, pp. 4353–4358, Sep. 2013.
[149] P. K. Ang, W. Chen, A. T. S. Wee, and K. P. Loh, “Solution-gated epitaxial graphene as pH
sensor,” J. Am. Chem. Soc., vol. 130, no. 44, pp. 14392–14393, Nov. 2008.
[150] F. Liao, C. Chen, and V. Subramanian, “Organic TFTs as gas sensors for electronic nose
applications,” Sensor. Actuat. B Chem., vol. 107, no. 2, pp. 849–855, Jun. 2005.
[151] L. Torsi and A. Dodabalapur, “Organic thin-film transistors as plastic analytical sensors,” Anal.
Chem., vol. 77, no. 19, p. 380A–387A, Oct. 2005.
[152] C. Feng, O. Marinov, M. J. Deen, P. R. Selvaganapathy, and Y. Wu, “Sensitivity of the threshold
voltage of organic thin-film transistors to light and water,” J. Appl. Phys., vol. 117, no. 18, p.
185501, May 2015.
[153] O. Knopfmacher, M. L. Hammock, A. L. Appleton, G. Schwartz, J. Mei, T. Lei, J. Pei, and Z. Bao,
“Highly stable organic polymer field-effect transistor sensor for selective detection in the marine
environment,” Nat. Commun., vol. 5, p. 2954, Jan. 2014.

Ph.D. Thesis - Y. Qin McMaster University - Electrical and Computer Engineering
181
[154] S. J. Zilker, C. Detcheverry, E. Cantatore, and D. M. de Leeuw, “Bias stress in organic thin-film
transistors and logic gates,” Appl. Phys. Lett., vol. 79, no. 8, p. 1124, 2001.
[155] J.-H. Ahn, J.-Y. Kim, M.-L. Seol, D. J. Baek, Z. Guo, C.-H. Kim, S.-J. Choi, and Y.-K. Choi, “A
pH sensor with a double-gate silicon nanowire field-effect transistor,” Appl. Phys. Lett., vol. 102,
no. 8, p. 83701, 2013.
[156] M. E. Roberts, S. C. B. Mannsfeld, N. Queralto, C. Reese, J. Locklin, W. Knoll, and Z. Bao,
“Water-stable organic transistors and their application in chemical and biological sensors,” Proc.
Natl. Acad. Sci., vol. 105, no. 34, pp. 12134–12139, Aug. 2008.
[157] J. Jin, Y. Suzuki, N. Ishikawa, and T. Takeuchi, “A miniaturized FIA system for the determination
of residual chlorine in environmental water samples,” Anal. Sci., vol. 20, no. 1, pp. 205–207, 2004.
[158] A. Mehta, H. Shekhar, S. H. Hyun, S. Hong, and H. J. Cho, “A micromachined electrochemical
sensor for free chlorine monitoring in drinking water,” Water Sci. Technol., vol. 53, no. 4–5, pp.
403–410, Feb. 2006.
[159] R. Olivé-Monllau, J. Orozco, C. Fernández-Sánchez, M. Baeza, J. Bartrolí, C. Jimenez-Jorquera,
and F. Céspedes, “Flow injection analysis system based on amperometric thin-film transducers for
free chlorine detection in swimming pool waters,” Talanta, vol. 77, no. 5, pp. 1739–1744, Mar.
2009.
[160] A. Okumura, A. Hirabayashi, Y. Sasaki, and R. Miyake, “Simple miniaturized amperometric flow
cell for monitoring residual chlorine in tap water.,” Anal. Sci., vol. 17, no. 9, pp. 1113–1115, 2001.
[161] F. Davis, S. D. Collyer, D. D. Gornall, K. A. Law, D. W. Mills, and S. P. J. Higson, “New
techniques in monitoring water pollution - Development of sonochemically fabricated microarrays
for the determination of pollutants,” Chim. Oggi-Chem. Today, vol. 25, pp. 28–31, 2007.
[162] M. Murata, T. A. Ivandini, M. Shibata, S. Nomura, A. Fujishima, and Y. Einaga, “Electrochemical
detection of free chlorine at highly boron-doped diamond electrodes,” J. Electroanal. Chem., vol.
612, no. 1, pp. 29–36, Jan. 2008.
[163] P. Salazar, M. Martín, F. J. García-García, J. L. González-Mora, and A. R. González-Elipe, “A
novel and improved surfactant-modified Prussian Blue electrode for amperometric detection of free
chlorine in water,” Sensor. Actuat. B Chem., vol. 213, pp. 116–123, Jul. 2015.
[164] B. Wang and J. Anzai, “A facile electrochemical detection of hypochlorite ion based on ferrocene
compounds,” Int. J. Electrochem. Sci., vol. 10, pp. 3260–3268, 2015.
[165] J. Muñoz, F. Céspedes, and M. Baeza, “Modified multiwalled carbon nanotube/epoxy
amperometric nanocomposite sensors with CuO nanoparticles for electrocatalytic detection of free
chlorine,” Microchem. J., vol. 122, pp. 189–196, Sep. 2015.
[166] Y. Qin, H.-J. Kwon, M. M. R. Howlader, and M. J. Deen, “Microfabricated electrochemical pH and
free chlorine sensors for water quality monitoring: Recent advances and research challenges,” RSC
Adv., vol. 5, no. 85, pp. 69086–69109, 2015.
[167] A. Lale, A. Tsopela, A. Civélas, L. Salvagnac, J. Launay, and P. Temple-Boyer, “Integration of
tungsten layers for the mass fabrication of WO3-based pH-sensitive potentiometric microsensors,”
Sensor. Actuat. B Chem., vol. 206, pp. 152–158, Jan. 2015.
[168] R. Zhao, M. Xu, J. Wang, and G. Chen, “A pH sensor based on the TiO2 nanotube array modified
Ti electrode,” Electrochim. Acta, vol. 55, no. 20, pp. 5647–5651, Aug. 2010.
[169] S. M. Al-Hilli, M. Willander, A. Ost, and P. Stralfors, “ZnO nanorods as an intracellular sensor for
pH measurements,” J. Appl. Phys., vol. 102, no. 8, p. 84304, 2007.
[170] C. Liu, D. Bocchicchio, P. Overmyer, and M. Neuman, “A Palladium-palladium oxide miniature
pH electrode,” Science, vol. 207, no. 4427, pp. 188–189, Jan. 1980.
[171] W. T. Grubb and L. H. King, “Palladium-palladium oxide pH electrodes,” Anal. Chem., vol. 52, no.
2, pp. 270–273, Feb. 1980.
[172] E. Kinoshita, F. Ingman, G. Edwall, S. Thulin, and S. Głab, “Polycrystalline and monocrystalline
antimony, iridium and palladium as electrode material for pH-sensing electrodes,” Talanta, vol. 33,
no. 2, pp. 125–134, Feb. 1986.

Ph.D. Thesis - Y. Qin McMaster University - Electrical and Computer Engineering
182
[173] E. Kinoshita, F. Ingman, G. Edwall, and S. Glab, “An examination of the palladium/palladium
oxide system and its utility for pH-sensing electrodes,” Electrochim. Acta, vol. 31, no. 1, pp. 29–38,
Jan. 1986.
[174] V. A. Karagounis, C. C. Liu, M. R. Neuman, L. T. Romankiw, P. A. Leary, and J. J. Cuomo, “A
Pd-PdO film potentiometnc pH sensor,” IEEE Trans. Biomed. Eng., vol. BME-33, no. 2, pp. 113–
116, Feb. 1986.
[175] C. C. Liu and M. R. Neuman, “Fabrication of miniature PO2 and pH sensors using microelectronic
techniques,” Diabetes Care, vol. 5, no. 3, pp. 275–277, May 1982.
[176] L. J. Bloor and D. J. Malcolme-Lawes, “An electrochemical preparation of palladium oxide pH
sensors,” J. Electroanal. Chem. Interfacial Electrochem., vol. 278, no. 1–2, pp. 161–173, Jan. 1990.
[177] J. Y. Kim and Y. H. Lee, “Pd-PdO pH microprobe for local pH measurement,” Biotechnol. Bioeng.,
vol. 34, no. 1, pp. 131–136, Jun. 1989.
[178] Y. Qin, D. H. Turkenburg, I. Barbu, W. T. T. Smaal, K. Myny, W.-Y. Lin, G. H. Gelinck, P.
Heremans, J. Liu, and E. R. Meinders, “Organic thin-film transistors with anodized gate dielectric
patterned by self-aligned embossing on flexible substrates,” Adv. Funct. Mater., vol. 22, no. 6, pp.
1209–1214, 2012.
[179] J. Chu, Y. Zhao, S.-H. Li, H.-Q. Yu, G. Liu, and Y.-C. Tian, “An integrated solid-state pH
microelectrode prepared using microfabrication,” Electrochim. Acta, vol. 152, pp. 6–12, Jan. 2015.
[180] Y. Qin, M. M. R. Howlader, M. J. Deen, Y. M. Haddara, and P. R. Selvaganapathy, “Polymer
integration for packaging of implantable sensors,” Sensor. Actuat. B Chem., vol. 202, pp. 758–778,
Oct. 2014.
[181] A. Santos, M. J. Deen, and L. F. Marsal, “Low-cost fabrication technologies for nanostructures:
State-of-the-art and potential,” Nanotechnology, vol. 26, no. 4, p. 42001, Jan. 2015.
[182] J. P. Metters, F. Tan, and C. E. Banks, “Screen-printed palladium electroanalytical sensors,” J.
Solid State Electrochem., vol. 17, no. 6, pp. 1553–1562, Jun. 2013.
[183] M. Ren, Y. Kang, W. He, Z. Zou, X. Xue, D. L. Akins, H. Yang, and S. Feng, “Origin of
performance degradation of palladium-based direct formic acid fuel cells,” Appl. Catal. B Environ.,
vol. 104, no. 1–2, pp. 49–53, Apr. 2011.
[184] D. Zemlyanov, B. Aszalos-Kiss, E. Kleimenov, D. Teschner, S. Zafeiratos, M. Hävecker, A. Knop-
Gericke, R. Schlögl, H. Gabasch, W. Unterberger, K. Hayek, and B. Klötzer, “In situ XPS study of
Pd(111) oxidation. Part 1: 2D oxide formation in 10−3mbar O2,” Surf. Sci., vol. 600, no. 5, pp.
983–994, Mar. 2006.
[185] H. Wang, T. Sun, W. Xu, F. Xie, L. Ye, Y. Xiao, Y. Wang, J. Chen, and J. Xu, “Low-temperature
facile solution-processed gate dielectric for combustion derived oxide thin film transistors,” RSC
Adv., vol. 4, no. 97, pp. 54729–54739, Oct. 2014.
[186] M. W. Lee, G. S. Ryu, Y. U. Lee, C. Pearson, M. C. Petty, and C. K. Song, “Control of droplet
morphology for inkjet-printed TIPS-pentacene transistors,” Microelectron. Eng., vol. 95, pp. 1–4,
Jul. 2012.
[187] S. Głab, A. Hulanicki, G. Edwall, and F. Ingman, “Metal-metal oxide and metal oxide electrodes as
pH sensors,” Crit. Rev. Anal. Chem., vol. 21, no. 1, pp. 29–47, Jan. 1989.
[188] H. H. Kan, R. J. Colmyer, A. Asthagiri, and J. F. Weaver, “Adsorption of water on a PdO(101) thin
film: Evidence of an adsorbed HO−H2O complex,” J. Phys. Chem. C, vol. 113, no. 4, pp. 1495–
1506, Jan. 2009.
[189] J.-S. Filhol and M. Neurock, “Elucidation of the electrochemical activation of water over Pd by first
principles,” Angew. Chemie Int. Ed., vol. 45, no. 3, pp. 402–406, Jan. 2006.
[190] M. Grdeń, M. Łukaszewski, G. Jerkiewicz, and A. Czerwiński, “Electrochemical behaviour of
palladium electrode: Oxidation, electrodissolution and ionic adsorption,” Electrochim. Acta, vol.
53, no. 26, pp. 7583–7598, Nov. 2008.
[191] J. Bobacka, A. Ivaska, and A. Lewenstam, “Potentiometric ion sensors,” Chem. Rev., vol. 108, no.
2, pp. 329–351, Feb. 2008.

Ph.D. Thesis - Y. Qin McMaster University - Electrical and Computer Engineering
183
[192] E. Bakker, “The phase-boundary potential model,” Talanta, vol. 63, no. 1, pp. 3–20, May 2004.
[193] A. W. Adamson and A. P. Gast, Physical chemistry of surfaces, 6th edition. New York, NY, USA:
John Wiley & Sons, 1997.
[194] G. N. Lewis, “The atom and the molecule,” J. Am. Chem. Soc., vol. 38, no. 4, pp. 762–785, Apr.
1916.
[195] R. P. Buck, “Theory of potential distribution and response of solid state membrane electrodes. I.
Zero current,” Anal. Chem., vol. 40, no. 10, pp. 1432–1439, Aug. 1968.
[196] L. M. Vracar, D. B. Sepa, and A. Damjanovic, “Palladium electrode in oxygen saturated solutions,”
J. Electrochem. Soc., vol. 134, no. 7, pp. 1695–1697, 1987.
[197] S. F. Parker, K. Refson, A. C. Hannon, and E. R. Barney, “Characterization of hydrous palladium
oxide: Implications for low-temperature carbon monoxide oxidation,” J. Phys. Chem. C, vol. 114,
no. 33, pp. 14164–14172, 2010.
[198] L. S. Kibis, A. I. Stadnichenko, S. V. Koscheev, V. I. Zaikovskii, and A. I. Boronin, “Highly
oxidized palladium nanoparticles comprising Pd4+ species: Spectroscopic and structural aspects,
thermal stability, and reactivity,” J. Phys. Chem. C, vol. 116, no. 36, pp. 19342–19348, Sep. 2012.
[199] K. G. Kreider, M. J. Tarlov, and J. P. Cline, “Sputtered thin-film pH electrodes of platinum,
palladium, ruthenium, and iridium oxides,” Sensor. Actuat. B Chem., vol. 28, no. 3, pp. 167–172,
1995.
[200] L. Bousse, S. Mostarshed, B. van der Schoot, and N. F. de Rooij, “Comparison of the hysteresis of
Ta2O5 and Si3N4 pH-sensing insulators,” Sensor. Actuat. B Chem., vol. 17, no. 2, pp. 157–164,
Jan. 1994.
[201] S. Chen, W. Huang, J. Zheng, and Z. Li, “Study on the electrodissolution and roughening of a
palladium electrode in chloride containing solutions,” J. Electroanal. Chem., vol. 660, no. 1, pp.
80–84, 2011.
[202] M. Singh, H. M. Haverinen, P. Dhagat, and G. E. Jabbour, “Inkjet printing-process and its
applications,” Adv. Mater., vol. 22, no. 6, pp. 673–685, Feb. 2010.
[203] M. Kuang, L. Wang, and Y. Song, “Controllable printing droplets for high-resolution patterns,”
Adv. Mater., vol. 26, no. 40, pp. 6950–6958, Oct. 2014.
[204] C. N. Hoth, S. A. Choulis, P. Schilinsky, and C. J. Brabec, “High photovoltaic performance of
inkjet printed polymer: Fullerene blends,” Adv. Mater., vol. 19, no. 22, pp. 3973–3978, Nov. 2007.
[205] E. Tekin, P. J. Smith, S. Hoeppener, A. M. J. van den Berg, A. S. Susha, A. L. Rogach, J.
Feldmann, and U. S. Schubert, “Inkjet printing of luminescent CdTe nanocrystal–polymer
composites,” Adv. Funct. Mater., vol. 17, no. 1, pp. 23–28, Jan. 2007.
[206] M. Medina-Sánchez, C. Martínez-Domingo, E. Ramon, and A. Merkoçi, “An inkjet-printed field-
effect transistor for label-free biosensing,” Adv. Funct. Mater., vol. 24, no. 40, pp. 6291–6302, Oct.
2014.
[207] B. Derby, “Printing and prototyping of tissues and scaffolds,” Science, vol. 338, no. 6109, pp. 921–
926, Nov. 2012.
[208] A. Chen and C. Ostrom, “Palladium-based nanomaterials: Synthesis and electrochemical
applications,” Chem. Rev., vol. 115, no. 21, pp. 11999–12044, Nov. 2015.
[209] R. Westerström, M. E. Messing, S. Blomberg, A. Hellman, H. Grönbeck, J. Gustafson, N. M.
Martin, O. Balmes, R. van Rijn, J. N. Andersen, K. Deppert, H. Bluhm, Z. Liu, M. E. Grass, M.
Hävecker, and E. Lundgren, “Oxidation and reduction of Pd(100) and aerosol-deposited Pd
nanoparticles,” Phys. Rev. B, vol. 83, no. 11, p. 115440, Mar. 2011.
[210] S. Busato, A. Belloli, and P. Ermanni, “Inkjet printing of palladium catalyst patterns on polyimide
film for electroless copper plating,” Sensor. Actuat. B Chem., vol. 123, no. 2, pp. 840–846, May
2007.
[211] M.-W. Wang, T.-Y. Liu, D.-C. Pang, J.-C. Hung, and C.-C. Tseng, “Inkjet printing of a pH
sensitive palladium catalyst patterns of ITO glass for electroless copper,” Surf. Coatings Technol.,
vol. 259, pp. 340–345, Nov. 2014.
Ph.D. Thesis - Y. Qin McMaster University - Electrical and Computer Engineering
184
[212] H. J. Gysling, “Nanoinks in inkjet metallization - Evolution of simple additive-type metal
patterning,” Curr. Opin. Colloid Interface Sci., vol. 19, no. 2, pp. 155–162, Apr. 2014.
[213] T. Bhuvana, W. Boley, B. Radha, B. D. Dolash, G. Chiu, D. Bergstrom, R. Reifenberger, T. S.
Fisher, and G. U. Kulkarni, “Inkjet printing of palladium alkanethiolates for facile fabrication of
metal interconnects and surface-enhanced Raman scattering substrates,” Micro Nano Lett., vol. 5,
no. 5, pp. 296–299, 2010.
[214] X. Fang, H. Li, R. Jackstell, and M. Beller, “Selective palladium-catalyzed aminocarbonylation of
1,3-dienes: Atom-efficient synthesis of β,γ-unsaturated amides,” J. Am. Chem. Soc., vol. 136, no.
45, pp. 16039–16043, Nov. 2014.
[215] J. Borris, A. Dohse, A. Hinze, M. Thomas, C.-P. Klages, A. Möbius, D. Elbick, and E.-R. Weidlich,
“Improvement of the adhesion of a galvanic metallization of polymers by surface functionalization
using dielectric barrier discharges at atmospheric pressure,” Plasma Process. Polym., vol. 6, no. S1,
pp. S258–S263, Jun. 2009.
[216] M. Robin, W. Kuai, M. Amela-Cortes, S. Cordier, Y. Molard, T. Mohammed-Brahim, E. Jacques,
and M. Harnois, “Epoxy based ink as versatile material for inkjet-printed devices,” ACS Appl.
Mater. Interfaces, vol. 7, no. 39, pp. 21975–21984, Oct. 2015.
[217] Y. Chang, C. Yang, X.-Y. Zheng, D.-Y. Wang, and Z.-G. Yang, “Fabrication of copper patterns on
flexible substrate by patterning–adsorption–plating process,” ACS Appl. Mater. Interfaces, vol. 6,
no. 2, pp. 768–772, Jan. 2014.
[218] H. I. Rasool, C. Ophus, and A. Zettl, “Atomic defects in two dimensional materials,” Adv. Mater.,
vol. 27, no. 38, pp. 5771–5777, Oct. 2015.
[219] A. Roshanghias, G. Khatibi, R. Pelzer, J. Steinbrenner, and J. Bernardi, “Cross-sectional
nanoindentation (CSN) studies on the effect of thickness on adhesion strength of thin films,” J.
Phys. D. Appl. Phys., vol. 48, no. 3, p. 35301, Jan. 2015.
[220] X. Jin, J. Strueben, L. Heepe, A. Kovalev, Y. K. Mishra, R. Adelung, S. N. Gorb, and A. Staubitz,
“Joining the un-joinable: adhesion between low surface energy polymers using tetrapodal ZnO
linkers,” Adv. Mater., vol. 24, no. 42, pp. 5676–5680, Nov. 2012.
[221] A. . Volinsky, N. . Moody, and W. . Gerberich, “Interfacial toughness measurements for thin films
on substrates,” Acta Mater., vol. 50, no. 3, pp. 441–466, Feb. 2002.
[222] M. D. Thouless, “Cracking and delamination of coatings,” J. Vac. Sci. Technol. A Vacuum,
Surfaces, Film., vol. 9, no. 4, pp. 2510–2515, Jul. 1991.
[223] D. Bernoulli, K. Häfliger, K. Thorwarth, G. Thorwarth, R. Hauert, and R. Spolenak, “Cohesive and
adhesive failure of hard and brittle films on ductile metallic substrates: A film thickness size effect
analysis of the model system hydrogenated diamond-like carbon (a-C:H) on Ti substrates,” Acta
Mater., vol. 83, pp. 29–36, Jan. 2015.
[224] Y.-T. Chen, “Optical, electrical, and adhesive properties of ZnO thin films,” J. Nanosci.
Nanotechnol., vol. 16, no. 1, pp. 658–662, Jan. 2016.
[225] N. Inagaki, S. Tasaka, and K. Hibi, “Surface modification of Kapton film by plasma treatments,” J.
Polym. Sci. Part A Polym. Chem., vol. 30, no. 7, pp. 1425–1431, Jun. 1992.
[226] J. H. Jung, J. A. Rim, S. J. Lee, and S. S. Lee, “Spatial organization and patterning of palladium
nanoparticles on a self-assembled helical ribbon lipid,” Chem. Commun., no. 4, pp. 468–470, 2005.
[227] G. Yu, X. Xie, L. Pan, Z. Bao, and Y. Cui, “Hybrid nanostructured materials for high-performance
electrochemical capacitors,” Nano Energy, vol. 2, no. 2, pp. 213–234, Mar. 2013.
[228] J. Halme, M. Toivola, A. Tolvanen, and P. Lund, “Charge transfer resistance of spray deposited and
compressed counter electrodes for dye-sensitized nanoparticle solar cells on plastic substrates,” Sol.
Energy Mater. Sol. Cells, vol. 90, no. 7–8, pp. 872–886, May 2006.
[229] B. E. Conway, V. Birss, and J. Wojtowicz, “The role and utilization of pseudocapacitance for
energy storage by supercapacitors,” J. Power Sources, vol. 66, no. 1–2, pp. 1–14, May 1997.
[230] J. C. Chou, K. Y. Huang, and J. S. Lin, “Simulation of time-dependent effects of pH-ISFETs,”
Sensor. Actuat. B Chem., vol. 62, no. 2, pp. 88–91, Feb. 2000.

Ph.D. Thesis - Y. Qin McMaster University - Electrical and Computer Engineering
185
[231] J. C. Chou, H. M. Tsai, C. N. Shiao, and J. S. Lin, “Study and simulation of the drift behaviour of
hydrogenated amorphous silicon gate pH-ISFET,” Sensor. Actuat. B Chem., vol. 62, no. 2, pp. 97–
101, Feb. 2000.
[232] L. Bousse, D. Hafeman, and N. Tran, “Time-dependence of the chemical response of silicon nitride
surfaces,” Sensor. Actuat. B Chem., vol. 1, no. 1–6, pp. 361–367, Jan. 1990.
[233] S. Jamasb, S. D. Collins, and R. L. Smith, “A physical model for threshold voltage instability in
Si3N4-gate H+-sensitive FET’s (pH ISFET’s),” IEEE Trans. Electron Devices, vol. 45, no. 6, pp.
1239–1245, Jun. 1998.
[234] S. Jamasb, S. Collins, and R. L. Smith, “A physical model for drift in pH ISFETs,” Sensor. Actuat.
B Chem., vol. 49, no. 1–2, pp. 146–155, Jun. 1998.
[235] L. L. Zhang, R. Zhou, and X. S. Zhao, “Graphene-based materials as supercapacitor electrodes,” J.
Mater. Chem., vol. 20, no. 29, p. 5983, 2010.
[236] C.-W. Pan, J.-C. Chou, T.-P. Sun, and S.-K. Hsiung, “Development of the tin oxide pH electrode by
the sputtering method,” Sensor. Actuat. B Chem., vol. 108, no. 1–2, pp. 863–869, Jul. 2005.
[237] M. Berggren and A. Richter-Dahlfors, “Organic bioelectronics,” Adv. Mater., vol. 19, no. 20, pp.
3201–3213, Sep. 2007.
[238] M. W. Shinwari, D. Zhitomirsky, I. A. Deen, P. R. Selvaganapathy, M. J. Deen, and D. Landheer,
“Microfabricated reference electrodes and their biosensing applications,” Sensors, vol. 10, no. 3, pp.
1679–1715, Mar. 2010.
[239] J. Hu, A. Stein, and P. Bühlmann, “Rational design of all-solid-state ion-selective electrodes and
reference electrodes,” TrAC Trends Anal. Chem., vol. 76, pp. 102–114, Feb. 2016.
[240] F. Huang, Y. Jin, and L. Wen, “Investigations of the hydration effects on cyclic thermo-oxidized
Ir/IrOx electrode,” J. Electrochem. Soc., vol. 162, no. 12, pp. B337–B343, Sep. 2015.
[241] H. Suzuki, A. Hiratsuka, S. Sasaki, and I. Karube, “Problems associated with the thin-film Ag/AgCl
reference electrode and a novel structure with improved durability,” Sensor. Actuat. B Chem., vol.
46, no. 2, pp. 104–113, Feb. 1998.
[242] G. A. Rechnitz and S. B. Zamochnick, “Behaviour of silver(II) in phosphoric acid media and a
general mechanism for solvent oxidation,” Talanta, vol. 12, no. 5, pp. 479–483, May 1965.
[243] P. Saini, “Tangential flow ultrafiltration as an antifouling strategy for water quality sensors,”
McMaster University, 2017.
[244] Y. Qin, H.-J. Kwon, S. Pan, P. Saini, R. Ghosh, P. R. Selvaganapathy, and M. J. Deen,
“Microfabricated pH sensors: Design, modeling and experiments,” in IC-IMPACTS Annual General
Meeting, 2015.
[245] J. Henriksson, L. G. Villanueva, and J. Brugger, “Ultra-low power hydrogen sensing based on a
palladium-coated nanomechanical beam resonator,” Nanoscale, vol. 4, no. 16, pp. 5059–5064,
2012.
[246] E. Rey, M. R. Kamal, R. B. Miles, and B. S. H. Royce, “The semiconductivity and stability of
palladium oxide,” J. Mater. Sci., vol. 13, no. 4, pp. 812–816, Apr. 1978.
[247] F. Xia, V. Perebeinos, Y. Lin, Y. Wu, and P. Avouris, “The origins and limits of metal–graphene
junction resistance,” Nat. Nanotechnol., vol. 6, no. 3, pp. 179–184, Mar. 2011.
[248] Y. Murakami, J. Li, D. Hirose, S. Kohara, and T. Shimoda, “Solution processing of highly
conductive ruthenium and ruthenium oxide thin films from ruthenium–amine complexes,” J. Mater.
Chem. C, vol. 3, no. 17, pp. 4490–4499, 2015.
[249] C.-J. Zhong, J. Luo, B. Fang, B. N. Wanjala, P. N. Njoki, R. Loukrakpam, and J. Yin,
“Nanostructured catalysts in fuel cells,” Nanotechnology, vol. 21, no. 6, p. 62001, Feb. 2010.
[250] H.-J. Qiu, X. Li, H.-T. Xu, H.-J. Zhang, and Y. Wang, “Nanoporous metal as a platform for
electrochemical and optical sensing,” J. Mater. Chem. C, vol. 2, no. 46, pp. 9788–9799, Oct. 2014.
[251] R. Griessen, N. Strohfeldt, and H. Giessen, “Thermodynamics of the hybrid interaction of hydrogen
with palladium nanoparticles,” Nat. Mater., vol. 15, no. 3, pp. 311–317, Nov. 2015.

Ph.D. Thesis - Y. Qin McMaster University - Electrical and Computer Engineering
186
[252] Y. Pak, N. Lim, Y. Kumaresan, R. Lee, K. Kim, T. H. Kim, S.-M. Kim, J. T. Kim, H. Lee, M.-H.
Ham, and G.-Y. Jung, “Palladium nanoribbon array for fast hydrogen gas sensing with ultrahigh
sensitivity,” Adv. Mater., vol. 27, no. 43, pp. 6945–6952, Nov. 2015.
[253] N. Ly, D. E. Xu, W. H. Song, and M. Mayer, “More uniform Pd distribution in free-air balls of Pd-
coated Cu bonding wire using movable flame-off electrode,” Microelectron. Reliab., vol. 55, no. 1,
pp. 201–206, Jan. 2015.
[254] M. E. Franke, T. J. Koplin, and U. Simon, “Metal and metal oxide nanoparticles in chemiresistors:
Does the nanoscale matter?,” Small, vol. 2, no. 1, pp. 36–50, Jan. 2006.
[255] J. F. Weaver, “Surface chemistry of late transition metal oxides,” Chem. Rev., vol. 113, no. 6, pp.
4164–4215, Jun. 2013.
[256] Y. Cao and Z.-X. Chen, “Slab model studies of water adsorption and decomposition on clean and
X- (X = C, N and O) contaminated Pd(111) surfaces,” Phys. Chem. Chem. Phys., vol. 9, no. 6, pp.
739–746, 2007.
[257] Z. Jiang, L. Li, M. Li, R. Li, and T. Fang, “Density functional theory study on the adsorption and
decomposition of H2O on clean and oxygen-modified Pd (100) surface,” Appl. Surf. Sci., vol. 301,
pp. 468–474, May 2014.
[258] Y.-J. Chiang, K.-C. Li, Y.-C. Lin, and F.-M. Pan, “A mechanistic study of hydrogen gas sensing by
PdO nanoflake thin films at temperatures below 250 °C,” Phys. Chem. Chem. Phys., vol. 17, no. 5,
pp. 3039–3049, 2015.
[259] S. Choudhury, C. A. Betty, K. Bhattacharyya, V. Saxena, and D. Bhattacharya, “Nanostructured
PdO thin film from Langmuir–Blodgett precursor for room temperature H2 gas sensing,” ACS Appl.
Mater. Interfaces, vol. 8, no. 26, pp. 16997–17003, Jul. 2016.
[260] A. Baylet, P. Marécot, D. Duprez, P. Castellazzi, G. Groppi, and P. Forzatti, “In situ Raman and in
situ XRD analysis of PdO reduction and Pd° oxidation supported on γ-Al2O3 catalyst under
different atmospheres,” Phys. Chem. Chem. Phys., vol. 13, no. 10, pp. 4607–4613, 2011.
[261] B. Jang, W. Kim, M.-J. Song, and W. Lee, “Thermal stability of the sensing properties in H2
sensors composed of Pd nanogaps on an elastomeric substrate,” Sensor. Actuat. B Chem., vol. 240,
pp. 186–192, Mar. 2017.
[262] L. Fei, Y. Xu, X. Wu, Y. Li, P. Xie, S. Deng, S. Smirnov, and H. Luo, “SBA-15 confined synthesis
of TiNb2O7 nanoparticles for lithium-ion batteries,” Nanoscale, vol. 5, no. 22, pp. 11102–11107,
2013.
[263] G. Socrates, Infrared and Raman characteristic group frequencies: Tables and charts. New York,
NY, USA: John Wiley & Sons, 2004.
[264] Y. Zheng, Q. Qiao, J. Wang, X. Li, and J. Jian, “Gas sensing behavior of palladium oxide for
carbon monoxide at low working temperature,” Sensor. Actuat. B Chem., vol. 212, pp. 256–263,
Jun. 2015.
[265] A. K. Datye, J. Bravo, T. R. Nelson, P. Atanasova, M. Lyubovsky, and L. Pfefferle, “Catalyst
microstructure and methane oxidation reactivity during the Pd↔PdO transformation on alumina
supports,” Appl. Catal. A Gen., vol. 198, no. 1–2, pp. 179–196, May 2000.
[266] S. Mishra and S. Daniele, “Metal–Organic Derivatives with Fluorinated Ligands as Precursors for
Inorganic Nanomaterials,” Chem. Rev., vol. 115, no. 16, pp. 8379–8448, Aug. 2015.
[267] E. Lundgren, G. Kresse, C. Klein, M. Borg, J. N. Andersen, M. De Santis, Y. Gauthier, C.
Konvicka, M. Schmid, and P. Varga, “Two-dimensional oxide on Pd(111),” Phys. Rev. Lett., vol.
88, no. 24, p. 246103, Jun. 2002.
[268] A. McNally, B. Haffemayer, B. S. L. Collins, and M. J. Gaunt, “Palladium-catalysed C–H
activation of aliphatic amines to give strained nitrogen heterocycles,” Nature, vol. 510, no. 7503,
pp. 129–133, May 2014.
[269] E. Roduner, “Size matters: Why nanomaterials are different,” Chem. Soc. Rev., vol. 35, no. 7, pp.
583–592, 2006.

Ph.D. Thesis - Y. Qin McMaster University - Electrical and Computer Engineering
187
[270] T. Teranishi and M. Miyake, “Size control of palladium nanoparticles and their crystal structures,”
Chem. Mater., vol. 10, no. 2, pp. 594–600, Feb. 1998.
[271] S. Polster, M. P. M. Jank, and L. Frey, “Correlation of film morphology and defect content with the
charge-carrier transport in thin-film transistors based on ZnO nanoparticles,” J. Appl. Phys., vol.
119, no. 2, p. 24504, Jan. 2016.
[272] D.-H. Kim, N. Lu, R. Ghaffari, Y.-S. Kim, S. P. Lee, L. Xu, J. Wu, R.-H. Kim, J. Song, Z. Liu, J.
Viventi, B. de Graff, B. Elolampi, M. Mansour, M. J. Slepian, S. Hwang, J. D. Moss, S.-M. Won,
Y. Huang, B. Litt, and J. A. Rogers, “Materials for multifunctional balloon catheters with
capabilities in cardiac electrophysiological mapping and ablation therapy,” Nat. Mater., vol. 10, no.
4, pp. 316–323, Apr. 2011.
[273] A. U. Alam, Y. Qin, M. M. R. Howlader, and M. J. Deen, “Direct bonding of liquid crystal polymer
to glass,” RSC Adv., vol. 6, no. 109, pp. 107200–107207, 2016.
[274] S. K. Mahadeva, K. Walus, and B. Stoeber, “Paper as a platform for sensing applications and other
devices: A review,” ACS Appl. Mater. Interfaces, vol. 7, no. 16, pp. 8345–8362, 2015.
[275] J. Mettakoonpitak, K. Boehle, S. Nantaphol, P. Teengam, J. A. Adkins, M. Srisa-Art, and C. S.
Henry, “Electrochemistry on paper-based analytical devices: A review,” Electroanalysis, vol. 28,
no. 7, pp. 1420–1436, Jul. 2016.
[276] S. Ahmed, M.-P. N. Bui, and A. Abbas, “Paper-based chemical and biological sensors: Engineering
aspects,” Biosens. Bioelectron., vol. 77, pp. 249–263, 2016.
[277] M. Cuartero, G. A. Crespo, and E. Bakker, “Paper-based thin-layer coulometric sensor for halide
determination,” Anal. Chem., vol. 87, no. 3, pp. 1981–1990, Feb. 2015.
[278] W.-J. Lan, X. U. Zou, M. M. Hamedi, J. Hu, C. Parolo, E. J. Maxwell, P. Bühlmann, and G. M.
Whitesides, “Paper-based potentiometric ion sensing,” Anal. Chem., vol. 86, no. 19, pp. 9548–9553,
Oct. 2014.
[279] B. D. Grant, C. A. Smith, K. Karvonen, and R. Richards-Kortum, “Highly sensitive two-
dimensional paper network incorporating biotin-streptavidin for the detection of malaria,” Anal.
Chem., vol. 88, no. 5, pp. 2553–2557, Mar. 2016.
[280] A. C. Glavan, J. Niu, Z. Chen, F. Güder, C.-M. Cheng, D. Liu, and G. M. Whitesides, “Analytical
devices based on direct synthesis of DNA on paper,” Anal. Chem., vol. 88, no. 1, pp. 725–731, Jan.
2016.
[281] Y. Xia, J. Si, and Z. Li, “Fabrication techniques for microfluidic paper-based analytical devices and
their applications for biological testing: A review,” Biosens. Bioelectron., vol. 77, pp. 774–789,
Mar. 2016.
[282] W. Kim, J.-C. Lee, J.-H. Shin, K.-H. Jin, H.-K. Park, and S. Choi, “Instrument-free synthesizable
fabrication of label-free optical biosensing paper strips for the early detection of infectious
keratoconjunctivitides,” Anal. Chem., vol. 88, no. 10, pp. 5531–5537, May 2016.
[283] J. Ho, M. K. Tan, D. B. Go, L. Y. Yeo, J. R. Friend, and H.-C. Chang, “Paper-based microfluidic
surface acoustic wave sample delivery and ionization source for rapid and sensitive ambient mass
spectrometry,” Anal. Chem., vol. 83, no. 9, pp. 3260–3266, 2011.
[284] X. Li, K. Scida, and R. M. Crooks, “Detection of hepatitis B virus DNA with a paper
electrochemical sensor,” Anal. Chem., vol. 87, no. 17, pp. 9009–9015, Sep. 2015.
[285] J. Olkkonen, K. Lehtinen, and T. Erho, “Flexographically printed fluidic structures in paper,” Anal.
Chem., vol. 82, no. 24, pp. 10246–10250, Dec. 2010.
[286] B. Gao, H. Liu, and Z. Gu, “Patterned photonic nitrocellulose for pseudo-paper microfluidics,”
Anal. Chem., vol. 88, no. 10, pp. 5424–5429, May 2016.
[287] Z. Li, H. Liu, C. Ouyang, W. Hong Wee, X. Cui, T. Jian Lu, B. Pingguan-Murphy, F. Li, and F. Xu,
“Recent advances in pen-based writing electronics and their emerging applications,” Adv. Funct.
Mater., vol. 26, no. 2, pp. 165–180, Jan. 2016.
[288] J. R. Choi, Z. Liu, J. Hu, R. Tang, Y. Gong, S. Feng, H. Ren, T. Wen, H. Yang, Z. Qu, B.
Pingguan-Murphy, and F. Xu, “Polydimethylsiloxane-paper hybrid lateral flow assay for highly

Ph.D. Thesis - Y. Qin McMaster University - Electrical and Computer Engineering
188
sensitive point-of-care nucleic acid testing,” Anal. Chem., vol. 88, no. 12, pp. 6254–6264, Jun.
2016.
[289] B. Kang, N. Park, H. Min, J. Lee, H. Jeong, S. Baek, K. Cho, and H. S. Lee, “Fully drawn all-
organic flexible transistors prepared by capillary pen printing on flexible planar and curvilinear
substrates,” Adv. Electron. Mater., vol. 1, no. 12, p. 1500301, Dec. 2015.
[290] Q. Hua, H. Liu, J. Zhao, D. Peng, X. Yang, L. Gu, and C. Pan, “Bioinspired electronic whisker
arrays by pencil-drawn paper for adaptive tactile sensing,” Adv. Electron. Mater., vol. 2, no. 7, p.
1600093, Jul. 2016.
[291] A. J. Bandodkar, W. Jia, J. Ramírez, and J. Wang, “Biocompatible enzymatic roller pens for direct
writing of biocatalytic materials: ‘Do-it-yourself’ electrochemical biosensors,” Adv. Healthc.
Mater., vol. 4, no. 8, pp. 1215–1224, 2015.
[292] A. J. Oostra, K. H. W. van den Bos, P. W. M. Blom, and J. J. Michels, “Disruption of the electrical
conductivity of highly conductive poly(3,4-ethylenedioxythiophene):poly(styrene sulfonate) by
hypochlorite,” J. Phys. Chem. B, vol. 117, no. 37, pp. 10929–10935, Sep. 2013.
[293] D. Alemu, H.-Y. Wei, K.-C. Ho, and C.-W. Chu, “Highly conductive PEDOT:PSS electrode by
simple film treatment with methanol for ITO-free polymer solar cells,” Energy Environ. Sci., vol. 5,
no. 11, pp. 9662–9671, 2012.
[294] G. Barbarella, L. Favaretto, M. Zambianchi, O. Pudova, C. Arbizzani, A. Bongini, and M.
Mastragostino, “From easily oxidized to easily reduced thiophene-based materials,” Adv. Mater.,
vol. 10, no. 7, pp. 551–554, 1998.
[295] H. Shi, C. Liu, Q. Jiang, and J. Xu, “Effective approaches to improve the electrical conductivity of
PEDOT:PSS: A review,” Adv. Electron. Mater., vol. 1, no. 4, p. 1500017, 2015.
[296] M. V. Storey, B. van der Gaag, and B. P. Burns, “Advances in on-line drinking water quality
monitoring and early warning systems,” Water Res., vol. 45, no. 2, pp. 741–747, Jan. 2011.
[297] D. Chapman, “Water quality assessments: A guide to the use of biota, sediments, and water in
environmental monitoring,” University Press, Cambridge, UK, 1996.
[298] Y. Qin, S. Pan, Z. Cheng, A. U. Alam, M. M. R. Howlader, R. Ghosh, N.-X. Hu, and M. J. Deen,
“Integrated water quality monitoring system with pH, free chlorine, and temperature sensors,” p.
submitted to Sensors and Actuators B: Chemical, 2017.
[299] Y. Feng, D. W. Smith, and J. R. Bolton, “Photolysis of aqueous free chlorine species (HOCl and
OCl-) with 254 nm ultraviolet light,” J. Environ. Eng. Sci., vol. 6, no. 3, pp. 277–284, May 2007.
[300] S. Joo and R. B. Brown, “Chemical sensors with integrated electronics,” Chem. Rev., vol. 108, no.
2, pp. 638–651, Jan. 2008.
[301] P. Salazar, M. Martín, J. L. González-Mora, and A. R. González-Elipe, “Application of Prussian
Blue electrodes for amperometric detection of free chlorine in water samples using flow injection
analysis,” Talanta, vol. 146, pp. 410–416, Jan. 2016.
[302] L. H. H. Hsu, E. Hoque, P. Kruse, and P. Ravi Selvaganapathy, “A carbon nanotube based
resettable sensor for measuring free chlorine in drinking water,” Appl. Phys. Lett., vol. 106, no. 6, p.
63102, Feb. 2015.
[303] A. Richter, G. Paschew, S. Klatt, J. Lienig, K.-F. Arndt, and H.-J. P. Adler, “Review on hydrogel-
based pH sensors and microsensors,” Sensors, vol. 8, no. 1, pp. 561–581, Jan. 2008.
[304] M. Sezen, J. T. Register, Y. Yao, B. Glisic, and Y.-L. Loo, “Eliminating piezoresistivity in flexible
conducting polymers for accurate temperature sensing under dynamic mechanical deformations,”
Small, vol. 12, no. 21, pp. 2832–2838, Jun. 2016.
[305] Y. Qin, A. U. Alam, M. M. R. Howlader, N.-X. Hu, and M. J. Deen, “Morphology and electrical
properties of inkjet-printed palladium/palladium oxide,” J. Mater. Chem. C, vol. 5, no. 8, pp. 1893–
1902, 2017.
[306] H. Lee, T. K. Choi, Y. B. Lee, H. R. Cho, R. Ghaffari, L. Wang, H. J. Choi, T. D. Chung, N. Lu, T.
Hyeon, S. H. Choi, and D.-H. Kim, “A graphene-based electrochemical device with

Ph.D. Thesis - Y. Qin McMaster University - Electrical and Computer Engineering
189
thermoresponsive microneedles for diabetes monitoring and therapy,” Nat. Nanotechnol., vol. 11,
no. 6, pp. 566–572, Mar. 2016.
[307] W. Honda, S. Harada, T. Arie, S. Akita, and K. Takei, “Wearable, human-interactive, health-
monitoring, wireless devices fabricated by macroscale printing techniques,” Adv. Funct. Mater.,
vol. 24, no. 22, pp. 3299–3304, Jun. 2014.
[308] H. Y. Y. Nyein, W. Gao, Z. Shahpar, S. Emaminejad, S. Challa, K. Chen, H. M. Fahad, L.-C. Tai,
H. Ota, R. W. Davis, and A. Javey, “A wearable electrochemical platform for noninvasive
simultaneous monitoring of Ca2+ and pH,” ACS Nano, vol. 10, no. 7, pp. 7216–7224, Jul. 2016.
[309] W. Gao, S. Emaminejad, H. Y. Y. Nyein, S. Challa, K. Chen, A. Peck, H. M. Fahad, H. Ota, H.
Shiraki, D. Kiriya, D.-H. Lien, G. A. Brooks, R. W. Davis, and A. Javey, “Fully integrated
wearable sensor arrays for multiplexed in situ perspiration analysis,” Nature, vol. 529, no. 7587, pp.
509–514, Jan. 2016.
[310] Z. Xu, Q. Dong, B. Otieno, Y. Liu, I. Williams, D. Cai, Y. Li, Y. Lei, and B. Li, “Real-time in situ
sensing of multiple water quality related parameters using micro-electrode array (MEA) fabricated
by inkjet-printing technology (IPT),” Sensor. Actuat. B Chem., vol. 237, pp. 1108–1119, Dec. 2016.
[311] S. Mross, T. Zimmermann, N. Winkin, M. Kraft, and H. Vogt, “Integrated multi-sensor system for
parallel in-situ monitoring of cell nutrients, metabolites, cell density and pH in biotechnological
processes,” Sensor. Actuat. B Chem., vol. 236, pp. 937–946, Nov. 2016.
[312] D. Kirsanov, A. Korepanov, D. Dorovenko, E. Legin, and A. Legin, “Indirect monitoring of protein
A biosynthesis in E.coli using potentiometric multisensor system,” Sensor. Actuat. B Chem., vol.
238, pp. 1159–1164, Jan. 2017.
[313] S. Pan, M. J. Deen, and R. Ghosh, “Low-cost graphite-based free chlorine sensor,” Anal. Chem.,
vol. 87, no. 21, pp. 10734–10737, Nov. 2015.
[314] T. Guo, “An optical system towards in-line monitoring of bacteria in drinking water,” McMaster
University, 2016.
[315] T. Guo, Y. Wei, C. Xu, B. R. Watts, Z. Zhang, Q. Fang, H. Zhang, P. R. Selvaganapathy, and M. J.
Deen, “Counting of Escherichia coli by a microflow cytometer based on a photonic-microfluidic
integrated device,” Electrophoresis, vol. 36, no. 2, pp. 298–304, Jan. 2015.
[316] Z. Li, M. J. Deen, S. Kumar, and P. R. Selvaganapathy, “Raman spectroscopy for in-line water
quality monitoring - instrumentation and potential,” Sensors, vol. 14, no. 9, pp. 17275–1730, Sep.
2014.
[317] Z. Li and M. J. Deen, “Towards a portable Raman spectrometer using a concave grating and a time-
gated CMOS SPAD,” Opt. Express, vol. 22, no. 15, p. 18736, Jul. 2014.
[318] Z. Li, M. J. Deen, Q. Fang, and P. R. Selvaganapathy, “Design of a flat field concave-grating-based
micro-Raman spectrometer for environmental applications,” Appl. Opt., vol. 51, no. 28, p. 6855,
Oct. 2012.
[319] M. Khalil, S. Wang, J. Yu, R. L. Lee, and N. Liu, “Electrodeposition of iridium oxide nanoparticles
for pH sensing electrodes,” J. Electrochem. Soc., vol. 163, no. 9, pp. B485–B490, Jun. 2016.
[320] J. Yang, T. J. Kwak, X. Zhang, R. McClain, W.-J. Chang, and S. Gunasekaran, “Digital pH test
strips for in-field pH monitoring using iridium oxide-reduced graphene oxide hybrid thin films,”
ACS Sensors, vol. 1, no. 10, pp. 1235–1243, Oct. 2016.
[321] T. Alizadeh and F. Jamshidi, “Synthesis of nanosized sulfate-modified α-Fe2O3 and its use for the
fabrication of all-solid-state carbon paste pH sensor,” J. Solid State Electrochem., vol. 19, no. 4, pp.
1053–1062, Apr. 2015.
[322] K. Xu, X. Zhang, K. Hou, M. Geng, and L. Zhao, “The effects of antimony thin film thickness on
antimony pH electrode coated with Nafion membrane,” J. Electrochem. Soc., vol. 163, no. 8, pp.
B417–B421, May 2016.
[323] T. Hashimoto, M. Miwa, H. Nasu, A. Ishihara, and Y. Nishio, “pH Sensors using 3D-block metal
oxide-coated stainless steel electrodes,” Electrochim. Acta, vol. 220, pp. 699–704, Dec. 2016.

Ph.D. Thesis - Y. Qin McMaster University - Electrical and Computer Engineering
190
[324] P. Salazar, F. J. Garcia-Garcia, F. Yubero, J. Gil-Rostra, and A. R. González-Elipe,
“Characterization and application of a new pH sensor based on magnetron sputtered porous WO3
thin films deposited at oblique angles,” Electrochim. Acta, vol. 193, pp. 24–31, Mar. 2016.
[325] N. C. S. Vieira, W. Avansi, A. Figueiredo, V. R. Mastelaro, and V. Zucolotto, “Potentiometric
detection of chemical species by spin-assisted assembly of vanadium pentoxide nanorods,” Sensor.
Actuat. B Chem., vol. 229, pp. 461–465, Jun. 2016.
[326] W. Lonsdale, D. K. Maurya, M. Wajrak, and K. Alameh, “Effect of ordered mesoporous carbon
contact layer on the sensing performance of sputtered RuO2 thin film pH sensor,” Talanta, vol. 164,
pp. 52–56, Mar. 2017.
[327] M. Liu, Y. Ma, L. Su, K.-C. Chou, and X. Hou, “A titanium nitride nanotube array for
potentiometric sensing of pH,” Analyst, vol. 141, no. 5, pp. 1693–1699, 2016.
[328] D. Sharp, “Printed composite electrodes for in-situ wound pH monitoring,” Biosens. Bioelectron.,
vol. 50, pp. 399–405, Dec. 2013.
[329] E. L. Silva, A. C. Bastos, M. A. Neto, R. F. Silva, M. G. S. Ferreira, M. L. Zheludkevich, and F. J.
Oliveira, “Novel diamond microelectrode for pH sensing,” Electrochem. commun., vol. 40, pp. 31–
34, Mar. 2014.
[330] A. Määttänen, U. Vanamo, P. Ihalainen, P. Pulkkinen, H. Tenhu, J. Bobacka, and J. Peltonen, “A
low-cost paper-based inkjet-printed platform for electrochemical analyses,” Sensor. Actuat. B
Chem., vol. 177, pp. 153–162, Feb. 2013.
[331] J. H. Yoon, S. B. Hong, S.-O. Yun, S. J. Lee, T. J. Lee, K. G. Lee, and B. G. Choi, “High
performance flexible pH sensor based on polyaniline nanopillar array electrode,” J. Colloid
Interface Sci., vol. 490, pp. 53–58, Mar. 2017.
[332] M. Kaempgen and S. Roth, “Transparent and flexible carbon nanotube/polyaniline pH sensors,” J.
Electroanal. Chem., vol. 586, no. 1, pp. 72–76, Jan. 2006.
[333] P. C. Pandey and G. Singh, “Tetraphenylborate doped polyaniline based novel pH sensor and solid-
state urea biosensor,” Talanta, vol. 55, no. 4, pp. 773–782, Oct. 2001.
[334] Q. Li, H. Li, J. Zhang, and Z. Xu, “A novel pH potentiometric sensor based on electrochemically
synthesized polybisphenol A films at an ITO electrode,” Sensor. Actuat. B Chem., vol. 155, no. 2,
pp. 730–736, Jul. 2011.
[335] H. Xu, Y. Pan, Y. Wang, G. Li, Y. Chen, and Y. Ye, “An all-solid-state screen-printed carbon paste
reference electrode based on poly(3,4-ethylenedioxythiophene) as solid contact transducer,” Meas.
Sci. Technol., vol. 23, no. 12, p. 125101, Dec. 2012.
[336] J. Hao, T. Xiao, F. Wu, P. Yu, and L. Mao, “High antifouling property of ion-selective membrane:
Toward in vivo monitoring of pH change in live brain of rats with membrane-coated carbon fiber
electrodes,” Anal. Chem., vol. 88, no. 22, pp. 11238–11243, Nov. 2016.
[337] B. Shapira, E. Avraham, and D. Aurbach, “Proton-selective electrode for pH sensing,”
Electrochem. commun., vol. 73, pp. 80–84, Dec. 2016.
[338] M. Amiri, E. Amali, A. Nematollahzadeh, and H. Salehniya, “Poly-dopamine films: Voltammetric
sensor for pH monitoring,” Sensor. Actuat. B Chem., vol. 228, pp. 53–58, Jun. 2016.
[339] J. Zhou, L. Zhang, and Y. Tian, “Micro electrochemical pH sensor applicable for real-time
ratiometric monitoring of pH values in rat brains,” Anal. Chem., vol. 88, no. 4, pp. 2113–2118, Feb.
2016.
[340] F. Zhao, L. Zhang, A. Zhu, G. Shi, and Y. Tian, “In vivo monitoring of local pH values in a live rat
brain based on the design of a specific electroactive molecule for H+,” Chem. Commun., vol. 52,
no. 18, pp. 3717–3720, 2016.
[341] M.-B. Gholivand and A. Akbari, “A novel voltammetric sensor for citalopram based on multiwall
carbon nanotube/(poly(p-aminobenzene sulfonic acid)/β-cyclodextrin),” Mater. Sci. Eng. C, vol. 62,
pp. 480–488, May 2016.
[342] W. Su, J. Xu, and X. Ding, “An electrochemical pH sensor based on the amino-functionalized
graphene and polyaniline composite film,” IEEE Trans. Nanobioscience, pp. 1–1, 2016.

Ph.D. Thesis - Y. Qin McMaster University - Electrical and Computer Engineering
191
[343] P. Kumar, S. Maikap, J.-T. Qiu, S. Jana, A. Roy, K. Singh, H.-M. Cheng, M.-T. Chang, R.
Mahapatra, H.-C. Chiu, and J.-R. Yang, “Detection of pH and enzyme-free H2O2 sensing
mechanism by using GdOx membrane in electrolyte-insulator-semiconductor structure,” Nanoscale
Res. Lett., vol. 11, no. 1, p. 434, Dec. 2016.
[344] T.-M. Pan, C.-W. Wang, C.-Y. Chen, and J.-L. Her, “Impact of yttrium content and thermal
annealing on the structural and sensing characteristics of YbYxOy sensing membranes,” J. Appl.
Phys., vol. 119, no. 7, p. 74503, 2016.
[345] T.-M. Pan and C.-Y. Tan, “Influence of praseodymium content and postdeposition annealing on the
structural and sensing characteristics of PrTixOy sensing films using the sol–gel spin-coating
method,” J. Mater. Chem. C, vol. 4, pp. 7436–7442, 2016.
[346] C.-M. Yang, T.-W. Chiang, Y.-T. Yeh, A. Das, Y.-T. Lin, and T.-C. Chen, “Sensing and pH-
imaging properties of niobium oxide prepared by rapid thermal annealing for electrolyte–insulator–
semiconductor structure and light-addressable potentiometric sensor,” Sensor. Actuat. B Chem., vol.
207, pp. 858–864, Feb. 2015.
[347] N. Hong, C. Park, D. Kim, K.-S. Jeong, J.-S. Yoon, B. Jin, M. Meyyappan, and J.-S. Lee, “Buffer
effects of two functional groups against pH variation at aminosilanized electrolyte-oxide-
semiconductor (EOS) capacitor,” Sensor. Actuat. B Chem., vol. 242, pp. 324–331, Apr. 2017.
[348] L. Wang, Y. Bu, and J.-P. Ao, “Effect of oxygen plasma treatment on the performance of
AlGaN/GaN ion-sensitive field-effect transistors,” Diam. Relat. Mater., vol. 73, pp. 1–6, Mar. 2017.
[349] H.-Y. Liu, W.-C. Hsu, W.-F. Chen, C.-W. Lin, Y.-Y. Li, C.-S. Lee, W.-C. Sun, S.-Y. Wei, and S.-
M. Yu, “Investigation of AlGaN/GaN ion-sensitive heterostructure field-effect transistors-based pH
sensors with Al2O3 surface passivation and sensing membrane,” IEEE Sens. J., vol. 16, no. 10, pp.
3514–3522, May 2016.
[350] T.-H. Yoo, B.-I. Sang, B.-Y. Wang, D.-S. Lim, H. W. Kang, W. K. Choi, Y. T. Lee, Y.-J. Oh, and
D. K. Hwang, “Metal-oxide thin-film transistor-based pH sensor with a silver nanowire top gate
electrode,” J. Korean Phys. Soc., vol. 68, no. 7, pp. 901–907, Apr. 2016.
[351] C.-C. Chen, H.-I. Chen, H.-Y. Liu, P.-C. Chou, J.-K. Liou, and W.-C. Liu, “On a GaN-based ion
sensitive field-effect transistor (ISFET) with a hydrogen peroxide surface treatment,” Sensor.
Actuat. B Chem., vol. 209, pp. 658–663, Mar. 2015.
[352] S. Rigante, P. Scarbolo, M. Wipf, R. L. Stoop, K. Bedner, E. Buitrago, A. Bazigos, D. Bouvet, M.
Calame, C. Schönenberger, and A. M. Ionescu, “Sensing with advanced computing technology: Fin
field-effect transistors with high-k gate stack on bulk silicon,” ACS Nano, vol. 9, no. 5, pp. 4872–
4881, May 2015.
[353] S. K. Ameri, P. K. Singh, and S. R. Sonkusale, “Three dimensional graphene transistor for ultra-
sensitive pH sensing directly in biological media,” Anal. Chim. Acta, vol. 934, pp. 212–217, Aug.
2016.
[354] C.-H. Lu, T.-H. Hou, and T.-M. Pan, “Low-voltage InGaZnO ion-sensitive thin-film transistors
fabricated by low-temperature process,” IEEE Trans. Electron Devices, vol. 63, no. 12, pp. 5060–
5063, Dec. 2016.
[355] H. Yuan, J. Zhang, C. Cao, G. Zhang, and S. Zhang, “Novel H+ ion sensor based on a gated lateral
BJT pair,” Sensors, vol. 16, no. 1, p. 14, Dec. 2015.
[356] J.-K. Park, H.-J. Jang, J.-T. Park, and W.-J. Cho, “SOI dual-gate ISFET with variable oxide
capacitance and channel thickness,” Solid. State. Electron., vol. 97, pp. 2–7, Jul. 2014.
[357] N. Liu, Y. Hui Liu, P. Feng, L. Qiang Zhu, Y. Shi, and Q. Wan, “Enhancing the pH sensitivity by
laterally synergic modulation in dual-gate electric-double-layer transistors,” Appl. Phys. Lett., vol.
106, no. 7, p. 73507, Feb. 2015.
[358] E. Accastelli, P. Scarbolo, T. Ernst, P. Palestri, L. Selmi, and C. Guiducci, “Multi-wire tri-gate
silicon nanowires reaching milli-pH unit resolution in one micron square footprint,” Biosensors,
vol. 6, no. 1, p. 9, 2016.

Ph.D. Thesis - Y. Qin McMaster University - Electrical and Computer Engineering
192
[359] D. Rani, V. Pachauri, A. Mueller, X. T. Vu, T. C. Nguyen, and S. Ingebrandt, “On the use of
scalable nanoISFET arrays of silicon with highly reproducible sensor performance for biosensor
applications,” ACS Omega, vol. 1, no. 1, pp. 84–92, Jul. 2016.
[360] S. Kim, D. W. Kwon, R. Lee, D. H. Kim, and B.-G. Park, “Investigation of drift effect on silicon
nanowire field effect transistor based pH sensor,” Jpn. J. Appl. Phys., vol. 55, no. 6S1, p. 06GG01,
Jun. 2016.
[361] T. N. Lee, H. J. H. Chen, and K. C. Hsieh, “Study on sensing properties of ion-sensitive field-
effect-transistors fabricated with stack sensing membranes,” IEEE Electron Device Lett., vol. 37,
no. 12, pp. 1642–1645, Dec. 2016.
[362] K. Takechi, S. Iwamatsu, T. Yahagi, Y. Abe, S. Kobayashi, and H. Tanabe, “Bottom-gate
amorphous InGaZnO4 thin-film transistor pH sensors utilizing top-gate effects,” Jpn. J. Appl.
Phys., vol. 53, no. 7, p. 76702, Jul. 2014.
[363] T.-M. Pan, C.-H. Cheng, and C.-D. Lee, “Yb2O3 thin films as a sensing membrane for pH-ISFET
application,” J. Electrochem. Soc., vol. 156, no. 5, pp. J108–J111, 2009.
[364] T. Ji, P. Rai, S. Jung, and V. K. Varadan, “In vitro evaluation of flexible pH and potassium ion-
sensitive organic field effect transistor sensors,” Appl. Phys. Lett., vol. 92, no. 23, p. 233304, Jun.
2008.
[365] I.-K. Lee, K. H. Lee, S. Lee, and W.-J. Cho, “Microwave annealing effect for highly reliable
biosensor: Dual-gate ion-sensitive field-effect transistor using amorphous InGaZnO thin-film
transistor,” ACS Appl. Mater. Interfaces, vol. 6, no. 24, pp. 22680–22686, Dec. 2014.
[366] N. Al-Hardan, M. Abdul Hamid, N. Ahmed, A. Jalar, R. Shamsudin, N. Othman, L. Kar Keng, W.
Chiu, and H. Al-Rawi, “High sensitivity pH sensor based on porous silicon (PSi) extended gate
field-effect transistor,” Sensors, vol. 16, no. 6, p. 839, Jun. 2016.
[367] F. A. Sabah, N. M. Ahmed, Z. Hassan, M. A. Almessiere, and N. H. Al-Hardan, “Sensitivity of CuS
membrane pH sensor with and without MOSFET,” JOM, Nov. 2016.
[368] J.-L. Chiang, J.-F. Hsu, S.-F. Lee, L.-Y. Lee, and H.-Y. Liu, “Ion sensitivity of the flowerlike ZnO
nanorods synthesized by the hydrothermal process,” J. Vac. Sci. Technol. B Microelectron. Nanom.
Struct., vol. 27, no. 3, pp. 1462–1465, 2009.
[369] Y.-R. Li, S. Chang, C.-T. Chang, W.-L. Tsai, Y.-K. Chiu, P.-Y. Yang, and H.-C. Cheng, “High-
sensitivity extended-gate field-effect transistors as pH sensors with oxygen-modified reduced
graphene oxide films coated on different reverse-pyramid silicon structures as sensing heads,” Jpn.
J. Appl. Phys., vol. 55, no. 4S, p. 04EM08, Apr. 2016.
[370] H. J. N. P. D. Mello and M. Mulato, “Well-established materials in microelectronic devices systems
for differential-mode extended-gate field effect transistor chemical sensors,” Microelectron. Eng.,
vol. 160, pp. 73–80, Jul. 2016.
[371] A. Caboni, E. Orgiu, E. Scavetta, M. Barbaro, and A. Bonfiglio, “Organic-based sensor for
chemical detection in aqueous solution,” Appl. Phys. Lett., vol. 95, no. 12, p. 123304, Sep. 2009.
[372] L. Liu, J. Shao, X. Li, Q. Zhao, B. Nie, C. Xu, and H. Ding, “High performance flexible pH sensor
based on carboxyl-functionalized and DEP aligned SWNTs,” Appl. Surf. Sci., vol. 386, pp. 405–
411, Nov. 2016.
[373] D. Jung, M.-E. Han, and G. S. Lee, “pH-sensing characteristics of multi-walled carbon nanotube
sheet,” Mater. Lett., vol. 116, pp. 57–60, Feb. 2014.
[374] G. Scheiblin, R. Coppard, R. M. Owens, P. Mailley, and G. G. Malliaras, “Referenceless pH sensor
using organic electrochemical transistors,” Adv. Mater. Technol., p. 1600141, Nov. 2016.
[375] Y. Zhang, J. Clausmeyer, B. Babakinejad, A. López Córdoba, T. Ali, A. Shevchuk, Y. Takahashi,
P. Novak, C. Edwards, M. Lab, S. Gopal, C. Chiappini, U. Anand, L. Magnani, R. C. Coombes, J.
Gorelik, T. Matsue, W. Schuhmann, D. Klenerman, E. V. Sviderskaya, and Y. Korchev, “Spearhead
nanometric field-effect transistor sensors for single-cell analysis,” ACS Nano, vol. 10, no. 3, pp.
3214–3221, Mar. 2016.
Ph.D. Thesis - Y. Qin McMaster University - Electrical and Computer Engineering
193
[376] T. Ikuta, T. Oe, Y. Ohno, K. Maehashi, K. Inoue, and K. Matsumoto, “Graphene device array using
transfer-free patterned growth on insulator for an electrolyte-gated sensor,” Thin Solid Films, vol.
612, pp. 87–90, Aug. 2016.
[377] K. Melzer, V. D. Bhatt, E. Jaworska, R. Mittermeier, K. Maksymiuk, A. Michalska, and P. Lugli,
“Enzyme assays using sensor arrays based on ion-selective carbon nanotube field-effect
transistors,” Biosens. Bioelectron., vol. 84, pp. 7–14, Oct. 2016.
[378] C. Reiner-Rozman, M. Larisika, C. Nowak, and W. Knoll, “Graphene-based liquid-gated field
effect transistor for biosensing: Theory and experiments,” Biosens. Bioelectron., vol. 70, pp. 21–27,
Aug. 2015.
[379] Y. Shintani, S. Ibori, K. Igarashi, T. Naramura, M. Inaba, and H. Kawarada, “Polycrystalline boron-
doped diamond with an oxygen-terminated surface channel as an electrolyte-solution-gate field-
effect transistor for pH sensing,” Electrochim. Acta, vol. 212, pp. 10–15, Sep. 2016.
[380] E. Piccinini, C. Bliem, C. Reiner-Rozman, F. Battaglini, O. Azzaroni, and W. Knoll, “Enzyme-
polyelectrolyte multilayer assemblies on reduced graphene oxide field-effect transistors for
biosensing applications,” Biosens. Bioelectron., Oct. 2016.
[381] F. Buth, D. Kumar, M. Stutzmann, and J. A. Garrido, “Electrolyte-gated organic field-effect
transistors for sensing applications,” Appl. Phys. Lett., vol. 98, no. 15, p. 153302, Apr. 2011.
[382] M. Hajmirzaheydarali, M. Sadeghipari, M. Akbari, A. Shahsafi, and S. Mohajerzadeh, “Nano-
textured high sensitivity ion sensitive field effect transistors,” J. Appl. Phys., vol. 119, no. 5, p.
54303, Feb. 2016.
[383] L.-C. Yen, T.-M. Pan, C.-H. Lee, and T.-S. Chao, “Label-free and real-time detection of ferritin
using a horn-like polycrystalline-silicon nanowire field-effect transistor biosensor,” Sensor. Actuat.
B Chem., vol. 230, pp. 398–404, Jul. 2016.
[384] J. Seo, M. Song, J. Jeong, S. Nam, I. Heo, S.-Y. Park, I.-K. Kang, J.-H. Lee, H. Kim, and Y. Kim,
“Broadband pH-sensing organic transistors with polymeric sensing layers featuring liquid crystal
microdomains encapsulated by di-block copolymer chains,” ACS Appl. Mater. Interfaces, vol. 8, no.
36, pp. 23862–23867, Sep. 2016.
[385] H. Shekhar, V. Chathapuram, S. H. Hyun, S. Hong, and H. J. Cho, “A disposable microsensor for
continuous monitoring of free chlorine in water,” in Sensors, 2003. Proceedings of IEEE, 2003, vol.
1, pp. 67–70.
[386] D. R. Kumar, S. Kesavan, T. T. Nguyen, J. Hwang, C. Lamiel, and J.-J. Shim,
“Polydopamine@electrochemically reduced graphene oxide-modified electrode for electrochemical
detection of free-chlorine,” Sensor. Actuat. B Chem., vol. 240, pp. 818–828, Mar. 2017.
[387] M. Jović, F. Cortés-Salazar, A. Lesch, V. Amstutz, H. Bi, and H. H. Girault, “Electrochemical
detection of free chlorine at inkjet printed silver electrodes,” J. Electroanal. Chem., vol. 756, pp.
171–178, Nov. 2015.

Ph.D. Thesis - Y. Qin McMaster University - Electrical and Computer Engineering
194
Appendix A
Comparison table of microfabricated
electrochemical pH sensors
Table A-1. Summary of microfabricated electrochemical pH sensors.
Structure Sensing material
Operation
voltage, V
Detection
range, pH Sensitivity
Response
time, s Stability
Fabrication of sensing
materials Ref.
Potentiometric CuO - 2-11 28 mV/pH 25 Drift=150 mV/h Hydrothermal deposition [75]
IrOx - 2-10 74 mV/pH <100 Sensitivity drops to
65 mV/pH in 14
days
Electrochemical deposition
of IrOx in anodized Al2O3
[72]
IrOx - 2.38-
11.61
69 mV/pH <2 Potential
variation<10 mV
Electrochemical deposition,
annealing at >300 °C
[70]
IrOx - 4-9 70 mV/pH - - Electrochemical deposition [71]
IrOx - 2-12 73 mV/pH - - Electrochemical deposition [319]
IrO2 - 1.56-12 74 mV/pH - Stable>7 days Electrochemical deposition [179]
IrO2 - 1-13 59 mV/pH <1 Drift<0.1 mV/day Thermal oxidation at
870 °C
[69]
IrO2+PMMA - 3-11 60 mV/pH <2 Stable>1 month Hydrolysis of (NH4)2IrCl6
for IrO2, thermal molding
with PMMA at 150 °C
[74]
IrO2+reduced
graphene oxide
- 2-12 62 mV/pH <120 Hysteresis=8.2 mV,
sensitivity drops to
52 mV/pH in 2
weeks
Electrochemical deposition
of IrO2, electrochemical
reduction/deposition of
reduced graphene oxide
[320]
Ta2O5-IrO2 bilayer - 2-13 60 mV/pH 15 Drift<0.1 mV/h RF sputtering [73]
S-modified-α-
Fe2O3
- 1.5-12.5 59 mV/pH 10 Stable<1 week Hydrothermal synthesis,
annealing at 600 °C
[321]
Sb - 4-9.2 63 mV/pH <22 Voltage variation
<2 mV in 10 min,
stable for 28 days
Sputtering of Sb, drop
casting of Nafion on Sb
[322]
Co3O4 - 3-13 58 mV/pH 53 Stable for 3 days Hydrothermal deposition,
annealing at 450 °C
[76]
Co3O4 - 4-9 59 mV/pH 9 - Sol-gel dip coating,
annealing at 500 °C
[323]
WO3 - 5-9 57 mV/pH 25 11.6% sensitivity
drop in 3 tests
Hydrothermal deposition [77]
WO3 - 2-12 55 mV/pH - Drift=6 mV/h;
hysteresis=50 mV
RF sputtering and O2
plasma oxidation
[167]
WO3 - 1-12 59 mV/pH 100 Drift=2.5 mV/h;
hysteresis<10.5
mV; stable>3
month
Reactive sputtering of WO3
at oblique angles on Au
[324]
V2O5+
poly(allylamine
hydrochloride)
- 2-12 61 mV/pH - Drift=13 mV/min;
stable for 5 days
Hydrothermal synthesis of
V2O5 at 200 °C, spin
coating of poly(allylamine
hydrochloride) and V2O5
solutions
[325]
RuO2 - 4-10 69 mV/pH 10 Potential
variation=9 mV
RF sputtering [78]
RuO2 - 4-10 58 mV/pH 30 Drift=5 mV/h;
hysteresis=1.1 mV
RF sputtering [326]

Ph.D. Thesis - Y. Qin McMaster University - Electrical and Computer Engineering
195
Structure Sensing material
Operation
voltage, V
Detection
range, pH Sensitivity
Response
time, s Stability
Fabrication of sensing
materials Ref.
TiO2 - 2-12 59 mV/pH <30 - Anodization, annealing at
450 °C
[168]
TiN - 2-11 55 mV/pH 4.4 Stable for 200 s Ti anodization, annealing at
450 °C, reduction and
nitridation at 900 °C
[327]
PdO - 2-12 65 mV/pH <18 Hysteresis=7.8
mV; stable>60
days
Spin coating, annealing at
200 °C
[80]
PdO - 4-10 57 mV/pH 6 Drift=0.6 mV/h;
hysteresis=5.3 mV;
stable>70 days
Inkjet printing, annealing at
200 °C
[81]
ZnO - 4-11 52 mV/pH - - Hydrothermal deposition [169]
PbOx - 0.25-13 84 mV/pH - - Electrochemical
deposition/oxidation
[79]
Uric acid
composite
- 4-10 73 mV/pH - - Electrochemical deposition [328]
Diamond - 2-12 51 mV/pH <1 - Hot filament CVD [329]
PANI - 2-9 62 mV/pH - - Electropolymerisation [84]
PANI - 3-7 54 mV/pH <25 Stable for 30 min Electropolymerisation [87]
PANI - 2.69-8.51 59 mV/pH <20 Stable>35 days Electropolymerisation [86]
PANI - 2-10 71 mV/pH - Stable for 5 weeks Electropolymerisation [330]
PANI - 3-8 63 mV/pH 20 Drift=0.07 mV/h;
hysteresis: 1%
deviation in 2 tests
Electropolymerisation [308]
PANI - 2-12 60 mV/pH <1 Drift=0.49 mV/h;
hysteresis=9.2 mV
Soft lithography,
electropolymerisation
[331]
PANI+CNT - 1-13 58 mV/pH <40 Drift=2-10 mV/h Spray of CNT suspension,
electrochemical deposition
of PANI
[332]
PANI doped with
tetraphenylborate
- 3-9 86 mV/pH - - Electropolymerisation [333]
Parylene C - 4-10 16 mV/pH - Drift=3-20 mV/h CVD + O2 plasma etching [89]
PEI - 2-11 46 mV/pH 15 Sensitivity drops at
0.65 mV/pH/day
Electropolymerisation [85]
Polybisphenol A - -1-15 57 mV/pH <20 Stable>12 days Electropolymerisation [334]
PEDOT:PSS - 5.9-8.7 52 mV/pH 15 3.2 mV/pH
sensitivity variation
in 50 days
Electropolymerisation [335]
PPY - 2-11 51 mV/pH 120 Stable for 30 days Electropolymerisation [83]
PPY:hydroquinone
monosulfonate
- 2-12 51 mV/pH <100 Stable for 30 days Electropolymerisation [88]
PVC:H+ ionophore
tridodecylamine,
on carbon fiber
- 6-8 58 mV/pH <1 - Dip coating [336]
CNT - 3-11 60 mV/pH <30 - CNT deposited from
solution
[90]
SWCNT-COOH - 3-11 48 mV/pH 7 Hysteresis=7.8
mV; stable>14
days
Inkjet printing, annealing at
160 °C
[91]
Porous carbon - 1.68-10 57 mV/pH - - Pyrolysis of filter paper at
600 °C, chemical activation
in 70% nitric acid
[337]
Voltammetric Polydopamine 1.2 1-12 58 mV/pH - - Electropolymerisation [338]
1,2-
naphthoquinone
1 5.8-8 58 mV/pH - Stable for 1000
voltage cycles
Self-assembly [339]
N-(6-
aminopyridin-2-
yl)ferrocene
0.6 5.9-8 50 mV/pH - Stable for 7 days Electrochemical deposition
of Au, surface modification
[340]
MWCNT/poly(p-
aminobenzene
sulfonic acid)/β-
cyclodextrin
1.1 7.4-11 68 mV/pH - - Drop casting of MWCNT,
electrochemical polymer
deposition
[341]

Ph.D. Thesis - Y. Qin McMaster University - Electrical and Computer Engineering
196
Structure Sensing material
Operation
voltage, V
Detection
range, pH Sensitivity
Response
time, s Stability
Fabrication of sensing
materials Ref.
NH2-
graphene/PANI
1.5 1-11 51 mV/pH - Sensitivity drops to
80% in 2 weeks
Electropolymerisation [342]
EIS Er2TiO5 3 2-12 57 mV/pH - Drift=0.29 mV/h Reactive sputtering, RTA
at 900 °C
[104]
Gd2O3 2 2-10 55 mV/pH - Sensitivity drops
by 0.65 mV/pH in
12 h
Reactive sputtering, RTA
at 800 °C
[103]
Gd2O3 2 2-10 54 mV/pH - Drift=2.12 mV/h E-beam evaporation [343]
Gd2Ti2O7 3 2-12 58 mV/pH - Drift=0.38 mV/h Reactive sputtering, RTA
at 900 °C
[104]
Lu2Ti2O7 3 2-12 59 mV/pH - Drift=0.55 mV/h Reactive sputtering, RTA
at 900 °C
[104]
YbYxOy 1.5 2-12 63 mV/pH - Drift=0.14 mV/h;
hysteresis=1 mV
Co-sputtering in O2, RTA
at 800 °C
[344]
PrTixOy 2 2-12 68 mV/pH - Drift=0.25 mV/h;
hysteresis=1 mV
Sol-gel spin coating, RTA
at 800 °C
[345]
Ta2O5 - 1-10 56 mV/pH 60 Drift=5 mV/h Thermal oxidation at
525 °C
[100]
Ta2O5 1.6 3-12 53 mV/pH - - ALD [311]
TiO2 - 3-11 62 mV/pH - Drift=0.9 mV/day MOCVD, annealing at 700
to 900 °C
[98]
Nb2O5 2.5 2-12 60 mV/pH - Drift=3 mV/h RF sputtering, RTA at
700 °C
[346]
3-APTES on SiO2
1.15 2-11 56 mV/pH - - Thermally grown of SiO2,
surface treatment using
APTES and O2 plasma
[347]
ISFET InAs 0.9 4.7-7.8 48 mV/pH - - Molecular beam epitaxy [106]
AlGaN 4 4-9 56 mV/pH - - CVD, annealing at 850 °C,
O2 plasma treatment
[348]
AlGaN/GaN 10 4-9 52 mV/pH - - Dry etching, annealing at
850 °C
[105]
Al2O3 4 2-12 56 mV/pH 3-7 Drift=1.25 mV/h;
hysteresis=4.3 mV;
sensitivity drops at
0.12 mV/pH/day
Ultrasonic spray pyrolysis
deposition
[349]
Al2O3 2 3-11 69 mV/pH 20 - ALD [350]
GaxOy 1.5 2-12 55 mV/pH - Drift=1.41 μA/h;
hysteresis=0.4 mV;
sensitivity drops at
0.14 mV/pH/day
MOCVD, RTA at 900 °C,
H2O2 surface treatment
[351]
HfO2 8 3-10 57 mV/pH 120 Drift=0.1 mV/h;
hysteresis=8 mV
E-beam lithography,
thermal SiO2 growth, ALD
of HfO2
[352]
HfO2 1 3-9 71 mV/pH - - ALD [353]
HfO2 1 3-11 61 mV/pH 60 Drift=2.5 mV/h;
hysteresis=8 mV
ALD [354]
Si3N4 8 4-10 175
nA/pH
- - Standard CMOS process [355]
SiO2 6 3-12 363
mV/pH
- Drift=3 mV/h;
hysteresis=13 mV
RF sputtering, RTA at
450 °C
[356]
SiO2 3 4-10 168
mV/pH
- PECVD [357]
SiO2 1.5 3-8 30 mV/pH 40 - Standard CMOS process [358]
SiO2 1 5-9 43 mV/pH - - Nanoimprinting, dry
etching, ion implantation,
annealing at 810 °C, gas-
phase silanization
[359]
3-APTES on SiO2 2 5-9 54 mV/pH 250 - Standard CMOS process [360]
3-APTES on SiO2 3 4-10 51 mV/pH 60 Drift=1.83 mV/h;
hysteresis=4 mV
Thermal oxidation of Si at
925 °C, O2 plasma
treatment, RTA at 1000 °C,
self-assembly of APTES
[361]

Ph.D. Thesis - Y. Qin McMaster University - Electrical and Computer Engineering
197
Structure Sensing material
Operation
voltage, V
Detection
range, pH Sensitivity
Response
time, s Stability
Fabrication of sensing
materials Ref.
TiO2 4 1-13 57 mV/pH - - RF sputtering, annealing at
500 °C
[97]
Ta2O5 1.2 3-8 55 mV/pH - Drift=1 mV/week ALD [109]
Ta2O5 12 3-8 120
mV/pH
- - RF sputtering, annealing at
300 °C
[362]
Yb2O3 2 2-12 56 mV/pH 60 Drift=1.54 mV/h Reactive sputtering, RTA
at 800 °C
[363]
ZnO 3 2-12 42mV/pH - Drift=1.78 mV/h RF sputtering, annealing
at >600 °C
[125]
Graphene+Al2O3 60 3-10 37 mV/pH 200 Drift=6.34 mV/h Rapid thermal CVD of
graphene at 950 °C, low
temperature transferring;
spin coating of Al2O3,
annealing at 250 °C
[108]
P3HT+valinomyci
n membrane
1 3.4-5.6 3 nA/pH 360 - P3HT spin coating,
valinomycin membrane
deposited by Langmuir-
Blodgett technique
[113]
P3HT+Ta2O5
+valinomycin
membrane
5 6.6-9.5 71 nA/pH - - RF sputtering of Ta2O5,
drop casting of
valinomycin membrane,
P3HT spin coating
[364]
P3HT+arachidic
acid
1 3.3-5.5 4 nA/pH 100 - Spin coating of P3HT,
arachidic acid deposited by
Langmuir-Blodgett
technique
[112]
P3HT+hydrogen
ionophore
0.6 3-12 25-52
mV/pH
- Stable for 30 s Drop casting [111]
Pentacene 100 4-10 30 nA/pH >2000 - Vacuum sublimation. [110]
Pentacene/PTAA+
Al2O3
4 2-12 5 nA/pH 30 Stable>5000 cycles Pentacene spin coating,
ALD of Al2O3
[115]
PTAA+ poly(isobutyl
methacrylate)
+Teflon
40 2-10 60 mV/pH - - PTAA spin coating, Teflon
spin coating
[114]
ExGFET Nb2O5 6 2-12 52 mV/pH 75 Drift=3.34 mV/h RF sputtering, CF4 plasma
treatment, RTA at 600 °C
[125]
TiO2:Ru 6 1-13 55 mV/pH - Drift=0.745 mV/h RF sputtering of TiO2,
sputtering of Ru, annealing
at 600 °C
[118]
TiO2 6 1-11 59 mV/pH 40 Drift=1.97 mV/h Sol-gel spin coating,
annealing at 600 °C
[120]
TiO2 5 2-12 50 mV/pH - - Hydrothermal deposition [123]
TiO2 5 2-12 62 mV/pH - - Hydrothermal deposition [122]
TiO2 10 1-11 61 mV/pH - Drift=9-60 mV/h Sol-gel spin coating,
annealing < 500 °C
[119]
TiO2-PPI bilayer - 4-10 57 mV/pH - - Layer-by-layer deposition
of PPI and TiO2 from
solution
[121]
In2O3-CNT bilayer 3 2-12 36 mV/pH - - Sputtering of indium, spray
coating of CNTs, annealing
at 400 °C
[129]
SnO2 40 3-10 287
mV/pH
- Drift=48.77 mV/h RF sputtering, microwave
annealing at 1000 W
(~87 °C)
[365]
SnO2:F 5 2-12 50 mV/pH - - Vacuum deposition [127]
Si 3 2-12 66 mV/pH - Hysteresis<11 mV Si anodization [366]
CuS 3 2-12 24 mV/pH <10 Hysteresis<13 mV Spray pyrolysis [367]
PdO 2 2-12 63 mV/pH - Drift=2.3 mV/h;
hysteresis=7.9 mV;
stable for 6 tests
Reactive e-beam
evaporation, annealing at
700 °C
[126]
ZnO 6 2-12 38 mV/pH - - Sol-gel brushing, annealing
at 150 °C
[95]

Ph.D. Thesis - Y. Qin McMaster University - Electrical and Computer Engineering
198
Structure Sensing material
Operation
voltage, V
Detection
range, pH Sensitivity
Response
time, s Stability
Fabrication of sensing
materials Ref.
ZnO 10 1-9 59 mV/pH - - Hydrothermal deposition [117]
ZnO 6 5-9 18 mV/pH - - Hydrothermal deposition [368]
ZnO 4 1-13 46 mV/pH 300 - ALD [124]
CNT+Ni 3 2-10 59 mV/pH 9 - Electrodeposition [130]
Reduced graphene
oxide
4 1-13 58 mV/pH <5 Drift=10.5 mV/min Spray coating, annealing in
N2 at 300 °C, O2 plasma
treatment
[369]
PANI - 2-8 37 mV/pH 20 Drift=40 mV/h;
hysteresis=5.3 mV
Electrodeposition [370]
Pentacene 100 2.5-7 5 V/pH - - Vacuum sublimation [371]
Parylene C 1.5 4-10 23 mV/pH <5 Drift=18 mV/h CVD, O2 plasma treatment [131]
Chemoresistor Pd 2 4-10 5% /pH 100 - DC sputtering [134]
TiO2 1 2-12 6 nS/pH - Stable>60 s Electrospinning and
hydrothermal deposition
[133]
Graphene 3 4-10 2000
Ω/pH
20 - Mechanical exfoliation of
bulk graphite, annealing at
200 °C
[132]
CNT - 5-9 65 Ω/pH - - Vacuum filtration of
aqueous solution
[135]
SWCNT-COOH 0.2 5-9 28.5% /pH <23 - Drop casting,
dielectrophoresis
[372]
CNT+Ni - 2-10 1% / pH - Stable>1 day CNT: LPCVD at 780 °C;
Ni: electrodeposition
[373]
ECT IrO2 1 5-7.3 21 mV/pH - - Electrochemical deposition [374]
P3HT 2 4-10 10 nA/pH - Stable for 12 h Spin coating [140]
PPY 0.6 2.4-7.5 51 mV/pH - - Laser pulling with
nanopipettes,
electropolymerisation
[375]
PEDOT:PSS 0.4 - 64 mV/pH 10 - Spin coating, annealing at
200 °C
[141]
Graphene 0.15 4-8.6 20 mV/pH - Large drift E-beam evaporation,
annealing at 850 °C in Ar
[376]
CNT+PAA 1 2-12 73 mS/pH - Stable>120 days Electropolymerisation [58]
EGFET ZnO+Pd/Au 2 7-9 - - - Hydrothermal deposition [145]
CNT 0.6 3-8 27 mV/pH 40 - Spin coating [148]
CNT with PVC
membrane
0.8 4.5-10.5 83 mV/pH - - Spray coating of CNT,
drop casting of PVC
[377]
Graphene 2 2-12 100
mV/pH
- - High temperature growth
(1100 °C)
[149]
Graphene 0.4 4.3-9.4 22 mV/pH - - CVD at 1000 °C, low
temperature transferring,
anneal at 500 °C
[147]
Reduced graphene
oxide
0.7 4-8 34 mV/pH - - Graphene oxide prepared
from Hummers method,
spin coating, reducing with
hydrazine at 70 °C
[378]
Reduced graphene
oxide
1.6 6-9 29 mV/pH - - Self-assembly and
reduction of graphene
oxide, annealing at 200 °C
[146]
Boron-doped
diamond
0.6 2-12 31 mV/pH - 10% sensitivity
variation in 10
months
CVD at 850 °C, annealing
at 450 °C, UV treatment
[379]
P3HT 0.6 3-8 28 mV/pH 20 - Spin coating [148]
Polyethylenimine 0.5 5-10 23 mV/pH 150 - Layer-by-layer assembly [380]
α6T 0.8 2-7 - - Drift by 10% in 3 h Thermal evaporation [381]
FET Si 0.8 4-10 68 mV/pH - Drift=27 mV/h Deep-UV lithography,
chemical-mechanical
polishing, annealing at
1000 °C, wet etching
[155]
Poly Si (native
oxide)
5 4-10 410
mV/pH
- - LPCVD of poly Si,
phosphorous diffusion at
850 °C, DRIE
[382]

Ph.D. Thesis - Y. Qin McMaster University - Electrical and Computer Engineering
199
Structure Sensing material
Operation
voltage, V
Detection
range, pH Sensitivity
Response
time, s Stability
Fabrication of sensing
materials Ref.
TEOS-Si3N4-TEOS 15 4-10 113
mV/pH
- - LPCVD [383]
4-cyano-4’-pentyl-
biphenyl/[poly(4-
cyano-biphenyl-4-
oxyundecylacrylate
)-PAA
0.5 2-7 40 nA/pH - - Spin coating [384]
DDFTTF 2 3-11 50 nA/pH 90 Stable>104 tests Thermal evaporation [156]

Ph.D. Thesis - Y. Qin McMaster University - Electrical and Computer Engineering
200
Appendix B
Comparison table of microfabricated
electrochemical free chlorine sensors
Table A-2. Summary of microfabricated electrochemical free chlorine sensors. Sensor
configuration Sensor material
Sensing range,
ppm Sensitivity
Response
time, s Stability Reusability Fabrication Ref.
Amperometric Au 0.08-0.4 13.7 μA/cm2
/ppm
- >7 days - Photolithography,
evaporation, lift-off
[35]
Au 1.5-8 69.2 μA/cm2
/ppm
20 - - Photolithography,
evaporation,
electrochemical
deposition, etching
[385]
Au 0.2-5 14.2 μA/cm2
/ppm
120 >10 days >6 times Photolithography,
evaporation, lift-off
[159]
Pt 0.1-1.5 8.0 μA
/ppm a
- >5 h - Photolithography,
sputtering, lift-off
[160]
Pt 4-400 - - - - Mechanical polishing,
electrochemical
activation
[34]
Potassium iodide 0-20 2.1 μA/cm2
/ppm
30 - - Screen printing,
solution dispensing
[161]
Polymelamine 0.4-521 4.0 μA/cm2
/ppm
- >7 days - Electro-polymerization [16]
Boron-doped
diamond
0.1-100 0.74 μA/cm2
/ppm
- >90 days >20 times Microwave plasma-
assisted CVD,
anodization
[162]
Benzethonium
chloride modified
Prussian Blue
0.009-10 12.3 μA/cm2
/ppm
< 5 >3 weeks >15 times Electrochemical
deposition
[163],
[301]
CuO NP
/MWCNT
0.0006-0.008 16.1 μA/cm2
/ppm
30 >7 days - Drop casting,
mechanical polishing
[165]
Ammonium
carbamate
modified graphite
1-6 0.3 μA/cm2
/ppm
<3 >7 weeks - Electrochemical
deposition
[313]
Ammonium
carbamate
modified graphite
1-8 1.04 μA/cm2
/ppm
30 >50 days - Electrochemical
deposition
[298]
Polydopamine on
reduced graphene
oxide
0.52-11.3 1.91 μA/cm2
/ppm
30 - 28 times Electrochemical
reduction,
electropolymerization
[386]
Linear sweep
voltammetry
Ag 1-100 125 μA/cm2
/ppm
200 - 3 times Inkjet printing,
sintering
[387]
Chemoresistor Phenyl capped
aniline tetramer
modified SWCNT
0.06-60 91.5
nA/decade
<300 >30 h >3 times Photolithography,
evaporation, etching,
drop casting, chemical
modification
[302]
PEDOT:PSS 0.5-50 1.05/decade b 300 >30 days >9 times Hand drawing [17]
50-500 1.49/decade b 15 >5 times a Data for electrode surface area was not given. b The common logarithm of relative resistance changes.

Ph.D. Thesis - Y. Qin McMaster University - Electrical and Computer Engineering
201
Appendix C
Digital masks for integrated pH, free chlorine,
and temperature sensors
Figure A-1. Digital mask for the inkjet printing pattern of rough Pd/PdO films for temperature sensors (2 cm
in figure = 1 cm in real device).
Figure A-2. Digital mask for the inkjet printing pattern of smooth Pd/PdO films for pH sensors (2 cm in
figure = 1 cm in real device).

Ph.D. Thesis - Y. Qin McMaster University - Electrical and Computer Engineering
202
Figure A-3. Digital mask for the inkjet printing pattern of SU-8 films (2 cm in figure = 1 cm in real device).
Figure A-4. Digital mask for the inkjet printing pattern of Ag films (2 cm in figure = 1 cm in real device).
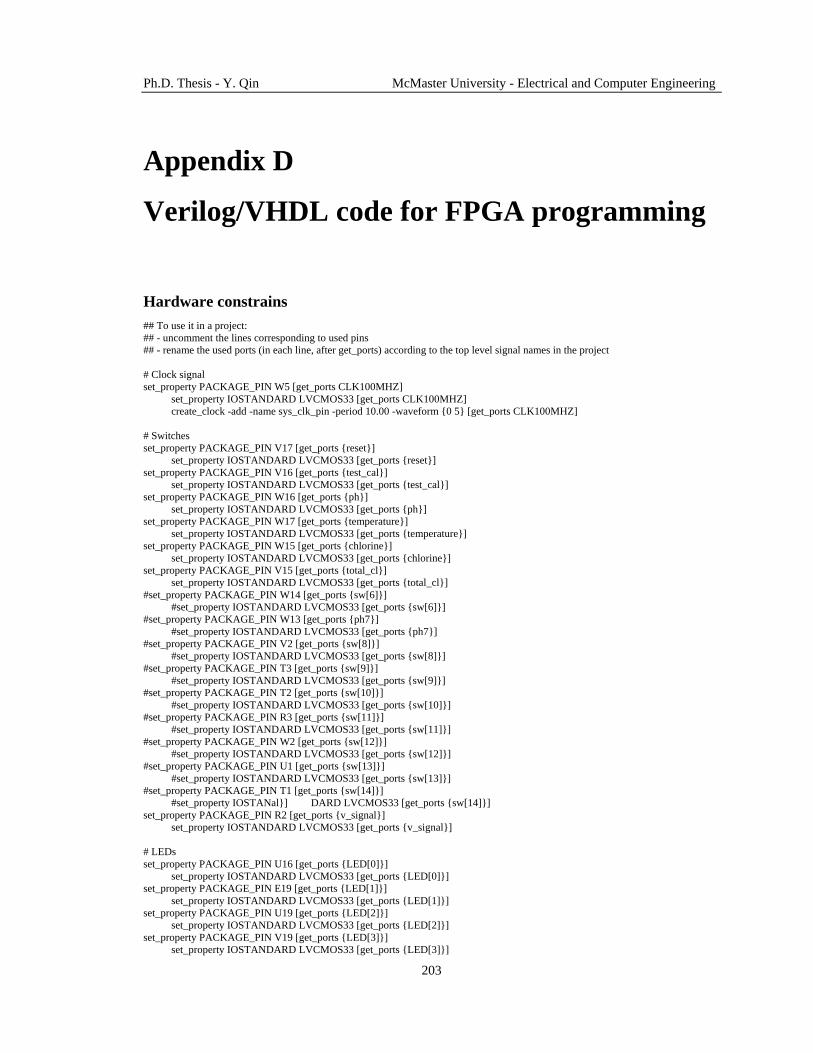
Ph.D. Thesis - Y. Qin McMaster University - Electrical and Computer Engineering
203
Appendix D
Verilog/VHDL code for FPGA programming
Hardware constrains
## To use it in a project:
## - uncomment the lines corresponding to used pins
## - rename the used ports (in each line, after get_ports) according to the top level signal names in the project
# Clock signal
set_property PACKAGE_PIN W5 [get_ports CLK100MHZ]
set_property IOSTANDARD LVCMOS33 [get_ports CLK100MHZ]
create_clock -add -name sys_clk_pin -period 10.00 -waveform 0 5 [get_ports CLK100MHZ]
# Switches
set_property PACKAGE_PIN V17 [get_ports reset]
set_property IOSTANDARD LVCMOS33 [get_ports reset]
set_property PACKAGE_PIN V16 [get_ports test_cal]
set_property IOSTANDARD LVCMOS33 [get_ports test_cal]
set_property PACKAGE_PIN W16 [get_ports ph]
set_property IOSTANDARD LVCMOS33 [get_ports ph]
set_property PACKAGE_PIN W17 [get_ports temperature]
set_property IOSTANDARD LVCMOS33 [get_ports temperature]
set_property PACKAGE_PIN W15 [get_ports chlorine]
set_property IOSTANDARD LVCMOS33 [get_ports chlorine]
set_property PACKAGE_PIN V15 [get_ports total_cl]
set_property IOSTANDARD LVCMOS33 [get_ports total_cl]
#set_property PACKAGE_PIN W14 [get_ports sw[6]]
#set_property IOSTANDARD LVCMOS33 [get_ports sw[6]]
#set_property PACKAGE_PIN W13 [get_ports ph7]
#set_property IOSTANDARD LVCMOS33 [get_ports ph7]
#set_property PACKAGE_PIN V2 [get_ports sw[8]]
#set_property IOSTANDARD LVCMOS33 [get_ports sw[8]]
#set_property PACKAGE_PIN T3 [get_ports sw[9]]
#set_property IOSTANDARD LVCMOS33 [get_ports sw[9]]
#set_property PACKAGE_PIN T2 [get_ports sw[10]]
#set_property IOSTANDARD LVCMOS33 [get_ports sw[10]]
#set_property PACKAGE_PIN R3 [get_ports sw[11]]
#set_property IOSTANDARD LVCMOS33 [get_ports sw[11]]
#set_property PACKAGE_PIN W2 [get_ports sw[12]]
#set_property IOSTANDARD LVCMOS33 [get_ports sw[12]]
#set_property PACKAGE_PIN U1 [get_ports sw[13]]
#set_property IOSTANDARD LVCMOS33 [get_ports sw[13]]
#set_property PACKAGE_PIN T1 [get_ports sw[14]]
#set_property IOSTANal] DARD LVCMOS33 [get_ports sw[14]]
set_property PACKAGE_PIN R2 [get_ports v_signal]
set_property IOSTANDARD LVCMOS33 [get_ports v_signal]
# LEDs
set_property PACKAGE_PIN U16 [get_ports LED[0]]
set_property IOSTANDARD LVCMOS33 [get_ports LED[0]]
set_property PACKAGE_PIN E19 [get_ports LED[1]]
set_property IOSTANDARD LVCMOS33 [get_ports LED[1]]
set_property PACKAGE_PIN U19 [get_ports LED[2]]
set_property IOSTANDARD LVCMOS33 [get_ports LED[2]]
set_property PACKAGE_PIN V19 [get_ports LED[3]]
set_property IOSTANDARD LVCMOS33 [get_ports LED[3]]

Ph.D. Thesis - Y. Qin McMaster University - Electrical and Computer Engineering
204
set_property PACKAGE_PIN W18 [get_ports LED[4]]
set_property IOSTANDARD LVCMOS33 [get_ports LED[4]]
set_property PACKAGE_PIN U15 [get_ports LED[5]]
set_property IOSTANDARD LVCMOS33 [get_ports LED[5]]
set_property PACKAGE_PIN U14 [get_ports LED[6]]
set_property IOSTANDARD LVCMOS33 [get_ports LED[6]]
set_property PACKAGE_PIN V14 [get_ports LED[7]]
set_property IOSTANDARD LVCMOS33 [get_ports LED[7]]
set_property PACKAGE_PIN V13 [get_ports LED[8]]
set_property IOSTANDARD LVCMOS33 [get_ports LED[8]]
set_property PACKAGE_PIN V3 [get_ports LED[9]]
set_property IOSTANDARD LVCMOS33 [get_ports LED[9]]
set_property PACKAGE_PIN W3 [get_ports LED[10]]
set_property IOSTANDARD LVCMOS33 [get_ports LED[10]]
set_property PACKAGE_PIN U3 [get_ports LED[11]]
set_property IOSTANDARD LVCMOS33 [get_ports LED[11]]
set_property PACKAGE_PIN P3 [get_ports LED[12]]
set_property IOSTANDARD LVCMOS33 [get_ports LED[12]]
set_property PACKAGE_PIN N3 [get_ports LED[13]]
set_property IOSTANDARD LVCMOS33 [get_ports LED[13]]
set_property PACKAGE_PIN P1 [get_ports LED[14]]
set_property IOSTANDARD LVCMOS33 [get_ports LED[14]]
set_property PACKAGE_PIN L1 [get_ports LED[15]]
set_property IOSTANDARD LVCMOS33 [get_ports LED[15]]
#7 segment display
set_property PACKAGE_PIN W7 [get_ports seg[0]]
set_property IOSTANDARD LVCMOS33 [get_ports seg[0]]
set_property PACKAGE_PIN W6 [get_ports seg[1]]
set_property IOSTANDARD LVCMOS33 [get_ports seg[1]]
set_property PACKAGE_PIN U8 [get_ports seg[2]]
set_property IOSTANDARD LVCMOS33 [get_ports seg[2]]
set_property PACKAGE_PIN V8 [get_ports seg[3]]
set_property IOSTANDARD LVCMOS33 [get_ports seg[3]]
set_property PACKAGE_PIN U5 [get_ports seg[4]]
set_property IOSTANDARD LVCMOS33 [get_ports seg[4]]
set_property PACKAGE_PIN V5 [get_ports seg[5]]
set_property IOSTANDARD LVCMOS33 [get_ports seg[5]]
set_property PACKAGE_PIN U7 [get_ports seg[6]]
set_property IOSTANDARD LVCMOS33 [get_ports seg[6]]
set_property PACKAGE_PIN V7 [get_ports dp]
set_property IOSTANDARD LVCMOS33 [get_ports dp]
set_property PACKAGE_PIN U2 [get_ports an[0]]
set_property IOSTANDARD LVCMOS33 [get_ports an[0]]
set_property PACKAGE_PIN U4 [get_ports an[1]]
set_property IOSTANDARD LVCMOS33 [get_ports an[1]]
set_property PACKAGE_PIN V4 [get_ports an[2]]
set_property IOSTANDARD LVCMOS33 [get_ports an[2]]
set_property PACKAGE_PIN W4 [get_ports an[3]]
set_property IOSTANDARD LVCMOS33 [get_ports an[3]]
##Buttons
#set_property PACKAGE_PIN U18 [get_ports btnC]
#set_property IOSTANDARD LVCMOS33 [get_ports btnC]
#set_property PACKAGE_PIN T18 [get_ports btnU]
#set_property IOSTANDARD LVCMOS33 [get_ports btnU]
#set_property PACKAGE_PIN W19 [get_ports btnL]
#set_property IOSTANDARD LVCMOS33 [get_ports btnL]
#set_property PACKAGE_PIN T17 [get_ports btnR]
#set_property IOSTANDARD LVCMOS33 [get_ports btnR]
#set_property PACKAGE_PIN U17 [get_ports btnD]
#set_property IOSTANDARD LVCMOS33 [get_ports btnD]
##Pmod Header JA
##Sch name = JA1
#set_property PACKAGE_PIN J1 [get_ports JA[0]]
Ph.D. Thesis - Y. Qin McMaster University - Electrical and Computer Engineering
205
#set_property IOSTANDARD LVCMOS33 [get_ports JA[0]]
##Sch name = JA2
#set_property PACKAGE_PIN L2 [get_ports JA[1]]
#set_property IOSTANDARD LVCMOS33 [get_ports JA[1]]
##Sch name = JA3
#set_property PACKAGE_PIN J2 [get_ports JA[2]]
#set_property IOSTANDARD LVCMOS33 [get_ports JA[2]]
##Sch name = JA4
#set_property PACKAGE_PIN G2 [get_ports JA[3]]
#set_property IOSTANDARD LVCMOS33 [get_ports JA[3]]
##Sch name = JA7
#set_property PACKAGE_PIN H1 [get_ports JA[4]]
#set_property IOSTANDARD LVCMOS33 [get_ports JA[4]]
##Sch name = JA8
#set_property PACKAGE_PIN K2 [get_ports JA[5]]
#set_property IOSTANDARD LVCMOS33 [get_ports JA[5]]
##Sch name = JA9
#set_property PACKAGE_PIN H2 [get_ports JA[6]]
#set_property IOSTANDARD LVCMOS33 [get_ports JA[6]]
##Sch name = JA10
#set_property PACKAGE_PIN G3 [get_ports JA[7]]
#set_property IOSTANDARD LVCMOS33 [get_ports JA[7]]
##Pmod Header JB
##Sch name = JB1
#set_property PACKAGE_PIN A14 [get_ports JB[0]]
#set_property IOSTANDARD LVCMOS33 [get_ports JB[0]]
##Sch name = JB2
#set_property PACKAGE_PIN A16 [get_ports JB[1]]
#set_property IOSTANDARD LVCMOS33 [get_ports JB[1]]
##Sch name = JB3
#set_property PACKAGE_PIN B15 [get_ports JB[2]]
#set_property IOSTANDARD LVCMOS33 [get_ports JB[2]]
##Sch name = JB4
#set_property PACKAGE_PIN B16 [get_ports JB[3]]
#set_property IOSTANDARD LVCMOS33 [get_ports JB[3]]
##Sch name = JB7
#set_property PACKAGE_PIN A15 [get_ports JB[4]]
#set_property IOSTANDARD LVCMOS33 [get_ports JB[4]]
##Sch name = JB8
#set_property PACKAGE_PIN A17 [get_ports JB[5]]
#set_property IOSTANDARD LVCMOS33 [get_ports JB[5]]
##Sch name = JB9
#set_property PACKAGE_PIN C15 [get_ports JB[6]]
#set_property IOSTANDARD LVCMOS33 [get_ports JB[6]]
##Sch name = JB10
#set_property PACKAGE_PIN C16 [get_ports JB[7]]
#set_property IOSTANDARD LVCMOS33 [get_ports JB[7]]
##Pmod Header JC
##Sch name = JC1
#set_property PACKAGE_PIN K17 [get_ports JC[0]]
#set_property IOSTANDARD LVCMOS33 [get_ports JC[0]]
##Sch name = JC2
#set_property PACKAGE_PIN M18 [get_ports JC[1]]
#set_property IOSTANDARD LVCMOS33 [get_ports JC[1]]
##Sch name = JC3
#set_property PACKAGE_PIN N17 [get_ports JC[2]]
#set_property IOSTANDARD LVCMOS33 [get_ports JC[2]]
##Sch name = JC4
#set_property PACKAGE_PIN P18 [get_ports JC[3]]
#set_property IOSTANDARD LVCMOS33 [get_ports JC[3]]
##Sch name = JC7
#set_property PACKAGE_PIN L17 [get_ports JC[4]]
#set_property IOSTANDARD LVCMOS33 [get_ports JC[4]]
##Sch name = JC8
Ph.D. Thesis - Y. Qin McMaster University - Electrical and Computer Engineering
206
#set_property PACKAGE_PIN M19 [get_ports JC[5]]
#set_property IOSTANDARD LVCMOS33 [get_ports JC[5]]
##Sch name = JC9
#set_property PACKAGE_PIN P17 [get_ports JC[6]]
#set_property IOSTANDARD LVCMOS33 [get_ports JC[6]]
##Sch name = JC10
#set_property PACKAGE_PIN R18 [get_ports JC[7]]
#set_property IOSTANDARD LVCMOS33 [get_ports JC[7]]
#Pmod Header JXADC
#Sch name = XA1_P
set_property PACKAGE_PIN J3 [get_ports vauxp6]
set_property IOSTANDARD LVCMOS33 [get_ports vauxp6]
#Sch name = XA2_P
set_property PACKAGE_PIN L3 [get_ports vauxp14]
set_property IOSTANDARD LVCMOS33 [get_ports vauxp14]
#Sch name = XA3_P
set_property PACKAGE_PIN M2 [get_ports vauxp7]
set_property IOSTANDARD LVCMOS33 [get_ports vauxp7]
#Sch name = XA4_P
set_property PACKAGE_PIN N2 [get_ports vauxp15]
set_property IOSTANDARD LVCMOS33 [get_ports vauxp15]
#Sch name = XA1_N
set_property PACKAGE_PIN K3 [get_ports vauxn6]
set_property IOSTANDARD LVCMOS33 [get_ports vauxn6]
#Sch name = XA2_N
set_property PACKAGE_PIN M3 [get_ports vauxn14]
set_property IOSTANDARD LVCMOS33 [get_ports vauxn14]
#Sch name = XA3_N
set_property PACKAGE_PIN M1 [get_ports vauxn7]
set_property IOSTANDARD LVCMOS33 [get_ports vauxn7]
#Sch name = XA4_N
set_property PACKAGE_PIN N1 [get_ports vauxn15]
set_property IOSTANDARD LVCMOS33 [get_ports vauxn15]
##VGA Connector
#set_property PACKAGE_PIN G19 [get_ports vgaRed[0]]
#set_property IOSTANDARD LVCMOS33 [get_ports vgaRed[0]]
#set_property PACKAGE_PIN H19 [get_ports vgaRed[1]]
#set_property IOSTANDARD LVCMOS33 [get_ports vgaRed[1]]
#set_property PACKAGE_PIN J19 [get_ports vgaRed[2]]
#set_property IOSTANDARD LVCMOS33 [get_ports vgaRed[2]]
#set_property PACKAGE_PIN N19 [get_ports vgaRed[3]]
#set_property IOSTANDARD LVCMOS33 [get_ports vgaRed[3]]
#set_property PACKAGE_PIN N18 [get_ports vgaBlue[0]]
#set_property IOSTANDARD LVCMOS33 [get_ports vgaBlue[0]]
#set_property PACKAGE_PIN L18 [get_ports vgaBlue[1]]
#set_property IOSTANDARD LVCMOS33 [get_ports vgaBlue[1]]
#set_property PACKAGE_PIN K18 [get_ports vgaBlue[2]]
#set_property IOSTANDARD LVCMOS33 [get_ports vgaBlue[2]]
#set_property PACKAGE_PIN J18 [get_ports vgaBlue[3]]
#set_property IOSTANDARD LVCMOS33 [get_ports vgaBlue[3]]
#set_property PACKAGE_PIN J17 [get_ports vgaGreen[0]]
#set_property IOSTANDARD LVCMOS33 [get_ports vgaGreen[0]]
#set_property PACKAGE_PIN H17 [get_ports vgaGreen[1]]
#set_property IOSTANDARD LVCMOS33 [get_ports vgaGreen[1]]
#set_property PACKAGE_PIN G17 [get_ports vgaGreen[2]]
#set_property IOSTANDARD LVCMOS33 [get_ports vgaGreen[2]]
#set_property PACKAGE_PIN D17 [get_ports vgaGreen[3]]
#set_property IOSTANDARD LVCMOS33 [get_ports vgaGreen[3]]
#set_property PACKAGE_PIN P19 [get_ports Hsync]
#set_property IOSTANDARD LVCMOS33 [get_ports Hsync]
#set_property PACKAGE_PIN R19 [get_ports Vsync]
#set_property IOSTANDARD LVCMOS33 [get_ports Vsync]
##USB-RS232 Interface

Ph.D. Thesis - Y. Qin McMaster University - Electrical and Computer Engineering
207
#set_property PACKAGE_PIN B18 [get_ports RsRx]
#set_property IOSTANDARD LVCMOS33 [get_ports RsRx]
#set_property PACKAGE_PIN A18 [get_ports RsTx]
#set_property IOSTANDARD LVCMOS33 [get_ports RsTx]
##USB HID (PS/2)
#set_property PACKAGE_PIN C17 [get_ports PS2Clk]
#set_property IOSTANDARD LVCMOS33 [get_ports PS2Clk]
#set_property PULLUP true [get_ports PS2Clk]
#set_property PACKAGE_PIN B17 [get_ports PS2Data]
#set_property IOSTANDARD LVCMOS33 [get_ports PS2Data]
#set_property PULLUP true [get_ports PS2Data]
##Quad SPI Flash
##Note that CCLK_0 cannot be placed in 7 series devices. You can access it using the
##STARTUPE2 primitive.
#set_property PACKAGE_PIN D18 [get_ports QspiDB[0]]
#set_property IOSTANDARD LVCMOS33 [get_ports QspiDB[0]]
#set_property PACKAGE_PIN D19 [get_ports QspiDB[1]]
#set_property IOSTANDARD LVCMOS33 [get_ports QspiDB[1]]
#set_property PACKAGE_PIN G18 [get_ports QspiDB[2]]
#set_property IOSTANDARD LVCMOS33 [get_ports QspiDB[2]]
#set_property PACKAGE_PIN F18 [get_ports QspiDB[3]]
#set_property IOSTANDARD LVCMOS33 [get_ports QspiDB[3]]
#set_property PACKAGE_PIN K19 [get_ports QspiCSn]
#set_property IOSTANDARD LVCMOS33 [get_ports QspiCSn]
XADC configuration
library ieee;
use ieee.std_logic_1164.all;
use ieee.numeric_std.all;
Library UNISIM;
use UNISIM.VCOMPONENTS.ALL;
entity xadc_wiz_0 is
port
(
daddr_in : in STD_LOGIC_VECTOR (6 downto 0); -- Address bus for the dynamic reconfiguration port
den_in : in STD_LOGIC; -- Enable Signal for the dynamic reconfiguration port
di_in : in STD_LOGIC_VECTOR (15 downto 0); -- Input data bus for the dynamic reconfiguration port
dwe_in : in STD_LOGIC; -- Write Enable for the dynamic reconfiguration port
do_out : out STD_LOGIC_VECTOR (15 downto 0); -- Output data bus for dynamic reconfiguration port
drdy_out : out STD_LOGIC; -- Data ready signal for the dynamic reconfiguration port
dclk_in : in STD_LOGIC; -- Clock input for the dynamic reconfiguration port
vauxp6 : in STD_LOGIC; -- Auxiliary Channel 6
vauxn6 : in STD_LOGIC;
vauxp7 : in STD_LOGIC; -- Auxiliary Channel 7
vauxn7 : in STD_LOGIC;
vauxp14 : in STD_LOGIC; -- Auxiliary Channel 14
vauxn14 : in STD_LOGIC;
vauxp15 : in STD_LOGIC; -- Auxiliary Channel 15
vauxn15 : in STD_LOGIC;
busy_out : out STD_LOGIC; -- ADC Busy signal
channel_out : out STD_LOGIC_VECTOR (4 downto 0); -- Channel Selection Outputs
eoc_out : out STD_LOGIC; -- End of Conversion Signal
eos_out : out STD_LOGIC; -- End of Sequence Signal
alarm_out : out STD_LOGIC; -- OR'ed output of all the Alarms
vp_in : in STD_LOGIC; -- Dedicated Analog Input Pair
vn_in : in STD_LOGIC
);
end xadc_wiz_0;
architecture xilinx of xadc_wiz_0 is
attribute CORE_GENERATION_INFO : string;
Ph.D. Thesis - Y. Qin McMaster University - Electrical and Computer Engineering
208
attribute CORE_GENERATION_INFO of xilinx : architecture is
"xadc_wiz_0,xadc_wiz_v3_0,component_name=xadc_wiz_0,enable_axi=false,enable_axi4stream=false,dclk_frequency=100,enable
_busy=true,enable_convst=false,enable_convstclk=false,enable_dclk=true,enable_drp=true,enable_eoc=true,enable_eos=true,enable_v
bram_alaram=false,enable_vccddro_alaram=false,enable_Vccint_Alaram=false,enable_Vccaux_alaram=falseenable_vccpaux_alaram
=false,enable_vccpint_alaram=false,ot_alaram=false,user_temp_alaram=false,timing_mode=continuous,channel_averaging=None,seq
uencer_mode=on,startup_channel_selection=contineous_sequence";
signal FLOAT_VCCAUX_ALARM : std_logic;
signal FLOAT_VCCINT_ALARM : std_logic;
signal FLOAT_USER_TEMP_ALARM : std_logic;
signal FLOAT_VBRAM_ALARM : std_logic;
signal FLOAT_MUXADDR : std_logic_vector (4 downto 0);
signal aux_channel_p : std_logic_vector (15 downto 0);
signal aux_channel_n : std_logic_vector (15 downto 0);
signal alm_int : std_logic_vector (7 downto 0);
begin
alarm_out <= alm_int(7);
aux_channel_p(0) <= '0'; aux_channel_n(0) <= '0'; aux_channel_p(1) <= '0';
aux_channel_n(1) <= '0'; aux_channel_p(2) <= '0'; aux_channel_n(2) <= '0';
aux_channel_p(3) <= '0'; aux_channel_n(3) <= '0'; aux_channel_p(4) <= '0';
aux_channel_n(4) <= '0'; aux_channel_p(5) <= '0'; aux_channel_n(5) <= '0';
aux_channel_p(6) <= vauxp6; aux_channel_n(6) <= vauxn6;
aux_channel_p(7) <= vauxp7; aux_channel_n(7) <= vauxn7;
aux_channel_p(8) <= '0'; aux_channel_n(8) <= '0'; aux_channel_p(9) <= '0';
aux_channel_n(9) <= '0'; aux_channel_p(10) <= '0'; aux_channel_n(10) <= '0';
aux_channel_p(11) <= '0'; aux_channel_n(11) <= '0'; aux_channel_p(12) <= '0';
aux_channel_n(12) <= '0'; aux_channel_p(13) <= '0'; aux_channel_n(13) <= '0';
aux_channel_p(14) <= vauxp14; aux_channel_n(14) <= vauxn14;
aux_channel_p(15) <= vauxp15; aux_channel_n(15) <= vauxn15;
U0 : XADC
generic map(
INIT_40 => X"3000", -- config reg 0
INIT_41 => X"210F", -- config reg 1
INIT_42 => X"0400", -- config reg 2
INIT_48 => X"0000", -- Sequencer channel selection
INIT_49 => X"C0C0", -- Sequencer channel selection
INIT_4A => X"3000", -- Sequencer Average selection
INIT_4B => X"3000", -- Sequencer Average selection
INIT_4C => X"0000", -- Sequencer Bipolar selection
INIT_4D => X"0000", -- Sequencer Bipolar selection
INIT_4E => X"0000", -- Sequencer Acq time selection
INIT_4F => X"0000", -- Sequencer Acq time selection
INIT_50 => X"B5ED", -- Temp alarm trigger
INIT_51 => X"57E4", -- Vccint upper alarm limit
INIT_52 => X"A147", -- Vccaux upper alarm limit
INIT_53 => X"CA33", -- Temp alarm OT upper
INIT_54 => X"A93A", -- Temp alarm reset
INIT_55 => X"52C6", -- Vccint lower alarm limit
INIT_56 => X"9555", -- Vccaux lower alarm limit
INIT_57 => X"AE4E", -- Temp alarm OT reset
INIT_58 => X"5999", -- Vccbram upper alarm limit
INIT_5C => X"5111", -- Vccbram lower alarm limit
SIM_DEVICE => "7SERIES",
SIM_MONITOR_FILE =>
"c:/Users/Nate/Desktop/work/GitProject/Demos/DemoTest/Basys3/Projects/Basys3_XADC_Demo/src/ip/xadc_wiz_0_1/xadc_wiz_0/
simulation/functional/design.txt"
)
port map (
CONVST => '0',
CONVSTCLK => '0',
DADDR(6 downto 0) => daddr_in(6 downto 0),
DCLK => dclk_in,
DEN => den_in,
Ph.D. Thesis - Y. Qin McMaster University - Electrical and Computer Engineering
209
DI(15 downto 0) => di_in(15 downto 0),
DWE => dwe_in,
RESET => '0',
VAUXN(15 downto 0) => aux_channel_n(15 downto 0),
VAUXP(15 downto 0) => aux_channel_p(15 downto 0),
ALM => alm_int,
BUSY => busy_out,
CHANNEL(4 downto 0) => channel_out(4 downto 0),
DO(15 downto 0) => do_out(15 downto 0),
DRDY => drdy_out,
EOC => eoc_out,
EOS => eos_out,
JTAGBUSY => open,
JTAGLOCKED => open,
JTAGMODIFIED => open,
OT => open,
MUXADDR => FLOAT_MUXADDR,
VN => vn_in,
VP => vp_in
);
end xilinx;
3-bit counter
module counter3bit (input clk, input rst, output reg [2:0] Q);
always @ (posedge(clk)) // When will Always Block Be Triggered
begin
if (rst == 3'b111) // How Output reacts when Reset Is Asserted
Q <= 3'b0;
else // How Output reacts when Rising Edge of Clock Arrives?
Q <= Q + 1'b1;
end
endmodule
3-8 decoder
module decoder_3_8 (input [2:0] I, input v_signal, output [3:0] an, output dp);
assign an[0] = ~(~I[2] & ~I[1] & ~I[0]);
assign an[1] = ~(~I[2] & ~I[1] & I[0]);
assign an[2] = ~(~I[2] & I[1] & ~I[0]);
assign an[3] = ~(~I[2] & I[1] & I[0]);
//assign an[4] = ~(I[2] & ~I[1] & ~I[0]);
//assign an[5] = ~(I[2] & ~I[1] & I[0]);
//assign an[6] = ~(I[2] & I[1] & ~I[0]);
//assign an[7] = ~(I[2] & I[1] & I[0]);
//decimal place
assign dp = (v_signal ? ~(~I[2] & ~I[1] & I[0]): ~(~I[2] & I[1] & ~I[0]));//v_signal=1, dp@ 3rd bit; v_signal=0, dp@ 2nd bit
endmodule
7-segment display
module DigitToSeg(in1, in2, in3, in4, in5, in6, in7, in8, mclk, an, dp, seg, v_signal);
input [3:0] in1; input [3:0] in2; input [3:0] in3; input [3:0] in4;
input [3:0] in5; input [3:0] in6; input [3:0] in7; input [3:0] in8;
input mclk; output [3:0] an; output [6:0] seg; output dp; input v_signal;
//wire swt7;
wire XLXN_94; wire [3:0] XLXN_102; wire [2:0] XLXN_109;
sevensegdecoder XLXI_6 (.nIn(XLXN_102[3:0]), .ssOut(seg[6:0]));
mux4_4bus XLXI_45 (.I0(in1[3:0]), .I1(in2[3:0]), .I2(in3[3:0]), .I3(in4[3:0]),
.I4(in5[3:0]), .I5(in6[3:0]), .I6(in7[3:0]), .I7(in8[3:0]),
.Sel(XLXN_109[2:0]), .Y(XLXN_102[3:0]));
segClkDevider XLXI_47 (.clk(mclk), .rst(), .clk_div(XLXN_94));

Ph.D. Thesis - Y. Qin McMaster University - Electrical and Computer Engineering
210
//GND XLXI_48 (.G(swt7));
counter3bit XLXI_49 (.clk(XLXN_94), .rst(), .Q(XLXN_109[2:0]));
decoder_3_8 XLXI_50 (.I(XLXN_109[2:0]), .dp(dp), .v_signal(v_signal), .an(an[3:0]));
endmodule
7-segment decoder
module sevensegdecoder( input [3:0] nIn, output reg [6:0] ssOut);
always @(nIn)
case (nIn)
4'h0: ssOut = 7'b1000000; 4'h1: ssOut = 7'b1111001; 4'h2: ssOut = 7'b0100100;
4'h3: ssOut = 7'b0110000; 4'h4: ssOut = 7'b0011001; 4'h5: ssOut = 7'b0010010;
4'h6: ssOut = 7'b0000010; 4'h7: ssOut = 7'b1111000; 4'h8: ssOut = 7'b0000000;
4'h9: ssOut = 7'b0011000; 4'hA: ssOut = 7'b0001000; 4'hB: ssOut = 7'b0000011;
4'hC: ssOut = 7'b1000110; 4'hD: ssOut = 7'b0100001; 4'hE: ssOut = 7'b0000110;
4'hF: ssOut = 7'b0001110; default: ssOut = 7'b1001001;
endcase
endmodule
MUX4
module mux4_4bus(input [3:0] I0, input [3:0] I1, input [3:0] I2, input [3:0] I3, input [3:0] I4,
input [3:0] I5, input [3:0] I6, input [3:0] I7, input [2:0] Sel, output [3:0] Y);
assign Y = ( Sel == 0 )? I0 : ( Sel == 1 )? I1 : ( Sel == 2 )? I2 : ( Sel == 3 )? I3 : ( Sel == 4 )? I4 :( Sel == 5 )? I5 :( Sel == 6 )? I6 : I7;
endmodule
Clock
module segClkDevider(input clk, input rst, output reg clk_div );
localparam constantNumber = 100000;
reg [31:0] count;
always @ (posedge(clk), posedge(rst))
begin
if (rst == 1'b1) count <= 32'b0;
else if (count == constantNumber - 1) count <= 32'b0;
else count <= count + 1;
end
always @ (posedge(clk), posedge(rst))
begin
if (rst == 1'b1) clk_div <= 1'b0;
else if (count == constantNumber - 1) clk_div <= ~clk_div;
else clk_div <= clk_div;
end
endmodule
Main (top-level) program
module XADCdemo(
input CLK100MHZ,input vauxp6,input vauxn6,input vauxp7,input vauxn7, input vauxp15,input vauxn15,input vauxp14,input
vauxn14,
input reset, input test_cal, input v_signal, input ph, input temperature, input chlorine, input total_cl,
//sw0_reset1; sw1_test0/calbration1; sw2_ph; sw15_v/signal ; sw3_T; sw4_Cl; sw5_total free chlorine
output reg [15:0] LED, output [3:0] an, output dp, output [6:0] seg);
wire enable; wire ready; wire [15:0] data;
reg [15:0] data_test, data_test_t, data_test_cl, data_current, data_previous; reg [32:0] count; reg [6:0] Address_in;
reg [32:0] decimal_cal, decimal_cal_ph, decimal_test, decimal_v, decimal_ph, decimal_vt, decimal_cal_vt, decimal_t,
decimal_cal_t, decimal_cl, decimal_vcl, decimal_ph_now, delta_ph, int_exp_cal, decimal_exp_cal, cl_ratio_cal, pka;
reg [3:0] dig0, dig1, dig2, dig3, dig4, dig5, dig6, digv0, digv1, digv2, digv3, digv4, digv5, digv6, digph0, digph1, digph2, digph3,
digph4, digph5, digph6;
Ph.D. Thesis - Y. Qin McMaster University - Electrical and Computer Engineering
211
reg cal_finished; integer DIVIDER=50000000, v_t_27=116250, t_s=3350, ph_s=60, cl_s=117600, cl_intecept=56882,
cl_t_coeff=3198; reg CLK_1HZ; integer CNT_1HZ;
//xadc instantiation connect the eoc_out .den_in to get continuous conversion
xadc_wiz_0 XLXI_7 (.daddr_in(Address_in), //addresses can be found in the artix 7 XADC user guide DRP register space
.dclk_in(CLK100MHZ), .den_in(enable), .di_in(), .dwe_in(), .busy_out(), .vn_in(), .vp_in(),
//.reset_in(),
.vauxp6(vauxp6), .vauxn6(vauxn6), .vauxp7(vauxp7), .vauxn7(vauxn7), .vauxp14(vauxp14), .vauxn14(vauxn14),
.vauxp15(vauxp15),.vauxn15(vauxn15),
.alarm_out(), .do_out(data), .eoc_out(enable), .channel_out(), .drdy_out(ready));
/////////////////////////////////////////////////////////////////////////////////////////////////////////////////////////////////////////////////////
always @(posedge CLK100MHZ) //reduce the op-chip frequency of 100M Hz to 1Hz
begin
CNT_1HZ<=CNT_1HZ+1;
if(CNT_1HZ<=DIVIDER/2) CLK_1HZ<=0; //50M of 0, 0.5s
else if(CNT_1HZ<=DIVIDER) CLK_1HZ<=1; //50M of 1, 0.5s
else CNT_1HZ<=0;
end
///////////////////////////////////////////////////////////////////////////////////////////////////
always @(posedge(CLK_1HZ))
begin
if(reset == 1'b1)
begin LED <= 16'b1; count = 0; data_current <= 16'b0; data_previous <= 16'b10000000; cal_finished<=0;
decimal_cal_ph <= 33'b1101101110111010000; decimal_cal<= 33'b111111100000; decimal_v <= 33'b1101101110111010000;
decimal_cal_t <= 33'b11100011000011010; decimal_vt <= 33'b11100011000011010;
end //reset, default cal_ph=450mV (450,000 for calculation, pH=7), default T=27C (116.25 mV)
///////////////////////////////pH calibration and test//////////////////////////////////////////////////////////////
else if (ph == 1'b1)
begin
if (test_cal==1) // =====================================calibration
begin
if(data_current!=data_previous) // calibration not finished; calibration finished if two sequential data values are same
begin LED <= 16'b0000_0000_1000_0000; data_current <= data >>4; data_previous<= data_current;
cal_finished <=0; end // two reg to store data from 2 sequential times
else begin LED <= 16'b1111_1111_1111_1111; cal_finished <=1; decimal_cal <= data_current; end
//calibration finished, the last data send for later calculation
decimal_v <= cal_finished ? decimal_cal : data_current; //display the voltage; stop at the calibration value
decimal_v = decimal_v * 250000; decimal_v = decimal_v >> 10;
//voltage converted by XADC to bin value, convert to dec for display
digv0 = decimal_v % 10; decimal_v = decimal_v / 10; digv1 = decimal_v % 10;
decimal_v = decimal_v / 10; digv2 = decimal_v % 10; decimal_v = decimal_v / 10; digv3 = decimal_v % 10;
decimal_v = decimal_v / 10; digv4 = decimal_v % 10; decimal_v = decimal_v / 10; digv5 = decimal_v % 10;
decimal_v = decimal_v / 10; digv6 = decimal_v % 10; decimal_v = decimal_v / 10;
dig0 <= digv0; dig1 <= digv0; dig2 <= digv1; dig3 <= digv2; dig4 <= digv3; dig5 <= digv4; dig6 <= digv5;
//dig0-6is for display, only 3-6 is used, 3 is the first digit
end
else //================================================read data, pH test
begin
if(count == 1) //set sampling frequency, here (1/2)x1Hz
begin LED <= 16'b0000_0000_0000_0100; //read data
data_test <= data; decimal_v = data_test >> 4; count = 0;
//test data for processing, display; looks nicer if our max value is 1V instead of .999755
decimal_v = decimal_v * 250000; decimal_v = decimal_v >> 10; decimal_cal_ph<=decimal_cal*250000;
decimal_cal_ph=decimal_cal_ph>>10;
if (v_signal == 1'b1) //display mV, in mV xxx.x mV
begin digv0 = decimal_v % 10; decimal_v = decimal_v / 10; digv1 = decimal_v % 10;
decimal_v=decimal_v/10; digv2=decimal_v%10; decimal_v=decimal_v/10; digv3=decimal_v%10;
decimal_v=decimal_v/10; digv4=decimal_v%10; decimal_v=decimal_v/10; digv5=decimal_v%10;
decimal_v=decimal_v/10; digv6=decimal_v%10; decimal_v=decimal_v / 10;
dig0<=digv0; dig1<=digv0; dig2<=digv1; dig3<=digv2; dig4<=digv3; dig5<=digv4; dig6<=digv5;
end
else //display pH, use mV, xx.xx pH
begin decimal_ph=(decimal_cal_ph+7*(ph_s*1000+ph_s*(v_t_27-decimal_cal_t)/3/5/60)
-decimal_v)/(ph_s+ph_s*(v_t_27-decimal_cal_t)/5/60/3000);
decimal_ph_now <= decimal_ph; digph2 = decimal_ph % 10;
decimal_ph=decimal_ph/10; digph3=decimal_ph%10; decimal_ph=decimal_ph/10;
digph4= decimal_ph%10; decimal_ph = decimal_ph / 10; digph5 = decimal_ph % 10;
Ph.D. Thesis - Y. Qin McMaster University - Electrical and Computer Engineering
212
decimal_ph = decimal_ph / 10; digph6 = decimal_ph % 10; decimal_ph = decimal_ph / 10;
dig0 = 0; dig1 = 0; dig2 = 0; dig3 <= digph3; dig4 <= digph4; dig5 <= digph5; dig6 <= digph6;
end
end
else begin count <= count + 1; LED <= 16'b0000_0000_0000_0000; end //sampling interval
end
end
///////////////////////////////temperature//////////////////////////////////////////////////////////////
else if (temperature == 1'b1) //read T
begin
if(count == 1) //set sampling frequency, here (1/2)x1Hz
begin LED <= 16'b0000_0000_0000_1000; //read data
data_test_t <= data; decimal_vt = data_test_t >> 4; count = 0;
//test data for processing, display; looks nicer if our max value is 1V instead of .999755
decimal_vt = decimal_vt * 250000; decimal_vt = decimal_vt >> 10; decimal_cal_t <= decimal_vt;
if (v_signal == 1'b1) //display mV, in mV xxx.x mV
begin digv0 = decimal_vt % 10; decimal_vt = decimal_vt / 10; digv1 = decimal_vt % 10;
decimal_vt=decimal_vt/10; digv2=decimal_vt%10; decimal_vt=decimal_vt/10; digv3=decimal_vt%10;
decimal_vt=decimal_vt/10; digv4=decimal_vt%10; decimal_vt=decimal_vt/10; digv5= decimal_vt%10;
decimal_vt = decimal_vt / 10; digv6 = decimal_vt % 10; decimal_vt = decimal_vt / 10;
dig0<=digv0; dig1<= digv0; dig2 <= digv1; dig3 <= digv2; dig4 <= digv3; dig5 <= digv4; dig6 <= digv5;
end
else //display T, use uV, xx.xx deg
begin decimal_t = 1000*(v_t_27 + 27 * t_s - decimal_vt)/t_s; digph2 = decimal_t % 10;
decimal_t=decimal_t/10; digph3=decimal_t%10; decimal_t=decimal_t/10; digph4 = decimal_t % 10;
decimal_t=decimal_t/10; digph5=decimal_t %10; decimal_t=decimal_t/10; digph6 = decimal_t % 10;
decimal_t = decimal_t / 10;
dig0 = 0; dig1 = 0; dig2 = 0; dig3 <= digph3; dig4 <= digph4; dig5 <= digph5; dig6 <= digph6;
end
end
else begin count <= count + 1; LED <= 16'b0000_0000_0000_0000; end //sampling interval
end
///////////////////////////////HOCL only//////////////////////////////////////////////////////////////
else if (chlorine == 1'b1) // read Cl
begin
if(count == 1) //set sampling frequency, here (1/2)x1Hz
begin LED <= 16'b0000_0000_0001_0000; //read data
data_test_cl <= data; decimal_vcl = data_test_cl >> 4; count = 0;
//test data for processing, display; looks nicer if our max value is 1V instead of .999755
decimal_vcl = decimal_vcl * 250000; decimal_vcl = decimal_vcl >> 10;
if (v_signal == 1'b1) //display mV, in mV xxx.x mV
begin digv0 = decimal_vcl % 10; decimal_vcl = decimal_vcl / 10; digv1 = decimal_vcl % 10;
decimal_vcl=decimal_vcl/10; digv2=decimal_vcl%10; decimal_vcl=decimal_vcl/10;
digv3= decimal_vcl%10; decimal_vcl = decimal_vcl / 10; digv4 = decimal_vcl % 10;
decimal_vcl = decimal_vcl / 10; digv5 = decimal_vcl % 10; decimal_vcl = decimal_vcl / 10;
digv6 = decimal_vcl % 10; decimal_vcl = decimal_vcl / 10;
dig0 <= digv0; dig1 <= digv0; dig2 <= digv1; dig3 <= digv2; dig4 <= digv3; dig5 <= digv4; dig6 <= digv5;
end
else //display Cl, use uV, xx.xx ppm ////use _ph to represent _Cl
begin decimal_cl = 1000*(decimal_vcl - cl_intecept)/(cl_s+(v_t_27-decimal_cal_t)*cl_t_coeff/t_s);
digph2 = decimal_cl % 10;// [HOCl]=(V-21482uV)/sensitivity ppm
decimal_cl = decimal_cl / 10; digph3 = decimal_cl % 10; decimal_cl = decimal_cl / 10;
digph4 = decimal_cl % 10; decimal_cl = decimal_cl / 10; digph5 = decimal_cl % 10;
decimal_cl = decimal_cl / 10; digph6 = decimal_cl % 10; decimal_cl = decimal_cl / 10;
dig0 = 0; dig1 = 0; dig2 = 0; dig3 <= digph3; dig4 <= digph4; dig5 <= digph5; dig6 <= digph6;
end
end
else begin count <= count + 1; LED <= 16'b0000_0000_0000_0000; end //sampling interval
end
///////////////////////////////total free chlorine//////////////////////////////////////////////////////////////
else if (total_cl == 1'b1) // read Cl
begin
if(count == 1) //set sampling frequency, here (1/2)x1Hz
Ph.D. Thesis - Y. Qin McMaster University - Electrical and Computer Engineering
213
begin LED <= 16'b0000_0000_0010_0000; //read data
data_test_cl <= data; decimal_vcl = data_test_cl >> 4; count = 0;
//test data for processing, display; looks nicer if our max value is 1V instead of .999755
decimal_vcl = decimal_vcl * 250000; decimal_vcl = decimal_vcl >> 10;
if (v_signal == 1'b1) //display mV, in mV xxx.x mV
begin digv0 = decimal_vcl % 10; decimal_vcl = decimal_vcl / 10; digv1 = decimal_vcl % 10;
decimal_vcl=decimal_vcl/10; digv2=decimal_vcl%10; decimal_vcl=decimal_vcl/10;
digv3=decimal_vcl%10; decimal_vcl = decimal_vcl / 10; digv4 = decimal_vcl % 10;
decimal_vcl = decimal_vcl / 10; digv5 = decimal_vcl % 10; decimal_vcl = decimal_vcl / 10;
digv6 = decimal_vcl % 10; decimal_vcl = decimal_vcl / 10;
dig0 <= digv0; dig1 <= digv0; dig2 <= digv1; dig3 <= digv2; dig4 <= digv3; dig5 <= digv4; dig6 <= digv5;
end
else //display total Cl, use mV, xx.xx ppm ///
begin decimal_cl = 1000*(decimal_vcl - cl_intecept)/(cl_s+(v_t_27-decimal_cal_t)*cl_t_coeff/t_s);
decimal_t = (v_t_27 + 27 * t_s - decimal_cal_t)/t_s; //xx deg.C
pka=(3000*1000/(decimal_t+273))-10069+25*(decimal_t+273);
//[HOCl]=(V-21482uV)/sensitivity; [total free chlorine]=[HOCl]*[1+10^(pH-7.53)], decimal_cl 1000x larger
if (decimal_ph_now >= pka)
begin delta_ph = (decimal_ph_now - pka)/10; //such as 9.00-7.53 -->900-753
int_exp_cal = delta_ph * 3322/100000; //log2(10)=3.222 -- *1000;
decimal_exp_cal = (delta_ph * 3322 - int_exp_cal * 100000)/1000; //take 2 decimals
cl_ratio_cal = 1000+(10000000+70000*decimal_exp_cal
+200*decimal_exp_cal*decimal_exp_cal
+decimal_exp_cal*decimal_exp_cal*decimal_exp_cal)
/10000*(2**int_exp_cal);
//this is 1000x larger than real value, eg. 1000+1525=2525, later used as 2.525x
decimal_cl = decimal_cl * cl_ratio_cal /1000; //decimal_cl is still 1000x larger than real value
end
else
begin delta_ph = (pka - decimal_ph_now)/10; //such as 7.53 - 7.00 --> (pka-7000)/10
int_exp_cal = delta_ph * 3322/100000; //log2(10)=3.222 -- *1000;
decimal_exp_cal = (delta_ph * 3322 - int_exp_cal * 100000)/1000; //take 2 decimals,
cl_ratio_cal = 100+1000000000/(10000000+70000*decimal_exp_cal
+200*decimal_exp_cal*decimal_exp_cal
+decimal_exp_cal*decimal_exp_cal*decimal_exp_cal)
/(2**int_exp_cal);
//this is 100x larger than real value, 10^9/10^(delta_ph)
decimal_cl = decimal_cl * cl_ratio_cal /100; //decimal_cl is still 1000x larger than real value
end
digph2 = decimal_cl % 10; decimal_cl = decimal_cl / 10; digph3 = decimal_cl % 10;
decimal_cl = decimal_cl / 10; digph4 = decimal_cl % 10; decimal_cl = decimal_cl / 10;
digph5 = decimal_cl % 10; decimal_cl = decimal_cl / 10; digph6 = decimal_cl % 10;
decimal_cl = decimal_cl / 10;
dig0 = 0; dig1 = 0; dig2 = 0; dig3 <= digph3; dig4 <= digph4; dig5 <= digph5; dig6 <= digph6;
end
end
else begin count <= count + 1; LED <= 16'b0000_0000_0000_0000; end //sampling interval
end
end
///////////////////////////////////////////////////////////////////////////////////////////////////////////
always @ ( posedge(CLK100MHZ) )
begin //select channel: ph, T, Cl
if (ph == 1'b1) Address_in <= 8'h17;
else if (temperature == 1'b1) Address_in <= 8'h1e;
else if (chlorine == 1'b1) Address_in <= 8'h16;
else if (total_cl == 1'b1) Address_in <= 8'h16;
end
DigitToSeg
segment1(.in1(dig3),.in2(dig4), .in3(dig5), .in4(dig6), .in5(),.in6(), .in7(), .in8(), .v_signal(v_signal), .mclk(CLK100MHZ), .an(an), .d
p(dp), .seg(seg));
endmodule
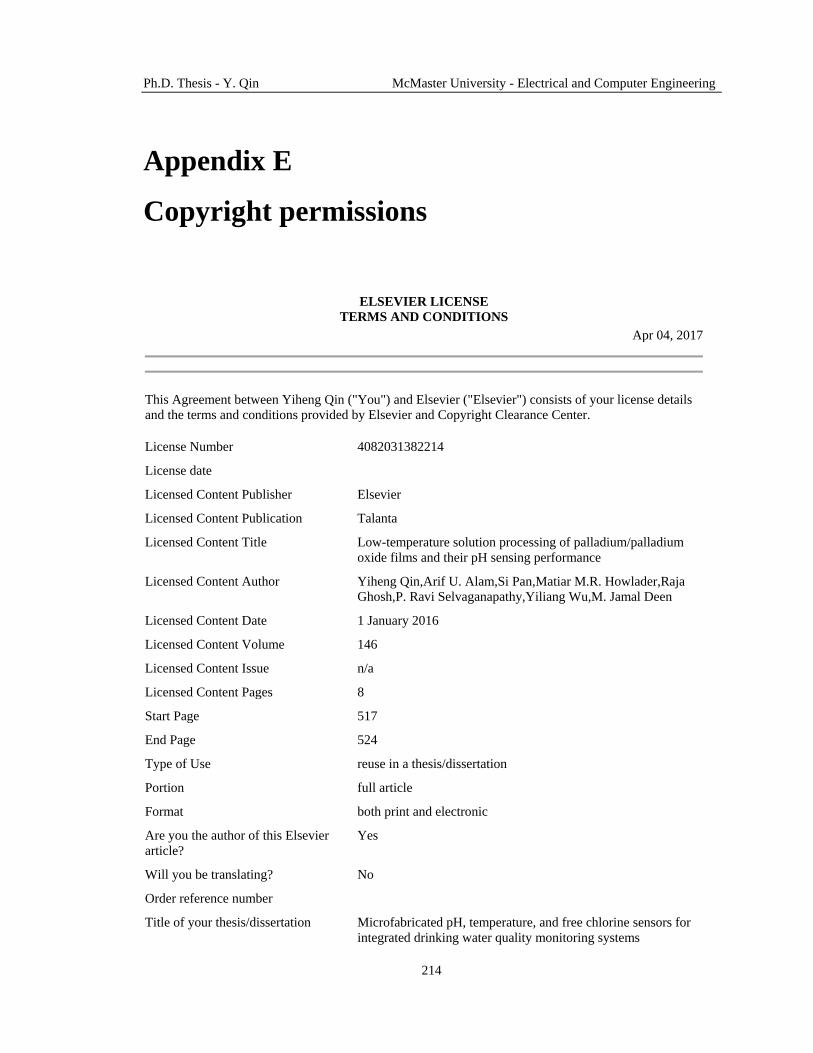
Ph.D. Thesis - Y. Qin McMaster University - Electrical and Computer Engineering
214
Appendix E
Copyright permissions
ELSEVIER LICENSE
TERMS AND CONDITIONS
Apr 04, 2017
This Agreement between Yiheng Qin ("You") and Elsevier ("Elsevier") consists of your license details
and the terms and conditions provided by Elsevier and Copyright Clearance Center.
License Number 4082031382214
License date
Licensed Content Publisher Elsevier
Licensed Content Publication Talanta
Licensed Content Title Low-temperature solution processing of palladium/palladium
oxide films and their pH sensing performance
Licensed Content Author Yiheng Qin,Arif U. Alam,Si Pan,Matiar M.R. Howlader,Raja
Ghosh,P. Ravi Selvaganapathy,Yiliang Wu,M. Jamal Deen
Licensed Content Date 1 January 2016
Licensed Content Volume 146
Licensed Content Issue n/a
Licensed Content Pages 8
Start Page 517
End Page 524
Type of Use reuse in a thesis/dissertation
Portion full article
Format both print and electronic
Are you the author of this Elsevier
article?
Yes
Will you be translating? No
Order reference number
Title of your thesis/dissertation Microfabricated pH, temperature, and free chlorine sensors for
integrated drinking water quality monitoring systems

Ph.D. Thesis - Y. Qin McMaster University - Electrical and Computer Engineering
215
Expected completion date May 2017
Estimated size (number of pages) 230
Elsevier VAT number GB 494 6272 12
Requestor Location Yiheng Qin
ITB-A301
McMaster University
1280 Main Street West
Hamilton, ON L8S 4K1
Canada
Attn: Yiheng Qin
Total 0.00 CAD
Terms and Conditions
INTRODUCTION 1. The publisher for this copyrighted material is Elsevier. By clicking "accept" in connection with
completing this licensing transaction, you agree that the following terms and conditions apply to this
transaction (along with the Billing and Payment terms and conditions established by Copyright
Clearance Center, Inc. ("CCC"), at the time that you opened your Rightslink account and that are
available at any time at http://myaccount.copyright.com).
GENERAL TERMS 2. Elsevier hereby grants you permission to reproduce the aforementioned material subject to the terms
and conditions indicated.
3. Acknowledgement: If any part of the material to be used (for example, figures) has appeared in our
publication with credit or acknowledgement to another source, permission must also be sought from that
source. If such permission is not obtained then that material may not be included in your
publication/copies. Suitable acknowledgement to the source must be made, either as a footnote or in a
reference list at the end of your publication, as follows:
"Reprinted from Publication title, Vol /edition number, Author(s), Title of article / title of chapter, Pages
No., Copyright (Year), with permission from Elsevier [OR APPLICABLE SOCIETY COPYRIGHT
OWNER]." Also Lancet special credit - "Reprinted from The Lancet, Vol. number, Author(s), Title of
article, Pages No., Copyright (Year), with permission from Elsevier."
4. Reproduction of this material is confined to the purpose and/or media for which permission is hereby
given.
5. Altering/Modifying Material: Not Permitted. However figures and illustrations may be
altered/adapted minimally to serve your work. Any other abbreviations, additions, deletions and/or any
other alterations shall be made only with prior written authorization of Elsevier Ltd. (Please contact
Elsevier at [email protected]). No modifications can be made to any Lancet figures/tables and
they must be reproduced in full.
6. If the permission fee for the requested use of our material is waived in this instance, please be advised
that your future requests for Elsevier materials may attract a fee.
7. Reservation of Rights: Publisher reserves all rights not specifically granted in the combination of (i)
the license details provided by you and accepted in the course of this licensing transaction, (ii) these
terms and conditions and (iii) CCC's Billing and Payment terms and conditions.
8. License Contingent Upon Payment: While you may exercise the rights licensed immediately upon
issuance of the license at the end of the licensing process for the transaction, provided that you have
disclosed complete and accurate details of your proposed use, no license is finally effective unless and
until full payment is received from you (either by publisher or by CCC) as provided in CCC's Billing
and Payment terms and conditions. If full payment is not received on a timely basis, then any license
preliminarily granted shall be deemed automatically revoked and shall be void as if never
granted. Further, in the event that you breach any of these terms and conditions or any of CCC's Billing

Ph.D. Thesis - Y. Qin McMaster University - Electrical and Computer Engineering
216
and Payment terms and conditions, the license is automatically revoked and shall be void as if never
granted. Use of materials as described in a revoked license, as well as any use of the materials beyond
the scope of an unrevoked license, may constitute copyright infringement and publisher reserves the
right to take any and all action to protect its copyright in the materials.
9. Warranties: Publisher makes no representations or warranties with respect to the licensed material.
10. Indemnity: You hereby indemnify and agree to hold harmless publisher and CCC, and their
respective officers, directors, employees and agents, from and against any and all claims arising out of
your use of the licensed material other than as specifically authorized pursuant to this license.
11. No Transfer of License: This license is personal to you and may not be sublicensed, assigned, or
transferred by you to any other person without publisher's written permission.
12. No Amendment Except in Writing: This license may not be amended except in a writing signed by
both parties (or, in the case of publisher, by CCC on publisher's behalf).
13. Objection to Contrary Terms: Publisher hereby objects to any terms contained in any purchase order,
acknowledgment, check endorsement or other writing prepared by you, which terms are inconsistent
with these terms and conditions or CCC's Billing and Payment terms and conditions. These terms and
conditions, together with CCC's Billing and Payment terms and conditions (which are incorporated
herein), comprise the entire agreement between you and publisher (and CCC) concerning this licensing
transaction. In the event of any conflict between your obligations established by these terms and
conditions and those established by CCC's Billing and Payment terms and conditions, these terms and
conditions shall control.
14. Revocation: Elsevier or Copyright Clearance Center may deny the permissions described in this
License at their sole discretion, for any reason or no reason, with a full refund payable to you. Notice
of such denial will be made using the contact information provided by you. Failure to receive such
notice will not alter or invalidate the denial. In no event will Elsevier or Copyright Clearance Center be
responsible or liable for any costs, expenses or damage incurred by you as a result of a denial of your
permission request, other than a refund of the amount(s) paid by you to Elsevier and/or Copyright
Clearance Center for denied permissions.
LIMITED LICENSE
The following terms and conditions apply only to specific license types:
15. Translation: This permission is granted for non-exclusive world English rights only unless your
license was granted for translation rights. If you licensed translation rights you may only translate this
content into the languages you requested. A professional translator must perform all translations and
reproduce the content word for word preserving the integrity of the article.
16. Posting licensed content on any Website: The following terms and conditions apply as follows:
Licensing material from an Elsevier journal: All content posted to the web site must maintain the
copyright information line on the bottom of each image; A hyper-text must be included to the
Homepage of the journal from which you are licensing
athttp://www.sciencedirect.com/science/journal/xxxxx or the Elsevier homepage for books
athttp://www.elsevier.com; Central Storage: This license does not include permission for a scanned
version of the material to be stored in a central repository such as that provided by Heron/XanEdu.
Licensing material from an Elsevier book: A hyper-text link must be included to the Elsevier homepage
at http://www.elsevier.com . All content posted to the web site must maintain the copyright information
line on the bottom of each image.
Posting licensed content on Electronic reserve: In addition to the above the following clauses are
applicable: The web site must be password-protected and made available only to bona fide students
registered on a relevant course. This permission is granted for 1 year only. You may obtain a new
license for future website posting.
17. For journal authors: the following clauses are applicable in addition to the above:
Preprints:
Ph.D. Thesis - Y. Qin McMaster University - Electrical and Computer Engineering
217
A preprint is an author's own write-up of research results and analysis, it has not been peer-reviewed,
nor has it had any other value added to it by a publisher (such as formatting, copyright, technical
enhancement etc.).
Authors can share their preprints anywhere at any time. Preprints should not be added to or enhanced in
any way in order to appear more like, or to substitute for, the final versions of articles however authors
can update their preprints on arXiv or RePEc with their Accepted Author Manuscript (see below).
If accepted for publication, we encourage authors to link from the preprint to their formal publication via
its DOI. Millions of researchers have access to the formal publications on ScienceDirect, and so links
will help users to find, access, cite and use the best available version. Please note that Cell Press, The
Lancet and some society-owned have different preprint policies. Information on these policies is
available on the journal homepage.
Accepted Author Manuscripts: An accepted author manuscript is the manuscript of an article that has
been accepted for publication and which typically includes author-incorporated changes suggested
during submission, peer review and editor-author communications.
Authors can share their accepted author manuscript:
immediately
o via their non-commercial person homepage or blog
o by updating a preprint in arXiv or RePEc with the accepted manuscript
o via their research institute or institutional repository for internal institutional uses or as
part of an invitation-only research collaboration work-group
o directly by providing copies to their students or to research collaborators for their
personal use
o for private scholarly sharing as part of an invitation-only work group on commercial
sites with which Elsevier has an agreement
After the embargo period
o via non-commercial hosting platforms such as their institutional repository
o via commercial sites with which Elsevier has an agreement
In all cases accepted manuscripts should:
link to the formal publication via its DOI
bear a CC-BY-NC-ND license - this is easy to do
if aggregated with other manuscripts, for example in a repository or other site, be shared in
alignment with our hosting policy not be added to or enhanced in any way to appear more like,
or to substitute for, the published journal article.
Published journal article (JPA): A published journal article (PJA) is the definitive final record of
published research that appears or will appear in the journal and embodies all value-adding publishing
activities including peer review co-ordination, copy-editing, formatting, (if relevant) pagination and
online enrichment.
Policies for sharing publishing journal articles differ for subscription and gold open access articles:
Subscription Articles: If you are an author, please share a link to your article rather than the full-text.
Millions of researchers have access to the formal publications on ScienceDirect, and so links will help
your users to find, access, cite, and use the best available version.
Theses and dissertations which contain embedded PJAs as part of the formal submission can be posted
publicly by the awarding institution with DOI links back to the formal publications on ScienceDirect.
If you are affiliated with a library that subscribes to ScienceDirect you have additional private sharing
rights for others' research accessed under that agreement. This includes use for classroom teaching and
internal training at the institution (including use in course packs and courseware programs), and
inclusion of the article for grant funding purposes.

Ph.D. Thesis - Y. Qin McMaster University - Electrical and Computer Engineering
218
Gold Open Access Articles: May be shared according to the author-selected end-user license and
should contain a CrossMark logo, the end user license, and a DOI link to the formal publication on
ScienceDirect.
Please refer to Elsevier's posting policy for further information.
18. For book authors the following clauses are applicable in addition to the above: Authors are
permitted to place a brief summary of their work online only. You are not allowed to download and post
the published electronic version of your chapter, nor may you scan the printed edition to create an
electronic version. Posting to a repository: Authors are permitted to post a summary of their chapter
only in their institution's repository.
19. Thesis/Dissertation: If your license is for use in a thesis/dissertation your thesis may be submitted
to your institution in either print or electronic form. Should your thesis be published commercially,
please reapply for permission. These requirements include permission for the Library and Archives of
Canada to supply single copies, on demand, of the complete thesis and include permission for
Proquest/UMI to supply single copies, on demand, of the complete thesis. Should your thesis be
published commercially, please reapply for permission. Theses and dissertations which contain
embedded PJAs as part of the formal submission can be posted publicly by the awarding institution with
DOI links back to the formal publications on ScienceDirect.
Elsevier Open Access Terms and Conditions You can publish open access with Elsevier in hundreds of open access journals or in nearly 2000
established subscription journals that support open access publishing. Permitted third party re-use of
these open access articles is defined by the author's choice of Creative Commons user license. See
our open access license policy for more information.
Terms & Conditions applicable to all Open Access articles published with Elsevier: Any reuse of the article must not represent the author as endorsing the adaptation of the article nor
should the article be modified in such a way as to damage the author's honour or reputation. If any
changes have been made, such changes must be clearly indicated.
The author(s) must be appropriately credited and we ask that you include the end user license and a DOI
link to the formal publication on ScienceDirect.
If any part of the material to be used (for example, figures) has appeared in our publication with credit
or acknowledgement to another source it is the responsibility of the user to ensure their reuse complies
with the terms and conditions determined by the rights holder.
Additional Terms & Conditions applicable to each Creative Commons user license: CC BY: The CC-BY license allows users to copy, to create extracts, abstracts and new works from the
Article, to alter and revise the Article and to make commercial use of the Article (including reuse and/or
resale of the Article by commercial entities), provided the user gives appropriate credit (with a link to
the formal publication through the relevant DOI), provides a link to the license, indicates if changes
were made and the licensor is not represented as endorsing the use made of the work. The full details of
the license are available at http://creativecommons.org/licenses/by/4.0.
CC BY NC SA: The CC BY-NC-SA license allows users to copy, to create extracts, abstracts and new
works from the Article, to alter and revise the Article, provided this is not done for commercial
purposes, and that the user gives appropriate credit (with a link to the formal publication through the
relevant DOI), provides a link to the license, indicates if changes were made and the licensor is not
represented as endorsing the use made of the work. Further, any new works must be made available on
the same conditions. The full details of the license are available
at http://creativecommons.org/licenses/by-nc-sa/4.0.
CC BY NC ND: The CC BY-NC-ND license allows users to copy and distribute the Article, provided
this is not done for commercial purposes and further does not permit distribution of the Article if it is
changed or edited in any way, and provided the user gives appropriate credit (with a link to the formal
publication through the relevant DOI), provides a link to the license, and that the licensor is not
represented as endorsing the use made of the work. The full details of the license are available
at http://creativecommons.org/licenses/by-nc-nd/4.0. Any commercial reuse of Open Access articles

Ph.D. Thesis - Y. Qin McMaster University - Electrical and Computer Engineering
219
published with a CC BY NC SA or CC BY NC ND license requires permission from Elsevier and will
be subject to a fee.
Commercial reuse includes:
Associating advertising with the full text of the Article
Charging fees for document delivery or access
Article aggregation
Systematic distribution via e-mail lists or share buttons
Posting or linking by commercial companies for use by customers of those companies.
20. Other Conditions:
v1.9
Questions? [email protected] or +1-855-239-3415 (toll free in the US) or +1-978-646-
2777.
JOHN WILEY AND SONS LICENSE
TERMS AND CONDITIONS
Apr 04, 2017
This Agreement between Yiheng Qin ("You") and John Wiley and Sons ("John Wiley and Sons")
consists of your license details and the terms and conditions provided by John Wiley and Sons and
Copyright Clearance Center.
License Number 4082040324262
License date
Licensed Content Publisher John Wiley and Sons
Licensed Content Publication Advanced Functional Materials
Licensed Content Title Inkjet Printing of a Highly Loaded Palladium Ink for Integrated,
Low‐Cost pH Sensors
Licensed Content Author Yiheng Qin,Arif U. Alam,Matiar M. R. Howlader,Nan‐Xing
Hu,M. Jamal Deen
Licensed Content Date May 24, 2016
Licensed Content Pages 11
Type of use Dissertation/Thesis
Requestor type Author of this Wiley article
Format Print and electronic

Ph.D. Thesis - Y. Qin McMaster University - Electrical and Computer Engineering
220
Portion Full article
Will you be translating? No
Title of your thesis / dissertation Microfabricated pH, temperature, and free chlorine sensors for
integrated drinking water quality monitoring systems
Expected completion date May 2017
Expected size (number of pages) 230
Requestor Location Yiheng Qin
ITB-A301
McMaster University
1280 Main Street West
Hamilton, ON L8S 4K1
Canada
Attn: Yiheng Qin
Publisher Tax ID EU826007151
Billing Type Invoice
Billing Address Yiheng Qin
ITB-A301
McMaster University
1280 Main Street West
Hamilton, ON L8S 4K1
Canada
Attn: Yiheng Qin
Total 0.00 CAD
Terms and Conditions
TERMS AND CONDITIONS
This copyrighted material is owned by or exclusively licensed to John Wiley & Sons, Inc. or one of its
group companies (each a"Wiley Company") or handled on behalf of a society with which a Wiley
Company has exclusive publishing rights in relation to a particular work (collectively "WILEY"). By
clicking "accept" in connection with completing this licensing transaction, you agree that the following
terms and conditions apply to this transaction (along with the billing and payment terms and conditions
established by the Copyright Clearance Center Inc., ("CCC's Billing and Payment terms and
conditions"), at the time that you opened your RightsLink account (these are available at any time
at http://myaccount.copyright.com).
Terms and Conditions
The materials you have requested permission to reproduce or reuse (the "Wiley Materials") are
protected by copyright.
You are hereby granted a personal, non-exclusive, non-sub licensable (on a stand-alone basis),
non-transferable, worldwide, limited license to reproduce the Wiley Materials for the purpose
specified in the licensing process. This license, and any CONTENT (PDF or image file)
purchased as part of your order, is for a one-time use only and limited to any maximum
distribution number specified in the license. The first instance of republication or reuse granted
by this license must be completed within two years of the date of the grant of this license
(although copies prepared before the end date may be distributed thereafter). The Wiley

Ph.D. Thesis - Y. Qin McMaster University - Electrical and Computer Engineering
221
Materials shall not be used in any other manner or for any other purpose, beyond what is
granted in the license. Permission is granted subject to an appropriate acknowledgement given
to the author, title of the material/book/journal and the publisher. You shall also duplicate the
copyright notice that appears in the Wiley publication in your use of the Wiley Material.
Permission is also granted on the understanding that nowhere in the text is a previously
published source acknowledged for all or part of this Wiley Material. Any third party content is
expressly excluded from this permission.
With respect to the Wiley Materials, all rights are reserved. Except as expressly granted by the
terms of the license, no part of the Wiley Materials may be copied, modified, adapted (except
for minor reformatting required by the new Publication), translated, reproduced, transferred or
distributed, in any form or by any means, and no derivative works may be made based on the
Wiley Materials without the prior permission of the respective copyright owner.For STM
Signatory Publishers clearing permission under the terms of the STM Permissions
Guidelines only, the terms of the license are extended to include subsequent editions and
for editions in other languages, provided such editions are for the work as a whole in situ
and does not involve the separate exploitation of the permitted figures or extracts,You
may not alter, remove or suppress in any manner any copyright, trademark or other notices
displayed by the Wiley Materials. You may not license, rent, sell, loan, lease, pledge, offer as
security, transfer or assign the Wiley Materials on a stand-alone basis, or any of the rights
granted to you hereunder to any other person.
The Wiley Materials and all of the intellectual property rights therein shall at all times remain
the exclusive property of John Wiley & Sons Inc, the Wiley Companies, or their respective
licensors, and your interest therein is only that of having possession of and the right to
reproduce the Wiley Materials pursuant to Section 2 herein during the continuance of this
Agreement. You agree that you own no right, title or interest in or to the Wiley Materials or
any of the intellectual property rights therein. You shall have no rights hereunder other than the
license as provided for above in Section 2. No right, license or interest to any trademark, trade
name, service mark or other branding ("Marks") of WILEY or its licensors is granted
hereunder, and you agree that you shall not assert any such right, license or interest with
respect thereto
NEITHER WILEY NOR ITS LICENSORS MAKES ANY WARRANTY OR
REPRESENTATION OF ANY KIND TO YOU OR ANY THIRD PARTY, EXPRESS,
IMPLIED OR STATUTORY, WITH RESPECT TO THE MATERIALS OR THE
ACCURACY OF ANY INFORMATION CONTAINED IN THE MATERIALS,
INCLUDING, WITHOUT LIMITATION, ANY IMPLIED WARRANTY OF
MERCHANTABILITY, ACCURACY, SATISFACTORY QUALITY, FITNESS FOR A
PARTICULAR PURPOSE, USABILITY, INTEGRATION OR NON-INFRINGEMENT AND
ALL SUCH WARRANTIES ARE HEREBY EXCLUDED BY WILEY AND ITS
LICENSORS AND WAIVED BY YOU.
WILEY shall have the right to terminate this Agreement immediately upon breach of this
Agreement by you.
You shall indemnify, defend and hold harmless WILEY, its Licensors and their respective
directors, officers, agents and employees, from and against any actual or threatened claims,
demands, causes of action or proceedings arising from any breach of this Agreement by you.
IN NO EVENT SHALL WILEY OR ITS LICENSORS BE LIABLE TO YOU OR ANY
OTHER PARTY OR ANY OTHER PERSON OR ENTITY FOR ANY SPECIAL,

Ph.D. Thesis - Y. Qin McMaster University - Electrical and Computer Engineering
222
CONSEQUENTIAL, INCIDENTAL, INDIRECT, EXEMPLARY OR PUNITIVE
DAMAGES, HOWEVER CAUSED, ARISING OUT OF OR IN CONNECTION WITH THE
DOWNLOADING, PROVISIONING, VIEWING OR USE OF THE MATERIALS
REGARDLESS OF THE FORM OF ACTION, WHETHER FOR BREACH OF CONTRACT,
BREACH OF WARRANTY, TORT, NEGLIGENCE, INFRINGEMENT OR OTHERWISE
(INCLUDING, WITHOUT LIMITATION, DAMAGES BASED ON LOSS OF PROFITS,
DATA, FILES, USE, BUSINESS OPPORTUNITY OR CLAIMS OF THIRD PARTIES),
AND WHETHER OR NOT THE PARTY HAS BEEN ADVISED OF THE POSSIBILITY OF
SUCH DAMAGES. THIS LIMITATION SHALL APPLY NOTWITHSTANDING ANY
FAILURE OF ESSENTIAL PURPOSE OF ANY LIMITED REMEDY PROVIDED
HEREIN.
Should any provision of this Agreement be held by a court of competent jurisdiction to be
illegal, invalid, or unenforceable, that provision shall be deemed amended to achieve as nearly
as possible the same economic effect as the original provision, and the legality, validity and
enforceability of the remaining provisions of this Agreement shall not be affected or impaired
thereby.
The failure of either party to enforce any term or condition of this Agreement shall not
constitute a waiver of either party's right to enforce each and every term and condition of this
Agreement. No breach under this agreement shall be deemed waived or excused by either party
unless such waiver or consent is in writing signed by the party granting such waiver or consent.
The waiver by or consent of a party to a breach of any provision of this Agreement shall not
operate or be construed as a waiver of or consent to any other or subsequent breach by such
other party.
This Agreement may not be assigned (including by operation of law or otherwise) by you
without WILEY's prior written consent.
Any fee required for this permission shall be non-refundable after thirty (30) days from receipt
by the CCC.
These terms and conditions together with CCC's Billing and Payment terms and conditions
(which are incorporated herein) form the entire agreement between you and WILEY
concerning this licensing transaction and (in the absence of fraud) supersedes all prior
agreements and representations of the parties, oral or written. This Agreement may not be
amended except in writing signed by both parties. This Agreement shall be binding upon and
inure to the benefit of the parties' successors, legal representatives, and authorized assigns.
In the event of any conflict between your obligations established by these terms and conditions
and those established by CCC's Billing and Payment terms and conditions, these terms and
conditions shall prevail.
WILEY expressly reserves all rights not specifically granted in the combination of (i) the
license details provided by you and accepted in the course of this licensing transaction, (ii)
these terms and conditions and (iii) CCC's Billing and Payment terms and conditions.
This Agreement will be void if the Type of Use, Format, Circulation, or Requestor Type was
misrepresented during the licensing process.

Ph.D. Thesis - Y. Qin McMaster University - Electrical and Computer Engineering
223
This Agreement shall be governed by and construed in accordance with the laws of the State of
New York, USA, without regards to such state's conflict of law rules. Any legal action, suit or
proceeding arising out of or relating to these Terms and Conditions or the breach thereof shall
be instituted in a court of competent jurisdiction in New York County in the State of New York
in the United States of America and each party hereby consents and submits to the personal
jurisdiction of such court, waives any objection to venue in such court and consents to service
of process by registered or certified mail, return receipt requested, at the last known address of
such party.
WILEY OPEN ACCESS TERMS AND CONDITIONS
Wiley Publishes Open Access Articles in fully Open Access Journals and in Subscription journals
offering Online Open. Although most of the fully Open Access journals publish open access articles
under the terms of the Creative Commons Attribution (CC BY) License only, the subscription journals
and a few of the Open Access Journals offer a choice of Creative Commons Licenses. The license type
is clearly identified on the article.
The Creative Commons Attribution License
The Creative Commons Attribution License (CC-BY) allows users to copy, distribute and transmit an
article, adapt the article and make commercial use of the article. The CC-BY license permits
commercial and non-
Creative Commons Attribution Non-Commercial License The Creative Commons Attribution Non-Commercial (CC-BY-NC)License permits use, distribution and
reproduction in any medium, provided the original work is properly cited and is not used for commercial
purposes.(see below)
Creative Commons Attribution-Non-Commercial-NoDerivs License
The Creative Commons Attribution Non-Commercial-NoDerivs License (CC-BY-NC-ND) permits use,
distribution and reproduction in any medium, provided the original work is properly cited, is not used
for commercial purposes and no modifications or adaptations are made. (see below)
Use by commercial "for-profit" organizations Use of Wiley Open Access articles for commercial, promotional, or marketing purposes requires further
explicit permission from Wiley and will be subject to a fee.
Further details can be found on Wiley Online Libraryhttp://olabout.wiley.com/WileyCDA/Section/id-
410895.html
Other Terms and Conditions:
v1.10 Last updated September 2015
Questions? [email protected] or +1-855-239-3415 (toll free in the US) or +1-978-646-
2777.
Title: Paper-Based, Hand-Drawn Free Chlorine Sensor with Poly(3,4-
ethylenedioxythiophene):Poly(styrenesulfonate)
Author: Yiheng Qin, Si Pan, Matiar M. R. Howlader, et al

Ph.D. Thesis - Y. Qin McMaster University - Electrical and Computer Engineering
224
Publication: Analytical Chemistry
Publisher: American Chemical Society
Date: Nov 1, 2016
Copyright © 2016, American Chemical Society
PERMISSION/LICENSE IS GRANTED FOR YOUR ORDER AT NO CHARGE
This type of permission/license, instead of the standard Terms & Conditions, is sent to you because no
fee is being charged for your order. Please note the following:
Permission is granted for your request in both print and electronic formats, and translations.
If figures and/or tables were requested, they may be adapted or used in part.
Please print this page for your records and send a copy of it to your publisher/graduate school.
Appropriate credit for the requested material should be given as follows: "Reprinted (adapted)
with permission from (COMPLETE REFERENCE CITATION). Copyright (YEAR) American
Chemical Society." Insert appropriate information in place of the capitalized words.
One-time permission is granted only for the use specified in your request. No additional uses
are granted (such as derivative works or other editions). For any other uses, please submit a
new request.
Copyright © 2017 Copyright Clearance Center, Inc. All Rights Reserved. Privacy
statement. Terms and Conditions.
Comments? We would like to hear from you. E-mail us at [email protected]
Related Documents


