INTERNATIONAL JOURNAL OF CLIMATOLOGY Int. J. Climatol. 23: 333–345 (2003) Published online in Wiley InterScience (www.interscience.wiley.com). DOI: 10.1002/joc.873 MICROCLIMATE OF A DESERT PLAYA: EVALUATION OF ANNUAL RADIATION, ENERGY, AND WATER BUDGETS COMPONENTS ESMAIEL MALEK* Department of Plants, Soils and Biometeorology, Utah State University, Logan, UT 84322-4820, USA Received 6 March 2002 Revised 24 October 2002 Accepted 24 October 2002 ABSTRACT We set up two automatic weather stations over a playa (the flat floor of an undrained desert basin that, at times, becomes a shallow lake), approximately 65 km east–west by 130 km north–south, located in Dugway (40 ° 08 N, 113 ° 27 W, 1124 m above mean sea level) in northwestern Utah, USA, in 1999. These stations measured the radiation budget components, namely: incoming R si and outgoing R so solar or shortwave radiation, using two Kipp and Zonen pyranometers (one inverted), the incoming R li (or atmospheric) and outgoing R lo (or terrestrial) longwave radiation, using two Kipp and Zonen pyrgeometers (one inverted) during the year 2000. These sensors were ventilated throughout the year to prevent dew and frost formation. Summation of these components yields the net radiation R n . We also measured the air temperatures and humidity at 1 and 2 m and the soil moisture and temperature (Campbell Sci., Inc., CSI) to evaluate the energy budget components (latent (LE), sensible (H ), and the soil (G sur ) heat fluxes). The 10 m wind speed U 10 and direction (R.M. Young wind monitor), precipitation (CSI), and the surface temperature (Radiation and Energy Balance Systems, REBS) were also measured during 2000. The measurements were taken every 2 s, averaged into 20 min, continuously, throughout the year 2000. The annual comparison of radiation budget components indicates that about 34% of the annual R si (6937.7 MJ m −2 year −1 ) was reflected back to the sky as R so , with R li and R lo amounting to 9943.4 MJ m −2 year −1 and 12 789.7 MJ m −2 year −1 respectively. This yields about 1634.3 MJ m −2 year −1 as R n , which is about 24% of the annual R si . Of the total 1634.3 MJ m −2 year −1 available energy, about 25% was used for the process of evaporation (LE) and 77% for heating the air (H ). The annual heat contribution from the soil to the energy budget amounted to 2% during the experimental period. Our studies showed that the total annual measured precipitation amounted to 108.0 mm year −1 during the year 2000, but the total evaporation was 167.6 mm year −1 , which means some water was extracted from the shallow water table (about 60 cm on the average depth during the year 2000). Copyright 2003 Royal Meteorological Society. KEY WORDS: annual radiation; energy and water budgets; playa; Bowen ratio system; evaporation 1. INTRODUCTION Many researchers have investigated the characteristics of both dry and wet playa environments. Pezzolesi et al. (1998) investigated nutrients in a playa wetland receiving wastewater. Scanlon and Goldsmith (1997) studied the spatial variability in unsaturated flow beneath and adjacent to playas. Malek et al. (1997) investigated the annual mesoscale water budget in an heterogeneous desert valley. Osterkamp and Wood (1987) worked on the hydrologic, geomorphologic and geologic evidence for development of playa-lake basins. Tyler et al. (1997) studied the groundwater evaporation and salt flux from a playa. Malek et al. (1990) searched on the seasonal evapotranspiration from the margin and moist playa of a closed desert valley. Eghbal et al. (1989) worked on the dynamics of evaporite distribution in soils on a fan–playa transect. However, little detailed information exists on the evaluation of annual radiation, energy, and water budget components over a barren desert playa. This paper reports the soil characteristics, the daily and annual * Correspondence to: Esmaiel Malek, Department of Plants, Soils and Biometeorology, Utah State University, Logan, UT 84322-4820, USA; e-mail: [email protected] Copyright 2003 Royal Meteorological Society

Welcome message from author
This document is posted to help you gain knowledge. Please leave a comment to let me know what you think about it! Share it to your friends and learn new things together.
Transcript
INTERNATIONAL JOURNAL OF CLIMATOLOGY
Int. J. Climatol. 23: 333–345 (2003)
Published online in Wiley InterScience (www.interscience.wiley.com). DOI: 10.1002/joc.873
MICROCLIMATE OF A DESERT PLAYA: EVALUATION OF ANNUALRADIATION, ENERGY, AND WATER BUDGETS COMPONENTS
ESMAIEL MALEK*Department of Plants, Soils and Biometeorology, Utah State University, Logan, UT 84322-4820, USA
Received 6 March 2002Revised 24 October 2002
Accepted 24 October 2002
ABSTRACT
We set up two automatic weather stations over a playa (the flat floor of an undrained desert basin that, at times, becomes ashallow lake), approximately 65 km east–west by 130 km north–south, located in Dugway (40°08′N, 113°27′W, 1124 mabove mean sea level) in northwestern Utah, USA, in 1999. These stations measured the radiation budget components,namely: incoming Rsi and outgoing Rso solar or shortwave radiation, using two Kipp and Zonen pyranometers (oneinverted), the incoming Rli (or atmospheric) and outgoing Rlo (or terrestrial) longwave radiation, using two Kipp andZonen pyrgeometers (one inverted) during the year 2000. These sensors were ventilated throughout the year to prevent dewand frost formation. Summation of these components yields the net radiation Rn. We also measured the air temperaturesand humidity at 1 and 2 m and the soil moisture and temperature (Campbell Sci., Inc., CSI) to evaluate the energybudget components (latent (LE), sensible (H ), and the soil (Gsur) heat fluxes). The 10 m wind speed U10 and direction(R.M. Young wind monitor), precipitation (CSI), and the surface temperature (Radiation and Energy Balance Systems,REBS) were also measured during 2000. The measurements were taken every 2 s, averaged into 20 min, continuously,throughout the year 2000. The annual comparison of radiation budget components indicates that about 34% of the annualRsi (6937.7 MJ m−2 year−1) was reflected back to the sky as Rso, with Rli and Rlo amounting to 9943.4 MJ m−2 year−1
and 12 789.7 MJ m−2 year−1 respectively. This yields about 1634.3 MJ m−2 year−1 as Rn, which is about 24% of theannual Rsi. Of the total 1634.3 MJ m−2 year−1 available energy, about 25% was used for the process of evaporation (LE)and 77% for heating the air (H ). The annual heat contribution from the soil to the energy budget amounted to 2% duringthe experimental period. Our studies showed that the total annual measured precipitation amounted to 108.0 mm year−1
during the year 2000, but the total evaporation was 167.6 mm year−1, which means some water was extracted from theshallow water table (about 60 cm on the average depth during the year 2000). Copyright 2003 Royal MeteorologicalSociety.
KEY WORDS: annual radiation; energy and water budgets; playa; Bowen ratio system; evaporation
1. INTRODUCTION
Many researchers have investigated the characteristics of both dry and wet playa environments. Pezzolesi et al.(1998) investigated nutrients in a playa wetland receiving wastewater. Scanlon and Goldsmith (1997) studiedthe spatial variability in unsaturated flow beneath and adjacent to playas. Malek et al. (1997) investigatedthe annual mesoscale water budget in an heterogeneous desert valley. Osterkamp and Wood (1987) workedon the hydrologic, geomorphologic and geologic evidence for development of playa-lake basins. Tyler et al.(1997) studied the groundwater evaporation and salt flux from a playa. Malek et al. (1990) searched on theseasonal evapotranspiration from the margin and moist playa of a closed desert valley. Eghbal et al. (1989)worked on the dynamics of evaporite distribution in soils on a fan–playa transect.
However, little detailed information exists on the evaluation of annual radiation, energy, and water budgetcomponents over a barren desert playa. This paper reports the soil characteristics, the daily and annual
* Correspondence to: Esmaiel Malek, Department of Plants, Soils and Biometeorology, Utah State University, Logan, UT 84322-4820,USA; e-mail: [email protected]
Copyright 2003 Royal Meteorological Society
334 E. MALEK
radiation, energy, and water budget components over a playa located in northwestern Utah, USA. Theinformation and findings should increase our knowledge about similar desert playas, which cover most ofthe desert regions in the world, and the possibility of harvesting solar and wind energies over these vast andflat playas.
2. EXPERIMENTAL SITE
Most of the North American dry lands lie in the Great Basin, which is located between the Rocky Mountainsand a continuous wall formed by the Sierra Nevada of California and the Cascades Range of Oregon andWashington. The region is a good example of a mid-latitude rain-shadow desert, though the terrain subdividesthe area. The Great Basin is not a single depression, but a collection of basins, and is the classic example ofbasin and range topography. Most of the basins are flat and occasionally covered by shallow lakes. These so-called playas soon evaporate, depositing clay and precipitating salts. The upper slopes are frequently coveredwith pine and juniper stands. The intermediate zone between mountain base and basin floor comprises about70% of the Great Basin and contains its cover of shrubs, dominated in most places by greasewood, sage, andsaltbush, and occasionally barren bare soils (Malek et al., 1997).
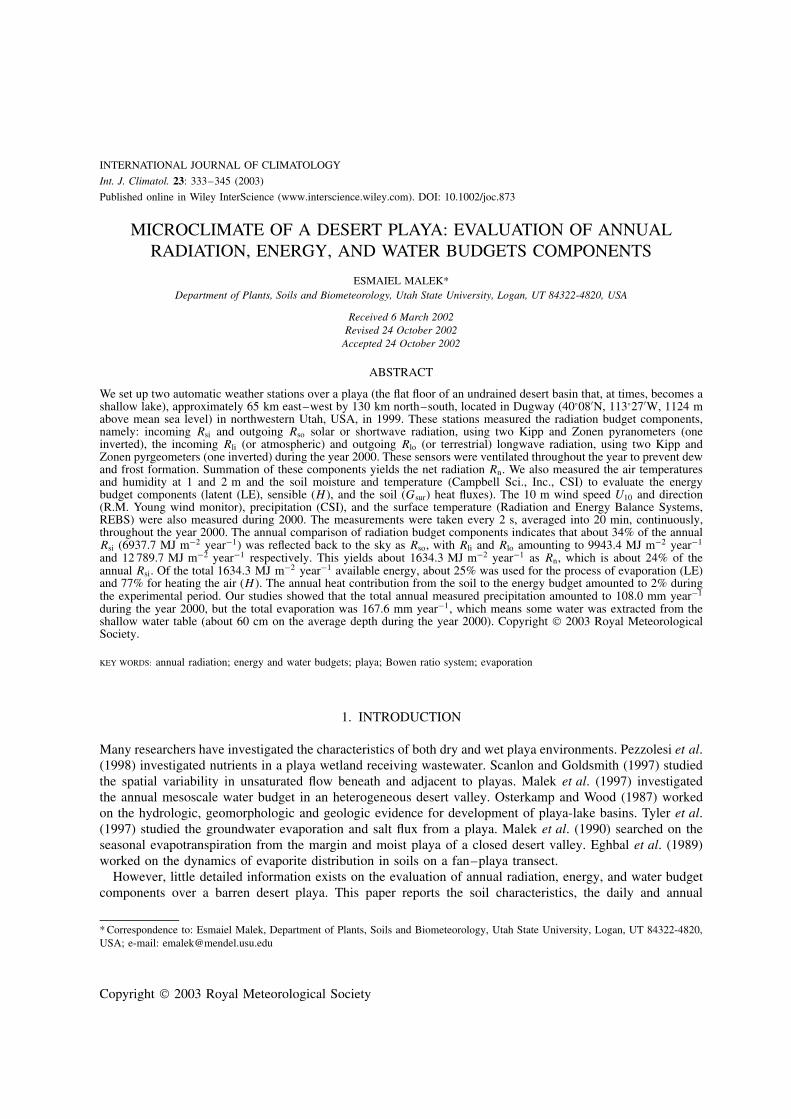
Figure 1 shows the position of the Great Basin, which covers most of the states of Nevada and Utah, andparts of the states of Colorado, Wyoming, Idaho, Oregon and California, in the western USA. The location ofthe experimental site (D), namely playa on the US Army Dugway Proving Ground test range, near Dugway(40°08′N, 113°27′W, 1124 m above mean sea level) in northwestern Utah, is also shown in Figure 1. Thisplaya is located in a vast, barren and flat floor of an undrained desert basin, with a size of approximately 65 kmeast–west by 130 km north–south, that becomes at times a shallow lake. Typical elevation variations on theplaya are less than 1 m km−1. Tables I and II show some of the soil properties at the experimental sites. Theplaya soil water-soluble extract shows much higher values for calcium, magnesium, sodium, potassium, boron,and sulphate-sulphur and an electrical conductivity of almost 35 times greater than that in an agricultural field.The predominance sodium in the playa soil gives it a lighter appearance. The water table in the playa variedfrom zero (after a heavy rain) to about 60 cm during hot, precipitation-free periods.
Table I. Some of the soil characteristics at the Dugway site
Station Water content on mass basis (%) Texture Density (kg m−3)
FC (1/3 atm)a PWP (15 atm)b
Dugway 32.3 21.6 Silty clay 1580
aFC: field capacity (the soil moisture content after the rate of drainage by gravity has markedlydecreased, measured at 1/3 atm).b PWP: permanent wilting point (the soil moisture content at which plants cannot recover overnightfrom excessive drying during the day, measured at 15 atm).
Table II. Some of the soil water-soluble extract characteristics at the Dugway experimental site and in an agriculturalfield
Site Electrical conductivity(dS m−1)
Ca(mg l−1)
Mg(mg l−1)
Na(mg l−1)
K(mg l−1)
B(mg l−1)
SO4-S(mg l−1)
Dugway 140 1019 1412 36 280 825 20 2125Agricultural field <4 30–50 0–20 30–50 <10 <0.2 0–20
Copyright 2003 Royal Meteorological Society Int. J. Climatol. 23: 333–345 (2003)
DESERT PLAYA MICROCLIMATE 335
0 km 500
500
1000
Omiles
PACIFICOCEAN
Washington
C o l u m b i a
PortlandJohn D
ayG R E A T
S A N D Y D E S E R T
H A R N E YB A S I N
Oregon
BLACKROCK
DESERT
GREAT BASIN
NevadaS
IER
RA
NE
VAD
A
snake
Boise
Butte
W y o m i n g
Utah
C o l o r a d o
W YO M I N GB A S I N
TwinFalls
GreatSalt Lake
UtahLake
Re
es
e
SevierLake
PyramidLake
ElyRenoCarson
CitySacramento
San Francisco
Owyhee
Tonopah
Boundary Peak4,005 m
Wendover
WinnemuccaElko
WalkerLake
Idaho
M o n t a n a
R O
C K
Y
M O
U N
T A
I N S
CO
LUM
BIA
PLATEAU
N
Cheyenne
Denver
Ogden
Gre
en
Pvovo
Salf Lake City
Cedar City
Arizona
California
Las VegasGrand
Canyon
Grand junction
Sev
ier
Co
lora
do
High mountain desert
GR
EA
TS
AL
TL
AK
ED
ES
ER
T
H um
beld
t
Figure 1. The Great Basin and locations of the three experimental sites, namely a playa in Dugway (D) in northwestern Utah
3. INSTRUMENTS AND METHODOLOGY
To evaluate the annual radiation, energy, and water budget components, we set up two automatic weatherstations over a playa in Dugway in 1999. These stations measured the incoming Rsi and outgoing Rso solaror shortwave radiation using two CM21 Kipp and Zonen pyranometers (one inverted), and the incomingRli (or atmospheric) and outgoing Rlo (or terrestrial) longwave radiation, using two CG1 Kipp and Zonenpyrgeometers (one inverted). The available or net energy Rn was then computed as
Rn = Rsi − Rso + Rli − Rlo (1)
The radiation sensors were ventilated with four CV2 Kipp and Zonen ventilation systems. The ventilated airwas heated at a rate of 5 W to prevent deposition of dew, frost and snow, which otherwise would disturbthe measurements, and to suppress the infrared offset, which is produced by cooling down of the glassdomes under clear sky conditions. The computed Rn (using Equation (1)) and that measured by a Q*7-1net radiometer (REBS) during dew-, snow- and frost-free periods are identical (Malek, 1997). The surfacetemperature and pressure were measured by an Everest 4000.4ZL infrared thermometer (REBS) and a CS105barometric pressure sensor (Campbell Sci., Inc., CSI) respectively.
We also measured the air temperatures and humidity at 1 and 2 m, using the Bowen ratio system (Bowen,1926), along with the soil moisture and temperature measurements, using the time domain resistance (TDR)
Copyright 2003 Royal Meteorological Society Int. J. Climatol. 23: 333–345 (2003)
336 E. MALEK
and soil thermocouples respectively (CSI). Detailed information about the performance of the Bowen ratiosystem was reported by Malek and Bingham (1993) and Malek et al. (1999). The air temperature and moisturegradients are needed to compute the Bowen ratio β, and the soil properties (temperature, moisture, density) arerequired to convert the measured soil heat flux at 8 cm G8cm to the soil surface heat flux Gsur (Malek, 1993).Having the available energy Rn, Gsur, and β, then the latent heat or evaporation LE and sensible heat H canbe evaluated. The Bowen ratio approach was applied for evaluation of evapotranspiration over agriculturalfields (Malek and Bingham, 1993) and in heterogeneous desert regions (Malek et al., 1997). Malek et al.(1999) used this system to estimate dew contribution in arid regions. The energy budget at the experimentalsite is expressed as
Rn = LE + H + Gsur (2)
All terms in Equation (2) are in W m−2 or J m−2 day−1. Other parameters measured at the experimentalsite were the 10 m wind speed U10 and direction (WD10) (R.M. Young Com.), and precipitation (CSI).Precipitation P is required to evaluate the water budget at the experimental site as
P = ETa + dS + R + D (3)
where ETa is the actual evaporation, dS is the change in the soil moisture content, R is the surface runoff andD is deep percolation. All terms in Equation (3) could be in mm day−1. Ignoring R and D during this dryyear, whenever there is no precipitation, the soil moisture is depleted and ETa = −dS. The validity of thisequation over agricultural and desert regions was reported by Malek and Bingham (1993) and Malek et al.(1997). They applied the Bowen ratio system to measure ETa and either the neutron probe method or TDR tomeasure dS. During wet years, possible surface runoff from the surrounding foothills should be considered.
ETa (m day−1) can be evaluated using the computed latent heat LE in J m−2 per unit time (for instance,20 min), divided by Lρw, where L (J kg−1) is the latent heat of vaporization, given by
L = 2 500 800 − 2366.8Tsur(°C) (4)
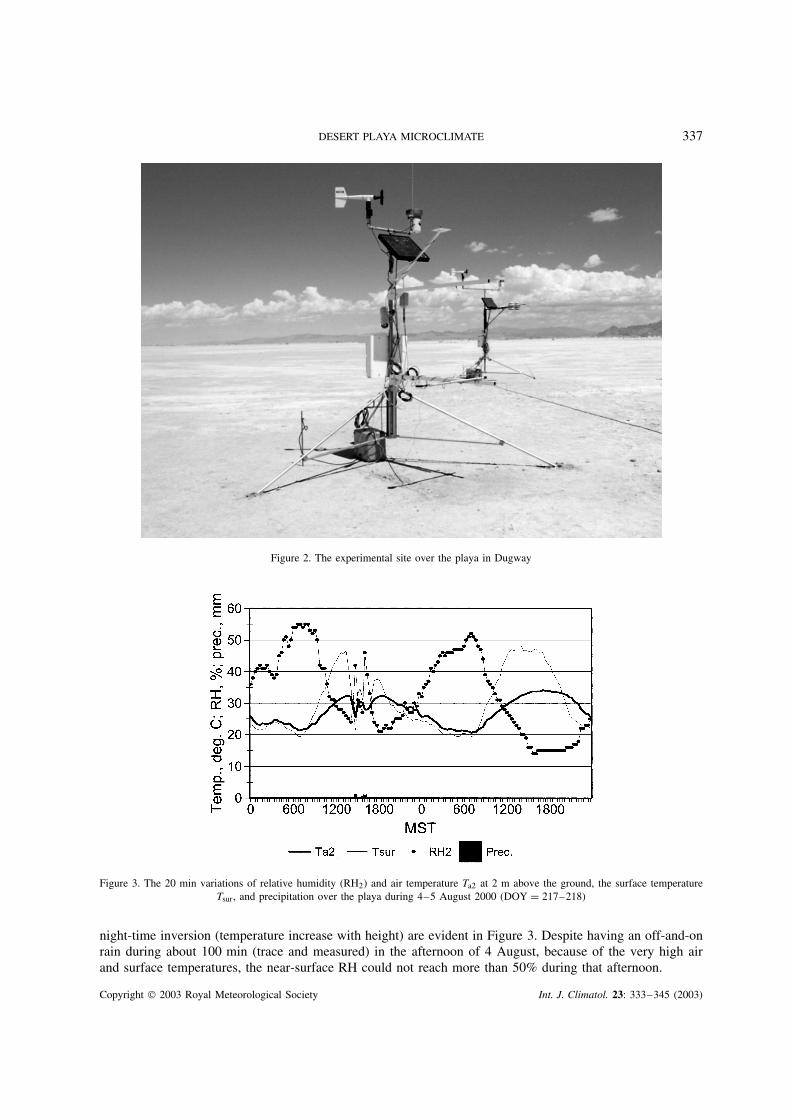
and ρw = 1000 kg m−3 is the density of liquid water (neglecting the effects of temperature change on ρw,less than 0.5% over the temperature range of 0–30 °C (Lide (1994)). All the measurements were done every2 s, averaged into 20 min, continuously, and stored in two 21X data loggers (CSI) throughout the year 2000.The data loggers were powered by deep-cycle batteries, which were charged by solar panels during the day.A 110 V AC power supply was also provided (as a back up) for proper operation of the batteries. Thesestations were contacted every day via phone to retrieve the data and check the status of the sensors. Figure 2shows the experimental site over the playa at Dugway.
4. RESULTS AND DISCUSSIONS
4.1. Radiation budget
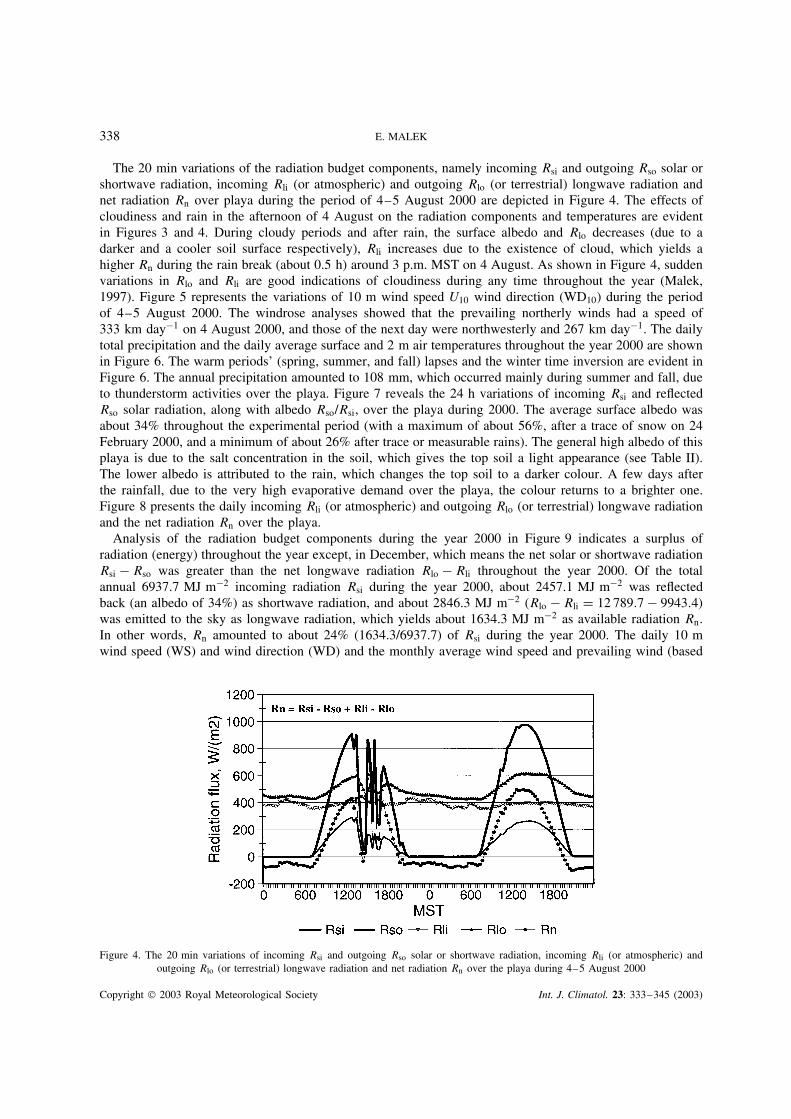
The highest late-afternoon surface temperature (Tsur = 54.8 °C at 3 p.m. on 1 August 2000) comparedwith the 2 m air temperature (Ta2 = 40.9 °C at 4 p.m. on the same day) and a very low moisture(RH2 = 8%) were measured in this desert playa during the experimental period. A super adiabatic lapserate [(54.8–40.9 °C)/(2 m) = 6.95 °C m−1, compared with the theoretical dry adiabatic value of 10 °C km−1]condition occurred in the dry and hot afternoon of 1 August 2000. The lowest early morning surfacetemperature (Tsur = −14.2 °C) and the 2 m air temperature (Ta2 = −13.5 °C) occurred at 7 a.m. and 7 : 20a.m. respectively on 8 February 2000. Figure 3 shows the 20 min Mountain Standard Time (MST) variationsof the 2 m relative humidity RH2 and air temperature Ta2, the surface temperature Tsur, and rain (Prec.) atthe experimental site during the period of 4–5 August 2000. The first day had a mid-afternoon showery rainfollowed by almost cloudless skies thereafter. The daytime lapse (temperature reduction with height) and the
Copyright 2003 Royal Meteorological Society Int. J. Climatol. 23: 333–345 (2003)
DESERT PLAYA MICROCLIMATE 337
Figure 2. The experimental site over the playa in Dugway
Figure 3. The 20 min variations of relative humidity (RH2) and air temperature Ta2 at 2 m above the ground, the surface temperatureTsur, and precipitation over the playa during 4–5 August 2000 (DOY = 217–218)
night-time inversion (temperature increase with height) are evident in Figure 3. Despite having an off-and-onrain during about 100 min (trace and measured) in the afternoon of 4 August, because of the very high airand surface temperatures, the near-surface RH could not reach more than 50% during that afternoon.
Copyright 2003 Royal Meteorological Society Int. J. Climatol. 23: 333–345 (2003)
338 E. MALEK
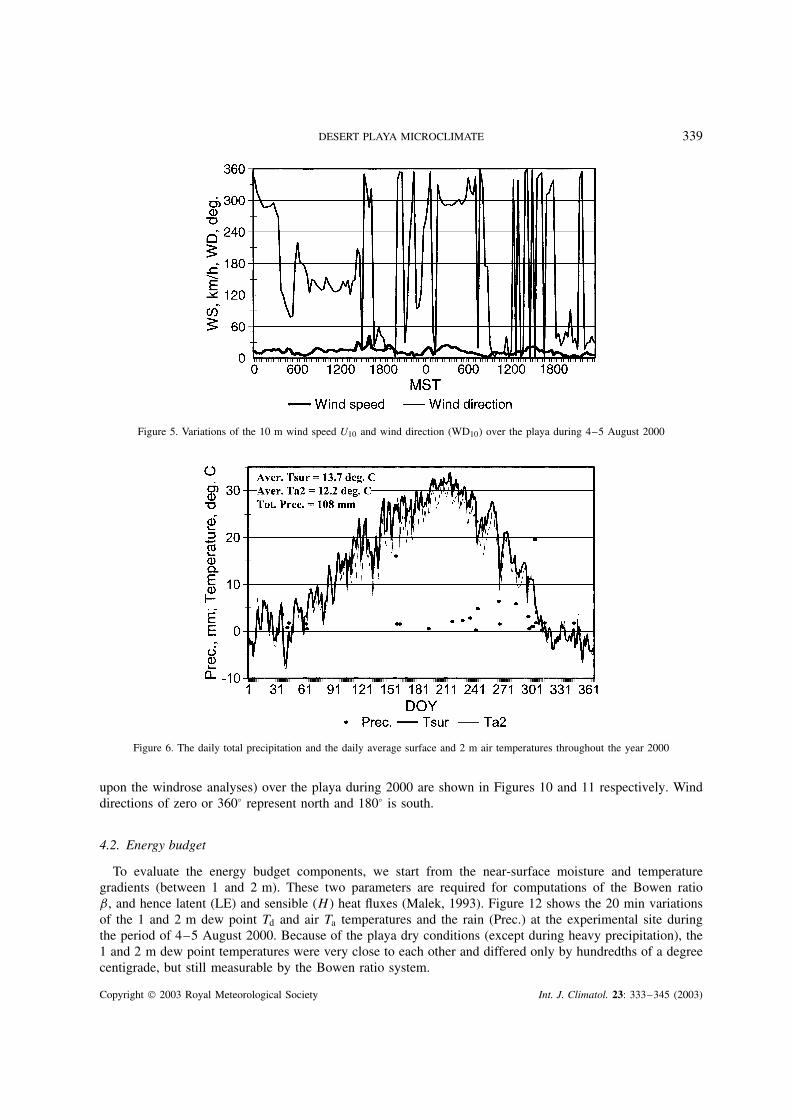
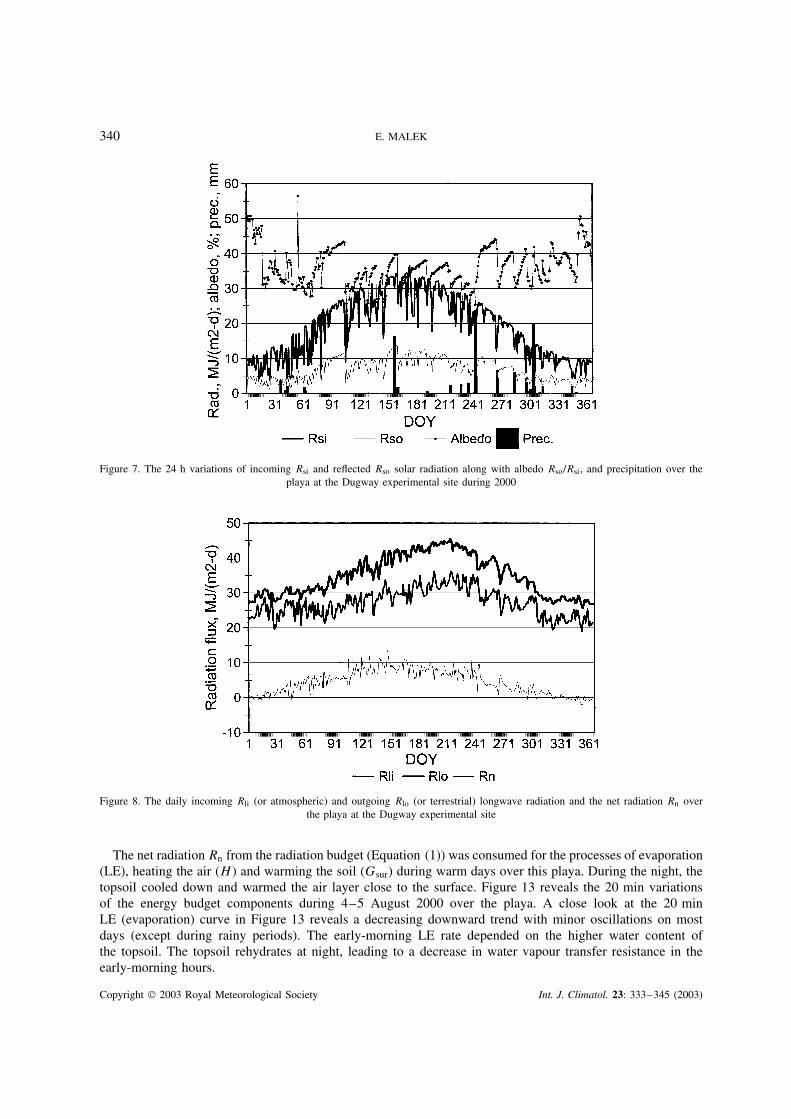
The 20 min variations of the radiation budget components, namely incoming Rsi and outgoing Rso solar orshortwave radiation, incoming Rli (or atmospheric) and outgoing Rlo (or terrestrial) longwave radiation andnet radiation Rn over playa during the period of 4–5 August 2000 are depicted in Figure 4. The effects ofcloudiness and rain in the afternoon of 4 August on the radiation components and temperatures are evidentin Figures 3 and 4. During cloudy periods and after rain, the surface albedo and Rlo decreases (due to adarker and a cooler soil surface respectively), Rli increases due to the existence of cloud, which yields ahigher Rn during the rain break (about 0.5 h) around 3 p.m. MST on 4 August. As shown in Figure 4, suddenvariations in Rlo and Rli are good indications of cloudiness during any time throughout the year (Malek,1997). Figure 5 represents the variations of 10 m wind speed U10 wind direction (WD10) during the periodof 4–5 August 2000. The windrose analyses showed that the prevailing northerly winds had a speed of333 km day−1 on 4 August 2000, and those of the next day were northwesterly and 267 km day−1. The dailytotal precipitation and the daily average surface and 2 m air temperatures throughout the year 2000 are shownin Figure 6. The warm periods’ (spring, summer, and fall) lapses and the winter time inversion are evident inFigure 6. The annual precipitation amounted to 108 mm, which occurred mainly during summer and fall, dueto thunderstorm activities over the playa. Figure 7 reveals the 24 h variations of incoming Rsi and reflectedRso solar radiation, along with albedo Rso/Rsi, over the playa during 2000. The average surface albedo wasabout 34% throughout the experimental period (with a maximum of about 56%, after a trace of snow on 24February 2000, and a minimum of about 26% after trace or measurable rains). The general high albedo of thisplaya is due to the salt concentration in the soil, which gives the top soil a light appearance (see Table II).The lower albedo is attributed to the rain, which changes the top soil to a darker colour. A few days afterthe rainfall, due to the very high evaporative demand over the playa, the colour returns to a brighter one.Figure 8 presents the daily incoming Rli (or atmospheric) and outgoing Rlo (or terrestrial) longwave radiationand the net radiation Rn over the playa.
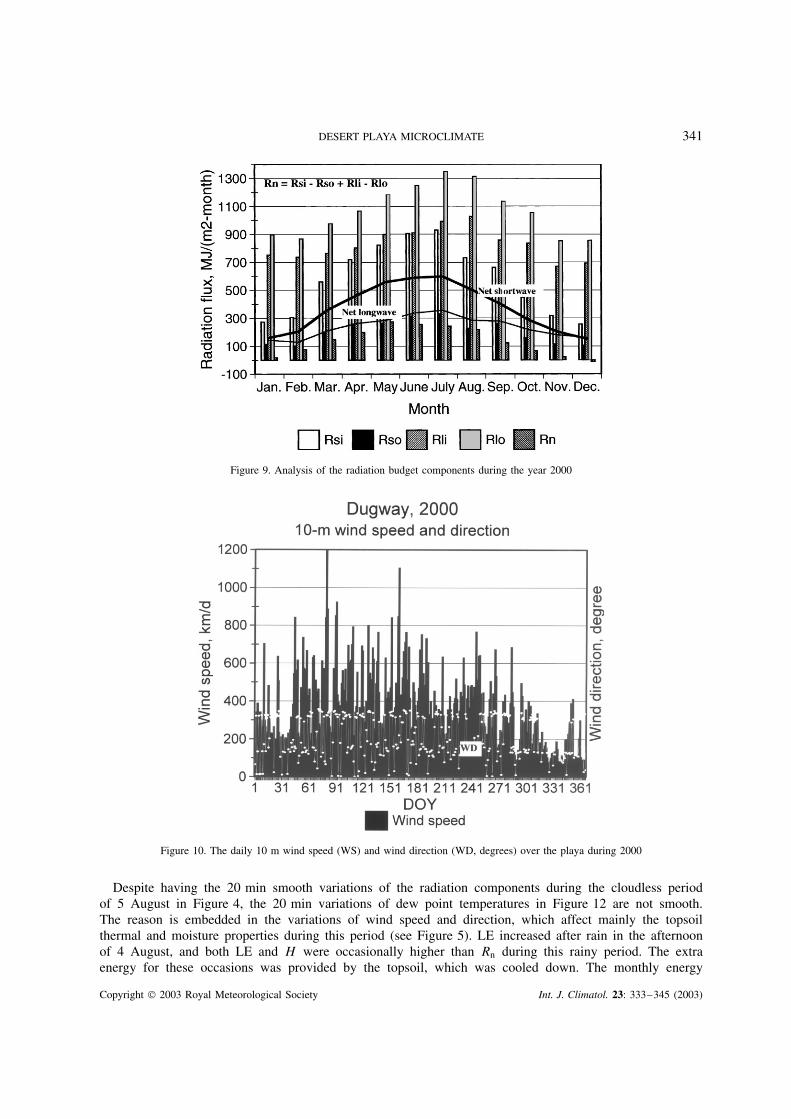
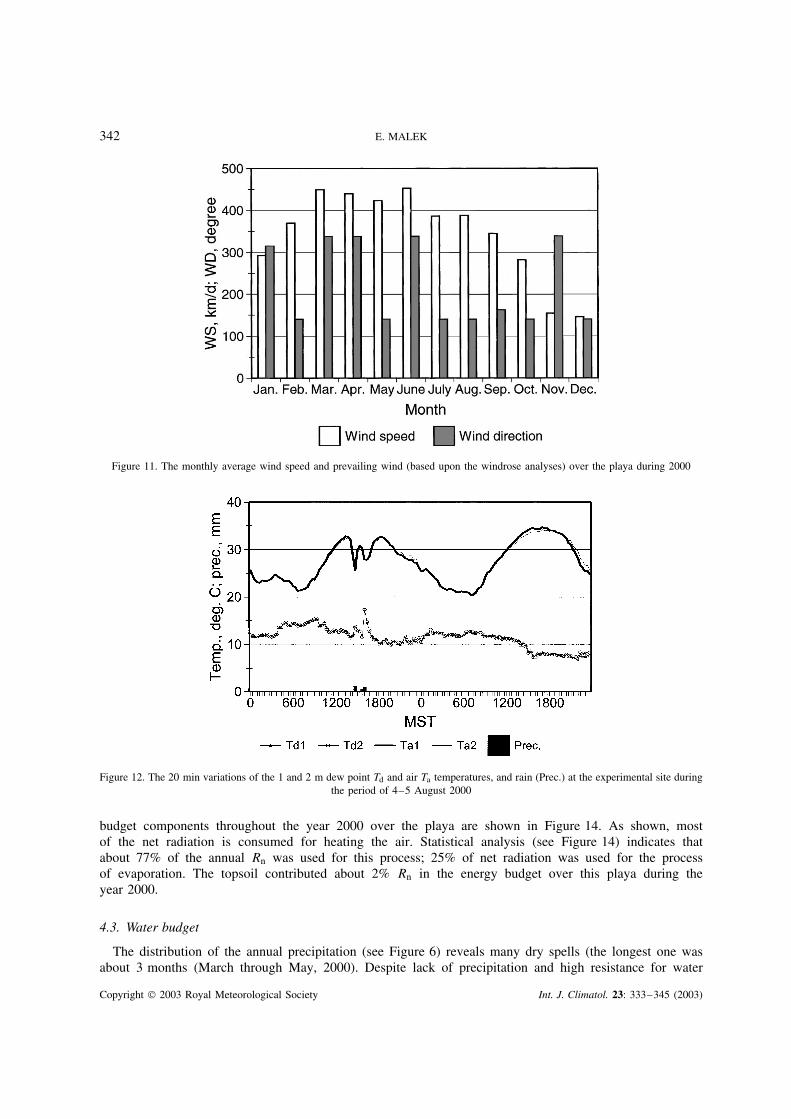
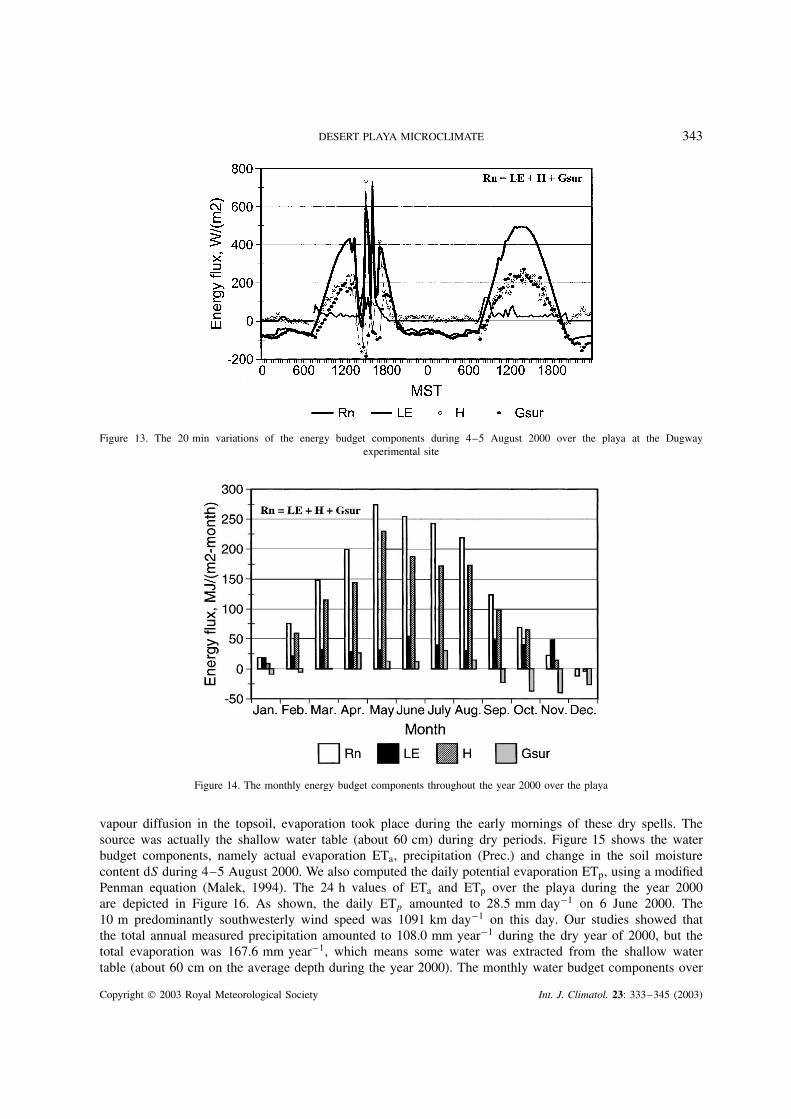
Analysis of the radiation budget components during the year 2000 in Figure 9 indicates a surplus ofradiation (energy) throughout the year except, in December, which means the net solar or shortwave radiationRsi − Rso was greater than the net longwave radiation Rlo − Rli throughout the year 2000. Of the totalannual 6937.7 MJ m−2 incoming radiation Rsi during the year 2000, about 2457.1 MJ m−2 was reflectedback (an albedo of 34%) as shortwave radiation, and about 2846.3 MJ m−2 (Rlo − Rli = 12 789.7 − 9943.4)was emitted to the sky as longwave radiation, which yields about 1634.3 MJ m−2 as available radiation Rn.In other words, Rn amounted to about 24% (1634.3/6937.7) of Rsi during the year 2000. The daily 10 mwind speed (WS) and wind direction (WD) and the monthly average wind speed and prevailing wind (based
Figure 4. The 20 min variations of incoming Rsi and outgoing Rso solar or shortwave radiation, incoming Rli (or atmospheric) andoutgoing Rlo (or terrestrial) longwave radiation and net radiation Rn over the playa during 4–5 August 2000
Copyright 2003 Royal Meteorological Society Int. J. Climatol. 23: 333–345 (2003)
DESERT PLAYA MICROCLIMATE 339
Figure 5. Variations of the 10 m wind speed U10 and wind direction (WD10) over the playa during 4–5 August 2000
Figure 6. The daily total precipitation and the daily average surface and 2 m air temperatures throughout the year 2000
upon the windrose analyses) over the playa during 2000 are shown in Figures 10 and 11 respectively. Winddirections of zero or 360° represent north and 180° is south.
4.2. Energy budget
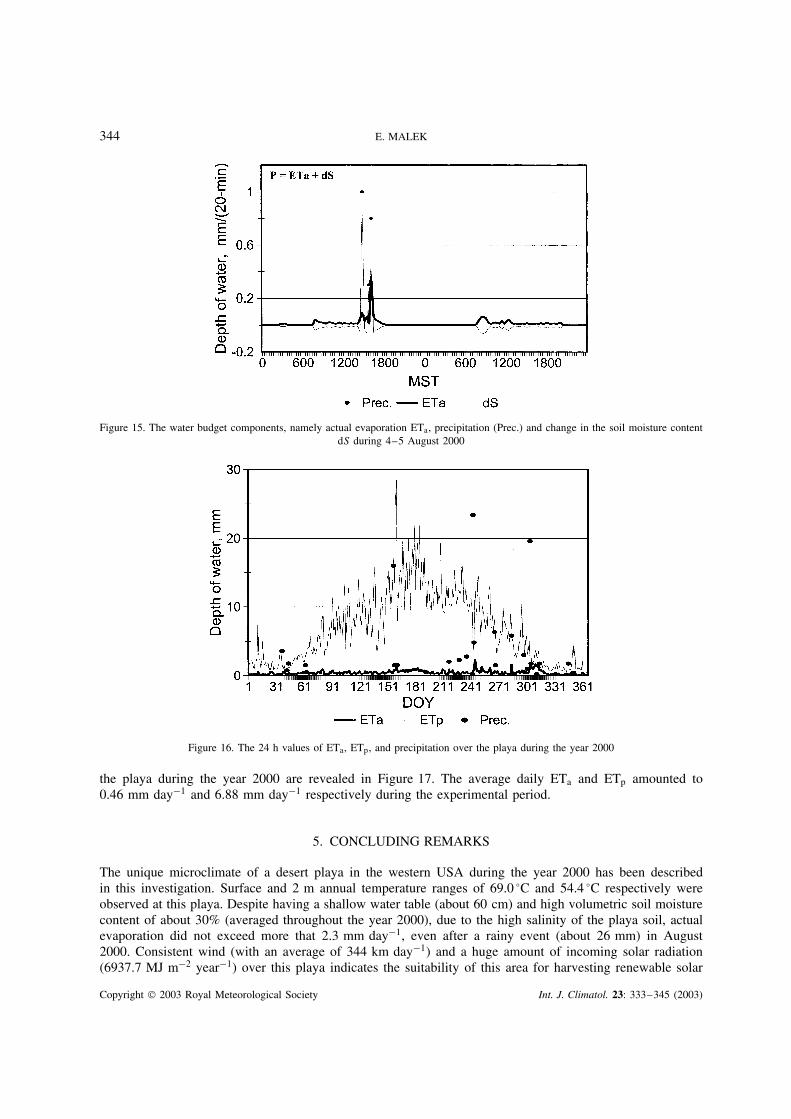
To evaluate the energy budget components, we start from the near-surface moisture and temperaturegradients (between 1 and 2 m). These two parameters are required for computations of the Bowen ratioβ, and hence latent (LE) and sensible (H ) heat fluxes (Malek, 1993). Figure 12 shows the 20 min variationsof the 1 and 2 m dew point Td and air Ta temperatures and the rain (Prec.) at the experimental site duringthe period of 4–5 August 2000. Because of the playa dry conditions (except during heavy precipitation), the1 and 2 m dew point temperatures were very close to each other and differed only by hundredths of a degreecentigrade, but still measurable by the Bowen ratio system.
Copyright 2003 Royal Meteorological Society Int. J. Climatol. 23: 333–345 (2003)
340 E. MALEK
Figure 7. The 24 h variations of incoming Rsi and reflected Rso solar radiation along with albedo Rso/Rsi, and precipitation over theplaya at the Dugway experimental site during 2000
Figure 8. The daily incoming Rli (or atmospheric) and outgoing Rlo (or terrestrial) longwave radiation and the net radiation Rn overthe playa at the Dugway experimental site
The net radiation Rn from the radiation budget (Equation (1)) was consumed for the processes of evaporation(LE), heating the air (H ) and warming the soil (Gsur) during warm days over this playa. During the night, thetopsoil cooled down and warmed the air layer close to the surface. Figure 13 reveals the 20 min variationsof the energy budget components during 4–5 August 2000 over the playa. A close look at the 20 minLE (evaporation) curve in Figure 13 reveals a decreasing downward trend with minor oscillations on mostdays (except during rainy periods). The early-morning LE rate depended on the higher water content ofthe topsoil. The topsoil rehydrates at night, leading to a decrease in water vapour transfer resistance in theearly-morning hours.
Copyright 2003 Royal Meteorological Society Int. J. Climatol. 23: 333–345 (2003)
DESERT PLAYA MICROCLIMATE 341
Figure 9. Analysis of the radiation budget components during the year 2000
Figure 10. The daily 10 m wind speed (WS) and wind direction (WD, degrees) over the playa during 2000
Despite having the 20 min smooth variations of the radiation components during the cloudless periodof 5 August in Figure 4, the 20 min variations of dew point temperatures in Figure 12 are not smooth.The reason is embedded in the variations of wind speed and direction, which affect mainly the topsoilthermal and moisture properties during this period (see Figure 5). LE increased after rain in the afternoonof 4 August, and both LE and H were occasionally higher than Rn during this rainy period. The extraenergy for these occasions was provided by the topsoil, which was cooled down. The monthly energy
Copyright 2003 Royal Meteorological Society Int. J. Climatol. 23: 333–345 (2003)
342 E. MALEK
Figure 11. The monthly average wind speed and prevailing wind (based upon the windrose analyses) over the playa during 2000
Figure 12. The 20 min variations of the 1 and 2 m dew point Td and air Ta temperatures, and rain (Prec.) at the experimental site duringthe period of 4–5 August 2000
budget components throughout the year 2000 over the playa are shown in Figure 14. As shown, mostof the net radiation is consumed for heating the air. Statistical analysis (see Figure 14) indicates thatabout 77% of the annual Rn was used for this process; 25% of net radiation was used for the processof evaporation. The topsoil contributed about 2% Rn in the energy budget over this playa during theyear 2000.
4.3. Water budget
The distribution of the annual precipitation (see Figure 6) reveals many dry spells (the longest one wasabout 3 months (March through May, 2000). Despite lack of precipitation and high resistance for water
Copyright 2003 Royal Meteorological Society Int. J. Climatol. 23: 333–345 (2003)
DESERT PLAYA MICROCLIMATE 343
Figure 13. The 20 min variations of the energy budget components during 4–5 August 2000 over the playa at the Dugwayexperimental site
Figure 14. The monthly energy budget components throughout the year 2000 over the playa
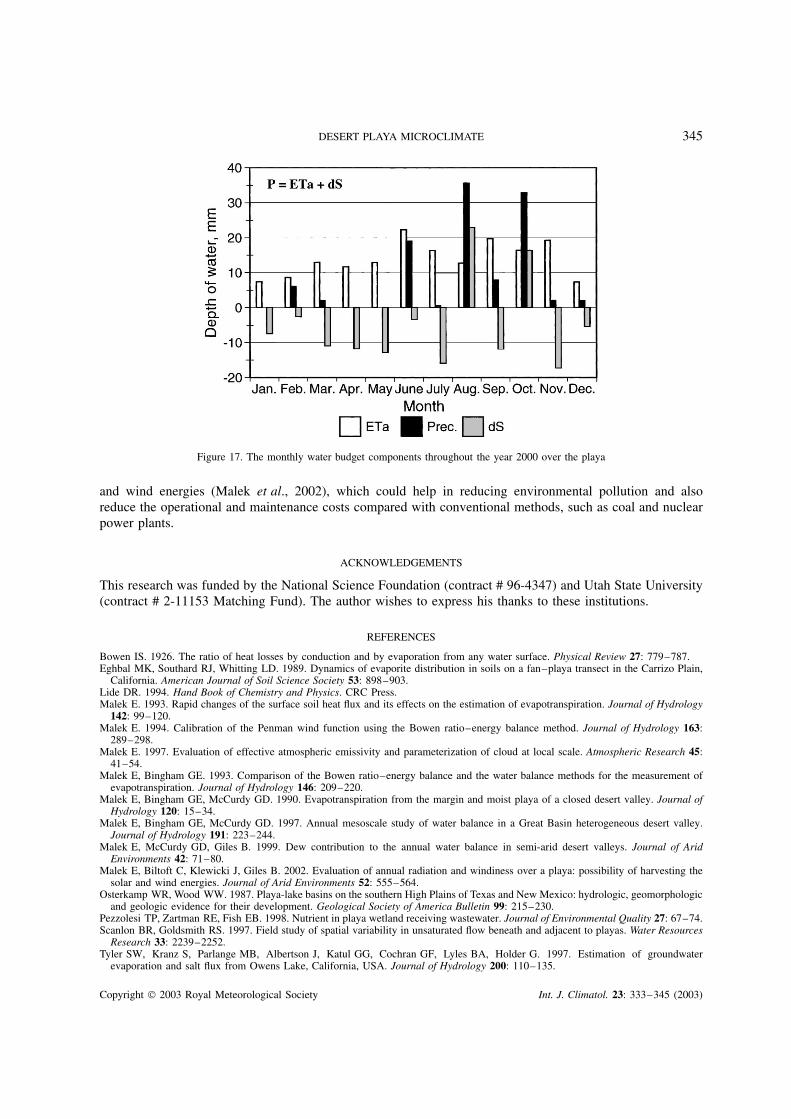
vapour diffusion in the topsoil, evaporation took place during the early mornings of these dry spells. Thesource was actually the shallow water table (about 60 cm) during dry periods. Figure 15 shows the waterbudget components, namely actual evaporation ETa, precipitation (Prec.) and change in the soil moisturecontent dS during 4–5 August 2000. We also computed the daily potential evaporation ETp, using a modifiedPenman equation (Malek, 1994). The 24 h values of ETa and ETp over the playa during the year 2000are depicted in Figure 16. As shown, the daily ETp amounted to 28.5 mm day−1 on 6 June 2000. The10 m predominantly southwesterly wind speed was 1091 km day−1 on this day. Our studies showed thatthe total annual measured precipitation amounted to 108.0 mm year−1 during the dry year of 2000, but thetotal evaporation was 167.6 mm year−1, which means some water was extracted from the shallow watertable (about 60 cm on the average depth during the year 2000). The monthly water budget components over
Copyright 2003 Royal Meteorological Society Int. J. Climatol. 23: 333–345 (2003)
344 E. MALEK
Figure 15. The water budget components, namely actual evaporation ETa, precipitation (Prec.) and change in the soil moisture contentdS during 4–5 August 2000
Figure 16. The 24 h values of ETa, ETp, and precipitation over the playa during the year 2000
the playa during the year 2000 are revealed in Figure 17. The average daily ETa and ETp amounted to0.46 mm day−1 and 6.88 mm day−1 respectively during the experimental period.
5. CONCLUDING REMARKS
The unique microclimate of a desert playa in the western USA during the year 2000 has been describedin this investigation. Surface and 2 m annual temperature ranges of 69.0 °C and 54.4 °C respectively wereobserved at this playa. Despite having a shallow water table (about 60 cm) and high volumetric soil moisturecontent of about 30% (averaged throughout the year 2000), due to the high salinity of the playa soil, actualevaporation did not exceed more that 2.3 mm day−1, even after a rainy event (about 26 mm) in August2000. Consistent wind (with an average of 344 km day−1) and a huge amount of incoming solar radiation(6937.7 MJ m−2 year−1) over this playa indicates the suitability of this area for harvesting renewable solar
Copyright 2003 Royal Meteorological Society Int. J. Climatol. 23: 333–345 (2003)
DESERT PLAYA MICROCLIMATE 345
Figure 17. The monthly water budget components throughout the year 2000 over the playa
and wind energies (Malek et al., 2002), which could help in reducing environmental pollution and alsoreduce the operational and maintenance costs compared with conventional methods, such as coal and nuclearpower plants.
ACKNOWLEDGEMENTS
This research was funded by the National Science Foundation (contract # 96-4347) and Utah State University(contract # 2-11153 Matching Fund). The author wishes to express his thanks to these institutions.
REFERENCES
Bowen IS. 1926. The ratio of heat losses by conduction and by evaporation from any water surface. Physical Review 27: 779–787.Eghbal MK, Southard RJ, Whitting LD. 1989. Dynamics of evaporite distribution in soils on a fan–playa transect in the Carrizo Plain,
California. American Journal of Soil Science Society 53: 898–903.Lide DR. 1994. Hand Book of Chemistry and Physics. CRC Press.Malek E. 1993. Rapid changes of the surface soil heat flux and its effects on the estimation of evapotranspiration. Journal of Hydrology
142: 99–120.Malek E. 1994. Calibration of the Penman wind function using the Bowen ratio–energy balance method. Journal of Hydrology 163:
289–298.Malek E. 1997. Evaluation of effective atmospheric emissivity and parameterization of cloud at local scale. Atmospheric Research 45:
41–54.Malek E, Bingham GE. 1993. Comparison of the Bowen ratio–energy balance and the water balance methods for the measurement of
evapotranspiration. Journal of Hydrology 146: 209–220.Malek E, Bingham GE, McCurdy GD. 1990. Evapotranspiration from the margin and moist playa of a closed desert valley. Journal of
Hydrology 120: 15–34.Malek E, Bingham GE, McCurdy GD. 1997. Annual mesoscale study of water balance in a Great Basin heterogeneous desert valley.
Journal of Hydrology 191: 223–244.Malek E, McCurdy GD, Giles B. 1999. Dew contribution to the annual water balance in semi-arid desert valleys. Journal of Arid
Environments 42: 71–80.Malek E, Biltoft C, Klewicki J, Giles B. 2002. Evaluation of annual radiation and windiness over a playa: possibility of harvesting the
solar and wind energies. Journal of Arid Environments 52: 555–564.Osterkamp WR, Wood WW. 1987. Playa-lake basins on the southern High Plains of Texas and New Mexico: hydrologic, geomorphologic
and geologic evidence for their development. Geological Society of America Bulletin 99: 215–230.Pezzolesi TP, Zartman RE, Fish EB. 1998. Nutrient in playa wetland receiving wastewater. Journal of Environmental Quality 27: 67–74.Scanlon BR, Goldsmith RS. 1997. Field study of spatial variability in unsaturated flow beneath and adjacent to playas. Water Resources
Research 33: 2239–2252.Tyler SW, Kranz S, Parlange MB, Albertson J, Katul GG, Cochran GF, Lyles BA, Holder G. 1997. Estimation of groundwater
evaporation and salt flux from Owens Lake, California, USA. Journal of Hydrology 200: 110–135.
Copyright 2003 Royal Meteorological Society Int. J. Climatol. 23: 333–345 (2003)
Related Documents


!['Real-time Urban Microclimate Analysis Using … Urban Microclimate Analysis Using Internet of Things ... In many IoT applications, ... urban microclimate monitoring [20]. To study](https://static.cupdf.com/doc/110x72/5ac834157f8b9aa3298bdae6/real-time-urban-microclimate-analysis-using-urban-microclimate-analysis-using.jpg)