MICROBIAL QUALITY OF RECREATIONAL WATER GUIDANCE NOTES Department of Health Produced with funding assistance from the Australian Government, Department of Health and Ageing Prepared by: Department of Health, Western Australia and The University of Western Australia October 2007 In Support of Chapter 5 of the NHMRC Guidelines for Managing Risks in Recreational Waters 2006

Welcome message from author
This document is posted to help you gain knowledge. Please leave a comment to let me know what you think about it! Share it to your friends and learn new things together.
Transcript
MICROBIAL QUALITYOF RECREATIONAL WATER GUIDANCE NOTES
Department of
Health
Produced with funding assistance from the Australian Government, Department of Health and AgeingPrepared by: Department of Health, Western Australia and The University of Western Australia October 2007
In Support of Chapter 5 of the NHMRC Guidelines for Managing Risks in Recreational Waters 2006
Manual Cover Design_A4 01.indd 1 16/10/2007 3:55:26 PM

MICROBIAL QUALITY OF RECREATIONAL
WATER
GUIDANCE NOTES
In support of Chapter 5 of the
National Health and Medical Research Council
Guidelines for Managing Risks in Recreational Water,
2006
Prepared by: Department of Health, Western Australia The University of Western Australia
October 2007
Produced with funding assistance from the
Australian Government, Department of Health and Ageing

The purpose of these ‘Guidance Notes’ is to provide supportive information to the practical application of chapter five of the National Health and Medical Research Council Guidelines for
Managing Risks in Recreational Waters.
These Guidance Notes have not been endorsed by the NHMRC.

Table of Contents
Page
1.0 INTRODUCTION 1
1.1 NHMRC Guidelines 1
1.2 Purpose 1
2.0 IMPLEMENTING THE NHMRC GUIDELINES 1
2.1 Step One: Sanitary Inspection 1
2.2 Step Two: Microbial Assessment Categories (95th Percentile) 2
2.3 Step Three: Recreational Water Quality Grades 3
3.0 TRIGGER LEVELS 5
3.1 Site Specific Trigger Levels 5
3.2 Generic Trigger Levels 6
4.0 FIELD OBSERVATION RECORD SHEET 6
5.0 EXCEPTIONAL CIRCUMSTANCES 7
6.0 TIPS TO GETTING STARTED 7
7.0 CD MATERIAL 8
8.0 FEEDBACK 8
9.0 REFERENCES 8
APPENDIX 1 SANITARY INSPECTION REPORT 11
APPENDIX 2 SANITARY INSPECTION REPORT INSTRUCTIONS 27
APPENDIX 3 ENTEROTESTER TEMPLATE 37
APPENDIX 4 INSTRUCTIONS FOR USING ENTEROTESTER TEMPLATE 39
APPENDIX 5 RESPONSE PLAN FOR ELEVATED RESULTS
APPENDIX 6 WASTEWATER OVERFLOW RESPONSE FLOW CHART 53
APPENDIX 7 FIELD OBSERVATION RECORD SHEET 55
51


1.0 INTRODUCTION 1.1 NHMRC Guidelines The ‘Guidelines for Managing Risks in Recreational Water’ (the Guidelines) were released by the National Health and Medical Research Council (NHMRC) in 2006. The Guidelines seek the adoption of a nationally harmonized approach using risk management to reduce hazards and risks associated with recreational water. Chapter 5 – ‘Microbial Quality of Recreational Water’ is important as it introduces risk assessment and management based on microbial and sanitary inspection classifications. However, while the Guidelines provide the framework on how to apply these principles there are some areas that need further information on interpretation and application. 1.2 Purpose The purpose of these ‘Guidance Notes’ is to provide supportive information to the application of the NHMRC Guidelines. The need for this supportive information arose from a workshop held in Perth, Western Australia in May 2007 at which State/Territory agencies attended. The agencies identified four areas they considered required further explanation to enable them to apply the relevant section of the Guidelines. The areas identified were:
1. A methodology for assigning sanitary inspection categories (see Section 5.4.1 of the Guidelines).
2. A methodology for calculating microbial assessment categories using the 95th percentile approach (see Section 5.3.2 of the Guidelines).
3. A ‘trigger level’ for action when elevated microbial results are obtained during routine sampling.
4. How to deal with ‘exceptional circumstances’. These guidance notes have been developed to cover the four areas identified above. Also, additional information is included which may assist agencies with interpretation and application of these specific areas. Your feedback would be appreciated as to the usefulness of the templates and the instructions provided. Please see Section 11 in these notes from more details on feedback.
2.0 IMPLEMENTING THE GUIDELINES If you intend to manage your recreational water bodies in accordance with the 2006 NHMRC Guidelines, there are three critical steps that need to be implemented. Guidance on how to apply each step is provided below. 2.1 Step One: Sanitary Inspection The aim of the sanitary inspection is detailed in Section 5.4.1 and Appendix 3 of the Guidelines. The recommended methodology for the sanitary inspection is the Water Services Association of Australia (WSAA) Occasional Paper No 8 – Catchments for Recreational Water: Conducting and Assessing Sanitary Inspections, May 2003. While this document provides a quantitative approach based on the scientific literature it is considered conservative in its estimates. Experiences from those agencies that have used this approach have found it tends to give an ‘over-estimation’ of the significance of faecal
1
1

contamination. This in turn has resulted in a ‘higher risk’ or ‘poorer’ assessment when applied to the sanitary inspection category. A modification on this approach is to obtain real time data for the sources listed in Table 4.1(WSAA, 2003) and replace this data for the concentration values shown in the Table. The most important consideration with the sanitary inspection is to understand and know what is going on in the catchments. This information should be collected overtime to provide as complete a picture as possible of the inputs from the catchments that may impact on the recreational water bodies. Stormwater drains can contribute a very significant pollution load to recreational water bodies and they need to be thoroughly assessed. Sewage overflows into these drains may go undetected. Therefore it is important to develop a good communication link with the relevant sewerage authority to advise on sewer overflows, breakdown in outfalls and pump station failures, all of which can have an impact if this pollution finds its way into recreational water bodies. The initial sanitary inspection can take the form of a ‘screening approach’. To assist in this regard a ‘Sanitary Inspection Report’ template, Appendix 1, has been developed and is provided on the CD attached to these notes. Also included is an instruction sheet, Appendix 2 to assist with the compilation of the report. This ‘screening approach’ is based on a qualitative assessment of faecal sources based on ‘consequence’ and ‘likelihood’ of a public health risk occurring. The sanitary inspection report is a very comprehensive report identifying all possible sources of pollution impacting on recreational water bodies. This report will become the historical document which can be referred to in the future, and will assist when undertaking annual sanitary inspections to see if circumstances have changed over time. The most important aspect of the sanitary inspection is to identify human faecal sources that are likely to pollute recreational water bodies. While animal sources may contribute a public health risk, these are not as significant (in most cases) as that of human origin. Table 4.3 (WSAA, 2003) provides infectivity factors for faecal pollution from animal sources. The significance of the sanitary inspection is that it identifies potential pollution sources. However, as the amount of microbiological data collected increases in numbers and begins to stabilise, more confidence can be given to the microbial results. When this occurs, the sanitary inspection will be of lesser significance unless there is a new pollution source identified during monitoring or at the annual inspection. Then the sanitary inspection becomes more important. Microbial monitoring may show a new source is impacting on the recreational water body. The health risk is what is in the water. 2.2 Step Two: Microbial Assessment Categories (95th Percentile) Section 5.3.2 of the Guidelines provides the rationale for using the 95th percentile approach to derive the microbial assessment categories as shown in Table 5.7. The two approaches suggested are the ‘parametric’ and ‘nonparametric’, and the appropriate formulae are shown. To assist with the calculation of the 95th percentile an Excel spreadsheet template referred to as the ‘Enterotester’, Appendix 3, and instructions, Appendix 4, for using it are provided on the CD with these notes. This enterotester has been designed by Dr Richard Lugg, Department of Health, Western Australia. Dr Lugg has been involved with recreational water issues for many years and was involved with the Farnham Consultation, Bathing Water Quality and Human Health: Faecal Pollution (2001) held at Farnham, UK. Following this consultation the World Health Organisation released its guidelines on recreational water.
Guidance Notes in Support of Chapter Five of the NHMRC Guidelines for Managing Risks in Recreational Waters
2
2

The enterotester is a simple to use spreadsheet and uses the parametric approach to calculate the 95th percentile. The reason for the parametric approach is as described by Dr Lugg ‘95th percentiles are a simple and readily comprehensible way of providing a summary representation of the bacterial (enterococci) distributions from which they are drawn. This is because they embody elements of both the location of the distribution (a measure the density of bacteria) and of its scale (a measure of the variability in the bacterial density). This means that they reflect both the average numbers, and the range of numbers, of the bacteria that are present in the water. If the bacteria are distributed lognormally in the water, the 95th percentile provides a summary index of two key statistical parameters, the geometric mean and the log standard deviation’. The minimum number of observations or sample results needed for the ‘Enterotester’ to work is 8 sample results. Table 1 below details the microbial assessment categories and the corresponding 95th percentile value, as shown in the Guidelines Table 5.7. Table 1: Microbial Assessment Categories (NHMRC Guidelines, p 75).
Category 95th percentile (enterococci)
Basis of derivation Estimation of probability
A ≤ 40 /100mL No illness seen in most epidemiological studies
GII risk: <1% AFRI risk: <0.3%
B 41-200 /100mL
200/100mL is above the illness threshold in most epidemiological studies
GII risk: 1-5% AFRI risk: 0.3-1.9%
C 201-500 /100mL
Substantial ↑ in risk of ad- verse effects where dose-response data available
GII risk: 5-10% AFRI risk: 1.9-3.9%
D >500 /100mL Significant risk of high levels of illness transmission
GII risk: >10% AFRI risk: >3.9%
GII: gastrointestinal illness AFRI: acute febrile respiratory illness
2.3 Step Three: Recreational Water Quality Grades The recreational water quality grade is determined from the matrix derived from the sanitary inspection category and the microbial assessment category. This grading is shown in Table 2 below (Table 5.13 of the Guidelines) and ranges from very good to very poor. Table 2: Classification matrix for faecal pollution of recreational water environments* (Table 5.13 of the Guidelines)
Microbiological Assessment Category (95th percentiles - intestinal enterococci /100mL)
Exceptional circumstancesc
A ≤40
B 41–200
C 201–500
D >500
Very low Very Good Very Good Follow upb Follow upb
Low Very Good Good Follow up Follow upb
Moderate Gooda Good Poor Poor
High Gooda Faira Poor Very Poor
Very high Follow upa Faira Poor
Very Poor
ACTION
Sanitary Inspection Category (suscept-
ibility to faecal influence)
Exceptional circumstancesc ACTION
3
3

a Indicates possible discontinuous/sporadic contamination (often driven by results such as rainfall). This is most commonly associated with the presence of combined sewer overflows. These results should be investigated further, and initial follow-up should include verification of the sanitary inspection category and ensuring that samples recorded include ‘event’ periods. Confirm analytical results, review possible analytical errors.
b Implies nonsewage sources of faecal indicators (eg livestock) which need to be verified. c Exceptional circumstances are known periods of higher risk, such as during an outbreak involving
a pathogen that may be waterborne (eg avian botulism – where outbreaks of avian botulism occur, swimming or other aquatic recreational activities should not be permitted), rupture of a sewer in a recreational water catchment etc. Under such circumstances, the classification matrix may not fairly represent risk/safety.
* In certain circumstances, there may be a risk of transmission of pathogens associated with more severe health effects through recreational water use. The human health risk depends greatly on specific (often local) circumstances. Public health authorities should be engaged in the identification and interpretation of such conditions.
Figure 5.1 of the Guidelines shows the three action levels applicable to these classification grades when considering the monitoring data results. To provide a further explanation of these terms, very good to very poor, a ‘traffic light’ approach of green, amber and red is described in Table 3. This approach may be useful when explaining to the public or the media the suitability of recreational water bodies. Green represents the safer areas to swim and red represents the recreational areas of higher risk. The definitions are a guide and can be changed to suit specific recreational water conditions e.g. coastal, river, estuarine and freshwater systems. Table 3: Definitions for Recreational Water Quality Grades Using the Traffic Light Approach
Very Good: Water is considered satisfactory for swimming at all times. Consistently very good water quality tests and very few potential faecal pollutant sources identified indicate that water quality at this location should be of a high standard. Good: Conditions are safe for swimming most of the time. Water quality tests are generally good on nearly all occasions and there are few potential faecal pollution sources identified. Standard advisories should be followed such as avoiding swimming 1 day after heavy rainfall (e.g. >10mm) in marine waters and up to 3 days after heavy rainfall in river and estuarine systems.
Fair: Conditions are generally okay for swimming, although water quality tests may show times of elevated bacteria mostly due to animal pollutant sources (e.g. bird faeces) and rainfall. Swimming should be avoided during and subsequent days following heavy rainfall (e.g. >10mm), and if the water is discoloured.
Poor: Conditions may not always be okay for swimming, as indicated by past results. The water can be affected by elevated bacteria, mostly during and following rainfall events, or due to animal pollutant sources (e.g. bird faeces). There may be a higher risk of illness if you ingest the water during these times, particularly by the very young, the very old and those with compromised immunity. Swimming or putting your head under the water should be avoided during these times. Other factors such as low dilution, tidal movement, wind direction and stormwater pollution may help pathogens survive longer in these waters. Very Poor: Avoid swimming at these locations, as there are direct discharges of faecal material. Permanent signage may be erected at the beach stating that swimming is not recommended.
Guidance Notes in Support of Chapter Five of the NHMRC Guidelines for Managing Risks in Recreational Waters
4
4

3.0. TRIGGER LEVELS The Guidelines do not provide specific guidance as to what level of elevated microbiological counts represents a Trigger level for action. Rather the Guidelines emphasise the risk management approach which relies on sanitary inspections and microbiological monitoring. The Guidelines do in Section 5.5.4 give some indication on how to deal with contamination triggered by specific events. Elevated results may occur during routine monitoring over the summer season. These elevated results can signify deterioration in water quality. Therefore at what elevated level is the ‘trigger’ requiring a response to investigate what could be the cause for such elevated results? In the absence of research into the area of establishing trigger levels, two methods for determining interim trigger levels are suggested and discussed below. 3.1 Site Specific Trigger Levels Based on Dr Lugg’s model (Section 2.2), it is suggested that site specific ‘Trigger levels’ be assigned to a recreational water body. Site specific trigger levels allow you to respond to unanticipated deterioration in water quality that is unusual for a specific site rather then using a generic trigger that is applied to all sites. There are two site specific trigger levels that can be calculated. These are:
1. One-off Trigger level (99th percentile): when the site specific enterococci count is exceeded after one sampling event. When this occurs: 1) Review field observation notes recorded on the day of sampling to determine a
cause for the elevated enterococci count 2) Re-sample the recreational water body on a daily basis where no obvious source of
faecal pollution is identified and 3) Undertake a sanitary inspection to establish a possible source of faecal pollution.
2. Two-in-a-row Trigger levels (90th percentile): when the site specific enterococci count is exceeded after two consecutive (within 24 hours) sampling events.
When this occurs: 1) Review field observation notes recorded on the day of sampling to determine a
cause for the elevated enterococci count 2) Re-sample the recreational water body on a daily basis where no obvious source of
faecal pollution is identified 3) Undertake a sanitary inspection to establish a possible source of faecal pollution 4) Erect health warning/advisory signage and 5) Inform the public through the media that a public health problem may exist.
These two ‘Trigger levels’ are built into the enterotester spreadsheet (Appendix 3). When the sampling data for a specific site is entered into the enterotester, the trigger level values will be automatically calculated for the sampling location. As a result, it will provide in advance, the recommended number of enterococci that must be reached in a sample before follow up action is required. If the re-sampling results return to background levels, and no change in condition is found following the sanitary inspection, continue routine monitoring. However, if results remain elevated, the source or cause must be identified and appropriate action taken. This may include signage at the site to advise the public on the safety of the recreational water body. A response plan for responding to elevated results triggered by (1) and (2) above is shown at Appendix 5.
5
5
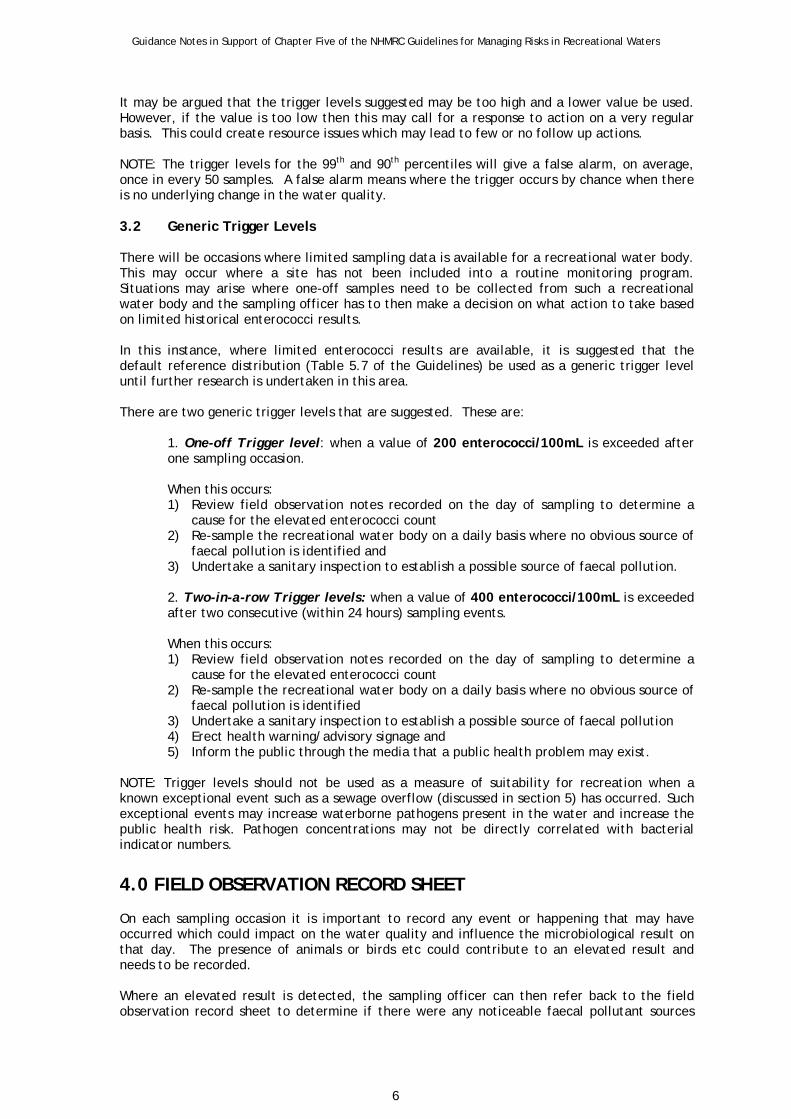
It may be argued that the trigger levels suggested may be too high and a lower value be used. However, if the value is too low then this may call for a response to action on a very regular basis. This could create resource issues which may lead to few or no follow up actions. NOTE: The trigger levels for the 99th and 90th percentiles will give a false alarm, on average, once in every 50 samples. A false alarm means where the trigger occurs by chance when there is no underlying change in the water quality. 3.2 Generic Trigger Levels There will be occasions where limited sampling data is available for a recreational water body. This may occur where a site has not been included into a routine monitoring program. Situations may arise where one-off samples need to be collected from such a recreational water body and the sampling officer has to then make a decision on what action to take based on limited historical enterococci results. In this instance, where limited enterococci results are available, it is suggested that the default reference distribution (Table 5.7 of the Guidelines) be used as a generic trigger level until further research is undertaken in this area. There are two generic trigger levels that are suggested. These are:
1. One-off Trigger level: when a value of 200 enterococci/100mL is exceeded after one sampling occasion. When this occurs: 1) Review field observation notes recorded on the day of sampling to determine a
cause for the elevated enterococci count 2) Re-sample the recreational water body on a daily basis where no obvious source of
faecal pollution is identified and 3) Undertake a sanitary inspection to establish a possible source of faecal pollution.
2. Two-in-a-row Trigger levels: when a value of 400 enterococci/100mL is exceeded after two consecutive (within 24 hours) sampling events.
When this occurs: 1) Review field observation notes recorded on the day of sampling to determine a
cause for the elevated enterococci count 2) Re-sample the recreational water body on a daily basis where no obvious source of
faecal pollution is identified 3) Undertake a sanitary inspection to establish a possible source of faecal pollution 4) Erect health warning/advisory signage and 5) Inform the public through the media that a public health problem may exist.
NOTE: Trigger levels should not be used as a measure of suitability for recreation when a known exceptional event such as a sewage overflow (discussed in section 5) has occurred. Such exceptional events may increase waterborne pathogens present in the water and increase the public health risk. Pathogen concentrations may not be directly correlated with bacterial indicator numbers. 4.0 FIELD OBSERVATION RECORD SHEET On each sampling occasion it is important to record any event or happening that may have occurred which could impact on the water quality and influence the microbiological result on that day. The presence of animals or birds etc could contribute to an elevated result and needs to be recorded. Where an elevated result is detected, the sampling officer can then refer back to the field observation record sheet to determine if there were any noticeable faecal pollutant sources
Guidance Notes in Support of Chapter Five of the NHMRC Guidelines for Managing Risks in Recreational Waters
6
6

identified on the day of sampling which may have caused the elevation. This information can assist the sampling officer in determining what response action is necessary. A “Field Observation Record Sheet’ is shown at Appendix 7, and is copied on the CD provided with these notes.
5.0. EXCEPTIONAL CIRCUMSTANCES In the Guidelines, Table 5.13 refers to ‘exceptional circumstances’ and a sub note at the bottom of the Table provides examples of such. The exceptional circumstances or event that is most likely to occur (from the microbiological aspect) is the rupture of a sewage line which discharges directly or indirectly into recreational water bodies. Agencies may have in place their own risk management plans to deal with such events. However to provide some guidance in this regard, a flow chart based on the approach taken by the Department of Health, Western Australia, is shown at Appendix 6. Also included in the CD is a Wastewater Overflow Response Plan developed by the Department. Factors to consider in dealing with an ‘exceptional circumstance’ may include:
• Identify area of spill – is it in a recreational water body, level of risk to users. • Estimate volume of spill. • When did it occur – is it still occurring. • Inspect water body – note wind direction, tidal movement, colouration, floating
material, location of recreational water body to spill area. • Closure of the area – determine distance and extent of area likely to be impacted, tape
off area, and erect warning signs. • Sampling – daily upstream and downstream of spill area. Sample at shoreline and out
in water body. • Liaison with media, groups and other agencies. • Debriefing session after cleanup with all agencies involved to assess outcomes and
Action Response Plan. Another example of an ‘exceptional event’ is where there is an abnormally high level of an infection (hepatitis A, cryptosporidiosis) within a community. If the sewage from such a community should enter a recreational water body then this risk may need specific attention. Liaison with communicable disease units will be important to ensure notification of unusual disease risks are made known. 6.0 TIPS TO GETTING STARTED If you intend to manage your recreational water bodies in accordance with the Guidelines, the following points may assist in starting your program if you have not already started:
1. Read Chapter 5 – Microbial Quality of Recreational Water’ in the Guidelines. 2. Identify the recreational water bodies which are used by the public for whole of body
contact activities. 3. Commence microbiological sampling of the recreational water bodies:
• Sampling should occur at least once per week during the summer season • Sampling should be undertaken at times when most frequented by the public
e.g. weekends, holiday seasons etc. • Aim to take at least 20 microbiological samples per summer season at each
recreational water body. 4. Undertake a comprehensive sanitary inspection of each catchment area surrounding a
recreational water body. Use the ‘Sanitary Inspection Report’ template as a screening approach to enable you to classify each site.
7
7
5. Review existing microbiological data, if available, for recreational water bodies and apply the 95th percentile using the ‘Enterotester’ to determine the microbial assessment category. If previous monitoring data is not available, build up the data set by weekly (or more frequent) sampling.
6. Based on 4 and 5 above, a ‘Provisional’ classification can be assigned to a recreational water body as described in the Guidelines.
7. Maintain a secure data storage base for all microbiological results and sanitary inspection reports.
7.0 CD MATERIAL The CD titled ‘Microbial Quality of Recreational Water – Instructions and Templates’ provided with these guidance notes has the following material on the CD:
• Microbial Quality of Recreational Water Guidance Notes. • Sanitary Inspection Report. • Instruction sheet on how to complete sanitary inspection report. • Enterotester Template for calculating 95th percentile. • Instructions for using Enterotester Template. • Exceptional Circumstances – Wastewater Overflow Response Plan. • Field Observation Record Sheet.
8.0 FEEDBACK The intention is to obtain the support, and feedback, of those agencies responsible for the management of recreational waters with the implementation of these identified areas over the forthcoming summer recreational water season. Your feedback on the use of the templates etc will be important to the development of final workable and verified templates that will be acceptable to agencies in the management of recreational water. Feed back will be sought from agencies at the end of the summer season, March/April 2008, as to the usefulness of the templates and other suggestions on implementation issues relating to the Guidelines. Ms Bree Abbott, Department of Health, Western Australia will be contacting agencies in this regard. Should you require further information on the material supplied or clarification on any issue, or wish to provide feedback, please contact Bree on Tel: (08) 9388 4963 or email: [email protected]
9.0 REFERENCES AS/NZS (2004). Risk Management AS/NZS 4360. Standards Australia/Standards New Zealand,
Sydney. DEC (2004) Beachwatch Programs: Monitoring and Reporting Coastal Recreational Water
Quality - Information Package and Field Manual. Department of Environment and Conservation (NSW), Sydney.
Green, A. and Doucette, J. (2006) Beach sediment and near-shore water microbial
contamination due to stormwater discharge at Sorrento Beach. University of Western Australia Honours thesis .
Guidance Notes in Support of Chapter Five of the NHMRC Guidelines for Managing Risks in Recreational Waters
8
8
HB 436:2004 Risk Management Guidelines – Companion to AS/NZS 4360:2004 Standards
Australia/Standards New Zealand, Sydney. NHMRC (2006). Guidelines for Managing Risks in Recreational Waters. National Health and
Medical Research Council, Australian Government Publishing Service, Canberra. Ministry for the Environment (2004) Recreational Water Quality Assessment Software
BatheWatch User Guide. National Institute of Water and Atmospheric Research, New Zealand.
Ministry for the Environment (2002). Microbiological Water Quality Guidelines for Marine and
Freshwater Recreational Areas, Ministry for the Environment, New Zealand. WHO (2003). Guidelines for Safe Recreational Water Environments Volume 1 Coastal and Fresh
Waters, WHO, Geneva. WSAA (2003). Catchments for Recreational Water: Conducting and Assessing Sanitary
Inspections Occasional Paper No. 8. Water Services Association of Australia.
Wyer, D., Kay, D., Fleisher, JM. (1999). An experimental health-related classification for marine waters. Water Research 33(3): 715-722.
9
9

1010
10

APPENDIX 1 - SANITARY INSPECTION REPORT PART A: DEFINE THE CATCHMENT AND RECREATIONAL WATER BODY NOTE: Recreational water body means any public coastal, estuarine or freshwater areas where a significant number of people use the water for recreation (or “whole of body contact”). 1. Site Identification Type of site: Estuarine Coastal Freshwater Other: Site Name: Site Address: Global Positioning Coordinates: Northing: Easting: Responsible Authority: Site Reference No.: Sample Site Global Positioning Coordinates (The exact location where sample is collected): Northing: Easting:
Sample Site Description (Describe the exact location where the sample is collected): Contact Person: Date: Has a previous sanitary inspection category (SIC) been assigned? Yes No
If yes, provide details (category and date of completion): 2. Physical Characteristics of the Recreational Water Body 2.1 Recreational Water Body Is there a beach (e.g. sand along the shoreline of the body of water) at this location? Yes No Define the approximate dimensions of the recreational water body used by the public for whole of body contact (define area on an aerial MAP): Length:
Mean Width: Area:
Describe characteristics of the immediate area surrounding the recreational water body e.g. trees along shoreline, reeds along river banks, reef, jetty: Direction of prevailing winds (Prevailing wind is the wind that blows most frequently across a particular region):
N NE NW E S SE SW W What level of dilution (e.g. mixing) occurs in the water?
High (high level of flushing and turn over of water, high tidal movement e.g. coastal beaches, estuaries) Low (low level of flushing and turn over of water, low tidal movement e.g. enclosed water bodies, small
lakes) 2.2 Land Cover and Geography Describe the main land cover and geography of the catchment (include the approximate percentage (%) of land cover within a 2km radius of site)
Residential _______ % Rural _______ % Landfill site ________ %
Commercial _______ % Parks, gardens, reserve, bush land _______ % Road/rail _______ %
Industrial ________% Specify: From your knowledge of the recreational water body, what are the potential faecal pollutant sources coming from the catchment? (e.g. sewage outfall, agricultural runoff) ATTACH MAP and PHOTOGRAPHS detailing physical characteristics of the immediate and surrounding areas.
11
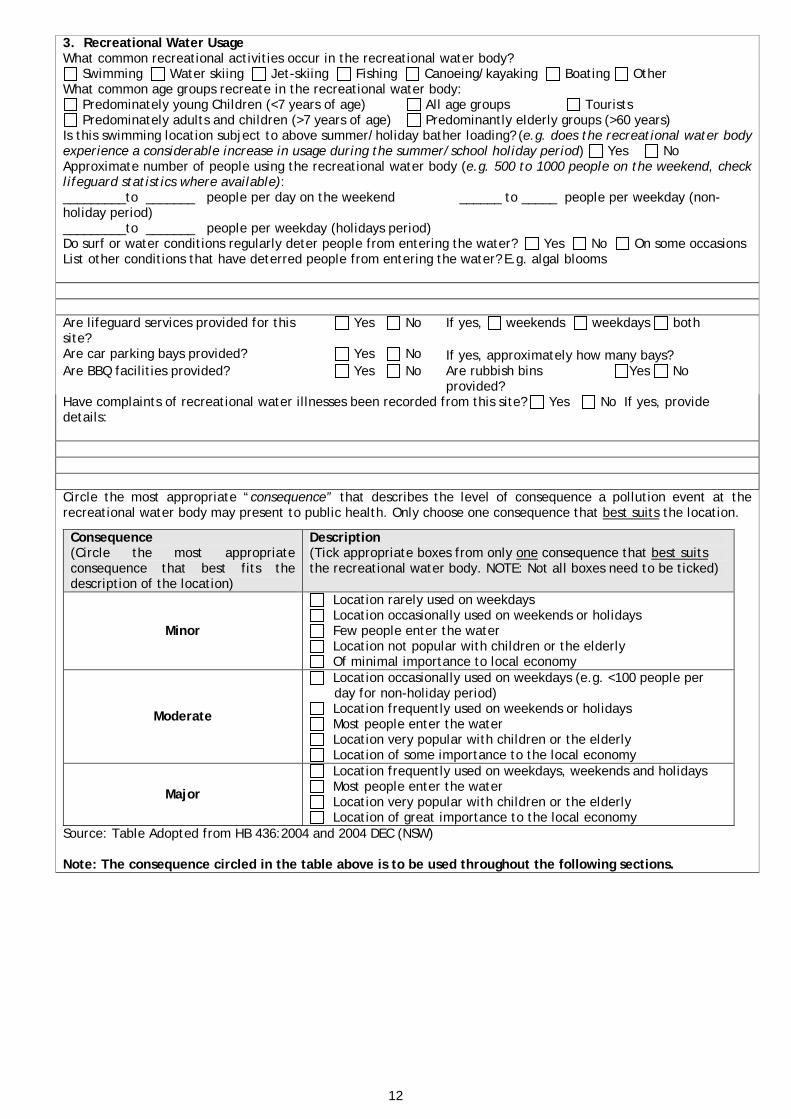
3. Recreational Water Usage What common recreational activities occur in the recreational water body?
Swimming Water skiing Jet-skiing Fishing Canoeing/kayaking Boating Other What common age groups recreate in the recreational water body:
Predominately young Children (<7 years of age) All age groups Tourists Predominately adults and children (>7 years of age) Predominantly elderly groups (>60 years)
Is this swimming location subject to above summer/holiday bather loading? (e.g. does the recreational water body experience a considerable increase in usage during the summer/school holiday period) Yes No Approximate number of people using the recreational water body (e.g. 500 to 1000 people on the weekend, check lifeguard statistics where available): _________to _______ people per day on the weekend ______ to _____ people per weekday (non-holiday period) _________to _______ people per weekday (holidays period) Do surf or water conditions regularly deter people from entering the water? Yes No On some occasions List other conditions that have deterred people from entering the water? E.g. algal blooms Are lifeguard services provided for this site?
Yes No If yes, weekends weekdays both
Are car parking bays provided? Yes No If yes, approximately how many bays? Are BBQ facilities provided? Yes No Are rubbish bins
provided? Yes No
Have complaints of recreational water illnesses been recorded from this site? Yes No If yes, provide details: Circle the most appropriate “consequence” that describes the level of consequence a pollution event at the recreational water body may present to public health. Only choose one consequence that best suits the location.
Source: Table Adopted from HB 436:2004 and 2004 DEC (NSW) Note: The consequence circled in the table above is to be used throughout the following sections.
Consequence (Circle the most appropriate consequence that best fits the description of the location)
Description (Tick appropriate boxes from only one consequence that best suits the recreational water body. NOTE: Not all boxes need to be ticked)
Minor
Location rarely used on weekdays Location occasionally used on weekends or holidays Few people enter the water Location not popular with children or the elderly Of minimal importance to local economy
Moderate
Location occasionally used on weekdays (e.g. <100 people per day for non-holiday period)
Location frequently used on weekends or holidays Most people enter the water Location very popular with children or the elderly Location of some importance to the local economy
Major
Location frequently used on weekdays, weekends and holidays Most people enter the water Location very popular with children or the elderly Location of great importance to the local economy
12
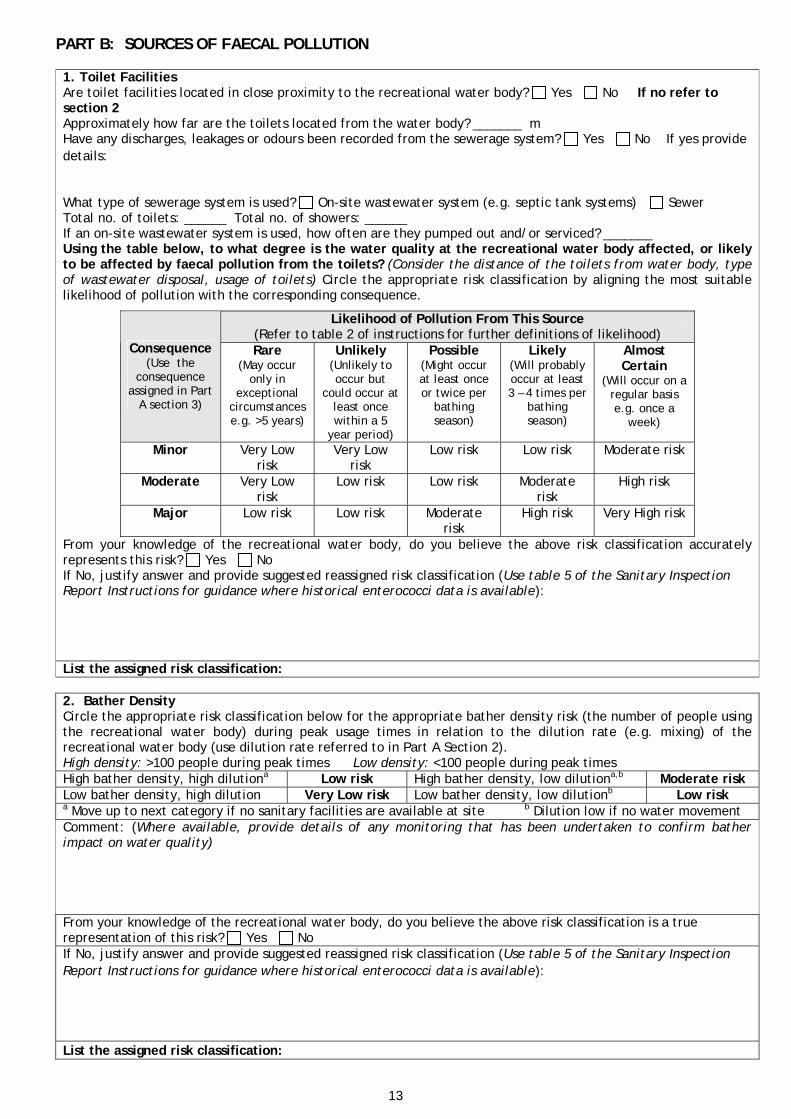
PART B: SOURCES OF FAECAL POLLUTION 1. Toilet Facilities Are toilet facilities located in close proximity to the recreational water body? Yes No If no refer to section 2 Approximately how far are the toilets located from the water body? _______ m Have any discharges, leakages or odours been recorded from the sewerage system? Yes No If yes provide details: What type of sewerage system is used? On-site wastewater system (e.g. septic tank systems) Sewer Total no. of toilets: ______ Total no. of showers: ______ If an on-site wastewater system is used, how often are they pumped out and/or serviced? _______ Using the table below, to what degree is the water quality at the recreational water body affected, or likely to be affected by faecal pollution from the toilets? (Consider the distance of the toilets from water body, type of wastewater disposal, usage of toilets) Circle the appropriate risk classification by aligning the most suitable likelihood of pollution with the corresponding consequence. Likelihood of Pollution From This Source
(Refer to table 2 of instructions for further definitions of likelihood) Consequence
(Use the consequence
assigned in Part A section 3)
Rare (May occur
only in exceptional
circumstances e.g. >5 years)
Unlikely(Unlikely to occur but
could occur at least once within a 5
year period)
Possible (Might occur at least once or twice per
bathing season)
Likely (Will probably occur at least 3 – 4 times per
bathing season)
Almost Certain
(Will occur on a regular basis e.g. once a
week)
Minor Very Low risk
Very Low risk
Low risk Low risk Moderate risk
Moderate Very Low risk
Low risk Low risk Moderate risk
High risk
Major Low risk Low risk Moderate risk
High risk Very High risk
From your knowledge of the recreational water body, do you believe the above risk classification accurately represents this risk? Yes No If No, justify answer and provide suggested reassigned risk classification (Use table 5 of the Sanitary Inspection Report Instructions for guidance where historical enterococci data is available): List the assigned risk classification:
2. Bather Density Circle the appropriate risk classification below for the appropriate bather density risk (the number of people using the recreational water body) during peak usage times in relation to the dilution rate (e.g. mixing) of the recreational water body (use dilution rate referred to in Part A Section 2). High density: >100 people during peak times Low density: <100 people during peak times High bather density, high dilutiona Low risk High bather density, low dilutiona,b Moderate risk Low bather density, high dilution Very Low risk Low bather density, low dilutionb Low risk a Move up to next category if no sanitary facilities are available at site b Dilution low if no water movement Comment: (Where available, provide details of any monitoring that has been undertaken to confirm bather impact on water quality) From your knowledge of the recreational water body, do you believe the above risk classification is a true representation of this risk? Yes No If No, justify answer and provide suggested reassigned risk classification (Use table 5 of the Sanitary Inspection Report Instructions for guidance where historical enterococci data is available): List the assigned risk classification:
13

3. Discharges of Wastewater 3.1 Sewage Outfalls Are sewage outfalls located within a 2km radius of the site? Yes No If no refer to section 3.2 If yes, outfall name: Global Positioning Coordinates: Northing: Easting: How far does the outfall discharge out into the water body? ______________________ How far is the outfall located from the recreational water body (are used by the public)? __________________ Attach specific details of the type of wastewater treatment and MAP of outfall schematics and location. Using the table below, circle the appropriate risk classification by aligning the type of outfall with the treatment applied:
Source: Table adopted from WHO Monitoring Bathing Waters – A Practical Guide to the Design and Implementation of Assessments and Monitoring Programmes na = not applicable a The risk is modified by population size. Risk is greater for discharges from large populations and less for discharges from small populations
This assumes that the design capacity has not been exceeded and that climatic and oceanic extreme conditions are considered in the design objective (ie no sewage on the beach zone) c Disinfection alone is inadequate d Additional investigation recommended to account for the likely lack of prediction with faecal indicator organisms as outlined in Table 5.7 of the Guidelines
Type of Outfall
Treatment (How is wastewater treated before being
discharged into offshore?)
Directa (Discharged directly
to recreational water body or adjacent area)
Shorta (Discharges within inter-tidal zone,
significant probability of sewage plume
reaching recreational water
body)
Long/Effectiveb
(Discharged several kilometres offshore, sufficient length and depth to ensure low
probability of sewage plume reaching
recreational water body)
No treatment (raw sewage) Very High High Na Preliminary (filtration with milli- or micro-screens)
Very High High Low
Primary (physical sedimentation) Very High High Low Secondary (primary + trickling filter/activated sludge)
High High Low
Secondary + disinfection (primary + trickling filter/activated sludge + disinfection)c,d
Moderate Moderate Very Low
Tertiary (secondary + coagulation-sand filtration)
Moderate Moderate Very Low
Tertiary + disinfection (secondary + coagulation-sand filtration + disinfection)
Very Low Very Low Very Low
Lagoons (low-rate biological treatment) High High Low
Is wastewater discharged at the outfall monitored regularly for microbiological quality? Yes No Provide comments on monitoring program (List program name, responsible authority, overview of monitoring results): Have any signs of sewage pollution been reported at the recreational water body? Yes No If yes, provide details:
14

Using the table below, to what degree is water quality at the recreational water body affected or likely to be affected by onshore winds, currents or tides carrying polluted wastewater into the area? Circle the appropriate risk classification by aligning the most suitable likelihood of pollution with the corresponding consequence.
Likelihood of Pollution From This Source (Refer to table 2 of instructions for further definitions of likelihood)
Consequence (Use the
consequence assigned in Part
A section 3)
Rare (May occur
only in exceptional
circumstances e.g. >5 years)
Unlikely(Unlikely to occur but
could occur at least once within a 5
year period)
Possible (Might occur at least once or twice per
bathing season)
Likely (Will probably occur at least 3 – 4 times per
bathing season)
Almost Certain
(Will occur on a regular basis e.g. once a
week)
Minor Very Low risk
Very Low risk
Low risk Low risk Moderate risk
Moderate Very Low risk
Low risk Low risk Moderate risk
High risk
Major Low risk Low risk Moderate risk
High risk Very High risk
From your knowledge of the recreational water body, do you believe the above risk classification is a true representation of this risk? Yes No If No, justify answer and provide suggested reassigned risk classification (Use table 5 of the Sanitary Inspection Report Instructions for guidance where historical enterococci data is available): Where available ATTACH CHARTS detailing ocean currents and tides. 3.2 Sewerage System Are pumping stations located within a 1km radius of the site? (1km is an approximate estimation and can be increased or decreased depending on the catchment) Yes No If no refer to section 3.3 If yes, provide pump station location(s) and ATTACH MAP detailing locations: Are pump station(s) fitted with emergency overflow alarms? (Confirm with appropriate agency)
Yes No Comment (Last time alarms checked for compliance): In the event that pumping station overflow alarms fail, where will wastewater be diverted (e.g. into stormwater system, retention basin)? 3.3 On-Site Wastewater Systems (e.g. septic tanks, aerobic treatment units) Are surrounding properties using on-site wastewater systems? (Look at a distance of at least a 100m radius from the recreational water body) Yes No If no refer to section 3.4 If yes, ATTACH MAP detailing approximate on-site system locations. How far is the nearest on-site disposal system from the recreational water body (not including onsite toilet facilities discussed in Part B.1)? Have specific studies been undertaken to determine whether on-site wastewater systems are contributing to faecal pollution of the recreational water body? Yes No If yes, provide details: Using the table below, to what degree is water quality at the recreational water body affected, or likely to be affected by contamination from on-site wastewater systems? (Consider the distance from water body) Circle the appropriate risk classification by aligning the most suitable likelihood of pollution with the corresponding consequence.
Likelihood of Pollution From This Source (Refer to table 2 of instructions for further definitions of likelihood)
Consequence (Use the
consequence assigned in Part
A section 3)
Rare (May occur
only in exceptional
circumstances e.g. >5 years)
Unlikely(Unlikely to occur but
could occur at least once within a 5
year period)
Possible (Might occur at least once or twice per
bathing season)
Likely (Will probably occur at least 3 – 4 times per
bathing season)
Almost Certain
(Will occur on a regular basis e.g. once a
week)
Minor Very Low risk
Very Low risk
Low risk Low risk Moderate risk
Moderate Very Low risk
Low risk Low risk Moderate risk
High risk
Major Low risk Low risk Moderate risk
High risk Very High risk
15

From your knowledge of the recreational water body, do you believe the above risk classification is a true representation of this risk? Yes No If No, justify answer and provide suggested reassigned risk classification (Use table 5 of the Sanitary Inspection Report Instructions for guidance where historical enterococci data is available): 3.4 Wastewater Reuse Are there areas where reuse of wastewater occurs within a 100m radius of the recreational water body? (e.g. To irrigate local parks and gardens) Yes No Is wastewater treated (e.g. chlorination) prior to application? Yes No How far is the wastewater reuse area from the recreational water body? ___________ Using the table below, to what degree is water quality at the bathing site affected, or likely to be affected by contamination from nearby wastewater reuse application? (Consider the distance from water body) Circle the appropriate risk classification by aligning the most suitable likelihood of pollution with the corresponding consequence.
Likelihood of Pollution From This Source (Refer to table 2 of instructions for further definitions of likelihood)
Consequence (Use the
consequence assigned in Part
A section 3)
Rare (May occur
only in exceptional
circumstances e.g. >5 years)
Unlikely(Unlikely to occur but
could occur at least once within a 5
year period)
Possible (Might occur at least once or twice per
bathing season)
Likely (Will probably occur at least 3 – 4 times per
bathing season)
Almost Certain
(Will occur on a regular basis e.g. once a
week)
Minor Very Low risk
Very Low risk
Low risk Low risk Moderate risk
Moderate Very Low risk
Low risk Low risk Moderate risk
High risk
Major Low risk Low risk Moderate risk
High risk Very High risk
From your knowledge of the recreational water body, do you believe the above risk classification is a true representation of this risk? Yes No If No, justify answer and provide suggested reassigned risk classification (Use table 5 of the Sanitary Inspection Report Instructions for guidance where historical enterococci data is available): List the highest ranked risk classification from section 3.1, 3.3 and 3.4:
4. Stormwater Discharge (wet weather) Do stormwater drains discharge into the recreational water body? (Look at a distance of at least a 500m radius either side of the sampling site. 500m is a general approximation and can be increased, or decreased depending on the nature of the recreational water body) Yes No If no refer to section 5 If yes, ATTACH MAP detailing stormwater discharge locations DRAIN 1: Global Positioning Coordinates: Northing: Easting: Agency responsible for management of stormwater drain: Is the drain piped or open? Piped Open Both Where does the drain discharge? (e.g. sand dunes, directly into water) __________________________________________________________________________________________________ How often does the drain flow? Following rainfall Constantly Unsure (If unsure investigate further) Is the drain fitted with a pollutant trap? Yes No Has any monitoring for bacterial indicators been undertake at the outlet? Yes No (If no investigate further) If yes, provide details of monitoring: Provide a description of possible faecal sources that may discharge into drain e.g. drain subject to excess faecal load from agricultural area:
16
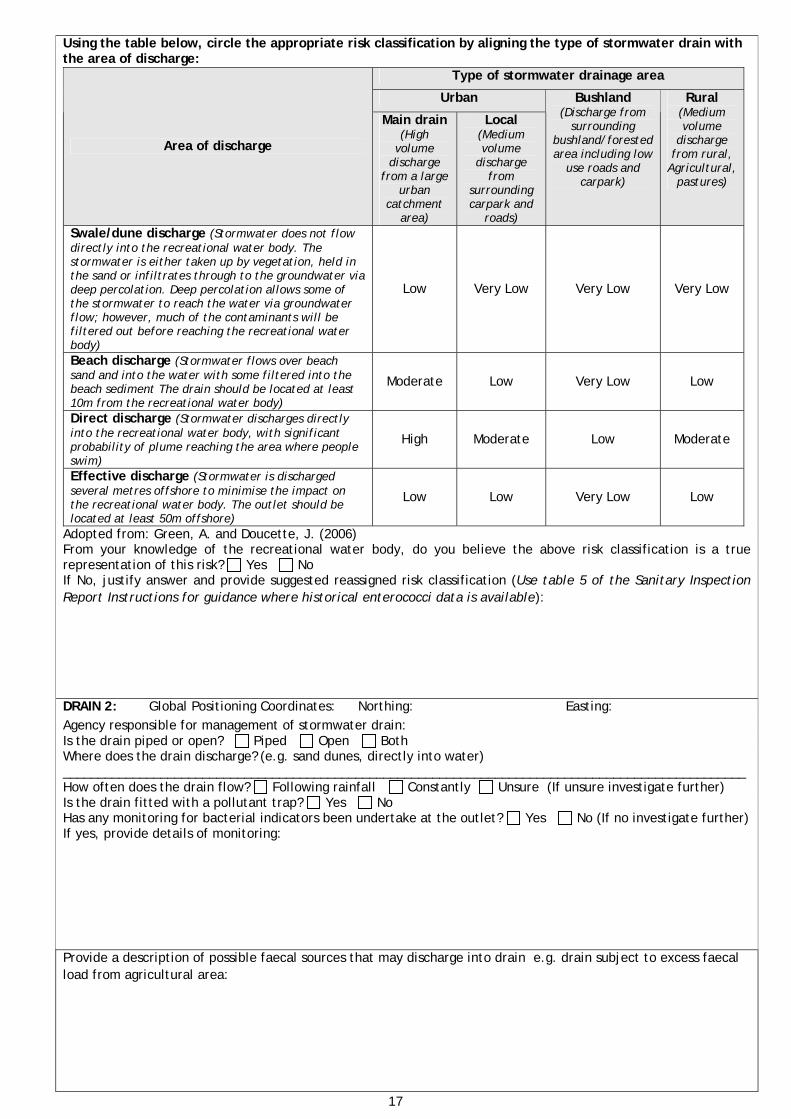
Using the table below, circle the appropriate risk classification by aligning the type of stormwater drain with the area of discharge:
Type of stormwater drainage area
Urban
Area of discharge
Main drain(High
volume discharge
from a large urban
catchment area)
Local(Medium volume
discharge from
surrounding carpark and
roads)
Bushland (Discharge from
surrounding bushland/forested area including low
use roads and carpark)
Rural (Medium volume
discharge from rural,
Agricultural, pastures)
Swale/dune discharge (Stormwater does not flow directly into the recreational water body. The stormwater is either taken up by vegetation, held in the sand or infiltrates through to the groundwater via deep percolation. Deep percolation allows some of the stormwater to reach the water via groundwater flow; however, much of the contaminants will be filtered out before reaching the recreational water body)
Low Very Low Very Low Very Low
Beach discharge (Stormwater flows over beach sand and into the water with some filtered into the beach sediment The drain should be located at least 10m from the recreational water body)
Moderate Low Very Low Low
Direct discharge (Stormwater discharges directly into the recreational water body, with significant probability of plume reaching the area where people swim)
High Moderate Low Moderate
Effective discharge (Stormwater is discharged several metres offshore to minimise the impact on the recreational water body. The outlet should be located at least 50m offshore)
Low Low Very Low Low
Adopted from: Green, A. and Doucette, J. (2006) From your knowledge of the recreational water body, do you believe the above risk classification is a true representation of this risk? Yes No If No, justify answer and provide suggested reassigned risk classification (Use table 5 of the Sanitary Inspection Report Instructions for guidance where historical enterococci data is available): DRAIN 2: Global Positioning Coordinates: Northing: Easting: Agency responsible for management of stormwater drain: Is the drain piped or open? Piped Open Both Where does the drain discharge? (e.g. sand dunes, directly into water) __________________________________________________________________________________________________ How often does the drain flow? Following rainfall Constantly Unsure (If unsure investigate further) Is the drain fitted with a pollutant trap? Yes No Has any monitoring for bacterial indicators been undertake at the outlet? Yes No (If no investigate further) If yes, provide details of monitoring: Provide a description of possible faecal sources that may discharge into drain e.g. drain subject to excess faecal load from agricultural area:
17
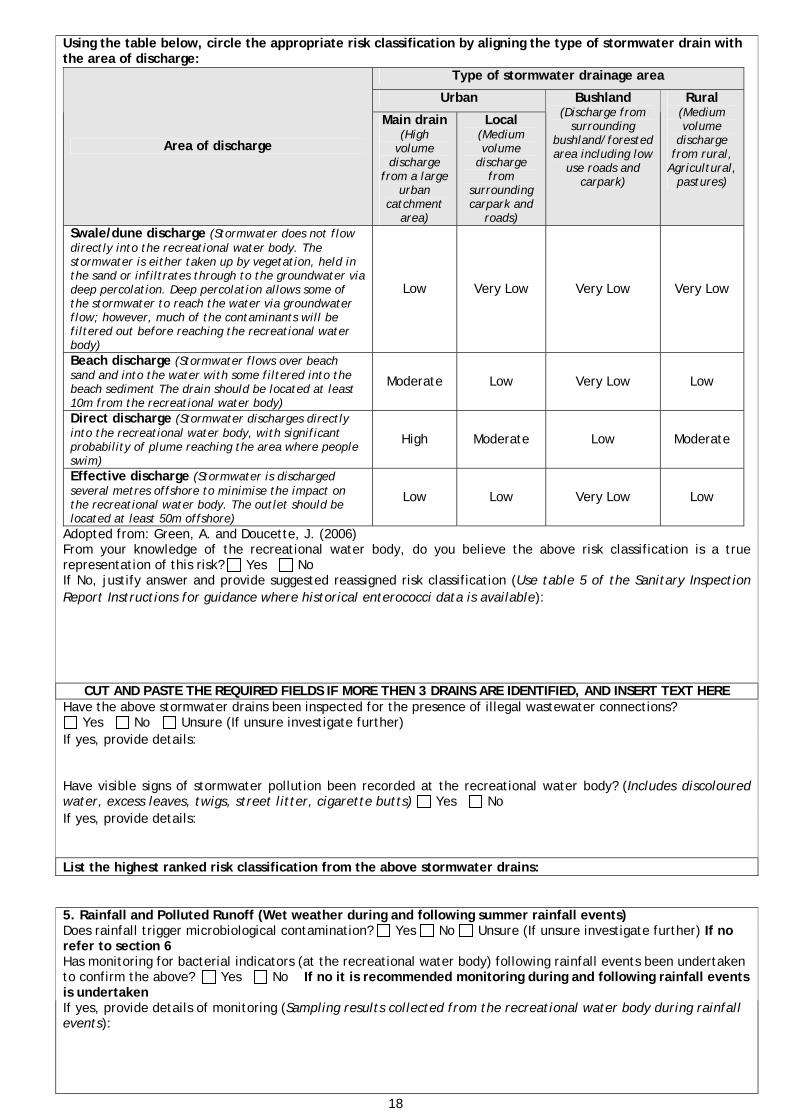
Using the table below, circle the appropriate risk classification by aligning the type of stormwater drain with the area of discharge:
Type of stormwater drainage area
Urban
Area of discharge
Main drain(High
volume discharge
from a large urban
catchment area)
Local(Medium volume
discharge from
surrounding carpark and
roads)
Bushland (Discharge from
surrounding bushland/forested area including low
use roads and carpark)
Rural (Medium volume
discharge from rural,
Agricultural, pastures)
Swale/dune discharge (Stormwater does not flow directly into the recreational water body. The stormwater is either taken up by vegetation, held in the sand or infiltrates through to the groundwater via deep percolation. Deep percolation allows some of the stormwater to reach the water via groundwater flow; however, much of the contaminants will be filtered out before reaching the recreational water body)
Low Very Low Very Low Very Low
Beach discharge (Stormwater flows over beach sand and into the water with some filtered into the beach sediment The drain should be located at least 10m from the recreational water body)
Moderate Low Very Low Low
Direct discharge (Stormwater discharges directly into the recreational water body, with significant probability of plume reaching the area where people swim)
High Moderate Low Moderate
Effective discharge (Stormwater is discharged several metres offshore to minimise the impact on the recreational water body. The outlet should be located at least 50m offshore)
Low Low Very Low Low
Adopted from: Green, A. and Doucette, J. (2006) From your knowledge of the recreational water body, do you believe the above risk classification is a true representation of this risk? Yes No If No, justify answer and provide suggested reassigned risk classification (Use table 5 of the Sanitary Inspection Report Instructions for guidance where historical enterococci data is available):
CUT AND PASTE THE REQUIRED FIELDS IF MORE THEN 3 DRAINS ARE IDENTIFIED, AND INSERT TEXT HERE Have the above stormwater drains been inspected for the presence of illegal wastewater connections?
Yes No Unsure (If unsure investigate further) If yes, provide details: Have visible signs of stormwater pollution been recorded at the recreational water body? (Includes discoloured water, excess leaves, twigs, street litter, cigarette butts) Yes No If yes, provide details: List the highest ranked risk classification from the above stormwater drains:
5. Rainfall and Polluted Runoff (Wet weather during and following summer rainfall events) Does rainfall trigger microbiological contamination? Yes No Unsure (If unsure investigate further) If no refer to section 6 Has monitoring for bacterial indicators (at the recreational water body) following rainfall events been undertaken to confirm the above? Yes No If no it is recommended monitoring during and following rainfall events is undertaken If yes, provide details of monitoring (Sampling results collected from the recreational water body during rainfall events):
18
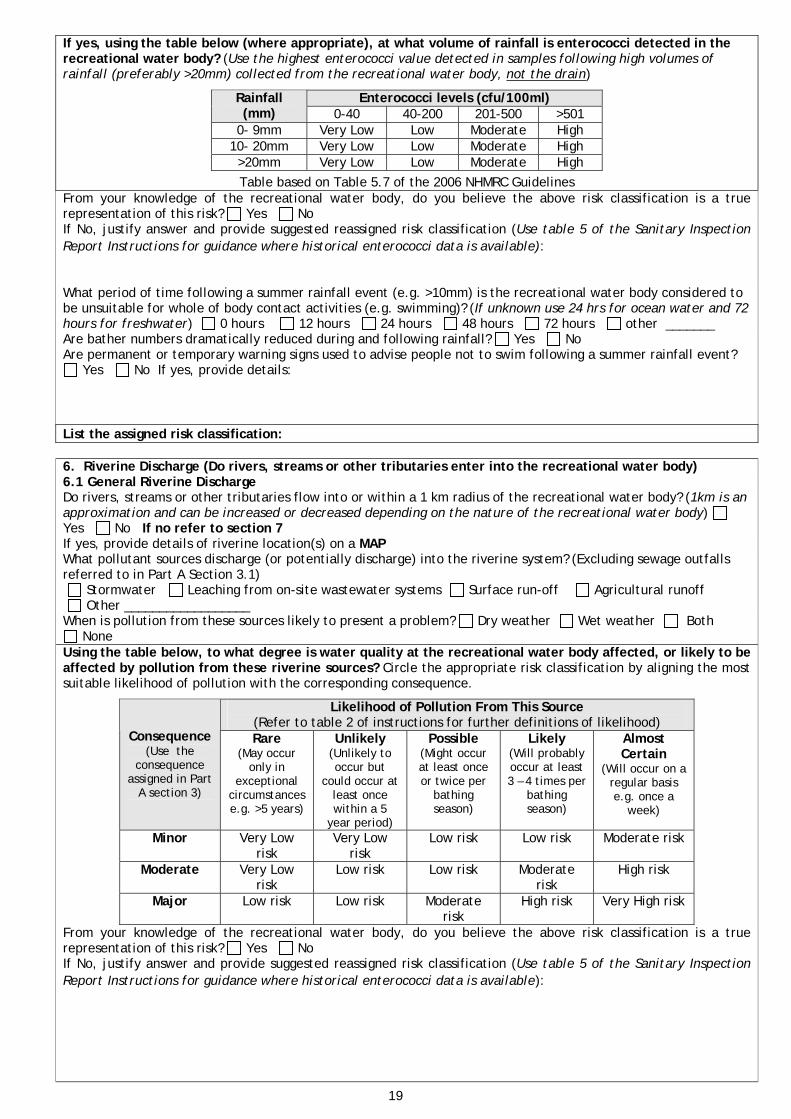
If yes, using the table below (where appropriate), at what volume of rainfall is enterococci detected in the recreational water body? (Use the highest enterococci value detected in samples following high volumes of rainfall (preferably >20mm) collected from the recreational water body, not the drain)
Table based on Table 5.7 of the 2006 NHMRC Guidelines
Enterococci levels (cfu/100ml)Rainfall (mm) 0-40 40-200 201-500 >501
0- 9mm Very Low Low Moderate High 10- 20mm Very Low Low Moderate High >20mm Very Low Low Moderate High
From your knowledge of the recreational water body, do you believe the above risk classification is a true representation of this risk? Yes No If No, justify answer and provide suggested reassigned risk classification (Use table 5 of the Sanitary Inspection Report Instructions for guidance where historical enterococci data is available): What period of time following a summer rainfall event (e.g. >10mm) is the recreational water body considered to be unsuitable for whole of body contact activities (e.g. swimming)? (If unknown use 24 hrs for ocean water and 72 hours for freshwater) 0 hours 12 hours 24 hours 48 hours 72 hours other _______ Are bather numbers dramatically reduced during and following rainfall? Yes No Are permanent or temporary warning signs used to advise people not to swim following a summer rainfall event?
Yes No If yes, provide details: List the assigned risk classification:
6. Riverine Discharge (Do rivers, streams or other tributaries enter into the recreational water body) 6.1 General Riverine Discharge Do rivers, streams or other tributaries flow into or within a 1 km radius of the recreational water body? (1km is an approximation and can be increased or decreased depending on the nature of the recreational water body) Yes No If no refer to section 7 If yes, provide details of riverine location(s) on a MAP What pollutant sources discharge (or potentially discharge) into the riverine system? (Excluding sewage outfalls referred to in Part A Section 3.1) Stormwater Leaching from on-site wastewater systems Surface run-off Agricultural runoff Other __________________ When is pollution from these sources likely to present a problem? Dry weather Wet weather Both
None Using the table below, to what degree is water quality at the recreational water body affected, or likely to be affected by pollution from these riverine sources? Circle the appropriate risk classification by aligning the most suitable likelihood of pollution with the corresponding consequence. Likelihood of Pollution From This Source
(Refer to table 2 of instructions for further definitions of likelihood) Consequence
(Use the consequence
assigned in Part A section 3)
Rare (May occur
only in exceptional
circumstances e.g. >5 years)
Unlikely(Unlikely to occur but
could occur at least once within a 5
year period)
Possible (Might occur at least once or twice per
bathing season)
Likely (Will probably occur at least 3 – 4 times per
bathing season)
Almost Certain
(Will occur on a regular basis e.g. once a
week)
Minor Very Low risk
Very Low risk
Low risk Low risk Moderate risk
Moderate Very Low risk
Low risk Low risk Moderate risk
High risk
Major Low risk Low risk Moderate risk
High risk Very High risk
From your knowledge of the recreational water body, do you believe the above risk classification is a true representation of this risk? Yes No If No, justify answer and provide suggested reassigned risk classification (Use table 5 of the Sanitary Inspection Report Instructions for guidance where historical enterococci data is available):
19

6.2 Sewage Contamination Do sewage outfalls discharge into these rivers/streams/tributaries? Yes No If no refer to section 7 If yes, when do riverine discharges present a problem? Dry weather Wet weather None Has monitoring for bacterial indicators from these rivers/streams/tributaries been undertaken to assess microbiological contamination? Yes No If yes, provide details of monitoring: (Results during dry and wet weather) Using the table below to what degree is water quality at the recreational water body affected, or likely to be affected by contamination from riverine discharges where sewage is discharged into the riverine system? Circle the appropriate risk classification by aligning the most suitable likelihood of pollution with the corresponding consequence.
Source: Table adopted from Table 5.11 from the NHMRC Guidelines a The population factor includes, in principle, all the population upstream from the recreational water area b Stream flow of primary concern is the lowest typical flow during the bathing season c Additional investigations recommended to account for the likely lack of prediction with faecal organisms
Treatment Level
Population and Flow Characteristics a,b None Primary Secondary Secondary
with Disinfection c
Lagoon
High Population with low river flow Very high Very high High Low Moderate Low population with low river flow Very high High Moderate Very low Moderate Medium population with medium river flow High Moderate Low Very low Low
High population with high river flow High Moderate Low Very low Low Low population with high river flow High Moderate Very low Very low Very low
From your knowledge of the recreational water body, do you believe the above risk classification is a true representation of this risk? Yes No If No, justify answer and provide suggested reassigned risk classification (Use table 5 of the Sanitary Inspection Report Instructions for guidance where historical enterococci data is available): List the highest ranked risk classification from section 6.1 and 6.2:
7. Boats Are boats/vessels located in the immediate area? Yes No If no refer to section 8
Marina Permanent boat moorings Jetty Boat ramp Harbour Temporary boat moorings Ferry Berth Anchorage
ATTACH MAP detailing boat mooring locations. How far is the nearest boat/vessel located from the recreational water body? What is the maximum number of boats/vessels that area likely to be anchored/moored at any given time? (In reasonable proximity to recreational water body):___________________________________________________________________ Are pump out facilities provided for boat wastes? Yes No If No, how are boat wastes disposed of? Have any complaints of boat discharges been recorded? Yes No If yes, provide details: Are onshore toilet facilities provided for boat owners? Yes No Has monitoring been undertaken to determine the impact of boat discharges on the recreational water body?
Yes No If yes, provide details:
20

Using the table below, to what degree is water quality at the recreational water body affected, or likely to be affected by pollution from boat discharge? (Considering the number of boats, historical enterococci data, recorded illnesses, pump out facilities available) Circle the appropriate risk classification by aligning the most suitable likelihood of pollution with the corresponding consequence.
Likelihood of Pollution From This Source (Refer to table 2 for further definitions of likelihood)
Consequence (Use the
consequence assigned in Part
A section 3)
Rare (May occur
only in exceptional
circumstances e.g. >5 years)
Unlikely(Unlikely to occur but
could occur at least once within a 5
year period)
Possible (Might occur at least once or twice per
bathing season)
Likely (Will probably occur at least 3 – 4 times per
bathing season)
Almost Certain
(Will occur on a regular basis e.g. once a
week)
Minor Very Low risk
Very Low risk
Low risk Low risk Moderate risk
Moderate Very Low risk
Low risk Low risk Moderate risk
High risk
Major Low risk Low risk Moderate risk
High risk Very High risk
From your knowledge of the recreational water body, do you believe the above risk classification is a true representation of this risk? Yes No If No, justify answer and provide suggested reassigned risk classification (Use table 5 of the Sanitary Inspection Report Instructions for guidance where historical enterococci data is available): List the assigned risk classification:
8. Animals 8.1 Wildlife (not including domestic animals) Are the following wildlife present at the site? Aquatic birds (e.g. including ducks, geese, seagulls, swans) Other (e.g. kangaroos, parrots) _____________ None If none refer to section 8.2 Comment (Provide details of anything significant concerning wildlife e.g. popular duck feeding area, migratory birds) If present, describe the density of the local aquatic bird population:
Low (<5 birds on any occasion) Medium (5-20 birds on any occasion) High (>20 birds on any occasion) Are structures (e.g. jetties, bridges, trees) present to promote birds (e.g. pigeons, parrots) nesting/roosting close to the water body? Yes No If yes, provide details: Using the table below, to what degree is water quality at the recreational water body affected, or likely to be affected by faecal pollution from wildlife? Circle the appropriate risk classification by aligning the most suitable likelihood of pollution with the corresponding consequence.
Note: Table modified due to decrease in potential public health risk that aquatic birds etc. may present to
humans.
Likelihood of Pollution From This Source (Refer to table 2 for further definitions of likelihood)
Consequence (Use the
consequence assigned in Part
A section.3)
Rare (May occur
only in exceptional
circumstances e.g. >5 years)
Unlikely(Unlikely to occur but
could occur at least once within a 5
year period)
Possible (Might occur at least once or twice per
bathing season)
Likely (Will probably occur at least 3 – 4 times per
bathing season)
Almost Certain
(Will occur on a regular basis e.g. once a
week)
Minor Very Low risk
Very Low risk
Very Low risk
Very Low risk
Low risk
Moderate Very Low risk
Very Low risk
Very Low risk
Low risk Moderate risk
Major Very Low risk
Very Low risk
Low risk Moderate risk
Moderate risk
From your knowledge of the recreational water body, do you believe the above risk classification is a true representation of this risk? Yes No
21

If No, justify answer and provide suggested reassigned risk classification (Use table 5 of the Sanitary Inspection Report Instructions for guidance where historical enterococci data is available): 8.2 Domestic Animals Is the area used as an animal exercise site? (Includes areas where domestic animals are commonly exercised even if not permitted) Yes No If no refer to section 8.3 If yes, what types of animals? dogs horses other _________________ Are dog waste bags supplied?
Yes No Do animals directly access the recreational water body?
Yes No
Is the area regularly cleaned and maintained to reduce the amount of animal faeces along the shoreline of the recreational water body? Yes No
Using the table below, to what degree is water quality at the recreational water body affected, or likely to be affected by faecal pollution from domestic animals? Circle the appropriate risk classification by aligning the most suitable likelihood of pollution with the corresponding consequence.
Note: Table modified due to decrease in potential public health risk that domestic animals etc. may present to humans.
Likelihood of Pollution From This Source (Refer to table 2 of instructions for further definitions of likelihood)
Consequence (Use the
consequence assigned in Part
A section 3)
Rare (May occur
only in exceptional
circumstances e.g. >5 years)
Unlikely(Unlikely to occur but
could occur at least once within a 5
year period)
Possible (Might occur at least once or twice per
bathing season)
Likely (Will probably occur at least 3 – 4 times per
bathing season)
Almost Certain
(Will occur on a regular basis e.g. once a
week)
Minor Very Low risk
Very Low risk
Very Low risk
Very Low risk
Low risk
Moderate Very Low risk
Very Low risk
Very Low risk
Low risk Moderate risk
Major Very Low risk
Very Low risk
Low risk Moderate risk
Moderate risk
From your knowledge of the recreational water body, do you believe the above risk classification is a true representation of this risk? Yes No If No, justify answer and provide suggested reassigned risk classification (Use table 5 of the Sanitary Inspection Report Instructions for guidance where historical enterococci data is available): 8.3 Agricultural Animals Are any of the following agricultural animals located within the catchment (as identified in Part A section 2.2)?
Poultry Cattle Pigs Sheep Other _________ None If none refer to section 9 Have any waste containment dams and their discharge points (e.g. piggery or dairy waste holding dams) been identified?
Yes No (ATTACH LOCATIONS ON MAP) If yes, provide details: Can agricultural animals directly access the water? Yes No If yes, provide details: (Access points, times of access) Using the table below, to what degree is water quality at the recreational water body affected, or likely to be affected by faecal pollution from agricultural animals in the immediate catchments, and potential run-off of untreated animal effluent (e.g. dairying, piggeries) into the recreational water body?* Circle the appropriate risk classification by aligning the most suitable likelihood of pollution with the corresponding consequence.
22
Likelihood of Pollution From This Source (Refer to table 2 of instructions for further definitions of likelihood)
Consequence (Use the
consequence assigned in Part
A section.3)
Rare (May occur
only in exceptional
circumstances e.g. >5 years)
Unlikely(Unlikely to occur but
could occur at least once within a 5
year period)
Possible (Might occur at least once or twice per
bathing season)
Likely (Will probably occur at least 3 – 4 times per
bathing season)
Almost Certain
(Will occur on a regular basis e.g. once a
week)
Minor Very Low risk
Very Low risk
Low risk Low risk Moderate risk
Moderate Very Low risk
Low risk Low risk Moderate risk
High risk
Major Low risk Low risk Moderate risk
High risk Very High risk
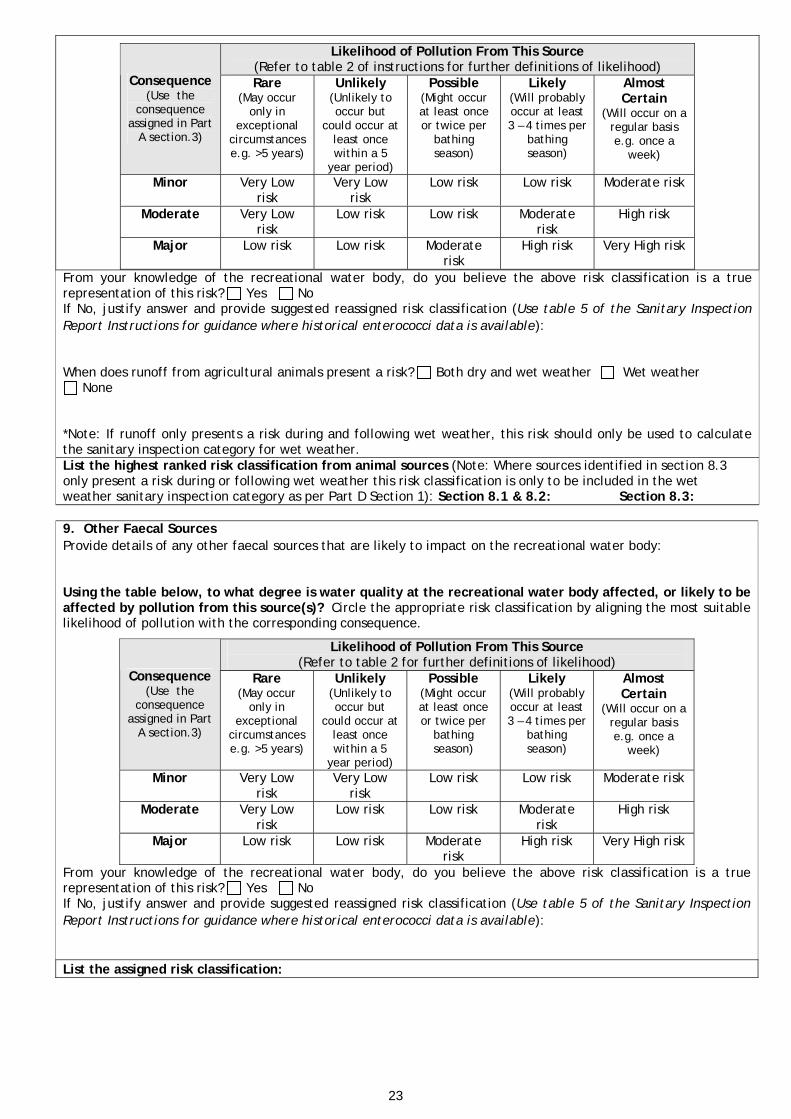
From your knowledge of the recreational water body, do you believe the above risk classification is a true representation of this risk? Yes No If No, justify answer and provide suggested reassigned risk classification (Use table 5 of the Sanitary Inspection Report Instructions for guidance where historical enterococci data is available): When does runoff from agricultural animals present a risk? Both dry and wet weather Wet weather
None *Note: If runoff only presents a risk during and following wet weather, this risk should only be used to calculate the sanitary inspection category for wet weather. List the highest ranked risk classification from animal sources (Note: Where sources identified in section 8.3 only present a risk during or following wet weather this risk classification is only to be included in the wet weather sanitary inspection category as per Part D Section 1): Section 8.1 & 8.2: Section 8.3:
9. Other Faecal Sources Provide details of any other faecal sources that are likely to impact on the recreational water body: Using the table below, to what degree is water quality at the recreational water body affected, or likely to be affected by pollution from this source(s)? Circle the appropriate risk classification by aligning the most suitable likelihood of pollution with the corresponding consequence.
Likelihood of Pollution From This Source (Refer to table 2 for further definitions of likelihood)
Consequence (Use the
consequence assigned in Part
A section.3)
Rare (May occur
only in exceptional
circumstances e.g. >5 years)
Unlikely(Unlikely to occur but
could occur at least once within a 5
year period)
Possible (Might occur at least once or twice per
bathing season)
Likely (Will probably occur at least 3 – 4 times per
bathing season)
Almost Certain
(Will occur on a regular basis e.g. once a
week)
Minor Very Low risk
Very Low risk
Low risk Low risk Moderate risk
Moderate Very Low risk
Low risk Low risk Moderate risk
High risk
Major Low risk Low risk Moderate risk
High risk Very High risk
From your knowledge of the recreational water body, do you believe the above risk classification is a true representation of this risk? Yes No If No, justify answer and provide suggested reassigned risk classification (Use table 5 of the Sanitary Inspection Report Instructions for guidance where historical enterococci data is available): List the assigned risk classification:
23

PART C: MANAGEMENT 1. Management Are any of the following management controls in place to warn people of microbiological risks during high risk periods (e.g. following heavy rainfall)? If none refer to Part D
Permanent on site signage Media releases Website Temporary on site signage Beach closures other _______________
Provide specific details of advisories:
Do management controls referred to above effectively prevent people from accessing the water during high risk periods?
Yes No Unsure If yes, justify evidence to prove this (e.g. Follow-up inspections during high risk periods indicate minimal water users): Does the responsible authority have a management response plan to deal with exceptional water contamination events such as sewage overflows? Yes No
If yes, provide details:
24

PART D: Sanitary Inspection Category (SIC) 1. Sanitary Inspection Category (SIC) Fill in the corresponding risk classifications for each pollutant source identified throughout the sanitary inspection report. Where a particular sources is not present write N/A.
SOURCE (Part B)
Risk Classification (Use the highest risk
classification identified for each section under
Part B)
SOURCE (Part B)
Risk Classification (Use the highest risk
classification identified for each section under
Part B) 1. Toilet Facilities 6. Riverine discharge
2. Bather Density 7. Boats
3. Discharge of Wastewater 8. Animals
4. Stormwater discharge 9. Other
5. Rainfall
1.1 Dry Weather Sanitary Inspection Category (SIC) List the highest ranked risk classification identified from the above table from Part B sections 1, 2, 3, 6, 7, 8 and 9. Remember to exclude Part B section 8.3 where agricultural runoff only presents a risk during wet weather): Dry Weather Sanitary Inspection Category: _______________________ 1.2 Wet Weather Sanitary Inspection Category (SIC) List the highest ranked risk classification identified from the above table from Part B sections 1, 2, 3, 4, 5, 6, 7, 8, and 9): Wet Weather Sanitary Inspection Category: _______________________ 1.3 Effectiveness of Management Controls Do management controls effectively prevent people from accessing the water during and following wet weather events?
Yes No If no, the wet weather sanitary inspection category identified above (1.2) should be accepted as the assigned sanitary inspection category. If yes, the dry weather sanitary inspection category identified above (1.1) should be accepted as the assigned sanitary inspection category. Assigned Sanitary Inspection Category:
2: Actions/Further Investigation What actions/further investigations are required to provide additional evidence to demonstrate microbial water quality for the recreational water body?
© The copyright to this template belongs to Ms Bree Abbott, under the provisions of the Copyright Act 1968 (C'with Australia). Apart from any fair dealing for personal, academic, research or non-commercial use, no part may be reproduced, or used for any commercial purposes, without the written permission of the Environmental Health Directorate, Western Australian Department of Health (Attention: Ms Bree Abbott), PO Box 8172, Perth Business Centre, Western Australia 6849, AUSTRALIA or [email protected]
25

26

APPENDIX 2 - SANITARY INSPECTION REPORT INSTRUCTIONS To assist in completing a sanitary inspection a “Sanitary Inspection Report” (Appendix 1) has been developed to help guide you through the process. The Sanitary Inspection Report is to be applied in combination with the guidance instructions below. Definitions: A recreational water body means any public coastal, estuarine or freshwater areas where a significant number of people use the water for recreation (or “whole of body contact”). Whole of body contact means any activity in which the whole body or the face and trunk are frequently immersed or the face is frequently wet by spray, and where it is likely that some water will be swallowed or inhaled, or come into contact with ears, nasal passages, mucous membranes or cuts in the skin (e.g. swimming, diving, surfing or whitewater canoeing) (NHMRC Guidelines). 1. Assessing the risk to public health – qualitative approach The Sanitary Inspection Report uses a qualitative risk assessment approach by assigning faecal pollutant sources into categories such as ‘very low’, ‘low’, ‘moderate’, ‘high’ or ‘very high’ (Table 5.13 NHMRC Guidelines). This qualitative approach is presented as a ‘screening approach’ tool for the purpose of determining sanitary inspection categories. A number of faecal pollutant sources may impact on recreational water quality, which includes:
Discharge from municipal wastewater Riverine discharges contaminated with wastewater Contamination from bathers Discharge from on-site toilet facilities Contamination from on-site wastewater systems Stormwater discharge Rainfall Boats and Animals.
The risks to human health through direct discharge of municipal wastewater, riverine discharge contaminated with sewage and bather contamination have been predetermined by the NHMRC Guidelines (Table 5.10 and 5.11). These risks estimations have taken into account the likelihood of human exposure and the degree of treatment of sewage. Risk estimations have not been provided for other sources including contamination from on-site toilet facilities, stormwater discharge, on-site wastewater systems, boats and animals. To reduce the subjectivity from one person to another when assigning sanitary inspection categories to these pollutant sources, a qualitative framework has been developed. The qualitative approach uses words to describe the magnitude of the potential consequence of pollution occurring at a recreational water body and the likelihood of pollution occurring from specific pollutant sources into a recreational water body. 2. Consequence Firstly, you need to determine the consequence of a pollution event occurring at the site and the impact it will have on the recreational water users. A consequence is defined as the outcome or impact of an event (AS/NZ 4360:2004). The consequence of a pollution event is likely to be greater at very popular recreational water bodies where large numbers of people may come into contact with water borne pathogens or at tourist beaches where reports of poor water quality may affect the local economy. The
25
27

consequences may also be greater at beaches used by people with weaker immune systems, such as small children or the elderly. For the purpose of this sanitary inspection, consequences have been rated into three categories; minor, moderate and major, and is defined using the qualitative definitions provided in Table 1. The recreational water usage information (reported in Part A, Section 3 of the Sanitary Inspection Report) will help determine which consequence best suits the recreational water body. Table 1: Qualitative definitions of consequence of pollution
Source: Table Adopted from HB 436:2004 and 2004 DEC (NSW)
Consequence (Circle the most appropriate consequence that best fits the description of the location)
Description (Tick appropriate boxes from only one consequence that best suits the recreational water body. NOTE: Not all boxes need to be ticked)
Minor
Location rarely used on weekdays Location occasionally used on weekends or holidays Few people enter the water Location not popular with children or the elderly Of minimal importance to local economy
Moderate
Location occasionally used on weekdays (e.g. <100 people per day for non-holiday period)
Location frequently used on weekends or holidays Most people enter the water Location very popular with children or the elderly Location of some importance to the local economy
Major
Location frequently used on weekdays, weekends and holidays
Most people enter the water Location very popular with children or the elderly Location of great importance to the local economy
The consequence which best suits the location is to be used when assessing the impact of each pollutant source. 3. Likelihood Secondly, you need to determine the likelihood of faecal pollution occurring from each of the identified sources. Likelihood is a general description of probability or frequency of a pollution event occurring (AS/NZ 4360:2004). For the purpose of this sanitary inspection, likelihood has been rated into five categories; rare, unlikely, possible, likely, and almost certain, and defined using the qualitative definitions provided in Table 2. Table 2: Qualitative definitions of likelihood of pollution Rating Description – the likelihood of pollution from a source occurring at the
recreational water body Rare Pollution from this source is unlikely to occur or may occur only in
exceptional circumstances (e.g. every five years or more). Unlikely Pollution from this source is unlikely but could occur at least once within a
five year period. Possible Pollution from this source might occur at least once or twice per bathing
season. Likely Pollution from this source is expected to occur several times per bathing
season (e.g. at least three or four times). Almost Certain
Pollution from this source is expected to occur on a regular basis (e.g. once a week).
Source: Adopted from HB 436:2004
26
28

4. Risk Classification Thirdly, a risk classification can be determined for each faecal pollutant source by combining the consequence and likelihood. Risk classifications will vary depending on whether the source is of human or animal origin. For the purpose of the sanitary inspection report, the level of risks has been rated into five categories; very low risk, low risk, moderate risk, high risk and very high risk. This has been done to equate with the categories shown in Table 5.13 of the NHMRC Guidelines. Table 3 represents estimated risks of human origin; Table 4 represents estimated risks of animal origin. Determine the risk classification by aligning the most suitable likelihood of pollution with the corresponding consequence. Table 3: Qualitative risk analysis matrix – level of risk from human sources
Source: Adopted from HB 436:2004
Likelihood of Pollution From This Source
Consequence
Rare (May occur only in exceptional circumstances e.g. >5 years)
Unlikely(Unlikely to
occur but could occur at least
once within a 5 year period)
Possible (Might occur at least once or
twice per bathing season)
Likely (Will probably
occur at least 3 – 4 times per
bathing season)
Almost Certain
(Will occur on a regular basis e.g.
once a week)
Minor Very Low risk
Very Low risk Low risk Low risk Moderate risk
Moderate Very Low risk Low risk Low risk Moderate
risk High risk
Major Low risk Low risk Moderate risk High risk Very High risk
Table 4: Qualitative risk analysis matrix – level of risk from animal sources
Source: Adopted from HB 436:2004
Likelihood of Pollution From This Source
Consequence
Rare (May occur only in exceptional circumstances e.g. >5 years)
Unlikely(Unlikely to
occur but could occur at least
once within a 5 year period)
Possible (Might occur at least once or
twice per bathing season)
Likely (Will probably
occur at least 3 – 4 times per
bathing season)
Almost Certain
(Will occur on a regular basis e.g.
once a week)
Minor Very Low risk
Very Low risk
Very Low risk
Very Low risk Low risk
Moderate Very Low risk
Very Low risk
Very Low risk Low risk Moderate risk
Major Very Low risk
Very Low risk Low risk Moderate
risk Moderate risk
5. Reclassifying Risk Where you believe the risk classification (Tables 3 and 4) does not accurately represent the impact the pollutant source has on the recreational water body, there is flexibility to reassign the classification. It is recommended that the decision to reassign the risk classification is done as a team exercise and agreed on by a committee or suitable persons with knowledge of the recreational water body. Provide an explanation on why you believe the risk classification should be reviewed. Document any differing views (i.e. one person may feel the reclassification is not suitable when the remainder of the group do) to ensure information on how the decision to reclassify was agreed upon. This information will help with future sanitary inspections. When reclassifying the risk classification you should review, where available, historical enterococci results recorded at the recreational water body, and any microbial data specific to the pollutant source.
27
29
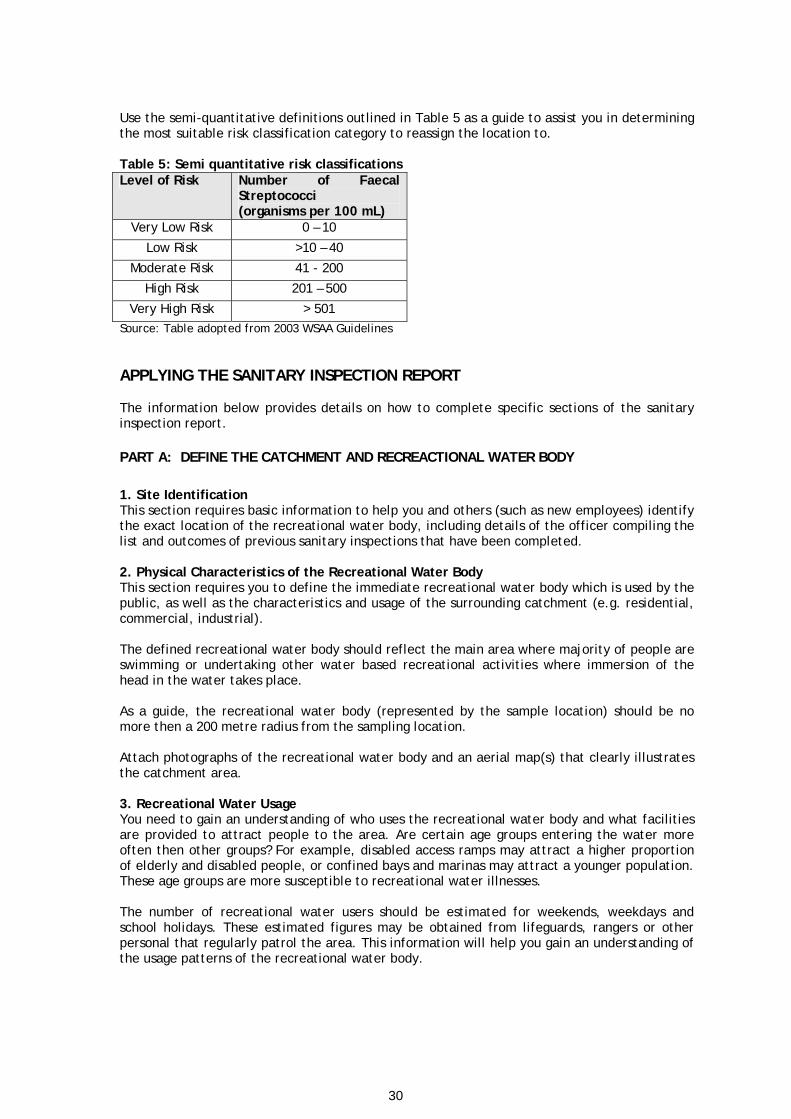
Use the semi-quantitative definitions outlined in Table 5 as a guide to assist you in determining the most suitable risk classification category to reassign the location to. Table 5: Semi quantitative risk classifications Level of Risk Number of Faecal
Streptococci (organisms per 100 mL)
Very Low Risk 0 – 10
Low Risk >10 – 40
Moderate Risk 41 - 200
High Risk 201 – 500
Very High Risk > 501 Source: Table adopted from 2003 WSAA Guidelines APPLYING THE SANITARY INSPECTION REPORT The information below provides details on how to complete specific sections of the sanitary inspection report. PART A: DEFINE THE CATCHMENT AND RECREACTIONAL WATER BODY
1. Site Identification This section requires basic information to help you and others (such as new employees) identify the exact location of the recreational water body, including details of the officer compiling the list and outcomes of previous sanitary inspections that have been completed. 2. Physical Characteristics of the Recreational Water Body This section requires you to define the immediate recreational water body which is used by the public, as well as the characteristics and usage of the surrounding catchment (e.g. residential, commercial, industrial). The defined recreational water body should reflect the main area where majority of people are swimming or undertaking other water based recreational activities where immersion of the head in the water takes place. As a guide, the recreational water body (represented by the sample location) should be no more then a 200 metre radius from the sampling location. Attach photographs of the recreational water body and an aerial map(s) that clearly illustrates the catchment area. 3. Recreational Water Usage You need to gain an understanding of who uses the recreational water body and what facilities are provided to attract people to the area. Are certain age groups entering the water more often then other groups? For example, disabled access ramps may attract a higher proportion of elderly and disabled people, or confined bays and marinas may attract a younger population. These age groups are more susceptible to recreational water illnesses. The number of recreational water users should be estimated for weekends, weekdays and school holidays. These estimated figures may be obtained from lifeguards, rangers or other personal that regularly patrol the area. This information will help you gain an understanding of the usage patterns of the recreational water body.
28
30
The number of recreational water users who actually go into the water should also be considered. Even though a recreational water body may be popular, dangerous surf conditions or regularly occurrences of algal blooms may deter many people from swimming.
Recreational water usage information will help you determine the consequence of a pollution event occurring at the site and the impact it will have on the local community. A consequence is the outcome or impact of an event.
How to apply the consequence table in this section has been explained in section 4. The consequence that best suits the recreational water body is to be used throughout the remainder of the sanitary inspection report. PART B: SOURCES OF FAECAL POLLUTION 1. Toilet Facilities On-site toilet facilities have the potential to cause faecal pollution to nearby water bodies if they are not regularly maintained and serviced. The type of disposal system used and the distance of the toilets from the recreational water body needs to be taken into consideration when determining if the toilets represent a risk to the recreational water body or are a pollutant source. Also note any recorded complaints of leaks, discharges or odours from such systems. Reviewing information relating to on-site toilet facilities will help you to determine the likelihood of faecal contamination from the toilets polluting the recreational water body. 2. Bather Density Bathers can influence water quality directly through bather shedding of microorganisms. Defecating in the water, particularly where toilet facilities are not readily available may occur. It can also be assumed that young children (<7 years of age) are more likely to defecate in the water. The potential impact of bathers on water quality will relate to the number of bathers using the recreational water body and the dilution rate of the water. Low dilution represent areas where there is a low level of flushing and turn over of the water, or little or no water movement (e.g. lakes, lagoons and coastal embayments). High dilution represents areas where there is a high level of flushing and turn over of water (e.g. coastal beaches). 3. Discharge of Wastewater 3.1 Sewage Outfalls Discharges from municipal wastewater treatment plants can be a significant source of faecal contamination. Wastewater treatment plants (WWTP) can often malfunction as a result of human error or breakage of old equipment. During these times raw or partially treated sewage may be discharged into coastal waters or other receiving water bodies. Depending on the location of the outfall and level of treatment applied, inadequately treated sewage may reach nearby recreational water areas and put bathers at risk. A number of factors need to be taken into consideration to determine the likelihood of contamination from WWTP on the bathing area. These include:
Location of outfall: o Direct – discharges directly to the recreational water body or adjacent area. o Short – discharges within inter-tidal zone, significant probability of sewage
plume reaching the recreational water body. o Long/effective – discharges several kilometres offshore, sufficient length and
depth to ensure low probability of sewage plume reaching the recreational water body.
Level of wastewater treatment: o No treatment (raw sewage)
29
31

o Preliminary (filtration with milli- or micro-screens) o Primary (physical sedimentation) o Secondary (primary + trickling filter/activated sludge) o Secondary + disinfection (primary + trickling filter/activated sludge +
disinfection) o Tertiary (secondary + coagulation-sand filtration) o Tertiary + disinfection (secondary + coagulation-sand filtration + disinfection) o Lagoons (low-rate biological treatment)
Visible signs of sewage pollution at the recreational water body: o Are regular complaints of sewage contamination recorded at the recreational
water body? Knowledge of local currents, dilution rates and tidal movements also need to be considered when determining the potential for polluted water reaching the recreational water body. Where available provide details of tide charts, currents, and specific details and design requirements of the WWTP and outfall. 3.2 Sewerage System Pumping stations are used to help transport wastewater to wastewater treatment plants. They can be located near recreational water bodies and in the event of a malfunction, can pollute the recreational water body. Determine the location of pumping stations in the catchment and specific details on where the wastewater will be diverted to in the event of system failure. For example, if there is a power failure and the pumping station stops working the wastewater may be diverted directly into a recreational water body. 3.3 On-site Wastewater Systems (e.g. septic tanks, aerobic treatment units) There is the potential for on-site wastewater systems which include septic tanks and aerobic treatment units, which if not sited, built, and maintained properly can leach wastewater into nearby recreational water bodies. Recreational water bodies can be contaminated by faecal matter from malfunctioning or overloaded systems. Runoff can also carry bacteria from failing on-site wastewater systems into streams or drains that empty into or near the recreational water body. Determine where onsite wastewater systems are located within the catchment and assess the likelihood of contamination of the recreational water body from these systems. Further studies and community education programs may be required by local governments to ensure on-site wastewater systems are adequately maintained to reduce the likelihood of contamination. 4. Stormwater Discharge (Wet Weather) Many urban lakes, rivers, estuaries and coastal beaches are polluted by urban stormwater, which can present a significant source of faecal pollution to bathers. As rainwater washes over roads, car parks, construction sites, industrial and commercial areas, and parks and gardens it collects a number of contaminates on its way to the stormwater system. Such contaminates can include faecal matter from dogs, cats, pigeons, seagulls, other urban and rural animals. Human waste may find its way into the stormwater system from illegal pipes connected into the system from adjacent residences or businesses. Leaks from sewage pipes or septics may also flow into the stormwater system. A number of factors need to be taken into consideration when determining the likelihood of contamination from stormwater drains. These include:
Area of discharge into the recreational water body: o Swale/dune discharge - Stormwater does not flow directly into the
recreational water body. The stormwater is either taken up by vegetation, held in the sand or infiltrates through to the groundwater via deep percolation. Deep percolation allows some of the stormwater to reach the water via
30
32

groundwater flow; however, much of the contaminants will be filtered out before reaching the water.
o Beach discharge - Stormwater flows over beach sand and into the water with some filtered into the beach sediment. The drain should be located at least 10m from the recreational water body.
o Direct discharge - Stormwater discharges directly into the recreational water body, with significant probability of plume reaching the area where people swim.
o Effective discharge – Stormwater is discharged several metres offshore to minimise the impact on the recreational water body. The drain should be located at least 50m offshore.
Type of stormwater drainage/catchment area: o Main drain - High volume discharge from a large urban catchment area. o Local drain - Medium volume discharge from surrounding carpark and roads. o Bushland - Discharge from surrounding bushland/forested area including low
use roads and carpark. o Rural - Medium volume discharge from rural, Agricultural, pastures.
5. Rainfall & Polluted Runoff (Wet weather during and following summer rainfall events) There is sufficient evidence that suggests summer rainfall (referred to as wet weather) events can contribute significantly to the pollution load of a recreational water body. In urban and rural areas uncontrolled runoff from farms, roads, golf course, and lawns can flow into waterways. Such runoff can result in high concentrations of bacteria in the recreational water body. Monitoring water quality at the recreational water body during and following rainfall events, particularly rainfall above 10mm should be undertaken to determine the waters susceptibility to faecal contamination during and following summer rainfall. The die-off rate of bacteria following rainfall needs to be determined to help estimate the period of time people should avoid swimming in the recreational water body. For example, in coastal waters it may take at least a day for the water to return to a safe level, and in river and estuarine waters it may take up to three days for the water body to return back to normal. 6. Riverine Discharge Rivers discharging into recreational water bodies may carry a heavy load of bacteria from a diverse number of sources, including faecal pollution from municipal wastewater treatment plants, surface run-off, urban and rural stormwater overflows, and leaching from sewers or on-site wastewater systems. It is important to determine the sources of faecal pollution entering these riverine systems and the likely impact these sources present to the recreational water body. Discharges from wastewater treatment plants will have the most significant impact. Rainfall may also contribute to the impact these pollutant sources have on the recreational water body. 7. Boats Boats can be a source of faecal pollution due to the improper disposal of boating wastes. Elevated bacteria may be found in areas with high boating density, particularly where there is no requirement for vessels to be fitted with effluent holding tanks or onboard chemical treatment prior to waste disposal. Many areas also lack sufficient pump-out facilities. When assessing the likelihood of contamination of boating wastes causing pollution onto the designated recreational water body, consider how close the boats are to the recreational water body, the number of boats, and when they are likely to present a risk. 8. Animals Faeces from animals can contribute to contamination of a recreational water body. Although animal sources represent less of a risk to public health they can significantly impact on the overall microbial quality of a water body.
31
33
Large or excessive populations of aquatic birds (e.g. seagulls, swans, ducks, geese) at a recreational water body or in a suburban area that drain into a beach can cause elevations in bacterial levels. Migratory birds may represent a problem during certain seasons. Faecal matter from domesticated animals such as dogs or horses may enter the recreational water body along animal exercise beaches, or into surrounding stormwater drains. Agricultural animals with direct access may pollute the recreational water body with faeces. Runoff from agricultural fields, feedlots, piggeries or dairy waste holding dams may contain high concentrations of bacteria. 10. Other Faecal Sources Identify any other faecal sources that may contribute to faecal pollution of the recreational water body. Assess these risks using the likelihood and consequence table. PART C: MANAGEMENT 1. Management Recreational water areas with successful management controls that aim to prevent or significantly reduce the number of people from accessing the recreational water body during high risk periods (e.g. following heavy rainfall) can improve the overall sanitary inspection category assigned to a site. A number of communication strategies can be introduced to advice people of the risks of swimming in recreational water bodies during high risk periods. These can include press releases, temporary and permanent signage, and websites. Where a recreational water body is very popular, particularly by tourists, and is susceptible to pollution following rainfall or from sewage pollution, temporary beach closures may be the only effective measure to prevent people from accessing the water. PART D: SANITARY INSPECTION CATEGORY 1. Sanitary Inspection Category (SIC) There are two parts to assigning a sanitary inspection category (SIC). Firstly you need to review the risk classifications assigned to each faecal pollutant source identified in the sanitary inspection report for both dry weather and wet weather. 1.1 Dry Weather Sanitary Inspection Category A dry weather sanitary inspection category includes all faecal pollutant sources that are likely to present a risk during dry summer weather only. Such faecal pollutant sources include those identified in Part B, Sections 1, 2, 3, 6, 7, 8 and 9. Remember to exclude Part B, section 8.3 where agricultural runoff only presents a risk during wet weather. The highest ranked risk classification identified from the above sources becomes the dry weather SIC. For example, Table 6 below outlines the risk classifications identified for a coastal recreational water body. The highest ranked risk classification for dry weather is ‘discharge of wastewater’ which is “Moderate”. Dry Weather Sanitary Inspection Category: MODERATE
32
34

Table 6: Risk Classifications for Faecal Pollutant Sources
SOURCE (Part B)
Risk Classification (Use the highest risk
classification identified for each
section under Part B)
SOURCE (Part B)
Risk Classification (Use the highest risk
classification identified for each
section under Part B) 1. Toilet Facilities Low 6. Riverine discharge N/A
2. Bather Density Low 7. Boats Low
3. Discharge of Wastewater Moderate 8. Animals Very Low
4. Stormwater discharge Low 9. Other N/A
5. Rainfall High
1.2 Wet Weather Sanitary Inspection Category A wet weather sanitary inspection category includes all faecal pollutant sources that are likely to present a risk during wet weather summer periods only (e.g. rainfall that occurs during the summer only). Such faecal pollutant sources include all dry weather sources identified above in Part B Sections 1, 2, 3, 6, 7, 8 and 9, as well as wet weather sources identified in Part B Sections 4 and 5. The highest ranked risk classification identified from the above sources becomes the wet weather SIC. For example, from the table above ‘rainfall’ has been assigned a “high” risk classification. This is the highest ranked risk classification from all the sources. Wet Weather Sanitary Inspection Category: HIGH 1.3 Effectiveness of Management Controls Where effective management controls (identified in Part C) are in place to prevent or significantly reduce the number of people who access the recreational water body during and following summer wet weather events (where wet weather presents a problem), the dry weather SIC is to be used as the assigned sanitary inspection category. Where management controls do not effectively prevent people from accessing the water during or following summer wet weather events, the wet weather SIC is to be used as the final SIC until such time that wet weather events are managed to minimise the number of people accessing the recreational water body. Assigned Sanitary Inspection Category: The assigned SIC is to be used when applying the risk classification matrix Table 5.13 of the NHMRC Guidelines. 2. Actions/Further Investigation A number of issues may need to be addressed or followed up as you complete the sanitary inspection report. Use this section to list follow up actions or other measures that can be taken to improve the quality of the recreational water body.
33
35

34
36

35
APPENDIX 3 - ENTEROTESTER TEMPLATE The Enterotester Template is an Excel spreadsheet that can automatically calculate microbial assessment categories and one-off and two-in-a-row trigger levels. The below picture provides a snapshot of what the Enterotester Template looks like. The Enterotester Template is attached in the CD provided with these guidance notes. Instructions on how to use the Enterotester Template are provided in Appendix 4.
37

36
38

APPENDIX 4 - INSTRUCTIONS FOR USING ENTEROTESTER TEMPLATE
Developed by Dr. Richard Lugg, 2006 The Copyright to this Enterotester Template belongs to the State of Western Australia, under the provisions of the Copyright Act 1968 (C’wth Australia). The use of the Enterotester Template is subject to the Terms of Use Agreement below. Terms of Use Agreement By using the Enterotester Template and Instructions you are agreeing to comply with, and be bound by, the following Terms of Use. Please review the following Terms of Use carefully. If you do not agree to these Terms, you should not use the Enterotester Template or Instructions. 1) This Agreement is between you and the State of Western Australia, represented by the
Western Australian Department of Health. All communication in respect of this Agreement will be to the Environmental Health Directorate, Western Australian Department of Health (Attention: Ms Bree Abbott), PO Box 8172, Perth Business Centre, Western Australia 6849, AUSTRALIA (or e-mail to [email protected]).
2) The material subject to the present Agreement is designated as the Enterotester Template.
3) You agree to recognise and acknowledge the ownership by the State of Western Australia, represented by the Western Australian Department of Health, of the Copyright to the Enterotester Template, in reproducing or quoting any material sourced therefrom.
4) The Enterotester Template may be used for bona fide personal, academic, research, public health and other non-commercial purposes.
5) The Enterotester Template is not to be reproduced or used for any commercial purposes without the written permission of the Western Australian Department of Health. The Department is under no obligation to grant this permission
6) You agree to advise the Western Australian Department of Health of any modifications that may be made to the Enterotester Template, and to allow it access to the new material, if requested.
7) You agree not to provide the Enterotester Template to any third party. Any requests from other parties for access to the Enterotester Template will be referred to the Western Australian Department of Health.
8) All information and content provided in the Enterotester Template is given in good faith by the WA Department of Health, and is believed to be reliable and accurate at the time of development. The State of Western Australia, the WA Department of Health and their respective officers, employees and agents, do not accept legal liability or responsibility for the Enterotester Template, or any consequences arising from its use.
INTRODUCTION The Enterotester Template has been designed to calculate 95th percentiles that characterises the risk of gastroenteritis in adults undertaking whole of body contact recreation in the water body being assessed, when calculated according to the equation of Wyer et al. (1999). These 95th percentiles are used to determine Microbiological Assessment Categories (MAC) for recreational water bodies which correspond to the MACs used in the WHO Guidelines for safe recreational water environments (2003), the New Zealand Microbiological Water Quality Guidelines for Marine and Freshwater Recreational Areas (2003) [marine waters only], and the NHMRC Guidelines for Managing Risks in Recreational Waters (2005). They thus should have wide application in many jurisdictions.
39

The Enterotester Template calculates the MAC by applying the parametric approach and standardises the 95th percentile results to reflect as closely as possible the infection risks shown in Table 5.7 of the NHMRC Guidelines. This approach is further discussed on page 72 of the Guidelines. Also produced are suggested trigger levels that may be used to initiate resampling, special investigations, or management action, as determined by the appropriate managing authority. Instructions and comments are included in the template to assist the user. However this document contains a fuller account of how to get the best results out of your Enterotester Template.
40

GETTING STARTED To get started double click on the Excel™ workbook titled “Enterotester” provided on the attached CD. Once the application has loaded, you will be prompted whether or not to allow the macro code to be activated.
Select “Enable Macros” as this will enable some of the advanced features of the Online forms. TROUBLESHOOTING When clicking the “Send to Supervisor” or the “Send to HCN” button, nothing happens. Solution: Check to make sure you were prompted to enable macros as shown in Step 2 above. If you didn’t see this dialogue box or were not prompted elsewhere whether or not to enable the macros, you may have opened the document with macro capability disabled. Contact your I.T. Support Team for assistance, or follow these steps to enable this function: For Microsoft Office versions 2000 and above: Click “Tools, Macro, Security” in the menu bar as shown on the left. The Security window will then be displayed as shown on the right. Select “Medium Security” to enable the form macros for this application. You may need to repeat the procedure for other applications.
41

USING THE ENTEROTESTER NOTE:
A minimum of 8 observations and maximum of 287 observations are required for the Enterotester to work.
A maximum of 5 years worth of enterococci values should be entered into the template in accordance with the NHMRC Guidelines. Only include enterococci results recorded during the recognised bathing season (e.g. season when majority of the public are swimming).
A red triangle is located in the top right hand corner of a number of the cells in the template. Place the cursor over the red triangle for an explanation of the text in the cell.
Additional definitions for all terms sited in the template are provided at the end of these instructions.
Step 1: Inserting the data
NOTE:
• Do not include results collected during the winter season. • Enterococci data that are shown as a less than value (e.g. <10) should be
entered with a "<" sign. • Complete column A, cell A21 “Lowest enumerated value” if there are
observations reported as less than a value other than 10 (e.g. <5 cfu/100mL). This value can be obtained from the NATA accredited analytical laboratory responsible for analysing the samples.
1.1 Cut and paste the dates of sample collection (day/month/year) starting from column A row 24, under the heading “Dates of observation”.
1.2 Cut and paste the corresponding enterococci concentrations (cfu/100ml) starting from column B, row 24, under the heading “Concentration of organisms”.
42

Step 2: Fixing the data Press the “Fix data” button (column A row 23). This button will fix the data into the template and the missing values will automatically calculate and appear on the template. Step 3: Testing the Lognormal Hypothesis Look at the value in column D row 19 under the heading “Probability of lognormal distribution of orgabisms”. (This is the lognormal hypothesis). You need to decide whether to accept this value (tentatively) or reject the value as lognormally distributed.
To do this, you either: 1. ACCEPT the value if it is greater than (>) 0.05 – then REFER TO STEP 3.1 2. REJECT the value if it is shown in pink and/or:
a) It is less than (<) 0.05. b) More than 80% of the observations are below the lowest enumerated value
(e.g. <10 cfu/100mL) Check column B row 21.
c) There are only two different enumerated concentrations
(two different detected values not including <10cfu/100mL) of organisms in the set of data (refer to data in column D starting from row 24).
Then REFER TO STEP 3.2
Value is greater than 0.05 ACCEPT
Value is less than 0.05 REJECT
43

Step 3.1: Accepting data as lognormal Where you accepted the data as lognormal in step 3 (e.g. Accept the value if it is greater than (>) 0.05), look at the value in column D row 21 under the heading “No. of Standard Errors away from Ref Standard Deviation”. If the value is less than (<) 0.01 ACCEPT VALUES IN TEMPLATE AND REFER TO STEP 4 If the value is greater than (>) 0.01, press the “Reassign” button (column H row 23). Continue pressing the Reassign button for as long as the value in column D row 21 under the heading “No. of Standard Errors away from Ref Standard Deviation” continues to approach zero, or until the value in column G row 19 under the heading “Assigned 95th percentile” no longer changes as you keep pressing the reassign button. If the value in column D row 21 reaches zero, or the value in column G row 19 no longer changes (without any text boxes appearing) ACCEPT VALUES IN TEMPLATE AND REFER TO STEP 4 TEXT BOX MESSAGES A number of text boxes may appear as you press the reassign button. Further action may be required if a text box appears as outlined below:
a) Text box 1:
Click “OK” and continue clicking the reassign button until the value in column D row 21 under the heading “No. of Standard Errors away from Ref Standard Deviation” approaches zero. ACCEPT VALUES IN TEMPLATE AND REFER TO STEP 4
Value is >0.01 so Press Reassign button
Value is <0.01 so ACCEPT values in template and refer to step 4
Keep pressing Reassign Button
until value approaches ZERO
44

b) Text box 2:
Click ‘Yes’. It is important that the value in column D row 8 under the heading “Log10 Standard Deviation of Ref. Distribution” is changed back to 0.81 (the original reference distribution value). Type 0.81 over the text in this cell. ACCEPT VALUES IN TEMPLATE AND REFER TO STEP 4
c) Text box 3:
Click ‘Yes’. The empirical distribution “dot” in column G row 23 will disappear. ACCEPT VALUES IN TEMPLATE AND REFER TO STEP 4
Step 3.2: Rejecting the data Where you reject the data in step 3 (where the value is shown in pink or the value is <0.05), delete the empirical distribution “dot” in column G row 23 (click on the dot in the cell and press delete). ACCEPT VALUES IN TEMPLATE AND REFER TO STEP 4
NOTE: The 95th percentile in column G row 19 “Assigned 95th percentile” is assigned on the assumption that the sample data can be regarded as drawn from a lognormal distribution with the same standard deviation as the Reference Distribution (0.81) and the “geometric mean” shown in column F row 19.
Type 0.81 over text
Click on dot and press delete
45

When testing the lognormal hypothesis as outlined above, and you decide it should be accepted after all, you can undo the deleting the dot in column G row 23. To undo the deletion of the dot, press Ctrl-Z or type “n” in this cell. Step 4: Export Data The final values calculated using the template (e.g. microbial assessment category values) can be exported into a second spreadsheet in table format for the purpose of report writing.
The data will be exported onto the third row of the spreadsheet unless otherwise specified. (If you have a number of sampling sites you can export the final values onto the same spreadsheet on different rows). The following values/fields will be exported into the second ‘export’ spreadsheet:
Site Code Site Name Seasons Covered* Number of Observations Percent of observations below lowest enumerated value Percent of observations less than 33 cfu/100mL Percent of observations above 157 cfu/100mL Assigned or Standardised 95th Percentile Microbial Assessment Category Website traffic light colour Suggested Water Quality two-in-a-row Trigger Level Suggested Water Quality one-off Trigger Level
*To be filled in manually.
Step 5: Trigger Adjustment NOTE: Step 5 is only necessary where the trigger levels in column I row 17 “Suggested Water quality one-off Trigger Level” and column I row 34 “Suggested Water Quality Two-in-a-row Trigger Level” are too high (e.g. >500 enterococc/100mL) and are considered unsuitable as trigger levels. If the trigger values are suitable Step 5 is not required. The values in the template can be accepted. Refer to Step 6. There will be occasions where the values in column I row 17 “Suggested Water quality one-off Trigger Level” and column I row 34 “Suggested Water Quality Two-in-a-row Trigger Level” will not be suitable as trigger levels. These values may be considered to be too high (e.g. >500 enterococci/100mL).
In this instance you can recalculate the trigger levels by pressing the “Trigger Adjustment” button on column C row 23.
Press the “Export” button (column F row 23) to transfer the final values into a second template.
46

This button will adjust the trigger levels by taking out the worst or highest values that may be causing the unsuitable trigger levels. A new trigger level will then be calculated. A text box may appear which states: Text box:
If this text box appears do not use the new triggers and revert back to the previous trigger levels.
Step 6: Reusing template To insert new data into the template simply highlight the enterococci results (column A row 24) and dates of observations (column B row 24) and press delete. New data can then be inserted into the template, and step 1 can be repeated.
Term Definition
Assigned 95th percentile or Standardised 95th percentile
The assigned 95th percentile is the 95th percentile of the lognormal distribution defined by the assigned geometric mean and a log standard deviation of 0.81, the same as the reference distribution used in the WHO and NHMRC Guidelines. The 95th percentile is the value below which 95 percent of the cumulative distribution lies. The assigned 95th percentile should not be taken as describing or characterising the sample set or its underlying distribution, unless the probability of a lognormal distribution shown in cell D19 is higher than 0.05. A standardised 95th percentile is the 95th percentile of a lognormal distribution of enterococci with the same calculated infection risk as that of the observed distribution (i.e. the risk of infection characterised in cell H27), but having a log standard deviation of 0.81. The value for both the assigned and standardised 95th percentile is suitably rounded to avoid false impressions of accuracy.
Assigned geometric mean
The assigned geometric mean is the geometric mean of the reference distribution (or whatever is in cell D7) multiplied by the test statistic. Geometric means are averages on a logarithmic scale. They reduce
Warning: This action is not reversible, so export your results (Step 5) before running or repeating this procedure. You will be alerted if the value in cell D19 should not be accepted. This spreadsheet cannot be reused with new data after the Trigger Adj button has been clicked.
47
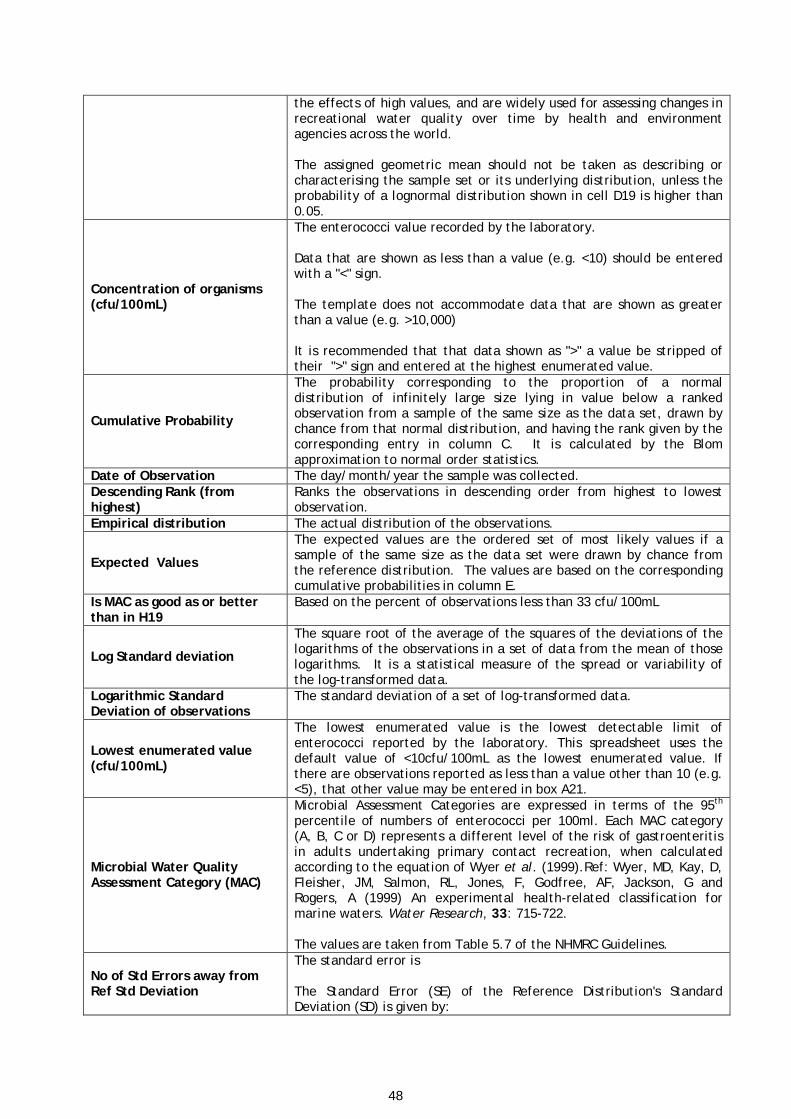
the effects of high values, and are widely used for assessing changes in recreational water quality over time by health and environment agencies across the world. The assigned geometric mean should not be taken as describing or characterising the sample set or its underlying distribution, unless the probability of a lognormal distribution shown in cell D19 is higher than 0.05.
Concentration of organisms (cfu/100mL)
The enterococci value recorded by the laboratory. Data that are shown as less than a value (e.g. <10) should be entered with a "<" sign. The template does not accommodate data that are shown as greater than a value (e.g. >10,000) It is recommended that that data shown as ">" a value be stripped of their ">" sign and entered at the highest enumerated value.
Cumulative Probability
The probability corresponding to the proportion of a normal distribution of infinitely large size lying in value below a ranked observation from a sample of the same size as the data set, drawn by chance from that normal distribution, and having the rank given by the corresponding entry in column C. It is calculated by the Blom approximation to normal order statistics.
Date of Observation The day/month/year the sample was collected. Descending Rank (from highest)
Ranks the observations in descending order from highest to lowest observation.
Empirical distribution The actual distribution of the observations.
Expected Values
The expected values are the ordered set of most likely values if a sample of the same size as the data set were drawn by chance from the reference distribution. The values are based on the corresponding cumulative probabilities in column E.
Is MAC as good as or better than in H19
Based on the percent of observations less than 33 cfu/100mL
Log Standard deviation
The square root of the average of the squares of the deviations of the logarithms of the observations in a set of data from the mean of those logarithms. It is a statistical measure of the spread or variability of the log-transformed data.
Logarithmic Standard Deviation of observations
The standard deviation of a set of log-transformed data.
Lowest enumerated value (cfu/100mL)
The lowest enumerated value is the lowest detectable limit of enterococci reported by the laboratory. This spreadsheet uses the default value of <10cfu/100mL as the lowest enumerated value. If there are observations reported as less than a value other than 10 (e.g. <5), that other value may be entered in box A21.
Microbial Water Quality Assessment Category (MAC)
Microbial Assessment Categories are expressed in terms of the 95th percentile of numbers of enterococci per 100ml. Each MAC category (A, B, C or D) represents a different level of the risk of gastroenteritis in adults undertaking primary contact recreation, when calculated according to the equation of Wyer et al. (1999).Ref: Wyer, MD, Kay, D, Fleisher, JM, Salmon, RL, Jones, F, Godfree, AF, Jackson, G and Rogers, A (1999) An experimental health-related classification for marine waters. Water Research, 33: 715-722. The values are taken from Table 5.7 of the NHMRC Guidelines.
No of Std Errors away from Ref Std Deviation
The standard error is The Standard Error (SE) of the Reference Distribution's Standard Deviation (SD) is given by:
48

SD/(2N)½ This SE will be ~ normally distributed where N>25. N.B. A value shown in pink should be disregarded.
Number of chosen samples
If the number of observations is even, half that number, otherwise the nearest integer above half; but if the number of enumerated observations is less than this, then the number of enumerated observations.
Number of observations N (from 5 to 287)
The number of samples collected at a particular sampling location over a period not exceeding five years. Requires a minimum of 5 samples and is currently limited to a maximum of 287 samples. However this number can be easily extended by filling down the relevant columns of the workbook.
Percent of observations above 157 cfu/100mL
The percent of observations above 157 cfu/100mL is the number of reported observations above this value. This value has been taken from the Wyer et al paper.
Percent of observations below lowest enumerated value
The percent of observations below the lowest enumerated value is simply the percentage of observations below the lowest reported enumerated value. If this figure exceeds 80%, the probability value shown in cell D19 may not be reliable. If the figure is 80%, the total number of observations should be at least 20. This statement comes from the following paper: Verrill, S and A Johnson (1988)., Tables and Large Sample Distribution Theory for Censored Data Correlation Statistics for Testing Normality. Journal of the American Statistical Association, 83, 1192-1197.
Percent of observations less than 33 cfu/100mL
The percent of observations less than 33 cfu/100mL is the number of reported observations below this value. This value has been taken from the Wyer et al paper.
Probability of lognormal distribution of the organisms
The probability of lognormal distribution of the organisms is calculated from the value of the Shapiro-Francia statistic W’ by the method given in Royston P (1993) A toolkit for testing for non-normality in complete and censored samples. The Statistician, 42: 37-43. The 95th percentile in cell G19 is assigned on the assumption that the sample data can be regarded as drawn from a lognormal distribution with the same standard deviation as the Reference Distribution and the geometric mean shown in cell F19. This assumption should be rejected at the 5% significance level if the probability of a log-normal distribution shown in cell D19 is less than 0.05. The value is suspect (shown in pink) if more than 80% of the observations are censored (below the lowest enumerated value). A value of 1.000 is suspect (shown in pink) if there are only two different concentrations of organisms in the sample.
Reference distribution
The lognormal distribution defined by a geometric mean of 9.3 and a log10 standard deviation of 0.81. This is the distribution of enterococci/100mL lying at the boundary of MACs B and C, as used in the WHO and NHMRC Guidelines.
Sorted Observations Sorts the observations in descending order from highest to lowest observation.
Suggested Water Quality one-off Trigger Level
The suggested water quality one-off trigger level at a particular sampling location is the recommended enterococci value that when exceeded should trigger further investigation into the source of pollution, and trigger when to re-sampled and further investigate where no sources are identified.
49

This value is calculated using the estimated 99th percentile of the distribution of the observations, if the lognormal model is acceptable; otherwise, if there are 57 or more observation, their 99th percentile as calculated by the average of the Blom and Hazen methods; otherwise, the 99th percentile of the bounding reference distribution for the category shown in cell H19. Helpful in judging whether the highest observation(s) may be best explained as part of the distribution, or as indicating a change in prevailing conditions. Note: May be less than an assigned or reassigned 95th percentile in cell F19, if the standard deviation used is much less than that of the reference distribution.
Suggested Water Quality two-in-a-row Trigger Level
The suggested water quality two-in-a-row trigger level at a particular sampling location is the recommended enterococci value that when exceeded after two consecutive sampling occasions should trigger further investigation into the cause of pollution and trigger when to re-sampled and further investigate where no sources are identified. This value is calculated using the estimated 90th percentile of the distribution of the observations, if the lognormal model is acceptable; otherwise, the 90th percentile of the observations as calculated by the average of the Blom and Hazen methods. The probability of two successive occurrences by chance at or above this level (~1%) is about the same as one occurrence at or above the level in cell I17.
Test Statistic
The test statistic is the mean of the top half of the sorted observations, including the median for odd-numbered series, or of the enumerated values (whichever is the fewer), divided by the mean of the corresponding expected values (from the reference distribution).
50

APPENDIX 5 - RESPONSE PLAN FOR ELEVATED RESULTS
Signage Signage should only be considered
for a recreational water area where there is clear evidence of faecal contamination. Once the source has been identified and
eliminated or controlled and the enterococci counts return to
normal levels, then the sign can be removed and public access allowed
to the recreational water area.
Press Release
A press release should only be considered for a recreational
water area where there is clear evidence of faecal
contamination of public health significance.
Elevated Results Where enterococci values remain high,
undertake a sanitary inspection to establish possible faecal pollutant source, and to determine whether
increased monitoring is warranted and whether signage and a press release
should be considered.
Background levels If the sanitary inspection reveals no identifiable health risk to swimmers and the re-sample enterococci value
returns to background levels, continue routine monitoring.
Elevated Enterococci ValueEnterococci value above suggested water
quality one-off or two-in-a row trigger level.
Review Field Observation NotesThe field sampling officer to review field observation notes collected on the day of sampling to
determine any possible causal link for high results, and look for the presence of any possible factors that could explain the high results e.g. presence of bird droppings at sample location, heavy
rainfall. Re-sampling would not be warranted only if the sampling officer saw clear evidence of a temporary circumstance that could be said with confidence to explain the high result.
Re-sampleRe-sample water on a daily basis for enterococci and undertake a sanitary inspection to identify possible faecal
pollution sources.
45
51

52
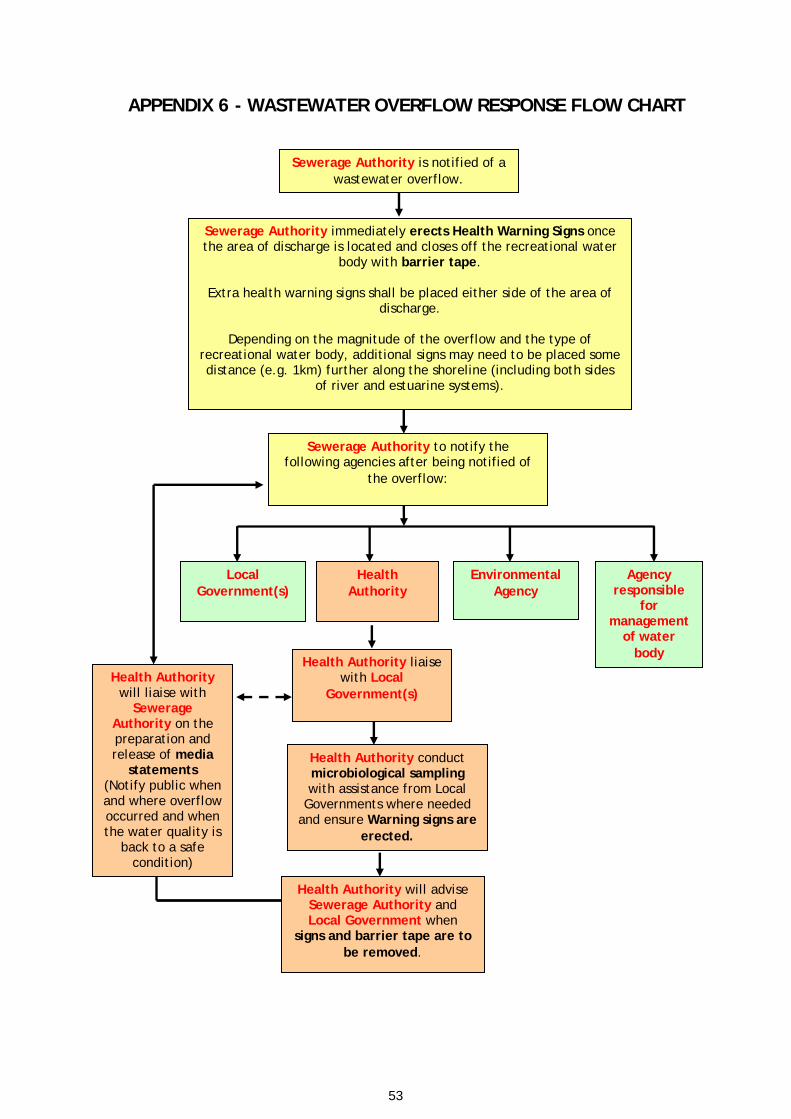
APPENDIX 6 - WASTEWATER OVERFLOW RESPONSE FLOW CHART
Sewerage Authority is notified of a wastewater overflow.
Sewerage Authority immediately erects Health Warning Signs once the area of discharge is located and closes off the recreational water
body with barrier tape.
Extra health warning signs shall be placed either side of the area of discharge.
Depending on the magnitude of the overflow and the type of
recreational water body, additional signs may need to be placed some distance (e.g. 1km) further along the shoreline (including both sides
of river and estuarine systems).
Sewerage Authority to notify the
following agencies after being notified of the overflow:
Health Authority conduct microbiological sampling with assistance from Local
Governments where needed and ensure Warning signs are
erected.
Health Authority
Local Government(s)
Environmental Agency
Agency responsible
for management
of water body
Health Authority will advise Sewerage Authority and Local Government when
signs and barrier tape are to be removed.
Health Authority will liaise with
Sewerage Authority on the preparation and release of media
statements (Notify public when and where overflow occurred and when the water quality is
back to a safe condition)
Health Authority liaisewith Local
Government(s)
47
53

46
54
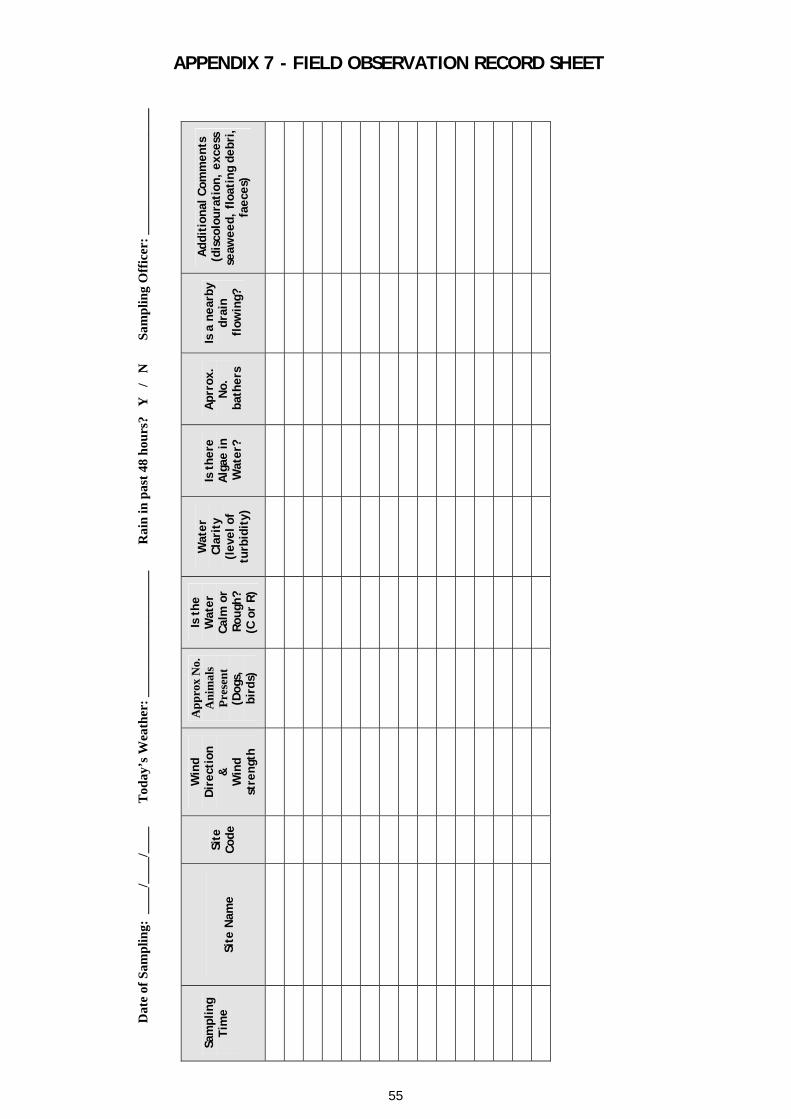
Dat
e of
Sam
plin
g: _
___/
____
/___
_
T
oday
’s W
eath
er: _
____
____
____
____
__
Rai
n in
pas
t 48
hour
s?
Y
/ N
Sam
plin
g O
ffic
er: _
____
____
____
____
__
APPENDIX 7 - FIELD OBSERVATION RECORD SHEET
Sam
plin
g Ti
me
Si
te N
ame
Site
Co
de
Win
d D
irec
tion
&
W
ind
stre
ngth
App
rox
No.
A
nim
als
Pres
ent
(Dog
s,
bird
s)
Is t
he
Wat
er
Calm
or
Roug
h?
(C o
r R)
W
ater
Cl
arit
y (l
evel
of
turb
idit
y)
Is t
here
A
lgae
in
Wat
er?
Apr
rox.
N
o.
bath
ers
Is a
nea
rby
drai
n fl
owin
g?
Add
itio
nal C
omm
ents
(d
isco
lour
atio
n, e
xces
s se
awee
d, f
loat
ing
debr
i,
faec
es)
49
55

48
56
Related Documents