MICROBIAL DYNAMICS IN SALT AFFECTED SOILS BY SYED ASIF SHAH DOCTOR OF PHILOSOPHY (Ph.D) IN AGRICULTURE (SOIL & ENVIRONMENTAL SCIENCES) DEPARTMENT OF SOIL AND ENVIRONMENTAL SCIENCES, FACULTY OF CROP PRODUCTION SCIENCES, THE UNIVERSITY OF AGRICULTURE, PESHAWAR, PAKISTAN NOVEMBER, 2013

Welcome message from author
This document is posted to help you gain knowledge. Please leave a comment to let me know what you think about it! Share it to your friends and learn new things together.
Transcript
MICROBIAL DYNAMICS IN SALT AFFECTED SOILS
BY
SYED ASIF SHAH
DOCTOR OF PHILOSOPHY (Ph.D) IN AGRICULTURE (SOIL & ENVIRONMENTAL SCIENCES)
DEPARTMENT OF SOIL AND ENVIRONMENTAL SCIENCES, FACULTY OF CROP PRODUCTION SCIENCES,
THE UNIVERSITY OF AGRICULTURE, PESHAWAR, PAKISTAN
NOVEMBER, 2013
MICROBIAL DYNAMICS IN SALT AFFECTED SOILS
BY
SYED ASIF SHAH
A Thesis Submitted to The University of Agriculture, Peshawar in Partial fulfillment of the requirements for the degree of
DOCTOR OF PHILOSOPHY (Ph.D) IN AGRICULTURE (SOIL & ENVIRONMENTAL SCIENCES)
APPROVED BY: _________________________________ Prof. Dr. Zahir Shah Dept. of Soil and Environmental Sciences
Chairman Supervisory Committee
_________________________________ Prof. Dr. Muhammad Jamal Khan Dept. of Soil and Environmental Sciences
Member (Major)
_________________________________ Prof. Dr. Muhammad Tariq Jan Dept. of Agronomy
Member (Minor)
_________________________________ Prof. Dr. Zahir Shah Dept. of Soil and Environmental Sciences
Convener Board of Studies
_________________________________ Prof. Dr. Zahoor Ahmed Swati
Dean, Faculty of Crop Production Sciences
_________________________________ Prof. Dr. Farhatullah
Director Advanced Studies and Research
DEPARTMENT OF SOIL AND ENVIRONMENTAL SCIENCES FACULTY OF CROP PRODUCTION SCIENCES,
THE UNIVERSITY OF AGRICULTURE, PESHAWAR, PAKISTAN NOVEMBER, 2013
i
TABLE OF CONTENTS
No. Title Page #
LIST OF TABLES .................................................................................................. VI
LIST OF FIGURES .................................................................................................. X
ABSTRACT ......................................................................................................... XIII
1 GENERAL INTRODUCTION ........................................................................ 1
2 OBJECTIVES .................................................................................................... 4
2.1 MAIN OBJECTIVE .............................................................................................. 4
2.2 SPECIFIC OBJECTIVES ........................................................................................ 4
3 REVIEW OF LITERATURE ........................................................................... 5
3.1 SALT AFFECTED SOILS ..................................................................................... 5
3.2 EXTENT OF SALINITY ........................................................................................ 5
3.3 CATEGORIES OF SALT-AFFECTED SOILS ........................................................... 6
3.4 EFFECT OF SALTS ON SOILS .............................................................................. 8
3.5 EFFECT OF SALTS ON PLANTS ........................................................................... 9
3.6 SALT-AFFECTED SOILS RECLAMATION ........................................................... 10
3.6.1 Pressmud ............................................................................................... 11
3.6.2 Gypsum .................................................................................................. 12
3.6.3 Farmyard manure .................................................................................. 13
3.7 EFFECT OF SALTS ON SOIL MICROBIAL PROPERTIES ....................................... 13
3.8 MICROBIAL INOCULATION .............................................................................. 14
3.9 ROLE OF MICROBES IN RECLAMATION OF SALT-AFFECTED SOIL .................... 15
4 MATERIALS AND METHODS .................................................................... 17
4.1 SITE CHARACTERISTICS .................................................................................. 17
4.2 SOIL SAMPLING AND PROCESSING .................................................................. 22
4.3 PROPOSED EXPERIMENTS ............................................................................... 22
4.3.1 Microbiological properties of native salt affected soils ........................ 23
4.3.2 Effect of NaCl induced salinity on CO2 evolution and N mineralization
in silty clay loam soil ......................................................................................... 23
ii
4.3.3 Effect of MgCl2 induced salinity on CO2 evolution and N mineralization
in a silty clay loam soil ...................................................................................... 24
4.3.4 Comparative effect of pressmud, gypsum, farmyard manure and
microbial inoculations on soil microbial biomass and activity in saline sodic
soil 25
4.4 LABORATORY ANALYSIS ................................................................................ 25
4.4.1 Microbial biomass C and N ................................................................... 26
4.4.1.1 Fumigation ..................................................................................... 26
4.4.1.2 Inoculations ................................................................................... 26
4.4.1.3 Measurements of CO2 evolution ................................................... 26
4.4.1.4 Calculation of biomass C ............................................................... 27
4.4.1.5 Calculation of biomass N .............................................................. 27
4.4.2 Determination of total mineral N .......................................................... 28
4.4.3 Mineralizable N (mg N kg-1 soil) ........................................................... 28
4.4.4 Total N ................................................................................................... 28
4.4.5 Preparation of microbial inoculants of salt tolerant microorganisms .. 29
4.4.5.1 Isolation and culture of salt tolerant microorganisms ................... 29
4.4.5.2 Inoculation of soil with desired number of salt tolerant
microorganisms ............................................................................................. 29
4.4.5.3 Preparation of nutrient agar media ................................................ 30
4.4.5.4 Preparation of peptone glucose acid agar media ........................... 30
4.4.6 Measurement of gypsum requirements .................................................. 30
4.4.7 Saturation moisture percentage/saturation extracts ............................. 31
4.4.8 Sodium ................................................................................................... 31
4.4.9 Calcium and magnesium ....................................................................... 31
4.4.10 Carbonates and bicarbonates ............................................................ 31
4.4.11 Chloride ............................................................................................. 32
4.4.12 Sodium adsorption ratio (SAR) ......................................................... 32
4.4.13 Exchangeable sodium percentage ..................................................... 32
4.4.14 pH ...................................................................................................... 33
4.4.15 Electrical conductivity ....................................................................... 33
4.4.16 Lime content ...................................................................................... 33
4.4.17 Organic matter .................................................................................. 33

iii
4.4.18 Soil texture ......................................................................................... 34
4.5 STATISTICAL ANALYSIS .................................................................................. 34
5 RESULTS AND DISCUSSION ...................................................................... 35
5.1 MICROBIAL BIOMASS AND ACTIVITY IN NATIVE SALT AFFECTED
SOIL ...................................................................................................................... 35
5.1.1 Soil chemical characteristics ................................................................. 35
5.1.2 Soil microbial characteristics ................................................................ 37
5.1.2.1 Effect of soil EC on microbiological parameters .......................... 37
5.1.2.1.1 Microbial biomass carbon ........................................................ 37
5.1.2.1.2 Microbial biomass nitrogen ..................................................... 38
5.1.2.1.3 Microbial biomass C/N ratio ................................................... 38
5.1.2.1.4 Nitrogen mineralization ........................................................... 41
5.1.2.1.5 Nitrification .............................................................................. 43
5.1.2.1.6 Rate of soil respiration ............................................................. 43
5.1.2.1.7 Cumulative CO2 production .................................................... 45
5.1.2.2 Effect of soil pH on microbial indices ........................................... 48
5.1.2.2.1 Microbial biomass carbon ........................................................ 48
5.1.2.2.2 Microbial biomass nitrogen ..................................................... 48
5.1.2.2.3 Microbial biomass C/N ratio ................................................... 50
5.1.2.2.4 Nitrogen mineralization ........................................................... 52
5.1.2.2.5 Nitrification .............................................................................. 52
5.1.2.2.6 Rate of soil respiration ............................................................. 54
5.1.2.2.7 Cumulative CO2 production .................................................... 54
5.1.2.3 Correlation coefficient of microbial indices with sodium ............. 58
5.1.2.4 Correlation coefficient of microbial indices with sodium
adsorption ratio .............................................................................................. 66
5.1.2.5 Correlation coefficient of microbial indices with soluble salts of
calcium and magnesium ................................................................................ 74
5.1.2.6 Correlation coefficient of microbial indices with soil carbonates . 81
5.1.2.7 Correlation coefficient of microbial indices with soil bicarbonates
88
5.1.2.8 Correlation coefficient of microbial indices with soil chloride ..... 95

iv
5.2 EFFECT OF NACL INDUCED SALINITY ON CO2 EVOLUTION AND N
MINERALIZATION IN A SILTY CLAY LOAM SOIL .................................... 103
5.2.1 Introduction ......................................................................................... 103
5.2.2 Materials and methods ........................................................................ 103
5.2.2.1 Experimental site ......................................................................... 104
5.2.2.2 Soil sampling and processing ...................................................... 104
5.2.2.3 Treatment arrangements .............................................................. 104
5.2.2.4 Incubation experiment ................................................................. 104
5.2.3 Soil chemical characteristics ............................................................... 105
5.2.4 Results and Discussion ........................................................................ 105
5.2.4.1 Rate of soil respiration ................................................................. 105
5.2.4.2 Cumulative CO2 evolution .......................................................... 106
5.2.4.3 Nitrogen mineralization ............................................................... 108
5.3 EFFECT OF MGCL2 INDUCED SALINITY ON CO2EVOLUTION AND N
MINERALIZATION IN A SILTY LOAM SOIL................................................ 112
5.3.1 Introduction ......................................................................................... 112
5.3.2 Materials and methods ........................................................................ 113
5.3.2.1 Site characteristics ....................................................................... 113
5.3.2.2 Experimental site ......................................................................... 113
5.3.2.3 Soil sampling and processing ...................................................... 113
5.3.2.4 Treatment arrangements .............................................................. 113
5.3.2.5 Incubation experiment ................................................................. 114
5.3.3 Results and Discussions....................................................................... 114
5.3.3.1 Rate of soil respiration ................................................................. 114
5.3.3.2 Cumulative CO2 production ........................................................ 117
5.3.3.3 Nitrogen mineralization ............................................................... 119
5.4 COMPARATIVE EFFECT OF PRESSMUD, GYPSUM, FARMYARD
MANURE AND MICROBIAL INOCULATIONS ON SOIL MICROBIAL
BIOMASS AND ACTIVITY IN SALINE SODIC SOIL .................................... 122
5.4.1 Introduction ......................................................................................... 122
5.4.2 Materials and methods ........................................................................ 123
5.4.2.1 Experimental site ......................................................................... 123
5.4.2.2 Soil sampling and processing ...................................................... 123
v
5.4.2.3 Treatments and experimental design ........................................... 123
5.4.2.4 Incubation experiment ................................................................. 124
5.4.3 Results and Discussion ........................................................................ 124
5.4.3.1 Rate of soil respiration ................................................................. 124
5.4.3.2 Microbial biomass C .................................................................... 125
5.4.3.3 Microbial biomass N ................................................................... 126
5.4.3.4 Microbial biomass C/N ratio ....................................................... 127
5.4.3.5 Ammonification ........................................................................... 128
5.4.3.6 Nitrification ................................................................................. 128
5.4.3.7 Net N mineralization ................................................................... 130
5.4.3.8 Crop response to amendments ..................................................... 131
6 SUMMARY .................................................................................................... 133
7 CONCLUSIONS AND RECOMMENDATIONS ...................................... 136
8 LITERATURE CITED ................................................................................. 137
9 APPENDICES ................................................................................................ 157
vi
List of Tables
No. Title Page #
Table 4.1: Meteorological data of Peshawar during 1973-2002. 21
Table 5.1: Chemical characteristics of soils (0-20cm) used in the study 36
Table 5.2: Correlation coefficient of soil EC with MBC, MBN, MB C/N ratio and
Nitrification 39
Table 5.3: Microbiological properties of soils (0-20cm) as affected by EC levels 39
Table 5.4: Rate of soil respiration in response to varying salinity levels during
different incubation periods 44
Table 5.5: Cumulative CO2 production in response to varying salinity levels during
different incubation periods 47
Table 5.6: Correlation coefficient of soil pH with MBC, MBN, MB C/N ratio and
Nitrification 49
Table 5.7: Microbial biomass C, N, Microbial biomass C/N ratio, N-mineralization
and Nitrification as affected by soil pH 49
Table 5.8: Effect of soil pH on soil respiration rate at different incubation periods 55
Table 5.9: Effect of soil pH on cumulative CO2 production 57
Table 5.10: Correlation coefficient of Na with MBC, MBN, MB C/N ratio and
Nitrification 59
Table 5.11: Microbial biomass C, N, N-mineralization, Microbial biomass C/N ratio
and Nitrification as influenced by soluble Na 59
Table 5.12: Effect of soil Na concentration on rate of respiration during different
incubation periods 63
Table 5.13: Cumulative CO2 production as influenced by soluble Na content 65
Table 5.14: Correlation coefficient of SAR with MBC, MBN, MB C/N ratio and
Nitrification 67
Table 5.15: Microbial biomass C, N, Microbial biomass C/N ratio, N-Mineralization
and Nitrification as influenced by soil SAR 67
Table 5.16: Rate of soil respiration as affected by SAR during different incubation
periods 71
Table 5.17: Cumulative CO2 production as affected by soil SAR 73
vii
Table 5.18: Correlation coefficient of Ca+Mg with MBC, MBN, MB C/N ratio,
nitrification and CO2 production 75
Table 5.19: Microbial biomass C, N, Microbial biomass C/N ratio, N-miniralizaion
and Nitrification with different soil Ca+Mg contents 75
Table 5.20: Rate of soil respiration as affected by soluble calcium and magnesium
content during different incubation periods 79
Table 5.21: Cumulative CO2 productions (mg kg-1) as influenced by soluble Ca+Mg
contents 80
Table 5.22: Correlation coefficient of MBC, MBN, MB C/N ratio, Nitrification and
CO2 production with soil carbonates content 82
Table 5.23: Microbial biomass C, N, N-Mineralization, Microbial biomass C/N ratio
and Nitrification as influenced with soluble carbonates 82
Table 5.24: Rate of soil respiration influenced by soluble carbonates during different
incubation periods 86
Table 5.25: Cumulative CO2 production as influenced by soluble carbonates content
87
Table 5.26: Correlation coefficient of MBC, MBN, MB C/N ratio, Nitrification and
CO2 production with soil bicarbonates content 89
Table 5.27: Microbiological properties of soils as affected by soluble HCO3- content
89
Table 5.28: Rate of soil respiration influenced with bi-carbonate contents during
different incubation periods 93
Table 5.29: Cumulative CO2 production as influenced with bicarbonates content
during different incubation periods 94
Table 5.30: Correlation coefficient of MBC, MBN, MB C/N ratio, Nitrification and
CO2 production with soil chloride content 96
Table 5.31: Microbiological properties of soils as affected by soil chloride content 96
Table 5.32: Rate of soil respiration in response to varying chloride concentrations
during different incubation periods 100
Table 5.33: Cumulative CO2 production as influenced by chloride contents during
different incubation periods 101
Table 5.34: Some properties of the soil (0-20 cm) used in the experiment 105
viii
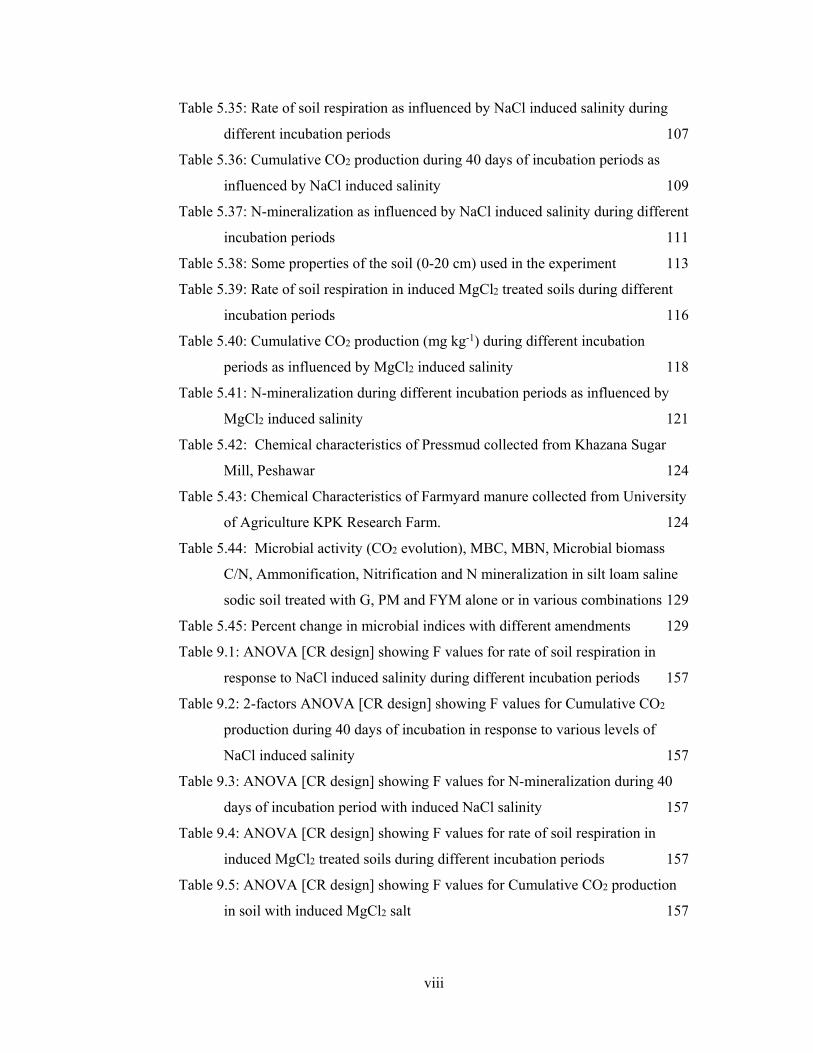
Table 5.35: Rate of soil respiration as influenced by NaCl induced salinity during
different incubation periods 107
Table 5.36: Cumulative CO2 production during 40 days of incubation periods as
influenced by NaCl induced salinity 109
Table 5.37: N-mineralization as influenced by NaCl induced salinity during different
incubation periods 111
Table 5.38: Some properties of the soil (0-20 cm) used in the experiment 113
Table 5.39: Rate of soil respiration in induced MgCl2 treated soils during different
incubation periods 116
Table 5.40: Cumulative CO2 production (mg kg-1) during different incubation
periods as influenced by MgCl2 induced salinity 118
Table 5.41: N-mineralization during different incubation periods as influenced by
MgCl2 induced salinity 121
Table 5.42: Chemical characteristics of Pressmud collected from Khazana Sugar
Mill, Peshawar 124
Table 5.43: Chemical Characteristics of Farmyard manure collected from University
of Agriculture KPK Research Farm. 124
Table 5.44: Microbial activity (CO2 evolution), MBC, MBN, Microbial biomass
C/N, Ammonification, Nitrification and N mineralization in silt loam saline
sodic soil treated with G, PM and FYM alone or in various combinations 129
Table 5.45: Percent change in microbial indices with different amendments 129
Table 9.1: ANOVA [CR design] showing F values for rate of soil respiration in
response to NaCl induced salinity during different incubation periods 157
Table 9.2: 2-factors ANOVA [CR design] showing F values for Cumulative CO2
production during 40 days of incubation in response to various levels of
NaCl induced salinity 157
Table 9.3: ANOVA [CR design] showing F values for N-mineralization during 40
days of incubation period with induced NaCl salinity 157
Table 9.4: ANOVA [CR design] showing F values for rate of soil respiration in
induced MgCl2 treated soils during different incubation periods 157
Table 9.5: ANOVA [CR design] showing F values for Cumulative CO2 production
in soil with induced MgCl2 salt 157

ix
Table 9.6: 2-factors ANOVA [CR design] showing F values for N-mineralization
during different incubation periods in MgCl2 induced salinity 158
Table 9.7: ANOVA [CR design] showing F values for CO2 evolution, MBC, MBN,
Microbial biomass C/N, Ammonification, Nitrification and N mineralization
in silt loam saline sodic soil treated with G, PM and FYM alone or in various
combinations 158
x
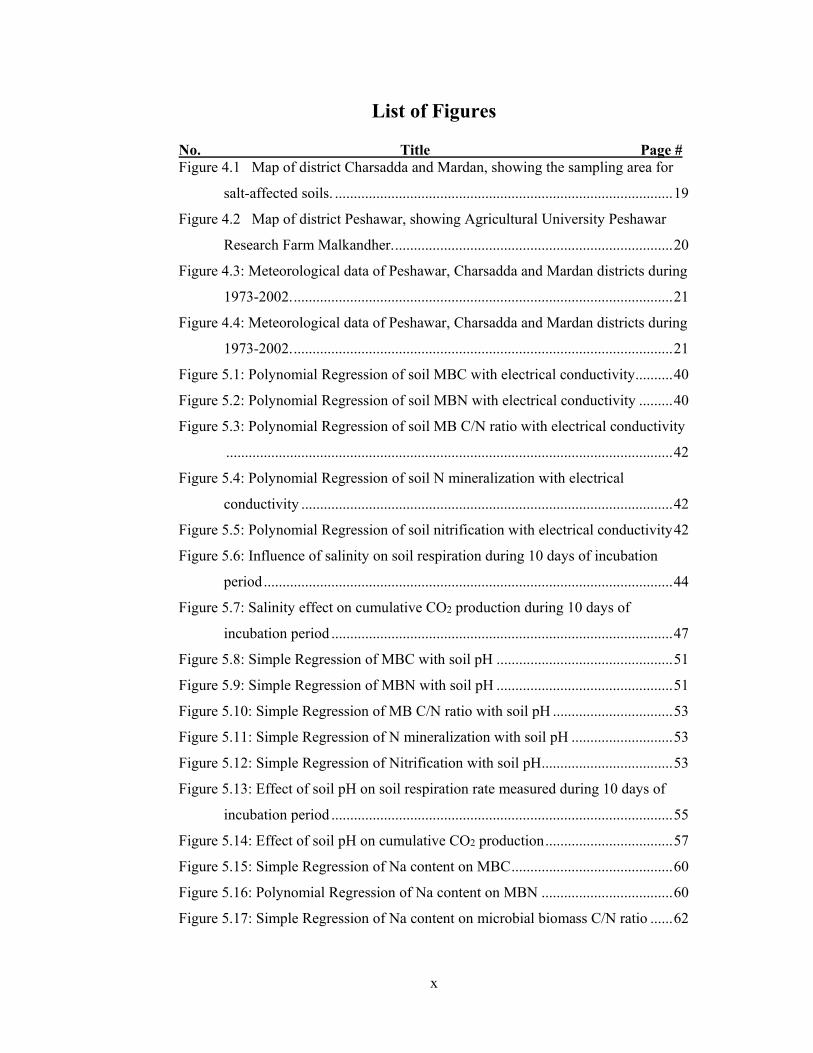
List of Figures
No. Title Page # Figure 4.1 Map of district Charsadda and Mardan, showing the sampling area for
salt-affected soils. .......................................................................................... 19
Figure 4.2 Map of district Peshawar, showing Agricultural University Peshawar
Research Farm Malkandher. .......................................................................... 20
Figure 4.3: Meteorological data of Peshawar, Charsadda and Mardan districts during
1973-2002. ..................................................................................................... 21
Figure 4.4: Meteorological data of Peshawar, Charsadda and Mardan districts during
1973-2002. ..................................................................................................... 21
Figure 5.1: Polynomial Regression of soil MBC with electrical conductivity .......... 40
Figure 5.2: Polynomial Regression of soil MBN with electrical conductivity ......... 40
Figure 5.3: Polynomial Regression of soil MB C/N ratio with electrical conductivity
....................................................................................................................... 42
Figure 5.4: Polynomial Regression of soil N mineralization with electrical
conductivity ................................................................................................... 42
Figure 5.5: Polynomial Regression of soil nitrification with electrical conductivity 42
Figure 5.6: Influence of salinity on soil respiration during 10 days of incubation
period ............................................................................................................. 44
Figure 5.7: Salinity effect on cumulative CO2 production during 10 days of
incubation period ........................................................................................... 47
Figure 5.8: Simple Regression of MBC with soil pH ............................................... 51
Figure 5.9: Simple Regression of MBN with soil pH ............................................... 51
Figure 5.10: Simple Regression of MB C/N ratio with soil pH ................................ 53
Figure 5.11: Simple Regression of N mineralization with soil pH ........................... 53
Figure 5.12: Simple Regression of Nitrification with soil pH ................................... 53
Figure 5.13: Effect of soil pH on soil respiration rate measured during 10 days of
incubation period ........................................................................................... 55
Figure 5.14: Effect of soil pH on cumulative CO2 production .................................. 57
Figure 5.15: Simple Regression of Na content on MBC ........................................... 60
Figure 5.16: Polynomial Regression of Na content on MBN ................................... 60
Figure 5.17: Simple Regression of Na content on microbial biomass C/N ratio ...... 62

xi
Figure 5.18: Simple Regression of Na content on N mineralization ......................... 62
Figure 5.19: Polynomial Regression of Na content on nitrification .......................... 62
Figure 5.20: Effect of soluble Na on rate of soil respiration during different
incubation periods ......................................................................................... 63
Figure 5.21: Soluble Na effect on cumulative CO2 production during different
incubation periods ......................................................................................... 65
Figure 5.22: Simple Regression of MBC with soil SAR ........................................... 67
Figure 5.23: Polynomial Regression of MBN with soil SAR ................................... 68
Figure 5.24: Polynomial Regression of MB C/N ratio with soil SAR ...................... 68
Figure 5.25: Polynomial Regression of N mineralization with soil SAR ................. 70
Figure 5.26: Polynomial Regression of Nitrification with soil SAR ......................... 70
Figure 5.27: Effect of SAR on soil respiration rate measured during different
incubation periods ......................................................................................... 71
Figure 5.28: SAR effect on cumulative CO2 production during different incubation
periods ........................................................................................................... 73
Figure 5.29: Simple Regression of MBC with soluble salts of Ca+Mg .................... 75
Figure 5.30: Simple Regression of MBN with soluble salts of Ca+Mg .................... 76
Figure 5.31: Simple Regression of MB C/N ratio with soluble salts of Ca+Mg ....... 76
Figure 5.32: Simple Regression of N mineralization with soluble salts of Ca+Mg .. 78
Figure 5.33: Simple Regression of nitrification with soluble salts of Ca+Mg .......... 78
Figure 5.34: Relationship of soil respiration rate with soluble salts of Ca+Mg during
different incubation periods ........................................................................... 79
Figure 5.35: Relationship of cumulative CO2 production with soluble salts of
Ca+Mg during different incubation periods .................................................. 80
Figure 5.36: Simple Regression of soil carbonates content on MBC ........................ 83
Figure 5.37: Simple Regression of soil carbonates content on MBN ....................... 83
Figure 5.38: Simple Regression t of soil carbonates content on MB C/N ratio ........ 85
Figure 5.39: Simple Regression of soil carbonates content on N mineralization ..... 85
Figure 5.40: Simple Regression of soil carbonates content on nitrification .............. 85
Figure 5.41: Effect of soil carbonates content on rate of soil respiration .................. 86
Figure 5.42: Effect of soil carbonates content on cumulative CO2 production ......... 87
Figure 5.43: Simple Regression of soil bicarbonates content on MBC .................... 90
Figure 5.44: Polynomial Regression of soil bicarbonates content on MBN ............. 90

xii
Figure 5.45: Simple Regression of soil bicarbonates content on MB C/N ratio ....... 92
Figure 5.46: Simple Regression of soil bicarbonates content on N mineralization .. 92
Figure 5.47: Simple Regression of soil bicarbonates content on nitrification .......... 92
Figure 5.48: Effect of soil bicarbonates content on rate of soil respiration .............. 93
Figure 5.49: Effect of soil bicarbonates content on cumulative CO2 production ...... 94
Figure 5.50: Simple Regression of soil chloride content on MBC ............................ 97
Figure 5.51: Polynomial Regression of soil chloride content on MBN .................... 97
Figure 5.52: Simple Regression of soil chloride content on MB C/N ratio .............. 99
Figure 5.53: Polynomial Regression of soil chloride content on N mineralization .. 99
Figure 5.54: Simple Regression of soil chloride content on nitrification .................. 99
Figure 5.55: Effect of soil chloride content on rate of soil respiration .................... 100
Figure 5.56: Effect of soil chloride content on cumulative CO2 production ........... 101
Figure 5.57: Rate of CO2 evolution as influenced by NaCl induced salinity .......... 107
Figure 5.58: Cumulative CO2 production as influenced by induced NaCl salinity . 109
Figure 5.59: N mineralization (mg kg-1) as influenced by induced NaCl salinity .. 111
Figure 5.60: Rate of soil respiration as influenced by MgCl2 induced salinity ....... 116
Figure 5.61: Cumulative CO2 production as influenced by MgCl2 induced salinity
..................................................................................................................... 118
Figure 5.62: N mineralization as influenced by MgCl2 induced salinity ................ 121
Figure 5.63: CO2 evolution as affected by different soil amendments in saline sodic
soil ............................................................................................................... 132
Figure 5.64: MBC as affected by different soil amendments in saline sodic soil ... 132
Figure 5.65: MBN, MB C/N ratio, Ammonification, Nitrification and net N
mineralization as affected by different soil amendments in saline sodic soil
..................................................................................................................... 132

xiii
Microbial Dynamics in Salt Affected Soils Syed Asif Shah and Zahir Shah
Department of Soil and Environmental Sciences, The University of Agriculture, Peshawar
Abstract
Soil salinity is a worldwide problem which not only influences the physical and
chemical properties of soil but may also seriously affect the microbiological
properties of soil. This project was undertaken to assess the behavior of various
microbiological properties of soil in relation to salinity in a series of incubation and
pot experiments during 2009-12. Initially the soil microbiological properties of
thirty naturally occurring diverse salt affected soils were determined. Based on the
results of preliminary experiments, further experiments were conducted to evaluate
the effect of NaCl and MgCl2 induced salinity on N dynamics and soil microbial
activity in soil. Finally, a pot experiment was conducted to assess the effect of
important amendments such as pressmud, gypsum and farmyard manure, which are
normally used for the reclamation of salt affected soils, on growth of wheat and
maize and on various microbial attributes in a highly saline-sodic soil (EC 20.3 dS
m-1). In addition, some bacteria and fungi were isolated from a highly saline-sodic
soil, and the effects of same organisms were also tested in the above experiment.
For experiment 1, soil samples at 0-20 cm were collected from various salt affected
soils ranged in salinity from EC < 4.0 to 32 dS m-1 in November 2009. The samples
were analyzed for soil microbiological (such as microbial biomass-C, microbial
biomass-N, N mineralization, nitrification, rate of soil respiration) and chemical
properties (such as pH, EC, soluble Ca+Mg, soluble Na, SAR (sodium adsorption
ratio), ESP (exchangeable sodium percentage), carbonates, bicarbonates, chloride).
The results showed that almost all microbial indices including microbial biomass-C
(MBC), microbial biomass-N (MBN), basal soil respiration, nitrification and net N
mineralization were negatively correlated with increasing salinity (r = -0.89, -0.74, -
0.79, -0.64 and -0.57 respectively). The results further showed that the depressive
effects of SAR and ESP on various soil microbial indices were much stronger than
that of carbonates and bicarbonates. Both NaCl and MgCl2 induced salinity
significantly reduced the rate of CO2 evolution and N mineralization during all
xiv
incubation periods. The depressive effects increased with increase in salts level. The
NaCl induced salinity depressed cumulative CO2 production by about 80% and N
mineralization by 50% during 40 days of incubation. Whereas MgCl2 induced
salinity decreased cumulative CO2 production by 95% and N mineralization by 81%
during 30 days of incubation. These results suggested that the impact of MgCl2
salinity on microbial indices was stronger than that of NaCl.
The amendment of saline-sodic soil with pressmud, gypsum and farmyard manure
(FYM) significantly improved the rate of CO2 evolution, N mineralization,
microbial biomass-C and microbial biomass-N. The effects were more pronounced
with combined application of pressmud with farmyard manure or gypsum. It was
also evident that the effect of pressmud + FYM was further improved with microbial
inoculation of microbial isolation from highly salt affected soil. Organic matter
decomposition generally increases the production of CO2 and liberation of H+ ions.
The H+ ion enhance the dissolution of CaCO3 and releases more Ca to replace Na
from clay particles and thus helps in the reclamation of saline-sodic soils. Both
wheat and maize seeds failed to germinate under the prevailing saline-sodic
conditions despite repeated re-seeding and thus no data was generated in this
respect. These results suggested that all microbial indices decreased significantly
with increasing salinity levels indicating that soil microorganisms were sensitive to
different types of salinity. Thus, salinity is a stress factor and can reduce microbial
diversity and control microbial abundance, composition and functions. Although,
amendments of saline-sodic soil with organic sources (such as FYM, pressmud)
substantially improved microbial attributes they did not enable the germination and
survival of wheat and maize sown in the soil. Nevertheless the evidence suggests
that organic matter may play significant role in the amelioration of saline-sodic or
sodic soils.
1
1 GENERAL INTRODUCTION
Salt-affected soils include saline soils, sodic soils or both saline-sodic soils that
interfere with the growth of normal plants. Approximately 10% of the total land
surface (954 million hectares) in the world is affected with different types of salinity
(Alam et al., 2000). In Pakistan nearly 5.7 m ha of land is salt affected, mainly in
Indus plain, where about 4.2 m ha of land is affected by water-logging and salinity,
0.12 m ha falling in the canal commanded area, while 4.45 m ha outside it. Of all the
salinized lands 1.9 m ha are saline, 2.91 m ha are saline-sodic and 0.028 m ha sodic
(Mujtaba et al., 2003).
Salt-affected soils are mostly found in arid landscapes where, most of the year
evapotranspiration exceeds precipitation (Jurinak, 1990). Generally, high
evapotranspiration in semi-arid and arid zones like in Pakistan is the basic cause for
salt accumulation. In Pakistan, the temperature reaches 40°C during summer and is
as low as 2°C to 5°C in winter. The annual precipitation varies from 100-700 mm
throughout the country. The high temperature and low precipitation plus shallow
ground water depth, enhances the accumulation of salts in the upper soil surface.
Other conditions that enhance salt concentration in soil includes improper irrigation
practices and lack of drainage which adds about 120 million tons of salts in canal
irrigated land and brackish underground water in which only 20% salt finds its ways
to the sea.
The presence of excess salts in soils influence crop growth through adverse
physiological effects (Osmotic stress or ion toxicity) and high sodium degrades its
physical structure (decreased adsorption of essential nutrients) (Richards, 1954;
Lauchli and Epstein, 1990; Rhoades, 1990; Shainberg, 1990). The excess amounts
of salts adversely affect soil biological processes including soil enzymes activity, N
mineralization, soil microbial biomass carbon and nitrogen (Frankenberger and
Bingham, 1982; McClung and Frankenberger, 1985; Sarig and Steinberger, 1994).
Salinity and sodicity has detrimental effect on soil microbial activity. Many studies
have shown a decrease in soil respiration with elevated salinity (Sardinha et al.,
2003; Wichern et al., 2006; Yuan et al., 2007). In another study Sardinha et al.

2
(2003) found that the combined effects of salinity and acidity depressed microbial
communities more than those of heavy-metal pollution in acidic conditions. They
attributed this to the possibility that a decline in vegetation reduces the root and litter
debris, which is an important energy resource for microbial organisms.
The rate of mineralization from added straw decreased with salinity and sodicity
early in the incubation Abdou et al. (1975). Salinity influenced soil mineralization
negatively (Wichern et al., 2006). Laura (1974) and Carter (1986) respectively
examined that soil respiration and microbial biomass both reduced with salinity.
Similar depressive effect on soil microbial activity due to saline irrigation was found
by Sarig et al. (1993). Negative effects on soils biological and biochemical fertility
were found by the addition of saline solution by Garcia and Hernandez, (1996).
Similar results were found in literature (Singh et al., 1969; Agarwal et al., 1971Ryan
and Sims, 1974;). Increases in salinity decrease the rate of soil respiration and the
soil microbial biomass (Laura 1973; Laura 1976; Pathak and Rao, 1998). Batra and
Manna (1997) stated that salt stress reduces microbial population due to osmotic
potential changes. Increasing sodicity levels showed depressive effect on C
mineralization (Nelson et al., 1997) and causes a decrease for biomass C (Chander
et al., 1994).
The salt affected soils can be reclaimed through physical, chemical and biological
methods (Ahmad and Qadir, 1995; Qadir et al., 2007). The salt affected soil can also
be reclaimed through biological means. Increasing microbial population of exo-
polysaccharides producing bacteria reduces the availability of Na+ for plant uptake
by binding the sodium ion, and thus help in reducing salt stress under saline
conditions. Selected exo-polysaccharides producing bacteria could be used for
salinity stress reduction in saline soils (Ashraf et al., 2004). Fungal inoculation can
cause water stable aggregates to form and thereby open up air spaces that contribute
to improve soil structure. As a result of these amendments, over time the soil tilth
will be improved as will the root system. Roots will penetrate and explore more of
the soil profile, and have the necessary air to be healthy and functional. Some of the
microbes provide relief from the toxic effects of salinity or heavy metals. Microbial
amendments may reduce soil salinity by creating better drainage so salts can be
leached down the soil profile. The mobility of phosphorus is very low in alkali soil,
3
making the phosphorus totally unavailable or available in limited quantities.
Phosphorus solubility is enhanced by addition of phosphorus solubilizing bacteria
(PSB) and phosphorus mobilizing fungi. Alkali soil is nitrogen deficient due to high
losses by volatilization process. Nitrogen fixing bacteria improves nitrogen content
of the soil by fixing atmospheric nitrogen into the soil. Shao et al., (2001) studied
that secondary salinization can be controlled using effective microbes.
Soil biological properties in relation to amendments and plant growth are poorly
understood for salt affected soils. The present analysis was planned to study the
microbial dynamics in salt affected soils and assess the effect of salt tolerant
microorganisms on reclamation of salt affected soils.

4
2 OBJECTIVES
2.1 Main objective
The main objective of this research was to improve our understanding regarding the
microbial dynamics in salt affected soils.
2.2 Specific objectives
Specific objectives were:
1. To evaluate salt-affected soils for various soil microbial characteristics and
determine their relationship with important soil properties.
2. To assess the effect of Na and Mg salinity on important soil microbiological
properties (rate of soil respiration and N mineralization).
3. To study the effect of different chemical amendments including pressmud,
gypsum and farmyard manure on soil microbiological properties.
4. To assess the influence of salt tolerant microbial inoculation on
improvement of salt affected soils.

5
3 REVIEW OF LITERATURE
3.1 Salt Affected Soils
Salt-affected is a general term which includes soils that are saline, sodic and saline-
sodic. Mostz occur in arid and semiarid regions of the world where
evapotranspiration is greater than annual precipitation. In addition, salt-affected soils
can also occur in humid and sub humid regions of the world under conditions
favorable to their development. One of the major causes of reduced crop production
is the salt accumulation in the root zone. Most crops have their threshold level up to
which they can tolerate salinity (Sharma, 1997; Kafi and Goldani, 2001).
3.2 Extent of Salinity
The distribution of salt-affected lands has a close relation with the environmental
factors, particularly in arid and semi-arid climatic conditions. In agriculture the
increasing salinity rate in arid and semi-arid lands has become a problem of great
concern. According to some recent estimates the total area of salt affected soils is
some 9.5 million km2 on a world-wide (Szabolcs, 1989) results an enormous loss of
agricultural production. The belief is, that about 7% of the earth crust is salt affected
and 10% of the world’s (7 × 10⁹ hectare) arable land surface is saline or sodic
(Francois and Maas, 1994). Of the total 1.5 × 10⁹ hectare cultivated lands, 23% are
saline and 37% sodic. It is estimated that 1/2 of all irrigated lands (about 2.5 × 10⁸
hectare) are affected by waterlogging or salinity (Rhoades and Loveday, 1990).
Salinity is considered to be one of the major stresses to crops, and affecting about 950
× 106 hectare of land world-wide (Flowers and Yeo, 1995).
Salts that accumulate insitu through the weathering of parent material act as a source
of primary salinization, or through water causing secondary salinization. The soils of
Pakistan have both the process of salinization causing 6.3 x 10⁶ hectare saline, of
which 60% is sodic or saline-sodic (Muhammad, 1983; Ghafoor et al., 1990; Qadir et
al., 2007).
In addition, the uses of unsuitable procedures for reclamation of salt-affected soils and
unscientific water management practices have been adding to the threat over the
passage of time (Reeve and Fireman, 1967; Bohn et al., 2001). Reports showed that

6
on the whole basis world is losing about 10 ha of arable land every minute, including
5 hectare because of soil erosion, 3 hectares due to soil salinization and 1 hectare due
to soil degradation processes (Abrol et al., 1988).
3.3 Categories of Salt-affected Soils
Topography, climate, geology, soil and cultural conditions influence the natural and
secondary processes, which actuate the nature and extent of saline soils (Fitzpatrick et al.,
1995). The ions that is dominant in the soil affects pH changes that in turn determine the
development of saline soil, the type of clay and how much precipitation the soil
receives. The main source of salts accumulation in the soil is weathering (US
Salinity Staff, 1954; Brady and Weil, 1999). Because of high precipitation these
salts are passed beyond the root zone in humid and sub humid areas. These salts
accumulate over time on the crust of the earth in arid and semiarid areas as the
leaching is restricted, to deteriorate soil physical, chemical and biological properties
(Rengasamy et al., 1984) and reduces crop productivity. Atmospheric precipitation
or deposition and fossil salts are two other natural sources of soil salinity (Bresler et
al., 1982; Bohn et al., 2001).
Elements that comprise salt affected soils includes Ca, Mg, Na, K, in major amounts
and CO3, NO3, Cl, SO4, HCO3, and B in minor amounts (US Salinity Staff, 1954;
Barber, 1984; Abrol et al., 1988; Ghafoor et al., 2004). The pH of a soil solution
determines the relative amount of HCO3 and CO3 in the soil (Lindsay, 1979; Bresler
et al., 1982). Only at pH values of 9.5 appreciable amount of CO3 can be present
with higher nitrate in some salt affected soils (Kelley, 1951; US Salinity Staff,
1954). The presence of white salt crusts on the surface is an indication of saline soil.
The saline soils also known as white alkali (US Salinity Staff, 1954) and in urdu
these soils are called “Thur” or “Kallar and “Khora” in Pashto. The sodic soils are
called “black alkali” in Russian and “Bara” in Urdu.
The main source of salt includes mineral weathering (Gunn and Richardson, 1979;
Lindsay, 1979; Macumber, 1991), rainfall (Rengasamy and Olsson, 1993),
groundwater (Macumber, 1991), various surface waters including irrigation
(Mehanni and Chalmers, 1986; Rengasamy and Olsson, 1993; Spore, 1995). Under
high evapotranspiration in arid climatic conditions, saline soil is formed due to the

7
upward movement of saline ground water (Isabelo and Jack, 1993), with highest
levels of salinity in areas of low water tables. However, physico-chemical
characteristics of the soil determine the extent of salinity like texture, hydraulic
conductivity, soil permeability, clay mineralogy and salt retention capacity
(Shainberg et al., 2001).
The amounts and kinds of salts determine the chemical characteristics of saline soils.
Soil Na is not usually adsorbed to any significant extent because it seldom
comprises more than half of the soluble cations (US Salinity Staff, 1954; Sposito,
1989; Bohn et al., 2001) and has a low affinity for cation exchange sites compared
with Ca and Mg. In the presence of excess soluble salts, saline soils are generally
flocculated and their permeability is increased or equals to that of non-saline soils.
Salts of MgCl2 and CaCl2 increase the darkness of the soil surface than non-saline
soil due to hygroscopic nature (FAO/UNESCO, 1973) hence the term black alkali
soils.
In proportion to Na the relative concentrations of other cations on exchange complex
and in soil solution deeply affect the behavior of saline-sodic soils. The soil turns
into sodic soil when Ca is exchanged by Na on exchange sites. The three cations i.e.
Ca, Na and Mg are exchangeable with each other and their exchange depends on
their relative concentrations and chemical affinity. Salts of Ca and Mg are
precipitate due to the evaporation process, whenever, due to evaporation excess salt
are accumulated or concentrated and Na becomes the predominant cation. As
because of precipitation of Ca and Mg, Na becomes excessively available at the
exchange complex, and soil become sodic or saline-sodic. But as soil affinity for Ca
and Mg is more than that of Na (Lindsay, 1979; Sposito, 1989) and thus the amounts
of Mg and Ca adsorbed much higher than that of Na. Generally, Na must be half or
more of the soluble cations at the exchange complex before significant amounts are
adsorbed (US Salinity Staff, 1954). The cations, NH4 and K can be fixed at certain
positions on clay particles so that they occur as exchangeable and fixed cations
(Mengel and Kirkby, 1987).
Frequently saline soils can turn into saline-sodic or sodic soils when irrigated with
water that contains high amounts of salt. The change occurs as soluble salts, are

8
leached and exchangeable Na+ remains in the soil but at concentration insufficient to
cause clay flocculation (Naidu and Rengasamy, 1993; SalCon, 1997).
3.4 Effect of Salts on Soils
Due to intense evaporation in semi-arid zones salts accumulate in the upper soil
profile instead of downward movement with water (Isabelo and Jack, 1993). With
increase in soil electrical conductivity the soil physico-chemical properties are
deteriorated (Rengasamy et al., 1984; Yasin et al., 1987). Use of saline sodic water
increases soil bulk density and compaction while, soil infiltration capacity and porosity is
reduced (Gupta and Gupta, 1997; Al-Nabulsi, 2001). Growth and yield of most crops is
affected with the imbalanced ionic concentrations of soil solution with high salt
concentration and poor soil properties (Sumner 1993; Curtin and Naidu, 1998; Grattan
and Grieve, 1999; Bohn et al., 2001).
Saline soils contain, relatively large amounts of neutral soluble salts (Abrol et al.,
1988), which can be present in soils in form of chlorides and sulphates of Mg2+, Ca2+
and Na+ and sometimes in the form of nitrate (NO3-) (SalCon, 1997; Anzecc, 2000;
Fitzpatrick et al., 2001). The concentration and nature of salts in the soil solution
determine soil pH.
The effects of elevated soluble salt concentrations are such that they prevent soil
colloids from dispersing and promote flocculation of soil particles. For example
exchangeable Ca2+ has the ability to flocculate or clump individual clay particles and
as a consequence creating larger pore spaces in the soil, which facilitates root
growth and better movement of water and air through the soil (Bell, 1993). Plant
growth in saline soil is generally not constrained by poor infiltration, aggregate
stability and aeration, but instead by high salt levels which are detrimental to plants
(Abrol et al., 1988; Brady and Weil, 2002; Warrence et al., 2002).
Saline soils can turn into saline-sodic or sodic soils when irrigated with low quality
water, due to the accumulation of exchangeable Na+ ions relative to Ca2+ and Mg2+
ions in soil and water (SalCon, 1997; Anzecc, 2000). For example, if irrigation
water has a high exchangeable sodium percentage (ESP) and is low in soluble salts,
the exchangeable Na will replace the soluble salts present at the cation-exchange
sites, and thus saturating the soil with exchangeable Na+ ions (Fetter, 2001). The soil
9
structure is destroyed as Na+ weakens the bonds between the clay particles
(Rengasamy and Walters, 1994; SalCon, 1997; Fetter, 2001). These small clay
particles, as they move down through the soil profile, are able to clog pore spaces,
thus reducing water infiltration and, consequently, causing temporary waterlogging
(Naidu and Rengasamy, 1993; Sumner, 1995; Qadir et al., 2001; Warrence et al.,
2002). Over time the soluble salts accumulate in the subsoil if they cannot be
dissolved, and leached (Rengasamy and Olsson, 1991), resulting in the upper soil
layer becoming sodic and the subsoil becoming saline (Rengasamy, 2002).
Saline or salt affected soils will often not show symptoms of sodicity, even when
excess Na+ is present (Rengasamy and Walters, 1994), as excess salt can prevent
clay particles from dispersing. Only if these soils are leached of the salt will the
symptoms of sodicity start to appear (Rengasamy and Walters, 1994). Even a small
amount of adsorbed Na+ (about 6%) at the exchange sites is enough to cause the
decline in soil structure (Naidu and Rengasamy, 1993). Accumulation of Na+ can be
a predominant feature in the heavy cracking clays (Vertosols) that swell upon
wetting, thus preventing deep penetration of irrigation water (Rengasamy and
Olsson, 1991). Repeated wetting and drying solidifies sodic soils over time,
producing cement like soil with little or no structure (Sumner, 1995; Warrence et al.,
2002). A relatively thin (up to 10 mm thick) but very dense crust can form upon
wetting, which then acts as a natural barrier for emerging seedlings. Another
important factor is the low organic matter level in sodic soils. The high levels of
Na+, low biological activity and low or high pH found in sodic soils are responsible
for low mineralization rate and low organic matter accumulation (Naidu and
Rengasamy, 1993; Peineman et al., 2005).
3.5 Effect of Salts on Plants
Apart from adverse effects of salinity and /or sodicity on soil physical conditions, it
also affects crop growth includes osmotic potential, specific ion effects like that of
toxic concentrations of Na, B and Cl, and interaction with the nutrient elements that
reduce the nutrients bio availabilities (US Salinity Staff, 1954; Muhammad, 1996;
Bonn et al., 2001; Yamaguchi and Blumwald, 2005). Due to salinity and /or sodicity
plant metabolism is affected with imbalance in plant nutrient concentration (Kramer,

10
1983; Garg and Gupta, 1997). These changes under saline conditions directly affect
and decrease crop growth and yield (Mer et al., 2000; Qadir et al., 2001; Qadir et
al., 2006), and excessive salts concentrations make the soil toxic for the plant
growth (Donahue et al., 1983). The salinity results in reduced crop growth and yield
along with stunned root’s growth by causing reduction in leaf area and reduce
photosynthesis rate (Garg and Gupta, 1997)
The responses of plant to salinity depend upon the (1) duration of plant’s exposure
to such conditions, (2) type of salts present, (3) on the time of the day, (3)
developmental stage of the plant, and many other factors (Maas and Hoffman, 1977;
Cramer et al., 2001). Salinity reduces plant growth by interacting with the plant’s
nutrients or by making the soil toxic due to high concentration of the cations (Garg and
Gupta, 1997; Mer et al., 2000) and with excessive salts concentrations plants fails
completely (Donahue et al., 1983). In case of salinity above threshold level, saline
tolerant crop growth is retarded (Maas and Hoffman, 1977). Ramoliya et al.
(2004) reported that under increasing salinity stress the acacia seedling show
shorter stems and roots with reduced emergence and stunted biomass. These
adverse conditions of salinity could be mitigated through effective reclamation
measures.
3.6 Salt-affected Soils Reclamation
The adequate physico-chemical properties of soil in saline or sodic environments
could be accomplished by using good quality water, appropriate drainage and
cultural practices, with suitable soil chemical amendments (Grattan and Oster,
2003). These includes the development of the most appropriate reclamation method
or a combination of methods necessary to optimize farm management to increase
crop yields in a sodic soil. The most effective method for removal of soluble salts
from the rhizo-sphere is proved to be the leaching process (Abrol et al., 1988). In
this process the high quality fresh water is intensely irrigated onto the soil surface
and allowed to flow the soluble salts down from the surface of the soil by mean of
infiltration, and is mostly incorporated with an effective drainage system (Jury et al.,
1979). On the other hand, application of chemical amendments necessitates removal
of exchangeable sodium from the soil’s cation exchange sites and replacement of Ca
11
(Sahin et al., 2002). Due to its availability at low cost and effectiveness gypsum
(CaSO4.2H2O) is the most commonly used amendment. The amelioration of saline-
sodic soils, thus, requires both leaching and application of gypsum (Abrol et al.,
1988). Various organic amendments such as organic mulch, manures, and compost
have been investigated for their effective reclamation of saline-sodic soils (Diez and
Krauss 1997; Wahid et al., 1998). In general, alone organic amendments application
has a very little effect on improving soil salinity (Madejon et al., 2001). But it can
improve many soil properties (Cheny and Swift, 1984; Uson and Cook, 1995;
Giusquiani et al., 1995; Gao and Chang, 1996; Prihar et al., 1996; Singh and Singh,
1996; Entry et al., 1997; Ibrahim and Shindo, 1999; Mamo et al., 2000; Naeni and
Cook, 2000).
Reclamations include all those strategic measures that are employed to reduce the
soil salinity (Abrol et al., 1988). These methods of reclamation can be of chemical,
physical or biological that can be used alone or in combination. Amendments are
materials that directly or indirectly furnish divalent cations (usually Ca2+) through
chemical or microbial action for replacement of exchangeable Na+ (Muhammad,
1996; Qadir et al., 2001). Many saline-sodic soils contains large amounts of Ca, as
(CaCO3) (Kovda et al., 1973) but it is less effective in ameliorating processes
because of its extremely low solubility (Qadir et al., 2007).
The salt affected soils characteristics includes high pH, level of ESP, desired rate
and extent of replacing exchangeable Na and presence of CaCO3 and MgCO3, soil
type and the cost and availability of the amendment. All chemical amendments
supply soluble Ca that replaces Na on exchange sites when applied under
appropriate soil conditions (Keren and Miyamoto, 1990; Nadler et al., 1996; Bohn et
al., 2001). Some of amendments used in reclamation are reviewed in the following
sections.
3.6.1 Pressmud
Pressmud (PM), sugar mills by-product, does the same job as any organic and
inorganic fertilizers can that is why it can be used for saline-sodic soil reclamation
(Patel and Singh, 1993; Zerega et al., 1995; Rai et al., 1999; Yaduvanshi and
Swarup, 2005). Although PM contains Ca of low solubility, but it produces desirable

12
effects in saline-sodic and sodic soils due to its higher organic contents and other
nutrients especially in low organic matter soils. Pressmud was used by many
researchers, to test its effectiveness on crop yield and soil conditions under
examination. The pressmud was found effective under percolated conditions in
removing leachable Ca, Mg and Na (Patel and Singh, 1993). Application of
pressmud can help in the retention of inorganic fertilizers, it improves the physical
condition of the soil and supplies trace nutrients (Singh et al., 1991; Yadav et al.,
1995). With PM addition soil’s biological properties can improve. In a study the root
zone microbial population were increased after 30 days of the application of the
pressmud especially bacteria and actinomycetes (Gaikwad et al., 1996).
3.6.2 Gypsum
Research showed that gypsum is very useful for sodic and saline sodic soils reclamation
(Shainberg et al., 1982; Elshout and Kamphorst 1990; Bohn et al., 2001; Qadir et al.,
2006; 2007). The constant dissolution of gypsum is considered an additional advantage
to sustain long term availability of Ca (Doneen, 1975). The application of gypsum in
standing water shows much better result than surface application (Chaudhry et al., 1986).
Similarly, gypsum, when used in powder form show more efficiency in the reclamation
of sodic soils (Dutt et al., 1971; Chaudhry et al., 1986; Ghafoor et al., 1989; Chaudhry
and Ihsanullah, 1989; Chaudhry, 2001). According to the estimation 20 to 28 inches
water is needed to dissolve 17 to 24 Mg ha-1 gypsum on surface soil application. While,
under sodic soil conditions the solubility of gypsum increases by 10 folds. Moreover, the
exchange process tends to be much speedy when the mixing of gypsum is accompanied
with the removal of Na from the soil solution (Frenkel et al., 1989). Ilyas et al. (1997)
observed that when gypsum is applied in the soil with poor permeability the soil will
show higher Na, Ca+, Mg, and EC values. Under such soil conditions deep spiking
facilitates the process of reclamation to allow leaching of salts mainly of Na.
The application of Gypsum improves soil physical and chemical properties (Ayers and
Westcot, 1985), increases empty spaces in the soil (soil porosity) (Oster, 1982; Gal et al.,
1984; Shainberg et al., 1989) and improves soil hydraulic conductivity (Scotter, 1985;
Greene et al., 1988). When treated with surface applied phospogypsum a noticeable
decrease in bulk density of soil was observed (Southard et al., 1988). Dramatic
13
increase in wheat grain yield was reported with application of gypsum (Ghafoor et
al., 1985).
3.6.3 Farmyard manure
Soil fertility improves with the application of organic materials (Tang et al., 1999;
Tang and Yu, 1999; Grace et al., 2006; Flavel and Murphy, 2006; Ferreras et al.,
2006) and brings favorable effects to the soil’s biological and physic-chemical
properties as well (Clark et al., 2007; Abbas and Fares, 2009). With the increased
number of soil macro pores due to structural stability indicated an improvement in
pore size distribution (Marinari et al., 2000). Because of improvement of soil
aggregation, organic materials influence root development, seedling emergence and
plant growth (Marinari et al., 2000; Ferreras et al., 2000). The sugar beet yield was
increased with increase in farmyard manure application rate up to 42% in salt-
affected soils of Mardan, Charsadda and Swabi district, KPK, Pakistan as compared
with control (Haq, 2005).
Upon decomposition organic matter releases essential plant nutrients. However, the
literature shows that salinity may reduce C and N mineralization rate (Malik and
Haider, 1977; Wichern et al., 2006) or it increases with salinity (Laura, 1973; Laura,
1976) depending upon the nature of organic matter and C/N ratio. Abdou et al.
(1975) found that the rate of mineralization from added straw is decreased by
salinity and sodicity. Mineralization and salinity has a negative correlation (Wichern
et al., 2006). The decomposition of organic matter depends on percentage of clay,
clay mineral type, the soil structure and presence of divalent cations, which directly
or indirectly affect microbial activity and the availability of water and soil aeration
(Baldock and Skjemstad, 2000; Von-Lutzow et al., 2006).
3.7 Effect of Salts on Soil Microbial Properties
The soil’s microbes are essential for plants as they release and mobilize minerals
and nutrients in the soil; and take oxygen, carbon dioxide and also may fix nitrogen
from the atmosphere and make it available to plants. Saline and sodic soils exhibit
soil structural problems, due to changes in physico-chemical properties (Qadir et al.,
2007). Presence of excess sodium in salt affected soil leads to the development of
poor physical conditions by dispersing the soil aggregates.
14
The soil microbial biomass is an ever changing organic matter pool that constitutes 1
to 3% of total organic matter in soil (Jenkinson and Ladd, 1981). It regulates the
functioning of the soil system by acting as a source and sink of nutrients for the
plant (Singh et al., 1991). The chemistry of the soil is influenced by physical
problems such as waterlogging and compaction, which can lead to changes in the
nutrient ion formation, rendering them unavailable to plants (Naidu and Rengasamy,
1993). Osmotic stress and high levels of Na+ can cause imbalances in plant nutrition,
causing ion deficiencies or toxicities (Sheldon et al., 2004; Qadir et al., 2007). These
physical and chemical changes reduce the activity of plant roots and crop growth as
well as of soil microbes (Rietz and Haynes, 2003). Furthermore, low SOM
combined with high salt concentrations and high or low pH, will generally also show
low biological activity (Naidu and Rengasamy, 1993; Sardinha et al., 2003).
Salinity and sodicity in soils has a detrimental effect on the microbial activity
including reduce microbial biomass, which in turn are then less efficient in using
available C resources and consequently showing a decrease in soil respiration (Rietz
and Haynes, 2003; Sardinha et al., 2003; Wichern et al., 2006; Yuan et al., 2007).
Yuan et al., (2007) found that in soils with highest salinity, the organic C content
was lowest. Rietz and Haynes (2003) reported declines in soil C due to lower OM
inputs, as plant growth was greatly reduced in these soils.
Soil respiration rate and salinity are inversely proportion as increases in salinity have
been shown to decrease soil microbial biomass and soil respiration rates (Laura,
1973; Laura, 1976; Pathak and Rao, 1998) changes in osmotic potential due to
salinity places stress on the microbial population (Batra & Manna, 1997).
Conversely, increased solubilization of organic matter with increasing sodicity is
possibly due to increased C mineralization (Nelson et al., 1997).
3.8 Microbial Inoculation
Microbial inoculants are amendments that use beneficial microbes to help and foster
plant health. Microbial inoculants are used to promote plant growth by stimulating
plant hormone production and to improve plant nutrition as well (Bashan and
Holguin, 1997; Sullivan, 2001). Most of the microbes follow mutualism, a form of
symbiotic relationship, with the target crops where both parties get the benefit. The
15
use of beneficial and effective microorganisms in agriculture as microbial inoculants
is a new technique (Shao et al., 2001). The use of microbial inoculants has been
shown to raise the growth yield and quality of crops by improving soil health and
quality (Li et al., 1999). Mycorrhizosphere development process by the inoculation
of mycorrhiza has been reported to modify the abundance and quality of
rhizospheric microflora and alter overall rhizosphere microbial activity which may
be responsible for the bioremediation in the contaminated soil (Khan, 2006).
Moreover, they influence the physiology of their host plant making them less
vulnerable to pathogens, soil pollution, salinity, drought and a number of other
environmental stress factors.
The combination of different strains of plant-growth promoting rhizobacteria
(PGPR) has been said to benefit barley (Belimov et al., 1995a) and rice (Nguyen et
al., 2002). Increased plant nutrient uptake in soils and also from fertilizer is the main
benefit of using combination of strains of PGPR (Belimov et al., 1995a; Bashan et
al., 2004). Interestingly, even if only one strain is diazotrophic in many strained
inoculants the increased total nitrogenase activity is noticed as compared to single
strain inoculants (Lippi et al., 1992; Khammas & Kaiser, 1992; Belimov et al.,
1995a). In nutrient poor soil, combination of PGPR and arbuscular mycorrhizae
(AM) can be useful in increasing crop growth (Singh and Kapoor, 1999) and for
improving nitrogen-extraction from the fertilized soils (Galal et al., 2003). The
beneficial effects of AM inoculation with Azospirillum brasilense associated with
Vicia faba plants were found by Rabie and Almadini (2005).
3.9 Role of Microbes in Reclamation of Salt-affected Soil
Increasing exo-polysaccharides producing bacteria population density in the root
zone decreases Na+ cations available for plant uptake. Fungal inoculation can cause
water stable aggregates to form and thereby open up air spaces that contribute to
improved soil structure. As a result of these amendments, over time the soil tilth
will be improved as will the root system. Roots will penetrate and explore more of
the soil profile, and have the necessary air to be healthy and functional. Some of the
microbes provide relief from the toxic effects of salinity or heavy metals. Microbial
amendments may reduce soil salinity by creating better drainage so salts can be
leached down the soil profile. The mobility of phosphorus is very low in alkali soil,
making the phosphorus totally unavailable or available in limited quantities.

16
Phosphorus solubility is enhanced by addition of phosphorus solubilizing bacteria
(PSB) and phosphorus mobilizing fungi. Alkali soil is nitrogen deficient due to high
losses by volatilization process. Nitrogen fixing bacteria improves nitrogen content
of the soil by fixing atmospheric nitrogen into the soil. Shao et al. (2001) studied
that secondary salinization can be controlled using effective microbes.

17
4 MATERIALS AND METHODS
Various experiments were conducted to assess the influence of salts on soil
microbiological properties in the Khyber Pakhtunkhwa Agricultural University
Peshawar Pakistan during 2009-2011. In the first study, soil microbiological
properties were assessed in 30 different salt affected soils collected from Charsadda
and Mardan districts. In the second study, the effect of NaCl induced salinity in soil
with native EC of 0.65 dS m-1 on soil microbial activity and N mineralization were
evaluated. In third experiment, the effects of MgCl2 induced salinity in soil with
native EC of 0.63 dS m-1 on soil microbiological parameters were assessed. In the
fourth experiment, saline-sodic soil (with pH = 10.47 and EC = 20.3 dS m-1) was
amended with pressmud, gypsum, farmyard manure and microbial inoculums and
their effects on soil microbial biomass C and N, ammonification, nitrification, CO2
evolution and N mineralization were evaluated during lab experiments. The details
on site characteristics and experimental procedures are given as under:
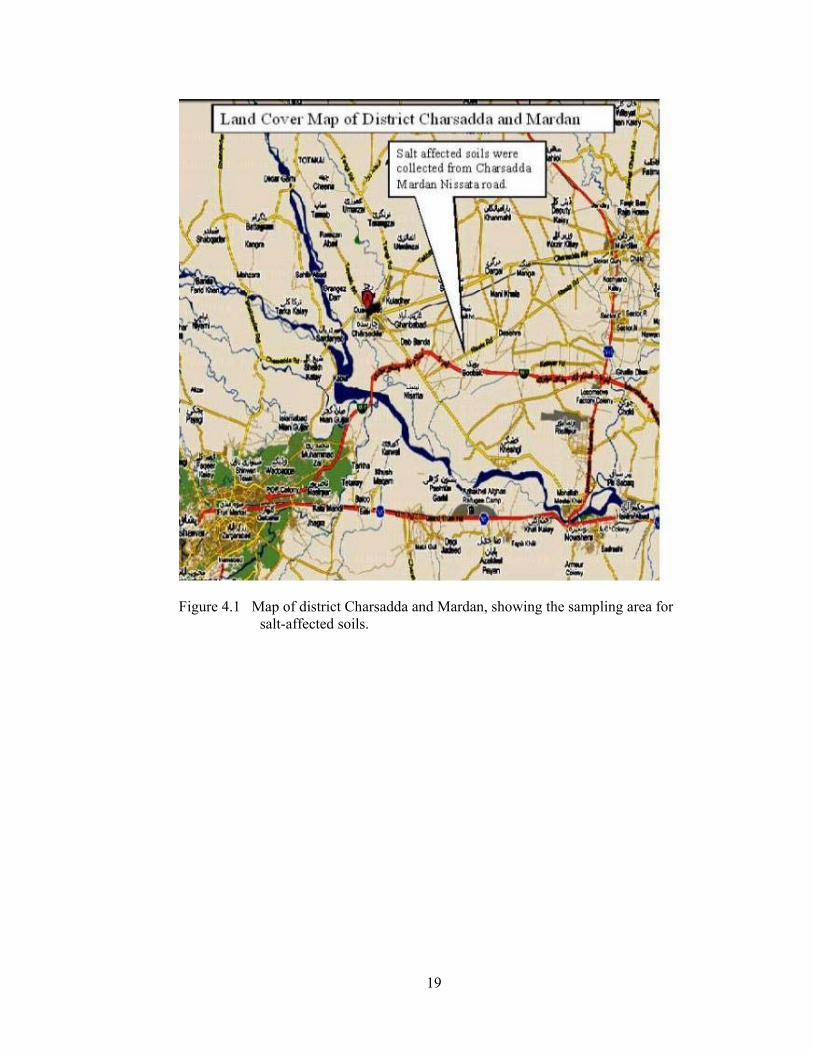
4.1 Site Characteristics
The soils of districts Charsadda, Mardan and Peshawar of Khyber Pakhtunkhwa
province of Pakistan were used in this study (Figure 4.1 and Figure 4.2). The
Charsadda district covering an area of 996 km2 is situated between 71°28’ and
71°35’ E and 34°03’ and 34°38’ N surrounded by Malakand agency on the north,
Mardan district on the east, Nowshera and Peshawar district on the south and the
Mohmand agency of the Federally Administrated Tribal Area on the west. Total
population of the area is about 1022,000 with most of them are agriculturist and
cultivating mainly tobacco, sugarcane, sugar beet and rice crops. Most of the area
was waterlogged and saline or saline-sodic before the establishment of tile drainage
system by the Salinity Control and Reclamation Project (SCARP) in 1983-92.
Although waterlogging and salinity problems have been eradicated in areas where
drainage system are installed, the problem of salinity/waterlogging still exist in areas
with no drainage system. The area lacking drainage system include Majoke,
Faqirabad, Nazo Kali and Bajovro Kali in district Charsadda are faced with
problems of shallow water-table, restricted leaching and poor drainage. During the
moon-soon rains soils become flooded and water logged (Soil Survey of Pak.,

18
2007b). The climatic characteristics of districts Peshawar which closely resembles
the Charsadda and Mardan districts are given in Table 4.1. In summer (May-August)
the temperature reached to 45°C, minimum 25°C and average is 32°C. The mean
maximum temperature is 20°C in winter (December to February) with average 5.3°C
and minimum 4.1°C. Mean annual precipitation in the area is 430 mm.
The Mardan district is situated between 71°48’ to 72°25’ E and 34°05’ to 34°32’ N
covering an area of 1632 km2 and is surrounded in the north by Buner district and
Malakand protected area, on the south by Nowshera district, on the east by Swabi
and Buner districts and on the west by Charsadda district and Malakand protected
area. The total population was 1.46 million with population density of 895 persons
per square kilometer (1998 census). A steep rise in temperature occurs from May
and stays highest in June to September. The temperature reaches its maximum in
June (41.5 °C). Most of the area was waterlogged and saline or saline-sodic before
the establishment of tile drainage system by the Salinity Control and Reclamation
Project (SCARP) in 1989-03. Although waterlogging and salinity problems have
been overcome in areas where drainage system have been installed, the problem of
salinity/waterlogging still exist in areas with no drainage system. The area lacking
drainage system include Ahmed village and Sherzaman kali in Mardan. Having poor
drainage, restricted leaching and shallow water table problems. The area is humid
due to intensive cultivation and artificial irrigation. A rapid fall of temperature
occurs from October onwards. December and January are the coldest months. The
mean minimum temperature is 2.1 °C recorded in January. Most of the rainfall
occurs in July to August and December to January. Maximum rainfall was126 mm
recorded in August. The relative humidity is quite high throughout the year while
maximum humidity has been recorded 73% in December.
19
Figure 4.1 Map of district Charsadda and Mardan, showing the sampling area for salt-affected soils.

20
Figure 4.2 Map of district Peshawar, showing Agricultural University Peshawar Research Farm Malkandher.
21
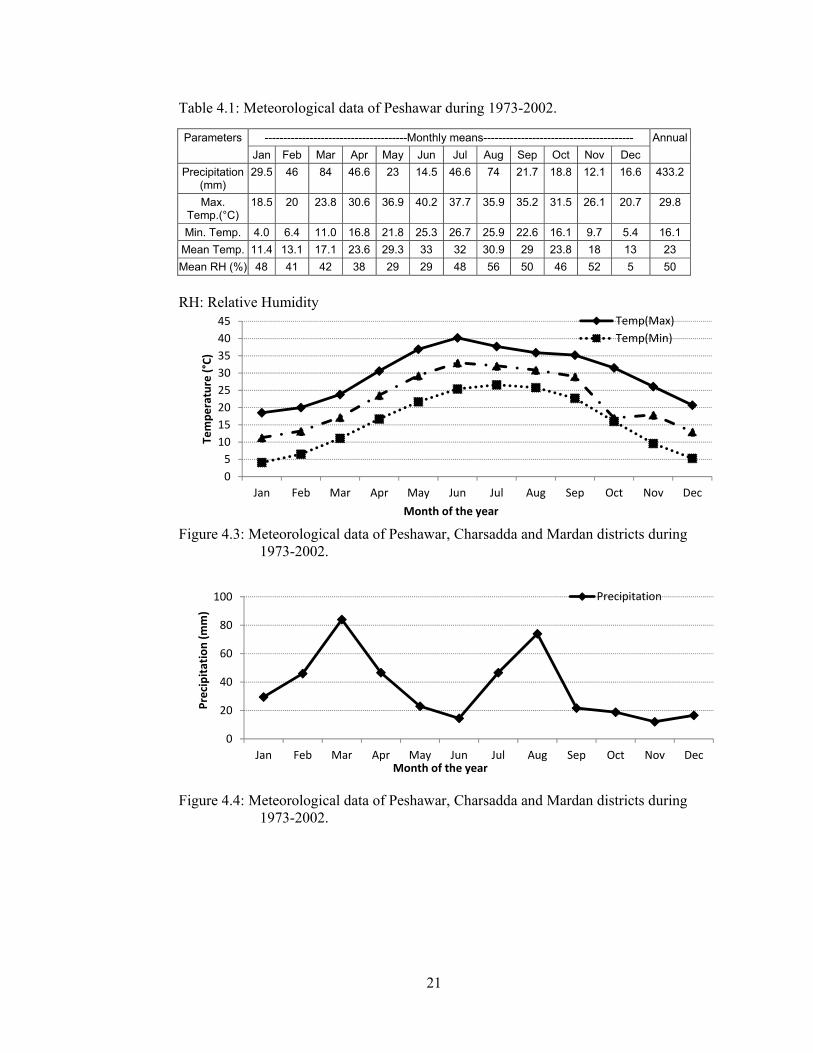
Table 4.1: Meteorological data of Peshawar during 1973-2002.
Parameters --------------------------------------Monthly means---------------------------------------- Annual
Jan Feb Mar Apr May Jun Jul Aug Sep Oct Nov Dec
Precipitation (mm)
29.5 46 84 46.6 23 14.5 46.6 74 21.7 18.8 12.1 16.6 433.2
Max. Temp.(°C)
18.5 20 23.8 30.6 36.9 40.2 37.7 35.9 35.2 31.5 26.1 20.7 29.8
Min. Temp. 4.0 6.4 11.0 16.8 21.8 25.3 26.7 25.9 22.6 16.1 9.7 5.4 16.1
Mean Temp. 11.4 13.1 17.1 23.6 29.3 33 32 30.9 29 23.8 18 13 23
Mean RH (%) 48 41 42 38 29 29 48 56 50 46 52 5 50
RH: Relative Humidity
Figure 4.3: Meteorological data of Peshawar, Charsadda and Mardan districts during
1973-2002.
Figure 4.4: Meteorological data of Peshawar, Charsadda and Mardan districts during 1973-2002.
05
1015202530354045
Jan Feb Mar Apr May Jun Jul Aug Sep Oct Nov Dec
Tem
pera
ture
(°C)
Month of the year
Temp(Max)Temp(Min)
0
20
40
60
80
100
Jan Feb Mar Apr May Jun Jul Aug Sep Oct Nov Dec
Prec
ipita
tion
(mm
)
Month of the year
Precipitation

22
Along with the other sites of the Khyber Pakhtunkhwa, Peshawar lies mainly on the
Iranian plateau and is situated near the eastern end of the Khyber Pass. Peshawar
was historically part of the Silk Road. Peshawar is situated between 34° 0' 28"
North, and 71° 34' 24" East with 329 meters elevation above the sea level. Peshawar
has a semi-arid, sub-tropical, warm to hot, continental climate with 360 mm average
annual rainfall. Temperature increases in summer (May to September) and reached
to a maximum 46°C with a mean minimum temperature of 25°C. The winter rainfall
is higher than that of summer on average basis. The mean minimum temperature is
4°C in winter (December to March) with a maximum temperature of 20°C. The
highest rainfall occurs in winter (February and March) and in summer (July and
August).
4.2 Soil Sampling and Processing
Soil samples were collected from 30 different locations in districts Charsadda and
Mardan. All the soil samples were taken from the surface 20 cm, with varying salt
concentrations (i.e. ECe of < 4.0 to 32 dS m-1) in the month of March, 2009. Fields
were either under wheat crops or fallow at the time of sampling. Soon after
collection the samples were transferred to the Lab of Soil and Environmental
Science Department in cool box and processed immediately for measurements of
microbial activities and other soil properties. The samples in its moist condition
were broken and passed through < 4.0 mm sieve. The samples were kept in
refrigerator if unable to run immediately for microbial analysis.
Samples required for measurements of microbiological characteristics were kept
moist and cool. However, part of soil samples were air-dried, ground and passed
through < 2.0 mm sieve, and analyzed for soil characteristics such as soil pH, EC
(Electrical conductivity), soluble calcium plus magnesium, soluble sodium, ESP
(exchangeable sodium percentage), SAR (sodium adsorption ratio), carbonates,
bicarbonates and chloride.
4.3 Proposed Experiments
The following experiments were conducted in the study.
a. Microbiological properties of native salt affected soils
23
b. Effect of NaCl induced salinity on CO2 evolution and N
mineralization in a silty loam soil
c. Effect of MgCl2 induced salinity on CO2 evolution and N
mineralization in a silty loam soil
d. Comparative effect of pressmud, gypsum farmyard manure and
microbial inoculations on soil microbial biomass and activity in
saline sodic soil
The detail of each experiment is given below:
4.3.1 Microbiological properties of native salt affected soils
Soil microbiological properties were determined on moist samples of the 30 soils
(see 4.2 for soil preparation).
The soil microbial properties determined in salt affected soils include microbial
biomass N, microbial biomass C, microbial activity, N mineralization, nitrification
and C/N ratio of the microbial biomass. After air drying part of soil samples were
ground and passed through < 2.0 mm sieve, and analyzed for soil characteristics
such as soil pH, EC, soluble calcium plus magnesium, soluble sodium, SAR, ESP,
carbonates, bicarbonates and chloride.
4.3.2 Effect of NaCl induced salinity on CO2 evolution and N mineralization in silty clay loam soil
The induced NaCl effect was studied in a lab experiment during November, 2009.
Soil used for this experiment was collected. A bulk soil sample of about 9.0 kg was
collected from the research farm of Agricultural University Peshawar. Soil was
collected from the upper 20 cm recently cultivated wheat field. Soon after collection
the sample was transferred to the Lab of Soil and Environmental Sciences
Department in cool box and processed immediately for measurements of microbial
activities and other soil properties. The sample was broken down by hand and
passed through < 4.0 mm sieve whilst still moist. Sample required for measurements
of microbiological characteristics was kept moist and cool. However, part of soil
24
sample was analyzed for EC, pH, CaCO3, total N, organic matter and soil texture
after air-drying and passing through < 2.0 mm sieve.
Eight treatments with EC levels of 0.65, 4, 8, 12, 16, 20, 30 and 40 dS m-1 were
arranged in a Completely Randomized Design with three replications. The soil was
amended with NaCl salt at 0, 4.87, 11.11, 18.86, 24.44, 32.44, 55.55 and 78.22 mg
g-1 soil to get the desired EC levels, respectively. For each treatment, moist soil
sample of 300 g in triplicate was taken in a clean plastic pot and amended with the
desired level of NaCl salt solution. The required amount of NaCl salt was dissolved
in 30 mL water and spread uniformly over the surface of soil (300 g) in each
incubation pot. After amendments, the pots were incubated at 28°C. The CO2
evolution was measured at 10 days of interval to 40 days of incubation period, while
N mineralization was measured at day 0 to day 40 at 10 days of interval.
4.3.3 Effect of MgCl2 induced salinity on CO2 evolution and N mineralization in a silty clay loam soil
A laboratory incubation experiment was conducted to evaluate the effect of MgCl2
induced salinity on microbial activity and N mineralization in a slity clay loam soil
collected from the research farm of Khyber Pakhtunkhwa Agricultural University
Peshawar in March, 2010. Eight treatments with EC levels of 0.63, 4, 8, 12, 16, 20,
30 and 40 dSm-1 were arranged in a Completely Randomized Design with three
replications. The soil was amended with MgCl2 salt at 0, 6.5, 17.5, 29.0, 44.0, 66.5,
132.75 and 200 mg g-1 soil to get the desired EC levels, respectively.
For each treatment, moist soil sample of 300 g in triplicate was taken in clean plastic
pot and amended with the desired level of MgCl2 salt solution. The required amount
of MgCl2 salt was dissolved in 30 mL water and spread uniformly over the surface
of soil (300 g) in each incubation pot. Peptone was added at 200 µg N g-1 soil for N
mineralization determination only. After amendments, the pots were incubated at
28°C. The CO2 evolution was measured at 10, 20 and 30 days of incubation period,
while N mineralization was measured at 0, 10, 20 and 30 days of incubation period.
25
4.3.4 Comparative effect of pressmud, gypsum, farmyard manure and microbial inoculations on soil microbial biomass and activity in saline sodic soil
An experiment was performed to evaluate the comparative effect of gypsum,
pressmud and farmyard manure on soil microbial biomass and activity in a saline
sodic soil collected from Majoke in District Charsadda. The soils were collected
from Khati Khel soil series with silt loam or vary fine sandy loam texture that
comprises 5970 ha area in Khyber Pakhtunkhwa dominated by saline sodic soil
(Khan, 1993). The sampling soil was strongly saline sodic having EC value of 20
mS cm-1, pH 10.0 with silt loam texture comprising redeposit loess material.
Gypsum was collected from Agricultural Research Station Tarnab Peshawar.
Pressmud was collected from Khazana Sugar Mill Peshawar and analyzed for pH,
EC, Na, SAR, lime, total N and organic matter. FYM was collected from
Agricultural Research Station Malakandher and analyzed for total N (0.65 g 100 g-1).
The treatments arranged for this experiment were; control, gypsum (G), pressmud
(PM), farmyard manure (FYM), G+FYM, G+PM, PM+FYM and PM+FYM +
microbial inoculation. Each treatment was repeated three times in a CR (completely
randomized) design. For each treatment 6 kg soil of saline sodic soil (pH = 10.4 and
EC= 20.3 dSm-1) was taken in clean plastic pot and amended with the required
amount of the desired amendment. Gypsum and pressmud were applied on the basis
of 100% gypsum requirement equal to 20 Mg ha-1. FYM alone or in combination
with chemical amendments, was applied at the rate of 17 Mg ha-1. Inoculum was
applied @ 100-120 million microbes per pot.
4.4 Laboratory Analysis
The important soil microbiological and chemical properties including microbial
biomass C and N, basal soil respiration, microbial biomass C/N ratio,
ammonificaton, nitrification, total mineral N, total N, nitrogen mineralization,
microbial inoculums preparation, gypsum requirement, saturation extracts, soluble
Na, soluble Ca+Mg, sodium adsorption ratio, exchangeable Na percentage, chloride,
carbonates and bicarbonates, organic matter, lime content, texture, pH and EC were
measured as follows:

26
4.4.1 Microbial biomass C and N
Microbial biomass carbon and nitrogen were determined by chloroform fumigation
incubation method Brookes et al. (1985) and Vance et al. (1987) as described in
Horwath and Paul (1994). In this method, 50 g soil sample was fumigated with
chloroform. After re-inoculation, the fumigated soil samples were run for measuring
CO2 evolution during incubation using the alkali trapping technique. The un-
fumigated soil samples were also run for CO2 measurement in similar manner.
Microbial biomass was calculated from the difference of CO2 evolved between the
fumigated and un-fumigated soil samples. The chloroform fumigation incubation
consists of the following steps:
4.4.1.1 Fumigation
For fumigation, 50 g moist soil samples were taken in 100 ml beaker and kept in
desiccator lined with moist tissue papers. Another tall beaker containing about 50 ml
chloroform and few anti-bumping granules was kept in the center of desiccator
along with the soil samples. The desiccator was properly air-tightened and
connected to the vacuum pump. The air from desiccator was evacuated 3 times; each
time for about 1 minute after chloroform began boiling. After the last evacuation,
the desiccator was kept in dark under vacuum for 24 hrs. The unfumigated samples
were also kept in desiccator (without vacuum and chloroform) and placed in dark for
the same period. After incubation in the dark, chloroform was carefully removed
from desiccator. The residual effect of chloroform was evacuated with the help of
vacuum pump.
4.4.1.2 Inoculations
The fumigated samples were then removed from desiccator and inoculated with 1 g
of respective fresh unfumigated soil samples and thoroughly mixed.
4.4.1.3 Measurements of CO2 evolution
The CO2 evolution was measured in both fumigated and un-fumigated soil samples
as follows:

27
Each soil sample was transferred to a 500 ml conical flask. A vial containing 5 ml of
0.3 M NaOH was suspended in the flask and properly air-tightened with a rubber
bung, and then incubated at 28°C for 2, 5, and 10 days. At each incubation period,
the NaOH solution of the vial was treated with 10 ml of 1 M BaCl2 solution in the
presence of 3 to 4 drops of phenolphthalein following titration against 0.1 N HCl till
the disappearance of pink color.
The vial was re-filled with fresh NaOH solution (same amount and strength) and
suspended in the same flask. The sample was re-incubated to measure CO2 evolution
at 5th and 10th day of incubation period. The amount of CO2 evolution was calculated
from the amount of HCl used in titration and expressed in mg CO2 kg-1 soil d-1.
After measurement of CO2 evolution at day 10, both the fumigated and un-
fumigated soil samples were analyzed for total mineral N.
4.4.1.4 Calculation of biomass C
Soil microbial biomass C was calculated from the amount of CO2-C produced in
fumigation and un-fumigated samples using the following expression:
Biomass C = (Fc – Ufc) / Kc
Where: KC = constant value i.e. 0.45 (Jenkinson and Ladd, 1981)
FC = CO2 flush from fumigated soil sample
Ufc = CO2 flush from un-fumigated soil sample
4.4.1.5 Calculation of biomass N
Soil microbial biomass N was calculated from the amount of mineral N produced in
the fumigated and un-fumigated soil samples using the following equation:
Biomass N = (Fn – Ufn) / Kn
Where: Kn = constant i.e. 0.54 (Jenkinson, 1981)
Fn = flush of NH4-Nfrom fumigated soil sample
Ufn = flush of NH4-N from un-fumigated soil sample
28
4.4.2 Determination of total mineral N
Total mineral N was determined in soil samples by the steam distillation procedure
(Mulvaney, 1996). Taking 20 g soil sample and shaking with 100 ml of 1 M KCl for
1 hr. The sample was filtered and NH4-N was recovered with MgO in 20 ml of
extract and both NH4+ and NO3
- nitrogen with MgO plus devarda’s alloy, titrated
against 0.005 M HCl in a 5 ml boric acid mixed indicator solution. A blank was also
run simultaneously. Mineral N was calculated using the following expression:
Mineral N (mg N kg-1 soil) = 20(g) soil ofweight
1001000014.0005.0)(
BlankSample
Nitrate N was determined by difference as follows:
Nitrate N (mg N kg-1 soil) = Total mineral N (mg N kg-1 soil) – NH4-N (mg N kg-1
soil)
4.4.3 Mineralizable N (mg N kg-1 soil)
Mineralizable N was calculated from total mineral N as follows:
Mineralizable N = Total mineral N at day 10 – Total mineral N at day 0.
Ammonification = Ammonium N at day 10 – Ammonium N at day 0.
Nitrification = Nitrate N at day 10 – Nitrate N at day 0.
4.4.4 Total N
Total N was determined by the Kjeldhal method of Bremner (1996). The method
includes digestion of 0.2 g soil sample with concentrated 3 ml of H2SO4 in the
presence of 1.1 g digestion mixture containing K2SO4, H2SO4 and Se in 100:10:1
ratio. The digest was cooled and distilled in a 5 ml boric acid mixed indicator
solution with 20 ml of 40% NaOH solution following titration against 0.005 N HCl.
The amount of N was calculated as 1 ml of 0.005 N HCl equals 70 µg N.

29
4.4.5 Preparation of microbial inoculants of salt tolerant microorganisms
The preparation of microbial inoculants of salt tolerant microorganisms was consist
of the following steps:
4.4.5.1 Isolation and culture of salt tolerant microorganisms
Salt tolerant microbes (bacteria and fungi) were isolated from salt affected soils. The
microorganisms present in salt-affected soil were grown on nutrient agar media for
bacteria or peptone-glucose-acid agar media for fungi using the dilution plate
technique as described in Wollum II (1982). In this method, 1 g fresh saline-sodic
soil (pH 10.5, EC 20.3) sample was shaken in 25 ml bottle in the presence of few
glass beads for 10 minutes in 9.5 ml diluents. Transferred 1 ml of the suspension to a
2nd bottle containing 9 ml of sterilized water for further dilutions. The same process
was repeated until reached to the desired dilutions. The bacterial (Nutrient Agar
Media) and fungal (Peptone Glucose Acid Agar Media) plates were inoculated form
the desired dilutions and incubated at 28°C for 1 wk. Any bacteria and fungi
appeared on these plates were considered as salt tolerant. Clear colonies of bacteria
and fungi on these plates were selected and multiplied further on relevant media.
4.4.5.2 Inoculation of soil salt tolerant microorganisms
In order to inoculate the soil with the desired number of microorganisms, the
following procedure was used:
A series of dilutions were prepared by transferring a loop of bacterial or fungal
colonies from salt tolerant microorganisms cultured as above to a test tube
containing 10 mL sterilized water. After shaking, 1 mL suspension from this tube
was transferred to another test tube containing 9 mL diluents, and then 1 mL from
this to another tube until the required dilutions were obtained. From each of the 3 or
4 last dilutions, 0.1 mL suspension was transferred to bacterial or fungal plates and
incubated at 28°C for about a week and counted the number of colonies appeared on
each plate. The number of microbial cells was then calculated per mL in each
dilution. Based on these calculations, the required amount of aliquot/suspension
from selected dilutions was transferred to achieve the targeted population of 100
30
million microorganisms in each sample. After transferring, the inoculums were
thoroughly mixed in the soil.
4.4.5.3 Preparation of nutrient agar media
Nutrient agar media was prepared by dissolving 3 g beef extract, 5 g peptone, one g
yeast extract and 15 g agar powder in 1000 mL distilled water. The media was
autoclaved at 121°C for 20 min. After cooling to a pouring temperature of 48°C,
about 15 mL media was distributed evenly into each sterilized petri dish and allowed
to solidify. The plates were inverted and cured for 2 days before inoculation.
4.4.5.4 Preparation of peptone glucose acid agar media
Peptone glucose acid agar media was prepared by dissolving 5 g peptone, 10 g
glucose, 1 g KH2PO4, 0.5 g MgSO4.7H2O and 20 g agar powder dissolved in 1 L
distilled water. The media was autoclaved and plated as nutrient agar media except
that 1 mL of 0.5 N sulfuric acid (H2SO4) per 100 mL of media was added just before
plating.
4.4.6 Measurement of gypsum requirements
Gypsum requirement to reclaim a sodic or saline-sodic soil was determined by the
method of Richards (1954). An air dried 5.0 g of soil was shaken with 100 mL of
saturated gypsum solution (28 meq Ca L-1). After shaking for 30 minutes on a
mechanical shaker, the suspension was filtered. For Ca+Mg measurements in the
solution, 5 mL of the filtrate was taken and added with 10 drops of Erichrom Black-
T indicator in China dish. The solution was then titrated against 0.01 N EDTA when
the color changed from wine red to blue or green. Gypsum requirement (GR) was
calculated from the following expression:
GR(mgg-1) =
224
Ca meq 1
0).2HCaSO mg (86
(g) sample ofweight
filt.)in MgCa meq - sol.in MgCa (meq
GR (Mg ha-1) = area ha 1
cm) 15-(0 soil kg 102
kg 10
Mg 1
mg 10
soil 1kg
soil g
mg GR 6
36

31
4.4.7 Saturation moisture percentage/saturation extracts
Saturation moisture percentage in soil sample (saturation extract) was determined as
described by Gardner (1986). Distilled water was added to 250 g air dried soil till
paste had the characteristic to flow off from the spatula easily while stirring with a
spatula. The saturation moisture percentage was calculated as follows:
% Saturation = dry wt.Oven
dry wt. - wet wt.
The extract was collected from the saturation paste after kept overnight in labeled
plastic bottles and analyzed for sodium, Ca+Mg, carbonates, bicarbonates, chloride,
pH and electrical conductivity as follows:
4.4.8 Sodium
Sodium (Na) concentration in the soil saturation extract was read on flame
photometer (Jenway PFP-7). The machine was calibrated with Na standards before
running the samples.
4.4.9 Calcium and magnesium
Calcium and Mg concentration in the soil saturation extract were measured by the
versinate method as described in Richards (1954). In this method, one ml of soil
saturation extract was treated with of ammonium chloride plus ammonium hydro
oxide solution (10 drops) and 2-3 drops of Eriochrome Black-T in China dish. The
sample was titrated with EDTA (0.01N) until the color changed to blue or green.
The amount of Ca+Mg was calculated from the following expression:
Ca+Mg (meq L-1) = aliquot of ml
1000 EDTA of (ml EDTAof
4.4.10 Carbonates and bicarbonates
Carbonates and bicarbonates in the saturation extract were determined by the
titration method as described in Richards (1954). Briefly, one ml of soil saturation
extract was added with few drops of solution in a China dish. The appearance of
pink color shows the presence of CO3. The extract is then titrated with H2SO4 (0.01

32
N) up to disappearance of the pink color. Note the burette reading as y. If the extract
did not changed color at first time with phenolphthalein or after the disappearance of
color with H2SO4, methyl orange (2-3 drops) was added to the sample solution and
titrated against H2SO4 (0.01 N) to the appearance of orange color and note the
burette reading as z. Both CO3 and HCO3 were calculated with the following
expressions:
CO3 (meq L-1) = aliquot of ml
1000 SOH of N (2y 42
HCO3 (meq L-1) = aliquot of ml
1000 SOH of N 2y -(z 42
4.4.11 Chloride
Chloride concentration in the saturation extract was determined with silver nitrate
titration method as described in Richards (1954). Briefly, one mL of sample was
added with 4 drops of 5% potassium chromate solution taken in a China dish and
titrated under bright light with 0.005 N AgNO3 to the appearance of permanent
reddish brown color. The amount of Cl was calculated from the following
expression:
Cl (meq L-1) = aliquot of ml
blank)for AgNO -samplefor AgNO of (ml 33
4.4.12 Sodium adsorption ratio (SAR)
The SAR was calculated from the amount of Na and Ca+Mg in soil saturation
extract using the following expression (Richards, 1954):
SAR=
2
MgCa
Na
4.4.13 Exchangeable sodium percentage
The exchangeable sodium percentage (ESP) was calculated from the SAR value
using the following formula (Richards, 1954):

33
ESP= )01475.00126.0(1
)01475.00126.0(100
SAR
SAR
4.4.14 pH
The soil saturation extract was read for pH with the help of pH meter (InoLab,
WTW, Germany).
4.4.15 Electrical conductivity
The EC was read on EC meter (WTW, Germany) in saturation extract. The EC
meter was calibrated against KCl (0.1 N and 0.01 N) solutions before analyzing soil
sample.
4.4.16 Lime content
Acid-neutralization method was used for the determination of lime in soil (Richards,
1954). In this method, 5 g soil sample was treated with 50 mL of 0.5 M HCl. The
suspension was heated for five minutes and after cooling filtered through Whatman
No. 42. The filtrate was titrated against 0.25 N NaOH in the presence of few drops
of phenolphthalein as indicator till the appearance of pink color. The amount of lime
(CaCO3) was calculated from the following expression:
% CaCO3 =
meq = milli equivalent
4.4.17 Organic matter
Organic matter in soil samples was determined by the K2Cr2O7 method of Walkley-
Black as described by Nelson and Sommers (1996). In this method, 1 g soil sample
was treated with 10 ml of 1 N K2Cr2O7 solution and 20 ml of concentrated H2SO4.
After cooling 200 ml of distilled water was added, filtered and titrated against 0.5 N
FeSO4 solution until color changed from green to dark brown using
organophenophthaline as indicator. At the same time a blank was also run. The
following formula is used to calculate soil organic matter:
Organic matter (%) = sample ofwt
C.F.(0.69)O).7HFeSO of meq OCrK of (meq 24722
gramsin sample ofWt
100 3CaCO meq on)in titrati used NaOH meq - added HCl (meq
34
4.4.18 Soil texture
The soil texture was determined by the bouyoucos hydrometer method as described
in Gee and Bauder (1986). In this method, 50 g soil sample was treated with 10 mL
of 1N Na2CO3 and dispersed mechanically for 10 minutes. After transfer to 1000 mL
cylinder, hydrometer was placed in the suspension and read its reading once after 40
sec for silt+clay and second after 2 hrs for clay. Temperature of the suspension was
also record with each hydrometer reading and corrected the readings accordingly.
Sand was calculated by subtracting silt and clay contents from the total weight of
soil. Soil texture class was determined using USDA textural triangle.
4.5 Statistical Analysis
The results are presented in the tables are arithmetic means of three replications.
Correlations between soil microbial parameters and various soil chemical properties
were studied using Pearson correlation (Pearson, 1896). Analysis of variance was
determined using a Completely Randomized Design (Steel and Torrie, 1980). Means
significant at the 5% level were tested using LSD (Least significant difference) test.
The statistical analyses were performed by using Win Stat computer program.
35
5 RESULTS AND DISCUSSION
Salts affect soils chemically, physically and biologically. Biological effects are the
changes in osmotic pressure and alteration of protoplasmic action in plants and the
microorganisms. The effect of salts on microorganisms depends on nature of salinity
(type and extent of salt concentrations, Na hazards), soil physico-chemical
properties (soil structure, texture, sodium adsorption ratio, soil reaction and organic
matter content) and climatic condition of the area. In the present investigation the
effect of different salinity levels were evaluated on soil microbial properties both in
induced and natural salt affected soils. The results obtained are presented and
discussed as follows:
5.1 MICROBIAL BIOMASS AND ACTIVITY IN NATIVE SALT AFFECTED SOIL
5.1.1 Soil chemical characteristics
Soils collected from thirty different locations in Charsadda and Mardan districts
were analyzed for different chemical properties including electrical conductivity
(EC), pH, soluble Ca+Mg, soluble Na, sodium adsorption ratio (SAR), exchangeable
sodium percentage (ESP), carbonates, bicarbonates and chloride. Results showed
that salinity varied considerably among all the thirty soils (Table 5.1). The soil EC
ranged from 0.63-32.3 dSm-1. The EC of seventeen soils was < 4.0 dSm-1, of three
soils (S17, S18 and S19) between 4.0-8.0 dSm-1, four soils (S2, S5, S11 and S13)
between 8.0-12.0 dSm-1, and six soils >12.0 dSm-1. All the thirty samples were
alkaline in reaction with pH > 7.0. The pH of five soils (S16, S17, S20, S22, and S30)
was below 8.0, thirteen soils between 8.0-9.0, eight soils between 9.0-10.0, and four
soils (S11, S13, S14 and S25) > 10.0. Soluble salts (Ca + Mg) varied from 2.5 to 29.5
meq L-1 in the corresponding soils. The soluble salts (Ca+Mg) of 25 soils were
below 10.0 meq L-1, and of five soils (S10, S15, S17, S18, and S19) >10.0 meq L-1. The
soluble Na ranged from 0.93-395 meq L-1, with seven soils > 10.0 meq L-1, twelve
soils between 10.0-100.0 meq L-1, seven soils between 100.0-200.0 meq L-1, and
four soils had >200.0 meq L-1.
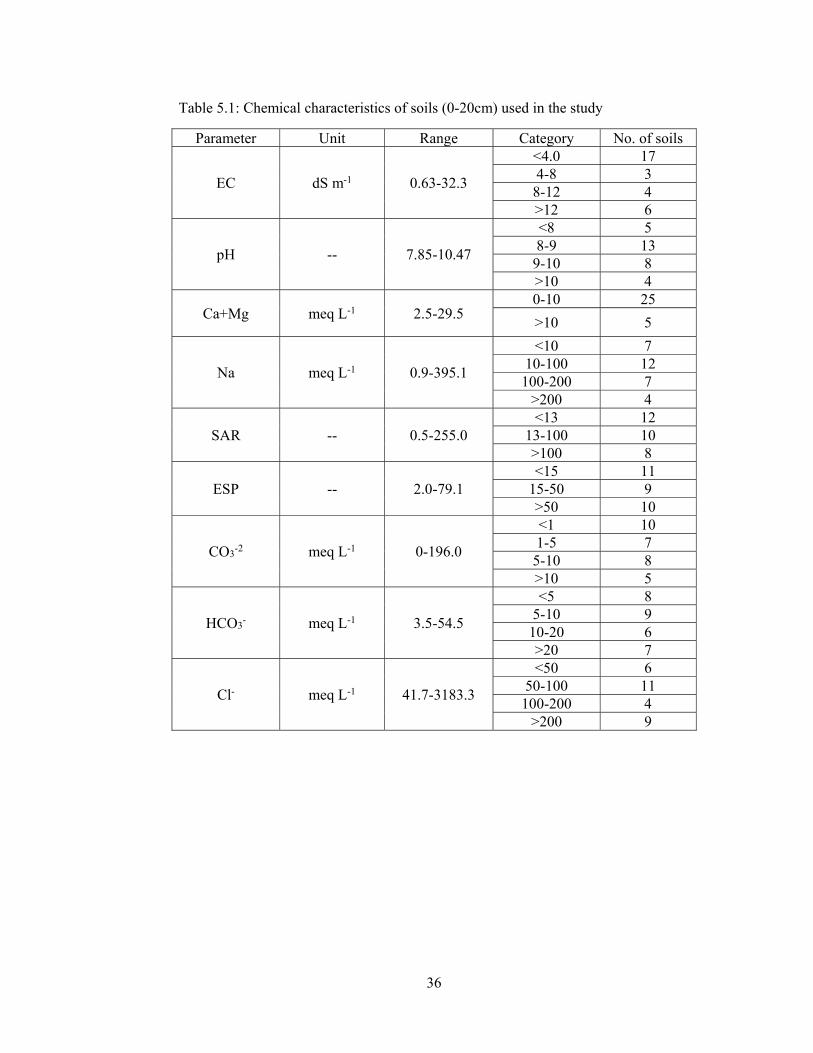
36
Table 5.1: Chemical characteristics of soils (0-20cm) used in the study
Parameter Unit Range Category No. of soils
EC dS m-1 0.63-32.3
<4.0 17 4-8 3
8-12 4 >12 6
pH -- 7.85-10.47
<8 5 8-9 13
9-10 8 >10 4
Ca+Mg meq L-1 2.5-29.5 0-10 25
>10 5
Na meq L-1 0.9-395.1
<10 7 10-100 12
100-200 7 >200 4
SAR -- 0.5-255.0 <13 12
13-100 10 >100 8
ESP -- 2.0-79.1 <15 11
15-50 9 >50 10
CO3-2 meq L-1 0-196.0
<1 10 1-5 7
5-10 8 >10 5
HCO3- meq L-1 3.5-54.5
<5 8 5-10 9
10-20 6 >20 7
Cl- meq L-1 41.7-3183.3
<50 6 50-100 11
100-200 4 >200 9
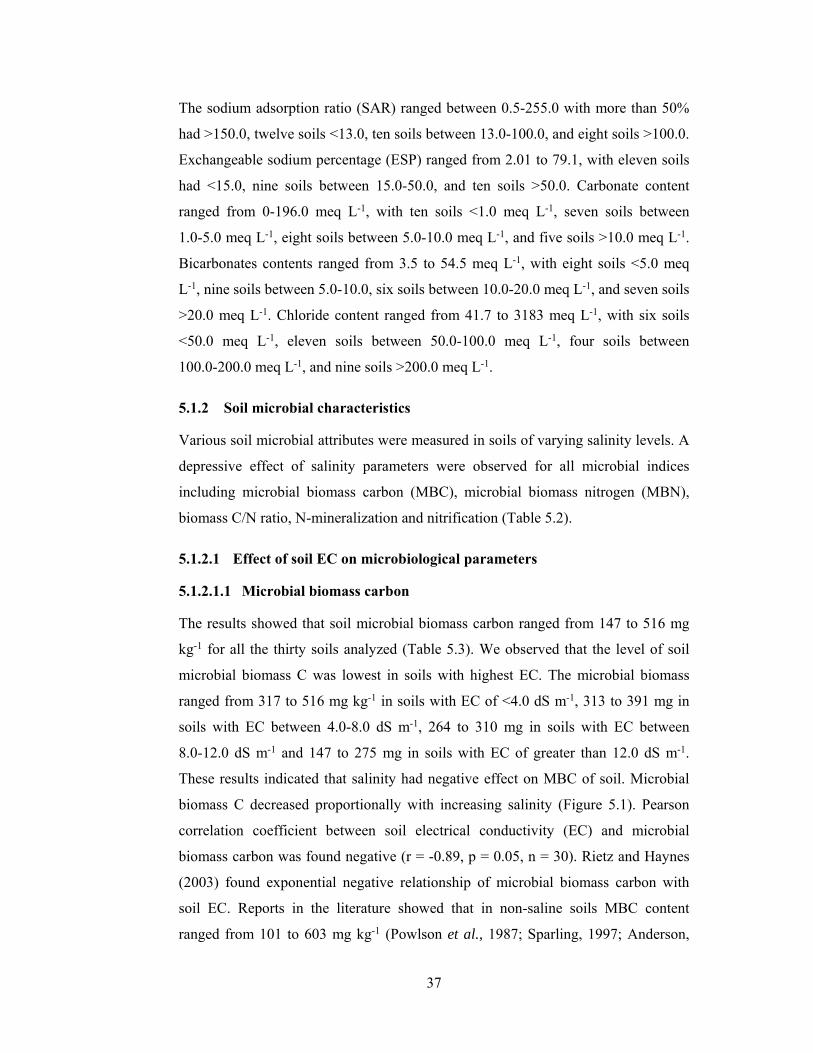
37
The sodium adsorption ratio (SAR) ranged between 0.5-255.0 with more than 50%
had >150.0, twelve soils <13.0, ten soils between 13.0-100.0, and eight soils >100.0.
Exchangeable sodium percentage (ESP) ranged from 2.01 to 79.1, with eleven soils
had <15.0, nine soils between 15.0-50.0, and ten soils >50.0. Carbonate content
ranged from 0-196.0 meq L-1, with ten soils <1.0 meq L-1, seven soils between
1.0-5.0 meq L-1, eight soils between 5.0-10.0 meq L-1, and five soils >10.0 meq L-1.
Bicarbonates contents ranged from 3.5 to 54.5 meq L-1, with eight soils <5.0 meq
L-1, nine soils between 5.0-10.0, six soils between 10.0-20.0 meq L-1, and seven soils
>20.0 meq L-1. Chloride content ranged from 41.7 to 3183 meq L-1, with six soils
<50.0 meq L-1, eleven soils between 50.0-100.0 meq L-1, four soils between
100.0-200.0 meq L-1, and nine soils >200.0 meq L-1.
5.1.2 Soil microbial characteristics
Various soil microbial attributes were measured in soils of varying salinity levels. A
depressive effect of salinity parameters were observed for all microbial indices
including microbial biomass carbon (MBC), microbial biomass nitrogen (MBN),
biomass C/N ratio, N-mineralization and nitrification (Table 5.2).
5.1.2.1 Effect of soil EC on microbiological parameters
5.1.2.1.1 Microbial biomass carbon
The results showed that soil microbial biomass carbon ranged from 147 to 516 mg
kg-1 for all the thirty soils analyzed (Table 5.3). We observed that the level of soil
microbial biomass C was lowest in soils with highest EC. The microbial biomass
ranged from 317 to 516 mg kg-1 in soils with EC of <4.0 dS m-1, 313 to 391 mg in
soils with EC between 4.0-8.0 dS m-1, 264 to 310 mg in soils with EC between
8.0-12.0 dS m-1 and 147 to 275 mg in soils with EC of greater than 12.0 dS m-1.
These results indicated that salinity had negative effect on MBC of soil. Microbial
biomass C decreased proportionally with increasing salinity (Figure 5.1). Pearson
correlation coefficient between soil electrical conductivity (EC) and microbial
biomass carbon was found negative (r = -0.89, p = 0.05, n = 30). Rietz and Haynes
(2003) found exponential negative relationship of microbial biomass carbon with
soil EC. Reports in the literature showed that in non-saline soils MBC content
ranged from 101 to 603 mg kg-1 (Powlson et al., 1987; Sparling, 1997; Anderson,
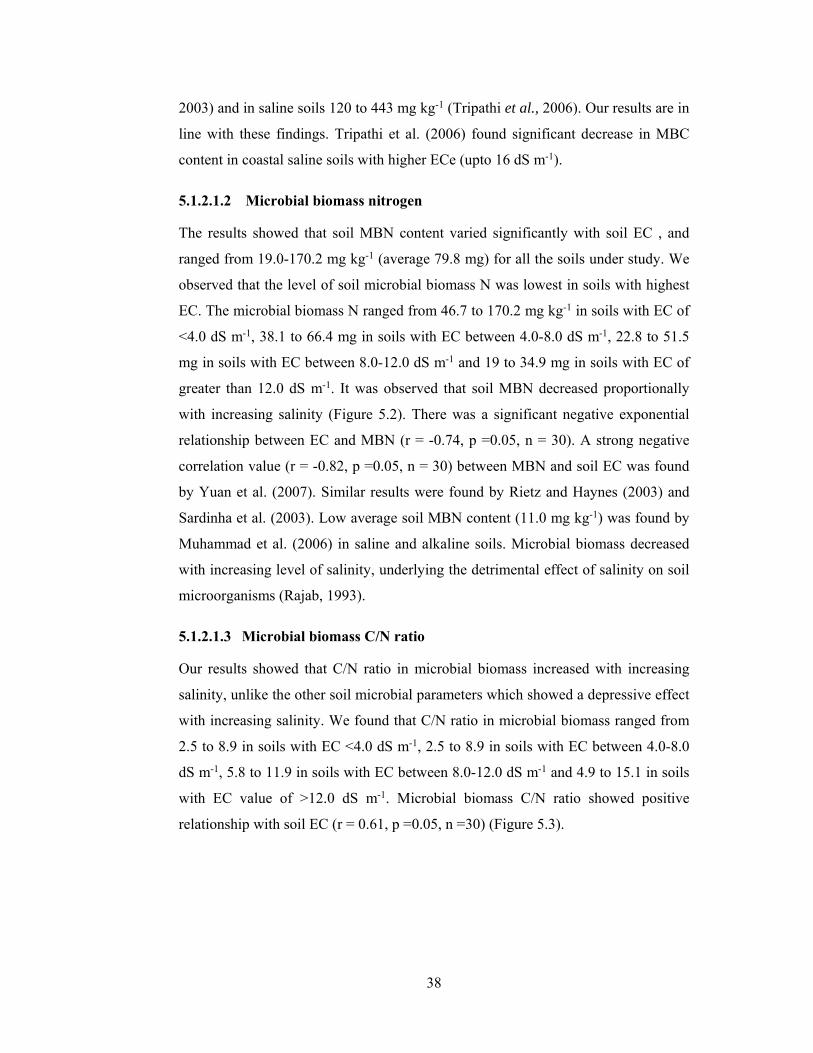
38
2003) and in saline soils 120 to 443 mg kg-1 (Tripathi et al., 2006). Our results are in
line with these findings. Tripathi et al. (2006) found significant decrease in MBC
content in coastal saline soils with higher ECe (upto 16 dS m-1).
5.1.2.1.2 Microbial biomass nitrogen
The results showed that soil MBN content varied significantly with soil EC , and
ranged from 19.0-170.2 mg kg-1 (average 79.8 mg) for all the soils under study. We
observed that the level of soil microbial biomass N was lowest in soils with highest
EC. The microbial biomass N ranged from 46.7 to 170.2 mg kg-1 in soils with EC of
<4.0 dS m-1, 38.1 to 66.4 mg in soils with EC between 4.0-8.0 dS m-1, 22.8 to 51.5
mg in soils with EC between 8.0-12.0 dS m-1 and 19 to 34.9 mg in soils with EC of
greater than 12.0 dS m-1. It was observed that soil MBN decreased proportionally
with increasing salinity (Figure 5.2). There was a significant negative exponential
relationship between EC and MBN (r = -0.74, p =0.05, n = 30). A strong negative
correlation value (r = -0.82, p =0.05, n = 30) between MBN and soil EC was found
by Yuan et al. (2007). Similar results were found by Rietz and Haynes (2003) and
Sardinha et al. (2003). Low average soil MBN content (11.0 mg kg-1) was found by
Muhammad et al. (2006) in saline and alkaline soils. Microbial biomass decreased
with increasing level of salinity, underlying the detrimental effect of salinity on soil
microorganisms (Rajab, 1993).
5.1.2.1.3 Microbial biomass C/N ratio
Our results showed that C/N ratio in microbial biomass increased with increasing
salinity, unlike the other soil microbial parameters which showed a depressive effect
with increasing salinity. We found that C/N ratio in microbial biomass ranged from
2.5 to 8.9 in soils with EC <4.0 dS m-1, 2.5 to 8.9 in soils with EC between 4.0-8.0
dS m-1, 5.8 to 11.9 in soils with EC between 8.0-12.0 dS m-1 and 4.9 to 15.1 in soils
with EC value of >12.0 dS m-1. Microbial biomass C/N ratio showed positive
relationship with soil EC (r = 0.61, p =0.05, n =30) (Figure 5.3).

39
Table 5.2: Correlation coefficient of soil EC with MBC, MBN, MB C/N ratio and Nitrification
Parameter Correlation coefficient (r) Microbial biomass carbon -0.89**
Microbial biomass nitrogen -0.74**
N-mineralization -0.57**
Microbial biomass C/N ratio 0.61**
Nitrification -0.64**
Cumulative CO2 production -0.79**
**, significant at P < 0.01
Table 5.3: Microbiological properties of soils (0-20cm) as affected by EC levels
EC (dS m-1)
No. of soils in the category
MBC (mg kg-1)
MBN (mg kg-1)
MB C/N
N-Mineralization (mg kg-1)
Nitrification (mg kg-1)
≤4.0 17
min 317.3 46.7 2.5 10.3 -2.7 max 516.3 170.2 8.9 63.1 73.7 mean 391.0 113.8 4.2 32.9 31.3 CV 42.6 32.4 1.2 14.3 20.6
4.0-8.0 3
min 313.3 38.1 5.2 13.9 7.9 max 390.8 66.4 8.9 22.9 23.9 mean 340.5 55.6 6.6 18.4 15.4 CV 33.6 11.7 1.5 3.0 5.7
8.0-12.0 4
min 263.9 22.8 5.8 5.2 -11.3 max 301.5 51.5 11.9 19.9 19.2 mean 276.3 36.8 8.1 11.8 1.2 CV 12.6 8.2 1.9 4.1 9.0
>12.0 6
min 146.8 19.0 4.9 1.9 -19.2 max 274.9 34.9 15.1 26.3 10.1 mean 208.7 24.8 10.5 10.7 -5.4 CV 32.8 4.6 3.1 9.2 8.2
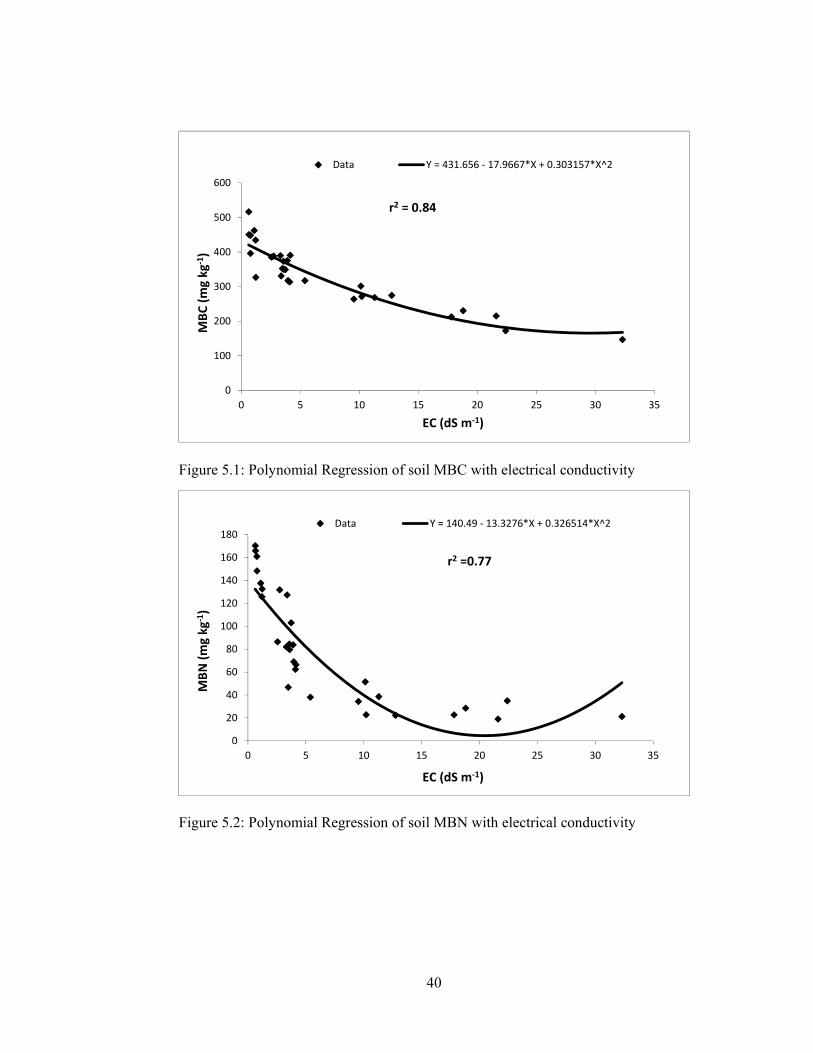
40
Figure 5.1: Polynomial Regression of soil MBC with electrical conductivity
Figure 5.2: Polynomial Regression of soil MBN with electrical conductivity
0
100
200
300
400
500
600
0 5 10 15 20 25 30 35
MBC
(mg
kg-1
)
EC (dS m-1)
r2 = 0.84
Data Y = 431.656 - 17.9667*X + 0.303157*X^2
0
20
40
60
80
100
120
140
160
180
0 5 10 15 20 25 30 35
MBN
(mg
kg-1
)
EC (dS m-1)
r2 =0.77
Data Y = 140.49 - 13.3276*X + 0.326514*X^2
41
A low microbial biomass C/N ratio (4.36-7.67) was found by Yaun et al. (2007).
Low N availability in combination with high C availability has been shown to
increase microbial biomass C/N ratio in pure cultures of soil fungi and soil bacteria
(Anderson and Domsch, 1980). For example, strongly increased microbial biomass
C/N ratio has been observed in a German soil after glucose addition (Chander and
Joergensen, 2007), and Rasul et al. (2008) found that average C/N of the microbial
biomass was 18.0 in the sugar filter cake and biogenic waste compost treated soils.
5.1.2.1.4 Nitrogen mineralization
The results indicated that N mineralization varied considerably with salinity.
Nitrogen mineralization ranged from 10.3 to 63.1 mg kg-1 in soils with EC of <4.0
dS m-1, 13.9 to 22.9 mg in soils with EC between 4.0-8.0 dS m-1, 5.2 to 19.9 mg in
soils with EC between 8.0-12.0 dS m-1 and 1.9 to 26.3 mg in soils with EC of greater
than 12.0 dS m-1. These results suggested that nitrogen mineralization showed
negative relationship with salinity and decreased proportionally with increasing
salinity (Figure 5.4). Potentially mineralizable N is describing as a sensitive measure
of the active soil organic N pool, which is the fraction accessible to soil organisms
and enzymes (Yuan et al., 2007). Our results demonstrated that soil N
mineralization was negatively affected by salinity. The Spearman correlation
coefficient (r =-0.57, p=0.05, n = 30) calculated between EC and N mineralization
showed that N mineralization decreased with increasing salinity. As salinity
provides a stressful environment for the microbial growth and activity therefore, it
directly influence the organic matter decomposition as the primary decomposer of
organic matter. Soil microbial biomass is mainly responsible for soil organic
substrate mineralization and its turnover (Killham, 1994), and increased salinity has
been shown to decrease soil microbial biomass and rate of soil respiration (Laura,
1973; Laura, 1976; Pathak and Rao, 1998). The decrease in microbial population
with increasing salinity is due to the stress placed by osmotic potential changes in
saline soil (Batra and Manna, 1997). Under osmotic stress, microorganisms enhance
their survival by channeling the consumed C and N into biomass production and
thus decreases rate of C and N mineralization (Killham et al., 1990).
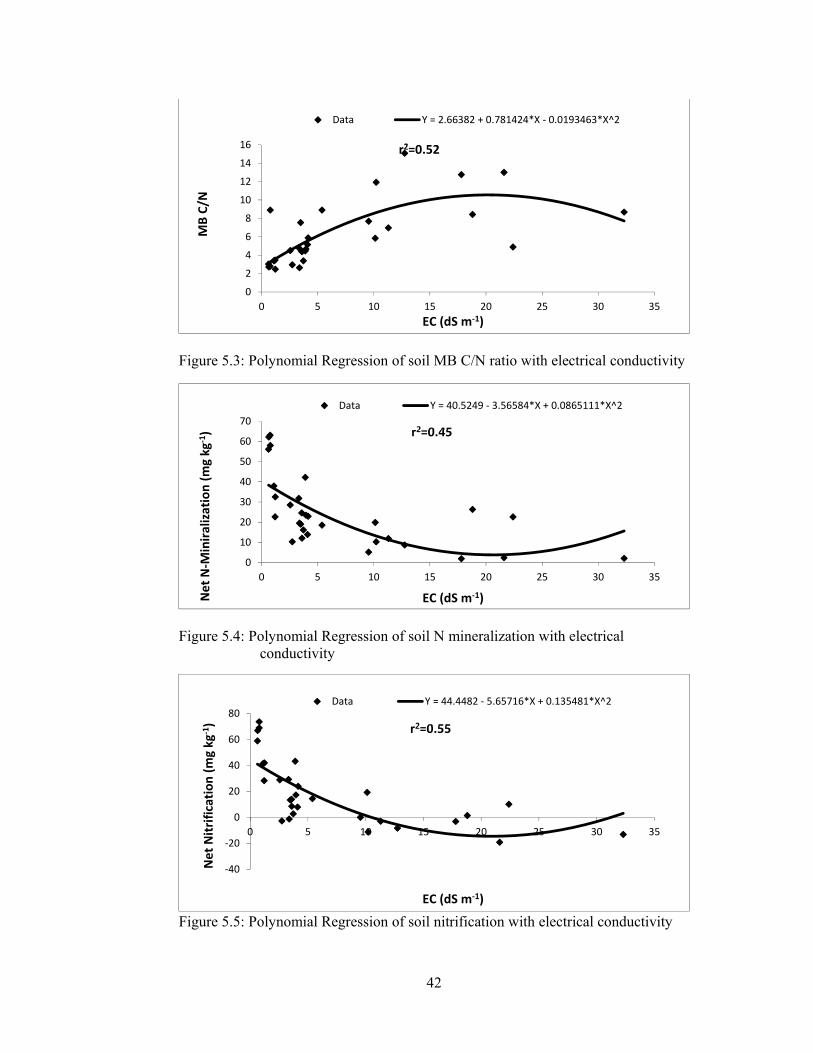
42
Figure 5.3: Polynomial Regression of soil MB C/N ratio with electrical conductivity
Figure 5.4: Polynomial Regression of soil N mineralization with electrical conductivity
Figure 5.5: Polynomial Regression of soil nitrification with electrical conductivity
0
2
4
6
8
10
12
14
16
0 5 10 15 20 25 30 35
MB
C/N
EC (dS m-1)
r2=0.52
Data Y = 2.66382 + 0.781424*X - 0.0193463*X^2
0
10
20
30
40
50
60
70
0 5 10 15 20 25 30 35
Net
N-M
inira
lizat
ion
(mg
kg-1
)
EC (dS m-1)
r2=0.45
Data Y = 40.5249 - 3.56584*X + 0.0865111*X^2
-40
-20
0
20
40
60
80
0 5 10 15 20 25 30 35
Net
Nitr
ifica
tion
(mg
kg-1
)
EC (dS m-1)
r2=0.55
Data Y = 44.4482 - 5.65716*X + 0.135481*X^2
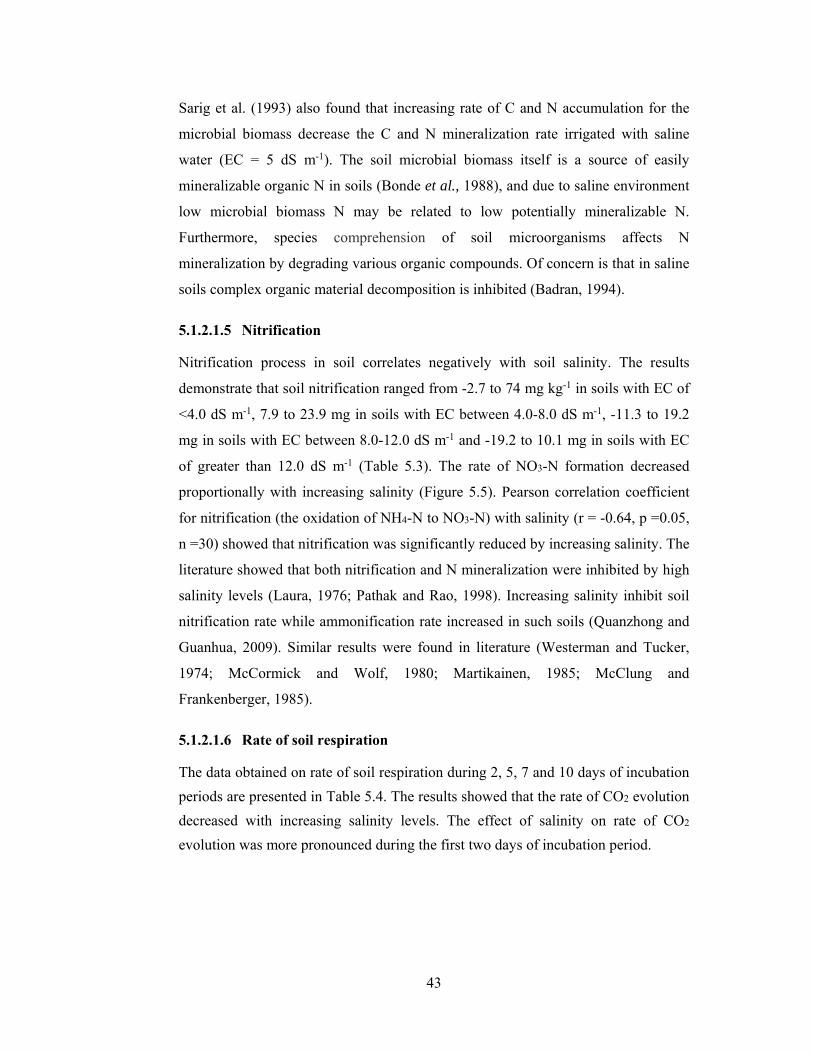
43
Sarig et al. (1993) also found that increasing rate of C and N accumulation for the
microbial biomass decrease the C and N mineralization rate irrigated with saline
water (EC = 5 dS m-1). The soil microbial biomass itself is a source of easily
mineralizable organic N in soils (Bonde et al., 1988), and due to saline environment
low microbial biomass N may be related to low potentially mineralizable N.
Furthermore, species comprehension of soil microorganisms affects N
mineralization by degrading various organic compounds. Of concern is that in saline
soils complex organic material decomposition is inhibited (Badran, 1994).
5.1.2.1.5 Nitrification
Nitrification process in soil correlates negatively with soil salinity. The results
demonstrate that soil nitrification ranged from -2.7 to 74 mg kg-1 in soils with EC of
<4.0 dS m-1, 7.9 to 23.9 mg in soils with EC between 4.0-8.0 dS m-1, -11.3 to 19.2
mg in soils with EC between 8.0-12.0 dS m-1 and -19.2 to 10.1 mg in soils with EC
of greater than 12.0 dS m-1 (Table 5.3). The rate of NO3-N formation decreased
proportionally with increasing salinity (Figure 5.5). Pearson correlation coefficient
for nitrification (the oxidation of NH4-N to NO3-N) with salinity (r = -0.64, p =0.05,
n =30) showed that nitrification was significantly reduced by increasing salinity. The
literature showed that both nitrification and N mineralization were inhibited by high
salinity levels (Laura, 1976; Pathak and Rao, 1998). Increasing salinity inhibit soil
nitrification rate while ammonification rate increased in such soils (Quanzhong and
Guanhua, 2009). Similar results were found in literature (Westerman and Tucker,
1974; McCormick and Wolf, 1980; Martikainen, 1985; McClung and
Frankenberger, 1985).
5.1.2.1.6 Rate of soil respiration
The data obtained on rate of soil respiration during 2, 5, 7 and 10 days of incubation
periods are presented in Table 5.4. The results showed that the rate of CO2 evolution
decreased with increasing salinity levels. The effect of salinity on rate of CO2
evolution was more pronounced during the first two days of incubation period.
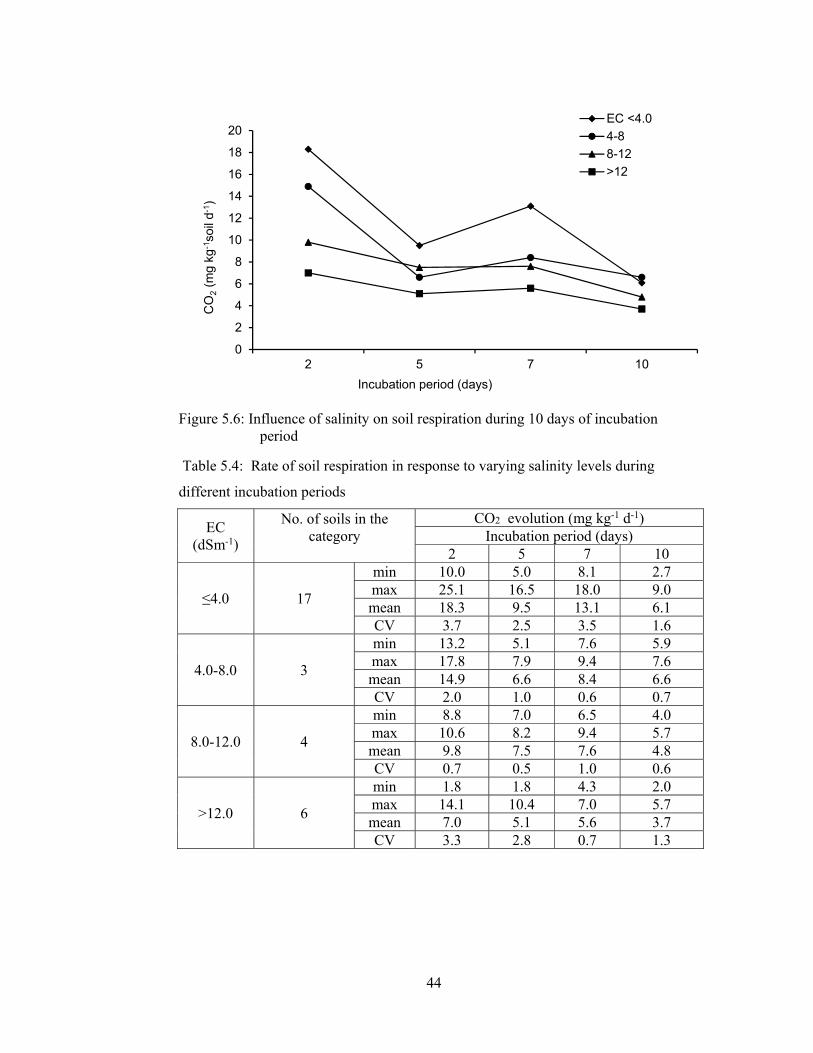
44
Figure 5.6: Influence of salinity on soil respiration during 10 days of incubation period
Table 5.4: Rate of soil respiration in response to varying salinity levels during
different incubation periods
EC (dSm-1)
No. of soils in the category
CO2 evolution (mg kg-1 d-1) Incubation period (days)
2 5 7 10
≤4.0 17
min 10.0 5.0 8.1 2.7 max 25.1 16.5 18.0 9.0 mean 18.3 9.5 13.1 6.1 CV 3.7 2.5 3.5 1.6
4.0-8.0 3
min 13.2 5.1 7.6 5.9 max 17.8 7.9 9.4 7.6 mean 14.9 6.6 8.4 6.6 CV 2.0 1.0 0.6 0.7
8.0-12.0 4
min 8.8 7.0 6.5 4.0 max 10.6 8.2 9.4 5.7 mean 9.8 7.5 7.6 4.8 CV 0.7 0.5 1.0 0.6
>12.0 6
min 1.8 1.8 4.3 2.0 max 14.1 10.4 7.0 5.7 mean 7.0 5.1 5.6 3.7 CV 3.3 2.8 0.7 1.3
0
2
4
6
8
10
12
14
16
18
20
2 5 7 10
CO
2(m
g k
g-1
soil
d-1
)
Incubation period (days)
EC <4.0
4-8
8-12
>12
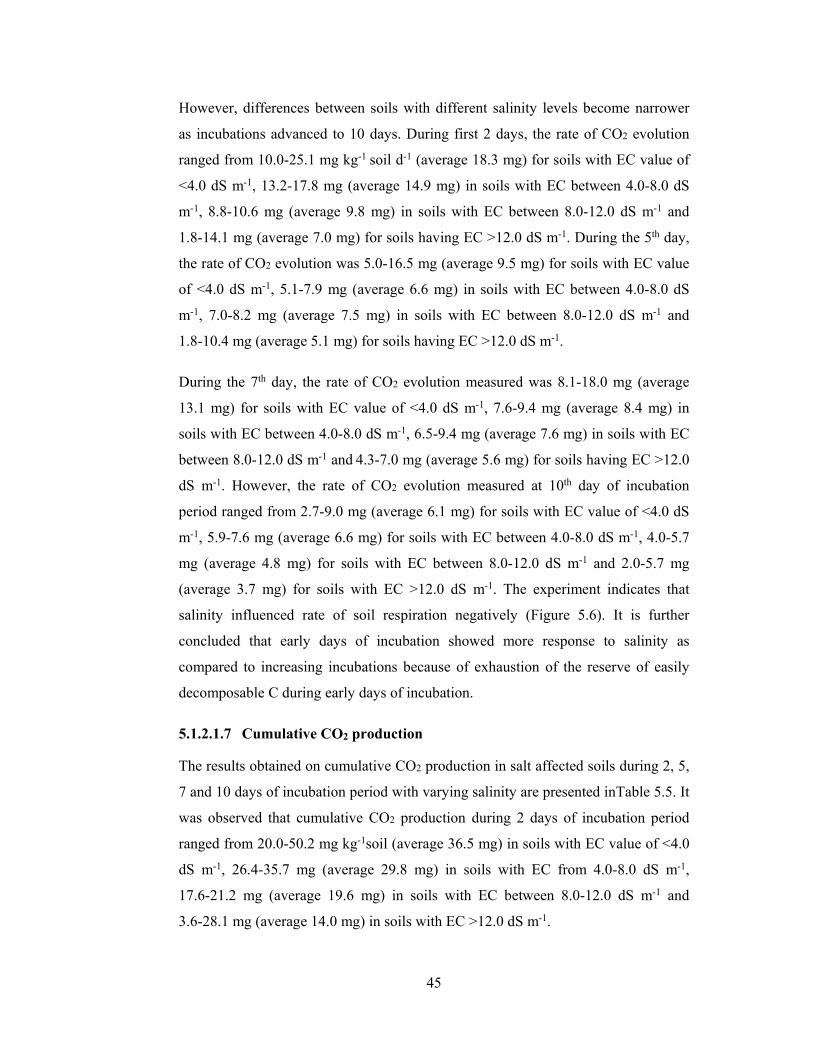
45
However, differences between soils with different salinity levels become narrower
as incubations advanced to 10 days. During first 2 days, the rate of CO2 evolution
ranged from 10.0-25.1 mg kg-1 soil d-1 (average 18.3 mg) for soils with EC value of
<4.0 dS m-1, 13.2-17.8 mg (average 14.9 mg) in soils with EC between 4.0-8.0 dS
m-1, 8.8-10.6 mg (average 9.8 mg) in soils with EC between 8.0-12.0 dS m-1 and
1.8-14.1 mg (average 7.0 mg) for soils having EC >12.0 dS m-1. During the 5th day,
the rate of CO2 evolution was 5.0-16.5 mg (average 9.5 mg) for soils with EC value
of <4.0 dS m-1, 5.1-7.9 mg (average 6.6 mg) in soils with EC between 4.0-8.0 dS
m-1, 7.0-8.2 mg (average 7.5 mg) in soils with EC between 8.0-12.0 dS m-1 and
1.8-10.4 mg (average 5.1 mg) for soils having EC >12.0 dS m-1.
During the 7th day, the rate of CO2 evolution measured was 8.1-18.0 mg (average
13.1 mg) for soils with EC value of <4.0 dS m-1, 7.6-9.4 mg (average 8.4 mg) in
soils with EC between 4.0-8.0 dS m-1, 6.5-9.4 mg (average 7.6 mg) in soils with EC
between 8.0-12.0 dS m-1 and 4.3-7.0 mg (average 5.6 mg) for soils having EC >12.0
dS m-1. However, the rate of CO2 evolution measured at 10th day of incubation
period ranged from 2.7-9.0 mg (average 6.1 mg) for soils with EC value of <4.0 dS
m-1, 5.9-7.6 mg (average 6.6 mg) for soils with EC between 4.0-8.0 dS m-1, 4.0-5.7
mg (average 4.8 mg) for soils with EC between 8.0-12.0 dS m-1 and 2.0-5.7 mg
(average 3.7 mg) for soils with EC >12.0 dS m-1. The experiment indicates that
salinity influenced rate of soil respiration negatively (Figure 5.6). It is further
concluded that early days of incubation showed more response to salinity as
compared to increasing incubations because of exhaustion of the reserve of easily
decomposable C during early days of incubation.
5.1.2.1.7 Cumulative CO2 production
The results obtained on cumulative CO2 production in salt affected soils during 2, 5,
7 and 10 days of incubation period with varying salinity are presented inTable 5.5. It
was observed that cumulative CO2 production during 2 days of incubation period
ranged from 20.0-50.2 mg kg-1soil (average 36.5 mg) in soils with EC value of <4.0
dS m-1, 26.4-35.7 mg (average 29.8 mg) in soils with EC from 4.0-8.0 dS m-1,
17.6-21.2 mg (average 19.6 mg) in soils with EC between 8.0-12.0 dS m-1 and
3.6-28.1 mg (average 14.0 mg) in soils with EC >12.0 dS m-1.
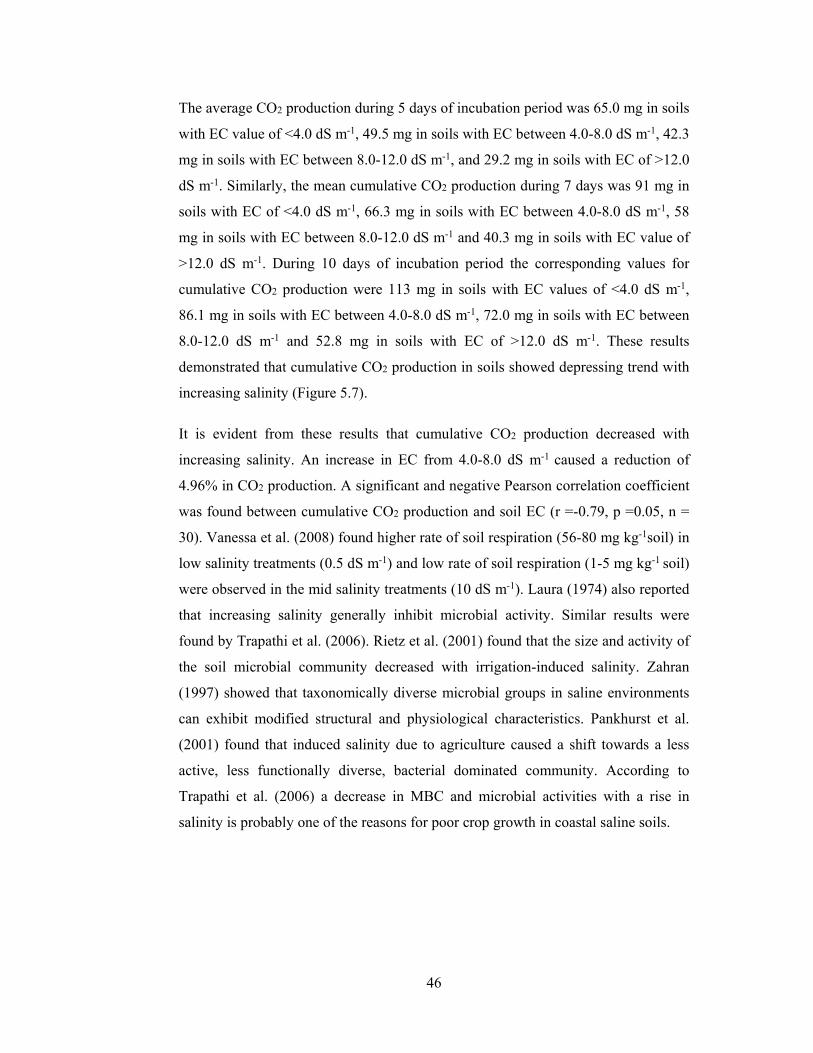
46
The average CO2 production during 5 days of incubation period was 65.0 mg in soils
with EC value of <4.0 dS m-1, 49.5 mg in soils with EC between 4.0-8.0 dS m-1, 42.3
mg in soils with EC between 8.0-12.0 dS m-1, and 29.2 mg in soils with EC of >12.0
dS m-1. Similarly, the mean cumulative CO2 production during 7 days was 91 mg in
soils with EC of <4.0 dS m-1, 66.3 mg in soils with EC between 4.0-8.0 dS m-1, 58
mg in soils with EC between 8.0-12.0 dS m-1 and 40.3 mg in soils with EC value of
>12.0 dS m-1. During 10 days of incubation period the corresponding values for
cumulative CO2 production were 113 mg in soils with EC values of <4.0 dS m-1,
86.1 mg in soils with EC between 4.0-8.0 dS m-1, 72.0 mg in soils with EC between
8.0-12.0 dS m-1 and 52.8 mg in soils with EC of >12.0 dS m-1. These results
demonstrated that cumulative CO2 production in soils showed depressing trend with
increasing salinity (Figure 5.7).
It is evident from these results that cumulative CO2 production decreased with
increasing salinity. An increase in EC from 4.0-8.0 dS m-1 caused a reduction of
4.96% in CO2 production. A significant and negative Pearson correlation coefficient
was found between cumulative CO2 production and soil EC (r =-0.79, p =0.05, n =
30). Vanessa et al. (2008) found higher rate of soil respiration (56-80 mg kg-1soil) in
low salinity treatments (0.5 dS m-1) and low rate of soil respiration (1-5 mg kg-1 soil)
were observed in the mid salinity treatments (10 dS m-1). Laura (1974) also reported
that increasing salinity generally inhibit microbial activity. Similar results were
found by Trapathi et al. (2006). Rietz et al. (2001) found that the size and activity of
the soil microbial community decreased with irrigation-induced salinity. Zahran
(1997) showed that taxonomically diverse microbial groups in saline environments
can exhibit modified structural and physiological characteristics. Pankhurst et al.
(2001) found that induced salinity due to agriculture caused a shift towards a less
active, less functionally diverse, bacterial dominated community. According to
Trapathi et al. (2006) a decrease in MBC and microbial activities with a rise in
salinity is probably one of the reasons for poor crop growth in coastal saline soils.
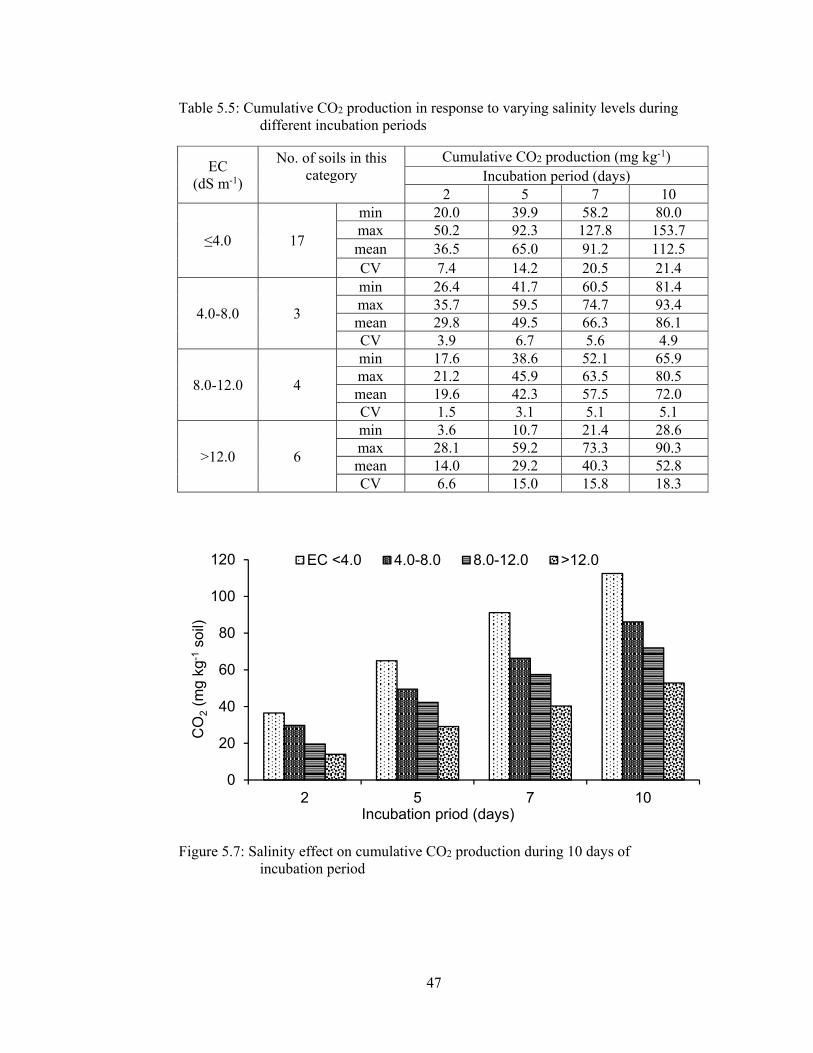
47
Table 5.5: Cumulative CO2 production in response to varying salinity levels during different incubation periods
EC (dS m-1)
No. of soils in this category
Cumulative CO2 production (mg kg-1) Incubation period (days)
2 5 7 10
≤4.0 17
min 20.0 39.9 58.2 80.0 max 50.2 92.3 127.8 153.7 mean 36.5 65.0 91.2 112.5 CV 7.4 14.2 20.5 21.4
4.0-8.0 3
min 26.4 41.7 60.5 81.4 max 35.7 59.5 74.7 93.4 mean 29.8 49.5 66.3 86.1 CV 3.9 6.7 5.6 4.9
8.0-12.0 4
min 17.6 38.6 52.1 65.9max 21.2 45.9 63.5 80.5 mean 19.6 42.3 57.5 72.0 CV 1.5 3.1 5.1 5.1
>12.0 6
min 3.6 10.7 21.4 28.6 max 28.1 59.2 73.3 90.3 mean 14.0 29.2 40.3 52.8 CV 6.6 15.0 15.8 18.3
Figure 5.7: Salinity effect on cumulative CO2 production during 10 days of incubation period
0
20
40
60
80
100
120
2 5 7 10
CO
2(m
g k
g-1so
il)
Incubation priod (days)
EC <4.0 4.0-8.0 8.0-12.0 >12.0

48
5.1.2.2 Effect of soil pH on microbial indices
5.1.2.2.1 Microbial biomass carbon
The effect of soil pH on soil microbial properties (i.e. microbial biomass C,
microbial biomass N, microbial biomass C/N, N mineralization and nitrification)
was also assessed. We found that most of the microbial indices were affected
negatively with soil pH (Table 5.6). The results showed that the soil microbial
biomass C ranged from 313 to 516 mg kg-1 with pH <8.0, 215-462 mg with pH
8.0-9.0, 147-385 mg with pH 9.0-10.0 and 172-302 mg with pH >10.0. The
reduction in soil microbial biomass C with increasing soil pH can be observed in
Figure 5.8.
The data suggest that soil MBC was influenced negatively with increasing soil pH.
With increase in soil pH form 8 to 9, caused 10% reduction in MBC and with further
increase in pH from 9 to 10, caused 20% reduction in soil MBC. A linear negative
Pearson correlation coefficient was found for MBC with soil pH (r =-0.62, p =0.05,
n =30). Kaur et al. (2008) found that soil pH significantly influenced MBC (r
= -0.42**, n = 60) but explained only 56 and 44% variation in MBC in the
un-amended and organically amended sodic water treatment respectively. Wardle
(1992) concluded that in influencing the size of the microbial biomass soil pH is as
important as soil carbon and nitrogen concentrations.
5.1.2.2.2 Microbial biomass nitrogen
The results showed that the soil microbial biomass N was negatively influenced with
increasing soil pH (Table 5.6). Soil microbial biomass N ranged from 62.4-170.2 mg
kg-1 in soil with pH <8.0, 19.0-160.9 mg in soil with pH 8.0-9.0, 21.2-86.4 mg in soil
with pH 9.0-10.0 and 22.6-51.5 mg in soil with pH >10.0. A depressive trend of
microbial biomass N with increasing soil pH was represented in Figure 5.9.
In arid and semi-arid climate, salinity is usually combined with high soil pH due to
CaCO3 enrichment in the upper most soil layer. High pH value is principally the
results of nodules of carbonates being present in the soil profile (Yuan et al., 2007).
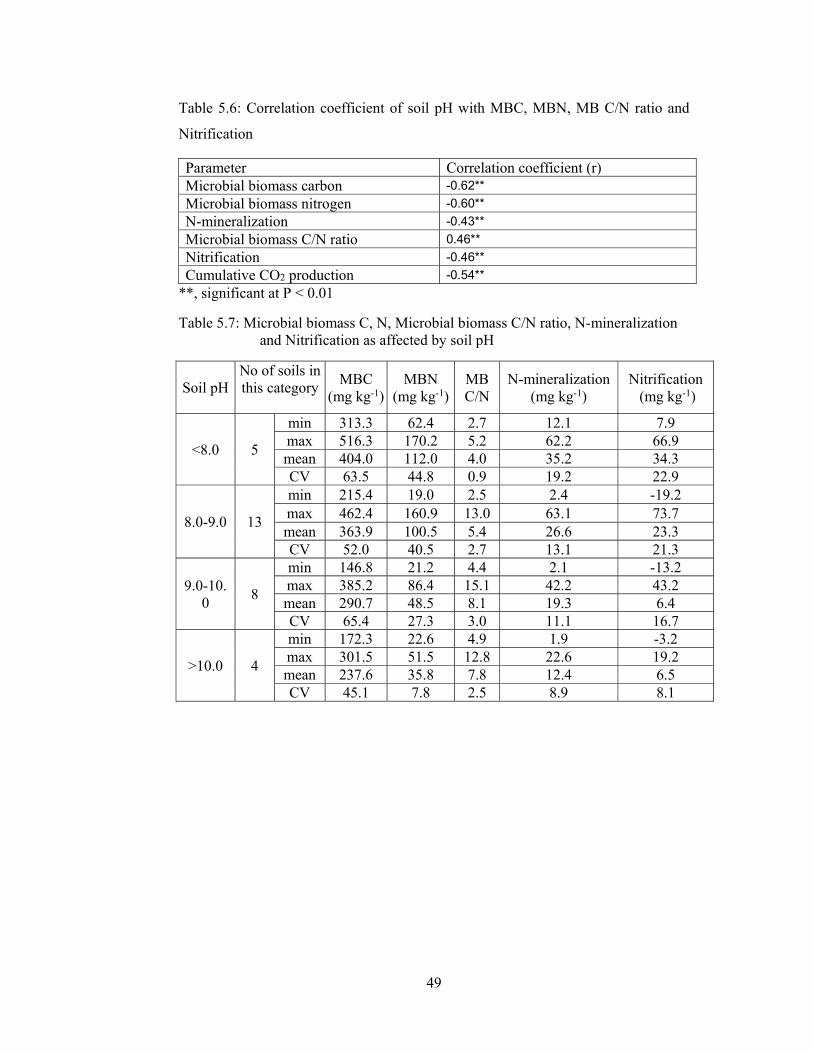
49
Table 5.6: Correlation coefficient of soil pH with MBC, MBN, MB C/N ratio and
Nitrification
Parameter Correlation coefficient (r) Microbial biomass carbon -0.62**
Microbial biomass nitrogen -0.60**
N-mineralization -0.43**
Microbial biomass C/N ratio 0.46**
Nitrification -0.46**
Cumulative CO2 production -0.54**
**, significant at P < 0.01
Table 5.7: Microbial biomass C, N, Microbial biomass C/N ratio, N-mineralization and Nitrification as affected by soil pH
Soil pH No of soils in this category
MBC (mg kg-1)
MBN (mg kg-1)
MB C/N
N-mineralization (mg kg-1)
Nitrification (mg kg-1)
<8.0 5
min 313.3 62.4 2.7 12.1 7.9 max 516.3 170.2 5.2 62.2 66.9 mean 404.0 112.0 4.0 35.2 34.3 CV 63.5 44.8 0.9 19.2 22.9
8.0-9.0 13
min 215.4 19.0 2.5 2.4 -19.2 max 462.4 160.9 13.0 63.1 73.7 mean 363.9 100.5 5.4 26.6 23.3 CV 52.0 40.5 2.7 13.1 21.3
9.0-10.0
8
min 146.8 21.2 4.4 2.1 -13.2 max 385.2 86.4 15.1 42.2 43.2 mean 290.7 48.5 8.1 19.3 6.4 CV 65.4 27.3 3.0 11.1 16.7
>10.0 4
min 172.3 22.6 4.9 1.9 -3.2 max 301.5 51.5 12.8 22.6 19.2 mean 237.6 35.8 7.8 12.4 6.5 CV 45.1 7.8 2.5 8.9 8.1
50
It is evident from our data that soil MBN decreased with increasing soil pH. Soil
MBN showed a significantly negative Pearson correlation coefficient with soil pH (r
=-0.60, P = 0.05, n = 30). Similar negative relationship of microbial biomass with
soil pH was also reported by Kaur et al. (2008). The effect of pH on soil microbial
biomass and activities were also observed by Rietz and Haynes (2003) and Sardinha
et al. (2003). Zahran (1997) reported that high soil pH may inhibit microbial growth.
Soil pH controls biotic factors such as the biomass composition of fungi and bacteria
(Fierer and Jackson, 2006) both in forest (Frostegard et al., 1993; Blagodatskaya and
Anderson, 1998; Baath and Anderson, 2003) and agricultural soils (Arao, 1999;
Bardgett et al., 2001).
5.1.2.2.3 Microbial biomass C/N ratio
The results showed that microbial biomass C/N ratio was the only microbial
property which showed positive response to increasing soil pH (Table 5.6). We
found that microbial biomass C/N ratio ranged from 2.7-5.2 with soil pH < 8.0,
2.5-13.0 with soil pH between 8.0-9.0, 4.4-15.1 with soil pH between 9.0-10.0 and
4.9-12.8 with pH > 10.0. The trend of microbial biomass C/N ratio in response to
increasing soil pH is represented in Figure 5.10.
Microbial biomass C/N ratio increased with increasing soil pH. A significantly
positive Pearson correlation coefficient between soil pH and soil microbial biomass
C/N ratio was found (r =0.46, p =0.05, n=30). Wolters and Joergensen (1991)
reported that microbial biomass C/N ratio tends to be higher with low soil pH. The
availability of biologically toxic aluminum is increased in low soil pH (Flis et al.,
1993). Wardle (1992) concluded that the size of the microbial biomass is influenced
with soil pH similar to that of C and N concentrations. It can also affect organic C
solubility (Andersson et al., 2000), which in turn, affects microbial community
structure (Blagodatskaya and Anderson, 1998; Zelles, 1999; Marstorp et al., 2000)
and brought significant changes in soil microbial activity (Baath and Anderson,
2003).
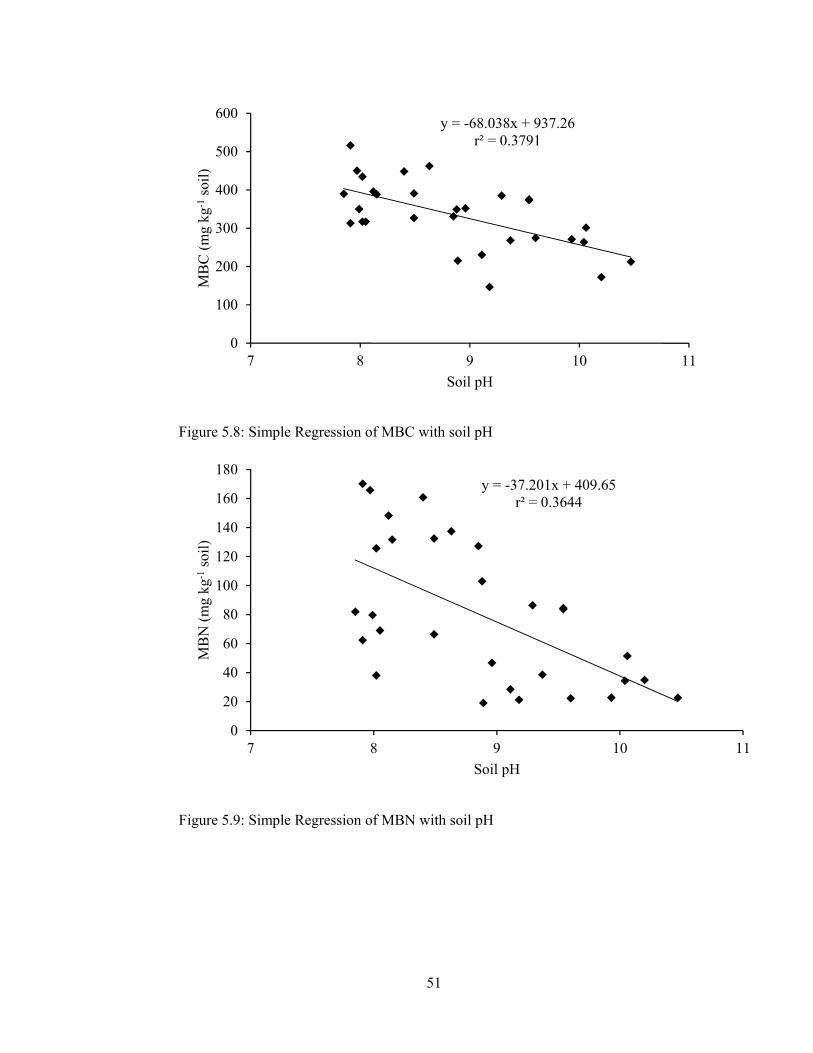
51
Figure 5.8: Simple Regression of MBC with soil pH
Figure 5.9: Simple Regression of MBN with soil pH
y = -68.038x + 937.26r² = 0.3791
0
100
200
300
400
500
600
7 8 9 10 11
MB
C (
mg
kg-1
soil
)
Soil pH
y = -37.201x + 409.65r² = 0.3644
0
20
40
60
80
100
120
140
160
180
7 8 9 10 11
MB
N (
mg
kg-1
soil
)
Soil pH
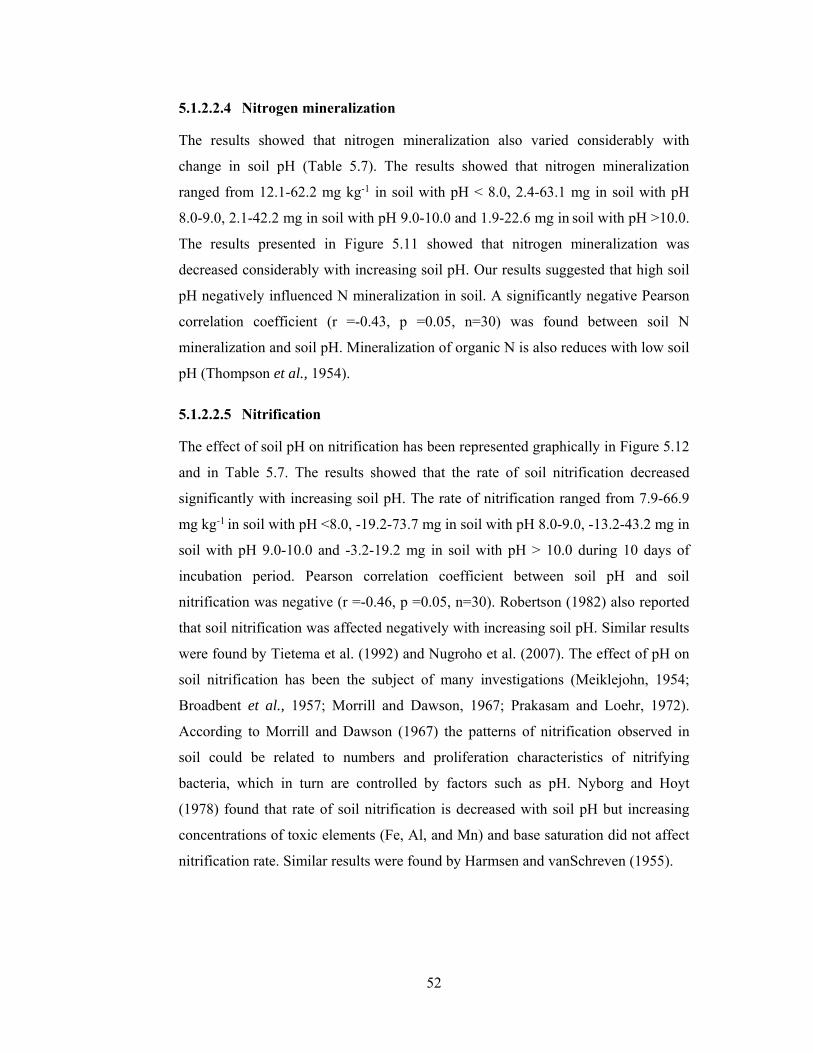
52
5.1.2.2.4 Nitrogen mineralization
The results showed that nitrogen mineralization also varied considerably with
change in soil pH (Table 5.7). The results showed that nitrogen mineralization
ranged from 12.1-62.2 mg kg-1 in soil with pH < 8.0, 2.4-63.1 mg in soil with pH
8.0-9.0, 2.1-42.2 mg in soil with pH 9.0-10.0 and 1.9-22.6 mg in soil with pH >10.0.
The results presented in Figure 5.11 showed that nitrogen mineralization was
decreased considerably with increasing soil pH. Our results suggested that high soil
pH negatively influenced N mineralization in soil. A significantly negative Pearson
correlation coefficient (r =-0.43, p =0.05, n=30) was found between soil N
mineralization and soil pH. Mineralization of organic N is also reduces with low soil
pH (Thompson et al., 1954).
5.1.2.2.5 Nitrification
The effect of soil pH on nitrification has been represented graphically in Figure 5.12
and in Table 5.7. The results showed that the rate of soil nitrification decreased
significantly with increasing soil pH. The rate of nitrification ranged from 7.9-66.9
mg kg-1 in soil with pH <8.0, -19.2-73.7 mg in soil with pH 8.0-9.0, -13.2-43.2 mg in
soil with pH 9.0-10.0 and -3.2-19.2 mg in soil with pH > 10.0 during 10 days of
incubation period. Pearson correlation coefficient between soil pH and soil
nitrification was negative (r =-0.46, p =0.05, n=30). Robertson (1982) also reported
that soil nitrification was affected negatively with increasing soil pH. Similar results
were found by Tietema et al. (1992) and Nugroho et al. (2007). The effect of pH on
soil nitrification has been the subject of many investigations (Meiklejohn, 1954;
Broadbent et al., 1957; Morrill and Dawson, 1967; Prakasam and Loehr, 1972).
According to Morrill and Dawson (1967) the patterns of nitrification observed in
soil could be related to numbers and proliferation characteristics of nitrifying
bacteria, which in turn are controlled by factors such as pH. Nyborg and Hoyt
(1978) found that rate of soil nitrification is decreased with soil pH but increasing
concentrations of toxic elements (Fe, Al, and Mn) and base saturation did not affect
nitrification rate. Similar results were found by Harmsen and vanSchreven (1955).
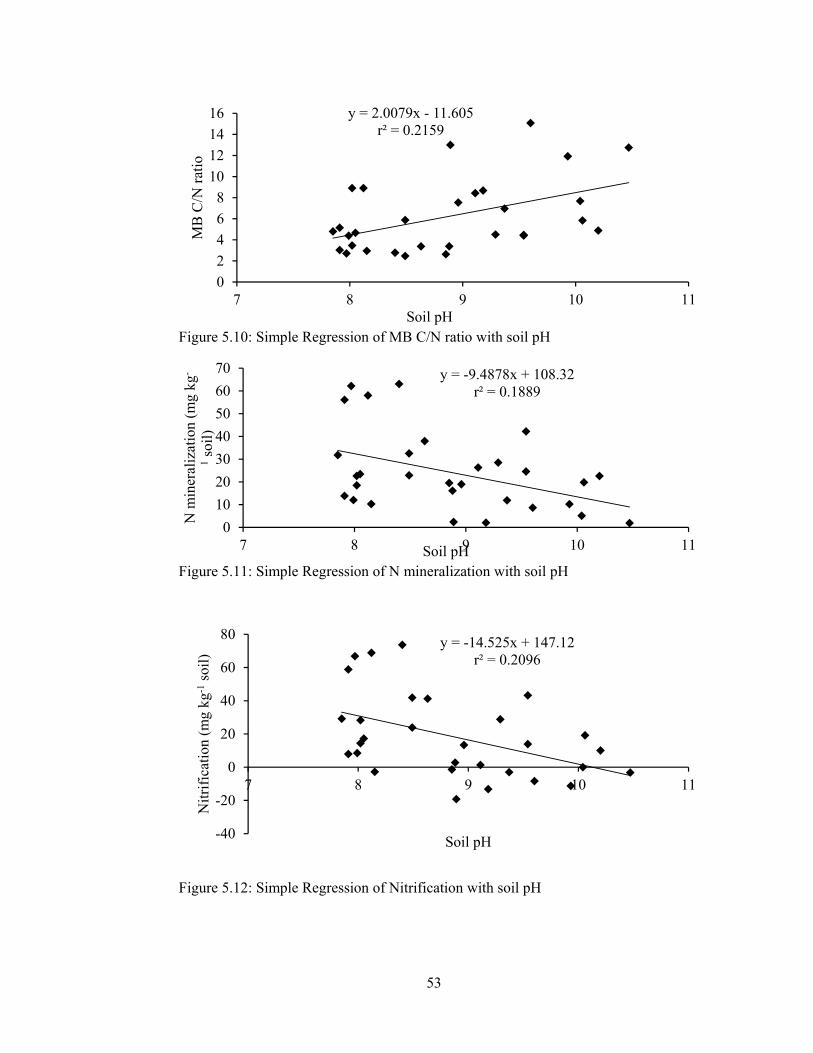
53
Figure 5.10: Simple Regression of MB C/N ratio with soil pH
Figure 5.11: Simple Regression of N mineralization with soil pH
Figure 5.12: Simple Regression of Nitrification with soil pH
y = 2.0079x - 11.605r² = 0.2159
0
2
4
6
8
10
12
14
16
7 8 9 10 11
MB
C/N
rat
io
Soil pH
y = -9.4878x + 108.32r² = 0.1889
0
10
20
30
40
50
60
70
7 8 9 10 11
N m
iner
aliz
atio
n (m
g kg
-
1so
il)
Soil pH
y = -14.525x + 147.12r² = 0.2096
-40
-20
0
20
40
60
80
7 8 9 10 11
Nit
rifi
cati
on (
mg
kg-1
soil
)
Soil pH

54
5.1.2.2.6 Rate of soil respiration
The results obtained on the influence of soil pH on basal soil respiration (BSR)
measured at 2, 5, 7 and 10th days of incubation period are presented in Table 5.8.
The results showed that BSR decreased with increasing soil pH. The rate of CO2
evolution measured at 2nd day of incubation period ranged from 16.0-25.1 mg kg-1
soil d-1 (average 19.4 mg) for soil with pH value <8.0, 2.3-25.1 mg (average 16.2
mg) for soil with pH between 8.0-9.0, 1.8-24.1 mg (average 11.5 mg) for soil with
pH between 9.0-10.0 and 7.0-10.6 mg (average 9.0 mg) for soil with pH >10.0.
The rate of CO2 evolution measured at 5th day of incubation period ranged from
5.6-16.5 mg kg-1 soil d-1 (average 10.2 mg) for soil with pH <8.0, 2.5-12.3 mg
(average 8.3 mg) for soil with pH value between 8.0-9.0, 2.4-10.4 mg (average 7.5
mg) for soil with pH between 9.0-10.0 and 1.8-8.2 mg (average 5.5 mg) for soil with
pH >10.0. The rate of CO2 evolution measured at 7th day of incubation period
ranged from 7.6-17.7 mg kg-1 soil d-1 (average 12.5 mg) for soil with pH <8.0,
5.9-18.0 mg (average 12.3 mg) for soil with pH between 8.0-9.0, 5.4-14.9 mg
(average 8.3 mg) for soil with pH between 9.0-10.0 and 4.3-7.8 mg (average 5.9 mg)
for soil with pH >10.0. The rate of CO2 evolution measured at 10th day of incubation
period ranged from 3.4-9.0 mg kg-1 soil d-1 (average 6.3 mg) for soil with pH <8.0,
2.7-8.3 mg (average 5.9 mg) for soil with pH between 8.0-9.0, 2.4-8.3 mg (average
5.4 mg) for soil with pH between 9.0-10.0 and 2.0-4.4 mg (average 3.5 mg) for soil
with pH >10.0. Our results suggested that basal soil respiration decreased with
increasing soil pH as evident in Figure 5.13.
5.1.2.2.7 Cumulative CO2 production
The results obtained on cumulative CO2 production measured at 2, 5, 7 and 10 days
of incubation, in response to soil pH are presented in Table 5.9. The results showed
that cumulative basal soil respiration also decreased with increasing soil pH.
Cumulative CO2 production during 2 days of incubation period ranged from
32.0-50.2 mg kg-1 (average 38.8 mg) for soil with pH <8.0, 4.7-50.2 mg (average
32.5 mg) for soil with pH 8.0-9.0, 6-48 mg (average 23.0 mg) for soil with pH
9.0-10.0 and 14.0-21.2 mg (average 18.0 mg) for soil with pH >10.0.
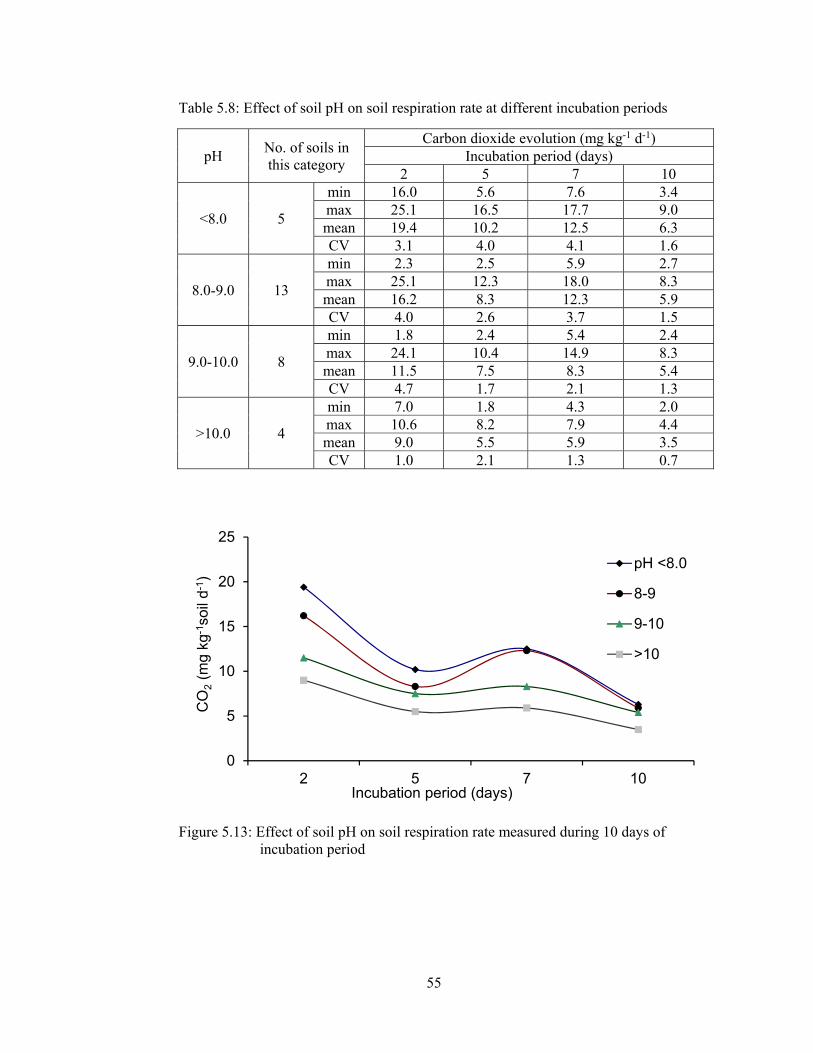
55
Table 5.8: Effect of soil pH on soil respiration rate at different incubation periods
pH No. of soils in this category
Carbon dioxide evolution (mg kg-1 d-1) Incubation period (days)
2 5 7 10
<8.0 5
min 16.0 5.6 7.6 3.4 max 25.1 16.5 17.7 9.0 mean 19.4 10.2 12.5 6.3 CV 3.1 4.0 4.1 1.6
8.0-9.0 13
min 2.3 2.5 5.9 2.7 max 25.1 12.3 18.0 8.3 mean 16.2 8.3 12.3 5.9 CV 4.0 2.6 3.7 1.5
9.0-10.0 8
min 1.8 2.4 5.4 2.4 max 24.1 10.4 14.9 8.3 mean 11.5 7.5 8.3 5.4 CV 4.7 1.7 2.1 1.3
>10.0 4
min 7.0 1.8 4.3 2.0 max 10.6 8.2 7.9 4.4 mean 9.0 5.5 5.9 3.5 CV 1.0 2.1 1.3 0.7
Figure 5.13: Effect of soil pH on soil respiration rate measured during 10 days of incubation period
0
5
10
15
20
25
2 5 7 10
CO
2(m
g kg
-1so
il d-1
)
Incubation period (days)
pH <8.0
8-9
9-10
>10
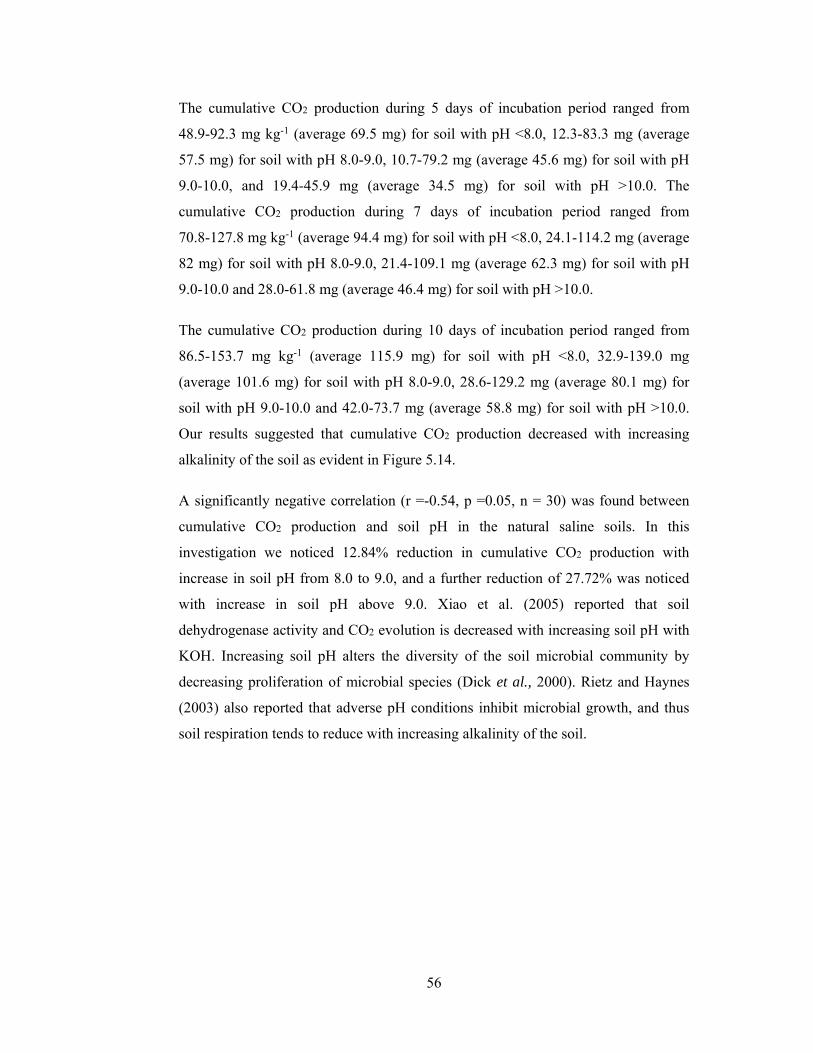
56
The cumulative CO2 production during 5 days of incubation period ranged from
48.9-92.3 mg kg-1 (average 69.5 mg) for soil with pH <8.0, 12.3-83.3 mg (average
57.5 mg) for soil with pH 8.0-9.0, 10.7-79.2 mg (average 45.6 mg) for soil with pH
9.0-10.0, and 19.4-45.9 mg (average 34.5 mg) for soil with pH >10.0. The
cumulative CO2 production during 7 days of incubation period ranged from
70.8-127.8 mg kg-1 (average 94.4 mg) for soil with pH <8.0, 24.1-114.2 mg (average
82 mg) for soil with pH 8.0-9.0, 21.4-109.1 mg (average 62.3 mg) for soil with pH
9.0-10.0 and 28.0-61.8 mg (average 46.4 mg) for soil with pH >10.0.
The cumulative CO2 production during 10 days of incubation period ranged from
86.5-153.7 mg kg-1 (average 115.9 mg) for soil with pH <8.0, 32.9-139.0 mg
(average 101.6 mg) for soil with pH 8.0-9.0, 28.6-129.2 mg (average 80.1 mg) for
soil with pH 9.0-10.0 and 42.0-73.7 mg (average 58.8 mg) for soil with pH >10.0.
Our results suggested that cumulative CO2 production decreased with increasing
alkalinity of the soil as evident in Figure 5.14.
A significantly negative correlation (r =-0.54, p =0.05, n = 30) was found between
cumulative CO2 production and soil pH in the natural saline soils. In this
investigation we noticed 12.84% reduction in cumulative CO2 production with
increase in soil pH from 8.0 to 9.0, and a further reduction of 27.72% was noticed
with increase in soil pH above 9.0. Xiao et al. (2005) reported that soil
dehydrogenase activity and CO2 evolution is decreased with increasing soil pH with
KOH. Increasing soil pH alters the diversity of the soil microbial community by
decreasing proliferation of microbial species (Dick et al., 2000). Rietz and Haynes
(2003) also reported that adverse pH conditions inhibit microbial growth, and thus
soil respiration tends to reduce with increasing alkalinity of the soil.
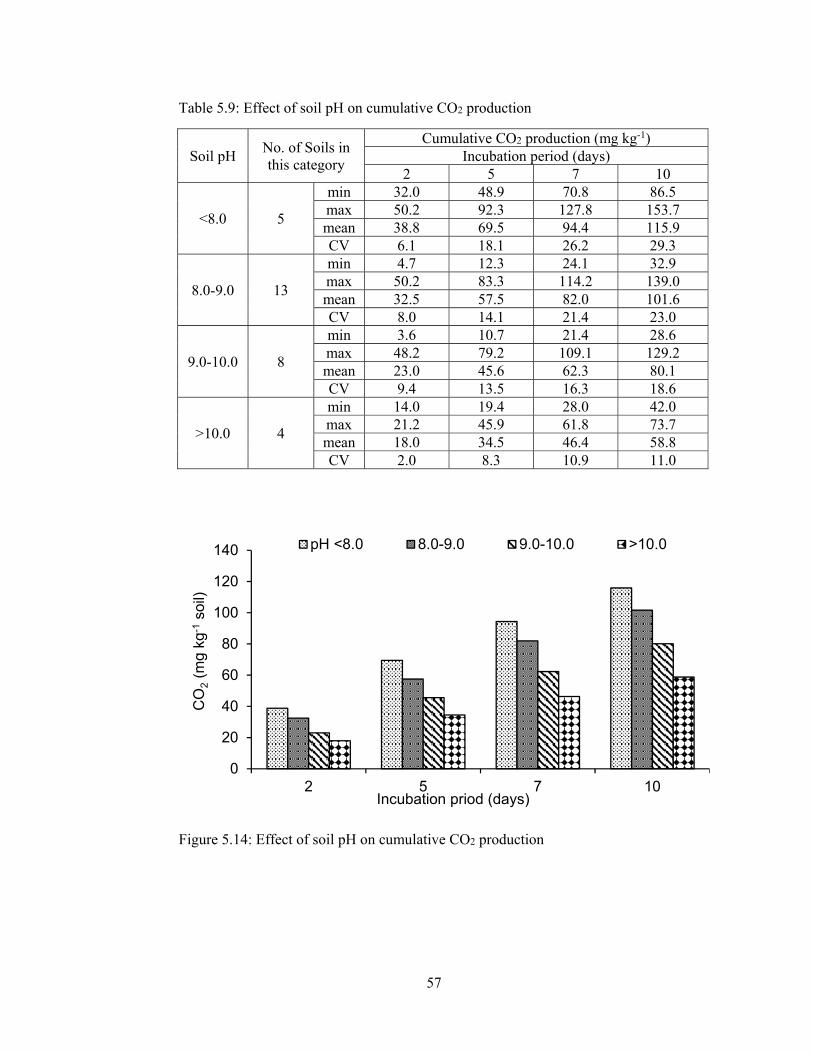
57
Table 5.9: Effect of soil pH on cumulative CO2 production
Soil pH No. of Soils in this category
Cumulative CO2 production (mg kg-1) Incubation period (days)
2 5 7 10
<8.0 5
min 32.0 48.9 70.8 86.5 max 50.2 92.3 127.8 153.7 mean 38.8 69.5 94.4 115.9 CV 6.1 18.1 26.2 29.3
8.0-9.0 13
min 4.7 12.3 24.1 32.9 max 50.2 83.3 114.2 139.0 mean 32.5 57.5 82.0 101.6 CV 8.0 14.1 21.4 23.0
9.0-10.0 8
min 3.6 10.7 21.4 28.6 max 48.2 79.2 109.1 129.2 mean 23.0 45.6 62.3 80.1 CV 9.4 13.5 16.3 18.6
>10.0 4
min 14.0 19.4 28.0 42.0 max 21.2 45.9 61.8 73.7 mean 18.0 34.5 46.4 58.8 CV 2.0 8.3 10.9 11.0
Figure 5.14: Effect of soil pH on cumulative CO2 production
0
20
40
60
80
100
120
140
2 5 7 10
CO
2(m
g kg
-1so
il)
Incubation priod (days)
pH <8.0 8.0-9.0 9.0-10.0 >10.0
58
5.1.2.3 Correlation coefficient of microbial indices with sodium
The correlation coefficient of soil microbial indices (microbial biomass C, microbial
biomass N, microbial biomass C/N ratio, N mineralization and nitrification) with
sodium are presented (Table 5.10) and discussed below:
The soil microbial biomass C (MBC) ranged from 327-516 mg kg-1 (average 434 mg
kg-1) for soil with Na content of <10.0 meq L-1 to 147-231 mg (average 191 mg)
with Na content of > 200 meq L-1. A significantly negative Pearson correlation
coefficient was found (r =-0.87, p =0.05, n = 30) between MBC and soluble Na.
These results suggested that MBC in soils decreased with increasing concentration
of soluble Na. The microbial biomass N (MBN) exhibited similar trend as that of
microbial biomass C with respect to soluble Na. The soil with lowest concentration
of soluble Na contained greatest amount of MBN and vice versa (Table 5.11, Figure
5.16). The result showed that soil MBN ranged from 125.7-170.2 mg kg-1 (average
149 mg) for soil with Na content of <10.0 meq L-1 to 19.0-34.9 mg (average 26 mg)
with soluble Na content of >200 meq L-1. A significantly negative Pearson
correlation coefficient (r =-0.71, p =0.05, n = 30) was found for soil MBN and
soluble Na. The results for C/N ratio in soil microbial biomass with respect to
different concentration of Na in soil are presented in Table 5.11 and Figure 5.17.
The results showed that C/N ratio of microbial biomass became wider with
increasing concentration of soluble Na. The C/N ratio of MB ranged from 2.5-8.9
(average 3.8) for soil with soluble Na content of <10.0 meq L-1 to 4.9-13 (average
8.8) for soil with soluble Na content of >200 meq L-1. A Significantly positive
Pearson correlation coefficient (r =0.52, p =0.05, n=30) was observed between C/N
ratio of microbial biomass and Na concentration in soil. The results further showed
that nitrogen mineralization decreased considerably with increasing concentrations
of soluble Na (Table 5.11 and Figure 5.18). Nitrogen mineralization in soil ranged
from 22.6-63.1 mg kg-1 (average 47.5 mg) for soil with soluble Na content of <10
meq L-1 to 2.1-26.3 mg (average 13.4 mg) with soluble Na content of >200 meq L-1.
Significantly negative Pearson correlation coefficient (r = -0.51, p =0.05, n=30) was
found for soil N mineralization and soil Na content. Our results further showed that
soil nitrification was significantly lowered in soils with increasing concentration of
soluble Na (Table 5.11).
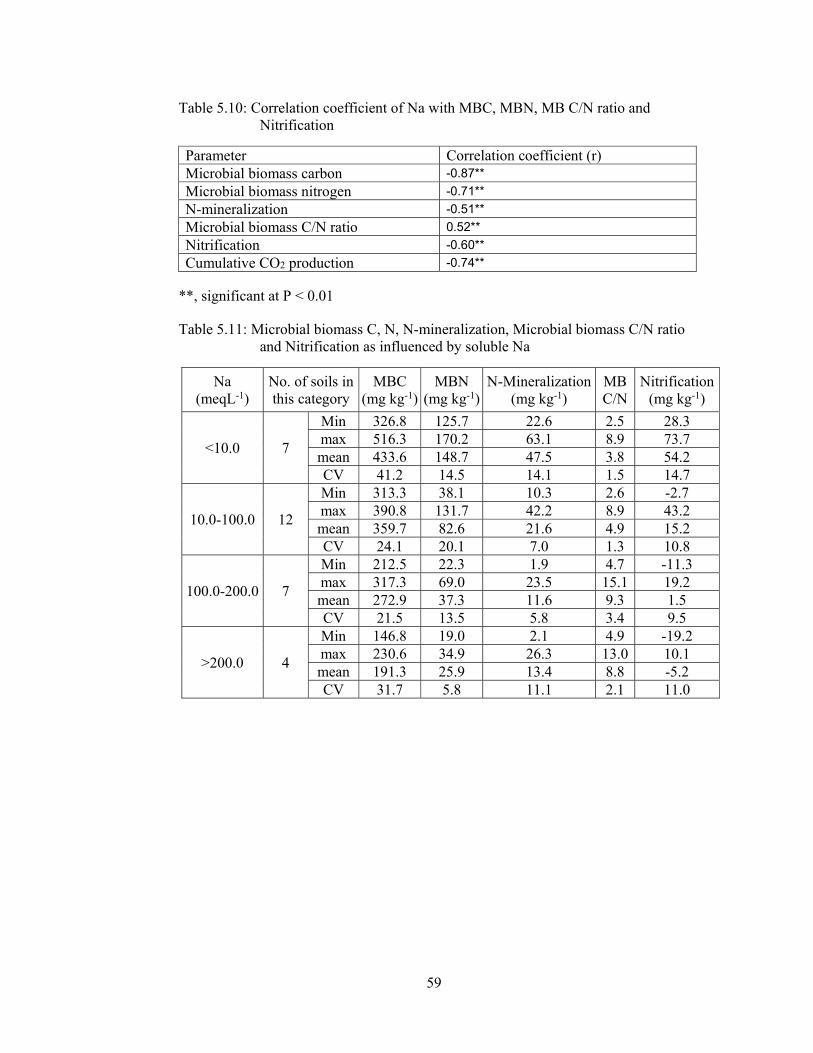
59
Table 5.10: Correlation coefficient of Na with MBC, MBN, MB C/N ratio and Nitrification
Parameter Correlation coefficient (r) Microbial biomass carbon -0.87**
Microbial biomass nitrogen -0.71**
N-mineralization -0.51**
Microbial biomass C/N ratio 0.52**
Nitrification -0.60**
Cumulative CO2 production -0.74**
**, significant at P < 0.01
Table 5.11: Microbial biomass C, N, N-mineralization, Microbial biomass C/N ratio and Nitrification as influenced by soluble Na
Na (meqL-1)
No. of soils in this category
MBC (mg kg-1)
MBN (mg kg-1)
N-Mineralization (mg kg-1)
MB C/N
Nitrification (mg kg-1)
<10.0 7
Min 326.8 125.7 22.6 2.5 28.3 max 516.3 170.2 63.1 8.9 73.7 mean 433.6 148.7 47.5 3.8 54.2 CV 41.2 14.5 14.1 1.5 14.7
10.0-100.0 12
Min 313.3 38.1 10.3 2.6 -2.7 max 390.8 131.7 42.2 8.9 43.2 mean 359.7 82.6 21.6 4.9 15.2 CV 24.1 20.1 7.0 1.3 10.8
100.0-200.0 7
Min 212.5 22.3 1.9 4.7 -11.3 max 317.3 69.0 23.5 15.1 19.2 mean 272.9 37.3 11.6 9.3 1.5 CV 21.5 13.5 5.8 3.4 9.5
>200.0 4
Min 146.8 19.0 2.1 4.9 -19.2 max 230.6 34.9 26.3 13.0 10.1 mean 191.3 25.9 13.4 8.8 -5.2 CV 31.7 5.8 11.1 2.1 11.0

60
Figure 5.15: Simple Regression of Na content on MBC
Figure 5.16: Polynomial Regression of Na content on MBN
y = -0.7415x + 401.47r² = 0.7646
0
100
200
300
400
500
600
0 50 100 150 200 250 300 350 400
MB
C (
mg
kg-1
soil
)
Na (meq L-1)
0
20
40
60
80
100
120
140
160
180
0 50 100 150 200 250 300 350 400 450
Biom
ass-
N (m
g kg
-1)
Soluble Na (meq l-1)
r2=0.68
Data Y = 129.014 - 0.894937*X + 0.00171649*X^2
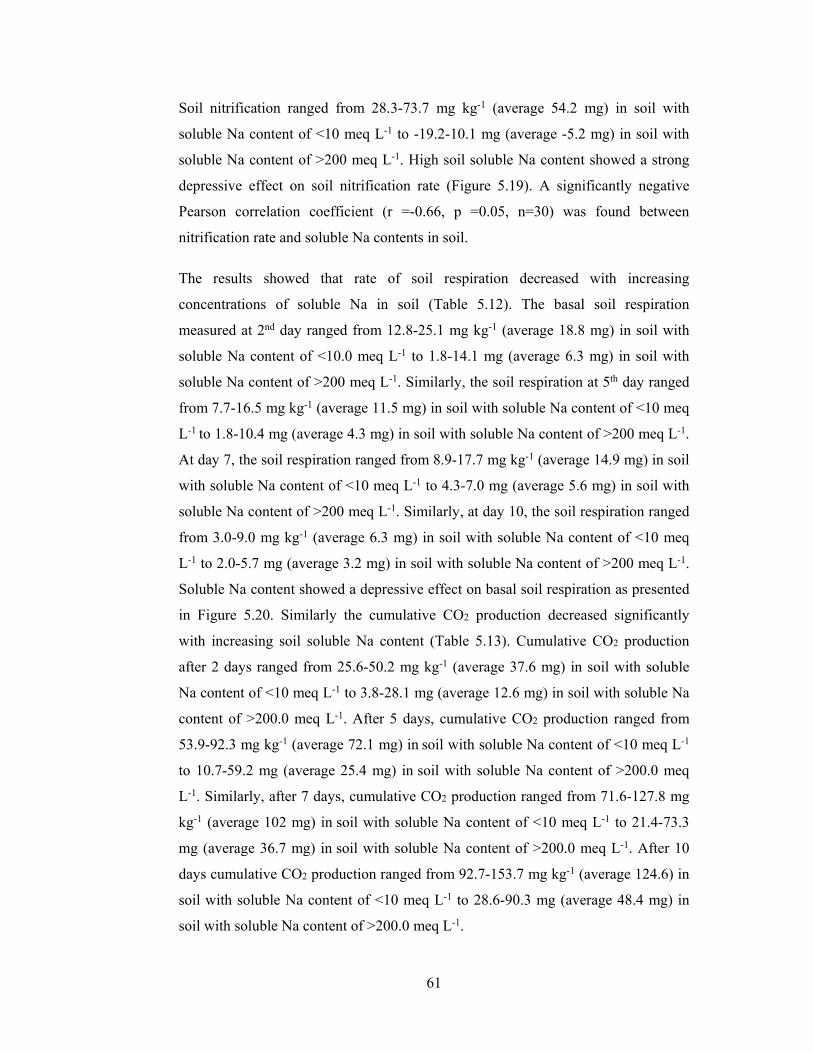
61
Soil nitrification ranged from 28.3-73.7 mg kg-1 (average 54.2 mg) in soil with
soluble Na content of <10 meq L-1 to -19.2-10.1 mg (average -5.2 mg) in soil with
soluble Na content of >200 meq L-1. High soil soluble Na content showed a strong
depressive effect on soil nitrification rate (Figure 5.19). A significantly negative
Pearson correlation coefficient (r =-0.66, p =0.05, n=30) was found between
nitrification rate and soluble Na contents in soil.
The results showed that rate of soil respiration decreased with increasing
concentrations of soluble Na in soil (Table 5.12). The basal soil respiration
measured at 2nd day ranged from 12.8-25.1 mg kg-1 (average 18.8 mg) in soil with
soluble Na content of <10.0 meq L-1 to 1.8-14.1 mg (average 6.3 mg) in soil with
soluble Na content of >200 meq L-1. Similarly, the soil respiration at 5th day ranged
from 7.7-16.5 mg kg-1 (average 11.5 mg) in soil with soluble Na content of <10 meq
L-1 to 1.8-10.4 mg (average 4.3 mg) in soil with soluble Na content of >200 meq L-1.
At day 7, the soil respiration ranged from 8.9-17.7 mg kg-1 (average 14.9 mg) in soil
with soluble Na content of <10 meq L-1 to 4.3-7.0 mg (average 5.6 mg) in soil with
soluble Na content of >200 meq L-1. Similarly, at day 10, the soil respiration ranged
from 3.0-9.0 mg kg-1 (average 6.3 mg) in soil with soluble Na content of <10 meq
L-1 to 2.0-5.7 mg (average 3.2 mg) in soil with soluble Na content of >200 meq L-1.
Soluble Na content showed a depressive effect on basal soil respiration as presented
in Figure 5.20. Similarly the cumulative CO2 production decreased significantly
with increasing soil soluble Na content (Table 5.13). Cumulative CO2 production
after 2 days ranged from 25.6-50.2 mg kg-1 (average 37.6 mg) in soil with soluble
Na content of <10 meq L-1 to 3.8-28.1 mg (average 12.6 mg) in soil with soluble Na
content of >200.0 meq L-1. After 5 days, cumulative CO2 production ranged from
53.9-92.3 mg kg-1 (average 72.1 mg) in soil with soluble Na content of <10 meq L-1
to 10.7-59.2 mg (average 25.4 mg) in soil with soluble Na content of >200.0 meq
L-1. Similarly, after 7 days, cumulative CO2 production ranged from 71.6-127.8 mg
kg-1 (average 102 mg) in soil with soluble Na content of <10 meq L-1 to 21.4-73.3
mg (average 36.7 mg) in soil with soluble Na content of >200.0 meq L-1. After 10
days cumulative CO2 production ranged from 92.7-153.7 mg kg-1 (average 124.6) in
soil with soluble Na content of <10 meq L-1 to 28.6-90.3 mg (average 48.4 mg) in
soil with soluble Na content of >200.0 meq L-1.
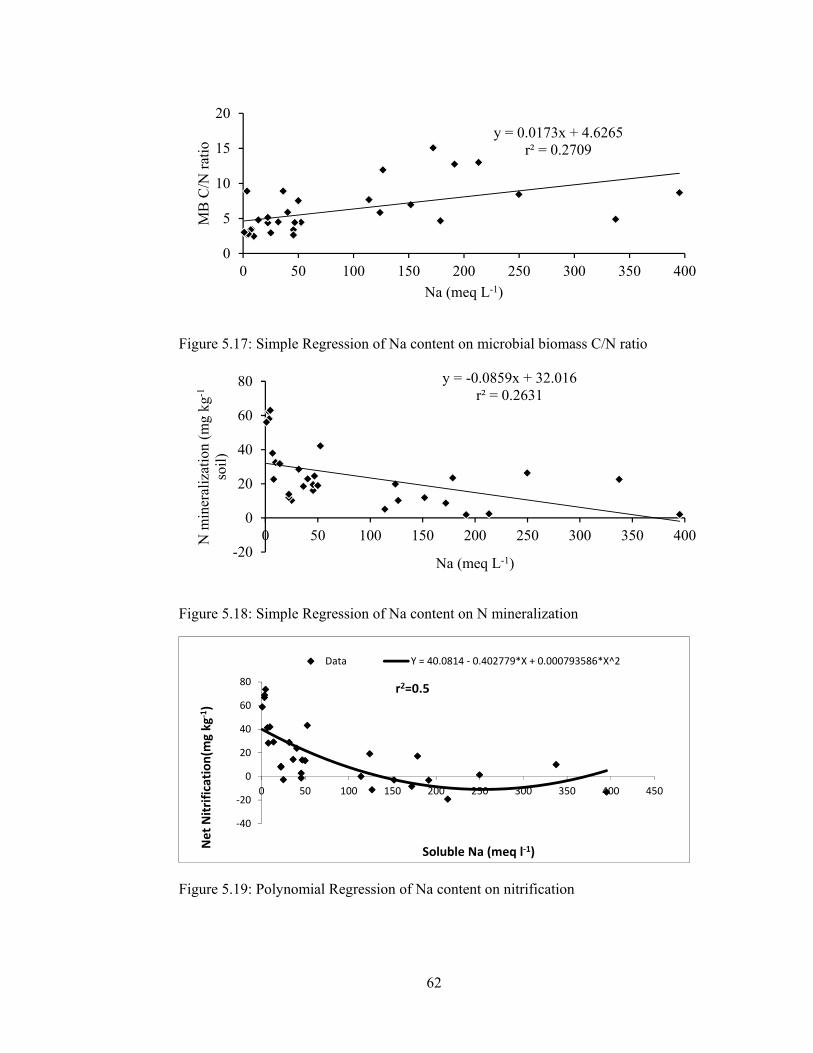
62
Figure 5.17: Simple Regression of Na content on microbial biomass C/N ratio
Figure 5.18: Simple Regression of Na content on N mineralization
Figure 5.19: Polynomial Regression of Na content on nitrification
y = 0.0173x + 4.6265r² = 0.2709
0
5
10
15
20
0 50 100 150 200 250 300 350 400
MB
C/N
rat
io
Na (meq L-1)
y = -0.0859x + 32.016r² = 0.2631
-20
0
20
40
60
80
0 50 100 150 200 250 300 350 400N m
iner
aliz
atio
n (m
g kg
-1
soil
)
Na (meq L-1)
-40
-20
0
20
40
60
80
0 50 100 150 200 250 300 350 400 450
Net
Nitr
ifica
tion(
mg
kg-1
)
Soluble Na (meq l-1)
r2=0.5
Data Y = 40.0814 - 0.402779*X + 0.000793586*X^2
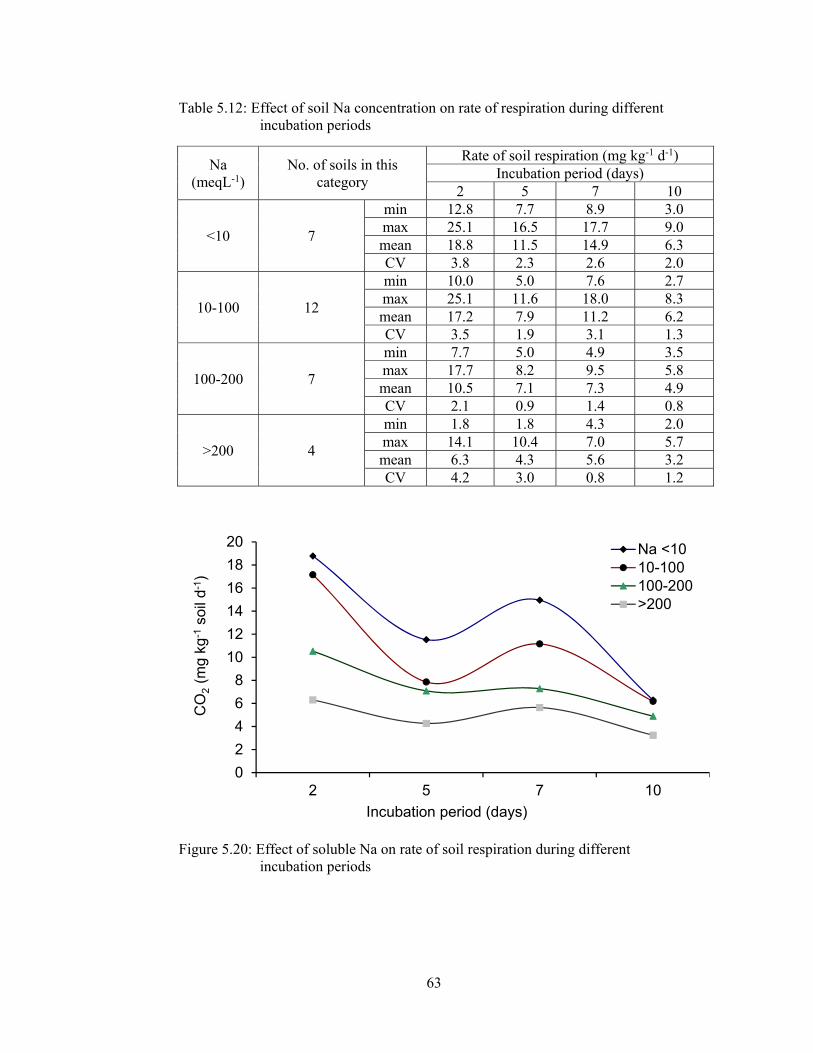
63
Table 5.12: Effect of soil Na concentration on rate of respiration during different incubation periods
Na (meqL-1)
No. of soils in this category
Rate of soil respiration (mg kg-1 d-1) Incubation period (days)
2 5 7 10
<10 7
min 12.8 7.7 8.9 3.0 max 25.1 16.5 17.7 9.0 mean 18.8 11.5 14.9 6.3 CV 3.8 2.3 2.6 2.0
10-100 12
min 10.0 5.0 7.6 2.7 max 25.1 11.6 18.0 8.3 mean 17.2 7.9 11.2 6.2 CV 3.5 1.9 3.1 1.3
100-200 7
min 7.7 5.0 4.9 3.5 max 17.7 8.2 9.5 5.8 mean 10.5 7.1 7.3 4.9 CV 2.1 0.9 1.4 0.8
>200 4
min 1.8 1.8 4.3 2.0 max 14.1 10.4 7.0 5.7 mean 6.3 4.3 5.6 3.2 CV 4.2 3.0 0.8 1.2
Figure 5.20: Effect of soluble Na on rate of soil respiration during different incubation periods
0
2
4
6
8
10
12
14
16
18
20
2 5 7 10
CO
2(m
g kg
-1so
il d-1
)
Incubation period (days)
Na <1010-100100-200>200
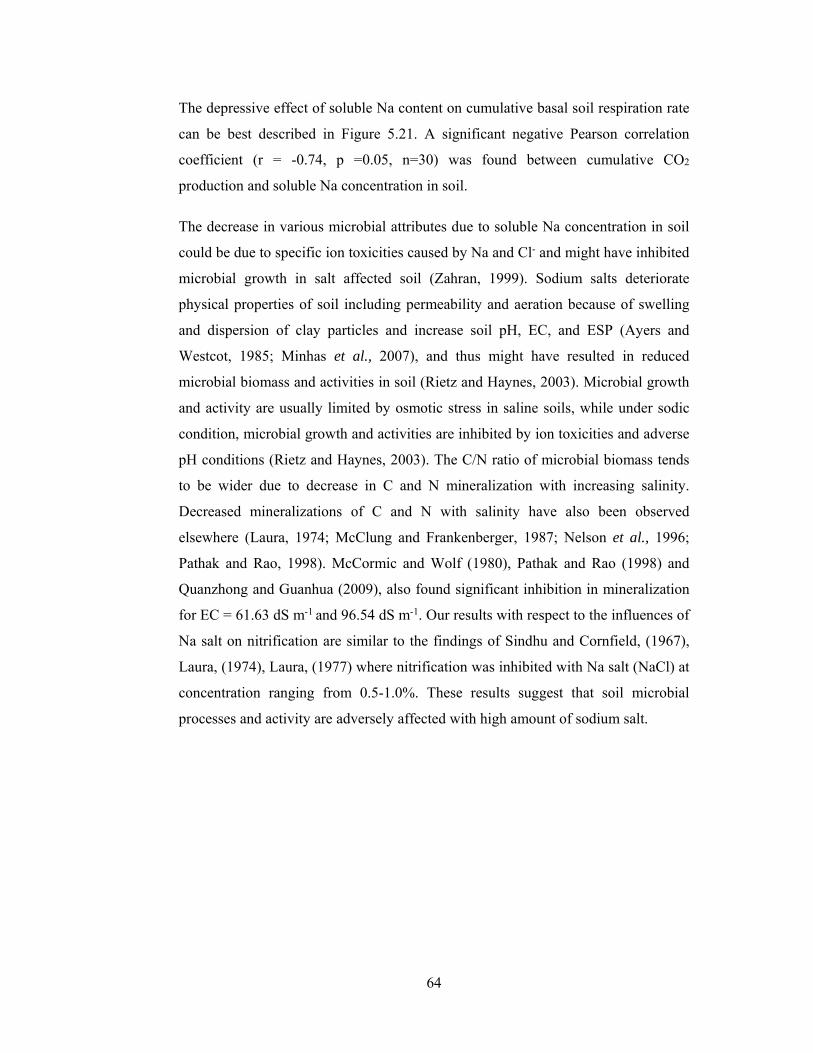
64
The depressive effect of soluble Na content on cumulative basal soil respiration rate
can be best described in Figure 5.21. A significant negative Pearson correlation
coefficient (r = -0.74, p =0.05, n=30) was found between cumulative CO2
production and soluble Na concentration in soil.
The decrease in various microbial attributes due to soluble Na concentration in soil
could be due to specific ion toxicities caused by Na and Cl- and might have inhibited
microbial growth in salt affected soil (Zahran, 1999). Sodium salts deteriorate
physical properties of soil including permeability and aeration because of swelling
and dispersion of clay particles and increase soil pH, EC, and ESP (Ayers and
Westcot, 1985; Minhas et al., 2007), and thus might have resulted in reduced
microbial biomass and activities in soil (Rietz and Haynes, 2003). Microbial growth
and activity are usually limited by osmotic stress in saline soils, while under sodic
condition, microbial growth and activities are inhibited by ion toxicities and adverse
pH conditions (Rietz and Haynes, 2003). The C/N ratio of microbial biomass tends
to be wider due to decrease in C and N mineralization with increasing salinity.
Decreased mineralizations of C and N with salinity have also been observed
elsewhere (Laura, 1974; McClung and Frankenberger, 1987; Nelson et al., 1996;
Pathak and Rao, 1998). McCormic and Wolf (1980), Pathak and Rao (1998) and
Quanzhong and Guanhua (2009), also found significant inhibition in mineralization
for EC = 61.63 dS m-1 and 96.54 dS m-1. Our results with respect to the influences of
Na salt on nitrification are similar to the findings of Sindhu and Cornfield, (1967),
Laura, (1974), Laura, (1977) where nitrification was inhibited with Na salt (NaCl) at
concentration ranging from 0.5-1.0%. These results suggest that soil microbial
processes and activity are adversely affected with high amount of sodium salt.

65
Table 5.13: Cumulative CO2 production as influenced by soluble Na content
Na (meq L-1)
No. of soils in this category
Cumulative CO2 production (mg kg-1) Incubation period (days)
2 5 7 10
<10 7
min 25.6 53.9 71.6 92.7 max 50.2 92.3 127.8 153.7 mean 37.6 72.1 102.0 124.6 CV 7.6 14.6 17.8 20.1
10-100 12
min 20.0 39.9 58.2 80.0 max 50.2 83.1 112.6 135.1 mean 34.3 57.9 80.2 100.8 CV 6.9 12.7 18.7 18.7
100-200 7
min 15.5 33.2 43.1 53.6 max 35.5 53.8 72.7 90.0 mean 21.1 42.3 56.9 71.6 CV 4.2 5.0 7.8 8.5
>200 4
min 3.6 10.7 21.4 28.6 max 28.1 59.2 73.3 90.3 mean 12.6 25.4 36.7 48.4 CV 8.5 16.9 18.3 20.9
Figure 5.21: Soluble Na effect on cumulative CO2 production during different incubation periods
0
50
100
150
2 5 7 10
CO
2(m
g kg
-1so
il)
Incubation priod (days)
Na <10 10-100 100-200 >200
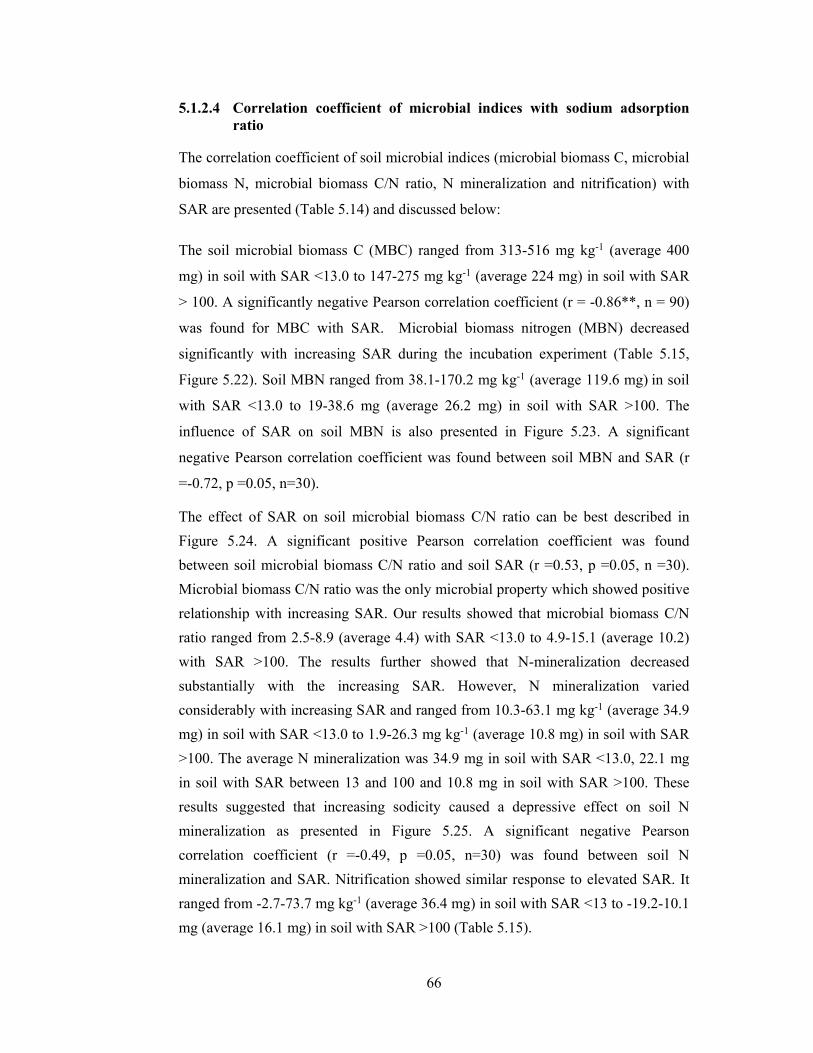
66
5.1.2.4 Correlation coefficient of microbial indices with sodium adsorption ratio
The correlation coefficient of soil microbial indices (microbial biomass C, microbial
biomass N, microbial biomass C/N ratio, N mineralization and nitrification) with
SAR are presented (Table 5.14) and discussed below:
The soil microbial biomass C (MBC) ranged from 313-516 mg kg-1 (average 400
mg) in soil with SAR <13.0 to 147-275 mg kg-1 (average 224 mg) in soil with SAR
> 100. A significantly negative Pearson correlation coefficient (r = -0.86**, n = 90)
was found for MBC with SAR. Microbial biomass nitrogen (MBN) decreased
significantly with increasing SAR during the incubation experiment (Table 5.15,
Figure 5.22). Soil MBN ranged from 38.1-170.2 mg kg-1 (average 119.6 mg) in soil
with SAR <13.0 to 19-38.6 mg (average 26.2 mg) in soil with SAR >100. The
influence of SAR on soil MBN is also presented in Figure 5.23. A significant
negative Pearson correlation coefficient was found between soil MBN and SAR (r
=-0.72, p =0.05, n=30).
The effect of SAR on soil microbial biomass C/N ratio can be best described in
Figure 5.24. A significant positive Pearson correlation coefficient was found
between soil microbial biomass C/N ratio and soil SAR (r =0.53, p =0.05, n =30).
Microbial biomass C/N ratio was the only microbial property which showed positive
relationship with increasing SAR. Our results showed that microbial biomass C/N
ratio ranged from 2.5-8.9 (average 4.4) with SAR <13.0 to 4.9-15.1 (average 10.2)
with SAR >100. The results further showed that N-mineralization decreased
substantially with the increasing SAR. However, N mineralization varied
considerably with increasing SAR and ranged from 10.3-63.1 mg kg-1 (average 34.9
mg) in soil with SAR <13.0 to 1.9-26.3 mg kg-1 (average 10.8 mg) in soil with SAR
>100. The average N mineralization was 34.9 mg in soil with SAR <13.0, 22.1 mg
in soil with SAR between 13 and 100 and 10.8 mg in soil with SAR >100. These
results suggested that increasing sodicity caused a depressive effect on soil N
mineralization as presented in Figure 5.25. A significant negative Pearson
correlation coefficient (r =-0.49, p =0.05, n=30) was found between soil N
mineralization and SAR. Nitrification showed similar response to elevated SAR. It
ranged from -2.7-73.7 mg kg-1 (average 36.4 mg) in soil with SAR <13 to -19.2-10.1
mg (average 16.1 mg) in soil with SAR >100 (Table 5.15).

67
Table 5.14: Correlation coefficient of SAR with MBC, MBN, MB C/N ratio and Nitrification
Parameter Correlation coefficient (r) Microbial biomass carbon -0.86**
Microbial biomass nitrogen -0.72**
N-mineralization -0.49**
Microbial biomass C/N ratio 0.53**
Nitrification -0.58**
Cumulative CO2 production -0.73**
**, significant at P < 0.01
Table 5.15: Microbial biomass C, N, Microbial biomass C/N ratio, N-Mineralization and Nitrification as influenced by soil SAR
SAR No. of soils in this category
MBC (mg kg-1)
MBN (mg kg-1)
N-mineralization (mg kg-1)
MB C/N
Nitrification (mg kg-1)
≤13 12
min 313.3 38.1 10.3 2.5 -2.7 max 516.3 170.2 63.1 8.9 73.7 mean 399.5 119.6 34.9 4.4 36.4 CV 52.4 36.0 17.1 1.7 22.2
13-100 10
min 263.9 34.3 5.2 2.6 -1.3 max 390.8 127.2 42.2 7.7 43.2 mean 344.0 75.3 22.1 5.1 16.1 CV 32.4 21.7 6.2 1.3 10.4
>100 8
min 146.8 19.0 1.9 4.9 -19.2 max 274.9 38.6 26.3 15.1 10.1 mean 224.0 26.2 10.8 10.2 -5.8 CV 37.3 5.8 7.1 3.0 7.2
Figure 5.22: Simple Regression of MBC with soil SAR
y = -1.1785x + 400.57r² = 0.734
0
100
200
300
400
500
600
0 40 80 120 160 200 240 280
MB
C (
mg
kg-1
soil
)
SAR

68
Figure 5.23: Polynomial Regression of MBN with soil SAR
Figure 5.24: Polynomial Regression of MB C/N ratio with soil SAR
0
20
40
60
80
100
120
140
160
180
0 50 100 150 200 250 300
MBN
(mg
kg-1
)
SAR
r2=0.66
Data Y = 126.096 - 1.30321*X + 0.00380645*X^2
0
2
4
6
8
10
12
14
16
0 50 100 150 200 250 300
Mic
robi
al B
iom
ass C
/N
SAR
r2=0.5
Data Y = 3.27647 + 0.0936225*X - 0.000329681*X^2
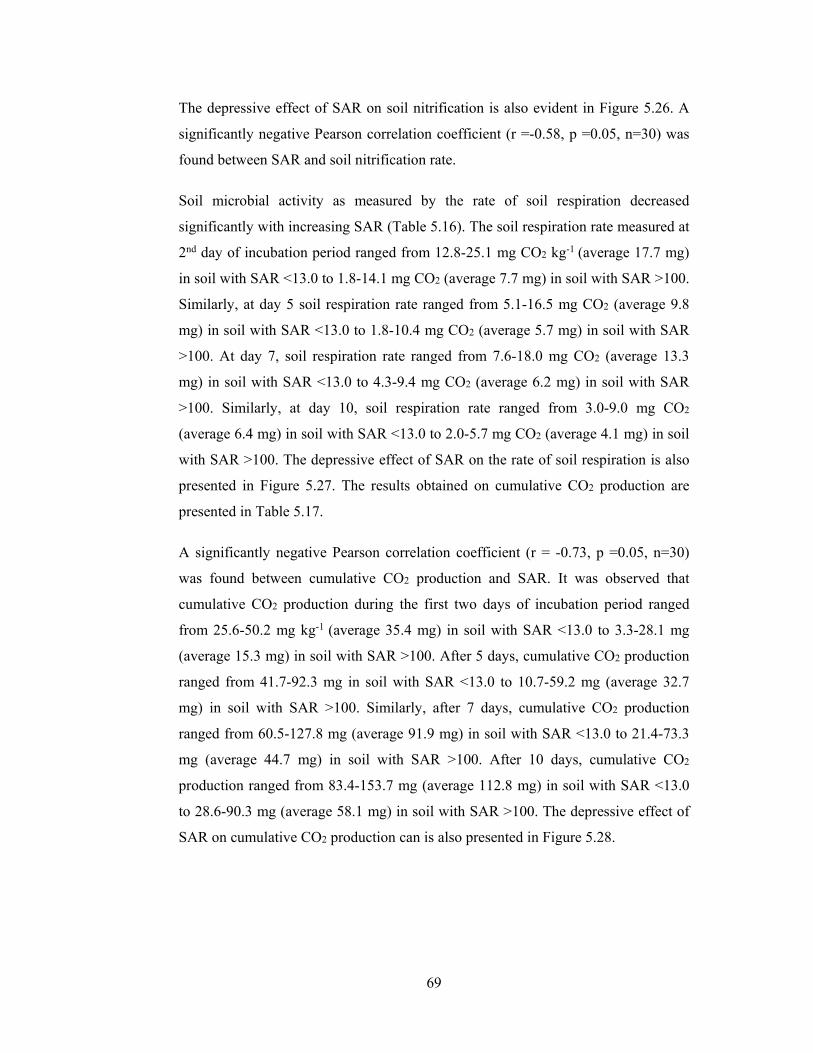
69
The depressive effect of SAR on soil nitrification is also evident in Figure 5.26. A
significantly negative Pearson correlation coefficient (r =-0.58, p =0.05, n=30) was
found between SAR and soil nitrification rate.
Soil microbial activity as measured by the rate of soil respiration decreased
significantly with increasing SAR (Table 5.16). The soil respiration rate measured at
2nd day of incubation period ranged from 12.8-25.1 mg CO2 kg-1 (average 17.7 mg)
in soil with SAR <13.0 to 1.8-14.1 mg CO2 (average 7.7 mg) in soil with SAR >100.
Similarly, at day 5 soil respiration rate ranged from 5.1-16.5 mg CO2 (average 9.8
mg) in soil with SAR <13.0 to 1.8-10.4 mg CO2 (average 5.7 mg) in soil with SAR
>100. At day 7, soil respiration rate ranged from 7.6-18.0 mg CO2 (average 13.3
mg) in soil with SAR <13.0 to 4.3-9.4 mg CO2 (average 6.2 mg) in soil with SAR
>100. Similarly, at day 10, soil respiration rate ranged from 3.0-9.0 mg CO2
(average 6.4 mg) in soil with SAR <13.0 to 2.0-5.7 mg CO2 (average 4.1 mg) in soil
with SAR >100. The depressive effect of SAR on the rate of soil respiration is also
presented in Figure 5.27. The results obtained on cumulative CO2 production are
presented in Table 5.17.
A significantly negative Pearson correlation coefficient (r = -0.73, p =0.05, n=30)
was found between cumulative CO2 production and SAR. It was observed that
cumulative CO2 production during the first two days of incubation period ranged
from 25.6-50.2 mg kg-1 (average 35.4 mg) in soil with SAR <13.0 to 3.3-28.1 mg
(average 15.3 mg) in soil with SAR >100. After 5 days, cumulative CO2 production
ranged from 41.7-92.3 mg in soil with SAR <13.0 to 10.7-59.2 mg (average 32.7
mg) in soil with SAR >100. Similarly, after 7 days, cumulative CO2 production
ranged from 60.5-127.8 mg (average 91.9 mg) in soil with SAR <13.0 to 21.4-73.3
mg (average 44.7 mg) in soil with SAR >100. After 10 days, cumulative CO2
production ranged from 83.4-153.7 mg (average 112.8 mg) in soil with SAR <13.0
to 28.6-90.3 mg (average 58.1 mg) in soil with SAR >100. The depressive effect of
SAR on cumulative CO2 production can is also presented in Figure 5.28.

70
Figure 5.25: Polynomial Regression of N mineralization with soil SAR
Figure 5.26: Polynomial Regression of Nitrification with soil SAR
0
10
20
30
40
50
60
70
0 50 100 150 200 250 300
Net
N-M
inira
lizat
ion
SAR
r2=0.4
Data Y = 37.2777 - 0.407004*X + 0.00137973*X^2
-40
-20
0
20
40
60
80
0 50 100 150 200 250 300
Net
Nitr
ifica
tion(
mg
kg-1
)
SAR
r2=0.51
Data Y = 39.6437 - 0.640249*X + 0.00206887*X^2

71
Table 5.16: Rate of soil respiration as affected by SAR during different incubation periods
SAR No. of soils in this
category
Rate of soil respiration (mg kg-1 d-1) Incubation period (days)
2 5 7 10
≤13 12
min 12.8 5.1 7.6 3.0 max 25.1 16.5 18.0 9.0 mean 17.7 9.8 13.3 6.4 CV 2.8 2.7 3.7 1.5
13-100 10
min 9.4 5.0 6.5 2.7 max 25.1 11.0 15.9 8.3 mean 16.2 7.8 10.3 5.6 CV 4.8 1.6 2.9 1.6
>100 8
min 1.8 1.8 4.3 2.0 max 14.1 10.4 9.4 5.7 mean 7.7 5.7 6.2 4.1 CV 3.0 2.7 1.1 1.4
Figure 5.27: Effect of SAR on soil respiration rate measured during different incubation periods
0
2
4
6
8
10
12
14
16
18
20
2 5 7 10
CO
2(m
g kg
-1so
il d-1
)
Incubation period (days)
SAR <13
13-100
>100
72
The depressive effect of SAR on soil microbial attributes has also been reported in
other studies. In a long term sodic water irrigation study, Kaur et al. (2008) found
that MBC decreased from 132.5 to 44.6 mg kg-1 soil in the upper 75 mm soil layer
and from 49.0 to 17.3 mg kg-1 soil in the 75–150 mm soil layer, and found a linear
negative relationship of MBC with SAR (r = -0.57, n = 60). Similar negative
relationship of SAR with soil microbial biomass C was also found by Rietz and
Haynes (2003). Batra et al. (1997) found lower MBC content (57 mg kg-1 soil) in a
sodic soil. Both C and N mineralization were negatively correlated with increasing
soil sodicity (Nelson et al., 1997), and caused a decrease in the amount of soil
microbial biomass (Chander et al., 1994). The lower microbial attributes in salt
affected soils could be due to reduced microbial activity caused by high salt
concentration. The lower microbial activity reduces organic matter decomposition.
The decreasing effects of salinity and sodicity on the decomposition rate were
reported elsewhere (Zahran et al., 1992; Sarig and Steinberger, 1994; Sarig et al.,
1996; Batra and Manna, 1997; Zahran, 1997; Rietz and Haynes, 2003; Sardinha et
al., 2003; Mamilov et al., 2004). Microbial biomass C to N ratio became wider with
increasing salt concentrations. This could be associated with the low mineralization
rate in high sodic soil. Nelson et al. (1997) found that plant straw mineralization
were lower in soils with high sodicity and in high clay content. Similar low
mineralization rate in high sodic soils were found by Tisdall and Oades, (1982);
Shainberg and Letely, (1984) and Nelson et al. (1996). Our results also showed that
soil nitrification was inhibited with high salt concentrations. The reduction in
nitrification in salt affected soils could be attributed to the toxic effect of high salt
concentrations. Significant inhibitions of nitrification at relatively low salt
concentration, i.e. EC of 17.15 dS m-1 were found by Quanzhong and Guanhua
(2009). Similar results were found by Westerman and Tucker, 1974; McCormick
and Wolf, 1980; Martikainen, 1985; McClung and Frankenberger, 1985;, who
reported that nitrification is more sensitive to salt than mineralization.

73
Table 5.17: Cumulative CO2 production as affected by soil SAR
SAR No. of soils in this
category
Cumulative CO2 production (mg kg-1) Incubation period (days)
2 5 7 10
≤13 12
min 25.6 41.7 60.5 83.4 max 50.2 92.3 127.8 153.7 mean 35.4 64.9 91.5 112.8 CV 5.6 13.3 19.7 21.1
13-100 10
min 18.7 39.7 52.7 65.9 max 50.2 83.1 112.6 135.1 mean 32.5 56.0 76.6 95.7 CV 9.6 13.7 19.6 20.8
>100 8
min 3.6 10.7 21.4 28.6 max 28.1 59.2 73.3 90.3 mean 15.3 32.3 44.7 58.1 CV 5.9 13.6 15.5 18.9
Figure 5.28: SAR effect on cumulative CO2 production during different incubation periods
0
50
100
150
2 5 7 10
CO
2(m
g kg
-1so
il)
Incubation period (days)
SAR <13.0
13-100
>100

74
5.1.2.5 Correlation coefficient of microbial indices with soluble salts of calcium and magnesium
The effect of soluble salts of calcium and magnesium (Ca+Mg) content on soil
microbial properties (i.e. microbial biomass C, microbial biomass N, microbial
biomass C/N, N mineralization, nitrification, rate of soil respiration and cumulative
CO2 production) is presented in Table 5.19.
The results showed that soil microbial biomass C ranged from 172-462 mg kg-1
(average 359 mg) with soluble salt (Ca+Mg) content of <4.0 meq L-1 to 147-390 mg
kg-1 (average 306 mg) with soluble salt (Ca+Mg) content of >8.0 meq L-1. The effect
of increasing Ca+Mg content on soil microbial biomass C is also described in Figure
5.29. Pearson correlation coefficient revealed that soluble salts of Ca and Mg had no
significant effect (r = -0.04, n = 30) on microbial biomass C. The response of soil
microbial N to Ca+Mg was almost the same as of SMC. It ranged from 23-166 mg
kg-1 (average 98 mg) with Ca+Mg content of <4.0 meq L-1 to 21-82 mg kg-1 (average
59 mg) with Ca+Mg content of >8.0 meq L-1. The effect of Ca+Mg on soil microbial
biomass N is also described in Figure 5.30. A negatively non-significant Pearson
correlation was found between soil MBN and Ca+Mg (r =-0.16, p =0.05, n = 30).
Variation in C/N ratio of microbial biomass with changing soluble salts of Ca+Mg is
presented in Table 5.19. Our data showed that microbial biomass C/N ratio was not
significantly affected by Ca+Mg. The average C/N ratio of MB ranged from 5.4
with Ca+Mg content of <4.0 meq L-1 to 6.1 with Ca+Mg content of > 8.0 meq L-1.
A positive but non-significant Pearson correlation coefficient (r =-0.03, p =0.05,
n=30) was found between soil microbial biomass C/N ratio and soil Ca+Mg content.
The N mineralization was generally lower for soil containing high concentrations of
Ca+Mg (Figure 5.32). On average, N mineralization ranged from 32.9 mg kg-1 soil
with Ca+Mg content of <4.0 meq L-1 to 17.0 mg with Ca+Mg content of >8.0 meq
L-1. Although the correlation between N mineralization and Ca+Mg was negative (r
=-0.18, p =0.05, n=30) but it was statistically non-significant. The pattern of
nitrification in response to Ca+Mg concentration was the same as that of N
mineralization. The rate of nitrification was lowered at high concentration of
Ca+Mg.

75
Table 5.18: Correlation coefficient of Ca+Mg with MBC, MBN, MB C/N ratio, nitrification and CO2 production
Parameter Correlation coefficient (r) Microbial biomass carbon -0.04 ns
Microbial biomass nitrogen -0.16 ns
N-mineralization -0.18 ns
Microbial biomass C/N ratio -0.03 ns
Nitrification -0.12 ns
Cumulative CO2 production -0.08 ns ns, non-significant at (P < 0.05)
Table 5.19: Microbial biomass C, N, Microbial biomass C/N ratio, N-miniralizaion and Nitrification with different soil Ca+Mg contents
Ca+Mg (meq L-1)
No. of soils in this category
MBC (mg kg-1)
MBN (mg kg-1)
MB C/N
N-mineralization (mg kg-1)
Nitrification (mg kg-1)
<4.0 11
min 172.3 22.8 2.6 10.2 -11.3 max 462.4 165.8 11.9 63.1 73.7 mean 359.1 97.6 5.4 32.9 28.3 CV 71.5 45.8 2.2 16.3 25.1
4.0-8.0 13
min 212.5 19.0 2.5 1.9 -19.2 max 516.3 170.2 15.1 56.1 58.8 mean 326.3 74.8 6.9 20.3 13.5 CV 70.6 45.9 3.5 12.1 19.1
>8.0 6
min 146.8 21.2 4.4 2.1 -13.2 max 389.6 82.0 8.9 31.8 29.2 mean 305.7 58.7 6.1 17.0 10.7 CV 53.0 19.4 1.8 7.6 9.6
Figure 5.29: Simple Regression of MBC with soluble salts of Ca+Mg
NS
0
100
200
300
400
500
600
0 5 10 15 20 25 30
MB
C (
mg
kg-1
soil
)
Ca+Mg (meq L-1)
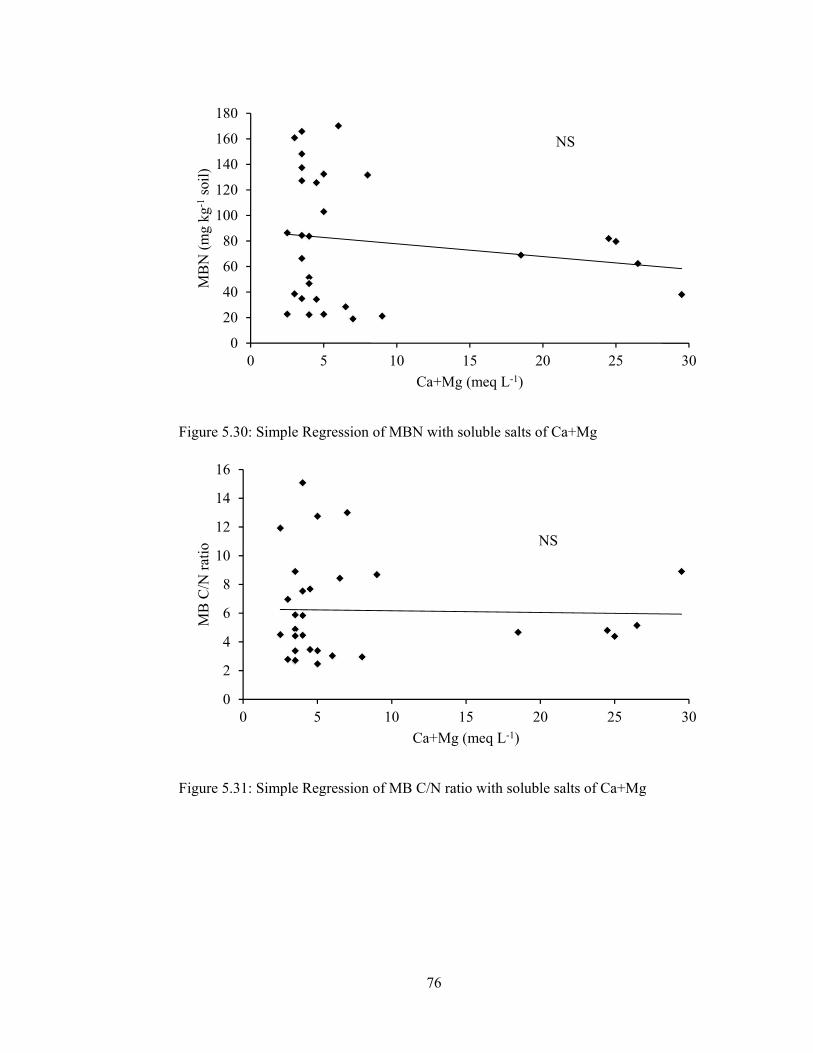
76
Figure 5.30: Simple Regression of MBN with soluble salts of Ca+Mg
Figure 5.31: Simple Regression of MB C/N ratio with soluble salts of Ca+Mg
NS
0
20
40
60
80
100
120
140
160
180
0 5 10 15 20 25 30
MB
N (
mg
kg-1
soil
)
Ca+Mg (meq L-1)
NS
0
2
4
6
8
10
12
14
16
0 5 10 15 20 25 30
MB
C/N
rat
io
Ca+Mg (meq L-1)

77
The average nitrification ranged from 28.3 mg kg-1 soil with Ca+Mg content of <4.0
meq L-1 to 10.7 mg with Ca+Mg content of > 8.0 meq L-1. The effect of calcium and
magnesium salts on soil nitrification rate is also described in Figure 5.33. Like in N
mineralization, the Pearson correlation coefficient between soil nitrification and
soluble salts of Ca+Mg was negative (r = -0.12, p =0.05, n=30).
The results on basal soil respiration were presented in (Table 5.20). The results
showed that the basal respiration was almost similar for soils with varying
concentrations of Ca+Mg. The average basal respiration at day 2 was 15 mg kg-1 soil
d-1 with Ca+Mg content of <4.0 meq L-1 to 13.9 mg with Ca+Mg content of >8.0
meq L-1. The corresponding values were 8.9 and 7.9 mg kg-1 soil d-1, 11.1 and 11.0
mg kg-1 soil d-1 at day 7 and 5.9 and 5.8 mg kg-1 soil d-1 respectively at day 10. It was
evident from the data that basal respiration generally decreased with time. The effect
of Ca+Mg content on basal soil respiration is also described in Figure 5.34. The
response of cumulative CO2 production to Ca+Mg concentration was almost similar
to that of basal respiration. Although the cumulative CO2 production was
consistently lower in soil with high concentration of Ca+Mg, differences were
statistically non-significant. The average cumulative CO2 production ranged from
100 mg kg-1 soil with Ca+Mg content of <4.0 meq L-1 to 79 mg mg kg-1 soil with
Ca+Mg content of >8.0 meq L-1. The effect of soluble salts content on cumulative
CO2 production is also presented in Figure 5.35. The Pearson correlation coefficient
(r = -0.08, n = 30) found between cumulative CO2 production and concentration of
Ca+Mg were negative but statistically non-significant.
In our study we found that it is not Ca and Mg salts that influenced soil
microbiological properties but it is the Na-salt which affect the microbiological
properties negatively, either physically by deteriorating soil properties or by its toxic
effect. Therefore, soil microbial biomass and their activity are expected to respond
differently in a sodic environment than in saline environment (Kaur et al., 2008).
Although literature showed that Mg2+ behaves similar characteristics like that of Na.
Hinrich et al. (2001) found that higher exchangeable Mg2+ is associated with low
water permeability, soil crusting, and high pH, similar to characteristic conditions of
sodic (Na+ rich) soils.

78
Figure 5.32: Simple Regression of N mineralization with soluble salts of Ca+Mg
Figure 5.33: Simple Regression of nitrification with soluble salts of Ca+Mg
NS
0
10
20
30
40
50
60
70
0 5 10 15 20 25 30
N m
iner
aliz
atio
n (m
g kg
-1so
il)
Ca+Mg (meq L-1)
NS
-40
-20
0
20
40
60
80
0 5 10 15 20 25 30
Nit
rifi
cati
on (
mg
kg-1
soil
)
Ca+Mg (meq L-1)

79
Table 5.20: Rate of soil respiration as affected by soluble calcium and magnesium content during different incubation periods
Ca+Mg (meq L-1)
No. of soils in this category
Rate of soil respiration (mg kg-1 d-1) Incubation period (days)
2 5 7 10
<4.0 11
min 7.0 1.8 4.3 2.0 max 25.1 16.5 17.7 8.3 mean 15.0 8.9 11.1 5.9 CV 5.0 2.9 3.7 1.7
4.0-8.0 13
min 2.3 2.5 4.9 2.7 max 25.1 13.9 18.0 9.0 mean 14.4 8.4 10.7 5.1 CV 5.1 2.3 4.6 1.6
>8.0 6
min 1.8 2.4 5.4 2.4 max 17.8 7.9 11.0 7.6 mean 13.9 5.7 8.6 5.8 CV 4.3 1.3 1.4 1.3
Figure 5.34: Relationship of soil respiration rate with soluble salts of Ca+Mg during different incubation periods
0
2
4
6
8
10
12
14
16
2 5 7 10
CO
2(m
g kg
-1so
il d-1
)
Incubation period (days)
Ca+Mg <4.0
4.0-8.0
>8.0

80
Table 5.21: Cumulative CO2 productions (mg kg-1) as influenced by soluble Ca+Mg contents
Ca+Mg (meq L-1)
No. of soils in this category
Cumulative CO2 production (mg kg-1) Incubation period (days)
2 5 7 10
<4.0 11
min 14.0 19.4 28.0 42.0 max 50.2 92.3 127.8 151.4 mean 30.1 56.9 79.0 99.7 CV 10.0 18.0 25.4 27.5
4.0-8.0 13
min 4.7 12.3 24.1 32.9 max 50.2 92.0 126.7 153.7 mean 28.9 54.0 75.4 92.5 CV 10.3 16.8 25.2 28.0
>8.0 6
min 3.6 10.7 21.4 28.6 max 35.7 59.5 74.7 94.4 mean 27.8 44.9 62.0 79.4 CV 8.5 12.4 14.1 16.9
Figure 5.35: Relationship of cumulative CO2 production with soluble salts of Ca+Mg during different incubation periods
0
50
100
150
2 5 7 10
CO
2(m
g k
g-1so
il)
Incubation priod (days)
Ca+Mg <4
4.0-8.0
>8.0

81
Our results for non-significant effect of Ca+Mg on soil microbiological properties
were not in line with the findings of Yuan et al. (2007), they concluded that salinity
and Mg2+ alkalinity altered both the size and composition of the microbial biomass,
as also suggested by Walley et al. (1996).
5.1.2.6 Correlation coefficient of microbial indices with soil carbonates
The correlation coefficient of soil microbial indices (microbial biomass C, microbial
biomass N, microbial biomass C/N ratio, N mineralization, nitrification, rate of soil
respiration and cumulative CO2 production) with soil CO32- content are presented
(Table 5.22) and discussed below:
The soil microbial biomass C (MBC) ranged from 313-516 mg kg-1 (average 396
mg) with CO32- content of <1.0 meq L-1 to 172-352 mg kg-1 (average 261 mg) with
CO32- content of > 10.0 meq L-1. The depressive effect of soluble CO3
2- content on
soil microbial biomass C is also presented in Figure 5.36. A significantly negative
Pearson correlation coefficient was found (r =-0.49, p =0.05, n = 30) between MBC
and soluble carbonates content. The microbial biomass N exhibited similar trend like
that of microbial biomass C with soluble CO32- content and ranged from 38-170 mg
kg-1 (average 103 mg) with CO32- content of <1.0 meq L-1 to 23-52 mg kg-1 (average
38 mg) with soluble CO32- content of >10.0 meq L-1. The effect of soil CO3
2- content
on microbial biomass N is also presented in Figure 5.37. A significantly negative
Pearson correlation coefficient (r = -0.34, p = 0.05, n = 30) was found between soil
MBN and soluble carbonates.
The effect of CO3 on C/N ratio in soil microbial biomass is presented in Table 5.23
and Figure 5.38. The results showed that C/N ratio of microbial biomass became
wider with increasing carbonates concentration in soil. The C/N ratio of MB ranged
from 2.7-8.9 (average 4.6) with soluble CO32- content of <1.0 meq L-1 to 4.9-12.8
(average 7.7) with soluble CO32- content of >10.0 meq L-1. However, correlation
coefficient (r =0.16, p =0.05, n=30) between soil microbial biomass C/N ratio and
soil carbonates content were non-significant. The results further showed that
nitrogen mineralization decreased considerably with increasing concentrations of
soil carbonates content (Table 5.23 and Figure 5.39).
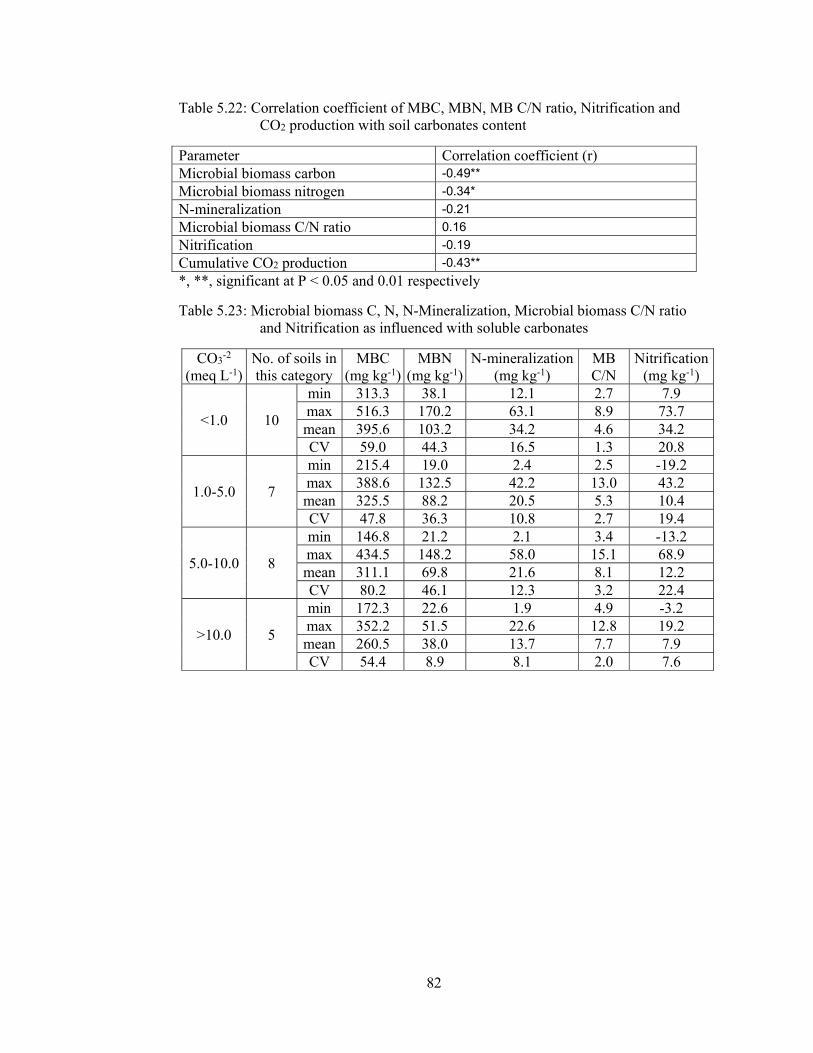
82
Table 5.22: Correlation coefficient of MBC, MBN, MB C/N ratio, Nitrification and CO2 production with soil carbonates content
Parameter Correlation coefficient (r) Microbial biomass carbon -0.49**
Microbial biomass nitrogen -0.34*
N-mineralization -0.21
Microbial biomass C/N ratio 0.16
Nitrification -0.19
Cumulative CO2 production -0.43**
*, **, significant at P < 0.05 and 0.01 respectively
Table 5.23: Microbial biomass C, N, N-Mineralization, Microbial biomass C/N ratio and Nitrification as influenced with soluble carbonates
CO3-2
(meq L-1) No. of soils in this category
MBC (mg kg-1)
MBN (mg kg-1)
N-mineralization (mg kg-1)
MB C/N
Nitrification (mg kg-1)
<1.0 10
min 313.3 38.1 12.1 2.7 7.9 max 516.3 170.2 63.1 8.9 73.7 mean 395.6 103.2 34.2 4.6 34.2 CV 59.0 44.3 16.5 1.3 20.8
1.0-5.0 7
min 215.4 19.0 2.4 2.5 -19.2 max 388.6 132.5 42.2 13.0 43.2 mean 325.5 88.2 20.5 5.3 10.4 CV 47.8 36.3 10.8 2.7 19.4
5.0-10.0 8
min 146.8 21.2 2.1 3.4 -13.2 max 434.5 148.2 58.0 15.1 68.9 mean 311.1 69.8 21.6 8.1 12.2 CV 80.2 46.1 12.3 3.2 22.4
>10.0 5
min 172.3 22.6 1.9 4.9 -3.2 max 352.2 51.5 22.6 12.8 19.2 mean 260.5 38.0 13.7 7.7 7.9 CV 54.4 8.9 8.1 2.0 7.6

83
Figure 5.36: Simple Regression of soil carbonates content on MBC
Figure 5.37: Simple Regression of soil carbonates content on MBN
y = -1.0587x + 351.28r² = 0.2444
0
100
200
300
400
500
600
0 20 40 60 80 100 120 140 160 180 200
MB
C (
mg
kg-1
soil
)
Soil carbonates (meq L-1)
y = -0.4027x + 86.409r² = 0.1137
0
20
40
60
80
100
120
140
160
180
0 20 40 60 80 100 120 140 160 180 200
MB
N (
mg
kg-1
soil
)
Soil carbonates (meq L-1)
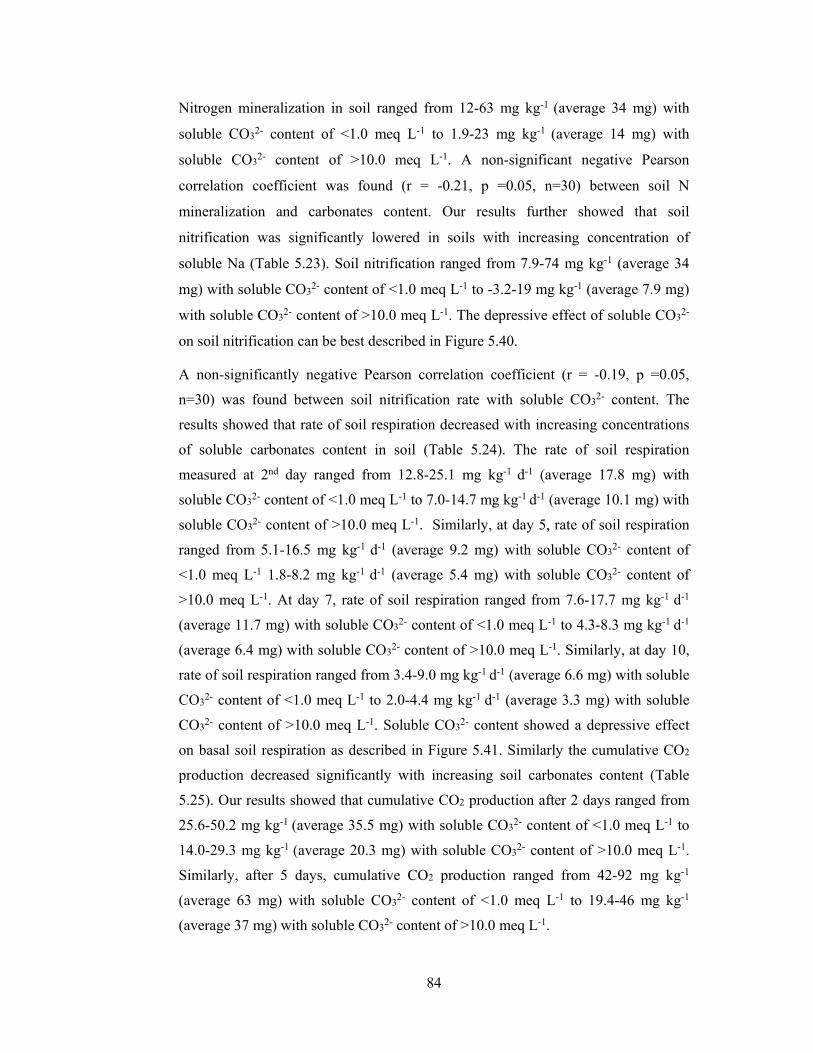
84
Nitrogen mineralization in soil ranged from 12-63 mg kg-1 (average 34 mg) with
soluble CO32- content of <1.0 meq L-1 to 1.9-23 mg kg-1 (average 14 mg) with
soluble CO32- content of >10.0 meq L-1. A non-significant negative Pearson
correlation coefficient was found (r = -0.21, p =0.05, n=30) between soil N
mineralization and carbonates content. Our results further showed that soil
nitrification was significantly lowered in soils with increasing concentration of
soluble Na (Table 5.23). Soil nitrification ranged from 7.9-74 mg kg-1 (average 34
mg) with soluble CO32- content of <1.0 meq L-1 to -3.2-19 mg kg-1 (average 7.9 mg)
with soluble CO32- content of >10.0 meq L-1. The depressive effect of soluble CO3
2-
on soil nitrification can be best described in Figure 5.40.
A non-significantly negative Pearson correlation coefficient (r = -0.19, p =0.05,
n=30) was found between soil nitrification rate with soluble CO32- content. The
results showed that rate of soil respiration decreased with increasing concentrations
of soluble carbonates content in soil (Table 5.24). The rate of soil respiration
measured at 2nd day ranged from 12.8-25.1 mg kg-1 d-1 (average 17.8 mg) with
soluble CO32- content of <1.0 meq L-1 to 7.0-14.7 mg kg-1 d-1 (average 10.1 mg) with
soluble CO32- content of >10.0 meq L-1. Similarly, at day 5, rate of soil respiration
ranged from 5.1-16.5 mg kg-1 d-1 (average 9.2 mg) with soluble CO32- content of
<1.0 meq L-1 1.8-8.2 mg kg-1 d-1 (average 5.4 mg) with soluble CO32- content of
>10.0 meq L-1. At day 7, rate of soil respiration ranged from 7.6-17.7 mg kg-1 d-1
(average 11.7 mg) with soluble CO32- content of <1.0 meq L-1 to 4.3-8.3 mg kg-1 d-1
(average 6.4 mg) with soluble CO32- content of >10.0 meq L-1. Similarly, at day 10,
rate of soil respiration ranged from 3.4-9.0 mg kg-1 d-1 (average 6.6 mg) with soluble
CO32- content of <1.0 meq L-1 to 2.0-4.4 mg kg-1 d-1 (average 3.3 mg) with soluble
CO32- content of >10.0 meq L-1. Soluble CO3
2- content showed a depressive effect
on basal soil respiration as described in Figure 5.41. Similarly the cumulative CO2
production decreased significantly with increasing soil carbonates content (Table
5.25). Our results showed that cumulative CO2 production after 2 days ranged from
25.6-50.2 mg kg-1 (average 35.5 mg) with soluble CO32- content of <1.0 meq L-1 to
14.0-29.3 mg kg-1 (average 20.3 mg) with soluble CO32- content of >10.0 meq L-1.
Similarly, after 5 days, cumulative CO2 production ranged from 42-92 mg kg-1
(average 63 mg) with soluble CO32- content of <1.0 meq L-1 to 19.4-46 mg kg-1
(average 37 mg) with soluble CO32- content of >10.0 meq L-1.
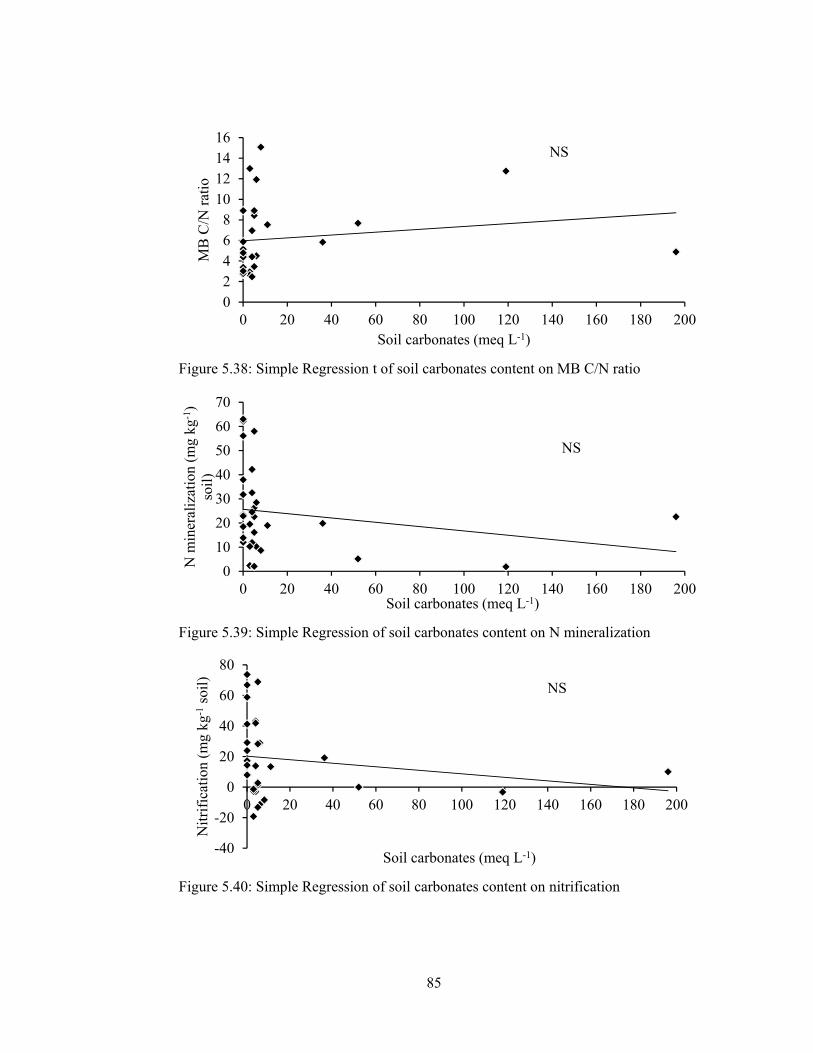
85
Figure 5.38: Simple Regression t of soil carbonates content on MB C/N ratio
Figure 5.39: Simple Regression of soil carbonates content on N mineralization
Figure 5.40: Simple Regression of soil carbonates content on nitrification
NS
02468
10121416
0 20 40 60 80 100 120 140 160 180 200
MB
C/N
rat
io
Soil carbonates (meq L-1)
NS
0
10
20
30
40
50
60
70
0 20 40 60 80 100 120 140 160 180 200
N m
iner
aliz
atio
n (m
g kg
-1)
soil
)
Soil carbonates (meq L-1)
NS
-40
-20
0
20
40
60
80
0 20 40 60 80 100 120 140 160 180 200
Nit
rifi
cati
on (
mg
kg-1
soil
)
Soil carbonates (meq L-1)

86
Table 5.24: Rate of soil respiration influenced by soluble carbonates during different incubation periods
CO3-2
(meq L-1) No. of soils in this
category
Rate of soil respiration (mg kg-1 d-1) Incubation period (days)
2 5 7 10
<1.0 10
min 12.8 5.1 7.6 3.4 max 25.1 16.5 17.7 9.0 mean 17.8 9.2 11.7 6.6 CV 3.3 3.3 3.1 1.3
1.0-5.0 7
min 2.3 2.5 5.9 2.9 max 25.1 11.6 18.0 8.3 mean 15.0 8.5 12.8 6.1 CV 6.4 2.4 4.0 1.2
5.0-10.0 8
min 1.8 2.4 5.4 2.4 max 22.1 10.5 16.0 8.0 mean 12.8 7.9 9.2 5.1 CV 5.1 1.8 3.3 1.6
>10.0 5
min 7.0 1.8 4.3 2.0 max 14.7 8.2 8.3 4.4 mean 10.1 5.4 6.4 3.3 CV 2.0 1.8 1.4 0.8
Figure 5.41: Effect of soil carbonates content on rate of soil respiration
0
2
4
6
8
10
12
14
16
18
20
2 5 7 10
CO
2(m
g kg
-1so
il d-
1)
Incubation period (days)
Carbonates <1.0
1.0-5.0
5.0-10.0
>10.0
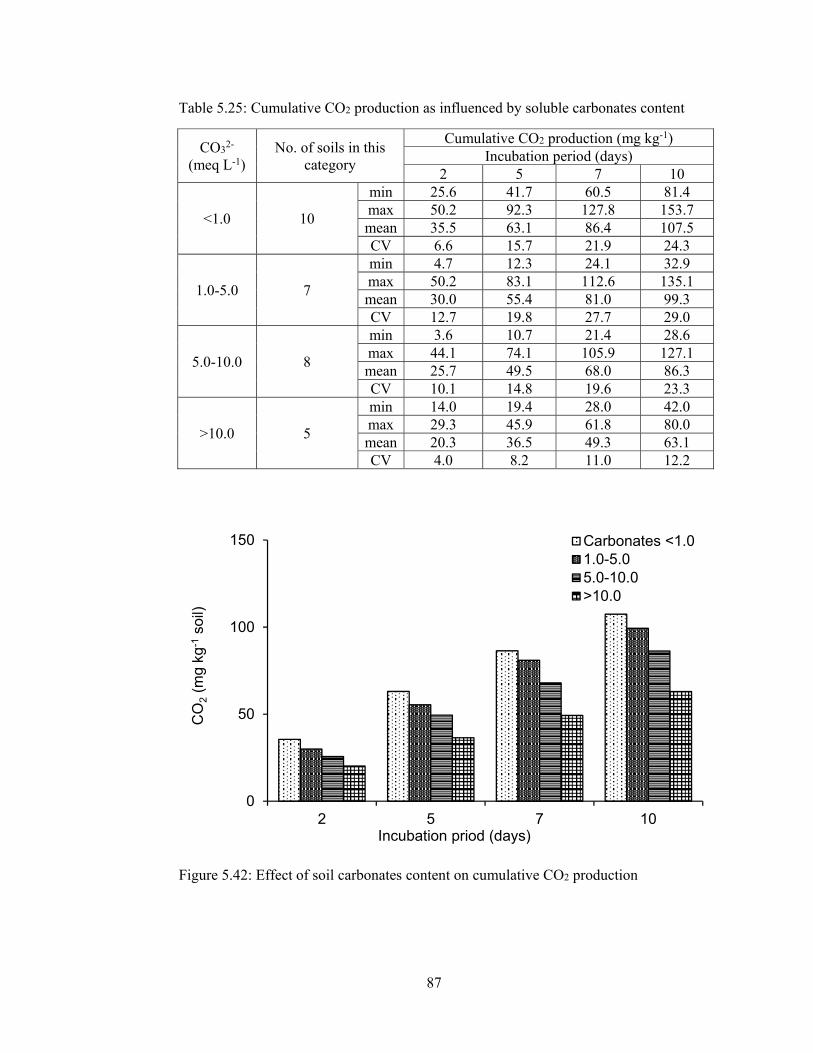
87
Table 5.25: Cumulative CO2 production as influenced by soluble carbonates content
CO32-
(meq L-1) No. of soils in this
category
Cumulative CO2 production (mg kg-1) Incubation period (days)
2 5 7 10
<1.0 10
min 25.6 41.7 60.5 81.4 max 50.2 92.3 127.8 153.7 mean 35.5 63.1 86.4 107.5 CV 6.6 15.7 21.9 24.3
1.0-5.0 7
min 4.7 12.3 24.1 32.9 max 50.2 83.1 112.6 135.1 mean 30.0 55.4 81.0 99.3 CV 12.7 19.8 27.7 29.0
5.0-10.0 8
min 3.6 10.7 21.4 28.6 max 44.1 74.1 105.9 127.1 mean 25.7 49.5 68.0 86.3 CV 10.1 14.8 19.6 23.3
>10.0 5
min 14.0 19.4 28.0 42.0 max 29.3 45.9 61.8 80.0 mean 20.3 36.5 49.3 63.1 CV 4.0 8.2 11.0 12.2
Figure 5.42: Effect of soil carbonates content on cumulative CO2 production
0
50
100
150
2 5 7 10
CO
2(m
g kg
-1so
il)
Incubation priod (days)
Carbonates <1.01.0-5.05.0-10.0>10.0

88
After 7 days, cumulative CO2 production ranged from 61-128 mg kg-1 (average 86
mg) with soluble CO32- content of <1.0 meq L-1 to 28-62 mg kg-1 (average 49 mg)
with soluble CO32- content of >10.0 meq L-1. Similarly after 10 days, cumulative
CO2 production ranged from 81-154 mg kg-1 (average 108 mg) with soluble CO32-
content of <1.0 meq L-1 to 42-80 mg kg-1 (average 63 mg) with soluble CO32-
content of >10.0 meq L-1. The effect of soluble CO32- content on cumulative CO2
production can be best presented in Figure 5.42. A significantly negative Pearson
correlation coefficient (r = -0.43, p =0.05, n=30) was found for cumulative CO2
production with soluble carbonates content. Kara and Bolat, (2007) found that
microbial biomass carbon correlated negatively with CaCO3 content (r = -0.52**,
p<0.05). Lorenz et al. (2001) reported that liming of soil decrease soil microbial
biomass. Zahran (1997) found that carbonates and bicarbonates along with high pH
inhibit microbial growth. Black (1968) found that despite altered composition of the
soil microbial population, after liming, a portion of the soil organic matter becomes
more susceptible to mineralization; but after this portion has been decomposed,
mineralization returns to near its original level.
5.1.2.7 Correlation coefficient of microbial indices with soil bicarbonates
High bicarbonates concentrations were found among the analyzed soils (Table 5.1).
The effect of bicarbonates concentrations on soil microbiological properties are
presented in Table 5.27 and discussed below:
The average soil microbial biomass C ranged from 350 mg kg-1 with HCO3- content
of <5.0 meq L-1 to 264 mg with HCO3- content of > 20.0 meq L-1. The depressive
effect of soluble HCO3- content on soil microbial biomass C can also be observed in
Figure 5.43. A significantly negative Pearson correlation coefficient (r = -0.57, p
=0.05, n = 30) was found between MBC and soluble HCO3- content. Microbial
biomass N showed similar trend like that of microbial biomass C with soluble
HCO3- content. Soil microbial biomass N ranged from 102 mg kg-1 with HCO3
-
content of <5.0 meq L-1 to 37 mg with soluble HCO3- content of >20.0 meq L-1. Soil
microbial biomass N was significantly reduced with higher soil HCO3- content as
observed in Figure 5.44. A significantly negative Pearson correlation coefficient (r =
-0.53, p =0.05, n = 30) was found between MBN and soluble HCO3- content.

89
Table 5.26: Correlation coefficient of MBC, MBN, MB C/N ratio, Nitrification and CO2 production with soil bicarbonates content
Parameter Correlation coefficient (r) Microbial biomass carbon -0.57**
Microbial biomass nitrogen -0.53*
N-mineralization -0.37*
Microbial biomass C/N ratio 0.38*
Nitrification -0.34*
Cumulative CO2 production -0.56**
*, **, significant at 0.05 and 0.01 respectively
Table 5.27: Microbiological properties of soils as affected by soluble HCO3- content
CO3-2
(meq L-1) No. of soils in this category
MBC (mg kg-1)
MBN (mg kg-1)
N-mineralization (mg kg-1)
MB C/N
Nitrification (mg kg-1)
<1.0 10
min 313.3 38.1 12.1 2.7 7.9 max 516.3 170.2 63.1 8.9 73.7 mean 395.6 103.2 34.2 4.6 34.2 CV 59.0 44.3 16.5 1.3 20.8
1.0-5.0 7
min 215.4 19.0 2.4 2.5 -19.2 max 388.6 132.5 42.2 13.0 43.2 mean 325.5 88.2 20.5 5.3 10.4 CV 47.8 36.3 10.8 2.7 19.4
5.0-10.0 8
min 146.8 21.2 2.1 3.4 -13.2 max 434.5 148.2 58.0 15.1 68.9 mean 311.1 69.8 21.6 8.1 12.2 CV 80.2 46.1 12.3 3.2 22.4
>10.0 5
min 172.3 22.6 1.9 4.9 -3.2 max 352.2 51.5 22.6 12.8 19.2 mean 260.5 38.0 13.7 7.7 7.9 CV 54.4 8.9 8.1 2.0 7.6

90
Figure 5.43: Simple Regression of soil bicarbonates content on MBC
Figure 5.44: Polynomial Regression of soil bicarbonates content on MBN
y = -3.9164x + 386.28r² = 0.3225
0
100
200
300
400
500
600
0 10 20 30 40 50
MB
C (
mg
kg-1
soil
)
Soil bicarbonates (meq L-1)
0
20
40
60
80
100
120
140
160
180
0 10 20 30 40 50 60
MBN
(mg
kg-1
)
HCO3- (meq l-1)
r2=0.38
Data Y = 135.567 - 6.31845*X + 0.0846785*X^2

91
While, the C/N ratio of microbial biomass increased with increasing HCO3- content.
Our data showed that soil microbial biomass C/N ratio ranged from 5.0 with soluble
HCO3- content of <5.0 meq L-1 to 9.4 with soluble HCO3
- content of >20.0 meq L-1.
The effect of soluble HCO3- content on microbial biomass C/N ratio can also be
presented in Figure 5.45. Unlike microbial biomass C and N, the Pearson correlation
coefficient between soil microbial biomass C/N ratio and HCO3- content was
significant and positive (r = 0.38, p =0.05, n=30). Nitrogen mineralization in soil
ranged from 30 mg kg-1 with HCO3- content of <5.0 meq L-1 to 13 mg with HCO3
-
content of >20 meq L-1. A significantly negative Pearson correlation coefficient (r =-
0.37, p =0.05, n=30) was found between soil N mineralization and bicarbonates. Our
results further showed that soil nitrification was significantly low in soils with
increasing concentration of soluble bicarbonates (Table 5.27, Figure 5.47). Soil
nitrification ranged from 24 mg kg-1 with soil HCO3- content of <5.0 meq L-1 to 2.8
mg with HCO3- content of >20.0 meq L-1. A significantly negative Pearson
correlation coefficient (r = -0.34, p =0.05, n=30) was found between soil
nitrification and soil soluble HCO3- content.
The results on basal soil respiration were presented in Table 5.28. The results
showed that basal soil respiration was much lower for soils with high bicarbonates
content. The average basal soil respiration at day 2 was 18.4 mg kg-1 d-1 with soluble
HCO3- content of <5.0 meq L-1 to 9.6 mg kg-1 d-1 with soluble HCO3
- content of
>20.0 meq L-1. Similarly, at day 5, the corresponding basal soil respiration was 8.6
and 6.0 mg kg-1 d-1, 12.3 to 6.4 mg kg-1 d-1 and 7.1 to 3.9 mg kg-1 d-1 respectively at
day 10. The depressive effect of soluble HCO3- content on soil respiration rate is
also presented in Figure 5.48. Similar depressive effect of bicarbonates was
observed on cumulative CO2 production during different incubation days (Table
5.29). The average cumulative CO2 production ranged from 109 mg CO2 kg-1 in soil
with HCO3- content of <5.0 meq L-1 to 65 mg CO2 kg-1 with HCO3
- content of >20.0
meq L-1. The effect of soluble HCO3- content on cumulative CO2 production is also
observed in Figure 5.49. A significantly negative Pearson correlation coefficient (r =
-0.56, p=0.05, n=30) was found between cumulative CO2 production and HCO3-
content.

92
Figure 5.45: Simple Regression of soil bicarbonates content on MB C/N ratio
Figure 5.46: Simple Regression of soil bicarbonates content on N mineralization
Figure 5.47: Simple Regression of soil bicarbonates content on nitrification
y = 0.1036x + 4.8148r² = 0.1475
02468
10121416
0 10 20 30 40 50
MB
C/N
rat
io
Soil bicarbonates (meq L-1)
y = -0.5037x + 30.918r² = 0.1367
0
10
20
30
40
50
60
70
0 10 20 30 40 50
N m
iner
aliz
atio
n (m
g kg
-1)
soil
)
Soil bicarbonates (meq L-1)
y = -0.6823x + 27.45r² = 0.1187
-40
-20
0
20
40
60
80
0 10 20 30 40 50
Nit
rifi
cati
on (
mg
kg-1
soil
)
Soil bicarbonates (meq L-1)

93
Table 5.28: Rate of soil respiration influenced with bi-carbonate contents during different incubation periods
HCO3-
(meq L-1) No. of soils in this
category
Rate of soil respiration (mg kg-1 d-1) Incubation period (days)
2 5 7 10
<1.0 10
min 12.8 5.1 7.6 3.4 max 25.1 16.5 17.7 9.0 mean 17.8 9.2 11.7 6.6 CV 3.3 3.3 3.1 1.3
1.0-5.0 7
min 2.3 2.5 5.9 2.9 max 25.1 11.6 18.0 8.3 mean 15.0 8.5 12.8 6.1 CV 6.4 2.4 4.0 1.2
5.0-10.0 8
min 1.8 2.4 5.4 2.4 max 22.1 10.5 16.0 8.0 mean 12.8 7.9 9.2 5.1 CV 5.1 1.8 3.3 1.6
>10.0 5
min 7.0 1.8 4.3 2.0 max 14.7 8.2 8.3 4.4 mean 10.1 5.4 6.4 3.3 CV 2.0 1.8 1.4 0.8
Figure 5.48: Effect of soil bicarbonates content on rate of soil respiration
0
2
4
6
8
10
12
14
16
18
20
2 5 7 10
CO
2(m
g kg
-1so
il d-
1 )
Incubation period (days)
bi-arbonates <5.05.0-10.010.0-20.0>20.0

94
Table 5.29: Cumulative CO2 production as influenced with bicarbonates content during different incubation periods
HCO3-
(meq L-1) No. of soils in this
category
Cumulative CO2 production (mg kg-1) Incubation period (days)
2 5 7 10
<5.0 10
min 25.6 41.7 60.5 81.4 max 50.2 92.3 127.8 153.7 mean 35.5 63.1 86.4 107.5 CV 6.6 15.7 21.9 24.3
1.0-5.0 7
min 4.7 12.3 24.1 32.9 max 50.2 83.1 112.6 135.1 mean 30.0 55.4 81.0 99.3 CV 12.7 19.8 27.7 29.0
5.0-10.0 8
min 3.6 10.7 21.4 28.6 max 44.1 74.1 105.9 127.1 mean 25.7 49.5 68.0 86.3 CV 10.1 14.8 19.6 23.3
>10.0 5
min 14.0 19.4 28.0 42.0 max 29.3 45.9 61.8 80.0 mean 20.3 36.5 49.3 63.1 CV 4.0 8.2 11.0 12.2
Figure 5.49: Effect of soil bicarbonates content on cumulative CO2 production
0
50
100
150
2 5 7 10
CO2
(mg
kg-1
soil)
Incubation priod (days)
bi-carbonates <5.05.0-10.010.0-20.0>20.0
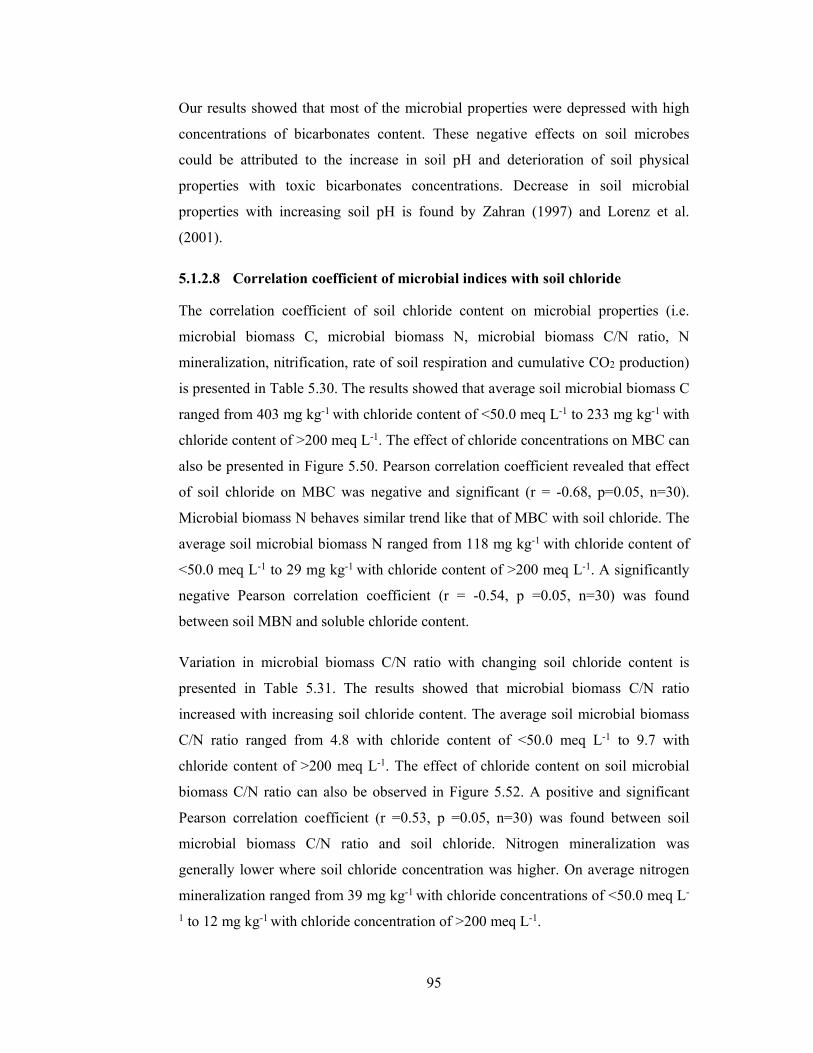
95
Our results showed that most of the microbial properties were depressed with high
concentrations of bicarbonates content. These negative effects on soil microbes
could be attributed to the increase in soil pH and deterioration of soil physical
properties with toxic bicarbonates concentrations. Decrease in soil microbial
properties with increasing soil pH is found by Zahran (1997) and Lorenz et al.
(2001).
5.1.2.8 Correlation coefficient of microbial indices with soil chloride
The correlation coefficient of soil chloride content on microbial properties (i.e.
microbial biomass C, microbial biomass N, microbial biomass C/N ratio, N
mineralization, nitrification, rate of soil respiration and cumulative CO2 production)
is presented in Table 5.30. The results showed that average soil microbial biomass C
ranged from 403 mg kg-1 with chloride content of <50.0 meq L-1 to 233 mg kg-1 with
chloride content of >200 meq L-1. The effect of chloride concentrations on MBC can
also be presented in Figure 5.50. Pearson correlation coefficient revealed that effect
of soil chloride on MBC was negative and significant (r = -0.68, p=0.05, n=30).
Microbial biomass N behaves similar trend like that of MBC with soil chloride. The
average soil microbial biomass N ranged from 118 mg kg-1 with chloride content of
<50.0 meq L-1 to 29 mg kg-1 with chloride content of >200 meq L-1. A significantly
negative Pearson correlation coefficient (r = -0.54, p =0.05, n=30) was found
between soil MBN and soluble chloride content.
Variation in microbial biomass C/N ratio with changing soil chloride content is
presented in Table 5.31. The results showed that microbial biomass C/N ratio
increased with increasing soil chloride content. The average soil microbial biomass
C/N ratio ranged from 4.8 with chloride content of <50.0 meq L-1 to 9.7 with
chloride content of >200 meq L-1. The effect of chloride content on soil microbial
biomass C/N ratio can also be observed in Figure 5.52. A positive and significant
Pearson correlation coefficient (r =0.53, p =0.05, n=30) was found between soil
microbial biomass C/N ratio and soil chloride. Nitrogen mineralization was
generally lower where soil chloride concentration was higher. On average nitrogen
mineralization ranged from 39 mg kg-1 with chloride concentrations of <50.0 meq L-
1 to 12 mg kg-1 with chloride concentration of >200 meq L-1.
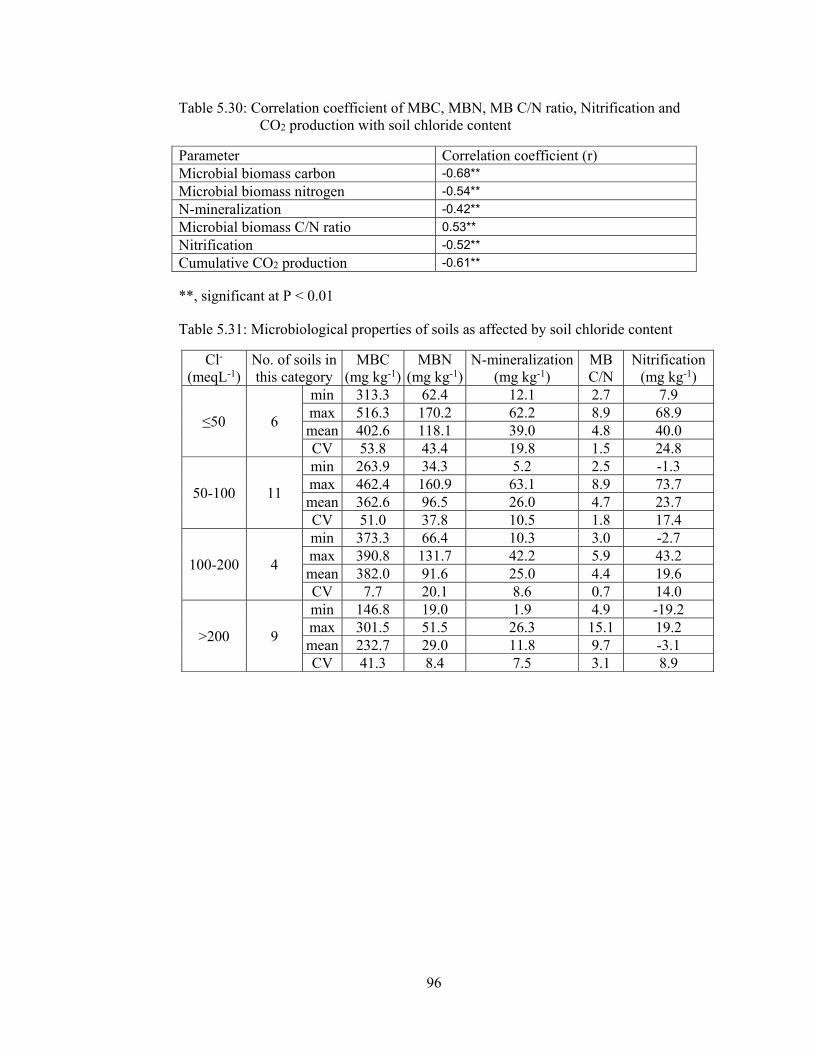
96
Table 5.30: Correlation coefficient of MBC, MBN, MB C/N ratio, Nitrification and CO2 production with soil chloride content
Parameter Correlation coefficient (r) Microbial biomass carbon -0.68**
Microbial biomass nitrogen -0.54**
N-mineralization -0.42**
Microbial biomass C/N ratio 0.53**
Nitrification -0.52**
Cumulative CO2 production -0.61**
**, significant at P < 0.01
Table 5.31: Microbiological properties of soils as affected by soil chloride content
Cl- (meqL-1)
No. of soils in this category
MBC (mg kg-1)
MBN (mg kg-1)
N-mineralization (mg kg-1)
MB C/N
Nitrification (mg kg-1)
≤50 6
min 313.3 62.4 12.1 2.7 7.9 max 516.3 170.2 62.2 8.9 68.9 mean 402.6 118.1 39.0 4.8 40.0 CV 53.8 43.4 19.8 1.5 24.8
50-100 11
min 263.9 34.3 5.2 2.5 -1.3 max 462.4 160.9 63.1 8.9 73.7 mean 362.6 96.5 26.0 4.7 23.7 CV 51.0 37.8 10.5 1.8 17.4
100-200 4
min 373.3 66.4 10.3 3.0 -2.7 max 390.8 131.7 42.2 5.9 43.2 mean 382.0 91.6 25.0 4.4 19.6 CV 7.7 20.1 8.6 0.7 14.0
>200 9
min 146.8 19.0 1.9 4.9 -19.2 max 301.5 51.5 26.3 15.1 19.2 mean 232.7 29.0 11.8 9.7 -3.1 CV 41.3 8.4 7.5 3.1 8.9
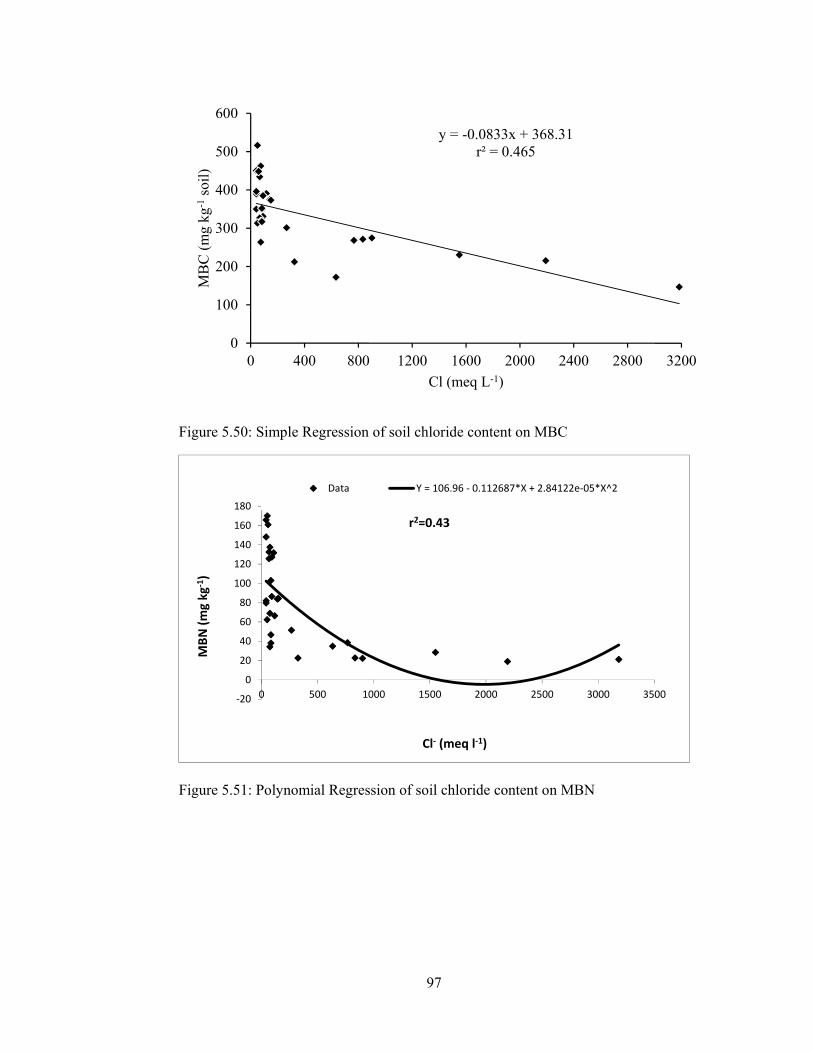
97
Figure 5.50: Simple Regression of soil chloride content on MBC
Figure 5.51: Polynomial Regression of soil chloride content on MBN
y = -0.0833x + 368.31r² = 0.465
0
100
200
300
400
500
600
0 400 800 1200 1600 2000 2400 2800 3200
MB
C (
mg
kg-1
soil
)
Cl (meq L-1)
-20
0
20
40
60
80
100
120
140
160
180
0 500 1000 1500 2000 2500 3000 3500
MBN
(mg
kg-1
)
Cl- (meq l-1)
r2=0.43
Data Y = 106.96 - 0.112687*X + 2.84122e-05*X^2
98
The Pearson correlation coefficient between soil chloride content and N
mineralization was found negative (r = -0.42, p =0.05, n=30). The pattern of
nitrification in response to chloride concentrations was same as that of N
mineralization (Table 5.31). The average nitrification ranged from 40 mg kg-1 with
chloride concentrations of <50.0 meq L-1 to –3.1 mg kg-1 with chloride
concentrations of >200 meq L-1. The depressive effect of soil chloride content on
soil nitrification rate can also be described in Figure 5.54. A Significantly negative
Pearson correlation coefficient (r = -0.52, p =0.05, n=30) was found between rate of
soil nitrification and chloride concentrations.
The results on basal soil respiration were presented in (Table 5.32). The results
showed that the basal respiration was decreased with varying soil chloride
concentrations. The average basal respiration at day 2 was 19.2 mg kg-1 soil d-1 with
chloride concentrations of <50 meq L-1 to 7.8 mg kg-1 soil d-1 with chloride
concentrations of >200 meq L-1. The corresponding values were 10.3 and 5.8 mg kg-
1 soil d-1, 13.1 and 6.2 mg kg-1 soil d-1 at day 7 and 6.6 and 4.2 mg kg-1 soil d-1
respectively at day 10. It was evident from the data that basal respiration generally
decreased with time. The effect of chloride concentrations on basal soil respiration is
also described in Figure 5.55. The response of cumulative CO2 production to
chloride concentration was almost similar to that of basal respiration. Although the
cumulative CO2 production was consistently lower in soil with high chloride
concentrations, with significant statistical differences. The average cumulative CO2
production ranged from 117.1 mg kg-1 soil with chloride concentrations of <50 meq
L-1 to 59 mg mg kg-1 soil with chloride concentrations of >200 meq L-1. The effect of
chloride concentrations on cumulative CO2 production is also presented in Figure
5.56. The Pearson correlation coefficient (r = -0.62, n = 30) found between
cumulative CO2 production and chloride concentrations were negative and
significant.

99
Figure 5.52: Simple Regression of soil chloride content on MB C/N ratio
Figure 5.53: Polynomial Regression of soil chloride content on N mineralization
Figure 5.54: Simple Regression of soil chloride content on nitrification
y = 0.0025x + 5.1521r² = 0.2829
0
2
4
6
8
10
12
14
16
0 400 800 1200 1600 2000 2400 2800 3200
MB
C/N
rat
io
Cl (meq L-1)
0
10
20
30
40
50
60
70
0 500 1000 1500 2000 2500 3000 3500Net
N-M
inira
lizat
ion
Cl- (meq l-1)
r2=21
Data Y = 30.2807 - 0.0221865*X + 4.5002e-06*X^2
y = -0.0183x + 25.865r² = 0.2719
-40
-20
0
20
40
60
80
0 400 800 1200 1600 2000 2400 2800 3200
Nit
rifi
cati
on (
mg
kg-1
soil
)
Cl (meq L-1)

100
Table 5.32: Rate of soil respiration in response to varying chloride concentrations during different incubation periods
Cl- (meqL-1)
No. of soils in this category
Rate of soil respiration (mg kg-1 d-1) Incubation period (days)
2 5 7 10
≤50 6
min 16.0 5.6 7.6 3.4 max 25.1 16.5 17.7 9.0 mean 19.2 10.3 13.1 6.6 CV 2.7 3.4 4.0 1.6
50-100 11
min 10.6 5.0 7.9 2.7 max 25.1 12.3 17.4 8.3 mean 16.9 8.4 11.6 5.6 CV 3.8 2.0 3.2 1.7
100-200 4
min 10.0 6.6 8.3 5.9 max 24.1 11.6 18.0 8.3 mean 16.3 8.8 12.6 6.7 CV 4.5 2.2 3.9 0.8
>200 9
min 1.8 1.8 4.3 2.0 max 14.1 10.4 9.4 5.7 mean 7.8 5.8 6.2 4.2 CV 2.8 2.5 1.0 1.3
Figure 5.55: Effect of soil chloride content on rate of soil respiration
0
5
10
15
20
25
2 5 7 10
CO
2(m
g kg
-1so
il d-
1 )
Incubation period (days)
Cl <5050-100100-200>200

101
Table 5.33: Cumulative CO2 production as influenced by chloride contents during different incubation periods
Cl- (meqL-1)
No. of soils in this category
Cumulative CO2 production (mg kg-1) Incubation period (days)
2 5 7 10
≤50 6
min 32.0 48.9 70.8 86.5 max 50.2 92.3 127.8 153.7 mean 38.3 69.1 95.2 117.1 CV 5.4 15.4 22.7 25.6
50-100 11
min 21.2 41.7 60.5 73.7 max 50.2 83.3 114.2 139.0 mean 33.7 59.0 82.1 102.3 CV 7.5 11.6 17.8 18.7
100-200 4
min 20.0 39.9 58.2 81.4 max 48.2 79.2 109.1 129.2 mean 32.6 59.0 84.1 104.4 CV 8.9 15.4 23.1 22.1
>200 9
min 3.6 10.7 21.4 28.6 max 28.1 59.2 73.3 90.3 mean 15.7 33.1 45.6 59.0 CV 5.6 12.6 14.6 17.5
Figure 5.56: Effect of soil chloride content on cumulative CO2 production
0
50
100
150
2 5 7 10
CO
2(m
g kg
-1so
il)
Incubation priod (days)
Cl <50.050-100100-200>200

102
The depressive effect of chloride concentrations on soil microbial properties might
be due to specific ion effect or osmotic stress. In saline conditions the inhibition of
microbial activity is by osmotic stress, while under sodic condition, ion toxicities
and adverse pH conditions inhibit microbial growth (Rietz and Haynes, 2003).
Similar results were found by Galinski, 1995 and Oren, 1999. High chloride slats
negatively influenced the size and activity of soil microbial biomass and
biochemical processes essential for maintenance of soil organic matter (Rietz and
Haynes, 2003; Tripathi et al., 2006). Literature shows that soil microbial activity are
inhibited with increasing salt concentrations (Batra and Manna, 1997; Rietz and
Haynes, 2003). Sardinha et al. (2003) reported that as compared to heavy-metal
pollution, salinization has stronger effects on soil microbial properties (Chander et
al., 2001), causing a more stress environmental conditions for microbial
proliferation and growth in soil.
Like other microbial properties soil nitrification was also negatively affected with
high chloride concentrations. Quanzhong and Guanhua (2009) reported that the
reduction of nitrification especially in high salt concentration is due to high NaCl
salt concentrations may become toxic to organisms and the microbial activity will be
retarded. Similar results were found by McCormick and Wolf, 1980; McClung and
Frnkenberger, 1985; Pathak and Rao, 1998. Nitrification is inhibited with NaCl at
concentration ranging from 0.5-1.0% (Sindhu and Cornfield, 1967; Laura, 1974;
Laura, 1977).

103
5.2 EFFECT OF NaCl INDUCED SALINITY ON CO2 EVOLUTION AND N MINERALIZATION IN A SILTY CLAY LOAM SOIL
5.2.1 Introduction
The salt accumulation may seriously affect the physical, chemical and biological
processes as well as the N dynamics in the soils and make negative influence on
crop growth. The influence of salt on nitrogen dynamics in soils varies with salinity
levels (Laura, 1974; Westerman and Tucker, 1974; Laura, 1976; McCormic and
Wolf, 1980; McClung and Frankenberger, 1985; Pathak and Rao, 1998;). Low
salinity levels can stimulate nitrogen mineralization and nitrification (Laura, 1974;
Pathak and Rao, 1998; Chandra et al., 2002), while both processes are inhibited by
high salinity levels (Laura, 1976; McCormic and Wolf, 1980; McClung and
Frankenberger, 1985; Pathak and Rao, 1998). Salinity has been found to negatively
influence the activity and size of soil microbial biomass and biochemical processes
essential for maintenance of soil organic matter (Rietz and Haynes, 2003; Tripathi et
al., 2006). The additions of salts to soils have been shown to result in decreased
microbial activity (Johnson and Guenzi, 1963; Singh et al., 1969; Agarwal et al.,
1971; Ryan and Sims, 1974; Laura, 1974, 1976, 1977). The adverse effect of excess
salts on soil microbial community is due to changes in osmotic pressure and
alteration of protoplasmic action in plants and the microorganisms (Smedema and
Rycroft, 1983).
The objective of present research was to assess the influence of NaCl induced
salinity on rate of CO2 evolution and N mineralization in silty loam soil. The
hypothesis were: (1) increasing NaCl induced salinity have depressive effect on
microbial activity (CO2 evolution) and (2) increasing NaCl induced salinity
influence N mineralization negatively and thus low N availability could be expected
in saline soils.
5.2.2 Materials and methods
A laboratory incubation experiment was conducted to evaluate the effect of NaCl
induced salinity on microbial activity and N mineralization in soil collected from the
Agricultural Research Farm of Khyber Pakhtunkhwa Agricultural University,
Peshawar, Pakistan in November, 2009. The soil and climatic condition of the area
104
and analytical procedure used to measure microbiological and other soil
characteristics are as follows:
5.2.2.1 Experimental site
The soil was collected from Malakandher (Research Farm of Agricultural University
Peshawar). The characteristics of the experimental sites are given earlier in section
4.1. The physico-chemical properties of the experimental site are given in Table
5.34.
5.2.2.2 Soil sampling and processing
A composite soil sample (9.0 kg) was collected from upper 20 cm soil from
Malakandher Farm in November, 2009. The sample field was cultivated with wheat.
Soon after collection the sample was transferred to the laboratory of Soil and
Environmental Sciences Department in cool box and processed immediately for
measurements of microbial activities and other soil properties. The samples were
broken down by hand and passed through < 4.0 mm sieve whilst still moist. Samples
required for measurements of microbiological characteristics were kept moist and
cool. However, part of soil samples were air-dried, ground and passed through < 2.0
mm sieve, and analyzed for ECe (Electrical conductivity of the saturation extract),
pH, CaCO3, total N, organic matter and soil texture.
5.2.2.3 Treatment arrangements
Eight treatments with EC levels of 0.65, 4, 8, 12, 16, 20, 30 and 40 dS m-1 were
arranged in Completely Randomized Design. The soil was amended with NaCl salt
at 0, 4.87, 11.11, 18.86, 24.44, 32.44, 55.55 and 78.22 mg g-1 soil to get the desired
EC levels, respectively. The required amount of NaCl salt was dissolved in 30 mL
water and spread uniformly over the surface of 300 g soil in each incubation pot.
Peptone was not added during N mineralization.
5.2.2.4 Incubation experiment
For each treatment, moist soil sample 300 g in triplicate was taken in a clean plastic
pot and amended with the desired level of NaCl salt solution. After amendments, the
pots were incubated at 28°C. The CO2 evolution was measured at 10, 20, 30 and 40
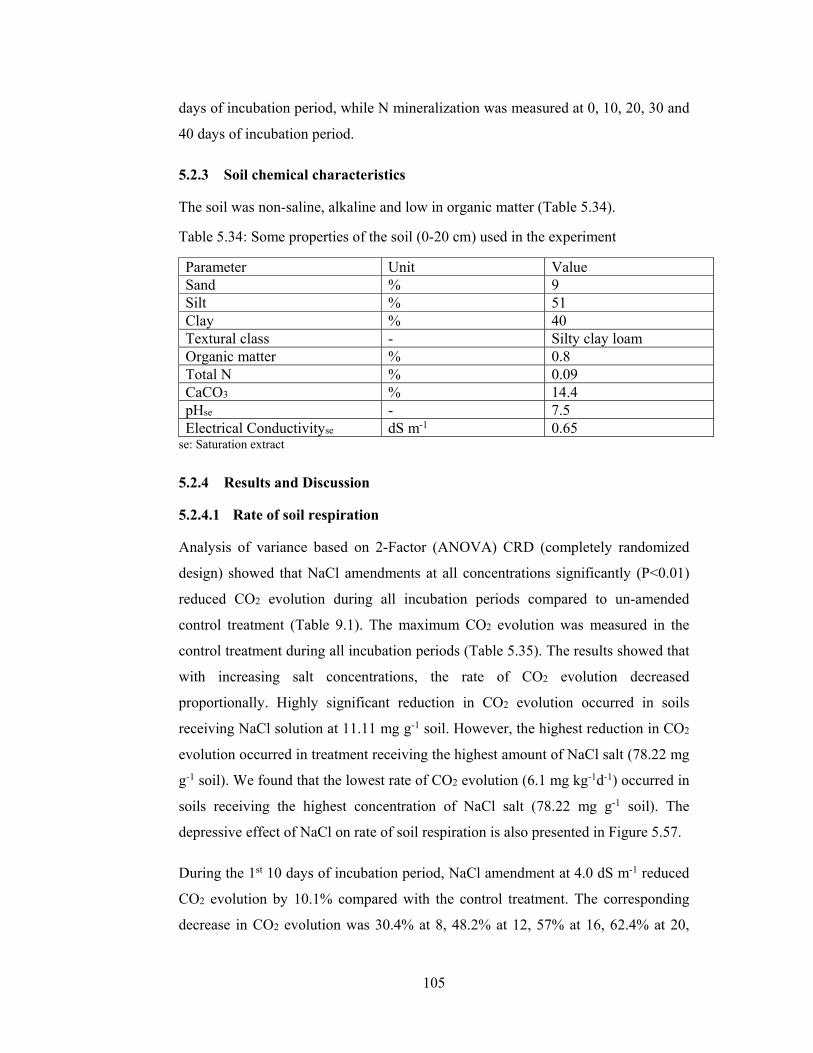
105
days of incubation period, while N mineralization was measured at 0, 10, 20, 30 and
40 days of incubation period.
5.2.3 Soil chemical characteristics
The soil was non-saline, alkaline and low in organic matter (Table 5.34).
Table 5.34: Some properties of the soil (0-20 cm) used in the experiment
Parameter Unit Value Sand % 9 Silt % 51 Clay % 40 Textural class - Silty clay loam Organic matter % 0.8 Total N % 0.09 CaCO3 % 14.4 pHse - 7.5 Electrical Conductivityse dS m-1 0.65
se: Saturation extract
5.2.4 Results and Discussion
5.2.4.1 Rate of soil respiration
Analysis of variance based on 2-Factor (ANOVA) CRD (completely randomized
design) showed that NaCl amendments at all concentrations significantly (P<0.01)
reduced CO2 evolution during all incubation periods compared to un-amended
control treatment (Table 9.1). The maximum CO2 evolution was measured in the
control treatment during all incubation periods (Table 5.35). The results showed that
with increasing salt concentrations, the rate of CO2 evolution decreased
proportionally. Highly significant reduction in CO2 evolution occurred in soils
receiving NaCl solution at 11.11 mg g-1 soil. However, the highest reduction in CO2
evolution occurred in treatment receiving the highest amount of NaCl salt (78.22 mg
g-1 soil). We found that the lowest rate of CO2 evolution (6.1 mg kg-1d-1) occurred in
soils receiving the highest concentration of NaCl salt (78.22 mg g-1 soil). The
depressive effect of NaCl on rate of soil respiration is also presented in Figure 5.57.
During the 1st 10 days of incubation period, NaCl amendment at 4.0 dS m-1 reduced
CO2 evolution by 10.1% compared with the control treatment. The corresponding
decrease in CO2 evolution was 30.4% at 8, 48.2% at 12, 57% at 16, 62.4% at 20,

106
67.8% at 30, and 89.3% at 40 dS m-1 compared with the control treatment. During
the following 10 days of incubation period, the reduction in CO2 evolution ranged
from 21.6% at 4 dS m-1 to 89.9% at 40 dS m-1compared with the control treatment.
Similarly during the next 10 days of incubation period, the corresponding decrease
in CO2 evolution ranged from 20.8% at 4 dS m-1 to 80.4% at 40 dS m-1compared
with the control treatment, finally during the last 10 days of incubation period, the
corresponding reduction in CO2 evolution ranged from 17.5% at 4 dS m-1 to 83.3%
at 40 dS m-1 as compared the control treatment.
The depressive effect of NaCl on CO2 evolution could be due to the specific ion
toxicities (e.g. those of Na+ and Cl-) which tend to inhibit microbial activities in
saline soils (Zahran, 1999). Rietz and Haynes (2003) also reported that microbial
growth was inhibited by ion toxicities and high soil pH under sodic conditions. High
salts accumulation also deteriorate physical properties of soil such as soil
permeability and soil aeration due to swelling and dispersion of clay particles and
increase in soil EC, ESP, and pH (Ayers and Westcot, 1985; Minhas et al., 2007)
which adversely affect microbial biomass and activities in soil (Rietz and Haynes,
2003). Other reason for the reduced activity of soil microorganisms in salt affected
soils could be the osmotic stress which is caused by large concentrations of salts in
soil solution (Galinski, 1995; Oren, 1999).
5.2.4.2 Cumulative CO2 evolution
Analysis of variance based on 2-factor (ANOVA) CR design showed that
cumulative CO2 evolution decreased significantly (P<0.01) during 40 days of
incubation period (Table 9.2). The maximum cumulative CO2 of 327.6 mg kg-1 soil
was produced in the control treatment.
However the production of cumulative CO2 decreased gradually with increasing salt
concentration. The results showed that cumulative CO2 production decreased from
328 mg at EC of < 4 dSm-1 to 45 mg kg-1 soil at EC 40 dSm-1 during 40 days of
incubation period (Table 5.36). The decreasing trend in cumulative CO2 production
in NaCl amended treatments are also depicted in Figure 5.58.
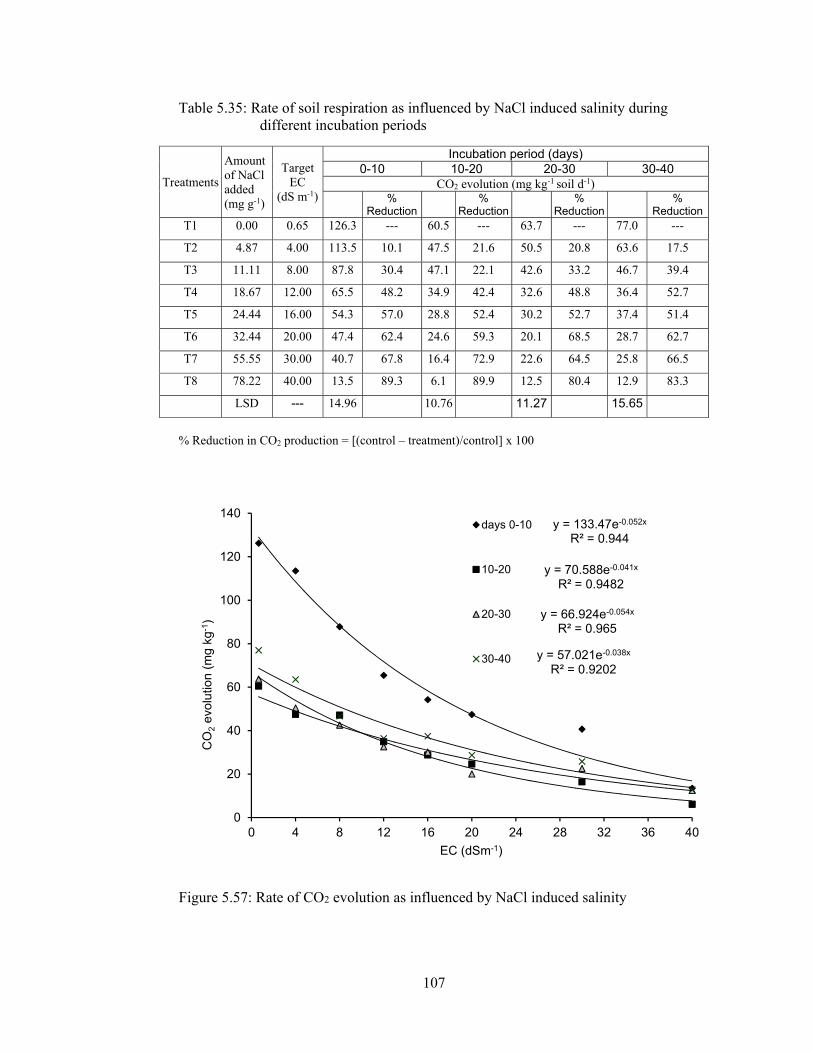
107
Table 5.35: Rate of soil respiration as influenced by NaCl induced salinity during different incubation periods
Treatments
Amount of NaCl added (mg g-1)
Target EC
(dS m-1)
Incubation period (days) 0-10 10-20 20-30 30-40
CO2 evolution (mg kg-1 soil d-1)
% Reduction
%
Reduction
% Reduction
%
ReductionT1 0.00 0.65 126.3 --- 60.5 --- 63.7 --- 77.0 ---
T2 4.87 4.00 113.5 10.1 47.5 21.6 50.5 20.8 63.6 17.5
T3 11.11 8.00 87.8 30.4 47.1 22.1 42.6 33.2 46.7 39.4
T4 18.67 12.00 65.5 48.2 34.9 42.4 32.6 48.8 36.4 52.7
T5 24.44 16.00 54.3 57.0 28.8 52.4 30.2 52.7 37.4 51.4
T6 32.44 20.00 47.4 62.4 24.6 59.3 20.1 68.5 28.7 62.7
T7 55.55 30.00 40.7 67.8 16.4 72.9 22.6 64.5 25.8 66.5
T8 78.22 40.00 13.5 89.3 6.1 89.9 12.5 80.4 12.9 83.3
LSD --- 14.96 10.76 11.27 15.65
% Reduction in CO2 production = [(control – treatment)/control] x 100
Figure 5.57: Rate of CO2 evolution as influenced by NaCl induced salinity
y = 133.47e-0.052x
R² = 0.944
y = 66.924e-0.054x
R² = 0.965
y = 57.021e-0.038x
R² = 0.9202
y = 70.588e-0.041x
R² = 0.9482
0
20
40
60
80
100
120
140
0 4 8 12 16 20 24 28 32 36 40
CO
2ev
olu
tion
(mg
kg-
1 )
EC (dSm-1)
days 0-10
10-20
20-30
30-40

108
It is evident from these results that cumulative CO2 production decreased with
increasing salinity. There was a sharp decrease in CO2 evolution when the NaCl
concentration increased above 11.11 mg NaCl g-1. Similar trend were observed by
McCormick and Wolf (1980). Laura, (1974) found that total microbial activity (as
measured by CO2 evolution) was generally depressed as soil salinity increased.
Similar results were found by Tripathi et al. (2006). Wong et al. (2008) reported that
soil respiration was highest (56-80 mg kg-1soil) in the low salinity treatments and
lowest (1-5 mg kg-1 soil) in the mid salinity treatments. Rietz et al. (2001) found that
irrigation induced salinity decreased the size and activity of the soil microbial
community. Zahran, (1997) showed that saline soil environments harbor
taxonomically diverse microbial groups, which exhibit modified physiological and
structural characteristics under saline conditions. Increasing salinity has shown to
decrease soil respiration rates and soil microbial biomass (Laura, 1973; Laura, 1976;
Pathak and Rao, 1998) and was attributed to stress placed on the microbial
population due to change in osmotic potential (Batra and Manna, 1997).
5.2.4.3 Nitrogen mineralization
The results showed that during 40 days of incubation period (Figure 5.59) the NaCl
amendments significantly (P<0.01) reduced N mineralization in soil. The highest
reduction in N mineralization occurred in soil receiving NaCl at >50 mg g-1 soil (EC
> 30 dSm-1) (see Table 5.37). The results demonstrated that during 10 days of
incubation period, increasing salinity to only 4 dSm-1 reduced N mineralization by
16.2%. The corresponding decrease in N mineralization with further salt (NaCl)
concentration was 8.6% at 8 dS m-1, 18% at 12.0 dS m-1, 44.9% at 16 dS m-1, 45.8%
at 20 dS m-1, 60.9% at 30 dS m-1, and 55% at 40 dS m-1 compared with the control
treatment during 10 days of incubation period. Due to NaCl salinity during 20, 30
and 40 days of incubation the extent of reduction in mineralization was almost
similar to that during the first 10 days of incubation. The decreasing trend in N
mineralization with increasing NaCl concentration is also demonstrated in Figure
5.59.

109
Table 5.36: Cumulative CO2 production during 40 days of incubation periods as influenced by NaCl induced salinity
Treat
ments
Amount
of NaCl
added
(mg g-1)
Target
EC
(dS m-1)
Incubation period (days)
10 20 30 40
Cumulative CO2 production (mg kg-1)
% Red % Red % Red % Red
T1 0.00 0.65 126.2 --- 186.80 --- 250.53 --- 327.55 ---
T2 4.87 4.00 113.5 10.1 160.97 13.8 211.43 15.6 274.99 16.0
T3 11.11 8.00 87.84 30.4 134.99 27.7 177.56 29.1 224.22 31.5
T4 18.67 12.00 65.46 48.2 100.34 46.3 132.94 46.9 169.38 48.3
T5 24.44 16.00 54.28 57.0 83.07 55.5 113.23 54.8 150.68 54.0
T6 32.44 20.00 47.42 62.4 72.05 61.4 92.14 63.2 120.86 63.1
T7 55.55 30.00 40.70 67.8 57.12 69.4 79.72 68.2 105.55 67.8
T8 78.22 40.00 13.50 89.3 19.64 89.5 32.13 87.2 44.99 86.3
LSD --- 14.97 --- 17.97 --- 21.87 --- 25.7 ---
% Red. Reduction in CO2 production = [(control – treatment)/control] x 100
Figure 5.58: Cumulative CO2 production as influenced by induced NaCl salinity
0
50
100
150
200
250
300
350
10 20 30 40
CO
2ev
olut
ion
(mg
kg-1
)
Incubation period (days)
t1
t2
t3
t4
t5
t6
t7
t8
110
The reduction in N mineralization with NaCl salinity demonstrates the detrimental
effect of NaCl salt on soil microbial activity. McClung and Frankenberger (1985)
reported that excessive amounts of salts have an adverse effect on biological activity
including soil enzyme activity and N mineralization. Okur et al. (2001) reported that
soil N-mineralization was more sensitive than C-mineralization to salinity. Sarig et
al (1993) reported that irrigation with saline water (EC = 5 dS m-1) increased the
accumulation of C and N in the microbial biomass, but decreased the rate of C and
N mineralization. An important pool of readily mineralizable organic N in soils is
soil microbial biomass (Bonde et al., 1988) and due to saline environment low
potentially mineralizable N may be linked to low microbial biomass N. Furthermore,
as species differ in their ability to degrade various organic compounds, N
mineralization may be affected by species composition of soil microorganisms. In
saline soils the salinity induced bacterial dominance may inhibit the decomposition
of complex organic materials (Badran, 1994). Under osmotic stress microorganisms
prefer a survival strategy in which they channel the consumed C and N to biomass
production or cell proliferation naturally results with a decline in the rate of C and N
mineralization (Killham et al., 1990). The effect of sodicity and salinity on the
decomposition of soil organic matter can be direct: by influencing microbial
organisms which form the soil microbial biomass, the size of the microbial
population and the amount of substrate available; or, indirect via the dispersion or
flocculation of inorganic colloids which can influence the availability of substrate.
Killham (1994) reported that soil microbial biomass controls turnover and
mineralization rate of organic substrate in the soil. Our results further demonstrated
that reduced rate of N mineralization with increasing NaCl salt concentration have
reduced microbial activity and in turn N mineralization in soil.

111
Table 5.37: N-mineralization as influenced by NaCl induced salinity during different incubation periods
Treatme
nts
Amount of
NaCl
added
(mg g-1)
Target
EC
(dS m-1)
Incubation period (days)
10 20 30 40
N mineralization (mg kg-1 soil)
% Red % Red % Red % Red
T1 0.00 0.65 38.29 --- 70.40 --- 106.82 --- 129.56 ---
T2 4.87 4.00 32.08 16.2 56.10 20.3 85.01 20.4 114.78 11.4
T3 11.11 8.00 34.98 8.6 57.83 17.9 81.26 23.9 111.18 14.2
T4 18.67 12.00 31.41 18.0 58.22 17.3 76.96 28.0 93.93 27.5
T5 24.44 16.00 21.08 44.9 42.70 39.4 67.71 36.6 86.51 33.2
T6 32.44 20.00 20.74 45.8 38.86 44.8 65.48 38.7 77.72 40.0
T7 55.55 30.00 14.98 60.9 31.75 54.9 44.80 58.1 57.79 55.4
T8 78.22 40.00 17.22 55.0 35.31 49.8 48.69 54.4 63.15 51.3
LSD --- 7.9 --- 6.33 --- 9.07 --- 9.55 ---
Red, % Reduction in N mineralization = [(control – treatment)/control] x 100
Figure 5.59: N mineralization (mg kg-1) as influenced by induced NaCl salinity
0
30
60
90
120
150
10 20 30 40
N m
iner
aliz
atio
n (m
g kg
-1)
Incubation period (days)
t1 t2 t3 t4 t5 t6 t7 t8

112
5.3 EFFECT OF MgCl2 INDUCED SALINITY ON CO2EVOLUTION AND N MINERALIZATION IN A SILTY LOAM SOIL
5.3.1 Introduction
Soil salinity and sodicity is an increasing problem worldwide. Salt affected soils
covers nearly 1 billion hectares, equal to 10% of the earth crust (Ghassemi et al.,
1995; Pessarakli and Szabolics, 1999). In Pakistan nearly 5.7 m ha of land is salt
affected. The salt affected land situated mainly in Indus plain, where about 4.2 m ha
of land is affected by salinity and water-logging, 0.12 m ha falling in the canal
commanded area, while 4.45 m ha outside it. Of all the salinized lands 1.9 m ha are
saline, 2.91 m ha are saline-sodic and 0.028 m ha sodic (Mujtaba et al., 2003). High
salts content not only affect physical and chemical properties of soil but also affect
soil microbiological properties. Osmotic stress, caused by high salinity usually limits
microbial activity and growth in saline soil, while under sodic condition, adverse pH
conditions and ion toxicities suppress biological activities (Rietz and Haynes, 2003).
The depressive effects of salinity and/or sodicity on soil biological activities
including CO2 evolution and mineralization of organic compounds have been
reported in many studies (Zahran et al., 1992; Sarig and Steinberger, 1994; Sarig et
al., 1996; Zahran, 1997; Batra and Manna, 1997; Sardinha et al., 2003; Rietz and
Haynes, 2003; Mamilov et al., 2004), but the effect of Mg2+ alkalinity is less well
understood. Unlike Ca2+ which improves soil physical properties through ionic
bonding with soil organic matter and clay particles, Mg2+ increases clay dispersion
and reduces soil aggregate stability (Zhang and Norton, 2002). The magnesium
domination process has large implications on soil deterioration and thus affects soil
microbial properties.
The present research was conducted to analyze the interactions between increasing
MgCl2 salinity and soil biological properties (CO2 evolution and N mineralization)
in silty loam soil. The hypotheses were: (1) increasing Magnesium chloride (MgCl2)
induced salinity has depressive effect on microbial activity (CO2 evolution) and (2)
increasing MgCl2 induced salinity influences N mineralization negatively and thus
low N availability could be expected in saline soils.
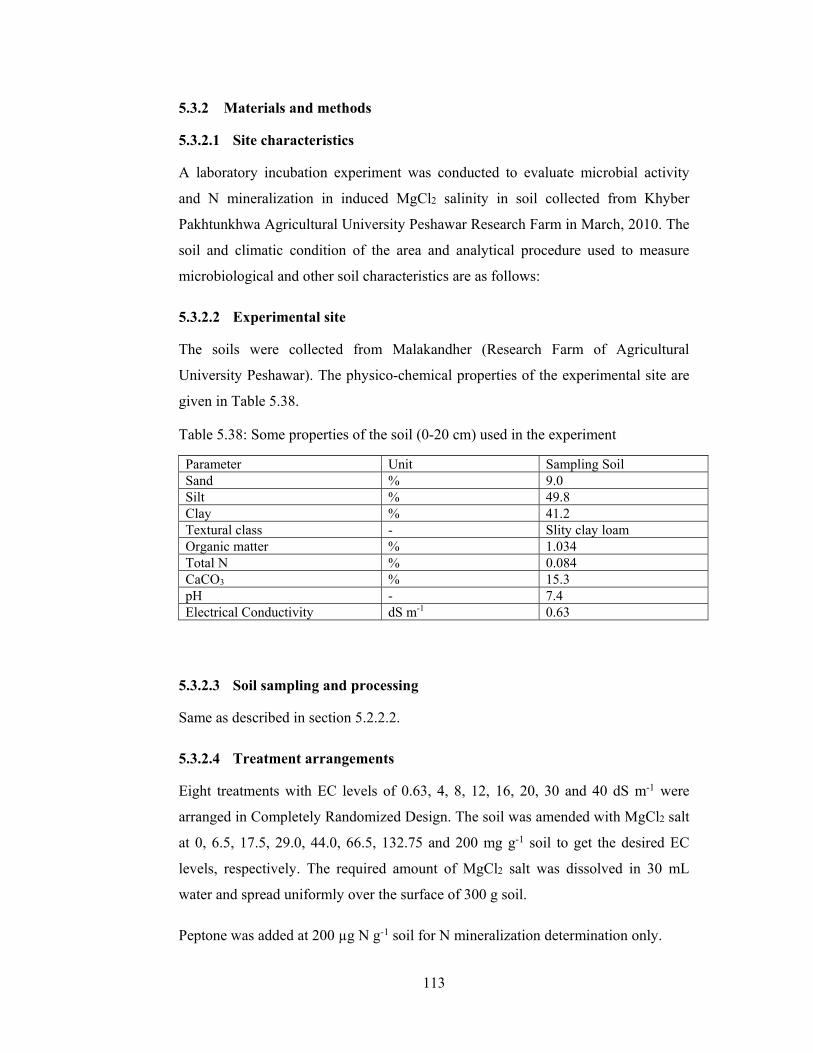
113
5.3.2 Materials and methods
5.3.2.1 Site characteristics
A laboratory incubation experiment was conducted to evaluate microbial activity
and N mineralization in induced MgCl2 salinity in soil collected from Khyber
Pakhtunkhwa Agricultural University Peshawar Research Farm in March, 2010. The
soil and climatic condition of the area and analytical procedure used to measure
microbiological and other soil characteristics are as follows:
5.3.2.2 Experimental site
The soils were collected from Malakandher (Research Farm of Agricultural
University Peshawar). The physico-chemical properties of the experimental site are
given in Table 5.38.
Table 5.38: Some properties of the soil (0-20 cm) used in the experiment
Parameter Unit Sampling Soil Sand % 9.0 Silt % 49.8 Clay % 41.2 Textural class - Slity clay loam Organic matter % 1.034 Total N % 0.084 CaCO3 % 15.3 pH - 7.4 Electrical Conductivity dS m-1 0.63
5.3.2.3 Soil sampling and processing
Same as described in section 5.2.2.2.
5.3.2.4 Treatment arrangements
Eight treatments with EC levels of 0.63, 4, 8, 12, 16, 20, 30 and 40 dS m-1 were
arranged in Completely Randomized Design. The soil was amended with MgCl2 salt
at 0, 6.5, 17.5, 29.0, 44.0, 66.5, 132.75 and 200 mg g-1 soil to get the desired EC
levels, respectively. The required amount of MgCl2 salt was dissolved in 30 mL
water and spread uniformly over the surface of 300 g soil.
Peptone was added at 200 µg N g-1 soil for N mineralization determination only.
114
5.3.2.5 Incubation experiment
For each treatment, moist soil sample of 300 g in triplicate was taken in clean plastic
pot and amended with the desired level of MgCl2 salt solution. After amendments,
the pots were incubated at 28°C. The CO2 evolution was measured at 10, 20 and 30
days of incubation period, while N mineralization was measured at 0, 10, 20 and 30
days of incubation period.
5.3.3 Results and Discussions
5.3.3.1 Rate of soil respiration
Analysis of variance based on 2-Factor (ANOVA) CRD (Completely randomized
design) showed that all treatments of MgCl2 addition significantly (P<0.01) reduced
CO2 evolution during all incubation periods (Table 9.4 and Table 5.39). A more
pronounced and significant reduction in CO2 evolution was observed for soils
receiving MgCl2 ≥ 6.5 mg g-1 soil and the highest reduction in CO2 evolution was
observed with the highest MgCl2 treatment (200 mg g-1 soil). The addition of even
the smallest amount of MgCl2 (6.5 mg g-1 soil) reduced the CO2 evolution, however
more pronounced and significant reduction in CO2 evolution occurred with MgCl2
amended at > 6.5 mg g-1 soil. The lowest CO2 evolution (4.4 mg kg-1 d-1) was
observed for soils receiving the highest concentration of MgCl2 salt (200 mg g-1
soil).
During the 1st 10 days of incubation period, MgCl2 at the rate of 6.5 mg g-1 soil
increased soil EC from 0.63 to 4.0 dS m-1 reduced CO2 evolution by 4.2%, further
increase in soil EC from 4.0 to 8.0 dS m-1 caused 22.8% reduction in CO2 evolution.
Increasing soil EC to 12.0 dS m-1 caused 42.2% reduction CO2 evolution, while soil
EC of 16.0 dS m-1 caused 59.3% reduction in CO2 evolution. Further increase in soil
EC with MgCl2 addition to 20.0 dS m-1 caused 68.6% reduction CO2 evolution and
EC of 30.0 dS m-1 caused 86.4% reduction CO2 evolution. Salt amended at the
highest concentration 200 mg MgCl2 g-1 soil increased soil EC to 40.0 dS m-1 and
caused 96.2% reduction in CO2 evolution.
During the 10-20th days of incubation period, MgCl2 at the rate of 6.5 mg g-1 soil
increased soil EC from 0.63 to 4.0 dS m-1 reduced CO2 evolution by 2.7%, further
115
increase in soil EC from 4.0 to 8.0 dS m-1 caused 5.5% reduction in CO2 evolution.
Increasing soil EC to 12.0 dS m-1 caused 18.2% reduction CO2 evolution, while soil
EC of 16.0 dS m-1 caused 36.4% reduction in CO2 evolution. Further increase in soil
EC with MgCl2 addition to 20.0 dS m-1 caused 40% reduction CO2 evolution and EC
of 30.0 dS m-1 caused 71% reduction CO2 evolution. Salt amended at the highest
concentration 200 mg MgCl2 g-1 soil increased soil EC to 40.0 dS m-1 and caused
92% reduction in CO2 evolution. During the 20-30th days of incubation period,
MgCl2 at the rate of 6.5 mg g-1 soil reduced CO2 evolution by 13.6%, further
increase in soil EC from 4.0 to 8.0 dS m-1 caused 20.9% reduction in CO2 evolution.
Increasing soil EC to 12.0 dS m-1 caused 27.2% reduction CO2 evolution, while soil
EC of 16.0 dS m-1 caused 42.7% reduction in CO2 evolution. Further increase in soil
EC with MgCl2 addition to 20.0 dS m-1 caused 46% reduction CO2 evolution and EC
of 30.0 dS m-1 caused 74% reduction CO2 evolution. Salt amended at the highest
concentration 200 mg MgCl2 g-1 soil increased soil EC to 40.0 dS m-1 and caused
96% reduction in CO2 evolution. The depressive effect of MgCl2 on rate of soil
respiration can be observed in Figure 5.60.
High Mg2+ in soil competes with Ca2+ for plant uptake, and thus reduces its
availability to plants. High Mg2+ is also associated with low soil crusting,
permeability and high pH, similar to the sodic soils characteristic conditions
(Hinrich et al., 2001).
Calcium improve soil structure, inhibit clay dispersion and helps in aggregate
stability by replacing Mg2+ and Na+ in clay (Armstrong and Tanton, 1992). By
increasing clay dispersion Mg2+ may have a deleterious effect on soil aggregate
stability as compared to Ca2+ (Zhang and Norton, 2002). And by expanding clays
resulting in disruption of aggregates, Mg2+ may also result in high swelling. Thus it
can be concluded that increasing salinity and Mg2+ alkalinity becoming detrimental
to soil microorganisms and this was demonstrated by the decline in microbial
activities.
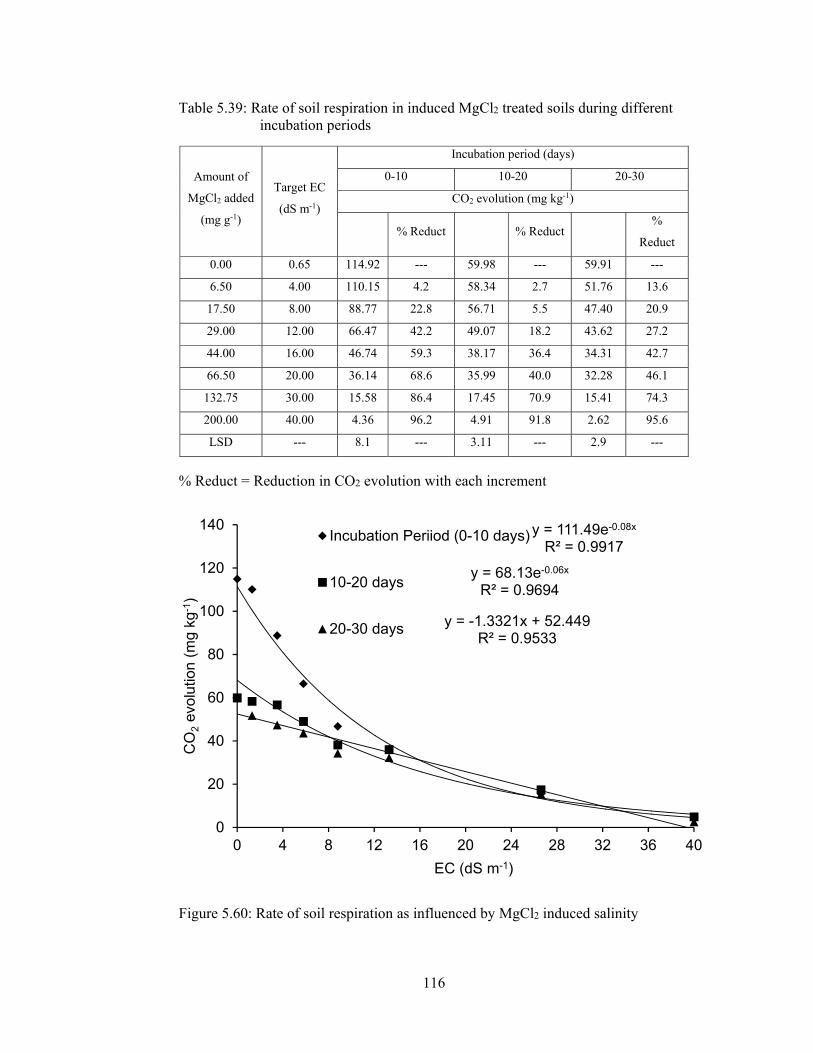
116
Table 5.39: Rate of soil respiration in induced MgCl2 treated soils during different incubation periods
Amount of
MgCl2 added
(mg g-1)
Target EC
(dS m-1)
Incubation period (days)
0-10 10-20 20-30
CO2 evolution (mg kg-1)
% Reduct % Reduct %
Reduct
0.00 0.65 114.92 --- 59.98 --- 59.91 ---
6.50 4.00 110.15 4.2 58.34 2.7 51.76 13.6
17.50 8.00 88.77 22.8 56.71 5.5 47.40 20.9
29.00 12.00 66.47 42.2 49.07 18.2 43.62 27.2
44.00 16.00 46.74 59.3 38.17 36.4 34.31 42.7
66.50 20.00 36.14 68.6 35.99 40.0 32.28 46.1
132.75 30.00 15.58 86.4 17.45 70.9 15.41 74.3
200.00 40.00 4.36 96.2 4.91 91.8 2.62 95.6
LSD --- 8.1 --- 3.11 --- 2.9 ---
% Reduct = Reduction in CO2 evolution with each increment
Figure 5.60: Rate of soil respiration as influenced by MgCl2 induced salinity
y = 111.49e-0.08x
R² = 0.9917
y = 68.13e-0.06x
R² = 0.9694
y = -1.3321x + 52.449R² = 0.9533
0
20
40
60
80
100
120
140
0 4 8 12 16 20 24 28 32 36 40
CO
2ev
olut
ion
(mg
kg-1
)
EC (dS m-1)
Incubation Periiod (0-10 days)
10-20 days
20-30 days
117
5.3.3.2 Cumulative CO2 production
Analysis of variance based on 2-factor (ANOVA) CR design showed that
cumulative CO2 evolution decreased significantly (P<0.01) during 30 days of
incubation period with all MgCl2 treatments. The lowest CO2 evolution (8.1 mg kg-
1) was observed for soils receiving the highest concentration of MgCl2 salt (Table
9.5, Table 5.40). A more pronounced and significant reduction in CO2 evolution was
observed for soils receiving MgCl2 ≥ 17.5 mg g-1 soil and the highest reduction in
CO2 evolution was observed with the highest MgCl2 treatment (200 mg g-1 soil). The
addition of even the smallest amount of MgCl2 (6.5 mg g-1 soil) reduced the CO2
evolution, however more pronounced and significant reduction in CO2 evolution
occurred with NaCl amended at ≥ 17.5 mg g-1 soil.
Increasing soil EC from 0.65 to 4.0 dS m-1 through MgCl2 amendment caused 6.2%
reduction in soil microbial activities (measured as CO2 evolution) compared to un-
amended control soil. Further increase in soil EC from 4.0 to 8.0 dS m-1 caused 18%
reduction in CO2 evolution. Increasing soil EC from 20 dS m-1 with MgCl2 addition
(66.5 mg g-1 soil) cause >50% reduction in cumulative CO2 evolution, while EC of
30 dS m-1 caused 60% reduction in CO2 evolution as compared to control and goes
to 95% reduction as soil EC increased to 40 dS m-1 with the highest MgCl2
treatments. The reduction in CO2 evolution indicates that the microorganisms are
stressed by the saline conditions. The depressive effect of MgCl2 on cumulative CO2
evolution can be observed in Figure 5.61. The lowest CO2 evolution (8.1 mg kg-1)
was observed for soils receiving the highest concentration of MgCl2 salt.

118
Table 5.40: Cumulative CO2 production (mg kg-1) during different incubation periods as influenced by MgCl2 induced salinity
Amount of MgCl2
added (mg g-1)
Targeted
EC
(dS m-1)
Incubation period (days)
10 20 30
Cumulative CO2 production (mg kg-1)
--- %Red --- %Red --- %Red
0.00 0.65 114.92 --- 174.90 --- 234.81 ---
6.50 4.00 110.15 4.2 168.49 3.7 220.25 6.2
17.50 8.00 88.77 22.8 145.47 16.8 192.87 17.9
29.00 12.00 66.47 42.2 115.54 33.9 159.16 32.2
44.00 16.00 46.74 59.3 84.90 51.5 119.22 49.2
66.50 20.00 36.14 68.6 72.13 58.8 104.41 55.5
132.75 30.00 15.58 86.4 33.03 81.1 48.44 79.4
200.00 40.00 4.36 96.2 9.27 94.7 11.89 94.9
LSD --- 8.1 --- 9.5 --- 9.78 ---
% Red = Reduction in CO2 evolution with each increment
Figure 5.61: Cumulative CO2 production as influenced by MgCl2 induced salinity
0
50
100
150
200
250
10 20 30
Cum
ulat
ive
CO
2ev
olut
ion
(mg
kg-1
soil)
Incubation period (days)
T1 T2 T3 T4 T5 T6 T7 T8

119
It is evident from these results that cumulative CO2 production decreased with
increasing MgCl2 salinity. When the MgCl2 concentration increased above 6.5 mg
MgCl2 g-1, there was a sharp decrease in CO2 evolution, similar trend was observed
by Yuan et al. (2007), Ronald et al. (1979). In another experiment Laura, (1974)
found that total microbial activity (as measured by CO2 evolution) was usually
depressed with the increase in soil salinity. Similar results were found by Trapathi et
al. (2006). Vanessa et al. (2008) reported that soil respiration was lowest (1-5 mg
kg-1 soil) in the mid salinity treatments and highest (56-80 mg kg-1soil) in the low
salinity treatments. Rietz et al. (2001) showed that size and activity of the soil
microbial community decreased with irrigation induced salinity. Zahran, (1997)
found that under saline environments microbial growth and structure are
taxonomically modified which perform different physiological characteristics under
such conditions.
5.3.3.3 Nitrogen mineralization
Analysis of variance based on 8 treatments and 3 replications (CR design) showed
that all treatments had significantly (P<0.01) and negatively affect soil N
mineralization during 30 days of incubation period. The initial values at control
treatment showed that soil N mineralization was normal (Figure 5.62, Table 9.6 &
Table 5.41). N mineralization was reduced with MgCl2 treatments >4.0 dS m-1,
while the highest reduction in N mineralization was observed for soil receiving
MgCl2 in amount >50 mg g-1 soil.
During the 1st 10 days of incubation period N mineralization reduced from 93.3 to
18.4 mg kg-1 soil with control and highest MgCl2 treated soil respectively and
caused a net 80% reduction in N mineralization. During the 20 days of incubation
period N mineralization was 145.1 mg kg-1 for control and reduced to 26.2 mg kg-1
with the highest MgCl2 treatment (200 mg g-1 soil) which caused 82% reduction in
N mineralization. N mineralization measured after 30 days of incubation period was
185.4 mg kg-1 and 34.5 mg kg-1 for control and highest MgCl2 treated soil
respectively, which caused a net reduction of 81% in N mineralization. N
mineralization was reduced with all MgCl2 treatments, while significant reduction in
N mineralization was observed for soil receiving MgCl2 in amount >6.5 mg g-1 soil,
120
but no significant effect in N mineralization was observed for soils receiving MgCl2
<6.5 mg g-1 soil.
Application of MgCl2 at the lowest rate (6.5 mg g-1 soil) not significantly reduced N
mineralization by 10% during 1st 10 days of incubation period, 7.4% during 20 days
of incubation period and 6% during 30 days of incubation period. An abrupt
decrease in N mineralization was observed with the addition of > 17.5 mg MgCl2 g-1
soil during all incubation periods. The exponential decline in microbial activities
with MgCl2 salinity demonstrates the extremely detrimental effect of small increase
in salinity. Thus it can be concluded that soil N-mineralization affected negatively
with salinity. The depressive effect of MgCl2 on N mineralization rate can be
observed in Figure 5.62.
The increased EC with increasing MgCl2, result in higher osmotic pressure that
could result in cell lyses (Killham et al., 1990). By inhibiting microbial growth and
activities, salinity and Mg2+ alkalinity may directly decrease organic matter
decomposition. Reduction in soil microbial activities due to increased Mg2+
alkalinity and salinity caused an exponential decline in potentially mineralizable N.
Different species are involved in N mineralization, therefore species composition
may also effect N mineralization. The salinity-induced reduction of fungi may
reduce the decomposition of complex organic material in saline-soils (Badran,
1994). In a research Bandyopadhyay and Bandyopadhyay, (1983) found that
mineralization and immobilization of N were decreased with increasing salinity. The
microbial biomass of soil controls organic matter mineralization and turnover rate
(Killham, 1994). Increasing in salinity produced considerable reduction both in soil
microbial biomass and soil respiration rates (Laura, 1973; Laura, 1976; Pathak and
Rao, 1998) and microbial population is reduced with increasing osmotic potential in
soils (Batra and Manna, 1997).

121
Table 5.41: N-mineralization during different incubation periods as influenced by MgCl2 induced salinity
MgCl2
added
(mg g-1)
Targeted
EC
(dS m-1)
Incubation period (days)
10 20 30
N mineralization (mg kg-1)
--- %Reduct --- %Reduct --- %Reduct
0.00 0.65 93.32 --- 145.08 --- 185.40 ---
6.50 4.00 84.09 9.9 134.32 7.4 174.24 6.0
17.50 8.00 71.22 23.7 108.55 25.2 144.63 22.0
29.00 12.00 54.69 41.4 80.67 44.4 105.70 43.0
44.00 16.00 42.42 54.5 63.43 56.3 80.11 56.8
66.50 20.00 33.94 63.6 45.77 68.5 57.61 68.9
132.75 30.00 22.91 75.4 32.05 77.9 40.88 78.0
200.00 40.00 18.40 80.3 26.24 81.9 34.45 81.4
LSD --- 9.7 --- 12.2 --- 14.8 ---
% Reduct = Reduction in CO2 evolution with each increment
Figure 5.62: N mineralization as influenced by MgCl2 induced salinity
0
40
80
120
160
200
10 20 30
N m
iner
aliz
atio
n (m
g kg
-1so
il )
Incubation period (days)
T1 T2 T3 T4 T5 T6 T7 T8
122
5.4 COMPARATIVE EFFECT OF PRESSMUD, GYPSUM, FARMYARD MANURE AND MICROBIAL INOCULATIONS ON SOIL MICROBIAL BIOMASS AND ACTIVITY IN SALINE SODIC SOIL
5.4.1 Introduction
Gypsum, pressmud and FYM have been successfully used for amelioration of
saline-sodic and sodic soils. Pressmud (the byproduct of sugar mills) as a fertilizer
has been used as an ameliorant in sodic and saline-sodic soils (Raman et al., 1999;
Barry et al., 2001; Qureshi et al., 2001; Rangaraj et al., 2007; Elsayed et al., 2008).
In Pakistan sugar is extracted from the sugarcane juice by carbonation (Lime or
addition of CO2) and thus contains high amount of lime. The pressmud contains 2-
3% sugar, 15-20% organic matter, and approximately 70% lime as CaCO3
(Muhammad and Khaliq, 1975; Khattak and Khan, 2004). The organic matter is
highly soluble and readily available to the soil and so to the microbial activity. More
CO2 is produced due to the microbial activity that may increases the solubility of
lime and hence its effectiveness in reclaiming saline sodic soils (Qadir et al., 2006;
Robbins, 1986a).
However alone application of organic matter is quite a slow process for the
reclamation of saline soil (Muhammad and Khaliq, 1975; Chaudhry et al., 1982;
Chand et al., 1997), therefore, combination of different chemical amendments along
with organic matter is advised by many researchers for more efficient amelioration
of saline sodic soils (Hussain et al., 2001; Chaudhry, 2001; Qadir et al., 2007; Clark
et al., 2007).
In this study an attempt was made to evaluate the effect of pressmud (PM), farmyard
manure (FYM) and gypsum (G) either applied alone or in different combinations in
strongly saline-sodic silt loam soil to assess soid microbial activity (soil respiration)
and microbial biomass over a period of time.
The objectives of the study were to:
• To assess the microbiological properties of native salt affected soils.

123
• To study the effect of different amendments used in reclamation of salt
affected soil on plant growth and soil microbiological properties.
5.4.2 Materials and methods
5.4.2.1 Experimental site
A laboratory incubation experiment was conducted to evaluate the comparative
effect of gypsum, farmyard manure, pressmud, and microbial inoculation on soil
microbial biomass and activity in saline sodic soil collected from Majoke (Khati
Khel soil series), Charsadda. The sampling site was situated near Charsadda Paper
Mill. The site (District Charsadda) characteristics are earlier discussed in section 4.1.
The soil was strongly saline sodic having EC value of 20 dS m-1, pH 10.0 with silt
loam texture.
5.4.2.2 Soil sampling and processing
A composite soil sample (100 kg) was collected from 0-20 cm uncultivated barren
soil layer from Majoke in April, 2010. Soon after collection the samples were
transferred to the Lab of Soil and Environmental Sciences Department, broken down
by hand and passed through < 4.0 mm sieve whilst still moist. Samples required for
amendments were kept in clean plastic buckets in glass house. However, part of soil
samples were air-dried, ground and passed through < 2.0 mm sieve, and analyzed for
ECe (Electrical conductivity of the saturation extract) and soil pH.
5.4.2.3 Treatments and experimental design
Plastic buckets were used with 6.0 kg soil for each treatment under study. The
treatments were arranged in CR design with three replications. Treatments included
(1) control, (2) gypsum (G), (3) pressmud (PM), (4) farmyard manure (FYM), (5)
G+FYM, (6) G+PM, (7) PM+FYM and (8) PM + FYN + microbial inoculum.
Gypsum and pressmud were applied on the basis of 100% gypsum requirement
equal to 20 Mg ha-1. FYM alone or in combination with chemical amendments, was
applied at the rate of 17 Mg ha-1. Inoculum was applied @ 100-120 million microbes
per pot.
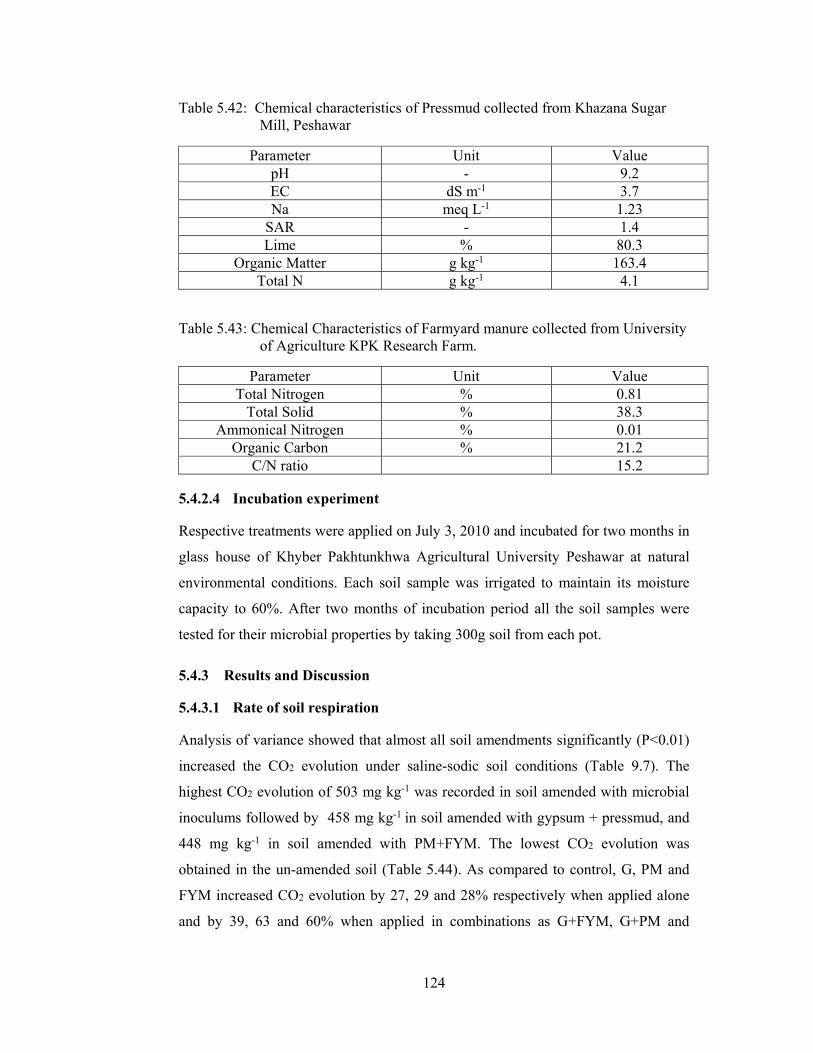
124
Table 5.42: Chemical characteristics of Pressmud collected from Khazana Sugar Mill, Peshawar
Parameter Unit Value pH - 9.2 EC dS m-1 3.7 Na meq L-1 1.23
SAR - 1.4 Lime % 80.3
Organic Matter g kg-1 163.4 Total N g kg-1 4.1
Table 5.43: Chemical Characteristics of Farmyard manure collected from University of Agriculture KPK Research Farm.
Parameter Unit Value Total Nitrogen % 0.81
Total Solid % 38.3 Ammonical Nitrogen % 0.01
Organic Carbon % 21.2 C/N ratio 15.2
5.4.2.4 Incubation experiment
Respective treatments were applied on July 3, 2010 and incubated for two months in
glass house of Khyber Pakhtunkhwa Agricultural University Peshawar at natural
environmental conditions. Each soil sample was irrigated to maintain its moisture
capacity to 60%. After two months of incubation period all the soil samples were
tested for their microbial properties by taking 300g soil from each pot.
5.4.3 Results and Discussion
5.4.3.1 Rate of soil respiration
Analysis of variance showed that almost all soil amendments significantly (P<0.01)
increased the CO2 evolution under saline-sodic soil conditions (Table 9.7). The
highest CO2 evolution of 503 mg kg-1 was recorded in soil amended with microbial
inoculums followed by 458 mg kg-1 in soil amended with gypsum + pressmud, and
448 mg kg-1 in soil amended with PM+FYM. The lowest CO2 evolution was
obtained in the un-amended soil (Table 5.44). As compared to control, G, PM and
FYM increased CO2 evolution by 27, 29 and 28% respectively when applied alone
and by 39, 63 and 60% when applied in combinations as G+FYM, G+PM and

125
PM+FYM respectively. The increase in CO2 evolution with PM application could be
its increasing effect on soil microorganisms. After 30 days of pressmud application
the population of rhizosphere microbes especially actinomycetes and bacteria were
increased (Gaikwad et al., 1996). In another study Tompe and More (1996a), found
highest actinomycetes population with combined application of pressmud with
fertilizer and alone application of pressmud slightly increased the azotobacter,
bacterial and fungal population. Rangaraj et al. (2007) found that compared to the
same level of FYM, application of 12.5 Mg ha-1 pressmud to soil resulted in more
number of colonies of bacteria, fungi and actinomycetes.
The data demonstrated that addition of microorganisms as inoculums promoted CO2
evolution by 80%. Engelking et al. (2007) found that addition of organic amendment
increased the rate of CO2 evolution by 100% during a four week study. Rasul et al.
(2006) found that soil amended with pressmud increase microbial activity in saline
soil. In another study Linkins et al. (1990) and Kautz et al. (2004) found that
addition of organic material to soil increase soil microbial activity by 69% as
compared to the unfertilized control. In the present highly saline soil the increasing
CO2 production in response to microbial inoculums and organic amendments in this
study indicated that soil microorganisms are capable to perform their metabolic
functions and survive under salt stress conditions (Luna-Guido and Dendooven,
2001; Conde et al., 2005). As reported for ryegrass in comparison with glucose, the
addition of sugarcane filter cake seems to add new microbial micro-sites for survival
in soil (Wu et al., 1993). A strong increase in microbial activity was observed after
filter cake (PM) amendment (Rasul et al., 2006) and a small increase in microbial
activity after organic material amendment (Muhammad et al., 2006). Mathew and
Varughese (2007) reported that the integrated use of pressmud @ 5 t ha-1 along with
mineral nutrition of NPK at recommended dosed had appreciably enhanced the
activity of phosphatase and population of actinomycetes under sugarcane
cultivation.
5.4.3.2 Microbial biomass C
The application of amendments alone or in combinations and of microbial
inoculum’s significantly (P < 0.01) increased the microbial biomass carbon (MBC)
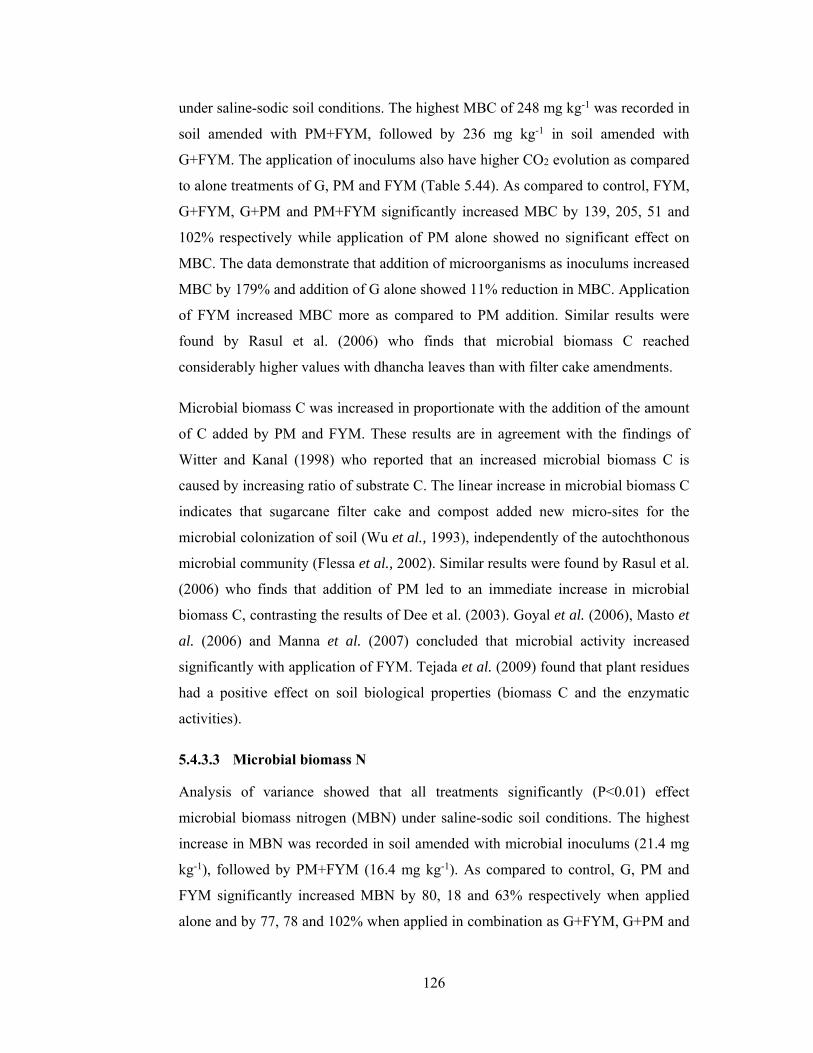
126
under saline-sodic soil conditions. The highest MBC of 248 mg kg-1 was recorded in
soil amended with PM+FYM, followed by 236 mg kg-1 in soil amended with
G+FYM. The application of inoculums also have higher CO2 evolution as compared
to alone treatments of G, PM and FYM (Table 5.44). As compared to control, FYM,
G+FYM, G+PM and PM+FYM significantly increased MBC by 139, 205, 51 and
102% respectively while application of PM alone showed no significant effect on
MBC. The data demonstrate that addition of microorganisms as inoculums increased
MBC by 179% and addition of G alone showed 11% reduction in MBC. Application
of FYM increased MBC more as compared to PM addition. Similar results were
found by Rasul et al. (2006) who finds that microbial biomass C reached
considerably higher values with dhancha leaves than with filter cake amendments.
Microbial biomass C was increased in proportionate with the addition of the amount
of C added by PM and FYM. These results are in agreement with the findings of
Witter and Kanal (1998) who reported that an increased microbial biomass C is
caused by increasing ratio of substrate C. The linear increase in microbial biomass C
indicates that sugarcane filter cake and compost added new micro-sites for the
microbial colonization of soil (Wu et al., 1993), independently of the autochthonous
microbial community (Flessa et al., 2002). Similar results were found by Rasul et al.
(2006) who finds that addition of PM led to an immediate increase in microbial
biomass C, contrasting the results of Dee et al. (2003). Goyal et al. (2006), Masto et
al. (2006) and Manna et al. (2007) concluded that microbial activity increased
significantly with application of FYM. Tejada et al. (2009) found that plant residues
had a positive effect on soil biological properties (biomass C and the enzymatic
activities).
5.4.3.3 Microbial biomass N
Analysis of variance showed that all treatments significantly (P<0.01) effect
microbial biomass nitrogen (MBN) under saline-sodic soil conditions. The highest
increase in MBN was recorded in soil amended with microbial inoculums (21.4 mg
kg-1), followed by PM+FYM (16.4 mg kg-1). As compared to control, G, PM and
FYM significantly increased MBN by 80, 18 and 63% respectively when applied
alone and by 77, 78 and 102% when applied in combination as G+FYM, G+PM and

127
PM+FYM respectively. The data demonstrate that addition of microorganisms as
inoculums promote MBN by 163% which is the highest increase in MBN as
compared to other treatments alone or in different combinations. PM alone or in
combination with other soil amendment increased immobilization of N. Although it
contains high content of extractable N and total N, the results are in agreement with
those of Rasul et al. (2006). Similar results were obtained by Wichern et al. (2004)
investigating the mineralization of FYM, having a similar low C/N ratio to the
present PM. PM has a specific feature of high concentration of extractable organic
C. As the biological decomposition proceeded, the concentration of this extractable
oraganic C is decreased. For the immobilization of N the importance of extractable
organic C has been shown repeatedly for immature or fresh FYM (Martin-Olmedo
and Rees, 1999; Wichern et al., 2004).
5.4.3.4 Microbial biomass C/N ratio
The application of chemical amendments alone or with different combination and
microbial inoculums significantly affected microbial biomass C/N ratio. Analysis of
variance showed that all treatments significantly (P<0.01) effect microbial biomass
C/N ratio. Microbial biomass C/N ratio ranged from 4.7-16.5 for all treatments. The
highest C/N ratio (16.5) was recorded for soil amended with G+FYM, while the
lowest C/N ratio (4.7) was found for soil amended with G alone. FYM alone or with
different combinations increase the microbial biomass C/N ratio, while microbial
inoculums showed no significant effect on microbial biomass C/N ratio. The highest
reduction (50 %) in microbial biomass C/N ratio was observed with G alone, while
PM and G+PM showed 14 and 15% reduction. The application of other amendments
i.e. FYM and PM+FYM increase the ratio of microbial biomass C/N by 47 and 57%
respectively. Similar results were found by Rasul et al., (2006 who found that
addition of sugar cane filter cake increased the microbial C/N ratio as compared to
the soil C/N ratio. However, in a German soil after glucose addition, strongly
increased microbial biomass C/N ratios have also been observed (Chander and
Joergensen, 2007).
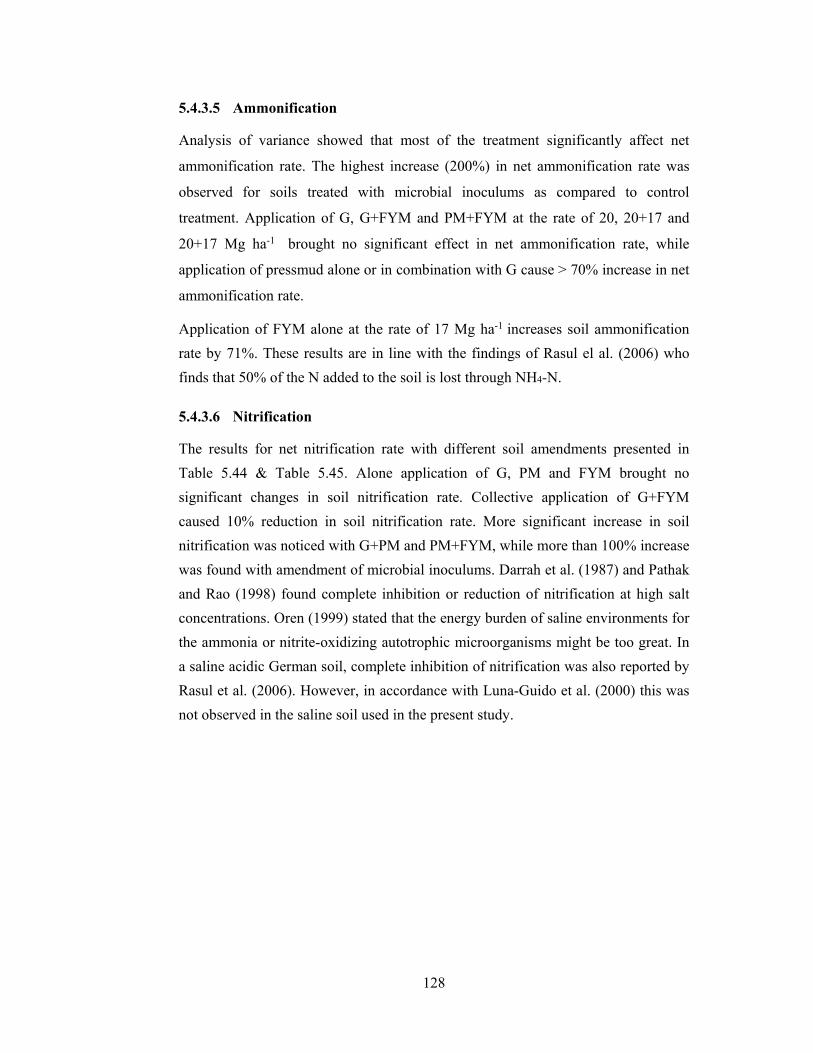
128
5.4.3.5 Ammonification
Analysis of variance showed that most of the treatment significantly affect net
ammonification rate. The highest increase (200%) in net ammonification rate was
observed for soils treated with microbial inoculums as compared to control
treatment. Application of G, G+FYM and PM+FYM at the rate of 20, 20+17 and
20+17 Mg ha-1 brought no significant effect in net ammonification rate, while
application of pressmud alone or in combination with G cause > 70% increase in net
ammonification rate.
Application of FYM alone at the rate of 17 Mg ha-1 increases soil ammonification
rate by 71%. These results are in line with the findings of Rasul el al. (2006) who
finds that 50% of the N added to the soil is lost through NH4-N.
5.4.3.6 Nitrification
The results for net nitrification rate with different soil amendments presented in
Table 5.44 & Table 5.45. Alone application of G, PM and FYM brought no
significant changes in soil nitrification rate. Collective application of G+FYM
caused 10% reduction in soil nitrification rate. More significant increase in soil
nitrification was noticed with G+PM and PM+FYM, while more than 100% increase
was found with amendment of microbial inoculums. Darrah et al. (1987) and Pathak
and Rao (1998) found complete inhibition or reduction of nitrification at high salt
concentrations. Oren (1999) stated that the energy burden of saline environments for
the ammonia or nitrite-oxidizing autotrophic microorganisms might be too great. In
a saline acidic German soil, complete inhibition of nitrification was also reported by
Rasul et al. (2006). However, in accordance with Luna-Guido et al. (2000) this was
not observed in the saline soil used in the present study.
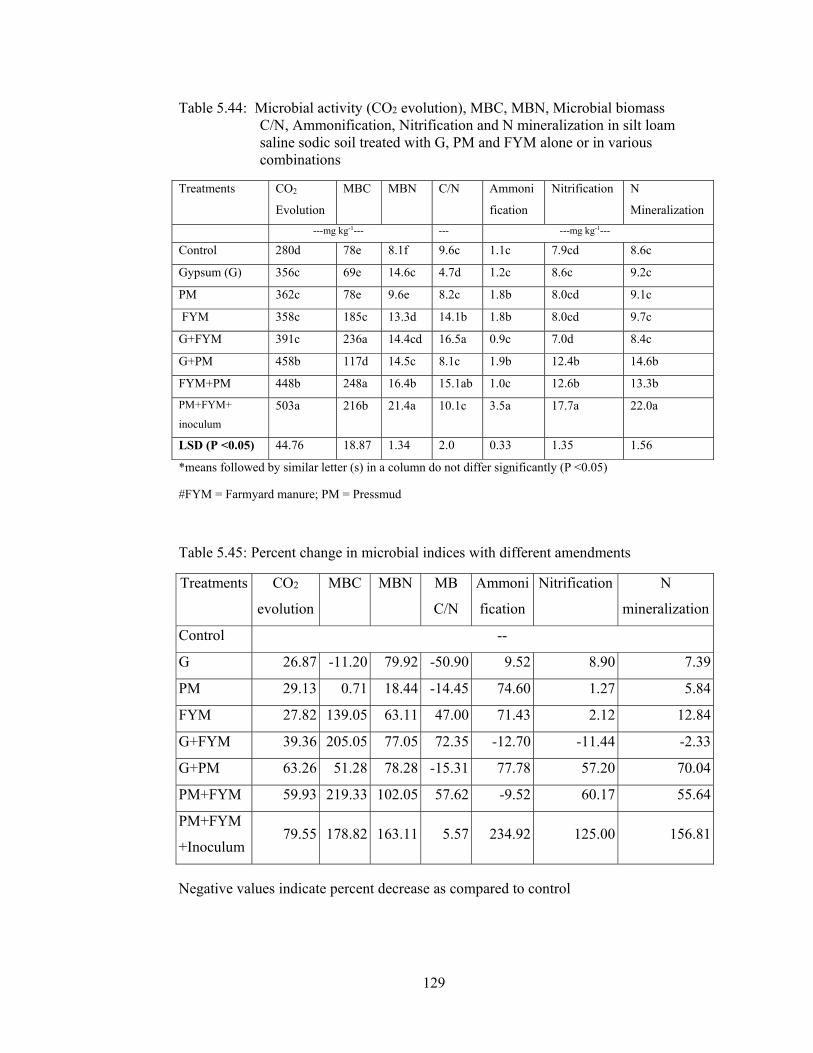
129
Table 5.44: Microbial activity (CO2 evolution), MBC, MBN, Microbial biomass C/N, Ammonification, Nitrification and N mineralization in silt loam saline sodic soil treated with G, PM and FYM alone or in various combinations
Treatments CO2
Evolution
MBC MBN C/N Ammoni
fication
Nitrification N
Mineralization
---mg kg-1--- --- ---mg kg-1---
Control 280d 78e 8.1f 9.6c 1.1c 7.9cd 8.6c
Gypsum (G) 356c 69e 14.6c 4.7d 1.2c 8.6c 9.2c
PM 362c 78e 9.6e 8.2c 1.8b 8.0cd 9.1c
FYM 358c 185c 13.3d 14.1b 1.8b 8.0cd 9.7c
G+FYM 391c 236a 14.4cd 16.5a 0.9c 7.0d 8.4c
G+PM 458b 117d 14.5c 8.1c 1.9b 12.4b 14.6b
FYM+PM 448b 248a 16.4b 15.1ab 1.0c 12.6b 13.3b
PM+FYM+
inoculum
503a 216b 21.4a 10.1c 3.5a 17.7a 22.0a
LSD (P <0.05) 44.76 18.87 1.34 2.0 0.33 1.35 1.56
*means followed by similar letter (s) in a column do not differ significantly (P <0.05)
#FYM = Farmyard manure; PM = Pressmud
Table 5.45: Percent change in microbial indices with different amendments
Treatments CO2
evolution
MBC MBN MB
C/N
Ammoni
fication
Nitrification N
mineralization
Control --
G 26.87 -11.20 79.92 -50.90 9.52 8.90 7.39
PM 29.13 0.71 18.44 -14.45 74.60 1.27 5.84
FYM 27.82 139.05 63.11 47.00 71.43 2.12 12.84
G+FYM 39.36 205.05 77.05 72.35 -12.70 -11.44 -2.33
G+PM 63.26 51.28 78.28 -15.31 77.78 57.20 70.04
PM+FYM 59.93 219.33 102.05 57.62 -9.52 60.17 55.64
PM+FYM
+Inoculum79.55 178.82 163.11 5.57 234.92 125.00 156.81
Negative values indicate percent decrease as compared to control

130
5.4.3.7 Net N mineralization
Analysis of variance showed that most of the treatments significantly (P<0.01) effect
nitrogen mineralization rate. The highest mineralization rate 22 mg kg-1 was
observed for soil treated with microbial inoculums followed by combined
application of G+PM and PM+FYM. Microbes including bacteria, fungi and
actinomycetes are the principal decomposers of organic matter in soil. The role of
soil microorganisms in sustainable productivity has been reviewed (Lee and
Pankhurst, 1992; Lata et al., 2000). No significant effect in N mineralization was
found for soil treated with G, PM, FYM alone or in combination of G+FYM.
Increase in mineralization of C and N can be attributed to a positive effect caused by
incorporation of FYM in the soil, which improves moisture conservation in the soil
stimulating microbial activity of the soil as well as addition of exogenous
microorganisms. The content of inorganic nitrogen released is related to the natural
mineralization potency of soil and is influenced by the simultaneous course of
mineralization and immobilization processed (Bizik, 1989, Bielek, 1998). The main
agent of both types of the processes is soil organisms, especially microorganisms,
which are besides abiotic factors affected by substrate resources.
The role of soil microorganisms in sustainable productivity has been reviewed (Lee
and Pankhurst, 1992; Lata et al., 2000). Microbes including bacteria, fungi and
actinomycetes are the principal decomposers of organic matter in soil. According to
the results of Vanek et al. (1997a), the amounts of mineral and mineralizable
nitrogen reached values of 30 to 50 ppm in soils unfertilized organically for a long
time. After fertilization with farmyard manure together with mineral fertilizers and
with pea as the previous crop, the values increased to 80 ppm in arable soil layer.
The decisive part of nitrogen available for plants comes from microbial biomass
mineralization (Novak, 1993). The turnover of nitrogen from dead microbial cells is
approximately 5 times quicker than the turnover of other soil nitrogen. This is
affected not only by abiotic factors but also by the input of substrate resources
whose quality and quantity are important from the viewpoint of net nitrogen
mineralization (Bielek, 1998).

131
5.4.3.8 Crop response to amendments
Wheat and maize were used to test the effect of different treatments used in
reclamation of saline sodic soil. Wheat was sown in October, 2009 while maize was
tested in March, 2010. Due to the adverse saline sodic condition of the soil (EC >20
dSm-1, pH=10.0) the test crops were unable to germinate. It might be due to the crust
formation or high alkalinity.
0
100
200
300
400
500
600
Control G PM FYM G+FYM G+PM PM+FYMInoculum
CO
2ev
olut
ion
(mg
kg-1
)
Soil amendments
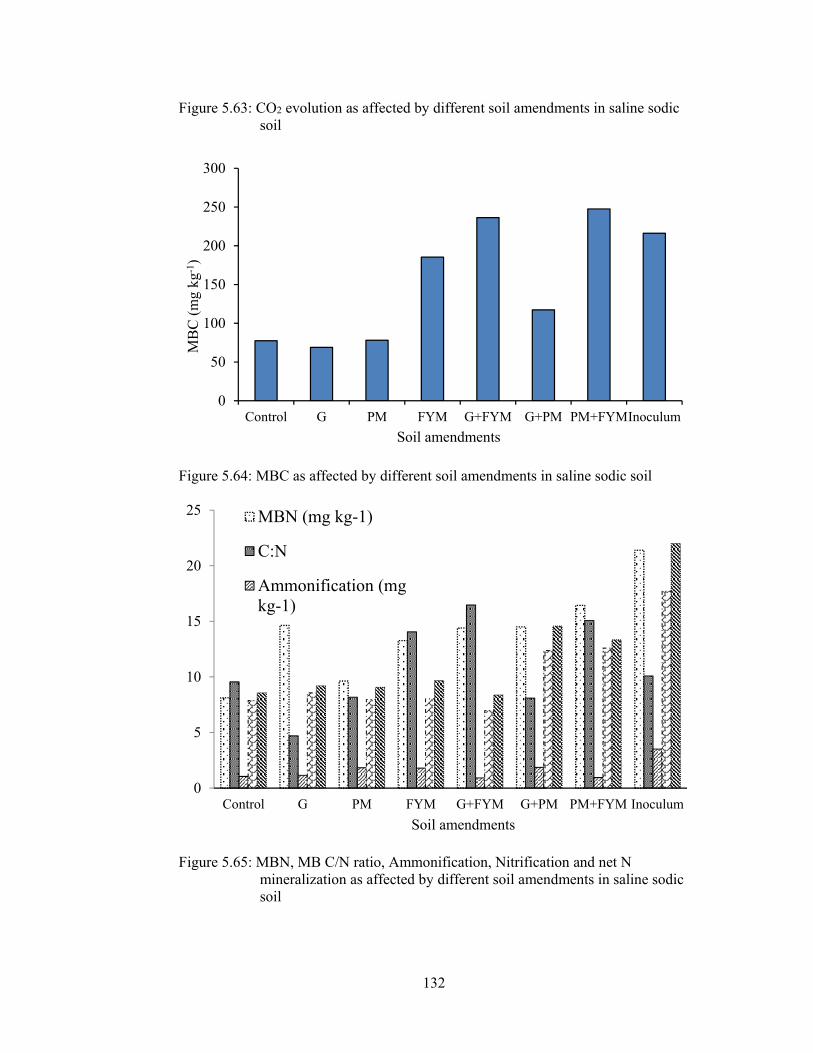
132
Figure 5.63: CO2 evolution as affected by different soil amendments in saline sodic soil
Figure 5.64: MBC as affected by different soil amendments in saline sodic soil
Figure 5.65: MBN, MB C/N ratio, Ammonification, Nitrification and net N mineralization as affected by different soil amendments in saline sodic soil
0
50
100
150
200
250
300
Control G PM FYM G+FYM G+PM PM+FYMInoculum
MB
C (
mg
kg-1
)
Soil amendments
0
5
10
15
20
25
Control G PM FYM G+FYM G+PM PM+FYM Inoculum
Soil amendments
MBN (mg kg-1)
C:N
Ammonification (mgkg-1)
133
6 SUMMARY
Soil salinity is a worldwide problem which not only influences the physical and
chemical properties of soil but may also seriously affect the microbiological
properties of soil. This project was undertaken with the objective to assess the
behavior of various microbiological properties of soil in relation to salinity during
2009-2012. In this connection, a series of incubation experiments were conducted to
evaluate the effect of salts on soil microbiological properties. In first experiment,
soil microbiological properties were measured in relation to various salinity
parameters in naturally occurring salt affected soils. In next experiments, the effect
of NaCl and MgCl2 induced salinity on N dynamics and soil microbial activity were
evaluated. Finally, the effect of pressmud, gypsum, farmyard manure and microbial
inoculation were assessed on various soil microbiological properties including soil
microbial biomass C and N, ammonification, nitrification, CO2 evolution and N
mineralization in a saline-sodic soil.
For experiment 1, soil samples (0-20 cm) were collected from salt affected soils with
EC ranged from < 4.0 to 32 dS m-1 in November 2009. The samples were analyzed
for soil microbiological properties (such as microbial biomass C, and N, microbial
biomass C/N ratio, N mineralization, nitrification and rate of soil respiration) and
soil chemical properties (such as pH, EC, soluble Ca+Mg, soluble sodium, SAR
(sodium adsorption ratio), ESP (exchangeable sodium percentage), carbonates,
bicarbonates and chloride). The results showed that almost all microbial indices
including MBC, MBN, basal soil respiration, nitrification and net N mineralization
were negatively correlated with increasing salinity (r = -0.89, -0.74, -0.79, -0.64 and
-0.57 respectively) except microbial biomass C/N ratio which showed positive
response to increasing soil salinity (0.61). The effect of salinity on rate of CO2
evolution (soil respiration) was more pronounced during the first two days of
incubation period. However, differences between soils with different salinity levels
become narrower as incubations advanced to 10 days. MBC, MBN, basal soil
respiration net nitrification and net N mineralization strongly affected with SAR and
ESP and the relationship is depressive. Carbonates and bicarbonate of all the soils
analyzed showed little response to any of the analyzed biological parameters. It is
134
concluded from the correlation data that all biological parameter, except soil
microbial biomass C/N ratio decreased with increasing salinity.
In experiment 2, the effect of NaCl induced salinity were measured on microbial
activity and N mineralization in a silty clay loam non-saline soil (EC = 0.65 dS m-1)
during lab incubation experiment. The results showed that all treatments
significantly reduced CO2 evolution during all incubation periods. A more
pronounced and significant reduction in CO2 evolution was observed for soils with
EC of 8 dSm-1 and the highest reduction in CO2 evolution was observed with the
highest EC of 40 dSm-1. The greatest reduction in CO2 evolution (90%) was
occurred during the 1st 10 days of incubation period and 80% during 20-40 days of
incubation period. Similar depressive effect of NaCl induced salinity was observed
for N mineralization. The lowest N mineralization was observed for soils with EC
40 dSm-1, even with the lowest EC level reduced N mineralization by 10% during 1st
10 days of incubation period. These results suggested that NaCl induced salinity
substantially reduced both the microbial activity and N mineralization in soil.
Another experiment was conducted to assess the influences of MgCl2 induced
salinity on microbial activity and N mineralization and compare its results with that
obtained with the NaCl experiment. The results showed that all treatments reduced
CO2 evolution but more pronounced and significant reduction in CO2 evolution was
found for soils with EC of 4 dSm-1 and the highest reduction in CO2 evolution was
observed with EC of 40 dSm-1. Similarly, reduction in N mineralization was
observed with all treatments and the highest reduction (80%) was observed for soil
receiving MgCl2 in amount >50 mg g-1 soil during the 1st 10 days of incubation
period. N mineralization was reduced to 26.2 mg kg-1 from 145.1 mg kg-1 (82%)
with the highest MgCl2 addition (200 mg g-1 soil) during the next 10 days of
incubation period.
Finally in experiment 4, the effect of pressmud, gypsum, farmyard manure and
microbial inoculation were measured on maize growth and on soil microbiological
properties in a saline sodic soil (pH >10.0 and EC > 20 dSm-1) in pot experiment.
Treatments were; control, gypsum (G), pressmud (PM), farmyard manure (FYM),
G+FYM, G+PM, PM+FYM and PM + FYM + microbial inoculation arranged in a
135
CR design with 3 replications. Respective treatments were applied on July 3, 2010
and incubated for two months in the glass house at ambient temperature. The pots
were irrigated to maintain soil moisture capacity at around 60%. After two months
of incubation period all the soil samples were run to measure microbial activity and
N mineralization. The results showed that almost all soil amendments significantly
increased the CO2 evolution under saline-sodic soil conditions. The highest CO2
evolution of 503 mg kg-1 was recorded in soil amended with PM + FYM + microbial
inoculums this was followed by G + PM, and PM+FYM treatments. The lowest CO2
evolution was obtained in the un-amended soil. As compared to control, PM + FYM
increased CO2 evolution by 60%. The effect was further enhanced to 80% when
microbial inoculum was combined with PM + FYM. The measured rate of CO2
production can greatly help in the amelioration of sodic or saline-sodic soils. The
CO2 after reacting with H+ can help in the dissolution of calcium carbonate and
released Ca++ which replaces Na+ from clay particles. These results suggested that
soil microorganisms were capable to survive and perform to a large extent their
metabolic functions under the salt stress conditions and providing energy sources (in
the form of FYM or PM) further improved their metabolic activity.
Other microbial attributes (such as microbial biomass C and N, microbial biomass
C/N ratio, ammonification, nitrification, and N mineralization) exhibited almost
similar pattern of response to amended treatments. As for CO2 evolution, the PM +
FYM + inoculation treatment produced the greatest MB-C & N, ammonification,
nitrification and N mineralization. These treatments increased the MB-C by 179%,
MB-N by 163%, ammonification by 235%, N mineralization by 157% and
nitrification by 125% compared with the control un-amended treatment.
Wheat and maize were used to test the effect of different treatments used in
reclamation of saline sodic soil. Wheat was sown in October, 2010 while maize was
tested in March, 2011. Due to the adverse saline sodic condition of the soil (EC >20
dSm-1, pH=10.0) the test crops were unable to germinate.

136
7 CONCLUSIONS AND RECOMMENDATIONS
Increasing soil salinity, combined with high soil pH, showed negative effect
on all microbial indices including MBC, MBN, basal soil respiration,
nitrification and net nitrogen mineralization.
All analyzed biological parameters were little affected by the levels of
carbonates and bicarbonates.
Both CO2 evolution and N mineralization decreased significantly with
increasing NaCl salinity, and the reduction was proportional to the NaCl
levels.
The results showed that increasing NaCl salinity from 0.64 to 40 dS m-1
decreased cumulative CO2 production by 80% and N mineralization by 50%
during 40 days of incubation.
Induced MgCl2 salinity from 0.64 to 40 dS m-1 decreased cumulative CO2
production by 95% and N mineralization by 81% during 30 days of
incubation.
These results demonstrated that soil microorganisms were highly sensitive to
NaCl salinity indicating that salinity is a stress factor and can reduce
microbial diversity and control microbial abundance, composition and
functions.
The results suggested that amendments of saline-sodic soil with organic
sources substantially improved the microbial attributes in soil and thus can
play significant role in the amelioration of saline sodic or sodic soils.
Organic matter decomposition increases the production of CO2 and liberation
of H+ ions. The H+ ions enhance the dissolution of CaCO3 and release more
Ca to replace Na from clay particles and thus can help in the reclamation of
saline sodic soils.
Soil amendments plus proper salinity management practices are required for
the amelioration of adverse effect of saline-sodic soil. Apply farmyard
manure and crop residues once every three to four years to saline areas. This
will provide additional organic matter to the soil.
137
8 LITERATURE CITED
Abbas, F., and A. Fares. 2009. Soil organic carbon and carbon dioxide emission from an organically amended Hawaiian Tropical Soil. Soil Sci. Soc. Am. J. 73: 995-1003.
Abdou F.M., T. El-Kobbia, and L.H. Sorensen. 1975. Decomposition of native organic matter and labelled barley straw in different Egyptian soils. Beitriige zur Tropischen Landwirtschaft und Veteriniirmedizin. 13: 203-209.
Abrol, I.P., J.S.P. Yadav, and F.I. Massoud. 1988. Salt-affected soils and their management. FAO- Soils Bulliton-39. FAO, Rome Italy.
Agarwal, A.S., B.R. Singh, and Y. Kanehiro. 1971. Ionic effect of salts on mineral nitrogen release in an allophonic soil. Proceedings of the Soil Sci. Soc. Am. 35: 454-457.
Ahmad, N., and M. Qadir. 1995. Reclamation methods for saline-sodic soils of Pakistan. p. 319-324. In M.A. Khan and I.A. Ungar (eds.) Biology of salt tolerant plants. Book Crafters, Chelsea, Mishigan, USA.
Alam, S.M., R. Ansari, S.M. Mujtaba, and A. Shereen. 2000. Saline Agriculture and Pakistan. NIA, Tandojam, Pakistan, pp: 32-35.
Al-Nabulsi, Y.A. 2001. Saline drainage water, irrigation frequency and crop species effects on some physical properties of soils. J. Agron. Crop Sci. 186: 15-20.
Anderson, J.P.E., and K.H. Domsch. 1980. Quantities of plant nutrients in the microbial biomass of selected soils. Soil Sci. 130: 211-216.
Anderson, T.H. 2003. Microbial eco-physiological indicators to assess soil quality. Agriculture, Ecosystems and Environment. 98: 285-293.
Andersson, S., I. Nilsson, and P. Saetre. 2000. Leaching of dissolved organic carbon (DOC) and dissolved organic nitrogen (DON) in mor humus as affected by temperature and pH. Soil Biol. Biochem. 32: 1-10.
Anzecc .2000. Australian and New Zealand Guidelines for Fresh and Marine Water Quality. Volume 1 The Guidelines, Chapter 4. Department of the Environment and Heritage. Australian Government.
Arao, T. 1999. In situ detection of changes in soil bacterial and fungal activities by measuring 13C incorporation into soil phospholipid fatty acids from 13C acetate. Soil Biol. Biochem. 31: 1015-1020.
Armstrong, A.S.B., and T.W. Tanton. 1992. Gypsum application to aggregated saline-sodic clay top soils. J. Soil Sci. 43: 249-260.
Ashraf, M., S. Hasnain, O. Berge, and T. Mahmood. 2004. Inoculating wheat seedlings with exopolysaccharide-producing bacteria restricts sodium uptake and stimulates plant growth under salt stress. Biol. Fertil. Soils. 40: 157-162.
Ayers, R.S., and D.W. Westcot. 1985. Water quality for agriculture. FAO Irrigation and Drainage Paper 29, Rev. 1. FAO, Rome. p. 63.
138
Baath, E., and T.H. Anderson. 2003. Comparison of soil fungal/bacterial ratios in a pH gradient using physiological and PLFA-based techniques. Soil Biol. Biochem. 35: 955-963.
Badran, R.A.M. 1994. Cellulolytic activity of some cellulose decomposing fungi in salinized soils. Acta Mycologica. 29: 245-321.
Baldock, J.A., and J.O. Skjemstad. 2000. Role of the soil matrix and minerals in protecting natural organic materials against biological attack. Organic Geochemistry. 31: 697-710.
Bandyopadhyay, B.K., and A.K. Bandyopadhyay. 1983. Effect of salinity on mineralization and immobilization of nitrogen in a coastal saline soil of west Bengal. Indian J. Agric. 27: 41-50.
Barber, S.A. 1984. Manganese. In Soil Nutrient Bioavailability: A mechanistic approach. Wiley-Interscience, New York. pp. 332-336.
Bardgett, R.D., A.C. Jones, D.L. Jones, S.J. Kemmitt, R. Cook, and P. Hobbs. 2001. Soil microbial community patterns related to the history and intensity of grazing in sub-montane ecosystems. Soil Biol. Biochem. 33: 1653-1664.
Barry, G.A., G.E. Rayment, A.J. Jeffery, and A.M. Price. 2001. Changes in cane soil properties from application of sugar mill by-products. In: proc. 2001 Conference of the Aust. Soc. Sugarcane Tech. Mackay, Queensland, Australia. pp. 185-199.
Bashan, Y., and G. Holguin. 1997. Azospirillum-plant relationships: environmental and physiological advances (1990-1996). Can. J. Microbiol. 43: 103-121.
Bashan, Y., G. Holguin, and L. de-Bashan, 2004. Azospirillum-plant relationships: physiological, molecular, agricultural, and environmental advances (1997-2003). Can. J. Microbiol. 50: 521-577.
Batra, L., A. Kumari, M.C. Manna, and R. Chhabra. 1997. Microbiological and chemical amelioration of alkaline soil by growing Karnal grass and gypsum application. Experimental Agriculture. 33: 389-397.
Batra, L., and M.C. Manna.1997. Dehydrogenase activity and microbial biomass carbon in salt-affected soils of semiarid and arid regions. Arid Soil Res. Rehabilitation. 11: 295-303.
Belimov, A.A., A.P. Kojemiakov, and C.V. Chuvarliyeva. 1995a. Interaction between barley and mixed cultures of nitrogen fixing and phosphate-solubilising bacteria. Plant and Soil. 173: 29-37.
Bell, L.C. 1993. Basic properties of soils. In: A Training Course for the Non-soils Specialist, Invited Lectures (Fergus, I.F., and K.J. Coughlan eds.) Aust. Soc. Soil Sci. Inc., pp. 33-54.
Bielek, P. 1998. Nitrate in agricultural soils of slovakia. Výskumný ústav pôdnej úrodnosti, Bratislava. (in slovak). p. 135.
Bizik, j. 1989. Conditions of Optimisation by nitrate nutrification of Plants. Polnohospodárstvo, séria A, SAV Bratislava. (in slovak).
Black, C.A. 1968. Soil-plant relationships.Wiley, London.

139
Blagodatskaya, E.V., and T.H. Anderson .1998. Interactive effects of pH and substrate quality on the fungal-to-bacterial ratio and QCO2 of microbial communities in forest soils. Soil Biol. Biochem. 30: 1269-1274.
Bohn, H.L., B.L. McNeal, and G.A. O’Connor. 2001. Soil Chemistry. 3rd Ed. John Wiley and Sons, Inc. New York.
Bonde, T.A., J. Schnürer, and T. Rosswall. 1988. Microbial biomass as a fraction of potentially mineralizable nitrogen in soils from long-term field experiments, Soil Biol. Biochem. 20: 447-452.
Brady, N.C., and R.R. Weil. 1999. The nature and Properties of Soils. 12th ed. Maxwell-Macmillan Publishing Company, New York, USA.
Brady, N.C., and R.R. Weil. 2002. The Nature and Properties of Soils. 13th ed. Prentice Hall, Inc., USA.
Bremner, J.M. 1996. Nitrogen-Total. In Methods of soil analysis Part 3-Chemical methods, eds. D.L. Sparks. SSSA and ASA Book series No. 5, Madison, Wisconsin, USA. pp. 1085-1122.
Bresler, E., B.L. McNeal, and D.L. Carter. 1982. Saline and sodic soils: Principles-dynamics-modeling. Springer-Verlag, NY, USA.
Broadbent, F.E., K.B. Tyler, and G.N. Hill. 1957. Nitrification of ammoniacal fertilizers in some California soils. Hilgardia. 27: 247-267.
Brookes, P.C., A. Landman, G. Pruden, and D.S. Jenkinson. 1985. Chloroform fumigation and the release of soil nitrogen: a rapid direct extraction method to measure microbial biomass nitrogen in soil. Soil Biol. Biochem. 17: 837-842.
Carter, M.R. 1986. Microbial biomass and mineralizable nitrogen in Solonetzic soils. Influence of gypsum and lime amendments. J. Soil Biol. Biochem. 18: 531-537.
Chand, M., I.P. Abrol, and D.R. Bhumbla, 1977. A comparison of the effect of eight amendments on soil properties and crop growth in a highly sodic soil. Ind. J. Agric. Sci. 47: 348-54.
Chander, K., J. Dyckmans, R.G. Joergensen, B. Meyer, and M. Ranbuch. 2001. Different source of heavy metals and their long-term effects on soil microbial properties. Biol. Fertil. Soils 34: 241-247.
Chander, K., S. Goyal, and K.K. Kapoor .1994. Effect of sodic water irrigation and farmyard manure application on soil microbial biomass and microbial activity. Appl. Soil Ecol. 1: 139-144.
Chander, K., and R.G. Joergensen. 2007. Microbial biomass and activity indices after organic substrate addition to a selenium contaminated soil. Boil. Fertil. Soils. 44: 241-244.
Chandra, S., H.C. Joshi, H. Pathak, M.C. Jain, and N. Kalra. 2002. Effect of potassium salts and distillery effluent on carbon mineralization. Bioresource Technology. 83: 255-257.
140
Chaudhry, M.R., Ihsanullah, A. Hamid, and M.A. Javed. 1982. Role of Inorganic and Organic Amendments in Reclamation of Saline-Sodic Soils. Mona Publication No. 124. MREP, WAPDA, Lahore. p. 25.
Chaudhry, M.R. 2001. Gypsum efficiency in the amelioration of saline sodic/sodic soils. Int. J. Agri. Biol. 3(3): 276-280.
Chaudhry, M.R., and Ihsanullah. 1989. Effect of different mesh sized gypsum on the reclamation of saline sodic soil. Mona Reclamation Experimental Project WAPDA Publication No. 173. p. 32.
Chaudhry, M.R., M.S. Rafique, and C.B. Ahmed. 1986. Effect of different grades of gypsum on soil properties and crop yield. Mona Reclamation Experimental Project, WAPDA Publication No.153. p. 20.
Cheny, K., and R.S. Swift. 1984. The influence of organic matter on aggregate stability in some British soils. Soil Sci. 35: 223-230.
Clark, G.J., N. Dodgshun, P.W.G. Sale, and C. Tang. 2007. Changes in chemical and biological properties of a sodic clay subsoil with addition of organic amendments. Soil Biol. Biochem. 39: 2806-2817.
Conde, E., M. Cardenas, A. Ponce-Mendoza, M.L. Luna-Guido, C. Cruz-Mondragon, and L. Ddendooven. 2005. The impact of inorganic nitrogen application on mineralization of 14C-labelled maize and glucose, and on priming effect in saline alkaline soil. Soil Biol. Biochem. 37: 681-691.
Cramer, G.R., C.L. Schmidt, and C. Bidart. 2001. Analysis of cell wall hardening and cell wall enzymes of salt-stressed maize (Zea mays) leaves. Aust. J. Plant Physiol. 28: 101-109.
Curtin, D., and R. Naidu. 1998. Fertility constraints to plant production. In M.E. Sumner and R. Naidu (eds.) Sodic Soils: Distribution, management and environmental consequences, Oxford University Press New York. pp. 107-123.
Darrah, P.R., P.H. Nye, and R.E. White . 1987. The effect of high solute concentrations on nitrification rates in soil. Plant Soil. 97: 37-45.
Dee, B.M., R.J., Haynes, and M.H. Graham. 2003. Changes in soil acidity and the size and activity of the microbial biomass in response to the addition of sugar mill wastes. Biol. Fertil. Soils 37: 47-54.
Dick, W.A., L. Cheng, and P. Wang. 2000. Soil acid and alkaline phosphatase activity as pH adjustment indicators. Soil Biol. Biochem. 32: 1915-1919.
Diez, T., and M. Krauss. 1997. Effect of long-term compost application on yield and soil fertility. Agribiological Research. Zeitschrift Fur Agrarbiologie. Agriculturchemie Okologie, Germany. 50: 78-84.
Donahue, R.L., R.W. Miller, and J.C. Shickluna. 1983. Soils: An Introduction to Soil and Plant Growth. Englewood Cliffs, New Jersey: Prentice-Hall, Inc. p. 667.
141
Doneen, L.D. 1975. Water quality for irrigated agriculture. In A. Poljakoff-Mayber and J. Gale (eds.) Plants in Saline Environment. Springer, Herlin Heidelberg New York, pp. 56-75.
Duran, Q.R. 1993. Organic manures based on filter-press cake. Serie-Tecnica -CENICANA,-Centro-de-Investigacion-de-la-Cana-de-Azucar-de-Colombia. No. 12. p. 47.
Dutt, G.R., R.M. Terkeit-Qub, and R.S. Ranschkolb. 1971. Prediction of gypsum and leaching requirements for sodium affected soils. Soil Sci. Soc. Am. Proc. 35: 93-103.
Elsayed, M.T., M.H. Babiker, M.E. Abdelmalik, O.N. Mukhtar, and D. Montange. 2008. Impact of filter mud application on the germination of sugarcane and small-seeded plants and on soil and sugarcane nitrogen contents. Bioresource Tech. 99: 4164-4168.
Elshout, S.V.D., and A. Kamphorst. 1990. Suitability of coarse-grade gypsum for sodic soil reclamation: a laboratory experiment. Soil Sci. 149: 228-234.
Engelking, B., H. Flessa, and R.G. Joergensen. 2007. Shifts in amino sugar and ergosterol contents after addition of sucrose and cellulose to soil. Soil Biol. Biochem. 39: 2111-2118.
Entry, J.A., B.H. Wood, J.H. Edwards, and C.W. Wood. 1997. Influence of organic by-products and nitrogen source on chemical and microbiological status of an agricultural soil. Biol. Fertil. Soils 24: 196-204.
FAO/UNESCO. 1973. Irrigation, drainage and salinity: An international sources-book. London: Hutchinson.
Ferreras, L., E. Gomez, S. Toresani, I. Firpo, and R. Rotondo. 2006. Effect of organic amendments on some physical, chemical and biological properties in a horticultural soil. Bioresource Tech. 97: 635-640.
Ferreras, L.A., J.L. Costa, F.O. Garcia, and C. Pecorari. 2000. Effect of no-tillage on some soil physical properties of a structural degraded Petrocalcic Paleudoll of the southern Pampa of Argentina. Soil Till. Res. 54: 31-39.
Fetter, C.W. 2001. Applied Hydrogeology, 4th Edition. Prentice Hall, USA.
Fierer, N., and R. Jackson. 2006. The diversity and biogeography of soil bacterial communities. Proc. Natl. Acad. Sci. USA. 103: 626-631.
Fitzpatrick, R.W., S.C. Boucher, R. Naidu, and E. Fritsch. 1995. Environmental Consequences of Soil Sodicity. In Naidu, R., Sumner, M.E. and Rengasamy, P. eds. Australian Soils: Distribution, properties and management. CSIRO, Australia. pp.163-176.
Fitzpatrick, R.W., P. Rengasamy, R. Merry, and J. Cox. 2001. Is dry land salinity reversible? National Dryland Salinity Program.
Flavel, T.C., and D.V. Murphy. 2006. Carbon and nitrogen mineralization rates after application of organic amendments to soil. J. Environ. Qual. 35: 183-193.
142
Flessa, H., M. Potthoff, and N. Loftfield. 2002. Laboratory estimates of CO2 and N2O emissions following surface application of grass mulch: importance of indigenous microflora of mulch. Soil Biol. Biochem. 34: 875-879.
Flis, S.E., A.R. Glenn, and J. Dilworth. 1993. The interaction between aluminium and root nodule bacteria. Soil Biol. Biochem. 25: 403-417.
Flowers, T.J., and A.R. Yeo. 1995. Breeding for salinity resistance in crop plants: where next. Aust. J. Plant Physiol. 22: 875-884.
Francois, L.E., and E.V. Maas.1994. Crop Response and Management on Salt Affected soils. In: Handbook of Plant and Crop Stress. Pessarakli M. (Ed.). Publisher Marcel Dekker, Inc. New York. pp. 148-181.
Frankenberger, Jr.W.T., and F.T. Bingham. 1982. Influence of salinity on soil enzyme activities. Soil Sci. Soc. Am. J. 46: 1173-1177.
Frenkel, H., Z. Gerstle, and N. Alperovitch. 1989. Exchange-induced dissolution and the reclamation of sodic-soils. J. Soil Sci. 40: 599-611.
Frostegard, A., Baath, E., and A. Tunlid. 1993. Shifts in the structure of soil microbial communities in limed forests as revealed by phospholipid fatty acid analysis. Soil Biol. Biochem. 25: 723-730.
Gaikwad, S.S., R.B. Puranik, and S.D. Deshmukh. 1996. Dynamics of soil microbial population and nutrient availability as influenced by application of pressmud cake in an Entisol. J. Soils and Crops. 6(1): 82-85.
Gal, M., L. Arcan, I. Shainberg, and R. Keren. 1984. Effect of exchangeable sodium and phosphogypsum on crust structure-scanning electron microscope observation. Soil Sci. Soc. Am. J. 48: 872-878.
Galal, Y.G.M., I.A. El-Ghandour, M.E. Osman, and A.M.N. Abdel. 2003. The effect of inoculation by mycorrhizae and rhizobium on the growth and yield of wheat in relation to nitrogen and phosphorus fertilization as assessed by 15n techniques, Symbiosis. 34(2): 171-183.
Galinski, E.A. 1995. Osmoadaptation in bacteria. Adv. Microb. Physiol. 37:273-328.
Gao, G., and C. Chang. 1996. Changes in CEC and particle size distribution of soils associated with long term annual applications of cattle feedlot manure. Soil Sci. 161: 115-120.
Garcia, C., and T. Hernandez. 1996. Influence of salinity on the biological and biochemical activity of a calciorthird soil. Plant and Soil. 178: 225-263.
Gardner, W.H. 1986. Water content. In A. Clute (ed.) Methods of Soil Analysis. Part 1. 2nd Ed. Agronomy. pp. 383-411.
Garg, B.K., and I.C. Gupta. 1997. Saline Wastelands Environment and Plant Growth. Jodhpur, India: Scientific Publishers. p. 283.
Gee, G.W., and J.W. Bauder. 1986. Particle-size analysis. In: Methods of Soil Analysis Part 1-Physical and mineralogical methods, 2nd edition, Page, A.L. ed. Agronomy Monograph 9, American Society of Agronomy, Madison, WI. pp. 383-411.
143
Ghafoor, A., M. Qadir, and G. Murtaza. 2004. Salt-Affected Soil: Principle and Management. Allied Book Centre, 34-Urdu Bazar, Lahore, Pakistan.
Ghafoor, A., M.M. Ahmad, S. Muhammad, and N. Ahmad. 1989. Efficiency of gypsum grades and quality of leaching water for reclaiming a saline-sodic soil. II. Chemical improvement of soil. Pak. J. Agric. Sci. 26: 313-321.
Ghafoor, A., S. Muhammad, and N. Ahmad. 1985. Reclamation of Khurrianwala saline-sodic soil. Bull. Pakistan Council of Research in Water Resources. 15(1): 23-28.
Ghafoor, A., S. Muhammad, N. Ahmad, and M.A. Mian. 1990. Making salt-affected soils and waters productive; I. Gypsum for the reclamation of sodic and saline-sodic soils. Pak. J. Agric. Sci. 41-42: 23-37.
Ghassemi, F., A. J. Jakeman, and H.A. Nix. 1995. Salinisation of Land and Water Resources: Human Causes, Extent, Management and Case Studies. CABI Publishing, Wallingford, UK. p. 517.
Giusquiani, P.L., M. Pagliai, G. Gigliotii, D. Businelli, and A. Benetti. 1995. Urban waste compost: Effects on physical, chemical and biochemical soil properties. J. Environ. Qual. 24: 175-182.
Goyal, S., K. Sakamoto, K. Inubushi, and K. Kamewada. 2006. Long-term effects of inorganic fertilization and organic amendments on soil organic matter and soil microbial properties in Andisols. Archives of Agron. Soil Sci. 52(6): 617-625.
Grace, P.R., M. Colunga-Garcia, S.H. Gage, G.P. Robertson, and G.R. Safir. 2006. The potential impact of agricultural management and climate change on soil organic carbon resources in terrestrial ecosystems of the North Central Region of the United States. Ecosystem. 9: 816-827.
Grattan, S.R., and C.M. Grieve. 1999. Salinity-mineral nutrient relations in horticultural crops. Scientia Horticulturae. 78: 127-157.
Grattan, S.R., and J.D. Oster. 2003. Use and reuse of saline-sodic water for irrigation of crops. In S.S. Goyal, S.K. Sharma, and D.W. Rains (Eds.) Crop Production in Saline Environments: Global and Integrative Perspectives. Haworth Press, New York, pp. 131-162.
Greene, R.S.B., P. Rengasamy, G.W. Ford, C.J. Chartres, and J.J. Miller. 1988. The effect of sodium and calcium on physical properties and micromorphology of two red-brown earth soils. J. Soil Sci. 39: 639-648.
Gunn, R.H., and D.P. Richardson. 1979. The Nature and Possible Origins of Soluble Salts in Deeply Weathered Landscapes of Eastern Australia. Aust. J. Soil Res.17: 197-215.
Gupta, S.K., and I.C. Gupta. 1997. Management of Saline Soils and Waters. Revised Ed. Scientific Publishers, Jodphur, India.
Haq, I. 2005. Management of salt-affected soils and brackish waters in Pakistan. Natl. Coordination project. Final Completion Report. NWFP Agric. University, Peshawar.

144
Harmsen, G.W., and D.A. VanSchreven. 1955. Mineralization of organic nitrogen in soil. Adv. Agron. 7: 299-398.
Hinrich, L., Bohn, L. Brain, McNeal, A. George, and O’Connor. 2001. Soil Chemistry. Wiley, New York, pp. 35-40.
Horwath, W.R., and E.A. Paul. 1994. Microbial Biomass. In: Methods of soil analysis. Part 2. Microbiological and Biochemical Properties. Weaver, R.W., J.S. Angle, and P.S. Bottomley, (eds). Soil Sci. Soc. Am. Inc., Madison, WI. 14: 2753-2773.
Hussain, N., G. Hassan, M. Arshadullah, and F. Mujeeb. 2001. Evaluation of amendments for the improvement of physical properties of sodic soil. Int. J. Agric. Biol. 3: 319-322.
Ibrahim, S.M. and H. Shindo. 1999. Effect of continuous compost application on water - stable soil macroaggregation in a field subjected to double cropping. Soil Sci. Plant Nutr. 45: 1003-1007.
Ilyas, M., R.H.Qureshi, and M.A. Qadir. 1997. Chemical changes in a saline-sodic soil after gypsum application and cropping. Soil Technology. 10: 247-260.
Isabelo, S.A., and E.R. Jack. 1993. Phosphogypsum in agriculture. Adv. Agron.49: 55-118.
Jenkinson, D.S., and J.N. Ladd. 1981. Microbial biomass in soil, measurement and turnover. Soil biochem. 5: 415-471.
Johnson, D.D., and W.G. Guenzi. 1963. Influence of salts on ammonium oxidation and carbon dioxide evolution from soil. Proc. Soil Sci. Soc. Am. 27: 663-666.
Jurinak, J.J. 1990. The chemistry of saltaffected soils and waters. In: Agricultural Salinity Assessment and Management. Tanji, K.K. (ed.) Am. Soc. Civil Engineers. NY. pp. 42-63.
Jury, H.A., G. Sinai, and L.H. Stolzy. 1979. Future sources of cooling water for power plants in arid regions. Water Resour. Bull. 15(5): 1444-1458.
Kafi, M., and M. Goldani. 2001. Effect of water potential and type of osmoticum on seed germination of three crop species of wheat, sugarbeet, and chickpea. Agric. Sci. Tech. 15: 121-133.
Kara, O., and I. Bolat. 2007. Impact of alkaline dust pollution on soil microbial biomass carbon. Turk. J. Agric. For. 31: 181-187.
Kaur, T., B.S. Brar, and N.S. Dhillon. 2008. Soil organic matter and nutrient dynamics as affected by long term use of organic and inorganic fertilizers under maize-wheat cropping system. Nutrient Cycling in Agroecosystems. 81: 59-69.
Kautz, T., S. Wirth, and F. Ellmer. 2004. Microbial activity in a sandy arable soil is governed by the fertilization regime. Eur. J. Soil Biol. 40: 87-94.
Kelley, W.P. 1951. Alkali Soils. Reinhold Publ. Corp., New York.
Keren, R., and S. Miyamoto. 1990. Reclamation of saline, sodic and boron- affected soils. In: Agricultural saline assessment and management. Tanji K.K. (ed.)
145
ASCE Manuals and Reports on Engineering Practices 71. Am. Soc. of Civil Engineering, NY. pp. 410-431.
Khammas, K.M., and P. Kaiser. 1992. Pectin decomposition and associated nitrogen fixation by mixed cultures of Azospirillum and Bacillus species. Can. J. Microbiol. 38: 794-797.
Khan, A.G., 2006. Mycorrhizoremediation—an enhanced form of phytoremediation. J. Zhejiang Univ. Sci. 7(7): 503-514.
Khan, G.S. 1993. Characterization and genesis of saline-sodic soils in Indus plains of Pakistan. Ph.D thesis, Dept. Soil Sci, Univ. Agric. Faisalabad, Pakistan.
Khattak, R.A., and M.J. Khan. 2004. Evaluation, reclamation and management of saline sodic soils in Kohat division. Final Report. Dept. of Soil and Environ. Science, NWFP Agric. Univ. Peshawar. National Drainage Programme (NDP), Govt. of Pakistan.
Killham, K. 1994. The soil environment. In: Soil Ecology. Killham, K. (Ed.) Cambridge Univ. Press Cambridge. pp. 1-33.
Killham, k., J.P. Schimel, and D. Wu. 1990. Ecophysiology of the soil microbial biomass and its relation to the soil microbial pool. Soil Use Management. 6: 86-88.
Kovda, V.A., C. Van-Den-Berg, and R.M. Hagan. 1973. Irrigation, Drainage and Salinity: An International Source Book. FAO/UNESCO, Hutchison and Co., London, UK.
Kramer, P.J. 1983. Water Relations of Plants. Academic Press, Inc. New York. p. 489.
Lata, A. K. Saxena, and K.V.B.R. Tilak. 2000. Biofertilizers to augment soil fertility and crop production. In: Soil Fertility and Crop Production. Krishna, K.R. (Ed.). Sci. Publishers Inc., Enfield (NH) USA/ Plymouth UK. pp. 279-312.
Lauchli, A., and E. Epstein. 1990. Plant responses to saline conditions. In: Agricultural Salinity Assessment and Management. Tanji, K.K. (ed.) Amer. Soc. Civil Engg. NY. USA. Mann. Rep. Eng. Pract. 71: 113-137.
Laura, R.D. 1973. Effects of sodium carbonate on carbon and nitrogen mineralization of organic matter added to soil. Geoderma. 9: 15-26.
Laura, R.D. 1974. Effects of neutral salts on C and N mineralization of organic matter in soil. Plant and Soil. 41: 113-127.
Laura, R.D. 1976. Effects of alkali salts on carbon and nitrogen mineralization of organic matter in soil. Plant and Soil. 44: 587-596.
Laura, R.D. 1977. Salinity and nitrogen mineralization in soil. Soil Biol. Biochem. 9: 333-336.
Lee, K.E., and C.E. Pankhurst. 1992. Soil organisms and sustainable productivity. Aust. J. Soil Res. 30: 855-892.
Li, W.J., Q.L. Sun, H. Umemura, H. Cai, L.A. Niu and Y.Z. Ni. 1999. Application of EM technology for intensive organic recycling, soil quality, crop yield and
146
quality, and environmental protection. In: Nature Farming and Sustainable Environment. Xu, H.L.(Ed.) pp. 137-148.
Lindsay, W.L. 1979. Chemical Equilibria in Soils. A Wiley-Interscience Publication. John Willey and Sons, New York.
Linkins, A.E., R.L. Sinsabaugh, C.A. McClaugherty, and J.M. Melills. 1990. Cellulase activity on decomposing leaf litter in microcosms. Plant Soil. 123: 17-25.
Lippi, D., I. Cacciari, T. Pietrosanti, and W. Pietrosanti. 1992. Interactions between Azospirillum and Arthrobacter in diazotrophic mixed culture. Symbiosis. 13: 107-114.
Lorenz, K., K.H. Feger, and E. Kandeler. 2001. The response of soil microbial biomass and activity of a Norway spruce forest to liming and drought. J. Plant Nutr. Soil Sci. 164: 9-19.
Luna-Guido, M.L., and L. Dendooven. 2001. Simulating the dynamics of glucose and NH4
+ in alkaline saline soils of the former Lake Texcoco with the Detran model. Eur. J. Soil Sci. 52: 269-277.
Luna-Guido, M.L., R.I. Beltran-Hernandez, N.A. Solis-Ceballos, N. Hernandez-Chavez, F. Mercado-Garcia, J.A. Catt, V. Olalde-Portugal, and L. Dendooven. 2000. Chemical and biological characteristics of alkaline saline soils from the former Lake Texcoco as affected by artificial drainage. Biol. Fertil. Soils. 32: 102-108.
Maas, E.V., and G.J. Hoffman. 1977. Crop salt tolerance-current assessment. J. Irrigation and Drainage Division, ASCE. 103: 115-134.
Macumber, P.G. 1991. Interaction between groundwater and surface systems in northern Victoria. Melbourne: Department of Conservation and Environment, Victoria.
Madejon, E., R. Lopes, Y.M. Murrilo, and F. Cabrera. 2001. Agricultural use of three (sugar-beet) vinasse compost effects on crops and chemical properties of a cambisol soil in the Quadalquivirm River Valley (SW Spain). Agric. Ecosyst. Environ. 84: 55-65.
Malik, K.A., and K. Haider. 1977. Decomposition of carbon-14 labeled plant material in saline-sodic soils. In: Soil Organic Matter Studies. Proceedings of a Symposium organized by IAEA, FAO and Agrochimica. Intr. Atomic Energy Agency, Vienna. 1: 215-225.
Mamilov, A., O.M. Dilly, S. Mamilov, and K. Inubushi. 2004. Microbial eco-physiology of degrading Aral Sea Wetlands: consequences for C-cycling. Soil Sci. Plant Nutr. 50: 839-842.
Mamo, M., J.F. Moncrief., J.E. Rosen, and T.R. Halbach. 2000. Municipal solid waste compost application on soil water and water stress in irrigated corn. Compost Sci. and Utiliz. 8: 236-246.
Manna, M.C., A. Swarup, R.H. Wanjari, B. Mishra, and D.K. Shahi. 2007. Long-term fertilization, manure and liming effects on soil organic matter and crop yields. Soil Till. Res. 94: 397-409.

147
Marinari, S., G. Masciandaro, B. Ceccanti, and S. Grego. 2000. Influence of organic and mineral fertilizers on soil biological and physical properties. Biores. Technol. 72: 9-17.
Marstorp, H., H. Guan, and P. Gong. 2000. Relationship between dsDNA, chloroform labile C and ergosterol in soils of different organic matter contents and pH. Soil Biol. Biochem. 32: 879-882.
Martikainen, P.J. 1985. Nitrification in forest soil of different soils of different pH as affected by urea, ammonium sulphate and potassium sulphate. Soil Biol. Biochem. 17(3): 363-367.
Martin-Olmedo, P., and R.M. Rees. 1999. Short-term N availability in response to dissolved-organic-carbon from poultry manure, alone or in combination with cellulose. Biol. Fertil. Soils. 29: 386-393.
Masto, R.E., P.K. Chhonkar, D. Singh, and A.K. Patra. 2006. Changes in soil biological and biochemical characteristics in a long-term field trial on a sub-tropical inceptisol. Soil Biol. Biochem. 38: 1577-1582.
Mathew, T., and K. Varughese. 2007. Effect of various nutrients on physic-chemical and biological properties of soils in sugarcane agro-ecosystem. Sugar Technol. 2-3: 147-151.
McClung, G., and Jr.W.T. Frankenberger. 1985. Soil nitrogen transformations as affected by salinity. Soil Sci. 139: 405-411.
McClung, G., and Jr.W.T. Frankenberger. 1987. Nitrogen mineralization rates in saline vs. salt amended soils. Plant Soil. 104: 13-21.
McCormick, R.W., and D.C. Wolf. 1980. Effect of sodium chloride on carbon dioxide evolution, ammonification and nitrification in a Sassafras sandy loam. Soil Biol. Biochem. 12: 153-157.
Mehanni, A.H., and D.J. Chalmers. 1986. Effect of irrigation with saline water on soil properties and salinisation of perennial pasture soils. Aust. J. Exper. Agric. 26: 173-179.
Meiklejohn, J. 1954. Some aspects of the physiology of the nitrifying bacteria symp. Soc. Gen. Microbiol. 4: 68-83.
Mengel, K., and E.A. Kirkby. 1987. Principles of plant nutrition. 4th Ed. Worblaufen-Bern, Switzerland: Intr. potash institute.
Mer, R.K, P.K. Prajith, D.H. Pandya, and A.N. Pandey. 2000. Effect of salts on germination of seeds and growth of young plants of Hordeum vulgare, Triticum aestivum, Cicer arietinum and Brassica juncea. J. Agron. Crop Sci. 185: 209-217.
Minhas, P.S., S.K. Dubey, and D.R. Sharma. 2007. Comparative effects of blending, intera/inter-seasonal cyclic uses of alkali and good quality water on soil properties and yields of paddy and wheat. Agric. Water Manag. 87: 83-90.
Morrill, L.G., and J.E. Dawson. 1967. Patterns observed for the oxidation of ammonium to nitrate by soil organisms. Soil Sci. Soc. Am. Proc. 31: 757-760.
148
Muhammad, S. 1975. Reclamation of salt-affected soils in Pakistan. Proc. Intr. Conf. waterlogging and salinity, Lahore. pp. 339-350.
Muhammad, S. 1983. Salt-affected soils and their reclamation. Presidential Address, Section of Agric. and Forestry, 29th Pakistan Sci. Conf. Univ. Karachi, Pakistan.
Muhammad, S. 1996. Soil salinity, sodicity, and waterlogging. In: Soil Science. Bashir, E., and R. Bantel (Eds.) National Book Foundation, Islamabad, Pakistan. pp. 471-508.
Muhammad, S., and A. Khaliq. 1975. Comparison of various chemical and organic amendments for reclamation of saline-sodic soil. Bull. Irrig. Drainage and Flood Control Res. Council of Pakistan. 5: 50-54.
Muhammad, S., T. Muller, and R.G. Joergensen. 2006. Decomposition of pea and maize straw in Pakistani soils along a gradient in salinity. Boil. Fertil. Soils. 43: 93-101.
Mujtaba, S.M., S. Mughal, and M.H. Naqvi. 2003. Reclamation of saline soils through biological approaches. Business Recorder, June 30, 2003. (http:/waterinfo.net.pk).
Mulvaney, R.L. 1996. Nitrogen - Inorganic forms. In: Methods of Soil Analysis Part-3 Chemical Methods. Sparks, D.L. (Ed.). SSSA Book Series No. 5. SSSA, Inc., ASA, Inc., Madison, Wisconsin, USA. pp. 1123-1184.
Nadler, A., G.J. Lwvy, R. Keren, and H. Eisenberg. 1996. Sodic calcareous soil reclamation as affected by water chemical composition and flow rate. Soil Sci. Soc. Am. J. 60: 252-257.
Naeni, S.A.R., and H.F. Cook. 2000. Influence of municipal waste compost amendment on soil water and evaporation. Commun. Soil Sci. Plant Anal. 31: 3147-3161.
Naidu, R., and P. Rengasamy. 1993. Ion interaction and constraints to plant nutrition in Australian sodic soils. Aust. J. Soil Res. 31: 801-819.
Nelson, P.N., J.N. Ladd, and J.M. Oades. 1996. Decomposition of 14C-labelled plant material in a salt-affected soil. Soil Biol. Biochem. 28: 433-441.
Nelson, D.W., and L.E. Sommer. 1996. Total C, organic C and organic matter. In: Method of Soil Analysis. Part-3. Spark, D.L. (Ed.) Am. Soc. Agron. 34: 961-1010.
Nelson, P.N., B.A. Rahman, and J.M. Oades. 1997. Sodicity and clay type: influence on decomposition of added organic matter. J. Soil Sci. Soc. Am. 61: 1052-1057.
Nguyen, D., R. Fedkiw, and H. Jensen. 2002. Physically based modeling and animation of fire. ACM Trans. Graph. (Siggraph Proc.) 29: 721-728.
Novak, F. 1993. Determination of nitrogen content in microbial biomass by anaerobic incubation method. In: Methods of study nitrogen changes in soils. Simek, M., F. Novak, and H. Santruckova (Eds.) Ceske Budejovice: pp. 37-40. (In Czech)
149
Nugroho, RA, W.F.M. Roling, A.M. Laverman, and H.A. Verhoef. 2007. Low nitrification rates in acid Scots pine forest soils are due to pH-related factors. Microb. Ecol. 53: 89-97.
Nyborg, M., and P.B. Hoyt. 1978. Effects of soil acidity and liming on mineralization of soil nitrogen. Can. J. Soil Sci. 58: 331-338.
Okur, N., M. Çengel and S. Göçmez. 2001. Influence of salinity on microbial respiration and enzyme activity of soils. International Symposium on Techniques to Control Salination for Horticultural Productivity. ISHS Acta Hort. 573: 189-194.
Oren, A. 1999. Bioenergetic aspects of halophilism. Microbiol. Molecular Biol. Rev. 65: 334-348.
Oster, J.D. 1982. Gypsum usage in irrigated agriculture: A review. Fertil. Res. 3: 73-89.
Pankhurst, C.E., S. Yu, B.G. Hawke, and B.D. Harch. 2001. Capacity of fatty acid profiles and substrate utilization patters to describe differences in soil microbial communities associated with increased salinity or alkalinity at three locations in South Australia. Biol. Fertil. Soils. 33: 204-217.
Patel, K.P., and B. Singh. 1993. Relative efficiency of gypsum, pressmud and pyrites as affected by time of application under percolation conditions in reclamation of alkali soil. Ann. Agric. Res. 14: 77-83.
Pathak, H., and D.L.N. Rao. 1998. Carbon and nitrogen mineralization from added organic matter in saline and alkali soils. Soil Biol. Biochem. 30: 695-702.
Pearson, K. 1896. Mathematical contributions to the theory of evolution. III. Regression, heredity, and panmixia. Philosophical Transactions of the Royal Society Ser. 187: 253-318.
Peineman, N., G. Guggenberger, and W. Zech. 2005. Soil organic matter and its lignin component in surface horizons of salt-affected soils of the Argentinian Pampa. Catena. 60: 113-128.
Pessarakli, M., and I. Szabolics. 1999. Soil salinity and sodicity as particular plant/crop stress factors. In: Handbook of plant and crop stress. Pessarakli, M. (Ed.) Marcel Dekker, NY. pp. 1-16.
Powlson, D.S., P.C. Brookes, and B.T. Christensen. 1987. Measurement in soil microbial biomass provides an early indication of changes in soil organic matter due to straw incorporation. Soil Biol. Biochem. 19:159-164.
Prakasam, T.B.S., and R.C. Loehr. 1972. Microbial nitrification and denitrification in concentrated wastes. Water Res. 6: 859-869.
Prihar, S.S., S.K. Jalota, and J.L. Steiner. 1996. Residue management for reducing evaporation in relation to soil type and evaporativity. Soil Use and Manag. 12: 150-157.
Qadir, M., A.D. Noble, S. Schubert, R.J. Thomas, and A. Arslan. 2006. Salinity induced land degradation and its sustainable management: problems and prospects. Land degrade. Dev. 17: 661-676.
150
Qadir, M., S. Schubert, A. Ghafoor A, and G. Murtaza. 2001. Amelioration strategies for sodic soils: a review. Land Degrad. Dev. 2: 357-386.
Qadir, M., S. Schubert, D. Badia, B.R. Sharma, A.S. Qureshi, and G. Murtaza. 2007. Ameliorating and nutrient management strategies for sodic and alkali soils. CAB Reviews: Perspective in Agriculture, Veterinary Sciences, Nutrition and Natural Resources: http://www.cababstractsplus.org/cabreview.
Quanzhong, H., and H. Guanhua. 2009. Effects of NaCl salt on mineralization and nitrification of a silt loam soil in the North China Plain. Int. J. Agric. Biol. Eng. 2(2): 14-23.
Qureshi, M.E., M.K. Wegener, and F.M. Mason. 2001. Economics of sugar mill by-products as a source of nutrients in the Australian sugar industry in Mackay. Proc. Aust. Soc. Sugar Cane Technol. 23: 192-198.
Rabie, G. H., and A.M. Almadini. 2005. Role of bioinoculants in development of salt-tolerance of Vicia faba plants under salinity stress. Afric. J. Biotech. 4(3): 210-222.
Rai, P.K., C.P. Sharma, B.K. Dube, M.P. Motiwala, and A.B. Singh. 1999. Improvement of yield and quality of a ratoon crop of sugarcane variety CoLK-8102 through organic amendments in non-saline sodic soil. Co-operative sugar. 30(11-12): 1047-1054.
Rajab, M. 1993. Distribution pattern of soil microbial population in salt affected soils. In: Towards Rational Use of High Salinity Tolerant plants. Lieth, H., and A.A. Al-Masoom, (Eds.) Deliberation about High Salinity Tolerant Plants and Ecosystems. Kluwer Academic Publishers, Dordrecht. 1: 467-472.
Raman, S., R.G. Patil, and N.M. Zalawadia. 1999. Pressmud as a potential source of nutrients, amendments and wax. Fertil. News. 44(11): 25-26, 29-31.
Ramoliya, P J, and A. N. Pandey. 2003. Effect of salinisation of soil on emergence, growth and survival of seedlings of Cordia rothii. Forest Ecol. Manag. 176: 185-194.
Ramoliya, P.J., H.M. Patel, and A.N. Pandey. 2004. Effect of salinisation of soil on growth and macro- and micro-nutrient accumulation in seedlings of Acacia catechu (Mimosaceae). Ann. Appl. Biol. 144: 321-332.
Rangaraj, T., E. Somasundaram, M.M. Amanullah, V. Thirumurgan, S. Ramesh, and S. Ravi. 2007. Effect of Agro-industrial wastes on soil properties and yield of irrigated finger millet (Eleusine coracana L. Gaertn) in coastal soil. Res. J. Agric. Biol. Sci. 3(3): 153-156.
Rasul, G., S.K. Khan, T. Müller, and J.G. Rainer. 2008. Soil microbial response to sugarcane filtercake and biogenic waste compost. J. Plant Nutr. Soil Sci.171: 355-360.
Rasul, G., A. Appuhn, T. Muller, and R.G. Joergensen. 2006. Salinity-induced changes in the microbial use of sugarcane filter cake added to soil. Appl. Soil Ecol. 31: 1-10.
Reeve, R.C., and M. Fireman. 1967. Salt problems in relation to irrigation. In: Irrigation of Agricultural Lands. Am. Soc. Agron. Madison Wisconsin, USA.
151
Rengasamy, P., and L. Walters. 1994. Technical note. In: Introduction to Soil Sodicity. Cooperative Research Centre for Soil and Land Management, Adelaide. South Australia.
Rengasamy, P. 2002. Transient salinity and subsoil constraints to dryland farming in Australian sodic soils: an overview. Aust. J. Exp. Agric. 42: 351-361.
Rengasamy, P., and K.A. Olsson. 1991. Sodicity and soil structure. Aust. J. Soil Res. 29: 935-952.
Rengasamy, P., and K.A. Olsson. 1993. Irrigation and sodicity. Aust. J. Soil Res. 31: 821-837.
Rengasamy, P., R.S.B. Greene, G.W. Ford, and A.H. Mehanni. 1984. Identification of dispersive behavior and the management of Red-brown Earths. Aust. J. Soil Res. 22: 413-431.
Rhoades, J.D., and J. Loveday.1990. Salinity in irrigated agriculture. In: Irrigation of agricultural crops. Stewart, B.A., and D.R. Nielsen (Eds.) Agron. Monogr. 30. ASA, CSSA, and SSSA, Madison, WI. pp. 1089-1142.
Rhoades, J.D. 1990. Overview: Diagnosis of salinity problems and selection of control practices, In: Agricultural Salinity Assessment and Management. Tanji, K.K. (ed.) Am. Soc. Civil Engg. New York. pp. 18-41
Richards, L.A., 1954. Diagnosis and Improvement of Saline and Alkaline Soils. Agriculture Handbook, Vol. 60. USDA.
Rietz, D.N., R.J. Haynes, and S. Chidoma. 2001. Effects of soil salinity induced under irrigated sugarcane in the Zimbabwean lowland on soil microbial activity. Proc. South Africa Sugar Technol. Assessments. 75: 68-74.
Rietz, D.N., and R.J. Haynes. 2003. Effect of irrigation-induced salinity and sodicity on soil microbial activity. Soil Biol. Biochem. 35: 845-854.
Robbins, C.W. 1986a. Carbon dioxide partial pressure in lysimeter soils. Agron. J. 78: 151-158.
Robertson, G.P. 1982. Factors regulating nitrification in primary and secondary succession. Ecology. 63: 1561-1573.
Ronald, W., McCormick, and D.C. Wolf. 1979. Effect of sodium chloride on CO2 evolution, ammonification and nitrification in a sassafras sandy loam. Soil Biol. Biochem. 12: 153-157.
Ryan, J.A., and J.L. Sims. 1974. Effect of phosphate and chloride salts on microbial activity in flooded soil. Soil Sci. 118: 95-101.
Sahin, U., O. Anapali, and A. Hanay. 2002. The effect of consecutive application of leaching water applied in equal, increasing or decreasing quantities on soil hydraulic conductivity on a saline-sodic soil in the laboratory. Soil Use Manag. 8: 152-154.
SalCon, (Salinity and Contaminant Hydrology Group).1997. Salinity Management Handbook. Queensland Department of Natural Resources, Brisbane.

152
Sardinha, M., T. Muller, H. Schmeisky, and R.G. Joergensen. 2003. Microbial performance in soils along a salinity gradient under acidic conditions. Appl. Soil Eco. 23: 237-244.
Sarig, S., A. Fliessbach, and Y. Steinberger. 1996. Microbial biomass reflects a nitrogen and phosphorus economy of halophytes grown in salty desert soil. Biol. Fertil. Soils. 21: 128-130.
Sarig, S., and Y. Steinberger, 1994. Microbial biomass response to seasonal fluctuation in soil salinity under the canopy of desert halophytes. Soil Biol. Biochem. 26: 1405-1408.
Sarig, S., E.B. Roberson, and M.K. Firestone. 1993. Microbial activity-soil structure: Response to saline water irrigation. Soil Biol. Biochem. 25: 693-697.
Scotter, D.R. 1985. The effect of electrolyte solutions on the unsaturated hydraulic conductivity of a sodic clay soil. Aust. J. Soil Res. 23: 301-307.
Shainberg, I. 1990. Soil responses to saline and sodic conditions. In: Agricultural Salinity Assessment and Management. Tanji, K.K. (ed.), Am. Soc. Civil Engg. New York. pp. 91-112.
Shainberg, I. and J. Letey. 1984. Response of soils to sodic and saline conditions. Hilgardia. 61: 21-57.
Shainberg, I., G.J. Levy, D. Goldstein, A.I. Mamedov, and J. Letey.2001. Prewetting rate and sodicity effects on the hydraulic conductivity of soils. Aust. J. Soil Res. 39: 1279-1291.
Shainberg, I., M.E. Sumner, W.P. Miller, M.P.W. Farina, M.A. Pavan, and M.V. Fey. 1989. Use of gypsum on soils: A review. Adv. Soil Sci. 9: 73-82.
Shainberg, I., R. Keren, and H. Frenkel. 1982. Response of sodic soils to gypsum and calcium chloride application. Soil Sci. Soc. Am. J. 46: 113-117.
Shao, X.H., D.Y. Liu, L. Zhu, and H. Wang. 2001. Prospect of EM treatment techniques of organic waste water for agricultural irrigation. Adv. Sci. Tech. Water Res. 21(1): 61-71.
Sharma, S.K. 1997. Plant growth, photosynthesis and ion uptake in chickpea as influenced by salinity. Indian J. Plant Physiol. 2: 171-173.
Sheldon, A., Menzies, N.W., So, H.B., and Dalal, R., 2004. The effect of salinity on plant available water. Super Soil 2004: 3rd Australian New Zealand Soils Conference, 5-9 December 2004, University of Sydney, Australia.
Sindhu, M.A., and A.H. Cornfield. 1967. Effects of sodium chloride and moisture on ammonification and nitrification in incubated soils. J. Sci. Food Agric. 18: 505-506.
Singh, B.R., A.S. Agarwal, and Y. Kanehiro. 1969. Effect of chloride salts on ammonium nitrogen release in two Hawaiian soils. Proc. Soil Sci. Soc. Am. 33: 557-560.

153
Singh, G., O.P. Signh, R.S. Singh, R.A. Yadav, and B.B. Singh. 1991. Effect of pressmud and fertilizer application on yield and quality of cane in flood affected condition. Bharatiya Sugar. 16(6): 29-30.
Singh, P.K., and Y. Singh. 1996. Effect of reduced tillage on soil properties, root growth and grain yield in rice-wheat system. Indian J. Agric. Res. 30: 179-185.
Singh, S., and K.K. Kapoor. 1999. Inoculation with phosphate-solubilising microorganisms and a vesicular-arbuscular mycorrhizal fungus improves dry matter yield and nutrient uptake by wheat grown in sandy soil. Biol. Fertil. Soils. 28: 139-144.
Smedema, L.K., and D.W. Rycroft. 1983. Land drainage. Batsford academic and educational Ltd. London. p. 376.
Soil Survey of Pakistan. 2007b. Land Resources Inventory and Agricultural Land Use Plan of Charsadda District. National Agric. Land Use Plan. Lahore, Pakistan.
Southard, R.J., I. Shainberg, and M.J. Singer. 1988. Influence of electrolyte concentration on the micromorphology of artificial deposition crust. Soil Sci. 145: 278-288.
Sparling, G.P. 1997. Soil microbial biomass, activity and nutrient cycling as indicators of soil health. In: Biological Indicators of Soil Health. Pankhurst, C.E., Doube, B.M., Gupta, V.V.S.R. (Eds.), CAB, Wall-ingford. pp. 97-119.
Spore. 1995. Bi-monthly bulletin of the Technical Centre for Agricultural and Rural Cooperation No. 57.
Sposito, G. 1989. The Chemistry of Soils. Oxford University Press, New York.
Steel, R.G.D., and J.H. Torrie. 1980. Principles and Procedures of Statistics. 2nd Ed. McGraw Hill Book Co., New York, USA.
Sullivan, D. J. 2001. Screening of intestinal microflora for effective probiotic bacteria. J. Agric. Food Chem. 49: 1751-1760.
Sumner, M.E. 1993. Sodic soils: New perspectives. Aust. J. Soil Res. 31: 683 -750.
Sumner, M.E., 1995. Sodic Soils: New Perspectives. In: Australian Soils: Distribution, properties and management. Naidu, R., Sumner, M.E. and Rengasamy, P. (Eds.) CSIRO, Australia. pp. 1-34.
Szabolcs, I. 1989. Salt-affected Soils. CRC Press. Boca Raton, Florida. p. 287.
Tang, C., and Q. Yu. 1999. Impact of chemical composition of legume residues and initial soil pH on pH change of a soil after residue incorporation. Plant and Soil. 215: 29-38.
Tang, C., G.P. Sparling, C.D.A. McLay, and C. Raphael. 1999. Effect of short-term legume residue decomposition on soil acidity. Aust. J. Soil Res. 37: 561-573.
Tejada, M., M.T. Hernandez, and C. Garcia. 2009. Soil restoration using composted plant residues: Effects on soil properties. Soil Till. Res. 102: 109-117.
154
Thompson, LM., C.A. Black, and J.A. Zoellner. 1954. Occurrence and mineralisation of organic phosphorus in soils, with particular reference to associations with nitrogen, carbon and pH. Soil Sci. 77: 185-196.
Tietema, A., B. Warmerdam, E. Lenting, and L. Riemer. 1992. Abiotic factors regulating nitrogen transformations in the organic layer of acid forest soils: Moisture and pH, Plant Soil. 147: 69-78.
Tisdall, J.M., and J.M. Oades. 1982. Organic matter and water stable aggregates in soils. J. Soil Sci. 33: 141-163.
Tompe, S.V., and S.D. More. 1996a. Effects of pressmud cake on uptake of nutrients by sunflower. J. Maharashtra Agric. Univ. 21(1): 139-140.
Tripathi, S., S. Kumari, A. Chakraborty, A. Gupta, K. Chakrabarti, and B.K. Bandyapadhyay. 2006. Microbial biomass and its activities in salt-affected coastal soils. Biol. Fertil. Soils. 42: 273-277.
US Salinity Staff. 1954. Diagnosis and Improvement of Saline and Alkali Soils. USDA Handbook 60. US Department of Agriculture, Washington DC.
Uson, A., and H.F. Cook. 1995. Water relations in a soil amended with composted organic waste. In: Soil Management. Cook, H.F. and C. Lee (Eds.) In Sustainable Agric. Wye College Press, Great Britain, UK. pp. 453-460.
Vance, E.D., P.C. Brookes, and D.S. Jenkinson. 1987. An extraction method for measuring soil microbial biomass carbon. Soil Biol. Biochem. 19: 703-707.
Vanek, V., R. Nemecek, and J. Najmanova. 1997a. The effect of site and way of management on the content of mineral and mineralizable nitrogen in soils . Rostlinná Výroba, 43: 463-471. (In Czech).
Vanessa, N.L.W., C.D. Ram, and S.B.G. Richard. 2008. Salinity and sodicity effects on respiration and microbial biomass of soil. Biol. Fertil. Soils. J. Earth Environ. Sci. 44: 943-953.
Von-Lutzow, M., I. Kogel-Knabner, K. Ekschmitt, E. Matzner, G. Guggenberger, Marschner, and H. Flessa. 2006. Stabilization of organic matter in temperate soils: mechanisms and their relevance under different soil conditions; a review. Euro. J. Soil Sci. 57: 426-445.
Wahid, A., S. Akhtar, 1. Ali and E. Rasul. 1998. Amelioration of saline-sodic soils with organic matter and their use for wheat growth. Commun. Soil Sci. Plant Anal. 29: 2307-2318.
Walley, F.L., C.V. Kessel, and D.J. Pennock. 1996. Landscape scale variability of N mineralization in forest soils. Soil Biol. Biochem. 28: 383-391.
Wardle, D.A. 1992. A comparative assessment of factors which influence microbial biomass carbon and nitrogen levels in soils. Biological Rev. 67: 321-358.
Warrence, N.J., J.W. Bauder, and K.E. Pearson. 2002. The Basics of Salinity and Sodicity Effects on Soil Physical Properties. The Department of Land Res. Environ. Sci., Montana State University - Bozeman. USA.
155
Westerman, R.L., and T.C. Tucker. 1974. Effect of salts and salts plus nitrogen-15-labeled ammonium chloride on mineralization of soil nitrogen, nitrification and immobilization. Proc. Soil Sci. Soc. Am. 38: 602-605.
Wichern, F., T. Muller, R.G. Joergensen, and A. Buerkert. 2004. Effects of manure quality and application forms on soil C and N turnover of a subtropical oasis soil under laboratory conditions. Biol. Fertil. Soils. 39: 165-171.
Wichern, J., F. Wichern, and R.G. Joergensen. 2006. Impact of salinity on soil microbial communities and the decomposition of maize in acidic soils. Geoderma. 137: 100-108.
Witter, E., and A. Kanal. 1998. Characteristics of the soil microbial biomass in soils from a long-term field experiment with different levels of C input. Appl. Soil Ecol. 10: 37-49.
Wollum II, A.G. 1982. Cultural methods for soil microorganisms. In: Methods of Soil Analysis: Chemical and Microbial Properties. Page, A.L., R.H. Miller, and D.R. Keeney (Eds.) ASA and SSSA Pub. Madison Wisconsin, USA. pp. 718-802.
Wolters, V., and R.G. Joergensen. 1991. Microbial carbon turnover in beech forest soils at different stages of acidification. Soil Biol. Biochem. 23: 897-902.
Wong, V.N.L., C.D. Dalal, and R.S.B. Greene. 2008. Salinity and sodicity effects on respiration and microbial biomass of soil. Biol. Fertil. Soils. 44: 943-953.
Wu, J., P.C. Brookes, and D.S. Jenkinson. 1993. Formation and destruction of microbial biomass during the decomposition of glucose and ryegrass in soil. Soil Biol. Biochem. 25: 1435-1441.
Xiao, C., M. Fauci, D.F. Bezdicek, W.T. Mckean, and W.L. Pan. 2005. Soil microbial responses to potassium, based black liquor for straw pulping. Soil. Sci. Soc. Am. J. 70: 72-77.
Yadav, D.V., G.B. Singh, and S. Solomon. 1995. Recent trends in the utilization of pressmud cake in Indian agriculture. Sugarcane agro-industrial alternatives. pp. 371-386.
Yaduvanshi, N.P.S., and A. Swarup. 2005. Effect of continuous use of sodic irrigation water with and without gypsum, farmyard manure, pressmud and fertilizer on soil properties and yields of rice and wheat in a long term experiment. Nutrient Cycling in Agroecosystems. 73: 111-118.
Yamaguchi, T., and T. Blumwald. 2005. Developing salt-tolerant crop plants: challenges and opportunities. Trends Plant Sci. 10: 615-20.
Yasin, M., A. Rauf, and M. Sarfraz. 1987. Effect of saline irrigation water and amendments on the yield and chemical composition of wheat. J. Agric. Res. 25(1): 81-91.
Yuan, B.C; Z.Z. Li; H. Liu; M. Gao, and Y.Y. Zhang. 2007. Microbial biomass and activity in salt affected soils under arid conditions. J. Appl. Soil. Eco. 35(2): 319-328.

156
Zahran, H.H. 1997. Diversity, adaptation and activity of the bacterial flora in saline environments. Biol. Fertil. soils. 25: 211-223.
Zahran, H.H. 1999. Rhizobium-legume symbiosis and nitrogen fixation under severe conditions and in an arid climate. Microbio. Molecular Biol. Rev. 63: 968-989.
Zahran, H.H., A.M. Moharram, and H.A. Mohammad. 1992. Some ecological and physiological studies on bacterial isolation from salt affected soils of Egypt. J. Basic Microbiol. 32: 405-413.
Zelles, L. 1999. Fatty acid patterns of phospholipids and lipopolysaccharides in the characterisation of microbial communities in soil: a review. Biol. Fertil. Soils. 29: 111-129.
Zerega, L., T. Hernandez, and J. Valladres. 1995. Effect of three amendments on saline-sodic soil used to grow nine sugarcane cultivar. Cana de Azucar. 13: 51-64.
Zhang, X.C., and L.D. Norton. 2002. Effect of exchangeable Mg on saturated hydraulic conductivity, disaggregation and clay dispersion of disturbed soils. J. Hydrology. 260: 194-205.

157
9 APPENDICES
Table 9.1: ANOVA [CR design] showing F values for rate of soil respiration in response to NaCl induced salinity during different incubation periods
SOV D.F. Rate of soil respiration (mg kg-1 soil)
Incubation periods (days) 0-10 10-20 20-30 30-40
Replications 2 3.06ns 1.71ns 1.46ns 2.99ns Treatments 7 58.42** 25.01** 20.5** 15.95**
**, ns significant at P < 0.01 and non-significant respectively
Table 9.2: 2-factors ANOVA [CR design] showing F values for Cumulative CO2 production during 40 days of incubation in response to various levels of NaCl induced salinity
SOV D.F. Cumulative CO2 production (mg kg-1)
Incubation periods (days) 10 20 30 40
Replications 2 3.06ns 3.29ns 2.12ns 3.15ns Treatments 7 58.42** 86.73** 99.2** 118.3**
**, ns significant at P < 0.01and non-significant respectively
Table 9.3: ANOVA [CR design] showing F values for N-mineralization during 40 days of incubation period with induced NaCl salinity
SOV D.F. N mineralization (mg kg-1) Incubation periods (days)
10 20 30 40Replications 2 0.9ns 3.0ns 3.42ns 5.43*Treatments 7 11.12** 51.96** 57.64** 99.18**
** significant at P<0.01; ns: non-significant
Table 9.4: ANOVA [CR design] showing F values for rate of soil respiration in induced MgCl2 treated soils during different incubation periods
SOV D.F. Rate of soil respiration (mg kg-1)
Incubation period (days) 0-10 10-20 20-30
Replications 2 4.3ns 2.6ns 0.13ns Treatments 7 336.7** 454.8** 346.8**
**, ns significant at P < 0.01 and non-significant respectively
Table 9.5: ANOVA [CR design] showing F values for Cumulative CO2 production in soil with induced MgCl2 salt
SOV D.F. Cumulative CO2 production (mg kg-1)
Incubation period (days) 10 20 30
Replications 2 2.2ns 6.8ns 5.1ns Treatments 7 65.5** 95.7** 137.0**
**, ns, significant at P < 0.01 and not significant respectively
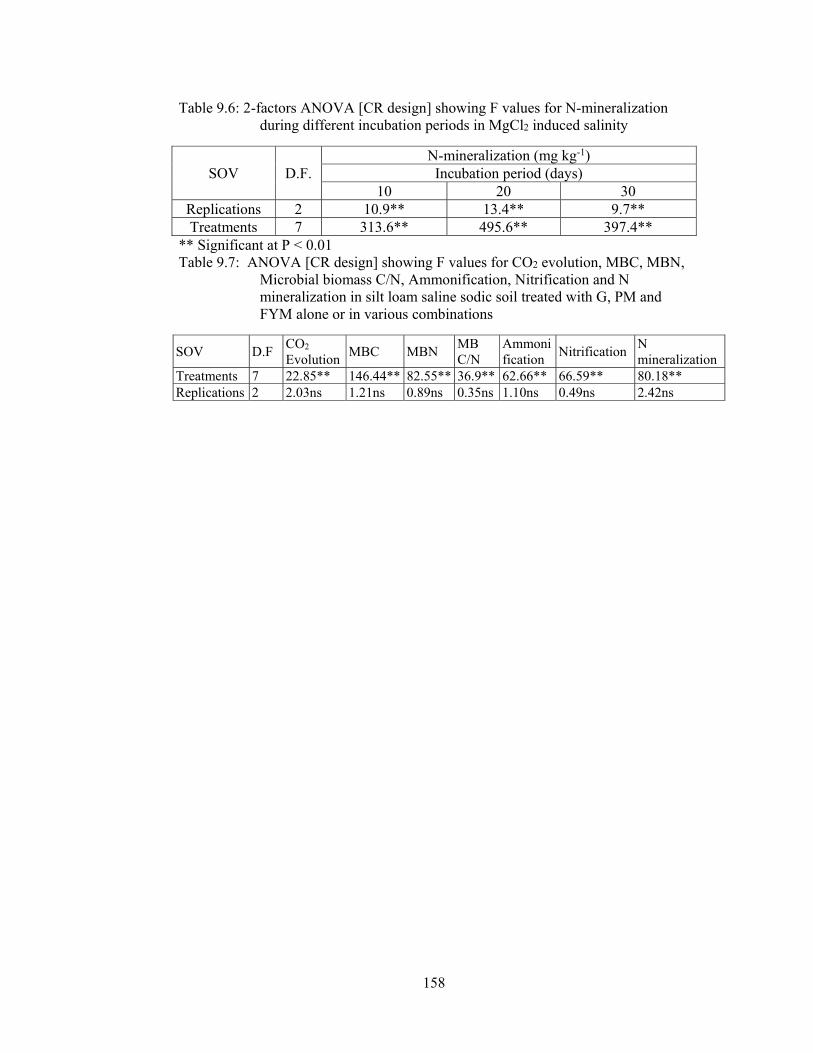
158
Table 9.6: 2-factors ANOVA [CR design] showing F values for N-mineralization during different incubation periods in MgCl2 induced salinity
SOV D.F. N-mineralization (mg kg-1) Incubation period (days)
10 20 30 Replications 2 10.9** 13.4** 9.7** Treatments 7 313.6** 495.6** 397.4**
** Significant at P < 0.01 Table 9.7: ANOVA [CR design] showing F values for CO2 evolution, MBC, MBN,
Microbial biomass C/N, Ammonification, Nitrification and N mineralization in silt loam saline sodic soil treated with G, PM and FYM alone or in various combinations
SOV D.F CO2 Evolution
MBC MBN MB C/N
Ammonification
Nitrification N mineralization
Treatments 7 22.85** 146.44** 82.55** 36.9** 62.66** 66.59** 80.18** Replications 2 2.03ns 1.21ns 0.89ns 0.35ns 1.10ns 0.49ns 2.42ns
Related Documents