Original article Microbial biomass in a semi arid soil of the central highlands of Mexico cultivated with maize or under natural vegetation Basilio Gabriel Reyes-Reyes a , Rocio Alca ´ntara-Herna ´ndez a , Viviana Rodrı ´guez b , Victor Olalde-Portugal b , Luc Dendooven c, * a Centro de Investigacio ´n en Ciencias Agropecuarias, Autonomous University of Mexico State, Instituto Literario 100, Toluca, Mexico 50000, Mexico b Laboratory of Ecological Biochemistry, Department of Biotechnology and Biochemistry, Cinvestav, Irapuato, 629, Irapuato, Guanajuato, Mexico c Laboratory of Soil Ecology, Department of Biotechnology and Bioengineering, Cinvestav, Av. Instituto Polite ´cnico Nacional 2508, San Pedro Zacatenco, 07360 Mexico City, Mexico Received 30 May 2006; accepted 12 February 2007 Available online 12 March 2007 Abstract Microbial biomass (MB) is the key factor in nutrient dynamics in soil, but no information exists how clearing of vegetation to cultivate maize in the central highlands of Mexico might affect it. Soil MB was measured with the chloroform fumigation incuba- tion (CFI) and fumigation extraction (CFE) techniques and the substrate-induced respiration (SIR) method in soil sampled under or outside the canopy of mesquite (Prosopis laevigata) and huisache (Acacia tortuoso), N 2 fixing shrubs, and from fields cultivated with maize. Microbial biomass C as measured with the CFI technique ranged from 122 mg C kg 1 in agricultural soil to 373 mg C kg 1 in soil sampled under mesquite shrubs. Microbial biomass N as measured with the CFI technique ranged from 11 mg N kg 1 in agricultural soil to 116 mg N kg 1 in soil sampled under mesquite shrub. The ratio of microbial biomass C as measured with CFI related to the ninhydrin-positive compounds (NPC) was 12.23 after 1 day and 8.43 after 10 days while the relationship with extractable C was 3.15 and 2.96, respectively. The metabolic quotient (qCO 2 ) decreased in the order OUTSIDE > MESQUITE > HUIZACHE > AGRICULTURE, and the microbial biomass:soil organic C ratio decreased in the order MESQUITE > HUIZACHE > OUTSIDE > AGRICULTURE using SIR to determine the microbial biomass. It was found that converting soil under natural vegetation to arable soil was not only detrimental for soil quality, but might be unsustainable as organic matter input is limited. Ó 2007 Elsevier Masson SAS. All rights reserved. Keywords: Chloroform-fumigation extraction; Microbial biomass; N 2 fixing shrubs; Ninhydrin-positive compounds; Eco-physiological indices 1. Introduction The soils in arid and semiarid environments repre- sent over 25% of the Earth’s land area and are increas- ing in proportion due to desertification [16]. The soils in these ecosystems characteristically contain less organic * Corresponding author. Tel.: þ52 55 5061 3311; fax: þ52 55 5061 3313. E-mail address: [email protected] (L. Dendooven). 1164-5563/$ - see front matter Ó 2007 Elsevier Masson SAS. All rights reserved. doi:10.1016/j.ejsobi.2007.02.001 European Journal of Soil Biology 43 (2007) 180e188 http://www.elsevier.com/locate/ejsobi

Welcome message from author
This document is posted to help you gain knowledge. Please leave a comment to let me know what you think about it! Share it to your friends and learn new things together.
Transcript

European Journal of Soil Biology 43 (2007) 180e188http://www.elsevier.com/locate/ejsobi
Original article
Microbial biomass in a semi arid soil of the central highlands ofMexico cultivated with maize or under natural vegetation
Basilio Gabriel Reyes-Reyes a, Rocio Alcantara-Hernandez a, Viviana Rodrıguez b,Victor Olalde-Portugal b, Luc Dendooven c,*
a Centro de Investigacion en Ciencias Agropecuarias, Autonomous University of Mexico State,Instituto Literario 100, Toluca, Mexico 50000, Mexico
b Laboratory of Ecological Biochemistry, Department of Biotechnology and Biochemistry, Cinvestav, Irapuato,
629, Irapuato, Guanajuato, Mexicoc Laboratory of Soil Ecology, Department of Biotechnology and Bioengineering, Cinvestav, Av.
Instituto Politecnico Nacional 2508, San Pedro Zacatenco, 07360 Mexico City, Mexico
Received 30 May 2006; accepted 12 February 2007
Available online 12 March 2007
Abstract
Microbial biomass (MB) is the key factor in nutrient dynamics in soil, but no information exists how clearing of vegetation tocultivate maize in the central highlands of Mexico might affect it. Soil MB was measured with the chloroform fumigation incuba-tion (CFI) and fumigation extraction (CFE) techniques and the substrate-induced respiration (SIR) method in soil sampled under oroutside the canopy of mesquite (Prosopis laevigata) and huisache (Acacia tortuoso), N2 fixing shrubs, and from fields cultivatedwith maize. Microbial biomass C as measured with the CFI technique ranged from 122 mg C kg�1 in agricultural soil to373 mg C kg�1 in soil sampled under mesquite shrubs. Microbial biomass N as measured with the CFI technique ranged from11 mg N kg�1 in agricultural soil to 116 mg N kg�1 in soil sampled under mesquite shrub. The ratio of microbial biomass C asmeasured with CFI related to the ninhydrin-positive compounds (NPC) was 12.23 after 1 day and 8.43 after 10 days while therelationship with extractable C was 3.15 and 2.96, respectively. The metabolic quotient (qCO2) decreased in the orderOUTSIDE > MESQUITE > HUIZACHE > AGRICULTURE, and the microbial biomass:soil organic C ratio decreased in theorder MESQUITE > HUIZACHE > OUTSIDE > AGRICULTURE using SIR to determine the microbial biomass. It was foundthat converting soil under natural vegetation to arable soil was not only detrimental for soil quality, but might be unsustainable asorganic matter input is limited.� 2007 Elsevier Masson SAS. All rights reserved.
Keywords: Chloroform-fumigation extraction; Microbial biomass; N2 fixing shrubs; Ninhydrin-positive compounds; Eco-physiological indices
* Corresponding author. Tel.: þ52 55 5061 3311; fax: þ52 55 5061
3313.
E-mail address: [email protected] (L. Dendooven).
1164-5563/$ - see front matter � 2007 Elsevier Masson SAS. All rights
doi:10.1016/j.ejsobi.2007.02.001
1. Introduction
The soils in arid and semiarid environments repre-sent over 25% of the Earth’s land area and are increas-ing in proportion due to desertification [16]. The soils inthese ecosystems characteristically contain less organic
reserved.
181B.G. Reyes-Reyes et al. / European Journal of Soil Biology 43 (2007) 180e188
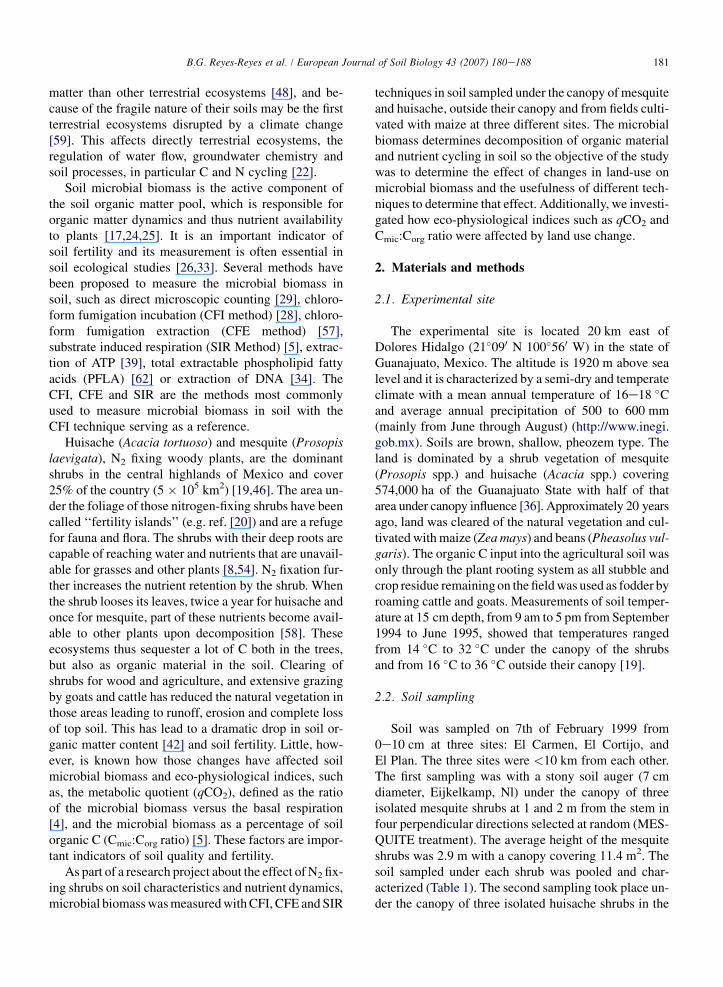
matter than other terrestrial ecosystems [48], and be-cause of the fragile nature of their soils may be the firstterrestrial ecosystems disrupted by a climate change[59]. This affects directly terrestrial ecosystems, theregulation of water flow, groundwater chemistry andsoil processes, in particular C and N cycling [22].
Soil microbial biomass is the active component ofthe soil organic matter pool, which is responsible fororganic matter dynamics and thus nutrient availabilityto plants [17,24,25]. It is an important indicator ofsoil fertility and its measurement is often essential insoil ecological studies [26,33]. Several methods havebeen proposed to measure the microbial biomass insoil, such as direct microscopic counting [29], chloro-form fumigation incubation (CFI method) [28], chloro-form fumigation extraction (CFE method) [57],substrate induced respiration (SIR Method) [5], extrac-tion of ATP [39], total extractable phospholipid fattyacids (PFLA) [62] or extraction of DNA [34]. TheCFI, CFE and SIR are the methods most commonlyused to measure microbial biomass in soil with theCFI technique serving as a reference.
Huisache (Acacia tortuoso) and mesquite (Prosopislaevigata), N2 fixing woody plants, are the dominantshrubs in the central highlands of Mexico and cover25% of the country (5 � 105 km2) [19,46]. The area un-der the foliage of those nitrogen-fixing shrubs have beencalled ‘‘fertility islands’’ (e.g. ref. [20]) and are a refugefor fauna and flora. The shrubs with their deep roots arecapable of reaching water and nutrients that are unavail-able for grasses and other plants [8,54]. N2 fixation fur-ther increases the nutrient retention by the shrub. Whenthe shrub looses its leaves, twice a year for huisache andonce for mesquite, part of these nutrients become avail-able to other plants upon decomposition [58]. Theseecosystems thus sequester a lot of C both in the trees,but also as organic material in the soil. Clearing ofshrubs for wood and agriculture, and extensive grazingby goats and cattle has reduced the natural vegetation inthose areas leading to runoff, erosion and complete lossof top soil. This has lead to a dramatic drop in soil or-ganic matter content [42] and soil fertility. Little, how-ever, is known how those changes have affected soilmicrobial biomass and eco-physiological indices, suchas, the metabolic quotient (qCO2), defined as the ratioof the microbial biomass versus the basal respiration[4], and the microbial biomass as a percentage of soilorganic C (Cmic:Corg ratio) [5]. These factors are impor-tant indicators of soil quality and fertility.
As part of a research project about the effect of N2 fix-ing shrubs on soil characteristics and nutrient dynamics,microbial biomass was measured with CFI, CFE and SIR
techniques in soil sampled under the canopy of mesquiteand huisache, outside their canopy and from fields culti-vated with maize at three different sites. The microbialbiomass determines decomposition of organic materialand nutrient cycling in soil so the objective of the studywas to determine the effect of changes in land-use onmicrobial biomass and the usefulness of different tech-niques to determine that effect. Additionally, we investi-gated how eco-physiological indices such as qCO2 andCmic:Corg ratio were affected by land use change.
2. Materials and methods
2.1. Experimental site
The experimental site is located 20 km east ofDolores Hidalgo (21�090 N 100�560 W) in the state ofGuanajuato, Mexico. The altitude is 1920 m above sealevel and it is characterized by a semi-dry and temperateclimate with a mean annual temperature of 16e18 �Cand average annual precipitation of 500 to 600 mm(mainly from June through August) (http://www.inegi.gob.mx). Soils are brown, shallow, pheozem type. Theland is dominated by a shrub vegetation of mesquite(Prosopis spp.) and huisache (Acacia spp.) covering574,000 ha of the Guanajuato State with half of thatarea under canopy influence [36]. Approximately 20 yearsago, land was cleared of the natural vegetation and cul-tivated with maize (Zea mays) and beans (Pheasolus vul-garis). The organic C input into the agricultural soil wasonly through the plant rooting system as all stubble andcrop residue remaining on the field was used as fodder byroaming cattle and goats. Measurements of soil temper-ature at 15 cm depth, from 9 am to 5 pm from September1994 to June 1995, showed that temperatures rangedfrom 14 �C to 32 �C under the canopy of the shrubsand from 16 �C to 36 �C outside their canopy [19].
2.2. Soil sampling
Soil was sampled on 7th of February 1999 from0e10 cm at three sites: El Carmen, El Cortijo, andEl Plan. The three sites were <10 km from each other.The first sampling was with a stony soil auger (7 cmdiameter, Eijkelkamp, Nl) under the canopy of threeisolated mesquite shrubs at 1 and 2 m from the stem infour perpendicular directions selected at random (MES-QUITE treatment). The average height of the mesquiteshrubs was 2.9 m with a canopy covering 11.4 m2. Thesoil sampled under each shrub was pooled and char-acterized (Table 1). The second sampling took place un-der the canopy of three isolated huisache shrubs in the

182 B.G. Reyes-Reyes et al. / European Journal of Soil Biology 43 (2007) 180e188
Table 1
Characteristics of the soil sampled under and outside canopy of huisache and mesquite, and in soil cultivated with maize for >19 years
Location Carbon Particle size distribution pHH2O
WHCa Total N Organic Inorganic Sand Silt Clay
(g kg�1 soil) (g kg�1 soil) (g kg�1 soil)
Under canopy of huisache (HUISACHE) 766 ab 3.0 a 32.4 a 0.67 a 626 a 182 a 192 a 6.4 b
Under canopy of mesquite (MESQUITE) 813 a 3.5 a 22.3 b 0.27 a 523 a 218 a 259 a 6.2 b
Outside canopy of the trees (OUTSIDE) 589 b 1.2 b 10.4 c 0.75 a 582 a 208 a 211 a 6.8 b
Cultivated (AGRICULTURE) 522 b 0.9 b 11.0 c 0.16 a 444 a 340 a 216 a 7.6 a
MSDc 5% 132 1.1 7.0 0.61 185 178 120 0.9
a WHC: water holding capacity.b Values for locations with a different letter are significantly different from each other (P < 0.05).c MSD: minimum significant difference.
vicinity of the mesquite shrubs in the same manner(HUISACHE treatment). The average height of the hui-sache shrubs was 2.5 m with a canopy covering 7.4 m2.The third sampling took place 5 m from the stem of threemesquite and huisache shrubs in four perpendicular di-rections and outside their canopy (OUTSIDE treatment).The soil from each shrub was pooled. The shrubs at eachsite were not further than 100 m away from each otherand no large shrubs were found between them. The areasoutside the canopy of both shrubs were covered <50%with grasses and other small plants. The soils fromOUTSIDE, HUISACHE and MESQUITE treatmentswere not used previously for cultivation.
The fourth and last sampling at each site took placein the vicinity of the shrubs, but from land cleared ofnatural vegetation and cultivated with maize and beansfor 20 y (el Carmen), 25 y (el Cortijo) and 19 y (el Plan)(AGRICULTURE treatment). Soil was collected by au-gering 20-times the 0e10 cm top-layer. The amount offertilizer added to these un-irrigated agricultural fieldswas 120 kg ha�1 when cultivated with maize. The soilsampled from each field was pooled separately. Assuch 36 soil samples were obtained, three replicatesfrom four treatments (HUISACHE, MESQUITE,OUTSIDE and AGRICULTURE) from 3 sites.
The bulk density of soil sampled under mesquite was0.84 g cm�3, 1.02 g cm�3 under huisache, 1.15 g cm�3
outside the canopy and 1.2 g cm�3 for soil cultivatedwith maize.
2.3. Chloroform fumigation extraction andchloroform fumigation incubation technique
The soil from each site and field (>10 kg) were sep-arately 5 mm sieved and adjusted to 40% water holdingcapacity (WHC) and pre-incubated for 7 days in drumscontaining a beaker with 1000 ml distilled H2O to avoid
desiccation of the soil. Each drum also contained abeaker with 100 ml 1 M NaOH to trap CO2 evolved.
Three sub-samples of 25 g of each replicate site andtreatment were extracted with 100 ml 0.5 M K2SO4 [30]and considered the unfumigated soil. Three sub-samples of 25 g soil were fumigated for 1 day and10 days [53] with ethanol-free chloroform in the darkat 22 �C [37] and extracted with 0.5 M K2SO4 [30].The CFI was done according to the original method[28], but an inoculum of 5 g of unfumigated soil wasused to account for possible effects of the specific soilconditions [13].
2.4. The qCO2, kEC and EC/FC
The qCO2 was calculated as suggested by Dilly andMunch [15] by dividing basal respiration (mg CO2-C g�1 dry soil h�1) by microbial C as measured withSIR (g CCBM g�1 dry soil). The basal respiration wasderived from the CO2 produced between day 7 and 14in an aerobic incubation. FC was defined as [(CO2-Cevolved from fumigated soil)-(CO2-C evolved fromnon-fumigated soil)]. Extractable-C (EC) was calcu-lated as [(organic C extracted from fumigated soil) e(organic C extracted from non-fumigated soil)] [57].kEC was calculated as [EC/microbial biomass C deter-mined by the fumigation-incubation procedure][43,50]. This factor is a measure of the efficiency of ex-traction rather than mineralization.
2.5. Substrate induced respiration (SIR)
Substrate induced respiration was measured by add-ing a range of glucose concentrations (0.25, 0.50, 1, 2,4 and 8 g kg�1 soil) to 25 g oven-dry soil, which wasthen incubated at 22 �C on an orbital shaker at180 rpm for 150 min [5]. The headspace volume of
183B.G. Reyes-Reyes et al. / European Journal of Soil Biology 43 (2007) 180e188
each flask was sampled after 30 and 150 min and ana-lyzed using an Agilent 4890D GC fitted with a thermalconductivity detector (TCD) at 250 �C for measurementof CO2. The HP-Plot Q column (30 m � 0.32 mm) fromHewlett-Packard, used to separate CO2 from the othergases with the carrier gas of He flowing at a rate of5 ml min�1 was maintained at 32 �C. The concentrationthat resulted in maximum production of CO2 was used tocalculate microbial biomass defined by Anderson andDomsch [5] as:
SIR-biomass C�mg g�1 soil
�
¼�ml CO2 g�1 soil h�1
�40:04þ 0:37:
As the pH of the cultivated soil was 7.8, we checkedif part of the respired CO2 was trapped in the soil solu-tion. Three sub-samples of 25 g soil from each plot andtreatment were added to 120 ml flasks, stoppered, ster-ilized three times every other day and the atmosphereenriched with CO2 to approximately 1615 ppm. TheCO2 in the atmosphere was determined after 30 minand 210 min. Five flasks without soil were used as con-trols. No significant differences in concentrations ofCO2 in the headspace were found between the treat-ments and over time, so soil characteristics had no effecton CO2 measured (no data shown).
2.6. Soil analysis
Soil pH was measured in 1:2.5 soil-H2O suspensionusing a glass electrode. The total C in soil was deter-mined by oxidation with potassium dichromate andtrapping the evolved CO2 in NaOH and then titratingit with 0.1 M HCl [1]. Inorganic C in soil was deter-mined by adding 20 ml 1 M HCl solution to 1 g air-dried soil and trapping CO2 evolved in 20 ml 1 M
NaOH and then titrating it with 0.1 M HCl to determinethe CO2 [38]. The organic C was defined as the differ-ence between total and inorganic C. Total N was mea-sured by the Kjeldhal method [9] and soil particle sizedistribution by the hydrometer method as describedby Gee and Bauder [21]. The CO2 in the 1 M NaOHwas determined by titration with 0.1 M HCl [28]. Theninhydrin N in the K2SO4 extracts of fumigated and un-fumigated soil was measured as described by Joergen-sen and Brookes [30] while total C was quantified asdescribed by Vance et al. [57].
2.7. Statistical analyses
Microbial biomass measurements were subjected toone way analysis of variance using PROC GLM SASstatistical package [47] to test for significant differencesbetween treatments with Tukey’s Studentized Range(HSD) test.
3. Results
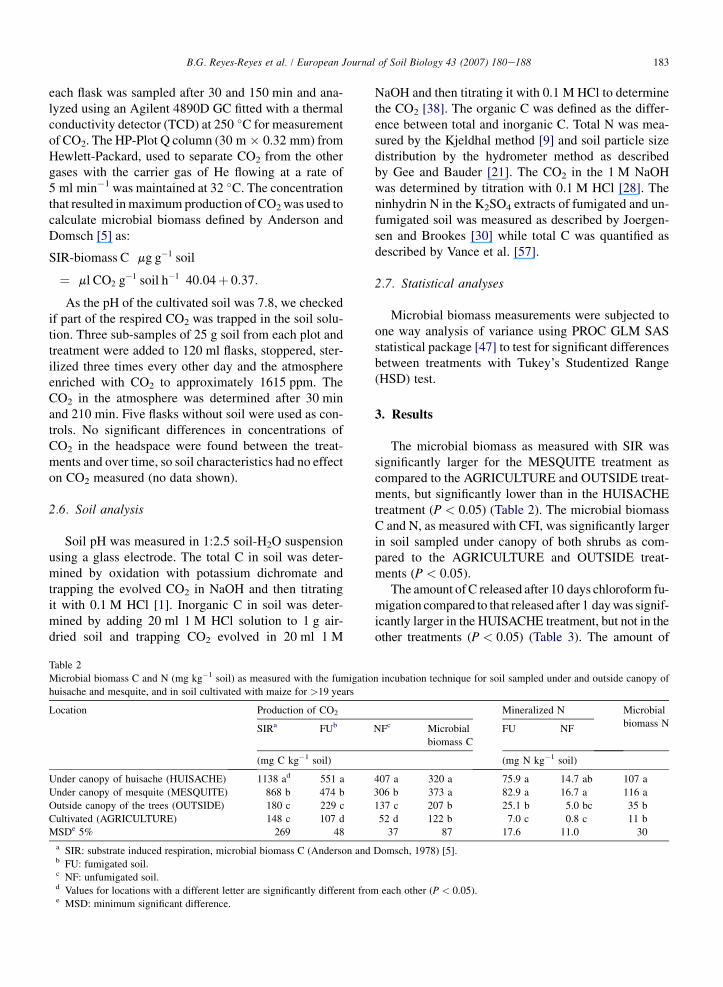
The microbial biomass as measured with SIR wassignificantly larger for the MESQUITE treatment ascompared to the AGRICULTURE and OUTSIDE treat-ments, but significantly lower than in the HUISACHEtreatment (P < 0.05) (Table 2). The microbial biomassC and N, as measured with CFI, was significantly largerin soil sampled under canopy of both shrubs as com-pared to the AGRICULTURE and OUTSIDE treat-ments (P < 0.05).
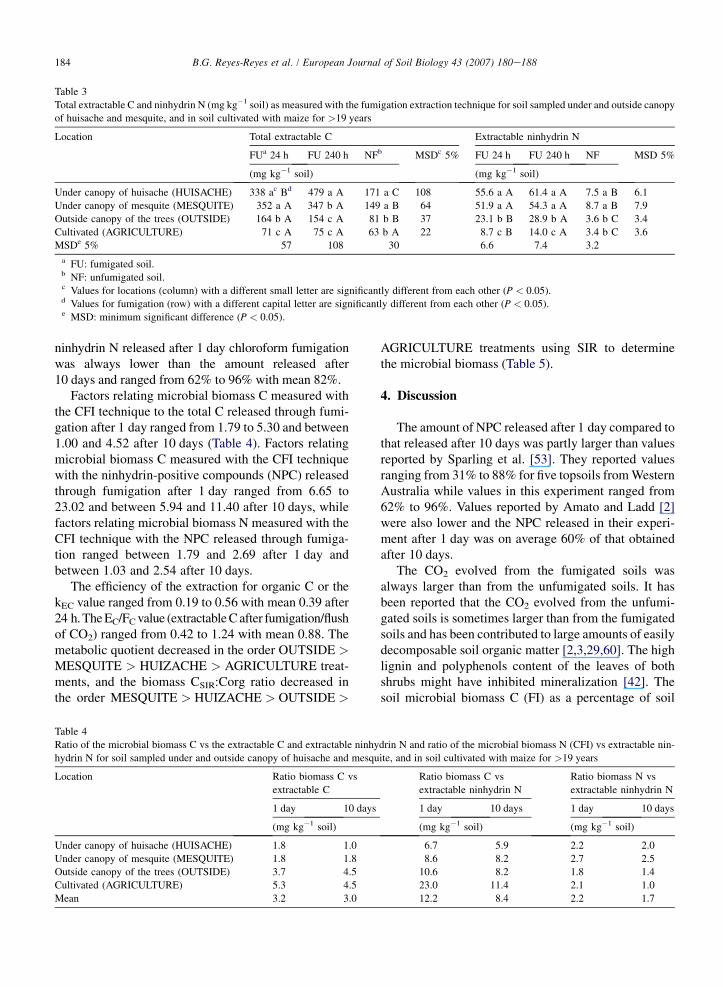
The amount of C released after 10 days chloroform fu-migation compared to that released after 1 day was signif-icantly larger in the HUISACHE treatment, but not in theother treatments (P < 0.05) (Table 3). The amount of
Table 2
Microbial biomass C and N (mg kg�1 soil) as measured with the fumigation incubation technique for soil sampled under and outside canopy of
huisache and mesquite, and in soil cultivated with maize for >19 years
Location Production of CO2 Mineralized N Microbial
biomass NSIRa FUb NFc Microbial
biomass C
FU NF
(mg C kg�1 soil) (mg N kg�1 soil)
Under canopy of huisache (HUISACHE) 1138 ad 551 a 407 a 320 a 75.9 a 14.7 ab 107 a
Under canopy of mesquite (MESQUITE) 868 b 474 b 306 b 373 a 82.9 a 16.7 a 116 a
Outside canopy of the trees (OUTSIDE) 180 c 229 c 137 c 207 b 25.1 b 5.0 bc 35 b
Cultivated (AGRICULTURE) 148 c 107 d 52 d 122 b 7.0 c 0.8 c 11 b
MSDe 5% 269 48 37 87 17.6 11.0 30
a SIR: substrate induced respiration, microbial biomass C (Anderson and Domsch, 1978) [5].b FU: fumigated soil.c NF: unfumigated soil.d Values for locations with a different letter are significantly different from each other (P < 0.05).e MSD: minimum significant difference.
184 B.G. Reyes-Reyes et al. / European Journal of Soil Biology 43 (2007) 180e188
Table 3
Total extractable C and ninhydrin N (mg kg�1 soil) as measured with the fumigation extraction technique for soil sampled under and outside canopy
of huisache and mesquite, and in soil cultivated with maize for >19 years
Location Total extractable C Extractable ninhydrin N
FUa 24 h FU 240 h NFb MSDc 5% FU 24 h FU 240 h NF MSD 5%
(mg kg�1 soil) (mg kg�1 soil)
Under canopy of huisache (HUISACHE) 338 ac Bd 479 a A 171 a C 108 55.6 a A 61.4 a A 7.5 a B 6.1
Under canopy of mesquite (MESQUITE) 352 a A 347 b A 149 a B 64 51.9 a A 54.3 a A 8.7 a B 7.9
Outside canopy of the trees (OUTSIDE) 164 b A 154 c A 81 b B 37 23.1 b B 28.9 b A 3.6 b C 3.4
Cultivated (AGRICULTURE) 71 c A 75 c A 63 b A 22 8.7 c B 14.0 c A 3.4 b C 3.6
MSDe 5% 57 108 30 6.6 7.4 3.2
a FU: fumigated soil.b NF: unfumigated soil.c Values for locations (column) with a different small letter are significantly different from each other (P < 0.05).d Values for fumigation (row) with a different capital letter are significantly different from each other (P < 0.05).e MSD: minimum significant difference (P < 0.05).
ninhydrin N released after 1 day chloroform fumigationwas always lower than the amount released after10 days and ranged from 62% to 96% with mean 82%.
Factors relating microbial biomass C measured withthe CFI technique to the total C released through fumi-gation after 1 day ranged from 1.79 to 5.30 and between1.00 and 4.52 after 10 days (Table 4). Factors relatingmicrobial biomass C measured with the CFI techniquewith the ninhydrin-positive compounds (NPC) releasedthrough fumigation after 1 day ranged from 6.65 to23.02 and between 5.94 and 11.40 after 10 days, whilefactors relating microbial biomass N measured with theCFI technique with the NPC released through fumiga-tion ranged between 1.79 and 2.69 after 1 day andbetween 1.03 and 2.54 after 10 days.
The efficiency of the extraction for organic C or thekEC value ranged from 0.19 to 0.56 with mean 0.39 after24 h. The EC/FC value (extractable C after fumigation/flushof CO2) ranged from 0.42 to 1.24 with mean 0.88. Themetabolic quotient decreased in the order OUTSIDE >MESQUITE > HUIZACHE > AGRICULTURE treat-ments, and the biomass CSIR:Corg ratio decreased inthe order MESQUITE > HUIZACHE > OUTSIDE >
AGRICULTURE treatments using SIR to determinethe microbial biomass (Table 5).
4. Discussion
The amount of NPC released after 1 day compared tothat released after 10 days was partly larger than valuesreported by Sparling et al. [53]. They reported valuesranging from 31% to 88% for five topsoils from WesternAustralia while values in this experiment ranged from62% to 96%. Values reported by Amato and Ladd [2]were also lower and the NPC released in their experi-ment after 1 day was on average 60% of that obtainedafter 10 days.
The CO2 evolved from the fumigated soils wasalways larger than from the unfumigated soils. It hasbeen reported that the CO2 evolved from the unfumi-gated soils is sometimes larger than from the fumigatedsoils and has been contributed to large amounts of easilydecomposable soil organic matter [2,3,29,60]. The highlignin and polyphenols content of the leaves of bothshrubs might have inhibited mineralization [42]. Thesoil microbial biomass C (FI) as a percentage of soil
Table 4
Ratio of the microbial biomass C vs the extractable C and extractable ninhydrin N and ratio of the microbial biomass N (CFI) vs extractable nin-
hydrin N for soil sampled under and outside canopy of huisache and mesquite, and in soil cultivated with maize for >19 years
Location Ratio biomass C vs
extractable C
Ratio biomass C vs
extractable ninhydrin N
Ratio biomass N vs
extractable ninhydrin N
1 day 10 days 1 day 10 days 1 day 10 days
(mg kg�1 soil) (mg kg�1 soil) (mg kg�1 soil)
Under canopy of huisache (HUISACHE) 1.8 1.0 6.7 5.9 2.2 2.0
Under canopy of mesquite (MESQUITE) 1.8 1.8 8.6 8.2 2.7 2.5
Outside canopy of the trees (OUTSIDE) 3.7 4.5 10.6 8.2 1.8 1.4
Cultivated (AGRICULTURE) 5.3 4.5 23.0 11.4 2.1 1.0
Mean 3.2 3.0 12.2 8.4 2.2 1.7

185B.G. Reyes-Reyes et al. / European Journal of Soil Biology 43 (2007) 180e188
Table 5
Microbial biomass C (mg kg�1 soil) as measured with substrate induced respiration technique and basal respiration (mg C kg�1 soil), qCO2, biomass
CSIR:Corg and biomass CFI:Corg for soil sampled under and outside canopy of huisache and mesquite, and in soil cultivated with maize for>19 years
Location SIRa Basal respirationb qCO2c Biomass
CSIR:Corgd
Biomass
CFI:Corge
(mg C kg�1 soil)
Under canopy of huisache (HUISACHE) 1138 af 2.10 1.85 3.5 1.0
Under canopy of mesquite (MESQUITE) 868 b 1.86 2.14 3.9 1.7
Outside canopy of the trees (OUTSIDE) 180 c 0.53 2.97 1.7 2.0
Cultivated (AGRICULTURE) 148 c 0.21 1.43 1.4 1.1
MSDg 5% 269
a SIR: substrate induced respiration, microbial biomass C (Anderson and Domsch, 1978), [5].b The basal respiration was derived from the CO2 produced between day 7 and 14 in an aerobic incubation.c The qCO2 was calculated by dividing basal respiration (mg CO2-C g�1 dry soil h�1) by microbial C as measured with SIR (g CCBM g�1 dry soil)
Dilly and Munch (1998, 55), [15].d Biomass CSIR:Corg: ratio of the microbial biomass C as measured with SIR and soil organic C.e Biomass CFI:Corg: ratio of the microbial biomass C as measured with the fumigation incubation [22] and soil organic C.f Values for locations with a different letter are significantly different from each other (P < 0.05).g MSD: minimum significant difference.
organic C ranged from 1.0 to 2.0% similar to valuesreported by Jenkinson [27]. He reported that values gen-erally range between 1 and 3%, although Kaiser et al.[32] reported values between 0.1 and 6.3%, Andersonand Domsch [6] values ranging from 0.27 to 7.00%,and Franzluebbers et al. [18] values between 1 and10%. This large range has been attributed to differencesin soil characteristics, vegetation cover, managementpractices, as well as to variations in sampling timeand analytical methods [6]. The microbial biomass Nas a percentage of soil organic N ranged between1.2% and 3.6%. This was within ranges of 1% to 6%,and 1.1% to 4.4% as found by Joergensen and Brookes[30] and Ross et al. [44], respectively. Diaz-Ravinaet al. [14] reported microbial biomass N values of 3%of total soil N for agricultural soil. In the experiment re-ported here, it was as low as 1%, and 3-times lower thansoils under natural vegetation.
The microbial biomass as measured with the SIRtechnique was>2-times larger than the biomass C mea-sured with the CFI technique for soil sampled under thecanopy of the shrubs, but similar for the other treat-ments (Table 2). Martens [35] reported that the ratioof microbial biomass estimated by SIR and micro-bial biomass C measured by the CFI for soils with pHvalues >6.0 ranged between 1.5 and 2.5. The ratio ofmicrobial biomass estimated by SIR and CFE rangedfrom 1.1 to 3.4 after 1 day, and from 1.2 to 2.4 after10 days. Both ranges were greater than the range of0.69e1.11 reported by Ross et al. [44]. However, hestated that higher values could be found in soil sampleswith a pH above 6.0.
The mean factor relating microbial biomass C (CFI)with the total C released through fumigation after 1 day
was 3.15 and similar to the factor of 2.64 reported byVance et al. [56,57]. Factors relating microbial biomassC with the ninhydrin positive compounds releasedthrough fumigation after 1 day reported in the literaturerange from 20.6 [30] to 64.8 [53]. The value for the ar-able soil was similar to values reported by Joergensenand Brookes [30], Ocio et al. [40] and Carter [12], butvalues for soil sampled under canopy of the shrubsand outside were lower.
Sparling et al. [52], reported kEC values ranging from0.19 to 0.56, Jordan and Beare [31] from 0.22 and 0.58and Sparling and West [50] from 0.15 to 0.56 similar tovalues reported here. Lower mean values, e.g. 0.17 [23]and larger ones, e.g. 0.63 [55] as compared to a value of0.39 found in this experiment have also been reported.The mean EC/FC value (extractable C after fumiga-tion/flush of CO2) of 0.88 was similar to a factor 0.70reported by Vance et al. [57], a factor of 1.00 reportedby Kaiser et al. [32] and Zagal [61] and a factor of0.98 reported by Sparling and Zhu [51].
The ratio between microbial biomass N and nin-hydrin positive compounds for 1 day fumigation hadmean 2.20 and was similar to values found by Brookeset al. [11] for a wide range of soils. A larger mean of 6.5was proposed by Sparling and Zhu [51] for acid soilsfrom Western-Australia after 1 day fumigation.
Brookes [10] suggested that qCO2 or the Cmic:Corgratio are better indicators for evaluating the effects ofsome stress factor, such as toxic metals, than eithermicrobial activity or biomass measurements alone.Anderson [4] stated that the Cmic:Corg ratio could beused as an indicator of stability to recognize environ-mental changes and together with qCO2, gives an‘‘eco-physiological profile’’ of a site. Anderson [4]
186 B.G. Reyes-Reyes et al. / European Journal of Soil Biology 43 (2007) 180e188
considered the critical values of qCO2 > 2 and Cmic:Corg ratio <2.0 for neutral arable soils. Anderson andDomsch [7] obtained qCO2 values ranging from 0.6 to1.7 for soils from different cropping systems. Values ob-tained for our lightly alkaline arable soil (pH 7.6) mightsuggest a careless cultivation [49], or lower availabilityand/or degradability of organic substrates. This appearsto be confirmed by the significantly lower microbial ac-tivity observed by Reyes-Reyes et al. [41] for this kindof arable soils compared to those variants sampled out-side the canopy of N2 fixing shrubs where the land is notcovered by shrubs, but by grasses and some Opuntiaspecies. Although Corg was 1.5 times larger in theHUISACHE compared to the MEZQUITE treatment(Table 1) a larger Cmic:Corg ratio was found in the latter.It indicated the accumulation of organic matter in thesoil and might be explained by the reduced degradabil-ity of Acacia spp. litter due to its larger polyphenolscontent [42]. The qCO2 obtained for huisache and mes-quite were similar to values reported for low, pure andhigh maquis with pine for the Mediterranean area[45]. Rutigliano et al. stated that plant cover type wasthe key factor influencing soil characteristics morethan plant species. The qCO2 and Cmic:Corg valueswere larger for soil sampled under the canopy of huis-ache and mesquite than for arable soil (Table 5).
It was found that cultivation of soils of the centralhighlands of Mexico with maize reduced microbial bio-mass C and N, and the factors relating the different tech-niques used to measure them, i.e. CFI, CFE and SIR,were variable but in the same range as those reportedfor other ecosystems. Converting soil under natural veg-etation to arable soil was not only detrimental for soilquality, but might be unsustainable as organic matterinput is limited.
Acknowledgements
We thank M. Luna-Guido and M.L. Maya-Salazarfor technical assistance. The research was funded bythe Universidad Autonoma del Estado de Mexico(UAEM), project 1604/2002 and Cinvestav. B.G. R.-R.received grant-aided support from Programa para elMejoramiento del Profesorado (PROMEP).
References
[1] M. Amato, Determinations of carbon 12C and 14C in plant and
soil, Soil Biol. Biochem 15 (1983) 611e612.
[2] M. Amato, J.N. Ladd, Assay for microbial biomass based on
ninhydrin-reactive nitrogen in extracts of fumigated soils, Soil
Biol. Biochem 20 (1988) 107e114.
[3] M. Amato, J.N. Ladd, Application of the ninhydrin-reactive N
assay for microbial biomass in acid soils, Soil Biol. Biochem
26 (1994) 1109e1115.
[4] T.H. Anderson, Microbial eco-physiological indicators to assess
soil quality, Agr. Ecosyst. Environ 98 (2003) 285e293.
[5] J.P.E. Anderson, K.H. Domsch, A physiological method for the
quantitative measurement of microbial biomass in soils, Soil
Biol. Biochem 10 (1978) 215e221.
[6] T.H. Anderson, K.H. Domsch, Ratios of microbial biomass car-
bon to total organic carbon in arable soils, Soil Biol. Biochem
21 (1989) 471e479.
[7] T.H. Anderson, K.H. Domsch, Application of eco-physiological
quotients (qCO2 and qD) on microbial biomasses from soils of
different cropping histories, Soil Biol. Biochem 22 (1990)
251e255.
[8] R.C. Barth, J.O. Klemmedson, Amount and distribution of dry
matter, nitrogen and organic carbon in soil-plant systems of
mesquite and palo verde, J. Range Manage 35 (1982) 412e418.
[9] J.M. Bremner, Total nitrogen, in: D.L. Sparks (Ed.), Methods of
Soil Analysis: Chemical Methods, Soil Science Society of
America, Madison, 1996, pp. 1085e1121.
[10] P.C. Brookes, The use of microbial parameters in monitoring
soil pollution by heavy metals, Biol. Fertil. Soils 19 (1995)
269e279.
[11] P.C. Brookes, A. Landman, G. Pruden, D.S. Jenkinson, Chloro-
form fumigation and the release of soil nitrogen: a rapid direct
extraction method to measure microbial biomass nitrogen in
soil, Soil Biol. Biochem 17 (1985) 837e842.
[12] M.R. Carter, Ninhydrin-reactive N released by the fumigation-
extraction method as a measure of microbial biomass under
field conditions, Soil Biol. Biochem 23 (1991) 139e143.
[13] S.J. Chapman, Inoculum in the fumigation method for soil bio-
mass determination, Soil Biol. Biochem 19 (1987) 83e87.
[14] M. Diaz-Ravina, A. Prieto, M.J. Acea, T. Carballas, Fumigation-
extraction method to estimate microbial biomass in heated soils,
Soil Biol. Biochem 24 (1992) 259e264.
[15] O. Dilly, J.C. Munch, Ratios between estimates of microbial
biomass content and microbial activity in soils, Biol. Fertil.
Soils 27 (1998) 374e379.
[16] W.R. Emanuel, H.H. Shugart, M.P. Stevenson, Climatic change
and the broad-scale distribution of terrestrial ecosystems com-
plexes, Climatic Change 7 (1985) 29e43.
[17] A.J. Franzluebbers, R.L. Haney, F.M. Hons, Relationships of
chloroform fumigation-incubation to soil organic matter pools,
Soil Biol. Biochem 31 (1999) 395e405.
[18] A.J. Franzluebbers, R.L. Haney, F.M. Hons, D.A. Zuberer, As-
sessing biological soil quality with chloroform fumigation-
incubation: why subtract a control? Can. J. Soil Sci. 79
(1999) 521e528.
[19] J.T. Frıas-Hernandez, Papel del mezquite Prosopis laevigata
(Humb. & Bonpl. Ex Wild) M.C. Johnst. en la sustentabilidad
de un ecosistema semiarido, Cinvestav, Irapuato, Guanajuato,
Mexico, 1998.
[20] W. Garner, Y. Steinberger, A proposal mechanism for the for-
mation of ‘‘Fertile islands’’ in the desert ecosystem, J. Arid
Environ 16 (1989) 257e262.
[21] G.W. Gee, J.W. Bauder, Particle-size analysis, in: A. Klute
(Ed.), Methods of Soil AnalysisPhysical and Mineralogical
Methods, Soil Science Society of America, Madison, 1986,
pp. 383e411.
[22] W. Genxu, M. Haiyan, Q. Ju, C. Juan, Impact of land use
change on soil carbon, nitrogen and phosphorus and water
187B.G. Reyes-Reyes et al. / European Journal of Soil Biology 43 (2007) 180e188
pollution in an arid region of northwest China, Soil Use Manage
20 (2004) 32e39.
[23] E.G. Gregorich, G. Wen, R.P. Voroney, R.G. Kachanoski, Cali-
bration of a rapid direct chloroform extraction method for mea-
suring soil microbial biomass C, Soil Biol. Biochem 22 (1990)
1009e1011.
[24] E.G. Gregorich, B.C. Liang, C.F. Drury, A.F. Mackenzie,
W.B. McGill, Elucidation of the source and turnover of water
soluble and microbial biomass carbon in agricultural soils,
Soil Biol. Biochem 32 (2000) 581e587.
[25] R.L. Haney, A.J. Franzluebbers, F.M. Hons, L.R. Hossner,
D.A. Zuberer, Molar concentration of K2SO4 and soil pH affect
estimation of extractable C with chloroform fumigation-
extraction, Soil Biol. Biochem 33 (2001) 1501e1507.
[26] H. Insam, Developments in soil microbiology since the mid-
1960s, Geoderma 100 (2001) 389e402.
[27] D.S. Jenkinson, The determination of microbial biomass carbon
and nitrogen in soil, in: J.R. Wilson (Ed.), Advances in Nitrogen
Cycling in Agricultural Ecosystems, CAB, Wallingford, 1988,
pp. 368e386.
[28] D.S. Jenkinson, D.S. Powlson, The effects of biocidal treat-
ments on metabolism in soil. V: a method for measuring soil
biomass, Soil Biol. Biochem 8 (1976) 209e213.
[29] D.S. Jenkinson, S.A. Davidson, D.S. Powlson, Adenosine tri-
phosphate and microbial biomass in soil, Soil Biol. Biochem
11 (1979) 521e527.
[30] R.G. Joergensen, P.C. Brookes, Ninhydrin-reactive nitrogen
measurements of microbial biomass in 0.5 M K2SO4 soil
extracts, Soil Biol. Biochem 22 (1990) 1023e1027.
[31] D. Jordan, M.H. Beare, A comparison of methods for estimat-
ing soil microbial biomass carbon, Agr. Ecosyst. Environ 34
(1991) 35e41.
[32] E.A. Kaiser, T. Mueller, R.G. Joergensen, H. Insam,
O. Heinemeyer, Evaluations of methods to estimate the soil
microbial biomass and the relationship with the soil texture
and organic matter, Soil Biol. Biochem 24 (1992) 675e683.
[33] Q. Lin, P.C. Brookes, Comparison of methods to measure mi-
crobial biomass in unamended, ryegrass-amended and fumi-
gated soils, Soil Biol. Biochem 28 (1996) 933e939.
[34] H. Marstorp, X. Guan, P. Gong, Relationship between dsDNA,
chloroform labile C and ergosterol in soils of different organic
matter contents and pH, Soil Biol. Biochem 32 (2000)
879e882.
[35] R. Martens, Estimation of microbial biomass in soil by the res-
piration method: Importance of soil pH and flushing methods
for the measurement of respired CO2, Soil Biol. Biochem 19
(1987) 77e81.
[36] G. Montesinos, J.E. Dobarganes-Bueno, J.T. Frıas-Hernandez,
Identificacion de comunidades vegetales dominadas por
mezquite Prosopis laevigata (Humb. & Bonpl. Ex. Wild)
M.C. Johnst. en el norte de Guanajuato por medio de sensores
remotos, in: J.T. Frias-Hernandez, V. Olalde-Portugal,
E.J. Vernon-Carter (Eds.), El mequite arbol de usos multiples.
Estado actual del conocimiento en Mexico, Guanajuato State
University, Mexico, 2000, pp. 65e73.
[37] T. Muller, R.G. Joergensen, B. Meyer, Estimation of soil micro-
bial biomass C in the presence of living roots by the fumigation
extraction, Soil Biol. Biochem 24 (1992) 179e181.
[38] D.W. Nelson, L.E. Sommers, Total carbon, organic carbon and
organic matter, in: D.L. Sparks (Ed.), Methods of Soil Analysis:
Chemical Methods, Soil Science Society of America, Madison,
1996, pp. 961e1010.
[39] J.M. Oades, D.S. Jenkinson, Adenosine triphosphate content
of the soil microbial biomass, Soil Biol. Biochem 11 (1979)
201e204.
[40] J.A. Ocio, P.C. Brookes, D.S. Jenkinson, Field incorporation of
straw and its effects on soil microbial and soil inorganic N, Soil
Biol. Biochem 23 (1991) 171e176.
[41] G. Reyes-Reyes, L. Baron-Ocampo, I. Cuali-Alvarez, J.T. Frias-
Hernandez, V. Olalde-Potugal, L. Varela-Fragoso, L. Dendooven,
C and N dynamics in soil from the central highlands of Mexico as
affected by mesquite (Prosopis spp.) and huizache (Acacia
tortuoso): a laboratory investigation, App. Soil Ecol 19 (2002)
27e34.
[42] G. Reyes-Reyes, E. Zamora-Villafranco, M.L. Reyes-Reyes,
J.T. Frıas-Hernandez, V. Olalde-Portugal, L. Dendooven, De-
composition of leaves of huisache (Acacia tortuoso) and mes-
quite (Prosopis laevigata) in soil of the central highlands of
Mexico, Plant Soil 256 (2003) 359e370.
[43] D.J. Ross, Measurements of microbial biomass C and N in
grassland soils by fumigation-incubation procedures: influence
of inoculum size and the control, Soil Biol. Biochem 22
(1990) 289e294.
[44] D.J. Ross, D.J. McQueen, H.A. Kettles, Land rehabilitation un-
der pasture on volcanic parent materials: changes in soil micro-
bial biomass and C and N metabolism, Aust. J. Soil Res. 32
(1994) 1321e1337.
[45] F.A. Rutigliano, R. D’Ascoli, A. Virzo De Santo, Soil microbial
metabolism and nutrient status in a Mediterranean area as af-
fected by plant cover, Soil Biol. Biochem 36 (2004) 1719e
1729.
[46] SARH (Secretarıa de Agricultura y Recursos Hidraulicos),
Inventario nacional forestal periodico 1992e1994, SARH,
Mexico, 1994, pp. 57.
[47] SAS Institute, Statistic Guide for Personal Computers, Version
6.04, SAS Institute, Cary, 1989.
[48] J.L. Smith, J.J. Halvorson, H. Bolton Jr., Soil properties and mi-
crobial activity across a 500 m elevations gradient in a semi-
arid environment, Soil. Biol. Biochem 34 (2002) 1749e1757.
[49] G.P. Sparling, Soil microbial biomass, activity and nutrient cy-
cling as indicators of soil health, in: C. Pankhurst, B.M. Doube,
V.V.S.R. Gupta (Eds.), Biological Indicators of Soil Health,
CAB International, Wallingford, 1997, pp. 97e119.
[50] G.P. Sparling, A.W. West, A direct extraction method to esti-
mate soil microbial C: calibration in situ using microbial respi-
ration and 14C labelled cells, Soil Biol. Biochem 20 (1988)
337e343.
[51] G. Sparling, C. Zhu, Evaluation and calibration of biochemical
methods to measure microbial biomass C and N in soils from
Western Australia, Soil Biol. Biochem 25 (1993) 1793e1801.
[52] G.P. Sparling, C.W. Feltham, J. Reynolds, A.W. West,
P. Singleton, Estimation of soil microbial C by a fumigation-
extraction method: use on soils of high organic matter content,
and a reassessment of the kEC-factor, Soil Biol. Biochem 22
(1990) 301e307.
[53] G.P. Sparling, V.S.R. Gupta, C. Zhu, Release of ninhydrin-
reactive compounds during fumigation of soil to estimate
microbial C and N, Soil Biol. Biochem 25 (1993) 1803e1805.
[54] J.I. Sprent, L. t’Mannetje, The role of legumes in sustainable
farming systems: Past, present and future, in: D. Younie
(Ed.), Legumes in Sustainable Farming Systems, British Grass-
land Society, Reading, UK, 1996, pp. 2e14.
[55] K.R. Tate, D.J. Ross, C.W. Feltham, A direct extraction method
to estimate soil microbial C: effects of experimental variables

188 B.G. Reyes-Reyes et al. / European Journal of Soil Biology 43 (2007) 180e188
and some different calibration procedures, Soil Biol. Biochem
20 (1988) 329e335.
[56] E.D. Vance, P.C. Brookes, D.S. Jenkinson, Microbial biomass
measurements in forest soils: determination of kC values and
tests of hypotheses to explain the failure of the chloroform
fumigation-incubation method in acid soils, Soil Biol. Biochem
19 (1987) 689e696.
[57] E.D. Vance, P.C. Brookes, D.S. Jenkinson, An extraction
method for measuring soil microbial biomass C, Soil Biol. Bio-
chem 19 (1987) 703e707.
[58] B. Vanlauwe, L. Dendooven, R. Merckx, Residue fractionation
and decomposition: the significance of the active fraction, Plant
Soil 158 (1994) 263e274.
[59] N.E. West, J.M. Stark, D.W. Johnson, M.M. Abrams,
J.R. Wight, Effects of climatic change on the edaphic features
of arid and semiarid lands of western North America, Arid
Soil Res. Rehab 8 (1994) 307e351.
[60] B.L.Williams, G.P. Sparling, ExtractableN and P in relation tomicro-
bial biomass in UK acid organic soils, Plant Soil 76 (1984) 139e148.
[61] E. Zagal, Measurement of microbial biomass in rewetted air-
dried soil by fumigation-incubation and fumigation-extraction
techniques, Soil Biol. Biochem 25 (1993) 553e559.
[62] L. Zelles, Q.Y. Bai, T. Beck, F. Beese, Signature fatty acids in
phospholipids and lipopolysaccharides as indicators of micro-
bial biomass and community structure in agricultural soils,
Soil Biol. Biochem 24 (1992) 317e323.
Related Documents