Macromol. Symp. 2001, 167, 45-62 45 © WILEY-VCH Verlag GmbH, D-69469 Weinheim, 2001 Micro-Thermal Analysis of Polymers: Current Capabilities and Future Prospects Michael Reading 1* , Duncan M. Price 1 , David B. Grandy 1 , Roger M. Smith 2 , Laurent Bozec 3 , Michael Conroy 3 , Azzedine Hammiche 3 and Hubert M. Pollock 3 1. Institute of Polymer Technology and Materials Engineering, Loughborough University, Loughborough, Leicestershire LE11 3TU, U.K. 2. Chemistry Department, Loughborough University, Loughborough, Leicestershire LE11 3TU, U.K 3. Department of Physics, Lancaster University, Lancaster LA1 4YB, U.K. Summary: The current state of development of micro-thermal analysis (micro- TA) and related techniques are briefly reviewed. Results for a PET/epoxy resin composite and a bilayer polymer film are given as illustrations. Details are given of a new interface that enables the micro-TA unit to be placed inside a conventional FTIR spectrometer to carry out photothermal IR microscopy. New results are presented for a micro-pyrolysis-mass spectroscopy technique. The limitations of the current instrumentation are discussed in terms of the overriding problem being one of spatial resolution. Images obtained using pulsed force mode AFM with a high-resolution heated tip indicate the scope for future development of this technique. The possibility of even higher spatial resolution with other forms of probe are discussed along with the potential for imaging micro-pyrolysis time of flight mass spectroscopy and even tomography. It is concluded that these methods offer excellent prospects for characterising a wide range of polymer systems. Current Capabilities of Micro-TA The technique of micro-thermal analysis (micro-TA) was introduced a few years ago by Hammiche et al. [1-5] and later Fryer et al. demonstrated their own version [6] . Micro-TA is an extension of scanning thermal microscopy (SThM) [7,8] which is part of the family of scanning probe microscopy (SPM) techniques. Micro-TA uses an atomic force microscope in which the conventional tip is replaced by an ultra-miniature electrical resistor. The present configuration employs the probe design described by Dinwiddie and Pylkki [9,10] (Figure 1). This is fashioned from Wollaston process wire which consists of a 75 μm diameter silver wire surrounding a 5 μm diameter core of platinum/10% rhodium alloy. The wire is bent to form a sharp loop and secured into shape with a bead of epoxy resin. The silver layer is then etched

Welcome message from author
This document is posted to help you gain knowledge. Please leave a comment to let me know what you think about it! Share it to your friends and learn new things together.
Transcript

Macromol. Symp. 2001, 167, 45-62 45
© WILEY-VCH Verlag GmbH, D-69469 Weinheim, 2001
Micro-Thermal Analysis of Polymers: Current Capabilities and Future
Prospects
Michael Reading1*, Duncan M. Price1, David B. Grandy1, Roger M. Smith2,
Laurent Bozec3, Michael Conroy3, Azzedine Hammiche3 and Hubert M. Pollock3
1. Institute of Polymer Technology and Materials Engineering, Loughborough
University, Loughborough, Leicestershire LE11 3TU, U.K.
2. Chemistry Department, Loughborough University, Loughborough,
Leicestershire LE11 3TU, U.K
3. Department of Physics, Lancaster University, Lancaster LA1 4YB, U.K.
Summary: The current state of development of micro-thermal analysis (micro-TA) and related techniques are briefly reviewed. Results for a PET/epoxy resincomposite and a bilayer polymer film are given as illustrations. Details are givenof a new interface that enables the micro-TA unit to be placed inside aconventional FTIR spectrometer to carry out photothermal IR microscopy. Newresults are presented for a micro-pyrolysis-mass spectroscopy technique. Thelimitations of the current instrumentation are discussed in terms of the overridingproblem being one of spatial resolution. Images obtained using pulsed force modeAFM with a high-resolution heated tip indicate the scope for future developmentof this technique. The possibility of even higher spatial resolution with otherforms of probe are discussed along with the potential for imaging micro-pyrolysistime of flight mass spectroscopy and even tomography. It is concluded that thesemethods offer excellent prospects for characterising a wide range of polymersystems.
Current Capabilities of Micro-TA
The technique of micro-thermal analysis (micro-TA) was introduced a few years ago by
Hammiche et al. [1-5] and later Fryer et al. demonstrated their own version [6]. Micro-TA is an
extension of scanning thermal microscopy (SThM) [7,8] which is part of the family of scanning
probe microscopy (SPM) techniques. Micro-TA uses an atomic force microscope in which
the conventional tip is replaced by an ultra-miniature electrical resistor. The present
configuration employs the probe design described by Dinwiddie and Pylkki [9,10] (Figure 1).
This is fashioned from Wollaston process wire which consists of a 75 µm diameter silver wire
surrounding a 5 µm diameter core of platinum/10% rhodium alloy. The wire is bent to form a
sharp loop and secured into shape with a bead of epoxy resin. The silver layer is then etched

46
away at the apex to reveal the platinum filament which forms the major electrical resistance
element (approximately 2 Ω ) in the assembly and acts as a temperature sensor and heater. A
reflective mirror is glued on the wires to serve as a target for a laser spot which forms part of
optical lever deflection feedback system of the microscope. The finished assembly is mounted
on a carrier for mechanical and electrical connection to the piezoelectric scanner of the
microscope.
Figure 1. Schematic diagram of thermal probe made from Wollaston process wire.
For imaging, the probe can be operated in a purely passive mode as a resistance thermometer
in order to map temperature variations across a specimen. However, it is more commonly
used in an active mode whereby current is passed through the resistance so as to maintain its
temperature typically 10 to 20°C above ambient while the probe is rastered over the surface of
the sample. By monitoring the electrical power required to achieve a constant tip temperature,
an image of the sample may be acquired whose contrast is determined by the heat flux from
the tip to the surface. Thus it is possible map relative differences in thermal conductivity
across the specimen. In addition, a sinusoidal modulation of tip temperature can be
superimposed upon the average constant value. This AC measurement is influenced by
(amongst other things) spatial variations in the sample’s thermal diffusivity. As these thermal
measurements are made in contact mode using the usual force-feedback loop of the
microscope, a map of topography is also obtained at the same time. Typically, therefore, an

47
imaging experiment provides a map of the topography plus the underlying “DC” thermal
image and two “AC” thermal images (the amplitude of the power required to modulate the tip
temperature and the phase difference between applied modulation and tip/sample response).
This is illustrated in Figure 2 for a microtomed cross-section of a sample of polyethylene
terephthalate (PET) embedded in an epoxy resin. Such thermal images have been used to
follow the process of phase separation in a polymer blend [4].
Figure 2. Clockwise from top left: topographic, DC thermal, AC amplitude and AC
phase images for a sample of poly(ethylene terephthalate) (PET) (right) embedded in an
epoxy resin.

48
There are a variety of different types of analysis that can be performed using the thermal
probe described above which exploit its ability to function as a heater/thermometer that may
positioned over a specimen with high precision using the x,y piezoelectric actuators of the
AFM scanner. The first of these is localised thermal analysis [1-3,5]. Using a previously
acquired image as a guide, the tip is placed at a selected point on the surface and its
temperature is ramped linearly with time, usually with a superimposed temperature
modulation. This carried out in a differential configuration in conjunction with a reference
probe that is normally suspended in air. The difference in electrical power supplied to the
sample and reference probes is measured. This gives three calorimetric signals: the average
or DC power required to achieve the underlying linear temperature rise and the amplitude and
phase difference of the sample response to the superimposed modulation [11,12]. These
measurements are often referred to as micro-modulated temperature differential scanning
calorimetry (micro-MTDSC) or micro-modulated temperature differential thermal analysis
(micro-MTDTA) by analogy to their counterparts in the field of “bulk” thermal analysis [13].
In addition to the localised calorimetry, the position of the cantilever is monitored using the
microscope z-axis displacement detection system. When the probe is placed on the surface
of the sample, the cantilever is bent to a predetermined extent so as to exert a controlled force
at the tip. As the temperature is increased the sample will often soften as it melts or undergoes
a glass-rubber transition. This leads to the tip indenting into the sample. During this
measurement, the force-feedback loop of the microscope is disabled after applying the initial
force so as to prevent the probe being driven through the sample as it softens. The change in
deflection of the cantilever is monitored concurrent with the localised calorimetry described
earlier. This measurement is usually referred to as micro-thermomechanical analysis (micro-
TMA) [14,15].
Figures 3 and 4 show typical results from the sample imaged in Figure 2 for areas located on
the PET and epoxy resin areas. Heating rates over 500°C min-1 can be employed due to the
small thermal mass of the system. In this way the transition temperatures can be determined in
a localised way and differences in, for example, degree of crystallinity between the bulk and
the surface of a sample can be determined [16]. The temperature response of the probe is
calibrated using low molecular weight organic materials with certified transition temperatures
such as biphenyl, benzoic acid and 2-chloranthraquninone [17]. Collectively the techniques
described above are usually known as micro-thermal analysis (micro-TA).

49
Figure 3 Localised thermal analysis data for an area from the top right of the images in
Figure 2 showing the melting of the PET around 250°C (? sensor displacement = micro-
TMA; ¦ DC power, ? AC amplitude, ? AC phase = micro-MTDSC). Heating rate 10°C/s
with superimposed 5°C amplitude, 5 kHz temperature modulation. Initial force of surface
10 nN.
Figure 4 Localised thermal analysis data for an area from the bottom left of the images
in figure 2 showing the response of the epoxy resin (glass transition around 75°C, thermal
degradation around 300°C). Conditions and curve labels as for Figure 3.

50
In addition to the thermal analysis experiments described above, the tip may be heated to a
temperature sufficient to bring about thermal degradation of most organic materials. This has
the benefit of allowing the probe to be decontaminated between thermal measurements by
simply burning off any residues. Furthermore, this facility can be used as an analytical
method by rapidly heating the tip in contact with the specimen in order to bring about
pyrolysis of the surface. Any evolved gases can be trapped by sucking them into a tube
packed with suitable sorbent such as a activated charcoal or a molecular sieve placed close to
the thermal probe using a micromanipulator. The sorbent tube can then be removed from the
microscope and analysed by thermal desorption-gas chromatography/mass spectrometry (td-
GC/MS) [12,18]. This affords the ability to perform localised chemical analysis of specimens
in addition to physical characterisation by thermal analysis. Furthermore, we have shown that
is possible to deliberately extract material from the surface of a specimen by using the heated
tip to soften a region and then pull the tip away as it is cooling to leave a small sample
adhered to the probe (“thermally assisted nano-sampling”). This could be removed from the
tip by a solvent wash and subjected to a number of forms of analysis (e.g. nuclear magnetic
resonance spectroscopy, size exclusion chromatography, etc.). How the sample on the tip
decomposes with temperature after it has been removed from the surface can be studied by
ramping the tip temperature while using the AC calorimetric signals as a measure of the
amount of material remaining on the probe [19]. This experiment approximates micro- (or
nano-) thermogravimetric analysis of the extracted sample.
Figure 5. Schematic diagram of interface that allows the microscope to be mounted in
the compartment of a standard infra-red spectrometer.

51
A further form of chemical analysis that can be carried out by the apparatus is localised
infrared (IR) spectroscopy [20]. IR radiation from a standard FTIR spectrometer is focused
onto as small a spot as possible with the thermal probe located in the area of highest flux. The
temperature change of the surface arising from the absorption of infrared radiation is detected
(photothermal effect) and used as the input into the spectrometer. Figure 5 is a schematic
diagram of a recently constructed interface that allows the microscope to be mounted in the
compartment of a standard spectrometer. Infrared radiation from the source of the
spectrometer is focused into a spot (typically of the order of 500 µm in diameter) on the
surface. The tip is then used as the detector and the spectrometer is operated in the normal
way.
Figure 6. Cross-section though a sample of polyethylene-coated styrene-butadiene
rubber film embedded in an epoxy resin. Left: topographic image, right: DC thermal image.
Broken lines drawn on topographic image indicate boundaries between the
rubber/polyethylene/resin.
An example of the characterisation of polymer system is shown in Figures 6-11 for a sample
of a styrene-butadiene rubber film coated with a thin layer of polyethylene. Topographic and
thermal conductivity images of a cross-section through the film embedded in epoxy resin are
shown in Figure 6. The images indicate that the outer layer is only 5 µm in thickness.
Thermal analysis of this layer indicates that it melts around 120°C - typical for polyethylene
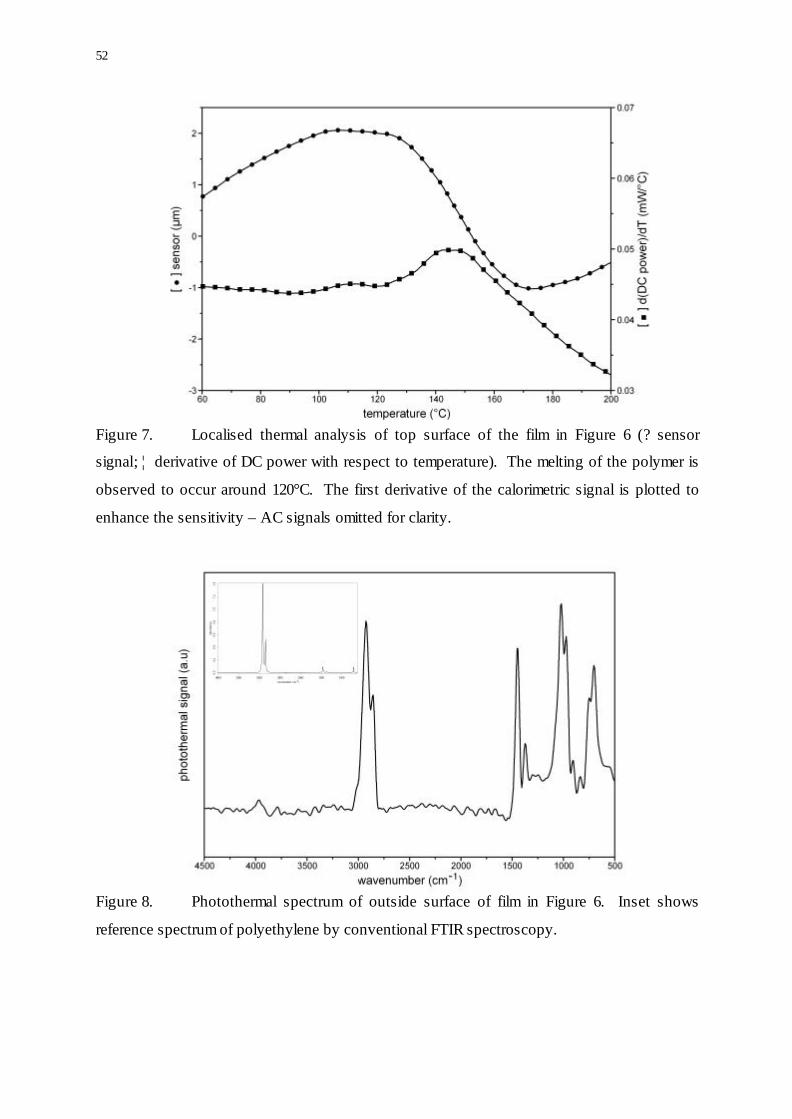
(Figure 7). The infrared spectrum of the outer layer, obtained using the thermal probe is
shown Figure 8 supports this assignment (although some bands from the substrate are visible
at low wavenumbers since the depth of penetration of the IR radiation depends on frequency
in a similar fashion to conventional attenuated total reflectance spectroscopy).
52
Figure 7. Localised thermal analysis of top surface of the film in Figure 6 (? sensor
signal; ¦ derivative of DC power with respect to temperature). The melting of the polymer is
observed to occur around 120°C. The first derivative of the calorimetric signal is plotted to
enhance the sensitivity – AC signals omitted for clarity.
Figure 8. Photothermal spectrum of outside surface of film in Figure 6. Inset shows
reference spectrum of polyethylene by conventional FTIR spectroscopy.

53
Figure 9. Localised pyrolysis-GC/MS data for top layer of film showing single ion
chromatograms for m/e 57 (C4H9+) and m/e 104 (styrene) (to same scale).
Pyrolysis of the outside surface of the free film (laid flat under the tip rather than in cross-
section) in air yields mainly a mixture of hydrocarbons. These are identified in the GC/MS
data by single ion monitoring of the C4H9+ ion (m/e = 57) which is a major product in the
fragmentation of higher alkanes (Figure 9). This confirms the structure of this outer layer.
Also shown in Figure 9 is a single ion chromatogram for styrene (m/e 104) which would arise
from some breakdown of the substrate underneath.
Figure 10 shows corresponding single ion chromatograms for a repeat measurement on the
same location measured during the first pyrolysis experiment. The polyethylene layer has
now been largely ablated by the earlier measurement and degradation products from the
rubber substrate now dominate the results. Also detected in the GS/MS data are peaks due to
butadiene dimer and trimer expected from the degradation of this polymer (not shown). The
photothermal spectrum of this layer is shown in Figure 11.

54
Figure 10. Localised pyrolysis-GC/MS data for film substrate following initial pyrolysis
experiment shown in figure 9.
Figure 11. Photothermal spectrum of film substrate in Figure 6. Inset shows reference
spectrum of styrene-butadiene rubber by conventional FTIR spectroscopy.
55
As an alternative to analysis of evolved gases by GC-MS, mass spectroscopy by itself can be
used. This has the disadvantage of lacking the specificity given by the chromatographic
separation but the advantage of considerably reduced time for analysis. Figure 12 shows some
initial results from this technique on the polyethylene/rubber film described above. The open
end of a fine capillary transfer line is placed near the probe - this leads directly to the ion
source of the mass spectrometer. It takes only a few seconds for the gas to travel to the
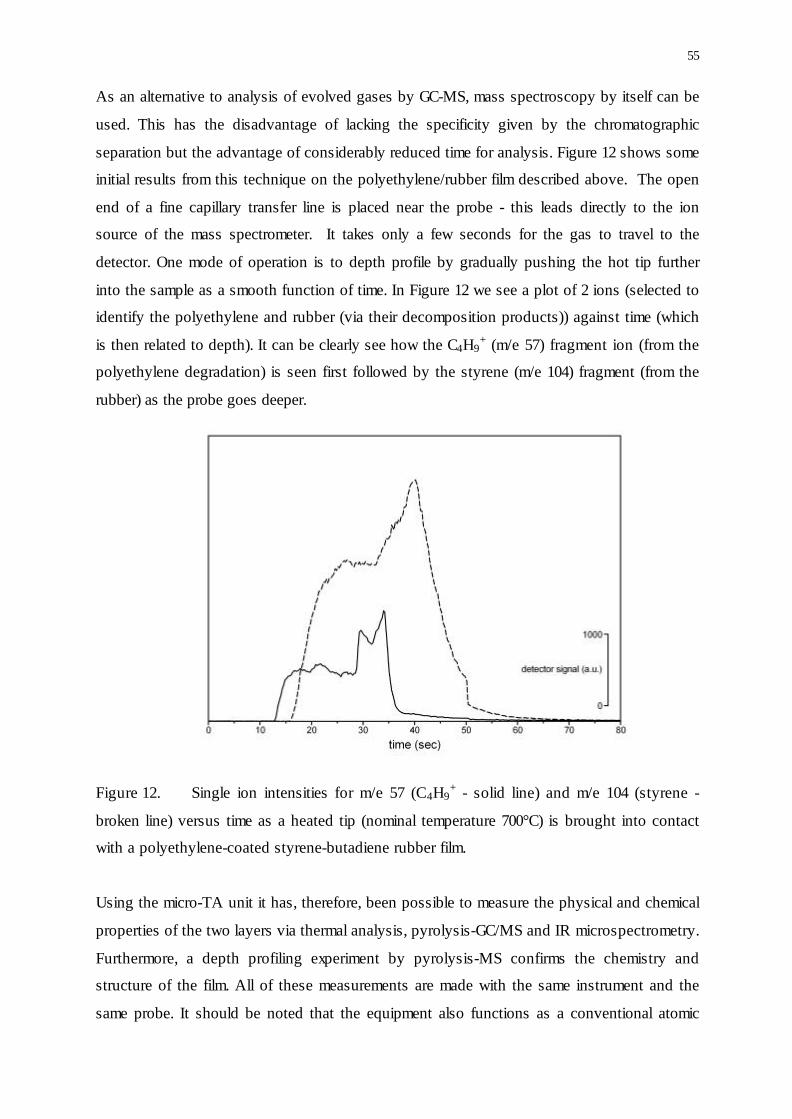
detector. One mode of operation is to depth profile by gradually pushing the hot tip further
into the sample as a smooth function of time. In Figure 12 we see a plot of 2 ions (selected to
identify the polyethylene and rubber (via their decomposition products)) against time (which
is then related to depth). It can be clearly see how the C4H9+ (m/e 57) fragment ion (from the
polyethylene degradation) is seen first followed by the styrene (m/e 104) fragment (from the
rubber) as the probe goes deeper.
Figure 12. Single ion intensities for m/e 57 (C4H9+ - solid line) and m/e 104 (styrene -
broken line) versus time as a heated tip (nominal temperature 700°C) is brought into contact
with a polyethylene-coated styrene-butadiene rubber film.
Using the micro-TA unit it has, therefore, been possible to measure the physical and chemical
properties of the two layers via thermal analysis, pyrolysis-GC/MS and IR microspectrometry.
Furthermore, a depth profiling experiment by pyrolysis-MS confirms the chemistry and
structure of the film. All of these measurements are made with the same instrument and the
same probe. It should be noted that the equipment also functions as a conventional atomic

56
force microscope and thus the morphology of samples can be studied in addition to the
localised characterisation afforded by micro-thermal analysis.
Other Micro-Thermal Analysis Modes
Although not yet available as a routine tool, localised dynamic mechanical analysis has been
demonstrated [5,21,22]. Either the whole sample can be heated [21] or the temperature of the tip
may be scanned [22]. Early indications are that it is possible to detect both primary and
secondary transitions. Both oscillation normal to the surface and lateral oscillations have been
used [22].
An imaging mode that has recently been demonstrated is thermal expansion microscopy
where the temperature of the tip is modulated and the resulting modulation of the z-position of
the probe is measured [22]. This modulation comprises a contribution from the thermal
expansion of the probe itself and from the thermal expansion of the sample. The thermal
diffusivity of the sample influences the amount of sample that is heated and therefore the
resulting thermal expansion of the surface. In principle calibration could disentangle these
various contributions. Even without this further refinement this mode of imaging has been
shown to give good contrast between different polymers.
Current Applications of Micro-Thermal Analysis
Micro-TA has been used to study a number of polymer systems in addition to those described
above: multi-layer packaging materials, polymer welds, defects in polymer films, interphase
regions in composites [11,14,23,24]. A number of applications have also been demonstrated in
biology, pharmacy and the electronics industry [14,24-26]. The range of problems that can be
tackled using these tools should be as broad as their parent macroscopic techniques.
Future prospects for micro-thermal analysis
The main drawback of current micro-TA instruments is insufficient spatial resolution. The
commercially available thermal probe described earlier, has a spatial resolution for imaging of
about 1 µm, a few micrometres square for local thermal analysis and a few tens of
micrometres square for localised pyrolysis-GC/MS. The limit of resolution for the
photothermal IR measurement has not yet been established, but calculations suggest it will

57
ultimately be < 1 µm [20]. A micro-machined probe has recently been developed in which the
resistance element is deposited across the apex of a silicon nitride pyramid similar to a
conventional AFM tip [27]. Results obtained using a micro-machined thermal probe for
imaging and micro-TA suggest that an order of magnitude improvement over the Wollaston
wire probe [16]. A spatial resolution on the scale of tens of nanometres for thermal imaging has
been realised using passive thermocouple tips [28]. Such devices could be adapted for use in an
active mode by passing current through them. There would seem to be no fundamental reason,
therefore, why micro-TA will not ultimately achieve a resolution of a few tens of nanometres.
It may even prove possible to collect IR spectra with this resolution.
Figure 13. Pull off force vs. temperature for polystyrene (?) and poly(methyl
methacrylate) (?).
However, if the capability for thermal imaging is abandoned, then heated tips with the
resolution of conventional AFM probes have been manufactured which are able to measure
mechanical properties as a function of temperature with sub-nanometer resolution. Recently
we have used pulsed force mode (PFM [29-31]) with a temperature stage to study how pull-off
force varies as a function of temperature for individual polymers and polymer blends [32].
Figure 13 shows the data for polystyrene (PS) and poly(methyl methacrylate) (PMMA). The
sharp increases in this quantity that are observed at specific temperatures are attributed to
changes in the rheological properties of the samples as the temperature is raised and are,
therefore, a measure of the viscoelastic response of the polymer. Krotil et al. have used PFM

58
data obtained at various temperatures to measure the glass-rubber transition temperature of
polystyrene [31]. Changes pull-off behaviour can be used to make phase separation apparent
and to identify the phases. Recent work using PFM microscopy in combination with a
variable temperature sample stage has been used to study the morphology of PS/PMMA
blends and several phase separated segmented polyurethane elastomers [32].
Figure 14. Pulsed force mode (pull off force) images of a phase separated polystyrene/
poly(methyl methacrylate) blend using a micro-machined thermal probe. Probe temperature
30°C (left) and 150°C (right). The higher adhesion between the heated tip at 150°C and the
occluded phase (bright) identify it as polystyrene. The light streaks in the image at 30°C are
due to the presence of contamination.
Preliminary measurements using a micro-machined thermal probe in PFM are illustrated in
Figure 14 for a phase-separated PS/PMMA blend. In this experiment it is the tip rather than
whole sample that is heated, but the same type of behaviour is observed. As the temperature is
increased, the pull of force for the polystyrene increases dramatically before any change
occurs for the PMMA thus identifying the occluded phase as polystyrene. The advantage of
heating the tip over heating the whole sample are that the experiments can be performed much
more quickly and easily over the same area, the chances of the thermal treatment altering the
sample are greatly reduced, and micro-TMA (or micro-DMA) experiments can be performed
to confirm any identification. Work with probes designed to make pits in a polymer coating as
a means of data storage indicate an area as small as 20 nm are affected by such local
experiments [33]. These or similar probes could also image using PFM or other modes that are
sensitive to local mechanical properties, such as phase imaging [34-36]. How these properties
change as a function of temperature could then be studied by successive images at different
tip temperatures rather than changing the temperature of the whole sample as has been done
elsewhere [37,38]. In this way phases could be visualised and identified with a spatial resolution

59
similar to that of conventional atomic force microscopy. Similar high-resolution probes might
well also make it possible to ablate pits of a few tens of nanometres with the evolved gases
being analysed by time-of-flight mass spectrometry. As this process would be very rapid, it
should be possible to generate images using this technique and even carry out tomography as
successive layers of the sample are ablated away with the probe being able to precisely map
the changes in topology that occur as the surface is eroded. An illustration of this concept is
shown in Figures 15 and 16 where a conventional Wollaston wire probe was used to image
across the boundary between a sheet of PMMA glued to a sheet of PS (Figure 15).
Figure 15. Topography of the interface between a sheet of poly(methyl methacrylate)
(top) and polystyrene. Image size: 100 × 100 µm.
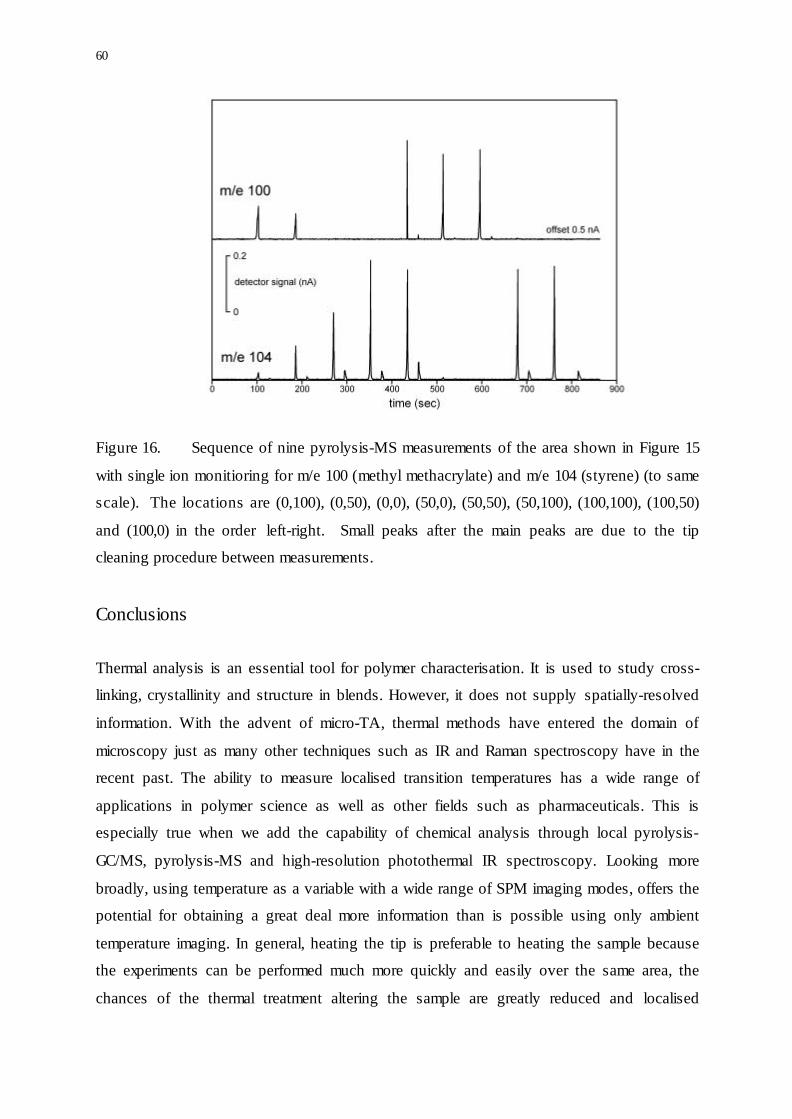
Localised pyrolysis-MS measurements were then carried out in a down-up zig-zag pattern
from the top left to the bottom right of the image whilst monitoring for the ions corresponding
to the monomers of each polymer: m/e 100 (methyl methacrylate) and m/e 104 (styrene). The
tip was heated at 25°C/s from 50°C to 600°C in air whilst in contact with the surface. The
sequence of peaks in Figure 16 corresponds to the composition changing between the
different layers and pyrolysis products from both polymers are detected at the interface
between the PMMA and PS. The small peaks after the main pyrolysis products were detected
are a result of cleaning the probe tip by heating it to 1000°C well away from the surface in
order to remove any contamination from the filament. The observation of small amounts of
residual material adhering to the tip is an example of “thermally assisted nano-sampling”
described earlier.
60
Figure 16. Sequence of nine pyrolysis-MS measurements of the area shown in Figure 15
with single ion monitioring for m/e 100 (methyl methacrylate) and m/e 104 (styrene) (to same
scale). The locations are (0,100), (0,50), (0,0), (50,0), (50,50), (50,100), (100,100), (100,50)
and (100,0) in the order left-right. Small peaks after the main peaks are due to the tip
cleaning procedure between measurements.
Conclusions
Thermal analysis is an essential tool for polymer characterisation. It is used to study cross-
linking, crystallinity and structure in blends. However, it does not supply spatially-resolved
information. With the advent of micro-TA, thermal methods have entered the domain of
microscopy just as many other techniques such as IR and Raman spectroscopy have in the
recent past. The ability to measure localised transition temperatures has a wide range of
applications in polymer science as well as other fields such as pharmaceuticals. This is
especially true when we add the capability of chemical analysis through local pyrolysis-
GC/MS, pyrolysis-MS and high-resolution photothermal IR spectroscopy. Looking more
broadly, using temperature as a variable with a wide range of SPM imaging modes, offers the
potential for obtaining a great deal more information than is possible using only ambient
temperature imaging. In general, heating the tip is preferable to heating the sample because
the experiments can be performed much more quickly and easily over the same area, the
chances of the thermal treatment altering the sample are greatly reduced and localised

61
characterisation can be performed to confirm any identification. As high-resolution probes
become more widely available, micro-TA could become the technique of choice for tackling a
wide range of academic and industrial problems in polymer science.
Acknowledgements
The authors wish to thank Bruker U.K. Ltd, TA Instruments Inc., V.G. Gas Systems and the
U.K. Engineering & Physical Sciences Research Council for financial assistance and
provision of equipment.
[1] N. S. Lawson, R. H. Ion, H. M. Pollock, D. J. Hourston, M. Reading, Physica Scripta 1995, T55, 199.[2] A. Hammiche, M. Reading, H. M. Pollock, M. Song, D. J. Hourston, Rev. Sci. Instrum. 1996, 67, 4268.[3] A. Hammiche, D. J. Hourston, H. M. Pollock, M. Reading, M. Song, J. Vac. Sci. Technol. 1996, B14, 1486.[4] H. M. Pollock, A. Hammiche, M. Song, D. J. Hourston, M. Reading, J. Adhesion 1998, 67, 217.[5] M. Reading, D. J. Hourston, M. Song, H. M. Pollock, A. Hammiche, Am. Lab. 1998, 30(1), 13.[6] D. S. Fryer, J. J. dePablo, P. F. Nealey, P.F.; Proc. SPIE 1998, 3333 1031.[7] E. Gmelin, R. Fisher, R. Stitzinger, Thermochim. Acta 1998, 310, 1.[8] A. Majumdar, Ann. Rev. Mat. Sci. 1999, 29, 505.[9] R. B. Dinwiddie, R. J. Pylkki, P. E. West, in “Thermal Conductivity 22” T. W. Tong, Ed., Technomics,Lancaster PA, 1994, pp. 668-677.[10] R. J. Pylkki, P. J. Moyer, P. E. West, Jpn. J. Appl. Phys. 1 1994, 33, 784.[11] D. M. Price, M. Reading, A. Caswell, A. Hammiche, H. M. Pollock, Eur. Microsc. Anal. 1998, 65, 17.[12] D. M. Price, M. Reading, A. Hammiche, H. M. Pollock, Int. J. Pharm. 1999, 192, 85.[13] M. Reading, Trends Poly. Sci. 1993, 1, 248.[14] D. M. Price, M. Reading, A. Hammiche, H. M. Pollock, M. G. Branch, Thermochim. Acta 1999, 332, 143.[15] D. M. Price, M. Reading, T. J. Lever, J. Thermal Anal. Calorim. 1999, 56, 673.[16] A. Hammiche, L. Bozec, M. Conroy, H. M. Pollock, G. Mills, J. M. R. Weaver, D. M. Price, M. Reading, D.J. Hourston, M. Song, J. Vac. Sci. Technol. B 2000, 18, 1322.[17] R. L. Blaine, C. G. Slough, D. M. Price, in Proc. 27th NATAS, K. Williams, K. Kociba, Eds., NorthAmerican Thermal Analysis Society/Omnipress 1999, pp. 691-696.[18] D. M. Price, M. Reading, T. J. Lever, in Proc. 27th NATAS, K. Williams, K. Kociba, Eds., North AmericanThermal Analysis Society/Omnipress 1999, pp. 420-425.[19] D. M. Price, M. Reading, A. Hammiche, H. M. Pollock, J. Thermal Anal. Calorim. 2000, 60, 723.[20] A. Hammiche. H. M. Pollock, M. Reading. M. Claybourn, P. H. Turner, K. Jewkes, Appl. Spectrosc. 1999,53, 810.[21] F. Oulevey, N. A. Burnham, G. Gremaud, A. J. Kulik, H. M. Pollock, A. Hammiche, M. Reading, M. Song,D. J. Hourston, Polymer 2000, 41, 3087.[22] A. Hammiche, D. M. Price, E. Dupas, G. Mills, A. Kulik, M. Reading, J. M. R. Weaver, H. M. Pollock, J.Microsc. 2000, 199, 180.[23] T. J. Lever, D. M. Price, Am. Lab. 1998, 30(16), 15.[24] M. Reading, D. M. Price, H. M.; Pollock, A. Hammiche, A. Murray, Am Lab. 1999, 31(1) 13.[25] P. G. Royall, D. Q. M. Craig, D. M. Price, M. Reading, T. J. Lever, Int. J. Pharm. 1999, 192, 87.[26] G. H. W. Sanders, C. J. Roberts, A. Danesh, A. Murray, D. M. Price, M. C. Davies, S. J. B. Tendler, M.Wilkins, J. Microsc. 2000, 198(2) 77.[27] H. Zhou, G. Mills, B. K. Chong, A. Midha, L. Donaldson, J. M. R. Weaver, J. Vac. Sci. Technol. A 1999,17(4), 2233.[28] A. Majumdar, J. Lai, M. Chandrachood, O. Nakabeppu, Y. Wu, Z. Shi, Rev. Sci. Instrum. 1995, 66, 3584.[29] E. Weilandt, S. Hild, O. Marti, Meas. Sci. Technol. 1997, 8, 1333.[30] T. Miyatani, M. Horii, A. Rosa-Zeiser, M. Fujihira, O. Marti, Appl. Phys. Lett. 1997, 71, 2632.[31] H. U. Krotil, T. Stifter, H. Waschipky, K. Weishaupt, S. Hild, O. Marti, Surf. Interface Anal. 1999, 27, 336.[32] D. B. Grandy, D. J. Hourston, D. M. Price, M. Reading, G. Goulart Silva, M. Song, P. A. Sykes,Macromolecules 2000, 33(25), 9348.

62
[33] G. Binnig, M. Despont, U. Drechsler, W. Häberle, M. Lutwyche, P. Vettiger, H. J. Mamin, B. Chui, T. W.Kenny, Appl. Phys. Lett. 1999, 74, 1329.[34] S. S. Sheiko, M. Möller, H.-J. Cantow, S. N. Magonov, Polym. Bull. 1993, 31, 693.[35] A. Wawkuschewski, K. Crämer, H.-J. Cantow, S. N. Magonov, Ultramicroscopy 1995, 58, 185.[36] R. García, J. Tamayo, A. San Paulo, Surf. Interface Anal. 1999, 27, 312.[37] V. V. Tsukruk, Z. Huang, Polymer 2000, 41, 5541.[38] R. M. Overney, C. Buenviaje, R. Luginbühl, F. Dinelli, J. Thermal Anal. Calorim. 2000, 56, 205.
Related Documents