doi: 10.1111/j.1529-8817.2005.00221.x Micro-Phylogeographic and Demographic History of Portuguese Male Lineages Sandra Beleza 1,2∗ , Leonor Gusm ˜ ao 1 , Alexandra Lopes 1,3 , C´ ıntia Alves 1 , Iva Gomes 1 , Maria Giouzeli 5 , Francesc Calafell 4 , Angel Carracedo 2 and Ant ´ onio Amorim 1,3 1 IPATIMUP, Instituto de Patologia e Imunologia da Universidade do Porto, R. Dr. Roberto Frias s/n, 4200 Porto, Portugal 2 Unidad de Gen´ etica Forense, Instituto de Medicina Legal, Universidad de Santiago de Compostela, E-15705 Santiago de Compostela, Galicia, Spain 3 Faculdade de Ciˆ encias da Universidade do Porto, 4050 Porto, Portugal 4 Unitat de Biologia Evolutiva, Facultat de Ci` encies de la Salut i de la Vida, Universitat Pompeu Fabra, Barcelona 08003, Catalonia, Spain 5 Department of Psychiatry, POWIC SANE Research Centre, University of Oxford, Warneford Hospital, Oxford OX3 7JX, United Kingdom Summary The clinal pattern observed for the distribution of Y-chromosome lineages in Europe is not always reflected at a geographically smaller scale. Six hundred and sixty-three male samples from the 18 administrative districts of Portugal were typed for 25 Y-chromosome biallelic and 15 microsatellite markers, in order to assess the degree of substructuring of male lineage distribution. Haplogroup frequency distributions, Analysis of Molecular Variance (AMOVA) and genetic distance analyses at both Y-SNP and Y-STR levels revealed a general genetic homogeneity of Portuguese sub-populations. The traditional division of the country in north, central and south, which is usually considered in studies addressing questions of the genetic variation distribution in Portugal, was not reflected in the Y-haplotype distribution. Instead, just one sub–region (Alentejo) stood out due to the presence of high diversity levels and a higher number of different lineages, at higher frequencies than in other regions. These results are reconciled with the historical evidence available, assuming that from prehistorical times down to the end of the medieval period this region harboured the most diverse groups of people and, because of economic depression, remained relatively isolated from recent homogenisation movements. The finding of a broadly homogeneous background for the Portuguese population has vast repercussions in forensic, epidemiological and association studies. Keywords: Y-SNPs, Y-STRs, population structure, phylogeny, Portugal. Introduction Portugal, a country situated in the Iberian Peninsula, constitutes the south-western European edge, and faces the Atlantic Ocean to the west and south, just ∼300 km from North Africa. The present Portuguese genetic landscape is the outcome of an old and slow process of gene flow, admixture with many different popula- tions, and local differentiation. These include the expan- ∗ Corresponding author: Sandra Beleza, IPATIMUP, Rua Dr. Roberto Frias, s/n, 4200-465 Porto, Portugal, Tel: +351 22 5570700; Fax: +351 22 5570799. E-mail: [email protected] sion from isolated population nuclei in refuges follow- ing the Last Glacial Maximum (LGM), the movement of peoples related to the introduction of agriculture, and subsequent Roman and Germanic invaders, which may have influenced the distribution of genetic diver- sity in the territory. In addition, some admixture events took place in historical epochs that were reported to have left imprints in the Portuguese genetic background, namely of North and sub-Saharan African origin, result- ing from the Moslem invasion during the 8th century, and the slave trade, particularly important from the 15th to 18th centuries (Pereira et al. 2000a,b; Spinola et al. 2002). C University College London 2005 Annals of Human Genetics (2005) 1

Welcome message from author
This document is posted to help you gain knowledge. Please leave a comment to let me know what you think about it! Share it to your friends and learn new things together.
Transcript

doi: 10.1111/j.1529-8817.2005.00221.x
Micro-Phylogeographic and Demographic Historyof Portuguese Male Lineages
Sandra Beleza1,2∗, Leonor Gusmao1, Alexandra Lopes1,3, Cıntia Alves1, Iva Gomes1,Maria Giouzeli5, Francesc Calafell4, Angel Carracedo2 and Antonio Amorim1,3
1IPATIMUP, Instituto de Patologia e Imunologia da Universidade do Porto, R. Dr. Roberto Frias s/n, 4200 Porto, Portugal2Unidad de Genetica Forense, Instituto de Medicina Legal, Universidad de Santiago de Compostela, E-15705 Santiago deCompostela, Galicia, Spain3Faculdade de Ciencias da Universidade do Porto, 4050 Porto, Portugal4Unitat de Biologia Evolutiva, Facultat de Ciencies de la Salut i de la Vida, Universitat Pompeu Fabra, Barcelona 08003, Catalonia,Spain5Department of Psychiatry, POWIC SANE Research Centre, University of Oxford, Warneford Hospital, Oxford OX3 7JX,United Kingdom
Summary
The clinal pattern observed for the distribution of Y-chromosome lineages in Europe is not always reflected ata geographically smaller scale. Six hundred and sixty-three male samples from the 18 administrative districts ofPortugal were typed for 25 Y-chromosome biallelic and 15 microsatellite markers, in order to assess the degree ofsubstructuring of male lineage distribution. Haplogroup frequency distributions, Analysis of Molecular Variance(AMOVA) and genetic distance analyses at both Y-SNP and Y-STR levels revealed a general genetic homogeneityof Portuguese sub-populations. The traditional division of the country in north, central and south, which is usuallyconsidered in studies addressing questions of the genetic variation distribution in Portugal, was not reflected in theY-haplotype distribution. Instead, just one sub–region (Alentejo) stood out due to the presence of high diversity levelsand a higher number of different lineages, at higher frequencies than in other regions. These results are reconciledwith the historical evidence available, assuming that from prehistorical times down to the end of the medievalperiod this region harboured the most diverse groups of people and, because of economic depression, remainedrelatively isolated from recent homogenisation movements. The finding of a broadly homogeneous background forthe Portuguese population has vast repercussions in forensic, epidemiological and association studies.
Keywords: Y-SNPs, Y-STRs, population structure, phylogeny, Portugal.
Introduction
Portugal, a country situated in the Iberian Peninsula,constitutes the south-western European edge, and facesthe Atlantic Ocean to the west and south, just ∼300 kmfrom North Africa. The present Portuguese geneticlandscape is the outcome of an old and slow processof gene flow, admixture with many different popula-tions, and local differentiation. These include the expan-
∗Corresponding author: Sandra Beleza, IPATIMUP, Rua Dr.
Roberto Frias, s/n, 4200-465 Porto, Portugal, Tel: +351 225570700; Fax: +351 22 5570799. E-mail: [email protected]
sion from isolated population nuclei in refuges follow-ing the Last Glacial Maximum (LGM), the movementof peoples related to the introduction of agriculture,and subsequent Roman and Germanic invaders, whichmay have influenced the distribution of genetic diver-sity in the territory. In addition, some admixture eventstook place in historical epochs that were reported tohave left imprints in the Portuguese genetic background,namely of North and sub-Saharan African origin, result-ing from the Moslem invasion during the 8th century,and the slave trade, particularly important from the 15thto 18th centuries (Pereira et al. 2000a,b; Spinola et al.2002).
C© University College London 2005 Annals of Human Genetics (2005) 1

S. Beleza et al.
Previous analyses of the Portuguese Y-SNP diversity(Pereira et al. 2000b) found statistically significant dif-ferences between the north and south of Portugal. Inthat study one haplogroup, E∗ (xE3a), showed an in-creasing north-to-south frequency gradient, which wasassociated with the influx of Berbers during the Islamicperiod in Iberia in the 8th to 14th centuries. The analy-sis of mtDNA variability failed to reveal any statisticallysignificant differences (Pereira et al. 2000a), although adifferent study showed opposite frequency gradients ofthe Paleolithic mtDNA lineage H∗ (without CRS) andthe Neolithic J2 (Gonzalez et al. 2003). These were ex-plained as the result of a higher impact of the Neolithicin the south.
In this work we have conducted a study of the distri-bution of the Y-chromosome in Portugal, by extendingthe sampling to all Portuguese districts and by increasingthe number of analysed markers. The combined studyof slow and fast evolving Y-specific markers providesa suitable approach to analyse the demographic histo-ries of populations on both micro-geographic level andin historical times, at least from a male perspective. Inthis study we use, for the first time, joint informationfrom both types of markers in order to better under-stand how the different sequence of historical events in-terfered with the genetic background of Portugal, andto determine if these events led to a relevant geographicstructuring of the male lineages in the territory.
Material and Methods
DNA Samples
A total of 663 blood samples were collected in the 18districts of Portugal from healthy unrelated individualsborn in each area, after informed consent (Figure 1).The samples analysed for Y-STRs (657) and Y-SNPs(658) did not always concur, either because the condi-tion of the sample did not allow further typing or due tothe lack of available sample. During the statistical analy-ses, three categories of samples were considered: either(1) local samples were considered independently, or (2)they were pooled into North, Central and South, tak-ing the rivers Douro and Tagus as barriers, as previouslyconsidered by others (Pereira et al. 2000a,b; Spinolaet al. 2002; Gonzalez et al. 2003), or (3) they were as-
signed to provinces, traditional regions defined accord-ing to geography and climate criteria (Amorim Girao,1941) (Figure 1). Genomic DNA was extracted withthe chelex extraction method (Lareu et al. 1994).
Marker Typing
Twenty-five Y-chromosome SNP markers were typedin order to define the most frequent male haplogroupsin Portugal (Figure 2, plus two SNPs within exon 5 ofthe PCDHY gene). The typing strategy involved sev-eral standard methods. The biallelic markers SRY 108311/2, YAP, SRY4064, M2, 12f2, M9, 92R7, SRY2627,LLY22g and Tat were typed as previously (Rosser et al.2000). For the remaining 14 Y-SNP markers, the fol-lowing hierarchical scheme was used (see Table 1 formethods):
- M35, M78, M81 and M123 were tested in individualsthat fell within the E∗ (xE3a);
- M170, M26, M172, M62 and M201 were tested inindividuals that fell within haplogroup F∗ (xK∗ );
Figure 1 Map of Portugal. Names in themap correspond to the district names.Provinces are individualized by differentgrey colours. North, centre and southcomprise the regions separated by themain Portuguese rivers displayed in thefigure, Douro and Tagus.
2 Annals of Human Genetics (2005) C© University College London 2005

Y-Chromosome Lineages in Portugal
Figure 2 Phylogenetic tree of Y-SNP haplogroups in Portugal. Biallelic markers aredisplayed in each branch. Note: following the work of Cinnioglu et al. (2004) and Semino etal. (2004), “J1d” was attributed to the J∗-M62 lineage.
- one BCF∗ (xGIJK) individual was tested for M213;- K∗ (xP) individuals were typed for M70;- M269 was typed in individuals recognised as
R1b∗ (xR1b3f);- two individuals that could not be assigned to any of
these lineages were later allocated to haplogroup L∗
due to the to presence of a derived state at M22 (seeTable 1);
- finally, two SNPs located within exon 5 of thePCDHY gene (NCBI assay IDs: ss5608044 and
ss5608045), recently described by Giouzeli et al.(2004), were typed according to Lopes et al. (2004).
The nomenclature given is according to the YCC(2002) and Jobling & Tyler-Smith (2003). The nomen-clature of haplogroups E3b and J was updated accordingto Cinnioglu et al. (2004), Cruciani et al. (2004) andSemino et al. (2004).
Fifteen Y-STRs (DYS19, DYS389 I and II, DYS390,DYS391, DYS392, DYS393, DYS437, DYS438,
C© University College London 2005 Annals of Human Genetics (2005) 3
S. Beleza et al.
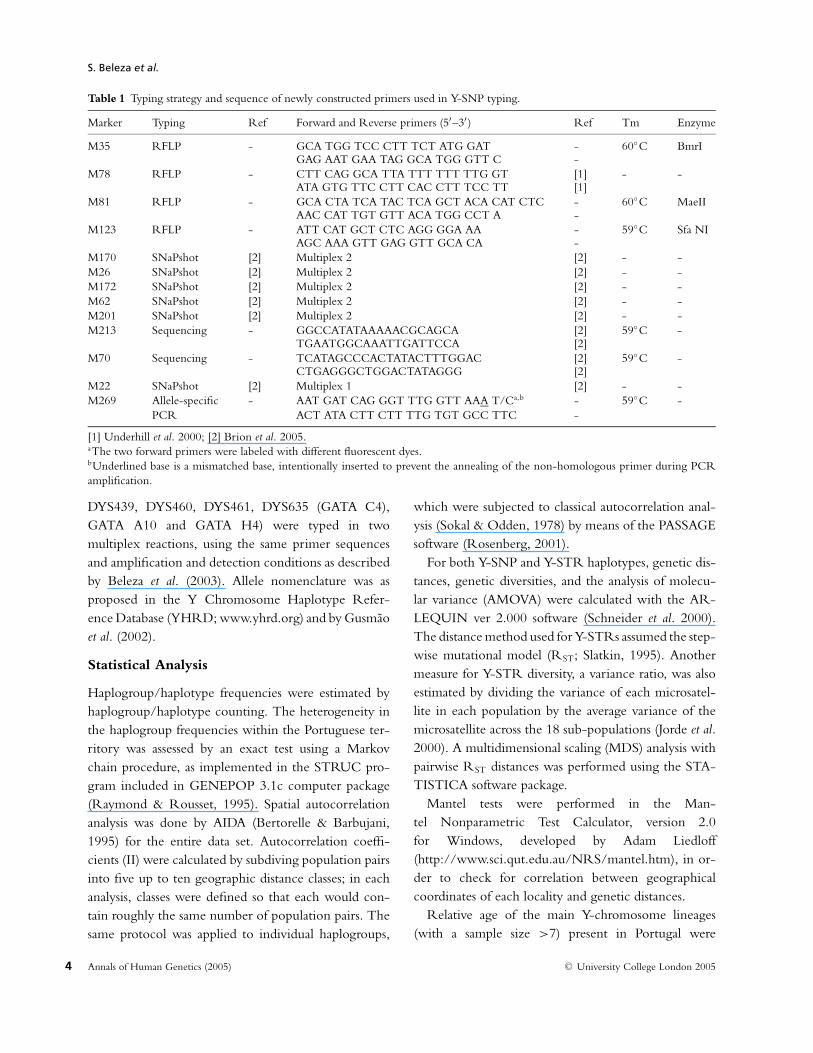
Table 1 Typing strategy and sequence of newly constructed primers used in Y-SNP typing.
Marker Typing Ref Forward and Reverse primers (5′–3′ ) Ref Tm Enzyme
M35 RFLP - GCA TGG TCC CTT TCT ATG GAT - 60◦C BmrIGAG AAT GAA TAG GCA TGG GTT C -
M78 RFLP - CTT CAG GCA TTA TTT TTT TTG GT [1] - -ATA GTG TTC CTT CAC CTT TCC TT [1]
M81 RFLP - GCA CTA TCA TAC TCA GCT ACA CAT CTC - 60◦C MaeIIAAC CAT TGT GTT ACA TGG CCT A -
M123 RFLP - ATT CAT GCT CTC AGG GGA AA - 59◦C Sfa NIAGC AAA GTT GAG GTT GCA CA -
M170 SNaPshot [2] Multiplex 2 [2] - -M26 SNaPshot [2] Multiplex 2 [2] - -M172 SNaPshot [2] Multiplex 2 [2] - -M62 SNaPshot [2] Multiplex 2 [2] - -M201 SNaPshot [2] Multiplex 2 [2] - -M213 Sequencing - GGCCATATAAAAACGCAGCA [2] 59◦C -
TGAATGGCAAATTGATTCCA [2]M70 Sequencing - TCATAGCCCACTATACTTTGGAC [2] 59◦C -
CTGAGGGCTGGACTATAGGG [2]M22 SNaPshot [2] Multiplex 1 [2] - -M269 Allele-specific - AAT GAT CAG GGT TTG GTT AAA T/Ca,b - 59◦C -
PCR ACT ATA CTT CTT TTG TGT GCC TTC -
[1] Underhill et al. 2000; [2] Brion et al. 2005.aThe two forward primers were labeled with different fluorescent dyes.bUnderlined base is a mismatched base, intentionally inserted to prevent the annealing of the non-homologous primer during PCRamplification.
DYS439, DYS460, DYS461, DYS635 (GATA C4),GATA A10 and GATA H4) were typed in twomultiplex reactions, using the same primer sequencesand amplification and detection conditions as describedby Beleza et al. (2003). Allele nomenclature was asproposed in the Y Chromosome Haplotype Refer-ence Database (YHRD; www.yhrd.org) and by Gusmaoet al. (2002).
Statistical Analysis
Haplogroup/haplotype frequencies were estimated byhaplogroup/haplotype counting. The heterogeneity inthe haplogroup frequencies within the Portuguese ter-ritory was assessed by an exact test using a Markovchain procedure, as implemented in the STRUC pro-gram included in GENEPOP 3.1c computer package(Raymond & Rousset, 1995). Spatial autocorrelationanalysis was done by AIDA (Bertorelle & Barbujani,1995) for the entire data set. Autocorrelation coeffi-cients (II) were calculated by subdiving population pairsinto five up to ten geographic distance classes; in eachanalysis, classes were defined so that each would con-tain roughly the same number of population pairs. Thesame protocol was applied to individual haplogroups,
which were subjected to classical autocorrelation anal-ysis (Sokal & Odden, 1978) by means of the PASSAGEsoftware (Rosenberg, 2001).
For both Y-SNP and Y-STR haplotypes, genetic dis-tances, genetic diversities, and the analysis of molecu-lar variance (AMOVA) were calculated with the AR-LEQUIN ver 2.000 software (Schneider et al. 2000).The distance method used for Y-STRs assumed the step-wise mutational model (RST; Slatkin, 1995). Anothermeasure for Y-STR diversity, a variance ratio, was alsoestimated by dividing the variance of each microsatel-lite in each population by the average variance of themicrosatellite across the 18 sub-populations (Jorde et al.2000). A multidimensional scaling (MDS) analysis withpairwise RST distances was performed using the STA-TISTICA software package.
Mantel tests were performed in the Man-tel Nonparametric Test Calculator, version 2.0for Windows, developed by Adam Liedloff(http://www.sci.qut.edu.au/NRS/mantel.htm), in or-der to check for correlation between geographicalcoordinates of each locality and genetic distances.
Relative age of the main Y-chromosome lineages(with a sample size >7) present in Portugal were
4 Annals of Human Genetics (2005) C© University College London 2005
Y-Chromosome Lineages in Portugal
estimated using a Bayesian approach incorporated in theprogram Batwing (Wilson et al. 2003). We considered amodel of exponential growth from initial constant pop-ulation size, using the effective population size and thepopulation growth rate priors specified in Weale et al.(2001). We considered two different sets of mutationrates as mutation priors: those estimated from pedigreedata (Kayser et al. 2000) and the effective mutation rateestimated in phylogenetic analyses (Zhivotovsky et al.2004). All other parameters were given flat, uninforma-tive priors to minimise their impact on the results. Themedian and the 5% and 95% quantiles for the posteriordistribution of the time since the most recent commonancestor of the sample (TMRCA or T) were estimated.Calculations were based on 50,000 runs of MCMC es-timator after a 10,000 run “burn in” time. Generationtime was set at 25 years.
Results
Y-SNP Haplogroup Variation
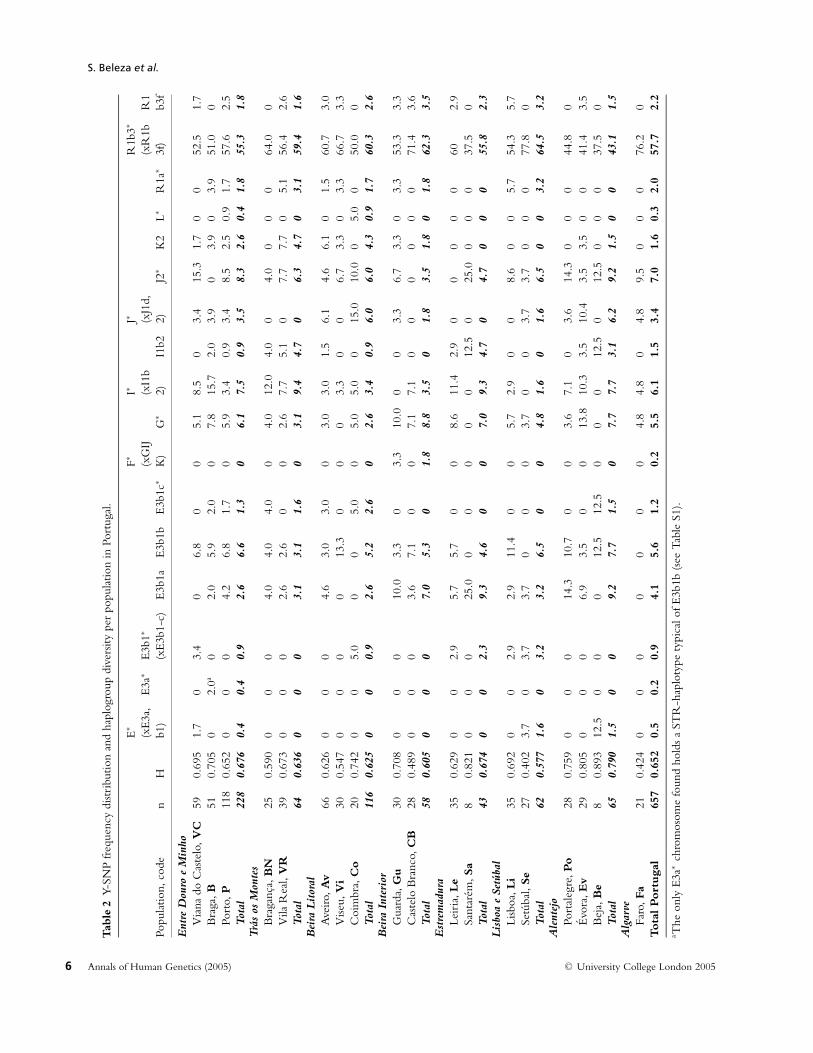
Of the 25 haplogroups discriminated by the 25 Y-SNPsthat were shown to be polymorphic in European popu-lations (Rosser et al. 2000; Semino et al. 2000; Underhillet al. 2000; 2001; Jobling & Tyler-Smith, 2003) only 17were present in our sample (Figure 2). Haplogroupfrequencies observed in each population and their re-spective diversities are shown in Table 2. Portugal hasa typical Western European haplogroup composition,characterized by high levels of haplogroup R1b3∗-M269 and smaller levels of haplogroups I∗-M170,G∗-M201 and E3b1∗-M35 (Semino et al. 2000; Boschet al. 2001; Cruciani et al. 2002; Flores et al. 2004; Brionet al. 2005). The only exception is the higher frequencyof haplogroup E3b1b, which was already reported to bea characteristic of Southwestern European populations,namely Iberia and Sicily (Rosser et al. 2000; Crucianiet al. 2004; Semino et al. 2004). The study of two re-cently described SNPs within exon 5 of the PCDHYgene, 288 bp apart, in a sample of 69 male individu-als of European descent (Giouzeli et al. 2004) and in asample of 112 Portuguese male individuals (Lopes et al.2004) showed them to be polymorphic, but present-ing only two allelic combinations: one ancestral (TG)and one doubly derived (GT). A rough estimation ofthese mutation ages suggested a more recent origin for
the derived haplotype compared to M173 (Lopes et al.2004). In our sample, we found that only R1a∗ andR1b3∗ chromosomes harboured the derivate state atboth PCDHY SNPs, meaning that these SNPs couldbe phylogenetically equivalent to either M173 or M207mutations. However, more lineages within clade R andwithin P(xR) need to be typed for these PCDHY SNPsto be precisely allocated in the Y phylogenetic tree.The most frequent haplogroup was R1b3∗ (xR1b3f),presenting frequencies higher than 50% in almost allsub-populations except Alentejo. The other haplogroupfrequencies remained lower than 10% in the total sam-ple and within the provinces, but exhibited the oppositetrend in some districts.
No significant differences in haplogroup frequencieswere found between districts (P = 0.09, exact test), aswell as between north, central and south (P = 0.64,exact test), or between provinces (P = 0.66, exact test).Furthermore, and contrary to previous findings (Pereiraet al. 2000b), no correlations were found between thefrequency of any haplogroup and latitude or longitude.Spatial autocorrelograms were also computed by meansof AIDA (Bertorelle & Barbujani, 1995). Different waysof dividing pairs of populations into distance classesyielded consistently non-significant correlograms (datanot shown). The same was true for the frequencies ofall haplogroups present in the Portuguese sample.
The haplogroup diversity values ranged between0.402 and 0.893. No differences in these values werefound between the North, Centre and South (Mann-Whitney test, P > 0.05). Curiously, the districts ofsouthern Alentejo show higher diversity values than theother provinces, with marginally significant differencesfrom the North and Central coastal provinces EntreDouro e Minho and Beira Litoral (Mann-Whitney test,P = 0.049). To exclude a spurious effect due to differentsample sizes, we tested to see if the haplogroup diver-sities and their standard errors were correlated acrossprovinces, which was shown not to be the case (Spear-man’s rho = 0.19, P = 0.445).
Y-STR Haplotype Variation
The typing of a 15 Y-STR set allowed the detec-tion of 577 different haplotypes, 36 of them beingshared by two sub-populations, nine by three, two byfour and one by five sub-populations (STR haplotype
C© University College London 2005 Annals of Human Genetics (2005) 5
S. Beleza et al.
Tab
le2
Y-SN
Pfr
eque
ncy
dist
ribu
tion
and
hapl
ogro
updi
vers
itype
rpo
pula
tion
inPo
rtug
al.
E∗
F∗I∗
J∗R
1b3∗
(xE
3a,
E3a
∗E
3b1∗
(xG
IJ(x
I1b
(xJ1
d,(x
R1b
R1
Popu
latio
n,co
den
Hb1
)(x
E3b
1-c)
E3b
1aE
3b1b
E3b
1c∗
K)
G∗
2)I1
b22)
J2∗
K2
L∗R
1a∗
3f)
b3f
Ent
reD
ouro
eM
inho
Via
nado
Cas
telo
,VC
590.
695
1.7
03.
40
6.8
00
5.1
8.5
03.
415
.31.
70
052
.51.
7B
raga
,B51
0.70
50
2.0a
02.
05.
92.
00
7.8
15.7
2.0
3.9
03.
90
3.9
51.0
0Po
rto,
P11
80.
652
00
04.
26.
81.
70
5.9
3.4
0.9
3.4
8.5
2.5
0.9
1.7
57.6
2.5
Tot
al22
80.
676
0.4
0.4
0.9
2.6
6.6
1.3
06.
17.
50.
93.
58.
32.
60.
41.
855
.31.
8T
ras
osM
onte
sB
raga
nca,
BN
250.
590
00
04.
04.
04.
00
4.0
12.0
4.0
04.
00
00
64.0
0V
ilaR
eal,
VR
390.
673
00
02.
62.
60
02.
67.
75.
10
7.7
7.7
05.
156
.42.
6T
otal
640.
636
00
03.
13.
11.
60
3.1
9.4
4.7
06.
34.
70
3.1
59.4
1.6
Bei
raL
itor
alA
veiro
,Av
660.
626
00
04.
63.
03.
00
3.0
3.0
1.5
6.1
4.6
6.1
01.
560
.73.
0V
iseu,
Vi
300.
547
00
00
13.3
00
03.
30
06.
73.
30
3.3
66.7
3.3
Coi
mbr
a,C
o20
0.74
20
05.
00
05.
00
5.0
5.0
015
.010
.00
5.0
050
.00
Tot
al11
60.
625
00
0.9
2.6
5.2
2.6
02.
63.
40.
96.
06.
04.
30.
91.
760
.32.
6B
eira
Inte
rior
Gua
rda,
Gu
300.
708
00
010
.03.
30
3.3
10.0
00
3.3
6.7
3.3
03.
353
.33.
3C
aste
loB
ranc
o,C
B28
0.48
90
00
3.6
7.1
00
7.1
7.1
00
00
00
71.4
3.6
Tot
al58
0.60
50
00
7.0
5.3
01.
88.
83.
50
1.8
3.5
1.8
01.
862
.33.
5E
stre
mad
ura
Leir
ia,L
e35
0.62
90
02.
95.
75.
70
08.
611
.42.
90
00
00
602.
9Sa
ntar
em,S
a8
0.82
10
00
25.0
00
00
012
.50
25.0
00
037
.50
Tot
al43
0.67
40
02.
39.
34.
60
07.
09.
34.
70
4.7
00
055
.82.
3L
isbo
ae
Setu
bal
Lisb
oa,L
i35
0.69
20
02.
92.
911
.40
05.
72.
90
08.
60
05.
754
.35.
7Se
tuba
l,Se
270.
402
3.7
03.
73.
70
00
3.7
00
3.7
3.7
00
077
.80
Tot
al62
0.57
71.
60
3.2
3.2
6.5
00
4.8
1.6
01.
66.
50
03.
264
.53.
2A
lent
ejo
Port
aleg
re,P
o28
0.75
90
00
14.3
10.7
00
3.6
7.1
03.
614
.30
00
44.8
0E
vora
,Ev
290.
805
00
06.
93.
50
013
.810
.33.
510
.43.
53.
50
041
.43.
5B
eja,
Be
80.
893
12.5
00
012
.512
.50
00
12.5
012
.50
00
37.5
0T
otal
650.
790
1.5
00
9.2
7.7
1.5
07.
77.
73.
16.
29.
21.
50
043
.11.
5A
lgar
veFa
ro,F
a21
0.42
40
00
00
00
4.8
4.8
04.
89.
50
00
76.2
0Tota
lPort
uga
l65
70.
652
0.5
0.2
0.9
4.1
5.6
1.2
0.2
5.5
6.1
1.5
3.4
7.0
1.6
0.3
2.0
57.7
2.2
a The
only
E3a
∗ch
rom
osom
efo
und
hold
sa
STR
-hap
loty
pety
pica
lofE
3b1b
(see
Tab
leS1
).
6 Annals of Human Genetics (2005) C© University College London 2005

Y-Chromosome Lineages in Portugal
Tab
le3
Y-ST
Rha
plot
ype
dive
rsity
and
aver
age
vari
ance
ratio
per
popu
latio
nin
Port
ugal
.
Via
nado
Vila
Cas
telo
Popu
latio
nC
aste
loB
raga
Port
oB
raga
nca
Rea
lA
veiro
Vise
uC
oim
bra
Gua
rda
Bra
nco
Leir
iaSa
ntar
emLi
sboa
Setu
bal
Port
aleg
reE
vora
Bej
aFa
ro
N60
5311
945
3948
3021
3028
317
3526
2628
823
Hap
loty
pe1.
0000
0.99
930.
9997
0.99
901.
0000
0.99
910.
9954
1.00
000.
9977
1.00
000.
9957
1.00
000.
9966
1.00
000.
9938
0.99
741.
0000
0.99
6di
vers
ityA
vera
geva
rian
ce1.
0827
1.06
010.
9851
0.91
700.
9057
0.90
231.
0109
1.02
051.
0234
0.66
161.
1215
1.28
020.
9138
0.81
441.
1186
1.08
791.
1053
0.98
89ra
tio
data within each haplogroup is given in supplementarymaterial, Table S1). Haplotype diversity was over 99%in all districts (Table 3), and shown to be uncorrelatedwith haplogroup diversity (r = 0.02). However, estimat-ing a Y-STR variance ratio for each district (Jorde et al.2000) in order to remove the possible bias arising fromthe contribution of highly mutating Y-STRs, the over-all correlation increased to r = 0.613. No differencesin the Y-STR diversity values were found between theNorth, Centre and South (Mann-Whitney test, P >
0.05). No differences were also observed between thedifferent provinces, although the samples from Alentejoshowed consistently higher diversity values.
Genetic Distances and MDS Analysis
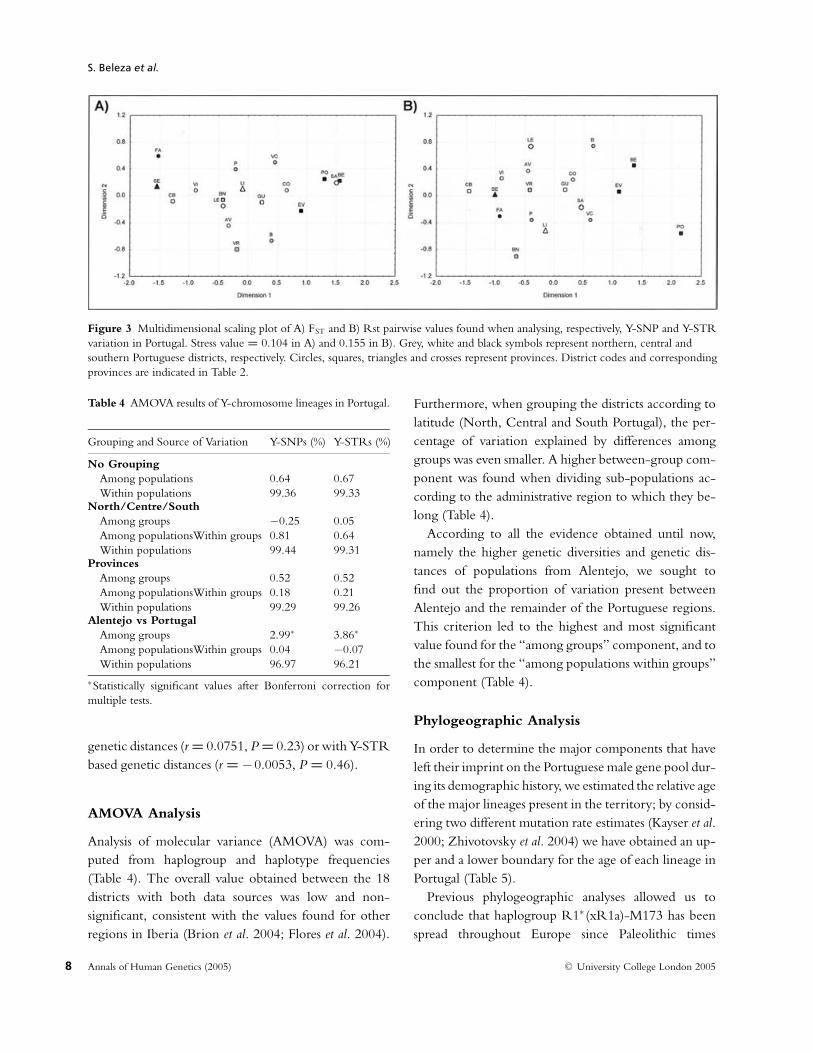
Haplogroup distributions in Portuguese sub-populations did not show a clear differentiation(Figure 3). Nevertheless, since the occurrence ofunique mutation events at the biallelic loci is mucholder than the establishment of the Portuguese popu-lation, and Y-STR loci possess a higher evolutionaryrate, Y-STR haplotypes are more informative intesting whether some heterogeneity exists amongthese sub-populations as a consequence of eithergenetic drift or low gene flow. Obviously, given thenon-recombinant nature of the NRY, differentiationbetween haplogroups and haplotypes is correlated(Mantel test between haplogroup Fst and haplotypeRst: r = 0.554, P < 0.01). However, this value impliesthat only ∼1/4 of the STR haplotype variation can beexplained by haplogroup differentiation; the remainingvariation may be a consequence of drift (affectingSTR haplotypes more intensely, each of which tendsto be relatively infrequent) and/or mutation locallygenerating STR variation. RST pairwise comparisonvalues were low (data not shown), as could be predictedfrom such a microgeographic study of neighbouringpopulations. The MDS plot of Figure 3 also showsthat there is not clear geographic heterogeneity inthe Portuguese Y-chromosomal variation. However,with respect to the Y-STR MDS plot, the samplesfrom Alentejo tend to separate from a common clustercomposed of the other Portuguese sub-populations(Figure 3).
Moreover, the Mantel test revealed no correlationbetween the geographical distance and Y-SNP based
C© University College London 2005 Annals of Human Genetics (2005) 7
S. Beleza et al.
Figure 3 Multidimensional scaling plot of A) FST and B) Rst pairwise values found when analysing, respectively, Y-SNP and Y-STRvariation in Portugal. Stress value = 0.104 in A) and 0.155 in B). Grey, white and black symbols represent northern, central andsouthern Portuguese districts, respectively. Circles, squares, triangles and crosses represent provinces. District codes and correspondingprovinces are indicated in Table 2.
Table 4 AMOVA results of Y-chromosome lineages in Portugal.
Grouping and Source of Variation Y-SNPs (%) Y-STRs (%)
No GroupingAmong populations 0.64 0.67Within populations 99.36 99.33
North/Centre/SouthAmong groups −0.25 0.05Among populationsWithin groups 0.81 0.64Within populations 99.44 99.31
ProvincesAmong groups 0.52 0.52Among populationsWithin groups 0.18 0.21Within populations 99.29 99.26
Alentejo vs PortugalAmong groups 2.99∗ 3.86∗
Among populationsWithin groups 0.04 −0.07Within populations 96.97 96.21
∗Statistically significant values after Bonferroni correction formultiple tests.
genetic distances (r = 0.0751, P = 0.23) or with Y-STRbased genetic distances (r = −0.0053, P = 0.46).
AMOVA Analysis
Analysis of molecular variance (AMOVA) was com-puted from haplogroup and haplotype frequencies(Table 4). The overall value obtained between the 18districts with both data sources was low and non-significant, consistent with the values found for otherregions in Iberia (Brion et al. 2004; Flores et al. 2004).
Furthermore, when grouping the districts according tolatitude (North, Central and South Portugal), the per-centage of variation explained by differences amonggroups was even smaller. A higher between-group com-ponent was found when dividing sub-populations ac-cording to the administrative region to which they be-long (Table 4).
According to all the evidence obtained until now,namely the higher genetic diversities and genetic dis-tances of populations from Alentejo, we sought tofind out the proportion of variation present betweenAlentejo and the remainder of the Portuguese regions.This criterion led to the highest and most significantvalue found for the “among groups” component, and tothe smallest for the “among populations within groups”component (Table 4).
Phylogeographic Analysis
In order to determine the major components that haveleft their imprint on the Portuguese male gene pool dur-ing its demographic history, we estimated the relative ageof the major lineages present in the territory; by consid-ering two different mutation rate estimates (Kayser et al.2000; Zhivotovsky et al. 2004) we have obtained an up-per and a lower boundary for the age of each lineage inPortugal (Table 5).
Previous phylogeographic analyses allowed us toconclude that haplogroup R1∗ (xR1a)-M173 has beenspread throughout Europe since Paleolithic times
8 Annals of Human Genetics (2005) C© University College London 2005

Y-Chromosome Lineages in Portugal
Table 5 Y-chromosome haplogroupvariance and age estimates in Portugalbased on 15 Y-STR loci.
Posterior Probabilities (in Ky)a
Haplogroup n Variance Tlower1 Tupper
2
R1b3∗ (xR1b3f)-M269 335 0.286 14.1 (7.7, 34.3) 38.3 (22.9, 77.4)R1b3f – SRY2627 14 0.172 3.1 (1.7, 6.9) 9.9 (5.9, 19.2)R1a∗- SRY10831.2 13 0.517 13.6 (7.6, 29.1) 40.8 (26.2, 77.2)K2 – M70 14 0.299 5.6 (3.1,13.1) 17.5 (10.7, 36.5)J∗ (xJ1d,2)- 12f2 21 0.329 8.7 (4.5, 21.0) 27.7 (15.7, 59.7)J2∗ – M172 44 0.607 11.9 (7.0, 25.2) 37.5 (25.1, 67.0)I∗ (xI1b2)-M170 38 0.521 10.3 (6.1, 20.8) 33.5 (22.2, 61.0)I1b2-M26 10 0.376 6.6 (3.7, 13.9) 20.2 (12.8, 37.0)G∗-M201 36 0.452 8.5 (4.9, 20.1) 27.8 (18.0, 57.8)E3b1a-M78 26 0.383 5.5 (3.3, 10.5) 17.2 (11.9, 28.8)E3b1b-M81 37 0.129 2.8 (1.4, 7.1) 8.0 (4.8, 18.1)E3b1c∗-M123 8 0.426 7.8 (4.4, 16.6) 23.4 (14.8, 43.4)
aMedian (95% equal-tailed intervals).1Estimated with the mutation rate obtained from pedigree data (Kayser et al. 2000)2Estimated with the effective mutation rate obtained in phylogenetic analyses(Zhivotovsky et al. 2004).
(Semino et al. 2000). Later, M269 was found to bepresent in all European R1∗ (xR1a)-M173 individualsby Cruciani et al. (2002), and STR variance analysissuggested that the distribution of R1b3∗-M269 in thiscontinent is more the result of its diffusion from theIberian refugia after the LGM, during the Late UpperPaleolithic (Cinnioglu et al. 2004). The same analysisof variance made with the Portuguese R1b3∗ (xR1b3f)individuals corroborates these findings (STR vari-ance of the Portuguese R1b3∗ (xR1b3f) equals 0.29,a smaller value when compared with that obtained byCinnioglu et al. [2004] in other Iberian samples [0.32]).Age estimates obtained from the STR variation asso-ciated with R1b3∗ (xR1b3f) chromosomes in Portugal(Table 5) point to a pre-Neolithic age for this hap-logroup, and set an upper limit for its introduction toPortugal (Barbujani et al. 1998). Another lineage alsofound to be characteristic of LGM expansions fromrefuge areas, I∗-M170 (Rootsi et al. 2004; see alsoTable 5), was present in our sample at lower levels.
Due to their decreasing frequencies from the Mid-dle East to Europe, haplogroups J, G and E have beenassociated with the demic diffusion of Neolithic farm-ers into Europe (Semino et al. 2000; Underhill et al.2001). J lineages were found to have a greater impactin the eastern and central part of the Mediterraneanbasin (Scozzari et al. 2001; Di Giacomo et al. 2003)than in Iberia and northeastern Europe (Scozzari et al.2001; Flores et al. 2004). Later, the refinement of thephylogeny of haplogroups J and E allowed the discrim-
ination of a collection of subclades of Neolithic andpost-Neolithic origin, reflecting very different evolu-tionary histories and processes of migration (Crucianiet al. 2004; Semino et al. 2004). Indeed, the age esti-mates of J∗ (xJ1d,2)-12f2, G∗-M201 and E3b1c∗-M123(Table 5) are consistent with an introduction to Portugalno earlier than the Neolithic. J2∗-M172 presents higherage estimates (Table 5) but, judging from its wide vari-ance, this must be a consequence of the coexistence ofmore than one subclade within this haplogroup (mainlyJ2-M172 and J2f∗-M67, both of Neolithic origin ac-cording to Semino et al. 2004) that was not discrimi-nated with the set of Y-SNP markers typed. This set ofpost-Paleolithic Y chromosomes comprises 17% of themale Portuguese background, a frequency that is smallerthan that observed in Italy or Greece for the same com-ponent (Semino et al. 2000; Di Giacomo et al. 2003) buthigher than in northeastern Europe (Semino et al. 2000;Wells et al. 2001). Within the Portuguese territory, thiscomponent is present at 17.5% in the north, 15% in thecentre and 20.4% in the south.
The distribution of E3b1a-M78 (E3b1a) in West-ern Europe was described as resulting from late demo-graphic expansions from the Balkans along the Mediter-ranean Sea (Cruciani et al. 2004; Semino et al. 2004),and E31b1a was considered to be a signature of Greekcolonists in south Italy (Semino et al. 2004). Its pres-ence in the Portuguese territory might have the sameorigin (see Table 5). In fact, within Portugal there is ahigher frequency of E3b1a in the south, which decreases
C© University College London 2005 Annals of Human Genetics (2005) 9

S. Beleza et al.
toward the north (6.2%, 4.8% and 2.7% in south, cen-tre and north, respectively). Nevertheless, and given thecurrent sample sizes, these values are not significantlydifferent from each other (P = 0.64, exact test), andthe autocorrelation analysis was not significant (data notshown).
E3b1b-M81 was found at 1.5–11.5% in a number ofSpanish populations (Bosch et al. 2001; Cruciani et al.2004; Flores et al. 2004; Brion et al. 2005), being as highas 20%–40% in Pasiegos from Cantabria, Spain (Brionet al. 2004; Cruciani et al. 2004). The distribution ofthese E3b1b chromosomes and respective age estimatesin Europe (e.g. Table 5) led to the suggestion that itspresence in the continent was mediated by the Islamicoccupation of the Iberian Peninsula (Bosch et al. 2001;Cruciani et al. 2004). The degree of North African con-tribution was found to be highly variable across dif-ferent Iberian populations (Cruciani et al. 2004; Floreset al. 2004). The same holds true in Portugal, whereno clear pattern can be observed (Table 2). Consideringthe division of the territory by latitude, we find 5.8%of E3b1b lineages in the north, 6% in the centre and4.4% in south. Pereira et al. (2000b) speculated that theobservation of a north to south increasing gradient ofE∗ (xE3a) might be associated with the patterns of Is-lamic occupation in Portugal reported in the historicalrecords (stronger and longer-lasting in the south). Ourresults do not support this hypothesis, and the higherfrequencies of E∗ (xE3a) in the south observed by the au-thors may have two non-exclusive explanations. Firstly,they might be a consequence of the higher frequencyof E3b1a rather than E3b1b in this region. Secondly,these observations were based on a relatively small sam-ple size for the south compared with the northern one,and the southern samples were mainly from Alentejo,which possesses higher frequencies of both haplogroups.Estimating the frequency of the same lineage in our ex-tended sample we also obtained an increasing gradientof 11.0% in the north, 13.1% in the centre and 14.4%in the south, although this was not significant. One factworth mentioning is the complete absence of this lin-eage in the most southern Portuguese region, Algarve,the area that is described as one of those most influencedby the Islamic rule (Torres, 1993), and its presence at6.6% in the northern region, Entre Douro e Minho.
Interestingly, the North African mtDNA counterpart,U6, is also found at 6% in the same northern region,the highest frequency found in Portugal (Pereira et al.2000a; Gonzalez et al. 2003), being rarer in southernareas.
When analysing globally the European Y lineages,we observe that all of them, R1b3∗ (xR1b3f) ex-cepted, are observed at higher frequencies in Alentejo(Table 2).
Finally, we have detected two L chromosomes, a hap-logroup that is characteristic of Southern Indian popula-tions (Kivisild et al. 2003) but extremely rare in Europe(Semino et al. 2000; Scozzari et al. 2001; Flores et al.2004; Brion et al. 2005).
Discussion
Y-chromosome population studies on a large geographicscale (Rosser et al. 2000; Semino et al. 2000) have re-vealed a significant substructuring of Y-chromosomevariation and important clinal patterns for some malelineages in Europe. However, research in more restrictedgeographical contexts has shown that this pattern is notalways reflected on a smaller scale (Di Giacomo et al.2003; Flores et al. 2004), revealing important geneticdrift and founder effects (Di Giacomo et al. 2003). Inthis work we have analysed for the first time joint in-formation given by Y-SNPs, and Y-STRs in order toassess the degree of micro-geographic substructuring ofthe Portuguese male lineages. It is known from archaeo-logical data (Ribeiro, 1966) that, throughout the demo-graphic history of Portugal, there was a clear differenti-ation between cultures that existed to the north of theriver Douro and those that influenced the south, beyondthe Tagus River. However, our results failed to detectany significant male gene pool heterogeneity betweenthe north, central and south regions. Conversely, ouranalysis revealed a general genetic homogeneity of Por-tuguese sub-populations, with the exception of thosebelonging to Alentejo. The relative differentiation ofAlentejo comes from the presence and abundance ofa higher number of different lineages of recent ances-try than are found in other sub-populations (Table 2).On the other hand, the lineage showing an oppositeclinal distribution to the arrival of new influences in
10 Annals of Human Genetics (2005) C© University College London 2005
Y-Chromosome Lineages in Portugal
Western Europe, R1b3∗-M269, presents an unusuallylow frequency in Alentejo: 43.1% vs values higher than50% in other Western European populations (Rosseret al. 2000; Semino et al. 2000). This seems rathercurious since populations from Alentejo nowadays arethe smallest in size and are still decreasing. However,this was not the case up to the end of the 15th cen-tury, when they harboured important rural and urbanpopulations.
As in other European populations, almost all Por-tuguese Y chromosomes belong to haplogroups R1b3∗-M269, I∗-M170, J∗-12f2, G∗-M201 and E3b1∗-M35.
One haplogroup that deserves special considerationis E3b1b-M81. Historical records show that in Portu-gal (and in all Iberia) the Muslim influence was morelimited to the south, but occupying a vast area that hadthe Iberian central mountain range as its northern limit(Torres, 1993). However, what we observe today at thegenetic level, both in the paternal (Table 2; Brion et al.2004; Cruciani et al. 2004; Flores et al. 2004) and thematernal gene pool (Pereira et al. 2000a; Gonzalez et al.2003; Maca-Meyer et al. 2003), is that this North Africaninfluence is well spread all over Iberia. However, thelater Christian Reconquest is described (Bartlett, 1993)as a period of extensive migrations all over the IberianPeninsula, involving the resettlement of Iberia on a vastscale. These might have erased any differential distribu-tion of the Y-chromosome that could have existed inthe past, especially for E3b1b; and today we witness arather homogeneous genetic landscape in Portugal (andprobably also in most of Iberia; Flores et al. 2004), atleast from the male perspective.
Finally, our findings for the Portuguese paternal back-ground and the ones of Pereira et al. (2000a; 2000b) forthe paternal and maternal components of the Portuguesepopulation do not reconcile with the clines detected byGonzalez et al. (2003). A more detailed survey of thedistribution pattern of female lineages in Portugal is stillneeded, with a larger sample size and a more in-depthphylogenetic analysis.
In conclusion, we show the usefulness of a detailed Y-chromosome analysis to the understanding of the demo-graphic history of human populations in the recent past,and at a micro-geographic level, a population attributethat has had a great impact on forensic and epidemio-
logical applications. The finding of a rather homoge-neous background for the Portuguese Y-chromosomegene pool, and all the strong indications that the samecarachteristic is found for its female counterpart, are ofgreat relevance for association studies. Although geneticdifferentiation follows a random distribution, and cer-tainly some genes of genetic epidemiological interest arebound to show more stratification than Y lineages do,it is nonetheless true that the Y chromosome is the ge-nomic region most sensitive to drift, and thus, with thelargest oportunity for stratification. The low levels ofdifferentiation for the Y chromosome in Portugal addadditional confidence to the use of general Portuguesesamples in case-control designs.
Acknowledgements
This work was supported by POCTI, Programa Opera-cional Ciencia, Tecnologia e Inovacao. Sandra Beleza andAlexandra Lopes have a PhD grant (SFRH/BD/860/2000and SFRH/BD/7006/2001, respectively) from FCT. Twoanonymous reviewers made significant contributions to theimprovement of this manuscript. We wish to thank local hos-pitals from the whole country for providing the samples thatmade this study possible.
References
Amorim Girao, A. (1941) Geografia de Portugal, p. 330. Por-tucalense Editora, Porto.
Barbujani, G., Bertorelle, G. & Chikhi, L. (1998) Evidencefor Paleolithic and Neolithic gene flow in Europe. Am J ofHum Genet 62, 488–492.
Bartlett, R. (1993) The Making of Europe: Conquest, Coloniza-tion, and Cultural Change, 950–1350. New Jersey: PrincetonUniversity Press.
Beleza, S., Alves, C., Gonzalez-Neira, A., Lareu, M.,Amorim, A., Carracedo, A. & Gusmao, L. (2003) Extend-ing STR markers in Y chromosome haplotypes. Int J LegalMed 117, 27–33.
Bertorelle, G. & Barbujani, G. (1995) Analysis of DNA di-versity by spatial autocorrelation. Genetics 140, 811–819.
Bosch, E., Calafell, F., Comas, D., Oefner, P. J., Underhill,P. A. & Bertranpetit, J. (2001) High-resolution analysis ofhuman Y-chromosome variation shows a sharp disconti-nuity and limited gene flow between northwestern Africaand the Iberian Peninsula. Am J Hum Genet 68, 1019–1029.
Brion, M., Quintans, B., Zarrabeitia, M., Gonzalez-Neira,A., Salas, A., Lareu, V., Tyler-Smith, C. & Carracedo,
C© University College London 2005 Annals of Human Genetics (2005) 11

S. Beleza et al.
A. (2004) Micro-geographical differentiation in NorthernIberia revealed by Y-chromosomal DNA analysis. Gene 329,17–25.
Brion, M., Sobrino, B., Blanco-Verea, A., Lareu, M. V.& Carracedo, A. (2005) Hierarchical analysis of 30 Y-chromosome SNPs in European populations. Int J LegalMed 119, 10–15.
Cinnioglu, C., King, R., Kivisild, T., Kalfoglu, E., Atasoy,S., Cavalleri, G. L., Lillie, A. S., Roseman, C. C., Lin,A. A., Prince, K., Oefner, P. J., Shen, P., Semino, O.,Cavalli-Sforza, L. L. & Underhill, P. A. (2004) Excavat-ing Y-chromosome haplotype strata in Anatolia. Hum Genet114, 127–148.
Cruciani, F., Santolamazza, P., Shen, P., Macaulay, V., Moral,P., Olckers, A., Modiano, D., Holmes, S., Destro-Bisol,G., Coia, V., Wallace, D. C., Oefner, P. J., Torroni,A., Cavalli-Sforza, L. L., Scozzari, R. & Underhill, P.A. (2002) A back migration from Asia to sub-SaharanAfrica is supported by high-resolution analysis of humanY-chromosome haplotypes. Am J Hum Genet 70, 1197–1214.
Cruciani, F., La Fratta, R., Santolamazza, P., Sellitto, D.,Pascone, R., Moral, P., Watson, E., Guida, V., Colomb,E. B., Zaharova, B., Lavinha, J., Vona, G., Aman, R., Cali,F., Akar, N., Richards, M., Torroni, A., Novelletto, A. &Scozzari, R. (2004) Phylogeographic analysis of haplogroupE3b (E-M215) y chromosomes reveals multiple migratoryevents within and out of Africa. Am J Hum Genet 74, 1014–1022.
Di Giacomo, F., Luca, F., Anagnou, N., Ciavarella, G., Corbo,R. M., Cresta, M., Cucci, F., Di Stasi, L., Agostiano, V.,Giparaki, M., Loutradis, A., Mammi’, C., Michalodimi-trakis, E. N., Papola, F., Pedicini, G., Plata, E., Terrenato,L., Tofanelli, S., Malaspina, P. & Novelletto, A. (2003) Cli-nal patterns of human Y chromosomal diversity in conti-nental Italy and Greece are dominated by drift and foundereffects. Mol Phylogenet Evol 28, 387–395.
Flores, C., Maca-Meyer, N., Gonzalez, A. M., Oefner, P. J.,Shen, P., Perez, J. A., Rojas, A., Larruga, J. M. & Under-hill, P. A. (2004) Reduced genetic structure of the Iberianpeninsula revealed by Y-chromosome analysis: implicationsfor population demography. Eur J Hum Genet 12, 855–863.
Giouzeli, M., Williams, N. A., Lonie, L. J., DeLisi, L. E. &Crow, T. J. (2004) ProtocadherinX/Y, a candidate gene-pair for schizophrenia and schizoaffective disorder: a DH-PLC investigation of genomic sequence. Am J Med Genet129B, 1–9.
Gonzalez, A. M., Brehm, A., Perez, J. A., Maca-Meyer, N.,Flores, C. & Cabrera, V. M. (2003) Mitochondrial DNAaffinities at the Atlantic fringe of Europe. Am J Phys An-thropol 120, 391–404.
Gusmao, L., Gonzalez-Neira, A., Lareu, M., Costa, S.,Amorim, A. & Carracedo, A. (2002) Chimpanzee ho-mologous of human Y specific STRs: a comparative studyand a proposal for nomenclature. Forensic Sci Int 126, 129–136.
Jobling, M. & Tyler–Smith, C. (2003) The human Y chro-mosome: an evolutionary marker comes of age. Nat RevGenet 4, 598–612.
Jorde, L. B., Watkins, W. S., Bamshad, M. J., Dixon, M. E.,Ricker, C. E., Seielstad, M. T. & Batzer, M. A. (2000) Thedistribution of human genetic diversity: a comparison ofmitochondrial, autosomal, and Y-chromosome data. Am JHum Genet 66, 979–988.
Kayser, M., Roewer, L., Hedman, M., Henke, L., Henke, J.,Brauer, S., Kruger, C., Krawczak, M., Nagy, M., Dobosz,T., Szibor, R., de Knijff, P., Stoneking, M. & Sajantila, A.(2000) Characteristics and frequency of germline mutationsat microsatellite loci from the human Y chromosome, asrevealed by direct observation in father/son pairs. Am JHum Genet 66, 1580–1588.
Kivisild, T., Rootsi, S., Metspalu, M., Mastana, S., Kaldma, K.,Parik, J., Metspalu, E., Adojaan, M., Tolk, H. V., Stepanov,V., Golge, M., Usanga, E., Papiha, S. S., Cinnioglu, C.,King, R., Cavalli-Sforza, L., Underhill, P. A. & Villems, R.(2003) The genetic heritage of the earliest settlers persistsboth in Indian tribal and caste populations. Am J Hum Genet72, 313–332.
Lareu, M. V., Phillips, C. P., Carracedo, A., Lincoln, P. J.,Syndercombe Court, D. & Thomson, J. A. (1994) Investi-gation of the STR locus HUMTH01 using PCR and twoelectrophoresis formats: UK and Galician Caucasian pop-ulation surveys and usefulness in paternity investigations.Forensic Sci Int 66, 41–52.
Lopes, A. M., Calafell, F. & Amorim, A. (2004) MicrosatelliteVariation and Evolutionary History of PCDHX/Y GenePair Within the Xq21.3/Yp11.2 Hominid-Specific Ho-mology Block. Mol Biol Evol 21, 2092–2101.
Maca-Meyer, N., Sanchez-Velasco, P., Flores, C., Larruga,J. M., Gonzalez, A. M., Oterino, A. & Leyva-Cobian, F.(2003) Y chromosome and mitochondrial DNA character-ization of Pasiegos, a human isolate from Cantabria (Spain).Ann Hum Genet 67, 329–339.
Pereira, L., Prata, M. J. & Amorim, A. (2000a) Diversity ofmtDNA lineages in Portugal: not a genetic edge of Euro-pean variation. Ann Hum Genet 64, 491–506.
Pereira, L., Prata, M. J., Brion, M., Jobling, M. A., Carracedo,A. & Amorim, A. (2000b) Clinal variation of YAP+ Y-chromosome frequencies in Western Iberia. Hum Biol 72,937–944.
Raymond, M. & Rousset, F. (1995) GENEPOP (version 1.2):population genetics software for exact tests and ecumeni-cism. J Heredity 86, 248–249.
12 Annals of Human Genetics (2005) C© University College London 2005

Y-Chromosome Lineages in Portugal
Ribeiro, O. (1966) Portugal, A Formacao de. In: Dicionarioda Historia de Portugal (eds Iniciativas Editoriais), Vol. V,pp. 130–149. Lisboa, Portugal.
Rootsi, S., Magri, C., Kivisild, T., Benuzzi, G., Help, H.,Bermisheva, M., Kutuev, I., Barac, L., Pericic, M., Bal-anovsky, O., Pshenichnov, A., Dion, D., Grobei, M., Zhivo-tovsky, L. A., Battaglia, V., Achilli, A., Al-Zahery, N., Parik,J., King, R., Cinnioglu, C., Khusnutdinova, E., Rudan, P.,Balanovska, E., Scheffrahn, W., Simonescu, M., Brehm,A., Goncalves, R., Rosa, A., Moisan, J. P., Chaventre, A.,Ferak, V., Furedi, S., Oefner, P. J., Shen, P., Beckman, L.,Mikerezi, I., Terzic, R., Primorac, D., Cambon-Thomsen,A., Krumina, A., Torroni, A., Underhill, P. A., Santachiara-Benerecetti, A. S., Villems, R. & Semino, O. (2004) Phylo-geography of Y-chromosome haplogroup I reveals distinctdomains of prehistoric gene flow in europe. Am J HumGenet 75, 128–137.
Rosenberg, M. S. (2001) PASSAGE. Pattern Analysis, SpatialStatistics, and GeographicExegesis. Version 1.1. Tempe, AZ:Department of Biology, Arizona State University.
Rosser, Z. H., Zerjal, T., Hurles, M. E., Adojaan, M., Alavan-tic, D., Amorim, A., Amos, W., Armenteros, M., Arroyo,E., Barbujani, G., Beckman, G., Beckman, L., Bertran-petit, J., Bosch, E., Bradley, D. G., Brede, G., Cooper, G.,Corte-Real, H. B., de Knijff, P., Decorte, R., Dubrova, Y.E., Evgrafov, O., Gilissen, A., Glisic, S., Golge, M., Hill, E.W., Jeziorowska, A., Kalaydjieva, L., Kayser, M., Kivisild,T., Kravchenko, S. A., Krumina, A., Kucinskas, V., Lavinha,J., Livshits, L. A., Malaspina, P., Maria, S., McElreavey, K.,Meitinger, T. A., Mikelsaar, A. V., Mitchell, R. J., Nafa,K., Nicholson, J., Norby, S., Pandya, A., Parik, J., Patsalis,P. C., Pereira, L., Peterlin, B., Pielberg, G., Prata, M. J.,Previdere, C., Roewer, L., Rootsi, S., Rubinsztein, D. C.,Saillard, J., Santos, F. R., Stefanescu, G., Sykes, B. C., Tolun,A., Villems, R., Tyler-Smith, C. & Jobling, M. A. (2000)Y-chromosomal diversity in Europe is clinal and influencedprimarily by geography, rather than by language. Am J HumGenet 67, 1526–1543.
Schneider, S., Roessli, D. & Excoffier, L. (2000) Arlequin: Asoftware for population genetics data analysis. Ver 2.000. Uni-versity of Geneva.
Scozzari, R., Cruciani, F., Pangrazio, A., Santolamazza, P.,Vona, G., Moral, P., Latini, V., Varesi, L., Memmi, M. M.,Romano, V., De Leo, G., Gennarelli, M., Jaruzelska, J.,Villems, R., Parik, J., Macaulay, V. & Torroni, A. (2001)Human Y-chromosome variation in the western Mediter-ranean area: implications for the peopling of the region.Hum Immunol 62, 871–884.
Semino, O., Magri, C., Benuzzi, G., Lin, A. A., Al-Zahery,N., Battaglia, V., Maccioni, L., Triantaphyllidis, C., Shen,P., Oefner, P. J., Zhivotovsky, L. A., King, R., Torroni,A., Cavalli-Sforza, L. L., Underhill, P. A. & Santachiara-
Benerecetti, A. S. (2004) Origin, diffusion, and differentia-tion of Y-chromosome haplogroups E and J: inferences onthe neolithization of Europe and later migratory events inthe Mediterranean area. Am J Hum Genet 74, 1023–1034.
Semino, O., Passarino, G., Oefner, P. J., Lin, A. A., Arbuzova,S., Beckman, L. E., De Benedictis, G., Francalacci, P., Kou-vatsi, A., Limborska, S., Marcikiae, M., Mika, A., Mika,B., Primorac, D., Santachiara-Benerecetti, A. S., Cavalli-Sforza, L. L. & Underhill, P. A. (2000) The genetic legacyof Paleolithic Homo sapiens sapiens in extant Europeans: aY chromosome perspective. Science 290, 1155–1159.
Slaktin, M. (1995) A measure of population subdivision basedon microsatellite allele frequencies. Genetics 139, 457–462.
Spinola, H., Brehm, A., Williams, F., Jesus, J. & Middleton,D. (2002) Distribution of HLA alleles in Portugal and CaboVerde. Relationships with the slave trade route. Ann HumGenet 66, 285–296.
Sokal, R. R. & Oden, N. L. (1978) Spatial autocorrelation inbiology 1. Methodology 10, 199–228.
Torres, C. (1993) O Garb-Al-Andaluz. In: Historia de Portu-gal (ed J. Mattoso), Vol. I, pp. 361–439. Lisboa, Portugal:Cırculo dos Leitores.
Underhill, P. A., Shen, P., Lin, A. A., Jin, L., Passarino, G.,Yang, W. H., Kauffman, E., Bonne-Tamir, B., Bertranpetit,J., Francalacci, P., Ibrahim, M., Jenkins, T., Kidd, J. R.,Mehdi, S. Q., Seielstad, M. T., Wells, R. S., Piazza, A.,Davis, R. W., Feldman, M. W., Cavalli-Sforza, L. L. &Oefner, P. J. (2000) Y chromosome sequence variation andthe history of human populations. Nat Genet 26, 358–361.
Underhill, P. A., Passarino, G., Lin, A. A., Shen, P., MirazonLahr, M., Foley, R. A., Oefner, P. J. & Cavalli-Sforza, L.L. (2001) The phylogeography of Y chromosome binaryhaplotypes and the origins of modern human populations.Ann Hum Genet 65, 43–62.
Weale, M. E., Yepiskoposyan, L., Jager, R. F., Hovhannisyan,N., Khudoyan, A., Burbage-Hall, O., Bradman, N. &Thomas, M. G. (2001) Armenian Y chromosome haplo-types reveal strong regional structure within a single ethno-national group. Hum Genet 109, 659–674.
Wells, R. S., Yuldasheva, N., Ruzibakiev, R., Underhill, P. A.,Evseeva, I., Blue-Smith, J., Jin, L., Su, B., Pitchappan, R.,Shanmugalakshmi, S., Balakrishnan, K., Read, M., Pear-son, N. M., Zerjal, T., Webster, M. T., Zholoshvili, I.,Jamarjashvili, E., Gambarov, S., Nikbin, B., Dostiev, A.,Aknazarov, O., Zalloua, P., Tsoy, I., Kitaev, M., Mirrakhi-mov, M., Chariev, A. & Bodmer, W. F. (2001) The Eurasianheartland: a continental perspective on Y-chromosome di-versity. Proc Natl Acad Sci U S A 98, 10244–10249.
Wilson, I., Balding, D. & Weale, M. (2003) Inferences fromDNA data: population histories, evolutionary processes andforensic match probabilities. J R Stat Soc Ser A 166, 155–188.
C© University College London 2005 Annals of Human Genetics (2005) 13
S. Beleza et al.
Y Chromosome Consortium (2002) A nomenclature systemfor the tree of human Y-chromosomal binary haplogroups.Genome Res 12, 339–348.
Zhivotovsky, L. A., Underhill, P. A., Cinnioglu, C., Kayser,M., Morar, B., Kivisild, T., Scozzari, R., Cruciani, F.,Destro-Bisol, G., Spedini, G., Chambers, G. K., Herrera,R. J., Yong, K. K., Gresham, D., Tournev, I., Feldman, M.
W. & Kalaydjieva, L. (2004) The effective mutation rate atY chromosome short tandem repeats, with application tohuman population-divergence time. Am J Hum Genet 74,50–61.
Received: 25 January 2005Accepted: 14 June 2005
Supplementary Material
The following material is available for this article online:Table S1. Y-chromosome halpotypes in 657 individuals from Portugal.
14 Annals of Human Genetics (2005) C© University College London 2005
Related Documents


