Chapter 7 Perfect Competition and the Invisible Hand © 2015 Pearson Education, Inc.

Welcome message from author
This document is posted to help you gain knowledge. Please leave a comment to let me know what you think about it! Share it to your friends and learn new things together.
Transcript

Chapter 7Perfect Competition
and the Invisible Hand
© 2015 Pearson Education, Inc.

© 2015 Pearson Education, Inc.
Chapter Outline
7.1 Perfect Competition and Efficiency7.2 Extending the Reach of the Invisible Hand: From the Individual to the Firm7.3 Extending the Reach of the Invisible Hand: Allocation of Resources across Industries7.4 Prices Guide the Invisible Hand7.5 Equity and Efficiency
7 Perfect Competition and the Invisible Hand
© 2015 Pearson Education, Inc.
7 Perfect Competition and the Invisible Hand
Key Ideas
1. The invisible hand efficiently allocates goods and services to buyers and sellers.
2. The invisible hand leads to efficient production within an industry.
3. The invisible hand efficiently allocates resources across industries.

© 2015 Pearson Education, Inc.
7 Perfect Competition and the Invisible Hand
Key Ideas
4. Prices direct the invisible hand.5. There are trade-offs between making the economic pie as big as possible and dividing the pieces equally.
© 2015 Pearson Education, Inc.
7 Perfect Competition and the Invisible Hand
Can markets composed of only self-interested people maximize the overall well-being of society?
Evidence-Based Economics Example:
© 2015 Pearson Education, Inc.
7.1 Perfect Competition and Efficiency
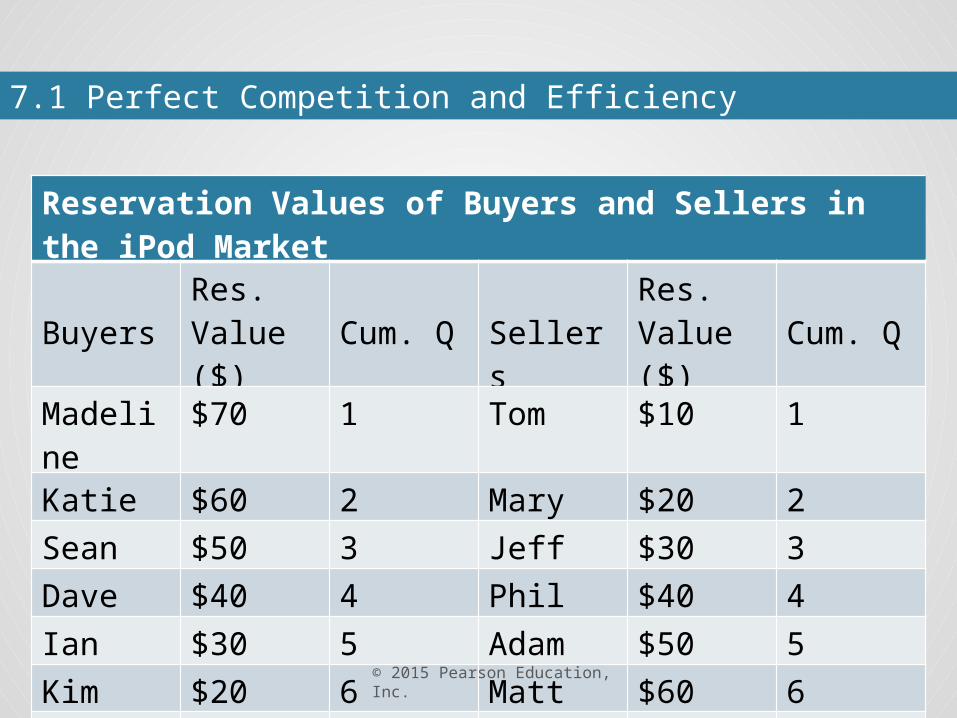
Reservation Values of Buyers and Sellers in the iPod Market
BuyersRes. Value ($) Cum. Q Sellers
Res. Value ($) Cum. Q
Madeline $70 1 Tom $10 1
Katie $60 2 Mary $20 2
Sean $50 3 Jeff $30 3
Dave $40 4 Phil $40 4
Ian $30 5 Adam $50 5
Kim $20 6 Matt $60 6
Ty $10 7 Fiona $70 7
© 2015 Pearson Education, Inc.
7.1 Perfect Competition and Efficiency
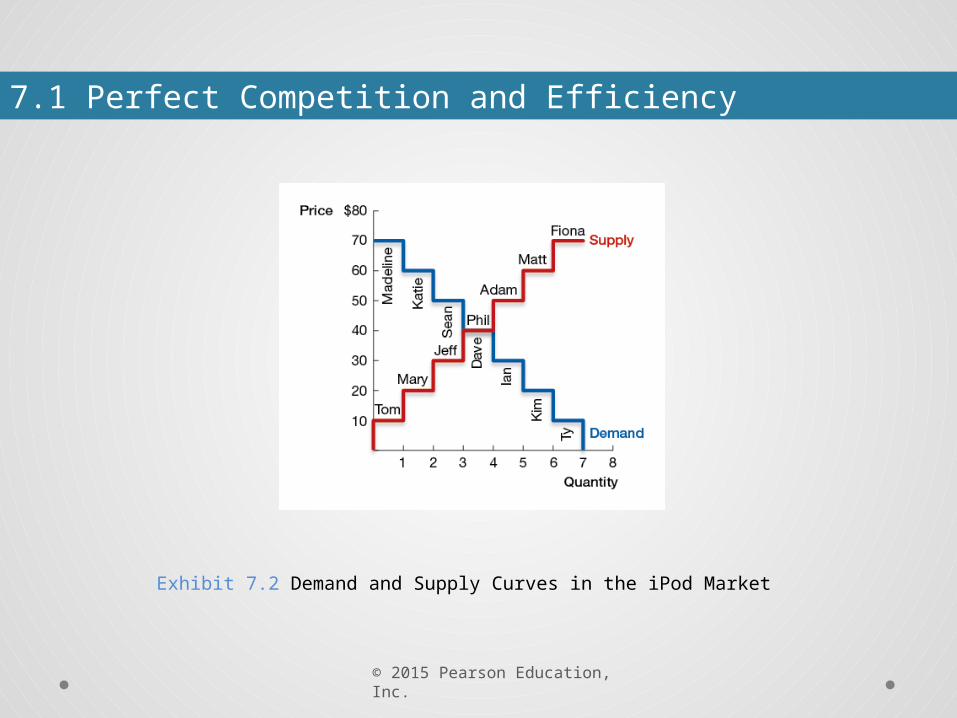
Exhibit 7.2 Demand and Supply Curves in the iPod Market

© 2015 Pearson Education, Inc.
7.1 Perfect Competition and EfficiencySocial Surplus
Reservation Values of Buyers and Sellers in the iPod Market
Buyers Res. Value ($)Consumer Surplus Cum. Q
Madeline $70 $30 1
Katie $60 $20 2
Sean $50 $10 3
Dave $40 $0 4
Ian $30 5
Kim $20 6
Ty $10 7
Total $60

© 2015 Pearson Education, Inc.
7.1 Perfect Competition and EfficiencySocial Surplus
Reservation Values of Buyers and Sellers in the iPod Market
Sellers Res. Value ($)Producer Surplus Cum. Q
Tom $10 $30 1
Mary $20 $20 2
Jeff $30 $10 3
Phil $40 $0 4
Adam $50 5
Matt $60 6
Fiona $70 7
Total $60
© 2015 Pearson Education, Inc.
7.1 Perfect Competition and EfficiencySocial Surplus
Social surplusThe sum of consumer and producer surplus
= $120

© 2015 Pearson Education, Inc.
7.1 Perfect Competition and EfficiencySocial Surplus
Reservation Values of Buyers and Sellers in the iPod Market
Buyers Res. Value ($)Consumer Surplus Cum. Q
Madeline $70 $30 1
Katie $60 $20 2
Sean $50 3
Dave $40 4
Ian $30 5
Kim $20 6
Ty $10 7
Total $100

© 2015 Pearson Education, Inc.
7.1 Perfect Competition and EfficiencySocial Surplus
Reservation Values of Buyers and Sellers in the iPod Market
Sellers Res. Value ($)Producer Surplus Cum. Q
Tom $10 $30 1
Mary $20 $20 2
Jeff $30 3
Phil $40 4
Adam $50 5
Matt $60 6
Fiona $70 7
Total $100
© 2015 Pearson Education, Inc.
7.1 Perfect Competition and EfficiencySocial Surplus
Social surplus= $100
© 2015 Pearson Education, Inc.
7.1 Perfect Competition and EfficiencySocial Surplus
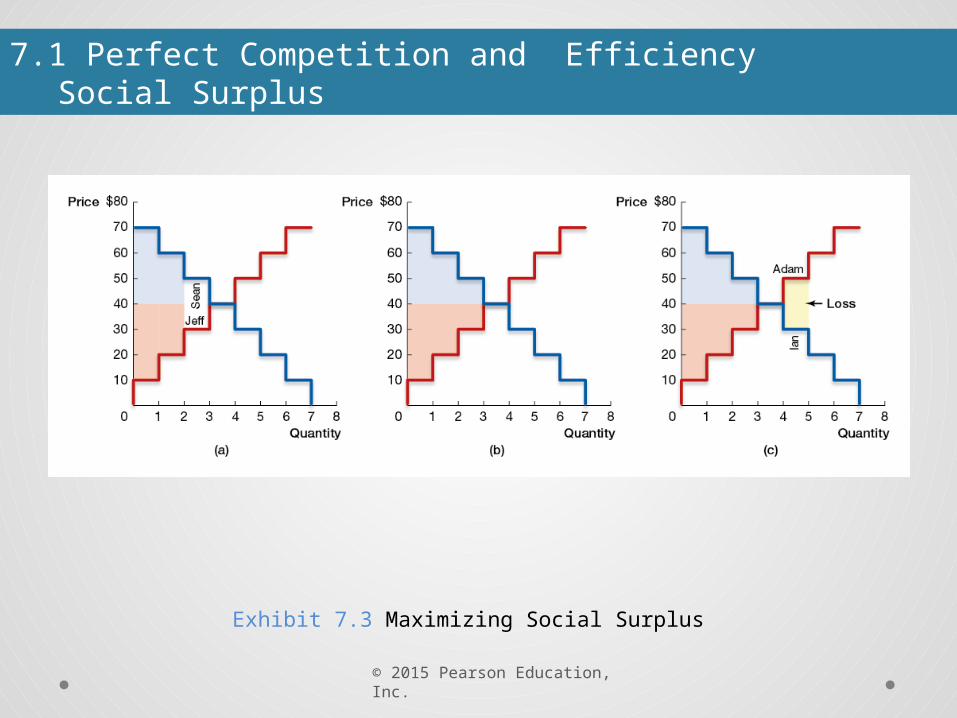
Exhibit 7.3 Maximizing Social Surplus

© 2015 Pearson Education, Inc.
7.1 Perfect Competition and EfficiencyPareto Efficiency
Pareto efficiencyWhen no one can be made better off without making someone else
worse off
Example: When price was set at $20, consumers were made better off, but producers were made worse off

© 2015 Pearson Education, Inc.
7.1 Perfect Competition and EfficiencyPareto Efficiency
The invisible hand directs consumers and producers to maximize their surplus…
And leads to the highest level of social welfare.

© 2015 Pearson Education, Inc.
7.2 Extending the Reach of the Invisible Hand: From the Individual to the Firm
You’re the new CEO of a company that operates two manufacturing plants.
Old Plant New Plant50 years old 4 years oldOld machinery New technology
The old plant has higher MC at every level of production than the new plant.

© 2015 Pearson Education, Inc.
7.2 Extending the Reach of the Invisible Hand: From the Individual to the Firm
Exhibit 7.4 Marginal Costs for Two Manufacturing Plants

© 2015 Pearson Education, Inc.
7.2 Extending the Reach of the Invisible Hand: From the Individual to the Firm
In the past, each plant has been run independently, and each plant manager is charged with maximizing profit at his/her plant.
© 2015 Pearson Education, Inc.
7.2 Extending the Reach of the Invisible Hand: From the Individual to the Firm
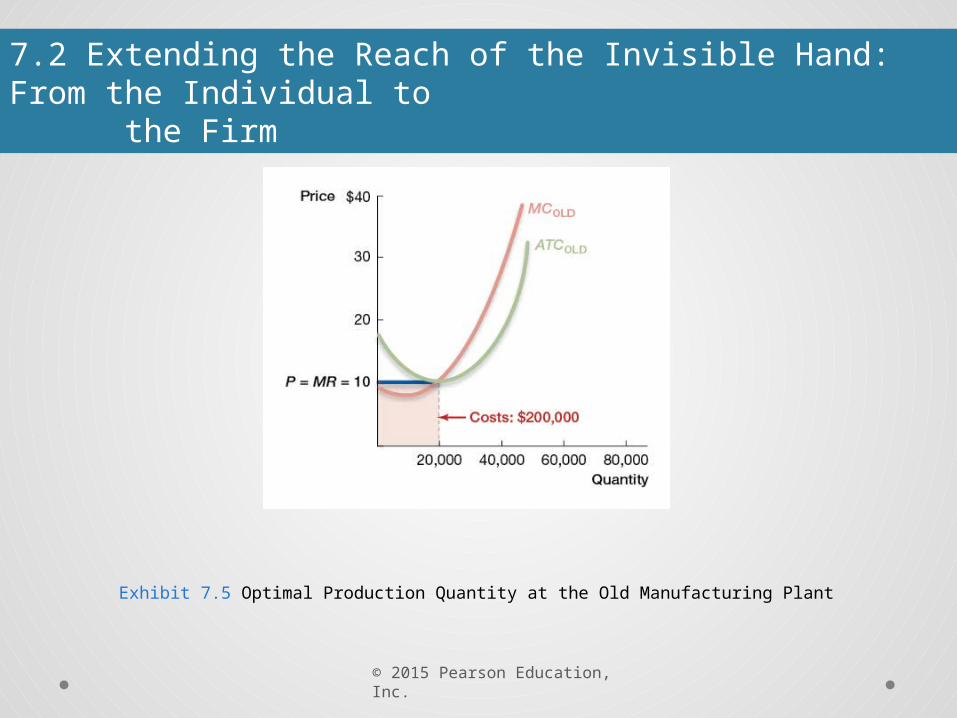
Exhibit 7.5 Optimal Production Quantity at the Old Manufacturing Plant
© 2015 Pearson Education, Inc.
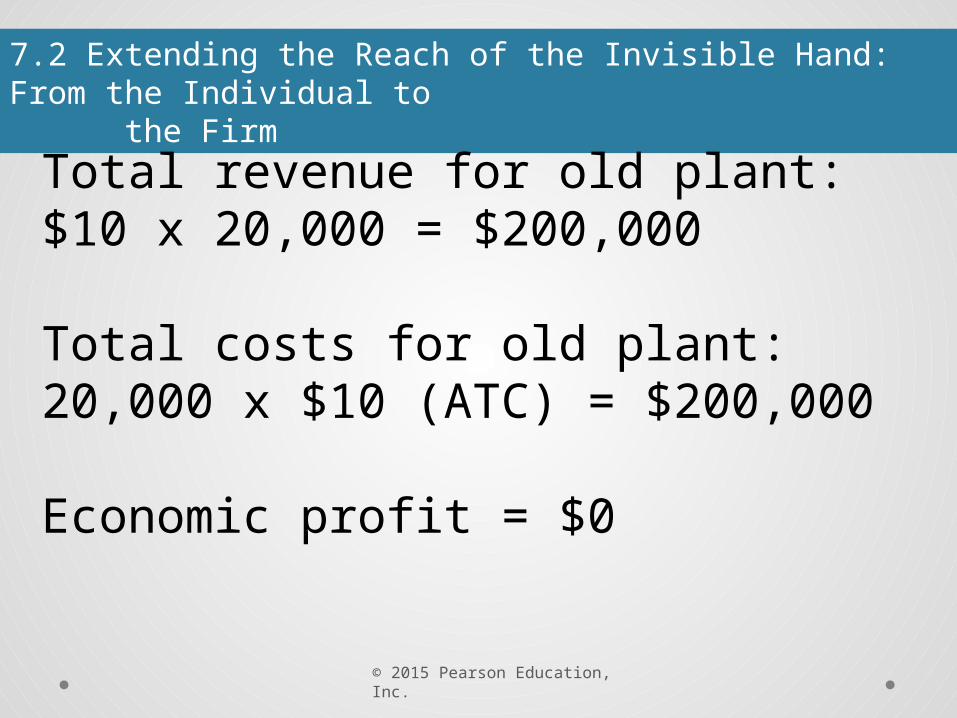
7.2 Extending the Reach of the Invisible Hand: From the Individual to the Firm
Total revenue for old plant:$10 x 20,000 = $200,000
Total costs for old plant:20,000 x $10 (ATC) = $200,000
Economic profit = $0

© 2015 Pearson Education, Inc.
7.2 Extending the Reach of the Invisible Hand: From the Individual to the Firm
Exhibit 7.6 Optimal Production Quantity at the New Manufacturing Plant

© 2015 Pearson Education, Inc.
7.2 Extending the Reach of the Invisible Hand: From the Individual to the Firm
Total revenue for new plant:$10 x 50,000 = $500,000
Total costs for new plant:50,000 x $7.50 (ATC) = $375,000
Economic profit = $125,000
© 2015 Pearson Education, Inc.
7.2 Extending the Reach of the Invisible Hand: From the Individual to the Firm
As the CEO, should you close the old plant and shift production to the new plant?
The new plant:• Earns more profit• Has lower costs• Has newer technology
© 2015 Pearson Education, Inc.
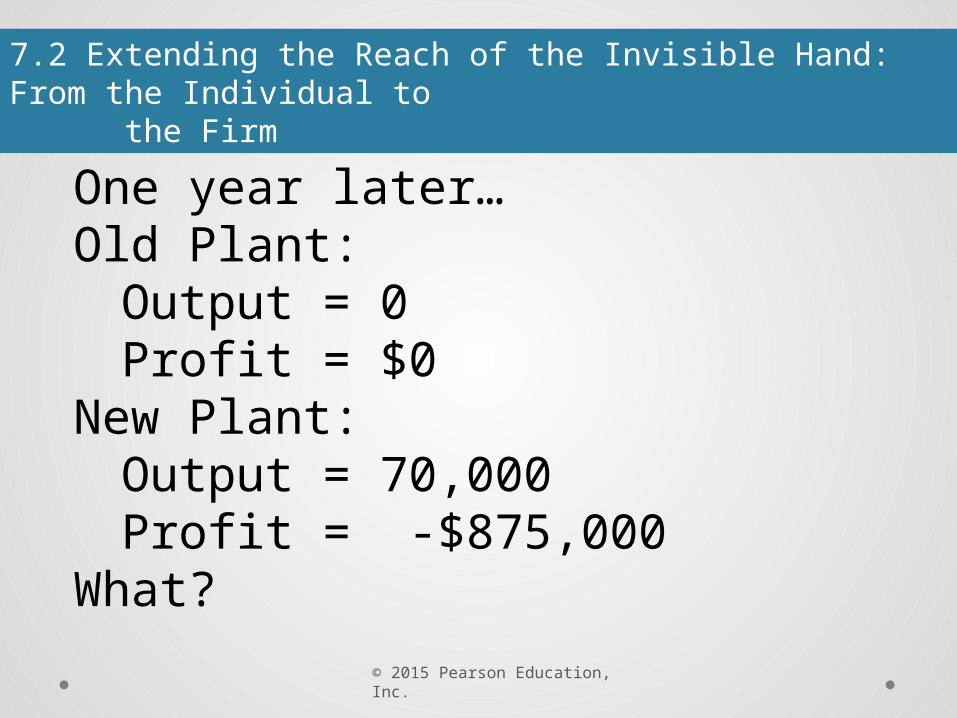
7.2 Extending the Reach of the Invisible Hand: From the Individual to the Firm
One year later…Old Plant:
Output = 0Profit = $0
New Plant: Output = 70,000Profit = -$875,000
What?
© 2015 Pearson Education, Inc.
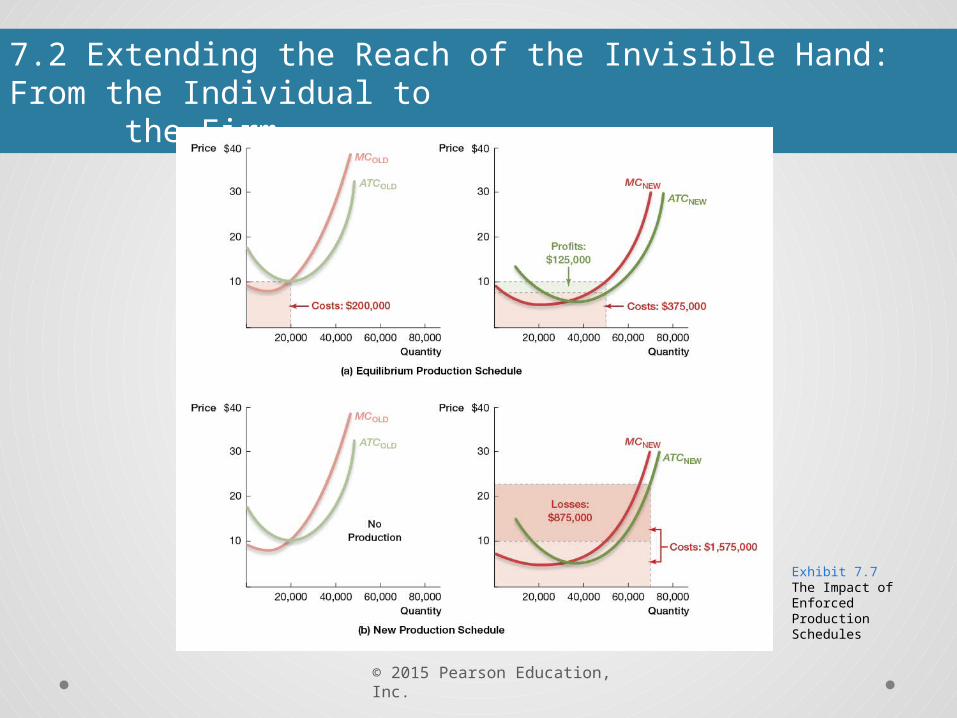
7.2 Extending the Reach of the Invisible Hand: From the Individual to the Firm
Exhibit 7.7 The Impact of Enforced Production Schedules
© 2015 Pearson Education, Inc.
7.2 Extending the Reach of the Invisible Hand: From the Individual to the Firm
The invisible hand directs managers to pursue their own self-interest…
And results in the most efficient (least- cost) production allocation.

© 2015 Pearson Education, Inc.
7.3 Extending the Reach of the Invisible Hand: Allocation of Resources across Industries
What if industries are different?
© 2015 Pearson Education, Inc.
7.3 Extending the Reach of the Invisible Hand: Allocation of Resources across Industries
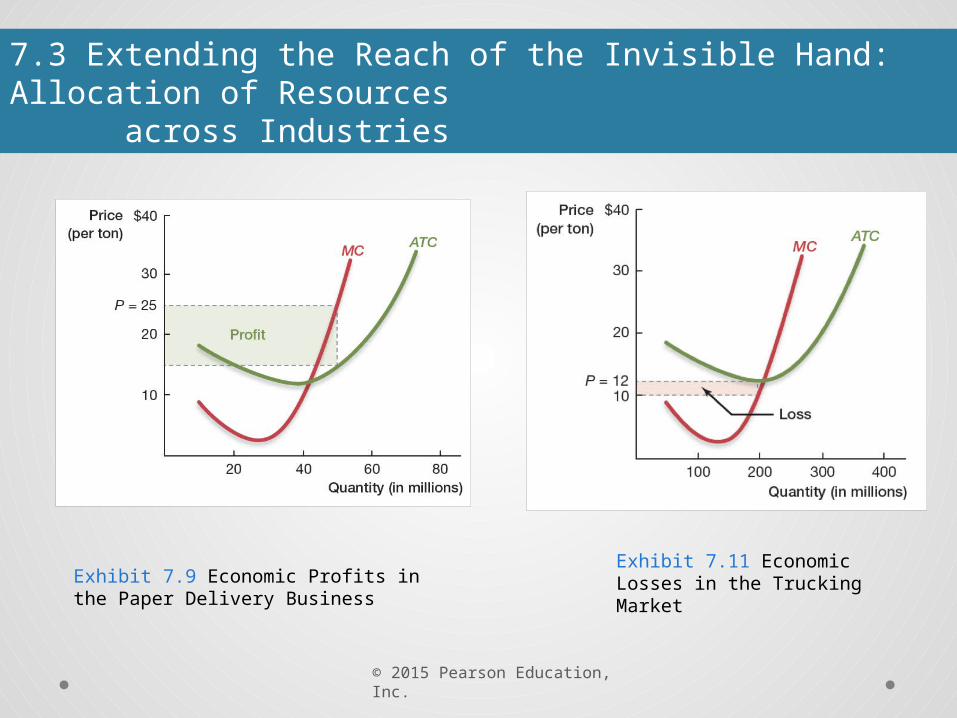
Exhibit 7.11 Economic Losses in the Trucking Market
Exhibit 7.9 Economic Profits in the Paper Delivery Business
© 2015 Pearson Education, Inc.
7.3 Extending the Reach of the Invisible Hand: Allocation of Resources across Industries
The invisible hand directs firms to seek out profits…
And results in resources being allocated to their highest value of use.

© 2015 Pearson Education, Inc.
7.4 Prices Guide the Invisible Hand
Prices are the key to the invisible hand.

© 2015 Pearson Education, Inc.
7.4 Prices Guide the Invisible Hand
What is the economic function of parking meters?
© 2015 Pearson Education, Inc.
7.4 Prices Guide the Invisible Hand
Price controls act to restrict efficiency.Efficiency

© 2015 Pearson Education, Inc.
7.4 Prices Guide the Invisible HandDeadweight Loss
Exhibit 7.15 Deadweight Loss from Price Controls

© 2015 Pearson Education, Inc.
7.4 Prices Guide the Invisible HandDeadweight Loss
Deadweight Loss
The reduction in social surplus resulting from a market
intervention

© 2015 Pearson Education, Inc.
7.4 Prices Guide the Invisible HandThe Command Economy
How does this all come together?

© 2015 Pearson Education, Inc.
7.4 Prices Guide the Invisible HandThe Command Economy
Two problems:
1. Coordination problem = bringing together self-interested economic agents to form markets
2. Incentive problem = how to motivate agents to participate in markets

© 2015 Pearson Education, Inc.
7.4 Prices Guide the Invisible HandThe Command Economy
Two possible solutions:
1. Market economy = prices direct flow of resources, provide incentives for participants
2. Command economy = central agency directs resources, provides incentives

© 2015 Pearson Education, Inc.
7.4 Prices Guide the Invisible HandThe Central Planner
K-Mart’s move to a command economy

© 2015 Pearson Education, Inc.
7.5 Equity and Efficiency
Equity
Addresses the issue of a “fair” distribution of resources across society
© 2015 Pearson Education, Inc.
7.5 Equity and Efficiency
Can markets composed of only self-interested people maximize the overall well-being of society?
Evidence-Based Economics Example:
Related Documents
![rsuper Micro] 7 -e y 7-532-0035 rsuper Micro] Super Micro ...rsuper Micro] 7 -e y 7-532-0035 rsuper Micro] Super Micro E240 cojp sales@deptazett.cojp YoutubeTrazettJP ! r Super Micro]](https://static.cupdf.com/doc/110x72/6107e5c6866d1d42da4aa8e4/rsuper-micro-7-e-y-7-532-0035-rsuper-micro-super-micro-rsuper-micro-7-e.jpg)