This article appeared in a journal published by Elsevier. The attached copy is furnished to the author for internal non-commercial research and education use, including for instruction at the authors institution and sharing with colleagues. Other uses, including reproduction and distribution, or selling or licensing copies, or posting to personal, institutional or third party websites are prohibited. In most cases authors are permitted to post their version of the article (e.g. in Word or Tex form) to their personal website or institutional repository. Authors requiring further information regarding Elsevier’s archiving and manuscript policies are encouraged to visit: http://www.elsevier.com/copyright

Welcome message from author
This document is posted to help you gain knowledge. Please leave a comment to let me know what you think about it! Share it to your friends and learn new things together.
Transcript

This article appeared in a journal published by Elsevier. The attachedcopy is furnished to the author for internal non-commercial researchand education use, including for instruction at the authors institution
and sharing with colleagues.
Other uses, including reproduction and distribution, or selling orlicensing copies, or posting to personal, institutional or third party
websites are prohibited.
In most cases authors are permitted to post their version of thearticle (e.g. in Word or Tex form) to their personal website orinstitutional repository. Authors requiring further information
regarding Elsevier’s archiving and manuscript policies areencouraged to visit:
http://www.elsevier.com/copyright
Author's personal copy
Available online at www.sciencedirect.com
Journal of the European Ceramic Society 30 (2010) 2555–2562
Micro- and macroscopic thermal expansion of stabilized aluminum titanate
Giovanni Bruno a,∗, Alexander Efremov b, Bryan Wheaton c,Ivan Bobrikov d, Valeriy G. Simkin d, Scott Misture e
a Corning SAS, CETC, Avon 77210, Franceb Corning OOO, CSC, St. Petersburg 194021, Russia
c Corning Inc., CS&S, Corning, NY 14831, USAd JINR, FLNP, Dubna 141980, Russia
e Alfred University, NY 14802, USA
Received 9 December 2009; received in revised form 21 April 2010; accepted 26 April 2010Available online 1 June 2010
Abstract
The lattice expansion of aluminum titanate (AT) obtained by firing a mixture of alumina, rutile, strontium and calcium carbonate and silica wasmeasured using neutron and laboratory X-ray diffraction. The microscopic data are compared with macroscopic measurement completed bydilatometry.
A powder and a compact rod sample were compared to assess the influence of micro residual stresses locked into the solid structure at grainlevel, which could possibly be relieved upon grinding.
Results show good correlation between neutron and X-ray diffraction techniques. They also show that a compact material behaves differentlythan a powder, contrary to what happens for other porous ceramics such as cordierite. The integrity factor model was used to rationalize the resultsand predict grain level stresses in all crystal directions and all phases (AT, Strontium aluminum silicate, alumina and residual glass). Calculationshow that the AT c-axis is always under compression while all other crystal directions and phases are under tension. Those micro-stresses do notundermine the macroscopic mechanical properties of the material and confer to it its interesting properties like low thermal expansion and enhancedstrain tolerance.© 2010 Elsevier Ltd. All rights reserved.
Keywords: Thermal expansion; Aluminium titanate; Neutron diffraction; X-ray diffraction; Integrity factor; Strain conversion factor; Micro-stresses
1. Introduction
Aluminum titanate (AT) is a material of great interestfor diesel particulate filter and many other environmentalapplications.1 As the most thermal shock resistant ceramicknown, AT is relevant for industrial applications in the formof highly porous and microcracked monolithic bodies.2 Recentcompositions and heat treatments have allowed obtaining stablecompounds with high mechanical strength In fact, in order to sta-bilize the microstructure with respect to thermal cycles, mulliteand other additives are often used.3 A typical X-ray diffractionpattern with the corresponding peak indexing is shown in Fig. 1.
∗ Corresponding author at: Corning Inc., CS&S, SP FR06, 14831 Corning,NY, USA. Tel.: +1 607 9741421; fax: +1 607 9742383.
E-mail address: [email protected] (G. Bruno).
The glass content is larger than for instance in cordierite-basedporous ceramics (also widely used for environmental applica-tions) and is estimated to be around 4%.
It has also been well established that extruded AT exhibitsa unique structure along the extrusion axis.4 However, whilethe macroscopic CTE (as measured by dilatometry) has beencharacterized extensively,5,7 very little is known on the lat-tice CTE components.8 This is particularly true for industriallyrelevant materials, which are particularly interesting for theirsuperior mechanical, thermal and stability properties, as opposedto model aluminum titanate.7,9 The anisotropy of the lattice CTEis believed to be the source of internal micro-stress and micro-cracking at the grain level,5,10 which confer to AT its attractivethermal shock resistance properties. In order to understand thebehaviour at microstructural level, we have undertaken an exten-sive study of the microscopic expansion of AT using laboratoryX-rays and neutron diffraction techniques. Neutron diffraction
0955-2219/$ – see front matter © 2010 Elsevier Ltd. All rights reserved.doi:10.1016/j.jeurceramsoc.2010.04.038

Author's personal copy
2556 G. Bruno et al. / Journal of the European Ceramic Society 30 (2010) 2555–2562
Fig. 1. X-ray diffraction pattern of aluminium titanate with Rietveld refinement. The residual is shown below the diffraction pattern and the Al2O3, TiO2, SAS andAT phases are indicated by the tick marks (the legend and the ticks are in the same order).
offers the advantage of large penetration depths and the ability ofaccurately measuring bulk specimens without unwanted surfaceeffects.
The specific U-shape of macroscopic dilation vs. tempera-ture curve observed in low CTE ceramics (e.g. cordierite, AT,�-eucryptite)6,8,11 gives a very clear indication of the tempera-ture at which thermal microcracks can be considered healed andthe material expands like a compact body.6,8 This effect in ATis much clearer than in other materials. Of key importance inmodelling the thermo-mechanical behaviour is the knowledgeof the crystal lattice properties vs. bulk properties.11,12
In this paper we will show how the global macroscopic and thephase-specific lattice (microscopic) expansions combine withour simulation work to yield the lattice micro-stresses, which inturn possibly influence the mechanical and physical propertiesat room and high temperature.
2. Experimental
Samples were prepared by extruding a batch mixture oftitania, alumina, silica, strontium and calcium carbonates andbinder.13 The composition was dried and then fired at temper-atures exceeding 1450 ◦C, with both heating and cooling donein ambient atmosphere with rates not exceeding 5 ◦C/min. Thespecimens had the form of a rod with about 1 m length and 10 mmdiameter. Powders were extracted from pieces of the same rodby (alumina) ball milling.
The microstructure of this material is well known frommicroscopy work.3,4 An X-ray diffraction pattern of the com-pound obtained is shown in Fig. 1. Extracted from Rietveldrefinement, it contains the phases reported in Table 1 withtheir approximate abundance in weight percent: Aluminum
Table 1Phase composition of the AT compound used in this work.
Phase %wt ICSD File
AT 71 2759Al2O3 5 60419SAS 22 97264TiO2 (rutile) <0.5 34372Glass <2 –
AT: aluminum titanate; SAS: strontium aluminum silicate.
Titanate (73), SAS (22), Corundum (5) and Rutile (<0.5). Frommicroscopy work (see13) the AT grain size diameter ranged from3 to 10 �m. The crystallographic database files used for therefinement are also reported in Table 1.
The macroscopic dilation of the material has been measuredat Corning’s research laboratories in Painted Post, NY usingconventional dilatometry on a Netzsch DL402 single pushroddilatometer. This is equipped with silica sample holder andpushrod, allowing easy calibration up to 1000 ◦C. A small rodwith 50 mm length was used for macroscopic dilation measure-ments. The macroscopic dilation of the rod is given in Fig. 2 (itis very similar to the curves shown in14). It was calculated usingthe formula
ε = �L
L0(1)
where L = L(T) length at temperature T and L0 = initial length atroom temperature.
The porosity of the sample was measured by mercury intru-sion, using an Autopore 9520 from Micromeritics. The globalporosity was 50% and the mean pore size about 20 �m.
High-temperature diffraction experiments have been carriedout at: (1) the Frank Laboratory for Neutron Physics, FLNP,Dubna, Russia, on the beamline HRFD and (2) the X-ray diffrac-tion laboratory at Alfred University, NY, USA.
Fig. 2. The macroscopic dilation of a compact rod of AT (see also13). The heatingand cooling branches are indicated.
Author's personal copy
G. Bruno et al. / Journal of the European Ceramic Society 30 (2010) 2555–2562 2557
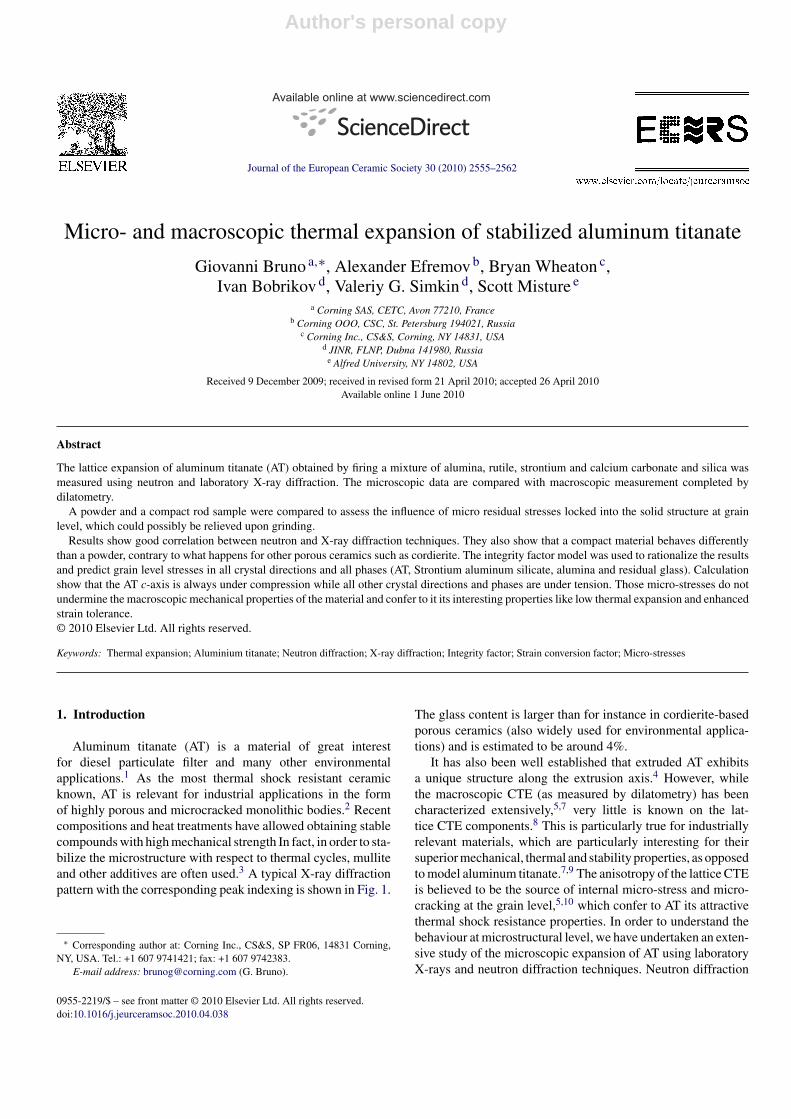
Fig. 3. The furnace (a) and the closed cycle refrigerator (b) used on HRFD. The different detector banks are also visible (covered by aluminium foils).
Neutron experiments employed the reverse time-of-flight(RTOF) technique15 to obtain very good d-spacing resolution.This consists of subtracting two out-of phase medium resolutionspectra to obtain a smaller peak width ω thereby improving thepeak figure of merit f16
f = I
ω2 (2)
where I is the peak intensity. On HRFD, a furnace capable of800 ◦C and a closed cycle refrigerator capable of liquid heliumtemperatures (∼10 K) have been used in two separate sets ofmeasurements. They are depicted in Fig. 3.
Neutron diffraction data were collected on two samples (pow-der and solid rod, in the form of a small piece with ∼20 mmlength) at fixed angles on several detector banks. For ToFdiffractometers, the time of flight (t) spectra are converted intod-spacing by17
2d · sin θ = h · t
m · L(3)
where h is the Planck’s constant, m the neutron mass and L is thepath length. The counting time per point was around 2 h, provid-ing data of sufficient accuracy to determine the lattice expansionfor aluminium titanate and the minor phase alumina. The SASphase was inserted in the Rietveld fit but, due to the large back-ground typical of Reverse ToF spectra, no reliable result wasobtained. In the following, only the AT lattice expansion will bediscussed. Indeed it is the most relevant for our discussion andconclusions.
High-temperature X-ray powder diffraction (HTXRD) wascarried out using a Siemens �–� D500 diffractometer equippedwith a Braun position sensitive detector and custom high-temperature furnace,18 using Co K� radiation with an iron filter.The X-ray diffractometer is shown in Fig. 4. The HTXRD tem-perature accuracy was calibrated using NIST-ICTA differentialthermal analysis standards including KNO3, KClO4, Ag2SO4,
K2SO4, K2CrO4, and BaCO3 that allow calibration up to approx-imately 800 ◦C. Higher temperature calibrations were madeusing the melting points of high-purity Ag, Au, and Ni metals,as well as the phase transitions of BaSO4 and Ca3(PO4)2 whichshow solid-state transitions at 1168 and 1475 ◦C, respectively.The high-temperature experiments were carried out using a heat-ing rate of 30 ◦C/min, with measurements made isothermally onreaching each setpoint temperature. The PSD has a resolutionof about 0.02◦ in 2θ (typical for laboratory XRD equipments).It was scanned along 2θ using a scan rate of 5◦ 2θ/min. In thisway, XRD patterns were collected over the 2θ range 5–90◦.Each complete XRD pattern collection time was ∼17 min. AT,SAS and residual alumina were easily modelled using Rietveldanalysis, while the Rutile phase was barely visible.
Fig. 4. The high-temperature X-ray diffraction system at Alfred University,Alfred, NY, USA.
Author's personal copy
2558 G. Bruno et al. / Journal of the European Ceramic Society 30 (2010) 2555–2562
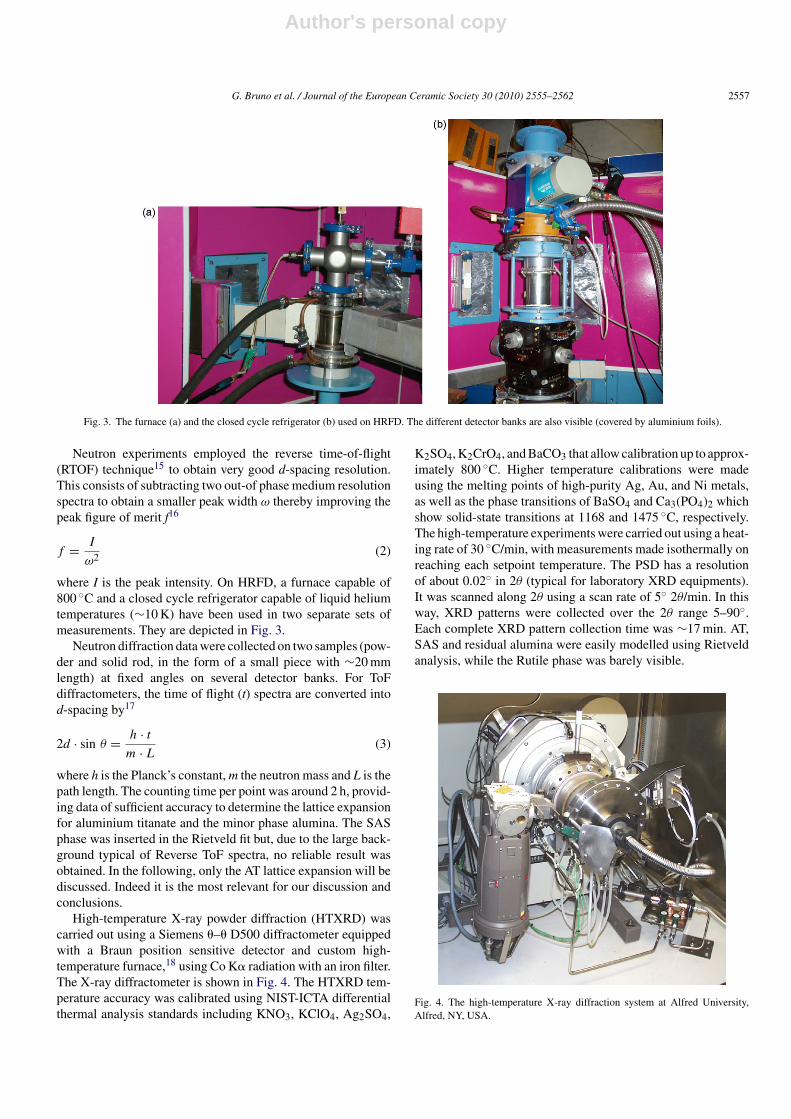
Fig. 5. The expansion of aluminum titanate as a function of temperature forthe solid rod and powder samples as measured by neutron diffraction (Dubna,Russia); both heating and cooling ramps are shown.
The ICSD files19 indicated in Table 1 were used for phaseanalysis. In particular, the convention used by Morosin andLynch20 has been adopted, where the c-axis has negative expan-sion and the b-axis has the maximum positive expansion.
We will see that in the modelling section the SAS latticeexpansion will be properly used.
3. Results
3.1. Neutron diffraction
The dilations of the three AT crystal axes are shown in Fig. 5.They are calculated similarly to Eq. (1) as:
εi = �di
di
i = a, b, c (4)
where di are the lattice parameters a, b, c and the suffix 0 standsfor the room temperature value. Even if a small shift can benoticed for the powder lattice parameters, when comparing thefurnace and cryostat data, the dilation data collected during dif-ferent runs look very consistent. No or very little hysteresis canbe detected in any of the three crystal directions. It must be notedthat the c-axis contraction is much smaller than the a- and b-axisexpansions.
It can be seen that the thermal expansion in the furnace exper-iment is always slightly larger for the powder than for the rod,while at sub-ambient temperatures the two samples have verysimilar dilations. This indicates that microcracking is completeand the rod expands like a loose powder (see also21).
Interestingly enough, the a and b dilations look linear in thehigh-temperature regions while they deviate from linearity atlow temperatures.
The fitting program MRIAWIN22 used at Dubna defines thefunctional dependence of the integral peak width ω on the d-spacing d in the form of
ω = (a1 + a22 · d2)
1/2(5)
The parameter a1 is a diffractometer constant, so the mostimportant parameter for our purposes is the term a2, the inte-
Fig. 6. The (relative) peak width parameter a2 of aluminum titanate as a functionof temperature for the compact rod and the powder samples as measured byneutron diffraction; error bars are included in the symbols.
gral peak width. Fig. 6 shows the variation of the integral peakwidth parameter a2 as a function of temperature for both pow-der and solid samples. We notice that the rod always has a largerintegral width parameter and the difference between the twosamples increases at low temperatures. Moreover, the integralwidth parameter increases with decreasing temperature.
3.2. X-ray diffraction
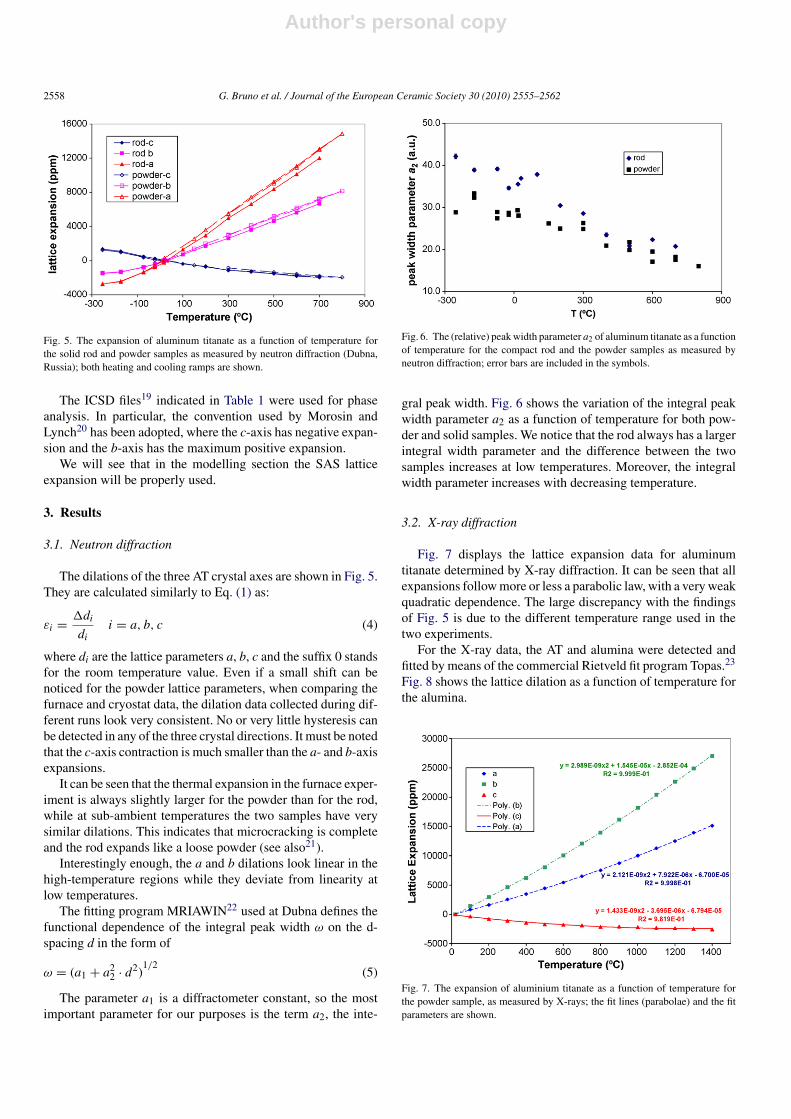
Fig. 7 displays the lattice expansion data for aluminumtitanate determined by X-ray diffraction. It can be seen that allexpansions follow more or less a parabolic law, with a very weakquadratic dependence. The large discrepancy with the findingsof Fig. 5 is due to the different temperature range used in thetwo experiments.
For the X-ray data, the AT and alumina were detected andfitted by means of the commercial Rietveld fit program Topas.23
Fig. 8 shows the lattice dilation as a function of temperature forthe alumina.
Fig. 7. The expansion of aluminium titanate as a function of temperature forthe powder sample, as measured by X-rays; the fit lines (parabolae) and the fitparameters are shown.
Author's personal copy
G. Bruno et al. / Journal of the European Ceramic Society 30 (2010) 2555–2562 2559
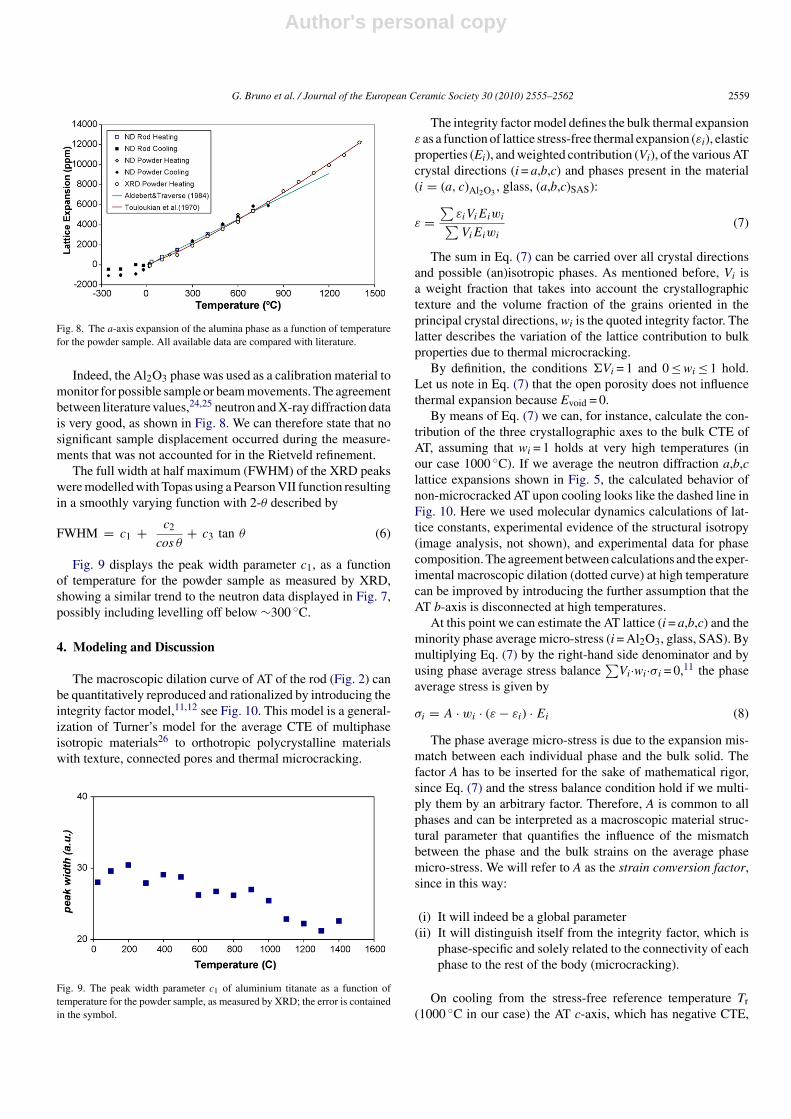
Fig. 8. The a-axis expansion of the alumina phase as a function of temperaturefor the powder sample. All available data are compared with literature.
Indeed, the Al2O3 phase was used as a calibration material tomonitor for possible sample or beam movements. The agreementbetween literature values,24,25 neutron and X-ray diffraction datais very good, as shown in Fig. 8. We can therefore state that nosignificant sample displacement occurred during the measure-ments that was not accounted for in the Rietveld refinement.
The full width at half maximum (FWHM) of the XRD peakswere modelled with Topas using a Pearson VII function resultingin a smoothly varying function with 2-θ described by
FWHM = c1 + c2
cos θ+ c3 tan θ (6)
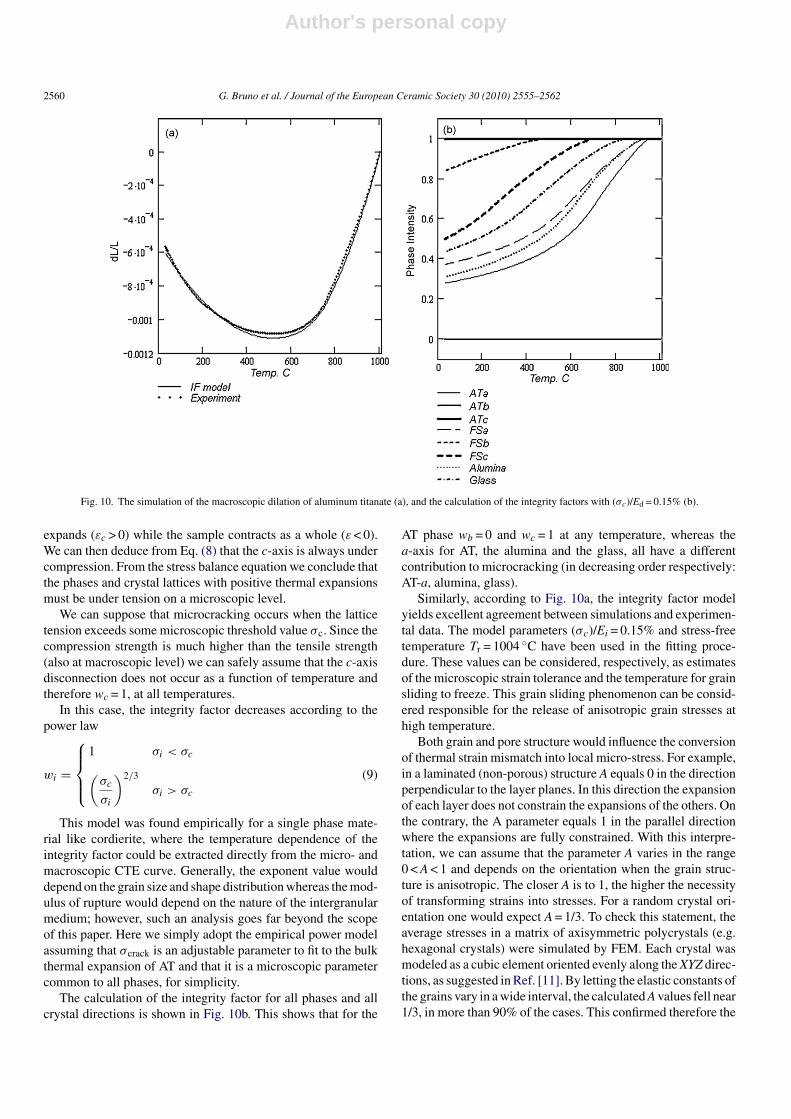
Fig. 9 displays the peak width parameter c1, as a functionof temperature for the powder sample as measured by XRD,showing a similar trend to the neutron data displayed in Fig. 7,possibly including levelling off below ∼300 ◦C.
4. Modeling and Discussion
The macroscopic dilation curve of AT of the rod (Fig. 2) canbe quantitatively reproduced and rationalized by introducing theintegrity factor model,11,12 see Fig. 10. This model is a general-ization of Turner’s model for the average CTE of multiphaseisotropic materials26 to orthotropic polycrystalline materialswith texture, connected pores and thermal microcracking.
Fig. 9. The peak width parameter c1 of aluminium titanate as a function oftemperature for the powder sample, as measured by XRD; the error is containedin the symbol.
The integrity factor model defines the bulk thermal expansionε as a function of lattice stress-free thermal expansion (εi), elasticproperties (Ei), and weighted contribution (Vi), of the various ATcrystal directions (i = a,b,c) and phases present in the material(i = (a, c)Al2O3
, glass, (a,b,c)SAS):
ε =∑
εiViEiwi∑ViEiwi
(7)
The sum in Eq. (7) can be carried over all crystal directionsand possible (an)isotropic phases. As mentioned before, Vi isa weight fraction that takes into account the crystallographictexture and the volume fraction of the grains oriented in theprincipal crystal directions, wi is the quoted integrity factor. Thelatter describes the variation of the lattice contribution to bulkproperties due to thermal microcracking.
By definition, the conditions �Vi = 1 and 0 ≤ wi ≤ 1 hold.Let us note in Eq. (7) that the open porosity does not influencethermal expansion because Evoid = 0.
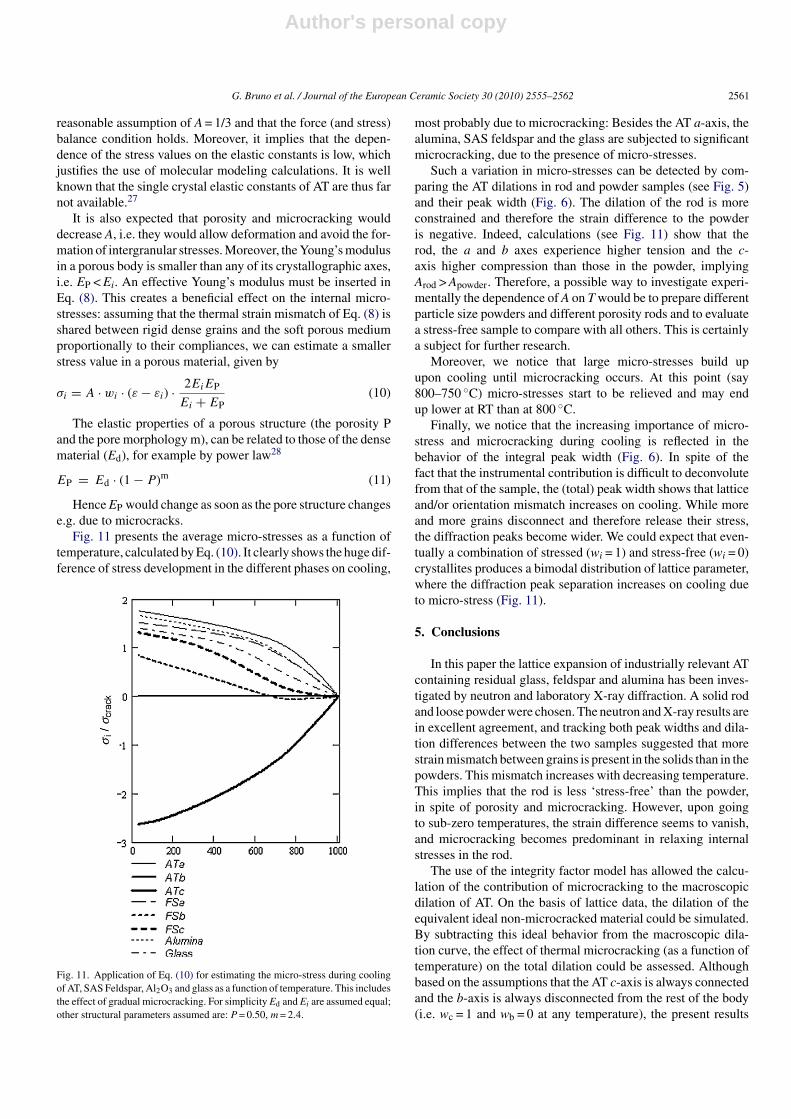
By means of Eq. (7) we can, for instance, calculate the con-tribution of the three crystallographic axes to the bulk CTE ofAT, assuming that wi = 1 holds at very high temperatures (inour case 1000 ◦C). If we average the neutron diffraction a,b,clattice expansions shown in Fig. 5, the calculated behavior ofnon-microcracked AT upon cooling looks like the dashed line inFig. 10. Here we used molecular dynamics calculations of lat-tice constants, experimental evidence of the structural isotropy(image analysis, not shown), and experimental data for phasecomposition. The agreement between calculations and the exper-imental macroscopic dilation (dotted curve) at high temperaturecan be improved by introducing the further assumption that theAT b-axis is disconnected at high temperatures.
At this point we can estimate the AT lattice (i = a,b,c) and theminority phase average micro-stress (i = Al2O3, glass, SAS). Bymultiplying Eq. (7) by the right-hand side denominator and byusing phase average stress balance
∑Vi·wi·σi = 0,11 the phase
average stress is given by
σi = A · wi · (ε − εi) · Ei (8)
The phase average micro-stress is due to the expansion mis-match between each individual phase and the bulk solid. Thefactor A has to be inserted for the sake of mathematical rigor,since Eq. (7) and the stress balance condition hold if we multi-ply them by an arbitrary factor. Therefore, A is common to allphases and can be interpreted as a macroscopic material struc-tural parameter that quantifies the influence of the mismatchbetween the phase and the bulk strains on the average phasemicro-stress. We will refer to A as the strain conversion factor,since in this way:
(i) It will indeed be a global parameter(ii) It will distinguish itself from the integrity factor, which is
phase-specific and solely related to the connectivity of eachphase to the rest of the body (microcracking).
On cooling from the stress-free reference temperature Tr(1000 ◦C in our case) the AT c-axis, which has negative CTE,
Author's personal copy
2560 G. Bruno et al. / Journal of the European Ceramic Society 30 (2010) 2555–2562
Fig. 10. The simulation of the macroscopic dilation of aluminum titanate (a), and the calculation of the integrity factors with (σc)/Ed = 0.15% (b).
expands (εc > 0) while the sample contracts as a whole (ε < 0).We can then deduce from Eq. (8) that the c-axis is always undercompression. From the stress balance equation we conclude thatthe phases and crystal lattices with positive thermal expansionsmust be under tension on a microscopic level.
We can suppose that microcracking occurs when the latticetension exceeds some microscopic threshold value σc. Since thecompression strength is much higher than the tensile strength(also at macroscopic level) we can safely assume that the c-axisdisconnection does not occur as a function of temperature andtherefore wc = 1, at all temperatures.
In this case, the integrity factor decreases according to thepower law
wi =
⎧⎪⎪⎨⎪⎪⎩1 σi < σc(
σc
σi
)2/3
σi > σc
(9)
This model was found empirically for a single phase mate-rial like cordierite, where the temperature dependence of theintegrity factor could be extracted directly from the micro- andmacroscopic CTE curve. Generally, the exponent value woulddepend on the grain size and shape distribution whereas the mod-ulus of rupture would depend on the nature of the intergranularmedium; however, such an analysis goes far beyond the scopeof this paper. Here we simply adopt the empirical power modelassuming that σcrack is an adjustable parameter to fit to the bulkthermal expansion of AT and that it is a microscopic parametercommon to all phases, for simplicity.
The calculation of the integrity factor for all phases and allcrystal directions is shown in Fig. 10b. This shows that for the
AT phase wb = 0 and wc = 1 at any temperature, whereas thea-axis for AT, the alumina and the glass, all have a differentcontribution to microcracking (in decreasing order respectively:AT-a, alumina, glass).
Similarly, according to Fig. 10a, the integrity factor modelyields excellent agreement between simulations and experimen-tal data. The model parameters (σc)/Ei = 0.15% and stress-freetemperature Tr = 1004 ◦C have been used in the fitting proce-dure. These values can be considered, respectively, as estimatesof the microscopic strain tolerance and the temperature for grainsliding to freeze. This grain sliding phenomenon can be consid-ered responsible for the release of anisotropic grain stresses athigh temperature.
Both grain and pore structure would influence the conversionof thermal strain mismatch into local micro-stress. For example,in a laminated (non-porous) structure A equals 0 in the directionperpendicular to the layer planes. In this direction the expansionof each layer does not constrain the expansions of the others. Onthe contrary, the A parameter equals 1 in the parallel directionwhere the expansions are fully constrained. With this interpre-tation, we can assume that the parameter A varies in the range0 < A < 1 and depends on the orientation when the grain struc-ture is anisotropic. The closer A is to 1, the higher the necessityof transforming strains into stresses. For a random crystal ori-entation one would expect A = 1/3. To check this statement, theaverage stresses in a matrix of axisymmetric polycrystals (e.g.hexagonal crystals) were simulated by FEM. Each crystal wasmodeled as a cubic element oriented evenly along the XYZ direc-tions, as suggested in Ref. [11]. By letting the elastic constants ofthe grains vary in a wide interval, the calculated A values fell near1/3, in more than 90% of the cases. This confirmed therefore the
Author's personal copy
G. Bruno et al. / Journal of the European Ceramic Society 30 (2010) 2555–2562 2561
reasonable assumption of A = 1/3 and that the force (and stress)balance condition holds. Moreover, it implies that the depen-dence of the stress values on the elastic constants is low, whichjustifies the use of molecular modeling calculations. It is wellknown that the single crystal elastic constants of AT are thus farnot available.27
It is also expected that porosity and microcracking woulddecrease A, i.e. they would allow deformation and avoid the for-mation of intergranular stresses. Moreover, the Young’s modulusin a porous body is smaller than any of its crystallographic axes,i.e. EP < Ei. An effective Young’s modulus must be inserted inEq. (8). This creates a beneficial effect on the internal micro-stresses: assuming that the thermal strain mismatch of Eq. (8) isshared between rigid dense grains and the soft porous mediumproportionally to their compliances, we can estimate a smallerstress value in a porous material, given by
σi = A · wi · (ε − εi) · 2EiEP
Ei + EP(10)
The elastic properties of a porous structure (the porosity Pand the pore morphology m), can be related to those of the densematerial (Ed), for example by power law28
EP = Ed · (1 − P)m (11)
Hence EP would change as soon as the pore structure changese.g. due to microcracks.
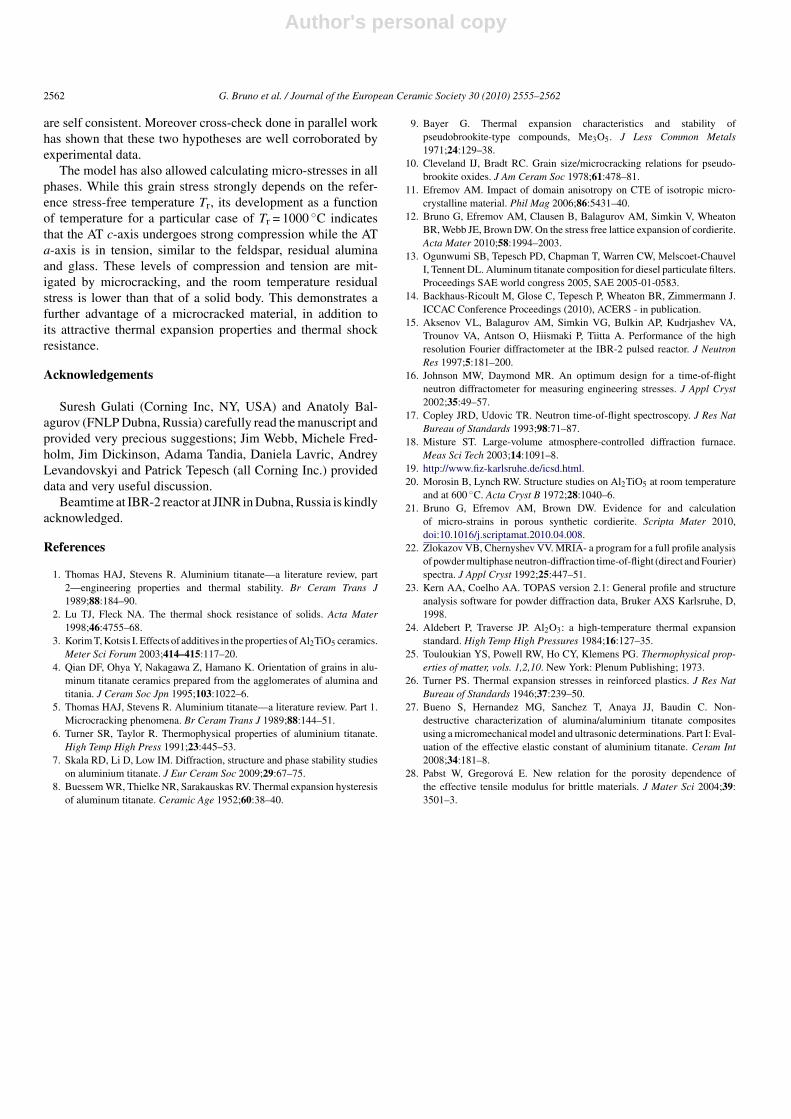
Fig. 11 presents the average micro-stresses as a function oftemperature, calculated by Eq. (10). It clearly shows the huge dif-ference of stress development in the different phases on cooling,
Fig. 11. Application of Eq. (10) for estimating the micro-stress during coolingof AT, SAS Feldspar, Al2O3 and glass as a function of temperature. This includesthe effect of gradual microcracking. For simplicity Ed and Ei are assumed equal;other structural parameters assumed are: P = 0.50, m = 2.4.
most probably due to microcracking: Besides the AT a-axis, thealumina, SAS feldspar and the glass are subjected to significantmicrocracking, due to the presence of micro-stresses.
Such a variation in micro-stresses can be detected by com-paring the AT dilations in rod and powder samples (see Fig. 5)and their peak width (Fig. 6). The dilation of the rod is moreconstrained and therefore the strain difference to the powderis negative. Indeed, calculations (see Fig. 11) show that therod, the a and b axes experience higher tension and the c-axis higher compression than those in the powder, implyingArod > Apowder. Therefore, a possible way to investigate experi-mentally the dependence of A on T would be to prepare differentparticle size powders and different porosity rods and to evaluatea stress-free sample to compare with all others. This is certainlya subject for further research.
Moreover, we notice that large micro-stresses build upupon cooling until microcracking occurs. At this point (say800–750 ◦C) micro-stresses start to be relieved and may endup lower at RT than at 800 ◦C.
Finally, we notice that the increasing importance of micro-stress and microcracking during cooling is reflected in thebehavior of the integral peak width (Fig. 6). In spite of thefact that the instrumental contribution is difficult to deconvolutefrom that of the sample, the (total) peak width shows that latticeand/or orientation mismatch increases on cooling. While moreand more grains disconnect and therefore release their stress,the diffraction peaks become wider. We could expect that even-tually a combination of stressed (wi = 1) and stress-free (wi = 0)crystallites produces a bimodal distribution of lattice parameter,where the diffraction peak separation increases on cooling dueto micro-stress (Fig. 11).
5. Conclusions
In this paper the lattice expansion of industrially relevant ATcontaining residual glass, feldspar and alumina has been inves-tigated by neutron and laboratory X-ray diffraction. A solid rodand loose powder were chosen. The neutron and X-ray results arein excellent agreement, and tracking both peak widths and dila-tion differences between the two samples suggested that morestrain mismatch between grains is present in the solids than in thepowders. This mismatch increases with decreasing temperature.This implies that the rod is less ‘stress-free’ than the powder,in spite of porosity and microcracking. However, upon goingto sub-zero temperatures, the strain difference seems to vanish,and microcracking becomes predominant in relaxing internalstresses in the rod.
The use of the integrity factor model has allowed the calcu-lation of the contribution of microcracking to the macroscopicdilation of AT. On the basis of lattice data, the dilation of theequivalent ideal non-microcracked material could be simulated.By subtracting this ideal behavior from the macroscopic dila-tion curve, the effect of thermal microcracking (as a function oftemperature) on the total dilation could be assessed. Althoughbased on the assumptions that the AT c-axis is always connectedand the b-axis is always disconnected from the rest of the body(i.e. wc = 1 and wb = 0 at any temperature), the present results
Author's personal copy
2562 G. Bruno et al. / Journal of the European Ceramic Society 30 (2010) 2555–2562
are self consistent. Moreover cross-check done in parallel workhas shown that these two hypotheses are well corroborated byexperimental data.
The model has also allowed calculating micro-stresses in allphases. While this grain stress strongly depends on the refer-ence stress-free temperature Tr, its development as a functionof temperature for a particular case of Tr = 1000 ◦C indicatesthat the AT c-axis undergoes strong compression while the ATa-axis is in tension, similar to the feldspar, residual aluminaand glass. These levels of compression and tension are mit-igated by microcracking, and the room temperature residualstress is lower than that of a solid body. This demonstrates afurther advantage of a microcracked material, in addition toits attractive thermal expansion properties and thermal shockresistance.
Acknowledgements
Suresh Gulati (Corning Inc, NY, USA) and Anatoly Bal-agurov (FNLP Dubna, Russia) carefully read the manuscript andprovided very precious suggestions; Jim Webb, Michele Fred-holm, Jim Dickinson, Adama Tandia, Daniela Lavric, AndreyLevandovskyi and Patrick Tepesch (all Corning Inc.) provideddata and very useful discussion.
Beamtime at IBR-2 reactor at JINR in Dubna, Russia is kindlyacknowledged.
References
1. Thomas HAJ, Stevens R. Aluminium titanate—a literature review, part2—engineering properties and thermal stability. Br Ceram Trans J1989;88:184–90.
2. Lu TJ, Fleck NA. The thermal shock resistance of solids. Acta Mater1998;46:4755–68.
3. Korim T, Kotsis I. Effects of additives in the properties of Al2TiO5 ceramics.Meter Sci Forum 2003;414–415:117–20.
4. Qian DF, Ohya Y, Nakagawa Z, Hamano K. Orientation of grains in alu-minum titanate ceramics prepared from the agglomerates of alumina andtitania. J Ceram Soc Jpn 1995;103:1022–6.
5. Thomas HAJ, Stevens R. Aluminium titanate—a literature review. Part 1.Microcracking phenomena. Br Ceram Trans J 1989;88:144–51.
6. Turner SR, Taylor R. Thermophysical properties of aluminium titanate.High Temp High Press 1991;23:445–53.
7. Skala RD, Li D, Low IM. Diffraction, structure and phase stability studieson aluminium titanate. J Eur Ceram Soc 2009;29:67–75.
8. Buessem WR, Thielke NR, Sarakauskas RV. Thermal expansion hysteresisof aluminum titanate. Ceramic Age 1952;60:38–40.
9. Bayer G. Thermal expansion characteristics and stability ofpseudobrookite-type compounds, Me3O5. J Less Common Metals1971;24:129–38.
10. Cleveland IJ, Bradt RC. Grain size/microcracking relations for pseudo-brookite oxides. J Am Ceram Soc 1978;61:478–81.
11. Efremov AM. Impact of domain anisotropy on CTE of isotropic micro-crystalline material. Phil Mag 2006;86:5431–40.
12. Bruno G, Efremov AM, Clausen B, Balagurov AM, Simkin V, WheatonBR, Webb JE, Brown DW. On the stress free lattice expansion of cordierite.Acta Mater 2010;58:1994–2003.
13. Ogunwumi SB, Tepesch PD, Chapman T, Warren CW, Melscoet-ChauvelI, Tennent DL. Aluminum titanate composition for diesel particulate filters.Proceedings SAE world congress 2005, SAE 2005-01-0583.
14. Backhaus-Ricoult M, Glose C, Tepesch P, Wheaton BR, Zimmermann J.ICCAC Conference Proceedings (2010), ACERS - in publication.
15. Aksenov VL, Balagurov AM, Simkin VG, Bulkin AP, Kudrjashev VA,Trounov VA, Antson O, Hiismaki P, Tiitta A. Performance of the highresolution Fourier diffractometer at the IBR-2 pulsed reactor. J NeutronRes 1997;5:181–200.
16. Johnson MW, Daymond MR. An optimum design for a time-of-flightneutron diffractometer for measuring engineering stresses. J Appl Cryst2002;35:49–57.
17. Copley JRD, Udovic TR. Neutron time-of-flight spectroscopy. J Res NatBureau of Standards 1993;98:71–87.
18. Misture ST. Large-volume atmosphere-controlled diffraction furnace.Meas Sci Tech 2003;14:1091–8.
19. http://www.fiz-karlsruhe.de/icsd.html.20. Morosin B, Lynch RW. Structure studies on Al2TiO5 at room temperature
and at 600 ◦C. Acta Cryst B 1972;28:1040–6.21. Bruno G, Efremov AM, Brown DW. Evidence for and calculation
of micro-strains in porous synthetic cordierite. Scripta Mater 2010,doi:10.1016/j.scriptamat.2010.04.008.
22. Zlokazov VB, Chernyshev VV. MRIA- a program for a full profile analysisof powder multiphase neutron-diffraction time-of-flight (direct and Fourier)spectra. J Appl Cryst 1992;25:447–51.
23. Kern AA, Coelho AA. TOPAS version 2.1: General profile and structureanalysis software for powder diffraction data, Bruker AXS Karlsruhe, D,1998.
24. Aldebert P, Traverse JP. Al2O3: a high-temperature thermal expansionstandard. High Temp High Pressures 1984;16:127–35.
25. Touloukian YS, Powell RW, Ho CY, Klemens PG. Thermophysical prop-erties of matter, vols. 1,2,10. New York: Plenum Publishing; 1973.
26. Turner PS. Thermal expansion stresses in reinforced plastics. J Res NatBureau of Standards 1946;37:239–50.
27. Bueno S, Hernandez MG, Sanchez T, Anaya JJ, Baudin C. Non-destructive characterization of alumina/aluminium titanate compositesusing a micromechanical model and ultrasonic determinations. Part I: Eval-uation of the effective elastic constant of aluminium titanate. Ceram Int2008;34:181–8.
28. Pabst W, Gregorová E. New relation for the porosity dependence ofthe effective tensile modulus for brittle materials. J Mater Sci 2004;39:3501–3.
Related Documents