Jorma Kilpi @ PAN-NET Research Seminar 16.3.2006. 1 Micro- and macroscopic analysis of RTT variability in GPRS and UMTS networks Jorma Kilpi Pasi Lassila Systems Research Networking Laboratory VTT Technical Research Centre of Finland Helsinki University of Technology P.O.Box 12022, FIN 02044 VTT, Finland P.O.Box 3000, FIN 02015 TKK, Finland Email: [email protected] Email: [email protected]

Welcome message from author
This document is posted to help you gain knowledge. Please leave a comment to let me know what you think about it! Share it to your friends and learn new things together.
Transcript

Jorma Kilpi @ PAN-NET Research Seminar 16.3.2006. 1
Micro- and macroscopic analysis of RTT variability in
GPRS and UMTS networks
Jorma Kilpi Pasi Lassila
Systems Research Networking Laboratory
VTT Technical Research Centre of Finland Helsinki University of Technology
P.O.Box 12022, FIN 02044 VTT, Finland P.O.Box 3000, FIN 02015 TKK, Finland
Email: [email protected] Email: [email protected]

Jorma Kilpi @ PAN-NET Research Seminar 16.3.2006. 2
Semi-RTT
GPRS network
GGSN FirewallFirewall
Service network
PublicInternetPublicInternet
mobile hostmobile host external hostexternal host
Gn Gi
datadata
ACKsACKs
semi-RTT
• RTT process:
(ti, RTT (ti)) i = 1, . . . , n
wheren = number ofvalid semi-RTT samples observed from the flow andti is the
time stamp of the ACK packet at the Gi interface.

Jorma Kilpi @ PAN-NET Research Seminar 16.3.2006. 3
Why micro- and macroscopic analysis?
• How individual flows see the RTT process? (Microscopic level)
• What information does theaggregate RTT process tell us? (Macroscopic level)
• Please note:We use the word ’aggregate’ in two cases when we consider
1. aggregate of all TCP flows from the same mobile or
2. aggregate of all TCP flows from all of the mobiles.

Jorma Kilpi @ PAN-NET Research Seminar 16.3.2006. 4
Reconstruction of TCP flows
• Mobile TCP connections: GSM/GPRS and UMTS access.
• Mobile host <-> Internet host.
• All down- and upstream traffic of a TCP connection goes through the same GGSN.
• We used a program called Tstat (http://tstat.tlc.polito.it/) which
reconstructs TCP connections from TCP/IP packet level data.
• Moreover, Tstat was modified slightly in order to obtain RTT processes(ti, RTT (ti)),
i = 1, . . . , n of a large number of flows.
• Biased view of mobile traffic in the sense that we only present analysis of
non-anomalious successful TCP connections.

Jorma Kilpi @ PAN-NET Research Seminar 16.3.2006. 5
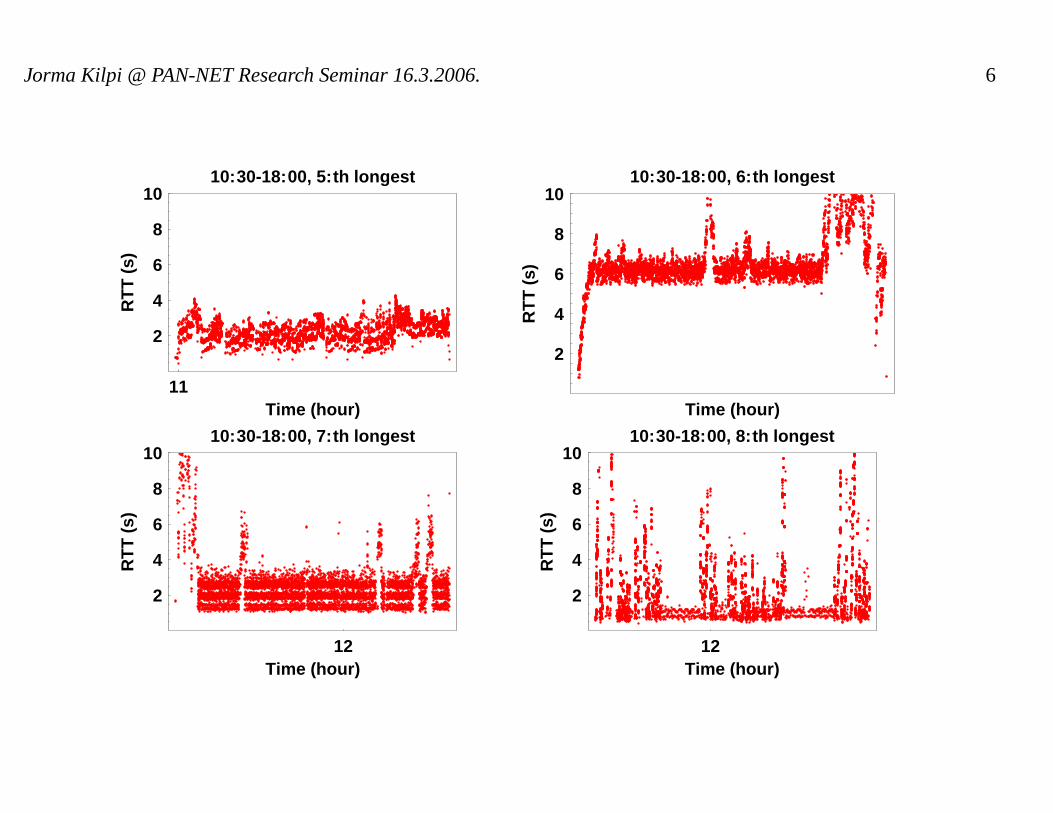
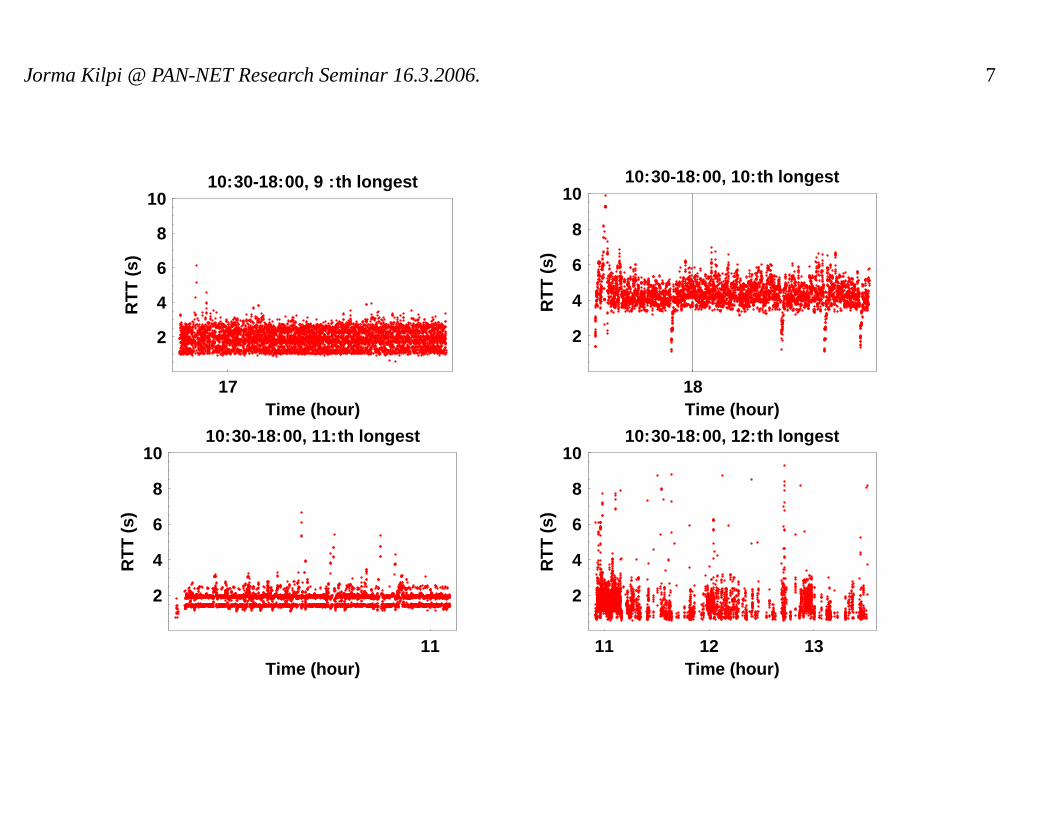
Examples of observed RTT processes
15 16 17 18 19Time (hour)
2
4
6
8
10
RT
T(s
)
10:30-18:00, longest
17 18Time (hour)
2
4
6
8
10
RT
T(s
)
10:30-18:00, 2:nd longest
13 14 15Time (hour)
2
4
6
8
10
RT
T(s
)
10:30-18:00, 3:rd longest
13 14 15 16 17Time (hour)
2
4
6
8
10
RT
T(s
)
10:30-18:00, 4:th longest
Jorma Kilpi @ PAN-NET Research Seminar 16.3.2006. 6
11Time (hour)
2
4
6
8
10
RT
T(s
)
10:30-18:00, 5:th longest
Time (hour)
2
4
6
8
10
RT
T(s
)
10:30-18:00, 6:th longest
12Time (hour)
2
4
6
8
10
RT
T(s
)
10:30-18:00, 7:th longest
12Time (hour)
2
4
6
8
10
RT
T(s
)
10:30-18:00, 8:th longest
Jorma Kilpi @ PAN-NET Research Seminar 16.3.2006. 7
17Time (hour)
2
4
6
8
10
RT
T(s
)
10:30-18:00, 9 :th longest
18Time (hour)
2
4
6
8
10
RT
T(s
)
10:30-18:00, 10:th longest
11Time (hour)
2
4
6
8
10
RT
T(s
)
10:30-18:00, 11:th longest
11 12 13Time (hour)
2
4
6
8
10
RT
T(s
)
10:30-18:00, 12:th longest

Jorma Kilpi @ PAN-NET Research Seminar 16.3.2006. 8
Microscopic level: Flow 1 in TCP port 80 (HTTP) but not a web page downloading!
15:00 16:00 17:00 18:00 19:00Time (hour)
1
2
3
4
5
6
RT
T(s
)
Flow 1
2.25 2.5 2.75 3 3.25 3.5 3.75 4Time Period (s)
0
50
100
150
200
Spe
ctra
lPow
er
Lomb Periodogram of Flow 1
Begin
Middle
2.25 2.5 2.75 3 3.25 3.5 3.75 4Time Period (s)
0
50
100
150
200
Spe
ctra
lPow
er
Lomb Periodogram of Flow 1
Middle
End
1 2 3 4 5 6 7 8Time Period (s)
20
40
60
80
100S
pect
ralP
ower
Lomb Periodogram of Flows 1 and 2
Flow 1
Flow 2

Jorma Kilpi @ PAN-NET Research Seminar 16.3.2006. 9
Microscopic level: Flow 2, also in TCP port 80 but lasts abouthalf an hour!
17:30 17:45Time (hour)
2.55
7.510
12.515
17.520
RT
T(s
)
Flow 2
0 5 10 15 20 25 30 35Time from the First Segment (min)
0
2
4
6
8
10
Vo
lum
e(M
B)
Flow 2
End: 26.8 kb/s
Begin: 40.2 kb/s
17:15 17:30 17:45 18:00 18:15Flow End Points
0
20
40
60
80
100
i:th
Flo
w
Simultaneous flows with Flow 2
Flow 2
• An example of the effect of simul-
taneous TCP-connections from the
same mobile.

Jorma Kilpi @ PAN-NET Research Seminar 16.3.2006. 10
Macroscopic level: Dominating RTT values
2 4 6 8 10 12j:th Scale
23456789
log 2
Ej
Energy Function Plot
0 1 2 3 4 5 6 7 8 9 10RTT (s)
0
0.002
0.004
0.006
0.008
PD
F
1.3 4.3Positions of Spikes in PDFs
Sample 1
Sample 2
0.7 1.9
• A paper by Huang, Feldmann and
Willinger used wavelets to detect
network performance problems.
• Energy Function Plots (EFPs) using
Haar wavelets showed local period-
icity in the range600ms − 5s.
• PDF of aggregate RTT processes
show that the probability mass essen-
tially lies between the same600ms−
5s!
• The positions of spikes are due to de-
terministic reasons.
• The (backbone) network as a whole
is not significantly congested during
the busy hours.

Jorma Kilpi @ PAN-NET Research Seminar 16.3.2006. 11
Macroscopic level: Self-congestion
0 5 10 15 20 25
Simultaneous TCP Connections (Max )
2.55
7.510
12.515
17.520
Max
RT
T(s
)
Conditional Expectation
Group 1
Group 0
0 5 10 15 20 25Simultaneous TCP Connections (Max)
2.55
7.510
12.515
17.520
Max
RT
T(s
)
Conditional Expectation (UMTS)
• Aggregate traffic from the same mo-
bile.
• Group 0: The set of those mobiles
that essentially did not send any data
in the uplink.
• Group 1: At least one of the flows
of the mobile in this group had non-
trivial simultaneous uploading.
• Robust estimates of conditional ex-
pectation.
• For individual flows, self-congestion
is due to simultaneous flows from
same mobiles are the main reason for
the observed RTT variability.
Jorma Kilpi @ PAN-NET Research Seminar 16.3.2006. 12
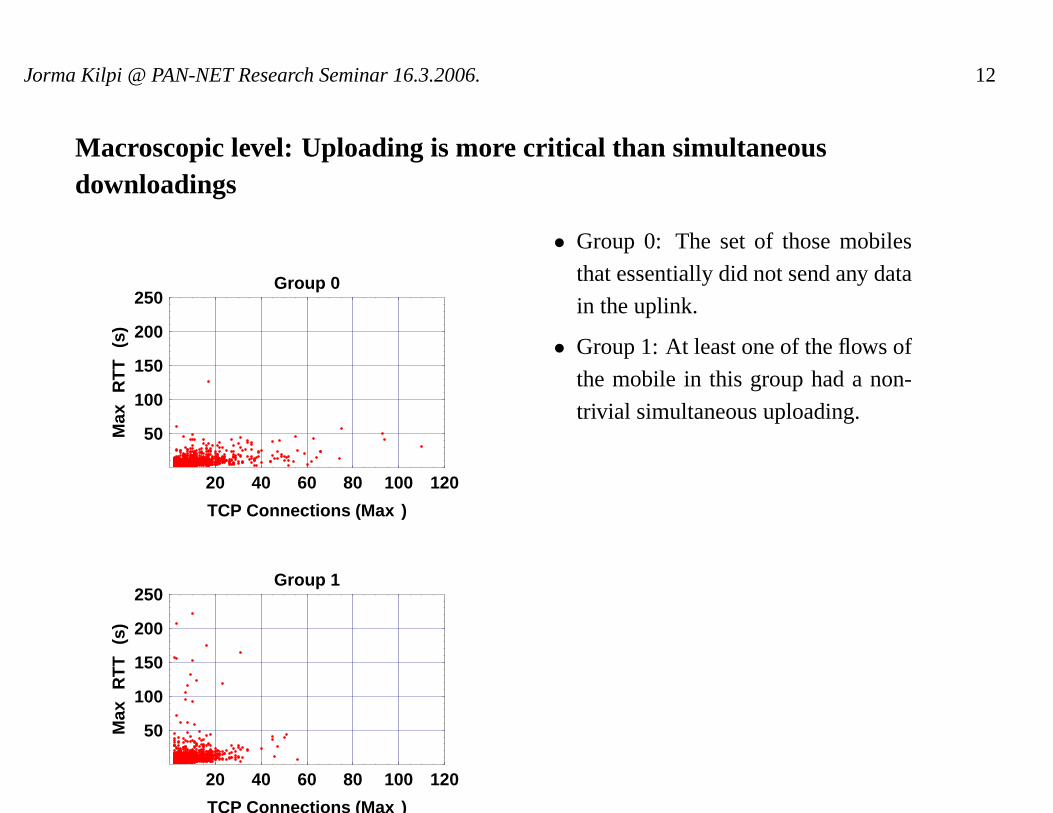
Macroscopic level: Uploading is more critical than simultaneousdownloadings
20 40 60 80 100 120
TCP Connections (Max )
50
100
150
200
250
Max
RT
T(s
)
Group 0
20 40 60 80 100 120
TCP Connections (Max )
50
100
150
200
250
Max
RT
T(s
)
Group 1
• Group 0: The set of those mobiles
that essentially did not send any data
in the uplink.
• Group 1: At least one of the flows of
the mobile in this group had a non-
trivial simultaneous uploading.

Jorma Kilpi @ PAN-NET Research Seminar 16.3.2006. 13
Conclusions and further research topics
• Dominating RTT values told that the (backbone) network was not significantly
congested during busy hours.
• Self-congestion and uploading are critical.
• Wavelets seem to be really a powerful tool.
– EFP gave the same information about the congestion level of the network from the
packet level data than the histogram of all RTTs,i.e., without reconstruction ofTCP flows.
• Usefulness of the Lomb periodogram?
– TCP port 80 does not indicate the true application.
– Distinguishing streaming applications from true file downloadings?
– Could the ACK packets alone be used? (Without reconstruction of TCP
connections)

Jorma Kilpi @ PAN-NET Research Seminar 16.3.2006. 14
• Poster (short paper) in Networking 2006 conference, May 15th-19th, Coimbra,
Portugal.
• Questions?
Related Documents