GREAT LAKES FISH NUTRIENTS, CONTAMINANTS, BENEFITS, AND RISKS PRESENTED TO MSU SEAFOOD SUMMIT MARCH 12, 2015 Michigan Fish Consumption Advisory Program Kory Groetsch & Rachel Fox Michigan Department of Community Health

Welcome message from author
This document is posted to help you gain knowledge. Please leave a comment to let me know what you think about it! Share it to your friends and learn new things together.
Transcript

GREAT LAKES FISH NUTRIENTS, CONTAMINANTS,
BENEFITS, AND RISKS
PRESENTED TO MSU SEAFOOD SUMMIT
MARCH 12, 2015
Michigan Fish Consumption Advisory Program
Kory Groetsch & Rachel Fox Michigan Department of Community Health

EAT SAFE FISH PROGRAM - BROCHURES


LEVELS OF ORGANIZATION

SATURATED VS UNSATURATED FATTY ACIDS

POLYUNSATURATED FATTY ACIDS
Omega-3 Omega-6

PHYSIOLOGIC BENEFITS OF LONG-TERM EPA/DHA FATTY ACID INGESTION Reduces creation of inflammatory proteins Reduced systemic inflammation Lower triglycerides in blood Slow plaque formation in blood vessels More stable plaque in blood vessel Less blood vessel constriction Lower concentrations of apolipoproteins (marker of diabetes,
heart disease, Alzheimer's) Improved endothelial function Improved plaque stability, may be due to increased EPA in the
plaque reducing inflammation

EFFECTS OF EPA & DHA (BENEFITS) Infant / Child Increased gestation times Better developmental outcomes visual acuity, cognitive function, motor skills
Adults Reduced risk of sudden death from a heart attack in
people with a history of myocardial infarction. Lower blood pressure
Source: Institute of Medicine of the National Academies. 2007. Seafood Choices Balancing Benefits and Risks

ADDITIONAL EFFECTS OF EPA & DHA
Lower risk of coronary heart disease Lower risk of ischemic stroke Improved cognitive development (fetus and
newborns) May reduce cognitive decline May help with depression

FATTY ACID FUNCTIONS
Energy for the cellular functions
Structural material for cell membranes Increased cell membrane fluidity Altered cell membrane function
Metabolized to other chemicals that alter systemic
inflammation, blood clotting, and blood vessel function.

2010 DIETARY GUIDELINES USDA & DHHS
Increase seafood
Choose seafood to replace a serving of meat and poultry.
8-oz per week, variety seafood (1,600-2,000 calorie per day)
250 mg EPA/DHA per day (1,750 mg per week)

USDA DATA: EPA+DHA BY FISH SPECIES (MLLIGRAMS PER 8-OZ SERVING (MEASURED RAW))
0
1000
2000
3000
4000
5000
6000O
rang
e Ro
ughy
Catfi
sh C
hann
el fa
rmed
Tila
pia
Tuna
Yel
low
fin fr
esh
Cod
- Pac
ific
Had
dock
Pollo
ck A
lask
aCo
d - A
tlant
icH
alib
ut -
Atla
ntic
& P
acifi
cPe
rch
Oce
an A
tlant
icG
roup
er m
ixed
Tuna
Ski
pjac
k Fr
esh
Flat
fish
(flou
nder
, sol
e)W
alle
yeM
acke
rel K
ing
Catfi
sh C
hann
el w
ildSe
atro
ut m
ixed
Pollo
ck A
tlant
icTi
lefis
hSa
lmon
Pin
kSe
abas
s W
ild M
ixed
Trou
t Rai
nbow
Wild
Bass
Fre
shw
ater
mix
edSm
elt R
ainb
owTr
out m
ixed
spe
cies
Bass
Str
iped
Swor
dfis
hSh
ark
mix
ed s
peci
esH
alib
ut -
Gre
enla
ndSa
lmon
Soc
keye
Salm
on C
oho
Wild
Tuna
Blu
efin
Fre
shSa
lmon
Coh
o Fa
rmed
Whi
tefis
h M
ixed
Spe
cies
Mac
kere
l Mix
ed S
peci
esSa
lmon
Atla
ntic
Wild
Anch
ovy
Her
ring
Pac
ific
& A
tlant
icSa
lmon
Chi
nook
Salm
on A
tlant
ic F
arm
edM
acke
rel,
Atla
ntic
mg
of E
PA
+DH
A
http://ndb.nal.usda.gov/ndb/nutrients/index

0
500
1000
1500
2000
2500
3000
3500
4000
mg
EPA+
DH
A/8
ozHow much EPA+DHA is in an 8oz serving of Great Lakes fish?

0
1000
2000
3000
4000
5000
6000
7000
mg
EPA+
DH
A / 8
oz
EPA+DHA in Great Lakes fish species

Bioaccumulative & Persistent
15
• Mercury (coal-fired industries)
• PCBs (used in transformers and capacitors, banned in the late ’70s)
• Dioxins (chlorine manufacturers, industrial incineration practices)
• PFOS (used in fire fighting foams)
• First public health fish advisory: 1970

0 0.1 0.2 0.3 0.4 0.5 0.6 0.7
BASS CHILEANCARP
CATFISHCOD
HADDOCK (Atlantic)HALIBUTHERRING
ORANGE ROUGHYPERCH (Freshwater)
PERCH OCEANPOLLOCK
SALMON (CANNED)SALMON…
SNAPPERTILAPIA
TROUT (FRESHWATER)TUNA (CANNED,…
TUNA (CANNED, LIGHT)TUNA(FRESH/FROZE…
WHITEFISH
Mercury (ppm)
US FDA MERCURY IN PURCHASED FISH

MERCURY IN GREAT LAKES FILETS
0
0.1
0.2
0.3
0.4
0.5
0.6
0.7
Mer
cury
(ppm
)
Erie Huron Michigan Superior

0 0.2 0.4 0.6 0.8 1 1.2 1.4 1.6 1.8 2
Lamb chop
Salmon
Catfish
PCBs (ppm)
0
0.003
0.006
0.009
0.012
0.015
Lamb chop Salmon Catfish
US FDA - PCBS IN PURCHASED FISH
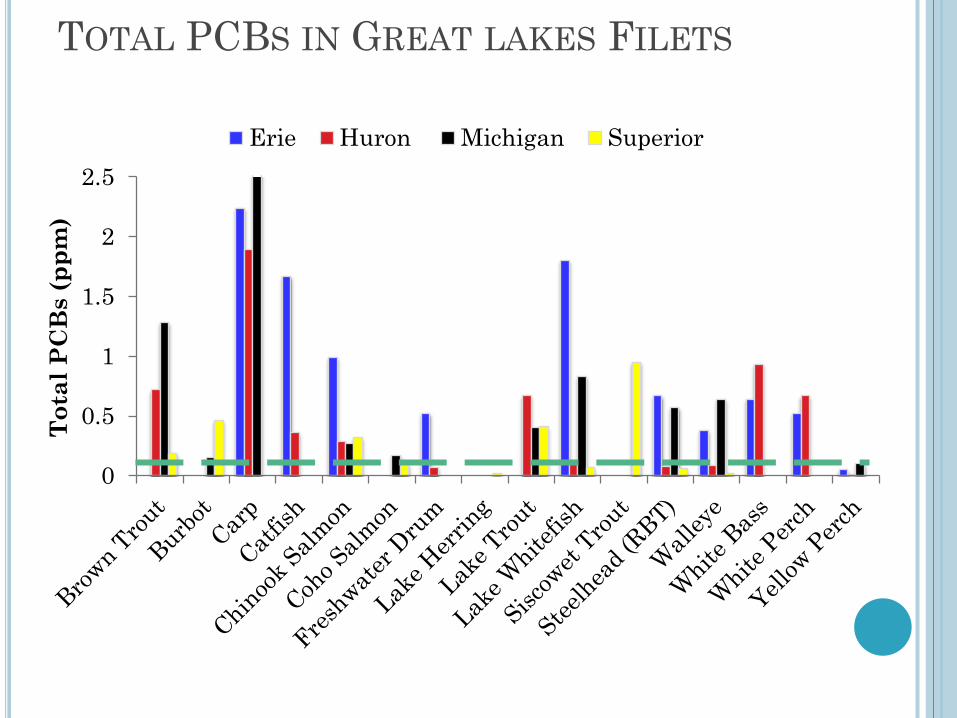
TOTAL PCBS IN GREAT LAKES FILETS
0
0.5
1
1.5
2
2.5
Tota
l PC
Bs
(ppm
)
Erie Huron Michigan Superior

0 5 10 15 20 25 30 35 40 45 50
CatfishTrout
Salmon (F)Salmon (W)
FlounderTuna (Cnd)
TilapiaHalibutPollock
Food Supply 2000Food Supply 2001Food Supply 2002
Dioxin (ppt-TEQ)
0
0.2
0.4
0.6
FDA - Purchased
US FDA – DIOXIN-LIKE CHEMICALS IN PURCHASED FISH

DIOXIN-LIKE CHEMICALS IN GREAT LAKES FILETS
0102030405060708090
100
Dio
xin-
like
Che
mic
als
(p
pt-T
EQ
)
Erie Huron Michigan Superior

EFFECTS IN HUMAN OR LABORATORY ANIMAL CELLS AND ORGAN SYSTEMS Cellular calcium dysregulation
growth, movement, metabolism, secretion and plasticity
Neurodevelopmental Disruption of neurotransmitter function During development, altered nerve cell growth in the brain (linked to
calcium regulation)
Cardiovascular Increase Arrhythmias Changes in measures of decreased heart rate variability Decreased function of inner lining of blood vessels (endothelial cells)
Reproductive Reduced sperm quality and quantity
Thyroid
Hormone metabolism and function

EFFECTS IN HUMAN POPULATIONS
Mercury, PCBs, or Dioxins Neurodevelopmental Immune system
suppression Endocrine disruption Sperm quality
reduction Dental changes
Mercury, PCBs, or Dioxins Cardiovascular disease Reproductive effects
(fertility) Endocrine disruption
(thyroid/metabolic effects/diabetes)
Reduced memory function Immune system
suppression
Fetus or Child Adults

Mortality – Great Lakes sport fish consumers
• Background – Great Lakes Charter boat Captains (N=2,123) vs Store-purchased Fish
Consumers (N=1,367) – Mortality (all-cause, cardiovascular disease, coronary heart disease)
• Results – Store-purchased Fish Consumers
• Reduction (40%) in all-cause mortality (≥1 fish meal/week) • Reduction (55%) in cardiovascular disease mortality (≥1 fish meal/week)
– Captains Population (Great Lakes fish consumers)
• No reduction in risk of all-cause and cardiovascular disease mortality • Risk of coronary heart disease mortality had a non-significant increase from
1.0 to 1.8; while Referents had a significant decrease from 1.0 to 0.31 (70%).
Tomasallo et al. Env. Res. 2010 110(1):62-9.

Transparent Documentation online
www.michigan.gov/eatsafefish
Consistent US EPA & ATSDR Risk
Assessment Methods One set of guidance
Current Science Toxicology and
Epidemiology Update with new science
Building Consensus Great Lakes Consortium for
Fish Consumption Advisories
Michigan Eat Safe Fish Program

US FDA – NUMBERS
Tolerance Levels Deleterious Substance
Level in Edible Tissue
Food Commodity
Reference
PCBs 2.0 ppm All Fish 21 CFR 109.30 Action Levels
Methylmercury 1.0 ppm All Fish “Compliance Policy Guide,” Sec. 540.600
http://www.fda.gov/downloads/Food/GuidanceRegulation/UCM251970.pdf

US FDA – METHYLMERCURY “SAFETY TIPS” Advice for
Women who might become pregnant Women who are pregnant Nursing Mothers Young Children
Do Not Eat – Shark, Swordfish, King Mackerel,
Tilefish
Eat up to 12-oz per week variety of fish lower in mercury (shrimp, light tuna, salmon, pollock, catfish)
http://www.fda.gov/food/resourcesforyou/consumers/ucm110591.htm

MERCURY IN PURCHASED FISH (US FDA)
0.01 0.02 0.025 0.03 0.13
0.24 0.35
0.57 0.69 0.73
0.98 1.0
1.45
00.20.40.60.8
11.21.41.6
Mer
cury
ppm

ACKNOWLEDGEMENTS EPA Great Lakes Fish Monitoring and Surveillance Program
Elizabeth Murphy, US Environmental Protection Agency Great Lakes
Great Lakes Consortium of Fish Consumption Advisories Meghan Williams, Wisconsin Department of Natural Resources Candy Shrank, Wisconsin Department of Natural Resources Patricia McCann, Minnesota Department of Health

Michelle Bruneau Kory Groetsch Rachel Fox Susan Manente Jennifer Gray Tom Mata
More Information: 1-800-648-6942
www.michigan.gov/eatsafefish Technical Reports Eat Safe Fish Brochures (6 languages) Buy Safe Fish Brochures (6 languages) 5 Regional Eat Safe Fish Guides Multiple Topic and Location Specific Materials

287 Detroit River Angler Study Participants At least 2 meals per month from Detroit River
BIOMONITORING OF PERSISTENT TOXIC SUBSTANCES IN MICHIGAN URBAN FISHEATERS STUDY

Total Blood Mercury (µg/l)
Geometric Mean & Selected Percentiles
(95% Confidence Intervals)
NHANES 2011-2012 (20 years and older)
N=5030
Detroit River Fish Consumers
N = 278
50th percentile .790 (.690-.940) 2.45 (2.20-2.90)
75th percentile 1.68 (1.36-2.12) 4.60 (4.10-5.50)
90th percentile 3.35 (2.71-4.31) 8.70 (7.10-10.0)
95th percentile 5.02 (3.94-6.96) 12.0 (9.60-15.0)

MEHG AFFECTS CARDIAC AUTONOMIC NERVOUS SYSTEM IN ADULTS
No differences in measured characteristics between fish eating volunteers (n=27) and control (n=27)
Volunteers ate bigeye tuna and swordfish Both fish had about 1 ppm mercury Volunteers ate 3.4 µg mercury/kg BW per week
(about 8 oz of fish per week for a 154 lb person)
Yaginuma-Sakurai et al. 2010 Neurotoxicol. Teratol. 32:
HACCP GUIDANCE CHAPTER 10 – METHYLMERCURY
As with previous editions of the “Fish and Fishery Products Hazards and Controls Guidance,” this fourth edition does not contain advice on Hazard Analysis Critical Control Point (HACCP) controls for methylmercury, except where federal, state, local, or foreign authorities close certain waters to commercial harvesting as described in Chapter 9.

FOOD SOURCES
Omega-3 Fatty Acids
Fatty fish* Fish oils* Flax seeds Chia seeds Walnuts Pumpkin seeds Canola (rapeseed) oil Small amounts in meats
and eggs GMO Soybean oil
Omega-6 Fatty Acids
Nuts Seeds Soybean oil Safflower oil Corn oil Cottonseed oil

MI SERVING CATEGORIES
MI Serving (Servings per
month)
16
12
8
4
2
1
6 meals per year
Limited
Do Not Eat
Best Choice
= Dietary Guideline
Advised Restrictions

ASSESSMENT PROCESS
Filet Homogenate Fish Lab Collection Extraction & Clean up
Samples Analytical Equipment
Chromatogram Chemical Concentrations
Toxicology and Epidemiology Literature Technical Documents
RfD or
CSF Potency
Value FCSV
Data Management &
Analysis
Planning
95% UCL or Regression
Statistics
Management Review Interdepartmental Review
Mercury
Meal Category FCSV Ranges
meals per month a µg/g (ppm)
16 ? 0.07 12 >0.07 to 0.09 8 >0.09 to 0.13 4 >0.13 to 0.27 2 >0.27 to 0.53 1 >0.53 to 1.1
6 meals per year >1.1 to 2.2 Do Not Eat >2.2

Dioxin Exposure – Seveso, Italy • Background
– Non-occupational – Exposures to boys < 10 years old in 1976 – Exposure to boys 10 -17 years old in 1976
• Results in 1998 – Permanent effects – 22-31 yr (<10 yr old cohort):
• Decreased sperm concentration, • Decreased total motile sperm count, • Decreased concentration of estradiol • Increased concentration in follicle stimulating hormone
– 32-39 yr (10 -17 yr old cohort): • Increased total sperm count • Increased total motile sperm count • Increased concentration in follicle stimulating hormone • Decreased concentration of estradiol
Mocarelli et al. 2008 EHP 116:70-77

Mercury & Adult Cardiovascular Effects • Higher risk of hypertension (ages 44-75) (not
statistically significant) (Bautista et al. 2008 WI Med J 108: 250.)
• Increase in blood pressure and artery thickness –
Faroese whaling men (ages 30-70) (Choi et al. 2009 Environ Health Perspect 117: 367.)
• Higher toenail Hg levels, higher risk of myocardial
infarction - 8 countries, men less than 70 (cases = 684, controls = 724: European Multicenter Case-Control Study on Antioxidants, Myocardial Infarction and Cancer of the Breast) (Guallar et al. 2002 NEJM 347: 1747.)

Women who are pregnant or breastfeeding:
Consume 8 to 12 ounces of seafood per week from a variety of seafood types.
Due to their high methylmercury content, limit white (albacore) tuna to 6 ounces per week and do not eat the following four types of fish: tilefish, shark, swordfish, and king mackerel.
2010 DIETARY GUIDELINES USDA & DHHS

HEALTHY LIFESTYLE CHOICES
Goal: Good overall health throughout life
Strategies for the Individual: Eat a healthy diet
Regular exercise
Good mental health
Reduce risks leading to chronic diseases
Regular medical checkups

CHEMICAL CONTAMINANTS
Variety effects causing gene expression changes or altered cellular functions
Each of the chemicals causes
unique or overlapping
changes

OMEGA-3 & OMEGA-6 FATTY ACIDS
Omega-3 Omega-6
Related Documents