Michigan Behavioral Resource Manual Behavior Modification Report Calibration Assessment Draft Slides for Internal Discussion

Welcome message from author
This document is posted to help you gain knowledge. Please leave a comment to let me know what you think about it! Share it to your friends and learn new things together.
Transcript

Michigan Behavioral Resource Manual Behavior Modification Report Calibration Assessment
Draft Slides for Internal Discussion

Agenda
2
1 2 3
Background Realization Rates Calibration Needs Assessment

Background
3

• The Behavior Resource Manual (BRM) requires annual verification of behavior measures
• “Third-party evaluation teams will review verification results across Michigan utilities, comparing to BRM savings values, and complete a calibration needs assessment as part of the “Existing Measure Review and Calibration Process” outlined in the Michigan Energy Measure Database Overview and Maintenance Process Manual.”
• The 2019 BRM includes only one measure• Home Energy Reports
• Annual verification was completed in August 2019
Background
4

Realization Rates
5

Impact Evaluation Inputs
6
Estimated using same methodology as BRM
calibration
Customer Billing Analysis
Realization Rates
Uplift Savings Analysis
Estimate annual net savings per household (percentage, kWh, and MCF)
Compare net adjusted percentage savings to BRM; calculate realization rates
Estimate HER savings double-counted by other energy efficiency programs
Evaluated Net Adjusted Percentage Savings
The evaluation teams used the same methodology as the BRM to estimate net adjusted percentage savings
Evaluated net adjusted percentage savings*2018 BRM assumption of deemed percentage savings
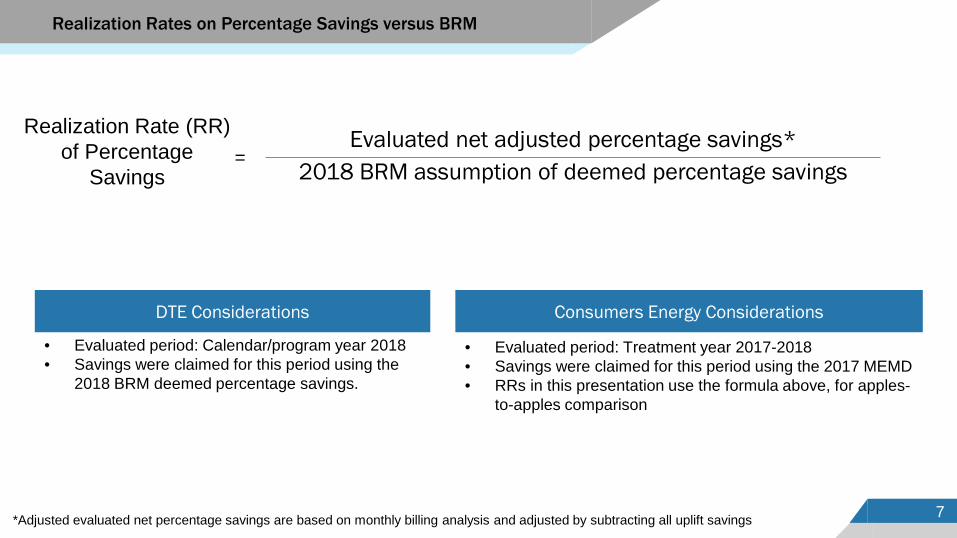
Realization Rates on Percentage Savings versus BRM
7
Consumers Energy ConsiderationsDTE Considerations
Realization Rate (RR) of Percentage
Savings
• Evaluated period: Treatment year 2017-2018• Savings were claimed for this period using the 2017 MEMD• RRs in this presentation use the formula above, for apples-
to-apples comparison
=
• Evaluated period: Calendar/program year 2018• Savings were claimed for this period using the
2018 BRM deemed percentage savings.
*Adjusted evaluated net percentage savings are based on monthly billing analysis and adjusted by subtracting all uplift savings

0.72
0.51
0.83
0.66
00.10.20.30.40.50.60.70.80.9
1
5,000-7,000 kWh 7,000-9,000 kWh 9,000-11,000 kWh >11,000 kWh
Real
izat
ion
Rate
BRM Electric Usage Band
DTE Energy Consumers Energy
Electric Realization Rates (2018)
8
2018 Electric Realization Rates by Usage Band
Realization rates of adjusted net percentage savings (evaluated) divided by 2018 BRM percentage savingsAdjusted evaluated net percentage savings are based on monthly billing analysis and adjusted by subtracting all uplift savings

1.32
0.74
0.24
0.65
0
0.2
0.4
0.6
0.8
1
1.2
1.4
900-1,200 Therms >1,200 Therms
Real
izat
ion
Rate
BRM Gas Usage Band
DTE Energy Consumers Energy
Gas Realization Rates (2018)
9
2018 Gas Realization Rates by Usage Band
Realization rates of adjusted net percentage savings (evaluated) divided by 2018 BRM percentage savings assumption,Adjusted evaluated net percentage savings are based on monthly billing analysis and adjusted by subtracting all uplift savings

Realization Rate Summary
10
DTE Energy (Calendar Year 2018)
Consumers Energy (Treatment Year 2017-2018)
Electric 73% 66%
Natural Gas 91% 31%
Realization rates of adjusted net percentage savings (evaluated) divided by 2018 BRM percentage savings assumption,Adjusted evaluated net percentage savings are based on monthly billing analysis and adjusted by subtracting all uplift savings
Weighted Average Realization Rates

DTE Realization Rates by Program Track
11
0.691.02
0.470.69
0.540.69
1.16
0.160.000.200.400.600.801.001.201.40
Electric
Gas 0.93 0.970.43
1.54
0.781.21 1.13
0.340.000.501.001.502.00
*Cohort names follow this structure: YYYYMM_FuelType. E.g., 201309_D is a dual fuel wave launched in September of 2013.
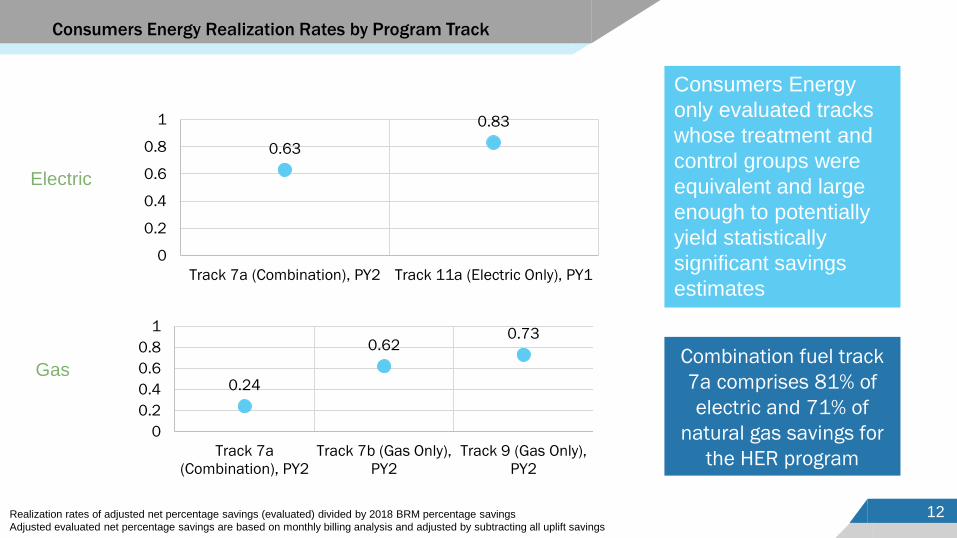
Consumers Energy Realization Rates by Program Track
12
Electric
Gas
0.63
0.83
0
0.2
0.4
0.6
0.8
1
Track 7a (Combination), PY2 Track 11a (Electric Only), PY1
0.24
0.620.73
00.20.40.60.8
1
Track 7a(Combination), PY2
Track 7b (Gas Only),PY2
Track 9 (Gas Only),PY2
Combination fuel track 7a comprises 81% of electric and 71% of
natural gas savings for the HER program
Consumers Energy only evaluated tracks whose treatment and control groups were equivalent and large enough to potentially yield statistically significant savings estimates
Realization rates of adjusted net percentage savings (evaluated) divided by 2018 BRM percentage savingsAdjusted evaluated net percentage savings are based on monthly billing analysis and adjusted by subtracting all uplift savings

Program Design Context
13

Behavioral Whitepaper Definition of HER Program
14
4. Measure Specification
Behavior Modification Reports are a tool that can be deployed to residential customers to drive a behavioral change to reduce home energy consumption. Key information includes:
1. Comparison of the customer’s home energy use to neighbors’ energy usage
2. An energy consumption grade
3. Comparison of the current period’s energy usage with a past period’s use and comments on increased or decreased energy utilization
a. Typically, this compares the current month or quarter with the same month or quarter from the prior year.
4. Suggested actions the customer can take to improve energy efficiency including some low or no cost ideas, as well as higher impact ideas that may require capital expenses
In addition, the program must have a simple opt-out process.
3. Measure Description
The Home Energy Reports program provides residential households accurate and timely information on their energy consumption through a variety of communication methods to change the consumers’ energy usage behavior.
The Home Energy Reports program is organized around two concepts. First, motivate consumers through normative messaging to change their energy-use behavior. Personalized neighbor comparisons based on the size of the home, location, and heating fuel type—among other criteria—give households a motivational benchmark for their energy usage. Second, provide them with salient, personalized advice to capitalize on this motivation to use less energy and save money.
Home Energy Reports are delivered through direct mail and are often supplemented with digital communications such as email, the web, mobile phones, and social networks. This platform approach ensures that all households can access this information in the most effective way.

DTE• Over time implementation has changed
such that fewer print and email reports are being sent (e.g., average of 6-9 print reports and 12 email reports in 2014, down to 3-5 print reports and 10 email reports in 2018).
Consumers Energy• Reduction in print report frequency over time:
About 6 print reports/year through 2014; about 4 per year from 2015-2019.
• Bimonthly eHERs discontinued in 2017 (delivered through 2016; resumed in mid-2019).
• Change in implementer and report design: Report design (layout, charts, look and feel) changed for the 2017 and 2018 program years.
Realization Rates: Context
15
Changes in program design since HER savings assumptions were last calibrated (i.e., pre-2016 program data)
Both programs have been in compliance with the MEMD Whitepaper measure definition for the life of the HER program (2011-2019)

Consumers Energy Print HER Program Changes
16
Reports redesigned for 2018
Earliest HER track launched in 2011; other early tracks roll out in 2012-2013.
Reports resume, to focus on areas low satisfaction
Several early program tracks (1-4) discontinued
Largest HER track (7a) launches in March.
Change in Implementer (to ICF). Reports redesigned & launched in March
Higher report frequency (~6 reports/yr) Lower report frequency (~4 reports/yr)
Bi-monthly eHER for Print Report recipients (w/ email addresses) No supplemental eHER
2011 2012 2013 2014 2015 2016 2017 2018 2019 2020
eHER
New Implementer & design
16

Program updates for 2020 should deliver higher savings and real-time performance monitoring.
eHER integration (monthly or bimonthly): Implementer proposed monthly eHERs, following the first print report. This is an improvement over 2017-2018 (no eHERs from 2017 through mid 2019)
Well-tested report design: The program will use implementer’s off-the-shelf template that’s been tested across the country.
Combined feedback for Combination customers: Combination-fuel customers will see information for both fuels on all reports. The 2017-2019 reports alternated fuel information (two reports per year with electric information and two with gas information).
Considering discontinuing underperforming tracks: May discontinue tracks that began in 2016 that have been exposed to multiple report designs (including track 7a with lowest realization rates)
Quarterly savings estimates: Implementer will provide quarterly performance estimates starting in summer 2020.
Print HER frequency (# reports/year) will not change: Still 4 per year, likely launching in March
Consumers Energy Program Changes for 2020
17

Calibration Needs Assessment
18

• Measures, including those in the BRM, are prioritized for calibration research based on four key criteria:
Calibration Needs Assessment
Expected contribution to stakeholder portfolio savings estimates (i.e., a large
share of current or future planned savings)
Savings calculation uncertainty
Expected data availability and timing (from updated codes, ongoing studies,
etc.)
Length of time since the last modification, review, or calibration
activity for a given measure
19
• Based on these four criteria, the HER program shows a need for calibration• However, planned 2020 program design changes mean immediate calibration would produce
estimates that do not reflect the program design when calibration is complete
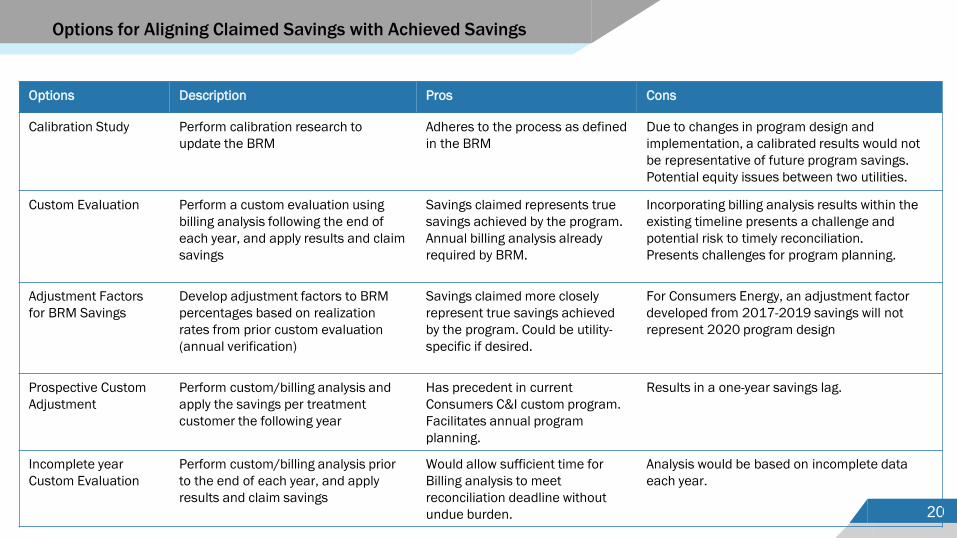
Options for Aligning Claimed Savings with Achieved Savings
20
Options Description Pros Cons
Calibration Study Perform calibration research to update the BRM
Adheres to the process as defined in the BRM
Due to changes in program design and implementation, a calibrated results would not be representative of future program savings. Potential equity issues between two utilities.
Custom Evaluation Perform a custom evaluation using billing analysis following the end of each year, and apply results and claim savings
Savings claimed represents true savings achieved by the program. Annual billing analysis already required by BRM.
Incorporating billing analysis results within the existing timeline presents a challenge and potential risk to timely reconciliation. Presents challenges for program planning.
Adjustment Factors for BRM Savings
Develop adjustment factors to BRM percentages based on realization rates from prior custom evaluation (annual verification)
Savings claimed more closely represent true savings achieved by the program. Could be utility-specific if desired.
For Consumers Energy, an adjustment factor developed from 2017-2019 savings will not represent 2020 program design
Prospective Custom Adjustment
Perform custom/billing analysis and apply the savings per treatment customer the following year
Has precedent in current Consumers C&I custom program. Facilitates annual program planning.
Results in a one-year savings lag.
Incomplete year Custom Evaluation
Perform custom/billing analysis prior to the end of each year, and apply results and claim savings
Would allow sufficient time for Billing analysis to meet reconciliation deadline without undue burden.
Analysis would be based on incomplete data each year.

Illustration of Prospective Custom Adjustment Process
21
Evaluation Analysis of Period 1
Claim savings for 2020 using “Period 1” results
Evaluation results available
Program Treatment Period 1 (12 months)
2019 2020 2021
Program Treatment Period 2(12 months)
Program Treatment Period 2(12 months)
Evaluation Analysis of Period 2
Evaluation results available
Claim savings for 2021 using “Period 2” results
• Few other states use deemed savings values• Other approaches:
• Annual evaluation* where programs wait to claim savings until evaluation results are ready (~6-12 month lag)
• Annual evaluation* where the previous year’s realization rate is applied to current-year results (RR calculated as evaluated to implementer-provided savings and applied to implementer-provided savings results)
• Use only implementer-provided values (after evaluators confirm stability/accuracy of implementer estimates)
What do other states do?
22*Some states may perform biannual evaluation and use realization rates from prior years in the evaluation “off-years”

Appendix ADetailed Realization Rates
23

AppendixRealization Rates by BRM Usage Bands: DTE Energy
24
BRMUsage Band
Deemed Savings1
Custom Estimates of
Savings1
Realization Rate
> 11000 kWh NA NA NA
9000-11000 kWh 2.09% 1.72% 0.83
7000-9000 kWh 2.03% 1.05% 0.51
5000-7000 kWh 0.74% 0.53% 0.72
BRM Usage Band
Deemed Savings1
Custom Estimates of
Savings1
Realization Rate
>1200 Therms 0.58% 0.77% 1.32
900-1200 Therms 0.67% 0.50% 0.74
Electric Realization Rates Gas Realization Rates
1. Deemed and Custom Savings are a weighted average of cohort-specific savings, weighted by the number of active participants in each cohort.

AppendixRealization Rates by BRM Usage Bands: DTE Energy
25
Cohort BRM Usage Band (kWh) Nth Year Deemed
Savings
Custom Estimates
of Savings1
Realization Rate
201309_D 9000-11000 6 2.12% 1.46% 0.69
201309_E_Reduced 9000-11000 6 2.12% 2.16% 1.02
201401_blended 7000-9000 5 2.01% 0.95% 0.47
201504_D 7000-9000 4 2.27% 1.56% 0.69
201602_D 9000-11000 3 1.77% 0.95% 0.54
201606_D 7000-9000 3 1.82% 1.25% 0.69
201710_D 5000-7000 2 0.77% 0.89% 1.16
201803_D 5000-7000 1 0.70% 0.11% 0.16
CohortBRM Usage
Band (Therms)
Nth Year Deemed Savings
Custom Estimates
of Savings1
Realization Rate
201309_D 900-1200 6 0.73% 0.68% 0.93
201401_D 900-1200 5 0.69% 0.67% 0.97
201602_D 900-1200 3 0.91% 0.39% 0.43
201602_G >1200 3 0.57% 0.88% 1.54
201606_D 900-1200 3 0.91% 0.71% 0.78
201610_G >1200 3 0.57% 0.69% 1.21
201710_D >1200 2 0.60% 0.68% 1.13
201710_G 900-1200 2 0.53% 0.18% 0.34
Electric Realization Rates Gas Realization Rates
1. Custom estimates of savings are based on regression analysis of HER recipient and control customers billing data.

AppendixRealization Rates by BRM Usage Bands: Consumers Energy
26
BRMUsage Band
Deemed Savings1
Custom Estimates of
Savings2
Realization Rate3
> 11000 kWh N/A
9000-11000 kWh 1.45% 0.95% 66%
7000-9000 kWh N/A
5000-7000 kWh N/A
BRM Usage Band
Deemed Savings1
Custom Estimates of
Savings2
Realization Rate3
>1200 Therms 0.60% 0.39% 65%
900-1200 Therms 0.53% 0.13% 24%
Electric Realization Rates Gas Realization Rates
1. Deemed and Custom Savings are a weighted average of cohort-specific savings, weighted by the number of active participants in each cohort.2. Custom estimates of savings are based on regression analysis of HER recipient and control customers billing data, and are adjusted for uplift savings3. Realization rates compare adjusted net percentage savings for the 2017-2018 program period with BRM percentage assumptions. These RRs differ
from what is Consumers Energy’s Final HER Program Evaluation Report for 2017-2018 because savings were claimed using 2017 MEMD assumptions.

Electric Realization Rates
Gas Realization Rates
AppendixRealization Rates by Track: Consumers Energy
27
Cohort BRM Usage Band Nth Year Deemed
Savings1
Custom Estimates of
Savings2
Realization Rate3
Track 7a (Combination) 9000-11000 2nd 1.52% 0.96% 63%
Track 11a (Electric Only) 9000-11000 1st 1.08% 0.90% 83%
Cohort BRM Usage Band Nth Year Deemed
Savings1
Custom Estimates of
Savings2
Realization Rate3
Track 7a (Combination) 900-1200 2nd 0.53% 0.13% 24%
Track 7b (Gas Only) >1200 2nd 0.60% 0.37% 62%
Track 9 (Gas Only) >1200 2nd 0.60% 0.44% 73%
1. Deemed and Custom Savings are a weighted average of cohort-specific savings, weighted by the number of active participants in each cohort.2. Custom estimates of savings are based on regression analysis of HER recipient and control customers billing data, and are adjusted for uplift savings3. Realization rates compare adjusted net percentage savings for the 2017-2018 program period with BRM percentage assumptions. These RRs differ
from what is Consumers Energy’s Final HER Program Evaluation Report for 2017-2018 because savings were claimed using 2017 MEMD assumptions.

Appendix BUplift Savings: Consumers Energy
28

Consumers Energy Uplift Savings
29
Electric uplift savings, as a percentage of evaluated net savings, are within the expected range
Uplift savings for natural gas-only tracks are within expected range, while track 7a uplift savings look high due to low evaluated savings (small denominator)
TrackSavings Estimate
Program Year
Evaluated Net Savings per Household
Evaluated Net Savings per
Household (kWh or MCF;
prorated)a
Uplift Savings per Household (kWh
or MCF; prorated)b
Uplift Savings as Percentage of Evaluated Net
Savings
Electric Savings
7aPY1 0.58% 53.3 1.7 3%PY2 1.02% 84.4 4.7 6%
11a PY1 0.93% 78.8 2.7 3%Natural Gas Savings
7aPY1 0.07% 0.06 0.03 54%PY2 0.25% 0.22 0.11 48%
7bPY1 0.48% 0.85 0.01 2%PY2 0.37% 0.61 -0.03 0%
9PY1 0.43% 0.66 0.05 8%PY2 0.49% 0.82 0.08 10%
a The average annual net savings per household were prorated for the portion of the year that each customer was treated by the HER program, which may be less than 365 days due to account attrition (account closures and supplier choice) and to customer eligibility screening that occurred when the program implementer changed in 2017. b Joint (uplift) savings per household were adjusted to account for the portion of the year that downstream program measures were installed in each customer’s home. For example, if a measure was installed halfway through the program year, only half of annual deemed savings for that measure were applied to this analysis.

Consumers Energy Uplift Savings
30
TrackSavings
Estimate Program Year
Claimed Savings (MWh
or MCF)
Unadjusted Results (before Cross-Participation Analysis)
Adjusted Results (after Cross-Participation Analysis)
Evaluated Net Savings (MWh
or MCF)
Realization Rate on Total
Energy Savings*
Adjusted Net Savings (MWh
or MCF)
Realization Rate on Adjusted
Energy Savings*
Electric Savings (MWh)
7aPY1 26,959 14,934 55% 14,459 54%PY2 36,357 21,104 58% 19,923 55%
11a PY1 4,819 3,645 76% 3,521 73%Natural Gas Savings (MCF)
7aPY1 151,741 15,743 10% 7,160 5%PY2 150,674 54,843 36% 28,466 19%
7bPY1 34,141 25,539 75% 25,003 73%PY2 29,296 16,794 57% 16,794 57%
9PY1 10,897 10,187 93% 9,372 86%PY2 13,626 9,942 73% 8,913 65%
Highlighted rows contain findings for the 2017 to 2018 program period (billing analysis results reported in this evaluation). For other rows, findings from the 2016 to 2017 billing analysis (unadjusted savings) were reported in the prior evaluation, but cross-participation analysis is first reported in this evaluation.
With the exception of natural gas savings for Track 7a, uplift savings have a small effect on net adjusted savings
*Realization rates in this chart are DIFFERENT from the rest of this presentation because they are based on claimed savings (which used the MEMD), and total savings versus percentage savings (introducing other small differences)
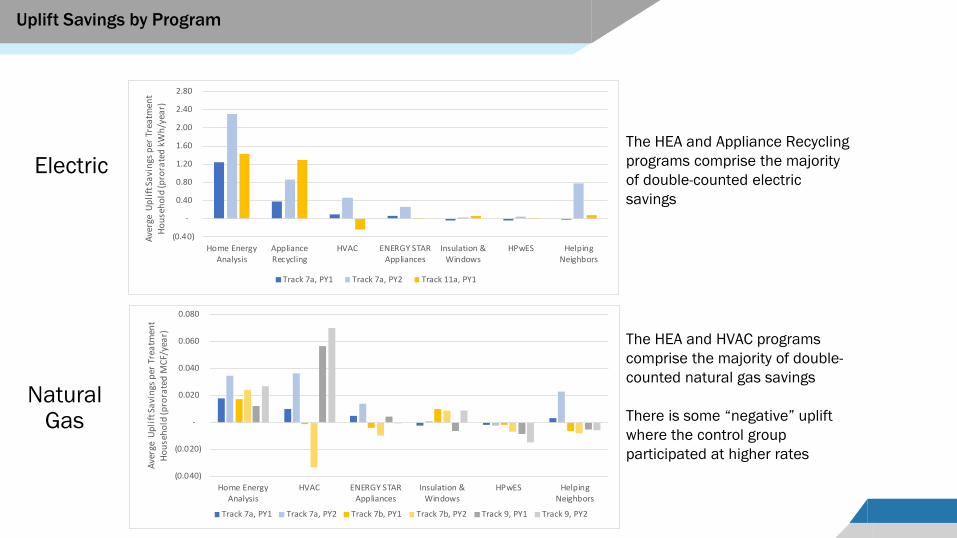
Uplift Savings by Program
31
The HEA and Appliance Recycling programs comprise the majority of double-counted electric savings
The HEA and HVAC programs comprise the majority of double-counted natural gas savings
There is some “negative” uplift where the control group participated at higher rates
(0.40)
-
0.40
0.80
1.20
1.60
2.00
2.40
2.80
Home EnergyAnalysis
ApplianceRecycling
HVAC ENERGY STARAppliances
Insulation &Windows
HPwES HelpingNeighbors
Aver
ge U
plift
Savi
ngs p
er T
reat
men
t Ho
useh
old
(pro
rate
d kW
h/ye
ar)
Track 7a, PY1 Track 7a, PY2 Track 11a, PY1
(0.040)
(0.020)
-
0.020
0.040
0.060
0.080
Home EnergyAnalysis
HVAC ENERGY STARAppliances
Insulation &Windows
HPwES HelpingNeighbors
Aver
ge U
plift
Savi
ngs p
er T
reat
men
t Ho
useh
old
(pro
rate
d M
CF/y
ear)
Track 7a, PY1 Track 7a, PY2 Track 7b, PY1 Track 7b, PY2 Track 9, PY1 Track 9, PY2
Electric
Natural Gas

• The 2019 HER customer survey revealed no differences in self-reported efficient lighting uptake between treatment and control (see figures below)
• Several utilities have attempted to estimate upstream lighting uplift savings and found small (but still possible) double-counted savings from upstream lighting (Source: Tetra Tech. May 26, 2017. Residential Behavioral Program Impact and Process Evaluation. Prepared for MidAmerican Energy Company.)
What about Upstream Lighting?
32
Upstream lighting savings are not included in joint (uplift) savings estimates since purchasers are not tracked at the account level
75% 74%
0%
25%
50%
75%
100%
Control(n=252)
Treatment(n=518)
Purchased Any Lighting in Past 12 Months (Self-Reported)
Source: 2019 HER Customer Survey. “Please indicate whether you completed any of the following home projects in the last 12 months.” Response option 1 was “Purchased or installed new light bulbs.”
84%
9% 15% 23%
83%
7% 15% 27%
0%25%50%75%
100%
LED Bulbs CFL Bulbs HalogenBulbs
IncandescentBulbs
Control (n=190) Treatment (n=385)
Types of Bulbs Purchased in Past 12 Months (Self-Reported)
Source: 2019 HER Customer Survey. “What type of light bulb(s) did you purchase or install?”
Related Documents