Operational Performance Opportunities and Challenges Michael Skelton Research and Knowledge Manager, Australia New Zealand

Welcome message from author
This document is posted to help you gain knowledge. Please leave a comment to let me know what you think about it! Share it to your friends and learn new things together.
Transcript

Operational PerformanceOpportunities and Challenges
Michael SkeltonResearch and Knowledge Manager,Australia New Zealand

Overview
• Understanding the Market Size
• What Return on Investment can be Achieved
• Capex vs Good Facility Management
• Drivers and Incentives
• Financial Implications of the ‘x’-factors

Electricity Price Projections
-5%
0%
5%
10%
15%
20%
-5%
0%
5%
10%
15%
20%
Annual Change
10 Year Average = 6%
Source: Adapted from ABS 6401.0 (Australian Electricity Index)
20 Year Average = 4%
Forecast

Comparative Commercial Sector Sizes
Tenant Drivers Differ Dramatically
Office41%
Shopping Centre
32%
Hotel27%
Total Market Size (m²)
Office 23,574,853 (NLA)
Shopping Centre 18,563,434 (GLAR)
Hotel 15,975,922 (GIFA)
Source: Property Council of Australia, Davis Langdon Research

Australian Property Investment Market
Source: RICS, Davis Langdon Research
Office, $92.00bn
Retail, $87.00bn
Industrial, $52.00bn

Victoria – Total Office Stock
CBD18%
Metropolitan65%
Regional17%
CBD46%
Metropolitan45%
Regional9%
Number of Buildings Area of Buildings

Lack of New Office Stock
Source: Construction Forecasting Council
New Office Construction Volumes

Australia’s Ageing Office Stock

Recent Studies

CBD Tower Level 1 Level 2 Level 3
NPV of Investment -$19,000,000 -$15,000,000 $7,000,000
IRR of Investment 4.2% 5.1% 10.0%
Fringe High Rise
NPV of Investment -$11,700,000 -$2,650,000 $4,200,000
IRR of Investment 5.4% 9.2% 11.2%
Suburban Office
NPV of Investment -$1,900,000 -$1,000,000 $200,000
IRR of Investment 3.4% 7.7% 10.9%
Improvement Asset Study

Heating/Cooling24%
Elec Reheat0%
Heating Gas3%
AHUs25%
Pumps in Plant Room2%
Carpark Fans4%
Carpark Lights5%
Lifts11%
Foyer lighting1%
Toilet, stairs and plant room lighting
5%
Outside Lighting5%
MechExhaust
7%
Tenant condenser water loop and cooling tower fans
2%
Hydraulic Servicing2%
Domestic Hot Water
Distribution of Base Building Energy Use
$
$
$
$

Typical Capital Cost Step Change
Base Building Office – Capital cost and emissions savings
$0$100$200$300$400$500$600$700$800$900$1,000
050
100150200250300350400450500
2.0 Star 2.5 Star 3.0 Star 3.5 Star 4.0 Star 4.5 Star 5.0 Star
Cost Range GHG Saving (LHS) Mean Cost (RHS)Source: Davis Langdon Research
BaselinekgCO2/m2 $/m2
Step 1 Step 2 Step 3 Step 4 Step 5 Step 6

Avoiding Obsolescence
Source: Davis Langdon Research
Vacancy Rate Sensitivity on Net Present Value

Reducing Base Building Energy Outgoings

However - ‘Typical’ Doesn’t Really Exist
Impact of existing condition – 1.5 to 4.5 Star Upgrade
Low Capex Required – Well Maintained
Building NLA 10,000 sq. m
Building Age 15 years
Base Building (Existing) 1.5 Star NABERS Energy
Base Building (Upgraded) 4.5 Star NABERS Energy
Green Power Included Yes (1 Star)
Total Capex $1,111,320
GHG Savings (Actual) 1,012 tonnesCO2/year
Equivalent Passenger Vehicles
166
Building Class B-Grade
0
200
400
600
800
1,000
1,200
0.0
20.0
40.0
60.0
80.0
100.0
120.0
1.5 to 4.5 StarGreen PowerEnergy Efficiency
tonnesCO2kgCO2/m²
Per Year High Capex Required – Poorly Maintained
Building NLA 10,000 sq. m
Building Age 15 years
Base Building (Existing) 1.5 Star NABERS Energy
Base Building (Upgraded) 4.5 Star NABERS Energy
Green Power Included Yes (1 Star)
Total Capex $4,358,400
GHG Savings (Actual) 1,012 tonnesCO2/year
Equivalent Passenger Vehicles
166
Building Class B-Grade

Energy Efficiency Drivers in the Office Market

Government Leased Area
0
5,000,000
10,000,000
15,000,000
20,000,000
25,000,000
NLA
Other
State and Territory (Leased)
Commonwealth Government (Leased)
26% Government Leased
Source: Government Property Group, Davis Langdon Research

What can we achieve? Existing Buildings are the Key!
Source: Adapted from AGO 1999 & DEWHA 2009, Davis Langdon Research
0
5
10
15
20
25
Emissons (Mt of CO2-e per annum)
Total GHG from Office Sub-Sector
Estimated Trajectory if 20% of Existing Buildings <2.5 Star upgraded to 4.5 Star
Forecast
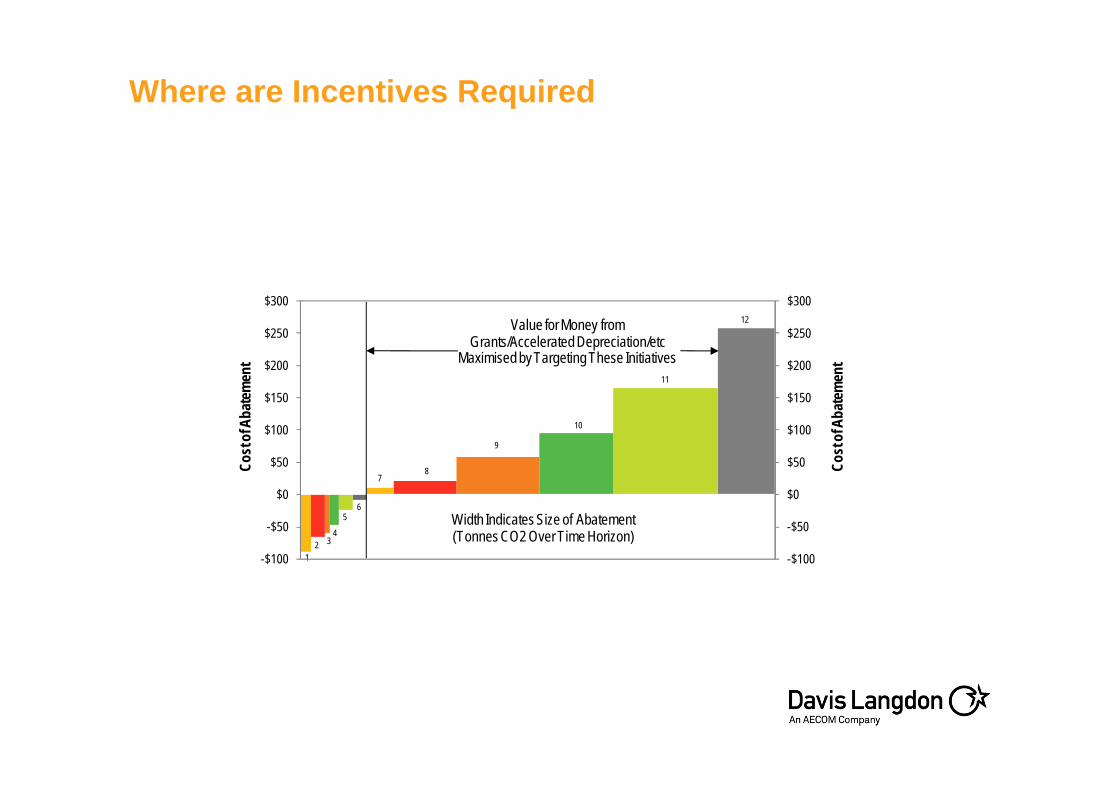
Where are Incentives Required
1
4
65
Larger Incentives RequiredHigh CO2 AbatementHigh Cost of AbatementLow Level of Industry Investment without Grants/Green Depreciation(Investment and Awareness of Cost to Industry should be Focussed Here)
Minimal Incentives RequiredLow CO2 AbatementNegative Cost of AbatementHigher Levels of Industry Investment(Government and Industry Commentators Focus Too Much on These Figures)
-$100
-$50
$0
$50
$100
$150
$200
$250
$300
-$100
-$50
$0
$50
$100
$150
$200
$250
$300
Width Indicates Size of Abatement(Tonnes CO2 Over Time Horizon)
2 3
78
10
9
11
12
Cost
of A
bate
men
t
Cost
of A
bate
men
t
Value for Money from Grants/Accelerated Depreciation/etc
Maximised by Targeting These Initiatives
Incentives – What Currently Exists...
• Green Building Fund
• Low Carbon Australia (Carbon Trust)
• Tax Breaks for Green Buildings
• City of Melbourne, 1200 Buildings Project
• Sustainable Melbourne Fund
• Victoria Energy Efficiency Target

Human Resources
the Biggest Incentive!
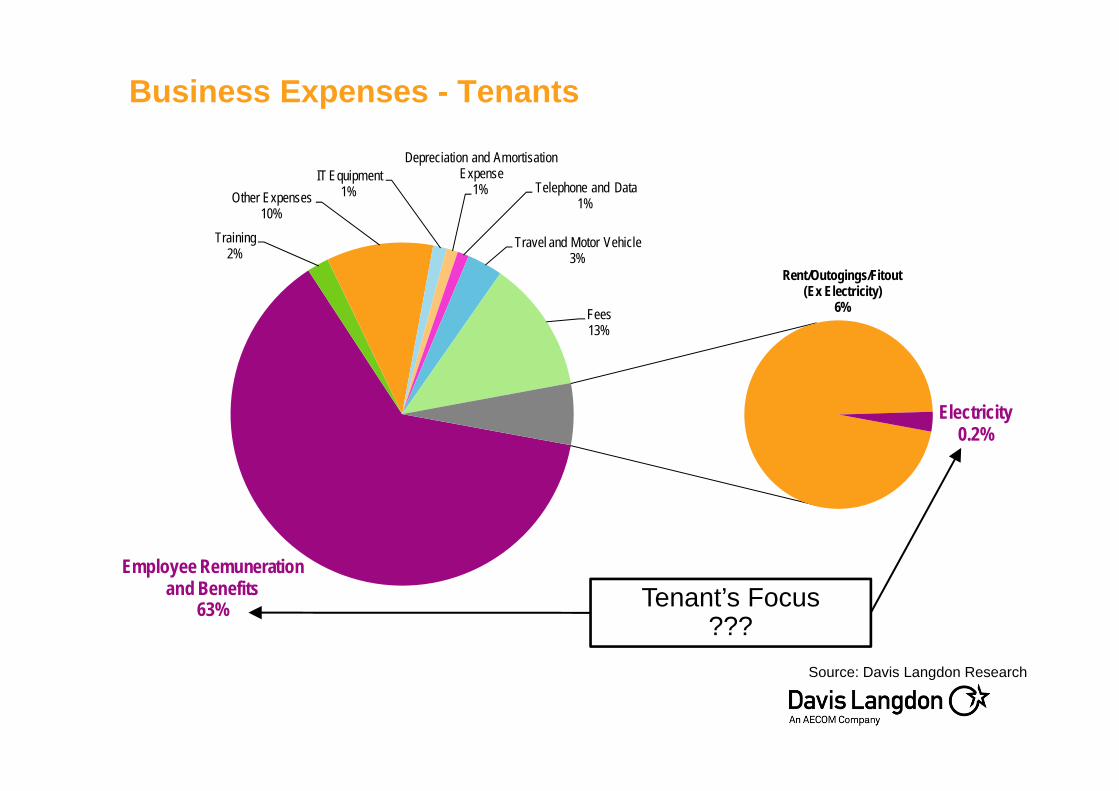
Employee Remuneration and Benefits
63%
Training 2%
Other Expenses10%
IT Equipment1%
Depreciation and Amortisation Expense
1% Telephone and Data1%
Travel and Motor Vehicle3%
Fees13%
Rent/Outogings/Fitout(Ex Electricity)
6%
Electricity0.2%
Business Expenses - Tenants
Tenant’s Focus ???
Source: Davis Langdon Research
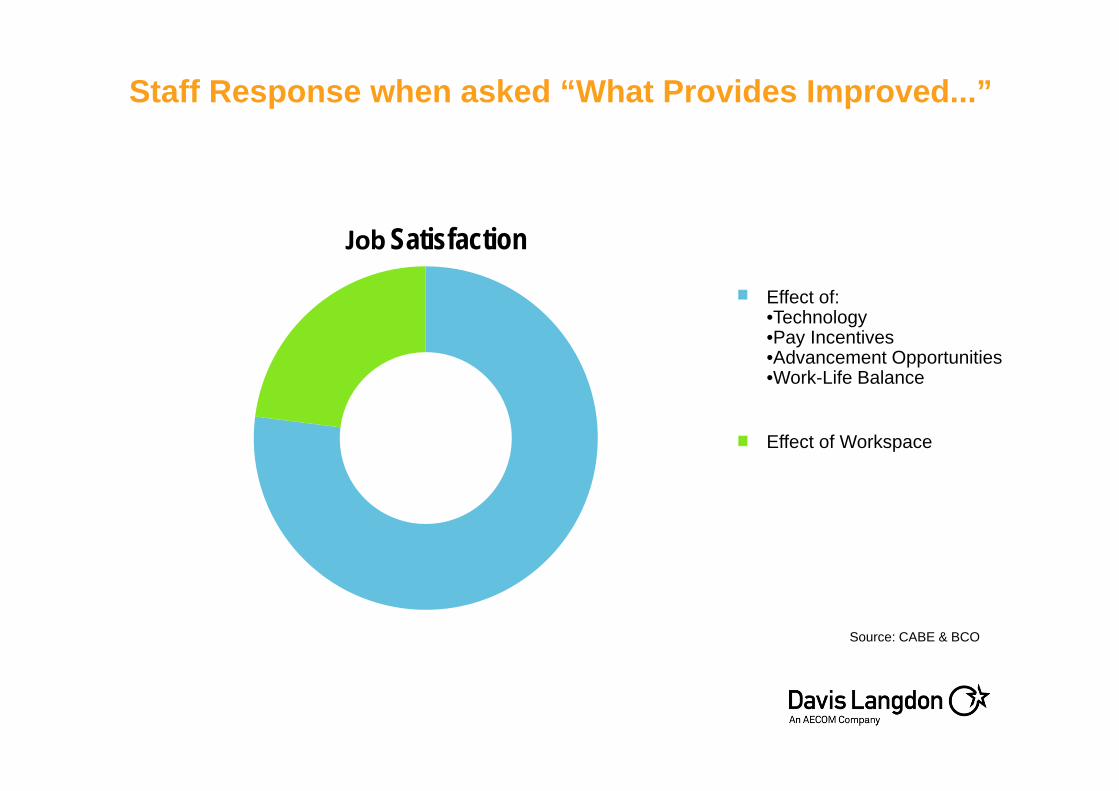
Staff Response when asked “What Provides Improved...”
Source: CABE & BCO
Job Satisfaction
Effect of Workspace
Effect of:•Technology•Pay Incentives•Advancement Opportunities•Work-Life Balance

Environmental Drivers
Embodied Energy and Water

Embodied CarbonCase Study – Educational Facility and Hospital Building
Source: Davis Langdon
Related Documents