2013 Microchip Technology Inc. DS40001681C MGC3130 Aurea Graphical User Interface User’s Guide

Welcome message from author
This document is posted to help you gain knowledge. Please leave a comment to let me know what you think about it! Share it to your friends and learn new things together.
Transcript
2013 Microchip Technology Inc. DS40001681C
MGC3130 AureaGraphical User Interface
User’s Guide
DS40001681C-page 2 2013 Microchip Technology Inc.
Information contained in this publication regarding deviceapplications and the like is provided only for your convenienceand may be superseded by updates. It is your responsibility toensure that your application meets with your specifications.MICROCHIP MAKES NO REPRESENTATIONS ORWARRANTIES OF ANY KIND WHETHER EXPRESS ORIMPLIED, WRITTEN OR ORAL, STATUTORY OROTHERWISE, RELATED TO THE INFORMATION,INCLUDING BUT NOT LIMITED TO ITS CONDITION,QUALITY, PERFORMANCE, MERCHANTABILITY ORFITNESS FOR PURPOSE. Microchip disclaims all liabilityarising from this information and its use. Use of Microchipdevices in life support and/or safety applications is entirely atthe buyer’s risk, and the buyer agrees to defend, indemnify andhold harmless Microchip from any and all damages, claims,suits, or expenses resulting from such use. No licenses areconveyed, implicitly or otherwise, under any Microchipintellectual property rights.
Note the following details of the code protection feature on Microchip devices:• Microchip products meet the specification contained in their particular Microchip Data Sheet.
• Microchip believes that its family of products is one of the most secure families of its kind on the market today, when used in the intended manner and under normal conditions.
• There are dishonest and possibly illegal methods used to breach the code protection feature. All of these methods, to our knowledge, require using the Microchip products in a manner outside the operating specifications contained in Microchip’s Data Sheets. Most likely, the person doing so is engaged in theft of intellectual property.
• Microchip is willing to work with the customer who is concerned about the integrity of their code.
• Neither Microchip nor any other semiconductor manufacturer can guarantee the security of their code. Code protection does not mean that we are guaranteeing the product as “unbreakable.”
Code protection is constantly evolving. We at Microchip are committed to continuously improving the code protection features of ourproducts. Attempts to break Microchip’s code protection feature may be a violation of the Digital Millennium Copyright Act. If such actsallow unauthorized access to your software or other copyrighted work, you may have a right to sue for relief under that Act.
Microchip received ISO/TS-16949:2009 certification for its worldwide headquarters, design and wafer fabrication facilities in Chandler and Tempe, Arizona; Gresham, Oregon and design centers in California and India. The Company’s quality system processes and procedures are for its PIC® MCUs and dsPIC® DSCs, KEELOQ® code hopping devices, Serial EEPROMs, microperipherals, nonvolatile memory and analog products. In addition, Microchip’s quality system for the design and manufacture of development systems is ISO 9001:2000 certified.
QUALITY MANAGEMENT SYSTEM CERTIFIED BY DNV
== ISO/TS 16949 ==
Trademarks
The Microchip name and logo, the Microchip logo, dsPIC, FlashFlex, KEELOQ, KEELOQ logo, MPLAB, PIC, PICmicro, PICSTART, PIC32 logo, rfPIC, SST, SST Logo, SuperFlash and UNI/O are registered trademarks of Microchip Technology Incorporated in the U.S.A. and other countries.
FilterLab, Hampshire, HI-TECH C, Linear Active Thermistor, MTP, SEEVAL and The Embedded Control Solutions Company are registered trademarks of Microchip Technology Incorporated in the U.S.A.
Silicon Storage Technology is a registered trademark of Microchip Technology Inc. in other countries.
Analog-for-the-Digital Age, Application Maestro, BodyCom, chipKIT, chipKIT logo, CodeGuard, dsPICDEM, dsPICDEM.net, dsPICworks, dsSPEAK, ECAN, ECONOMONITOR, FanSense, HI-TIDE, In-Circuit Serial Programming, ICSP, Mindi, MiWi, MPASM, MPF, MPLAB Certified logo, MPLIB, MPLINK, mTouch, Omniscient Code Generation, PICC, PICC-18, PICDEM, PICDEM.net, PICkit, PICtail, REAL ICE, rfLAB, Select Mode, SQI, Serial Quad I/O, Total Endurance, TSHARC, UniWinDriver, WiperLock, ZENA and Z-Scale are trademarks of Microchip Technology Incorporated in the U.S.A. and other countries.
SQTP is a service mark of Microchip Technology Incorporated in the U.S.A.
GestIC and ULPP are registered trademarks of Microchip Technology Germany II GmbH & Co. KG, a subsidiary of Microchip Technology Inc., in other countries.
All other trademarks mentioned herein are property of their respective companies.
© 2013, Microchip Technology Incorporated, Printed in the U.S.A., All Rights Reserved.
Printed on recycled paper.
ISBN: 9781620777022
MGC3130 AUREAGRAPHICAL USER INTERFACE
USER’S GUIDE
Table of Contents
Chapter 1. Overview1.1 Introduction ................................................................................................... 10
1.1.1 Install Aurea .............................................................................................. 101.1.2 Running Aurea .......................................................................................... 10
1.2 Aurea Graphical User Interface .................................................................... 111.2.1 Aurea Tabs ................................................................................................ 111.2.2 Real-Time Control .................................................................................... 121.2.3 Control Bar ................................................................................................ 131.2.4 Status Bar ................................................................................................. 14
Chapter 2. Aurea Tabs2.1 Colibri Suite ................................................................................................. 15
2.1.1 Colibri Suite Tab ........................................................................................ 152.1.1.1 XY and XYZ Position-Tracking Plots ......................................... 162.1.1.2 Signal Level ............................................................................... 172.1.1.3 History Logging .......................................................................... 172.1.1.4 Gesture Indication .................................................................... 17
2.1.2 Colibri Suite Real-Time Control ................................................................ 182.1.2.1 Gestures .................................................................................... 182.1.2.2 Applications ............................................................................... 212.1.2.3 Feature Control .......................................................................... 22
2.2 Signals .......................................................................................................... 232.2.1 Signals Visualization Tab .......................................................................... 232.2.2 Signals Real-Time Control ........................................................................ 24
2.2.2.1 Channels ................................................................................... 242.2.2.2 Levels ........................................................................................ 242.2.2.3 Autocalibration Check-Box ........................................................ 242.2.2.4 Approach Detection/Power-Saving Check-Box ......................... 252.2.2.5 Autozoom Check-Box ................................................................ 252.2.2.6 Signal Drop-down List ............................................................... 252.2.2.7 Automatic Frequency Hopping List ............................................ 252.2.2.8 Force Calibration Button ............................................................ 25
2.3 Setup ........................................................................................................... 262.3.1 Flash Library File ....................................................................................... 262.3.2 Colibri Parameterization ............................................................................ 28
2.3.2.1 Start New Parameterization ....................................................... 282.3.2.2 Load from File ............................................................................ 292.3.2.3 Parameterization Progress State ............................................... 302.3.2.4 Parameterization Navigation ..................................................... 302.3.2.5 Parameterization Options .......................................................... 312.3.2.6 Analog Front End (AFE) ............................................................ 322.3.2.7 System Start-up ......................................................................... 342.3.2.8 Position Tracking ....................................................................... 36
2013 Microchip Technology Inc. DS40001681C-page 3
Table of Contents
2.3.2.9 HMM Gesture Recognition ........................................................ 462.3.2.10 Approach Detection ................................................................. 502.3.2.11 Touch Detection ...................................................................... 512.3.2.12 AirWheel .................................................................................. 522.3.2.13 Noise Power ............................................................................ 542.3.2.14 Gesture Port ............................................................................ 552.3.2.15 Save Parameterization ............................................................ 57
2.3.3 Electrode Capacitance Measurement ....................................................... 582.3.3.1 Step 1: Initial Measurement (VRx) ............................................. 592.3.3.2 Step 2: Measurement with Auxiliary Capacitors (V’Rx) ............. 60
Chapter 3. Advanced Aurea Features3.1 Logging Sensor Data ................................................................................... 62
3.1.1 Record a Log File ...................................................................................... 623.1.2 Log File Content and Format .................................................................... 63
3.2 Sensitivity Profile Acquisition ........................................................................ 653.2.1 Sensor Calibration ..................................................................................... 653.2.2 Measurement ............................................................................................ 65
3.3 Sniffing Mode ............................................................................................... 663.3.1 Saleae ....................................................................................................... 673.3.2 Install Saleae ............................................................................................. 673.3.3 Saleae Hardware Connection ................................................................... 673.3.4 Running Aurea with Saleae ....................................................................... 67
Appendix A. Glossary
2013 Microchip Technology Inc. DS40001681C-page 4

MGC3130 AUREAGRAPHICAL USER INTERFACE
USER’S GUIDE
Preface
INTRODUCTIONThis chapter contains general information that will be useful to know before using the MGC3130 Aurea Graphical Interface. Items discussed in this chapter include:• Document Layout• Conventions Used in this Guide• Warranty Registration• Recommended Reading• The Microchip Web Site• Development Systems Customer Change Notification Service• Customer Support• Document Revision History
DOCUMENT LAYOUTThis document describes the installation and use of the MGC3130 Aurea Graphical Interface. Microchip’s Aurea is a Windows® based graphical user interface that can be used to demonstrate, evaluate and configure Microchip’s MGC3130 3D Tracking and Gesture Controller. The document is organized as follows:• Chapter 1. “Overview” • Chapter 2. “Aurea Tabs” • Chapter 3. “Advanced Aurea Features”• Appendix A. “Glossary”
NOTICE TO CUSTOMERS
All documentation becomes dated, and this manual is no exception. Microchip tools and documentation are constantly evolving to meet customer needs, so some actual dialogs and/or tool descriptions may differ from those in this document. Please refer to our web site (www.microchip.com) to obtain the latest documentation available.
Documents are identified with a “DS” number. This number is located on the bottom of each page, in front of the page number. The numbering convention for the DS number is “DSXXXXXA”, where “XXXXX” is the document number and “A” is the revision level of the document.
For the most up-to-date information on development tools, see the MPLAB IDE online help. Select the Help menu, and then Topics to open a list of available online help files.
2013 Microchip Technology Inc. DS40001681C-page 5
MGC3130 Aurea Graphical User Interface User’s Guide
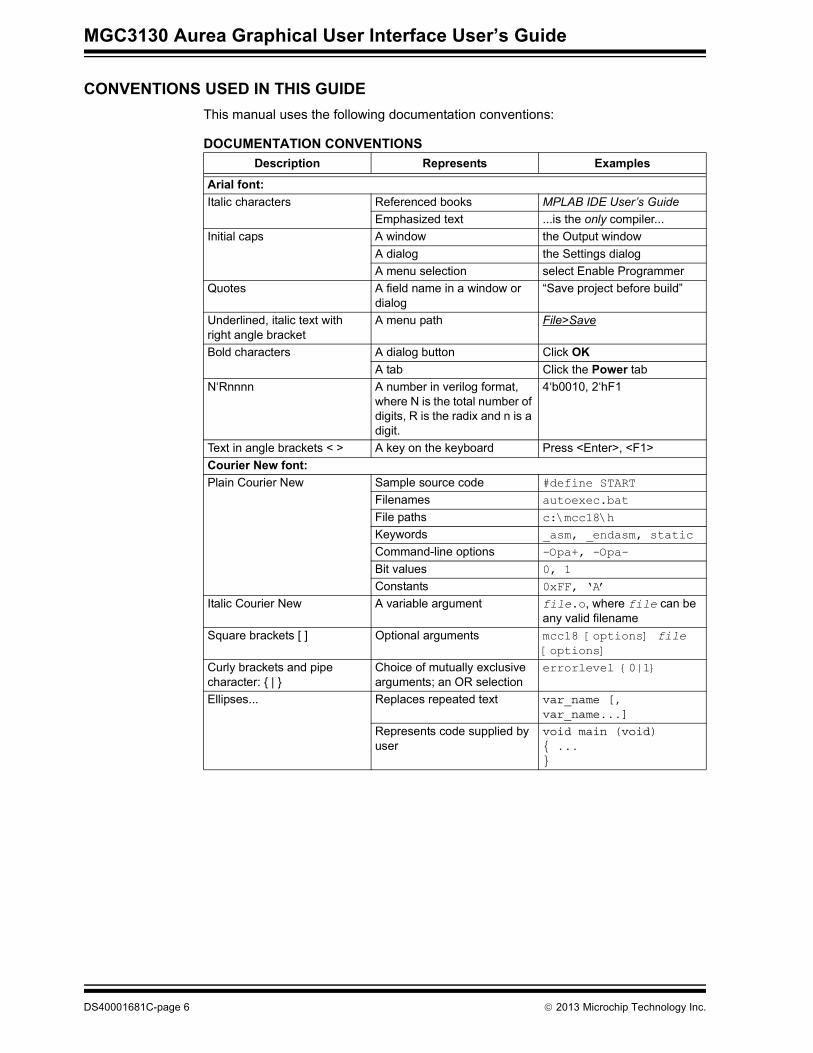
CONVENTIONS USED IN THIS GUIDEThis manual uses the following documentation conventions:
DOCUMENTATION CONVENTIONSDescription Represents Examples
Arial font:Italic characters Referenced books MPLAB IDE User’s Guide
Emphasized text ...is the only compiler...Initial caps A window the Output window
A dialog the Settings dialogA menu selection select Enable Programmer
Quotes A field name in a window or dialog
“Save project before build”
Underlined, italic text with right angle bracket
A menu path File>Save
Bold characters A dialog button Click OKA tab Click the Power tab
N‘Rnnnn A number in verilog format, where N is the total number of digits, R is the radix and n is a digit.
4‘b0010, 2‘hF1
Text in angle brackets < > A key on the keyboard Press <Enter>, <F1>Courier New font:Plain Courier New Sample source code #define START
Filenames autoexec.bat
File paths c:\mcc18\h
Keywords _asm, _endasm, static
Command-line options -Opa+, -Opa-
Bit values 0, 1
Constants 0xFF, ‘A’
Italic Courier New A variable argument file.o, where file can be any valid filename
Square brackets [ ] Optional arguments mcc18 [options] file [options]
Curly brackets and pipe character: { | }
Choice of mutually exclusive arguments; an OR selection
errorlevel {0|1}
Ellipses... Replaces repeated text var_name [, var_name...]
Represents code supplied by user
void main (void){ ...}
DS40001681C-page 6 2013 Microchip Technology Inc.
Preface
WARRANTY REGISTRATIONPlease complete the enclosed Warranty Registration Card and mail it promptly. Sending in the Warranty Registration Card entitles users to receive new product updates. Interim software releases are available at the Microchip web site.
RECOMMENDED READINGThis user’s guide describes how to use the MGC3130 Aurea Graphical User Interface. Other useful documents are listed below. The following Microchip documents are available and recommended as supplemental reference resources.• “MGC3130 Single-Zone 3D Gesture Controller Data Sheet” (DS40001667) –
Consult this document for information regarding the MGC3130 3D Tracking and Gesture Controller.
• “MGC3130 GestIC® Design Guide” (DS40001716) – This document describes the MGC3130 system characteristic parameters and the design process. It enables the user to generate a good electrode design and to parameterize the full GestIC® system.
• “MGC3130 GestIC® Library Interface Description User’s Guide” (DS40001718) – This document is the interface description of the MGC3130’s GestIC Library. It outlines the function of the Library’s message interface, and contains the complete message reference to control and operate the MGC3130 system.
• “MGC3130 Sabrewing Single Zone Evaluation Kit” (DS41685) – This document describes the Sabrewing Evaluation Kit demonstrating Microchip’s GestIC technology.
• “MGC3130 Hillstar Development Kit User’s Guide” (DS40001721) – This document describes the Hillstar Development Kit supporting an easy integration of Microchip’s MGC3130 3D Tracking and Gesture Controller into the user’s applications.
2013 Microchip Technology Inc. DS40001681C-page 7

MGC3130 Aurea Graphical User Interface User’s Guide
THE MICROCHIP WEB SITEMicrochip provides online support via our web site at www.microchip.com. This web site is used as a means to make files and information easily available to customers. Information about GestIC technology and MGC3130 can be directly accessed via www.microchip.com/gestic.
DEVELOPMENT SYSTEMS CUSTOMER CHANGE NOTIFICATION SERVICEMicrochip’s customer notification service helps keep customers current on Microchip products. Subscribers will receive e-mail notification whenever there are changes, updates, revisions or errata related to a specified product family or development tool of interest.To register, access the Microchip web site at www.microchip.com, click on Customer Change Notification and follow the registration instructions.The Development Systems product group categories are:• Compilers – The latest information on Microchip C compilers, assemblers, linkers
and other language tools. These include all MPLAB® C compilers; all MPLAB assemblers (including MPASM™ assembler); all MPLAB linkers (including MPLINK™ object linker); and all MPLAB librarians (including MPLIB™ object librarian).
• Emulators – The latest information on Microchip in-circuit emulators.This includes the MPLAB REAL ICE and MPLAB ICE 2000 in-circuit emulators.
• In-Circuit Debuggers – The latest information on the Microchip in-circuit debuggers. This includes MPLAB ICD 3 in-circuit debuggers and PICkit™ 3 debug express.
• MPLAB IDE – The latest information on Microchip MPLAB IDE, the Windows Integrated Development Environment for development systems tools. This list is focused on the MPLAB IDE, MPLAB IDE Project Manager, MPLAB Editor and MPLAB SIM simulator, as well as general editing and debugging features.
• Programmers – The latest information on Microchip programmers. These include production programmers such as MPLAB® REAL ICE™ in-circuit emulator, MPLAB ICD 3 in-circuit debugger and MPLAB PM3 device programmers. Also included are nonproduction development programmers such as PICSTART® Plus and PICkit 2 and 3.
DS40001681C-page 8 2013 Microchip Technology Inc.
Preface
CUSTOMER SUPPORTUsers of Microchip products can receive assistance through several channels:• Distributor or Representative• Local Sales Office• Field Application Engineer (FAE)• Technical SupportCustomers should contact their distributor, representative or field application engineer (FAE) for support. Local sales offices are also available to help customers. Technical support is available through the web site at: http://www.microchip.com/support.
SOFTWARE LICENSE INFORMATIONCopyright (C) 2013 Microchip Technology Inc. and its subsidiaries (“Microchip”). All rights reserved.You are permitted to use the Aurea software, MGC3130 Software Development Kit and other accompanying software with Microchip products. Refer to the license agreement accompanying this software, if any, for additional info regarding your rights and obligations.SOFTWARE AND DOCUMENTATION ARE PROVIDED “AS IS” WITHOUT WARRANTY OF ANY KIND, EITHER EXPRESS OR IMPLIED, INCLUDING WITHOUT LIMITATION, ANY WARRANTY OF MERCHANTABILITY, TITLE, NON-INFRINGEMENT AND FITNESS FOR A PARTICULAR PURPOSE. IN NO EVENT SHALL MICROCHIP, SMSC, OR ITS LICENSORS BE LIABLE OR OBLIGATED UNDER CONTRACT, NEGLIGENCE, STRICT LIABILITY, CONTRIBUTION, BREACH OF WARRANTY, OR OTHER LEGAL EQUITABLE THEORY FOR ANY DIRECT OR INDIRECT DAMAGES OR EXPENSES INCLUDING BUT NOT LIMITED TO ANY INCIDENTAL, SPECIAL, INDIRECT OR CONSEQUENTIAL DAMAGES, OR OTHER SIMILAR COSTS.
DOCUMENT REVISION HISTORY
Revision A (February, 2013)• Initial release of the document.
Revision B (August, 2013)• Updated to support Colibri Parameterization (Updated chapters 1, 2 and 3).• Aligned with Aurea GUI Version 0.4.20 or later.
Revision C (November, 2013)• Updated chapters 1, 2 and 3; Updated Appendix A.
2013 Microchip Technology Inc. DS40001681C-page 9
MGC3130 AUREAGRAPHICAL USER INTERFACE
USER’S GUIDE
Chapter 1. Overview
1.1 INTRODUCTIONThe Aurea evaluation software demonstrates Microchip’s GestIC technology and its features and applications. Aurea provides visualization of MGC3130 generated data and access to GestIC Library controls and configuration parameters.That contains the following:• Visualization of hand position and user gestures• Visualization of sensor data• Control of sensor features• MGC3130 GestIC Library update• Analog Front End parameterization • Colibri Signal Processing parameterization• Electrode capacitance measurement• Logging of sensor values and storage in a log file• Sniffing of MGC3130 I2C™ traffic via Saleae Logic Analyzer
1.1.1 Install AureaTo install Aurea on your system:• Download and install the MGC3130 software package.
1.1.2 Running AureaAurea requires Windows® XP, Windows® 7 or Windows® 8 operating system, a USB port and a minimum screen resolution of 1024x768. To start Aurea:
1. Connect the GestIC device to your PC via USB port (for information on the GestIC devices supported by your Aurea version, refer to the Aurea Release Notes).
2. To start Aurea, double click on the $\Install_Directory\Microchip\MGC3130\02_Aurea\Aurea.exe installed on your drive after installation or select Start>Programs> Aurea>Aurea. A screen will display the Aurea GUI.
3. Aurea detects the GestIC device automatically and is ready for use.
Note: If you encounter problems while connecting your GestIC® device with Aurea, make sure the appropriate USB drivers are installed on your PC. For troubleshooting, refer to the user’s manual of your GestIC® device.
2013 Microchip Technology Inc. DS40001681C-page 10
Overview
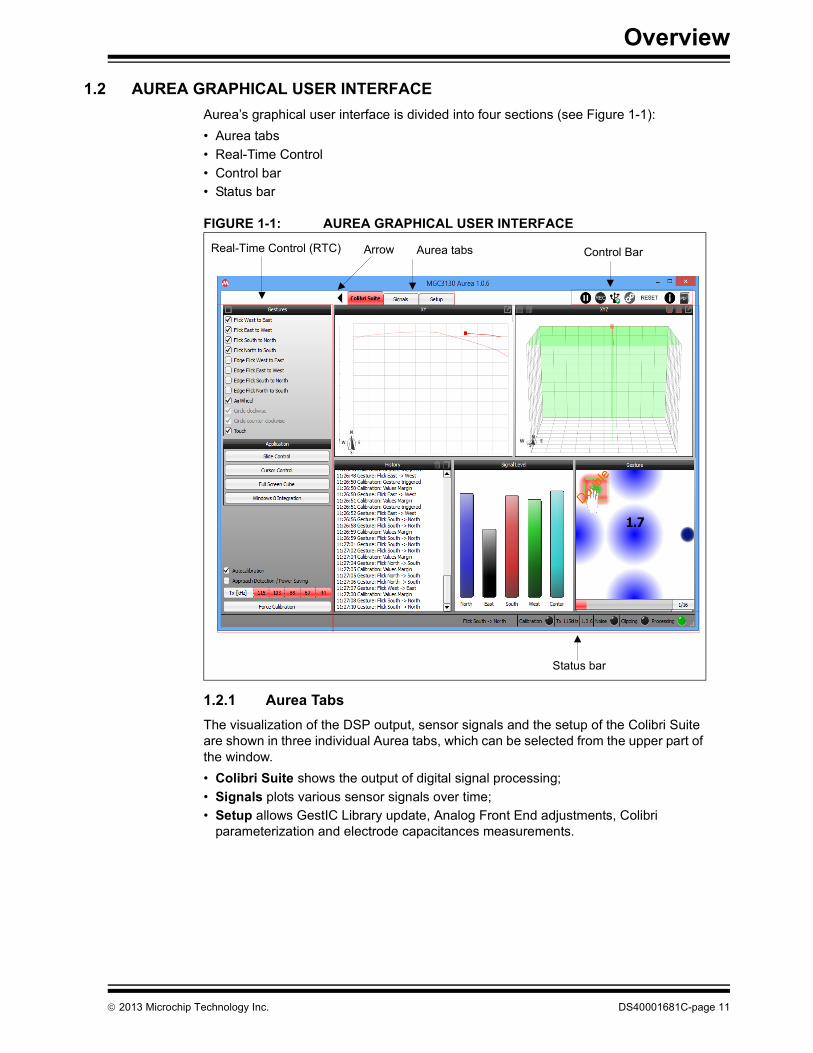
1.2 AUREA GRAPHICAL USER INTERFACEAurea’s graphical user interface is divided into four sections (see Figure 1-1):• Aurea tabs• Real-Time Control• Control bar• Status bar
FIGURE 1-1: AUREA GRAPHICAL USER INTERFACE
1.2.1 Aurea TabsThe visualization of the DSP output, sensor signals and the setup of the Colibri Suite are shown in three individual Aurea tabs, which can be selected from the upper part of the window.• Colibri Suite shows the output of digital signal processing;• Signals plots various sensor signals over time;• Setup allows GestIC Library update, Analog Front End adjustments, Colibri
parameterization and electrode capacitances measurements.
Aurea tabsReal-Time Control (RTC)
Status bar
Arrow Control Bar
2013 Microchip Technology Inc. DS40001681C-page 11
MGC3130 Aurea Graphical User Interface User’s Guide
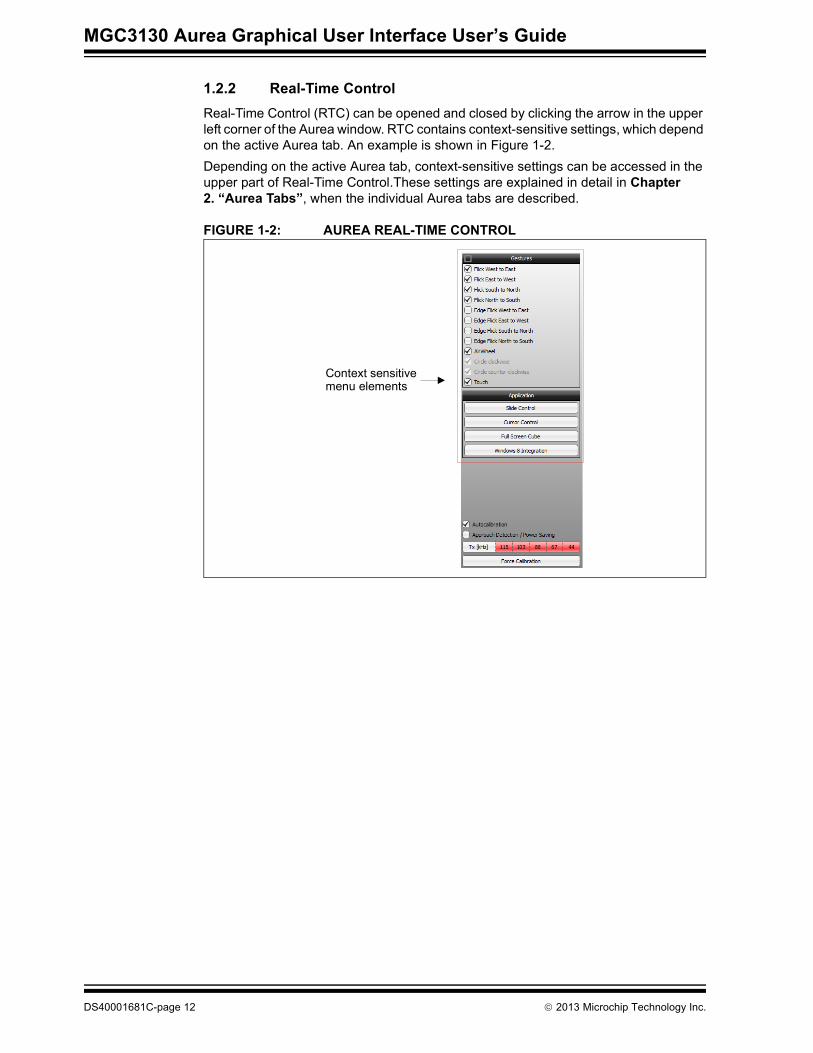
1.2.2 Real-Time Control Real-Time Control (RTC) can be opened and closed by clicking the arrow in the upper left corner of the Aurea window. RTC contains context-sensitive settings, which depend on the active Aurea tab. An example is shown in Figure 1-2. Depending on the active Aurea tab, context-sensitive settings can be accessed in the upper part of Real-Time Control.These settings are explained in detail in Chapter 2. “Aurea Tabs”, when the individual Aurea tabs are described.
FIGURE 1-2: AUREA REAL-TIME CONTROL
Context sensitive menu elements
DS40001681C-page 12 2013 Microchip Technology Inc.

Overview
1.2.3 Control BarThe control bar elements are valid for all Aurea tabs and are always visible across all tabs and can be accessed in the upper right corner within Aurea. These static control elements are (see Figure 1-3):• Freeze/Unfreeze Plot: Press this button to freeze the Visualization window.
Press it again to continue plotting. • Start Log/Stop Log: Records and saves sensor data into a log file. Refer to
Chapter 3. “Advanced Aurea Features” for additional details.• Connect/Disconnect: Toggles connect and disconnect of the USB connection
between the PC and the attached hardware which will be used to read the data output from MGC3130 I2C protocol. This hardware can be GestIC Bridge or Saleae USB Logic Analyzer.
• Preferences: Configures the hardware which will be used to read the data output from MGC3130 I2C protocol. This hardware can be GestIC Bridge or Saleae USB Logic Analyzer. Refer to Section 3.3 “Sniffing Mode” for additional details.
• Reset: Initiates a reset of the MGC3130.• About Aurea• Open Manual
FIGURE 1-3: AUREA CONTROL BAR
Open ManualStart/Stop loggingPreferencesFreeze/Unfreeze plot
About
Connect/Disconnect GestIC® HW Reset GestIC® HW
2013 Microchip Technology Inc. DS40001681C-page 13

MGC3130 Aurea Graphical User Interface User’s Guide
1.2.4 Status Bar The static Status Bar is located at the bottom of the Aurea window and it provides information about the recent status of the MGC3130 system (see to Figure 1-4).The following information displays from left to right:• Gesture indication shows the latest recognized gesture (only when the Colibri
Suite tab is active)• Calibration indication flashes when a sensor calibration is issued• Tx working frequency currently used by the MGC3130• GestIC Library version read from the MGC3130 after start-up and Reset. When
moving the cursor on it, other versions are displayed:- Library Loader version read MGC3130 after Reset- Colibri Suite version read from the MGC3130 after start-up and Reset- I2C Bridge version read from GestIC device after start-up
• Noise indication flashes when high noise is detected• Clipping indication flashes when signal clipping is detected• Processing indication lights up when the MGC3130 is in Processing mode and
turns off when in power-saving Sleep mode
FIGURE 1-4: AUREA STATUS BAR
Note: Calibration, noise and clipping indication are deactivated in the Colibri Parameterization of the AFE.
Clipping indication
Processing indicationTx working frequency
GestIC® Library versionLibrary Loader versionColibri Suite versionI2CTM bridge versionGesture indication
Noise indication
Calibration indication
DS40001681C-page 14 2013 Microchip Technology Inc.
MGC3130 AUREAGRAPHICAL USER INTERFACE
USER’S GUIDE
Chapter 2. Aurea Tabs
This chapter describes the individual tabs of Aurea and the respective context-sensitive settings within Real-Time Control.2.1 COLIBRI SUITE
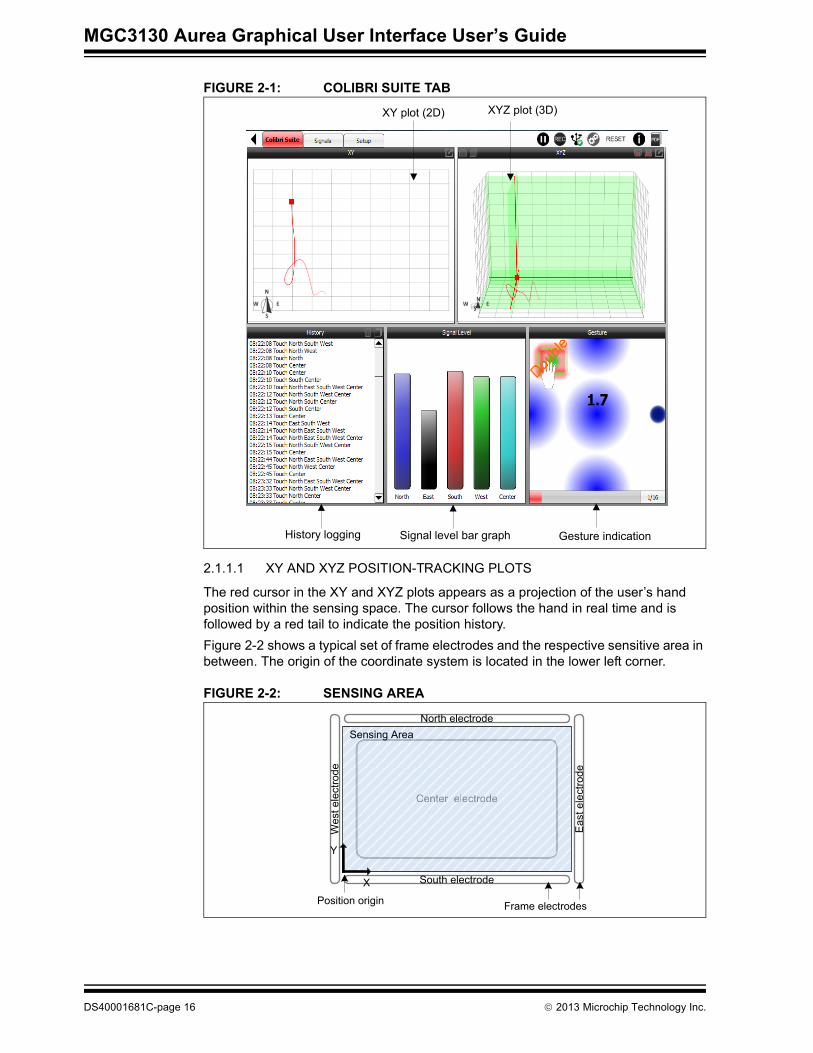
2.1.1 Colibri Suite TabThe Colibri Suite tab displays the MGC3130 3D gesture recognition and position tracking features, and is divided into five sub-windows (Figure 2-1):• XY position tracking plot (2D)• XYZ position tracking plot (3D)• Signal level bar graph• History Logging window• Gesture Indication window
Note: When the Approach Detection/Power-Saving feature is enabled, the MGC3130 controller is set to Sleep when no hand is present and the processing indication is turned off. In addition, the signal stream stops and the tab background turns gray. When a hand approaches the sensing area, the system will wake-up.
2013 Microchip Technology Inc. DS40001681C-page 15
MGC3130 Aurea Graphical User Interface User’s Guide
FIGURE 2-1: COLIBRI SUITE TAB
2.1.1.1 XY AND XYZ POSITION-TRACKING PLOTS
The red cursor in the XY and XYZ plots appears as a projection of the user’s hand position within the sensing space. The cursor follows the hand in real time and is followed by a red tail to indicate the position history. Figure 2-2 shows a typical set of frame electrodes and the respective sensitive area in between. The origin of the coordinate system is located in the lower left corner.
FIGURE 2-2: SENSING AREA
XYZ plot (3D)XY plot (2D)
History logging Signal level bar graph Gesture indication
Center electrode
North electrode
South electrode
Wes
tele
ctro
de
Eas
tele
ctro
de
CCeeeenntteerr eelleeccccttrrooddee
Sensing Area
X
Y
Frame electrodesPosition origin
DS40001681C-page 16 2013 Microchip Technology Inc.
Aurea Tabs
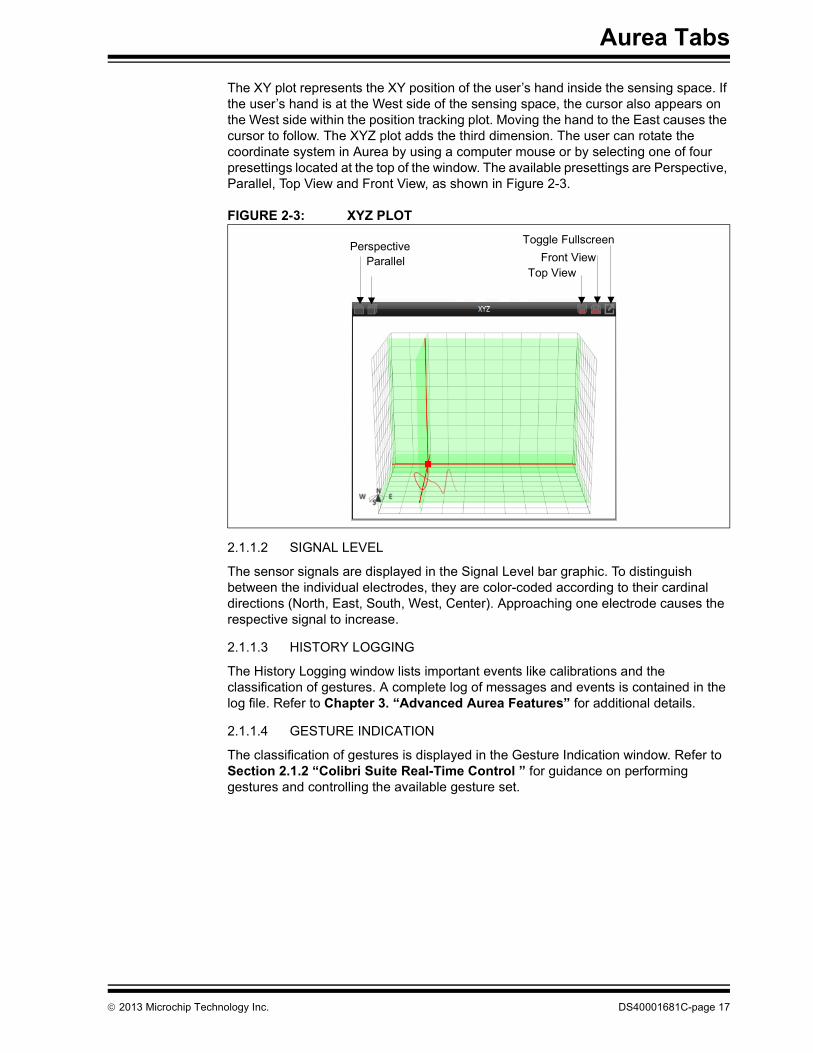
The XY plot represents the XY position of the user’s hand inside the sensing space. If the user’s hand is at the West side of the sensing space, the cursor also appears on the West side within the position tracking plot. Moving the hand to the East causes the cursor to follow. The XYZ plot adds the third dimension. The user can rotate the coordinate system in Aurea by using a computer mouse or by selecting one of four presettings located at the top of the window. The available presettings are Perspective, Parallel, Top View and Front View, as shown in Figure 2-3.
FIGURE 2-3: XYZ PLOT
2.1.1.2 SIGNAL LEVEL
The sensor signals are displayed in the Signal Level bar graphic. To distinguish between the individual electrodes, they are color-coded according to their cardinal directions (North, East, South, West, Center). Approaching one electrode causes the respective signal to increase.
2.1.1.3 HISTORY LOGGING
The History Logging window lists important events like calibrations and the classification of gestures. A complete log of messages and events is contained in the log file. Refer to Chapter 3. “Advanced Aurea Features” for additional details.
2.1.1.4 GESTURE INDICATION
The classification of gestures is displayed in the Gesture Indication window. Refer to Section 2.1.2 “Colibri Suite Real-Time Control ” for guidance on performing gestures and controlling the available gesture set.
PerspectiveParallel Front View
Top View
Toggle Fullscreen
2013 Microchip Technology Inc. DS40001681C-page 17
MGC3130 Aurea Graphical User Interface User’s Guide
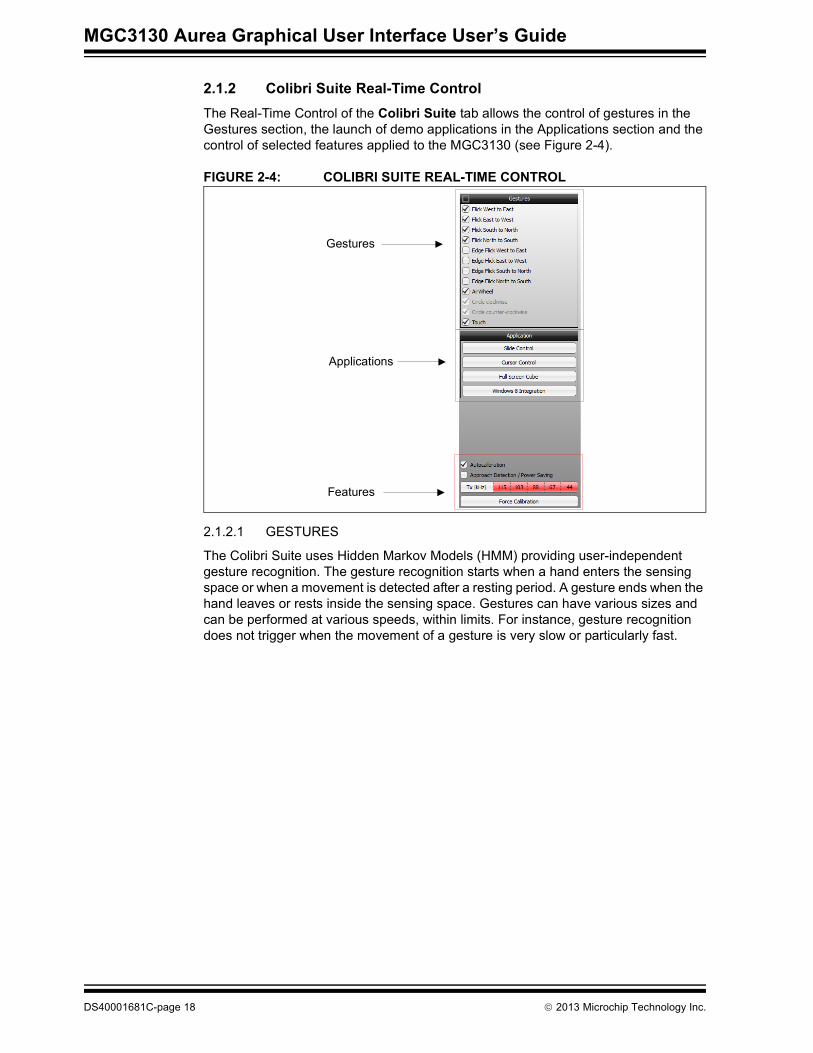
2.1.2 Colibri Suite Real-Time Control The Real-Time Control of the Colibri Suite tab allows the control of gestures in the Gestures section, the launch of demo applications in the Applications section and the control of selected features applied to the MGC3130 (see Figure 2-4).
FIGURE 2-4: COLIBRI SUITE REAL-TIME CONTROL
2.1.2.1 GESTURES
The Colibri Suite uses Hidden Markov Models (HMM) providing user-independent gesture recognition. The gesture recognition starts when a hand enters the sensing space or when a movement is detected after a resting period. A gesture ends when the hand leaves or rests inside the sensing space. Gestures can have various sizes and can be performed at various speeds, within limits. For instance, gesture recognition does not trigger when the movement of a gesture is very slow or particularly fast.
Gestures
Applications
Features
DS40001681C-page 18 2013 Microchip Technology Inc.

Aurea Tabs
2.1.2.1.1 Flick GesturesA flick gesture is defined as a linear hand or finger movement in a specified direction. Flick gestures can start and end inside and outside the sensing space. The Colibri Suite supports flick gestures in four directions and can further distinguish edge flicks. Edge flicks are performed at the edge of the sensing space. They always start outside the sensing space and cover less than 70% of it. The implementation of flick recognition is illustrated in Figure 2-5 on the example of flicks from West to East.
FIGURE 2-5: EXAMPLES FOR FLICK RECOGNITION
Colibri RTC supports the flick gestures listed in Table 2-1. The gestures can be individually enabled and disabled by checking and unchecking the respective check-boxes.
TABLE 2-1: FLICK GESTURESSymbol Gesture Symbol Gesture
Flick West to East Edge Flick West to East
Flick East to West Edge Flick East to West
Flick South to North Edge Flick South to North
Flick North to South Edge Flick North to South
Sensing area
South electrode
Eas
tele
ctro
de
North electrode
Wes
tele
ctro
deFlick
Flick
Flick
Flick
Flick
70 %Edge Flick
Flick
2013 Microchip Technology Inc. DS40001681C-page 19
MGC3130 Aurea Graphical User Interface User’s Guide
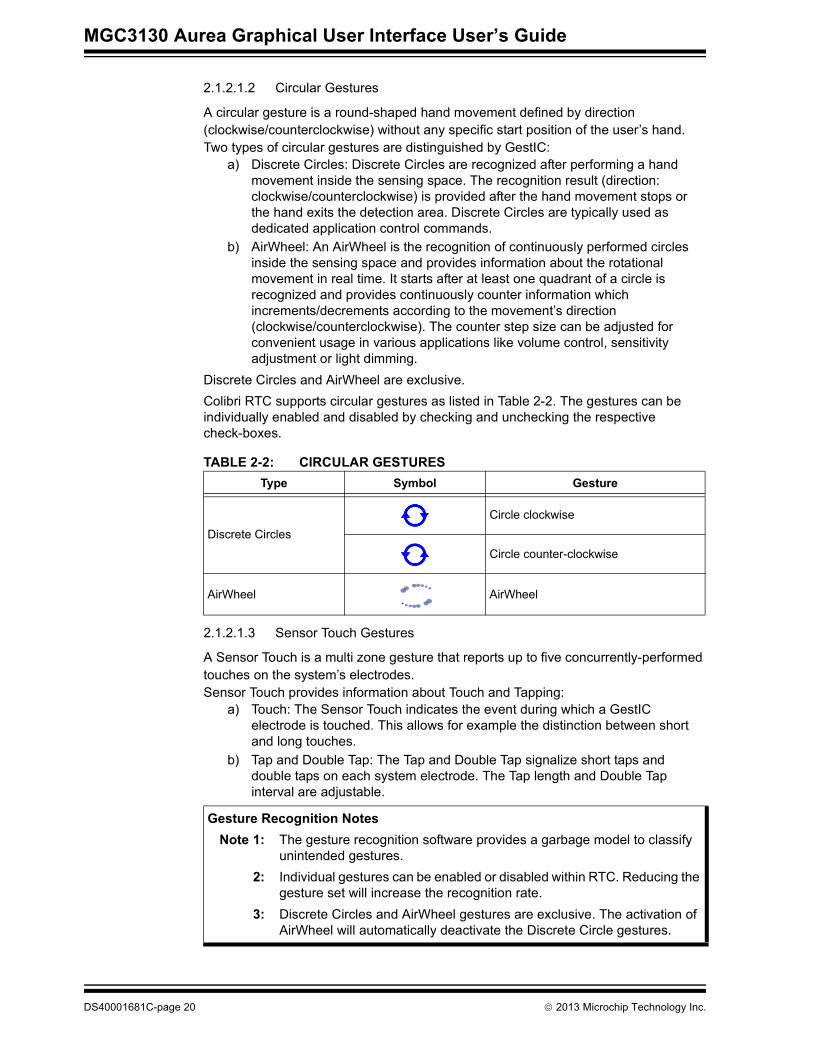
2.1.2.1.2 Circular Gestures
A circular gesture is a round-shaped hand movement defined by direction (clockwise/counterclockwise) without any specific start position of the user’s hand. Two types of circular gestures are distinguished by GestIC:
a) Discrete Circles: Discrete Circles are recognized after performing a hand movement inside the sensing space. The recognition result (direction: clockwise/counterclockwise) is provided after the hand movement stops or the hand exits the detection area. Discrete Circles are typically used as dedicated application control commands.
b) AirWheel: An AirWheel is the recognition of continuously performed circles inside the sensing space and provides information about the rotational movement in real time. It starts after at least one quadrant of a circle is recognized and provides continuously counter information which increments/decrements according to the movement’s direction (clockwise/counterclockwise). The counter step size can be adjusted for convenient usage in various applications like volume control, sensitivity adjustment or light dimming.
Discrete Circles and AirWheel are exclusive.Colibri RTC supports circular gestures as listed in Table 2-2. The gestures can be individually enabled and disabled by checking and unchecking the respective check-boxes.
2.1.2.1.3 Sensor Touch Gestures
A Sensor Touch is a multi zone gesture that reports up to five concurrently-performed touches on the system’s electrodes.Sensor Touch provides information about Touch and Tapping:
a) Touch: The Sensor Touch indicates the event during which a GestIC electrode is touched. This allows for example the distinction between short and long touches.
b) Tap and Double Tap: The Tap and Double Tap signalize short taps and double taps on each system electrode. The Tap length and Double Tap interval are adjustable.
TABLE 2-2: CIRCULAR GESTURESType Symbol Gesture
Discrete CirclesCircle clockwise
Circle counter-clockwise
AirWheel AirWheel
Gesture Recognition NotesNote 1: The gesture recognition software provides a garbage model to classify
unintended gestures.2: Individual gestures can be enabled or disabled within RTC. Reducing the
gesture set will increase the recognition rate.3: Discrete Circles and AirWheel gestures are exclusive. The activation of
AirWheel will automatically deactivate the Discrete Circle gestures.
DS40001681C-page 20 2013 Microchip Technology Inc.
Aurea Tabs
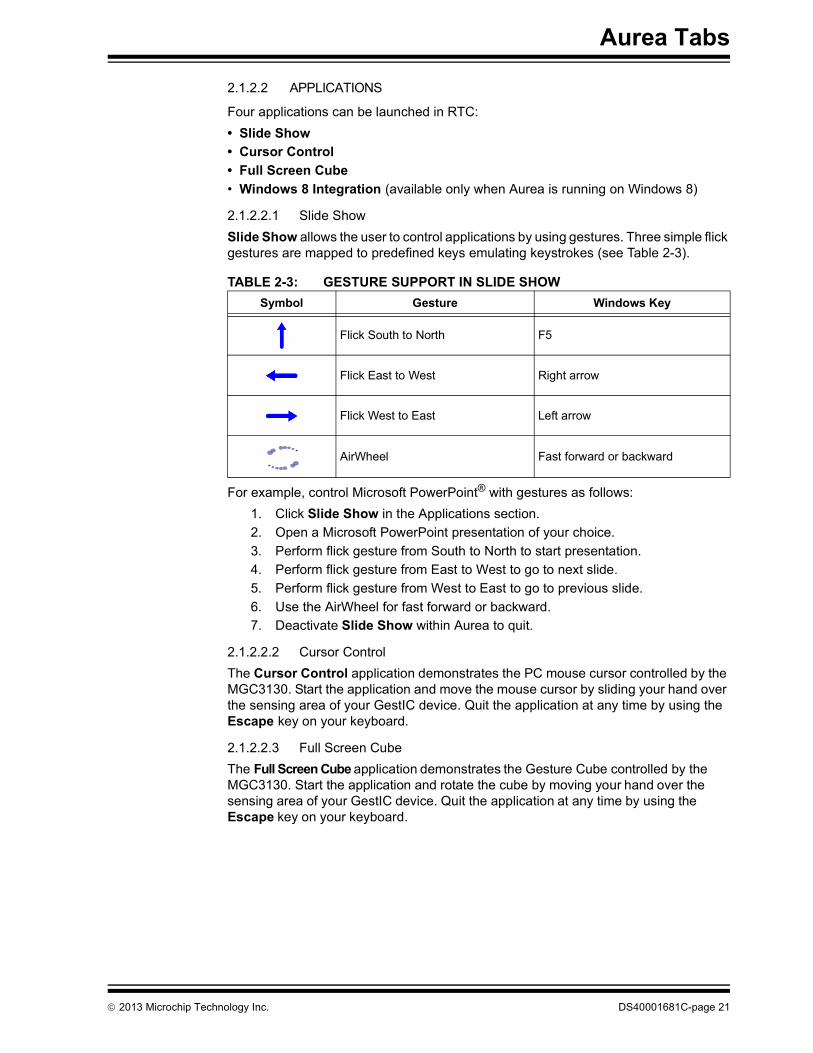
2.1.2.2 APPLICATIONS
Four applications can be launched in RTC: • Slide Show• Cursor Control• Full Screen Cube• Windows 8 Integration (available only when Aurea is running on Windows 8)
2.1.2.2.1 Slide ShowSlide Show allows the user to control applications by using gestures. Three simple flick gestures are mapped to predefined keys emulating keystrokes (see Table 2-3).
For example, control Microsoft PowerPoint® with gestures as follows:1. Click Slide Show in the Applications section. 2. Open a Microsoft PowerPoint presentation of your choice.3. Perform flick gesture from South to North to start presentation.4. Perform flick gesture from East to West to go to next slide.5. Perform flick gesture from West to East to go to previous slide.6. Use the AirWheel for fast forward or backward.7. Deactivate Slide Show within Aurea to quit.
2.1.2.2.2 Cursor ControlThe Cursor Control application demonstrates the PC mouse cursor controlled by the MGC3130. Start the application and move the mouse cursor by sliding your hand over the sensing area of your GestIC device. Quit the application at any time by using the Escape key on your keyboard.
2.1.2.2.3 Full Screen CubeThe Full Screen Cube application demonstrates the Gesture Cube controlled by the MGC3130. Start the application and rotate the cube by moving your hand over the sensing area of your GestIC device. Quit the application at any time by using the Escape key on your keyboard.
TABLE 2-3: GESTURE SUPPORT IN SLIDE SHOWSymbol Gesture Windows Key
Flick South to North F5
Flick East to West Right arrow
Flick West to East Left arrow
AirWheel Fast forward or backward
2013 Microchip Technology Inc. DS40001681C-page 21
MGC3130 Aurea Graphical User Interface User’s Guide
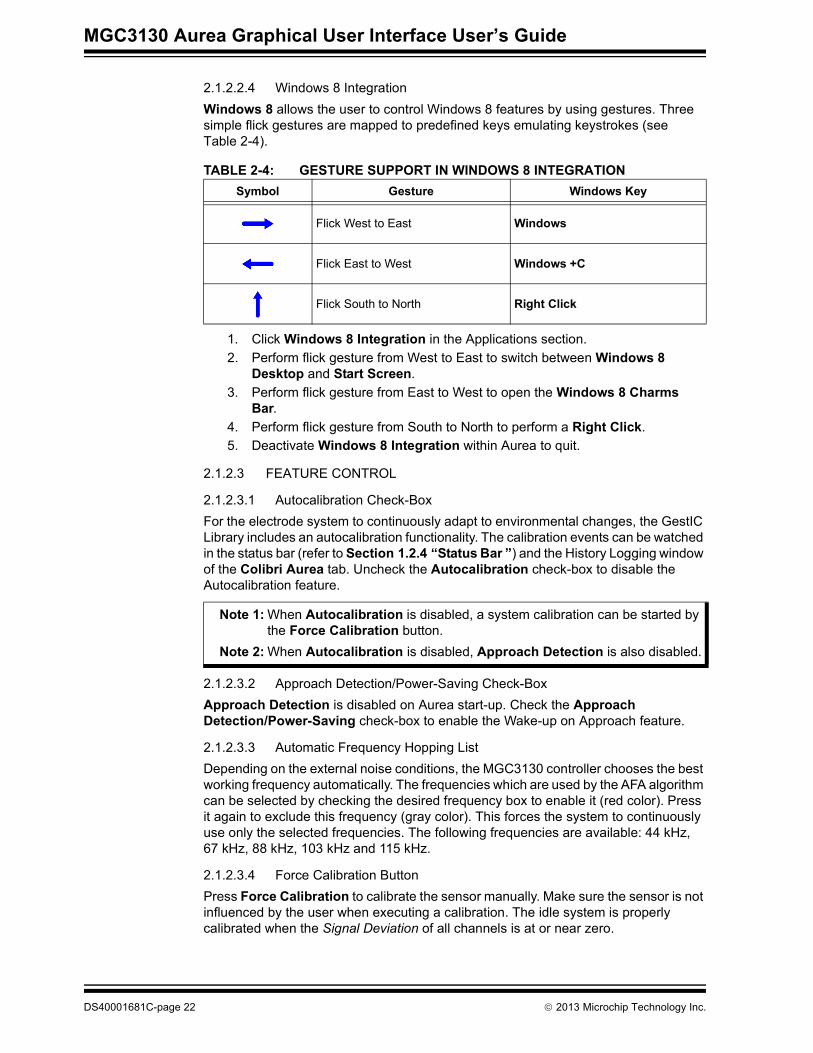
2.1.2.2.4 Windows 8 IntegrationWindows 8 allows the user to control Windows 8 features by using gestures. Three simple flick gestures are mapped to predefined keys emulating keystrokes (see Table 2-4).
1. Click Windows 8 Integration in the Applications section.2. Perform flick gesture from West to East to switch between Windows 8
Desktop and Start Screen.3. Perform flick gesture from East to West to open the Windows 8 Charms
Bar.4. Perform flick gesture from South to North to perform a Right Click.5. Deactivate Windows 8 Integration within Aurea to quit.
2.1.2.3 FEATURE CONTROL
2.1.2.3.1 Autocalibration Check-BoxFor the electrode system to continuously adapt to environmental changes, the GestIC Library includes an autocalibration functionality. The calibration events can be watched in the status bar (refer to Section 1.2.4 “Status Bar ”) and the History Logging window of the Colibri Aurea tab. Uncheck the Autocalibration check-box to disable the Autocalibration feature.
2.1.2.3.2 Approach Detection/Power-Saving Check-BoxApproach Detection is disabled on Aurea start-up. Check the Approach Detection/Power-Saving check-box to enable the Wake-up on Approach feature.
2.1.2.3.3 Automatic Frequency Hopping ListDepending on the external noise conditions, the MGC3130 controller chooses the best working frequency automatically. The frequencies which are used by the AFA algorithm can be selected by checking the desired frequency box to enable it (red color). Press it again to exclude this frequency (gray color). This forces the system to continuously use only the selected frequencies. The following frequencies are available: 44 kHz, 67 kHz, 88 kHz, 103 kHz and 115 kHz.
2.1.2.3.4 Force Calibration ButtonPress Force Calibration to calibrate the sensor manually. Make sure the sensor is not influenced by the user when executing a calibration. The idle system is properly calibrated when the Signal Deviation of all channels is at or near zero.
TABLE 2-4: GESTURE SUPPORT IN WINDOWS 8 INTEGRATIONSymbol Gesture Windows Key
Flick West to East Windows
Flick East to West Windows +C
Flick South to North Right Click
Note 1: When Autocalibration is disabled, a system calibration can be started by the Force Calibration button.
Note 2: When Autocalibration is disabled, Approach Detection is also disabled.
DS40001681C-page 22 2013 Microchip Technology Inc.
Aurea Tabs
2.2 SIGNALS
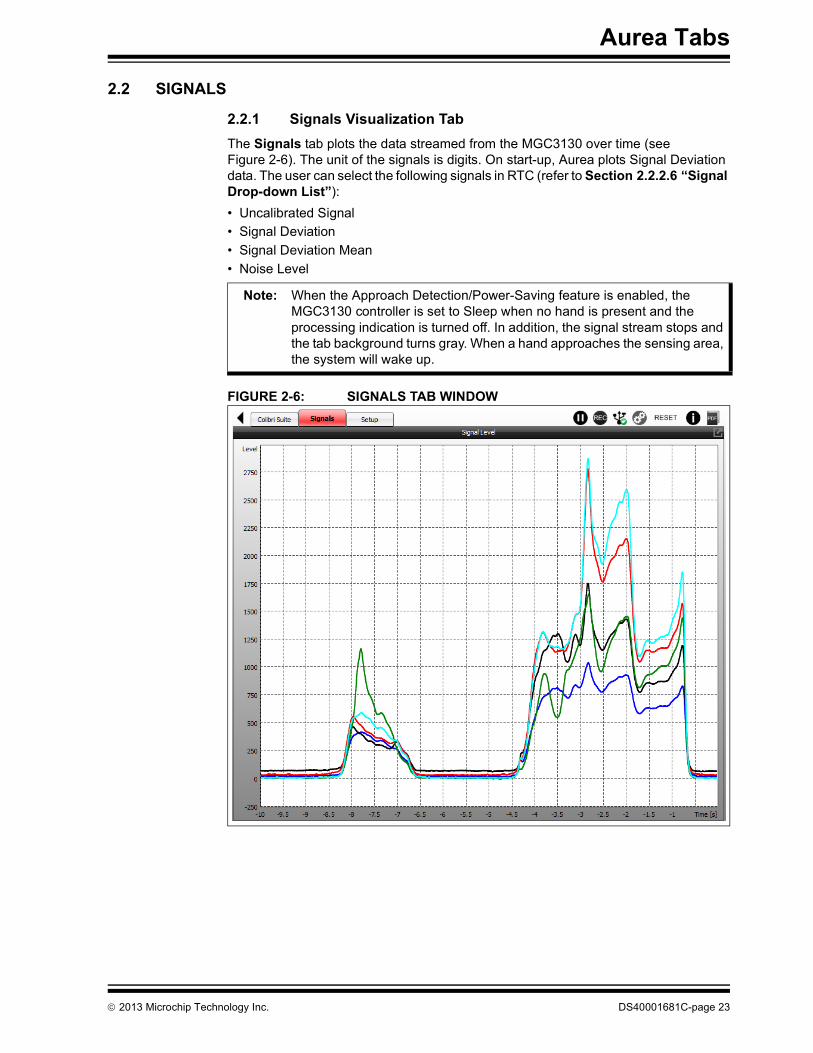
2.2.1 Signals Visualization TabThe Signals tab plots the data streamed from the MGC3130 over time (see Figure 2-6). The unit of the signals is digits. On start-up, Aurea plots Signal Deviation data. The user can select the following signals in RTC (refer to Section 2.2.2.6 “Signal Drop-down List”):• Uncalibrated Signal • Signal Deviation• Signal Deviation Mean • Noise Level
FIGURE 2-6: SIGNALS TAB WINDOW
Note: When the Approach Detection/Power-Saving feature is enabled, the MGC3130 controller is set to Sleep when no hand is present and the processing indication is turned off. In addition, the signal stream stops and the tab background turns gray. When a hand approaches the sensing area, the system will wake up.
2013 Microchip Technology Inc. DS40001681C-page 23

MGC3130 Aurea Graphical User Interface User’s Guide
2.2.2 Signals Real-Time Control When Signals tab is active, Real-Time Control allows the configuration of the plot in the Signals window and the control of selected features applied to the MGC3130 (see Figure 2-7).
FIGURE 2-7: SIGNALS REAL-TIME CONTROL
The individual GUI elements are described below.
2.2.2.1 CHANNELS
The Channels section allows the user to select the electrode signals plotted in the Visualization window. In the standard configuration, all five channels are displayed. For a detailed look into one electrode signal, unused channels can be unchecked.
2.2.2.2 LEVELS
The most recent signal values (time = 0) are shown in the Levels section. The values can be copied and pasted to an application of your choice (e.g., Microsoft Excel®). Before selecting the values, the signal stream must be paused first by pressing the Freeze/Unfreeze Plot button (refer to Section 1.2.3 “Control Bar”).
2.2.2.3 AUTOCALIBRATION CHECK-BOX
The GestIC Library includes an Autocalibration functionality for a continuous adaptation to the environmental changes. The calibration events can be observed in the status bar (refer to Section 1.2.4 “Status Bar ”) and in the History Logging window of the Colibri Suite tab. Uncheck the Autocalibration check-box to disable the Autocalibration feature.
Signals
Features
Note 1: When Autocalibration is disabled, a system calibration can be started by the Force Calibration button.
2: When Autocalibration is disabled, Approach Detection is also disabled.
DS40001681C-page 24 2013 Microchip Technology Inc.
Aurea Tabs
2.2.2.4 APPROACH DETECTION/POWER-SAVING CHECK-BOX
Check the Approach Detection/Power-Saving check-box to enable the Approach Detection feature.
2.2.2.5 AUTOZOOM CHECK-BOX
Uncheck the Autozoom Level check-box to disable auto-scaling the Y axis in the Signals plot.
2.2.2.6 SIGNAL DROP-DOWN LIST
A drop-down list allows selecting the signal streamed by the MGC3130. This signal is then displayed in the plot within the Signals tab. The provided signals are listed in Table 2-5.
2.2.2.7 AUTOMATIC FREQUENCY HOPPING LIST
Depending on the external noise conditions, the MGC3130 controller automatically chooses the best working frequency. The frequencies which are used by the AFA algorithm can be selected by checking the desired frequency box to enable it (red color). Press it again to exclude this frequency (gray color). This forces the system to continuously use only the selected frequencies. The following frequencies are available: 44 kHz, 67 kHz, 88 kHz, 103 kHz and 115 kHz.
2.2.2.8 FORCE CALIBRATION BUTTON
Press Force Calibration to calibrate the sensor manually. Make sure the sensor is not influenced by the user when executing a calibration. The idle system is properly calibrated when the Signal Deviation of all channels is about zero.
TABLE 2-5: AUREA SIGNALSName of Signal Description
Uncalibrated Signal The Uncalibrated Signal is taken directly from the decimation filter implemented in the MGC3130. Any other signals are calculated from there. Two additional indications are displayed below the Signal Level window: clipping and noise power variance. Signal peaks are observed when the automatic frequency hopping is enabled. Selecting only one frequency will avoid these peaks.
Signal Deviation Signal Deviation shows the signals received from the electrodes after preprocessing and calibration. When there is no approach by a hand, the signals are approximately zero. A users approach causes the signal deviation to rise.
Signal Deviation Mean The Signal Deviation Mean is the Signal Deviation with a simple moving average filter applied. The filtering is executed within Aurea with a filter length of 10 seconds. This signal is used when recording a sensitivity profile (refer to Section 3.2 “Sensitivity Profile Acquisition”). A pop-up window is shown during the initialization phase. It automatically disappears when data are valid.
Noise Level The Noise Level is defined as the Standard Deviation of the Uncalibrated Signal. It is calculated over 100 seconds and gives information about the self-noise level of the sensor system. A pop-up window is shown during the initialization phase. It automatically disappears when data are valid.
2013 Microchip Technology Inc. DS40001681C-page 25
MGC3130 Aurea Graphical User Interface User’s Guide
2.3 SETUP The Setup tab collects functions to update the GestIC Library, to adjust the hardware settings of the MGC3130, to configure the Colibri Suite (Analog Front End and Digital Signal Processing) and to measure the electrodes capacitances. Pressing one of these buttons will open the corresponding setup task (see Figure 2-8).
FIGURE 2-8: SETUP TASKS
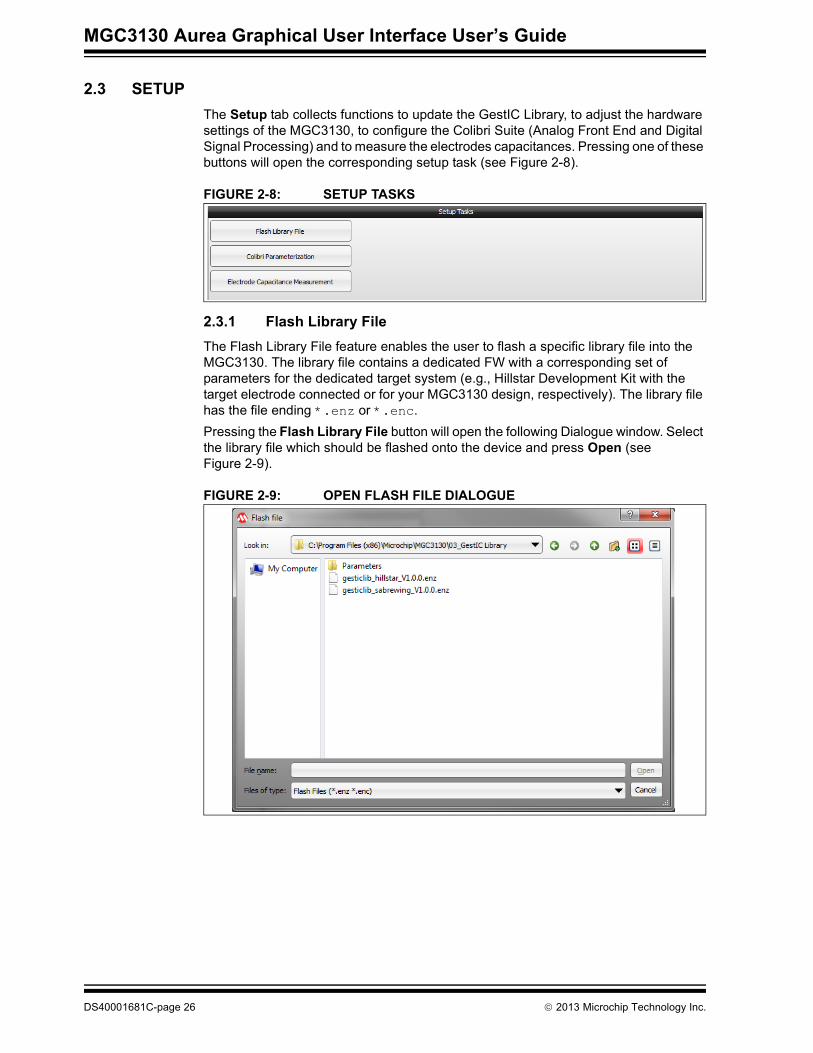
2.3.1 Flash Library FileThe Flash Library File feature enables the user to flash a specific library file into the MGC3130. The library file contains a dedicated FW with a corresponding set of parameters for the dedicated target system (e.g., Hillstar Development Kit with the target electrode connected or for your MGC3130 design, respectively). The library file has the file ending *.enz or *.enc.Pressing the Flash Library File button will open the following Dialogue window. Select the library file which should be flashed onto the device and press Open (see Figure 2-9).
FIGURE 2-9: OPEN FLASH FILE DIALOGUE
DS40001681C-page 26 2013 Microchip Technology Inc.
Aurea Tabs
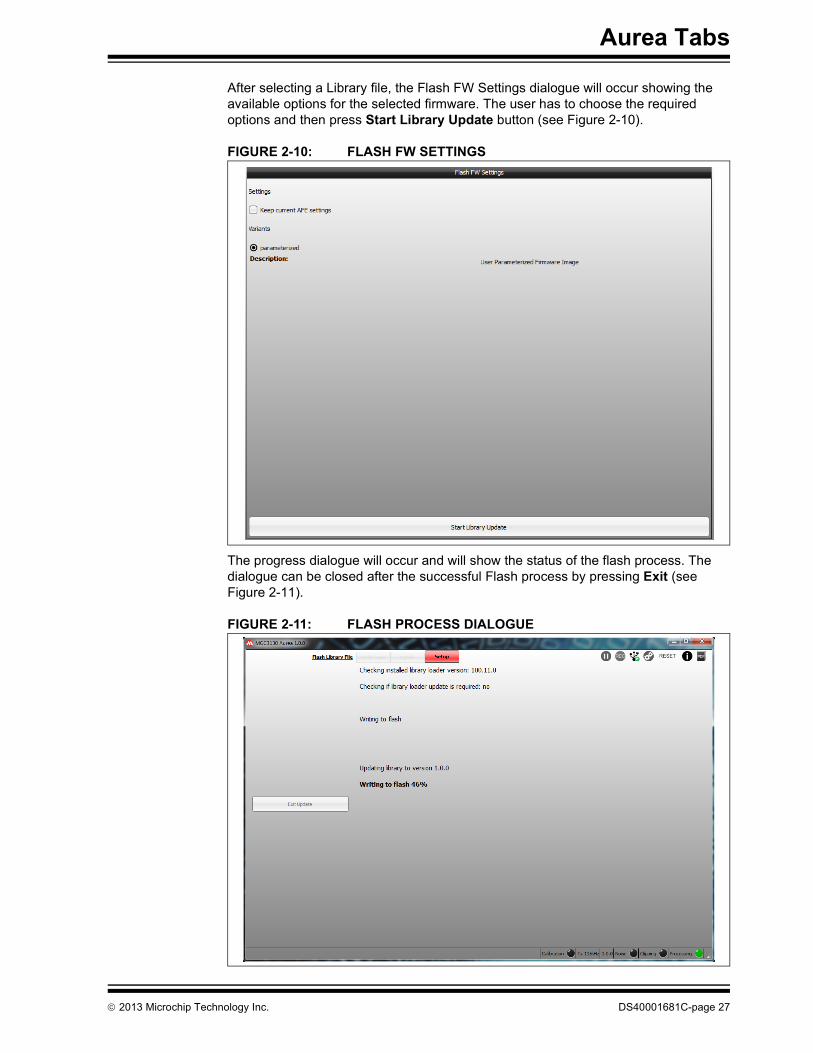
After selecting a Library file, the Flash FW Settings dialogue will occur showing the available options for the selected firmware. The user has to choose the required options and then press Start Library Update button (see Figure 2-10).
FIGURE 2-10: FLASH FW SETTINGS
The progress dialogue will occur and will show the status of the flash process. The dialogue can be closed after the successful Flash process by pressing Exit (see Figure 2-11).
FIGURE 2-11: FLASH PROCESS DIALOGUE
2013 Microchip Technology Inc. DS40001681C-page 27
MGC3130 Aurea Graphical User Interface User’s Guide
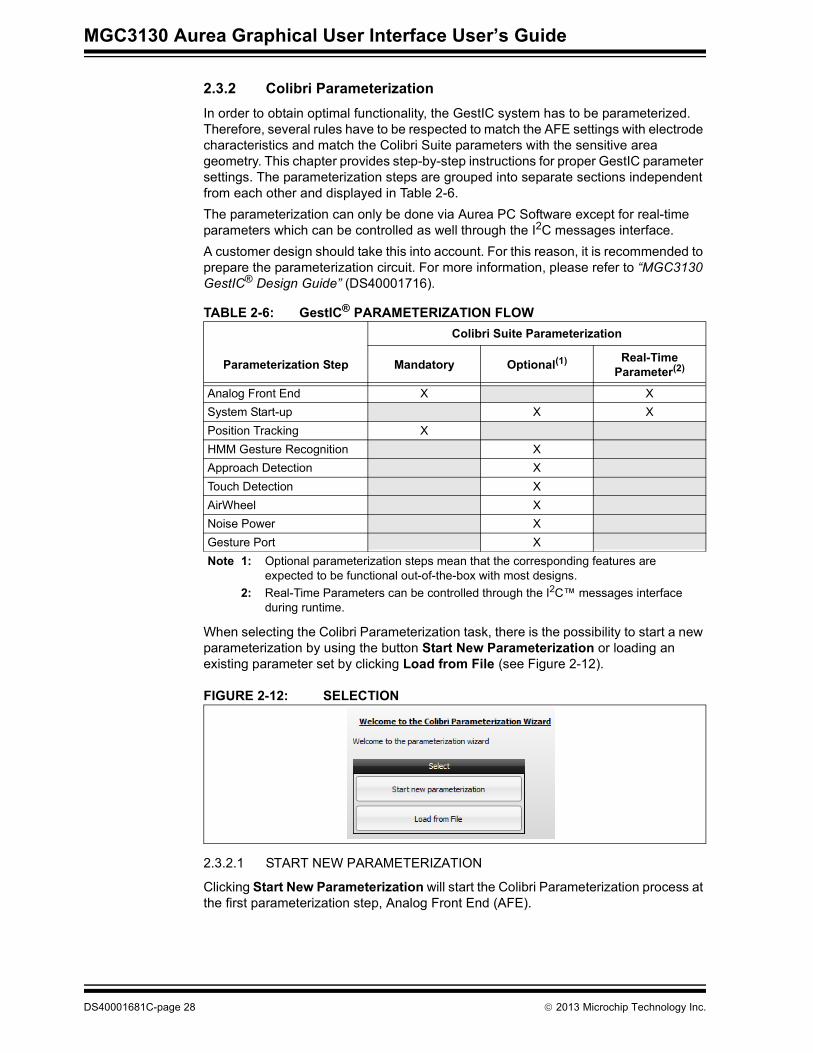
2.3.2 Colibri ParameterizationIn order to obtain optimal functionality, the GestIC system has to be parameterized. Therefore, several rules have to be respected to match the AFE settings with electrode characteristics and match the Colibri Suite parameters with the sensitive area geometry. This chapter provides step-by-step instructions for proper GestIC parameter settings. The parameterization steps are grouped into separate sections independent from each other and displayed in Table 2-6.The parameterization can only be done via Aurea PC Software except for real-time parameters which can be controlled as well through the I2C messages interface.A customer design should take this into account. For this reason, it is recommended to prepare the parameterization circuit. For more information, please refer to “MGC3130 GestIC® Design Guide” (DS40001716).
When selecting the Colibri Parameterization task, there is the possibility to start a new parameterization by using the button Start New Parameterization or loading an existing parameter set by clicking Load from File (see Figure 2-12).
FIGURE 2-12: SELECTION
2.3.2.1 START NEW PARAMETERIZATION
Clicking Start New Parameterization will start the Colibri Parameterization process at the first parameterization step, Analog Front End (AFE).
TABLE 2-6: GestIC® PARAMETERIZATION FLOWColibri Suite Parameterization
Parameterization Step Mandatory Optional(1) Real-Time Parameter(2)
Analog Front End X XSystem Start-up X XPosition Tracking XHMM Gesture Recognition XApproach Detection XTouch Detection XAirWheel XNoise Power XGesture Port XNote 1: Optional parameterization steps mean that the corresponding features are
expected to be functional out-of-the-box with most designs.2: Real-Time Parameters can be controlled through the I2C™ messages interface
during runtime.
DS40001681C-page 28 2013 Microchip Technology Inc.
Aurea Tabs
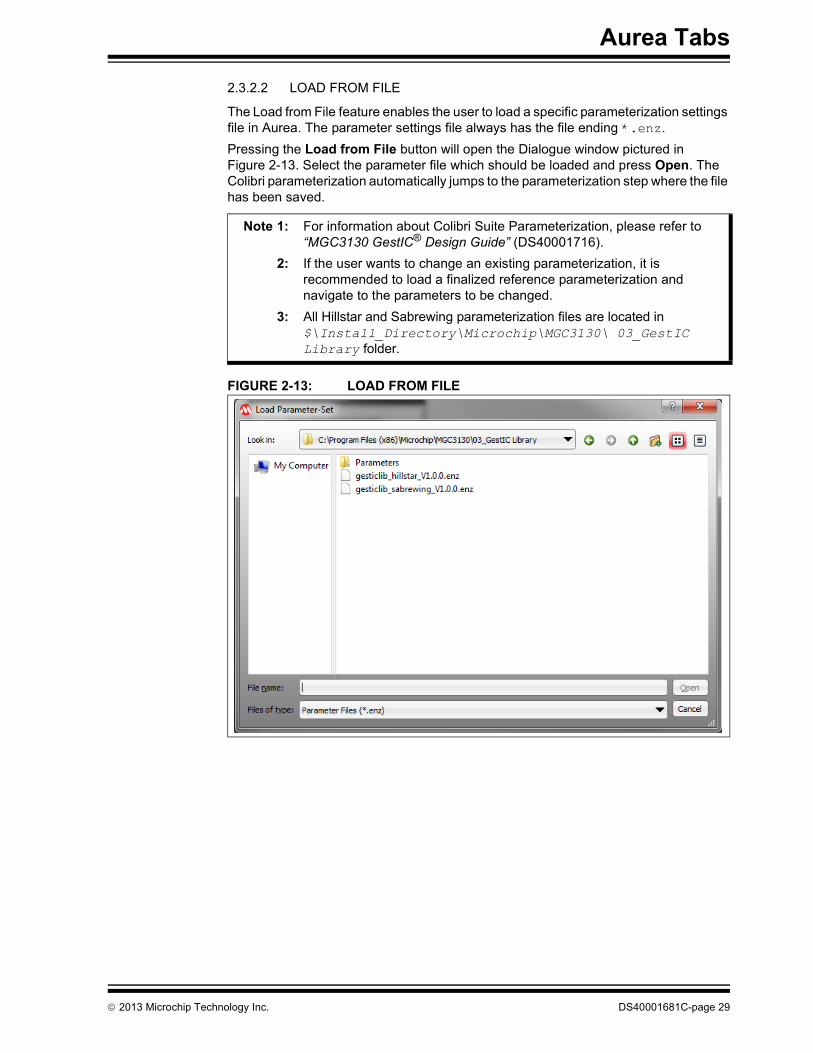
2.3.2.2 LOAD FROM FILE
The Load from File feature enables the user to load a specific parameterization settings file in Aurea. The parameter settings file always has the file ending *.enz.Pressing the Load from File button will open the Dialogue window pictured in Figure 2-13. Select the parameter file which should be loaded and press Open. The Colibri parameterization automatically jumps to the parameterization step where the file has been saved.
FIGURE 2-13: LOAD FROM FILE
Note 1: For information about Colibri Suite Parameterization, please refer to “MGC3130 GestIC® Design Guide” (DS40001716).
2: If the user wants to change an existing parameterization, it is recommended to load a finalized reference parameterization and navigate to the parameters to be changed.
3: All Hillstar and Sabrewing parameterization files are located in $\Install_Directory\Microchip\MGC3130\ 03_GestIC Library folder.
2013 Microchip Technology Inc. DS40001681C-page 29
MGC3130 Aurea Graphical User Interface User’s Guide
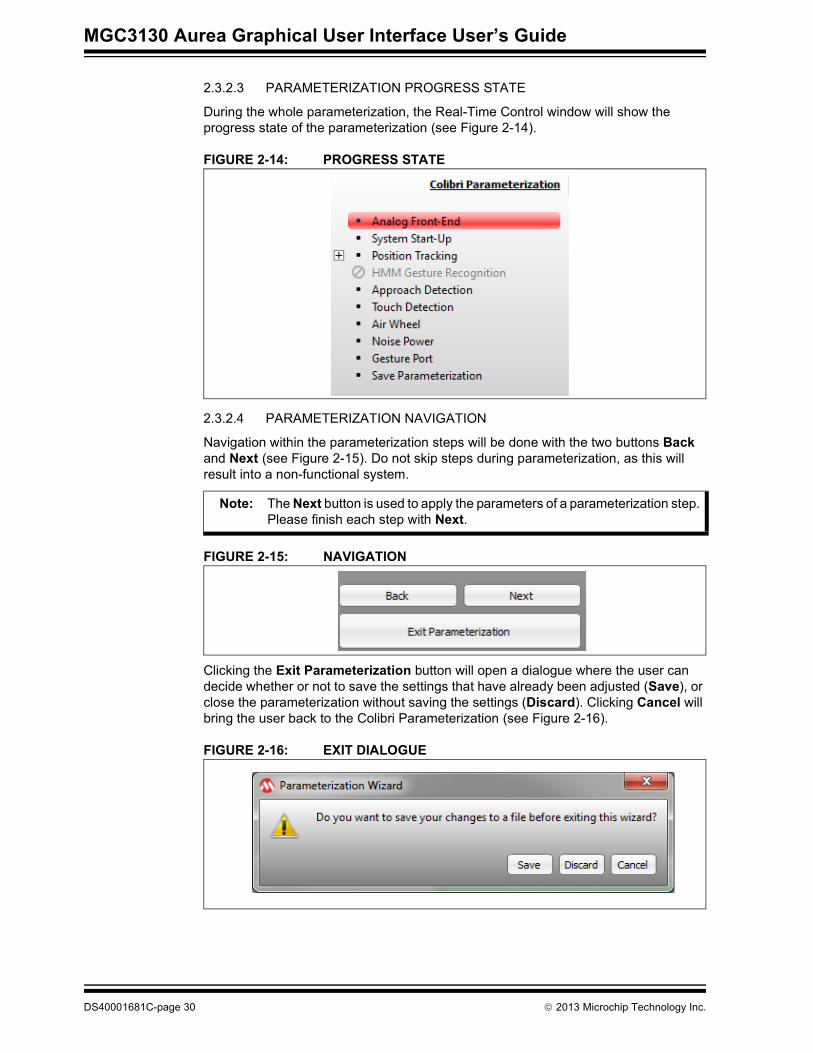
2.3.2.3 PARAMETERIZATION PROGRESS STATE
During the whole parameterization, the Real-Time Control window will show the progress state of the parameterization (see Figure 2-14).
FIGURE 2-14: PROGRESS STATE
2.3.2.4 PARAMETERIZATION NAVIGATION
Navigation within the parameterization steps will be done with the two buttons Back and Next (see Figure 2-15). Do not skip steps during parameterization, as this will result into a non-functional system.
FIGURE 2-15: NAVIGATION
Clicking the Exit Parameterization button will open a dialogue where the user can decide whether or not to save the settings that have already been adjusted (Save), or close the parameterization without saving the settings (Discard). Clicking Cancel will bring the user back to the Colibri Parameterization (see Figure 2-16).
FIGURE 2-16: EXIT DIALOGUE
Note: The Next button is used to apply the parameters of a parameterization step. Please finish each step with Next.
DS40001681C-page 30 2013 Microchip Technology Inc.
Aurea Tabs
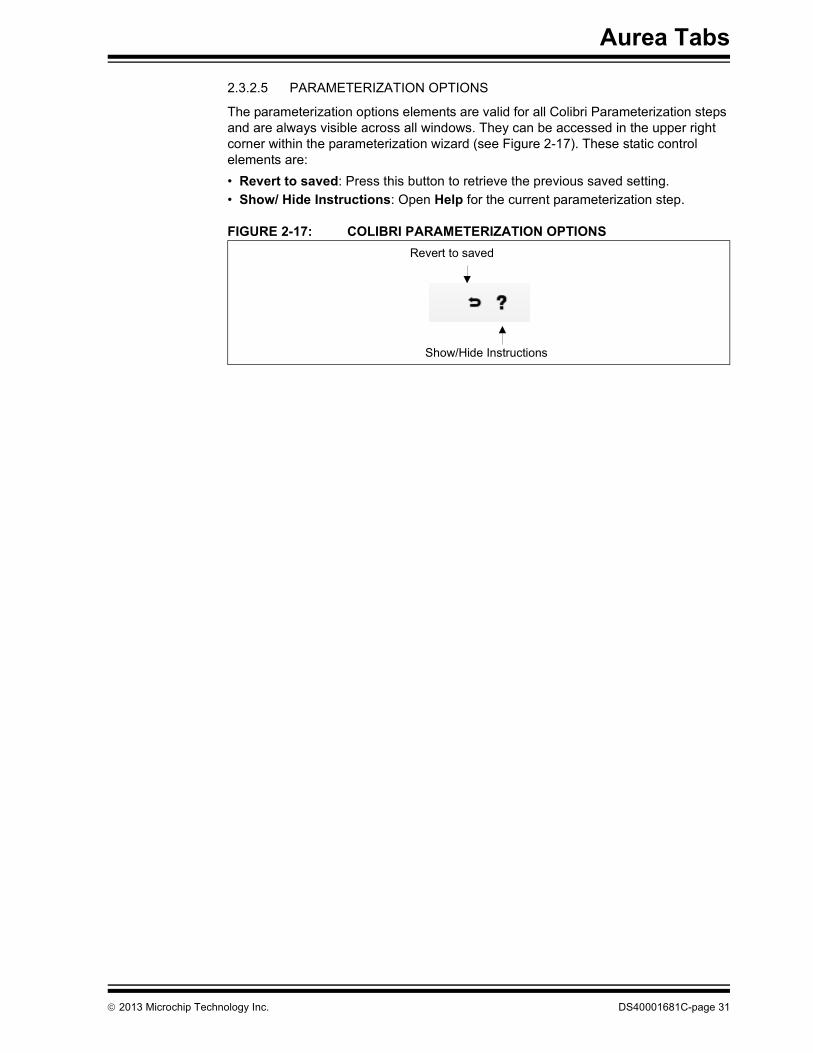
2.3.2.5 PARAMETERIZATION OPTIONS
The parameterization options elements are valid for all Colibri Parameterization steps and are always visible across all windows. They can be accessed in the upper right corner within the parameterization wizard (see Figure 2-17). These static control elements are:• Revert to saved: Press this button to retrieve the previous saved setting.• Show/ Hide Instructions: Open Help for the current parameterization step.
FIGURE 2-17: COLIBRI PARAMETERIZATION OPTIONSRevert to saved
Show/Hide Instructions
2013 Microchip Technology Inc. DS40001681C-page 31
MGC3130 Aurea Graphical User Interface User’s Guide
2.3.2.6 ANALOG FRONT END (AFE)
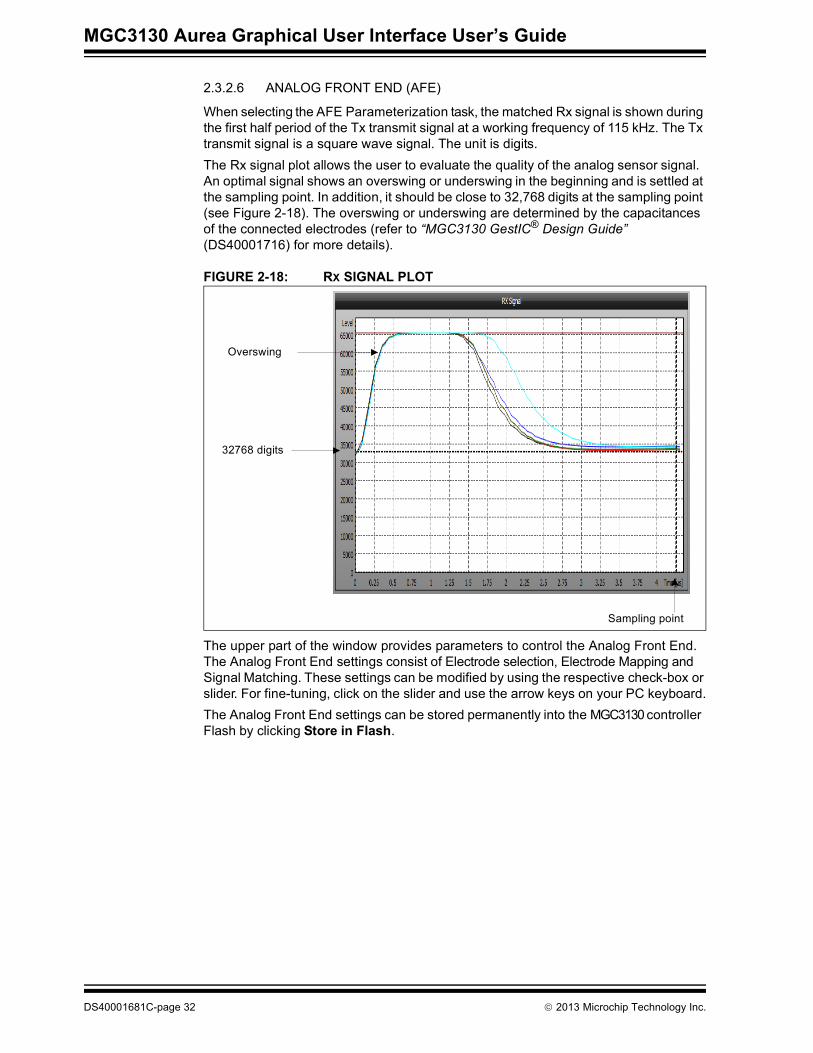
When selecting the AFE Parameterization task, the matched Rx signal is shown during the first half period of the Tx transmit signal at a working frequency of 115 kHz. The Tx transmit signal is a square wave signal. The unit is digits.The Rx signal plot allows the user to evaluate the quality of the analog sensor signal. An optimal signal shows an overswing or underswing in the beginning and is settled at the sampling point. In addition, it should be close to 32,768 digits at the sampling point (see Figure 2-18). The overswing or underswing are determined by the capacitances of the connected electrodes (refer to “MGC3130 GestIC® Design Guide” (DS40001716) for more details).
FIGURE 2-18: RX SIGNAL PLOT
The upper part of the window provides parameters to control the Analog Front End. The Analog Front End settings consist of Electrode selection, Electrode Mapping and Signal Matching. These settings can be modified by using the respective check-box or slider. For fine-tuning, click on the slider and use the arrow keys on your PC keyboard.The Analog Front End settings can be stored permanently into the MGC3130 controller Flash by clicking Store in Flash.
32768 digits
Sampling point
Overswing
DS40001681C-page 32 2013 Microchip Technology Inc.
Aurea Tabs
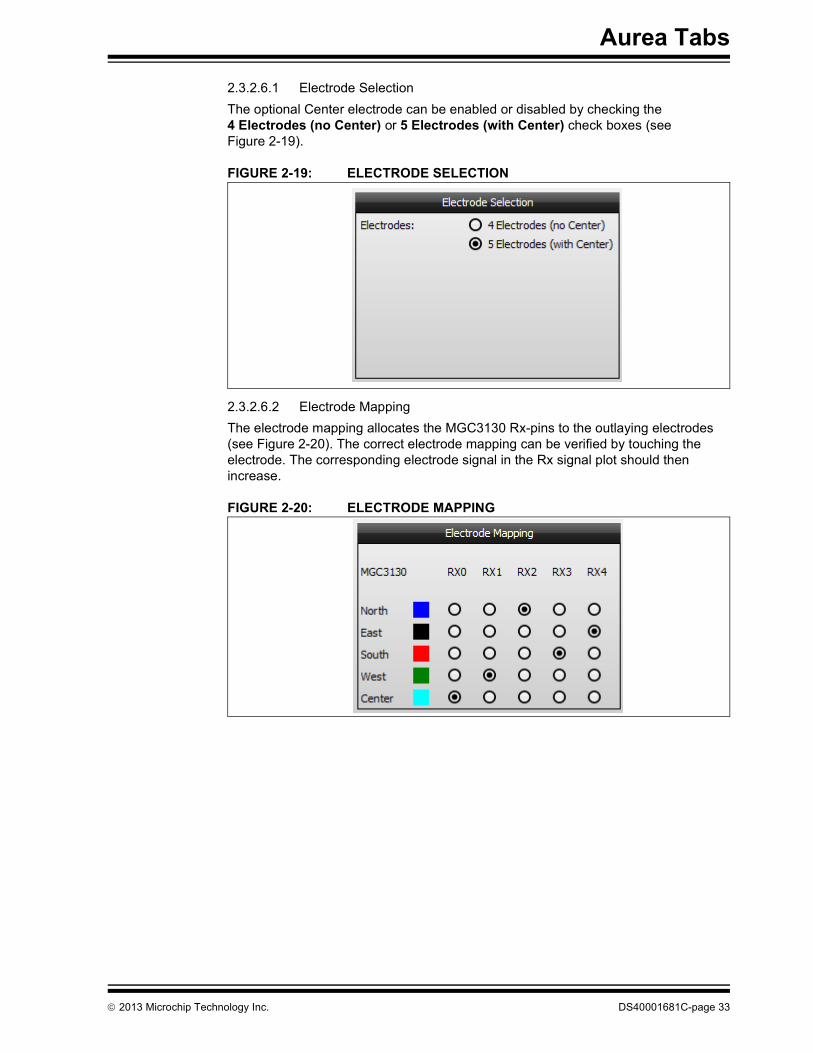
2.3.2.6.1 Electrode SelectionThe optional Center electrode can be enabled or disabled by checking the 4 Electrodes (no Center) or 5 Electrodes (with Center) check boxes (see Figure 2-19).
FIGURE 2-19: ELECTRODE SELECTION
2.3.2.6.2 Electrode MappingThe electrode mapping allocates the MGC3130 Rx-pins to the outlaying electrodes (see Figure 2-20). The correct electrode mapping can be verified by touching the electrode. The corresponding electrode signal in the Rx signal plot should then increase.
FIGURE 2-20: ELECTRODE MAPPING
2013 Microchip Technology Inc. DS40001681C-page 33
MGC3130 Aurea Graphical User Interface User’s Guide
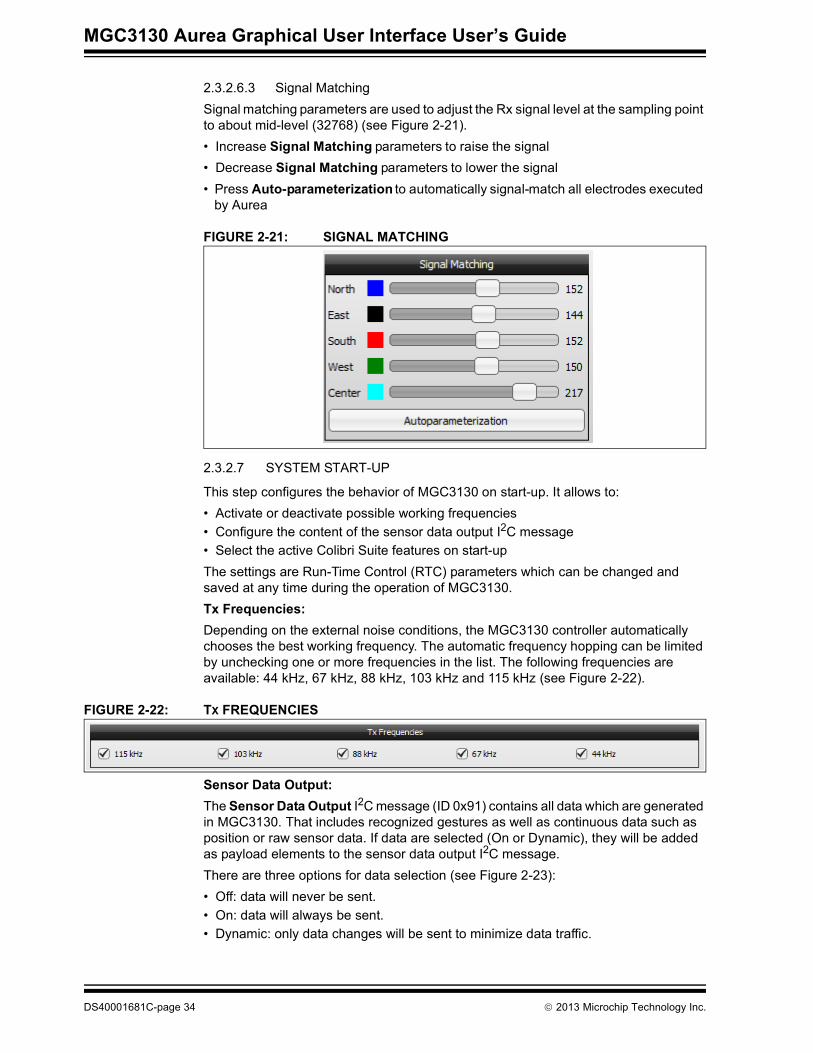
2.3.2.6.3 Signal MatchingSignal matching parameters are used to adjust the Rx signal level at the sampling point to about mid-level (32768) (see Figure 2-21).• Increase Signal Matching parameters to raise the signal• Decrease Signal Matching parameters to lower the signal• Press Auto-parameterization to automatically signal-match all electrodes executed
by Aurea
FIGURE 2-21: SIGNAL MATCHING
2.3.2.7 SYSTEM START-UP
This step configures the behavior of MGC3130 on start-up. It allows to:• Activate or deactivate possible working frequencies• Configure the content of the sensor data output I2C message• Select the active Colibri Suite features on start-upThe settings are Run-Time Control (RTC) parameters which can be changed and saved at any time during the operation of MGC3130.Tx Frequencies:Depending on the external noise conditions, the MGC3130 controller automatically chooses the best working frequency. The automatic frequency hopping can be limited by unchecking one or more frequencies in the list. The following frequencies are available: 44 kHz, 67 kHz, 88 kHz, 103 kHz and 115 kHz (see Figure 2-22).
FIGURE 2-22: TX FREQUENCIES
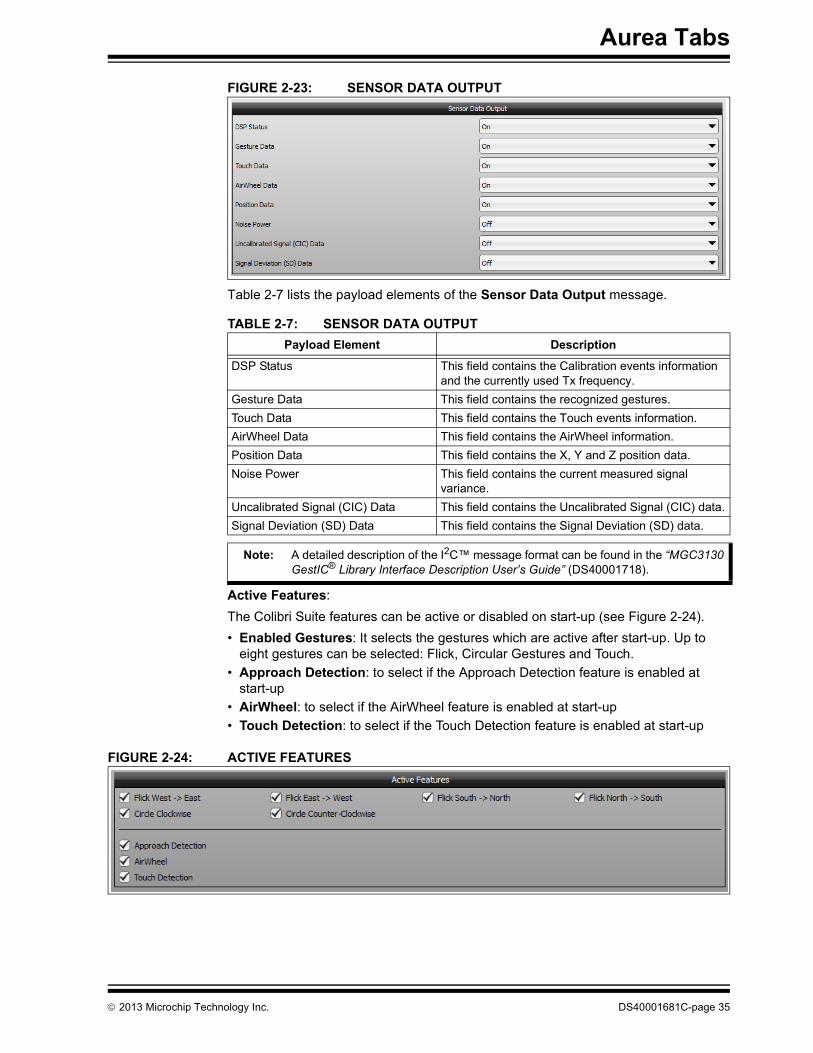
Sensor Data Output:The Sensor Data Output I2C message (ID 0x91) contains all data which are generated in MGC3130. That includes recognized gestures as well as continuous data such as position or raw sensor data. If data are selected (On or Dynamic), they will be added as payload elements to the sensor data output I2C message.There are three options for data selection (see Figure 2-23):• Off: data will never be sent.• On: data will always be sent.• Dynamic: only data changes will be sent to minimize data traffic.
DS40001681C-page 34 2013 Microchip Technology Inc.
Aurea Tabs
FIGURE 2-23: SENSOR DATA OUTPUT
Table 2-7 lists the payload elements of the Sensor Data Output message.
Active Features:The Colibri Suite features can be active or disabled on start-up (see Figure 2-24).• Enabled Gestures: It selects the gestures which are active after start-up. Up to
eight gestures can be selected: Flick, Circular Gestures and Touch.• Approach Detection: to select if the Approach Detection feature is enabled at
start-up• AirWheel: to select if the AirWheel feature is enabled at start-up• Touch Detection: to select if the Touch Detection feature is enabled at start-up
FIGURE 2-24: ACTIVE FEATURES
TABLE 2-7: SENSOR DATA OUTPUTPayload Element Description
DSP Status This field contains the Calibration events information and the currently used Tx frequency.
Gesture Data This field contains the recognized gestures.Touch Data This field contains the Touch events information.AirWheel Data This field contains the AirWheel information.Position Data This field contains the X, Y and Z position data.Noise Power This field contains the current measured signal
variance.Uncalibrated Signal (CIC) Data This field contains the Uncalibrated Signal (CIC) data.Signal Deviation (SD) Data This field contains the Signal Deviation (SD) data.
Note: A detailed description of the I2C™ message format can be found in the “MGC3130 GestIC® Library Interface Description User’s Guide” (DS40001718).
2013 Microchip Technology Inc. DS40001681C-page 35
MGC3130 Aurea Graphical User Interface User’s Guide
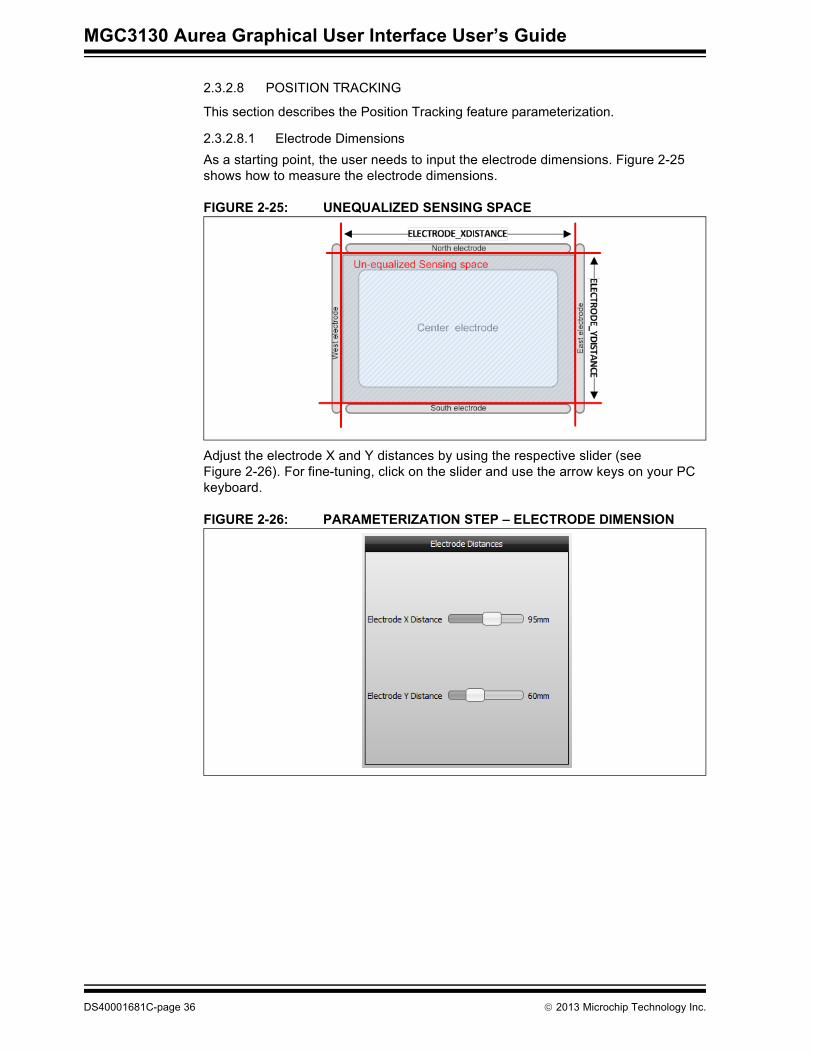
2.3.2.8 POSITION TRACKING
This section describes the Position Tracking feature parameterization.
2.3.2.8.1 Electrode DimensionsAs a starting point, the user needs to input the electrode dimensions. Figure 2-25 shows how to measure the electrode dimensions.
FIGURE 2-25: UNEQUALIZED SENSING SPACE
Adjust the electrode X and Y distances by using the respective slider (see Figure 2-26). For fine-tuning, click on the slider and use the arrow keys on your PC keyboard.
FIGURE 2-26: PARAMETERIZATION STEP – ELECTRODE DIMENSION
DS40001681C-page 36 2013 Microchip Technology Inc.

Aurea Tabs
2.3.2.8.2 Electrode WeightingDuring the Electrode Weighting step, five measurements with brick and five corresponding reference measurements without a brick are conducted at a constant Z-level of 30 mm. Always use the 30 mm Styrofoam spacer brick to establish the distance between hand brick and electrodes. The drawing in the Electrode Weighting step will show where to place the brick for the current measurement (West, North, East, South and Center) (see Figure 2-27).
FIGURE 2-27: ELECTRODE WEIGHTING – ANIMATION BRICK POSITION
The button Start Measurement will trigger the measurement. After pressing the button, a progress bar in the Visualization window will occur (see Figure 2-28).
FIGURE 2-28: ELECTRODE WEIGHTING – PROGRESS BAR
Note: It is not necessary to adjust or correct the 30 mm Styrofoam spacer brick for the thickness of the target device’s housing or for a decoration layer covering the electrodes.
2013 Microchip Technology Inc. DS40001681C-page 37
MGC3130 Aurea Graphical User Interface User’s Guide
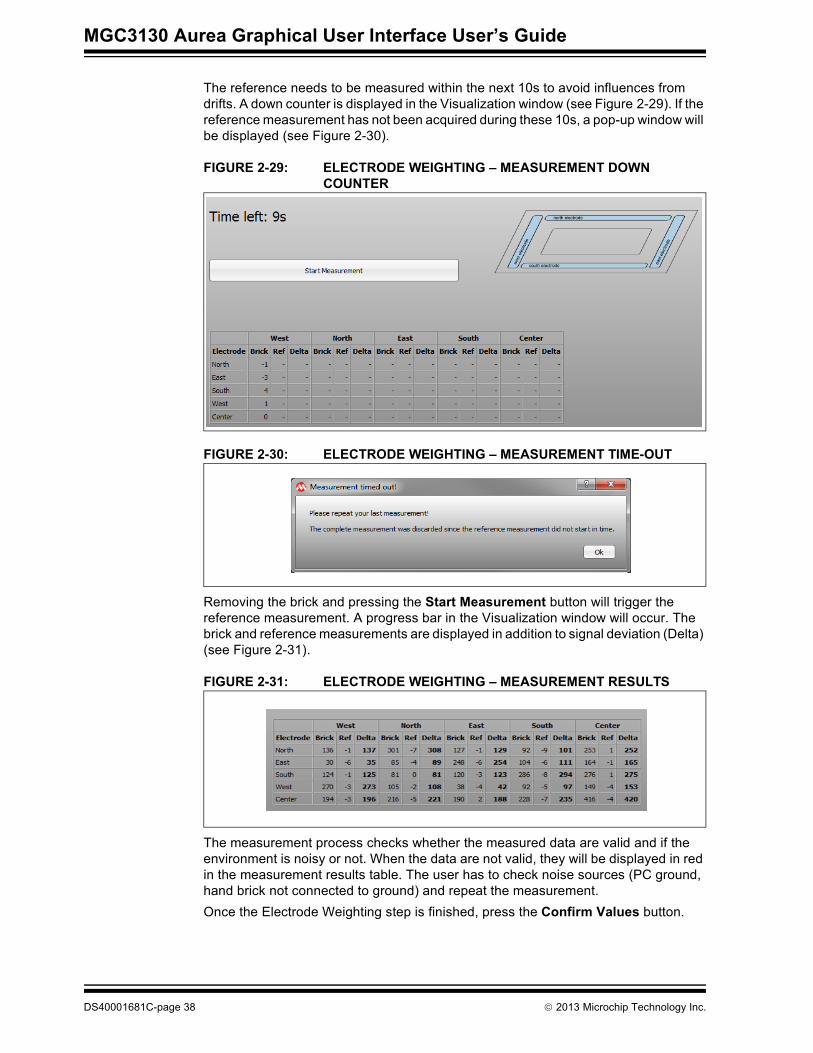
The reference needs to be measured within the next 10s to avoid influences from drifts. A down counter is displayed in the Visualization window (see Figure 2-29). If the reference measurement has not been acquired during these 10s, a pop-up window will be displayed (see Figure 2-30).
FIGURE 2-29: ELECTRODE WEIGHTING – MEASUREMENT DOWN COUNTER
FIGURE 2-30: ELECTRODE WEIGHTING – MEASUREMENT TIME-OUT
Removing the brick and pressing the Start Measurement button will trigger the reference measurement. A progress bar in the Visualization window will occur. The brick and reference measurements are displayed in addition to signal deviation (Delta) (see Figure 2-31).
FIGURE 2-31: ELECTRODE WEIGHTING – MEASUREMENT RESULTS
The measurement process checks whether the measured data are valid and if the environment is noisy or not. When the data are not valid, they will be displayed in red in the measurement results table. The user has to check noise sources (PC ground, hand brick not connected to ground) and repeat the measurement.Once the Electrode Weighting step is finished, press the Confirm Values button.
DS40001681C-page 38 2013 Microchip Technology Inc.
Aurea Tabs
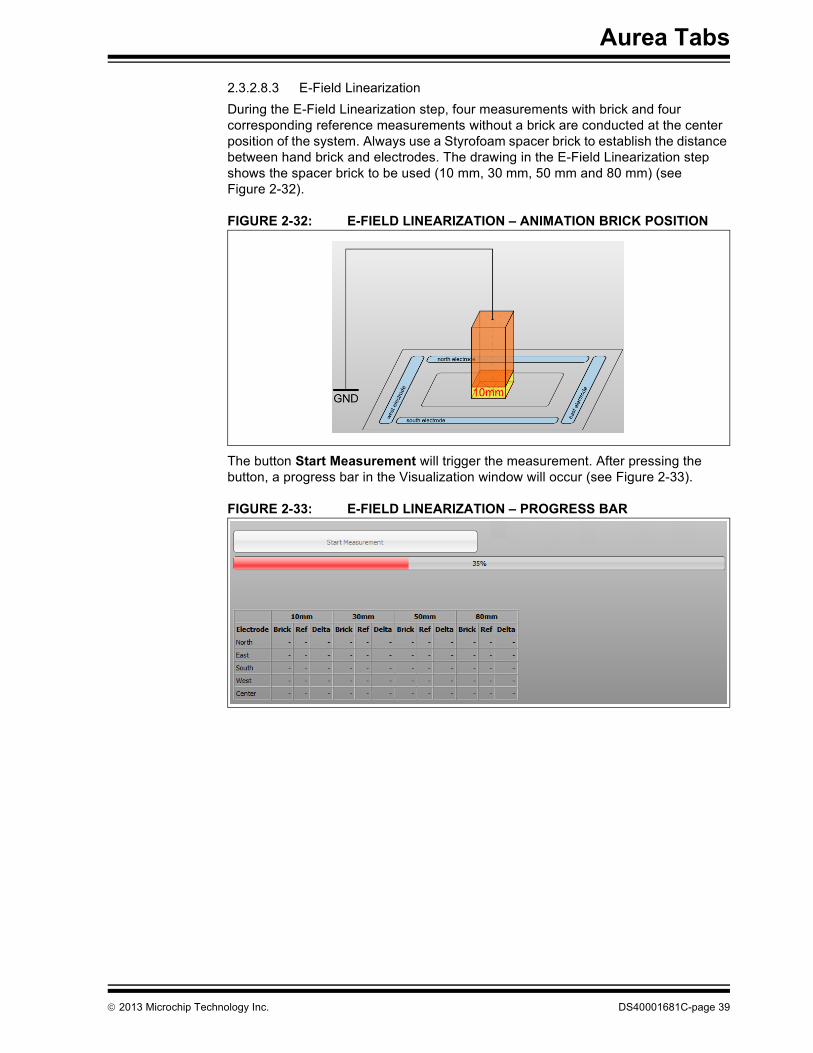
2.3.2.8.3 E-Field LinearizationDuring the E-Field Linearization step, four measurements with brick and four corresponding reference measurements without a brick are conducted at the center position of the system. Always use a Styrofoam spacer brick to establish the distance between hand brick and electrodes. The drawing in the E-Field Linearization step shows the spacer brick to be used (10 mm, 30 mm, 50 mm and 80 mm) (see Figure 2-32).
FIGURE 2-32: E-FIELD LINEARIZATION – ANIMATION BRICK POSITION
The button Start Measurement will trigger the measurement. After pressing the button, a progress bar in the Visualization window will occur (see Figure 2-33).
FIGURE 2-33: E-FIELD LINEARIZATION – PROGRESS BAR
2013 Microchip Technology Inc. DS40001681C-page 39

MGC3130 Aurea Graphical User Interface User’s Guide
The reference needs to be measured within the next 10s to avoid influences from drifts. A down counter is displayed in the Visualization window (see Figure 2-34). If the reference measurement has not been acquired during these 10s, a pop-up window will be displayed (see Figure 2-35).
FIGURE 2-34: E-FIELD LINEARIZATION – MEASUREMENT DOWN COUNTER
FIGURE 2-35: E-FIELD LINEARIZATION – MEASUREMENT TIME-OUT
Removing the brick and pressing the button Start Measurement will trigger the reference measurement. A progress bar will occur in the Visualization window. The brick and reference measurements are displayed in addition to signal deviation (Delta) (see Figure 2-36).
FIGURE 2-36: E-FIELD LINEARIZATION – MEASUREMENT RESULTS
The measurement process checks if the measured data are valid or not and if the environment is noisy or not. When the data are not valid, it will be displayed in red in the measurement results table. The user has to check noise sources (PC ground, hand brick not connected to ground) and repeat the measurement.Once the E-Field Linearization step is finished, press the Confirm Values button.
DS40001681C-page 40 2013 Microchip Technology Inc.
Aurea Tabs
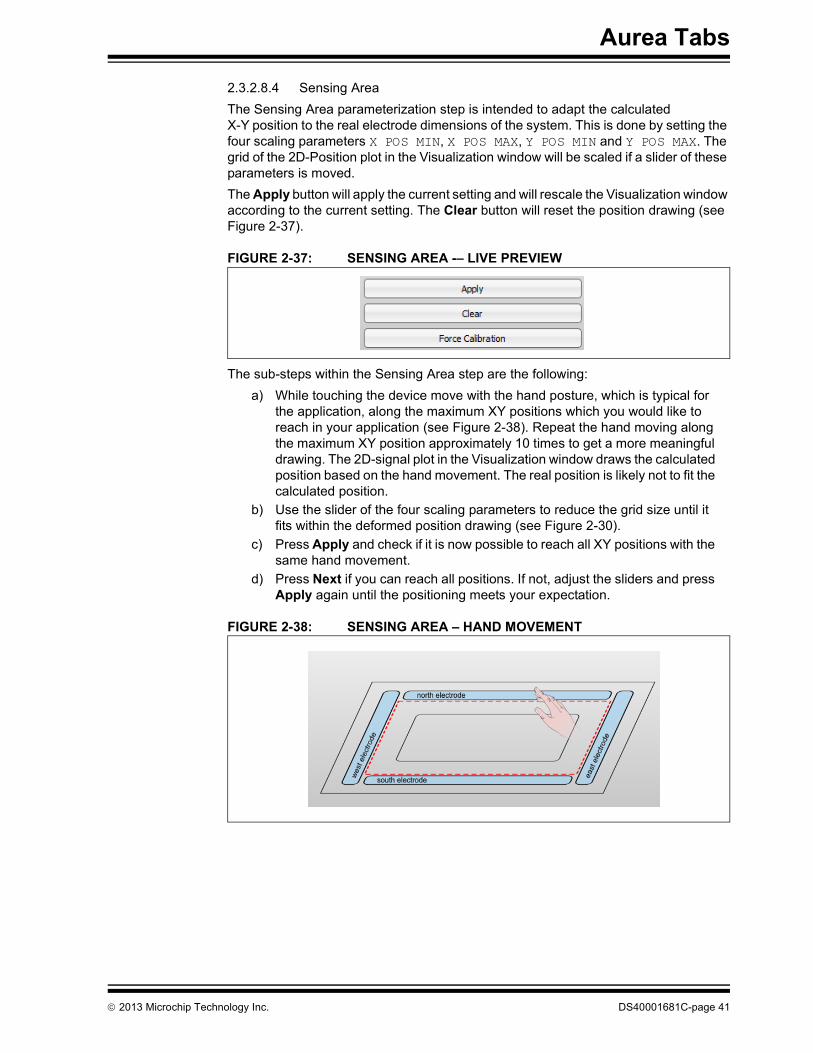
2.3.2.8.4 Sensing AreaThe Sensing Area parameterization step is intended to adapt the calculated X-Y position to the real electrode dimensions of the system. This is done by setting the four scaling parameters X POS MIN, X POS MAX, Y POS MIN and Y POS MAX. The grid of the 2D-Position plot in the Visualization window will be scaled if a slider of these parameters is moved.The Apply button will apply the current setting and will rescale the Visualization window according to the current setting. The Clear button will reset the position drawing (see Figure 2-37).
FIGURE 2-37: SENSING AREA -– LIVE PREVIEW
The sub-steps within the Sensing Area step are the following:a) While touching the device move with the hand posture, which is typical for
the application, along the maximum XY positions which you would like to reach in your application (see Figure 2-38). Repeat the hand moving along the maximum XY position approximately 10 times to get a more meaningful drawing. The 2D-signal plot in the Visualization window draws the calculated position based on the hand movement. The real position is likely not to fit the calculated position.
b) Use the slider of the four scaling parameters to reduce the grid size until it fits within the deformed position drawing (see Figure 2-30).
c) Press Apply and check if it is now possible to reach all XY positions with the same hand movement.
d) Press Next if you can reach all positions. If not, adjust the sliders and press Apply again until the positioning meets your expectation.
FIGURE 2-38: SENSING AREA – HAND MOVEMENT
2013 Microchip Technology Inc. DS40001681C-page 41
MGC3130 Aurea Graphical User Interface User’s Guide
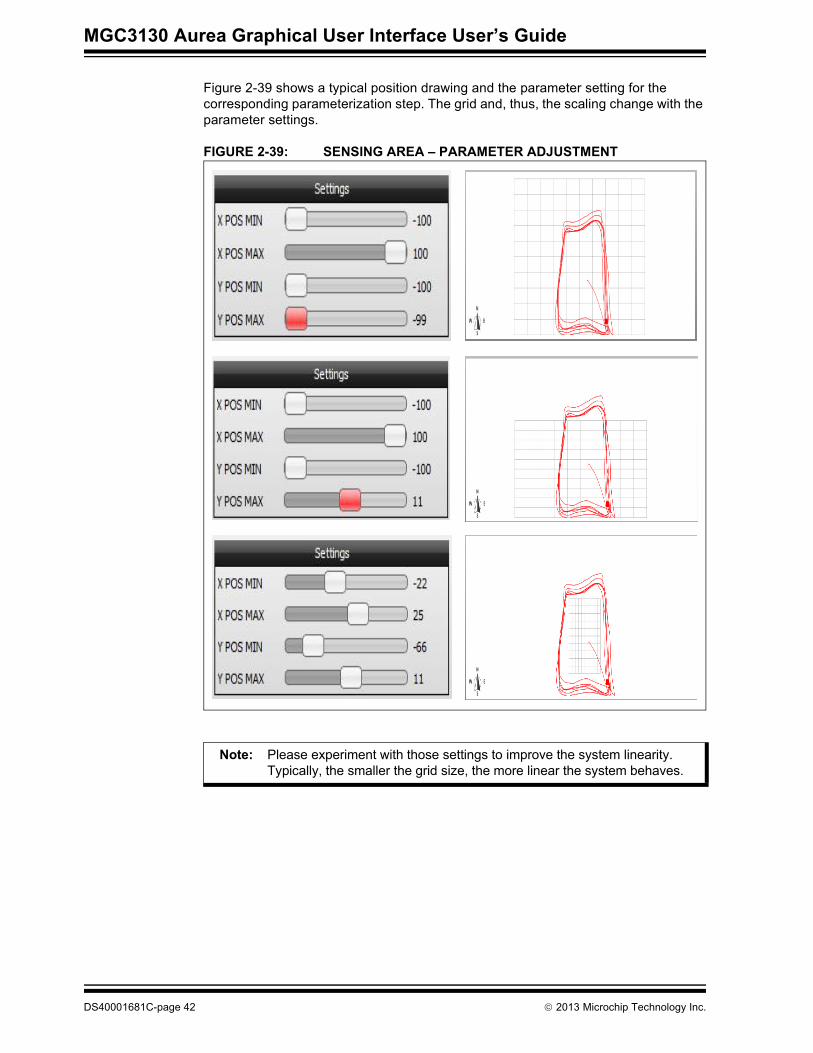
Figure 2-39 shows a typical position drawing and the parameter setting for the corresponding parameterization step. The grid and, thus, the scaling change with the parameter settings.
FIGURE 2-39: SENSING AREA – PARAMETER ADJUSTMENT
Note: Please experiment with those settings to improve the system linearity. Typically, the smaller the grid size, the more linear the system behaves.
DS40001681C-page 42 2013 Microchip Technology Inc.

Aurea Tabs
2.3.2.8.5 Min. Distance LevelSimilar to the Sensing Area step which was intended to adjust the XY positioning, the Z-positioning step is intended to adjust the Z-position calculation. Z position is adjusted through two steps: minimum and maximum Z level.The first step is to adjust the minimum Z-distance level (Z = 0) by configuring the Z POS MIN parameter. This parameter can be modified by using the respective slider (see Figure 2-40). For fine-tuning, click on the slider and use the arrow keys on your PC keyboard.
FIGURE 2-40: TOUCH LEVEL – PARAMETER ADJUSTMENT
Touch the surface of the sensing area with the typical hand posture for the application and adjust the slider of Z POS MIN until the green Z level illustrated in the 3D-signal plot hits the zero level. In this manner, the zero level is the lowest level which is possible to reach in the 3D-signal plot (see Figure 2-41). The Z position must increase when the hand is moving up from the surface.
FIGURE 2-41: MIN. DISTANCE LEVEL
2013 Microchip Technology Inc. DS40001681C-page 43
MGC3130 Aurea Graphical User Interface User’s Guide
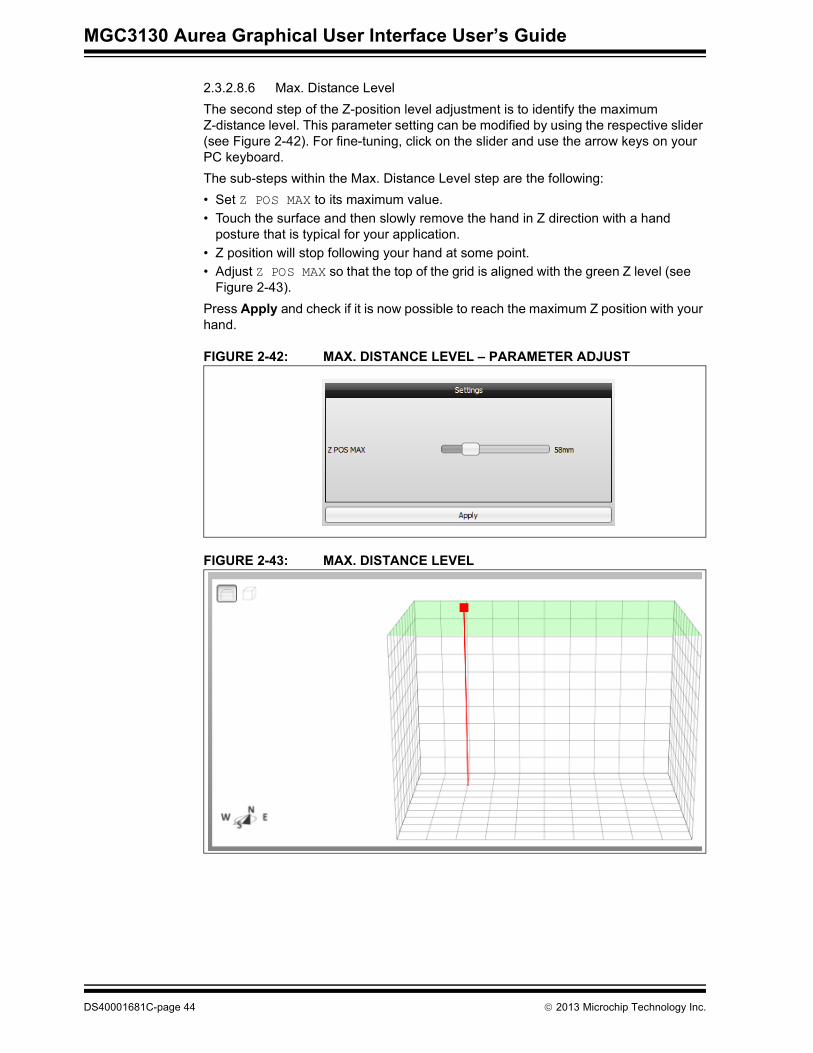
2.3.2.8.6 Max. Distance LevelThe second step of the Z-position level adjustment is to identify the maximum Z-distance level. This parameter setting can be modified by using the respective slider (see Figure 2-42). For fine-tuning, click on the slider and use the arrow keys on your PC keyboard.The sub-steps within the Max. Distance Level step are the following:• Set Z POS MAX to its maximum value.• Touch the surface and then slowly remove the hand in Z direction with a hand
posture that is typical for your application.• Z position will stop following your hand at some point.• Adjust Z POS MAX so that the top of the grid is aligned with the green Z level (see
Figure 2-43).Press Apply and check if it is now possible to reach the maximum Z position with your hand.
FIGURE 2-42: MAX. DISTANCE LEVEL – PARAMETER ADJUST
FIGURE 2-43: MAX. DISTANCE LEVEL
DS40001681C-page 44 2013 Microchip Technology Inc.
Aurea Tabs
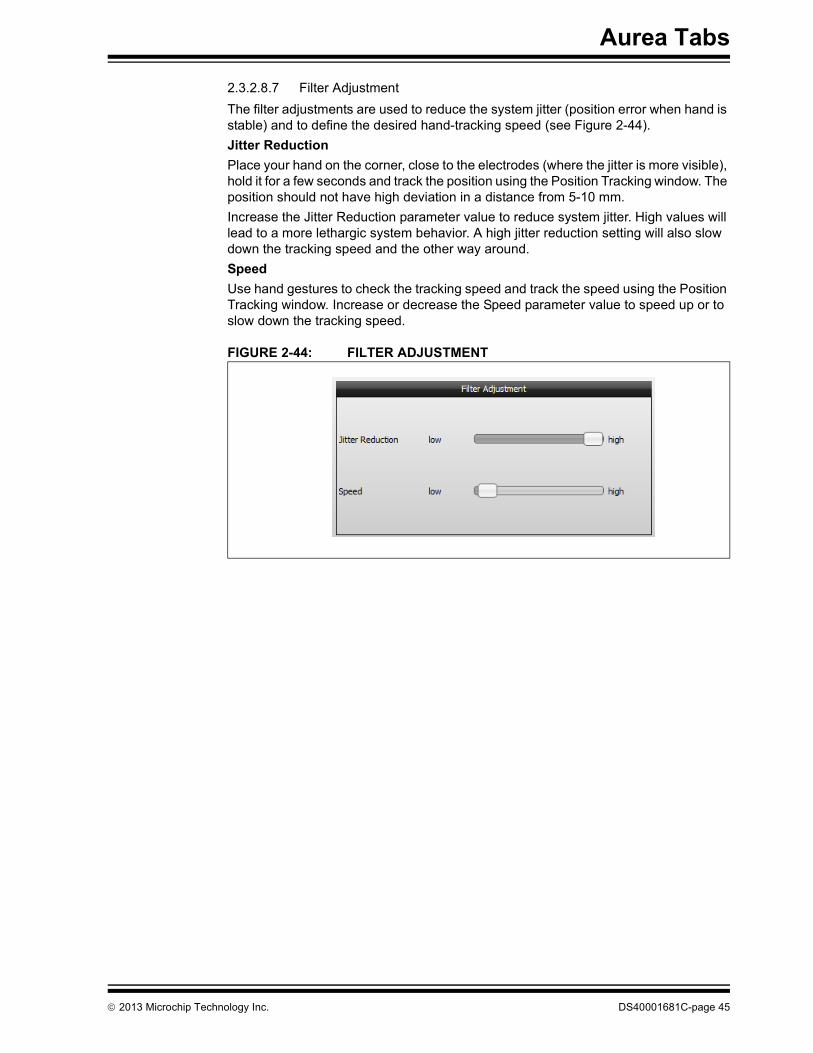
2.3.2.8.7 Filter AdjustmentThe filter adjustments are used to reduce the system jitter (position error when hand is stable) and to define the desired hand-tracking speed (see Figure 2-44).Jitter ReductionPlace your hand on the corner, close to the electrodes (where the jitter is more visible), hold it for a few seconds and track the position using the Position Tracking window. The position should not have high deviation in a distance from 5-10 mm.Increase the Jitter Reduction parameter value to reduce system jitter. High values will lead to a more lethargic system behavior. A high jitter reduction setting will also slow down the tracking speed and the other way around.SpeedUse hand gestures to check the tracking speed and track the speed using the Position Tracking window. Increase or decrease the Speed parameter value to speed up or to slow down the tracking speed.
FIGURE 2-44: FILTER ADJUSTMENT
2013 Microchip Technology Inc. DS40001681C-page 45
MGC3130 Aurea Graphical User Interface User’s Guide
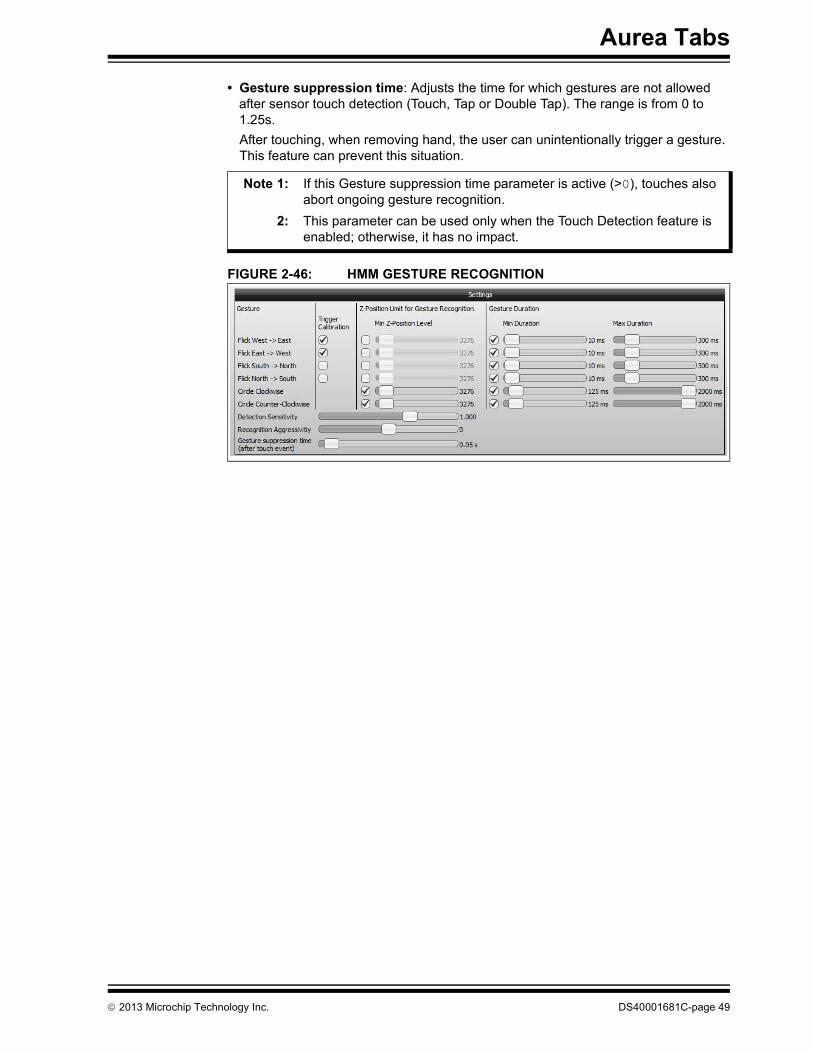
2.3.2.9 HMM GESTURE RECOGNITION
The Colibri Suite uses Hidden Markov Models (HMM) providing user-independent gesture recognition. Gesture recognition starts when a hand enters the sensing area or when a movement is detected after a resting period. A gesture ends when the hand leaves or rests inside the sensing area. Gestures can have various sizes and can be performed at various speeds within defined limits. For instance, gesture recognition does not trigger when the movement of a gesture is very slow or particularly fast.The gestures settings provided within this step are (see Figure 2-46):• Trigger Calibration• Z-Position Limit for Gesture Recognition• Minimum and Maximum Duration• Detection Sensitivity• Recognition Aggressivity• Suppression TimeThese parameters can be modified by using the respective slider. For fine-tuning of the parameters, click on the slider and use the arrow keys on your keyboard. The Gestures and XYZ Position visualization windows give immediate feedback upon parameter adjustment.• Trigger Calibration: The Colibri Suite provides the functionality to calibrate the
sensor manually (adapt the electrode system to environmental changes). It is recommended that the sensor is not influenced by the user when executing a calibration. Colibri Suite can use flick gestures to force a system calibration, as it is expected that, by the end of the Flick event, the hand has already crossed the entire sensitive area. The idle system is properly calibrated when the Signal Deviation of all channels is at or near zero. Immediate feedback is given by the calibration indication in Aurea Status Bar. Each time a selected gesture is performed, the calibration indication blinks. To select the gestures which are used to trigger a Colibri Suite calibration, check the corresponding check-box. Up to four flick gestures can be selected.
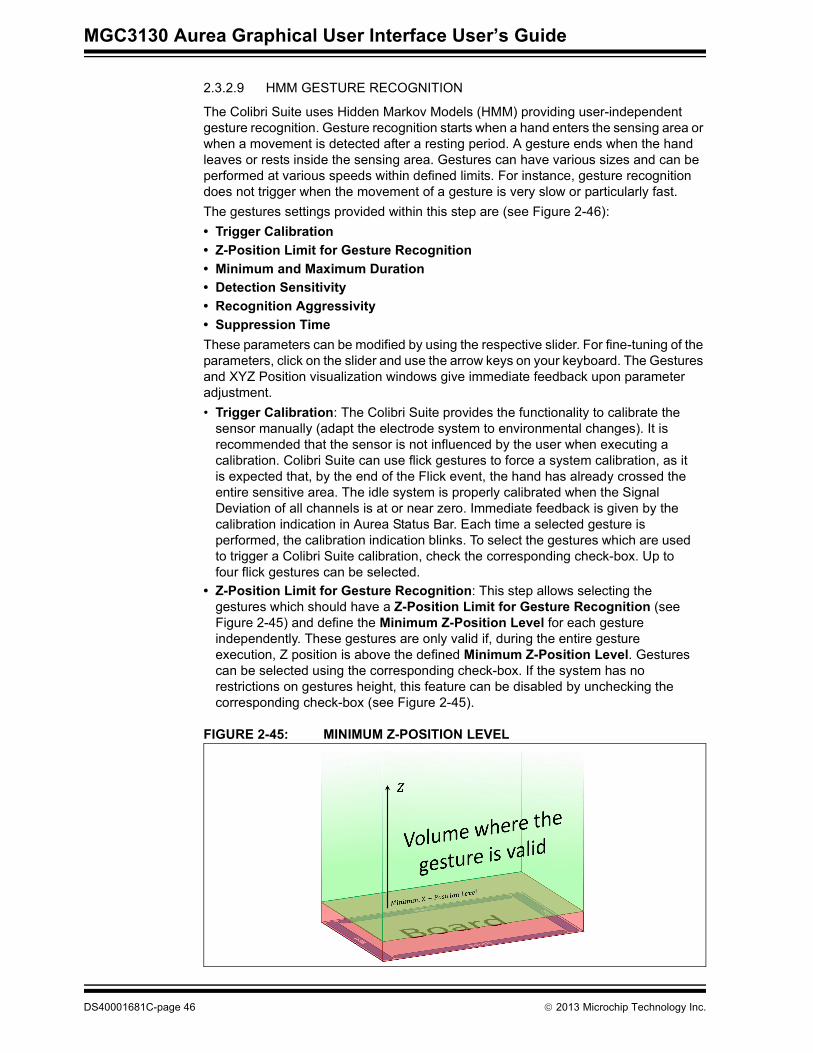
• Z-Position Limit for Gesture Recognition: This step allows selecting the gestures which should have a Z-Position Limit for Gesture Recognition (see Figure 2-45) and define the Minimum Z-Position Level for each gesture independently. These gestures are only valid if, during the entire gesture execution, Z position is above the defined Minimum Z-Position Level. Gestures can be selected using the corresponding check-box. If the system has no restrictions on gestures height, this feature can be disabled by unchecking the corresponding check-box (see Figure 2-45).
FIGURE 2-45: MINIMUM Z-POSITION LEVEL
DS40001681C-page 46 2013 Microchip Technology Inc.
Aurea Tabs
The Minimum Z-Position Level can be modified by using the respective slider. For fine-tuning, click on the slider and use the arrow keys on your PC keyboard. The range for this slider is 0 to 65535.To adjust Minimum Z-Position Level, please proceed as follows:
1. Adjust the slider of Min Z-Position Level to the maximum value.2. Perform the gesture with the typical hand posture for the application and at
the minimum distance desired for the application.3. Decrease the value until the gestures are correctly recognized. Lower values
mean gestures can be recognized at lower Z-position levels. Gestures performed at higher distances should be recognized.
• Gesture Duration: This step selects the gestures which should have duration limits and define the minimum and the maximum duration for each gesture independently. These gestures are only valid if their durations are in the range of the minimum and maximum values.Min Duration: It specifies the minimum amount of time that gestures have to last in order to be detected.Max Duration: It specifies the maximum amount of time that gestures should not exceed in order to be detected. This limit is always higher than the Limit Min Duration.Min Duration < Gesture Duration < Max Duration
Gestures can be selected using the corresponding check-box. If the system has no restrictions on gestures duration, this feature can be disabled by unchecking the corresponding check-box.The minimum and maximum durations can be modified by using the respective slider. For fine-tuning, click on the slider and use the arrow keys on your PC keyboard. The range for this slider is 0 to 2000ms.To adjust Min and Max Duration Time, proceed as follows:
1. Adjust the slider of Min Duration to a higher value.2. Perform the corresponding gestures with the highest speed allowed for the
application.3. Decrease the slider until the gestures are recognized correctly.4. Adjust the slider of Max Duration to a lower value, above Min Duration;5. Perform the corresponding gestures with the lowest speed allowed for the
application.6. Increase the slider until the gestures are recognized correctly.
Note 1: Only flick and discrete circular gestures can be selected.2: This feature depends on correct parameterization of Position Tracking.
Without it, Z position can be erroneous and lead to bad recognition performance.
2013 Microchip Technology Inc. DS40001681C-page 47
MGC3130 Aurea Graphical User Interface User’s Guide
• Detection Sensitivity: It is a gain which needs to be adjusted depending on expected system noise. With low values, gestures have to be performed very close to the electrodes. High values increase sensitivity but are also less robust. The Detection Sensitivity values range between 0,01 and 10 digits.
To adjust Detection Sensitivity, please proceed as follows:1. For maximum robustness to noise:
a) Perform gestures as far away from the sensitive area as allowed by the application.
b) Reduce Detection Sensitivity until gestures are no longer detected.c) At this point, amplitude from performed gestures is not enough to trigger
gesture start. This is approximately the minimum sensitivity of the appli-cation.
2. For maximum system sensitivity:a) Perform gestures close to the sensitive area.b) Increase Detection Sensitivity until gestures are no longer detected.c) At this point, noise amplitude is enough to trigger gesture start. Noise is
mixed with the performed gesture signal and no valid gesture is recog-nized. This is approximately the maximum sensitivity of the application.
• Recognition Aggressivity: This parameter defines how exact gestures have to be performed in order to be recognized. Recognition Aggressivity will scale the probability threshold defined for each gesture.High Aggressivity will classify a gesture even if it has been very inaccurately performed (e.g., half circle classified as circle, diagonal flicks as flick etc.). Low Aggressivity yields a cautious system that only recognizes a gesture when it has been accurately performed (e.g., the user must perform a very round complete circle or several circles).The Recognition Aggressivity can be modified by using the corresponding slider. For fine-tuning, click on the slider and use the arrow keys on your PC keyboard. The range for this slider is -1 to 1.
To adjust Recognition Aggressivity, proceed as follows:1. Increase Recognition Aggressivity to the maximum value.2. Perform gestures in the most relaxed way the application will allow.3. Decrease Recognition Aggressivity until these gestures are no longer
recognized. The value achieved is the maximum Aggressivity allowed for the gesture performance.
Note: Very high sensitivity can prevent the system from working properly, since gesture recognition can be trigged by noise without any hand present in the sensitive area.
Note: This parameter also affects the AirWheel recognition.
DS40001681C-page 48 2013 Microchip Technology Inc.
Aurea Tabs
• Gesture suppression time: Adjusts the time for which gestures are not allowed after sensor touch detection (Touch, Tap or Double Tap). The range is from 0 to 1.25s.After touching, when removing hand, the user can unintentionally trigger a gesture. This feature can prevent this situation.
FIGURE 2-46: HMM GESTURE RECOGNITION
Note 1: If this Gesture suppression time parameter is active (>0), touches also abort ongoing gesture recognition.
2: This parameter can be used only when the Touch Detection feature is enabled; otherwise, it has no impact.
2013 Microchip Technology Inc. DS40001681C-page 49
MGC3130 Aurea Graphical User Interface User’s Guide
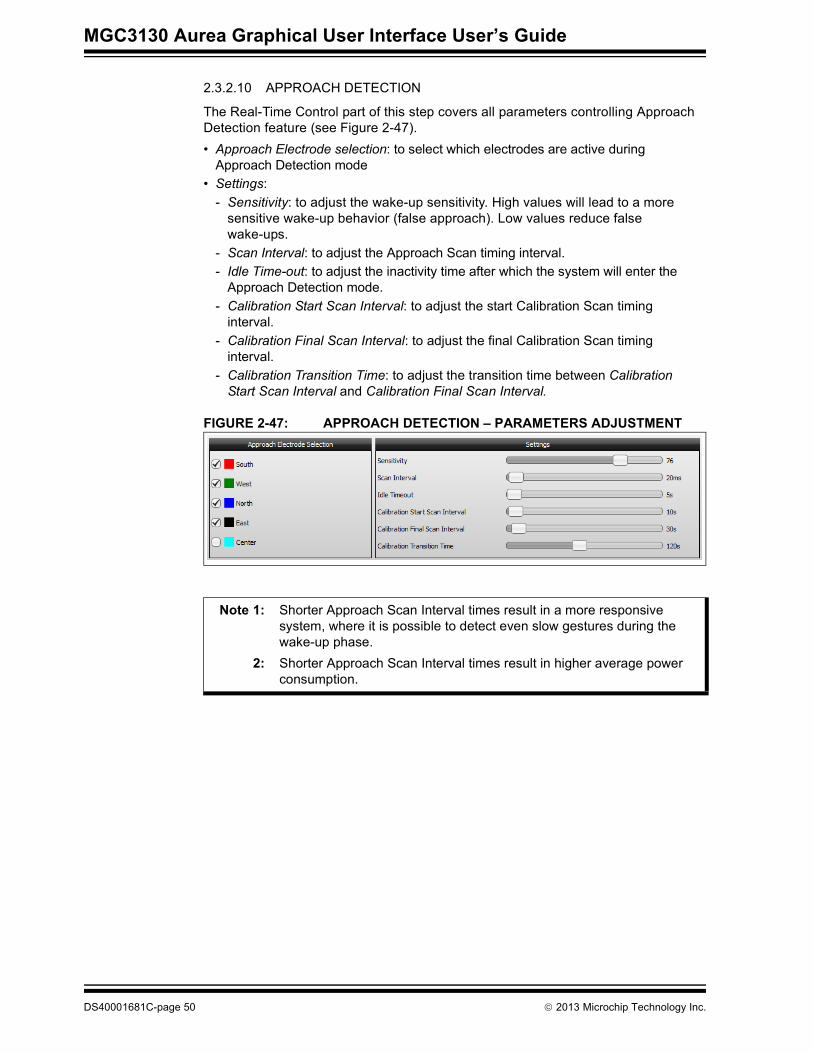
2.3.2.10 APPROACH DETECTION
The Real-Time Control part of this step covers all parameters controlling Approach Detection feature (see Figure 2-47).• Approach Electrode selection: to select which electrodes are active during
Approach Detection mode• Settings:
- Sensitivity: to adjust the wake-up sensitivity. High values will lead to a more sensitive wake-up behavior (false approach). Low values reduce false wake-ups.
- Scan Interval: to adjust the Approach Scan timing interval.- Idle Time-out: to adjust the inactivity time after which the system will enter the
Approach Detection mode.- Calibration Start Scan Interval: to adjust the start Calibration Scan timing
interval.- Calibration Final Scan Interval: to adjust the final Calibration Scan timing
interval.- Calibration Transition Time: to adjust the transition time between Calibration
Start Scan Interval and Calibration Final Scan Interval.
FIGURE 2-47: APPROACH DETECTION – PARAMETERS ADJUSTMENT
Note 1: Shorter Approach Scan Interval times result in a more responsive system, where it is possible to detect even slow gestures during the wake-up phase.
2: Shorter Approach Scan Interval times result in higher average power consumption.
DS40001681C-page 50 2013 Microchip Technology Inc.
Aurea Tabs
2.3.2.11 TOUCH DETECTION
The Real-Time Control part of this step covers all parameters controlling the Touch Detection feature (see Figure 2-49).• Threshold Settings: Touch Threshold North, East, South, West, Center: This
field specifies the SD values that have to be exceeded to validate the touch event. The range is 0 to 32000 LSB. The horizontal line in the Level window is adjusted according to the slider value.The sub-steps within the Touch Detection Threshold settings step are the following:1. Touch each electrode in its geometric center and move your finger to the
borders of the electrode while touching.2. Adjust corresponding Touch Threshold according to the displayed SD value
while your finger is positioned on the electrode. If touches are missed, you may need to decrease the Touch Threshold.
• Release Threshold: Touch state is released if SD value drops below a threshold which is calculated by SD value on Start of Touch * Release Threshold. The slider can be adjusted between 50% and 100%.- Touch each electrode in its geometric center and change the hand posture. If
touch state becomes released though you are still touching, decrease Release Threshold. If you lift your finger from the surface, but touch state is still signaled, increase Release Threshold.
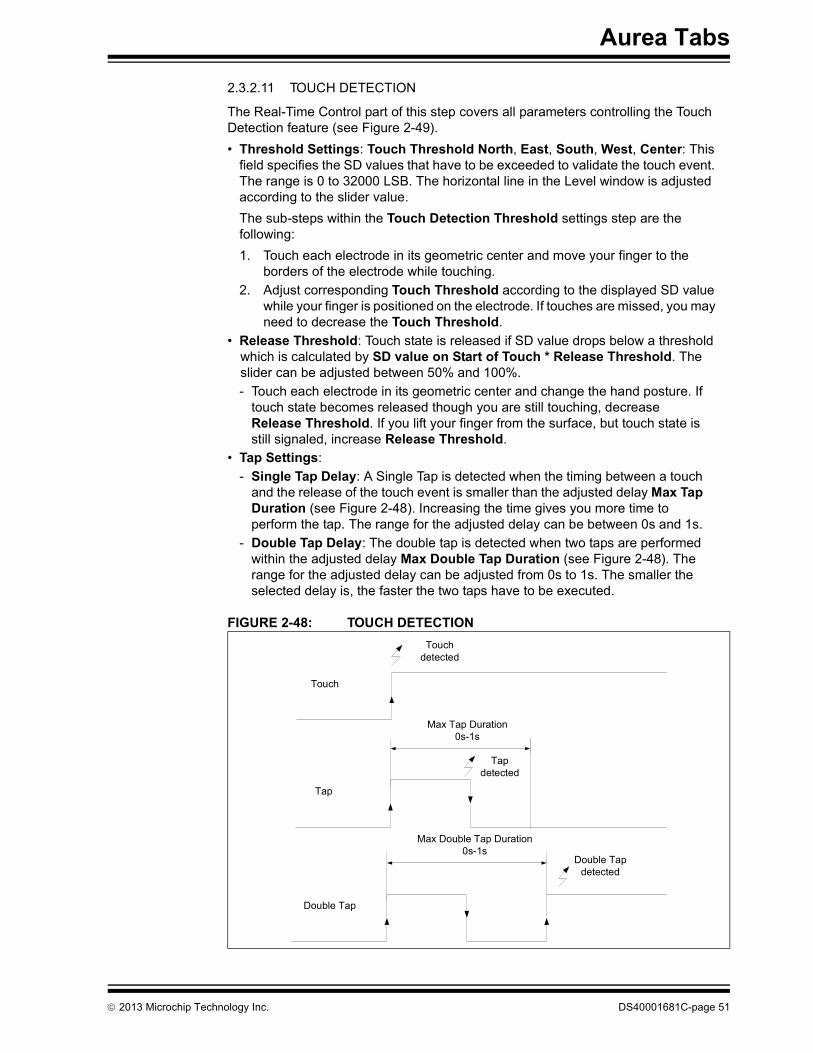
• Tap Settings:- Single Tap Delay: A Single Tap is detected when the timing between a touch
and the release of the touch event is smaller than the adjusted delay Max Tap Duration (see Figure 2-48). Increasing the time gives you more time to perform the tap. The range for the adjusted delay can be between 0s and 1s.
- Double Tap Delay: The double tap is detected when two taps are performed within the adjusted delay Max Double Tap Duration (see Figure 2-48). The range for the adjusted delay can be adjusted from 0s to 1s. The smaller the selected delay is, the faster the two taps have to be executed.
FIGURE 2-48: TOUCH DETECTION
Touch
Touch detected
Tap
Tap detected
Max Tap Duration0s-1s
Double Tap
Double Tap detected
Max Double Tap Duration0s-1s
2013 Microchip Technology Inc. DS40001681C-page 51

MGC3130 Aurea Graphical User Interface User’s Guide
FIGURE 2-49: TOUCH DETECTION – PARAMETERS ADJUSTMENT
2.3.2.12 AIRWHEEL
The AirWheel is part of the Colibri Suite’s circular gestures. It provides a counter which can be either increased or decreased. It increases with clockwise circles and decreases with counter-clockwise circles, being possible to invert direction while gesture is ongoing.The output value accumulates the angle change during circular movement. Its resolution is around 32 counts per full circle, but it may depend on configuration parameters and sensor board layout. Aurea displays the direction and the counter (see Figure 2-50).
FIGURE 2-50: POSITIVE DIRECTION AND MINIMUM ARC REPRESENTATION
DS40001681C-page 52 2013 Microchip Technology Inc.
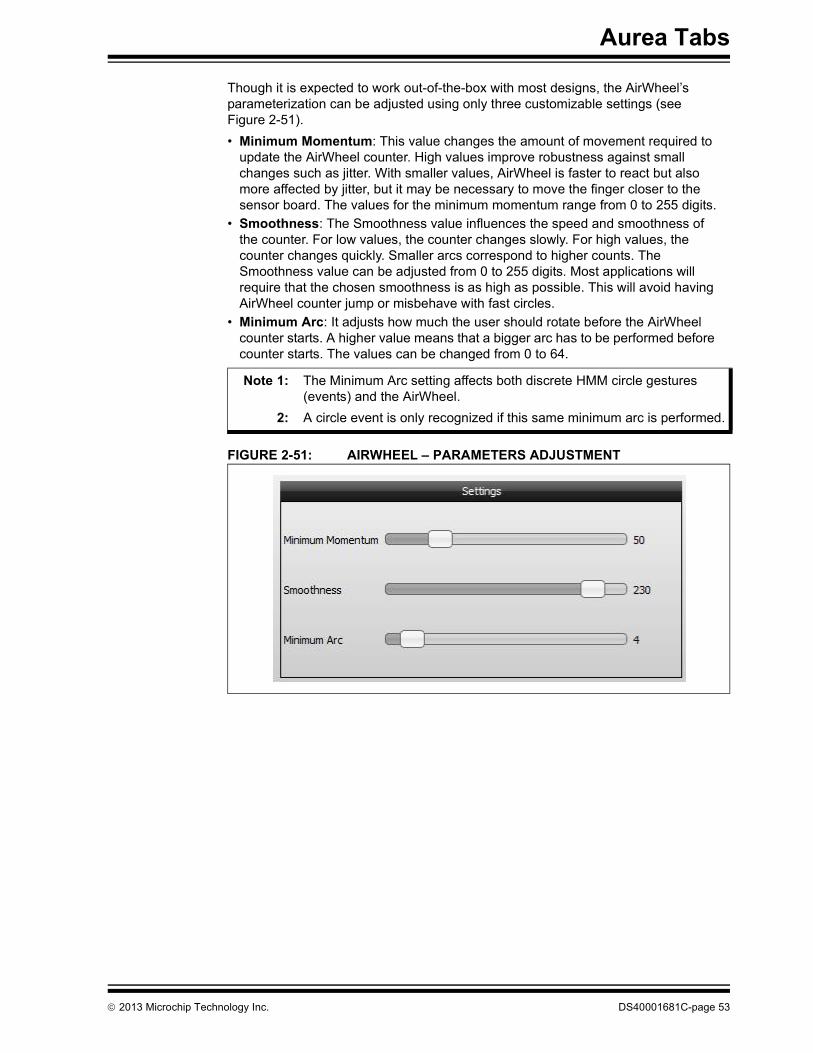
Aurea Tabs
Though it is expected to work out-of-the-box with most designs, the AirWheel’s parameterization can be adjusted using only three customizable settings (see Figure 2-51).• Minimum Momentum: This value changes the amount of movement required to
update the AirWheel counter. High values improve robustness against small changes such as jitter. With smaller values, AirWheel is faster to react but also more affected by jitter, but it may be necessary to move the finger closer to the sensor board. The values for the minimum momentum range from 0 to 255 digits.
• Smoothness: The Smoothness value influences the speed and smoothness of the counter. For low values, the counter changes slowly. For high values, the counter changes quickly. Smaller arcs correspond to higher counts. The Smoothness value can be adjusted from 0 to 255 digits. Most applications will require that the chosen smoothness is as high as possible. This will avoid having AirWheel counter jump or misbehave with fast circles.
• Minimum Arc: It adjusts how much the user should rotate before the AirWheel counter starts. A higher value means that a bigger arc has to be performed before counter starts. The values can be changed from 0 to 64.
FIGURE 2-51: AIRWHEEL – PARAMETERS ADJUSTMENT
Note 1: The Minimum Arc setting affects both discrete HMM circle gestures (events) and the AirWheel.
2: A circle event is only recognized if this same minimum arc is performed.
2013 Microchip Technology Inc. DS40001681C-page 53
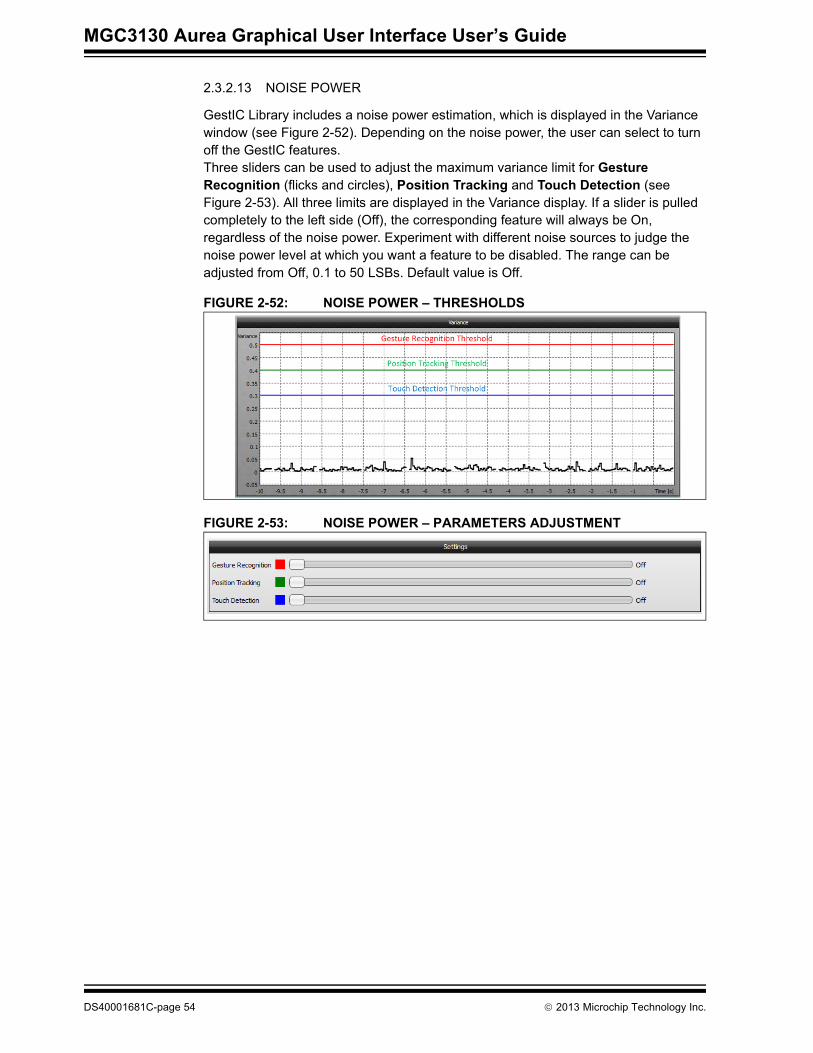
MGC3130 Aurea Graphical User Interface User’s Guide
2.3.2.13 NOISE POWER
GestIC Library includes a noise power estimation, which is displayed in the Variance window (see Figure 2-52). Depending on the noise power, the user can select to turn off the GestIC features.Three sliders can be used to adjust the maximum variance limit for Gesture Recognition (flicks and circles), Position Tracking and Touch Detection (see Figure 2-53). All three limits are displayed in the Variance display. If a slider is pulled completely to the left side (Off), the corresponding feature will always be On, regardless of the noise power. Experiment with different noise sources to judge the noise power level at which you want a feature to be disabled. The range can be adjusted from Off, 0.1 to 50 LSBs. Default value is Off.
FIGURE 2-52: NOISE POWER – THRESHOLDS
FIGURE 2-53: NOISE POWER – PARAMETERS ADJUSTMENT
DS40001681C-page 54 2013 Microchip Technology Inc.
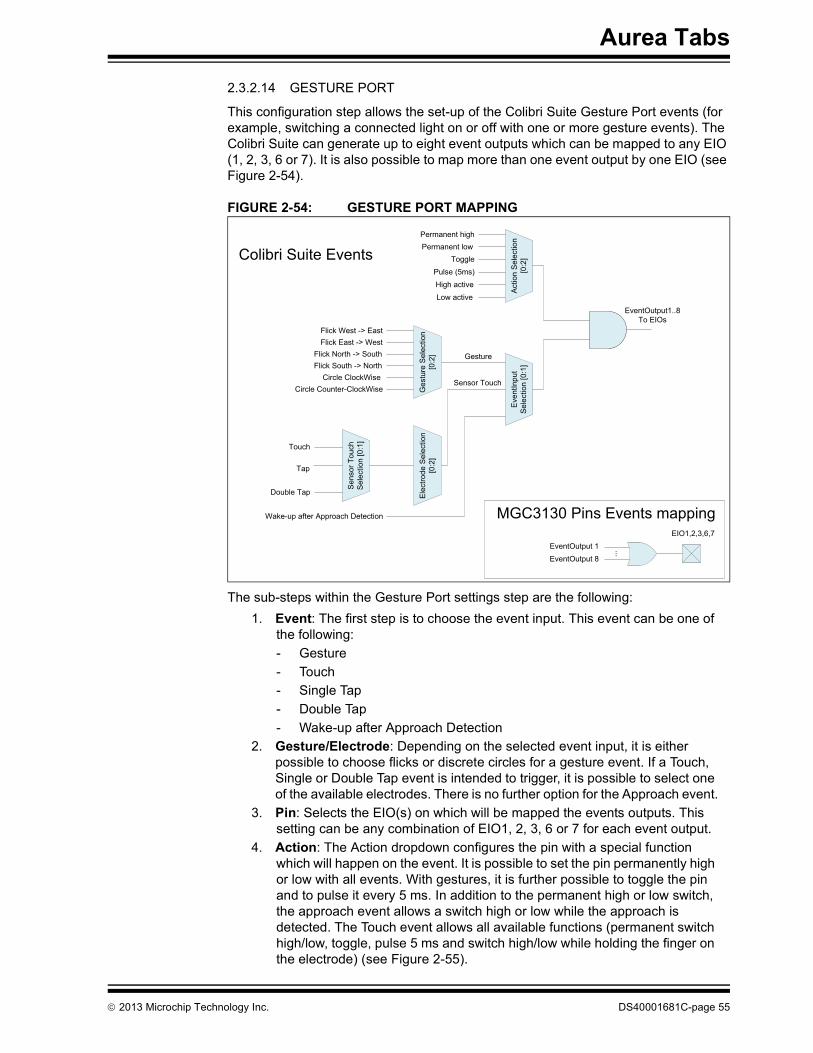
Aurea Tabs
2.3.2.14 GESTURE PORT
This configuration step allows the set-up of the Colibri Suite Gesture Port events (for example, switching a connected light on or off with one or more gesture events). The Colibri Suite can generate up to eight event outputs which can be mapped to any EIO (1, 2, 3, 6 or 7). It is also possible to map more than one event output by one EIO (see Figure 2-54).
FIGURE 2-54: GESTURE PORT MAPPING
The sub-steps within the Gesture Port settings step are the following:1. Event: The first step is to choose the event input. This event can be one of
the following:- Gesture- Touch- Single Tap- Double Tap- Wake-up after Approach Detection
2. Gesture/Electrode: Depending on the selected event input, it is either possible to choose flicks or discrete circles for a gesture event. If a Touch, Single or Double Tap event is intended to trigger, it is possible to select one of the available electrodes. There is no further option for the Approach event.
3. Pin: Selects the EIO(s) on which will be mapped the events outputs. This setting can be any combination of EIO1, 2, 3, 6 or 7 for each event output.
4. Action: The Action dropdown configures the pin with a special function which will happen on the event. It is possible to set the pin permanently high or low with all events. With gestures, it is further possible to toggle the pin and to pulse it every 5 ms. In addition to the permanent high or low switch, the approach event allows a switch high or low while the approach is detected. The Touch event allows all available functions (permanent switch high/low, toggle, pulse 5 ms and switch high/low while holding the finger on the electrode) (see Figure 2-55).
EventOutput1..8To EIOs
Ges
ture
Sel
ectio
n[0
:2]
Ele
ctro
deS
elec
tion
[0:2
]
Gesture
Wake-up after Approach DetectionA
ctio
nS
elec
tion
[0:2
]E
vent
Inpu
tS
elec
tion
[0:1
]
Sensor Touch
Flick West -> EastFlick East -> West
Flick North -> SouthFlick South -> North
Circle ClockWiseCircle Counter-ClockWise
Permanent highPermanent low
Sen
sorT
ouch
Sel
ectio
n[0
:1]
Touch
Tap
Double Tap
Colibri Suite Events
MGC3130 Pins Events mapping
High activeLow active
TogglePulse (5ms)
EIO1,2,3,6,7EventOutput 1EventOutput 8 ...
2013 Microchip Technology Inc. DS40001681C-page 55
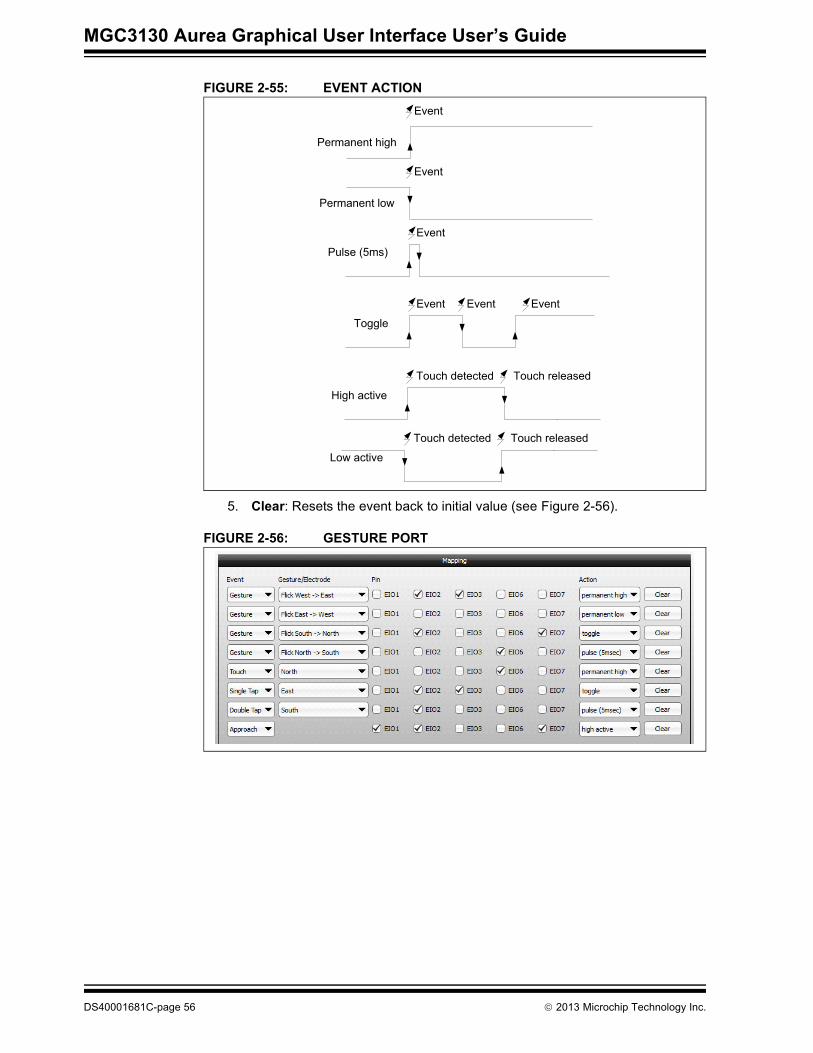
MGC3130 Aurea Graphical User Interface User’s Guide
FIGURE 2-55: EVENT ACTION
5. Clear: Resets the event back to initial value (see Figure 2-56).
FIGURE 2-56: GESTURE PORT
Permanent high
Toggle
Event
Event Event Event
Pulse (5ms)
Event
Permanent low
Event
High active
Touch detected Touch released
Low active
Touch detected Touch released
DS40001681C-page 56 2013 Microchip Technology Inc.
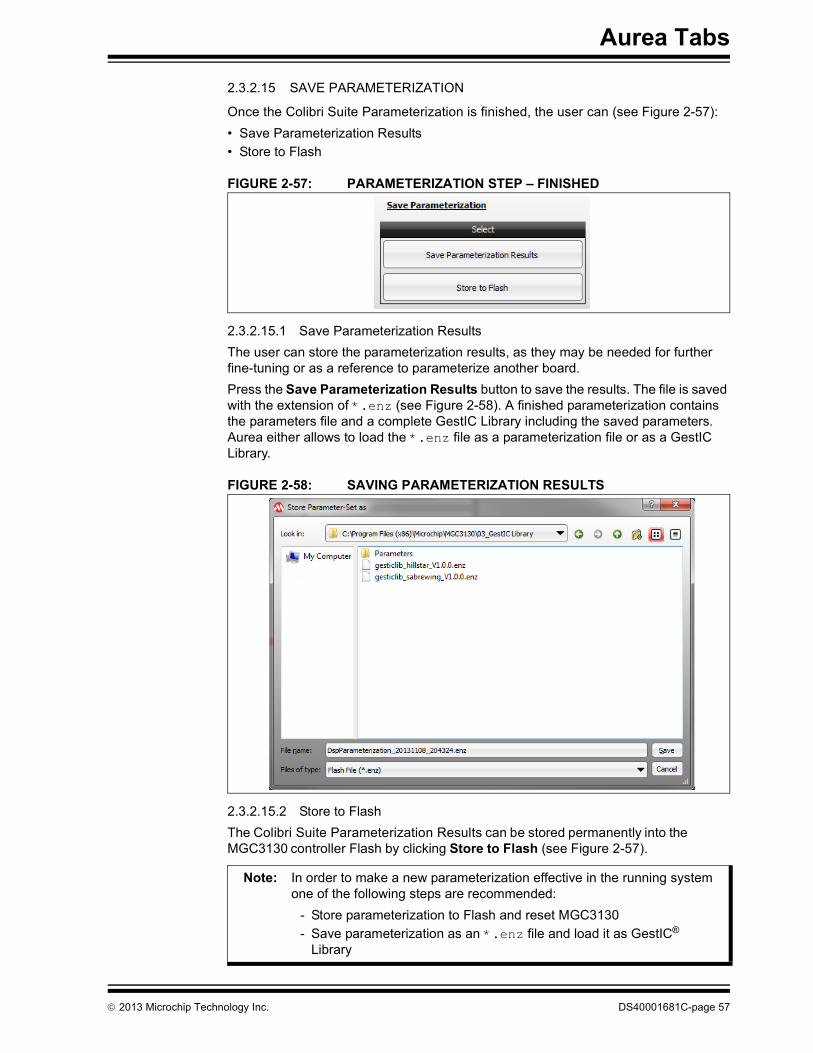
Aurea Tabs
2.3.2.15 SAVE PARAMETERIZATION
Once the Colibri Suite Parameterization is finished, the user can (see Figure 2-57):• Save Parameterization Results• Store to Flash
FIGURE 2-57: PARAMETERIZATION STEP – FINISHED
2.3.2.15.1 Save Parameterization ResultsThe user can store the parameterization results, as they may be needed for further fine-tuning or as a reference to parameterize another board.Press the Save Parameterization Results button to save the results. The file is saved with the extension of *.enz (see Figure 2-58). A finished parameterization contains the parameters file and a complete GestIC Library including the saved parameters. Aurea either allows to load the *.enz file as a parameterization file or as a GestIC Library.
FIGURE 2-58: SAVING PARAMETERIZATION RESULTS
2.3.2.15.2 Store to FlashThe Colibri Suite Parameterization Results can be stored permanently into the MGC3130 controller Flash by clicking Store to Flash (see Figure 2-57).
Note: In order to make a new parameterization effective in the running system one of the following steps are recommended:
- Store parameterization to Flash and reset MGC3130- Save parameterization as an *.enz file and load it as GestIC®
Library
2013 Microchip Technology Inc. DS40001681C-page 57
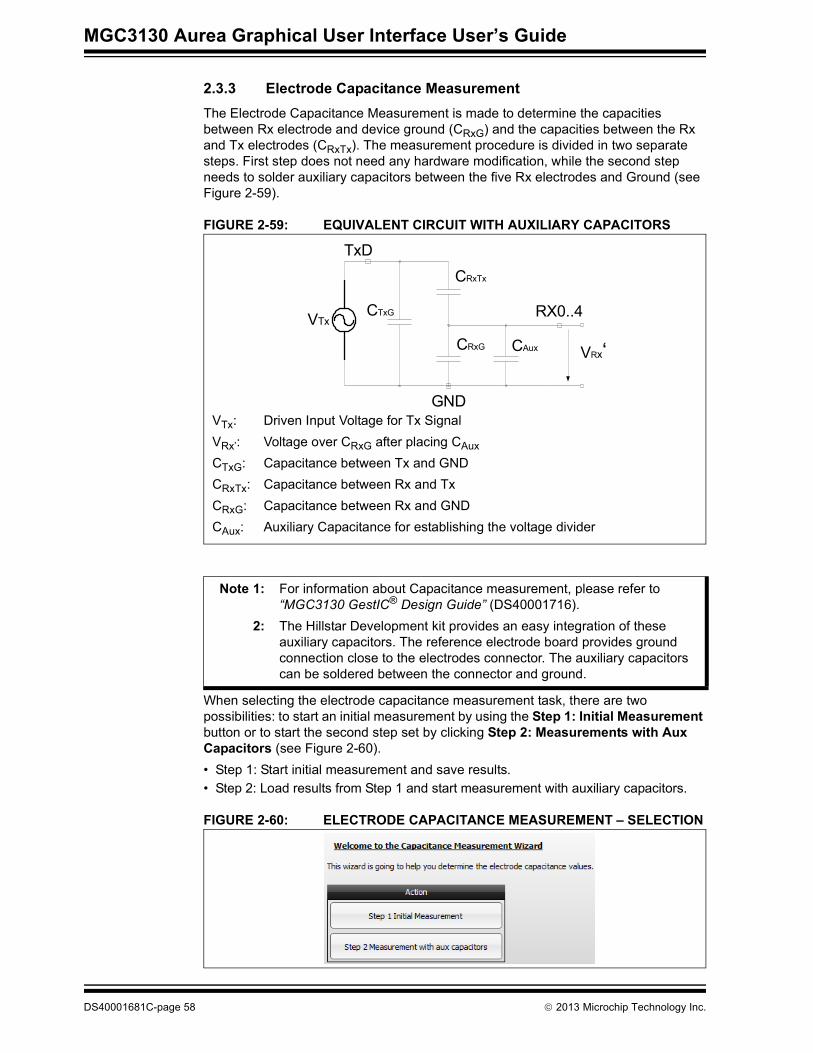
MGC3130 Aurea Graphical User Interface User’s Guide
2.3.3 Electrode Capacitance MeasurementThe Electrode Capacitance Measurement is made to determine the capacities between Rx electrode and device ground (CRxG) and the capacities between the Rx and Tx electrodes (CRxTx). The measurement procedure is divided in two separate steps. First step does not need any hardware modification, while the second step needs to solder auxiliary capacitors between the five Rx electrodes and Ground (see Figure 2-59).
FIGURE 2-59: EQUIVALENT CIRCUIT WITH AUXILIARY CAPACITORS
When selecting the electrode capacitance measurement task, there are two possibilities: to start an initial measurement by using the Step 1: Initial Measurement button or to start the second step set by clicking Step 2: Measurements with Aux Capacitors (see Figure 2-60).• Step 1: Start initial measurement and save results.• Step 2: Load results from Step 1 and start measurement with auxiliary capacitors.
FIGURE 2-60: ELECTRODE CAPACITANCE MEASUREMENT – SELECTION
VTx
TxD
CRxG
CTxG
CRxTx
CAux VRx‘
RX0..4
GNDVTx: Driven Input Voltage for Tx SignalVRx’: Voltage over CRxG after placing CAux
CTxG: Capacitance between Tx and GNDCRxTx: Capacitance between Rx and TxCRxG: Capacitance between Rx and GNDCAux: Auxiliary Capacitance for establishing the voltage divider
Note 1: For information about Capacitance measurement, please refer to “MGC3130 GestIC® Design Guide” (DS40001716).
2: The Hillstar Development kit provides an easy integration of these auxiliary capacitors. The reference electrode board provides ground connection close to the electrodes connector. The auxiliary capacitors can be soldered between the connector and ground.
DS40001681C-page 58 2013 Microchip Technology Inc.
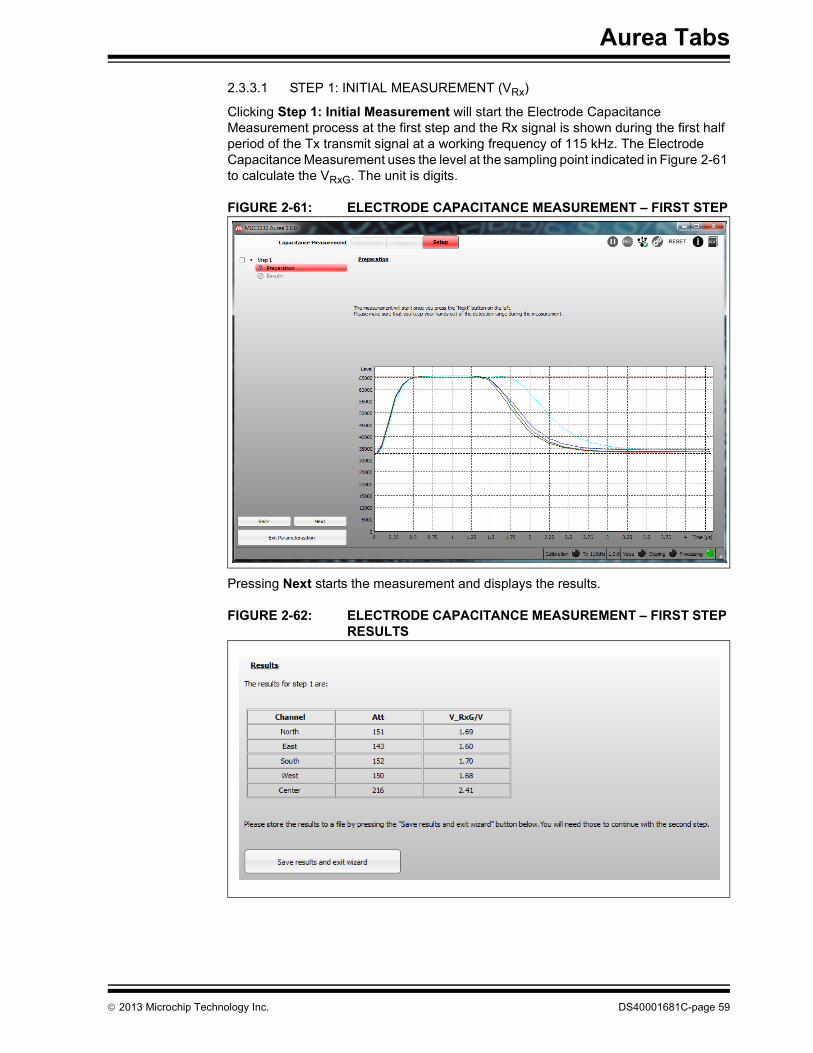
Aurea Tabs
2.3.3.1 STEP 1: INITIAL MEASUREMENT (VRx)
Clicking Step 1: Initial Measurement will start the Electrode Capacitance Measurement process at the first step and the Rx signal is shown during the first half period of the Tx transmit signal at a working frequency of 115 kHz. The Electrode Capacitance Measurement uses the level at the sampling point indicated in Figure 2-61 to calculate the VRxG. The unit is digits.
FIGURE 2-61: ELECTRODE CAPACITANCE MEASUREMENT – FIRST STEP
Pressing Next starts the measurement and displays the results.
FIGURE 2-62: ELECTRODE CAPACITANCE MEASUREMENT – FIRST STEP RESULTS
2013 Microchip Technology Inc. DS40001681C-page 59
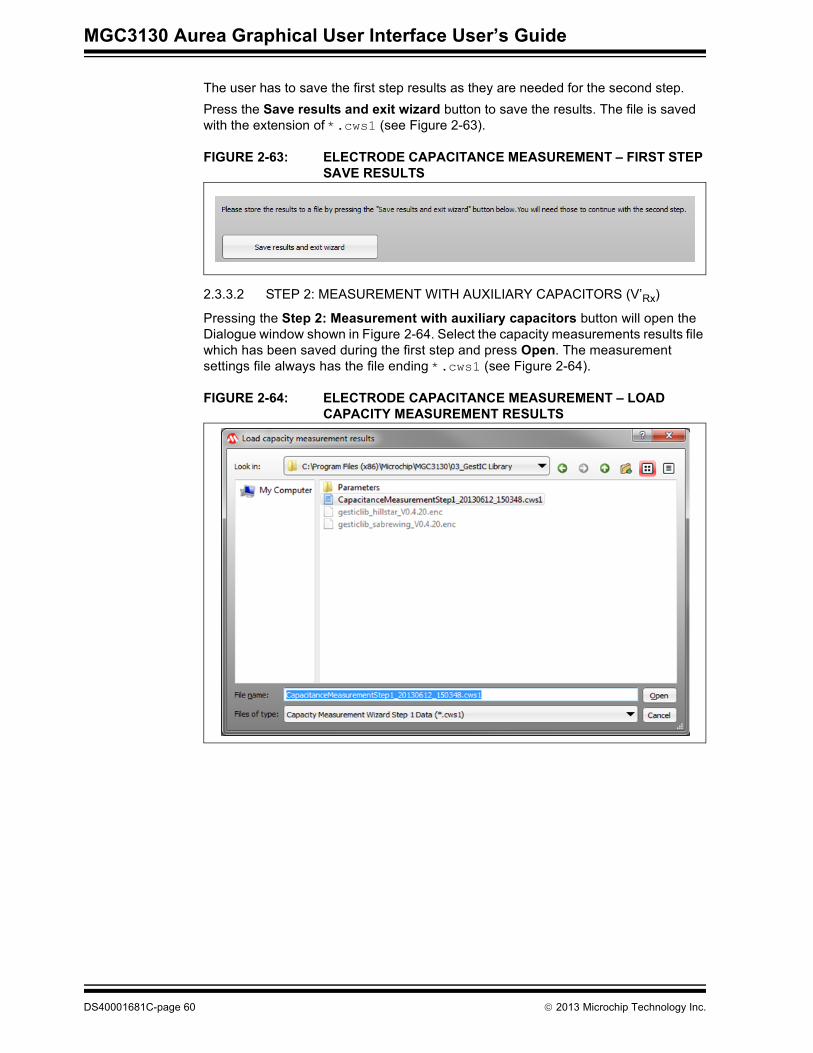
MGC3130 Aurea Graphical User Interface User’s Guide
The user has to save the first step results as they are needed for the second step.Press the Save results and exit wizard button to save the results. The file is saved with the extension of *.cws1 (see Figure 2-63).
FIGURE 2-63: ELECTRODE CAPACITANCE MEASUREMENT – FIRST STEP SAVE RESULTS
2.3.3.2 STEP 2: MEASUREMENT WITH AUXILIARY CAPACITORS (V’Rx)
Pressing the Step 2: Measurement with auxiliary capacitors button will open the Dialogue window shown in Figure 2-64. Select the capacity measurements results file which has been saved during the first step and press Open. The measurement settings file always has the file ending *.cws1 (see Figure 2-64).
FIGURE 2-64: ELECTRODE CAPACITANCE MEASUREMENT – LOAD CAPACITY MEASUREMENT RESULTS
DS40001681C-page 60 2013 Microchip Technology Inc.
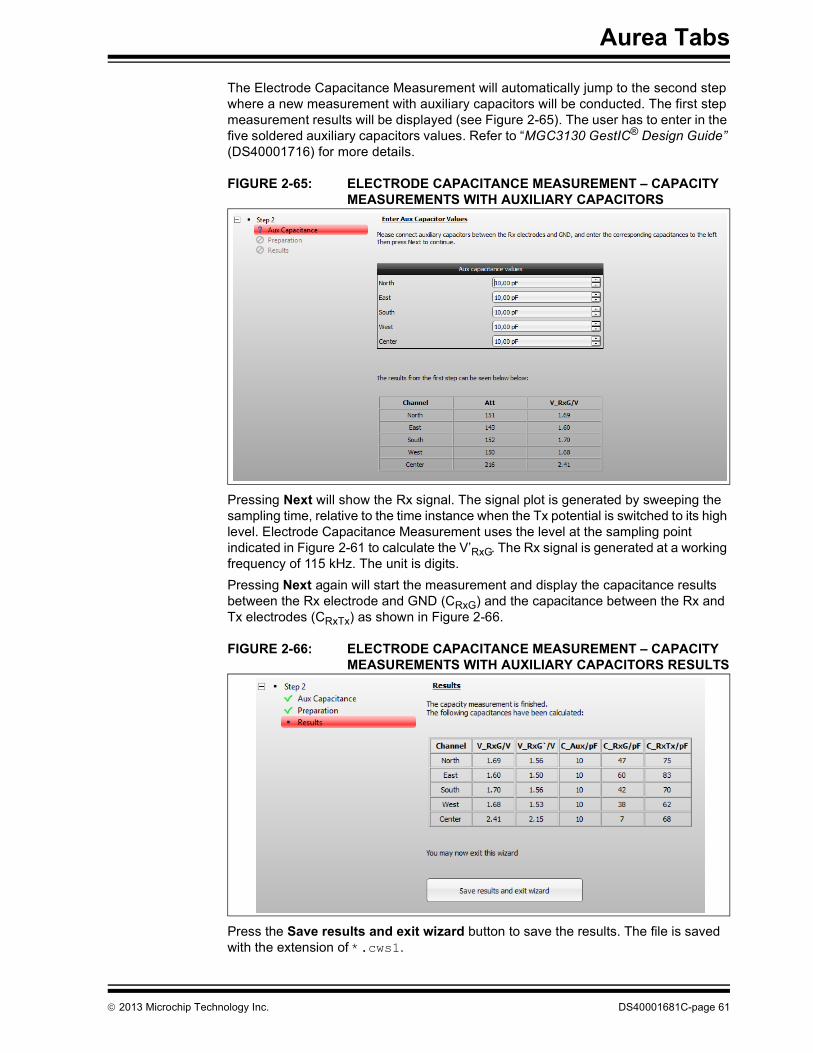
Aurea Tabs
The Electrode Capacitance Measurement will automatically jump to the second step where a new measurement with auxiliary capacitors will be conducted. The first step measurement results will be displayed (see Figure 2-65). The user has to enter in the five soldered auxiliary capacitors values. Refer to “MGC3130 GestIC® Design Guide” (DS40001716) for more details.
FIGURE 2-65: ELECTRODE CAPACITANCE MEASUREMENT – CAPACITY MEASUREMENTS WITH AUXILIARY CAPACITORS
Pressing Next will show the Rx signal. The signal plot is generated by sweeping the sampling time, relative to the time instance when the Tx potential is switched to its high level. Electrode Capacitance Measurement uses the level at the sampling point indicated in Figure 2-61 to calculate the V’RxG. The Rx signal is generated at a working frequency of 115 kHz. The unit is digits.Pressing Next again will start the measurement and display the capacitance results between the Rx electrode and GND (CRxG) and the capacitance between the Rx and Tx electrodes (CRxTx) as shown in Figure 2-66.
FIGURE 2-66: ELECTRODE CAPACITANCE MEASUREMENT – CAPACITY MEASUREMENTS WITH AUXILIARY CAPACITORS RESULTS
Press the Save results and exit wizard button to save the results. The file is saved with the extension of *.cws1.
2013 Microchip Technology Inc. DS40001681C-page 61
MGC3130 AUREAGRAPHICAL USER INTERFACE
USER’S GUIDE
Chapter 3. Advanced Aurea Features
3.1 LOGGING SENSOR DATA It is possible to log and store the data streamed from the MGC3130 controller to the PC. This can be used for observing data over long time periods and for system debugging. The log file contains:• Message: All messages sent from the MGC3130 in hex format.• Data: System Status information and Sensor Data of the Colibri Suite decoded
from the respective messages. The data fields contain:- Operation mode- Working frequency- XYZ position- Uncalibrated Sensor Data- Signal deviation- Touch- Tap- Double Tap- AirWheel- Gestures
3.1.1 Record a Log FileTo start logging data:
1. Press the REC button in the upper right corner of Aurea. Aurea immediately starts logging data in the background. The logged data includes a 30-second history.
2. In the dialog box confirm the file name and press OK.3. Press REC again to stop the logging process.
Note: The kind of messages being logged depends on the active Aurea tab and the content displayed inside (refer to Section 3.1.2 “Log File Content and Format ”).
2013 Microchip Technology Inc. DS40001681C-page 62
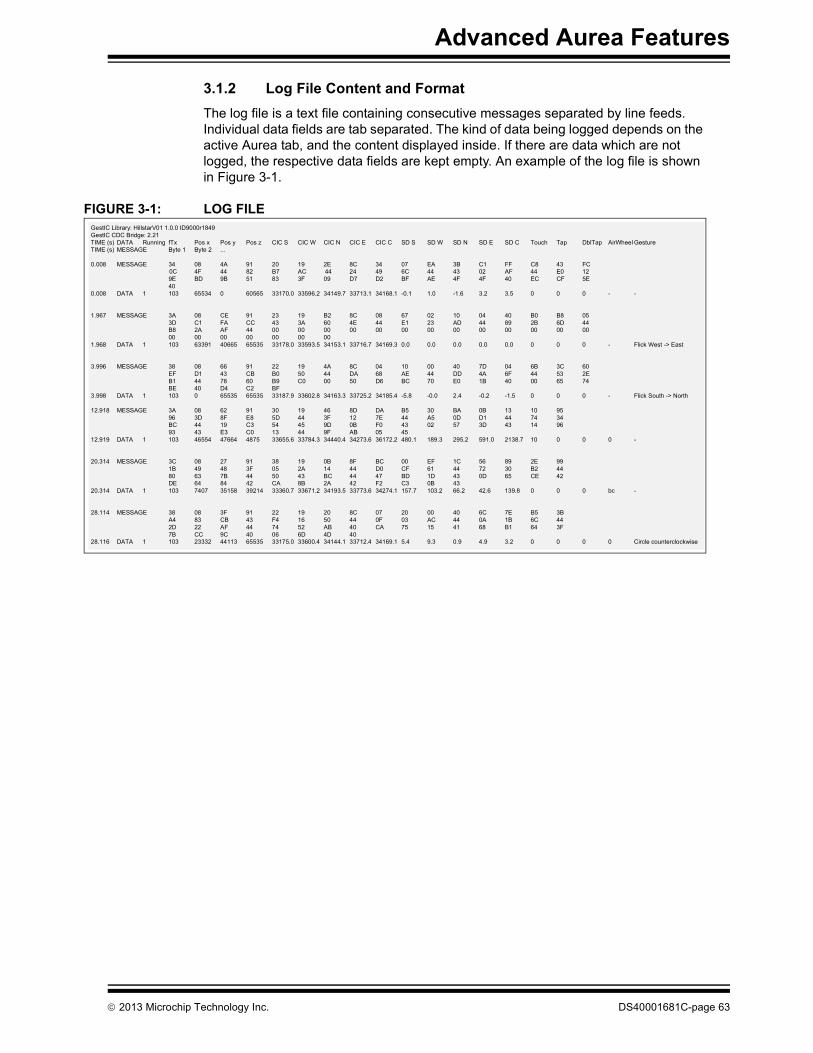
Advanced Aurea Features
3.1.2 Log File Content and Format The log file is a text file containing consecutive messages separated by line feeds. Individual data fields are tab separated. The kind of data being logged depends on the active Aurea tab, and the content displayed inside. If there are data which are not logged, the respective data fields are kept empty. An example of the log file is shown in Figure 3-1.
FIGURE 3-1: LOG FILEGestIC Library: HillstarV01 1.0.0 ID9000r1849GestIC CDC Bridge: 2.21TIME (s) DATA Running fTx Pos x Pos y Pos z CIC S CIC W CIC N CIC E CIC C SD S SD W SD N SD E SD C Touch Tap DblTap AirWheel GestureTIME (s) MESSAGE Byte 1 Byte 2 ...
0.008 MESSAGE 34 08 4A 91 20 19 2E 8C 34 07 EA 3B C1 FF C8 43 FC 0C 4F 44 82 B7 AC 44 24 49 6C 44 43 02 AF 44 E0 12 9E BD 9B 51 83 3F 09 D7 D2 BF AE 4F 4F 40 EC CF 5E 400.008 DATA 1 103 65534 0 60565 33170.0 33596.2 34149.7 33713.1 34168.1 -0.1 1.0 -1.6 3.2 3.5 0 0 0 - -
1.967 MESSAGE 3A 08 CE 91 23 19 B2 8C 08 67 02 10 04 40 B0 B8 05 3D C1 FA CC 43 3A 60 4E 44 E1 23 AD 44 89 2B 6D 44 B8 2A AF 44 00 00 00 00 00 00 00 00 00 00 00 00 00 00 00 00 00 00 00 001.968 DATA 1 103 63391 40665 65535 33178.0 33593.5 34153.1 33716.7 34169.3 0.0 0.0 0.0 0.0 0.0 0 0 0 - Flick West -> East
3.996 MESSAGE 38 08 66 91 22 19 4A 8C 04 10 00 40 7D 04 6B 3C 60 EF D1 43 CB B0 50 44 DA 68 AE 44 DD 4A 6F 44 53 2E B1 44 78 60 B9 C0 00 50 D6 BC 70 E0 1B 40 00 65 74 BE 40 D4 C2 BF3.998 DATA 1 103 0 65535 65535 33187.9 33602.8 34163.3 33725.2 34185.4 -5.8 -0.0 2.4 -0.2 -1.5 0 0 0 - Flick South -> North
12.918 MESSAGE 3A 08 62 91 30 19 46 8D DA B5 30 BA 0B 13 10 95 96 3D 8F E8 5D 44 3F 12 7E 44 A5 0D D1 44 74 34 BC 44 19 C3 54 45 9D 0B F0 43 02 57 3D 43 14 96 93 43 E3 C0 13 44 9F AB 05 4512.919 DATA 1 103 46554 47664 4875 33655.6 33784.3 34440.4 34273.6 36172.2 480.1 189.3 295.2 591.0 2138.7 10 0 0 0 -
20.314 MESSAGE 3C 08 27 91 38 19 0B 8F BC 00 EF 1C 56 89 2E 99 1B 49 48 3F 05 2A 14 44 D0 CF 61 44 72 30 B2 44 80 63 7B 44 50 43 BC 44 47 BD 1D 43 0D 65 CE 42 DE 64 84 42 CA 8B 2A 42 F2 C3 0B 4320.314 DATA 1 103 7407 35158 39214 33360.7 33671.2 34193.5 33773.6 34274.1 157.7 103.2 66.2 42.6 139.8 0 0 0 bc -
28.114 MESSAGE 38 08 3F 91 22 19 20 8C 07 20 00 40 6C 7E B5 3B A4 83 CB 43 F4 16 50 44 0F 03 AC 44 0A 1B 6C 44 2D 22 AF 44 74 52 AB 40 CA 75 15 41 68 B1 64 3F 7B CC 9C 40 06 6D 4D 4028.116 DATA 1 103 23332 44113 65535 33175.0 33600.4 34144.1 33712.4 34169.1 5.4 9.3 0.9 4.9 3.2 0 0 0 0 Circle counterclockwise
2013 Microchip Technology Inc. DS40001681C-page 63
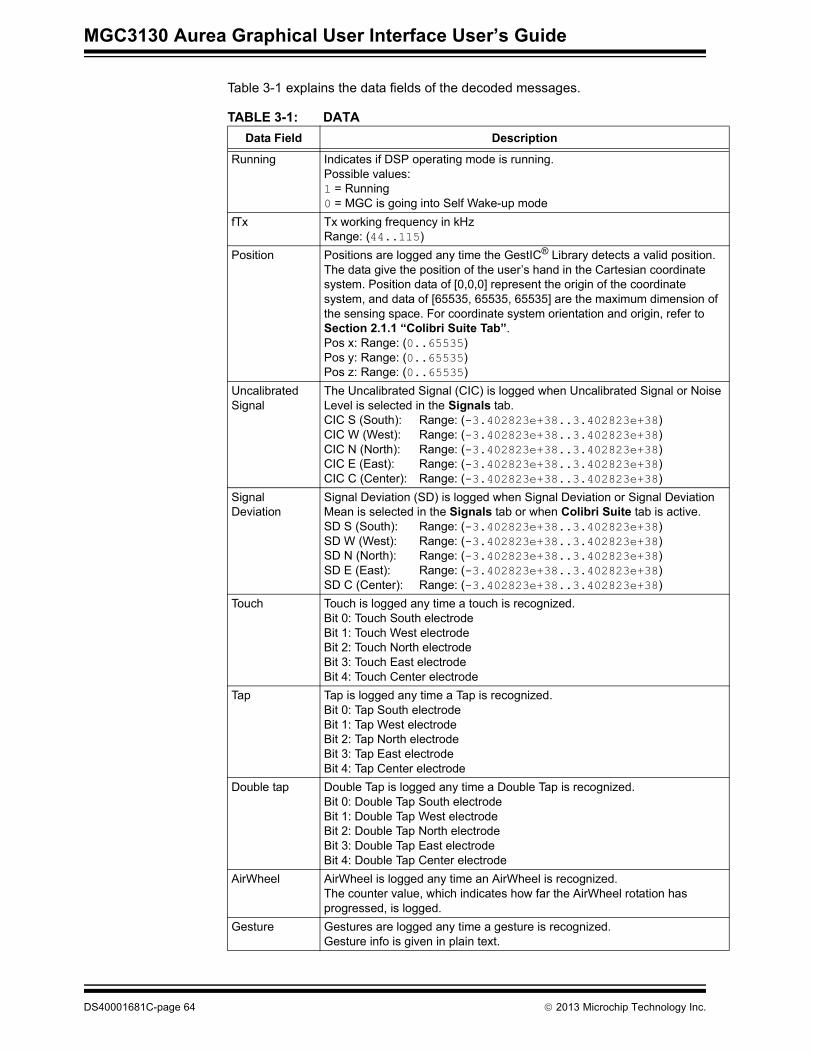
MGC3130 Aurea Graphical User Interface User’s Guide
DS
Table 3-1 explains the data fields of the decoded messages.
TABLE 3-1: DATAData Field Description
Running Indicates if DSP operating mode is running.Possible values:1 = Running0 = MGC is going into Self Wake-up mode
fTx Tx working frequency in kHzRange: (44..115)
Position Positions are logged any time the GestIC® Library detects a valid position. The data give the position of the user’s hand in the Cartesian coordinate system. Position data of [0,0,0] represent the origin of the coordinate system, and data of [65535, 65535, 65535] are the maximum dimension of the sensing space. For coordinate system orientation and origin, refer to Section 2.1.1 “Colibri Suite Tab”.Pos x: Range: (0..65535)Pos y: Range: (0..65535)Pos z: Range: (0..65535)
Uncalibrated Signal
The Uncalibrated Signal (CIC) is logged when Uncalibrated Signal or Noise Level is selected in the Signals tab.CIC S (South): Range: (-3.402823e+38..3.402823e+38)CIC W (West): Range: (-3.402823e+38..3.402823e+38)CIC N (North): Range: (-3.402823e+38..3.402823e+38)CIC E (East): Range: (-3.402823e+38..3.402823e+38)CIC C (Center): Range: (-3.402823e+38..3.402823e+38)
Signal Deviation
Signal Deviation (SD) is logged when Signal Deviation or Signal Deviation Mean is selected in the Signals tab or when Colibri Suite tab is active.SD S (South): Range: (-3.402823e+38..3.402823e+38)SD W (West): Range: (-3.402823e+38..3.402823e+38)SD N (North): Range: (-3.402823e+38..3.402823e+38) SD E (East): Range: (-3.402823e+38..3.402823e+38)SD C (Center): Range: (-3.402823e+38..3.402823e+38)
Touch Touch is logged any time a touch is recognized.Bit 0: Touch South electrodeBit 1: Touch West electrodeBit 2: Touch North electrodeBit 3: Touch East electrodeBit 4: Touch Center electrode
Tap Tap is logged any time a Tap is recognized.Bit 0: Tap South electrodeBit 1: Tap West electrodeBit 2: Tap North electrodeBit 3: Tap East electrodeBit 4: Tap Center electrode
Double tap Double Tap is logged any time a Double Tap is recognized.Bit 0: Double Tap South electrodeBit 1: Double Tap West electrodeBit 2: Double Tap North electrodeBit 3: Double Tap East electrodeBit 4: Double Tap Center electrode
AirWheel AirWheel is logged any time an AirWheel is recognized.The counter value, which indicates how far the AirWheel rotation has progressed, is logged.
Gesture Gestures are logged any time a gesture is recognized.Gesture info is given in plain text.
40001681C-page 64 2013 Microchip Technology Inc.
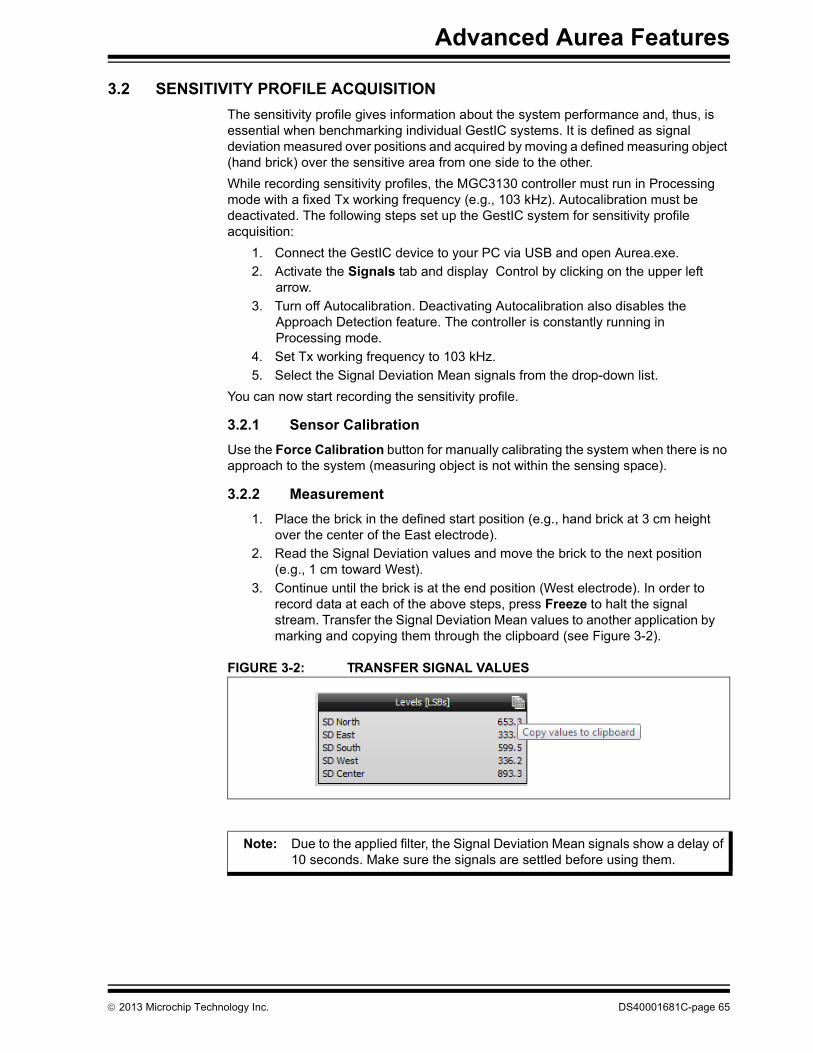
Advanced Aurea Features
3.2 SENSITIVITY PROFILE ACQUISITIONThe sensitivity profile gives information about the system performance and, thus, is essential when benchmarking individual GestIC systems. It is defined as signal deviation measured over positions and acquired by moving a defined measuring object (hand brick) over the sensitive area from one side to the other. While recording sensitivity profiles, the MGC3130 controller must run in Processing mode with a fixed Tx working frequency (e.g., 103 kHz). Autocalibration must be deactivated. The following steps set up the GestIC system for sensitivity profile acquisition:
1. Connect the GestIC device to your PC via USB and open Aurea.exe.2. Activate the Signals tab and display Control by clicking on the upper left
arrow.3. Turn off Autocalibration. Deactivating Autocalibration also disables the
Approach Detection feature. The controller is constantly running in Processing mode.
4. Set Tx working frequency to 103 kHz.5. Select the Signal Deviation Mean signals from the drop-down list.
You can now start recording the sensitivity profile.
3.2.1 Sensor CalibrationUse the Force Calibration button for manually calibrating the system when there is no approach to the system (measuring object is not within the sensing space).
3.2.2 Measurement1. Place the brick in the defined start position (e.g., hand brick at 3 cm height
over the center of the East electrode).2. Read the Signal Deviation values and move the brick to the next position
(e.g., 1 cm toward West).3. Continue until the brick is at the end position (West electrode). In order to
record data at each of the above steps, press Freeze to halt the signal stream. Transfer the Signal Deviation Mean values to another application by marking and copying them through the clipboard (see Figure 3-2).
FIGURE 3-2: TRANSFER SIGNAL VALUES
Note: Due to the applied filter, the Signal Deviation Mean signals show a delay of 10 seconds. Make sure the signals are settled before using them.
2013 Microchip Technology Inc. DS40001681C-page 65
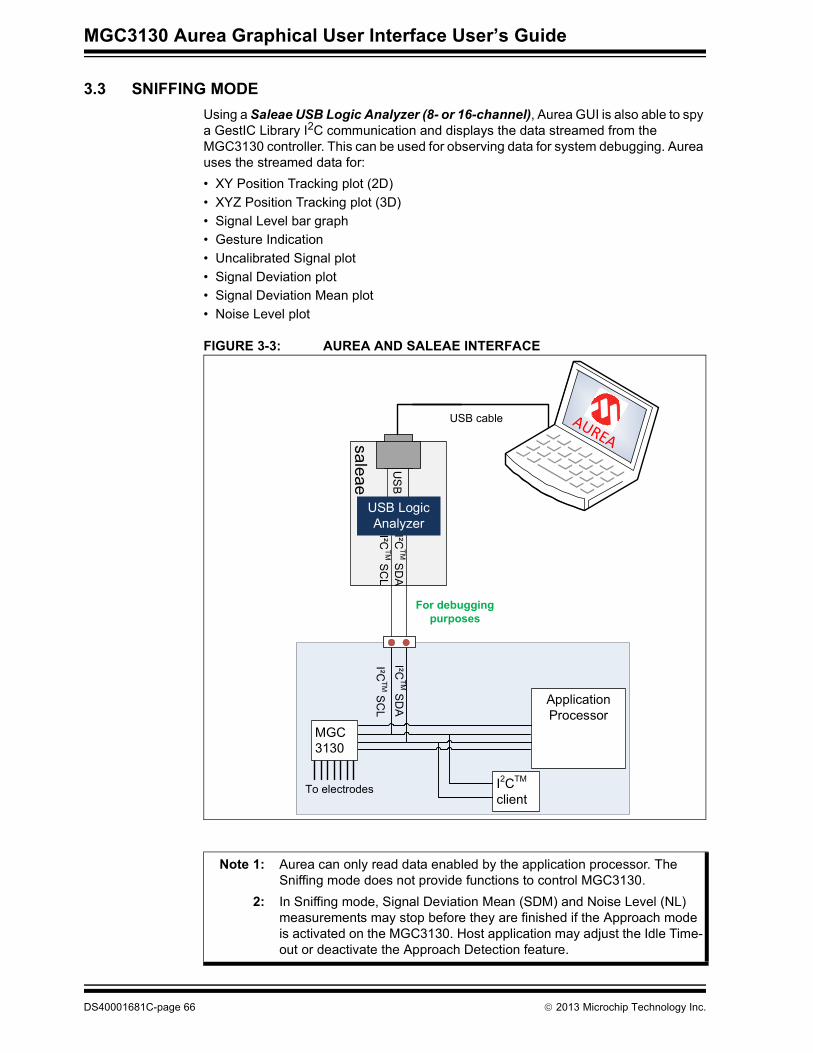
MGC3130 Aurea Graphical User Interface User’s Guide
3.3 SNIFFING MODEUsing a Saleae USB Logic Analyzer (8- or 16-channel), Aurea GUI is also able to spy a GestIC Library I2C communication and displays the data streamed from the MGC3130 controller. This can be used for observing data for system debugging. Aurea uses the streamed data for:• XY Position Tracking plot (2D)• XYZ Position Tracking plot (3D)• Signal Level bar graph• Gesture Indication• Uncalibrated Signal plot• Signal Deviation plot• Signal Deviation Mean plot• Noise Level plot
FIGURE 3-3: AUREA AND SALEAE INTERFACE
saleae
USB Logic AnalyzerI²C
TM SC
L
Application Processor
US
B
For debugging purposes
USB cable
To electrodes
I²CTM S
DA
I²CTM S
DA
I²CTM S
CL
MGC 3130
I2CTM client
AUREA
Note 1: Aurea can only read data enabled by the application processor. The Sniffing mode does not provide functions to control MGC3130.
2: In Sniffing mode, Signal Deviation Mean (SDM) and Noise Level (NL) measurements may stop before they are finished if the Approach mode is activated on the MGC3130. Host application may adjust the Idle Time-out or deactivate the Approach Detection feature.
DS40001681C-page 66 2013 Microchip Technology Inc.
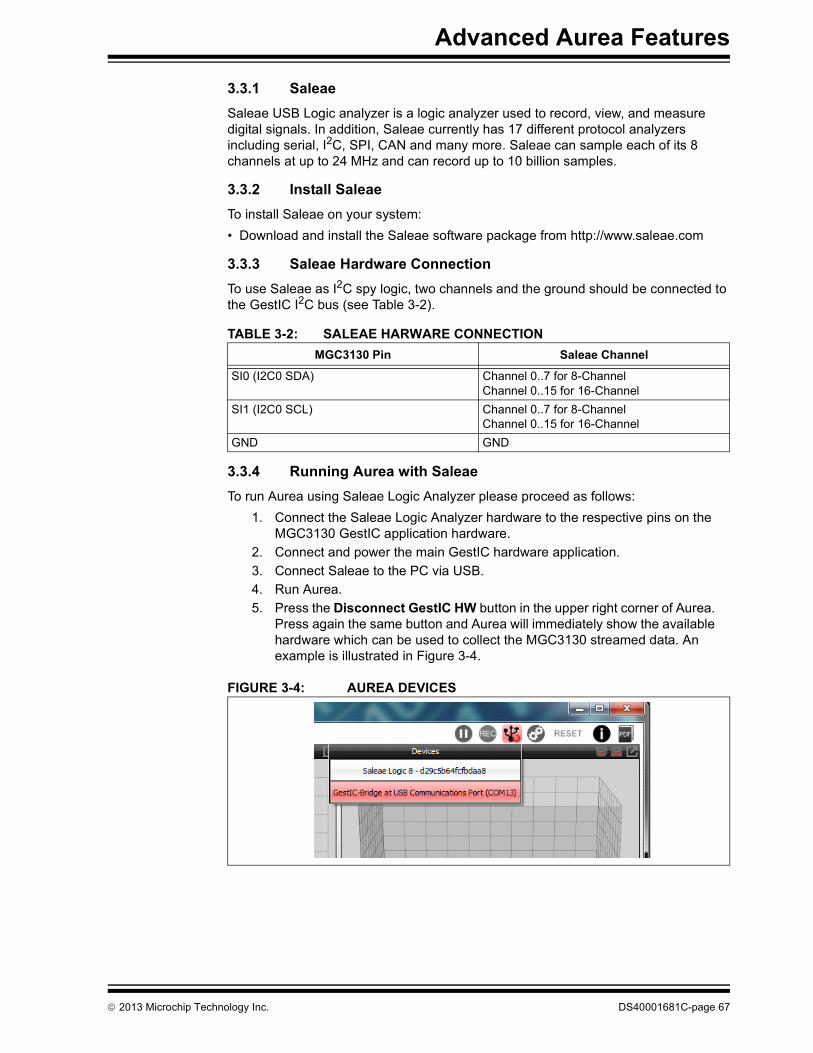
Advanced Aurea Features
3.3.1 SaleaeSaleae USB Logic analyzer is a logic analyzer used to record, view, and measure digital signals. In addition, Saleae currently has 17 different protocol analyzers including serial, I2C, SPI, CAN and many more. Saleae can sample each of its 8 channels at up to 24 MHz and can record up to 10 billion samples.
3.3.2 Install SaleaeTo install Saleae on your system:• Download and install the Saleae software package from http://www.saleae.com
3.3.3 Saleae Hardware ConnectionTo use Saleae as I2C spy logic, two channels and the ground should be connected to the GestIC I2C bus (see Table 3-2).
3.3.4 Running Aurea with SaleaeTo run Aurea using Saleae Logic Analyzer please proceed as follows:
1. Connect the Saleae Logic Analyzer hardware to the respective pins on the MGC3130 GestIC application hardware.
2. Connect and power the main GestIC hardware application.3. Connect Saleae to the PC via USB.4. Run Aurea.5. Press the Disconnect GestIC HW button in the upper right corner of Aurea.
Press again the same button and Aurea will immediately show the available hardware which can be used to collect the MGC3130 streamed data. An example is illustrated in Figure 3-4.
FIGURE 3-4: AUREA DEVICES
TABLE 3-2: SALEAE HARWARE CONNECTIONMGC3130 Pin Saleae Channel
SI0 (I2C0 SDA) Channel 0..7 for 8-ChannelChannel 0..15 for 16-Channel
SI1 (I2C0 SCL) Channel 0..7 for 8-ChannelChannel 0..15 for 16-Channel
GND GND
2013 Microchip Technology Inc. DS40001681C-page 67
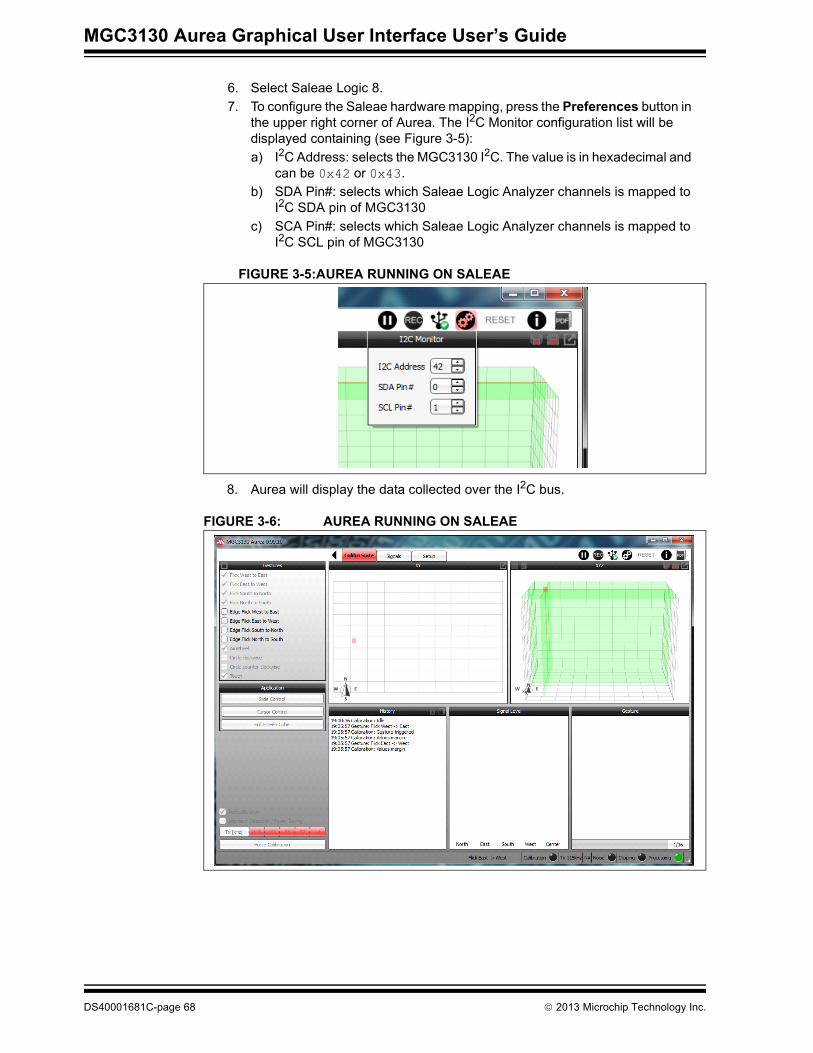
MGC3130 Aurea Graphical User Interface User’s Guide
6. Select Saleae Logic 8.7. To configure the Saleae hardware mapping, press the Preferences button in
the upper right corner of Aurea. The I2C Monitor configuration list will be displayed containing (see Figure 3-5):a) I2C Address: selects the MGC3130 I2C. The value is in hexadecimal and
can be 0x42 or 0x43.b) SDA Pin#: selects which Saleae Logic Analyzer channels is mapped to
I2C SDA pin of MGC3130c) SCA Pin#: selects which Saleae Logic Analyzer channels is mapped to
I2C SCL pin of MGC3130
FIGURE 3-5:AUREA RUNNING ON SALEAE
8. Aurea will display the data collected over the I2C bus.
FIGURE 3-6: AUREA RUNNING ON SALEAE
DS40001681C-page 68 2013 Microchip Technology Inc.
MGC3130 AUREAGRAPHICAL USER INTERFACE
USER’S GUIDE
Appendix A. Glossary
TABLE A-1: GLOSSARYTerm Definition
AFE Analog Front EndApplication Host PC or embedded controller which controls the MGC3130Aurea MGC3130 PC control software with graphical user interfaceColibri Suite Embedded Digital Signal Processing (DSP) suite within the GestIC® LibraryDeep Sleep MGC3130 Power-Saving modeE-field Electrical fieldFrame Electrodes Rectangular set of four electrodes for E-field sensing
GestIC® Technology Microchip’s patented technology providing 3D free-space gesture recognition utilizing the principles of electrical near-field sensing
GestIC® Library Includes the implementation of MGC3130 features and is delivered as a binary file preprogrammed on the MGC3130
Gesture Recognition Microchip’s stochastic HMM classifier to automatically detect and classify hand movement patterns
Gesture Set A set of provided hand movement patternsHand Brick Copper coated test block (40x40x70 mm) HMM Hidden Markov ModelMGC3130 Single-Zone 3D Gesture Sensing ControllerPosition Tracking GestIC® technology featureSabrewing MGC3130 evaluation boardSelf Wake-Up MGC3130 Power-Saving modeSensing Area Area enclosed by the four frame electrodesSensing Space Space above Sensing AreaSignal Deviation Term for the delta of the sensor signal on approach of the hand versus non-approach
Spacer Brick Spacer between the sensor layer and hand brick(Styrofoam block 40x40xh mm with h= 1/2/3/5/8/12 cm)
SPU Signal Processing Unit
Approach Detection GestIC® technology feature: Power-Saving mode of the MGC3130 with approach detection
Hillstar – MGC3130 Development Kit
Hillstar Development Kit supports an easy integration of Microchip’s MGC3130 3D Tracking and Gesture Controller into customer’s applications
2013 Microchip Technology Inc. DS40001681C-page 69

DS40001681C-page 70 2013 Microchip Technology Inc.
AMERICASCorporate Office2355 West Chandler Blvd.Chandler, AZ 85224-6199Tel: 480-792-7200 Fax: 480-792-7277Technical Support: http://www.microchip.com/supportWeb Address: www.microchip.comAtlantaDuluth, GA Tel: 678-957-9614 Fax: 678-957-1455Austin, TXTel: 512-257-3370 BostonWestborough, MA Tel: 774-760-0087 Fax: 774-760-0088ChicagoItasca, IL Tel: 630-285-0071 Fax: 630-285-0075ClevelandIndependence, OH Tel: 216-447-0464 Fax: 216-447-0643DallasAddison, TX Tel: 972-818-7423 Fax: 972-818-2924DetroitNovi, MI Tel: 248-848-4000Houston, TX Tel: 281-894-5983IndianapolisNoblesville, IN Tel: 317-773-8323Fax: 317-773-5453Los AngelesMission Viejo, CA Tel: 949-462-9523 Fax: 949-462-9608New York, NY Tel: 631-435-6000San Jose, CA Tel: 408-735-9110Canada - TorontoTel: 905-673-0699 Fax: 905-673-6509
ASIA/PACIFICAsia Pacific OfficeSuites 3707-14, 37th FloorTower 6, The GatewayHarbour City, KowloonHong KongTel: 852-2401-1200Fax: 852-2401-3431Australia - SydneyTel: 61-2-9868-6733Fax: 61-2-9868-6755China - BeijingTel: 86-10-8569-7000 Fax: 86-10-8528-2104China - ChengduTel: 86-28-8665-5511Fax: 86-28-8665-7889China - ChongqingTel: 86-23-8980-9588Fax: 86-23-8980-9500China - HangzhouTel: 86-571-2819-3187 Fax: 86-571-2819-3189China - Hong Kong SARTel: 852-2943-5100 Fax: 852-2401-3431China - NanjingTel: 86-25-8473-2460Fax: 86-25-8473-2470China - QingdaoTel: 86-532-8502-7355Fax: 86-532-8502-7205China - ShanghaiTel: 86-21-5407-5533 Fax: 86-21-5407-5066China - ShenyangTel: 86-24-2334-2829Fax: 86-24-2334-2393China - ShenzhenTel: 86-755-8864-2200 Fax: 86-755-8203-1760China - WuhanTel: 86-27-5980-5300Fax: 86-27-5980-5118China - XianTel: 86-29-8833-7252Fax: 86-29-8833-7256China - XiamenTel: 86-592-2388138 Fax: 86-592-2388130China - ZhuhaiTel: 86-756-3210040 Fax: 86-756-3210049
ASIA/PACIFICIndia - BangaloreTel: 91-80-3090-4444 Fax: 91-80-3090-4123India - New DelhiTel: 91-11-4160-8631Fax: 91-11-4160-8632India - PuneTel: 91-20-3019-1500Japan - OsakaTel: 81-6-6152-7160 Fax: 81-6-6152-9310Japan - TokyoTel: 81-3-6880- 3770 Fax: 81-3-6880-3771Korea - DaeguTel: 82-53-744-4301Fax: 82-53-744-4302Korea - SeoulTel: 82-2-554-7200Fax: 82-2-558-5932 or 82-2-558-5934Malaysia - Kuala LumpurTel: 60-3-6201-9857Fax: 60-3-6201-9859Malaysia - PenangTel: 60-4-227-8870Fax: 60-4-227-4068Philippines - ManilaTel: 63-2-634-9065Fax: 63-2-634-9069SingaporeTel: 65-6334-8870Fax: 65-6334-8850Taiwan - Hsin ChuTel: 886-3-5778-366Fax: 886-3-5770-955Taiwan - KaohsiungTel: 886-7-213-7830Taiwan - TaipeiTel: 886-2-2508-8600 Fax: 886-2-2508-0102Thailand - BangkokTel: 66-2-694-1351Fax: 66-2-694-1350
EUROPEAustria - WelsTel: 43-7242-2244-39Fax: 43-7242-2244-393Denmark - CopenhagenTel: 45-4450-2828 Fax: 45-4485-2829France - ParisTel: 33-1-69-53-63-20 Fax: 33-1-69-30-90-79Germany - DusseldorfTel: 49-2129-3766400Germany - MunichTel: 49-89-627-144-0 Fax: 49-89-627-144-44Germany - PforzheimTel: 49-7231-424750Italy - Milan Tel: 39-0331-742611 Fax: 39-0331-466781Italy - VeniceTel: 39-049-7625286 Netherlands - DrunenTel: 31-416-690399 Fax: 31-416-690340Poland - WarsawTel: 48-22-3325737 Spain - MadridTel: 34-91-708-08-90Fax: 34-91-708-08-91Sweden - StockholmTel: 46-8-5090-4654UK - WokinghamTel: 44-118-921-5800Fax: 44-118-921-5820
Worldwide Sales and Service
10/28/13
Related Documents


